Organic Agriculture Worldwide 2017: Current Statistics Helga Willer and Julia Lernoud, Research Institute of Organic Agriculture (FiBL), Frick, Switzerland BIOFACH 2017, February 15, 2017

Organic Agriculture Worldwide 2017:Current Statistics
Jan 22, 2018
Welcome message from author
This document is posted to help you gain knowledge. Please leave a comment to let me know what you think about it! Share it to your friends and learn new things together.
Transcript
Research Institute of Organic AgricultureForschungsinstitut für biologischen Landbau
Organic Agriculture Worldwide 2017: Current StatisticsHelga Willer and Julia Lernoud, Research Institute of Organic Agriculture (FiBL), Frick, Switzerland
BIOFACH 2017, February 15, 2017
www.fibl.org
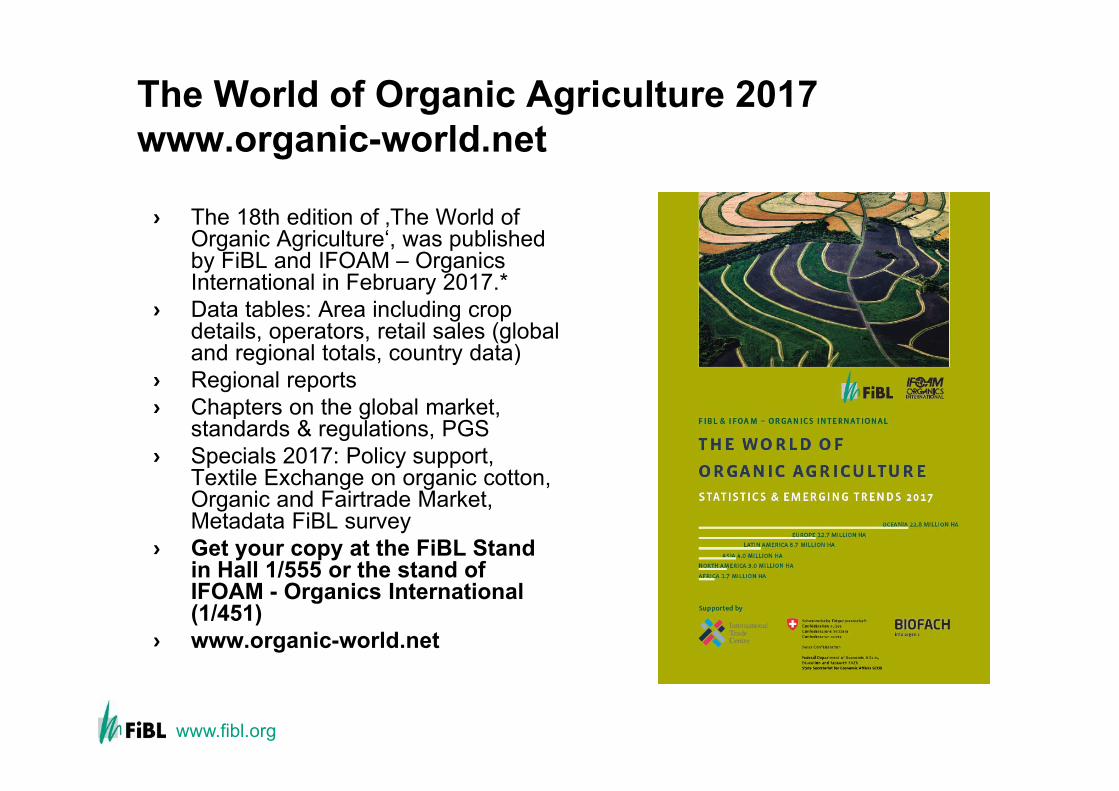
The World of Organic Agriculture 2017www.organic-world.net
› The 18th edition of ‚The World of Organic Agriculture‘, was published by FiBL and IFOAM – Organics International in February 2017.*
› Data tables: Area including cropdetails, operators, retail sales (global and regional totals, country data)
› Regional reports› Chapters on the global market,
standards & regulations, PGS› Specials 2017: Policy support,
Textile Exchange on organic cotton, Organic and Fairtrade Market, Metadata FiBL survey
› Get your copy at the FiBL Stand in Hall 1/555 or the stand of IFOAM - Organics International (1/451)
› www.organic-world.net
www.fibl.org
Acknowledgements› The Swiss State Secretariat of
Economic Affairs SECO, Berne
› International Trade Centre ITC
› Nürnberg Messe, the organizers of the BioFach World Organic Trade Fair
› 200 experts from all parts of the world contributed to the FiBL survey 2017.
www.fibl.org
Another record year: Key data/indicators related to area and producers 2015
› 179 countries have data on organic agriculture. › 50.9 million hectares of agricultural land are organic
(including conversion areas).› 6.5 million hectares more than in 2014› 1.1 percent of the agricultural land is organic› In 11 countries 10 percent or more of the farmland is
organic› 2.4 million producers were reported, more than three
quarters are in developing countries.
www.fibl.org
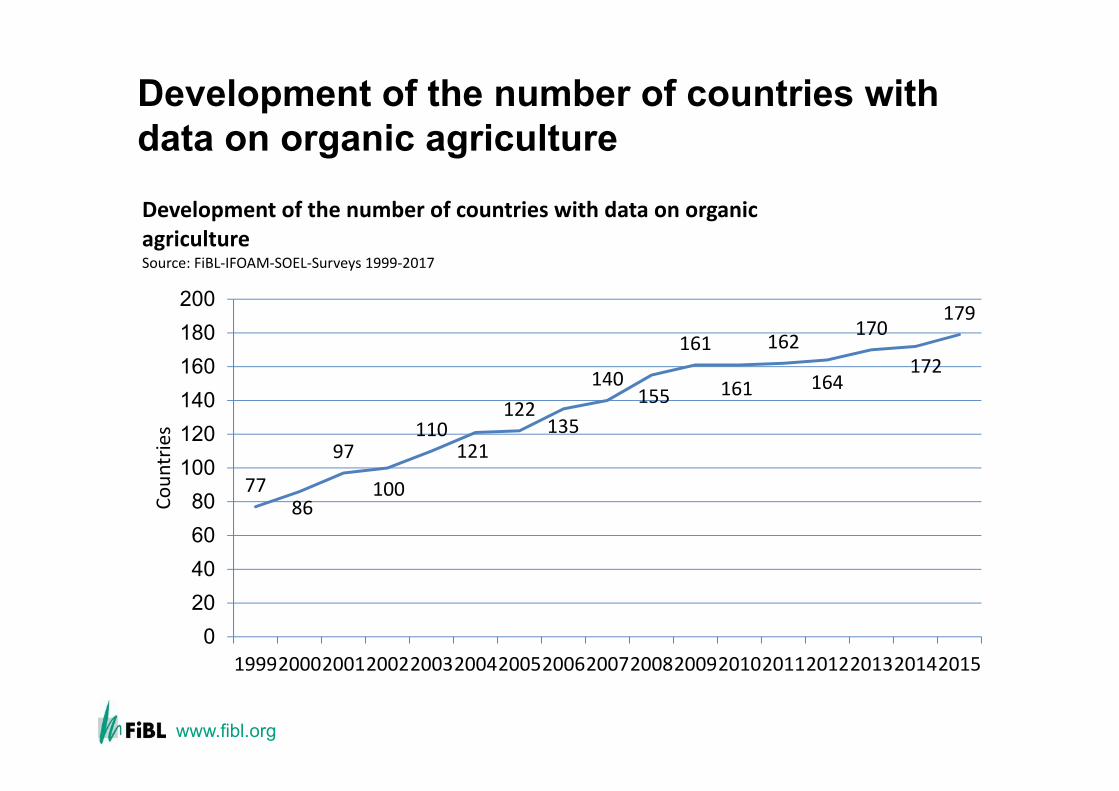
Development of the number of countries with data on organic agriculture
7786
97
100
110121
122135
140155
161
161
162
164
170
172
179
020406080
100120140160180200
19992000200120022003200420052006200720082009201020112012201320142015
Coun
tries
Development of the number of countries with data on organic agricultureSource: FiBL‐IFOAM‐SOEL‐Surveys 1999‐2017
www.fibl.org
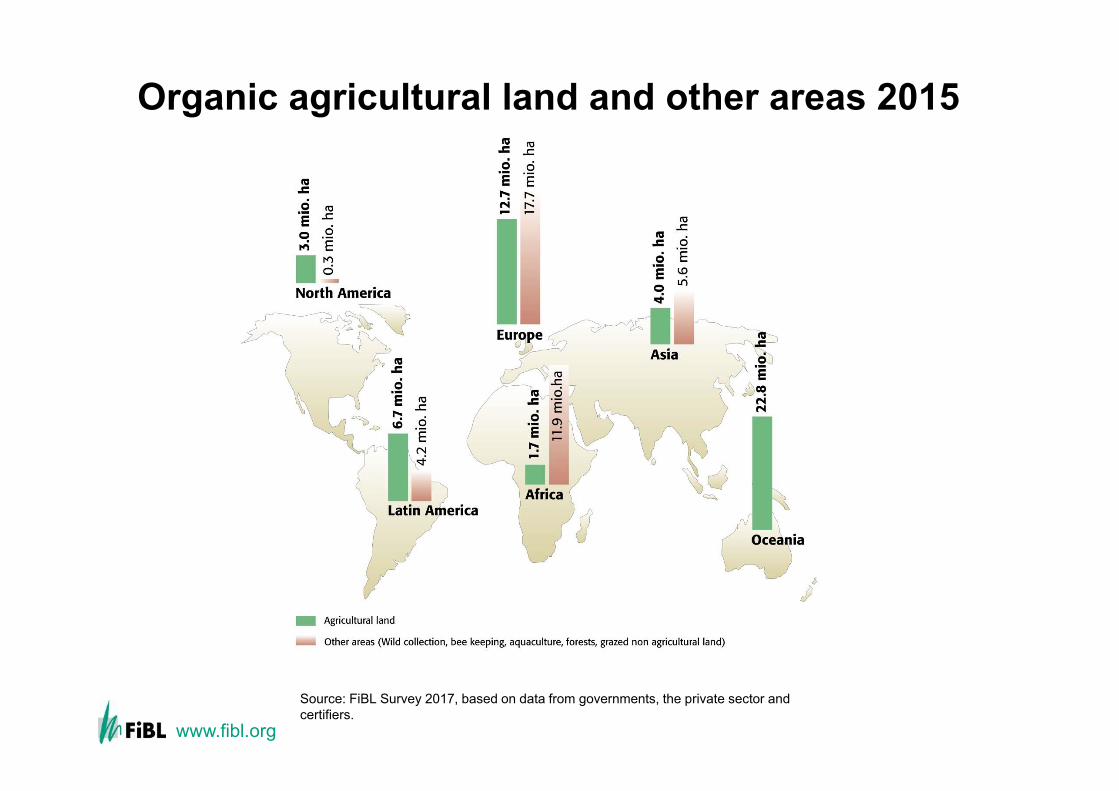
Organic agricultural land and other areas 2015
Source: FiBL Survey 2017, based on data from governments, the private sector and certifiers.
www.fibl.org
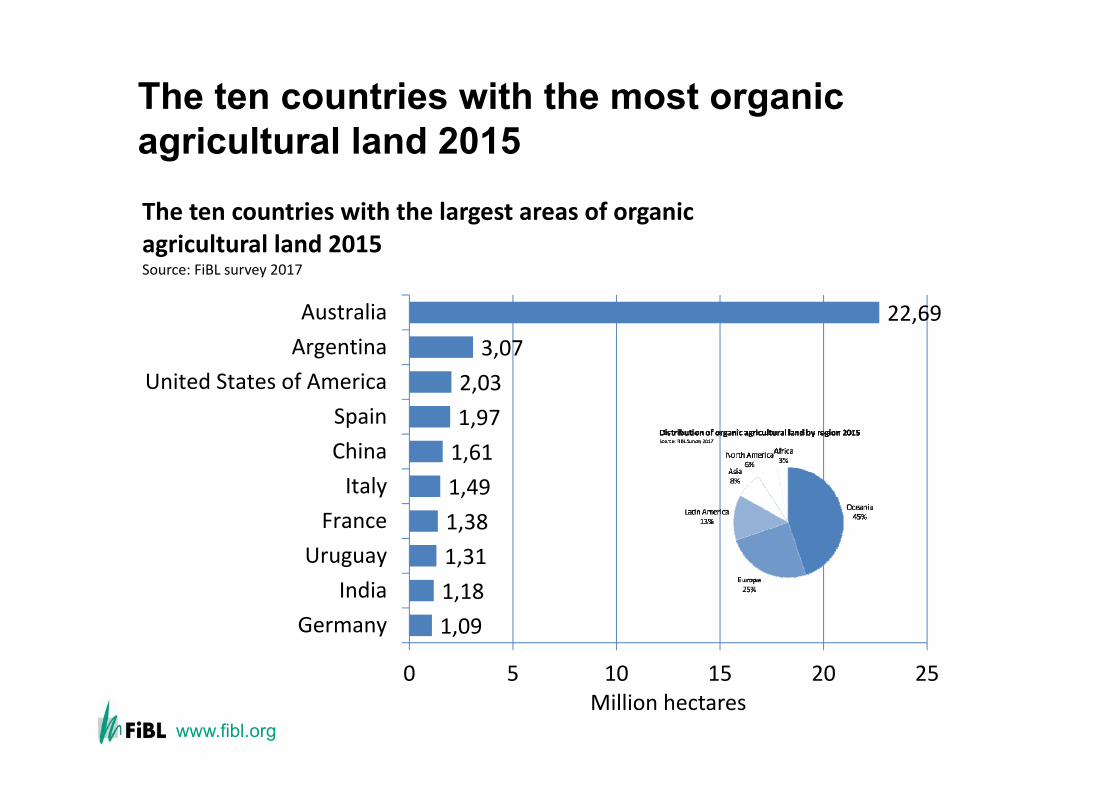
The ten countries with the most organic agricultural land 2015
1,091,181,311,381,491,611,972,033,07
22,69
0 5 10 15 20 25
GermanyIndia
UruguayFrance
ItalyChinaSpain
United States of AmericaArgentinaAustralia
Million hectares
The ten countries with the largest areas of organic agricultural land 2015Source: FiBL survey 2017
www.fibl.org
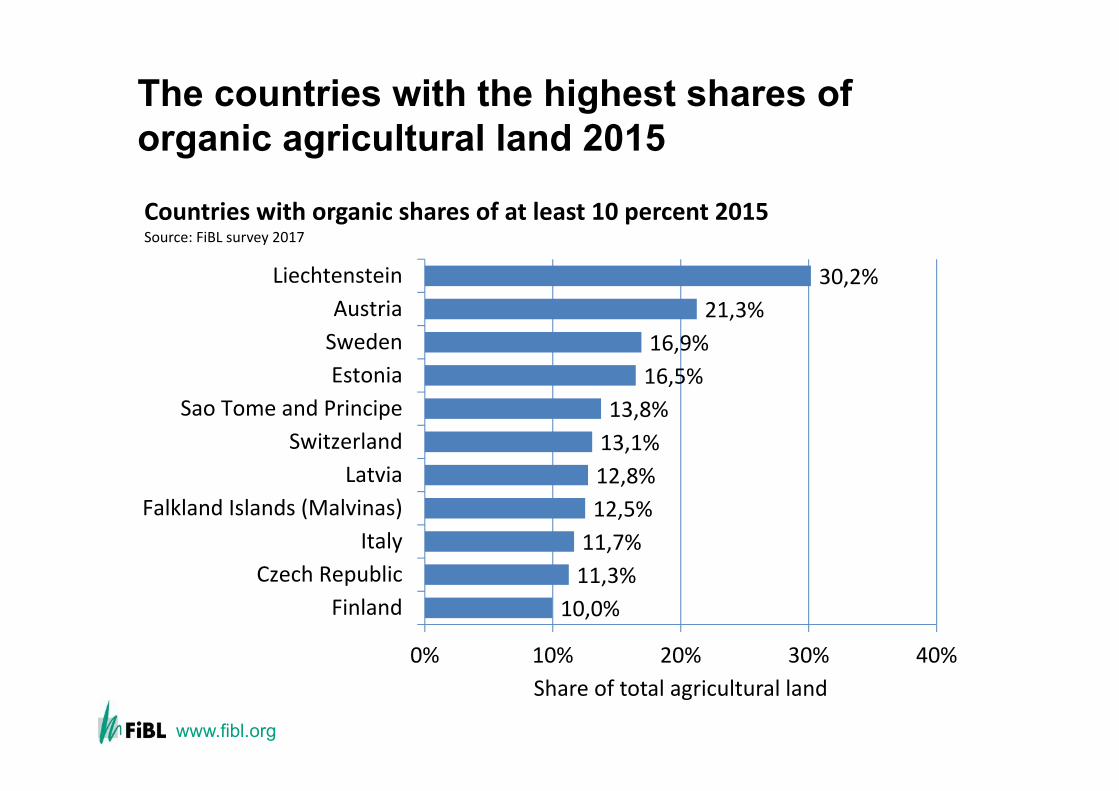
The countries with the highest shares of organic agricultural land 2015
10,0%11,3%11,7%12,5%12,8%13,1%13,8%
16,5%16,9%
21,3%30,2%
0% 10% 20% 30% 40%
FinlandCzech Republic
ItalyFalkland Islands (Malvinas)
LatviaSwitzerland
Sao Tome and PrincipeEstoniaSwedenAustria
Liechtenstein
Share of total agricultural land
Countries with organic shares of at least 10 percent 2015Source: FiBL survey 2017
www.fibl.org
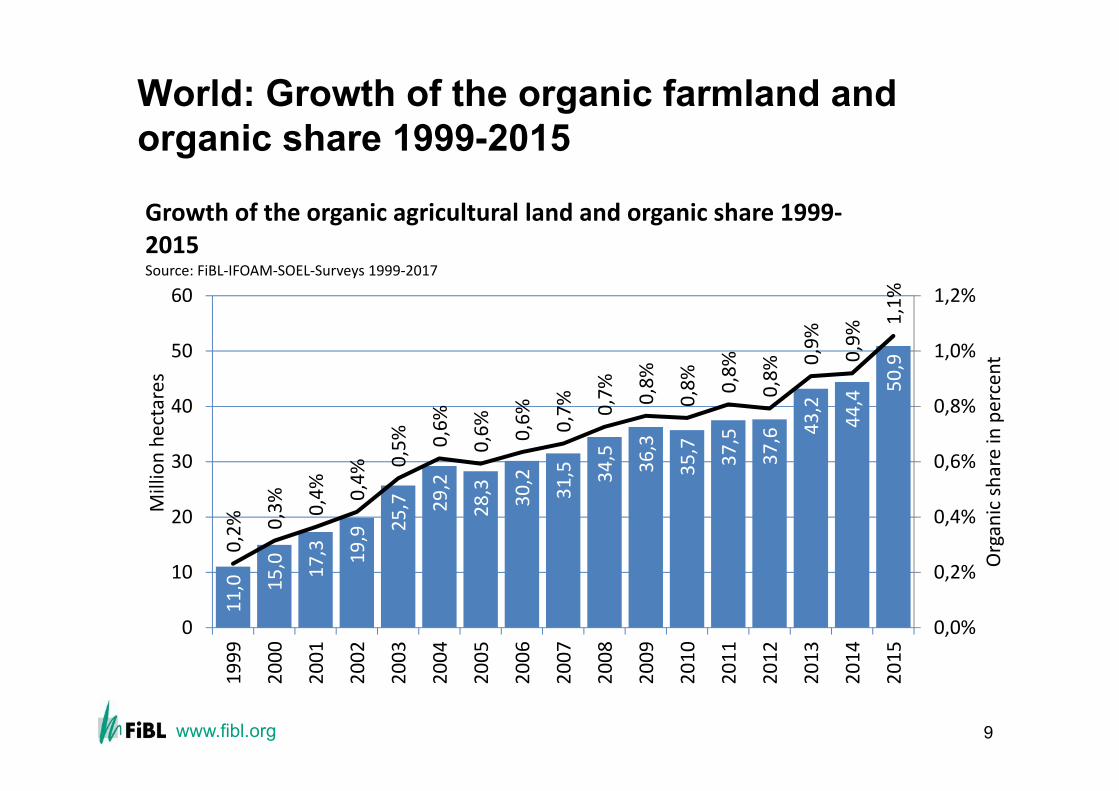
World: Growth of the organic farmland and organic share 1999-2015
9
11,0 15
,0 17,3 19,9 25
,7 29,2
28,3 30,2
31,5 34,5 36,3
35,7 37,5
37,6 43
,2
44,4
50,9
0,2% 0,
3% 0,4% 0,4%
0,5% 0,6%
0,6% 0,6% 0,7% 0,7% 0,8%
0,8% 0,8%
0,8%
0,9% 0,9%
1,1%
0,0%
0,2%
0,4%
0,6%
0,8%
1,0%
1,2%
0
10
20
30
40
50
60
1999
2000
2001
2002
2003
2004
2005
2006
2007
2008
2009
2010
2011
2012
2013
2014
2015
Organ
ic sh
are in percent
Million he
ctares
Growth of the organic agricultural land and organic share 1999‐2015Source: FiBL‐IFOAM‐SOEL‐Surveys 1999‐2017
www.fibl.org
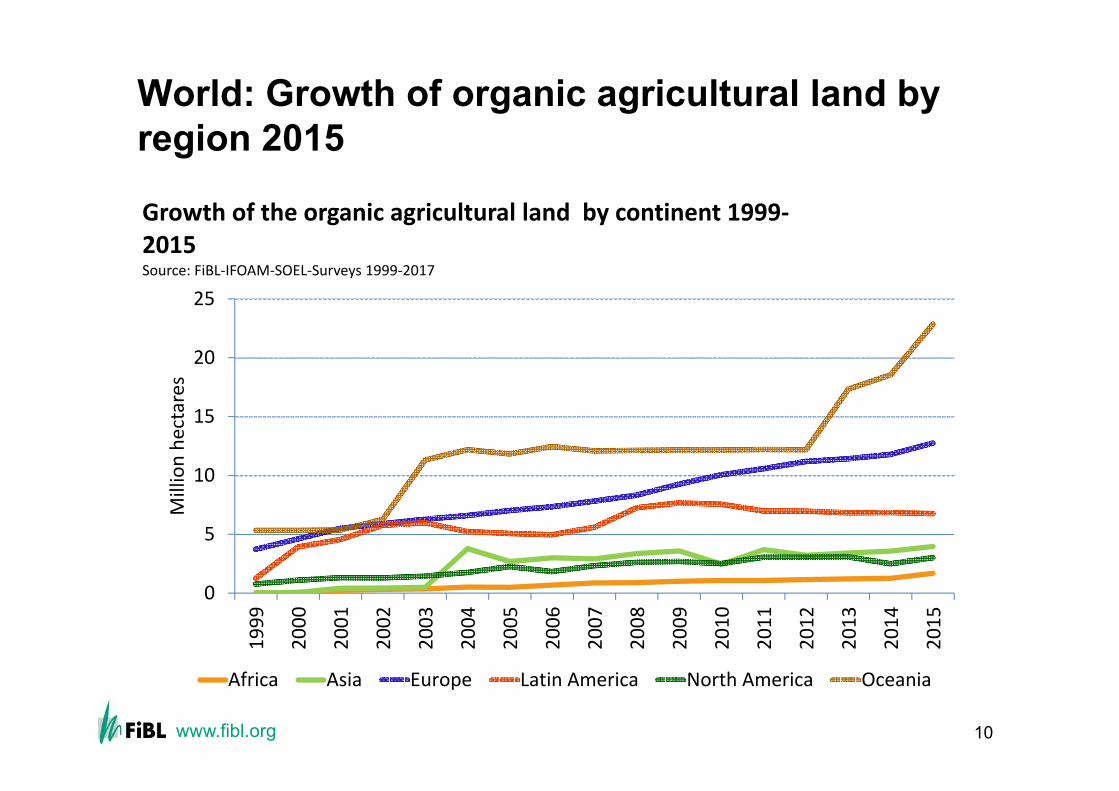
World: Growth of organic agricultural land by region 2015
10
0
5
10
15
20
25
1999
2000
2001
2002
2003
2004
2005
2006
2007
2008
2009
2010
2011
2012
2013
2014
2015
Million he
ctares
Growth of the organic agricultural land by continent 1999‐2015Source: FiBL‐IFOAM‐SOEL‐Surveys 1999‐2017
Africa Asia Europe Latin America North America Oceania
www.fibl.org
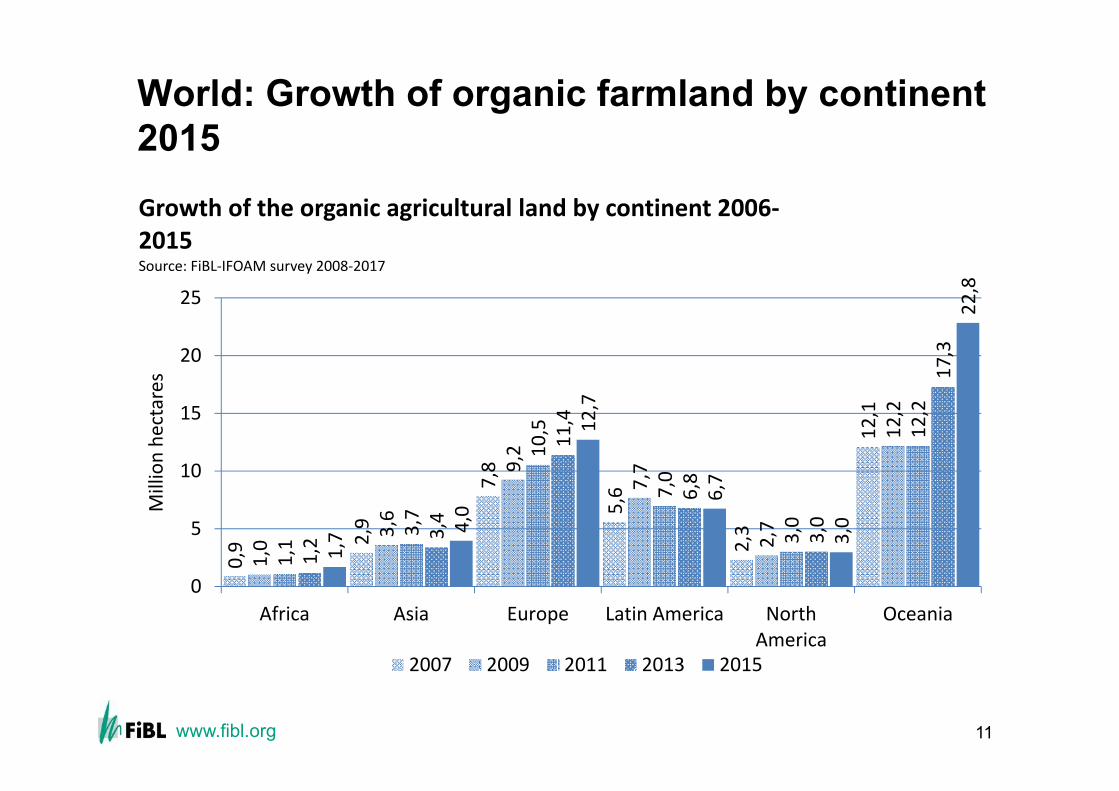
World: Growth of organic farmland by continent 2015
11
0,9 2,
9
7,8
5,6
2,3
12,1
1,0
3,6
9,2
7,7
2,7
12,2
1,1
3,7
10,5
7,0
3,0
12,2
1,2 3,
4
11,4
6,8
3,0
17,3
1,7 4,
0
12,7
6,7
3,0
22,8
0
5
10
15
20
25
Africa Asia Europe Latin America NorthAmerica
Oceania
Million he
ctares
Growth of the organic agricultural land by continent 2006‐2015Source: FiBL‐IFOAM survey 2008‐2017
2007 2009 2011 2013 2015
www.fibl.org
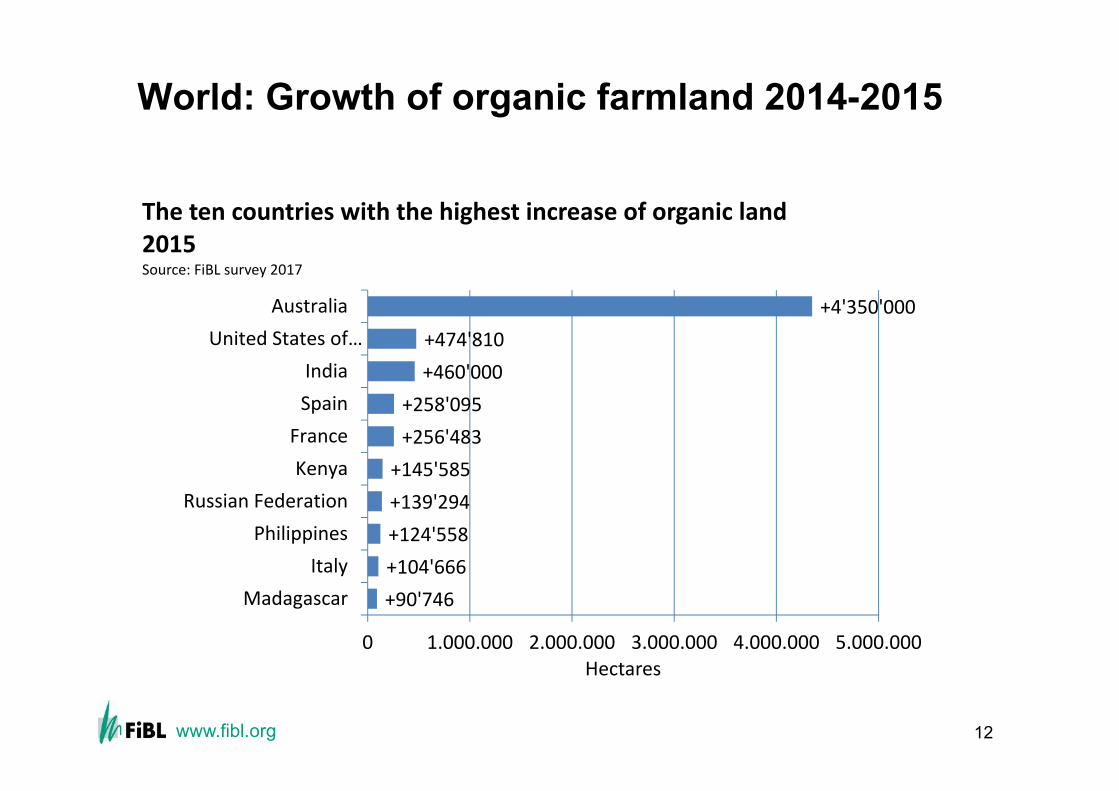
World: Growth of organic farmland 2014-2015
12
+90'746+104'666+124'558+139'294+145'585+256'483+258'095+460'000+474'810
+4'350'000
0 1.000.000 2.000.000 3.000.000 4.000.000 5.000.000
MadagascarItaly
PhilippinesRussian Federation
KenyaFranceSpainIndia
United States of…Australia
Hectares
The ten countries with the highest increase of organic land 2015Source: FiBL survey 2017
www.fibl.org
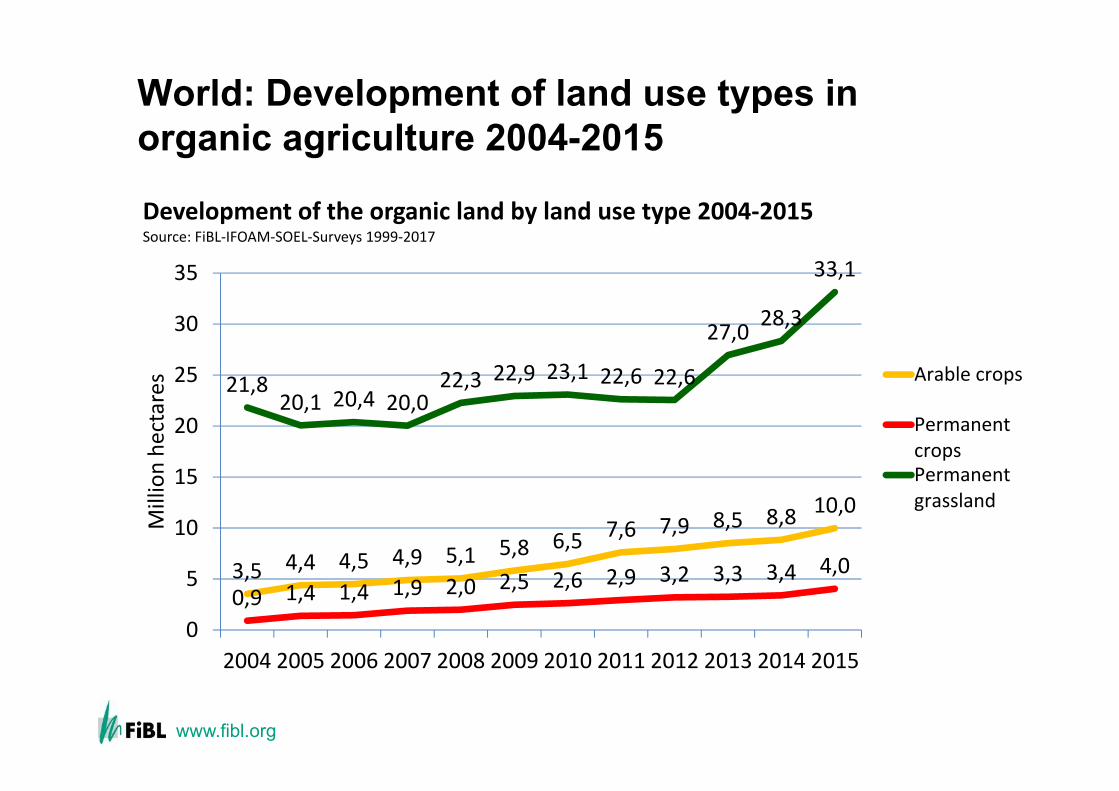
World: Development of land use types in organic agriculture 2004-2015
3,5 4,4 4,5 4,9 5,1 5,8 6,5 7,6 7,9 8,5 8,8 10,0
0,9 1,4 1,4 1,9 2,0 2,5 2,6 2,9 3,2 3,3 3,4 4,0
21,820,1 20,4 20,0
22,3 22,9 23,1 22,6 22,6
27,0 28,3
33,1
0
5
10
15
20
25
30
35
2004 2005 2006 2007 2008 2009 2010 2011 2012 2013 2014 2015
Million he
ctares
Development of the organic land by land use type 2004‐2015Source: FiBL‐IFOAM‐SOEL‐Surveys 1999‐2017
Arable crops
PermanentcropsPermanentgrassland
www.fibl.org
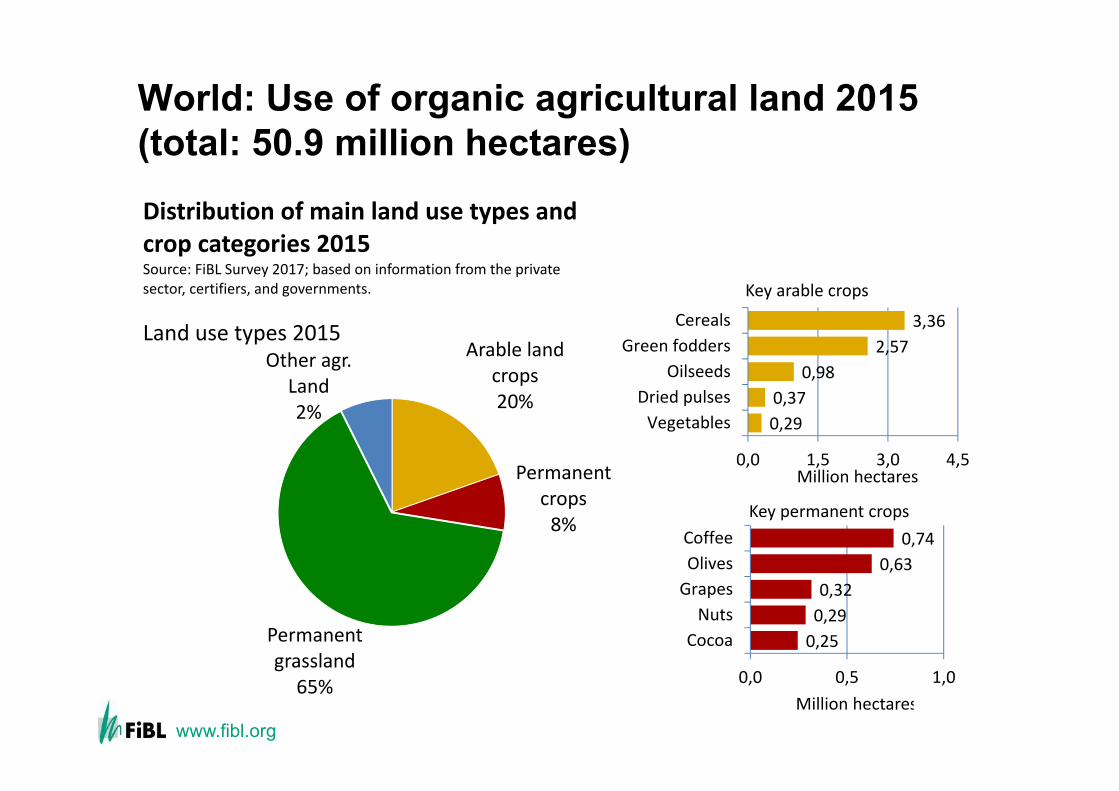
World: Use of organic agricultural land 2015 (total: 50.9 million hectares)
Arable land crops20%
Permanent crops8%
Permanent grassland
65%
Other agr. Land2%
Distribution of main land use types and crop categories 2015Source: FiBL Survey 2017; based on information from the private sector, certifiers, and governments.
Land use types 2015
0,290,37
0,982,57
3,36
0,0 1,5 3,0 4,5
VegetablesDried pulses
OilseedsGreen fodders
Cereals
Million hectares
Key arable crops
0,250,290,32
0,630,74
0,0 0,5 1,0
CocoaNuts
GrapesOlivesCoffee
Million hectares
Key permanent crops
www.fibl.org
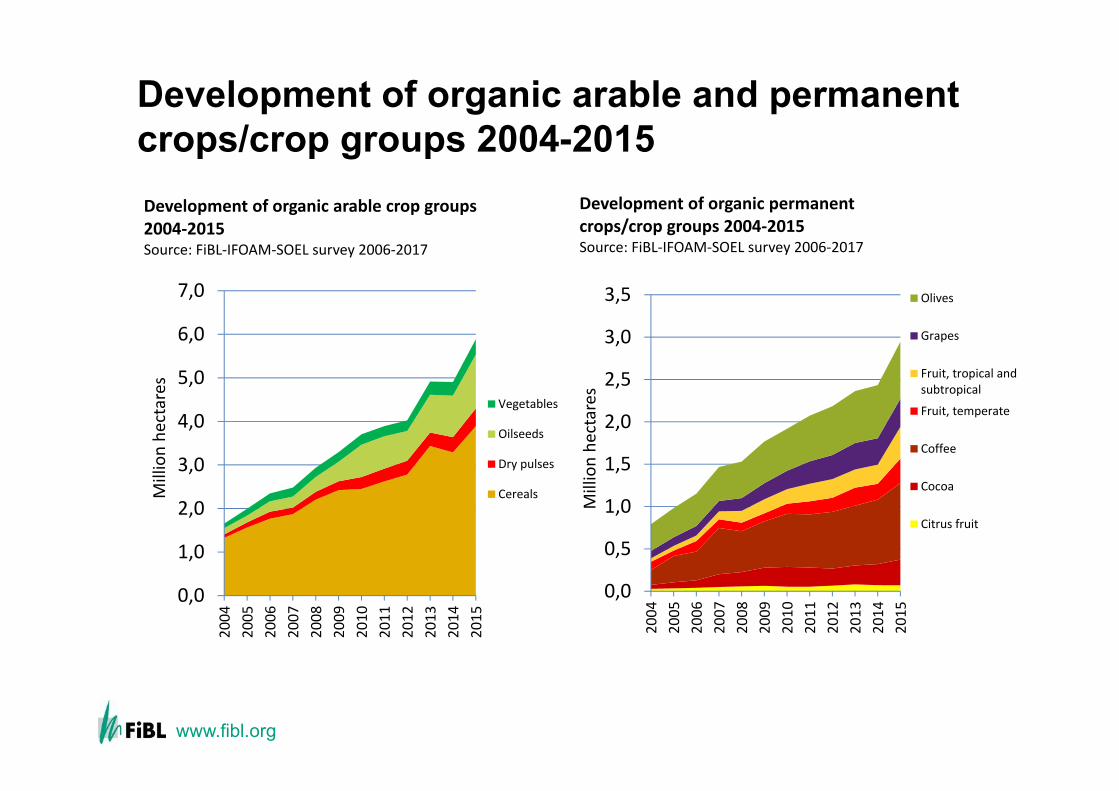
Development of organic arable and permanent crops/crop groups 2004-2015
0,0
1,0
2,0
3,0
4,0
5,0
6,0
7,0
2004
2005
2006
2007
2008
2009
2010
2011
2012
2013
2014
2015
Million he
ctares
Development of organic arable crop groups 2004‐2015Source: FiBL‐IFOAM‐SOEL survey 2006‐2017
Vegetables
Oilseeds
Dry pulses
Cereals
0,0
0,5
1,0
1,5
2,0
2,5
3,0
3,5
2004
2005
2006
2007
2008
2009
2010
2011
2012
2013
2014
2015
Million he
ctares
Development of organic permanent crops/crop groups 2004‐2015Source: FiBL‐IFOAM‐SOEL survey 2006‐2017
Olives
Grapes
Fruit, tropical andsubtropical
Fruit, temperate
Coffee
Cocoa
Citrus fruit
www.fibl.org
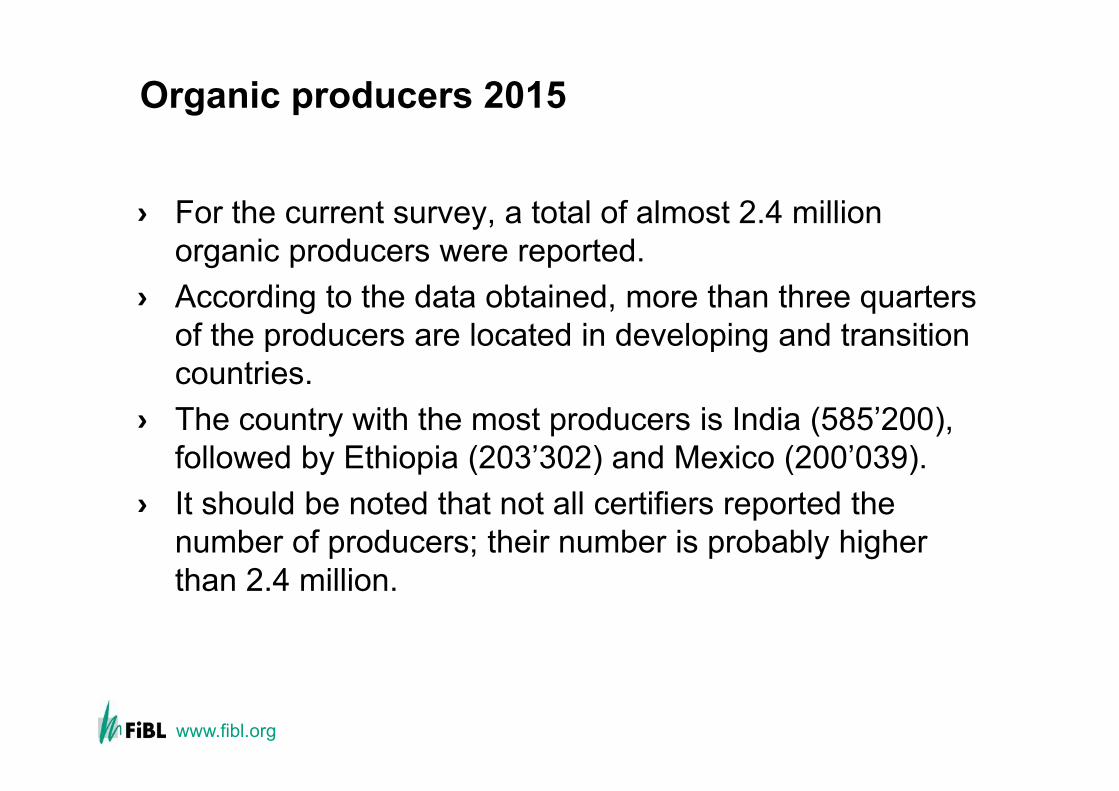
Organic producers 2015
› For the current survey, a total of almost 2.4 million organic producers were reported.
› According to the data obtained, more than three quarters of the producers are located in developing and transition countries.
› The country with the most producers is India (585’200), followed by Ethiopia (203’302) and Mexico (200’039).
› It should be noted that not all certifiers reported the number of producers; their number is probably higher than 2.4 million.
www.fibl.org
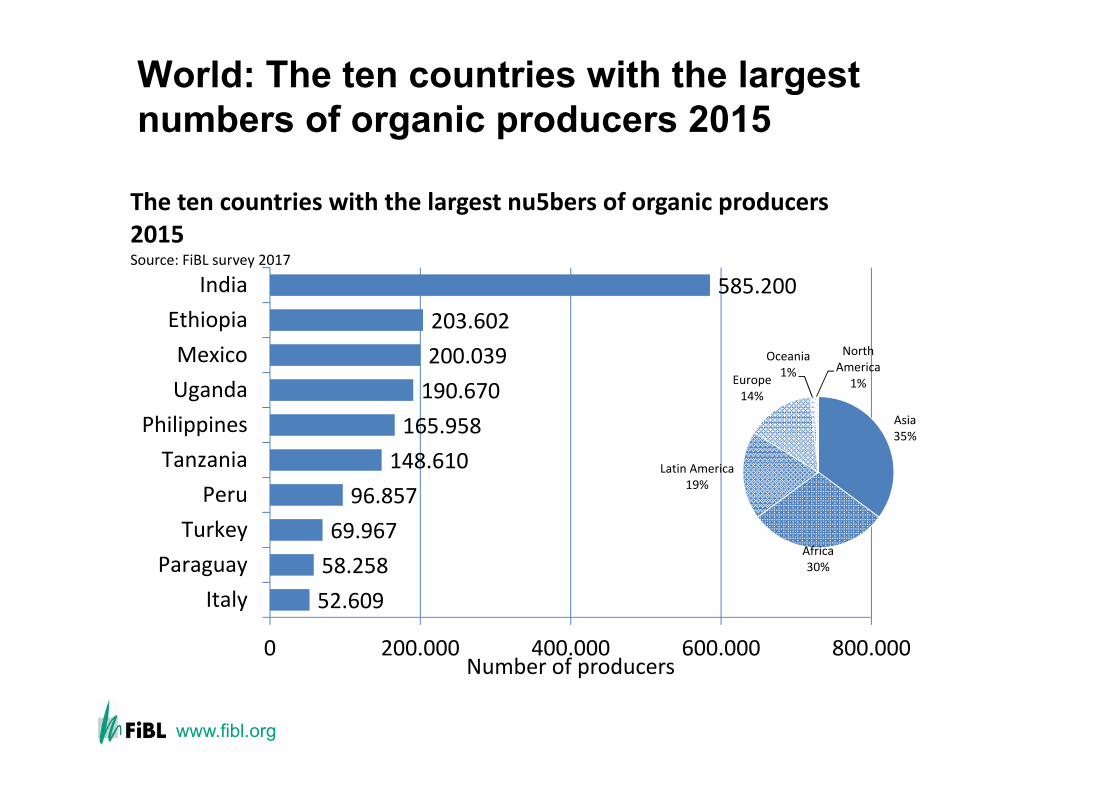
World: The ten countries with the largestnumbers of organic producers 2015
52.60958.25869.96796.857
148.610165.958190.670200.039203.602
585.200
0 200.000 400.000 600.000 800.000
ItalyParaguay
TurkeyPeru
TanzaniaPhilippines
UgandaMexicoEthiopia
India
Number of producers
The ten countries with the largest nu5bers of organic producers 2015Source: FiBL survey 2017
Asia35%
Africa30%
Latin America19%
Europe14%
Oceania1%
North America
1%
www.fibl.org
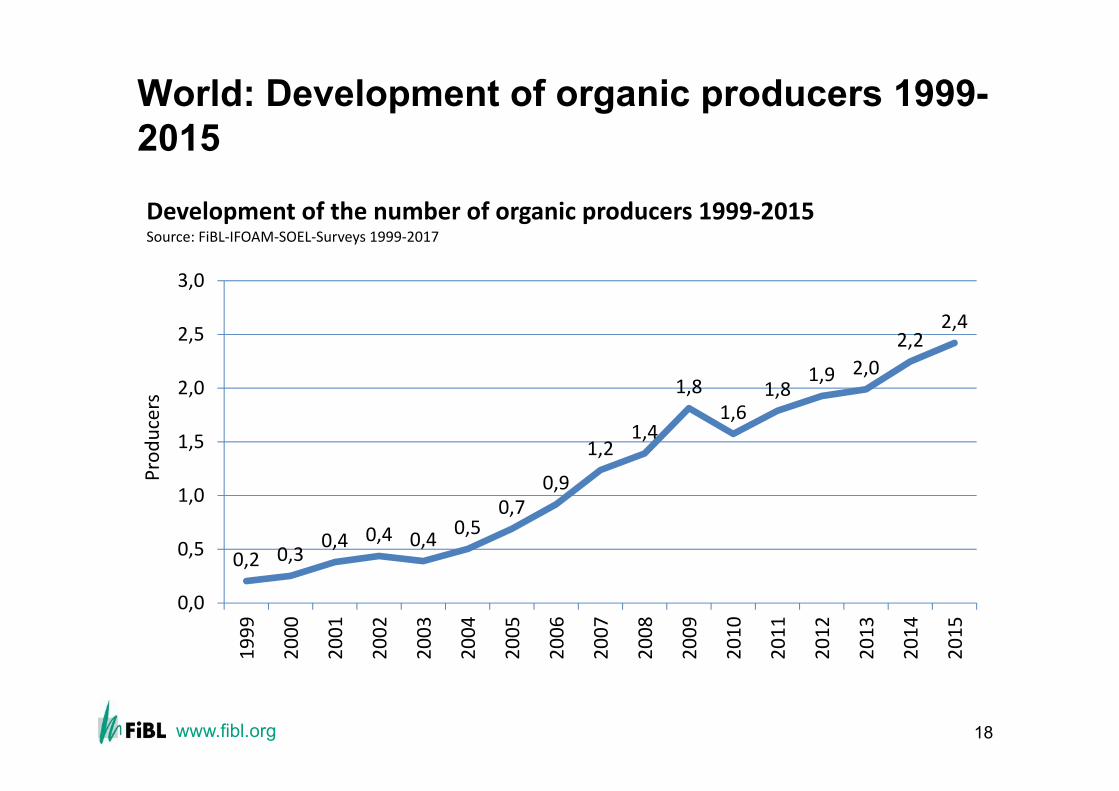
World: Development of organic producers 1999-2015
18
0,2 0,30,4 0,4 0,4 0,5
0,70,9
1,21,4
1,81,6
1,81,9 2,0
2,22,4
0,0
0,5
1,0
1,5
2,0
2,5
3,0
1999
2000
2001
2002
2003
2004
2005
2006
2007
2008
2009
2010
2011
2012
2013
2014
2015
Prod
ucers
Development of the number of organic producers 1999‐2015Source: FiBL‐IFOAM‐SOEL‐Surveys 1999‐2017
www.fibl.org
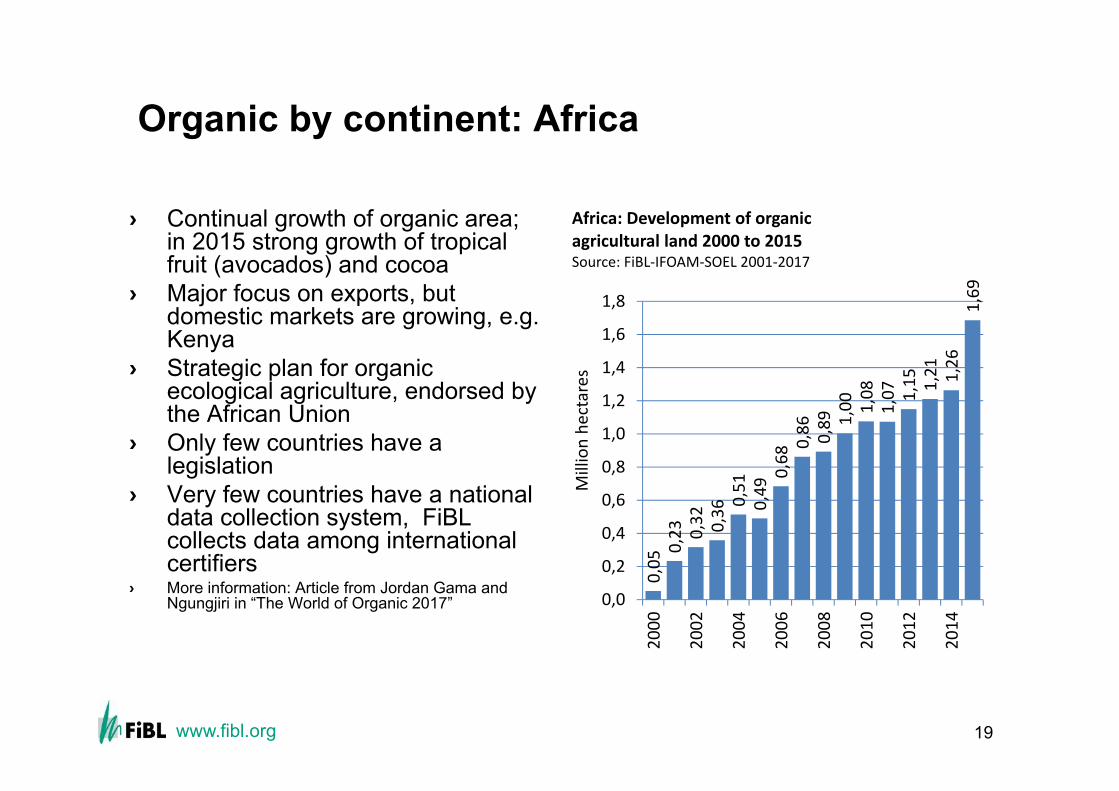
Organic by continent: Africa
› Continual growth of organic area; in 2015 strong growth of tropical fruit (avocados) and cocoa
› Major focus on exports, but domestic markets are growing, e.g. Kenya
› Strategic plan for organic ecological agriculture, endorsed by the African Union
› Only few countries have a legislation
› Very few countries have a national data collection system, FiBL collects data among international certifiers
› More information: Article from Jordan Gama and Ngungjiri in “The World of Organic 2017”
19
0,050,23 0,32 0,360,51
0,490,680,86 0,89 1,
00 1,08
1,07 1,15 1,21 1,26
1,69
0,0
0,2
0,4
0,6
0,8
1,0
1,2
1,4
1,6
1,8
2000
2002
2004
2006
2008
2010
2012
2014
Million he
ctares
Africa: Development of organic agricultural land 2000 to 2015Source: FiBL‐IFOAM‐SOEL 2001‐2017
www.fibl.org
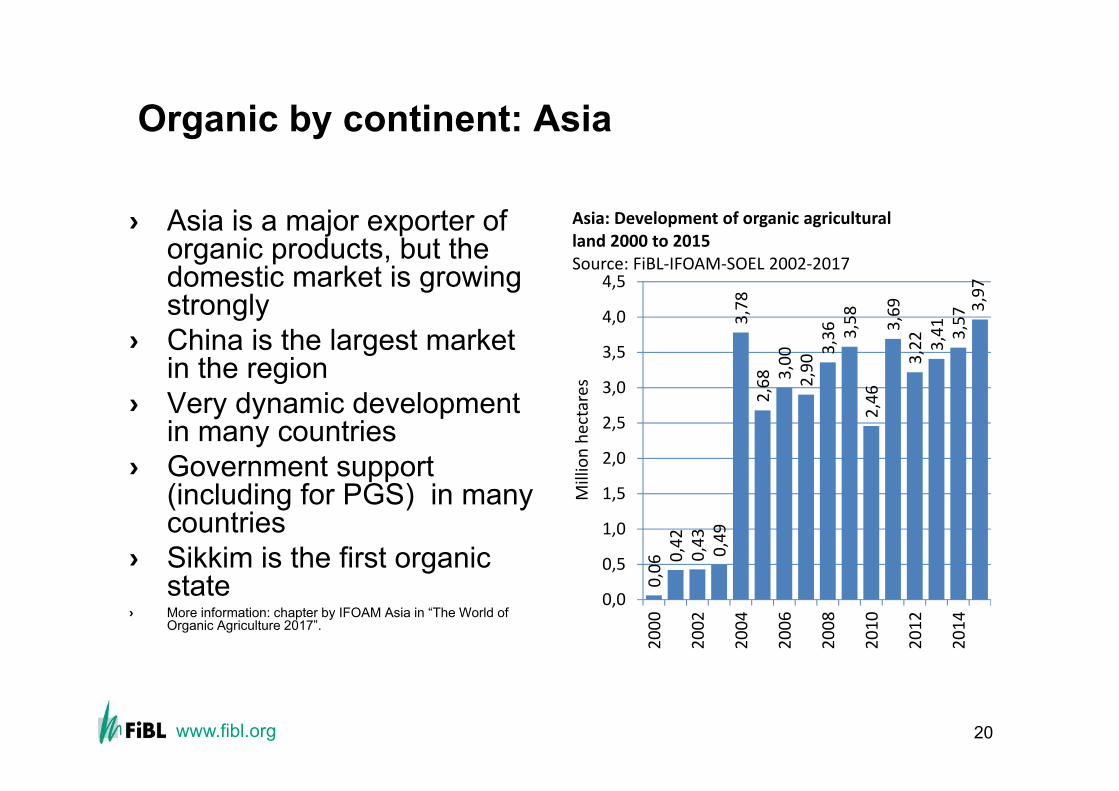
Organic by continent: Asia
› Asia is a major exporter of organic products, but the domestic market is growing strongly
› China is the largest market in the region
› Very dynamic development in many countries
› Government support (including for PGS) in many countries
› Sikkim is the first organic state
› More information: chapter by IFOAM Asia in “The World of Organic Agriculture 2017”.
20
0,06 0,
420,43 0,49
3,78
2,68 3,
002,90
3,36 3,58
2,46
3,69
3,22 3,41 3,573,97
0,0
0,5
1,0
1,5
2,0
2,5
3,0
3,5
4,0
4,5
2000
2002
2004
2006
2008
2010
2012
2014
Million he
ctares
Asia: Development of organic agricultural land 2000 to 2015Source: FiBL‐IFOAM‐SOEL 2002‐2017
www.fibl.org
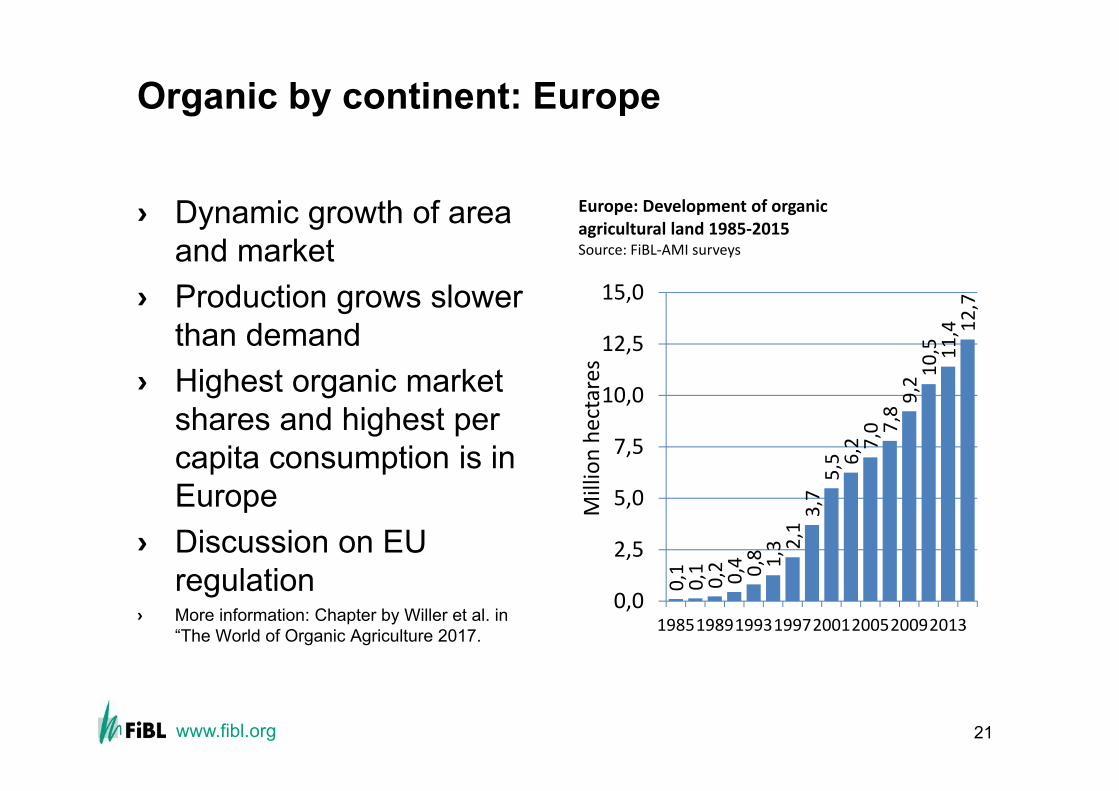
Organic by continent: Europe
› Dynamic growth of area and market
› Production grows slower than demand
› Highest organic market shares and highest per capita consumption is in Europe
› Discussion on EU regulation
› More information: Chapter by Willer et al. in “The World of Organic Agriculture 2017.
21
0,1
0,1
0,2 0,4 0,8 1,3 2,13,75,5 6,2 7,0 7,89,2 10
,5 11,4 12
,7
0,0
2,5
5,0
7,5
10,0
12,5
15,0
19851989199319972001200520092013
Million he
ctares
Europe: Development of organic agricultural land 1985‐2015Source: FiBL‐AMI surveys
www.fibl.org
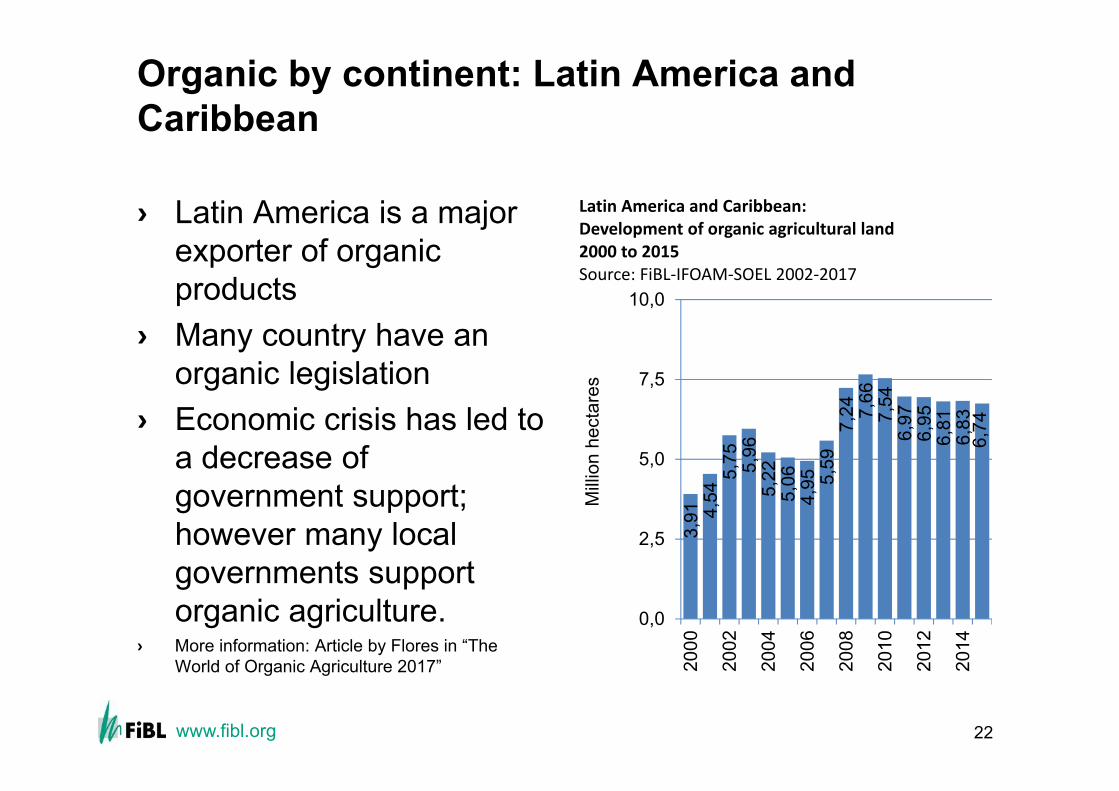
Organic by continent: Latin America andCaribbean
› Latin America is a major exporter of organic products
› Many country have an organic legislation
› Economic crisis has led to a decrease of government support; however many local governments support organic agriculture.
› More information: Article by Flores in “The World of Organic Agriculture 2017”
22
3,91 4,
545,
75 5,96
5,22
5,06
4,95 5,
597,
24 7,66
7,54
6,97
6,95
6,81
6,83
6,74
0,0
2,5
5,0
7,5
10,0
2000
2002
2004
2006
2008
2010
2012
2014
Milli
on h
ecta
res
Latin America and Caribbean: Development of organic agricultural land 2000 to 2015Source: FiBL‐IFOAM‐SOEL 2002‐2017
www.fibl.org
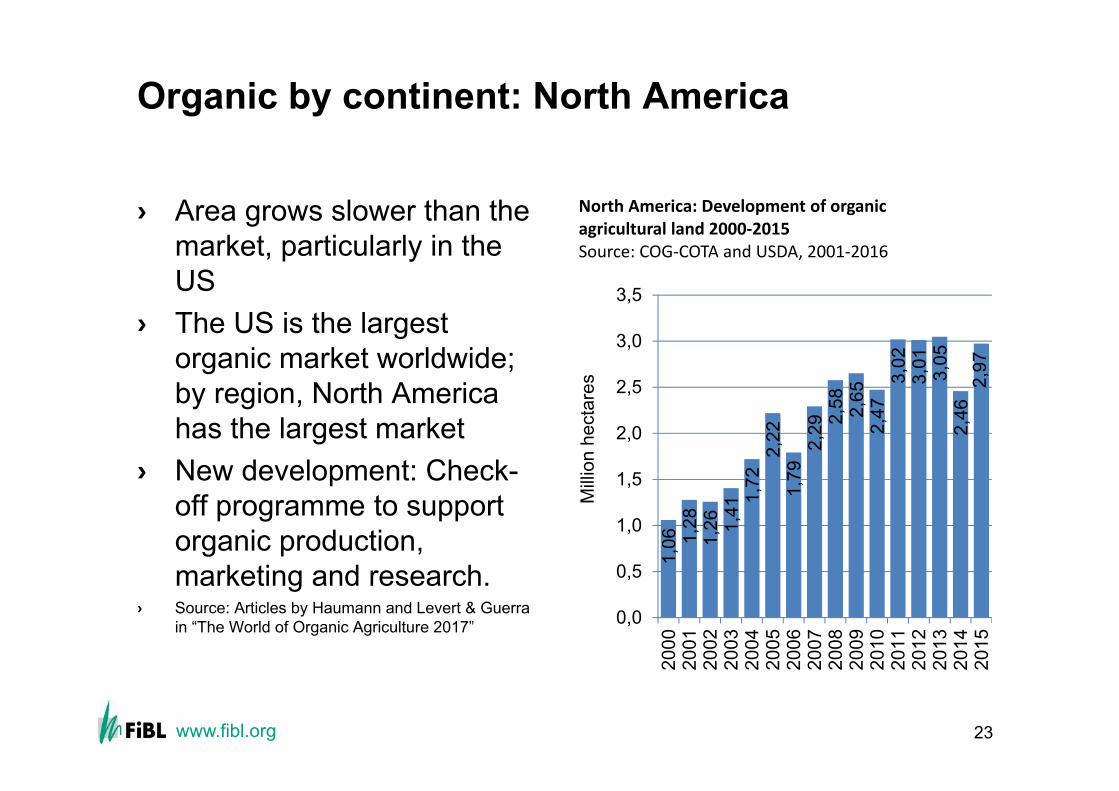
Organic by continent: North America
› Area grows slower than the market, particularly in the US
› The US is the largest organic market worldwide; by region, North America has the largest market
› New development: Check-off programme to support organic production, marketing and research.
› Source: Articles by Haumann and Levert & Guerra in “The World of Organic Agriculture 2017”
23
1,06 1,
281,
26 1,41
1,72
2,22
1,79
2,29 2,
58 2,65
2,47
3,02
3,01 3,05
2,46
2,97
0,0
0,5
1,0
1,5
2,0
2,5
3,0
3,5
2000
2001
2002
2003
2004
2005
2006
2007
2008
2009
2010
2011
2012
2013
2014
2015
Milli
on h
ecta
res
North America: Development of organic agricultural land 2000‐2015Source: COG‐COTA and USDA, 2001‐2016
www.fibl.org
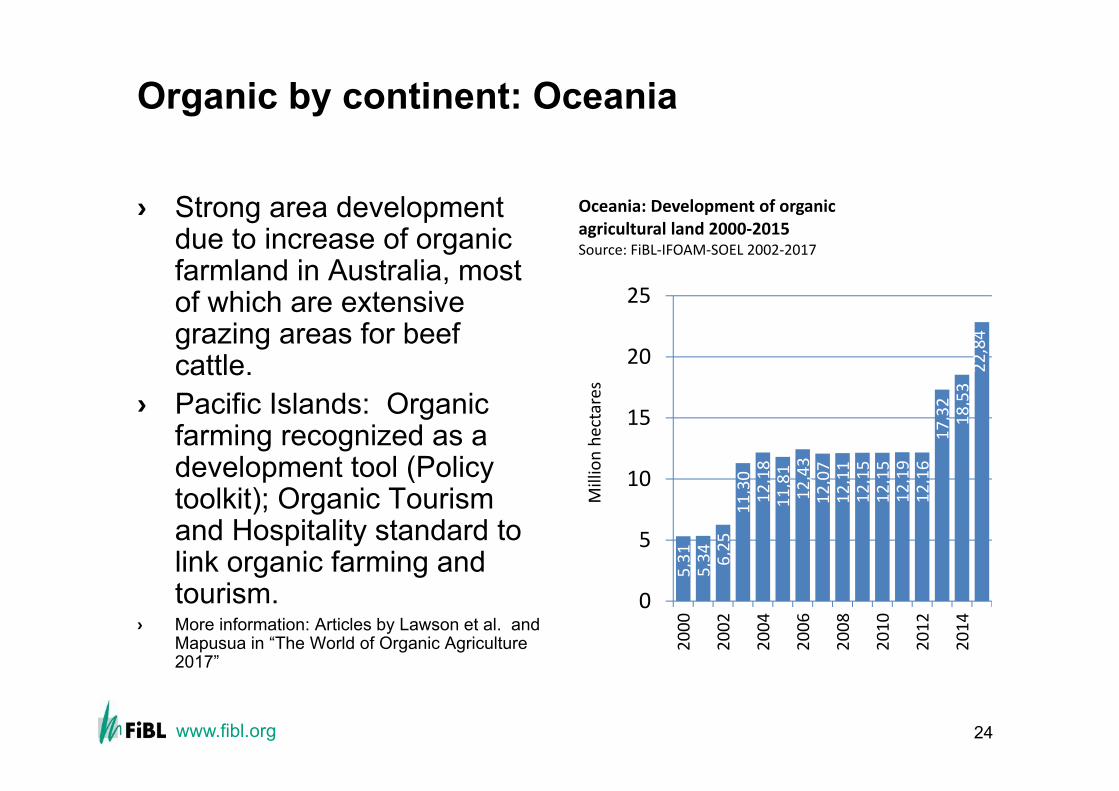
Organic by continent: Oceania
› Strong area development due to increase of organic farmland in Australia, most of which are extensive grazing areas for beef cattle.
› Pacific Islands: Organic farming recognized as a development tool (Policy toolkit); Organic Tourism and Hospitality standard to link organic farming and tourism.
› More information: Articles by Lawson et al. and Mapusua in “The World of Organic Agriculture 2017”
24
5,31
5,34 6,25
11,30
12,18
11,81
12,43
12,07
12,11
12,15
12,15
12,19
12,16
17,32
18,53
22,84
0
5
10
15
20
25
2000
2002
2004
2006
2008
2010
2012
2014
Million he
ctares
Oceania: Development of organic agricultural land 2000‐2015Source: FiBL‐IFOAM‐SOEL 2002‐2017
www.fibl.org
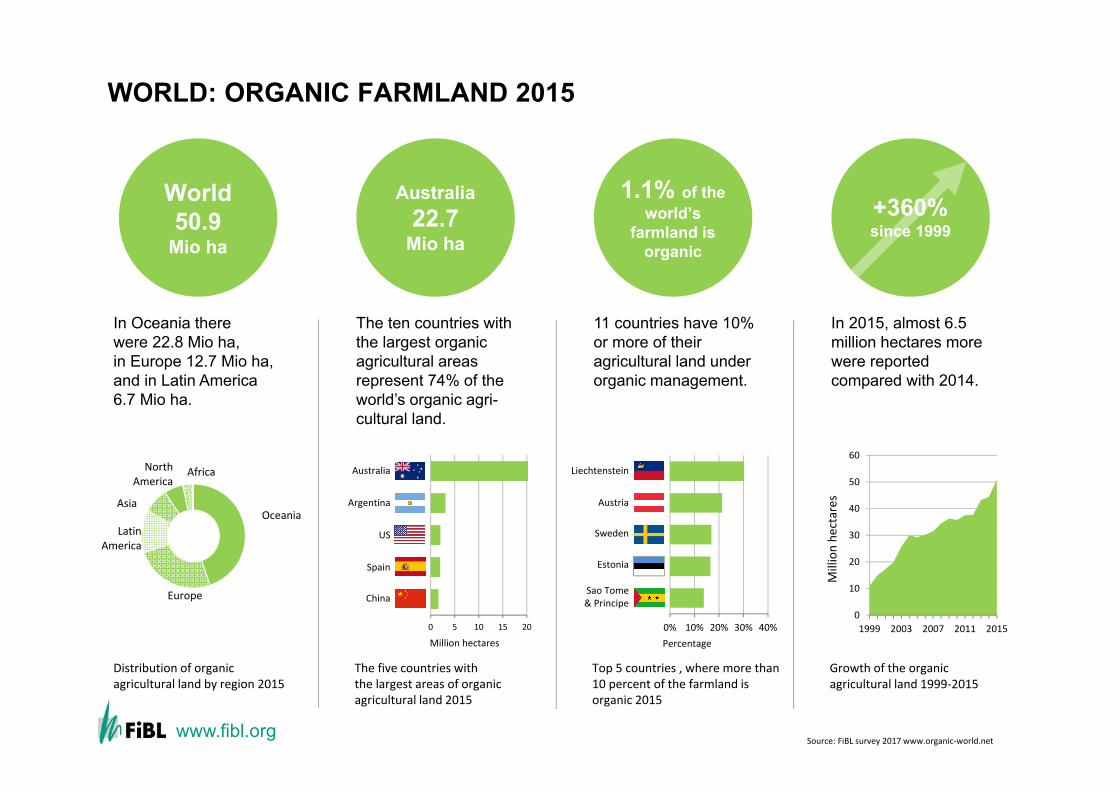
WORLD: ORGANIC FARMLAND 2015
Oceania
Europe
Latin America
Asia
North America
Africa
0 5 10 15 20
1
2
3
4
5
Million hectares0% 10% 20% 30% 40%
0
10
20
30
40
50
60
1999 2003 2007 2011 2015
Million he
ctares
1.1% of the world’s
farmland is organic
World50.9
Mio ha
Australia 22.7
Mio ha
In Oceania there were 22.8 Mio ha, in Europe 12.7 Mio ha, and in Latin America 6.7 Mio ha.
The ten countries with the largest organic agricultural areas represent 74% of the world’s organic agri-cultural land.
11 countries have 10% or more of their agricultural land under organic management.
In 2015, almost 6.5 million hectares morewere reported compared with 2014.
Source: FiBL survey 2017 www.organic‐world.net
Distribution of organic agricultural land by region 2015
The five countries with the largest areas of organic agricultural land 2015
Top 5 countries , where more than10 percent of the farmland is organic 2015
Growth of the organic agricultural land 1999‐2015
Argentina
US
Spain
China
Australia Liechtenstein
Sao Tome & Principe
Estonia
Sweden
Austria
Percentage
+360% since 1999
www.fibl.org
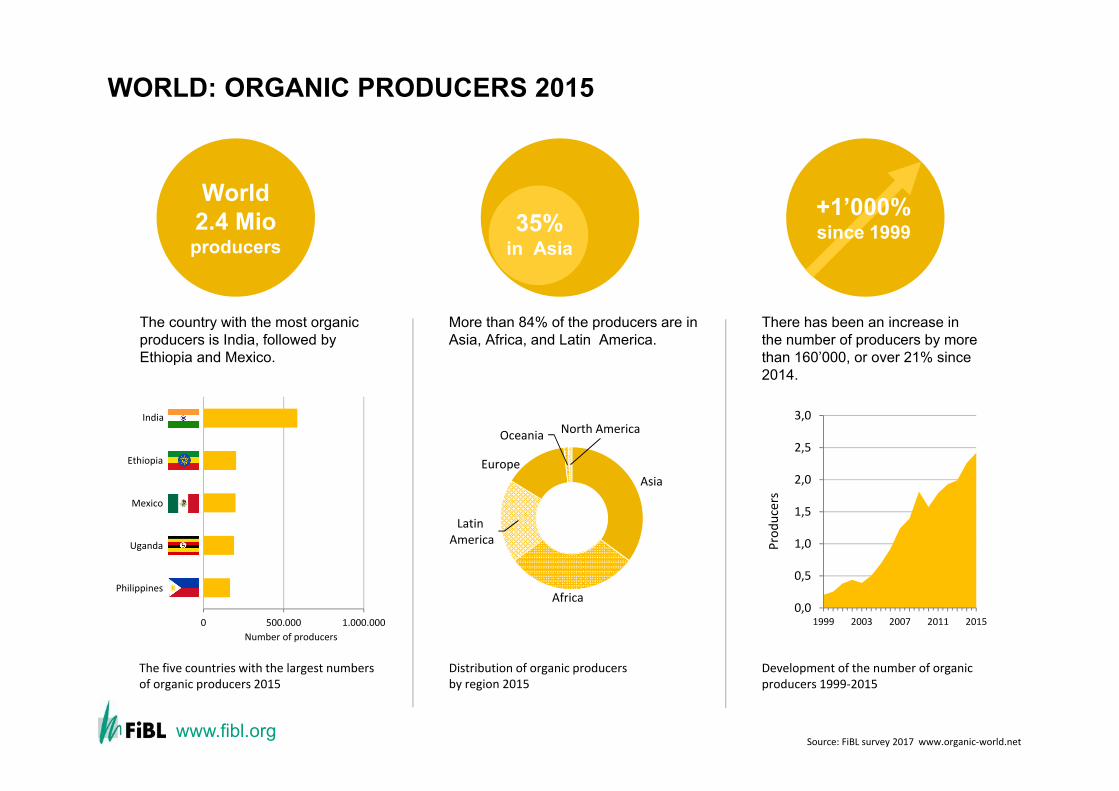
WORLD: ORGANIC PRODUCERS 2015
Asia
Africa
Latin America
Europe
Oceania North America
0 500.000 1.000.000
1
2
3
4
5
Number of producers
0,0
0,5
1,0
1,5
2,0
2,5
3,0
1999 2003 2007 2011 2015
Prod
ucers
World2.4 Mio producers
The country with the most organic producers is India, followed by Ethiopia and Mexico.
More than 84% of the producers are in Asia, Africa, and Latin America.
There has been an increase in the number of producers by more than 160’000, or over 21% since 2014.
The five countries with the largest numbers of organic producers 2015
Distribution of organic producers by region 2015
Development of the number of organic producers 1999‐2015
Source: FiBL survey 2017 www.organic‐world.net
India
Ethiopia
Mexico
Uganda
Philippines
35% in Asia
+1’000% since 1999
www.fibl.org
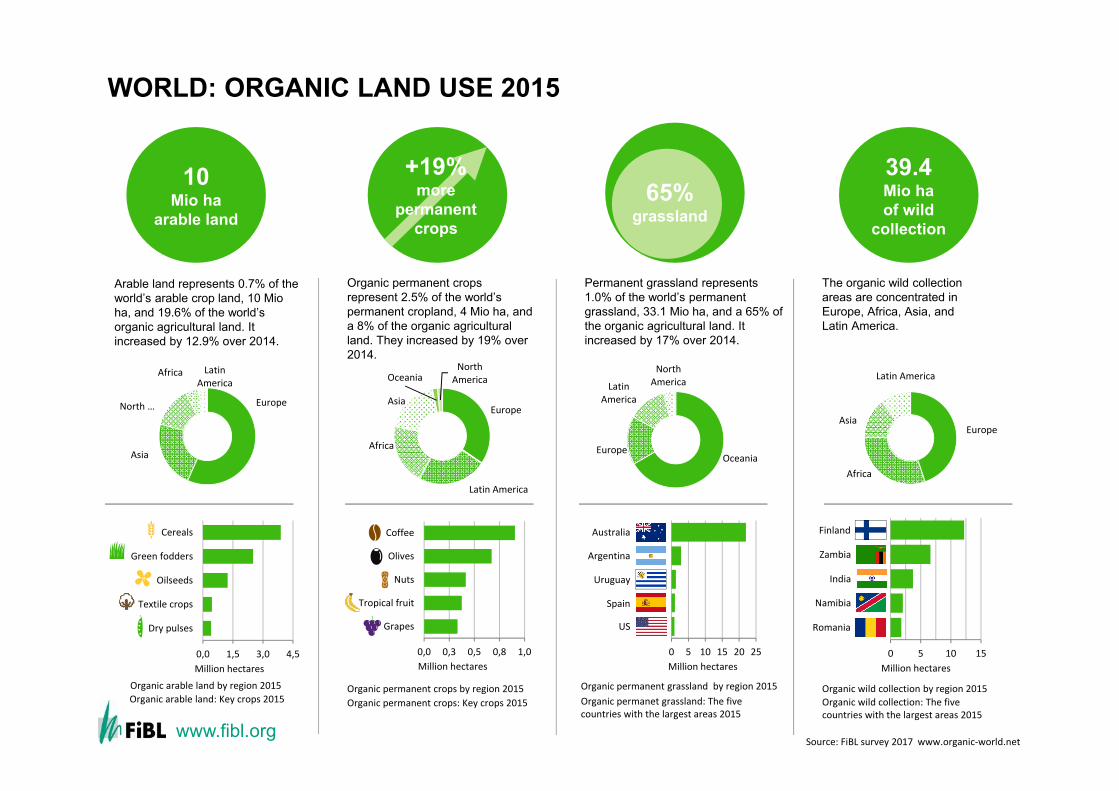
WORLD: ORGANIC LAND USE 2015
10 Mio ha
arable land
0,0 1,5 3,0 4,5
Dry pulses
Textile crops
Oilseeds
Green fodders
Cereals
Million hectares
Europe
Asia
North …
Africa Latin America
0,0 0,3 0,5 0,8 1,0
Grapes
Tropical fruit
Nuts
Olives
Coffee
Million hectares
Europe
Latin America
Africa
Asia
OceaniaNorth
America
39.4Mio ha of wild
collection
The organic wild collection areas are concentrated in Europe, Africa, Asia, and Latin America.
Europe
Africa
Asia
Latin America
0 5 10 15
1
2
3
4
5
Million hectares
Permanent grassland represents 1.0% of the world’s permanent grassland, 33.1 Mio ha, and a 65% of the organic agricultural land. It increased by 17% over 2014.
Organic permanent crops represent 2.5% of the world’s permanent cropland, 4 Mio ha, and a 8% of the organic agricultural land. They increased by 19% over 2014.
Arable land represents 0.7% of the world’s arable crop land, 10 Mio ha, and 19.6% of the world’s organic agricultural land. It increased by 12.9% over 2014.
OceaniaEurope
Latin America
North America
0 5 10 15 20 25
1
2
3
4
5
Million hectares
Organic permanent grassland by region 2015Organic arable land by region 2015 Organic permanent crops by region 2015 Organic wild collection by region 2015Organic wild collection: The five countries with the largest areas 2015
Organic permanent crops: Key crops 2015Organic arable land: Key crops 2015 Organic permanet grassland: The fivecountries with the largest areas 2015
Source: FiBL survey 2017 www.organic‐world.net
Australia
Argentina
Uruguay
Spain
US
Finland
Zambia
India
Namibia
Romania
63% grassland
+19% more
permanent crops
65% grassland
www.fibl.org
www.fibl.org
Resources
› «The World of Organic Agriculture» at www.organic-world.net
› Print version: shop.fibl.org› Slides and infographics at www.organic-world.net› Interactive maps at www.organic-world.net› Interactive datatables at www.organic-world.net› Interactive infographics at www.ifoam-eu.org› Twitter.com/fiblstatistics
29
www.fibl.org
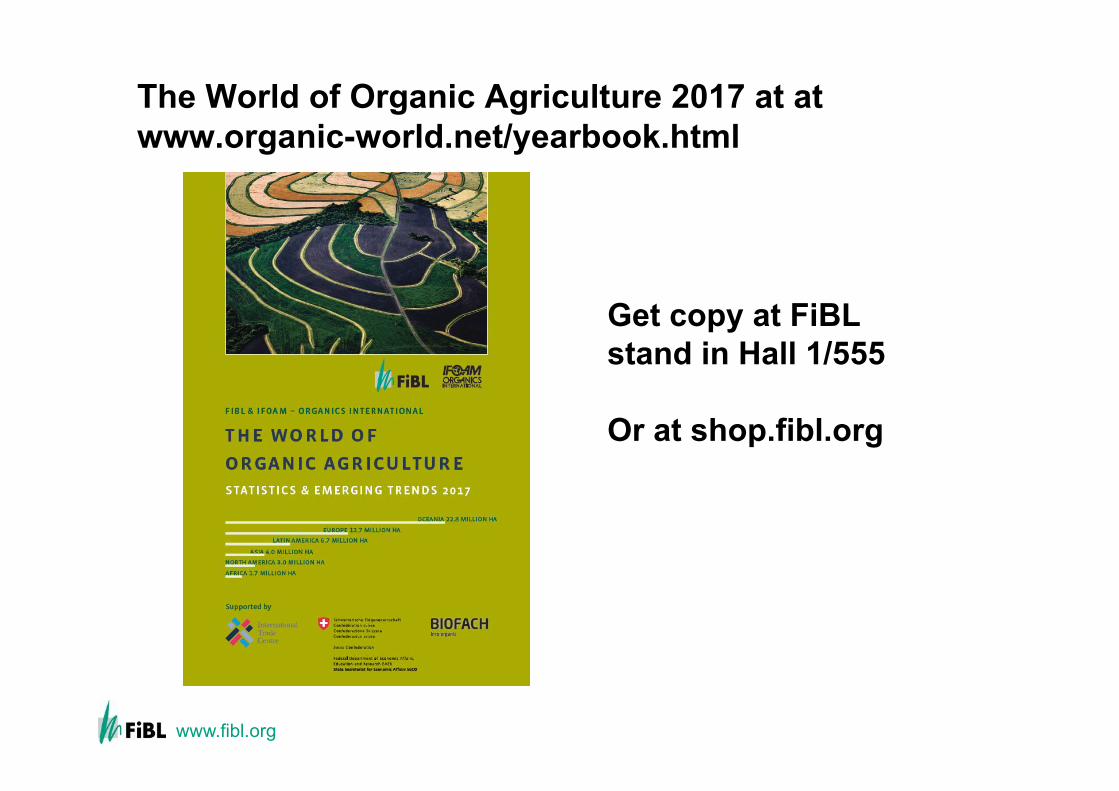
The World of Organic Agriculture 2017 at at www.organic-world.net/yearbook.html
Get copy at FiBL stand in Hall 1/555
Or at shop.fibl.org

www.fibl.org
Slide presentations at www.organic-world.net/yearbook.html
31
www.fibl.org
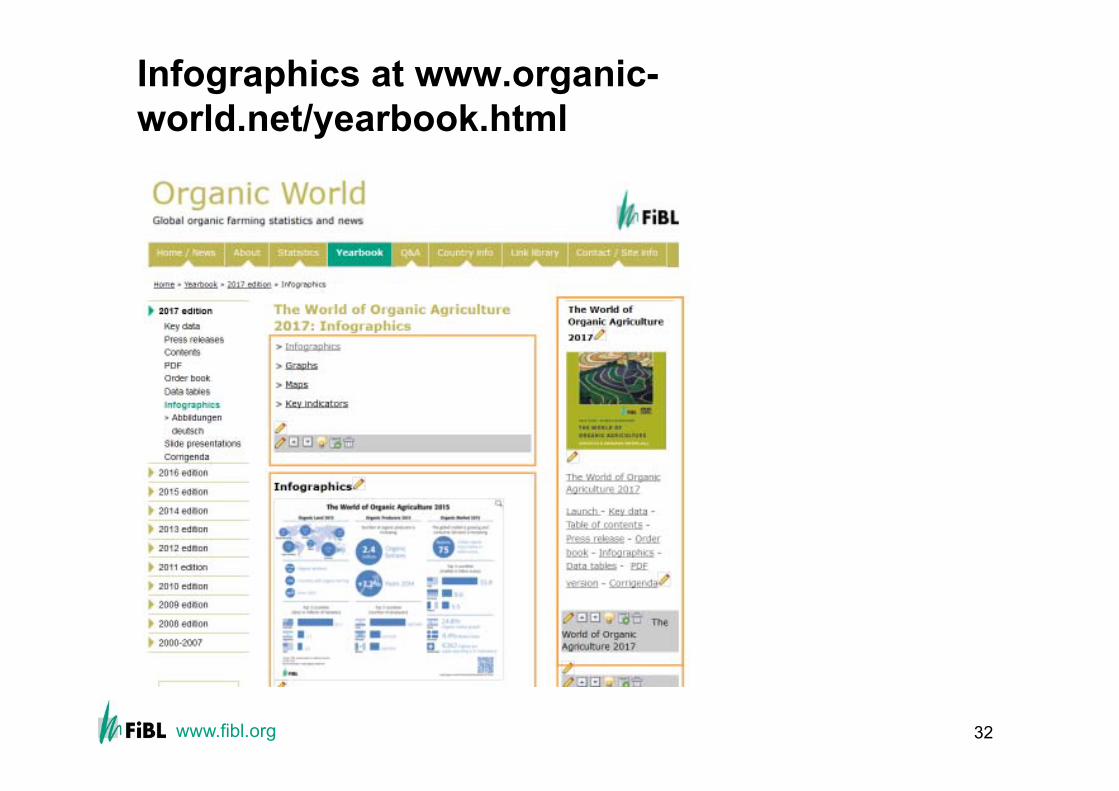
Infographics at www.organic-world.net/yearbook.html
32
www.fibl.org
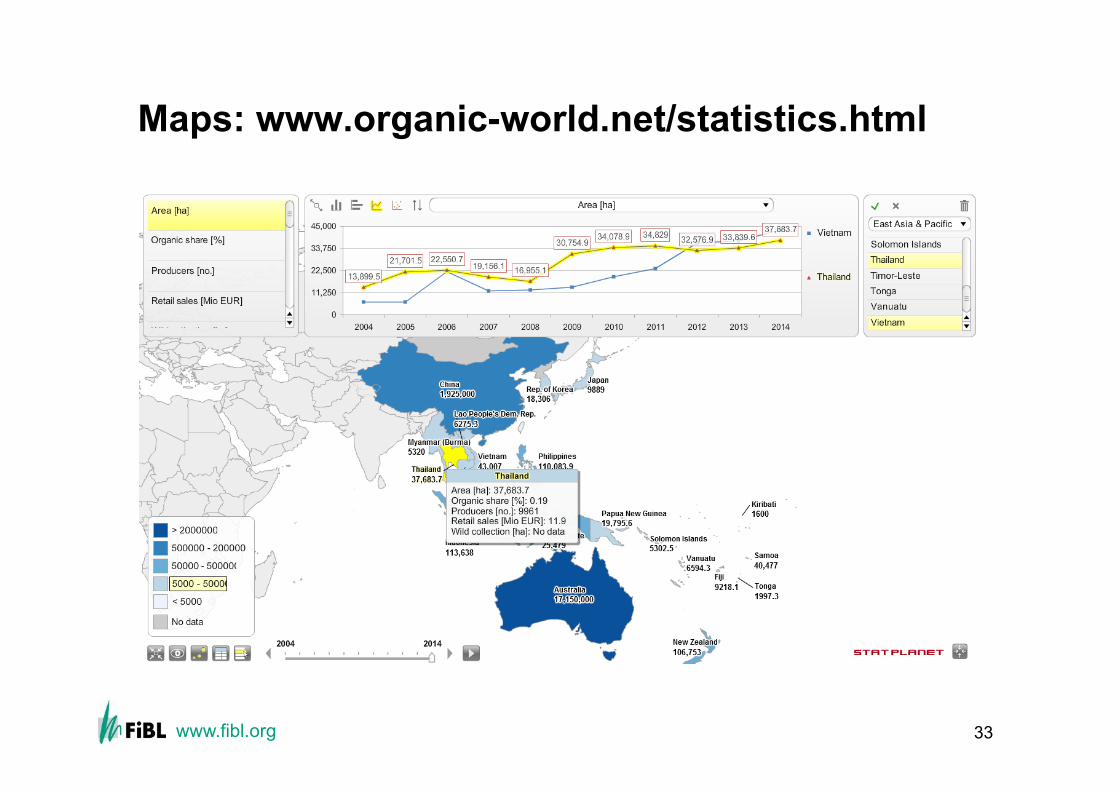
Maps: www.organic-world.net/statistics.html
33
www.fibl.org
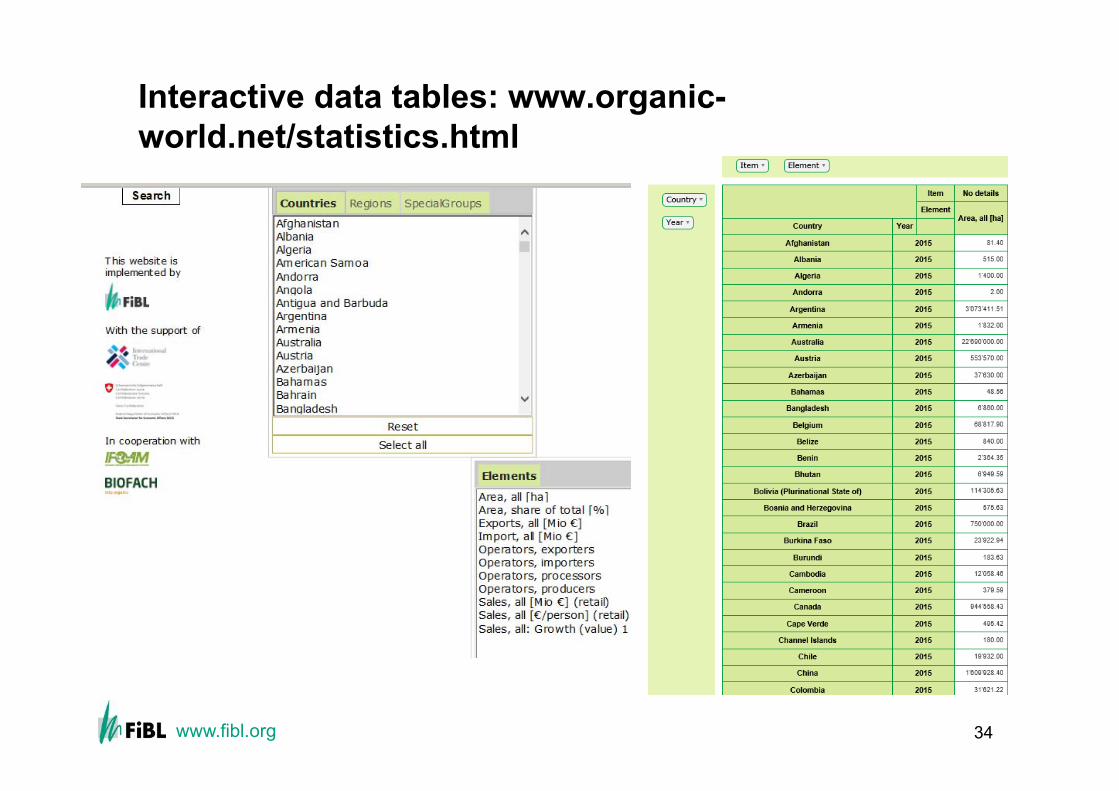
Interactive data tables: www.organic-world.net/statistics.html
34
www.fibl.org
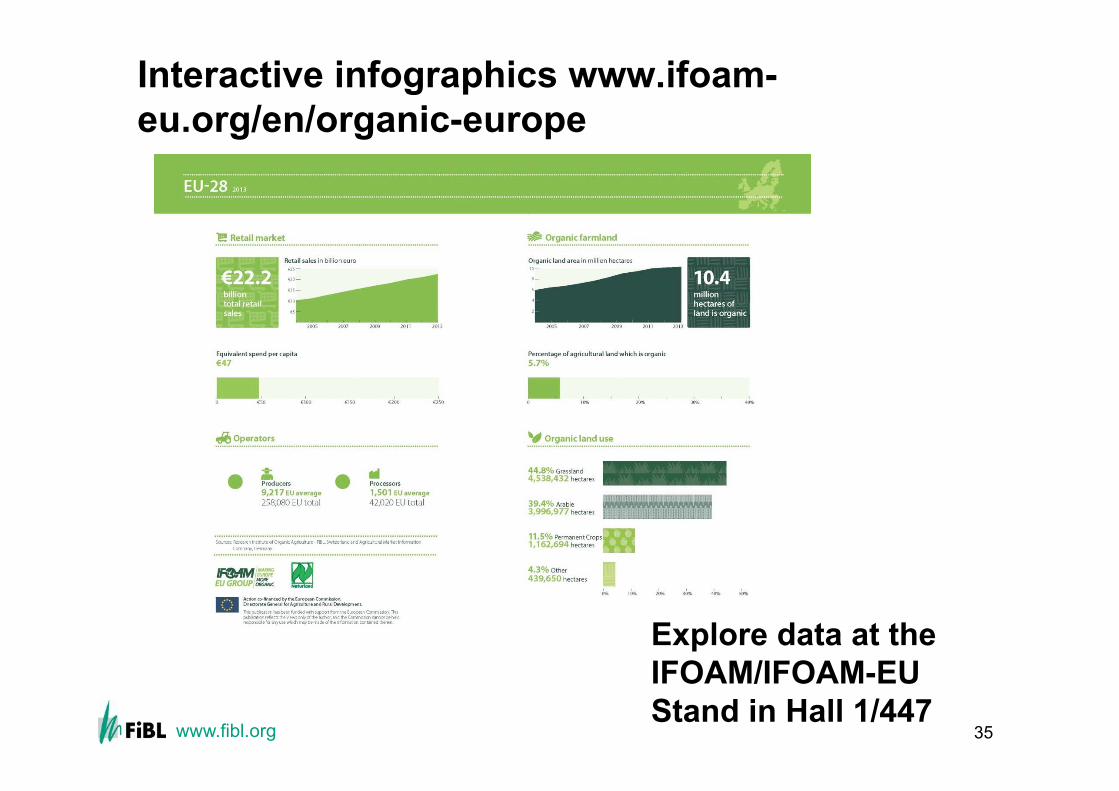
Interactive infographics www.ifoam-eu.org/en/organic-europe
35
Explore data at the IFOAM/IFOAM-EU Stand in Hall 1/447
www.fibl.org
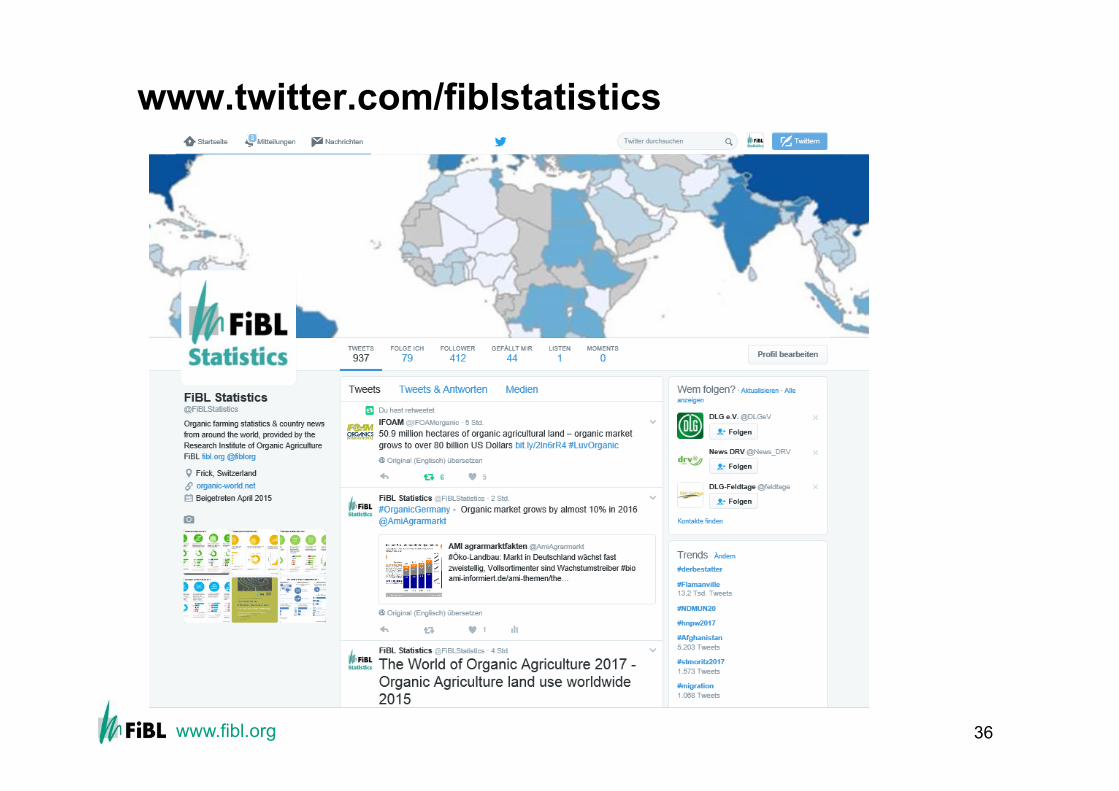
www.twitter.com/fiblstatistics
36
www.fibl.org
Conclusions
› In 2015 organic farming continued to grow: More organic farmland, more producers, market growth.
› However, the development varies a lot between countries and regions.
› The outlook on the organic markets continues to be good; there is scope for further growth. However, particularly in Europe, production is not keeping pace with the market development.
› For better monitoring of the development of the sector, data collection and processing need to be improved in many countries, in particular for market and international trade data.
www.fibl.org
Indicator World Leading countries Countries with data on certified organic agriculture 2015: 179 countries
New countries: Brunei Darussalam, Cape Verde, Hong Kong, Kuwait, Monaco, Sierra Leone, and Somalia
Organic agricultural land 2015: 50.9 million hectares (1999: 11 million hectares)
Australia (22.7 million hectares)Argentina (3.1 million hectares)United States (2 million hectares)
Share of total agricultural land
2015: 1.1 % Liechtenstein (30.2 %)Austria (21.3 %)Sweden (16.9%)
Further, non‐agricultural organic areas (mainly wild collection)
2015: 39.7 million hectares Finland (12.2 million hectares)Zambia (6.6 million hectares)India (3.7 million hectares)
Producers 2015: 2.3 million producers (1999: 200’000 producers)
India (585'200)Ethiopia (203'602)Mexico (200'039)
Organic market size
2015: 81.6 billion US dollars (approx. 75 billion euros)(2000: 17.9 billion US dollars)Source: Organic Monitor
US (39.7 billion US dollars; 35.8 billion euros)Germany (9.5 billion US dollars; 8.6 billion euros)France (6.1 billion US dollars; 5.5 billion euros)
Per capita consumption 2015: 11.1 US dollars (10.3 euros)Switzerland (291 US dollars; 262 euros) Denmark (212 US dollars; 191 euros)Sweden (196 US dollars; 177 euros)
Number of countries with organic regulations 2015 2016: 87 countries
Number of IFOAM affiliates 2016: 833 affiliates from 121 countries
Germany ‐ 91 affiliates; India ‐ 73 affiliates;China ‐ 55 affiliates; United States ‐ 49 affiliates
Related Documents