Welcome message from author
This document is posted to help you gain knowledge. Please leave a comment to let me know what you think about it! Share it to your friends and learn new things together.
Transcript
2
Contents
Organic farming statistics United Kingdom 2019 ........................................................ 1
Contents ..................................................................................................................... 2
What you need to know about this release ................................................................. 3
National Statistics Status ........................................................................................ 3
Section 1 – Detailed Results ...................................................................................... 4
1.1 Land area farmed organically ........................................................................ 4
1.2 Land in conversion ............................................................................................ 5
1.3 Organic land use ........................................................................................... 5
1.5 Organic Livestock ............................................................................................. 6
1.6 Number of organic producers and processors in the United Kingdom .............. 7

3
What you need to know about this release
Contact details
Responsible statistician: Sarah Thompson
Team: Farming Statistics - Department for Environment, Food and Rural Affairs
Email: [email protected]
Tel: 0300 060 0170
National Statistics Status
National Statistics status means that our statistics meet the highest standards of trustworthiness, quality and public value, and it is our responsibility to maintain compliance with these standards. The continued designation of these statistics as National Statistics was confirmed in 2014 following a full assessment by the UK Statistics Authority against the Code of Practice for Statistics. Since the last review of these statistics in 2014, we have continued to comply with the Code of Practice for Statistics, and have made improvements including:
Providing a detailed breakdown of livestock categories following user feedback Improved the data quality by updating guidance for data providers and carrying
out enhanced validation checks on data received
For general enquiries about National Statistics, contact the National Statistics Public Enquiry Service:
Tel: 0845 601 3034
Email: [email protected].
You can find National Statistics on the internet on the Gov.uk website.
4
Section 1 – Detailed Results
1.1 Land area farmed organically
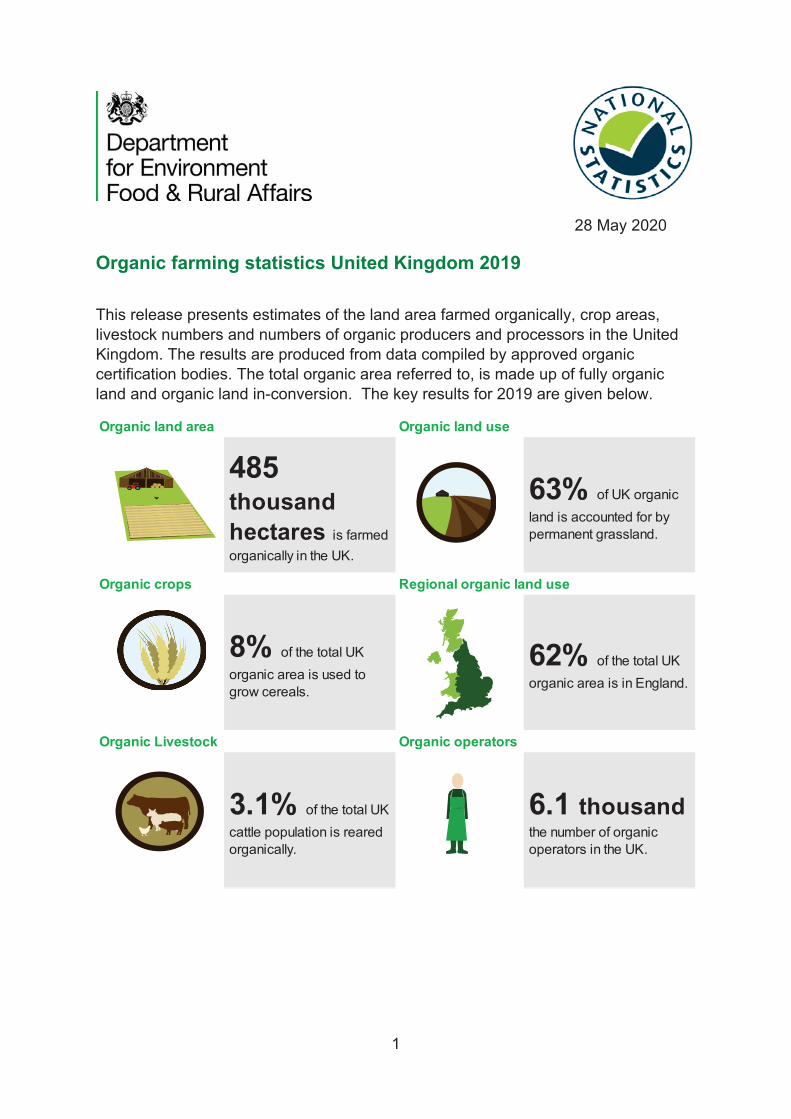
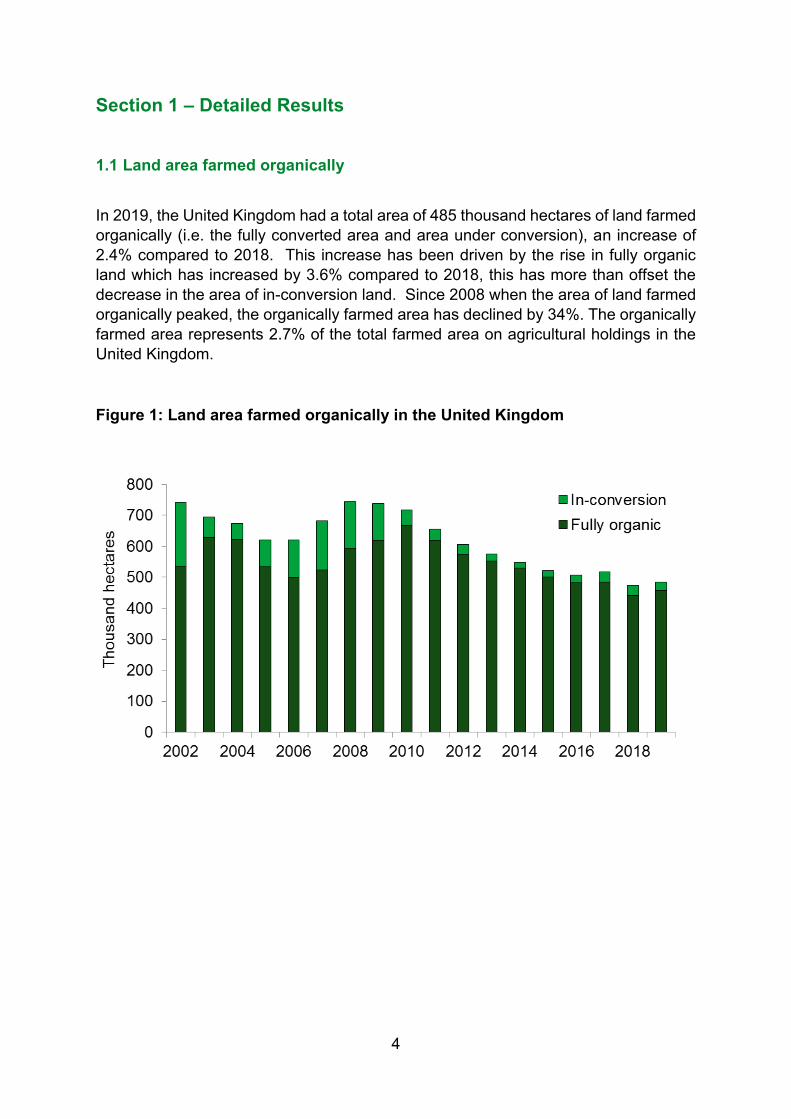
In 2019, the United Kingdom had a total area of 485 thousand hectares of land farmed organically (i.e. the fully converted area and area under conversion), an increase of 2.4% compared to 2018. This increase has been driven by the rise in fully organic land which has increased by 3.6% compared to 2018, this has more than offset the decrease in the area of in-conversion land. Since 2008 when the area of land farmed organically peaked, the organically farmed area has declined by 34%. The organically farmed area represents 2.7% of the total farmed area on agricultural holdings in the United Kingdom.
Figure 1: Land area farmed organically in the United Kingdom
5
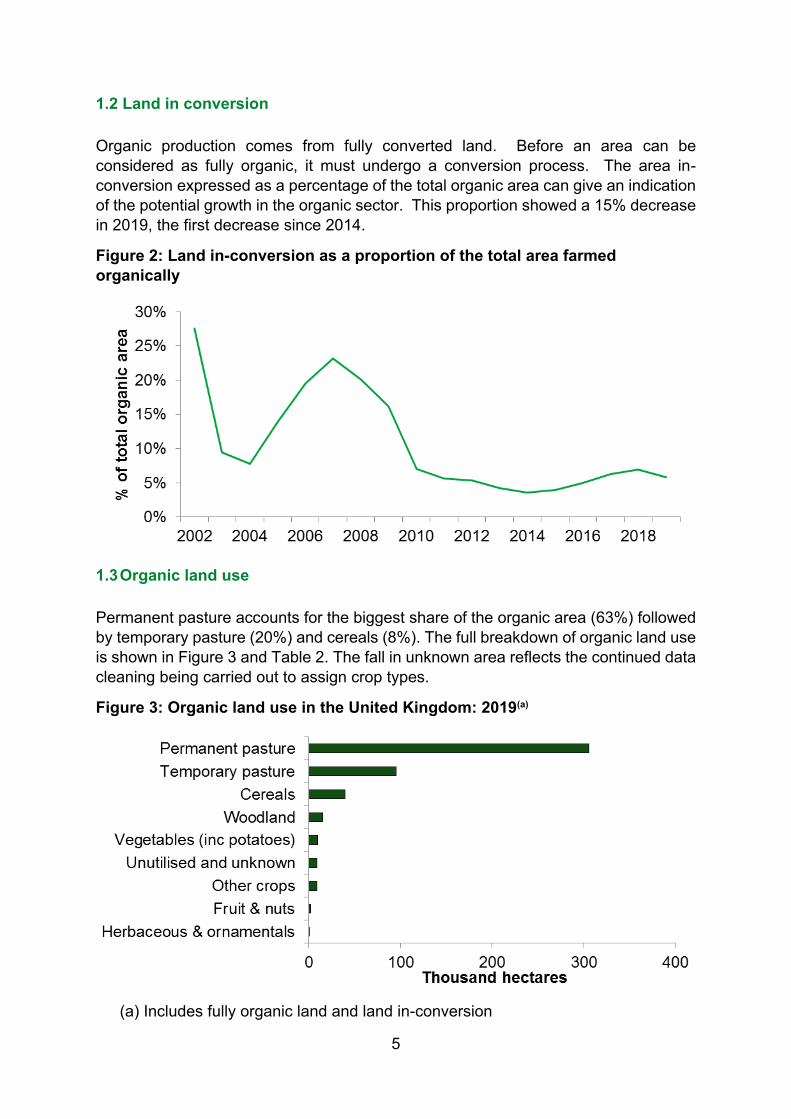
1.2 Land in conversion Organic production comes from fully converted land. Before an area can be considered as fully organic, it must undergo a conversion process. The area in-conversion expressed as a percentage of the total organic area can give an indication of the potential growth in the organic sector. This proportion showed a 15% decrease in 2019, the first decrease since 2014.
Figure 2: Land in-conversion as a proportion of the total area farmed organically
1.3 Organic land use Permanent pasture accounts for the biggest share of the organic area (63%) followed by temporary pasture (20%) and cereals (8%). The full breakdown of organic land use is shown in Figure 3 and Table 2. The fall in unknown area reflects the continued data cleaning being carried out to assign crop types.
Figure 3: Organic land use in the United Kingdom: 2019(a)
(a) Includes fully organic land and land in-conversion
6
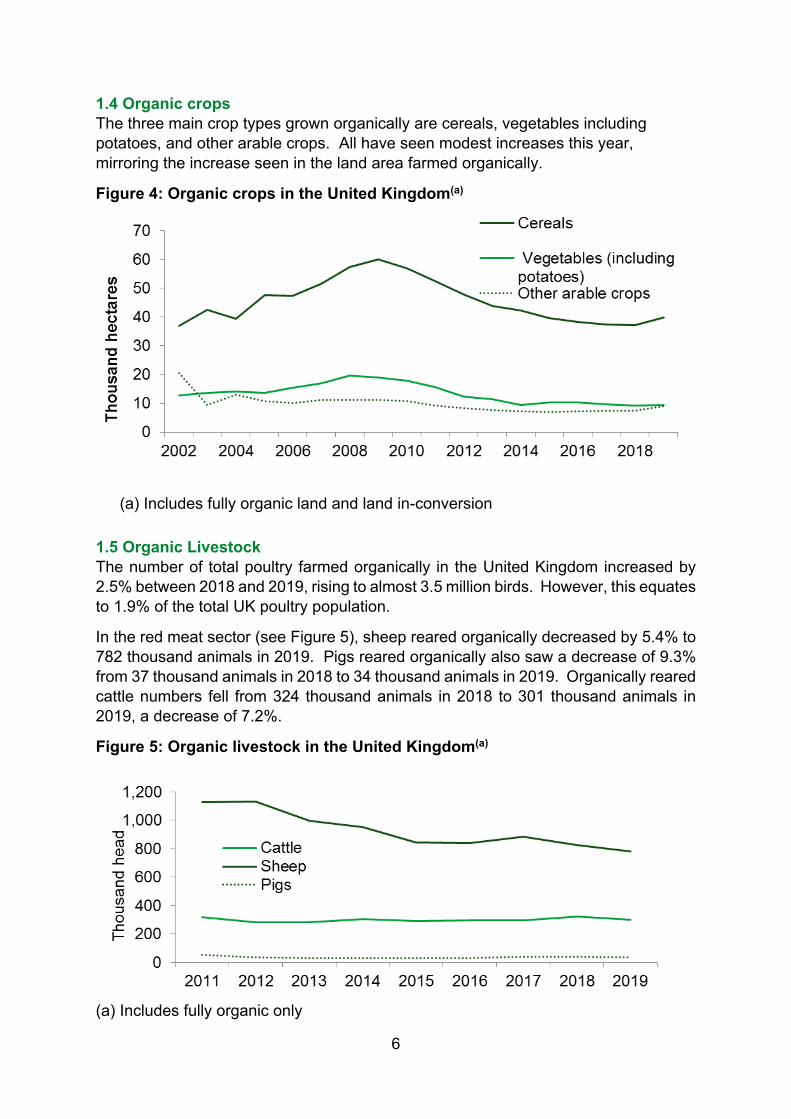
1.4 Organic crops The three main crop types grown organically are cereals, vegetables including potatoes, and other arable crops. All have seen modest increases this year, mirroring the increase seen in the land area farmed organically.
Figure 4: Organic crops in the United Kingdom(a)
(a) Includes fully organic land and land in-conversion
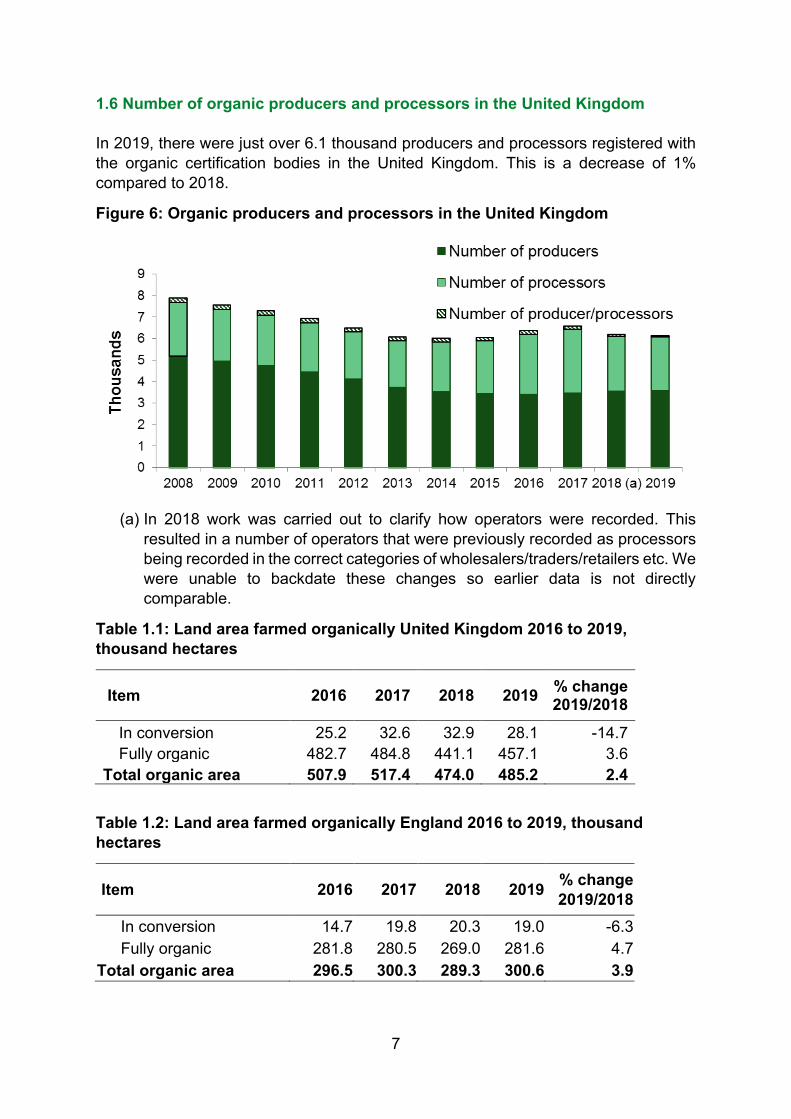
1.5 Organic Livestock The number of total poultry farmed organically in the United Kingdom increased by 2.5% between 2018 and 2019, rising to almost 3.5 million birds. However, this equates to 1.9% of the total UK poultry population.
In the red meat sector (see Figure 5), sheep reared organically decreased by 5.4% to 782 thousand animals in 2019. Pigs reared organically also saw a decrease of 9.3% from 37 thousand animals in 2018 to 34 thousand animals in 2019. Organically reared cattle numbers fell from 324 thousand animals in 2018 to 301 thousand animals in 2019, a decrease of 7.2%.
Figure 5: Organic livestock in the United Kingdom(a)
(a) Includes fully organic only
7
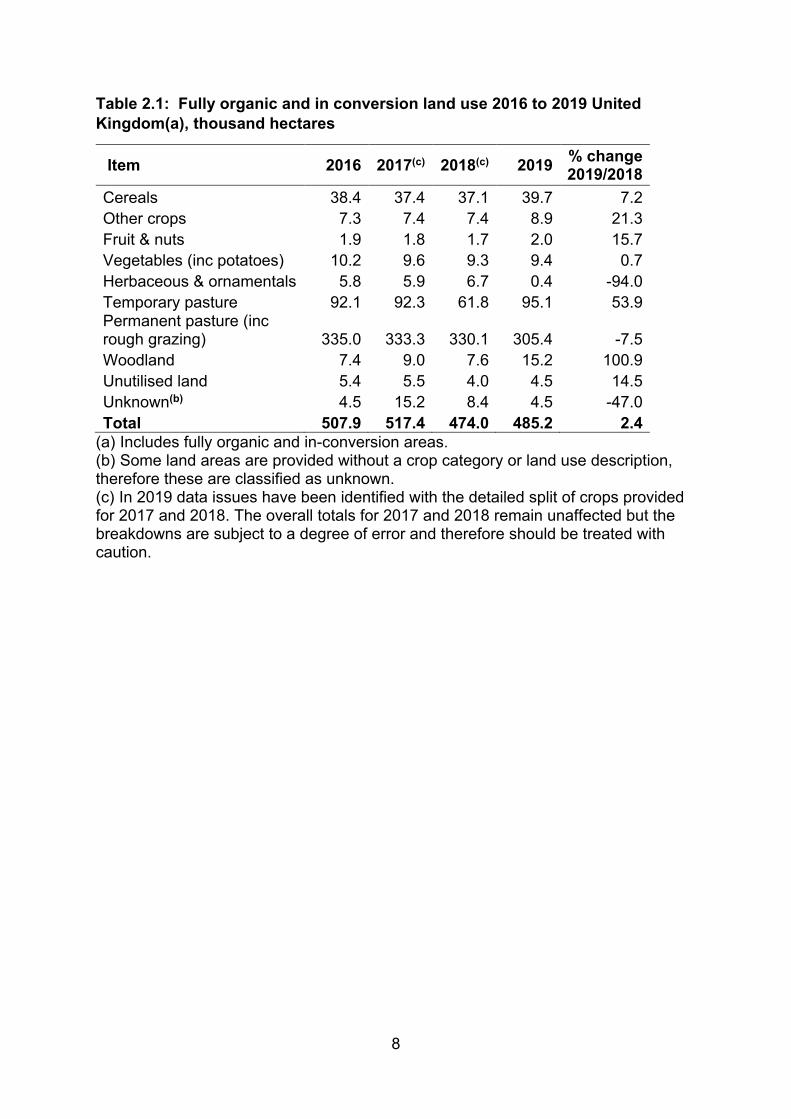
1.6 Number of organic producers and processors in the United Kingdom In 2019, there were just over 6.1 thousand producers and processors registered with the organic certification bodies in the United Kingdom. This is a decrease of 1% compared to 2018.
Figure 6: Organic producers and processors in the United Kingdom
(a) In 2018 work was carried out to clarify how operators were recorded. This
resulted in a number of operators that were previously recorded as processors being recorded in the correct categories of wholesalers/traders/retailers etc. We were unable to backdate these changes so earlier data is not directly comparable.
Table 1.1: Land area farmed organically United Kingdom 2016 to 2019, thousand hectares
Item 2016 2017 2018 2019 % change 2019/2018
In conversion 25.2 32.6 32.9 28.1 -14.7 Fully organic 482.7 484.8 441.1 457.1 3.6
Total organic area 507.9 517.4 474.0 485.2 2.4
Table 1.2: Land area farmed organically England 2016 to 2019, thousand hectares
Item 2016 2017 2018 2019 % change 2019/2018
In conversion 14.7 19.8 20.3 19.0 -6.3 Fully organic 281.8 280.5 269.0 281.6 4.7
Total organic area 296.5 300.3 289.3 300.6 3.9
8
Table 2.1: Fully organic and in conversion land use 2016 to 2019 United Kingdom(a), thousand hectares
Item 2016 2017(c) 2018(c) 2019 % change 2019/2018
Cereals 38.4 37.4 37.1 39.7 7.2 Other crops 7.3 7.4 7.4 8.9 21.3 Fruit & nuts 1.9 1.8 1.7 2.0 15.7 Vegetables (inc potatoes) 10.2 9.6 9.3 9.4 0.7 Herbaceous & ornamentals 5.8 5.9 6.7 0.4 -94.0 Temporary pasture 92.1 92.3 61.8 95.1 53.9 Permanent pasture (inc rough grazing) 335.0 333.3 330.1 305.4 -7.5 Woodland 7.4 9.0 7.6 15.2 100.9 Unutilised land 5.4 5.5 4.0 4.5 14.5 Unknown(b) 4.5 15.2 8.4 4.5 -47.0 Total 507.9 517.4 474.0 485.2 2.4
(a) Includes fully organic and in-conversion areas. (b) Some land areas are provided without a crop category or land use description, therefore these are classified as unknown. (c) In 2019 data issues have been identified with the detailed split of crops provided for 2017 and 2018. The overall totals for 2017 and 2018 remain unaffected but the breakdowns are subject to a degree of error and therefore should be treated with caution.
9
Table 2.2: Fully organic and in conversion land use 2016 to 2019 England(a), thousand hectares
Item 2016 2017(c) 2018(c) 2019 % change 2019/2018
Cereals 32.1 31.3 31.4 33.8 7.5 Other crops 5.4 5.4 5.5 7.0 25.8 Fruit & nuts 1.8 1.6 1.6 1.9 15.7 Vegetables (inc potatoes) 8.5 8.0 7.7 7.8 0.5 Herbaceous & ornamentals 5.0 5.2 5.8 0.3 -94.0 Temporary pasture 75.0 75.5 51.9 76.8 47.9 Permanent pasture (inc rough grazing) 155.6 153.9 172.2 154.9 -10.1 Woodland 5.3 5.3 4.7 11.2 138.6 Unutilised land 4.0 4.0 2.7 2.9 7.0 Unknown(b) 3.8 10.1 5.6 4.1 -26.6 Total 296.5 300.3 289.3 300.6 3.9
(a) Includes fully organic and in-conversion areas. (b) Some land areas are provided without a crop category or land use description, therefore these are classified as unknown. (c) In 2019 data issues have been identified with the detailed split of crops provided for 2017 and 2018. The overall totals for 2017 and 2018 remain unaffected but the breakdowns are subject to a degree of error and therefore should be treated with caution

10
Table 3.1: Detailed fully organic and in conversion land use 2016 to 2019 United Kingdom, thousand hectares
Item Area in-conversion
Fully organic
area
Total organic
area
Total areas at
June 2019(a)
Total organic area as
% of June area
Cereals 3.0 36.8 39.7 3,211 1.2 Wheat 0.9 8.3 9.2 1,816 0.5 Barley 1.5 12.0 13.5 1,162 1.2 Oats 0.5 13.3 13.8 182 7.6 Other cereals 0.1 3.1 3.2 51 6.3
Other arable crops 0.9 8.0 8.9 1,196 0.7 Sugar beet 0.1 0.0 0.1 108 0.0 Fodder, forage and silage 0.8 7.3 8.0 99 8.1 Maize, oilseeds and
protein crops 0.1 0.7 0.8 989 0.1 Vegetables 0.9 7.3 8.2 115 7.1 Potatoes 0.2 1.0 1.2 144 0.8 Fruit & nuts 0.1 1.9 2.0 35 5.7 Herbaceous & ornamentals 0.0 0.4 0.4 11 3.5 Temporary pasture 6.1 89.0 95.1 1,193 8.0 Permanent pasture (inc rough grazing) 15.4 290.0 305.4 10,193 3.0 Woodland 0.8 14.4 15.2 1,033 1.5 Unutilised land 0.4 4.2 4.5 na na Unknown(b) 0.2 4.2 4.5 na na Total 28.1 457.1 485.2 na na
(a) Source: June Survey of Agriculture as at 1 June 2019. Excludes common land. (b) Some land areas are provided without a crop category or land use description, therefore these are classified as unknown. na no comparable June survey data is available
11
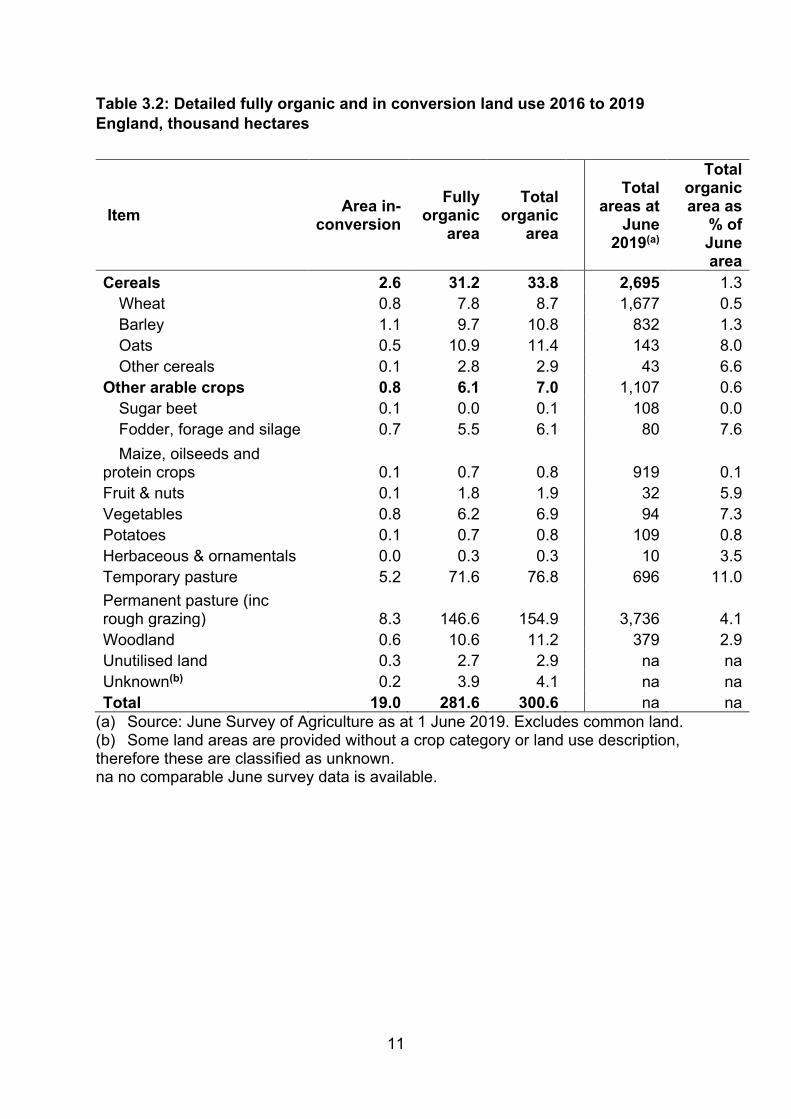
Table 3.2: Detailed fully organic and in conversion land use 2016 to 2019 England, thousand hectares
Item Area in-conversion
Fully organic
area
Total organic
area
Total areas at
June 2019(a)
Total organic area as
% of June area
Cereals 2.6 31.2 33.8 2,695 1.3 Wheat 0.8 7.8 8.7 1,677 0.5 Barley 1.1 9.7 10.8 832 1.3 Oats 0.5 10.9 11.4 143 8.0 Other cereals 0.1 2.8 2.9 43 6.6
Other arable crops 0.8 6.1 7.0 1,107 0.6 Sugar beet 0.1 0.0 0.1 108 0.0 Fodder, forage and silage 0.7 5.5 6.1 80 7.6 Maize, oilseeds and
protein crops 0.1 0.7 0.8 919 0.1 Fruit & nuts 0.1 1.8 1.9 32 5.9 Vegetables 0.8 6.2 6.9 94 7.3 Potatoes 0.1 0.7 0.8 109 0.8 Herbaceous & ornamentals 0.0 0.3 0.3 10 3.5 Temporary pasture 5.2 71.6 76.8 696 11.0 Permanent pasture (inc rough grazing) 8.3 146.6 154.9 3,736 4.1 Woodland 0.6 10.6 11.2 379 2.9 Unutilised land 0.3 2.7 2.9 na na Unknown(b) 0.2 3.9 4.1 na na Total 19.0 281.6 300.6 na na
(a) Source: June Survey of Agriculture as at 1 June 2019. Excludes common land. (b) Some land areas are provided without a crop category or land use description, therefore these are classified as unknown. na no comparable June survey data is available.
12
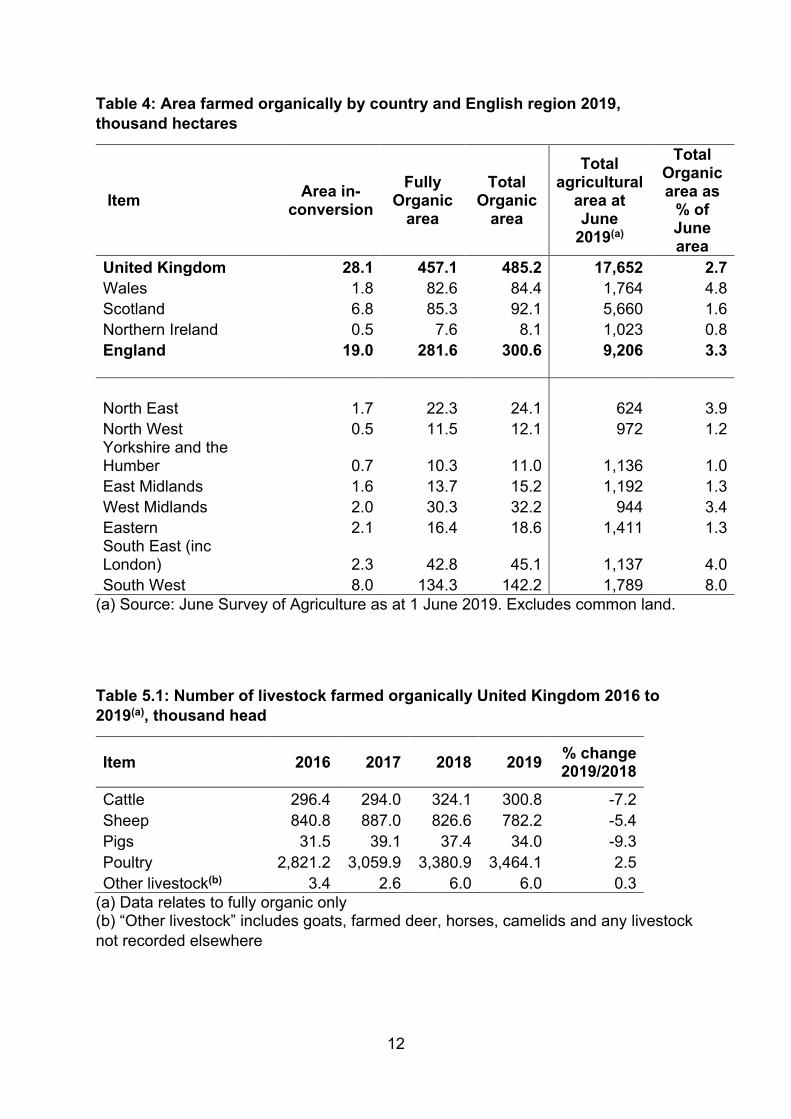
Table 4: Area farmed organically by country and English region 2019, thousand hectares
Item Area in- conversion
Fully Organic
area
Total Organic
area
Total agricultural
area at June
2019(a)
Total Organic area as
% of June area
United Kingdom 28.1 457.1 485.2 17,652 2.7 Wales 1.8 82.6 84.4 1,764 4.8 Scotland 6.8 85.3 92.1 5,660 1.6 Northern Ireland 0.5 7.6 8.1 1,023 0.8 England 19.0 281.6 300.6 9,206 3.3 North East 1.7 22.3 24.1 624 3.9 North West 0.5 11.5 12.1 972 1.2 Yorkshire and the Humber 0.7 10.3 11.0 1,136 1.0 East Midlands 1.6 13.7 15.2 1,192 1.3 West Midlands 2.0 30.3 32.2 944 3.4 Eastern 2.1 16.4 18.6 1,411 1.3 South East (inc London) 2.3 42.8 45.1 1,137 4.0 South West 8.0 134.3 142.2 1,789 8.0
(a) Source: June Survey of Agriculture as at 1 June 2019. Excludes common land.
Table 5.1: Number of livestock farmed organically United Kingdom 2016 to 2019(a), thousand head
Item 2016 2017 2018 2019 % change 2019/2018
Cattle 296.4 294.0 324.1 300.8 -7.2 Sheep 840.8 887.0 826.6 782.2 -5.4 Pigs 31.5 39.1 37.4 34.0 -9.3 Poultry 2,821.2 3,059.9 3,380.9 3,464.1 2.5 Other livestock(b) 3.4 2.6 6.0 6.0 0.3
(a) Data relates to fully organic only (b) “Other livestock” includes goats, farmed deer, horses, camelids and any livestock not recorded elsewhere

13
Table 5.2: Number of livestock farmed organically England 2016 to 2019 (a), thousand head
Item 2016 2017 2018 2019 % change 2019/2018
Cattle 219.3 217.3 240.6 220.8 -8.2 Sheep 405.9 421.2 374.0 350.6 -6.2 Pigs 29.4 37.2 29.2 30.6 4.8 Poultry 1,699.2 2,002.0 2,038.2 2,071.6 1.6 Other livestock(b) 2.8 2.3 4.8 5.0 4.8
(a) Data relates to fully organic only (b) “Other livestock” includes goats, farmed deer, horses, camelids and any livestock not recorded elsewhere

14
Table 6.1: Detailed organic livestock numbers United Kingdom 2019, thousand head
Item Total organic livestock(a)
Total livestock at June 2019 (b)
Total organic
livestock as % of
June livestock
Cattle 300.8 9,739 3.1 for slaughter 88.2 3,854 2.3 Dairy cows 89.8 3,223 2.8 Other cattle 122.7 2,662 4.6 Sheep 782.2 33,580 2.3 Breeding females 389.7 16,035 2.4 Other sheep 392.5 17,545 2.2 Pigs 34.0 5,078 0.7 Fattening pigs 20.6 4,569 0.5 Breeding sows 3.4 413 0.8 Other pigs 9.9 96 10.3 Poultry 3,464.1 186,982 1.9 Broilers 1,767.6 121,500 1.5 Laying hens 1,584.3 41,535 3.8 Other poultry 112.2 23,947 0.5 Other livestock 6.0 na na Farmed deer 3.4 38 9.1 Goats 0.6 111 0.6 Horses 1.1 250 0.4 Others(c) 0.9 na na
(a) Data relates to fully organic only (b) Source: June survey of agriculture/Cattle Tracing system for cattle populations (c) "Others” include camelids and any livestock not recorded elsewhere na June figures are not provided for other livestock as the type of animals are not comparable
15
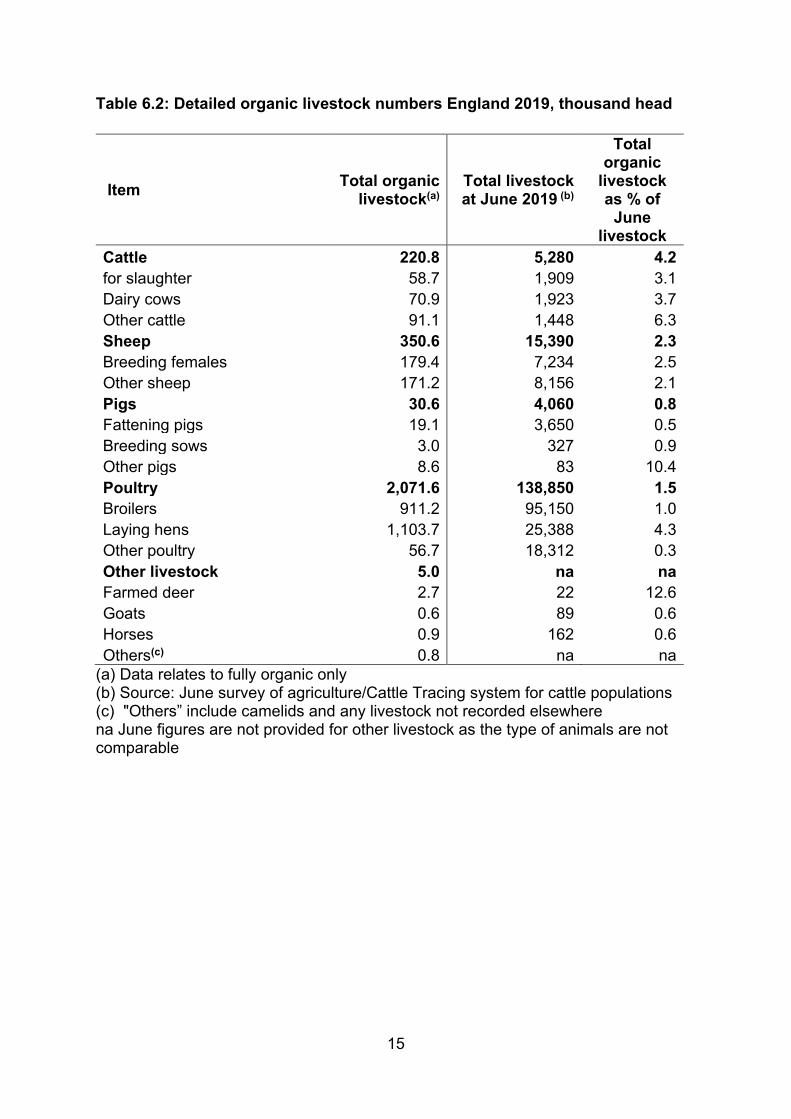
Table 6.2: Detailed organic livestock numbers England 2019, thousand head
Item Total organic livestock(a)
Total livestock at June 2019 (b)
Total organic
livestock as % of
June livestock
Cattle 220.8 5,280 4.2 for slaughter 58.7 1,909 3.1 Dairy cows 70.9 1,923 3.7 Other cattle 91.1 1,448 6.3 Sheep 350.6 15,390 2.3 Breeding females 179.4 7,234 2.5 Other sheep 171.2 8,156 2.1 Pigs 30.6 4,060 0.8 Fattening pigs 19.1 3,650 0.5 Breeding sows 3.0 327 0.9 Other pigs 8.6 83 10.4 Poultry 2,071.6 138,850 1.5 Broilers 911.2 95,150 1.0 Laying hens 1,103.7 25,388 4.3 Other poultry 56.7 18,312 0.3 Other livestock 5.0 na na Farmed deer 2.7 22 12.6 Goats 0.6 89 0.6 Horses 0.9 162 0.6 Others(c) 0.8 na na
(a) Data relates to fully organic only (b) Source: June survey of agriculture/Cattle Tracing system for cattle populations (c) "Others” include camelids and any livestock not recorded elsewhere na June figures are not provided for other livestock as the type of animals are not comparable

16
Table 7: Number of organic producers and processors 2019
Item Number of producers
only
Number of producer/
processors
Number of processors
only
Total organic producers and
processors United Kingdom 3,568 49 2,512 6,129 Wales 611 6 120 737 Scotland 383 1 175 559 Northern Ireland 161 2 43 206 England 2,413 40 2,174 4,627 North East 79 1 36 116 North West 118 5 151 274 Yorkshire and the Humber 103 1 142 246 East Midlands 171 3 179 353 West Midlands 307 5 148 460 Eastern 185 6 266 457 South East (inc London) 373 4 840 1,217 South West 1,077 15 412 1,504
Table 8: Number of organic producers and processors 2016 to 2019
Item 2016 2017 2018 2019 % change 2019/2018
United Kingdom 6,363 6,586 6,188 6,129 -1.0 Wales 751 751 759 737 -2.9 Scotland 560 578 577 559 -3.1 Northern Ireland 204 220 216 206 -4.6 England 4,848 5,037 4,636 4,627 -0.2 North East 130 132 113 116 2.7 North West 301 308 263 274 4.2 Yorkshire & The Humber 273 275 240 246 2.5 East Midlands 371 388 350 353 0.9 West Midlands 446 514 475 460 -3.2 Eastern 508 543 477 457 -4.2 South East (inc London) 1,192 1,254 1,196 1,217 1.8 South West 1,627 1,623 1,522 1,504 -1.2

17
Table 9: Number of organic crop and livestock producers and processors 2019(a)
Number of:
Item Crop producers
Crop producers
and processors
Livestock producers
Livestock producers
and processors
United Kingdom 3,294 46 2,390 32 Wales 596 5 511 2 Scotland 340 1 265 1 Northern Ireland 134 2 117 0 England 2,224 38 1,497 29 North East 75 1 56 1 North West 110 4 75 3 Yorkshire and the Humber 93 1 67 1 East Midlands 159 3 115 1 West Midlands 290 5 168 5 Eastern 155 5 76 3 South East (inc London) 332 4 184 3 South West 1,010 15 756 12
(a) Mixed organic holdings will be recorded under both the crop and livestock headings above. The numbers shown cannot be added together to arrive at total producers / processors by region as this will lead to double counting.

18
Organic statistics methodology, data notes and feedback Organic statistics methodology This statistical release contains summary results of data compiled by the UK Organic Certification Bodies. Each year, certifier bodies visit their registered farms to carry out annual inspections. During these inspections, certifiers record the crop areas and numbers of livestock present on the organic holding on that day. The data collected during these inspections are sent to Defra each January to form an annual return required by the European Commission under Regulation No. 889/2008 of 5 September 2008. The information collated by Defra is checked thoroughly before the figures are presented in this statistical release. Data are checked against historical data for comparability and any unusual values are queried with the relevant certification bodies. Due to the nature of the inspections, the data are collected at varying times through the year. Therefore, the data presented here do not give an exact snapshot of organic farming at any specific time of year, so they should be treated with a degree of caution. Defra is very grateful to the inspectors and members in the UK’s Organic Certification Bodies for the information collected in the annual returns each year. Note In this statistical release, unless specified otherwise, all figures include both in conversion and fully organic holdings. Also, totals in this release are based on unrounded figures so may not agree with the sum of their components in the tables. Organics overview Only food that has been produced in accordance with organic standards by farmers /producers registered with an approved inspection body may be legally sold as ‘organic’ within the EU. The inputs and practices used in organic farming are strictly regulated in accordance with EU Regulation. Key elements of organic farming systems The main components of an organic farming system are the avoidance of artificial fertilisers and pesticides, and the use of crop rotations and other forms of husbandry to maintain soil fertility and control weeds, pests and diseases. Livestock also form an integral part of the majority of organic farms, although there are some successful stockless systems. Organic standards do not allow intensively housed stock or systems where a large amount of total feed has to be bought in. Pigs and poultry must be managed with extensive outdoor access under an organic system. Conversion In most cases, land must be managed organically for a minimum of two years (three years for top fruit orchards) before it is granted approved 'organic' status and is eligible for organic certification. Producers can then sell their produce as 'organic' and organic livestock breeding can commence.
19
Other relevant data sources Data on agricultural crop areas and livestock numbers are collected through the annual June Survey of Agriculture. Results from this survey can be accessed at: structure of the agricultural industry Users and uses of these statistics Users of the data include the EU Commission who require these statistics to be supplied annually under paragraph 36, Council Regulation (EC) No 834/2007 and Article 93 Commission Regulation (EC) No 889/2008. The purpose is to support the management of the organic production sector in the EU. Statistics are published by Eurostat in their database European statistics Other major users include the organic certification bodies in the UK, who provide the information used to compile the statistics, and the Government and devolved administrations, who use the information when formulating policy on support for organic farming. Other users include farming organisations, research bodies, students and there is interest also from the general public. Feedback We welcome feedback and any thoughts to improve the publication further. Please send any feedback to: [email protected] Suggested questions to help you structure your feedback are below but all feedback is welcome:
How relevant is the current content of the publication to your needs as a user? What purpose do you require the data for? Which data do you find most useful? Is there any content that you did not find useful? Do you have any suggestions for further development of this release; including
additional content, presentation and any other thoughts?
Related Documents