SIMULATED HYDROLOGIC RESPONSES TO CLIMATE VARIATIONS AND CHANGE IN THE MERCED, CARSON, AND AMERICAN RIVER BASINS, SIERRA NEVADA, CALIFORNIA, 1900–2099 MICHAEL D. DETTINGER 1 , DANIEL R. CAYAN 2, 1 , MARY K. MEYER 2 and ANNE E. JETON 3 1 U.S. Geological Survey, Scripps Institution of Oceanography, Dept. 0224, 9500 Gilman Drive, La Jolla, CA 92093-0224, U.S.A. E-mail: [email protected] 2 Climate Research Division, Scripps Institution of Oceanography, University of California, San Diego, U.S.A. 3 U.S. Geological Survey, Carson City, Nevada, U.S.A. Abstract. Hydrologic responses of river basins in the Sierra Nevada of California to historical and future climate variations and changes are assessed by simulating daily streamflow and water- balance responses to simulated climate variations over a continuous 200-yr period. The coupled atmosphere-ocean-ice-land Parallel Climate Model provides the simulated climate histories, and existing hydrologic models of the Merced, Carson, and American Rivers are used to simulate the basin responses. The historical simulations yield stationary climate and hydrologic variations through the first part of the 20th century until about 1975 when temperatures begin to warm noticeably and when snowmelt and streamflow peaks begin to occur progressively earlier within the seasonal cycle. A future climate simulated with business-as-usual increases in greenhouse-gas and aerosol radiative forcings continues those recent trends through the 21st century with an attendant +2.5 ◦ C warming and a hastening of snowmelt and streamflow within the seasonal cycle by almost a month. The various projected trends in the business-as-usual simulations become readily visible despite realistic simulated natural climatic an d hydrologic variabilityby about 2025. In contrast to these changes that are mostly associated with streamflow timing, long-term average totals of streamflow and other hydrologic fluxes remain similar to the historical mean in all three simulations. A control simulation in which radiative forcings are held constant at 1995 levels for the 50 years following 1995 yields climate and streamflow timing conditions much like the 1980s and 1990s throughout its duration. The availability of continuous climate-change projection outputs and careful design of initial conditions and control experiments, like those utilized here, promise to improve the quality and usability of future climate-change impact assessments. 1. Introduction Global warming associated with rising atmospheric concentrations of greenhouse gases has been recognized in the Earth’s atmosphere and oceans (Ding and Houghton, 2001; National Research Council, 2001), and simulations of its possible future course suggest substantial potential consequences for human societies and The U.S. Government right to retain a non-exclus ive royalty-free license in and to any copyright is acknowledged. Climatic Change 62: 283–317, 2004. © 2004Kluwer Academic Publishers. Printed in the Netherlands.

Welcome message from author
This document is posted to help you gain knowledge. Please leave a comment to let me know what you think about it! Share it to your friends and learn new things together.
Transcript

SIMULATED HYDROLOGIC RESPONSES TO CLIMATE VARIATIONS AND CHANGE IN THE MERCED, CARSON, AND AMERICAN RIVER
BASINS, SIERRA NEVADA, CALIFORNIA, 1900–2099 �
MICHAEL D. DETTINGER 1, DANIEL R. CAYAN 2, 1, MARY K. MEYER 2 and ANNE E. JETON 3
1U.S. Geological Survey, Scripps Institution of Oceanography, Dept. 0224, 9500 Gilman Drive,La Jolla, CA 92093-0224, U.S.A.
E-mail: [email protected] Research Division, Scripps Institution of Oceanography, University of California,
San Diego, U.S.A.3U.S. Geological Survey, Carson City, Nevada, U.S.A.
Abstract. Hydrologic responses of river basins in the Sierra Nevada of California to historical and future climate variations and changes are assessed by simulating daily streamflow and water-balance responses to simulated climate variations over a continuous 200-yr period. The coupled atmosphere-ocean-ice-land Parallel Climate Model provides the simulated climate histories, and existing hydrologic models of the Merced, Carson, and American Rivers are used to simulate the basin responses. The historical simulations yield stationary climate and hydrologic variations through the first part of the 20th century until about 1975 when temperatures begin to warm noticeably and when snowmelt and streamflow peaks begin to occur progressively earlier within the seasonal cycle. A future climate simulated with business-as-usual increases in greenhouse-gas and aerosol radiative forcings continues those recent trends through the 21st century with an attendant +2.5 ◦C warming and a hastening of snowmelt and streamflow within the seasonal cycle by almost a month. The various projected trends in the business-as-usual simulations become readily visible despite realistic simulated natural climatic and hydrologic variability by about 2025. In contrast to these changes that are mostly associated with streamflow timing, long-term average totals of streamflow and other hydrologic fluxes remain similar to the historical mean in all three simulations. A control simulation in which radiative forcings are held constant at 1995 levels for the 50 years following 1995 yields climate and streamflow timing conditions much like the 1980s and 1990s throughout its duration. The availability of continuous climate-change projection outputs and careful design of initial conditions and control experiments, like those utilized here, promise to improve the quality and usability of future climate-change impact assessments.
1. Introduction
Global warming associated with rising atmospheric concentrations of greenhouse gases has been recognized in the Earth’s atmosphere and oceans (Ding and Houghton, 2001; National Research Council, 2001), and simulations of its possible future course suggest substantial potential consequences for human societies and
� The U.S. Government right to retain a non-exclusive royalty-free license in and to any copyright is acknowledged.
Climatic Change 62: 283–317, 2004.© 2004 Kluwer Academic Publishers. Printed in the Netherlands.

284 MICHAEL D. DETTINGER ET AL.
natural systems (U.S. National Assessment Synthesis Team, 2000). Such climate changes are of great concern in the State of California where much of the water supply is derived from snowmelt runoff from mountainous watersheds that may be particularly susceptible to warming trends. In order to better understand the consequences, as they might emerge in California, this paper reports simulated watershed responses of three river basins in the Sierra Nevada to several recent climate simulations spanning from 1900 to 2099.
Like any such local hydrologic assessment at present, the results of the present analyses depend on the particular regional changes simulated by the climate models. Thus, the specifics of results presented here are climate-model dependent. However, there is a long-standing, fair level of consensus among current models that global warming in the range from +2 to +5 ◦C could attend a doubling of greenhouse-gas concentrations and that warming in this range would affect the western United States (e.g., U.S. National Assessment Synthesis Team, 2000). Consequently, the temperature-dependent aspects of the present analysis, which includes a simulated warming in California by about +2.4 ◦C over the next century, are probably representative of responses that would arise from using any of the current global climate models with similar forcings. In contrast, there is essentially no consensus among current climate models as to how precipitation totals might change over the United States nor about how its spatial and temporal character might change. Indeed, the climate model (and forcings) used in the present analysis yields rather small precipitation changes over California (roughly –10% over the next century in the simulation exploited here), changes that vary in magnitude and even sign from simulation to simulation in response to the sensitive dependence of this model upon uncertain initial conditions.
However, the climate model used here – the Parallel Climate Model (PCM; Washington et al., 2000) – is a very modern and high-fidelity representation of the global climate system, which has been shown to produce realistic simulations of historical ocean and atmosphere responses to increasing greenhouse-gas concentrations (Washington et al., 2000; Barnett et al., 2001). The model represents the coupled atmosphere, ocean, sea-ice, and land-surface systems with modern parameterizations, specialized gridding, and no flux corrections applied. Thus the climate-change simulations – while not expected to be precise predictions – are representative of current state-of-the-art projections (as of 2001). Three PCM simulations are considered, in detail, here:
• simulation B06.22, a simulation of the climate of the 1870–1999 period with realistic historical radiative forcings (i.e., greenhouse-gas and sulfate-aerosol concentrations in the atmosphere, referred to hereafter as the simulated-historical (HIS) run;
• simulation B06.45, a simulation of the climate of the 1995–2048 period with greenhouse-gas concentrations fixed at 1995 levels (to provide a ‘future

SIMULATED HYDROLOGIC RESPONSES TO CLIMATE VARIATIONS AND CHANGE 285
control’ simulation), referred to hereafter as the future-control (FC) run; and
• simulation B06.44, a simulation of the climate of the 1995–2099 period with greenhouse-gas concentrations that increase in a ‘business-as-usual’ manner (Ding and Houghton, 2001), referred to hereafter as the business-as-usual (BAU) run.
These climate simulations provide a basis for imposing realistic past and future meteorologic changes on the Sierra Nevada basins being studied to allow (a) assessment of streamflow responses to plausible future warming trends (with relatively small precipitation changes) and (b) to assess the role of greenhouse gases in those changes and in the historically anomalous character of California’s climate and streamflow regimes in the last few decades (Roos, 1991; Aguado et al., 1992; Wahl, 1992; Dettinger and Cayan, 1995; Cayan et al., 2001). The FC run yields striking hydrologic results that support the hypothesis that recent trends in Califor-nia’s streamflow timing are relatively direct responses to increasing greenhouse-gas concentrations by indicating that, by the 1990s, greenhouse-gas concentrations and attendant warming were large enough (in simulation) to alter several aspects of streamflow timing and amount detectably from the remainder of the historical period. Thus the availability of the FC climate simulation in the present analysis adds a unique aspect to this study.
In order to reduce the possibility of confusion between trends associated with changing radiative forcings and long-term natural climate fluctuations that also are represented in the PCM, the simulations discussed in detail were compared with additional climate simulations that were similar in all respects to the HIS and BAU simulations, except that the additional simulations were initiated from different conditions. An additional HIS simulation (B06.23) is compared with the HIS results in several figures, and two additional BAU simulations (B06.46 and B06.47) are compared with BAU. Although these additional simulations yield quite different day-to-day to decade-to-decade climate and streamflow variations, the conclusions drawn here regarding historical and future trends proved robust for the choices of which particular simulations were considered.
Another relatively unusual characteristic of the present study is that the watershed simulations have been made with temporally complete versions of the climate simulations, drawing upon daily meteorological outputs from each of the climate simulations for the entire 1900–2099 period. A realistic climate-system model will have climate variations that span seasons to decades and longer, as do the present simulations (Barnett et al., 2001). The shorter of these climate fluctuations provide essentially stochastic forcings to the river basins, yielding hydrologic responses that are critical to projection and understanding of river responses. The longer of these variations provide statistical nonstationarities that can potentially bias assessments that focus closely upon one decade or another in a climate-change simulation (e.g., like the focus in Wilby and Dettinger, 2000). Access to the complete histories

286 MICHAEL D. DETTINGER ET AL.
from the PCM simulations used here provides an opportunity to visualize the future course of hydrologic changes at all time scales, including both greenhouse-gas induced changes and natural fluctuations as represented by this modern climate model. Thus, the extent to which the greenhouse-gas induced river responses can be identified among realistic levels of natural hydrologic variability, over the course of the two centuries simulated here, can be readily judged by the reader.
In this paper, the several climate simulations outlined above are downscaled from the climate-model grid to obtain meteorological time series corresponding to each of the half dozen meteorological stations to which the river models have been calibrated by methods described in the next section. These downscaled, daily meteorological series will be used to force calibrated watershed models of three river basins in the Sierra Nevada (Figure 1) – the Merced River above Yosemite Valley at Happy Isles Bridge (U.S. Geological Survey site 11264500), the East Fork Carson River at Markleeville (10308200), and the North Fork American River at North Fork Dam (11427000) – to simulate hydrologic responses to the two centuries of climate variability and change from the PCM model. These responses are analyzed here to identify changes in the amount and seasonality of streamflow, snowmelt, evapotranspiration (ET), and soil moisture associated with historical changes in greenhouse-gas concentrations and with future BAU greenhouse-gas increases. In Section 2, the models and downscaling methods are described. In Section 3, the global climate changes and meteorological forcings for the Sierra Nevada basins, derived from the PCM climate model, are discussed. Then, in Section 4, simulated streamflow responses are presented, with attention to projected changes in snowmelt and streamflow amounts and timing during the winter and spring high streamflow seasons. In Section 5, changes in low flow conditions are analyzed, with special attention to ET and soil-moisture changes under the various climates, and conclusions are drawn in Section 6. The present analyses focuses primarily on basin-scale changes at monthly-average levels, with shorter term extremes (e.g., floods) left as a subject for further research.
2. Models and Methods
2.1. CLIMATE MODEL
The PCM is a numerical model of the global climate system that couples atmospheric, ocean, sea-ice, and land-surface components, described by Washington et al. (2000) and Dai et al. (2004). The PCM realistically represents historical climate variability and accurately simulates observed long-term rises in the temperature of the world’s oceans (Washington et al., 2000; Barnett et al., 2001). Atmospheric processes are simulated at a horizontal resolution of T42 (about 2.8◦ in latitude and longitude) with 18 vertical levels (Dai et al., 2004). The ocean model is global in coverage, and has an average resolution of 2/3◦ latitude and longitude, with resolution increasing near the equator to about 1/2◦ .

SIMULATED HYDROLOGIC RESPONSES TO CLIMATE VARIATIONS AND CHANGE 287
Figure 1. Locations of the Sierra Nevada river basins, stream gages, and meteorological stations studied; triangles indicate stream gages at lowest points in shaded river basins, diamonds indicate weather stations used as inputs for the watershed models, at 1 – Colfax, 2 – Gold Run, 3 – Blue Canyon, 4 – Central Sierra Snow Laboratory, 5 – Twin Lakes, 6 – Woodfords, and 7 – Yosemite National Park Headquarters.
This high resolution contributes to a higher amplitude El Niño–La Niña cycle than in many previous models, which in turn increases the interannual climate variability of both the tropics and the extratropics. The coupled model also yields realistic (if somewhat overestimated) interdecadal North Pacific climate variations (Zhu et al., 2004). Up-to-date information about the PCM can be found at http://www.cgd.ucar.edu/pcm/.
Initial conditions and radiative forcings for the PCM simulations were developed to provide for realistic historical and future climates with minimal spin-up problems from slowly evolving ocean conditions (Dai et al., 2004). The PCM HIS simulation was initiated from realistic, modern (1996) ocean conditions and then spun up for at least five years, prior to commencement of the ‘actual’ simulations with radiative forcings characteristic of the year 1870. For our purposes here, we begin analysis in 1900, allowing yet another 30 years for the various model components to come into dynamic agreement with each other. The historical simulations represent other realization of the climate during the 20th century with only the time-dependent historical concentrations of greenhouse gases and sulfate aerosols specified. The future-climate simulations studied were initiated from a data-assimilated estimate of ocean salinity and temperature conditions for

288 MICHAEL D. DETTINGER ET AL.
the year 1996, spun up for five years, and then allowed to simulate variations of the global climate system during the 21st century with FC greenhouse gases and sulfate aerosols held constant at 1995 concentrations, and with BAU greenhouse-gas and aerosol concentrations specified to increase under a ‘business-as-usual’ scenario. This BAU scenario is similar to the Intergovernmental Panel on Climate Change’s (IPCC’s) ‘IS92a’ scenario (Leggett et al., 1992) and is roughly in the center of the spectrum of published possible scenarios of future greenhouse-gas and sulfate-aerosol concentrations during the 21st century (see Dai et al., 2001, 2004, for more detail). Globally, under the business-as-usual scenario considered here, the mean forcing increases linearly from zero in 1870 to 0.6 W/m 2 in 1970, followed by a much more rapid but still almost linear increase to 6 W/m 2 by 2100 (see Figure 1c in Dai et al., 2001).
2.2. HYDROLOGIC MODELS
Three Sierra Nevada river basins are simulated using the parameterizations of daily heat and water budgets in the Precipitation–Runoff Modeling System (PRMS; Leavesley et al., 1983), a physically based, distributed-parameter model of precipitation forms, snowpack evolution, and runoff generation. The spatial variability of land characteristics that affect snowpack and runoff is represented by hydrologic response units (HRUs), within which runoff responses to precipitation or snowmelt inputs are assumed to be homogeneous. HRUs are characterized and delineated in terms of physiographic properties that determine hydrologic responses: elevation, slope, aspect, vegetation, soils, geology, and climate (e.g., Smith and Reece, 1995). In the three models used here, HRUs were designed to incorporate all grid cells, on 100-m grids, that share nearly identical combinations of these seven physiographic properties, regardless of whether the grid cells in an HRU form a contiguous polygon (Jeton and Smith, 1993). The resulting ‘pixelated’ model delineations represent the basins in terms of 50 HRUs in the American River model, 50 HRUs in the Carson River, and 64 HRUs in the Merced River (with average HRU areas of about 18, 14, and 8 km2, respectively).
Within each HRU, the heat- and water-budget responses to daily inputs of precipitation and daily fluctuations of air temperature are simulated. The daily mixes of rain and snow are estimated from each day’s temperatures by interpolations between the temperatures at which precipitation historically has been either all snow or all rain (Willen et al., 1971). Interception losses, sublimation, and ET are also parameterized and simulated in terms of precipitation and daily maximum and minimum temperatures. Snowpack accumulation, evolution, melt, and the heat and water balances of the snowmelt periods are simulated by PRMS from the daily inputs of precipitation and daily air temperatures (using the parameterizations of Obled and Rosse, 1977). Runoff is partitioned between surface runoff, shallow-subsurface runoff, deep-subsurface runoff, and deep ground-water recharge on the basis of the simulated accumulations of soil moisture at each HRU and of

SIMULATED HYDROLOGIC RESPONSES TO CLIMATE VARIATIONS AND CHANGE 289
water in deeper subsurface reservoirs that underlie multiple HRUs. The various processes acting on runoff generation from the basins are represented in sufficient detail that heat- and moisture-fluxes vary realistically with short- and long-term climatic variations. However, model parameters (such as temperature thresholds for rain to fall) and various land-surface descriptors (such as plant-canopy densities) were not modified in the future-climate simulations. Thus, the details of the model’s temperature-based parameterizations are assumed, in the present study, to be unchanged under the future-climate scenarios. This simplification amounts to assumptions that precipitation would derive from the same heights in the atmosphere as at present and that land-surface properties, such as vegetation types and infiltration rates and capacities, would not change under the future scenarios. The effect of this simplification on the hydrologic responses projected here are unknown at present and deserve further research to extend present-day watershed models.
The runoff models simulate daily streamflow from, along with water and energy balances within, about 900 km2 of the North Fork American River basin, 700 km2
of the East Fork Carson, and 500 km2 of the Merced (Figure 1), with internal variations of elevation, slope, aspect, soils, and vegetation represented at resolutions of 100 m. The three rivers basins are largely free from current human influences like dams, diversions, and major land-use changes (Slack and Landwehr, 1992; Jeton et al., 1996). The Carson River drains the rain-shadowed eastern slope of the Sierra Nevada, whereas the American and Merced Rivers drain the wetter, western slopes (Figure 1). The area-averaged altitude of the modeled part of the American River basin is 1250 m above sea level with its outlet at 200 m and ridgeline near 2700 m, and is a Wild and Scenic River. The area-averaged altitude of the modeled Carson River basin is 2400 m (with outlet at 1650 m and ridgeline at 3400 m), and drains a largely undeveloped Eastern Sierra Nevada catchment. The area-averaged altitude of the the modeled Merced River basin is 2800 m (with outlet at 1200 m and ridgeline near 3900 m), and drains high country of Yosemite National Park above Yosemite Valley. Because it comes from a lower, warmer basin, streamflow in the American River is about two-thirds wintertime rainfall and snowmelt runoff and less than one-third springtime snowmelt runoff; the higher and cooler Carson and Merced Rivers are dominated by springtime snowmelt runoff. All three basins are geologically dominated by the granodiorites of the central Sierra Nevada, with varying additions from volcanic and metamorphic rocks. The vegetation of the basins grade from subalpine and alpine conifer forests and meadows at their upper ranges down into chaparral-sagebrush rangelands in the Carson River basin, pine-oak woodlands and rangelands in the American, and pine forests in the Merced. In the climate-change simulations that follow, the vegetation distributions are not changed.
The Carson and American River models are described in detail in Jeton et al. (1996). The Carson River model has been used to simulate historical stream-flows from 1969 to 1998, and the American River model has simulated historical

290 MICHAEL D. DETTINGER ET AL.
Table I
Watershed-model R-squared statistics for comparisons of streamflow simulations to observations, for simulations driven by observed meteorology during model-calibration, prior verification (at time of calibration), and subsequent verification (performed for the present study) periods
Calibration Prior Subsequent
verification verification
Merced River 1982–1990 1950–1981 1991–2000
Daily variations 0.82 0.76 0.76
Monthly variations 0.91 0.84 0.89
Annual variations 0.98 0.86 0.88
East Fork Carson River 1982–1990 1950–1981 1991–2000
Daily variations 0.82 0.80 0.85
Monthly variations 0.93 0.91 0.91
Annual variations 0.88 0.80 0.97
North Fork American River 1969–1990 1949–1968 1991–1998
Daily variations 0.78 0.78 0.65
Monthly variations 0.86 0.79 0.73
Annual variations 0.96 0.97 0.99
streamflows from 1949 to 1998. These simulations are driven by precipitation and temperature records from two nearby weather stations in the Carson River model and by records from four nearby stations in the American River model. The Merced River model was designed to simulate daily flows for the period from 1916 to present (Dettinger et al., 1999; Wilby and Dettinger, 2000), and the model is driven by precipitation and temperature observations from two long-term weather stations in the Sierra Nevada for most of that time. (Prior to the mid 1930s, only one of the two stations had weather records and the model was driven with just one input station). Indications of the goodness-of-fit of the American and Carson River models are presented in detail by Jeton et al. (1996), and (in the interests of concision) a few calibration and verification statistics are summarized for all three models in Table I. Overall, the models reproduce daily to annual streamflow variations (in response to weather and climate variations) quite faithfully. All three models have been used previously to hindcast and forecast streamflow from days to months in the future (Dettinger, 1997; Dettinger et al., 1998, 1999; Miller et al., 1999) and to estimate climate-change responses (Jeton et al., 1996; Miller et al., 2000; Wilby and Dettinger, 2000).

SIMULATED HYDROLOGIC RESPONSES TO CLIMATE VARIATIONS AND CHANGE 291
2.3. DOWNSCALING CLIMATE-MODEL OUTPUT INTO HYDROLOGIC-MODEL
INPUTS
To make the connection between the global-scale PCM climate simulations and the watershed-scale (on order of 1000 km2) hydrologic models, simple deterministic downscaling functions for the daily, climate-model grid-scale climate series were developed. Climate time series simulated by PCM were modified so that their probability distributions approximate observed probability distributions of air temperatures and precipitation at weather stations that the hydrologic models use. Because only the radiative forcings of the global climate system are specified in the climate simulations used here, with the ocean–air interactions left free to evolve chaotically, each simulation represents just one realization among many possible outcomes, of which the observed historical climate – in principle – has been another. Thus, no day-to-day correspondence between the historical simulations and observations could be expected. However, ideally, one would hope that the probability distributions of the historical simulation and historical observations would be comparable, just as – in a statistically stationary climate – one would expect probability distributions of observations at a site to be much the same from one 30year period to another. To the extent that the probability distributions of weather variables in the historical simulation (B06.22) deviated from those estimated from the historical record at local weather stations, they have been modified (deterministically) here to push those probability distributions into overall agreement with the historical records (see also O’Brien et al., 2001). Then, the same deterministic transformations (and relatively small extrapolations thereof) were applied to the PCM climate series from the simulated future climates.
The procedure was to sort – for each month of the year – the maximum daily temperatures, minimum daily temperatures, and daily precipitation totals in the historical records at each of the weather stations used in the calibrated hydrologic models (Figure 1) for the period from 1951 to 1972; likewise, simulated reference-level daily air temperatures and precipitation for a period of the same length were sorted. Simulated temperatures were then transformed into the probability distributions of observations by developing a simple regression relation between the observed and simulated values (at the same ranks). As long as exactly the same number of temperature values are present in the historical and simulated series, the simple regression is equivalent to estimating exceedance probabilities for each temperature value in the series and then developing a function that transforms the simulated daily values so that the probability plot of the simulated is the same as the probability plot of observations. The equivalence arises from the fact that, as long as the number of samples in each series is the same, the exceedance probabilities estimated at each rank in the two sorted series will be equal (e.g., i/(N + 1)), with i equal to rank and N equal to number of samples in each series). An example of the result of this transformation for one of the stations used in the Carson model is shown in Figure 2a, where – after transforming each month separately and daily

292 MICHAEL D. DETTINGER ET AL.
Figure 2. Comparisons of observed 1960–72, simulated 1960–72, downscaled-simulated 1960–72, and downscaled-simulated 2048–99 daily temperatures (a) and precipitation rates (b) for Woodfords, California, weather station (site 6 in Figure 1); at other meteorological stations, observations spanned the entire 1951–72 training period and were used for fitting the downscaling relations.
minimum temperatures separately from daily maxima – daily mean temperatures from all months of the year have been lumped into a single probability plot. The correspondence between observations and the downscaled version of simulated temperatures is excellent.
The probability distributions of daily precipitation are somewhat more complex than the (essentially Gaussian) temperature distributions, because daily precipitation includes many days with no precipitation and because precipitation seldom

SIMULATED HYDROLOGIC RESPONSES TO CLIMATE VARIATIONS AND CHANGE 293
exhibits a Gaussian distribution. The procedure described for temperatures was modified to accommodate these complexities. First, the sorted precipitation series from observations and simulations were compared in order to identify a threshold value in the simulations that corresponds to the onset of precipitation in observations. That is, because climate models often exhibit a grid-scale tendency to ‘drizzle’ more than the real world (e.g., Lindberg and Broccoli, 1995), it was assumed that many of the lowest simulated precipitation values might amount to dry days in the real world. Determining a threshold for assigning simulated precipitation values to the ‘dry day’ category was as simple as counting the number of dry days in the observed time series and determining the precipitation value for the corresponding rank in the sorted precipitation series; days with simulated precipitation values greater than this threshold were treated as wet days, those drier than this threshold were assigned a precipitation total of zero. For example, notice, in Figure 2b, that untransformed (raw) simulated precipitation values below about 1.5 mm/day were assigned to the ‘dry day’ category to ensure that simulated (historical period) dry days were no less common than observed dry days; in fact, this determination was made separately for each month of the year and so is more complex than a single threshold. (The primary difficulty with this procedure occurs when there are fewer simulated wet days than observed wet days. In the present study, this was rare and only occurred in the dry months of July and August when little precipitation is contributed in any event. The procedure was modified to accommodate this occurrence by setting observed values less than the corresponding simulated threshold to zero and scaling all the remaining wet (observed) days up to conserve total precipitation, before proceeding as follows.)
Having separated wet from dry days, the remainder of the downscaling procedure was similar to that used previously for temperatures: the sorted, remaining observed precipitation values were functionally related to the corresponding (ranked) simulated values by fitting a regression relation. Unlike temperatures, the daily square roots of precipitation were regressed (in order to render them approximately Gaussian; Wilson, 1997), and cubic or more complex equations were fitted rather than the simple linear relations used with temperatures. This additional level of polynomic detail in the downscaling of precipitation ultimately reduced extreme values achieved in the future simulations when a few precipitation values that were much larger than any observed in the training period had to be accommodated. The resulting probability distributions of the untransformed (raw) simulated, transformed simulated, and observed precipitation values are compared in Figure 2b, where a very close agreement of the observed and downscaled simulated distributions is evident.
One concern with this procedure, when applied to coupled climate model outputs, is whether the large-scale climate conditions in the simulated training period (1951–72) were the same as in the observed training period. Suppose that the coupled model had been in a period dominated by El Niños (e.g., in a positive phase of the Pacific Decadal Oscillation (PDO; Mantua et al., 1997)) during the
294 MICHAEL D. DETTINGER ET AL.
training period, whereas the real world was in a period more dominated by La Niñas. In such case, the downscaling functions developed might have had the effect of making an El Niño-rich model climatology of temperature and precipitation over California look like the observed La Niña climatology (Cayan and Webb, 1992). Then, in other periods of the simulations, when the model was more La Niña-rich, the downscaling could yield temperatures and precipitation rates that overcompensated, making the downscaled climatology resemble a super-La Niña climate. This problem was (as far as we know) avoided by our choice of training periods; comparisons of central North Pacific sea-surface temperatures from observations and simulation during the 1951–72 training period (not shown here) indicate that both were in a relatively warm (negative PDO, La Niña-rich) decadal state during that period. On interannual time scales, this training period contained both El Niños and La Niñas in both the HIS simulation and the observations. Indeed, analyses of the HIS and BAU simulations of sea-surface temperatures, tropical precipitation fields, and atmospheric circulations (not shown) indicate that PCM yields realistic interannual ocean-air climate variations in the HIS simulation (see also Zhu et al., 2004) and that those variations continue with little change under future conditions.
The remainder of the historical simulation and the future-climate simulations were then transformed using the same regression relations as developed for the training period, under the assumptions (a) that, even under differing climate conditions, the combination of simulated weather conditions that yielded a particular daily temperature or precipitation value in the simulated training period, if encountered at another time, will yield – in the real world – a similar value, and (b) that, even in a climate changed world, almost all daily values will be within the range of values encountered in the 21-year training period. The range of values will be (mostly) the same, with only the frequency with which, say, warmer values occur changing along with the occurrence of a relatively few much-warmer-than-ever-before values. For example, note, in Figure 2a, that even though the simulated 2048–99 period is generally several degrees warmer than the training period, the number of future days that are warmer than any in the training period (warmer than about 30 ◦C) is quite small (less than 0.1%). Similarly, fewer than 0.5% of the simulated 2048–99 days are wetter than any in the training period. Thus, extrapolations beyond the ranges of values in the training period are relatively uncommon. For the purposes of this study, then, the transformation functions fitted in the 1951–72 training period are assumed to apply to all simulated values. This is an important and potentially problematic oversimplification, but is closely related to common assumptions (Wilby et al., 1998) that (a) the statistical relations used in many, more elaborate statistical-downscaling procedures can be transferred beyond their historical training periods (or even from one model to another) and (b) that regional climate-dynamics models calibrated in one period will necessarily be transferable to other, different climate forcings. The present approximation is assumed to be adequate for the analyses of long-term river responses to climate changes pre

SIMULATED HYDROLOGIC RESPONSES TO CLIMATE VARIATIONS AND CHANGE 295
sented here; dynamical downscalings of the duration of the continuous simulations presented here (200 years) are essentially beyond present computational capacities.
3. Historical and Future Climate Changes
Globally, the PCM BAU simulations of climate yield significant long-term increases in temperature and precipitation. Notably, PCM responses to greenhouse-gas increases are near the low end of projections made by a sampling of comparably modern climate models (not shown here, but see http://ipcc-ddc.cru.uea.ac.uk/cru_ data/visualization/). The global-mean HIS temperatures begin to warm markedly after about 1975 when the historical increases in radiative forcing accelerate. The BAU simulation yields a continuation of this trend (not shown). Global mean temperatures in the FC simulation are somewhat warmer than those from the 1975– 2000 period in HIS, and are fully +0.6 ◦C warmer than those from earlier in the 20th century. Global precipitation also increases markedly and significantly in the BAU future, although overall the change is only about +5% of the early HIS values. Global precipitation in the FC run is also significantly increased relative to the early HIS values, but not significantly different than those in the 1985–2000 period. BAU precipitation rates are greater than the FC rates after about 2020.
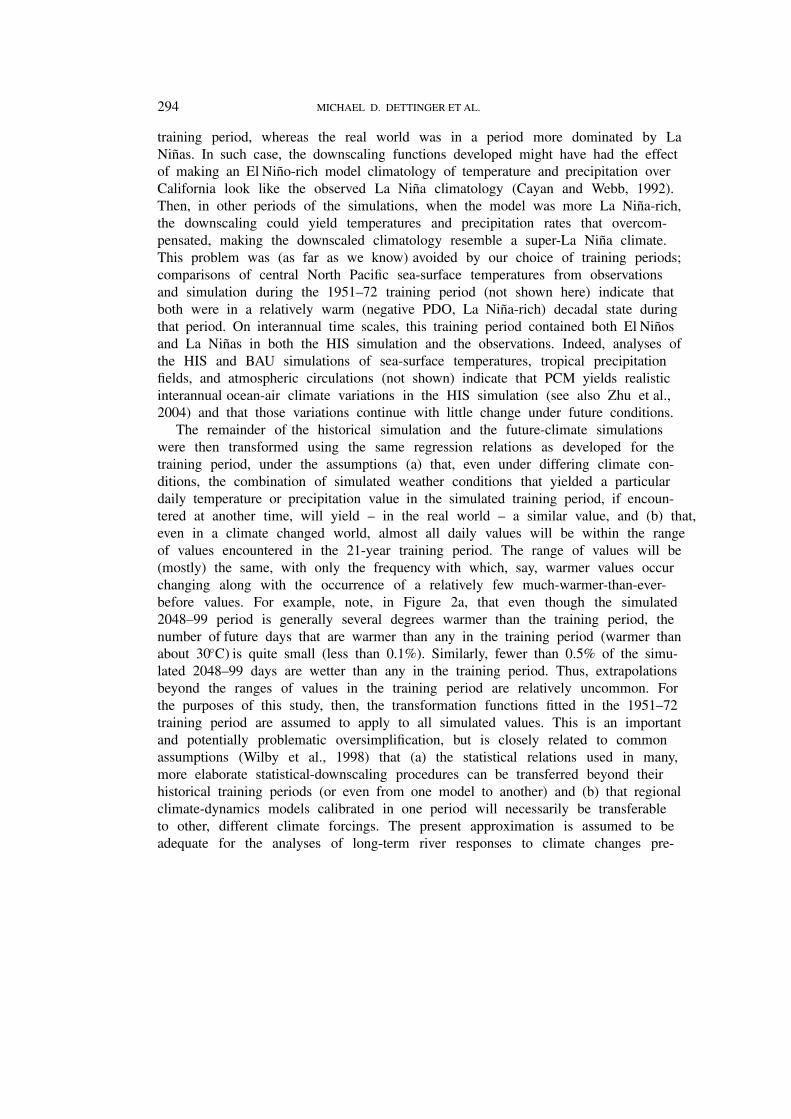
Over California (and, indeed, over the Northern Hemisphere as a whole), similar future warming trends are simulated (Figure 3a), while the HIS trend is weak and restricted to the last several decades. The BAU simulation yields a highly significant mean warming over California during the 21st century of +2.4 ◦C (that is, the hypothesis that the means of BAU and HIS periods are different can rejected under a simple student-t at 99% levels, so that the attained significance level p � 0.01). This warming is reproduced in the two other BAU simulations shown. In the BAU simulation, California is located along the transition from relatively mild warming trends in the subtropics to greater warming in the high latitudes, and in the transition between relatively mild warming over the North Pacific and greater warming over North America (Figure 4a). Thus, California’s projected warming in the BAU simulation is moderate compared to other regions. An artifactual trend of +0.7 ◦C/century is simulated in the FC run (Figure 3a), but is not significantly discernible from seasonal and interannual variability. Mean Northern California temperatures from the 1900–1974 segment of the HIS simulation are significantly cooler (at p < 0.01 levels, amounting to about 0.5 ◦C cooler overall) than those of the 1975–2000 period and are significantly cooler than those in the FC run or in either the first or second halves of the BAU simulation. The temperatures in the FC run are significantly cooler than either half of the BAU run and are significantly warmer than the pre-1975 mean of the HIS simulation; in contrast, the mean FC temperature is indistinguishable (with p > 0.01) from the mean of the 1975–2000 period in the HIS run. Thus, taken literally, the PCM simulations indicate that the (historically) unusual warmth of the last decades of the 20th century were not a

296 MICHAEL D. DETTINGER ET AL.
Figure 3. Comparisons of simulated 2-m air temperatures (a) and precipitation rates (b), from a single PCM grid point over Northern California from 1900–2100, where the historical run is a PCM simulation with historical radiative forcings imposed, the business-as-usual run is a simulation with future business-as-usual increases in greenhouse gases, and the future-control run is a simulation with future greenhouse-gas concentrations held constant at 1995 levels. All series shown are direct outputs from the PCM simulations, unmodified by any downscaling, that have been filtered with 365-day moving averages. Light dashed curves represent temperatures and precipitation during additional historical and business-as-usual simulations.
SIMULATED HYDROLOGIC RESPONSES TO CLIMATE VARIATIONS AND CHANGE 297
Figure 4. Mean differences between annual-average 2-m air temperatures (a) and precipitation rates (b) in PCM business-as-usual simulation in periods 2069–2098 and 1996–2025.
random fluctuation of the climate, but rather were closely related to the elevated greenhouse-gas concentrations. When the (model) climate system has greenhouse gases held constant at 1995 levels for 50 years, global to regional temperatures remain very near those in the HIS simulation during the decades in which those concentrations are reached.
Although global-mean and Northern Hemisphere-mean precipitation rates increase in the BAU and, even, FC simulations, simulated mean precipitation rates over Northern California differ little from simulation to simulation (whether between HIS, FC, and BAU, or between the various HIS and BAU simulations), while they fluctuate substantially on interannual to interdecadal time scales. Northern California-mean precipitation rates are shown in Figure 3b, for the HIS, FC, and BAU simulations. Mean precipitation rates in the various simulations are not significantly different from each other (nor even from beginning and ending halves of the longer runs). Similarly, precipitation in the simulations does not trend significantly during their various durations. However, although the trend is not large enough to

298 MICHAEL D. DETTINGER ET AL.
rise to the level of statistical significance amidst so much local variability (including an extended dry period at the end of the simulation), the BAU simulation yields a long-term precipitation trend over Northern California of +62 mm/yr/century (+8%/century). This trend is comparable in magnitude to the land-only precipitation trend for the Northern Hemisphere extratropics in the same simulation (+57 mm/yr/century, not shown here) and is much larger than the oceans-only trend (+21 mm/yr/century). In the BAU simulation, northern California is located near the transition between mid- to high-latitude North American regions of increasing wetness and a band of drying conditions over the subtropical North Pacific and Mexico (Figure 4b). This outcome is substantially different from the simulation of future California climate by the Hadley Center for Climate Prediction and Research climate model that was a centerpiece of the recent U.S. national assessment of climate-change impacts (U.S. National Assessment Synthesis Team, 2000); that model simulated a remarkably wetter California climate by the end of the 21st Century (Kim, 2001; Wilby and Dettinger, 2000). The current PCM simulations yield much subtler precipitation changes and thus highlight the influences of regional warming on California hydrology.
Overall, the California-climate variations used to drive the hydrologic models in the next sections include a +0.5 ◦C warming in the last decades of the 20th Century (in the HIS run) and a +2.4 ◦C warming during the 21st Century (in the BAU simulation). In the FC simulation, long-term mean temperatures are very near those in the 1990s over a total of 50 simulated years. Small precipitation changes are simulated in the models, but are neither large nor consistent over the life of any of the simulations.
4. Cool-Season Responses
When the PCM temperature and precipitation series, illustrated in Figure 3, are downscaled as described in Section 2.3 and used to force models of the Merced, Carson, and American Rivers, realistic hydrologic variations are simulated, along with notable long-term trends. In this section, streamflow responses to the simulated climates are discussed, with particular focus on changes in the overall flows and their seasonality. As documented in several previous investigations of the sensitivities of Sierra Nevada rivers to warming trends (Gleick, 1987; Lettenmaier and Gan, 1990; Dettinger and Cayan, 1995; Jeton et al., 1996; Risbey and Entekhabi, 1996; Knowles and Cayan, 2001), overall amounts of streamflow do not respond much, but streamflow timing is quite sensitive. Notably, in California, changes in streamflow timing can upset the delicate balance between flood-control management and the storage of water for year-round water-resource needs.
The evolution of water-year mean streamflow rates in response to the PCM climates, 1900–2100, are shown in Figure 5, along with simulated flows from an additional HIS simulation and two additional BAU simulations. Also shown in

SIMULATED HYDROLOGIC RESPONSES TO CLIMATE VARIATIONS AND CHANGE 299
Figure 5. Water-year mean streamflows in the Merced (a), Carson (b), and American (c) Rivers, in response to PCM-simulated climates. Heavy curves are 9-yr moving averages; light dashed curves represent additional historical and business-as-usual simulations and open circles indicated the observed historical records of flows.

300 MICHAEL D. DETTINGER ET AL.
Figure 5 are the observed water-year discharges at the three streamflow gaging stations. Notably, the combination of PCM climate with the watershed models reproduces the observed averages and ranges of annual flows in the three rivers well. The capability of this particular combination of models extends to the daily scale as well. The frequencies of occurrence (as exceedance probabilities) of various flow rates in observations, the calibrated simulations using observed meteorological inputs to the watershed models, and the simulations using the PCM HIS climate are compared, for each river, in Figure 6. In general, the levels of agreement shown are acceptable. Notably, in the high-to-middle range of flow in each river, the frequencies of occurrence are in good agreement. Low flows in both the calibrated and HIS simulations are undersimulated, especially in the Carson and American River models. Even in this low-flow range, however, the calibrated and HIS simulations are quite similar, indicating that the low-flow undersimulation problem is due to the calibrations rather than the use of PCM climate. These low-flow problems reflect undersimulations of contributions to streamflow from shallow ground-water reservoirs in the basin models. The simulated ground-water baseflow provides 42% of the flow in the Merced River (which performs better at the low flows than the other models), but only 12% of flow in the Carson River and 7% in the American River, as calibrated by Jeton et al. (1996). The ground-water reservoirs in PRMS support the most slowly varying discharge fluctuations (Leavesley et al., 1983) and especially the seasonal recession of flows during summer and fall. When these reservoirs are underrepresented, many more extremely low-flow days are simulated. For our purposes, however, the close agreement of the calibrated and HIS curves at most flow rates in Figure 6 indicates that the effects of PCM climate variations and changes can be analyzed, usefully, especially during most of the periods of higher-than-median flows. The highest few percent of the HIS-driven flows, however, diverge from the observed flows and flows simulated with observed meteorology. This problem arises, apparently, from an unrealistic tendency of the PCM to generate a few days with extremely large (and warm) winter storms to which the watershed models respond with extremely large (by real-world standards) floods. This unfortunate divergence of the PCM-simulations limits our ability to quantify the changes in flood statistics during the future climates projected here, although the qualitative ‘direction’ of flood responses will be inferred.
Notably, extremely large yearly precipitation totals occur in both future simulations, in terms of both precipitation (Figure 3b) and streamflow (Figure 5), which may be attributable to the projected future radiative forcings are imposed in the climate model. All three models share this tendency because they are all driven by downscaled versions of meteorology from a single PCM grid point (just north of the rivers). Also, for unknown reasons, the FC simulation is wetter overall than are the last decades of the HIS simulation or the BAU simulation.
None of the simulated streamflow series trend significantly in Figure 5. This is partly because temperature changes – by themselves – yield relatively small annual-flow changes in these rivers (Jeton et al., 1996; Risbey and Entekhabi,

SIMULATED HYDROLOGIC RESPONSES TO CLIMATE VARIATIONS AND CHANGE 301
Figure 6. Frequencies of exceedance of daily streamflow rates in the Merced (a), Carson (b), and American Rivers (c), in observations, the calibrated simulations using observed meteorological inputs, and simulations using the historical simulation of climate, 1960–1998.

302 MICHAEL D. DETTINGER ET AL.
1996), and partly because California precipitation changes in these simulations are relatively small. The insensitivity of streamflow totals to warming in Sierra Nevada basins follows from the close temporal linkages between snowmelt and ET; earlier snowmelt releases water to exit from the basins prior to the major increases in the potential for ET associated with the warmer climates. By the time summer arrives with the highest potentials for ET, runoff has long since carried water from the basins, soil-moisture levels are much reduced (more on this in the next section), and actual ET rates are substantially reduced. As a result, in a warmer climate, annual ET rates do not increase much unless precipitation also increases; otherwise, annual runoff rates remain nearly the same as today (Jeton et al., 1996; Risbey and Entekhabi, 1996).
Unlike the water-year streamflow totals, streamflow timing changes markedly during the course of the various simulations. A practical measure of the projected timing trends is the April–July fraction of each water year’s total flow (Figure 7). April–July flows are critical to California water-supply management practices because, under California’s Mediterranean climate, flows during these months can typically be captured in reservoirs with little risk of floods generated by large storms. In contrast, during the earlier winter and early spring months, ‘winter’ storms are common, and reservoirs often have to release water to maintain flood-control space. The April–July fractions of annual streamflow are reduced, over the course of the BAU simulations, by 14% (of the total flow) in the Merced, by 10% in the Carson, and by 7% in the American, relative to HIS springtime flow fractions. The projected BAU April–July total flows (as opposed to April–July fractions of flow) are reduced by an average of 16% in the Merced, 5% in the Carson River, and 29% in the American during the 21st century. Notice, in Figure 7, that the projected streamflow-timing trends do not depend upon which HIS and BAU simulations are considered and thus, are attributable to the changing radiative forcing rather than to natural climate variations.
Interestingly, the spring fractions of annual flow shown in Figure 7 become more variable from year to year and even from decade to decade under the BAU climate. This increased variability reflects increased variability of snowfall conditions (to be discussed later) but is not a direct reflection of increasing climatic variations. Year-to-year temperature variance remains more of less constant through the HIS and BAU simulations (Figure 3), and the large decadal BAU fluctuations in Figure 7 reflect decadal temperature (and precipitation) fluctuations that are present also in the HIS simulations (with the same amplitudes) but which have a larger impact on the springtime flow fractions under BAU conditions than HIS conditions. The year-to-year precipitation variance increases by about 10% from HIS to BAU simulations. However, the spring fraction of annual flows does not depend directly on the total precipitation or flows. Thus the increased 21st Century variance in Figure 7 corresponds to basin conditions (ultimately, snowfall conditions) that are increasingly variable and sensitive to climate variations as the basins warm.

SIMULATED HYDROLOGIC RESPONSES TO CLIMATE VARIATIONS AND CHANGE 303
Figure 7. Fractions of each water year’s total flows that occur during April-July in the Merced (a), Carson (b), and American (c) Rivers, in response to PCM-simulated climates. Heavy curves are 9-yr moving averages; light green and orange curves represent additional historical and business-as-usual simulations.

304 MICHAEL D. DETTINGER ET AL.
The projected changes in the timing of centroids of annual hydrographs (not shown, but arriving earlier in BAU and FC simulations) and April–July fractions of flow are comparable to observed trends over the last 50 years (Roos, 1991; Dettinger and Cayan, 1995; Cayan et al., 2001) and have been reported in other simulation studies (e.g., Gleick, 1987; Lettenmaier and Gan, 1990; Jeton et al., 1996; Kim, 2001; Knowles and Cayan, 2001; Wilby and Dettinger, 2000). Flow timings in response to the FC climate are quite similar overall to timings in the HIS simulations as a whole.
Another depiction of the simulated streamflow-timing changes is shown in Figure 9, wherein mean-monthly hydrographs for selected 28-yr periods in the simulations are plotted. Large spring streamflow peaks centered on May characterize the high-altitude Merced and Carson Rivers. These two rivers respond to the warming trends in the BAU climate with progressive reductions in the peak monthly flows (in May) and with compensating increases in winter flows. The increased winter flows reflect a greater preponderance of rain in the winter precipitation, earlier snowmelt episodes, and more winter floods. For example, days (nearly all in winter) with simulated Merced River flows greater than 150 m3/s are 250% more common in the last 50 years of the BAU scenario than in the first 50 years of the HIS simulation. Annual maximum daily flood rates are roughly doubled (relative to HIS) in the BAU simulation of the Merced River at all recurrence intervals (not shown). Recall, however, that even the HIS flood magnitudes are unrealistically large (Figure 6) so that the flood-statistic changes projected in the present simulations may be overestimated. Flows from the lower altitude American River basin are dominated by wintertime rainfall runoff and winter-to-early-spring snowmelt so that flows peak in winter and early spring (Figure 8c). Progressively even more streamflow occurs in early winter under the various future scenarios. These changes in the American River (Figure 8c) increase the flows during January through March and reduce the flows in the preceding as well as the following months, so that the centroids of flow timing do not change much. Even the FC simulation is warm enough to yield enhanced winter streamflow rates, comparable to the earlier BAU epoch in Figure 8. The increased winter flows under the FC climate are accompanied by larger flows in other months (especially in the Merced and Carson River basins) as a result of the wetter-than-HIS conditions early in the FC simulation.
The corresponding changes in snowpack are indicated by Figure 9, which shows basin-averaged snow water contents for the three basins on April 1 of each simulated year. April 1 snow water content measures the amount of snowpack available to melt and provides streamflow during the critical late-spring and summer months for water resources in California, when water demands are high and when the risk of winter-storm floods has mostly passed. A slight trend toward increases in April 1 snow water contents characterizes the first three-quarters of the HIS simulation, followed by a major decline after the simulated warming began in earnest in the mid 1970s. The initial wetness of the FC simulation (Figure 5) results in unusually

SIMULATED HYDROLOGIC RESPONSES TO CLIMATE VARIATIONS AND CHANGE 305
Figure 8. Mean-monthly streamflow rates in the Merced (a), Carson (b), and American (c) Rivers, in responses to PCM-simulated climates during selected 29-yr periods, where the historical run is a PCM simulation with historical radiative forcings imposed, the business-as-usual run is a simulation with future business-as-usual increases in greenhouse gases, and the future-control run is a simulation with future greenhouse-gas concentrations held constant at 1995 levels.

306 MICHAEL D. DETTINGER ET AL.
Figure 9. Basin-average April 1 snowwater contents in the Merced (a), Carson (b), and American (c) River basins, in response to PCM-simulated climates; heavy curves are 9-yr moving averages.

SIMULATED HYDROLOGIC RESPONSES TO CLIMATE VARIATIONS AND CHANGE 307
heavy snowpacks that persist until April in its early years. After these first FC decades, its SWE values fall to levels below the early values in the HIS simulation and to levels that are slightly higher than the BAU SWE values, as would be expected for an (FC) simulation that is midway between the smaller greenhouse warming of the early HIS years and the larger greenhouse warming of the 21st Century BAU simulation. After the initial high values in the early years of the simulation, the FC SWEs return to April 1 snow water contents that are generally comparable to the last decades of the HIS simulations. The steadily warming BAU climate yields gradual decreases in April 1 snow water contents in all three river basins. In the American River basin, by the end of the 21st century, average April 1 snowpack is less than 15% of the historical norms (see also U.S. National Assessment Synthesis Team, 2000; Knowles and Cayan, 2001).
These changes in streamflow and April 1 snowpack reflect changes in both the mix of rain and snow in each basin’s precipitation and the timing of snowmelt. By 2099, the water-year average fractions of total precipitation that are rain increases by about 10% in each basin under the BAU future. For example, a significant BAU trend in the Merced River basin’s fraction of precipitation as rain is evident in Figure 10a; changes of similar magnitude are simulated in the other basins (not shown). At the same time, snowmelt occurs much earlier in the BAU simulations. The water-year centroids of simulated snowmelt for the high-altitude Merced River (see Figure 10b) and Carson River (not shown) basins are very similar to the streamflow centroids (not shown), reflecting the dominance of snowmelt in these basins. Snowmelt is simulated to arrive a full month earlier in these basins by the end of the 21st century. Even in the middle altitude American River basin, the snowmelt centroid arrives a month earlier in the BAU run (not shown). During 2070–2098 in the BAU simulation, the net results of these changes in rainfall and snowmelt are reductions of the total (integrated) amounts of average snowwater content in the basins to 51% of the 1970–1998 HIS totals in the Merced River basin, to 67% in the Carson River basin, and to 21% in the American River basin. Most of these snowpack reductions are already evident during 2020–2048 in that simulation, along with their attendant streamflow-timing effects.
The year-to-year and, even, decade-to-decade variability of rainfall fractions increase notably from the HIS to BAU simulations in Figure 10a, just as year-to-year variations of spring fractions of annual flow increased in Figure 7. Notably, the year-to-year variations of the snowmelt centroid dates shown in Figure 10b do not increase as the climate warms. Recalling that the spring fraction of streamflow is only weakly a function of total flow and precipitation, the fluctuations in the spring fraction of streamflow are thus presumed to be a result of simulated increases in the variability of precipitation form (rain versus snow), as winter and spring temperatures increasingly approach or surpass freezing levels in larger parts of the basins. As the fraction of precipitation as rain varies more widely from year to year, the amounts of snowpack formed and then stored for springtime melting also

308 MICHAEL D. DETTINGER ET AL.
Figure 10. (a) Water-year fractions of total precipitation as rainfall; and (b) water-year centroids of snowmelt timing in the Merced River basin, in response to PCM-simulated climates; heavy curves are 9-yr moving averages.
vary more widely (Figure 9). Increasing year-to-year fluctuations in the springtime fraction of river discharge thus would be expected under the present simulations.
5. Warm-Season Streamflow Responses
The hastening of snowmelt and streamflow timing described in the preceding section would affect riverine processes and resource management all along the rivers as they flow out of the mountains, through their respective reservoirs and water

SIMULATED HYDROLOGIC RESPONSES TO CLIMATE VARIATIONS AND CHANGE 309
uses, to their eventual downstream outflow to the Sacramento–San Joaquin Delta and San Francisco Bay (Knowles and Cayan, 2001) to the west and to the Carson Sink in the east. Within the basins themselves, the timing changes correspond to changing cool-season conditions (e.g., winter and spring flooding) but also have consequences throughout the dry, warm season.
Because snowmelt and runoff occur earlier in the year in response to the warming climates, less water is left in the basins by the time that the warm seasons arrive. Remnant snowpacks, soil moisture, and shallow ground-water reservoirs are more depleted by summertime in response to earlier runoff from the basins. As a result, simulated late summer and autumn flows are much reduced under the BAU scenarios. For example, although the models all tend to underestimate the lowest flows (Figure 6) and thus may be overly sensitive at this extreme, the average 7day low-flow rates in all three models decline by as much as 49% in the BAU simulations.
The reduced warm-season flows of the BAU simulation reflect decreases in the warm-season supply of water to the basin (by snowmelt) and depletions in moisture storage in the soils and shallow ground waters of the basins; they do not result from summertime increases in ET. Because the characteristic snowmelt peaks have been much reduced in the BAU simulations, the moisture that spring snowmelt currently releases into the basins is no longer available for warm-season ET in that scenario. As a result, the BAU summertime rates of ET are reduced to values substantially below the HIS and FC counterparts (Figure 11). The strong control of wintertime conditions on these ET reductions can be illustrated by manipulating the inputs to the watershed models: When the BAU watershed simulations were rerun with cool-season meteorology replaced by the corresponding seasons from the HIS simulation, the projected summertime ET reductions shown in Figure 11 were essentially eliminated. Conversely, when BAU simulations were rerun with summertime conditions replaced by the summer condition from the HIS simulations, the reduction of summer ET remained almost unchanged.
Despite these changes in the seasonality of ET, water-year totals of ET are remarkably similar among the various climates. Table II compares the water-year ET totals for the epochs shown in Figure 11, and demonstrates that the reductions in summertime ET indicated in Figure 11, due to summer reductions in soil-moisture and despite increases in the summer potential for ET, are just sufficient to compensate for the increases in winter-spring ET due to warmer temperatures and greater moisture availability in winter. Jeton et al. (1996) and Risbey and Entekhabi (1996) explored this compensatory balance over a broad range of temperature and precipitation changes and found that it is a common feature of the response of these basins to warmer (and cooler) climates, in both simulations and observations. As discussed early in Section 4, these small responses in water-year ET totals result in correspondingly small responses of water-year streamflow totals to the warmer PCM-simulated climates.

310 MICHAEL D. DETTINGER ET AL.
Figure 11.

SIMULATED HYDROLOGIC RESPONSES TO CLIMATE VARIATIONS AND CHANGE 311
Table II
Basin-average, water-year total evapotranspiration-plus-sublimation rates(mm/yr) in response to PCM-simulated climates
Simulation Basin
Merced Carson American
Historical (1970–98) 541 546 533
Future-control (2020–48) 549 579 549
Business-as-usual (2020–48) 511 531 513
Business-as-usual (2070–98) 518 544 538
The reductions in ET, and the soil-moisture depletions that they herald (not shown), would also be reflected in moisture stresses on the flora and fauna of the basins, and in additional drying of wildfire-fuel loads in their forests and grasslands. To illustrate the additional stress that the summertime drying in these various simulations might impose on the basin ecosystems, a simple index of soil-moisture deficits was constructed: The mean seasonal cycles of basin-averaged soil moisture in each of the basins was calculated for the 1970–1998 period of the historical simulations; the lowest soil-moisture value in the average cycle for each basin was determined, and deviations below that (basin-specific) mean low soil-moisture content were integrated over 50-yr segments of the simulations. This index of soil-moisture deficits is analogous to the degree-day temperature indices commonly used in snowmelt investigations and, in this case, measures how much soil-moisture deficit is ‘inflicted’ on each basin. Clearly, from Table III, the extremes of soil-moisture deficit would increase under the BAU climate; by the measure used here, by 2049 in the BAU simulations, accumulated deficits are between 161 and 191% of those accumulated in the HIS simulation during a similar number of years. Deficits in the FC simulation – with its wetter and only modestly warmer climate – accumulate at the same rates as in the HIS simulation. A die-back of vegetation in the basins, in response to these stresses, could serve to further decrease summertime ET, but neither the (unknown) rate nor the (unknown) role of long-term vegetation change in response to the simulated climate effects could be incorporated into the present watershed simulations. Along with any major vegetation changes may come significant soil and infiltration changes as well.
Figure 11 (facing page). Seasonal cycles of the sum of evapotranspiration and sublimation in the Merced (a), Carson (b), and American (c) River basins in response to PCM-simulated climates during selected 29-yr periods, where the historical run is a PCM simulation with historical radiative forcings imposed, the business-as-usual run is a simulation with future business-as-usual increases in greenhouse gases, and the future-control run is a simulation with future greenhouse-gas concentrations held constant at 1995 levels.

312 MICHAEL D. DETTINGER ET AL.
Table III
Basin-average accumulated soil-moisture deficits below historical (1970–98) mean-seasonal low soil-moisture contents in response to PCM-simulated climates, in mm-days
Simulation Basin
Merced Carson American
Historical (1900–1949) 121 109 6
Historical (1949–1998) 151 132 8
Future-control (2000–2049) 157 106 6
Business-as-usual (2000–2049) 231 176 11
Business-as-usual (2049–2098) 291 207 12
6. Conclusions
Likely responses of Sierra Nevada rivers to climate changes associated with historical and future increases in greenhouse-gas and sulfate-aerosol concentrations in the atmosphere have been simulated by coupling the Parallel Climate Model (PCM) to watershed models of the Merced, Carson, and American Rivers, by a deterministic downscaling of global-model outputs to surface-observation scales. The PCM has been shown to produce realistic climate variations (Washington et al., 2000) as well as remarkably realistic simulations of historical ocean-temperature responses to greenhouse-gas increases (Barnett et al., 2001). The simulations used here are notable also for the considerable efforts invested to establish realistic initial conditions in the model ocean (Dai et al., 2004), for their completeness (daily values for 50–105 years each were used in the hydrological simulations), and for the availability of an unusual future-control simulation in which radiative forcings (greenhouse-gas and aerosol concentrations) were held constant at 1995 levels for 50 years following the 1990s. This future-control simulation allowed us to investigate the possibility that the anomalous climate conditions experienced globally, and locally in California, during the 1990s may reflect increased greenhouse-gas concentrations more than natural climate fluctuations. The watershed models have been adequately calibrated to historical records and have been used previously for climate-change investigations (e.g., Jeton et al., 1996; Wilby and Dettinger, 2000).
The PCM-simulated climate responds to historical radiative forcings with fairly stable temperatures and precipitation rates, globally and locally, through the 20th Century until the mid 1970s, when a clear warming trend begins. Globally, the future-control simulation yields temperatures and precipitation rates that are stationary (but naturally variable) around values much like those of the last decades of the 20th Century. Locally, over northern California, simulated temperatures

SIMULATED HYDROLOGIC RESPONSES TO CLIMATE VARIATIONS AND CHANGE 313
rise in the last part of the 20th Century and then stabilize at 1990s levels under the future-control simulation. Mean northern California precipitation rates remain more-or-less stationary (by simple statistical measures) throughout all three climate simulations. In contrast to the future-control climate, the business-as-usual future climate continues the trends of the late 20th Century, with additional warming of about +2.4 ◦C and a 5% increase in precipitation by 2100. In the midst of realistic levels of interannual and decadal climate variability, these business-as-usual trends become indisputably different from historical variations by about 2025. The contrast between the trending business-as-usual climate and the stabilized-near-1990-levels future-control climate suggest that, in this model, the anomalously warm wet conditions of the late 20th Century are closely related to the greenhouse-gas concentrations, rather than being a random climate excursion. Simulated hydrologic responses to the PCM-simulated climates include small trends in total streamflow and ET, and large, clear trends towards earlier snowmelt runoff and reductions in summertime low flows and soil moisture. Snowmelt and streamflow arrive about one month earlier by 2100 in the business-as-usual future, in response to increased proportions of rain to snow and earlier snowmelt episodes. These timing changes are accompanied by increased frequency of winter flooding and, later in the year, result in lower low flows, less summertime soil moisture, increased stresses on basin vegetation and ecosystems, and presumably increased wildfire risks. The relative historical preponderance of rainfall runoff and rapid-snowmelt runoff in the middle-altitude, warm American River basin ensures that the ‘center-of-mass’ of its annual hydrographs (as a measure of overall streamflow timing) does not trend as much as those in the higher, cooler Merced and Carson Rivers, although its snowmelt is hastened by just as much as in those higher basins.
By summer, because most of the runoff has exited the basins earlier in their water years, less moisture is available and various shallow groundwater ‘reservoirs’ are depleted (relative to the historical simulations). This reduction in summertime moisture availability ensures that, although the potential for ET increases with the warming of the business-as-usual climate, the actual amounts of summer ET decline along with the summertime streamflow rates. The reductions in warm-season ET are almost entirely a response to the projected winter-spring changes.
By and large, a tendency for the future-control climate to include more wet years in California than in the other simulations, made it somewhat difficult to compare its hydrologic responses to the others. Notably, though, the response of streamflow and snowmelt timing to that scenario were more similar to the historical simulation than to the business-as-usual future (Figure 7), suggesting that – even though earlier snowmelt and runoff trends have already been observed in the Sierra Nevada (e.g., Dettinger and Cayan, 1995; Cayan et al., 2001; Stewart et al., 2004) – much of the streamflow-timing change projected here will await the warmer-than-historical temperatures of the post-2025 business-as-usual climate. The greater wetness of the future-control simulation partly ameliorates the tendencies toward less snow (as

314 MICHAEL D. DETTINGER ET AL.
a fraction of precipitation) and earlier snowmelt, so that under the future-control climate, April 1 snowpacks and summer low flows are slightly enhanced relative to both the historical and business-as-usual scenarios. Thus, the direction and amount of precipitation changes in the climate scenario are, once again, demonstrated to be of primary importance in impact assessments, although the present BAU simulations, like those of many other GCMs, yield notably small precipitation changes over California. Overall, though, uncertainties associated with projections of precipitation change remain large.
The future trends in runoff timing and the reductions in snowpack and soil moisture are evident in the continuous 200-yr period spanned by these simulations. The availability of such continuous simulations allows us to discard many concerns that the particular climate-change responses reported might be ‘contaminated’ by inadvertent focuses on wet- or dry-, warm- or cool decades in the naturally varying course of the climate. The trends reported here are clearly visible in the 200-yr time series plots provided, despite the presence of strong decadal fluctuations, so that most trends would be indisputable by 2025. Similarly, comparisons of business-as-usual future river basin responses to the future-control responses allow us to conclude that the primary agent that is changing the simulated hydrologic conditions in the 21st Century are the rising greenhouse-gas concentrations. The use of continuous climate forcings through the evolution of climate changes, and comparisons to well-designed control experiments that parallel the changing future climates, are critical to the usefulness and success of studies like this and should be subjects of careful planning for future assessments of the sensitivities of hydrologic systems to climate change.
The most notable conclusion from the present study may be that even the relatively modest changes in climate projected by the PCM model would be sufficient to induce significant and disruptive changes in the hydrology and ecosystems of these three representative Sierra Nevadan river basins. The PCM climate-change projections are actually near the lower edge of the available climate-change simulations in terms of warming (ranging from about +2 ◦C to +5 ◦C in Ding and Houghton, 2001) and yield only modest changes in overall precipitation. If even these modest climate-change projections are sufficient to cause the important hydrological changes in the Sierra Nevada simulated here, then prospects for climate-change impacts in California can rightly be taken quite seriously, despite large remaining climate-change uncertainties.
Acknowledgements
This work was supported by the U.S. Department of Energy’s Office of Science (BER) Accelerated Climate Prediction Initiative, the National Oceanic and Atmospheric Administration’s Office of Global Programs through the California Applications Program and Climate Change Center at Scripps Institution of Oceanography, and the U.S. Geological Survey’s Office of Surface Water.

SIMULATED HYDROLOGIC RESPONSES TO CLIMATE VARIATIONS AND CHANGE 315
References
Aguado, E., Cayan, D. R., Riddle, L., and Roos, M.: 1992, ‘Climatic Fluctuations and the Timing of West Coast Streamflow’, J. Climate 5, 468–1483.
Barnett, T. P., Pierce, D. W., and Schnur, R.: 2001, ‘Detection of Anthropogenic Climate Change in the World’s Oceans’, Science 292, 270–274.
Briegleb, B. P. and Bromwich, D. H.: 1998, ‘Polar Radiation Budgets of the NCAR CCM3’, J. Climate 11, 1246–1269.
Cayan, D. R., Kammerdiener, S., Dettinger, M. D., Caprio, J. M., and Peterson, D. H.: 2001, ‘Changes in the Onset of Spring in the Western United States’, Bull. Amer. Meteorol. Soc. 82, 399–415.
Cayan, D. R. and Webb, R. H.: 1992, ‘El Nino/Southern Oscillation and Streamflow in the Western United States’, in Diaz, H. F. and Marlkgraf, V. (eds.), El Niño: Historical and Paleoclimatic Aspects of the Southern Oscillation, Cambridge University Press, New York, pp. 29–68.
Dai, A., Washington, W. M., Meehl, G. A., Bettge, T. W., and Strand, W. G.: 2004, ‘The ACPI Climate Change Simulations’, Clim. Change 62, 29–43.
Dai, A., Wigley, T. M. L., Boville, B. A., Kiehl, J. T., and Buja, L. E.: 2001, ‘Climates of the Twentieth and Twenty-First Centuries Simulated by the NCAR Climate System Model’, J. Climate 14, 485–519.
Dettinger, M. D.: 1997, ‘Forecasting Runoff Pulses in the Merced River, Yosemite Valley, California, Springs 1979–97’, EOS 78, F218.
Dettinger, M. D. and Cayan, D. R.: 1995, ‘Large-Scale Atmospheric Forcing of Recent Trends toward Early Snowmelt in California’, J. Climate 8, 606–623.
Dettinger, M. D., Mo, K., Cayan, D. R., and Jeton, A. E.: 1999, ‘Global to Local Scale Simulations of Streamflow in the Merced, American, and Carson Rivers, Sierra Nevada, California’, Preprints, AMS, 14th Conf. Hydrology, 80–82.
Dettinger, M. D., Mo, K. C., Cayan, D. R., and Peterson, D. H.: 1998, ‘Hindcasts and Forecasts of Streamflow in the Merced and American Rivers, Sierra Nevada, during Recent El Ninos’, EOS 79, F326.
Ding, Y. and Houghton, J. T. (eds.): 2001, Climate Change 2001 – The Scientific Basis: Contribution of Working Group I to the Third Assessment Report of the Intergovernmental Panel on Climate Change, Cambridge University Press, New York, 881 pp.
Gleick, P. H.: 1987, ‘The Development and Testing of a Water Balance Model for Climate Change Impact Assessment – Modeling the Sacramento basin’, Water Resour. Res. 23, 1049–1061.
Hack, J. J., Kiehl, J. T., and Hurrell, J. W.: 1998, ‘The Hydrologic and Thermodynamic Characteristics of the NCAR CCM3’, J. Climate 11, 1179–1206.
Hurrell, J., Hack, J. J., Boville, B. A., Williamson, D., and Kiehl, J. T.: 1998, ‘The Dynamical Simulation of the NCAR Community Climate Model Version 3 (CCM3)’, J. Climate 11, 1207–1236.
Jeton, A. E., Dettinger, M. D., and Smith, J. L.: 1996, Potential Effects of Elimate Change on Streamflow, Eastern and Western Slopes of the Sierra Nevada, California and Nevada, USGS, Water Resources Investigations Report 95–4260, 44 pp.
Jeton, A. E. and Smith, J. L.: 1993, ‘Development of Watershed Models for Two Sierra Nevada Basins using a Geographic Information System’, Water Resour. Bull. 29, 923–932.
Kiehl, J. T, Hack, J. J., Bonan, G. B., Boville, B. A., Williamson, D. L., and Rasch, P. J.: 1998, ‘The National Center for Atmospheric Research Community Climate Model: CCM3’, J. Climate 11, 1131–1149.
Kim, J.: 2001, ‘A Nested Modeling Study of Elevation-Dependent Climate Change Signals in California Induced by Increased Atmospheric CO2’, Geophys. Res. Lett. 28, 2951–2954.
Knowles, N. and Cayan, D.: 2001, ‘Global Climate Change – Potential Effects on the Sacra-mento/San Joaquin Watershed and the San Francisco Estuary’, Interagency Ecological Studies Program for the Sacramento-San Joaquin Estuary Newsletter (Summer), 23–30.

316 MICHAEL D. DETTINGER ET AL.
Leavesley, G. H., Lichty, R. W., Troutman, B. M., and Saindon, L. G.: 1983, ‘Precipitation-Runoff Modeling System: User’s Manual’, USGS Water-Resources Investigations Report 83–4238, 207 pp.
Leggett, J. A., Pepper, W. J., and Swart, R. J.: 1992, ‘Emissions Scenarios for IPCC: An Update’, in Houghton, J. T., Callande, B. A., and Varney, S. K. (eds)., Climate Change 1992: The Supplementary Report to the IPCC Scientific Assessment, Cambridge University Press, New York, pp. 69–95.
Lettenmaier, D. P. and Gan, T. Y.: 1990, ‘Hydrologic Sensitivities of the Sacramento-San Joaquin River Basin, California, to Global Warming’, Water Resour. Res. 26, 69–86.
Lindberg, C. and Broccoli, A. J.: 1995, ‘Representation of Topography in Spectral Climate Models and its Effect on Simulated Precipitation’, Preprints, AMS 7th Conf. Mountain Meteorology, 6–11.
Mantua, N. J., Hare, S. R., Zhang, Y., Wallace, J. M., and Francis, R. C.: 1997, ‘A Pacific Interdecadal Climate Oscillation with Impacts on Salmon Production’, Bull. Amer. Meteorol. Soc. 78, 1069– 1079.
Miller, N., Kim, J. W., and Dettinger, M. D.: 1999, ‘California Streamflow Evaluation Based on a Dynamically Downscaled 8-Year Hindcast (1988–1995), Observations, and Physically Based Hydrologic Models’, Eos 80, F406.
Miller, N. L., Kim, J. W., and Dettinger, M. D.: 2000, ‘Climate Change Sensitivity Analysis of Two California Headwaters: American River and Russian River’, Proc. 17th Annual PACLIM Workshop, 110.
National Research Council: 2001, Climate Change – An Analysis of some Key Questions, National Academy Press, Washington, D.C., 42 pp.
Obled, C. and Rosse, B. B.: 1977, ‘Mathematical Models of a Melting Snowpack at an Index Plot’, J. Hydrology 32, 139–163.
O’Brien, T. P., Sornette, D., and McPherron, R. L.: 2001, ‘Statistical Asynchronous Regression: Determining the Relationship between Two Quantities that are not Measured Simultaneously’, J. Geophys. Res. 106, 13247–13259.
Risbey, J. S. and Entekhabi, D.: 1996, ‘Observed Sacramento Basin Streamflow Responses to Precipitation and Temperature Changes and its Relevance to Climate Impact Studies’, J. Hydrology 184, 209–223.
Roos, M.: 1991, ‘A Trend of Decreasing Snowmelt Runoff in Northern California’, Proc. 59th Western Snow Conference, Juneau, AK, 29–36.
Slack, J. R. and Landwehr, J. M.: 1992, ‘Hydro-Climatic Data Network (HCDN): A U.S. Geological Survey Streamflow Data Set of the United States for the Study of Climate Variations, 1874– 1988’, USGS Open-File Report 92–129, 193 pp.
Smith, J. L. and Reece, B. D.: 1995, ‘Watershed Characterization for Precipitation Runoff Modeling System, North Fork American River and East Fork Carson River Watersheds, California,’ USGS Hydrologic Investigations Atlas HA-734, 1 sheet.
Stewart, I., Cayan, D. R., and Dettinger, M. D.: 2004, ‘Changes in Snowmelt Runoff Timing in Western North America under a “Business as Usual” Climate Change Scenario’, Clim. Change 62, 217–232.
U.S. National Assessment Synthesis Team: 2000, ‘Climate Change Impacts on the United States: The Potential Consequences of Climate Variability and Change: Overview’, Report of the National Assessment Synthesis Team, U.S. Global Change Research Program, Cambridge University Press, New York, 154 pp.
Wahl, K. L.: 1992, ‘Evaluation of Trends in Runoff in the Western United States’, AWRA, Managing Water Resources during Global Change, 701–710.
Washington, W. M., Weatherly, J. W., Meehl, G. A., Semtner, A. J., Bettge, T. W., Craig, A. P., Strand, W. G., Arblaster, J., Wayland, V. B., James, R., and Zhang, Y.: 2000, ‘Parallel Climate Model (PCM) Control and Transient Simulations’, Clim. Dyn. 16, 755–774.

SIMULATED HYDROLOGIC RESPONSES TO CLIMATE VARIATIONS AND CHANGE 317
Wilby, R. L. and Dettinger, M. D.: 2000, ‘Streamflow Changes in the Sierra Nevada, California, Simulated using Statistically Downscaled General Circulation Model Output’, in McLaren, S. and Kniveton, D. (eds.), Linking Climate Change to Land Surface Change, Advances in Global Change Research 6, Kluwer Academic Publishers, pp. 99–121.
Wilby, R. L., Wigley, T. M. L., Conway, D., Jones, P. D., Hewitson, B. C., Main, J., and Wilks, D. S.: 1998, ‘Statistical Downscaling of General Circulation Model Output: A Comparison of Methods’, Water Resour. Res. 34, 2995–3008.
Willen, D. W., Shumway, C. A., and Reid, J. E.: 1971, ‘Simulation of Daily Snow Water Equivalent and Melt’, Proc. 1971 Western Snow Conference, 1–8.
Wilson, R. C.: 1997, ‘Daily Rainfall along the U.S. Pacific Coast Appears to Conform to a Square-Root Normal Probability Distribution’, Proc. 13th Annual Pacific Climate Workshop, 19–32.
Zhu, C., Pierce, D. W., Barnett, T. P., Wood, A. W., and Lettenmaier, D. P.: 2004, ‘Evaluation of Hydrologically Relevant PCM Climate Variables and Large-Scale Variability over the Continental U.S.’, Clim. Change 62, 45–74.
(Received 10 June 2002; in revised form 1 July 2003)
Related Documents