HDZZ ZBORNIK RADOVA ŠESTOG SIMPOZIJA HRVATSKOG DRUŠTVA ZA ZAŠTITU OD ZRAČENJA CRPA PROCEEDINGS OF THE SIXTH SYMPOSIUM OF THE CROATIAN RADIATION PROTECTION ASSOCIATION Urednici / Editors Verica Garaj Vrhovac Nevenka Kopjar Saveta Miljanić Zagreb 2005

Welcome message from author
This document is posted to help you gain knowledge. Please leave a comment to let me know what you think about it! Share it to your friends and learn new things together.
Transcript
HDZZ
ZBORNIKRADOVAŠESTOG
SIMPOZIJAHRVATSKOGDRUŠTVA ZAZAŠTITU OD
ZRAČENJA
CRPA
PROCEEDINGSOF THE SIXTHSYMPOSIUMOF THECROATIANRADIATIONPROTECTIONASSOCIATION
Urednici / EditorsVerica Garaj-Vrhovac
Nevenka KopjarSaveta Miljanić
Zagreb2005

Zbornik radova VI. simpozijaHRVATSKOG DRUŠTVA ZA ZAŠTITU OD ZRAČENJA
Proceedings of the 6th Symposium of theCROA TIAN RADI A TION PROTECTION ASSOCIA TION
Izdavač / Published by
HRVATSKO DRUŠTVO ZA ZAŠTITU OD ZRAČENJACROA TIAN RADIA TION PROTECTION ASSOCIA TION
Urednici / EditorsVerica Garaj-Vrhovac
Nevenka KopjarSaveta Miljanić
Tiskara / Printing House"Agraf
Franjina ulica 7, 10430 Hrastina Samoborska
Naklada / Copies220
ISBN 953-96133-5-3
HDZZ - CRPAZagreb, 2005
CIP - Katalogizacija u publikacijiNacionalna i sveučilišna knjižnica, Zagreb
UDK 613.648(063)614.876(063)
HRVATSKO društvo za zaštitu od zračenjaSimpozij (6 ; 2005 ; Zagreb)
Zbornik radova VI. Simpozija Hrvatskog društva za zaštitu odzračenja, <Zagreb, 18.-20. travnja 2OO5.> = Proceedings of the6th Symposium of the Croatian Radiation ProtectionAssociation /
Urednici / editors: Verica Garaj Vrhovac, Nevenka Kopjar iSaveta Miljanić - Zagreb : Hrvatsko društvo za zaštitu odzračenja,2005.-477 str.; 24 cm
Tekst na hrv. ili engl. jeziku. -Bibliografija iza većine radova.-Summaries
ISBN 953-96133-5-3
450321061
ISBN 953-96133-5-3
VI. SIMPOZIJHRVATSKOG DRUŠTVA ZA ZAŠTITU OD ZRAČENJA
s međunarodnim sudjelovanjemStubičke Toplice, Hrvatska
18.-20. travnja 2005.
6th SYMPOSIUM OF THECROA TI AN RADI A TION PROTECTION ASSOCIA TION
with international participationStubičke Toplice, Croatia
April 18-20, 2005
Organizator / Organiser
HRVATSKO DRUŠTVO ZA ZAŠTITU OD ZRAČENJACROA TIAN RADI A TION PROTECTION ASSOCIA TION
Suorganizatori / Co-organisers
Institut za medicinska istraživanja i medicinu rada, ZagrebInstitute for Medical Research and Occupational Health, Zagreb
Institut "Ruđer Bošković", ZagrebRuđer Bošković Institute, Zagreb
Pokroviteljstvo / Under the Auspices ofMinistarstvo gospodarstva, rada i poduzetništva
Ministry of Economy, Labour and EntrepreneurshipMinistarstvo zaštite okoliša, prostornog uređenja i graditeljstva
Ministry of Environmental Protection, Physical Planning and ConstructionMinistarstvo znanosti, obrazovanja i športa
Ministry of Science, Education and SportsDržavni zavod za zaštitu od zračenja
State Institute of Radiation ProtectionDržavni zavod za normizaciju i mjeriteljstvo
State Office for Standardization and MetrologyAgencija za posebni otpad
APO Ltd. - Hazardous Waste Management Agency
Znanstveni odbor / Scientific Committee
Verica Garaj-Vrhovac (predsjednica /chairwoman)Zdenko Franić
Ines Krajcar BronićStipe Lulić
Rafael MartinčićSaveta MiljanićBogomil ObelićMirjana Poropat
Maria Ranogajec-KomorMladen Vrtar
Organizacijski odbor / Scientific Committee
Nevenka Kopjar (predsjednica/chairwoman)Željka KneževićJadranka KovačVladimir LoknerGordana MarovićĐurđica MilkovićJasminka Senčar
Nikša SviličićMiljenko Šimpraga
Sponzori / SponsorsTermika, Novi Marof
Izlagači / Exhibitors
Canberra Packard Central Europe GmbH, AustriaHebe d.o.o. - PerkinElmer Precisely, Hrvatska
MEDICEM-Servis d.o.o., Hrvatska
Radovi objavljeni u ovom Zborniku odražavaju stanovišta autora.Urednici su ispravili samo očite pogreške u tekstovima, te ujednačili
izgled svih radova.

SADRŽAJ
CONTENTS

VI. simpozij HDZZ, Stubičke Toplice, 2005.
Uvodno predavanje / Introductory lecture
G. PichlerIzvori svjetlosti i svjetlosno zagađenjeLight sources and light pollution
Predavanje uz okrugli stol / Round table opening lecture
D. Škanata, S. MedakovićPlan pripravnosti za slučaj nuklearne ili radiološke opasnostiNuclear or radiological emergency plan 11
Opće teme / General topics
D. Kubelka, N. Sviličić, I. Kralik Markovinović, D. TrifunovićPregled stanja zaštite od ionizirajućih zračenja u Republici HrvatskojIonising radiation protection in Croatia 19
M. ZavalićZdravstvena zaštita osoba profesionalno izloženih ioniizrajućem zračenjuu Republici HrvatskojHealth protection of persons occupationally exposed to ionisingradiation in Croatia 25
F.J. Maringer, A. Leitner, M. TschurlovitsRadiation protection metrology in Austria: status and needs ina European perspective 28
S. Galjanić, Z. FranićAkreditacija laboratorija u području zaštite od zračenjaAccreditation of laboratories in the field of radiation protection 34
B. Vekić, R. Ban, S. MiljanićSekundarni standardni dozimetrijski laboratorij Instituta"Ruđer Bošković", ZagrebSecondary standard dosimetry laboratory at the Ruđer BoškovićInstitute, Zagreb 40
IX
VI. simpozij HDZZ, Stubičke Toplice, 2005.
H. JanžekovičImplementation of the 96/29/EURA TOM in industry 49
M. NovakovićNew ICRP recommendations 2005: without full consensus? 54
N. NovoselŠto donosi novi Zakon o nuklearnoj sigurnostiWhat is new in the Act on nuclear safety 60
Z. Franić, B. IlijašUgovor o neširenju nuklearnog oružjaThe comprehensive nuclear test ban treaty 64
A. ČižmekRadiological preparedness in the case of a terrorist attackor an accident 69
H. JanžekovičRadiation protection performance indicators of the NPP after themodernisation 1A
Ines Krajcar BronićElastic scattering of electrons and positrons 78
Dozimetrija zračenja i instrumentacijaRadiation dosimetry and instrumentation
M. Štuhec, S. Miljanić, B. VekićHarmonisation of measurements in radiation protection 87
S. Deme, I. Apathy, L. Bodnar, A. Csoke, I. Feher, T. PazmandiPorTL® - a compact, portable TLD reader for environmentaland personal dosimetry 91
B. Zorko, D. Jezeršek, M. Štuhec, S. GobecEnergy dependence ofTL dosemeters using CaFj'-Mnpellets 97
VI. simpozij HDZZ, Stubičke Toplice, 2005.
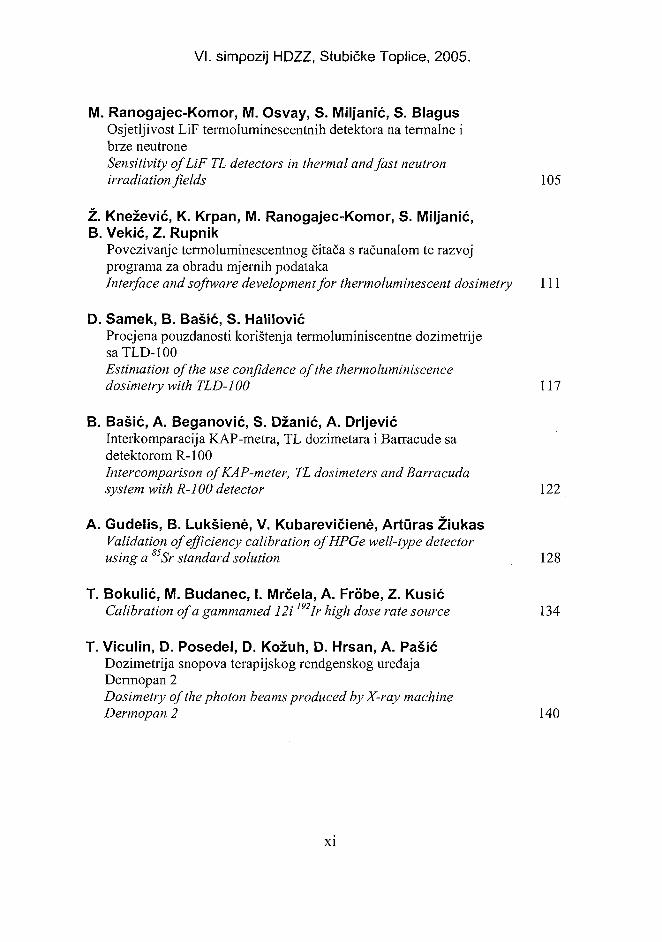
M. Ranogajec-Komor, M. Osvay, S. Miljanić, S. BlagusOsjetljivost LiF termoluminescentnih detektora na termalne ibrze neutroneSensitivity of LiF TL detectors in thermal and fast neutronirradiation fields 10 5
Ž. Knežević, K. Krpan, M. Ranogajec-Komor, S. Miljanić,B. Vekić, Z. Rupnik
Povezivanje termoluminescentnog čitača s računalom te razvojprograma za obradu mjernih podatakaInterface and software development for thermoluminescent dosimetry 111
D. Samek, B. Bašić, S. HaliiovićProcjena pouzdanosti korištenja termoluminiscentne dozimetrijesaTLD-100Estimation of the use confidence of the thermoluminiscencedosimetry with TLD-100 117
B. Bašić, A. Beganović, S. Džanić, A. DrljevićInterkomparacija KAP-metra, TL dozimetara i Barracude sadetektorom R-100Intercomparison of KAP-meter, TL dosimeters and Barracudasystem with R-100 detector 122
A. Gudelis, B. Lukšiene, V. Kubarevičiene, Arturas ŽiukasValidation of efficiency calibration ofHPGe well-type detectorusing a 85Sr standard solution 128
T. Bokulić, M. Budanec, I. Mrčela, A. Frobe, Z. KusićCalibration of a gammamed 12i l92Ir high dose rate source 134
T. Viculin, D. Posedel, D. Kožuh, D. Hrsan, A. PašićDozimetrija snopova terapijskog rendgenskog uređajaDermopan 2Dosimetry of the photon beams produced by X-ray machineDermopan 2 140
XI
VI. simpozij HDZZ, Stubičke Toplice, 2005.
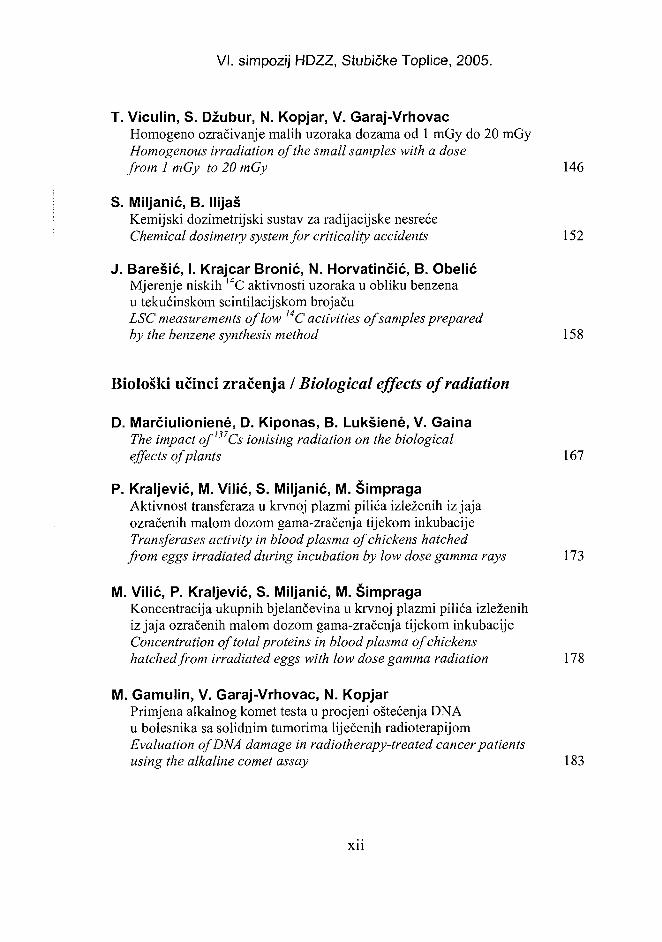
T. Viculin, S. Džubur, N. Kopjar, V. Garaj-VrhovacHomogeno ozračivanje malih uzoraka dozama od 1 mGy do 20 mGyHomogenous irradiation of the small samples with a dosefrom I mGy to 20 mGy 146
S. Miljanić, B. IlijašKemijski dozimetrijski sustav za radijacijske nesrećeChemical dosimetry system for criticality accidents 152
J. Barešić, I. Krajcar Bronić, N. Horvatinčić, B. ObelićMjerenje niskih I4C aktivnosti uzoraka u obliku benzenau tekućinskom scintilacijskom brojačuLSC measurements of low I4C activities of samples preparedby the benzene synthesis method 158
Biološki učinci zračenja / Biological effects of radiation
D. Marčiulioniene, D. Kiponas, B. Lukšiene, V. GainaThe impact of1 Cs ionising radiation on the biologicaleffects of plants 167
P. Kraljević, M. Vilić, S. Miljanić, M. ŠimpragaAktivnost transferaza u krvnoj plazmi pilića izleženih iz jajaozračenih malom dozom gama-zračenja tijekom inkubacijeTransferases activity in blood plasma of chickens hatched
from eggs irradiated during incubation by low dose gamma rays 173
M. Vilić, P. Kraljević, S. Miljanić, M. ŠimpragaKoncentracija ukupnih bjelančevina u krvnoj plazmi pilića izleženihiz jaja ozračenih malom dozom gama-zračenja tijekom inkubacijeConcentration of total proteins in blood plasma of chickenshatched from irradiated eggs with low dose gamma radiation 178
M. Gamulin, V. Garaj-Vrhovac, N. KopjarPrimjena alkalnog komet testa u procjeni oštećenja DNAu bolesnika sa solidnim tumorima liječenih radioterapijomEvaluation of DNA damage in radiotherapy-treated cancer patientsusing the alkaline comet assay 183
xn
VI. simpozij HDZZ, Stubičke Toplice, 2005.
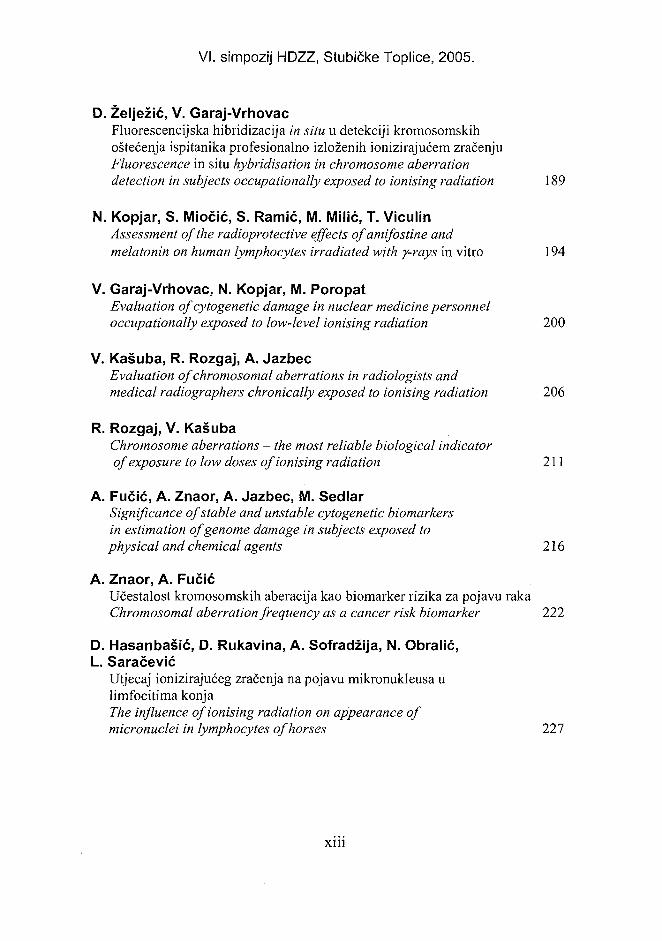
D. Želježić, V. Garaj-VrhovacFluorescencijska hibridizacija in situ u detekciji kromosomskihoštećenja ispitanika profesionalno izloženih ionizirajućem zračenjuFluorescence in situ hybridisation in chromosome aberrationdetection in subjects occupationally exposed to ionising radiation 189
N. Kopjar, S. Miočić, S. Ramić, M. Milić, T. ViculinAssessment of the radioprotective effects of amifostine andmelatonin on human lymphocytes irradiated with /-rays in vitro 194
V. Garaj-Vrhovac, N. Kopjar, M. PoropatEvaluation of cytogenetic damage in nuclear medicine personneloccupationally exposed to low-level ionising radiation 200
V. Kašuba, R. Rozgaj, A. JazbecEvaluation of chromosomal aberrations in radiologists andmedical radiographers chronically exposed to ionising radiation 206
R. Rozgaj, V. KašubaChromosome aberrations - the most reliable biological indicatorof exposure to low doses of ionising radiation 211
A. Fučić, A. Znaor, A. Jazbec, M. SedlarSignificance of stable and unstable cytogenetic biomarkersin estimation of genome damage in subjects exposed tophysical and chemical agents 216
A. Znaor, A. FučićUčestalost kromosomskih aberacija kao biomarker rizika za pojavu rakaChromosomal aberration frequency as a cancer risk biomarker 222
D. Hasanbašić, D. Rukavina, A. Sofradžija, N. Obralić,L. Saračević
Utjecaj ionizirajućeg zračenja na pojavu mikronukleusa ulimfocitima konjaThe influence of ionising radiation on appearance ofmicronuclei in lymphocytes of horses 227
xm
VI. simpozij HDZZ, Stubičke Toplice, 2005.
Izloženost stanovništva zračenju / Public exposure
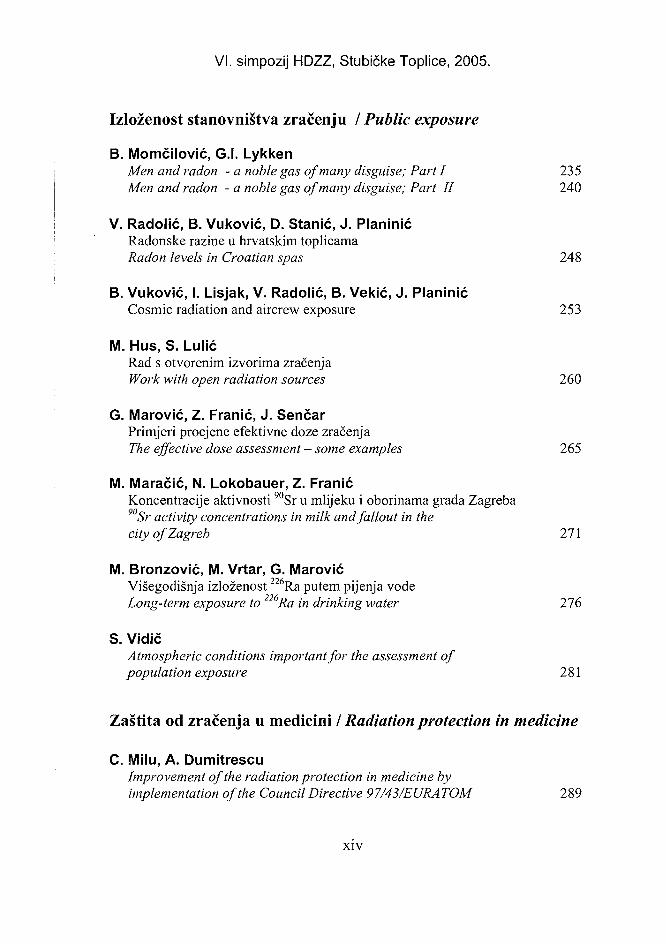
B. Momčilović, G.I. LykkenMen and radon - a noble gas of many disguise; Part I 235Men and radon - a noble gas of many disguise; Part II 240
V. Radolić, B. Vuković, D. Stanić, J. PlaninićRadonske razine u hrvatskim toplicamaRadon levels in Croatian spas 248
B. Vuković, I. Lisjak, V. Radolić, B. Vekić, J. PlaninićCosmic radiation and aircrew exposure 253
M. Hus, S. LulićRad s otvorenim izvorima zračenjaWork with open radiation sources 260
G. Marović, Z. Franić, J. SenčarPrimjeri procjene efektivne doze zračenjaThe effective dose assessment - some examples 265
M. Maračić, N. Lokobauer, Z. FranićKoncentracije aktivnosti 90Sr u mlijeku i oborinama grada Zagreba90Sr activity concentrations in milk and fallout in thecity of Zagreb 271
M. Bronzović, M. Vrtar, G. MarovićVišegodišnja izloženost 226Ra putem pijenja vodeLong-term exposure to 226Ra in drinking water 276
S. VidičAtmospheric conditions important for the assessment ofpopulation exposure 281
Zaštita od zračenja u medicini / Radiation protection in medicine
C. Milu, A. DumitrescuImprovement of the radiation protection in medicine byimplementation of the Council Directive 97/43/EURATOM 289
xiv
VI. simpozij HDZZ, Stubičke Toplice, 2005.
H. HršakLeksell gamma knife i osiguranje kakvoće u stereotaksijskojradioterapijiLeksell gamma knife and quality assurance in stereotacticradiotherapy 294
I. Mrčela, T. Bokulić, M. Budanec, Z. KusićCalibration ofp-type silicon diodes for in-vivo dosimetry in60Co beams 300
A. Beganović, S. Džanić, B. Bašić, A. Drljević, A. SkopljakDoze za mamografske pretrage na Institutu za radiologijuDoses in mammography at Institute of radiology 306
Đ. Milković, M. Ranogajec-Komor, S. MiljanićProtokol radiološkog snimanja torakalnih organa u svrhuzaštite od zračenjaProtocol of radiographic examination of children in orderto improve the radiation protection 312
M. Surić Mihić, I. Prlić, S. Milković-Kraus, T. Meštrović,F. Rojnica
Područje nadzora oko rendgen uređaja za slikanje zubi -Dozimetrijska studijaControl area around dental X-ray units - Dosimetric study 317
M. Budanec, T. Bokulić, I. Mrčela, Z. KusićRadiation treatment planning system verification 325
A. Skopljak, E. Kučukalić-Selimović, N. Bešlić, A. Begić,S. Begović-Hadžimuratović, Z. Dražeta, A. Beganović
Proračun doze i ekspozicije zračenja kod sentinel nodus studijeEstimation of dose and exposure at sentinel node study 331
Radioekologija I Radioecology
V. Oreščanin, D. Barišić, L. Mikelić, I. Lovrenčić,M. Rozmarić-Mačefat, S. Lulić
Chemical and radiological characterisation ofTENORM depositedin Kaštel Gomilica 339
xv
VI. simpozij HDZZ, Stubičke Toplice, 2005.
B. Petrinec, Z. FranićRadiocezij u neobrađenom tlu na nekim lokacijama u Republici HrvatskojRadiocaesium in uncultivated soil on some locations in Croatia 345
R. Druteikiene, B. LukšieneInvestigation ofplutonium chemical compounds sorption in soil 351
D. Deljkić, A. Vidic, S. Marić, Z. Ilić, D. SirkoRadioaktivnost u uzorcima zemlje na području FBiHRadioactivity of the soil in Federation Bosnia and Herzegovina 358
A. Vidic, Z. Ilić, D. Deljkić, U. Repine, Lj. Benedik, S. MarićDetermination of uranium in soil with emphasis on dose assessment 363
S. Lulić, L. Mikelić, V. Oreščanin, G. PavlovićDetermination ofactinides in Sava river sediments upstreamand downstream ofNPP Krško by low-level alpha-spectrometry 369
Z. FranićAnaliza osjetljivosti modela za procjenu srednjeg vremena boravkamorske vode u Jadranskom moru zasnovanom na 90Sr kaoradioaktivnom obilježivačuSensitivity analysis of the model for estimation of the Adriatic seaturnover time using fallout 90Sr as a radioactive tracer 373
M. Rožmarić Mačefat, K. Košutić, Ž. GrahekOdređivanje 89>90Sr u morskoj vodiDetermination ofS9'90Sr in seawater 379
I. Lovrenčić, D. Barišić, N. Kezić, I. Seletković, M. Volner,M. Popijač, S. Lulić
Comparison between the distribution of Cs and 4 K in fir-tree(Abies alba) 384
N. Gradaščević, L. Saračević, A. Mihalj, D. SamekTransfer faktori l37Cs u lancu tlo-lucerkaTransfer factors ofn7Cs in chain soil-alfalfa 390
xvi
VI. simpozij HDZZ, Stubičke Toplice, 2005.
D. Barišić, I. Lovrenčić, V. Oreščanin, N. Kezić, D. Bubalo,M. Popijač, M. Volner
Med kao bioindikator kontaminacije okoliša cezijemHoney as a bioindicator of environment contamination with caesium 395
J. Kovač, G. Marović, J. SenčarPraćenje radioaktivnosti na plinskom polju MolveRadiation monitoring at natural gas field Molve 400
I. Krajcar Bronić, P. Vreča, N. Horvatinčić, N. Ogrinc, J. Barešić,B. Obelić, T. Kanduč
Raspodjela izotopnog sastava vodika, kisika i ugljika u atmosferiHrvatske i SlovenijeDistribution ofisotopic composition of hydrogen, oxygen and carbonin the atmosphere of Croatia and Slovenia 405
P. JovanovičActivity concentration of cesium in air in Slovenia afterChernobyl accident 411
A. Mihalj, L. Saračević, D. Samek, N. Gradaščević, E. LokmićPrirodna radioaktivnost termalnog izvora u selu Banja, općina FojnicaNatural radioactivity of thermal spring in village Banja,municipality Fojnica 415
K. Košutić, Ž. Grahek, M. Rožmarić Mačefat, S. LulićUtjecaj matriksa na odabir metode izolacije radioaktivnog stroncijaInfluence of matrix on method selection for radioactivestrontium isolation 420
T. Sofilić.T. Marjanović, A. Rastovčan-MiočUvođenje sustava za nadzor radioaktivnosti u procesimaproizvodnje čelikaIntroducing radioactivity monitoring systems in theproduction of steel 425
L. Mikelić, V. Oreščanin, S. Lulić, M. RubčićDetermination ofchromium(IH), chromium(VI),manganese(H) and manganese(VII) by EDXRF method 433
XVI1
VI. simpozij HDZZ, Stubičke Toplice, 2005.
Neionizirajuća zračenja / Non-ionising radiations
K. Malarić, R. Malarić, M. Tkalec, I. Leniček, A. ŠalaInstrumentation for electromagnetic field generation inbiological measurements 441
M. Tkalec, K. Malarić, R. Malarić, Ž. Vidaković-Cifrek,B. Pevalek-Kozlina
Effect of electromagnetic fields on duckweed (Lemna minor)and alga (Chlorella kessleri) 447
I. Pavičić, I. Trošić, A. ŠarolićUsporedba djelovanja mikrovalnog zračenja frekvencija864 i 935 MHz na stanice u kulturiComparison of 864 and 935 MHz microwave radiationeffects on cell culture 454
I. Trošić, I. Bušljeta, I. Pavičić, B. ModlicKinetika mikronuklearnih stanica koštane srži i perifernekrvi štakora tijekom subkroničnog izlaganja mikrovalovimaKinetics of induction of micronucleated polychromaticerythrocytes in bone marrow and peripheral bloodfollowing subchronic microwave exposure 459
V. Brumen, V. Garaj-Vrhovac, J. Franekić Čolić, Ž. RadaljZdravstvene tegobe operatera na videoterminalima - posljedicaelektromagnetskog zračenja ili štogod drugo?Health issues of the operaters on video display units -the consequence of electromagnetic radiation or something else? 464
B. VojnikovićUtjecaj optičke radijacije - UV A i B na pojavu A.M.D. -makularne degeneracijeInfluence of optical radiations on development of age relatedmacular degeneration (AMD) 468
Popis autora / Author index 471
XVlll
UVODNO PREDAVANJE
INTROD UCTOR Y LECTURE

Rezolucijom A/RES/58/293 Opća skupština Ujedinjenih narodaproglasila je 2005. godinu Međunarodnom godinom fizike.
General Conference of UNESCO adopted a resolution supporting theinitiative of 2005 as the World Year of Physics.

VI. simpozij HDZZ, Stubičke Toplice, HR0500019
IZVORI SVJETLOSTI I SVJETLOSNO ZAGAĐENJE
Goran PichlerInstitut za fiziku, Bijenička c. 46, 10000 Zagreb
e-mail: [email protected]
UVODZna se da su neandertalci poznavali vatru, stoje dakako ne samo promijenilo
način prehrane i uopće pradavnog života, već je i kao prvi izvor svjetlosti osvijetliopećinska skloništa i nastambe učinio ugodnijim i sigurnijim. Od obične vatre, kojase brižno čuvala, potekli su inovativnim nastojanjima kromanjonaca i drugi izvorisvjetlosti na bazi životinjskih masti i ulja. Kada bi se pratio razvoj izvora svjetlostiod pojave civilizacije onda bi se moglo zaključiti daje uzor bilo Sunce. Postići da umraku ostvari djelić dnevnog sjaja nevjerojatan je intelektualni uspjehmezopotamske, helenističke i starorimske civilizacije.
Svjetlost u mraku oduvijek je bila opsesija istraživača od renesanse pa svedo današnjih dana. Pojavile su se plinske svjetiljke, pa onda i izvori svjetlosti naosnovi električkih izboja. I upravo ovi posljednji bilježe nevjerojatne uspjehe unastojanju oponašanja sjaja i spektra Sunca.
Nisko- i visoko-tlačne žarulje punjene živom, natrijem i plemenitimplinovima zavladale su cijelim planetom i Zemlja se po noći iz Svemira vidisasvim lijepo obasjana prekrasnom žućkastom rasvjetom [1]. Naročito je toistaknuto na geografskim položajima, gdje je i civilizacija na najvišoj razini. Nažalost, uspjesi moderne svjetlotehnike uzrokovali su takozvano svjetlosnozagađenje, koje u noćni život životinja i biljaka unosi smetnju, koja će vremenompostati itekako značajna.
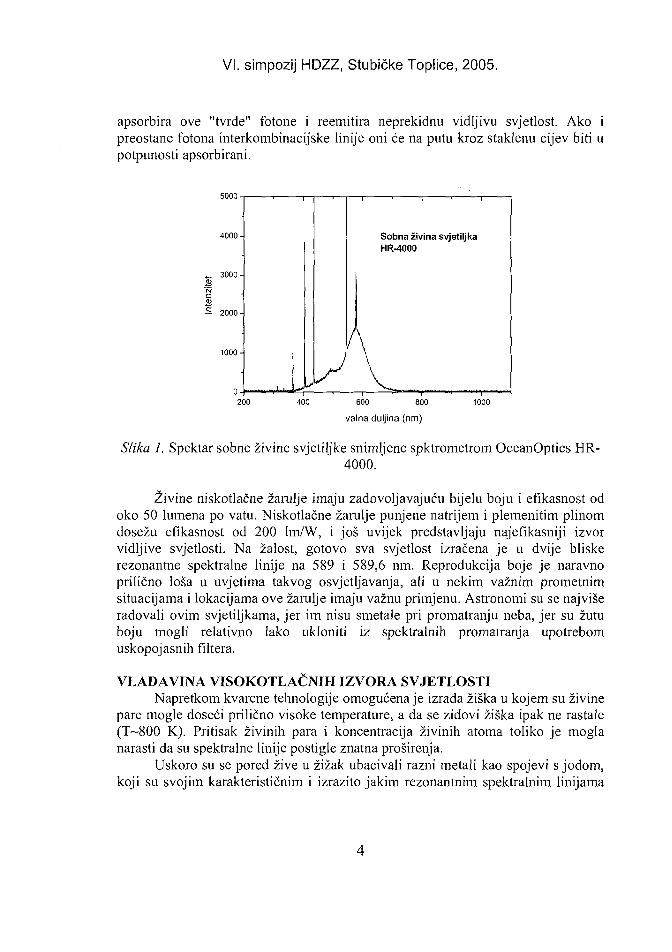
IZVORI SVJETLOSTIČesto se govori o neonskim reklamama, jer se nekada zaista radilo o
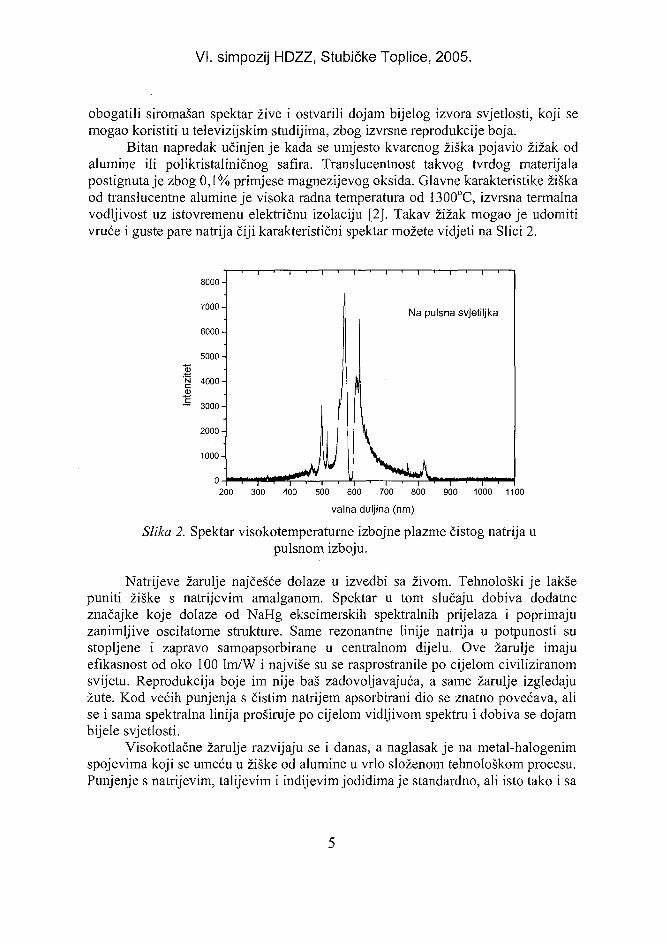
izbojnim cijevima punjenim plemenitim plinom neonom. Prepoznatljivo jesvjetlucanje neonskih reklama crvenkastom bojom. Budući da je neon priličnoskup, često se upotrebljavao argon. Vremenom se razvila tehnika niskotlačnihelektričnih izboja punjenih živom. Odmah nakon paljenja izboja u argonu, živinepare dosegnu dovoljan pritisak da slobodni elektroni u sudaru sa živinim atomimapobuđuju mnogobrojne energijske razine. Iz tih pobuđenih razina spontanimprijelazima u niža stanja zrači se karakteristična svjetlost. Na Slici 1. vidimospektar sobne živine svjetiljke. Pored poznate četiri spektralne linije u vidljivomdijelu spektra, vide se i ultraljubičaste spektralne linije. UV linije žive mogu imatiloš utjecaj na vid kod dugog izlaganja. Vrlo jaka interkombinacijska linija žive na253 nm se ne vidi u snimljenom spektru jer je na unutrašnjem oblogu staklenecijevi nanesen fluorescentni prah (najčešće dvo- ili tro-komponentni), koji
VI. simpozij HDZZ, Stubičke Toplice, 2005.
apsorbira ove "tvrde" fotone i reemitira neprekidnu vidljivu svjetlost. Ako ipreostane fotona interkombinacijske linije oni će na putu kroz staklenu cijev biti upotpunosti apsorbirani.
5000
4000-
3000-
B— 2000-
Sobna živina svjetiljkaHR-4000
200 400 600 800 1000
valna duljina (nm)
Slika 1. Spektar sobne živine svjetiljke snimljene spktrometrom OceanOptics HR-4000.
Živine niskotlačne žarulje imaju zadovoljavajuću bijelu boju i efikasnost odoko 50 lumena po vatu. Niskotlačne žarulje punjene natrijem i plemenitim plinomdosežu efikasnost od 200 lm/W, i još uvijek predstavljaju najefikasniji izvorvidljive svjetlosti. Na žalost, gotovo sva svjetlost izračena je u dvije bliskerezonantne spektralne linije na 589 i 589,6 nm. Reprodukcija boje je naravnoprilično loša u uvjetima takvog osvjetljavanja, ali u nekim važnim prometnimsituacijama i lokacijama ove žarulje imaju važnu primjenu. Astronomi su se najvišeradovali ovim svjetiljkama, jer im nisu smetale pri promatranju neba, jer su žutuboju mogli relativno lako ukloniti iz spektralnih promatranja upotrebomuskopojasnih filtera.
VLADAVINA VISOKOTLAČNIH IZVORA SVJETLOSTINapretkom kvarcne tehnologije omogućena je izrada žiška u kojem su živine
pare mogle doseći prilično visoke temperature, a da se zidovi žiška ipak ne rastale(T-800 K). Pritisak živinih para i koncentracija živinih atoma toliko je moglanarasti da su spektralne linije postigle znatna proširenja.
Uskoro su se pored žive u žižak ubacivali razni metali kao spojevi s jodom,koji su svojim karakterističnim i izrazito jakim rezonantnim spektralnim linijama
VI. simpozij HDZZ, Stubičke Toplice, 2005.
obogatili siromašan spektar žive i ostvarili dojam bijelog izvora svjetlosti, koji semogao koristiti u televizijskim studijima, zbog izvrsne reprodukcije boja.
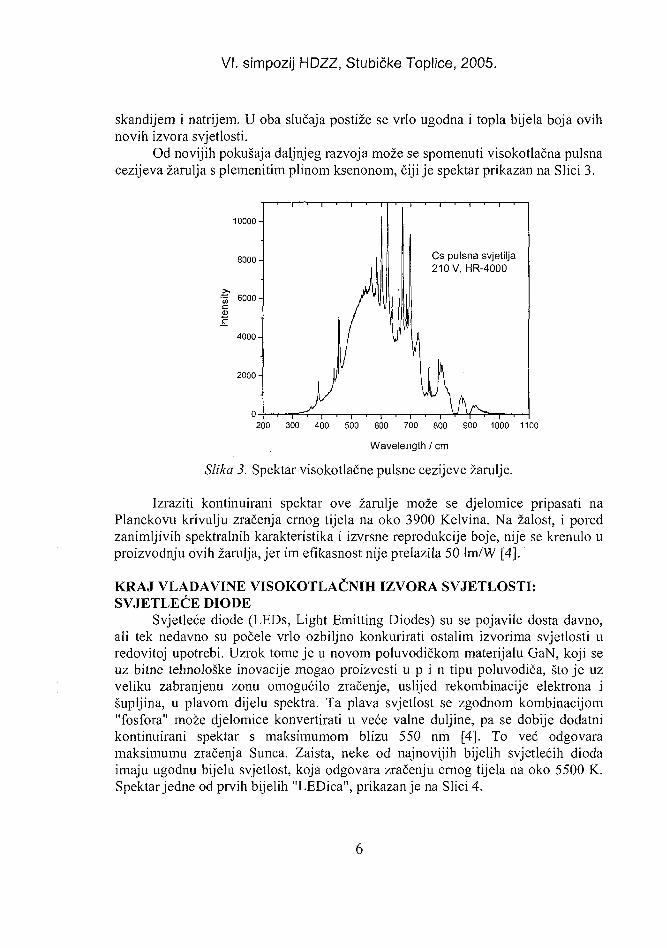
Bitan napredak učinjen je kada se umjesto kvarcnog žiška pojavio žižak odalumine ili polikristaliničnog safira. Translucentnost takvog tvrdog materijalapostignuta je zbog 0,1% primjese magnezijevog oksida. Glavne karakteristike žiškaod translucentne alumine je visoka radna temperatura od 1300°C, izvrsna termalnavodljivost uz istovremenu električnu izolaciju [2]. Takav žižak mogao je udomitivruće i guste pare natrija čiji karakteristični spektar možete vidjeti na Slici 2.
200 300 400 500 600 700 800 900 1000 1100
valna duljina (nm)
Slika 2. Spektar visoko temperaturne izbojne plazme čistog natrija upulsnom izboju.
Natrijeve žarulje najčešće dolaze u izvedbi sa živom. Tehnološki je lakšepuniti žiške s natrijevim amalganom. Spektar u tom slučaju dobiva dodatneznačajke koje dolaze od NaHg ekscimerskih spektralnih prijelaza i poprimajuzanimljive oscilatorne strukture. Same rezonantne linije natrija u potpunosti sustopljene i zapravo samoapsorbirane u centralnom dijelu. Ove žarulje imajuefikasnost od oko 100 lm/W i najviše su se rasprostranile po cijelom civiliziranomsvijetu. Reprodukcija boje im nije baš zadovoljavajuća, a same žarulje izgledajužute. Kod većih punjenja s čistim natrijem apsorbirani dio se znatno povećava, alise i sama spektralna linija proširuje po cijelom vidljivom spektru i dobiva se dojambijele svjetlosti.
Visokotlačne žarulje razvijaju se i danas, a naglasak je na metal-halogenimspojevima koji se umeću u žiške od alumine u vrlo složenom tehnološkom procesu.Punjenje s natrijevim, talijevim i indijevim jodidima je standardno, ali isto tako i sa
VI. simpozij HDZZ, Stubičke Toplice, 2005.
skandijem i natrijem. U oba slučaja postiže se vrlo ugodna i topla bijela boja ovihnovih izvora svjetlosti.
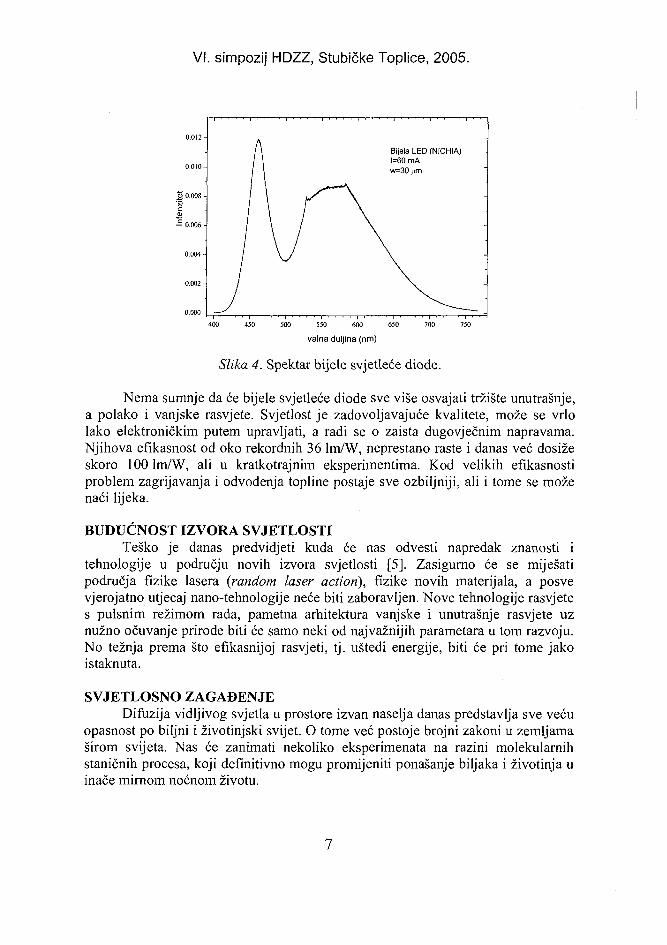
Od novijih pokušaja daljnjeg razvoja može se spomenuti visokotlačna pulsnacezijeva žarulja s plemenitim plinom ksenonom, čiji je spektar prikazan na Slici 3.
10000-
8000-
f" 6000-
B
4 0 0 0 -
2 0 0 0 -
0-
liA\
i
y
Cs pulsna svjetilja210 V, HR-4000
200 300 400 500 600 700 800 900 1000 1100
Wavelength / cm
Slika 3. Spektar visokotlačne puisne cezijeve žarulje.
Izraziti kontinuirani spektar ove žarulje može se djelomice pripasati naPlanckovu krivulju zračenja crnog tijela na oko 3900 Kelvina. Na žalost, i poredzanimljivih spektralnih karakteristika i izvrsne reprodukcije boje, nije se krenulo uproizvodnju ovih žarulja, jer im efikasnost nije prelazila 50 lm/W [4].
KRAJ VLADAVINE VISOKOTLAČNIH IZVORA SVJETLOSTI:SVJETLEĆE DIODE
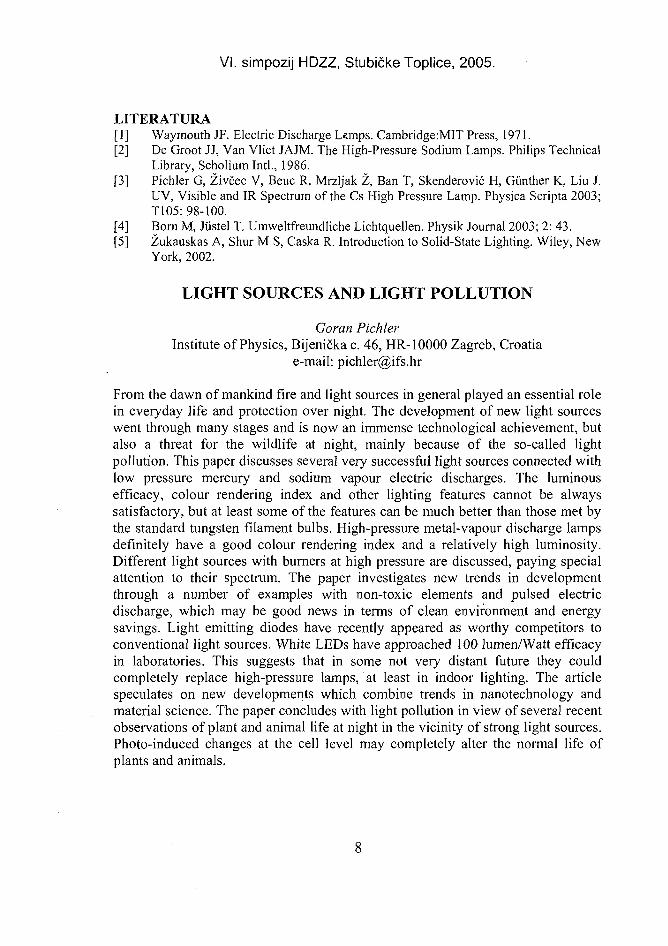
Svjetleće diode (LEDs, Light Emitting Diodes) su se pojavile dosta davno,ali tek nedavno su počele vrlo ozbiljno konkurirati ostalim izvorima svjetlosti uredovitoj upotrebi. Uzrok tome je u novom poluvodičkom materijalu GaN, koji seuz bitne tehnološke inovacije mogao proizvesti u p i n tipu poluvodiča, što je uzveliku zabranjenu zonu omogućilo zračenje, uslijed rekombinacije elektrona išupljina, u plavom dijelu spektra. Ta plava svjetlost se zgodnom kombinacijom"fosfora" može djelomice konvertirati u veće valne duljine, pa se dobije dodatnikontinuirani spektar s maksimumom blizu 550 nm [4]. To već odgovaramaksimumu zračenja Sunca. Zaista, neke od najnovijih bijelih svjetlećih diodaimaju ugodnu bijelu svjetlost, koja odgovara zračenju crnog tijela na oko 5500 K.Spektar jedne od prvih bijelih "LEDica", prikazanje na Slici 4.
VI. simpozij HDZZ, Stubičke Toplice, 2005.
0.012 -
0.010-
Inte
nzite
t
0.004-
0.002 -
o.ooo-
j\ Bijela LED (NICHIA)/ 1 1=60 mAI 1 w=30(im
1 \ yS \
/
400 450 500 550 600 650 700 750
valna duljina (nm)
Slika 4. Spektar bijele svjetleće diode.
Nema sumnje da će bijele svjetleće diode sve više osvajati tržište unutrašnje,a polako i vanjske rasvjete. Svjetlost je zadovoljavajuće kvalitete, može se vrlolako elektroničkim putem upravljati, a radi se o zaista dugovječnim napravama.Njihova efikasnost od oko rekordnih 36 lm/W, neprestano raste i danas već dosižeskoro lOOlm/W, ali u kratkotrajnim eksperimentima. Kod velikih efikasnostiproblem zagrijavanja i odvođenja topline postaje sve ozbiljniji, ali i tome se moženaći lijeka.
BUDUĆNOST IZVORA SVJETLOSTITeško je danas predvidjeti kuda će nas odvesti napredak znanosti i
tehnologije u području novih izvora svjetlosti [5]. Zasigurno će se miješatipodručja fizike lasera (random laser action), fizike novih materijala, a posvevjerojatno utjecaj nano-tehnologije neće biti zaboravljen. Nove tehnologije rasvjetes pulsnim režimom rada, pametna arhitektura vanjske i unutrašnje rasvjete uznužno očuvanje prirode biti će samo neki od najvažnijih parametara u tom razvoju.No težnja prema što efikasnijoj rasvjeti, tj. uštedi energije, biti će pri tome jakoistaknuta.
SVJETLOSNO ZAGAĐENJEDifuzija vidljivog svjetla u prostore izvan naselja danas predstavlja sve veću
opasnost po biljni i životinjski svijet. O tome već postoje brojni zakoni u zemljamaširom svijeta. Nas će zanimati nekoliko eksperimenata na razini molekularnihstaničnih procesa, koji definitivno mogu promijeniti ponašanje biljaka i životinja uinače mirnom noćnom životu.
VI. simpozij HDZZ, Stubičke Toplice, 2005.
LITERATURA[1] Waymouth JF. Electric Discharge L«imps. Cambridge:MIT Press, 1971.[2] De Groot JJ, Van Vliet JAJM. The High-Pressure Sodium Lamps. Philips Technical
Library, Scholium Intl., 1986.[3] Pichler G, Živčec V, Beuc R, Mrzljak Ž, Ban T, Skenderović H, Gunther K, Liu J.
UV, Visible and IR Spectrum of the Cs High Pressure Lamp. Physica Scripta 2003;T105: 98-100.
[4] Born M, Jiistel T. Umweltfreundliche Lichtquellen. Physik Journal 2003; 2: 43.[5] Žukauskas A, Shur M S, Ćaska R. Introduction to Solid-State Lighting. Wiley, New
York, 2002.
LIGHT SOURCES AND LIGHT POLLUTION
Goran PichlerInstitute of Physics, Bijenička c. 46, HR-10000 Zagreb, Croatia
e-mail: [email protected]
From the dawn of mankind fire and light sources in general played an essential rolein everyday life and protection over night. The development of new light sourceswent through many stages and is now an immense technological achievement, butalso a threat for the wildlife at night, mainly because of the so-called lightpollution. This paper discusses several very successful light sources connected withlow pressure mercury and sodium vapour electric discharges. The luminousefficacy, colour rendering index and other lighting features cannot be alwayssatisfactory, but at least some of the features can be much better than those met bythe standard tungsten filament bulbs. High-pressure metal-vapour discharge lampsdefinitely have a good colour rendering index and a relatively high luminosity.Different light sources with burners at high pressure are discussed, paying specialattention to their spectrum. The paper investigates new trends in developmentthrough a number of examples with non-toxic elements and pulsed electricdischarge, which may be good news in terms of clean environment and energysavings. Light emitting diodes have recently appeared as worthy competitors toconventional light sources. White LEDs have approached 100 lumen/Watt efficacyin laboratories. This suggests that in some not very distant future they couldcompletely replace high-pressure lamps, at least in indoor lighting. The articlespeculates on new developments which combine trends in nanotechnology andmaterial science. The paper concludes with light pollution in view of several recentobservations of plant and animal life at night in the vicinity of strong light sources.Photo-induced changes at the cell level may completely alter the normal life ofplants and animals.
PREDAVANJE UZ OKRUGLI STOL
ROUND TABLE OPENING LECTURE

VI. simpozij HDZZ, Stubičke Toplice, 2 HR0500020
PLAN PRIPRAVNOSTI ZA SLUČAJ NUKLEARNEILI RADIOLOŠKE OPASNOSTI
Dejan Škanata i Šaša MedakovićEnconet International d.o.o., Miramarska 20, 10000 Zagreb
e-mail: [email protected], [email protected]
UVODObveza izgradnje sustava pripravnosti za slučaj nuklearne ili radiološke
nesreće je neupitna za svaku državu, pa tako i za onu koja na svojem teritorijunema instaliranih nuklearnih postrojenja. Naime, jedna od bitnih karakteristikanesreće na nuklearnom postrojenu je mogućnost prijenosa onečišćenja(radioaktivnog oblaka), na relativno velike udaljenosti. S druge strane, uzdravstvenim i znanstvenim institucijama svake države, kao i u različitimindustrijskim postrojenjima smještenim na njenom teritoriju, koriste se izvorizračenja. Također, prometnicama svake države obavlja se transport radioaktivnimmaterijalima. Drugim riječima, postoji sasvim dovoljno razloga da se u svakojdržavi izgradi sustav pripravnosti za slučaj nuklearne ili radiološke nesreće'.
Da bi se sustav pripravnosti mogao izgraditi, periodično provjeravati i potomunapređivati potrebno je da postoji odgovarajući plan. Uobičajeno je takve planoverazvijati na državnoj i na lokalnim razinama. Isto tako, uobičajeno je da takviplanovi postanu sastavnim dijelom zakonodavnog okvira koji regulira pitanjazaštite i spašavanja stanovništva i zaštita okoliša. Takvi se planovima izrađuju natemelju unaprijed definiranih funkcionalnih, organizacijskih i logističkih zahtjeva.U tim planovima se definiraju odgovornosti pojedinih sudionika u sustavupripravnosti i određuje način financiranja pojedinih segmenata plana. Dobriprimjeri koji idu u prilog ovakvoj konstataciji su Državni plan za zaštitu voda [1] iDržavni plan obrane od poplava [2].
ZAKONODAVNI OKVIRDva su zakonska akata koji u nas propisuju obvezu izrade Plana pripravnosti
za slučaj nuklearne ili radiološke nesreće. U prvom redu to je Konvencije o
'Najznačajnija razlika između ove dvije vrste nesreća sastoji se u tome što se kod nuklearne nesrećeračuna s velikim ispuštanjem radioaktivnosti u okoliš (atmosferu, površinske vode ili u zemlju,odnosno podzemne vode) čime mogu biti obuhvaćena relativno velika područja. Nuklearne nesrećedogađaju se na reaktorskim postrojenjima, tj. postrojenjima u kojima se odvija kontrolirana lančanareakcija (nuklearne elektrane, istraživački reaktori, brodovi i podmornice na nuklearni pogon), i nanekim od postrojenja koja pripadaju nuklearnom gorivnom ciklusu (postrojenja za preradu istrošenoggoriva i postrojenja za konverziju urana). S druge strane, radiološka nesreća uglavnom podrazumijevalokalna onečišćenja a odnosi se na gubitak izvora ionizirajućeg zračenja, na akcident u transporturadioaktivnih materijala, na diverziju s tzv. prljavom bombom te na pad satelita na nuklearni pogon.
11
VI. simpozij HDZZ, Stubičke Toplice, 2005.
nuklearnoj sigurnosti ratificirana 1995. godine, koja problematiku pripravnosti zaslučaj nuklearne nesreće regulira u članku 16. - Spremnost u hitnim slučajevima[3]. U prvoj alineji stoji: Svaka ugovorna stranka osigurat će postojanje planova zadjelovanje u hitnim slučajevima ..., dok se u trećoj alineji ovoga članka navodisljedeće: Ugovorne stranke koje nemaju nuklearno postrojenje na vlastitomteritoriju a pod mogućim su utjecajem radiološke opasnosti zbog nuklearnogpostrojenja u susjednoj državi, poduzet će potrebite mjere za pripremanje iprovjeru planova djelovanja na svom području u hitnom slučaju. Za provedbuKonvencije u nas je nadležno Ministarstvo gospodarstva, rada i poduzetništva (unajnovije vrijeme tu je nadležnost naslijedio Državni zavod za nuklearnusigurnost).
U članku 34. Zakona o zaštiti od ionizirajućih zračenja iz 1999. godine,propisuje se obveza izrade državnog plana i programa mjera zaštite odionizirajućih zračenja u slučaju izvanrednog događaja [4]. Izvanredni događaj jepri tome definiran kao: događaj u svezi s djelatnostima s ionizirajućim zračenjimaili sigurnošću nuklearnih postrojenja prouzročen okolnostima koje više nisu podnadzorom, a posljedica je izlaganje povišenu ozračenju djelatnika koji rade sizvorima ionizirajućih zračenja, pučanstva ili radioaktivno zagađenje okoliša(Članak 2.). Vlada Republike Hrvatske na prijedlog ministra zdravstva obvezna jedonijeti Državni plan i program mjera zaštite u slučaju izvanrednog događaja uroku od godinu dana od dana stupanja na snagu ovog Zakona (Članak 50.). Dakle,Državni plan trebao je biti donesen još tijekom 2000. godine.
ZAHTJEVI EUROPSKE UNIJESveukupno zakonodavstvo i mehanizmi Europske unije vezani uz
pripravnost za slučaj nuklearne ili radiološke opasnosti temelji se na Euratomugovoru (Euratom trety). U članku 2 ovog ugovora stoji obveza prema kojoj ćezajednica propisati jedinstvene sigurnosne standarde u cilju zaštite zdravljaradnika i stanovništva. Posljednji takvi jedinstveni (osnovni) sigurnosni standardi(Basic Safety Standards) usvojeni su 1997. godine [5] i do 2000. godine uvedeni suu nacionalna zakonodavstva država članica Europske unije. U poglavlju IX ovihstandarda (Intervention) razrađeni su zahtjevi koji se odnose na pripravnost zaslučaj radiološke opasnosti. U članku 50. tog poglavlja izričito se navodi kako jesvaka članica dužna razviti i redovito provjeravati planove intervencija iintervencijske razine na nacionalnoj i lokalnim razinama.
PREPORUKE IAEAIAEA je u okviru serije svojih sigurnosnih standarda, zajedno s drugim
međunarodnim agencijama (FAO, ILO, OECD/NEA, PAHO, OCHA i WHO),razvila sustav funkcionalnih, organizacijskih, logističkih i drugih zahtjeva kojimasvaki sustav pripravnosti za slučaj nuklearne ili radiološke nesreće treba udovoljiti[6]. U okviru svojih projekata pomoći i suradnje IAEA je za svoje članice razvila
12
VI. simpozij HDZZ, Stubičke Toplice, 2005.
postupak za uspostavu sustava pripravnosti u slučaju nuklearne ili radiološkeopasnosti [7]. Dosljedna primjena ovoga postupka vodi izradi državnog planapripravnosti za slučaj radiološke opasnosti {National Radiation2 Emergency Plan).Unutar sustava tehničke dokumentacije IAEA je otišla i korak dublje te preporučilageneričke postupke koji se imaju primjenjivati u uvjetima nuklearne [8], odnosnoradiološke nesreće [9].
POSTOJEĆE STANJE U NASUnatoč postojanju vrlo jasnih zahtjeva navedenih u našem novijem
zakonodavstvu o potrebi izrade plana za slučaj nuklearne ili radiološke nesreće, tebez obzira na obvezu koja je propisana u našem zakonodavstvu iz područjazdravstva, takav plan u nas još uvijek nije izrađen. Treba navesti da su s time usvezi postajale dvije inicijative. Jedna 1999. godine potaknuta od straneMinistarstva gospodarstva, i ona iz 2003. godine potaknuta od strane Ministarstvazdravstva. Međutim, niti jedna od njih nije dala rezultat.
U međuvremenu je Ministarstvo gospodarstva, rada i poduzetništva u okvirusvojih nadležnosti na provedbi Konvencije o nuklearnoj sigurnosti pokrenulonekoliko aktivnosti usmjerenih na izgradnju Sustav pripravnosti za slučajnuklearne nesreće [10]. Te su aktivnosti uglavnom bile usmjerene u dva pravca.Prvi je podrazumijevao osnivanje Tehničkog potpornog centra (TPC) kao vodećetehničke agencije u slučaju nuklearne nesreće, izrada Priručnika o radu TPC-a iperiodično uvježbavanje TPC-a. Drugi pravac odnosio se na održavanje iunapređenje Sustava pravodobnog radiološkog upozoravanja (SPRU), na razmjenutako pridobivenih radioloških podataka sa sličnim institucijama u Sloveniji iMađarskoj, te na pristupanje sustavima EURDEP i ECURIE za razmjenuradioloških podataka s državama članicama Europske unije. U svrhu osiguravanjauvjeta za funkcioniranja TPC-a, te prikupljanje i razmjenu radioloških podatakaMinistarstvo je uspostavilo dobru suradnju s institucijama poput IRB, 1MI, DHMZ,FER, APO i Enconet te s Državnim centrom za obavješćivanje (DCO) i s Civilnomzaštitom.
Vezano za pripravnost u slučaju radiološke nesreće valja naglasiti da se one unas razrješavaju ad-hoc rješenjima [11]. U tim slučajevima uglavnom su uključenisamo: Ministarstvo zdravstva, Hrvatski zavod za zaštitu od zračenja i ovlašteneosobe za obavljanje stručnih poslova zaštite od ionizirajućeg zračenja i po potrebidjelatnici imatelja odobrenja za radioaktivni izvor. Te radiološke nesrećepodrazumijevale su: potragu i zbrinjavanje oštećenih ili izgubljenih radioaktivnihizvora (ratna razaranja 1991-1995.), popravak i zbrinjavanje radioaktivnih izvoraiz radioaktivnih gromobrana (RAG) i ionizirajućih javljača požara (UP) u općoj
2Termin radiation emergency se u ovom dokumentu koristi kao zajednički tennin za nuclear and/orradiological emergency.
13
VI. simpozij HDZZ, Stubičke Toplice, 2005.
uporabi, te posebice zbrinjavanje radioaktivnih izvora koji su pronađeni na graniciprilikom pokušaja njihova uvoza ili izvoza.
REORGANIZACIJA DRŽAVNE UPRAVEOd druge polovice 2004. godine pa do danas došlo je do reorganizacije
državne uprave i to upravo u segmentima koji su važni za izradu plana. Tako jeDržavni zavod za nuklearnu sigurnost, pored ostaloga, od Ministarstvagospodarstva, rada i poduzetništva preuzeo ingerencije vezane za provedbuKonvencije o nuklearnoj sigurnosti [12]. Državni zavod za zaštitu od zračenjaJ
preuzeo je od Ministarstva zdravstva obvezu izrade Državnog plana i programamjera zaštite u slučaju izvanrednog događaja [13,14].
Od veljače 2005. godine državna je administracija bogatija za Državnuupravu za zaštitu i spašavanje [15], u okviru koje su se okupili svi resursi civilnezaštite i DCO-a koji su ranije bili raspoređeni u okviru Ministarstva unutarnjihposlova i Ministarstva obrane. Rad Državne uprave organiziran je preko njenihslužbi, odjela i područnih ureda. Nadležnosti Uprave su mnogobrojne. Za ovupriliku izdvajaju samo dio nadležnosti koje ima Služba za civilnu zaštitu. Tako jeova služba nositelj koordiniranja operativnih snaga zaštite i spašavanja za vrijemekatastrofe ili veće nesreće. Ona sudjeluje u izradi operativnih postupaka zaštite ispašavanja i nositelj je izrade propisa iz svoje nadležnosti.
ZAKLJUČAKIzrada Plana pripravnosti za slučaj nuklearne ili radiološke nesreće neupitna
je, i to kako na državnoj tako i na lokalnim razinama. Uostalom, obveza izradePlana propisana je u odgovarajućim zakonodavnim aktima.
Tri su tijela državne administracije odgovorna za njegovu izradu. Inicijator ikoordinator izrade takvoga plana treba biti Državni zavod za zaštitu od zračenja.Njegova neposredna zadaća je da razvije dio plana pripravnosti koji se odnosi naradiološku nesreću. Ingerencija Državnog zavoda za nuklearnu sigurnost je dadoprinese segmentu plana koji se odnosi na nuklearnu nesreću, dok je Državnauprava za zaštitu i spašavanja odgovorna za razvoj svih detalja koji se tičupoduzimanja mjera zaštite i spašavanja stanovništva.
LITERATURA[1] NN-8/99, Državni plan za zaštitu voda[2] NN-8/97, Državni plan obrane od poplava[3] NN-MU-13/95, Zakon o potvrđivanju Konvencije o nuklearnoj sigurnosti[4] NN-27/99, Zakon o zaštiti od ionizirajućih zračenja[5] 96/29/Euratom, Council Directive laying down basic safety standards for the health
protection of the general public and workers against the dangers of ionising radiation
''Sljedbenik prijašnjeg Hrvatskog zavoda za zaštitu od zračenja.
14
VI. simpozij HDZZ, Stubičke Toplice, 2005.
[6] International Atomic Energy Agency (IAEA). 2002, Preparedness and Response fora Nuclear or Radiological Emergency, No. GS-R-2
[7] International Atomic Energy Agency (IAEA). 2003, Method for DevelopingArrangements for Response to a Nuclear or Radiological Emergency, UpdatingIAEA-TECDOC-953
[8] International Atomic Energy Agency (IAEA). 1997, Generic Assessment Proceduresfor Determing Protective Actions during a Reactor Accident, IAEA-TECDOC-955
[9] International Atomic Energy Agency (IAEA). 2000, Generic Procedures forAssessment and Response during a Radiological Emergency, IAEA-TECDOC-1162
[10] D.Škanata, I.Valčić, I.Toth, Pripravnost u Hrvatskoj za slučaj nuklearne nesreće,EGE, God.9, Br.5/01, 135-142, Energetika marketing, Zagreb, prosinac-studeni 2001.
[11] Ekoteh, 2003, Prijedlog nacrta Državnog plana i programa mjera zaštite odionizirajućih zračenja u slučaju izvanrednog događaja.
[12] NN-167/04, Uredba o unutarnjem ustroju Državnog zavoda za nuklearnu sigurnost[13] NN-173/03, Odluka o izmjenama i dopunama Zakona o zaštiti od ionizirajućih
zračenja[14] NN-110/04, Uredba o unutarnjem ustrojstvu Državnog zavoda za zaštitu od zračenja[15] NN-20/05, Uredba o unutarnjem ustroju Državne uprave za zaštitu i
spašavanje
NUCLEAR OR RADIOLOGICAL EMERGENCY PLAN
Dejan Škanata and Šaša MedakovićEnconet International d.o.o., Miramarska 20, HR-10000 Zagreb, Croatia
e-mail: [email protected], [email protected]
This article briefly describes the legislative framework for the development ofnuclear or radiological emergency plan paying particular attention to relevantrequirements set by the Convention on Nuclear Safety and Law on protectionagainst ionising radiations. It also briefly addresses the requirements set by theEuratom Treaty and recommendations by the International Atomic Energy Agency.The current status of the nuclear and radiological emergencies in Croatia is shortlyexplained. Recent administrative changes were made to clearly defineresponsibilities for the development of the emergency plan.
15

OPĆE TEME
GENERAL TOPICS

VI. simpozij HDZZ, Stubičke Toplice,: HR0500021
PREGLED STANJA ZAŠTITE OD IONIZIRAJUĆIHZRAČENJA U REPUBLICI HRVATSKOJ
Dragan Kubelka, Nikša Sviličić, Ivana Kralik Markovinović iDejan Trifunović
Državni zavod za zaštitu od zračenja, Trg I. Mešlrovića 16, 10000 Zagrebdragan .kubelka@hzzz. hr
UVODZaštita od zračenja u našoj zemlji ima dugogodišnju tradiciju, a u skladu s
njom, nadležno tijelo za vođenje poslova zaštite od zračenja bilo je Ministarstvozdravstva. Tehničke poslove pregleda izvora, osobne dozimetrije, vođenjaevidencija o osobama koje rade s izvorima ionizirajućih zračenja i samih izvoraobavljao je Institut za medicinska istraživanja i medicinu rada, a za svoje potrebe,vlastitu službu imao je Institut "Ruđer Bošković".
Odluka Ministarstva zdravstva iz 1991. godine kojom su ovlašteni Institut"Ruđer Bošković" i Ekoteh dozimetrija d.o.o. za obavljanje poslova zaštite odionizirajućih zračenja imala je vrlo pozitivan odjek. Ovom je odlukom po prvi putaomogućeno da više ustanova koje imaju za to uvjete mogu obavljati poslove zaštiteod ionizirajućih zračenja.
Veliki pomak u kvaliteti očitovao se i u tome što se ovi poslovi više nedodjeljuju na osnovu odluke, nego zainteresirane ustanove moraju dokazatitehničke, materijale i kadrovske mogućnosti za obavljanje ovakvih poslova.
Preuzimanjem pojedinih poslova od ovlaštenih ustanova, pokazala sepotreba za kontrolom i koordinacijom njihova rada, kreiranjem politike zaštite odzračenja, vođenjem poslova izrade zakonskih i podzakonskih akata, stvaranjem iodržavanjem jedinstvene baze podataka te stručnom pomoći Ministarstvu zdravstvapri vođenju poslova vezanih uz zaštitu od zračenja.
S tim u vezi, osnovan je Hrvatski zavod za zaštitu od zračenja, koji jezapočeo s radom 1. srpnja 1998. godine. Početak rada Zavoda bila je novina uorganizaciji zaštite od zračenja u Republici Hrvatskoj i daljnji korak k usklađivanjunašeg zakonodavstva sa zakonodavstvom EU i temeljnim zahtjevima sigurnostiMeđunarodne agencije za atomsku energiju (IAEA).
Unatoč vidnom poboljšanju u organizaciji zaštite od zračenja, ekspertiMeđunarodne agencije za atomsku energiju i dalje su upozoravali na određenepropuste i manjkavosti. Smatrali su da upravno tijelo ne može biti unutarMinistarstva zdravstva, koje je najveći korisnik izvora ionizirajućih zračenja.Osnovna zamjerka bila je da takvo tijelo mora biti u potpunosti neovisno odutjecaja korisnika ili proizvođača opreme.
Najveći korak u približavanju međunarodnim standardima učinjen je 2003.godine kad je donesen Zakon o izmjenama i dopunama zakona o zaštiti od
19
VI. simpozij HDZZ, Stubičke Toplice, 2005.
ionizirajućih zračenja kojim je osnovan Državni zavod za zaštitu od zračenja,neovisno tijelo državne uprave nadležno za poslove zaštite od zračenja. Navedenimzakonom, Državni zavod za zaštitu od zračenja preuzeo je od Ministarstvazdravstva vođenje svih upravnih poslova vezanih uz izvore ionizirajućih zračenjaosim inspekcijskih. Ovdje ćemo nabrojati tek neke od tih poslova kao što suizdavanje odobrenja za obavljanje djelatnosti, uporabe, uvoza, izvoza i prijevozaizvora ionizirajućih zračenja. Zavod nadalje ovlašćuje pravne osobe za obavljanjestručnih poslova zaštite od ionizirajućih zračenja, organizira osposobljavanjeradnika iz područja zaštite od ionizirajućih zračenja te surađuje s međunarodnim idomaćim organizacijama i ustanovama za zaštitu od ionizirajućih zračenja.
Posebno treba naglasiti da se u Zavodu vode evidencije o ustanovama kojekoriste izvore ionizirajućih zračenja, djelatnicima koji rade u zoni ionizirajućihzračenja, dozama koje primaju, radioaktivnim izvorima i rendgenskim uređajima.Poslovi vezani uz vođenje evidencija obavljaju se uz pomoć računala, akomunikacija i razmjena podataka između Zavoda i ovlaštenih ustanova kaokorisnika baze podataka odvija se preko Internet-a. Takvim načinom razmjenepodataka osigurali smo da se promjene evidentiraju odmah, već pri njihovomnastanku. Podaci koji se odnose na izloženost djelatnika ionizirajućim zračenjimavode se najednom mjestu što osigurava kontinuitet njihovog prikupljanja. Lako semože pratiti stupanj ozračenosti pojedinca ili skupine, a u slučaju prekomjernogozračenja moguće je odmah reagirati na predviđen način.
U slučaju da za pojedini izvor zračenja ne postoji potrebna dokumentacija,odnosno da nisu izdana predviđena rješenja, postojeće stanje se lako može utvrditi.Isto vrijedi i za slučaj da se izvor zagubi, odnosno da bude neadekvatno smješten.Moguće je točno, brzo, na osnovu pouzdanih podataka provesti potrebne analize iodgovoriti na brojna pitanja potrebna pri planiranju nabavke opreme iliorganiziranju zaštite od zračenja.
IZVORI IONIZIRAJUĆIH ZRAČENJAU bazi podataka koja se vodi pri Zavodu evidentirano je 666 ustanova u
kojima se koriste izvori ionizirajućih zračenja. U tim ustanovama koristi se ukupno1907 izvora, od kojih je 1438 rendgenskih uređaja, odnosno 469 zatvorenihradioaktivnih izvora.
Od gore navedenog broja, 1262 rendgenska uređaja i 151 zatvoreniradioaktivni izvor u upotrebi su u medicinskim ustanovama, a u gospodarstvu 134rendgenska uređaja, odnosno 436 zatvorenih radioaktivnih izvora. Ukupnaaktivnost otvorenih radioaktivnih izvora nabavljenih tijekom 2004. godine iznosilaje 6613,04 GBq.
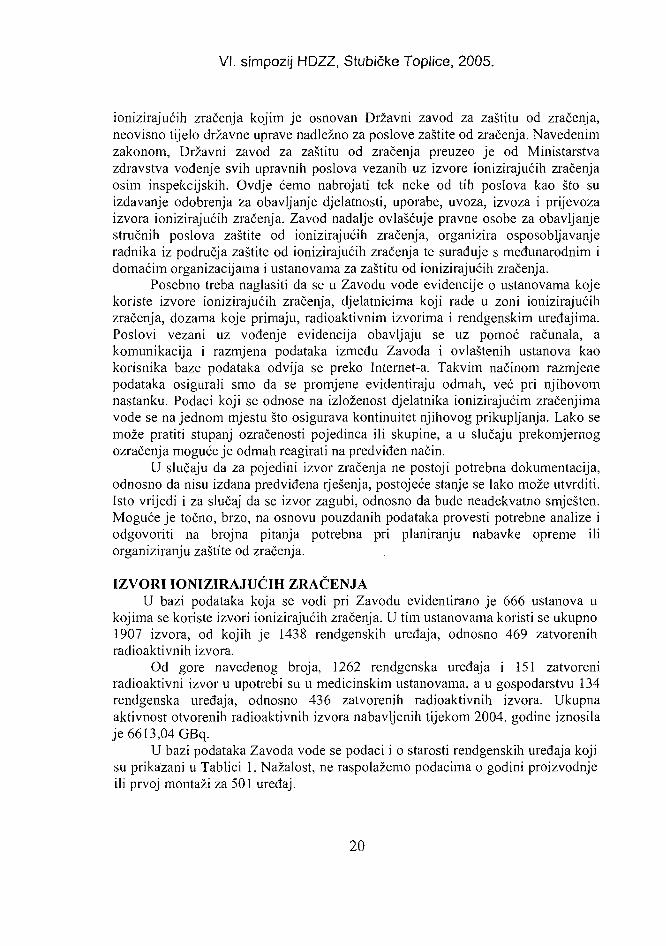
U bazi podataka Zavoda vode se podaci i o starosti rendgenskih uređaja kojisu prikazani u Tablici 1. Nažalost, ne raspolažemo podacima o godini proizvodnjeili prvoj montaži za 501 uređaj.
20
VI. simpozij HDZZ, Stubičke Toplice, 2005.
Tablica 1. Starost rendgenskih uređajaSTAROST
Odo 55 do 1010 do 15
stariji od 15 g.nepoznata
Broj30139882156501
%20.9327,685,7010.8534,84
TEHNIČKI NADZORTehnički nadzor nad izvorima ionizirajućih zračenja provodi se na osnovu
zakonskih propisa i akata donesenih na osnovi njih. U skladu s tim zakonskimpropisima, rješenje za obavljanje stručnih poslova zaštite od ionizirajućih zračenjaimaju tri ustanove. S tim u vezi, od 1446 aktivnih rendgenskih uređaja, tijekom2004. godine nisu pregledana 203 uređaja. Treba napomenuti da za 31 uređaj neraspolažemo ni podacima o pregledima za ranije godine. Od 469 zatvorenihradioaktivnih izvora, koliko ih se koristi u 60 ustanova, 115 nije pregledano. Odukupnog broja radioaktivnih gromobrana, prema podacima koji se vode u Zavodu,od 01. siječnja 2004. godine pregledano je 114 gromobrana. Nije pregledano 217gromobrana, a za njih 47 nikada nije upisano ni jedno izvješće.
KONTROLA UVOZA I TRANSPORTA RADIOAKTIVNIH IZVORAGranična sanitarna inspekcija Ministarstva zdravstva i socijalne skrbi
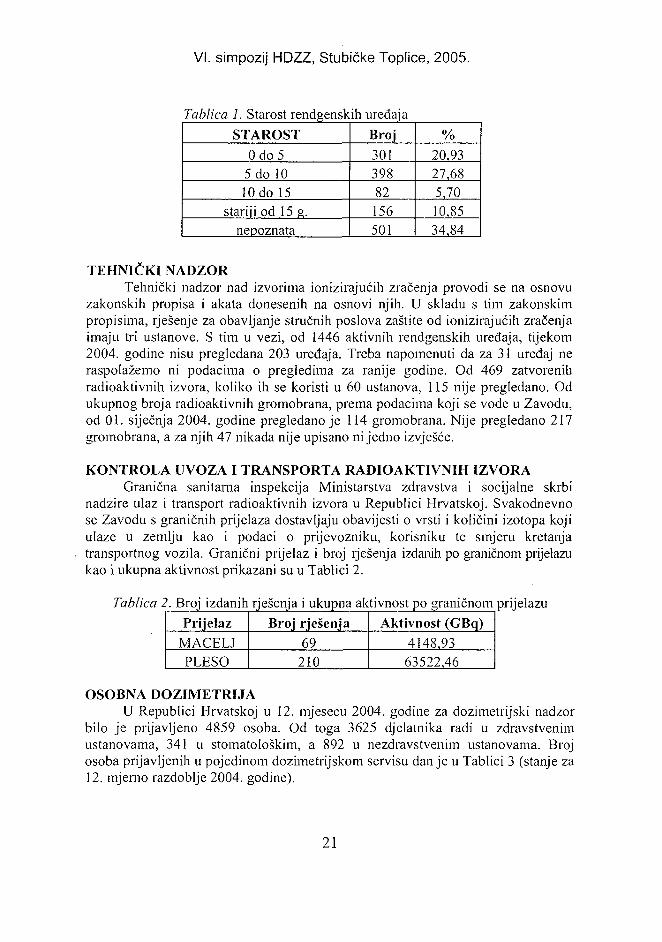
nadzire ulaz i transport radioaktivnih izvora u Republici Hrvatskoj. Svakodnevnose Zavodu s graničnih prijelaza dostavljaju obavijesti o vrsti i količini izotopa kojiulaze u zemlju kao i podaci o prijevozniku, korisniku te smjeru kretanjatransportnog vozila. Granični prijelaz i broj rješenja izdanih po graničnom prijelazukao i ukupna aktivnost prikazani su u Tablici 2.
Tablica 2. Broj izdanih rješenja i ukupna aktivnost po graničnom prijelazuPrijelaz Broj rješenja Aktivnost (GBq)
MACELJPLESO
69210
4148,9363522,46
OSOBNA DOZIMETRIJAU Republici Hrvatskoj u 12. mjesecu 2004. godine za dozimetrijski nadzor
bilo je prijavljeno 4859 osoba. Od toga 3625 djelatnika radi u zdravstvenimustanovama, 341 u stomatološkim, a 892 u nezdravstvenim ustanovama. Brojosoba prijavljenih u pojedinom dozimetrijskom servisu danje u Tablici 3 (stanje za12. mjerno razdoblje 2004. godine).
21
VI. simpozij HDZZ, Stubičke Toplice, 2005.
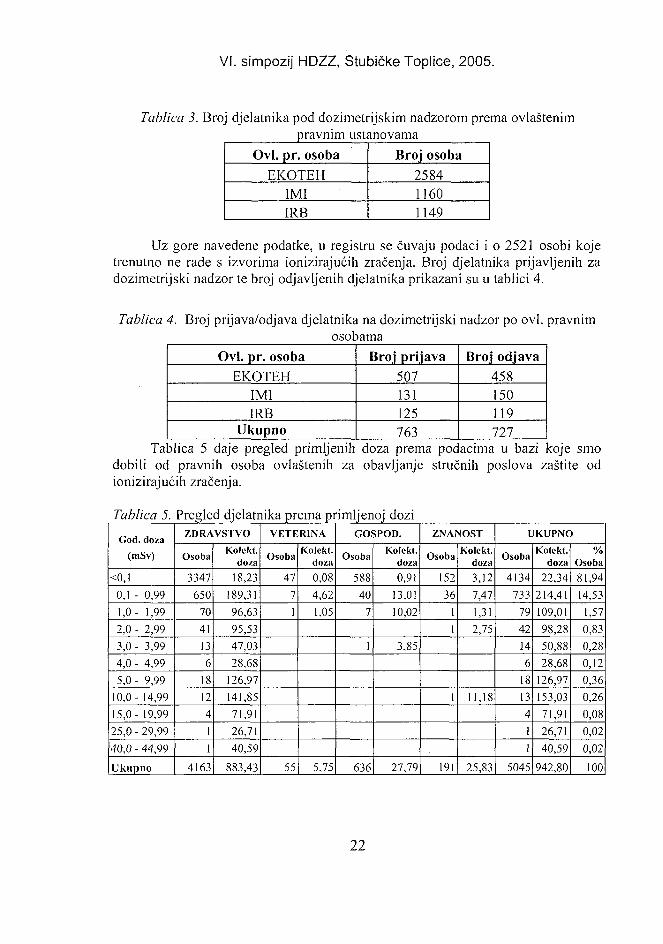
Tablica 3. Broj djelatnika pod dozimetrijskim nadzorom prema ovlaštenimpravnim ustanovama
Ovi. pr. osobaEKOTEH
IMIIRB
Broj osoba258411601149
Uz gore navedene podatke, u registru se čuvaju podaci i o 2521 osobi kojetrenutno ne rade s izvorima ionizirajućih zračenja. Broj djelatnika prijavljenih zadozimetrijski nadzor te broj odjavljenih djelatnika prikazani su u tablici 4.
Tablica 4. Broj prijava/odjava djelatnika na dozimetrijski nadzor po ovi. pravnimosobama
Ovi. pr. osobaEKOTEH
IM1IRB
Ukupno
Broj prijava507131125763
Broj odjava458150119727
Tablica 5 daje pregled primljenih doza prema podacima u bazi koje smodobili od pravnih osoba ovlaštenih za obavljanje stručnih poslova zaštite odionizirajućih zračenja.
Tablica 5.God. doza
(mSv)
<0,l0,1 - 0,991,0- 1.992,0- 2,993,0- 3,994,0 - 4,995,0- 9,99
10,0- 14,9915,0- 19,9925,0 - 29,9940,0 - 44,99
Ukupno
Pregled djelatnika prema primljenoj doziZDRAVSTVO
Osoba
3347650
7041136
1812411
4163
Kolckt.doza
18,23189,3196,6395,5347,0328,68
126,97141,8571,9126,7140,59
883,43
VETERINA
Osoba
4771
55
Kolckt.doza0,084,621,05
5,75
GOSPOD.
Osoba
58840
7
1
636
Kolckt.doza0,91
13,0110,02
3,85
27,79
ZNANOST
Osoba
15236
11
1
191
Kolekt.doza3,127,471,312,75
11,18
25,83
UKUPNO
Osoba
4134733
7942146
1813411
5045
Kolekt.doza
22,34214,41109,0198,2850,8828,68
126,97153,0371,9126,7140,59
942,80
%Osoba81,9414,53
1,570,830,280,120,360,260,080,020,02
100
22
VI. simpozij HDZZ, Stubičke Toplice, 2005.
U bazi se također vode podaci o ukupnom broju dozimetara koji sudostavljeni ustanovama te postotku dozimetara koji su vraćeni na vrijeme, odnosnonakon određenog perioda. Postotak dozimetara koji nisu vraćeni u skladu spozitivnim propisima kreće se od 2,9 do 4,3 posto za pojedino mjerno razdoblje. Izistih podataka evidentno je da ustanove tijekom 2004. godine nisu osiguraledozimetrijski nadzor za 595 djelatnika.
Propisi kojima bi se reguliralo zbrinjavanje radioaktivnog otpada te državniplan i program za slučaj izvanrednog događaja još nisu doneseni.
Pravilnik o zbrinjavanju rdioaktivnog otpada i iskorištenih zatvorenihradioaktivnih izvora je napisan. Ne može stupiti na snagu dok se na nivou državene odredi centralno državno skladište.
ZAKLJUČAK• Većina izvora pregledana je u zakonskom roku, a podaci se razmjenjuju na
predviđen način.Poseban problem predstavljaju gromobranske instalacije. Obzirom na
to da za većinu izvora nema podataka da su pregledani, postoji opravdanasumnja da se više ne nalaze na predviđenoj lokaciji, odnosno da se nadnjima ne provode mjere nadzora i sigurnosti predviđene zakonom. Zbogtoga je neophodno u što kraćem roku provesti inspekcijski nadzor s ciljemda se utvrdi stvarno stanje.
Rad s radioaktivnim izvorima koji nisu pregledani u zakonskom rokutrebalo bi zabraniti, a izvore pohraniti na prikladan način.
• Razmjena podataka s graničnom sanitarnom inspekcijom odvija u zakonompredviđenim okvirima. U pojedinim slučajevima obavijesti ne sadrže svepredviđene podatke.
- Podaci koji se dostavljaju Zavodu trebaju biti potpuni kako bi nadzor nadkorištenjem otvorenih radioaktivnih izvora bio čim kvalitetniji.
- Potrebno je razviti informacijski sustav koji će omogućiti graničnimsanitarnim inspektorima uvid u odobrenja kojima se određujemaksimalne godišnja količina radionuklida koje pojedine ustanove smijunabaviti.
• Dozimetrijski nadzor osoba koje rade u kontroliranom području provode triovlaštena servisa. Oni podatke o očitanim dozama dostavljaju Zavodu napredviđen način. Prema prikupljenim podacima, postotak dozimetara kojeustanove ne vraćaju duže od tri mjeseca od predviđenog roka kreće se oko 5%.To predstavlja znatno poboljšanje u usporedbi s ranijim godinama, ali jošuvijek ne zadovoljava.
- S ciljem poboljšanja stanja, trebalo bi provesti inspekcijski nadzor uustanovama koje, prema podacima koje se vode u Zavodu, ne vraćajudozimetre na vrijeme.
23
VI. simpozij HDZZ, Stubičke Toplice, 2005.
- Inspekcijski nadzor potrebno je provesti i s ciljem provjere osoba za kojese sumnja da ne koriste dozimetre u skladu sa zakonskim propisima.
• Potrebno je na nivou države odrediti mjesto za centralno skladištenje otpadnogradioaktivnog materijala i radioaktivnih izvora koji se ne koriste kako biPravilnik o zbrinjavanju rdioaktivnog otpada i iskorištenih zatvorenihradioaktivnih izvora mogao sutpiti na snagu.
• Potrebno je izraditi prijedlog plana za slučaj izvanrednog događaja vezanog uzizvore ionizirajućih zračenja te otpočeti s njegovom primjenom.
IONISING RADIATION PROTECTION IN CROATIA
Dragan Kubelka, Nikša Sviličić, Ivana Kralik Markovinović andDejan Trifunović
State Institute of Radiation Protection, Trg I. Meštrovića 16,HR-10020 Zagreb, [email protected]
The majority of sources are examined within legal timeframes and data areexchanged through prescribed procedures. Lightning installations present separateproblem. As no examination data are available for the majority of sources, there isreasonable doubt that prescribed measures for their surveillance and safety are notenforced. Data with state border sanitary inspections are exchanged according toprescribed procedures. In some cases, documents lack required information.Dosimetry surveillance of persons working in controlled areas is done by threeauthorised services. They report to the Institute through prescribed procedures.According to available data, only 5% of dosimeters are not returned by institutionsfor longer than three months after the prescribed submission deadline. This is asignificant improvement in respect to previous years, but is still unsatisfactory. It isnecessary to determine a location for the central storage of radioactive waste anddisused sources on the national level in order to establish Regulations on wastemanagement and on used and sealed radioactive sources. Forming of draft plan foraccidents with radioactive sources and its implementation is important. Currentdosimetry surveillance suggests that about 82% of persons working in thecontrolled areas receive doses below 0.1 mSv per year.
24
VI. simpozij HDZZ, Stubičke Toplice, 2 HR0500022
ZDRAVSTVENA ZAŠTITA OSOBA PROFESIONALNOIZLOŽENIH IONIZIRAJUĆEM ZRAČENJU U REPUBLICI
HRVATSKOJ
Marija ZavalićHrvatski zavod za medicinu rada,
Avenija V. Holjevca 22, 10000 Zagrebe-mail: [email protected]
UVODZdravstvena zaštita radnika izloženih ionizirajućim zračenjima u Republici
Hrvatskoj određena je Zakonom o zaštiti od ionizirajućeg zračenja [1], Pravilnikomo zdravstvenim uvjetima za rad s izvorima ionizirajućih zračenja, te mjerilima,sadržaju, načinu i rokovima čuvanja podataka o zdravstvenim pregledima osobakoje rade s izvorima ionizirajućih zračenja [2] i Pravilnikom o poslovima sposebnim uvjetima rada [3]. Pravilnikom o zdravstvenim uvjetima za rad sizvorima ionizirajućih zračenja, te mjerilima, sadržaju, načinu i rokovima čuvanjapodataka o zdravstvenim pregledima osoba koje rade s izvorima ionizirajućihzračenja određen je minimun opreme koji moraju zadovoljavati zdravstevneustanove, trgovačka društva ili ordinacije medicine rada koje pregledavaju radnikeizložene ionizirajućim zračenjima. Trenutno u Republici Hrvatskoj pedeset i trispecijalističke ordinacije medicine rada imaju ovlaštenje za preglede radnikaizloženih ionizirajućim zračenjima, ali je teritorijalna raspodjela u RepubliciHrvatskoj neravnomjerna. Čak u pet Županija, Zagrebačkoj, Krapinsko-zagorskoj,Virovitičko-podravskoj, Šibensko-kninskoj i Dubrovačko-neretvanskoj ni jednaordinacija medicine rada nema odobrenje za preglede radnika izloženihionizirajućim zračenjima i radnici sa područja tih županija pregledavaju se uordinacijama u drugim županijama.
ISPITANICI I METODEUčinjena je analiza zdravstvenog stanja na 1406 ili 1/3 svih radnika
izloženih ionizirajućim zračenjima koji su pregledani u redovitim periodičkimpregledima tijekom 2004. godine, a za koje su do 31. 12. 2004. godine prispjelipodaci u Hrvatski zavod za medicinu rada. U svih su radnika, sukladno važećemPravilnikom o zdravstvenim uvjetima za rad s izvorima ionizirajućih zračenja, temjerilima, sadržaju, načinu i rokovima čuvanja podataka o. zdravstvenimpregledima osoba koje rade s izvorima ionizirajućih zračenja [1] izvršen propisaniopseg pregleda. Analizirani su podaci o dobi i spolu radnika, pobolu radnikaizloženih ionizirajućem zračenju, uzrocima privremene ili trajne nesposobnostiradnika za daljnji rad u zoni ionizirajućih zračenja te podaci o broju profesionalnihbolesti uzrokovanih ionizirajućim zračenjima utvrđenih tijekom 2004. godine. Iz
25
VI. simpozij HDZZ, Stubičke Toplice, 2005.
izvješća specijalističkih ordinacija medicine rada nije se mogla analizirati duljinaizloženosti ionizirajućem zračenju, duljina latencije (vremena od početkaizloženosti) niti su pregledima podvrgavani radnici koji su prestali raditi u zoniionizirajućih zračenja.
U dva je radnika (svi zaposleni u zdravstvenoj djelatnosti) ustanovljenamaligna bolest koja je proglašena profesionalnom bolešću.
REZULTATIOd ukupno analiziranih 1406 radnika 562 (40%) su žene, dok su ostalo
muškarci. Najveći broj radnika 1302 (92,6%) su radnici u zdravstvu, dok su ostalizaposleni u drugim privrednim granama. Prosječna je dob pregledanih radnika 54godine i nema razlike između muškaraca i žena.
Od ukupnog broja pregledanih radnika njih je 16 (1,13%) ocijenjeno trajnonesposobnima; u 11 slučajeva uzrok nesposobnosti su zamućenja leće (nađeni suopaciteti koji po lokalizaciji ne odgovaraju promjenama kakve može izazvatiionizirajuće zračenje), u dva slučaja perzistentna trombocitopenija (perzistentna iduža od 6 mjeseci), dva su malignoma (pluća u muškarca i dojka u žene, i ujednom slučaju kožna neprofesionalna bolest).
Privremeno nesposobnim je ocijenjeno 24 radnika; od toga pet žena zbogtrudnoće. Čak je u 12 muškaraca, a svega u jedne žene utvrđena trombocitopenija,anemija je utvrđena u četiri žene, dok leukopenije ili leukocitoze uopće nijeutvrđeno niti u jedne pregledane osobe. Sve su se žene podvrgnule dodatnoj obradizbog razjašnjenja etiologije navedenih bolesti, dok je to učinio samo jedanmuškarac. Jednoj je osobi uzrok privremene nesposobnosti nađen bicentričnikromosom, a drugoj aktivna tuberkuloza.
Drugostupanjskom povjerenstvu za ocjenu radne sposobnosti žalile su se 3osobe, sve zaposlene u zdravstvu; kod 2 osobe kod kojih su nađene promjene usmislu pojedinačnih, rijetkih zamućenja leće obostrano, i to na mjestima koja nisutipična za oštećenje ionizirajućim zračenjem a karakteristika im je da sustacionarna a ne progredientna (ocjena Referentnog centra za leće iz Zagreba) idonesena je pozitivna ocjena, tj. osposobljene su za rad u zoni ionizirajućihzračenja. Jedna je osoba imala refrakternu leukopeniju i ocijenjena jenesposobnom.
ZAKLJUČAKRezultati zdravstvenih pregleda radnika izloženih ionizirajućim zračenjima u
Republici Hrvatskoj govore u prilog niskoj razini izloženosti ionizirajućemzračenju, odnosno upućuju na dobru cjelokupnu zaštitu na radu osoba izloženihionizirajućem zračenju.
Ustanovljena oštećenja leće u radnika izloženih ionizirajućem zračenjunemaju karakteristike profesionalnog oštećenja za ovaj tip zračenja.
26
VI. simpozij HDZZ, Stubičke Toplice, 2005.
Analiza zdravstvenog stanja ujedno ukazuje na nedovoljnu odgovornostosoba, poglavito muškaraca, u razjašnjenju etiologije trombocitopenija koje su unjih bile uzrok privremenoj nesposobnosti. Od njih dvanaest samo je jedan učiniopreporučenu dodatnu obradu. Ovakvo ponašanje radnika ukazuje na potrebu trajnezdravstvene edukacije, koja se za sada ne provodi sistematično i kontinuirano većsamo sporadično. Nasuprot muškarcima sve su žene učinile dodatnu obradu koju jepreporučio specijalist medicine rada i razrješio se uzrok bolesti.
Dva utvrđena malignoma su bolesti koje se učestalije javljaju u izloženihionizirajućim zračenjima, te su sukladno tome, priznati profesionalnim bolestima.
LITERATURA[ 1 ] Zakon o zaštiti od ionizirajućeg zračenja (NN 27/99).[2] Pravilnik o zdravstvenim uvjetima za rad s izvorima ionizirajućih zračenja, te
mjerilima, sadržaju, načinu i rokovima čuvanja podataka o zdravstvenim pregledimaosoba koje rade s izvorima ionizirajućih zračenja (NN 1/05).
[3] Pravilnik o poslovima s posebnim uvjetima rada (NN 3/84).
HEALTH PROTECTION OF PERSONS OCCUPATIONALLYEXPOSED TO IONISING RADIATION IN CROATIA
Marija ZavalićCroatian Institute of Occupational Health
Avenija V. Holjevca 22, HR-10000 Zagreb, Croatiae-mail: [email protected]
The aim of this study was to investigate the health condition of workersoccupationally exposed to ionising radiation. The results for 1406 workers exposedto ionising radiations, who were regularly examined in 2004, were analysed usingStatistica 5.0. The analysis included workers' case histories, frequency of illnessesand causes of temporary or permanent work disability. Of 1406 workers, 16(1.13%) were found permanently disabled; in 11 the cause of disability was lensopacity, in 2 persistent trombocitophenia, and in 2 malignant tumour. Twenty-fourworkers were temporarily disabled, of whom 5 due to pregnancy.Thrombocytopenia was found in 12 men and only one woman. Anaemia was foundin 4 women; dicentric chromosomes were the cause of temporary disability in oneperson, and tuberculosis in one person. Medical examinations of Croatian workersconfirm low occupational exposure to ionising radiation. With this type ofradiation, the established lense impairments could not be characterised asoccupational. The two malignant tumours however were recognised asoccupational diseases.
27
VI. simpozij HDZZ, Stubičke Topli« , HR0500023
RADIATION PROTECTION METROLOGY IN AUSTRIA:STATUS AND NEEDS IN A EUROPEAN PERSPECTIVE
Franz Josef Maringer, Arnold Leitner and Manfred TschurlovitsBEV - Bundesamt fur Eich- und Vermessungswesen,
Arltgasse 35, 1160 Wien, AustriaTechnical University Vienna, Atomic Institute,
Stadionallee 2, 1020 Wien, Austriae-mail: [email protected]
INTRODUCTIONIn the last 40 years the use of ionising radiation, radioactivity and nuclear
applications in science, medicine and industry became more and more widespread.In this context it was obvious that a global harmonised system in radiationprotection and radiation dosimetry is required to assure quality and accuracy inexchange of ideas, science, technologies and products.
Accurate and high-grade measurements of ionising radiation are required ina wide range of industrial and medical applications where they are critical relatingto human health and safety. In the field of dosimetry and activity measurements,radiology and nuclear medicine are perhaps the most stringent in its accuracyrequirements. Generally this means that the uncertainty of measurements inmedical applications should not exceed a few percent.
ORGANISATIONS IN RADIATION PROTECTION METROLOGYBIPM
In 1960, the ll I h General Conference of the Meter Convention decided toestablish the Ionising Radiation section at the Bureau International des Poids etMesures, BIPM.
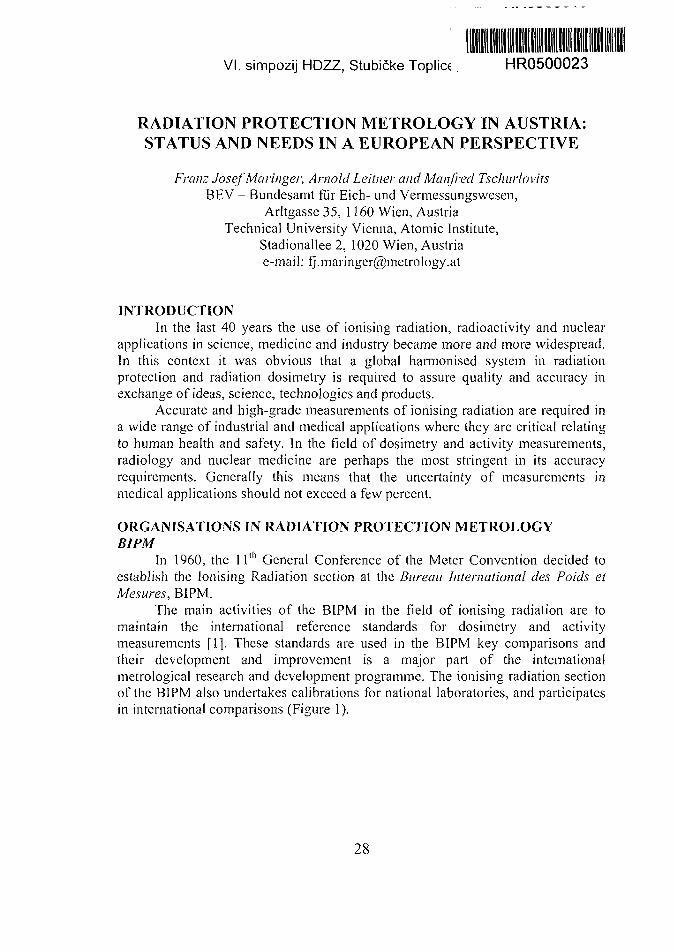
The main activities of the BIPM in the field of ionising radiation are tomaintain the international reference standards for dosimetry and activitymeasurements [1]. These standards are used in the BIPM key comparisons andtheir development and improvement is a major part of the internationalmetrological research and development programme. The ionising radiation sectionof the BIPM also undertakes calibrations for national laboratories, and participatesin international comparisons (Figure 1).
28
VI. simpozij HDZZ, Stubičke Toplice, 2005.
IDosimetry
International participation in CCRI
{comparisons j4^D&?% ' j e ^ ^ f l H f lAustralia
! Austria; Belgium: Brazil: Canada
Czech RepublicFrance
; Germanyi Hungaryi India! Italy; Japani Netherlands\ Poland
pHHp »•> \., ^ H f l• "•'• * *** •. ,' v. / ^^F "\
| Russian Federation H I . . . . . . I B _ . 1 1; Slovakia: Switzerland! UK; USA
1j
^ all J S<.viion^Hlan> _ Scciioi^ 1 1 i\n\ 1 Sc<.
L i cxicn^itm through ihc IAIiA SSI)[ Nciwvu'k
Dosimetry calibrationsArgentina Greece SpainBulgaria Norway SwedenDenmark Poland SwitzeilandEgypt Republic of Korea YugoslaviaFinland South Africa IAEA
activitiesActivity
• p r comparisons^: % Arqentina• j \ Australia^ \ Austria !L "*r . Belgium i
V : ' Brazil \f ^ . Canada i1 ?\ • Chinamff"***- Chinese Taipei I
-*lL? l ' V / , Czech Republic !^ ^ r l France
| ^ H K Germany ifli^^P Hungary I
^ P ^ ^ India !' (.;--'
='"" Italy 1JapanMexico
l i o n Netherlands ;Poland iRepublic of Korea ;Romania iRussian FederationSlovakia :
South Africa
Spam ;Switzerland ;Thailand 'UK •USA :1RMM •
Figure 1. Comparison and calibration network of the Comite consultatif desrayonmments ionisants, CCRI of the Bureau International des Poids et Mesures, BIPM [1]
IAEA SSDL NETWORKThe IAEA/WHO Network of Secondary Standards Dosimetry Laboratories
(SSDL Network) includes currently 81 laboratories in 62 Member States, of whichover half are developing countries [2].
The SSDL network also includes 15 affiliated members (Primary StandardDosimetry Laboratories, PSDLs) - the BEV is one of them - and 5 collaboratingorganisations; these supply scientific and technical support to the Network. TheSSDL project has the responsibility to verify that the services provided by thenational laboratories follow internationally accepted metrological standards,including also the traceability for radiation protection instruments. IAEA's supportis accomplished first with the transmission of calibration factors for ionisationchambers from the BIPM or PSDLs through the IAEA's Dosimetry Laboratory. Formore than 15 years a postal TLD programme has monitored the performance of theSSDLs in the therapy dose range and more recently a comparison has been initiatedusing ionisation chambers. One of the principal goals of the SSDL network is toguarantee that the dose delivered to patients undergoing radiotherapy treatment inthe Member States is kept within internationally accepted levels. During the lastyears the trend towards the implementation of quality assurance (QA) proceduresin radiotherapy has been based on the criticality of biological response to radiation
29
VI. simpozij HDZZ, Stubičke Toplice, 2005.
dose, as the probabilities of tumour control and normal tissue complication areclosely related to a correct patient dosimetry [2].
EUROMETAt the European level EUROMET is acting as the regional metrological
confederation. It is coordinating the metrological activities of the Europeannational metrology institutes (NMI's) of the EU including the EuropeanCommission, EFTA and EU Accession States. Other European states may applyfor membership, based on certain published criteria. The organisation currently has31 participating member countries [3].
The objective of EUROMET is to promote the coordination of metrologicalactivities and services with the purpose of achieving higher efficiency.
EUROMET is working in Technical Committees; on of them is the TCIonising Radiation. This TC is divided the Sub-Fields photon dosimetry,radioactivity, and neutron measurements. The basic activities are jointly done byco-operative scientific and technical projects.
THE AUSTRIAN METROLOGICAL SERVICE IN IONISING RADIATIONATBEV
The metrological objectives of the BEV based on the Austrian MetrologyAct are:• Maintenance of the national standards for dosimetry in radiation protection,
diagnostic radiology and radiation therapy,• Verification and calibration of dosimeters used in radiation protection, diagnostic
radiology and radiation therapy,• Metrological examination of personal dosimeters used in radiation protection.
The BEV dosimetry laboratory [4] was jointly installed together with theAustrian Research Centers Seibersdorf and has been in operation since 1977. Tofulfil the international requirements for mutual recognition the BEV dosimetrylaboratory participates regularly in international comparisons organised by BIPM,EUROMET and IAEA. The dosimetry branch of the BEV is member of the Comiteconsultatif des rayonnements ionisants, CCRI. This committee advises the Comiteinternational des poids et measures, CIPM, in Sevres near Paris in metrologicalaffairs, in the planning and running of international comparison exercises andscientific topics in dosimetry of ionising radiation.
30
VI. simpozij HDZZ, Stubičke Toplice, 2005.
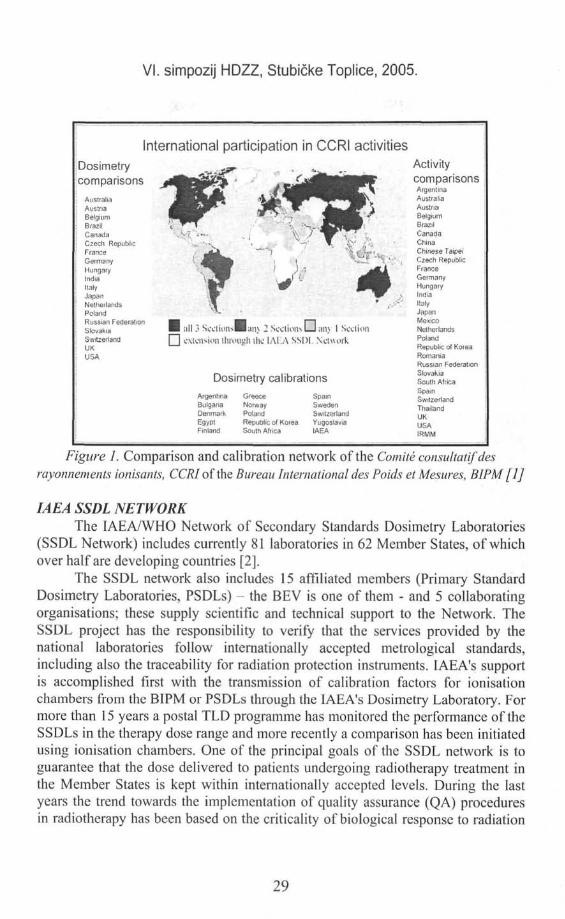
Figure 2. Verification of a radiation protection dosimeter at theBEV dosimetry laboratory Seibersdorf
Furthermore the BEV dosimetry laboratory irradiates referencethermoluminescence dosimeters for the postal dose comparison measurementprogram of the IAEA within the scope of the Secondary Standard DosimetryLaboratory SSDL network.The irradiation facilities of the BEV dosimetry laboratory are:® Three X-ray tubes with adjustable tube voltage from 5 keV to 320 keV,• 60Co-teletherapy unit with adjustable collimator and preset of irradiation time
for therapy dosimetry,• Panoramic irradiation facility containing four 137Cs sources with pneumatic
transport system and radiation time control for radiation protection dosimetry,• Reference beam facility containing three l37Cs and three 60Co sources with
conical ring collimator, pneumatic shutter and irradiation time control forradiation protection dosimetry.
The realisation of the dosimetric quantities / units is done by:• Graphite-cavity ionisation chambers for absolute realisation of the units of air
kerma and derived dose equivalent quantities of gamma radiation of 137Cs andCo,
• Free air-parallel plate ionisation chambers for absolute realisation of the unitsof kerma and derived dose equivalent quantities of X-rays with energies from 5keV to 320 KeV,
• Graphite Calorimeter for absolute realisation of the units of absorbed dose inwater, which is derived from absorbed dose to graphite by means of conversionfactors (ICRU),
® Secondary standard transfer ionisation chambers with volumes from 0,03 cm3
to 10000 cm3 for realisation of the dosimetric units of the total dose rate rangefrom natural/environmental levels up to dose rates used in radiation therapy.
31
VI. simpozij HDZZ, Stubičke Toplice, 2005.
Additionally there are high-quality digital current and charge measurementsystems in operation. The ionisation current is in the range from 0.1 pA to 100 nA.The measurement facilities are partly self-constructed and partly developed in co-operation with foreign national metrology institutes.
The objectives in the radioactivity branch [4] of the ionising radiationsection of the BEV are:9 Verification of activity meters (Bq) and contamination monitors (Bq/cm2)
applied for diagnostic, therapy and radiation protection,• Metrological examination and calibration of gamma-ray spectrometry facilities
applied in nuclear medicine, nuclear industry, environmental monitoring,® Verification and calibration of radon monitors applied in the determination of
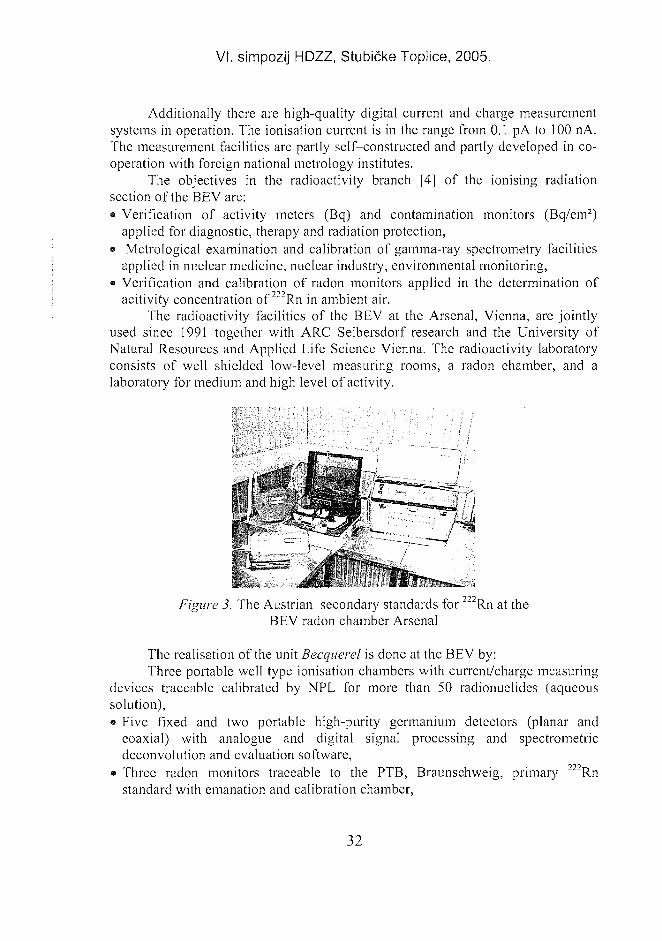
acitivity concentration of 222Rn in ambient air.The radioactivity facilities of the BEV at the Arsenal, Vienna, are jointly
used since 1991 together with ARC Seibersdorf research and the University ofNatural Resources and Applied Life Science Vienna. The radioactivity laboratoryconsists of well shielded low-level measuring rooms, a radon chamber, and alaboratory for medium and high level of activity.
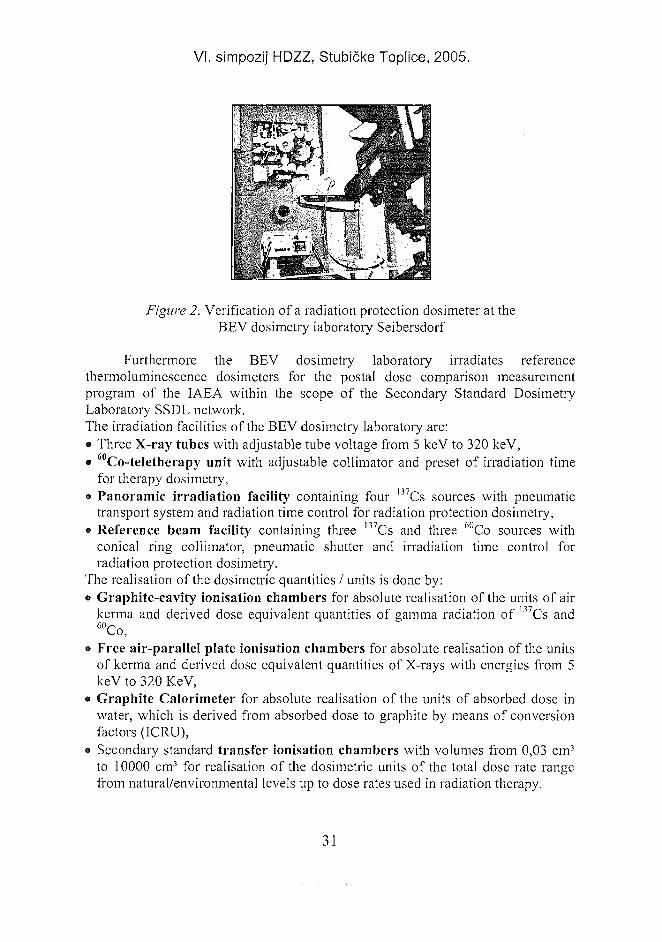
Figure 3. The Austrian secondary standards for 222Rn at theBEV radon chamber Arsenal
The realisation of the unit Becquerel is done at the BEV by:Three portable well type ionisation chambers with current/charge measuring
devices traceable calibrated by NPL for more than 50 radionuclides (aqueoussolution),• Five fixed and two portable high-purity germanium detectors (planar and
coaxial) with analogue and digital signal processing and spectrometricdeconvolution and evaluation software,
® Three radon monitors traceable to the PTB, Braunschweig, primary 222Rnstandard with emanation and calibration chamber,
32
VI. simpozij HDZZ, Stubičke Toplice, 2005.
• Radioactive sources of different radionuclides - point and volume sources withcertified activities for calibration, verification and quality assurance as well asarea sources with defined activity and emission rate.
PERSPECTIVE IN A EUROPEAN CONTEXTIt is obvious that future developments of radiation protection metrology in
Europe could only be achieved as well as in established as in newly created co-operative metrological networks:• The world-wide exchange of ideas, science, technology and products in nuclear
and radiation application and radiation protection increasingly demandsharmonised metrological standards in dosimetry and radiometry,
• The decay and disappearance of obsolete technical and administrative structuresand the formation of new states in Europe necessitate the effectively affiliation ofnew member states in the established European metrological institutions,
• The European contribution to the social and economic development of the worldis a clear responsibility due to the cultural and scientific heritage of EuropeanNations.
This general frame leads to specific objectives in metrology of ionisingradiation and radioactivity in Europe in the near future e.g.:• Joint development, financing and co-operative use of high energy photon and
particle generator facilities for the metrology of scientific and medicalapplications,
• Establishing of a common traceability network for radon detectors and radonmeasurement instruments,
• Co-ordination of all metrological aspects of radiation protection and co-ordination of common objectives in a European Confederation of radiationprotection associations.
REFERENCES[1] BIPM-Homepage,
http://wwwl.bipm.org/utils/common/pdf/ri/international_participation.pdf, 2005.[2] IAEA-Homepage, http://www-naweb.iaea.org/nahu/external/e3/ssdl.asp, 2005.[3] EUROMET-Homepage, http://www.euromet.org/tc/ionrad.html, 2005.[4] BEV-Homepage, www.metrology.at, 2005.
ABSTRACTA global harmonised system of radiation protection and radiation dosimetry
metrology is required to assure quality and accuracy in exchange of ideas, science,technologies and products. Accurate and high-grade measurements of ionising radiation arerequired in a wide range of industrial and medical applications where they are critical forhuman health and safety. This paper presents current work of international and Austrianmetrological institutions in the field of ionising radiation and briefly discusses the futureneed and perspectives in the European context.
33
VI. simpozij HDZZ, Stubičke Toplio HR0500024
AKREDITACIJA LABORATORIJA U PODRUČJUZAŠTITE OD ZRAČENJA
Slobodan Galjanić1 iZdenko Franić2
'Državni zavod za normizaciju i mjeriteljstvoUlica grada Vukovara 78, 10000 Zagreb
2Institut za medicinska istraživanja i medicinu rada,Ksaverska c. 2, 10000 Zagreb
e-mail: [email protected], [email protected]
UVODAkreditacija laboratorija je formalno priznavanje osposobljenosti laboratorija
da obavlja određena ispitivanja ili određene vrste ispitivanja, a dodjeljuje ganezavisno akreditacijsko tijelo koje i samo mora dokazati svoju osposobljenost. Zarazliku od certifikacije, kojom se potvrđuje sukladnost sa zahtjevima specificiranimu kojoj normi, npr. HRN ISO 9000 koja se odnosi na sustav upravljanja,akreditacija je sredstvo za uspostavu povjerenja u ukupnu osposobljenostlaboratorija za provedbu ispitivanja iz područja akreditacije. Glavni karakteristikeakreditacije jesu:
priznavanje tehničke kompetencije,područje akreditacije je u pravilu vrlo specifično,ocjenjuje se osoblje, vještine i znanje, oprema, provedba postupaka ispitivanja,ocjenu vode tehnički visokokompetentni ocjenitelji (tzv. auditori, engl.:assessors),ocjenjuje se i sustav upravljanja kvalitetom,može uključivati i provedbu specifičnih testova npr. interkomparacija,međulaboratorijskih ispitivanja, mjeriteljske audite i si.Valja napomenuti da je sustav akreditacije dobrovoljno područje te svaki
subjekt sam procjenjuje hoće li mu to donijeti tržišnu prednost. No, sve se mijenjaonoga časa kada zahtjev za akreditacijom uđe u neki zakonski akt. Primjerice,državna uprava, odnosno zakonodavac, može odrediti da neki laboratoriji kojiprovode određena ispitivanja moraju biti akreditirani.
U području zaštite od zračenja na globalnom planu akreditacija ispitnih iumjernih (kalibracijskih) laboratorija intenzivirala se posljednjih nekoliko godina,kao posljedica napretka znanosti i tehnologije, razvojem sve veće konkurencije, alii zbog velikog interesa stručne i šire javnosti za problematiku zaštite od zračenja iradioekologije [1], posebice nakon nuklearne nesreće u Čornobilju.
34
VI. simpozij HDZZ, Stubičke Toplice, 2005.
ISPITNI LABORATORIJINakon udesa reaktora NE Lenjin u Čornobilju, požari koji su uslijedili
prouzročili su dvotjedno kontinuirano ispuštanje radioaktivnog materijala uatmosferu. Radioaktivne perjanice zahvatile su gotovo cijelu Europu, doveli su dokontaminacije velikih površina poljoprivrednog zemljišta prvo jodom, a potomizotopima cezija. Radioaktivni materijal iz čornobiljskog reaktora, dospjevši dotroposfere te nošen globalnim transportnim procesima još je godinama putemradioaktivnih oborina {fallout) dodatno kontaminirao tlo. Posljedično, povećanekoncentracije fisijskih produkata vrlo su brzo detektirane u praktički u svimsvježim namirnicama.
Vlasti gotovo svih država brzo su reagirale određenim preporukama iodlukama manje ili više sukladnih tada važećem sustavu zaštite od zračenja. Zaradiocezij u hrani postavljeni su standardi od 30000 Bq kg"1, koji su zbogaditivnosti postroženi na 9000 Bq kg"' [2]. Usprkos tome, Europska ekonomskazajednica je odlukom 1707/86 od 31. svibnja 1986. godine odredila dakoncentracija aktivnosti cezija-134 ( l34Cs) i cezija-137 ( l37Cs) u hrani mora bitiispod 600 Bqkg"1. Mnogo strože granične vrijednosti odredile su europske zemljekoje nisu bile pogođene nesrećom, te su u nekim slučajevima, te vrijednosti bilemanje od 100 Bq kg"1. Budući da tako stroge granice s aspekta analize rizikazapravo nisu opravdane, između ostaloga, radi se o protekcionističkim mjeramazaštite vlastitog tržišta.
Interesantno, od institucija koje su provodile mjerenja su se u praksi vrlorijetko tražile neke reference i dokazi o kvaliteti mjerenih rezultata. Situacija seposljednjih godina pomalo mijenja, te su neke zemlje počele upozoravati da ćepriznavati rezultate analiza samo onih laboratorija koji su akreditirani pomeđunarodnim normama. Uz to EU je još više snizila dopuštene vrijednosti zaradiocezij tako da za ukupnu aktivnost 137Cs i 134Cs u mlijeku i hrani dopuštenakoncentracija aktivnosti danas iznosi 370 Bq kg"' [3]. U tom se svjetlu valjazapitati što bi se desilo s izvozom poljoprivrednih proizvoda, pa i nekih drugihproizvoda iz Hrvatske, u one zemlje koje bi svoja tržišta, sasvim legitimno,odlučile zaštititi priznavajući nalaze samo akreditiranih laboratorija?
UMJERNI LABORATORIJIPouzdani umjerni (kalibracijski) dozimetrijski i slični laboratoriji bitan su
čimbenik pravilno ustrojenog sustava zaštite od zračenja neke države. Primjerice, uradiologiji i medicinskoj dijagnostici općenito, nepravilno umjerena mjerna opremai aparatura mogu dovesti do niza neželjenih, pa i po život opasnih posljedica.Također, u konačnici to može dovesti i do znatnog povećavanja kolektivne doze.Valja istaći da osim u medicini, problematika zaštite od ionizirajućeg ineionizirajućeg zračenja iziskuje i pouzdane mjeriteljske programe vezane uzizloženost pučanstva zračenju, profesionalnu izloženost, zaštitu okoliša, teindustrijske i slične primjene.
35
VI. simpozij HDZZ, Stubičke Toplice, 2005.
Posljednjih godina napretkom znanosti i tehnologije kao i minijaturizacijomelektronike pojavili su se novi sofisticirani uređaji i mjerni istrumenti. Međutim,interkomparacijama je ustanovljeno kako karakteristike, pouzdanost i odziv takvihnaprava uvelike ovisi ne samo o kvaliteti umjeravanja i uvjetima okoliša već i odozimetričaru. Odnosno, kvaliteta i pouzdanost mjerenja nije se bitnije povećalanapretkom mjerne tehnike [4]. To je u slučaju osobne dozimetrije dovelo douspostave posebnih akreditacijskih programa za osobe koje procesuiraju dozimetre.
Sva umjeravanja provedena u mjeriteljskim laboratorijima moraju biti uneprekinutom nizu sljediva sve do međunarodnih etalona i biti provedena pozahtjevima formalnog sustava kvalitete. Važan je zahtjev i izračun mjernihnesigurnosti [5,6].
INTER KOMPARACIJE I ISPITIVANJE OSPOSOBLJENOSTIKvaliteta programa zaštite od zračenja ne može biti veća od kvalitete
pripadnih mjerenja. Osiguranje kvalitete mjeranja postiže se i dokazujesudjelovanjem u tzv. MQA {Measurement Quality Assurance) interkomparacijskimprogramima. Takvi programi procjenjuju pogodnost određene procedure, prostorijui opremu, kao i periodičke akcije provjere cjelokupne osposobljenosti. Naročito suvažni i interkomparacijski testovi. Takve testove vezano uz područje ionizirajućegzračenja vrlo često organiziravaju Međunarodna agencija za atomsku energiju(IAEA), Međunarodna zdravstvena organizacija (WHO), a u posljednje vrijemečak i Europska komisija preko putem svog Instituta za referentne materijale imjeriteljstvo (IRMM). Također, takve testove na redovnoj bazi zajedničkiorganiziraju i Nuklearna alektrana Krško, Institut Ruđer Bošković i Institut zamedicinska istraživanja i medicinu rada.
ZAHTJEVI ZA OSPOSOBLJENOST LABORATORIJALaboratorij koji želi biti akreditiran mora u postupku ocjene osposobljenosti
za provedbu zatraženih ispitivanja zadovoljiti zahtjeve norme HRN EN ISO/IEC17025:2004. [7]. Ti se zahtjevi odnose na zahtjeve na upravljanje i na tehničkezahtjeve.
Zahtjevi na upravljanje opisani su u poglavlju 4. i odnose se na sustavupravljanja kvalitetom u laboratoriju. Navedeni zahtjevi temelje se na odrednicamanorma ISO 9001 i ISO 9002, a prilagođeni su specifičnim djelatostima ispitnih iumjernih laboratorija.
Zahtjevima na upravljanje obuhvaćeni su organizacija (tehnička uprava,odgovornosti za djelatnost laboratorija), sustav kvalitete (politika, ciljevi sustavakvalite, upravljanje dokumentima), postupak ugovaranja (uključene odgovorneosobe iz laboratorija), nabava (npr. kemikalije, referencijske tvari, umjeravanje,servisiranje opreme), nesukladan rad (postupanje u slučaju da se utvrdi da rad ilirezultati nisu u skladu s vlastitim pravilima), popravne i preventivne radnje(otklanjanje uzroka nesukladnosti i prevencija njihovog pojavljivanja), unutrašnje
36
VI. simpozij HDZZ, Stubičke Toplice, 2005.
ocjene (interna provjera svih zahtjeva norme), upravina ocjena (ocjenafunkcioniranja sustava od strane najviše uprave laboratorija)
Tehničkim zahtjevima opisanim u poglavlju 5. obuhvaćeno je osoblje(osposobljenost, odgovornosti, ciljevi i planovi obuke), prostor (prikladnost, izvorienergije, kontroliran pristup), metode ispitivanja (normirane/nenormirane,validacija, procjena mjerne nesigurnosti), oprema (raspoloživost, ispravnost,odgovornosti za rukovanje), mjerna sljedivost (umjeravanje u osposobljenimumjernim laboratorijima), uzorkovanje (planovi i postupci, statističke metode,zapisi), rukovanje uzorcima (prijevoz, prijem, označavanje, distribucija,skladištenje, čuvanje), osiguranje kvalitete rezultata ispitivanja(međulaboratorijska ispitivanja, referencijske tvari, ponovljena ispitivanja,kontrolne karte), prikazivanje rezultata (ispitni izvještaj, mišljenja i tumačenja,izmjene izvještaja)
STANJE U REPUBLICI HRVATKOJU Republici Hrvatskoj još niti jedan ispitni ili umjerni laboratorij koji se bavi
problematikom ionizirajućeg zračenja nema formalnu akreditaciju.Hrvatsko nacionalno akreditacijsko tijelo do sada je akreditiralo 33 ispitna
laboratorija za različite vrste ispitivanja (fizikalno-mehanička ispitivanjagrađevinskih proizvoda, kemijska i fizikalno-kemijska ispitivanja naftnihproizvoda i plina, fizikalno-kemijska ispitivanja namirnica i voda, ispitivanja vina ijakih alkoholnih pića, visokonaponska ispitivanja, ispitivanja namještaja, itd.) i 3umjerna laboratorija (sila kočenja, električne veličine).
Sustav akreditacije u Republici Hrvatskoj uspostavljen je i razvijen uDržavnom zavodu za normizaciju i mjeriteljstvo - Nacionalnoj službi zaovlašćivanje (DZNM-NSO) u skladu sa Zakonom o normizaciji [8]. Prvi postupciakreditacije provedem su tijekom 1997. godine, a u 1998. godini dodijeljene suprve ovlasnice (akreditacijske potvrde).
Pristupanjem Hrvatske Svjetskoj trgovinskoj organizaciji (WT0) isklapanjem Sporazuma o stabilizaciji i pridruživanju (SSP) s EU 2001. godine,Hrvatska je preuzela i obvezu usklađivanja svog zakonodavstva u područjutehničkih propisa, normizacije, ocjene sukladnosti akreditacije i mjeriteljstva stehničkom regulativom EU. U postupku usklađivanja, a u skladu s Nacionalnimprogramom RH za pridruživanje EU, u 2003. godini stupili su na snagu osnovnizakoni kojima se na usklađen način obrađuju navedena područja, među kojima je iZakon o akreditaciji [9].
Uredbom Vlade [10] definirana je uspostava nezavisnog akreditacijskogtijela, Hrvatske akreditacijske agencije (HAA), kao javne ustanove. Nova ustanovanastavit će s djelatnostima na akreditaciji koje je do sad provodio DZNM-NSO.
Od 1999. godine DZNM-NSO ima status pridružene članice EA {Europeanco-operation for Accreditation), regionalne organizacije koja okuplja nacionalna
37
VI. simpozij HDZZ, Stubičke Toplice, 2005.
akreditacijska tijela europskih zemalja i usklađuje pravila i rad tih tijela naeuropskoj razini.
Dobivanjem statusa zemlje kandidata za članstvo u EU u lipnju 2004. godineuklonjena je i formalna prepreka za primanje HAA-a u stalno članstvo EA-a.Postupak, koji uključuje ponovno ocjenjivanje HAA-a od strane nezavisnihocjenitelja EA-a, je u toku.
Osim na regionalnoj (europskoj) razini, HAA sudjeluje, u statusu pridruženečlanice, i u radu međunarodne organizacije s područja akreditacije, ILAC(International Laboratory Accreditation Cooperation).
Sudjelovanje predstavnika HAA-a u radu tijela EA-a i ILAC-a omogućujuHAA-u brz i kvalitetan transfer usklađenih postupaka i pravila akreditacije nanacionalnu razinu.
Na taj način HAA i njegovi rezultati (akreditacijske potvrde) postajuprepoznatljivi i na području izvan Hrvatske čime se ostvaruje osnovna pretpostavkaza prepoznatljivost i prihvatljivost izvještaja o ispitivanju koje izdaju laboratorijiakreditirani od strane HAA, a time izbjegava potreba za ponovnim ispitivanjem.
ZAKLJUČAKU Republici Hrvatskoj još niti jedan ispitni ili umjetni laboratorij koji se
bavi problematikom ionizirajućeg zračenja nema formalnu akreditaciju.Razvojem sve veće konkurencije, ali i zbog velikog interesa stručne i šire
javnosti za problematiku zaštite od zračenja, nuklearne sigurnosti i radioekologije,uočljiv je trend sve strožih standarda i propisa vezanih uz ta područja.
U postupku prilagodbe tehničkih propisa koji su na snazi Hrvatskoj sodgovarajućim propisima Europske Unije trebat će mijenjati i zakonske odredbe izpodručja zaštite od zračenja, uključivši i one koje se odnose na davanje ovlaštenjaza ispitivanja i izdavanje izvještaja od strane nadležnog ministarstva.
U postupku dodjele ovlaštenja za rad laboratorijima u zakonom propisanompodručju racionalno bi bilo iskoristiti postojeću akreditacijsku infrastrukturu,Hrvatsku akreditacijsku agenciju, koja je uspostavila i razvija na međunarodnojrazini prepoznatljiv sustav akreditacije laboratorija u Hrvatskoj.
LITERATURA[1] Franić. Z., Treba li unaprijediti postojeći sustav zaštite od zračenja? Sigurnost,
2002:44(2):109-121.[2] Anon., Nature, 1987;327:354 .[3] EEC Council Regulation No 737/90.[4] Council of Ionising Radiation Mesurements and Standards (CIRMS)
<http://www.cirms.org/library/NEEDS/3rd%20Oct%2001.pdf>[5] Upute za iskazivanje mjerne nesigurnosti, Državni zavod za normizaciju i
mjeriteljstvo, Zagreb, 1995.[6] Quantifying Uncertainty in Analytical Measurement, EURACHEM/CITAC Guide
CG 4, 2n d Ed, 2000.
38
VI. simpozij HDZZ, Stubičke Toplice, 2005.
[7] HRN EN ISO/IEC 17025:2004 Opći zahtjevi za osposobljenost umjemih i ispitnihlaboratorija (ISO/IEC 17025:1999; EN ISO/IEC 17025:2000), 2. izd, Državni zavodza normizaciju i mjeritreljstvo, Zagreb, 2004.
[8] Zakon o normizaciji, Narodne novine br. 55/96[9] Zakon o akreditaciji, Narodne novine br. 158/03[10] Uredba o osnivanju Hrvatske akreditacijske agencije, Narodne novine br. 158/04.
ACCREDITATION OF LABORATORIES IN THE FIELD OFRADIATION PROTECTION
Slobodan Galjanic and Zdenko Franić2
'State Office for Standardization and MetrologyUlica grada Vukovara 78, HR-10000 Zagreb, Croatia
institute for Medical Research and Occupational Health, Ksaverska c. 2HR-10000 Zagreb, Croatia
e-mail: [email protected], [email protected]
This paper gives a review of requirements and procedures for theaccreditation of test and calibration laboratories in the field of radiation protection,paying particular attention to Croatia. General requirements to be met by a testingor calibration laboratory to be accredited are described in the standard HRN ENISO/IEC 17025, "General requirements for the competence of testing andcalibration laboratories." The quality of a radiation protection programme can onlybe as good as the quality of the measurements made to support it. Measurementquality can be assured by participation in measurement assurance programmes thatevaluate the appropriateness of procedures, facilities, and equipment and includeperiodic checks to assure adequate performance. These also include internalconsistency checks, proficiency tests, intercomparisons and site visits by technicalexperts to review operations. In Croatia, laboratories are yet to be accredited in thefield of radiation protection. However, harmonisation of technical legislation withthe EU legal system will require some changes in laws and regulations in the fieldof radiation protection, including the ones dealing with the notification of testinglaboratories and connected procedures. Regarding the notification procedures fortesting laboratories in Croatia, in the regulated area, the existing accreditationinfrastructure, i.e. Croatian Accreditation Agency is ready for its implementation,as it has already established and further developed a consistent accreditationsystem, compatible with international requirements and procedures.
39
VI. simpozij HDZZ, Stubičke Toplice, HR0500025
SEKUNDARNI STANDARDNI DOZIMETR1JSKILABORATORIJ INSTITUTA "RUĐER BOŠKOVIĆ",
ZAGREB
Branko Vekić, Renata Ban i Saveta MiljanićInstitut "Ruder Bošković", Bijenička c. 54, 10000 Zagreb, Hrvatska
e-mail: [email protected]
UVODU skladu s preporukama Međunarodne agencije za atomsku energiju (IAEA)
[1], Sekundarni standardni dozimetrijski laboratorij (SSDL) jest zadovoljavajućeopremljen (prostor, oprema, kadar) laboratorij, kojeg odgovarajući upravni(državni) organ zadužuje (ovlašćuje) za održavanje sljedivosti dozimetrijskihjedinica unutar neke zemlje, u skladu s međunarodnim standardima. Dakle, SSDLmora biti zadovoljavajuće opremljen sekundarnim standardima s osiguranomsljedivosti prema nekom od primarnih standardnih dozimetrijskih laboratorija(PSDL) iz međunarodnog mjeriteljskog sustava, ili direktno prema Međunarodnomuredu za mjere i utege (BIPM).
Važnost točnih i međunarodno sljedivih dozimetrijskih vrijednosti uradioterapiji postoji od ranih šezdesetih godina dvadesetog stoljeća. Krajem togstoljeća sve veća pozornost se posvećuje zaštiti pacijenata u dijagnostičkojradiologiji [2], jer je nepouzdanost dozimetrije značajno veća nego u radioterapiji,a doprinos dijagnostičke radiologije (i nuklearne medicine) ukupnom ozračenjucjelokupnog stanovništva značajno je viši od onog u raditerapiji.
Medicinska primjena izvora ionizirajućih zračenja u Hrvatskoj zadnjevrijeme je u značajnom porastu. Posebno se to odnosi na terapiju zračenjem (6teleterapijskih izvora 60Co u uporabi, gamma-knife, 7 linearnih akceleratora uuporabi, nekoliko starijih uređaja za terapiju na bazi X - zračenja, tipa RT-100 iDERMOPAN su također u uporabi), ali i na dijagnostičku radiologiju, gdje jeznačajan broj CT uređaja i različitih dijagnostičkih rendgenskih uređaja (dijelomzastarjelih, dob više od 10, čak i više od 20 godina) u svakodnevnoj uporabi. Svesu to opravdani razlozi za "hitno" uvođenje programa kontrole kvalitete iosiguranja kvalitete (QC i QA) dozimetrije u Hrvatskoj, za stoje zadovoljavajućeopremljeni SSDL jedan od bitnih preduvjeta.
U skladu s odredbama zakona o zaštiti od ionizirajućih zračenja [3] ipratećih propisa "rendgenski uređaj, akcelerator ili zatvoreni radioaktivni izvormora biti etaloniran (umjeren) tako da se za svaki odabir veličina određenihplanom zračenja može odrediti doza koju je primio pacijent tijekom terapije".Nadalje, "uređaji za mjerenje ionizirajućih zračenja koji se rabe tijekomradioterapije za umjeravanje ili utvrđivanje razine zračenja u okolišu morajuudovoljavati uvjetima propisa o mjeriteljstvu" [4,5].
40
VI. simpozij HDZZ, Stubičke Toplice, 2005.
Hrvatska, "nedavno" uspostavljena kao neovisna država, postupno preuzimasvoje obveze u području metrologije. Kao jedan od prioriteta iskristalizirala sepotreba za formiranjem nacionalne ustanove za kalibraciju (umjeravanje)dozimetrije u Hrvatskoj, prvenstveno u odjelima (zavodima) za radioterapiju idijagnostiku, ali i u zaštiti od zračenja (osobna dozimetrija i kalibracija različitihuređaja koji se koriste u zaštiti od zračenja, kao i sva mjerenja radioaktivnosti),dozimetriji pri primjeni izvora zračenja za radijacijsku sterilizaciju, i/ili radijacijskuobradu potrepština; u biti formiranje Sekundardnog standardnog dozimetrijskoglaboratorija (SSDL).
Zahvaljujući razumijevanju Instituta "Ruđer Bošković" (osiguranodgovarajući prostor), Državnog zavoda za normizaciju i mjeriteljstvo(uključivanje u međunarodni projekt "Unaprjeđenje mjeriteljske infrastrukture uRH"), te zahvaljujući razumijevanju Ministarstva zdravstva i socijalne skrbi iDržavnog zavoda za zaštitu od zračenja (dali podršku za dobivanje značajnetehničke pomoći Međunarodne agencije za atomsku energiju), stvoreni su uvjeti zaosnivanje SSDL-a na Institutu "Ruđer Bošković". Osnovni zadaci SSDL-a su:
- verifikacija (ovjera) instrumenata za mjerenje zračenja,- uspostava, usporedba i održavanje veze hrvatskog sustava za mjerenje doza
zračenja s međunarodnim sustavom mjerenja doza zračenja.
RADNI PROSTORZa potrebe Sekundarnog standardnog dozimetrijskopg laboratorija osiguran
je odgovarajući prostor u KRILU X (za kalibracijske izvore zračenja i pratećuinfrastrukturu). Prostor je uređen u skladu s normativima za rad takvoglaboratorija, točnije rečeno u skladu s normativima Međunarodne agencije zaatomsku energiju (IAEA). To znači da zidovi i vrata imaju zadovoljavajuću zaštitu(zadovoljavajuća zaštitna moć zidova i vrata, video nadzor iz kontrolnih soba,automatsko isključivanje uređaja u slučaju neovlaštenog / nekontroliranog ulaska,dvostruka neovisna zaštita), a prostorije zadovoljavajuću klimatizaciju (20 ± 2°C).
Sekundarni standardni dozimetrijski laboratorij (SSDL) Instituta "RuđerBošković", Zagreb sastoji se od 2 prostorije, kao stoje prikazano na Slikama 1 i 2.Na Slici 1 prikazanje položaj zatvorenih kalibracijskih izvora 60Co i 137Cs (zajednos kalibracijskim stolom duljine 6 m, između navedenih izvora), a na Slici 2prikazanje položaj kalibracijskog rendgena s kalibracijskim stolom duljine 5 m.
41
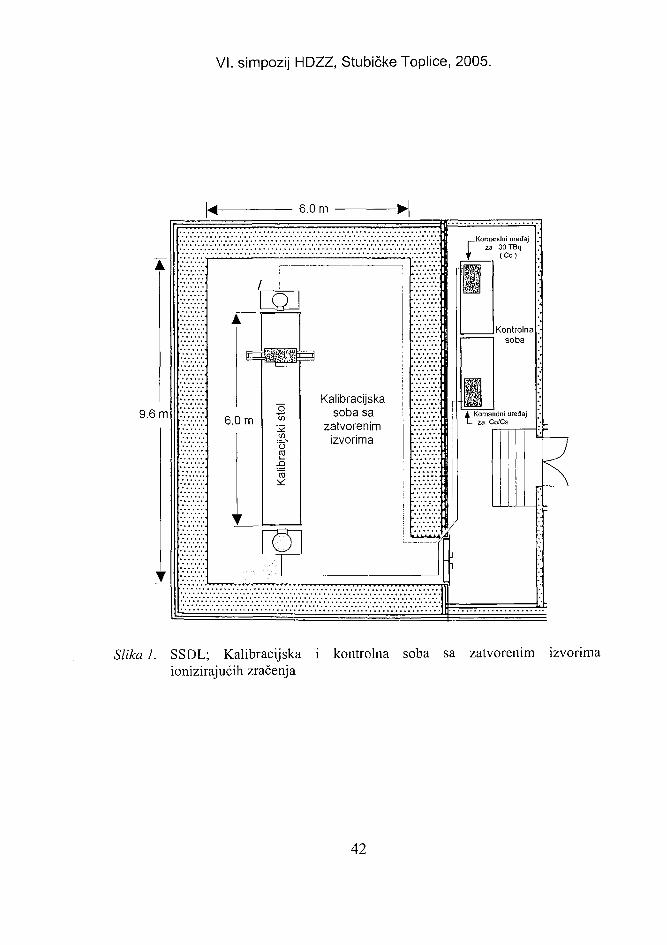
VI. simpozij HDZZ, Stubičke Toplice, 2005.
6.0 m
9.6 m 6.0 moto
oTO
Kalibracijskasoba sa
zatvorenimizvorima
-Komandni uređajza 3OTBq
(Co)
Kontrolnasoba
, Komandni uređaj- za Co/Cs
Slika 1. SSDL; Kalibracijska i kontrolna soba sa zatvorenim izvorimaionizirajućih zračenja
42
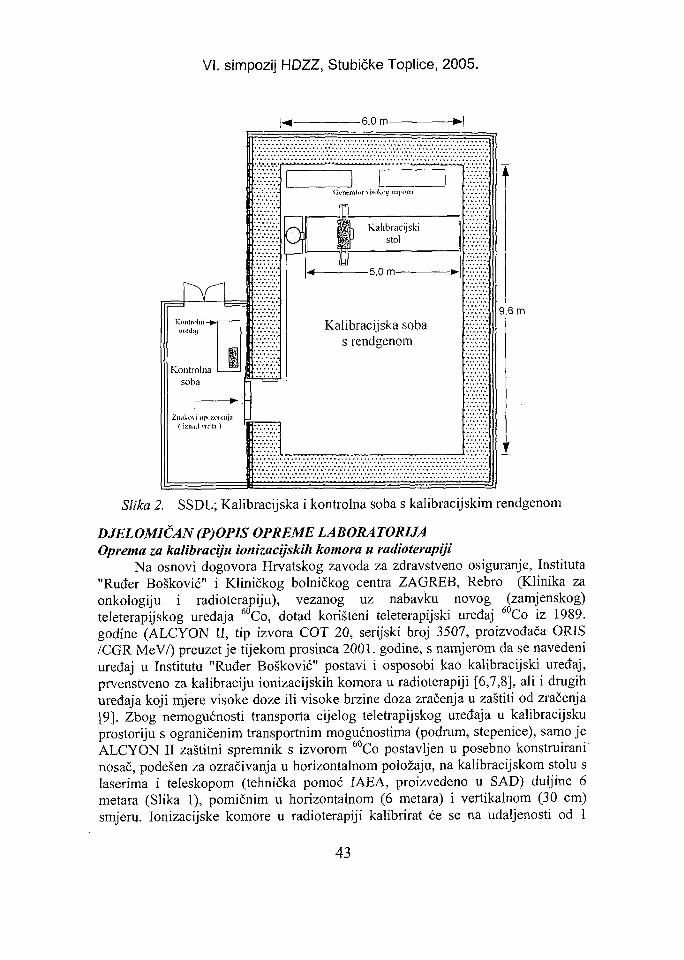
VI. simpozij HDZZ, Stubičke Toplice, 2005.
I-«- -6.0 m-
Kontrolnasoba
Ziwko\i upozorenja( izn;ul vrjila )
Generator \isokns napona
Kalibracijsldstol
-5.0 m-
Kalibracijska sobas rendgenom
9.6 m
Slika 2. SSDL; Kalibracijska i kontrolna soba s kalibracijskim rendgenom
DJELOMIČAN (P)OPIS OPREME LABORATORIJAOprema za kalibraciju ionizacijskih komora u radioterapiji
Na osnovi dogovora Hrvatskog zavoda za zdravstveno osiguranje, Instituta"Ruđer Bošković" i Kliničkog bolničkog centra ZAGREB, Rebro (Klinika zaonkologiju i radioterapiju), vezanog uz nabavku novog (zamjenskog)teleterapijskog uređaja 60Co, dotad korišteni teleterapijski uređaj 60Co iz 1989.godine (ALCYON II, tip izvora COT 20, serijski broj 3507, proizvođača ORIS/CGR MeV/) preuzet je tijekom prosinca 2001. godine, s namjerom da se navedeniuređaj u Institutu "Ruđer Bošković" postavi i osposobi kao kalibracijski uređaj,prvenstveno za kalibraciju ionizacijskih komora u radioterapiji [6,7,8], ali i drugihuređaja koji mjere visoke doze ili visoke brzine doza zračenja u zaštiti od zračenja[9]. Zbog nemogućnosti transporta cijelog teletrapijskog uređaja u kalibracijskuprostoriju s ograničenim transportnim mogućnostima (podrum, stepenice), samo jeALCYON II zaštitni spremnik s izvorom 60Co postavljen u posebno konstruirani'nosač, podešen za ozračivanja u horizontalnom položaju, na kalibracijskom stolu slaserima i teleskopom (tehnička pomoć IAEA, proizvedeno u SAD) duljine 6metara (Slika 1), pomičnim u horizontalnom (6 metara) i vertikalnom (30 cm)smjeru. Ionizacijske komore u radioterapiji kalibrirat će se na udaljenosti od 1
43
VI. simpozij HDZZ, Stubičke Toplice, 2005.
metar, a ostala oprema na udaljenosti do 6 metara. Aktivnost izvora 60Co (prosinac2004.) bila je 30 TBq.
Za potrebe kalibracije ionizacijskih komora u radioterapiji, Institut "RuđerBošković" kalibrirao je vlastitu opremu u Primarnom standardnom dozimetrijskomlaboratoriju, kako slijedi:- PTW UNIDOS UNIVERSAL DOSEMETER, Type 10002, ser. br. 20164,
proizvođač PTW Freiburg (kalibriran u PTB, Braunschweig, travnja 2004.),- Farmer type ionisation chamber 0.6 cm3, W30002, ser. br. 0115, proizvođač
PTW, Freiburg, (kalibrirana u PTB, Braunschweig, travnja 2004.),- Farmer Dosemeter, Type 2570/1B, ser. br. 978, proizvođač NE Technology, UK,- Farmer type ionisation chamber 0.6 cm3, NE2581, ser. br. 848, proizvođač NE
Technology, UK, a u fazi isporuke je- Farmer type ionisation chamber 0.6 cm3, Type NE2571A, proizvođač NE
Technology, UK,te odgovarajući fantomi, kako slijedi:- Water phantom for horizontal beams, Type 4322 (30 x 30 x 30 cm3, PMMA
walls), PTW Freiburg, ser. br. 008,- Solid phantom (20 x 20 x 15 cm3, PMMA), PTW Freiburg, Type 2996,- Water phantom for calibrations and checks. 20 x 20 x 10 cm3, PMMA walls,
including holder fixed at a depth of 5 cm for a Farmer ionisation chamber (natestiranju u SSDL-IAEA).
Oprema za kalibraciju uređaja u zaštiti od zračenjaZahvaljujući tehničkoj pomoći IAEA, tijekom srpnja 2004. dobiven je i
postavljen kalibracijski uređaj proizvođača Hopewell Designs, Inc., SAD, ser. broj504-441, koji sadrži slijedeća 2 zatvorena izvora: (1.) 137Cs (ser. broj 1234,aktivnosti /veljača 2004./ od 740 GBq), te (2.) L37Co (ser. broj 0241 HB, aktivnosti/veljača 2004./ od 185 GBq). Navedeni uređaj je isporučen s tri kolimatora (jedanfiksni, 2 pomična), u skladu s ISO-4037, za zadovoljavajuće mijenjanje promjerapolja zračenja, te sa tri atenuatura, koji intenzitete zračenja niCs smanjuju za faktorod 10, 100 i 1000 puta. Ovaj uređaj je postavljen s druge strane istog, 6 metaradugačkog kalibracijskog stola (Slika 1). U skladu s navedenim uvjetimaozračivanja, ispunjeni su svi zahtjevi ISO-4037 standarda [10] za kalibracijuopreme koja se koristi za potrebe zaštite od zračenja [9).
Za potrebe kalibracije opreme koja se koristi u zaštiti od zračenja, Institut"Ruđer Bošković" kalibrirao je vlastitu opremu u Primarnom standardnomdozimetrijskom laboratoriju, ili Sekundarnom standardnom dozimetrijskomlaboratoriju IAEA, kako slijedi:- PTW UNIDOS UNIVERSAL DOSEMETER, Type 10002, kalibriran u SSDL-
IAEA, tijekom svibnja 2004.,- PTW 32002 Spherical 1000 cm3 chamber LS01, kalibrirana u SSDL-IAEA
tijekom svibnja 2004.,
44
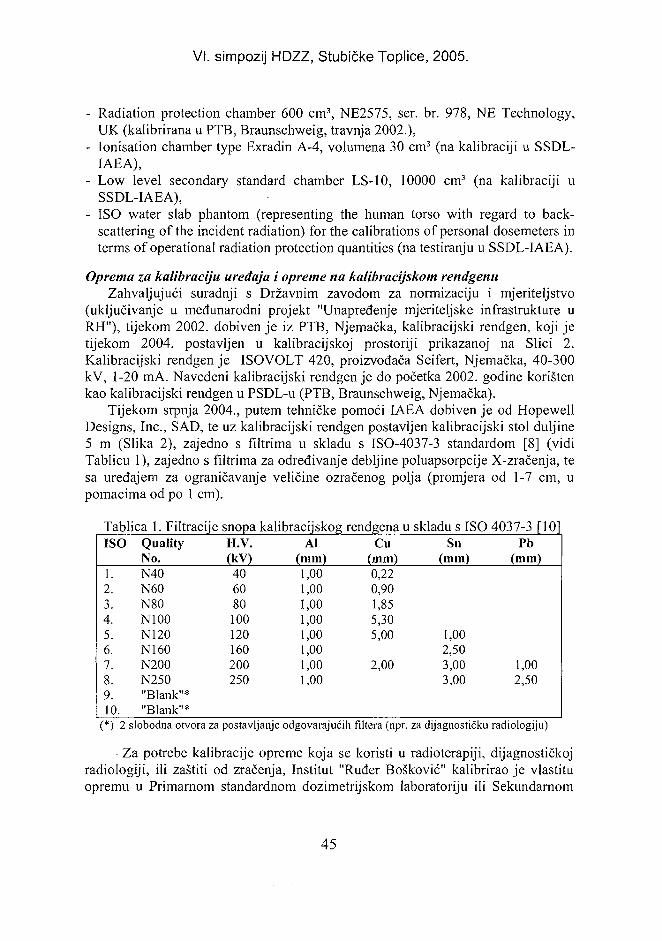
VI. simpozij HDZZ, Stubičke Toplice, 2005.
- Radiation protection chamber 600 cm3, NE2575, ser. br. 978, NE Technology,UK (kalibrirana u PTB, Braunschweig, travnja 2002.),
- Ionisation chamber type Exradin A-4, volumena 30 cm3 (na kalibraciji u SSDL-IAEA),
- Low level secondary standard chamber LS-10, 10000 cm3 (na kalibraciji uSSDL-IAEA),
- ISO water slab phantom (representing the human torso with regard to back-scattering of the incident radiation) for the calibrations of personal dosemeters interms of operational radiation protection quantities (na testiranju u SSDL-IAEA).
Oprema za kalibraciju uređaja i opreme na kalibracijskom rendgenuZahvaljujući suradnji s Državnim zavodom za normizaciju i mjeriteljstvo
(uključivanje u međunarodni projekt "Unapređenje mjeriteljske infrastrukture uRH"), tijekom 2002. dobiven je iz PTB, Njemačka, kalibracijski rendgen, koji jetijekom 2004. postavljen u kalibracijskoj prostoriji prikazanoj na Slici 2.Kalibracijski rendgen je ISOVOLT 420, proizvođača Seifert, Njemačka, 40-300kV, 1-20 mA. Navedeni kalibracijski rendgen je do početka 2002. godine korištenkao kalibracijski rendgen u PSDL-u (PTB, Braunschweig, Njemačka).
Tijekom srpnja 2004., putem tehničke pomoći IAEA dobiven je od HopewellDesigns, Inc., SAD, te uz kalibracijski rendgen postavljen kalibracijski stol duljine5 m (Slika 2), zajedno s filtrima u skladu s ISO-4037-3 standardom [8] (vidiTablicu 1), zajedno s filtrima za određivanje debljine poluapsorpcije X-zračenja, tesa uređajem za ograničavanje veličine ozračenog polja (promjera od 1-7 cm, upomacima od po 1 cm).
Tablica 1. FiltracijeISO
1.2.3.4.5.6.7.8.9.10.
QualityNo.N40N60N80N100N120N160N200N250"Blank"*"Blank"*
snopaH.V.(kV)
406080100120160200250
kalibracijskog rendgena uAl
(mm)1,001,001,001,001,001,001,001,00
Cu(mm)0,220,901,855,305,00
2,00
skladu s ISOSn
(mm)
1,002,503,003,00
4037-3 [10]Pb
(mm)
1,002,50
(*) 2 slobodna otvora za postavljanje odgovarajućih filtera (npr. za dijagnostičku radiologiju)
Za potrebe kalibracije opreme koja se koristi u radioterapiji, dijagnostičkojradiologiji, ili zaštiti od zračenja, Institut "Ruđer Bošković" kalibrirao je vlastituopremu u Primarnom standardnom dozimetrijskom laboratoriju ili Sekundarnom
45
VI. simpozij HDZZ, Stubičke Toplice, 2005.
standardnom dozimetrijskom laboratoriju IAEA (vidi ranije navedenu opremu),kako slijedi:- Soft X ray ionisation chamber 0.02 cm3 W23342-1126 (kalibrirana u PTB,
Braunschweig, travnja 2004.).- Soft X ray ionisation chamber 0.2 cm3 W23344-0722 (kalibrirana u PTB,
Braunschweig, travnja 2004.).- Electrometer measurements system composed of: Keithley electrometer type
6517A, model 6171.- LabView 7.1 Full Dev Systems for Windows (p.n. 776670-09)- Interface for the electrometer measuring system composed of: PCI-GPIB
Controller for PCI (p.n. 778032-01), NI PCI-6601 Counter/Timer card (p.n.777918-01), SCB-68 shielded I/O connector block (p.n. 776844-01), R6868Ribbon I/O cable (p.n. 182482-01)
Oprema za kalibraciju uređaja i opreme u brahiterapijiZahvaljujući tehničkoj pomoći IAEA, u Sekundarnom standardnom
dozimetrijskom laboratoriju Instituta "Ruder Bošković" nabavljena je odgovarajućaoprema za kalibraciju zatvorenih izvora l37Cs i 192Ir koji se koriste u brahiterapiji.Za razliku od ostale, naprijed navedene opreme SSDL-a, kad korisnik (naručitelj)opremu donosi u SSDL radi kalibracije, ova oprema je prijenosnog tipa,predviđena za donošenje korisniku i kalibraciju brahiterapiskih izvora na lokacijikorisnika.
Za potrebe kalibracije zatvorenih brahiterapijskih izvora 137Cs i 192Ir, SSDLInstitut "Ruđer Bošković" osigurao je opremu, kako slijedi:
- Brachytherapy well chamber HDR 1000 Plus (type 90008), 70010 HDRsource holder 2.2 mm dia., 10 m cable, TNC connector, and the following:80010 ADCL calibration for HDR 192lr, 70020 source holder for 137Cs, 5 mmdia., 80020 ADCC calibration for l37Cs.
- Electrometer capable of measuring charge and current for HDR l92Ir, LDRl 9 2Ir and LDR 137Cs sources, compatible with chamber above.
Posebna napomenaU nastojanju da se izbjegnu bilo kakvi nesporazumi zbog prijevoda naziva opreme nahrvatski, sva oprema u ovom dijelu rada navedena je na originalnom (engleskom) jeziku.
SUSTAV KAKVOĆEU okviru sustava kakvoće Sekundarni standardni dozimetrijski laboratorij
(Laboratory for Dosimetry) Instituta "Ruder Bošković", Zagreb, načinio je, tekrajem prosinca 2004. dostavio u PTB odnosno DKD "Quality Manual" (QM),zajedno s odlukama o imenovanjima odgovornih osoba (voditelj laboratorija,zamjenik voditelja laboratorija, osoba zadužena za kontrolu kvalitete u laboratorijui na Institutu), načina kalibracije (Method of Calibration), određivanja mjernenesigurnosti (Measurement Uncertainty), popisom opreme, te svih radnih protokola
46
VI. simpozij HDZZ, Stubičke Toplice, 2005.
izrađenih u skladu s HRN EN ISO/IEC 17025:2000 norme, radi akreditacije putemakreditacijske ustanove, članice EA [11].
Akreditacija putem EA akreditacijske ustanove (DKD) je u tijeku. Tijekomove (2005.) godine očekuje se, od strane IAEA/WHO, isporuka preostale opreme,te uključivanje ovog, Sekundarnog standardnog dozimetrijskog laboratorijaInstituta "Ruđer Bošković", Zagreb, u mrežu SSDL ovlaštenih putem IAEA iWHO.
SUDJELOVANJE U PROJEKTIMA EUROMETA I BILATERALNIMPROJEKTIMA
U pripremi je novi EUROMET project (br. 813; "Comparison of air kermaand absorbed dose to water measurements of 60Co radiation in radiotherapy"), kojise planira za slijedeće 2 godine i u kojem će naš SSDL (tijekom 2006.) sudjelovati.
Nadalje, IAEA je organizirala (siječanj 2005.) interkomparaciju u područjuzaštite od zračenja (izvor 137Cs, D=5 mGy) u kojem je naš SSDL tijekom siječnja2005. sudjelovao (konačne rezultate čekamo).
LITERATURA[1] International Atomic Energy Agency (IAEA)AVorld Health Organisation (WHO)
IAEA SSDL Network Charter, IAEA/WHO Network of secondary standarddosimetry laboratories, Vienna: IAEA; 1999.
[2] International Atomic Energy Agency (IAEA). International Basic Safety Standardsfor Protection against Ionizing Radiation and for the Safety of Radiation Sources.Safety Series No. 115. Vienna: IAEA; 1996.
[3] Zakon o zaštiti od ionizirajućih zračenja, Narodne novine, br. 27/99 i 173/03.[4] Pravilnik o primjeni izvora ionizirajućih zračenja u medicini i stomatologiji,
Narodne novine br. 113/99.[5] Naredba o mjerilima nad kojima se provodi mjeriteljski nadzor, Narodne novine, br.
100/03.[6] International Atomic Energy Agency (IAEA). Absorbed Dose Determination in
Photon and Electron Beams, An International Code of Practice. TRS No. 277.Vienna: IAEA; 1987. (2nd edition 1997).
[7] International Atomic Energy Agency (IAEA). The Use of Plane Parallelal IonizationChambers in High Energy Electron and Photon Beams, An International Code ofPractice. TRS No. 115. Vienna: IAEA; 1996.
[8] International Atomic Energy Agency (IAEA). Absorbed Dose Determination inExternal Beam Radiotherapy, An International Code of Practice for DosimetryBased on Standards of Absorbed Dose in Water. TRS No. 398. Vienna: IAEA; 2000.
[9] International Atomic Energy Agency (IAEA). Calibration of Radiation ProtectionMonitoring Instruments. Safety Reports Series No. 16. Vienna: IAEA; 2000.
[10] International Organization for Standardization. X and gamma reference radiation forcalibrating dosemeters and doserate meters and for diterming their response as afunction of photon energy (Part 1: Radiation characteristics and productionmethods: 1996; Part 2: [1 l]Dosimetry for radiation protection over the energy ranges8 keV to 1,3 MeV and 4 MeV to 9 MeV: 1997; Part 3: Calibration of area and
47
VI. simpozij HDZZ, Stubičke Toplice, 2005.
personal dosemeters and the measurement of their response as a function of energyand angle of incidence: 1999; ISO 4037-1,2,3. Geneve: ISO; 1996-1999.
[11] HRN EN ISO/IEC 17025 Requirements: General requirements for the competenceof testing and calibration laboratories.
SECONDARY STANDARD DOSIMETRY LABORATORY ATTHE RUDER BOŠKOVIĆ INSTITUTE, ZAGREB
Branko Vekić, Renata Ban and Saveta MiljanićRuder Bošković Institute, Bijenička c. 54, HR-I0000 Zagreb, Croatia
e-mail: [email protected]
The Secondary Standard Dosimetry Laboratory at Ruder Bošković Institute, Zagreb,Croatia, was set up a few years ago. Its establishment was strongly supported by theInternational Atomic Energy Agency (IAEA) through the Technical Cooperation Project(CRO 1/004/; Establishing Calibration Services). In the country, this Technical CooperationProject was supported by the State Office for Standardization and Metrology, State Institutefor Radiation Protection and the Ministry of Health. The Secondary Standard DosimetryLaboratory at Ruder Bošković Institute was set up in two calibration rooms. Bothcalibration rooms are 9.6 metres long and 6 metres wide. Both are properly air conditioned.Their concrete walls are 1 metre and the entrance doors are protected by Pb to prevent ofradiation in control rooms, neighbouring rooms and in environment. In the first calibrationroom placed in the basement two sealed sources share the same six metre long calibrationbench (produced by Hopewell Designs, Inc., USA). On one side there is a 30 TBq Co-60source (December 2004) for the calibration of radiotherapy ionising chambers and otherequipment in the field of high dose rate range. On the other side there is a radiation unitconsisting of two sealed sources for radiation protection purposes: a 137Cs-source with theactivity of 740 MBq (February 2004) and a 60Co source with the activity of 185 MBq(February 2004). This second source is equipped with three attenuators yielding a tenfold, ahundredfold and a thousandfold attenuation. The second calibration room, placed justabove the first, accommodates one X-ray unit (gift from PTB, Germany, ISOVOLT 420,40-300 kV, 1-20 mA). In front of the X-ray tube there are: (1) aperture wheel assemblydesigned to modify the beam diameter of the X-ray to meet various beam configurationsrequired for calibration instruments, (2) a set of filter assembly to produce beam definitionas called for in the ISO 4037-3, (3) the Half-Value Layer Kit, and (4) a five metre longcalibration bench (produced by Hopewell Designs, Inc., USA). All ionisation chambers andelectrometers used in SSDL are calibrated in the Primary Standard Dosimetry Laboratory(PTB, Germany) or in the Secondary Standard Dosimetry Laboratory of the InternationalAtomic Energy Agency.
48
VI. simpozij HDZZ, Stubičke Toplice, i HR0500026
IMPLEMENTATION OF THE 96/29/EURATOM ININDUSTRY
Helena JanžekovičSlovenian Nuclear Safety Administration
Železna cesta 16, 1001 Ljubljana, Sloveniae-mail: [email protected]
INTRODUCTIONThe European Directive 96/29/EURATOM [1] set up in 1996 a series of
specific requirements related to a safe use of radiation sources and also to theexposure of a member of the public and workers. The implementation of theserequirements based on the ICRP 60 [2] is reflected in comprehensive radiationprotection measures at the user site in industry as well as in a practice of regulatoryauthority.
DIRECTIVE 96/29/EURATOMThe European Union published the first radiation protection directive already
in 1959 in order to standardise the protection of workers and public in theEuropean Union. This directive was revised six times in the period from 1959 to1984 when the Directive 84/467/ was adopted. The last revision was promoted bythe fact that the International Commission on Radiation Protection published theRecommendations [2] in 1990 based on new scientific knowledge.
The Directive entered into force in 2000. An analysis of the implementationof the 96/29/EURATOM Directive in European Countries given in [3] andpublished in 2002 showed that the full implementation of the 96/29/EURATOMDirective into national regulations was far from what it was to be achieved at thattime. The analysis also showed that the principles of justification, optimisation anddose limitations were translated in a consistent manner.
The cause for difficulties in the harmonisation procedure could be found inthe fact that radiation protection is a comprehensive system of measures whichshould be valid in a normal use of ionising radiation as well as in case ofemergencies. In addition the analysis of the use of ionising radiation shows anexceptional diversity in practice as well as in physical characteristics of a source[4]. All the above mentioned component should be taken into account in order tomake out an effective system of regulatory control [5]. In addition, the Directivealso introduces some basic changes in radiation protection, for example thecancellation of classification of around 800 nuclides in four groups based onradiotoxity.
Slovenia issued the Act on Protection against Ionising Radiation andNuclear Safety which entered into force in 2002 (the 2002 Act). It was established
49
VI. simpozij HDZZ, Stubičke Toplice, 2005.
according to the EU basic safety standards, particularly on the 96/29/EURATOMDirective. The implementation of the 96/29/EURATOM Directive by the 2002 Actand by regulations which were subsequently published could be categorised intotwo groups, new instruments and updated old instruments.
The most important new instruments are:reporting an intention to carry out a practiceprior authorisationarea classification and definitions of a supervised and controlled arearadiation protection of apprenticespreparation of a written document about an evaluation of the protectionof exposedconcept of qualified expertsconcept of clearance levels.
Among updated old instruments which were known in the Slovenianlegislation before publishing the 2002 Act are radiation protection of apprentices,students, breastfeeding women an pregnant women, dose limit of a member of thepublic, workers, classification of workers into A and B groups etc. Updating of theinstruments in some cases lead to more severe radiation protection measures as forexample the limitation of the annual dose limit for workers from 50 mSv to 20mSv. In other cases the relaxation of measurers was achieved by updating theradiation protection instruments as for example the health surveillance of workerscategorised B who are examined every 3 years and not every year as requiredbefore the implementation of the 96/29/EURATOM Directive.
IMPLEMENTATION OF THE 96/29/EURATOM IN INDUSTRYThe inventory of radiation sources used in Slovenia includes besides the
nuclear power plant a few hundred sources [6] as for example radioisotopes and X-ray machines used in industrial radiography, level gauges, thickness gauges,moisture gauges, density gauges. The implementation of the 96/29/EURATOMDirective in Slovenia is reflected in radiation protection measures which affectpractice of users. The basic changes are connected to:
a system of reporting an intentionclassification of a working area.
System of reporting an intentionThe reporting an intention is a new legislative instrument related to a use of
radioactive sources. It means submitting a document for notifying the competentministry about the intention to carry out a practice involving radiation or using aradiation source. The purpose of the implementation of a reporting system is toenable the regulatory authority and a user to implement an efficient authorisationprocedure based on basic data submitted in the reporting document. Table 1 givesthe basic data required for notification of a practice to a regulatory authority.
50
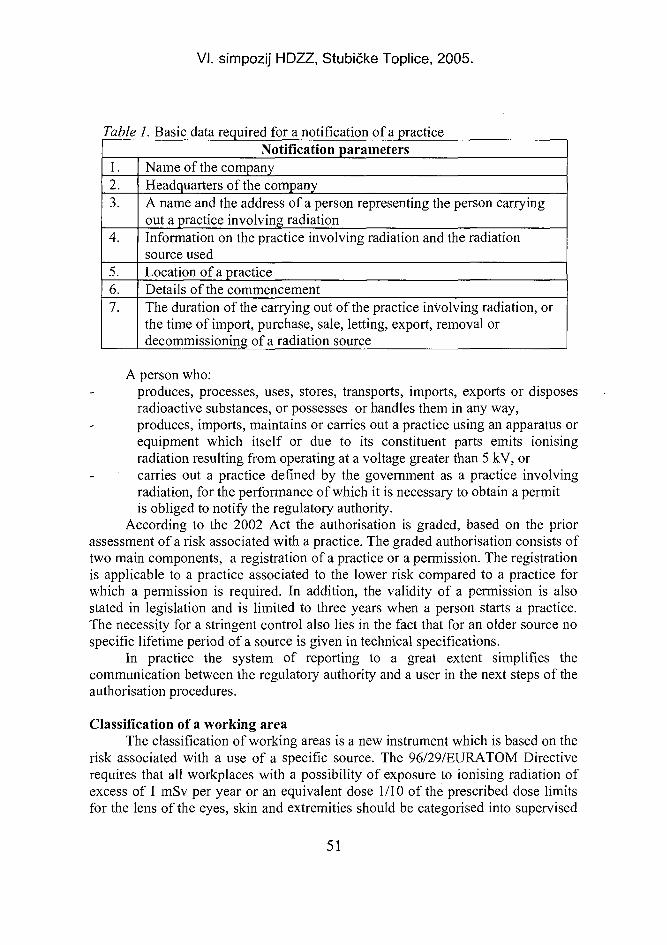
VI. simpozij HDZZ, Stubičke Toplice, 2005.
Table 1. Basic data required for a notification of a practiceNotification parameters
1.2.3.
4.
5.6.7.
Name of the companyHeadquarters of the companyA name and the address of a person representing the person carryingout a practice involving radiationInformation on the practice involving radiation and the radiationsource usedLocation of a practiceDetails of the commencementThe duration of the carrying out of the practice involving radiation, orthe time of import, purchase, sale, letting, export, removal ordecommissioning of a radiation source
A person who:produces, processes, uses, stores, transports, imports, exports or disposesradioactive substances, or possesses or handles them in any way,produces, imports, maintains or carries out a practice using an apparatus orequipment which itself or due to its constituent parts emits ionisingradiation resulting from operating at a voltage greater than 5 kV, orcarries out a practice defined by the government as a practice involvingradiation, for the performance of which it is necessary to obtain a permitis obliged to notify the regulatory authority.
According to the 2002 Act the authorisation is graded, based on the priorassessment of a risk associated with a practice. The graded authorisation consists oftwo main components, a registration of a practice or a permission. The registrationis applicable to a practice associated to the lower risk compared to a practice forwhich a permission is required. In addition, the validity of a permission is alsostated in legislation and is limited to three years when a person starts a practice.The necessity for a stringent control also lies in the fact that for an older source nospecific lifetime period of a source is given in technical specifications.
In practice the system of reporting to a great extent simplifies thecommunication between the regulatory authority and a user in the next steps of theauthorisation procedures.
Classification of a working areaThe classification of working areas is a new instrument which is based on the
risk associated with a use of a specific source. The 96/29/EURATOM Directiverequires that all workplaces with a possibility of exposure to ionising radiation ofexcess of 1 mSv per year or an equivalent dose 1/10 of the prescribed dose limitsfor the lens of the eyes, skin and extremities should be categorised into supervised
51
VI. simpozij HDZZ, Stubičke Toplice, 2005.
or controlled areas. No operational quantities are given in the 96/29/EURATOMDirective. The Slovenian legislation gives a detailed definition of a controlled areaapplicable to the industry as given in Table 2.
Table 2. Definition of controlied and supervised areasControlled area
Annual occupational effective dose > 6 mSvAnnual equivalent dose for lens of the eye >45 mSvAnnual equivalent dose for the skin, palm of hand, hand or forearm > 150 mSvThe average dose rate in 8 hours >=3 micro Sv/hThe instantaneous dose rate >= 60 micro Sv/hThe significant risk associated to a spread of a contamination exist
Supervised areasThe average dose rate in 8 hours >0.5 micro Sv/h and < 3 micro Sv/hThe instantaneous dose rate >3 micro Sv/h and < 60 micro Sv/hThe restriction of an area is not required but monitoring is necessary
The classification of an area in industry is a comprehensive task which isdone with help of a qualified expert. Moreover, once a workplace is classified as acontrolled or supervised area additional measures should be put in place, morestringent measures related to radiation protection in controlled areas. Some of themeasures are of administrative nature as for example the working instructions foruse of a source but some pose a demanding task for a user as for example therequirements for a strict control of the entrance and exit from the controlled area.
CONCLUSIONSThe harmonisation of legislation in Slovenia with the Council Directive
96/29/EURATOM which was carried out in the last years introduced some newconcepts in the regulatory framework i.e. reporting and at the same time updatingsome of the old concepts i.e. dose limits. The implementation of the harmonisationis based on the risk informed analysis of technical specifications of a particularsource or a practice as well as radiation protection. The analysis required a higherlevel of knowledge at both sides, the regulatory as well as the user sides in theindustry. The implementation of new instruments as well as the updated oldinstruments leads to more effective control of sources and practices.
52
VI. simpozij HDZZ, Stubičke Toplice, 2005.
REFERENCES[1] The Council of the European Union, Council Directive of 13 May 1996 Laying
down Basic Safety Standards for the Protection of the Health of Workers and theGeneral Public against the Danger Arising from Ionising Radiation, CouncilDirective 96/29/Euratom, Official Journal European Communities L 349, 21-25(1996).
[2] International Commission on Radiological Protection, 1990 Recommendations ofthe International Commission on Radiological Protection, ICRP Publication 60,Pergamon Press (1991).
[3] C. Lefaure, P. Croiiail, Implementation of the Basic Safety Standards in theRegulations of European Countries, 3rd ISOE European Workshop on OccupationalExposure Management at NPPs, Portorož, Slovenia, 17-19 April (2002).
[4] International Atomic Energy Agency, Categorisation of Sources, IAEA-TECDOC-1344, IAEA, Vienna (2003).
[5] H. Janžekovič, M. Krizman, B. Vokal, Z. Petrovič, Categorisation of Practices andSources - a Key Issue in Licensing Process, 11th International Congress of theInternational Radiation Protection Association, Madrid 23.-28.05.2004, CD IRPA11, Madrid (2004).
[6] Slovenian Nuclear Safety Administration, Nuclear and Radiation Safety in Slovenia,Annual Report 2001, Ljubljana (2002).
ABSTRACTThe European directive 96/29/EURATOM [1] set up in 1996 a series of
specific requirements related to a safe use of radiation sources and also to theexposure of a member of public and workers. The implementation of theserequirements based on the ICRP 60 is reflected in the comprehensive radiationprotection measures at the user site. In addition, the requirements are reflected in apractice of a regulatory authority. The implementation of the 96/29/EURATOM inthe last years in Slovenia will be discussed based on the inspection practiceincluding inspections of industry radiography, industrial gauges and practice withsmoke detectors. The problems related to the safe use of sources withrecommended working life given by a producer will be discussed.
[1] The Council of the European Union, Council Directive of 13 May 1996 Layingdown Basic Safety Standards for the Protection of the Health of Workers and theGeneral Public against the Danger Arising from Ionising Radiation, CouncilDirective 96/29/Euratom, Official Journal European Communities L 349, 21-25(1996).
53
VI. simpozij HDZZ, Stubičke Toplice, HR0500027
NEW ICRP RECOMMENDATIONS 2005: WITHOUT FULLCONSENSUS?
Mladen Novaković'EKOTEH dosimetry Co. Radiation Protection
V.Ruždjaka 21, HR-10000 Zagreb, Croatiae-mail: [email protected]
INTRODUCTIONIonising radiation is currently viewed as one of the most studied of all
known carcinogens. The system of radiation protection that has been created toprotect the public and workers from the harmful effects of ionising radiation hasbeen evolved over the years, new radiological challenges have been identified andaddressed. Although it is seen as robust and extensive this evolution has resulted ina system that is increasingly complicated.
Of relevance to the system of radiation protection is the increasing socialdesire/need to understand decision made by governments, regulatory bodies andindustry, and to participate more actively in decision-making processes involvingenvironmental and health issues. Scientific rationale that was earlier sufficient toexplain radiation protection theory and practice is no longer adequate.
The leading body in radiological protection is ICRP (InternationalCommission for Radiological Protection). It was formed in 1928 as theInternational X-ray and Radium Protection Committee, but adopted its presentname in 1950 to reflect its growing involvement in areas outside that of medicine,where it originated. According to its constitution, ICRP is established to advancefor the public benefit the science of Radiological Protection, in particular byproviding Recommendations and guidance on all aspects of radiation protection.ICRP works closely with its sister Commission, ICRU, and has relationship withmany other bodies, e.g. within the United Nations structure (IAEA, ILO, PAHO,UNSCEAR and WHO). ICRP has always been an advisory body, offering itsrecommendations to regulatory and advisory agencies at international, regional andnational levels.
For the 21s t century the Commission aims to make the system more coherentand less confusing. As part of this process ICRP proposed a series of ideas forsimplifying the system of radiation protection, in line with modern societal needs.Over the last few years ICRP developed these ideas, and more importantly hasinvited the radiation protection community, and beyond, to discuss the futuresystem of radiation of protection in order to move towards a broadly basedconsensus on which to build new ICRP recommendations. This process is finishedand it is expected the new ICRP recommendations to be published in the 2005.
54
VI. simpozij HDZZ, Stubičke Toplice, 2005.
The paper presents essential issues of the outcome of the Commissiondiscussions and improvement of the current system of radiation protection.
THE PRESENT SITUATION - THE 1990 SYSTEM OF PROTECTIONThe current Recommendations of radiation protection, set out in the Annals
of the ICRP as Publication 60 in 1991, were developed over last 30 years. Theprevious 1977 Recommendations established the three principles of the system ofdose limitation as Justification, Optimisation and Limitation. Optimisation ofprotection was to be applied to a source and a formal cost-benefit procedure wasrecommended to address the question "How much does it cost and how many livesare saved?". This introduced quantity Collective Dose, which emphasised theprotection of society and was unable to take in account of the distribution ofindividual doses within it. The issue was resolved in the 1990 Recommendationswhen fundamental changes were made to the principle of optimisation. The doselimit is considered as a boundary above which the consequential risk would bedeemed unacceptable and introduction of the dose constraint was in order tooptimise radiation protection to include the recognition of the need for individualprotection. The exposure restrictions to sources are termed dose constraints; theexposure restrictions to practices are termed dose limits. The constraint would beset at a fraction of the dose limit, as a boundary on the optimisation of that source.
The principles of justification and optimisation aim at doing more good thanharm and at maximising the margin of good over harm for Society as a whole.They therefore satisfy the utilitarian principle of ethics, whereby actions arejudged by their overall consequences, usually by comparing in monetary terms therelevant benefits (e.g. statistical estimates of lives saved) obtained by a particularprotective measure with the net cost of introducing that measure.
ICRP has made clear that the present system of protection distinguishesbetween practices, which add doses and risks, and intervention, which reducesdoses and risks. For both Practices and Interventions, the Recommendations fromICRP in the last 15 years have been made in terms of controlling the maximum riskto the individual. There has been a corresponding reduction in the emphasis oncollective dose and cost-benefit analysis. Overall this reflects a shift fromutilitarian values to an equity-based policy (the egalitarian principle of ethics),which starts with the premise that all individuals have unconditional rights tocertain levels of protection.
MAJOR CHANGES FROM THE 1990 RECOMMENDATIONSIn protecting individuals from the harmful effects of ionising radiation, it is
the control of radiation doses that is important, no matter what the source. Suchdoses could be received at work, in medical applications and in the environmentfrom the use of artificial sources, or could arise from elevated levels of naturalradiation and radionuclides, including radon. It does not apply to exposures that are
55
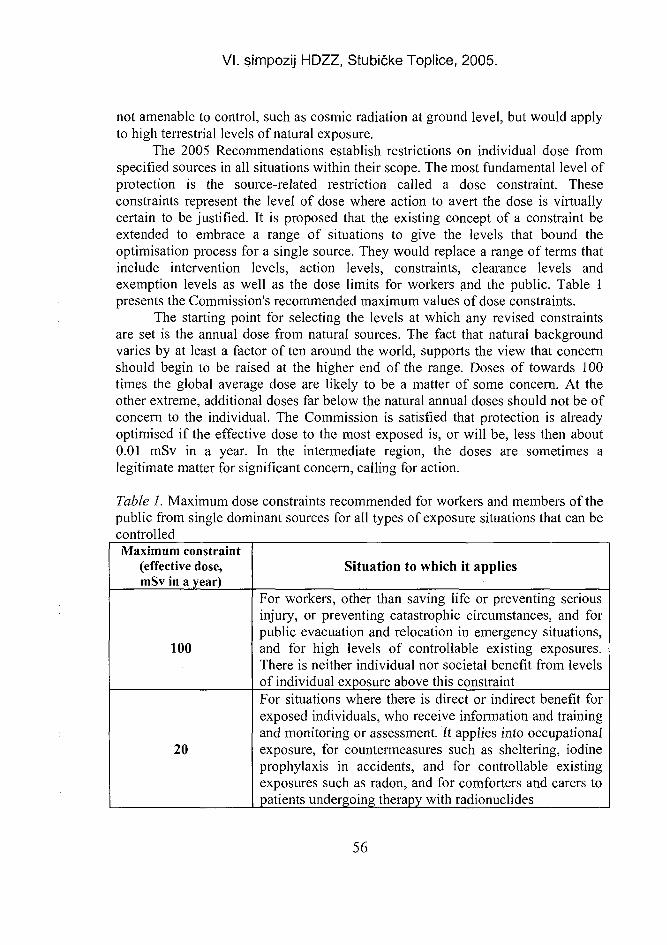
VI. simpozij HDZZ, Stubičke Toplice, 2005.
not amenable to control, such as cosmic radiation at ground level, but would applyto high terrestrial levels of natural exposure.
The 2005 Recommendations establish restrictions on individual dose fromspecified sources in all situations within their scope. The most fundamental level ofprotection is the source-related restriction called a dose constraint. Theseconstraints represent the level of dose where action to avert the dose is virtuallycertain to be justified. It is proposed that the existing concept of a constraint beextended to embrace a range of situations to give the levels that bound theoptimisation process for a single source. They would replace a range of terms thatinclude intervention levels, action levels, constraints, clearance levels andexemption levels as well as the dose limits for workers and the public. Table 1presents the Commission's recommended maximum values of dose constraints.
The starting point for selecting the levels at which any revised constraintsare set is the annual dose from natural sources. The fact that natural backgroundvaries by at least a factor of ten around the world, supports the view that concernshould begin to be raised at the higher end of the range. Doses of towards 100times the global average dose are likely to be a matter of some concern. At theother extreme, additional doses far below the natural annual doses should not be ofconcern to the individual. The Commission is satisfied that protection is alreadyoptimised if the effective dose to the most exposed is, or will be, less then about0.01 mSv in a year. In the intermediate region, the doses are sometimes alegitimate matter for significant concern, calling for action.
Table 1. Maximum dose constraints recommended for workers and members of thepublic from single dominant sources for all types of exposure situations that can becontrolledMaximum constraint
(effective dose,mSv in a year)
100
20
Situation to which it applies
For workers, other than saving life or preventing seriousinjury, or preventing catastrophic circumstances, and forpublic evacuation and relocation in emergency situations,and for high levels of controllable existing exposures.There is neither individual nor societal benefit from levelsof individual exposure above this constraintFor situations where there is direct or indirect benefit forexposed individuals, who receive information and trainingand monitoring or assessment. It applies into occupationalexposure, for countermeasures such as sheltering, iodineprophylaxis in accidents, and for controllable existingexposures such as radon, and for comforters and carers topatients undergoing therapy with radionuclides
56
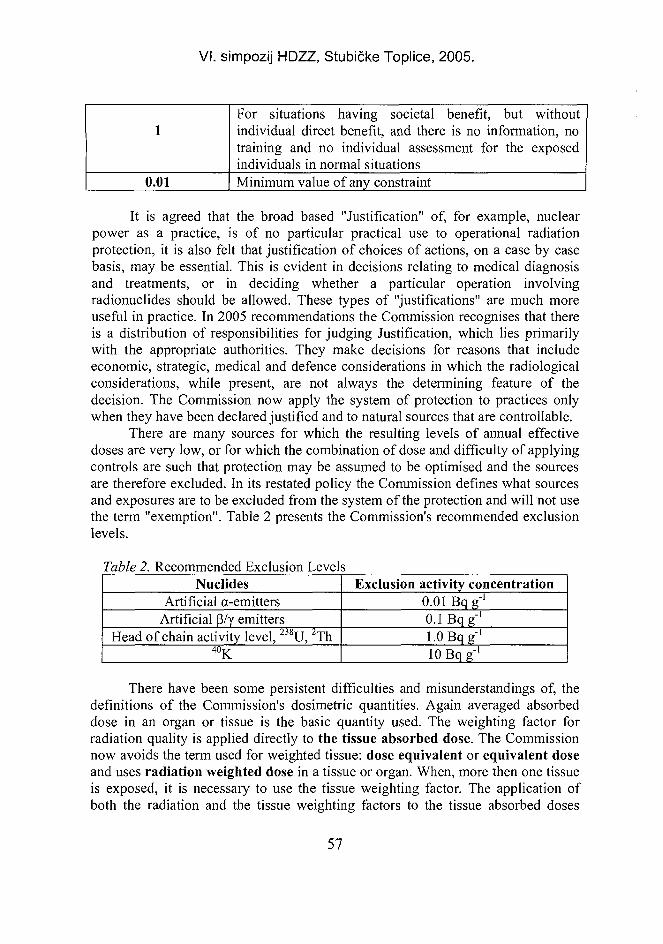
VI. simpozij HDZZ, Stubičke Toplice, 2005.
1
0.01
For situations having societal benefit, but withoutindividual direct benefit, and there is no information, notraining and no individual assessment for the exposedindividuals in normal situationsMinimum value of any constraint
It is agreed that the broad based "Justification" of, for example, nuclearpower as a practice, is of no particular practical use to operational radiationprotection, it is also felt that justification of choices of actions, on a case by casebasis, may be essential. This is evident in decisions relating to medical diagnosisand treatments, or in deciding whether a particular operation involvingradionuclides should be allowed. These types of "justifications" are much moreuseful in practice. In 2005 recommendations the Commission recognises that thereis a distribution of responsibilities for judging Justification, which lies primarilywith the appropriate authorities. They make decisions for reasons that includeeconomic, strategic, medical and defence considerations in which the radiologicalconsiderations, while present, are not always the determining feature of thedecision. The Commission now apply the system of protection to practices onlywhen they have been declared justified and to natural sources that are controllable.
There are many sources for which the resulting levels of annual effectivedoses are very low, or for which the combination of dose and difficulty of applyingcontrols are such that protection may be assumed to be optimised and the sourcesare therefore excluded. In its restated policy the Commission defines what sourcesand exposures are to be excluded from the system of the protection and will not usethe term "exemption". Table 2 presents the Commission's recommended exclusionlevels.
Table 2. Recommended Exclusion LevelsNuclides
Artificial a-emittersArtificial p7y emitters
Head of chain activity level, 2 3 8U, 2Th4 0 K
Exclusion activity concentration0.01 Bqg-1
0.1 B q g '1.0 B q g '10 Bq g '
There have been some persistent difficulties and misunderstandings of, thedefinitions of the Commission's dosimetric quantities. Again averaged absorbeddose in an organ or tissue is the basic quantity used. The weighting factor forradiation quality is applied directly to the tissue absorbed dose. The Commissionnow avoids the term used for weighted tissue: dose equivalent or equivalent doseand uses radiation weighted dose in a tissue or organ. When, more then one tissueis exposed, it is necessary to use the tissue weighting factor. The application ofboth the radiation and the tissue weighting factors to the tissue absorbed doses
57
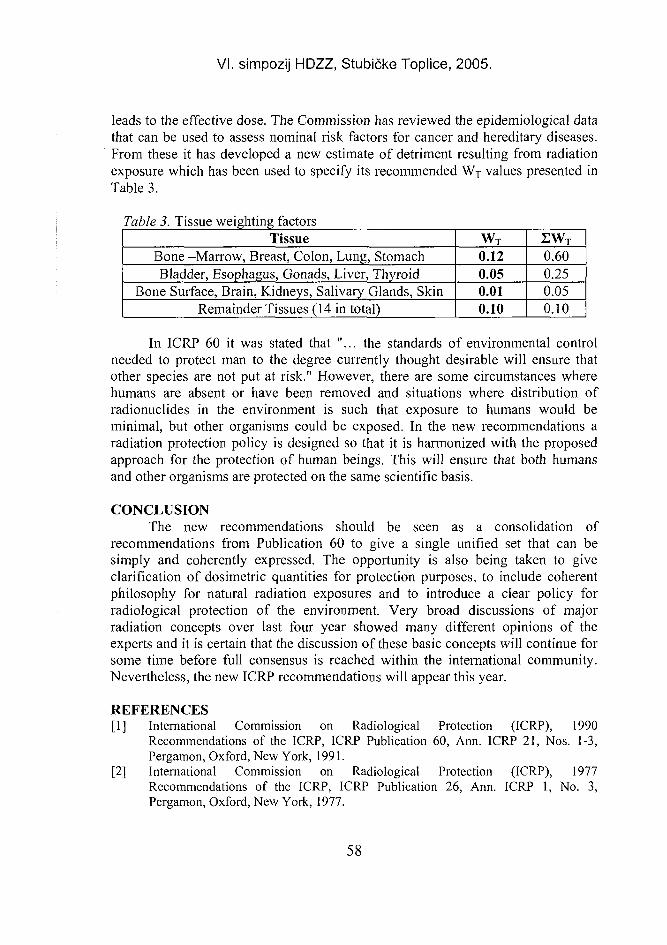
VI. simpozij HDZZ, Stubičke Toplice, 2005.
leads to the effective dose. The Commission has reviewed the epidemiological datathat can be used to assess nominal risk factors for cancer and hereditary diseases.From these it has developed a new estimate of detriment resulting from radiationexposure which has been used to specify its recommended WT values presented inTable 3.
Table 3. Tissue weighting factorsTissue
Bone -Marrow, Breast, Colon, Lung, StomachBladder, Esophagus, Gonads, Liver, Thyroid
Bone Surface, Brain, Kidneys, Salivary Glands, SkinRemainder Tissues (14 in total)
WT
0.120.050.010.10
I W T
0.600.250.050.10
In ICRP 60 it was stated that "... the standards of environmental controlneeded to protect man to the degree currently thought desirable will ensure thatother species are not put at risk." However, there are some circumstances wherehumans are absent or have been removed and situations where distribution ofradionuclides in the environment is such that exposure to humans would beminimal, but other organisms could be exposed. In the new recommendations aradiation protection policy is designed so that it is harmonized with the proposedapproach for the protection of human beings. This will ensure that both humansand other organisms are protected on the same scientific basis.
CONCLUSIONThe new recommendations should be seen as a consolidation of
recommendations from Publication 60 to give a single unified set that can besimply and coherently expressed. The opportunity is also being taken to giveclarification of dosimetric quantities for protection purposes, to include coherentphilosophy for natural radiation exposures and to introduce a clear policy forradiological protection of the environment. Very broad discussions of majorradiation concepts over last four year showed many different opinions of theexperts and it is certain that the discussion of these basic concepts will continue forsome time before full consensus is reached within the international community.Nevertheless, the new ICRP recommendations will appear this year.
REFERENCES[1] International Commission on Radiological Protection (ICRP), 1990
Recommendations of the ICRP, ICRP Publication 60, Ann. ICRP 21, Nos. 1-3,Pergamon, Oxford, New York, 1991.
[2] International Commission on Radiological Protection (ICRP), 1977Recommendations of the ICRP, ICRP Publication 26, Ann. ICRP 1, No. 3,Pergamon, Oxford, New York, 1977.
58
VI. simpozij HDZZ, Stubičke Toplice, 2005.
[3] Clark R.H. The Evolution of the System of Radiological Protection: TheJustification for New ICRP Recommendations, Draft of 22/11/02, RestrictedDistribution-CRPPH Expert group only, Paris, November 2002.
ABSTRACTIonising radiation is viewed as one of the most studied of all known
carcinogens. Over the last 50 years Recommendations of International Commissionfor Radiological Protection (ICRP) have been changed regularly every 10 years. Atthe beginning these changes were significant, sometimes even radical, according toquick acquiring of new scientific evidence on physical, biological and healtheffects of radiation. In order to handle each new situation evolution of the radiationprotection system has been extended and new portions have been added (theubiquitous exposure of public to radon gas and its progeny, and the need to developan appropriate response to emergency situations, increasing social desire toparticipate in decision making processes, concern for the protection of non-humanspecies and environment), that resulted in a system that is increasinglycomplicated. Over the last few years very broad discussions of major radiationprotection concepts have been encouraged by the ICRP in order to achieveconsensus on a more operational and coherent system of radiation protectionelaborated in a transparent fashion, and presented in readily understandable terms.This process for the first time involves a broad spectrum of stakeholders in thesediscussions. It is further assumed that these debates will eventually result inconsensus on the basis for the next round of ICRP general recommendations,probably in the 2005. While now it is certain that the consensus is not yet reachedwithin the international community and the discussion of these issues will continuefor some time the new recommendations should be seen as a consolidation ofrecommendations from 1990 to give a single unified set that can be simply andcoherently expressed. The paper presents essential issues of the outcome of theCommission discussions and improvement of the current system of radiationprotection.
59
VI. simpozij HDZZ, Stubičke Toplice, HR0500028
ŠTO DONOSI NOVI ZAKON O NUKLEARNOJ SIGURNOSTI
Nevenka NovoselMinistarstvo gospodarstva, rada i poduzetništva,
Ulica grada Vukovara 78, 10000 Zagrebe-mail: [email protected]
UVODZakon o nuklearnoj sigurnosti donio je Hrvatski sabor na sjednici 15.
listopada 2003. godine, a objavljen je u "Narodnim novinama" br. 173/03 [1].Ovim se Zakonom određuju mjere sigurnosti i zaštite pri uporabi nuklearnihmaterijala i posebne opreme odnosno pri obavljanju nuklearnih djelatnosti teosniva Državni zavod za nuklearnu sigurnost.
Danom stupanja na snagu ovoga Zakona prestali su važiti Zakon o mjeramaza zaštitu od ionizirajućih zračenja i za sigurnost pri upotrebi nuklearnih objekata ipostrojenja ("Narodne novine", br. 18/81.) i Zakon o zaštiti od ionizirajućihzračenja i o posebnim mjerama sigurnosti pri upotrebi nuklearne energije("Narodne novine", br. 53/91.). Podzakonski propisi doneseni temeljem Zakona ozaštiti od ionizirajućih zračenja i o posebnim mjerama sigurnosti pri upotrebinuklearne energije, ostaju na snazi do donošenja propisa temeljem Zakona onuklearnoj sigurnosti.
Odredbe ovoga Zakona odnose se na nuklearne djelatnosti, nuklearnematerijale i posebnu opremu. U Republici Hrvatskoj nema nuklearnih objekata, alije Hrvatska elektroprivreda vlasnik 50% Nuklearne elektrane Krško, koja se nalazina teritoriju Republike Slovenije. Potpisivanjem i potvrđivanjem Ugovora izmeđuVlade Republike Hrvatske i Vlade Republike Slovenije o uređenju statusnih idrugih pravnih odnosa vezanih uz ulaganje, iskorištavanje i razgradnju Nuklearneelektrane Krško ("Narodne novine - Međunarodni ugovori" br. 9/02.), Hrvatska jepreuzela odgovarajuće obveze.
Također, pristupanjem međunarodnim ugovorima (konvencijama isporazumima), Republika Hrvatska je preuzela obvezu provođenja odredbi tihmeđunarodnih ugovora. Republika Hrvatska u svojoj težnji za svjetskim ieuropskim integracijama mora se i na području nuklearne sigurnosti prilagoditisvjetskim i europskim normama.
U ovom radu bit će pobliže obrađena osnovna pitanja koja se uređuju ovimZakonom, kao i uloga Državnog zavoda za nuklearnu sigurnost.
OSNOVNA PITANJA KOJA SE UREĐUJU OVIM ZAKONOMOdredbe ovog Zakona odnose se na sve aktivnosti vezane uz nuklearne
djelatnosti i nuklearne materijale te posebnu opremu.Ovaj Zakon zasniva se na slijedećim pretpostavkama:
60
VI. simpozij HDZZ, Stubičke Toplice, 2005.
- korisnik mora provoditi mjere sigurnosti i zaštite pri obavljanju nuklearnedjelatnosti i snosi isključivu odgovornost za sigurnost i zaštitu,
- osniva se Državni zavod za nuklearnu sigurnost kao tijelo državne upravenadležno za poslove nuklearne sigurnosti, koje izdaje dozvole za obavljanjenuklearne djelatnosti u svezi s nuklearnim materijalom i posebnom opremom irješenja odnosno potvrde za smještaj, projektiranje, gradnju, uporabu te razgradnjuobjekta u kojem će se obavljati nuklearna djelatnost,
- poslovi od utjecaja na nuklearnu sigurnost moraju se provoditi uz primjenuzahtjeva osiguranja kvalitete,
- Tehnički potporni centar koji djeluje kao organizacijska jedinica tijela državneuprave nadležnog za poslove nuklearne sigurnosti, priprema i provodi stručne itehničke aktivnosti u slučaju opasnosti od nuklearne nesreće,
- Državni zavod za nuklearnu sigurnost također osigurava stručnu pomoć uposlovima suzbijanja nedozvoljenog prometa nuklearnog materijala tijelimadržavne uprave nadležnim za te poslove.
Upravni nadzor nad provedbom ovog Zakona provodi Državni zavod zanuklearnu sigurnost, a inspekcijski nadzor provode inspektori za nuklearnusigurnost.
Određene poslove iz područja nuklearne sigurnosti mogu obavljati stručneorganizacije koje ispunjavaju posebne uvjete za pojedine djelatnosti, koje određujeDržavni zavod za nuklearnu sigurnost.
Zakonom je predviđeno da Hrvatski sabor na prijedlog Vlade RepublikeHrvatske osniva Vijeće za nuklearnu sigurnost koje daje prijedloge i mišljenja oraznim aspektima nuklearne sigurnosti u Republici Hrvatskoj. Hrvatski sabor je nasjednici 1. listopada 2004. godine donio Odluku o imenovanju predsjednika ičlanova Vijeća za nuklearnu sigurnost ("Narodne novine" br. 140/04).
DRŽAVNI ZAVOD ZA NUKLEARNU SIGURNOSTPrema članku 22. Zakona o nuklearnoj sigurnosti, za svrhu provedbe mjera
nuklearne sigurnosti i zaštite Državni zavod za nuklearnu sigurnost:1. izdaje dozvole za obavljanje nuklearne djelatnosti u svezi s nuklearnim
materijalom ili posebnom opremom;2. provodi nezavisne analize sigurnosti i izdaje rješenja odnosno potvrde za
smještaj, projektiranje, gradnju, uporabu te razgradnju objekta u kojem će seobavljati nuklearna djelatnost;
3. vodi očevidnike o dozvolama, suglasnostima, rješenjima i potvrdama, koje izdaje uokviru svojih ovlasti;
4. obavlja upravni nadzor nad provedbom odredbi ovoga Zakona i propisadonesenih na temelju ovoga Zakona;
5. obavlja inspekcijski nadzor nad provedbom odredbi ovoga Zakona i propisadonesenih na temelju ovoga Zakona;
61
VI. simpozij HDZZ, Stubičke Toplice, 2005.
6. osigurava stručnu pomoć za provođenje državnog plana i programa postupaka uslučaju nuklearne nesreće, putem djelovanja Tehničkog potpornog centra;
7. osigurava stručnu pomoć u poslovima suzbijanja nedozvoljenog prometanuklearnog materijala tijelima državne uprave nadležnim za te poslove;
8. prati stanje sigurnosti nuklearnih elektrana u regiji i provodi procjenu opasnostiod mogućih nuklearnih nesreća u njima, a osobito za Nuklearnu elektranuKrško u Sloveniji i Nuklearnu elektranu Paks u Mađarskoj;
9. provodi obveze koje je Republika Hrvatska preuzela prema međunarodnimkonvencijama i bilateralnim sporazumima, a odnose se na nuklearnu sigurnost iprimjenu mjera zaštite u svrhu neširenja nuklearnog oružja;
10.surađuje s međunarodnim i domaćim organizacijama i društvima s područjanuklearne sigurnosti, te imenuje svoje stručne predstavnike koji sudjeluju u radutih organizacija i društava ili prate njihov rad;
11.koordinira poslove tehničke suradnje s Međunarodnom agencijom za atomskuenergiju za sve sudionike iz Republike Hrvatske;
12.potiče i podupire razvojno-istraživački rad u skladu sa zahtjevima i potrebamarazvoja nuklearne sigurnosti u Republici Hrvatskoj;
13.izdaje upute za provođenje međunarodnih preporuka i normi u područjunuklearne sigurnosti i zaštite;
14.obavlja i druge poslove iz svoje nadležnosti temeljem ovoga Zakona, propisadonesenih temeljem ovoga Zakona i drugih propisa.
U Zakonu o nuklearnoj sigurnosti navedeno je da će Državni zavod zanuklearnu sigurnost započeti s radom najkasnije do 1. siječnja 2005. godine.
Državni zavod za nuklearnu sigurnost preuzet će postojeće zaposlenike,nekretnine, pokretnine, opremu i sredstva sukladno poslovima koji se odnose nanuklearnu sigurnost i suradnju s Međunarodnom agencijom za atomsku energiju odMinistarstva gospodarstva, rada i poduzetništva koje je prema sadašnjem ustrojstvui djelokrugu rada nadležno za područje nuklearne sigurnosti.
Neupitno je da će određena sredstva trebati uložiti u unapređenje stanjanuklearne sigurnosti u Republici Hrvatskoj (posebno u modernizaciju tehničkeopreme) u skladu s međunarodnim pravnim obvezama i propisima unutarnjegpravnog poretka Republike Hrvatske.
Uspostava i funkcioniranje Državnog zavoda za nuklearnu sigurnost, kaotijela za koordinaciju svih poslova nuklearne sigurnosti, na duži rok značiracionalizaciju i smanjenje troškova svih sudionika u poslovima nuklearnesigurnosti.
ZAKLJUČAKDonošenjem Zakona o nuklearnoj sigurnosti utvrđuje se jasan pravni okvir i
definira odgovarajuća infrastruktura za kontinuiranu i učinkovitu provedbu svihpotrebnih mjera nuklearne sigurnosti sukladno međunarodnim normama ipreporukama. Osnivanjem Državnog zavoda za nuklearnu sigurnost razrješuje se
62
VI. simpozij HDZZ, Stubičke Toplice, 2005.
potencijalni sukob interesa, koji je mogao nastati unutar tijela državne upravenadležnog istovremeno za promociju nuklearne energije i nuklearnu sigurnost.Glavni cilj donošenja Zakona o nuklearnoj sigurnosti i osnivanja Državnog zavodaza nuklearnu sigurnost je podizanje optimalne razine sigurnosti svih stanovnikaRepublike Hrvatske.
LITERATURA[ 1 ] Zakon o nuklearnoj sigurnosti. Narodne novine br. 173/03
WHAT IS NEW IN THE ACT ON NUCLEAR SAFETY
Nevenka NovoselMinistry of Economy, Labour and Entrepreneurship,Ulica grada Vukovara 78, HR-10000 Zagreb, Croatia
e-mail: [email protected]
The Act on Nuclear Safety was passed by the Croatian Parliament on 15October 2003, and published in Narodne novine (official journal) No. 173/03. ThisAct regulates safety measures for using nuclear materials and equipment, regulatesnuclear activities, and establishes the National Office for Nuclear Safety. The newact supersedes the Act on Protective Measures Against Ionising Radiation andSafety in the Use of Nuclear Facilities and Installations {Narodne novine No.18/81) and the Act on Protection against Ionising Radiation and Special SafetyMeasures in Using Nuclear Energy {Narodne novine No. 53/91). Regulations basedon the latter Act shall apply until they are replaced by new regulations based on theAct on Nuclear Safety. Provisions of this Act apply for nuclear activities, nuclearmaterials and specified equipment. Croatia does not have nuclear facilities on itsterritory, but a Croatian power utility company owns 50% of the Nuclear PowerPlant Krško on the territory of Slovenia. In that respect, Croatia has assumedresponsibilities defined by the Agreement between the Government of the Republicof Slovenia and the Government of the Republic of Croatia on the Regulation ofthe Status and Other Legal Relationships, Connected with Investments in the KrškoNuclear Power Plant, its Exploitation and Decommissioning {Narodne novine No.9/02, International Agreements). Having accessioned international conventions andagreements, Croatia has also assumed the responsibility to implement theirprovisions. In the process of European and international integrations, Croatia has toharmonize with the European and international standards in nuclear safety.
63
Vl . .HDZZS1,.kT ,. H H H I HVI, simpozij HDZZ, Stubicke TopliD HR0500029
UGOVOR O NESIRENJU NUKLEARNOG ORUŽJA
Zdenko Franić1 i Boris Ilijaš2
'institut za medicinska istraživanja i medicinu rada, Ksaverska c. 2,10000 Zagreb2Zapovjedništvo hrvatske kopnene vojske Domobranska 12,47000 Karlovac
e-mail: [email protected], [email protected]
UVODNakon što su SAD obavile prvo testiranje nuklearnog oružja u Alamogordu
u New Mexicu 16. srpnja 1945., a potom u kolovozu iste godine bacile nuklearnebombe na Hirošimu i Nagasaki, i druge zemlje počinju razvijati nuklearno oružje.Tako je SSSR obavio prvu nuklearnu probu 1949., Velika Britanija 1952.,Francuska 1960. i Kina 1964. godine.
Tijekom 1950-ih počinju intenzivni pregovori o ugovoru koji bi onemogućiodaljnje širenje nuklearnog oružja. Ugovor o neširenju nuklearnog oružja (NuclearNon-Proliferation Treaty - NPT) konačno je zaključen 1968., stupio je na snagu1970., a za sada gaje ratificiralo 187 država. Njime se uvodi status nuklearnih inenuklearnih država. Zemlje bez nuklearnog oružja su se obvezale ne razvijati isto,a zemlje u posjedu nuklearnog oružja su se obvezale ne prodavati ga drugimdržavama, kao i tehnologiju za njegovu proizvodnju. Mjere nadzora provodiMeđunarodna agencija za atomsku energiju (IAEA) sa sjedištem u Beču.
Republika Hrvatska je u okviru sukcesije bivše države pristupila tomUgovoru 1992. godine. Osim djelatnika HVS-a koji prate aktivnosti u provedbiUgovora, za stručne seminare i konferencije država stranaka angažiraju sedjelatnici iz drugih ustrojbenih cjelina MORH-a koji su eksperti za nuklearnooružje. Međutim, uz neširenje nuklearnog oružja trebalo je ograničiti i probe većpostojećeg nuklearnog oružja, budući da nuklearni pokusi sami po sebi noseopasnost ne samo po mir već i za zdravlje ljudi i sigurnost okoliša. Smatrajući danuklemi pokusi predstavljaju globalnu prijetnju svijetu, tadašnji predsjednik vladeIndije J. Nehru je još godine 1954. pokrenuo inicijativu o suspenziji nuklearnihproba.
UGOVOR O POTPUNOJ ZABRANI NUKLEARNIH PROBAGodine 1963. potpisan je Ugovor o zabrani nuklearnih proba u atmosferi,
svemiru i podmorju. Međutim, taj je ugovor bio parcijalnog značaja jer nisuzabranjeni podzemni pokusi. Uslijedio je godine 1974. bilateralni Ugovor SAD-a iSSSR-a o ograničenju nuklearnih proba. Tijekom 1990-ih Rusija i Velika Britanijaobjavili su prekid izvođenja nuklearnih proba, a Francuska, Kina i SAD proglasilisu moratorij.
Nakon intenzivnih pregovora Ugovor o potpunoj zabrani nuklearnih proba(The Comprehensive Nuclear Test Ban Treaty - CTBT) potpisan je 24. rujna 1996.
64
VI. simpozij HDZZ, Stubičke Toplice, 2005.
godine od strane 71 države, uključujući 5 nuklearnih sila. Puni tekst ugovoradostupan je na Interentu [1]. Ugovor će stupiti na snagu nakon što ga ratificirajudržave pobrojane u aneksu 2. Ugovora.
Ugovor o potpunoj zabrani nuklearnih proba zabranjuje nuklearne eksplozijeu svim okolišima (svemiru, atmosferi, zemlji, podmorju i unutrašnjosti Zemlje)bilo u vojne ili civilne svrhe.
Osnovne obveze predviđene Ugovorom precizirane su člankom 1:• Svaka država potpisnica obvezuje se da neće obavljati nikakve pokusne
eksplozije nuklearnog oružja niti bilo kakve druge nuklearne eksplozije i da ćezabraniti i spriječiti svaku takvu nuklearnu eksploziju bilo gdje na području unjezinoj nadležnosti ili pod njezinim nadzorom.
• Svaka država potpisnica obvezuje se, nadalje, da neće uzrokovati, poticati niti nabilo koji način sudjelovati u obavljanju bilo kakve pokusne eksplozijenuklearnog oružja ili kakve druge nuklearne eksplozije.
CTBTODržave potpisnice Ugovora formirale su nezavisno međunarodno tijelo (The
Comprehensive Nuclear Test Ban Treaty Organization - CTBTO) koja djeluje priUjedinjenim narodima u Beču kao krovnu organizaciju koja prati provedbuUgovora.
Tijela Organizacije jesu Konferencija država potpisnica, Izvršno vijeće iTehničko tajništvo koje obuhvaća i Međunarodni centar podataka. Izvršni tajnikPripremnog povjerenstva Organizacije za provedbu Ugovora o sveobuhvatnojzabrani nuklearnih pokušaje diplomat Wolfgang Hoffmann.
Države potpisnice surađuju s Organizacijom u obavljanju njenih dužnosti isavjetuju se izravno ili putem ove Organizacije ili drugih odgovarajućihmeđunarodnih procedura, uključujući i procedure u okviru Ujedinjenih naroda osvakom pitanju koje se potakne u svezi s predmetom i svrhom ili provedbom ovogUgovora. Organizacija je dužna provoditi verifikacijske aktivnosti utvrđene ovimUgovorom maksimalno nenametljivo, sukladno pravodobnom i učinkovitompostizanju njihovih ciljeva. Organizacija može tražiti samo one informacije ipodatke nužne za ispunjenje obveza Organizacije temeljem ovog Ugovora.Organizacija će provoditi sve potrebne mjere radi zaštite povjerljivosti informacijao civilnim i vojnim aktivnostima i objektima o kojima sazna tijekom provedbeUgovora te će se, posebice pridržavati odredaba o povjerljivosti utvrđenih ovimUgovorom. Informacije i podatke što ih tijekom provedbe Ugovora u povjerenjudobije od ove Organizacije svaka će država potpisnica smatrati povjerljivima ipostupati s njima na poseban način. Takvim informacijama i podacima državepotpisnice služit će se isključivo u okviru prava i obveza što ih imaju temeljemovog Ugovora. Organizacija će se, kao neovisno tijelo, truditi da po potrebiiskoristi postojeće stručnjake i sredstva, te će u troškovima biti maksimalnoekonomična, putem dogovora o suradnji s drugim međunarodnim organizacijama
65
VI. simpozij HDZZ, Stubičke Toplice, 2005.
kao što je Međunarodna agencija za atomsku energiju. Troškove djelovanjaOrganizacije podmiruju države potpisnice godišnje u skladu s UN-ovim ključem zarazrez doprinosa prilagođenim tako da se uzmu u obzir razlike u članstvu izmeđuUjedinjenih naroda i ove Organizacije.
STATUS UGOVORAUgovor o sveobuhvatnoj zabrani nuklearnih pokusa, usvojen rezolucijom u
okviru UN-a, do sredine veljače 2005. godine potpisalo je do sada 175 država, aratificiralo 120, među njima i Republika Hrvatska. Od 44 države koje imaju nasvom teritoriju nuklearne reaktore iz Aneksa 2. Ugovora, 11 ga još nije ratificiralo,među ostalima SAD, Sjeverna Koreja, Indija, Pakistan, Vijetnam, Kolumbija,Izrael, Egipat i Iran. Od pet nuklearnih svjetskih sila Rusija, Francuska, Engleska iKina su ga ratificirale, dok SAD još nisu. Indija, Pakistan i Sjeverna Koreja nisu gajoš ni potpisale, niti ratificirale. Međutim, tajnik CTBTO-a Wolfgang Hoffmann,označio je nedavnu zajedničku izjavu Indije i Pakistana "da više ne žele izvoditinuklearne pokuse i da će se držati moratorija za izvođenje nuklearnih pokusa"izuzetnim napretkom.
Valja dakle još jednom naglasiti da je neizvjesno kada će sve 44 zemljenavedene u Aneksu 2. Ugovora, a posebice nuklearne sile, deponirati svojeinstrumente ratifikacije i nakon čega Ugovor stupa na snagu.
CTBTO I REPUBLIKA HRVATSKARepublika Hrvatska pristupila je Ugovoru 01.12.2001. godine.U skladu s tim
Vlada Republike Hrvatske je na temelju članka 30. stavka 2. Zakona o VladiRepublike Hrvatske, a u vezi s točkom 4. članka III. Ugovora o sveobuhvatnojzabrani nuklearnih pokusa [2] 6. lipnja 2002. godine donijela Odluku o osnivanjuNacionalnog povjerenstva za provedbu Ugovora o sveobuhvatnoj zabraninuklearnih pokusa [3,4]. Povjerenstvo je s radom započelo početkom 2004. godinekonstituirajućom sjednicom koja je održana u prostorijama HVS-a.
U Nacionalno povjerenstvo imenovani su predstavnici Ministarstva vanjskihposlova, Ministarstva obrane, Ministrarstva gospodarstva (Odjel nuklearnesigurnosti), Ministarstva znanosti i tehnologije, te znanstveno istraživačkihinstitucija (Institut Ruđer Bošković, Građevinski institut, Brodarski Institut,Geofizički zavod Prirodoslovno matematičkog fakulteta Sveučilišta u Zagrebu).Predsjednik povjerenstva je dr. se. Zdenko Franić. Sredstva za rad Nacionalnogpovjerenstva osiguravaju se u državnog proračuna.
Krajem 2004. godine Republiku Hrvatsku posjetio je Wolfgang Hoffmann,te se upoznao s radom Nacionalnog povjerenstva i posjetio neke od institucija čijase djelatnost odnosi na područje interesa CTBTO-a. Jedan od neposrednih zadatakaPovjerenstva jest rasprava i ustroj nacionalnog središta podataka vezanih uzverifikacijski režim.
66
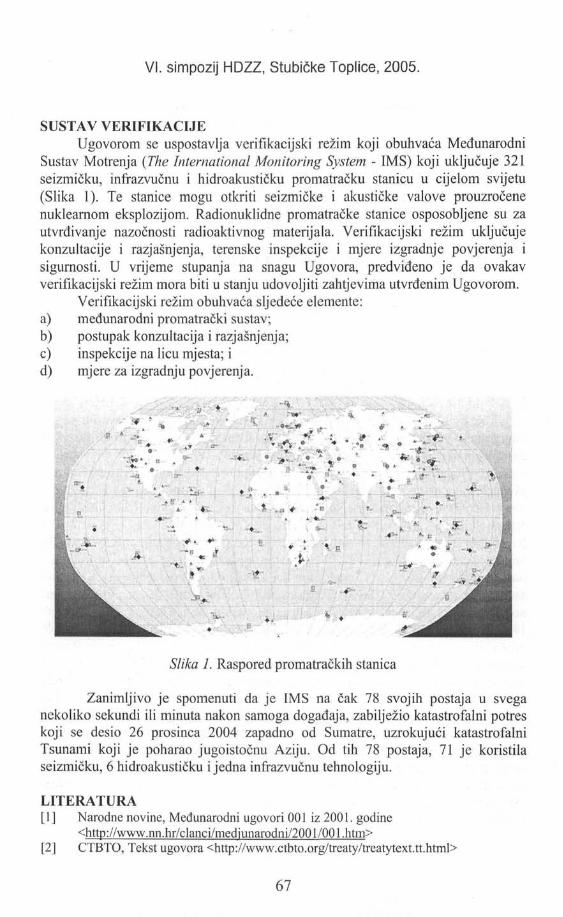
VI. simpozij HDZZ, Stubičke Toplice, 2005.
SUSTAV VERIFIKACIJEUgovorom se uspostavlja verifikacijski režim koji obuhvaća Međunarodni
Sustav Motrenja (The International Monitoring System - IMS) koji uključuje 321seizmičku, infrazvučnu i hidroakustičku promatračku stanicu u cijelom svijetu(Slika 1). Te stanice mogu otkriti seizmičke i akustičke valove prouzročenenuklearnom eksplozijom. Radionuklidne promatračke stanice osposobljene su zautvrđivanje nazočnosti radioaktivnog materijala. Verifikacijski režim uključujekonzultacije i razjašnjenja, terenske inspekcije i mjere izgradnje povjerenja isigurnosti. U vrijeme stupanja na snagu Ugovora, predviđeno je da ovakavverifikacijski režim mora biti u stanju udovoljiti zahtjevima utvrđenim Ugovorom.
Verifikacijski režim obuhvaća sljedeće elemente:a) međunarodni promatrački sustav;b) postupak konzultacija i razjašnjenja;c) inspekcije na licu mjesta; id) mjere za izgradnju povjerenja.
V
\ * i" v • * • . •
Slika 1. Raspored promatračkih stanica , .
Zanimljivo je spomenuti da je IMS na čak 78 svojih postaja u sveganekoliko sekundi ili minuta nakon samoga događaja, zabilježio katastrofalni potreskoji se desio 26 prosinca 2004 zapadno od Sumatre, uzrokujući katastrofalniTsunami koji je poharao jugoistočnu Aziju. Od tih 78 postaja, 71 je koristilaseizmičku, 6 hidroakustičku i jedna infrazvučnu tehnologiju.
LITERATURA[1] Narodne novine, Međunarodni ugovori 001 iz 2001. godine
<http://www.nn.hr/clanci/mediunarodni/2001/001.htm>[2] CTBTO, Tekst ugovora <http://www.ctbto.org/treaty/treatytext.tt.html>
67
VI. simpozij HDZZ, Stubičke Toplice, 2005.
[3] Narodne novine br. 69/2002. od 13.06.2002. Odluka o osnivanju Nacionalnogpovjerenstva za provedbu Ugovora o sveobuhvatnoj zabrani nuklearnih pokusa<http://www.nn.hr/clanci/s1uzbeno/2002/1164.htm>
[4] Narodne novine br. 22/2003 .od 30.07.2003. Odluka o izmjenama Odluke oosnivanju Nacionalnog povjerenstva za provedbu Ugovora o sveobuhvatnoj zabraninuklearnih pokusa.<http://www.nn.hr/clanci/sluzbeno/2002/1735.htm>
THE COMPREHENSIVE NUCLEAR TEST BAN TREATY
Zdenko Franić' and Boris Ilijaš2
'institute for Medical Research and Occupational Health, Ksaverska c. 2HR-10000 Zagreb, Croatia
2Headquarters of Croatian Land Forces,Domobranska 12, HR-47000 Karlovac, Croatia
e-mail: [email protected], [email protected]
The Comprehensive Nuclear-Test-Ban Treaty (CTBT) is a cornerstone of theinternational regime on the non-proliferation of nuclear weapons and an essentialfoundation for the pursuit of nuclear disarmament. Its total ban of any nuclearweapon test explosion will constrain the development and qualitative improvementof nuclear weapons and end the development of advanced new types of theseweapons. The Comprehensive Nuclear-Test-Ban Treaty was adopted by the UnitedNations General Assembly, and was opened for signature in New York on 24September 1996. The Treaty will enter into force after it has been ratified by the 44States listed in its Annex 2. These states possess nuclear power or researchreactors. The Preparatory Commission for the Comprehensive Nuclear-Test-BanTreaty Organization (CTBTO Preparatory Commission) is an internationalorganization established by the States Signatories to the Treaty on 19 November1996. It carries out the necessary preparations for the effective implementation ofthe Treaty, and prepares for the first session of the Conference of the States Partiesto the Treaty. The Treaty has been signed and ratified by the Republic of Croatiaand National Commission for the implementation of the Treaty has beenestablished. Basic obligations of the Treaty, as specified in Article I, are: (1) EachState Party undertakes not to carry out any nuclear weapon test explosion or anyother nuclear explosion, and to prohibit and prevent any such nuclear explosion atany place under its jurisdiction or control. (2) Each State Party undertakes,furthermore, to refrain from causing, encouraging, or in any way participating inthe carrying out of any nuclear weapon test explosion or any other nuclearexplosion.
68
VI. simpozij HDZZ, Stubičke Toplice, i HR0500030
RADIOLOGICAL PREPAREDNESS IN THE CASE OF ATERRORIST ATTACK OR AN ACCIDENT
Ankica ČižmekMinistry of Economy, Labour and Entrepreneurship
Ulica Grada Vukovara 78, HR-10000 Zagreb, Croatiae-mail: [email protected]
INTRODUCTIONSurely there is no more unsettling task than considering how to defend
against individuals and groups seeking to advance their aims by killing and injuringinnocent people. But recent events make it necessary to take almost inconceivablyevil acts seriously. Analysis of this threat has reached next principle conclusions:1. Radiological attacks constitute a credible threat. Radioactive materials that couldbe used for such attacks are stored in thousands of facilities all around the world,many of which may not be adequately protected against theft by determinedterrorists. Some of this material could be easily dispersed in urban areas by usingconventional explosives or by other methods.2. In the past ten years, 175 cases have been recorded worldwide of nuclearmaterials (not bombs) being smuggled out of former Soviet territories and othercountries.3. Osama Bin Laden has made no secret of his ambition to join the nuclear club- hehas even proclaimed it a "religious duty" for Muslim states to acquire nuclear,chemical and biological weapons to attack the West.4. While radiological attacks would result in some deaths, they would not result inthe hundreds of thousands of fatalities that could be caused by a crude nuclearweapon. Attacks could contaminate large urban areas with radiation levels thatexceed safety health and toxic material guidelines.5. Materials that could easily be lost or stolen from research institutions andcommercial sites could contaminate tens of city blocks at a level that would requireprompt evacuation and create terror in large communities even if radiationcasualties were low. Areas as large as tens of square miles could be contaminatedat levels that exceed recommended civilian exposure limits. Since there are oftenno effective ways to decontaminate buildings that have been exposed at theselevels, demolition may be the only practical solution. If such an event were to takeplace in a city like New York, it would result in losses of potentially trillions ofdollars.
Beside terroristic attack we must take into consideration also the accidents(because of the different reasons). One of such cases (because of doctors' neglect)was the accident in Goiania-i, in Brasil. After they closed the oncological clinic(1985), doctors left unsafety stored teleterapic facility. In 1987 aboandoned facility
69
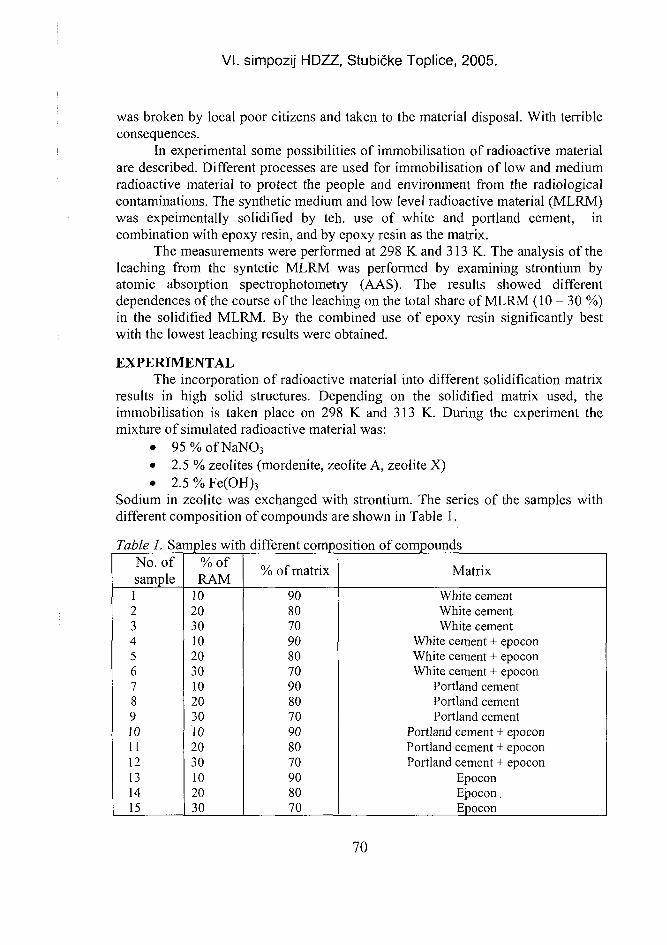
VI. simpozij HDZZ, Stubičke Toplice, 2005.
was broken by local poor citizens and taken to the material disposal. With terribleconsequences.
In experimental some possibilities of immobilisation of radioactive materialare described. Different processes are used for immobilisation of low and mediumradioactive material to protect the people and environment from the radiologicalcontaminations. The synthetic medium and low level radioactive material (MLRM)was expeimentally solidified by teh. use of white and portland cement, incombination with epoxy resin, and by epoxy resin as the matrix.
The measurements were performed at 298 K and 313 K. The analysis of theleaching from the syntetic MLRM was performed by examining strontium byatomic absorption spectrophotometry (AAS). The results showed differentdependences of the course of the leaching on the total share of MLRM (10 — 30 %)in the solidified MLRM. By the combined use of epoxy resin significantly bestwith the lowest leaching results were obtained.
EXPERIMENTALThe incorporation of radioactive material into different solidification matrix
results in high solid structures. Depending on the solidified matrix used, theimmobilisation is taken place on 298 K and 313 K. During the experiment themixture of simulated radioactive material was:
• 95 % of NaNO3
• 2.5 % zeolites (mordenite, zeolite A, zeolite X)• 2.5 % Fe(OH)3
Sodium in zeolite was exchanged with strontium. The series of the samples withdifferent composition of compounds are shown in Table 1.
Table 1. Samples with different composition of compoundsNo. ofsample123456789101112131415
%ofRAM
102030102030102030102030102030
% of matrix
908070908070908070908070908070
Matrix
White cementWhite cementWhite cement
White cement + epoconWhite cement + epoconWhite cement + epocon
Portland cementPortland cementPortland cement
Portland cement + epoconPortland cement + epoconPortland cement + epocon
EpoconEpocon.Epocon
70
VI. simpozij HDZZ, Stubičke Toplice, 2005.
In the teflon model the cylindric samples were prepared. For every model itwas prepared 10 samples. Matrix was prepared in the different combinations ofRAM with white and portland cement and epocon resin.
The sampling schedule is defined by «Leaching testings of immobilizedradioactive material solids» and is as follows:
1. every day during the first week2. then weekly for the following five weeksLeaching is measured in closed system (iuvidure kivets). Relation of
geometrical surface of sample and the volume of liquid phase is expresed by thequotient 1:10 according to IAEA standard. The rate of releasing is measured byanalysis of strontium in the liquid phase by AAS Perkin Elmer 3030B.
The rate of leaching is determined using the equation:
(mL/m s) M s rciL Ms c V M s
R = - — - = — =At m s A t m s A t
Where:• Ris the rate of releasing radionuclides,• mL is the ammount of ion which rate of leaching is measuring in the liquid
phase, calculated on the total number of mL (c V; c - concentration of theions in g/ml, V - volume of the liquid phase),
• M s is the mass of the solidification agnt in g,• Ms is the mass of the element which rate of leaching is measured in the mass,
Ms of the solidification agent,• A is the surface of solidification agent,• t is the time of exchange of two liquid phases.
X-ray analysis was made by Phillips difractometer PW 1370. X-ray analysisshows the stability of the structure of the solidification agent. Leaching shows thatthe immobilisation matrixes are of great quality, but that there are a significantdifference between different types of matrix, that the leaching is different on 298 Kand 313 K.
The leaching depends on the ammount of RAM in solidification agent.
RESULTS AND DISCUSSIONThe results of measurements of leaching are presented in Table 2.
According to the results the level of the leaching is the highest in the systems whithwhite cement, and the lowest with epoxy resins. Cement samples show thecorrosion on 313 K, while epoxy resin rise the quality of both cements.
71
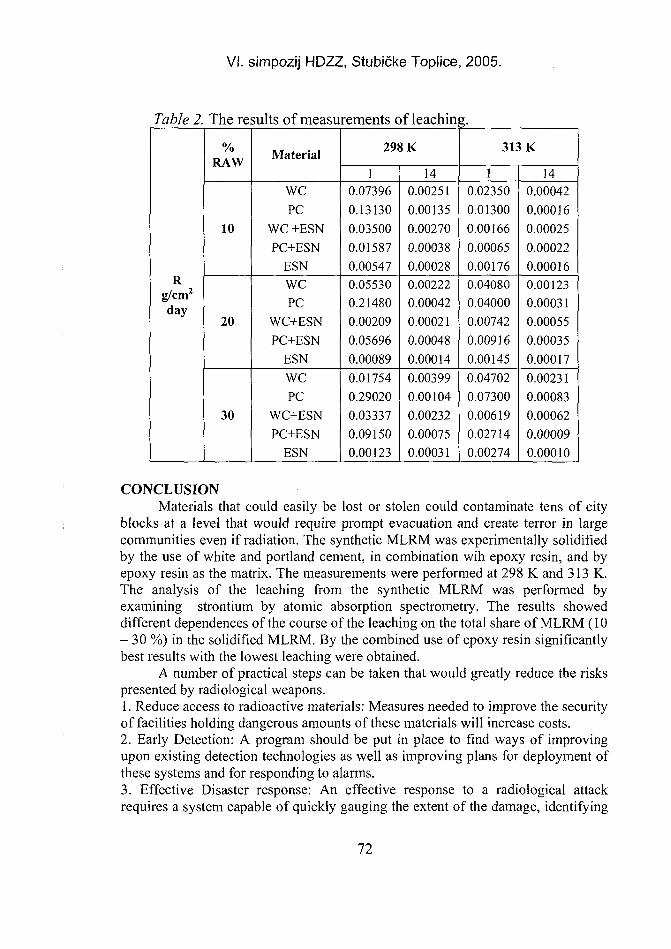
VI. simpozij HDZZ, Stubičke Toplice, 2005.
Table 2.
R, 2
g/cnrday
The results of measurements of leachinj
%RAW
10
20
30
Material
wePC
WC +ESNPC+ESN
ESNWCPC
WC+ESNPC+ESN
ESNWCPC
WC+ESNPC+ESN
ESN
298 K
10.073960.131300.035000.015870.005470.055300.214800.002090.056960.000890.017540.290200.033370.091500.00123
140.002510.001350.002700.000380.000280.002220.000420.000210.000480.000140.003990.001040.002320.000750.00031
313 K
10.023500.013000.001660.000650.001760.040800.040000.007420.009160.001450.047020.073000.006190.027140.00274
140.000420.000160.000250.000220.000160.001230.000310.000550.000350.000170.002310.000830.000620.000090.00010
CONCLUSIONMaterials that could easily be lost or stolen could contaminate tens of city
blocks at a level that would require prompt evacuation and create terror in largecommunities even if radiation. The synthetic MLRM was experimentally solidifiedby the use of white and portland cement, in combination wih epoxy resin, and byepoxy resin as the matrix. The measurements were performed at 298 K and 313 K.The analysis of the leaching from the synthetic MLRM was performed byexamining strontium by atomic absorption spectrometry. The results showeddifferent dependences of the course of the leaching on the total share of MLRM (10- 30 %) in the solidified MLRM. By the combined use of epoxy resin significantlybest results with the lowest leaching were obtained.
A number of practical steps can be taken that would greatly reduce the riskspresented by radiological weapons.1. Reduce access to radioactive materials: Measures needed to improve the securityof facilities holding dangerous amounts of these materials will increase costs.2. Early Detection: A program should be put in place to find ways of improvingupon existing detection technologies as well as improving plans for deployment ofthese systems and for responding to alarms.3. Effective Disaster response: An effective response to a radiological attackrequires a system capable of quickly gauging the extent of the damage, identifying
72
VI. simpozij HDZZ, Stubičke Toplice, 2005.
appropriate responders, developing a coherent response plan, and getting thenecessary personnel and equipment to the site rapidly.
In the end, however, we must face the brutal reality that no technologicalremedies can provide complete confidence that we are safe from radiologicalattack. Determined, malicious groups might still find a way to use radiologicalweapons or other means when their only goal is killing innocent people, and if theyhave no regard for their own lives. In the long run our greatest hope must lie inbuilding a prosperous, free world where the conditions that breed such monstershave vanished from the earth.
R E F E R E N C E S[1] International Atomic Energy Agency (IAEA). Conditioning of Low- and
Intermediate-Level Radioactive materials, IAEA, Vienna, 1983.[2] Ollila K. Quality requirements for the solidification products of reactor material.
Tech. Res. Centre of Finland, Reractor Laboratory. 1980.[3] Donato A. Incorporation of radioactive material in polymer impregnated cement,
Management of radioactive materials fron the nuclear fuel cycle, Pro. Symp. Vienna,1976, International Atomic Energy Agency (IAEA).
[4] Colombo P. Some techniques for the solidification of radioactive material in concrete.NuclTechnoll977; 32:30.
[5] Donato A. Studies on Polymer Impregnated Cement for Radioactive MaterialConditioning in Italy. Proc Second Int Congr On Polymers in Concrete, Austin,Texas, 1978.
ABSTRACTDuring the Cold War, every information about weapons of mass destruction
was treated as top secret, regardless of whether the information concerned friend orfoe. The most serious threat in our post Cold War era are terrorist radiologicaldispersal devices. "Dirty nukes" are what you may choose to build if you're unableto create a real nuclear bomb, i.e. one whose explosion is based on a nuclearreaction. A dirty bomb is a conventional explosive salted with radioactive isotopesin order to spew out that nuclear material and contaminate a wide area. Themilitary usefulness of such devices have always been in dispute. In fact, the TNT insuch a bomb may still be more dangerous than the nuclear material. Its destructivepower would really depend on the size of the conventional bomb, and the volumeand nature of nuclear material. This paper addresses the possibilities ofdecontamination and preparedness in the case of a terrorist attack or accident.
73
VI. simpozij HDZZ, Stubičke Topli HR0500031
RADIATION PROTECTION PERFORMANCE INDICATORSOF THE NPP AFTER THE MODERNISATION
Helena JanžekovičSlovenian Nuclear Safety Administration
Železna cesta 16, 1001 Ljubljana, Sloveniae-mail: [email protected]
INTRODUCTIONThe nuclear power plant safety performance indicators are developed in
order to serve as a tool used "by nuclear operating organisations to monitor theirown performance and progress, to set their own challenging goals forimprovement, and to gain additional perspective on performance relative to that ofother plants" as stated by the World Association of Nuclear Operators, WANO [1].In addition, the performance indicators are widely used by the regulatoryauthorities although the use is not harmonised yet [2]. In the year 2000 the Krškonuclear power plant (Westinghouse pressurised water reactor with electrical output700 MW) finished an extensive modernisation including the replacement of bothsteam generators. The radiation protection performance indicators after themodernisation will be presented and the problems related to the use of performanceindicators will be discussed.
MODERNISATION OF THE NPPThe commercial operation of the NPP Krško started in 1983. The
modernisation took place from 1996 to 2000 in order to:stabilise long term plant operationincrease net electrical output by 6.3%reduce annual outage duration to -30 daysincrease availability to 85% (unit forced outage rate < 2%)increase annual energy production to ~5TWh.
The modernisation included the replacement of 2 steam generators,installation of a plant specific full scope simulator at the plant site and ICCM. Themodernisation was successfully completed and the licensed reactor thermal powerwas updated to 1996 MWt. The replacement of both steam generators took place in2000 during the annual outage which lasted for 62 days.
RADIATION PROTECTION PERFORMANCE INDICATORSThe performance indicators which are widely used in NPPs in the last years
and promoted by WANO are:unit capability factor
74
VI. simpozij HDZZ, Stubičke Toplice, 2005.
unplanned capability loss factorunplanned automatic scrams per 7000 hours criticalthermal performancecollective radiation exposurevolume of low-level solid radioactive wasteindustrial safety accident ratesafety system performance (high pressure safety injection, auxiliary feedwater,emergency AC power)fuel reliabilitychemistry index.
In addition, other performance indicators are often used by a specific NPP asfor example time availability factor, load factor, number of duration of annualoutage etc. In addition, self assessment procedures which were developed in thelast years involve more and more internal indicators in order to follow theevaluation of the safety in the plant.
The performance indicators are not used just by the NPPs but also by theregulatory authority. As given in [1] the indicators are not harmonised yet and areusually the result of the agreement between the NPPs and the regulatory authority.Neither the role of the performance indicators in legislation is harmonised in allcountries.
The basic performance indicators which are related to radiation safety are:collective radiation exposurevolume of low-level radioactive wastefuel reliabilitychemistry index.
Among them the collective radiation exposure and the volume of low-levelradioactive waste are obviously related to good radiation protection practice. Otherperformance indicators mentioned are less obviously connected to radiationprotection. The fuel reliability factor (FRI) monitors progress in achieving andmaintaining high fuel integrity and is defined as a corrected steady-state primarycoolant 1 3 l I activity. The chemistry index monitors the progress in improvingchemistry control in PWR's with recirculation steam generators.
The collective radiation exposure measures the total radiation exposure ofplant personnel and also the effectiveness of radiological protection programs. Themeasurements are done by a film or a TLD dosimeter. The readings of theoperational dosimeters are taken into account just in cases when the TLD or filmbadges data are not available. The annual collective radiation exposure from 1996to 2003 in the Krško NPP is presented in Figure 1.
Before the replacement of both steam generators a positive trend in theannual collective dose can be observed partly due to intervention on the steamgenerators and partly due to preparation on the final stage of the modernisation.After modernisation the annual collective dose is substantially lower and is
75
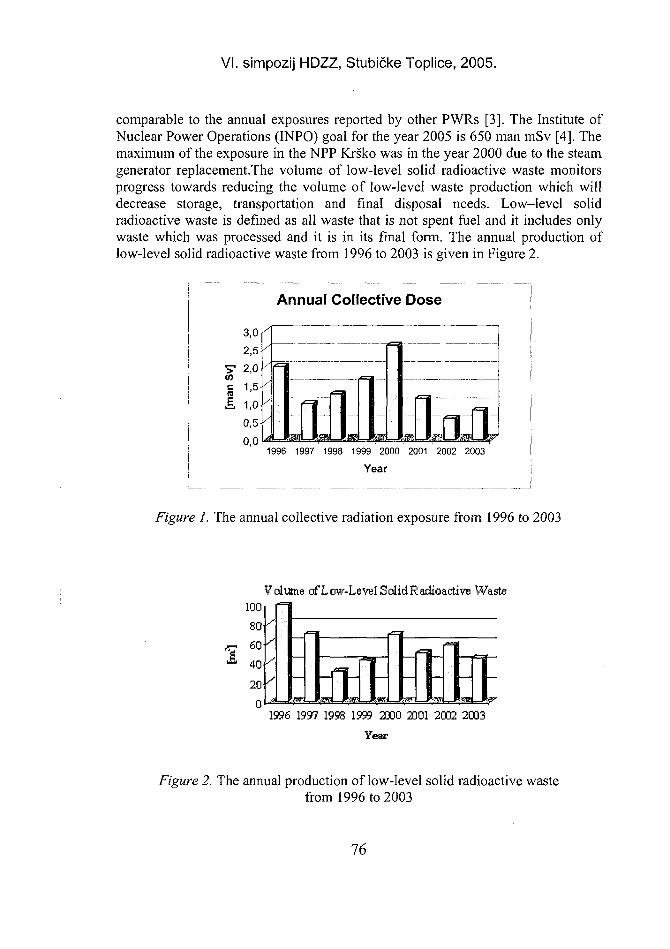
VI. simpozij HDZZ, Stubičke Toplice, 2005.
comparable to the annual exposures reported by other PWRs [3]. The Institute ofNuclear Power Operations (INPO) goal for the year 2005 is 650 man mSv [4]. Themaximum of the exposure in the NPP Krško was in the year 2000 due to the steamgenerator replacement.The volume of low-level solid radioactive waste monitorsprogress towards reducing the volume of low-level waste production which willdecrease storage, transportation and final disposal needs. Low-level solidradioactive waste is defined as all waste that is not spent fuel and it includes onlywaste which was processed and it is in its final form. The annual production oflow-level solid radioactive waste from 1996 to 2003 is given in Figure 2.
Annual Collective Dose I
3,0
2,5
T 2,0
1,5
1,0
0,5
0,0 J1996 1997 1998 1999 2000 2001 2002 2003
Year
Figure I. The annual collective radiation exposure from 1996 to 2003
Volume of Low-Level Solid Radioactive Waste100
SO
60
40
20
01996 1997 1998 1999 2000 2001 2002 2003
Year
Figure 2. The annual production of low-level solid radioactive wastefrom 1996 to 2003
76
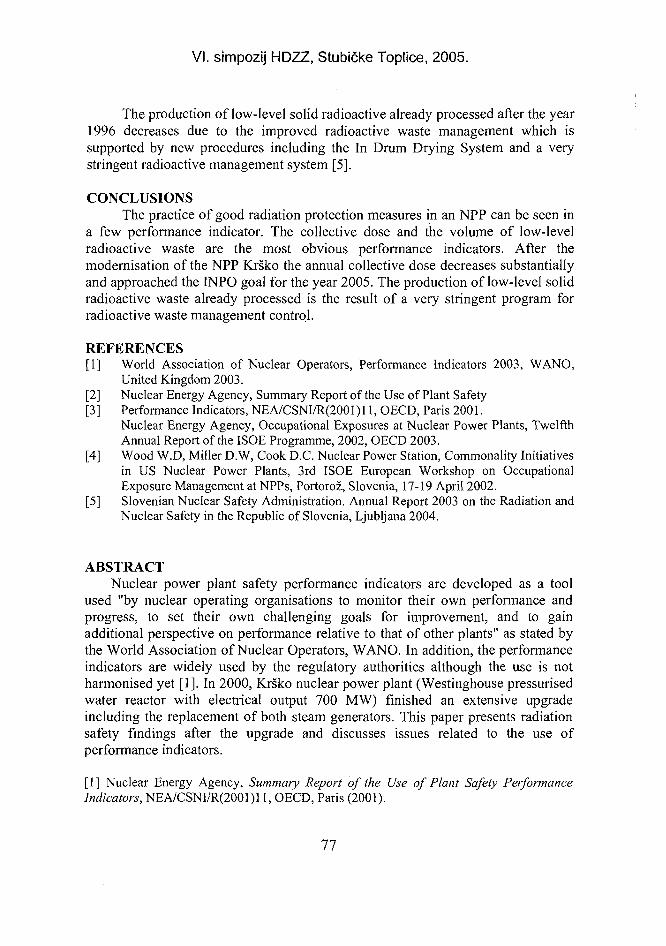
VI. simpozij HDZZ, Stubičke Toplice, 2005.
The production of low-level solid radioactive already processed after the year1996 decreases due to the improved radioactive waste management which issupported by new procedures including the In Drum Drying System and a verystringent radioactive management system [5].
CONCLUSIONSThe practice of good radiation protection measures in an NPP can be seen in
a few performance indicator. The collective dose and the volume of low-levelradioactive waste are the most obvious performance indicators. After themodernisation of the NPP Krško the annual collective dose decreases substantiallyand approached the INPO goal for the year 2005. The production of low-level solidradioactive waste already processed is the result of a very stringent program forradioactive waste management control.
REFERENCES[1] World Association of Nuclear Operators, Performance Indicators 2003, WANO,
United Kingdom 2003.[2] Nuclear Energy Agency, Summary Report of the Use of Plant Safety[3] Performance Indicators, NEA/CSNI/R(2001)l 1, OECD, Paris 2001.
Nuclear Energy Agency, Occupational Exposures at Nuclear Power Plants, TwelfthAnnual Report of the ISOE Programme, 2002, OECD 2003.
[4] Wood W.D, Miller D.W, Cook D.C. Nuclear Power Station, Commonality Initiativesin US Nuclear Power Plants, 3rd ISOE European Workshop on OccupationalExposure Management at NPPs, Portorož, Slovenia, 17-19 April 2002.
[5] Slovenian Nuclear Safety Administration. Annual Report 2003 on the Radiation andNuclear Safety in the Republic of Slovenia, Ljubljana 2004.
ABSTRACTNuclear power plant safety performance indicators are developed as a tool
used "by nuclear operating organisations to monitor their own performance andprogress, to set their own challenging goals for improvement, and to gainadditional perspective on performance relative to that of other plants" as stated bythe World Association of Nuclear Operators, WANO. In addition, the performanceindicators are widely used by the regulatory authorities although the use is notharmonised yet [1]. In 2000, Krško nuclear power plant (Westinghouse pressurisedwater reactor with electrical output 700 MW) finished an extensive upgradeincluding the replacement of both steam generators. This paper presents radiationsafety findings after the upgrade and discusses issues related to the use ofperformance indicators.
[ 1 ] Nuclear Energy Agency, Summary Report of the Use of Plant Safety PerformanceIndicators, NEA/CSNI/R(2001)11, OECD, Paris (2001).
77
VI. simpozij HDZZ, Stubičke Toplice HR0500032
ELASTIC SCATTERING OF ELECTRONS AND POSITRONS
Ines Krajcar BronićRuder Bošković Institute, Bijenička 54, HR-10000 Zagreb, Croatia
e-mail: [email protected]
INTRODUCTIONElectrons and positrons interact with matter through several competing
mechanisms, elastic and inelastic scattering being the most abundant. Elasticscattering is considered as the non-radiative interaction between the projectileelectron or positron and a target atom/molecule in which the internal energy of thetarget is not changed. In measurements of electron scattering by molecules, pureelastic scattering cannot be resolved from low-energy vibrational or rotationalexcitations; and the term quasi-elastic scattering is used.
Elastic scattering has a prominent influence on the transport of fast electronsand positrons in matter. In elastic collisions, these particles may undergo largedeflections and, as a result, the space distribution of dose from electrons andpositrons depends strongly on the elastic scattering properties of the medium.
The demand for accurate cross sections of electron and positron interactionswith different atoms and molecular systems has been growing rapidly in theapplied science community. In particular detailed information on elastic scatteringof these particles by molecules is required for Monte Carlo simulations inmicrodosimetry, radiation dosimetry, nuclear medicine, radiation therapy, radiationprotection, atmospheric and plasma physics, various electron-spectrotroscopictechniques, etc. A similar need arises in modeling the energy deposition associatedwith the interaction of any form of ionising radiation with matter.
REPORT COMMITTEEInternational Commission for Radiation Units and Measurements (ICRU),
having headquarters in Bethesda, MD, USA, formed in 2000 a Report Committeethat should prepare a new ICRU Report on "Elastic Scattering of Electrons andPositrons" (ESEP). The report should constitute a synthesis of the leading scientificthinking on matters of radiation quantities, units and measurements techniques andprovide recommendations that represent an international consensus on thesematters [1]. The ICRU sponsors for this activity are Dr. Mitio Inokuti (ArgonneNational Laboratory, USA, and ICRU) and Mr. Steven M. Seltzer (NationalInstitute of Standards and Technology, USA). Dr. Francesc Salvat (Faculty ofPhysics, University of Barcelona, Spain) has been appointed as the Chairman of theESEP Report Committee. The members are Dr. Martin J. Berger (Bethesda, MD,USA, U12004), Prof. Dr. Aleksander Jablonski (Institute of Physical Chemistry,
78
VI. simpozij HDZZ, Stubičke Toplice, 2005.
Polish Academy of Sciences, Warszawa, Poland), Dr. Ines Krajcar Bronić (RudjerBošković Institute, Zagreb, Croatia), Dr. James Mitroy (Faculty of Science,Northern Territory University, Darwin, Australia), Dr. Cedric J. Powell (NIST,USA) and Dr. Leon Sanche (Faculty of Medicine, University of Sherbrooke,Canada).
The first meeting of the Report Committee was held in ICRU Headquartersin Bethesda, MD, in April 2000. The objectives and scopes of the report have beenelaborated and the outline of the report was discussed. Each Report Committeemember received specific tasks and duties. On the second meeting in Bethesda inDecember 2001, the individual contributions were presented and discussed. Thenext meeting of the Report Committee was held in Barcelona, Spain, in June 2003.The Report has been presented in its final form, and the discussion was directedinto making the report more consistent and homogeneous.
OUTLINE OF THE REPORTThe ESEP Report consists of the following chapters:1. Introduction (including nomenclature, application of data to be given in the
Report, and scope of the report);2. Experimental methods (measurement techniques of differential cross
sections (DCS), integral elastic (ae |) and momentum transfer (amt) crosssections; for gases, liquids and solids);
3. Theoretical background (fundamentals of scattering theory, quantum theory,approximation methods, elastic scattering by molecules, scattering in thecondensed phase, positron scattering);
4. Calculations for atoms (numerical calculation methods, properties of thephase shifts, DCS for atoms, high-energy factorization) for energies above100 eV;
5. Experimental data (comparison of theoretical with experimental data, atomicand molecular gases, condensed phases);
6. Multiple-scattering angular deflections.Two appendices contain details on the theory of relativistic kinematics and
the Dirac equation. Bibliography contains more than 300 relevant references. TheCD ROM with the original software for calculating DCS will be distributed withthe Report. For the calculation of DCSs for free atoms the central optical modelpotential is used [2]. The type of the incident particle and its energy, the targetatom, and the choice of the model can be chosen by the user. A program forcalculation DCSs for electron or positron scattering by molecules according to theindependent atom approximation will be also available [3].
EXPERIMENTAL TECHNIQUESThe experimental techniques used to study electron collisions with atoms
and molecules can be broadly classified into two groups: beam experiments (where
19
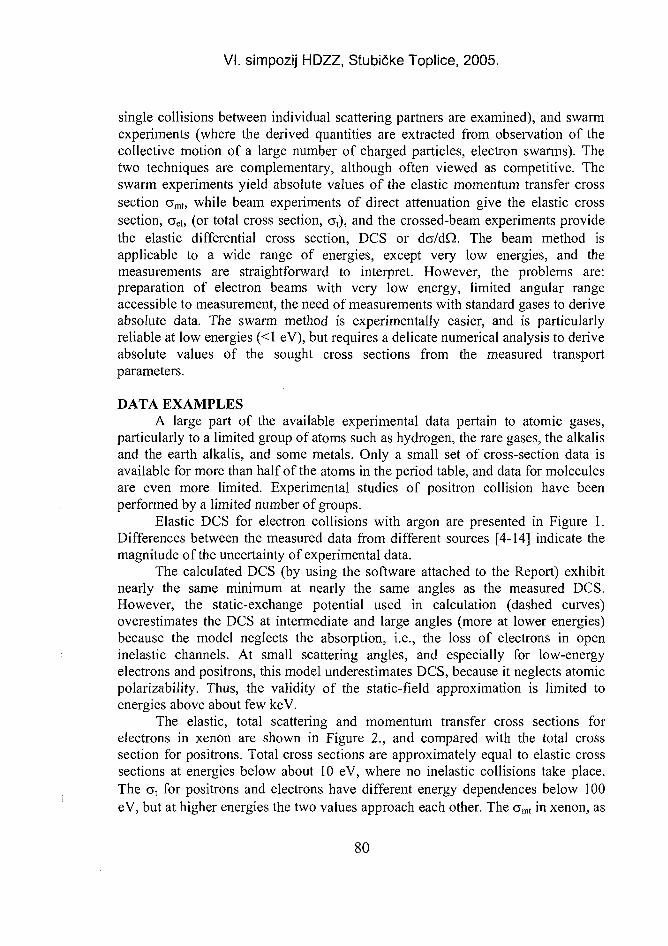
VI. simpozij HDZZ, Stubičke Toplice, 2005.
single collisions between individual scattering partners are examined), and swarmexperiments (where the derived quantities are extracted from observation of thecollective motion of a large number of charged particles, electron swarms). Thetwo techniques are complementary, although often viewed as competitive. Theswarm experiments yield absolute values of the elastic momentum transfer crosssection amt, while beam experiments of direct attenuation give the elastic crosssection, aei, (or total cross section, a t), and the crossed-beam experiments providethe elastic differential cross section, DCS or da/dQ. The beam method isapplicable to a wide range of energies, except very low energies, and themeasurements are straightforward to interpret. However, the problems are:preparation of electron beams with very low energy, limited angular rangeaccessible to measurement, the need of measurements with standard gases to deriveabsolute data. The swarm method is experimentally easier, and is particularlyreliable at low energies (<1 eV), but requires a delicate numerical analysis to deriveabsolute values of the sought cross sections from the measured transportparameters.
DATA EXAMPLESA large part of the available experimental data pertain to atomic gases,
particularly to a limited group of atoms such as hydrogen, the rare gases, the alkalisand the earth alkalis, and some metals. Only a small set of cross-section data isavailable for more than half of the atoms in the period table, and data for moleculesare even more limited. Experimental studies of positron collision have beenperformed by a limited number of groups.
Elastic DCS for electron collisions with argon are presented in Figure 1.Differences between the measured data from different sources [4-14] indicate themagnitude of the uncertainty of experimental data.
The calculated DCS (by using the software attached to the Report) exhibitnearly the same minimum at nearly the same angles as the measured DCS.However, the static-exchange potential used in calculation (dashed curves)overestimates the DCS at intermediate and large angles (more at lower energies)because the model neglects the absorption, i.e., the loss of electrons in openinelastic channels. At small scattering angles, and especially for low-energyelectrons and positrons, this model underestimates DCS, because it neglects atomicpolarizability. Thus, the validity of the static-field approximation is limited toenergies above about few keV.
The elastic, total scattering and momentum transfer cross sections forelectrons in xenon are shown in Figure 2., and compared with the total crosssection for positrons. Total cross sections are approximately equal to elastic crosssections at energies below about 10 eV, where no inelastic collisions take place.The a, for positrons and electrons have different energy dependences below 100eV, but at higher energies the two values approach each other. The crmt in xenon, as
80
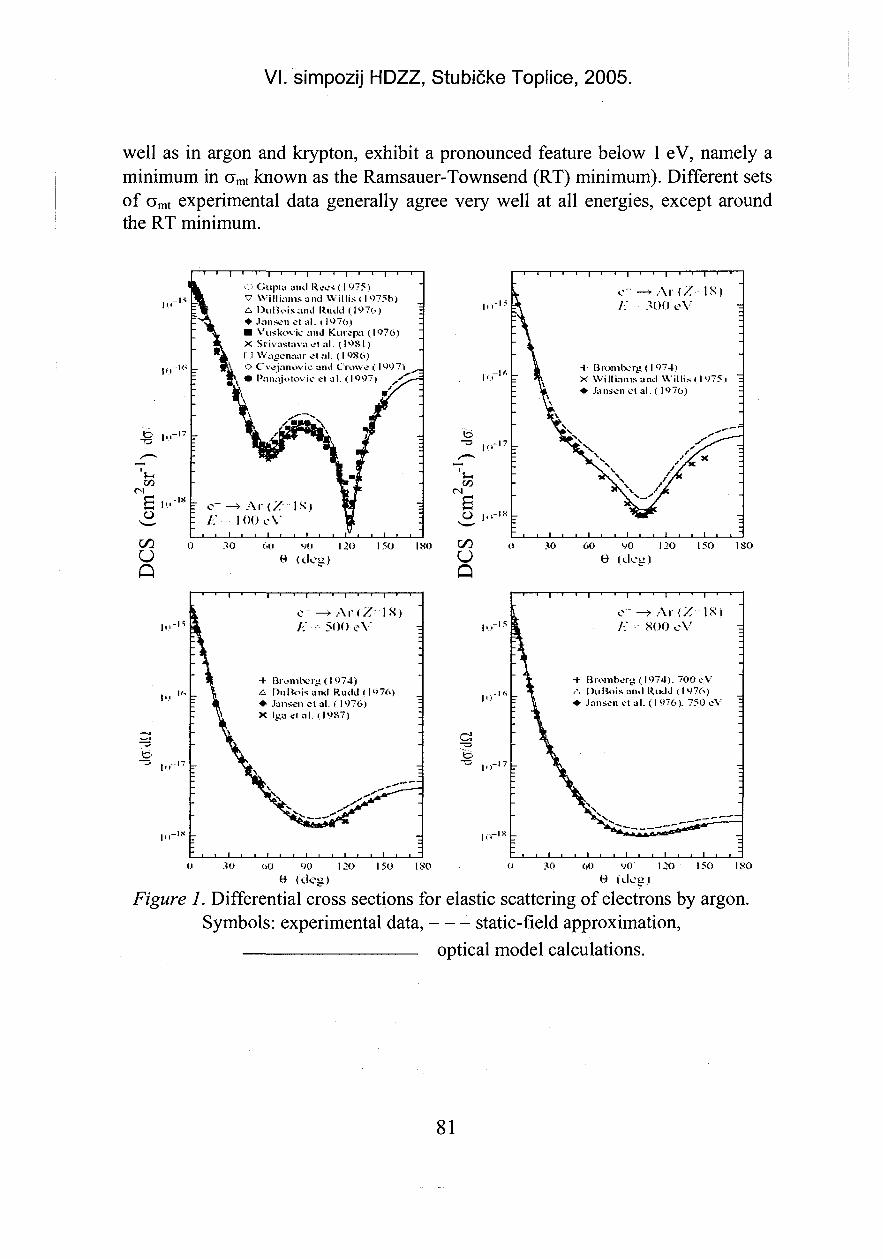
VI. simpozij HDZZ, Stubičke Toplice, 2005.
well as in argon and krypton, exhibit a pronounced feature below 1 eV, namely aminimum in amt known as the Ramsauer-Townsend (RT) minimum). Different setsof crmt experimental data generally agree very well at all energies, except aroundthe RT minimum.
C Ciiipta and Rocs (I 975)v Williams and Willis < I 975b)
DuHoisand Rudd (1970)• Janson el ul. (1976)• Vuskovk- and Kurcpa (1976)X Srivaslava ol al. (1981)CJ Wagenaar el :il. ( I 986)O C'vcjanovic and Crowe (
Ai <Z IS)l O O o V
150 180
1 . . . - "
I . , - 1 *
It ' l 7
I I - ' "
• • 1
r \
: \
11
i|
i i
• • i
•X
t • 1
• • 1 • • 1 i i
c —> A r ( Z/;••••••- 5 0 0 e V
I • •
IS)
Bromherg (1 974)DuBois and Rudd (1976)Jansenel al. ( 1976) :Iga otal. (1987) I
^ — ' " ' A T E
-
I I I "
6O |,
u
| M - ' *
o- l f t
11 n
i i
HX•
o - - » A r ( / IS)/:" 300 eV •;
llroml-vri; (1 974)Wi 11 iciin.s and Willis f 1 975 i ~-Jansenet al.( 1976) :
60 90 120 150 ISOe (Joii)
•» A r ( Z IS)8 0 0 c V
+ Urombery (1974). 700 cVA IXiRois and Rudd (1 976)
n ot al. (1976). 750 eV
<M <><) I2O 150 180 60 90 120 150 ISO0 (cleg) 9 klog)
Figure 1. Differential cross sections for elastic scattering of electrons by argon.Symbols: experimental data, static-field approximation,
optical model calculations.
81
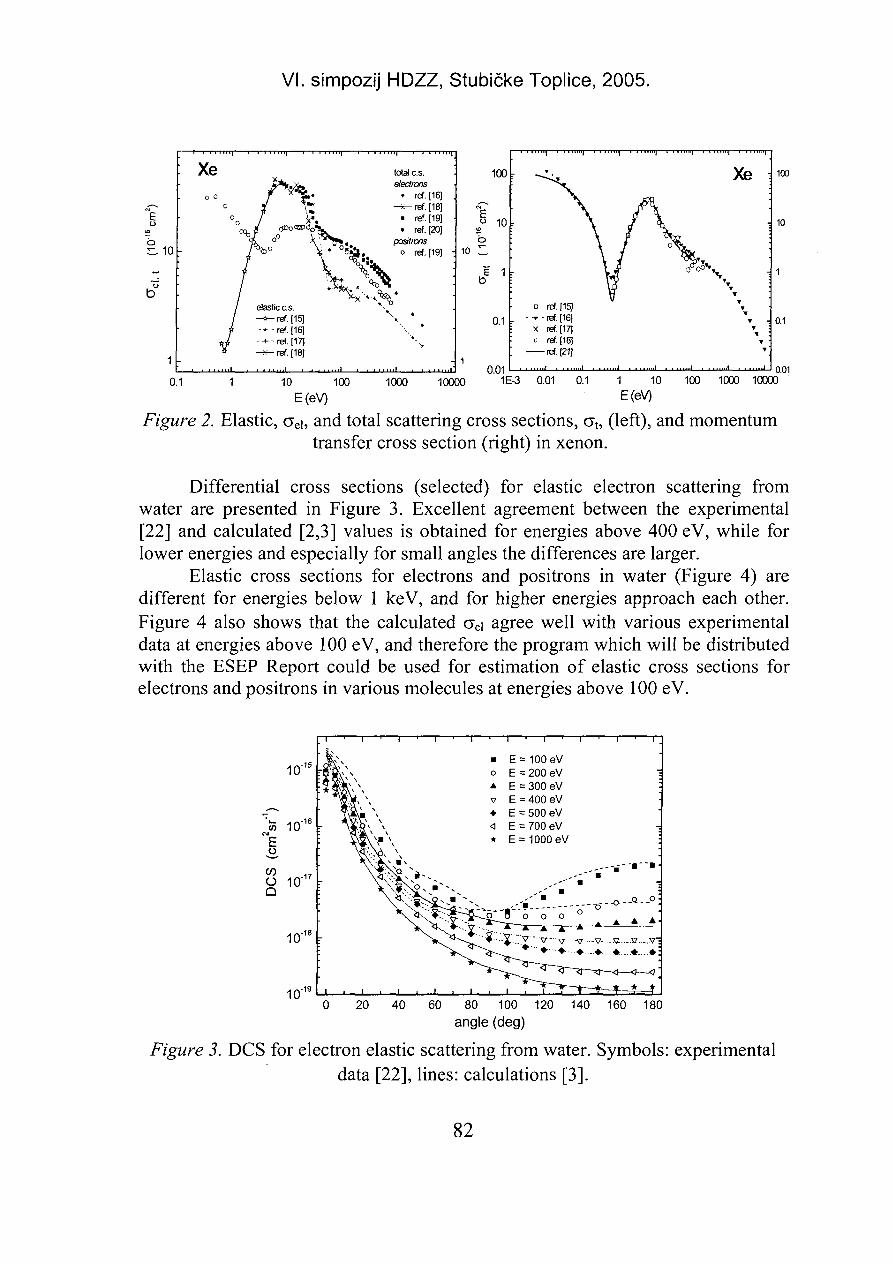
VI. simpozij HDZZ, Stubičke Toplice, 2005.
E
o10
Xe total c.s.elections
• ref. [16]- * - ref. [18]
• ref. [19]. ref. [20]
positronso ref. [19] :
100
10
10
0.1
0.01
Xe
D ref. [15]• T • ref. [16]
x ref. [17]o ref. [18]
ref. [21]
100
10
0.1
0.010.1 1000 10000 1E-3 0.01 0.1 1 10 100 1000 10000
E(eV)1 10 100
E(eV)
Figure 2. Elastic, aei, and total scattering cross sections, a t, (left), and momentumtransfer cross section (right) in xenon.
Differential cross sections (selected) for elastic electron scattering fromwater are presented in Figure 3. Excellent agreement between the experimental[22] and calculated [2,3] values is obtained for energies above 400 eV, while forlower energies and especially for small angles the differences are larger.
Elastic cross sections for electrons and positrons in water (Figure 4) aredifferent for energies below 1 keV, and for higher energies approach each other.Figure 4 also shows that the calculated aei agree well with various experimentaldata at energies above 100 eV, and therefore the program which will be distributedwith the ESEP Report could be used for estimation of elastic cross sections forelectrons and positrons in various molecules at energies above 100 eV.
10,-15
CO 17O 10*17
Q
10"
10"
I ' I
• E = 100eVo E = 200 eVA E = 300 eVv E = 400 eV• E = 500 eV< E = 700 eV* E = 1000eV
_ -Q - -O
0 20 40 60 80 100 120 140 160 180
angle (deg)
Figure 3. DCS for electron elastic scattering from water. Symbols: experimentaldata [22], lines: calculations [3].
82
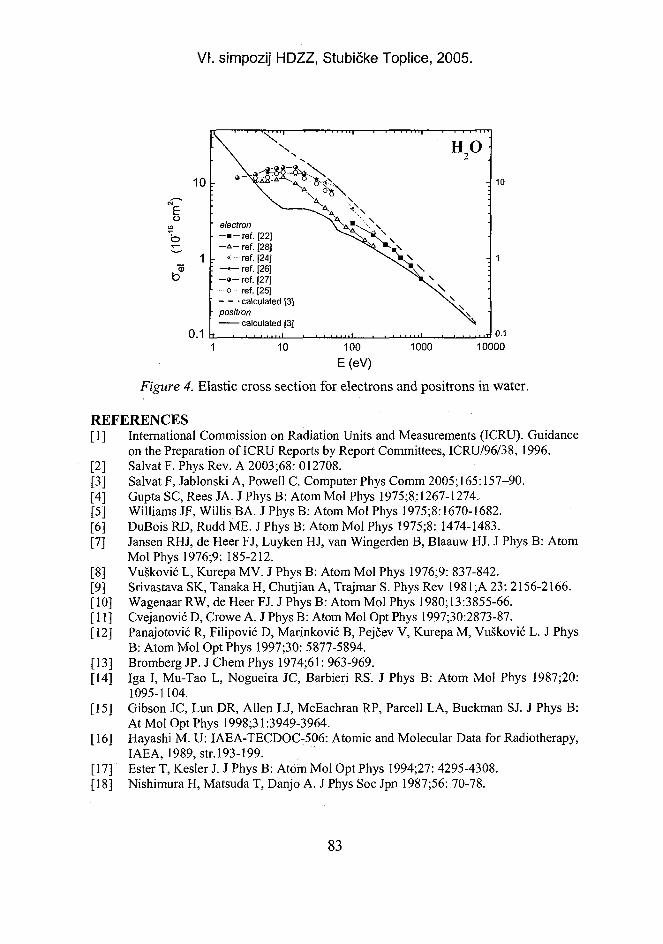
VI. simpozij HDZZ, Stubičke Toplice, 2005.
o
10
1
0.1
electron ^ v ? ^ " \ ;- . - r e f . [22] ^ - ^- A - ref. [28J ^
- •>. ref. [24]-*— ref. [26]- » - ref. [27]
o ref. [25]— • calculated [3]positron
calculated [3]
H2O
:
\*<: -%\ :
\ s
I r
- 10
- 1
10 100
E(eV)1000
0.110000
Figure 4. Elastic cross section for electrons and positrons in water.
REFERENCES[I] International Commission on Radiation Units and Measurements (ICRU). Guidance
on the Preparation of ICRU Reports by Report Committees, ICRU/96/38, 1996.[2] Salvat F. Phys Rev. A 2003 ;68: 012708.[3] Salvat F, Jablonski A, Powell C. Computer Phys Comm 2005;165:157-90.[4] Gupta SC, Rees JA. J Phys B: Atom Mol Phys 1975;8:1267-1274.[5] Williams JF, Willis BA.J Phys B: Atom Mol Phys 1975;8:1670-1682.[6] DuBois RD, Rudd ME. J Phys B: Atom Mol Phys 1975;8: 1474-1483.[7] Jansen RHJ, de Heer FJ, Luyken HJ, van Wingerden B, Blaauw HJ. J Phys B: Atom
Mol Phys 1976;9: 185-212.[8] Vušković L, Kurepa MV. J Phys B: Atom Mol Phys 1976;9: 837-842.[9] Srivastava SK, Tanaka H, Chutjian A, Trajmar S. Phys Rev 1981;A 23: 2156-2166.[10] WagenaarRW, de Heer FJ.J Phys B: Atom Mol Phys 1980;13:3855-66.[II] Cvejanović D, Crowe A. J Phys B: Atom Mol Opt Phys 1997;30:2873-87.[12] Panajotović R, Filipović D, Marinković B, Pejčev V, Kurepa M, Vušković L. J Phys
B: Atom Mol Opt Phys 1997;30: 5877-5894.[13] Bromberg JP. J Chem Phys 1974;61: 963-969.[14] Iga I, Mu-Tao L, Nogueira JC, Barbieri RS. J Phys B: Atom Mol Phys 1987;20:
1095-1104.[15] Gibson JC, Lun DR, Allen LJ, McEachran RP, Parceli LA, Buckman SJ. J Phys B:
At Mol Opt Phys 1998;31:3949-3964.[16] Hayashi M. U: IAEA-TECDOC-506: Atomic and Molecular Data for Radiotherapy,
IAEA, 1989, str. 193-199.[17] Ester T, Kesler J. J Phys B: Atom Mol Opt Phys 1994;27: 4295-4308.[18] Nishimura H, Matsuda T, Danjo A. J Phys Soc Jpn 1987;56: 70-78.
83
VI. simpozij HDZZ, Stubičke Toplice, 2005.
[19] Dababneh MS, Hsieh Y-F, Kauppila WE, Pol V, Stein TS. Phys Rev A 1982; 26/3:1252-1259.
[20] Wagenaar RW, de Heer FJ. J Phys B: Atom Mol Phys 1980; 13:3855-66.[21] Elford MT, Buckman SJ. U: Landolt-Bornstein, Numerical Data and Functional
Relationships in Science and Technology, New Series, Vol. 17, Springer 2000. str.2-35 - 2-56.
[22] Katase A, Ishibashi K, Matsumoto Y, Sakae T, Maezono S, Kurakami E, WatanabeK, Maki H. J Phys B: At Mol Phys 1986;19:2715-2734.
[23] Saglam Z, Aktekin N. J Phys B: At Mol Phys 1990;23:1529-1536. and J. Phys. B:At. Mol. Opt. Phys. 1991;24:3491-3496.
[24] Sueoka O, Mori S, Katayama Y. J Phys B: At Mol Phys 1986; 19: L373-8.[25] Cho H, Lee H, Park YS. Radiat Phys Chem 2003;68: 115-120.[26] Johnstone WM, Newell WR. J Phys B: At Mol Opt Phys 1991;24:3633-43.[27] Shyn TW, Cho SY. Phys Rev A 1987;36: 5138-5142.[28] Danjo A, Nishimura H. J Phys Soc Jpn 1985;54: 1224-1227.
ABSTRACTElectrons and positrons interact with matter through several competing
mechanisms, elastic and inelastic scattering being the most frequent. Elasticscattering is a non-radiative interaction between the projectile electron or positronand a target atom/molecule in which the internal energy of the target is notchanged. Elastic scattering greatly affects the transport of fast electrons andpositrons in matter. In elastic collisions, these particles may undergo largedeflections and, as a result, the space distribution of dose from electrons andpositrons depends strongly on the elastic scattering properties of the medium.Knowledge of elastic-scattering cross sections of electrons and positrons is neededin modelling the deposition of energy when beams of these particles or any form ofionising radiation interact with matter. Specific application fields range fromradiation dosimetry, radiation therapy, radiation processing, radiation sensors, andradiation protection to atmospheric studies, plasma physics and material analysis(e.g., by electron-probe microanalysis, analytical electron microscopy, Auger-electron spectroscopy, and X-ray photoelectron spectroscopy). In 2000 TheInternational Commission for Radiation Units and Measurements (ICRU)established a Report Committee to prepare the ICRU Report on "Elastic Scatteringof Electrons and Positrons". The Report contains theoretical background of elasticscattering, description of measurement methods, and comparison of theexperimental and theoretical cross sections (differential, integral elastic andmomentum transfer. The CD ROM with the original software for calculatingdifferential cross sections will be distributed with the Report. This paper presentsseveral examples of comparison of the experimental and theoretical cross sections.A large part of available experimental data is obtained for atomic gases,particularly for a limited group of atoms such as hydrogen and rare gases.Experimental data for molecules are very limited, as well as for positron scattering.
84
DOZIMETRIJA ZRAČENJA IINSTRUMENTACIJA
RADI A TION DOSIMETRY ANDINSTR UMENTA TION

VI. simpozij HDZZ, Stubičke Toplice, HR0500033
HARMONISATION OF MEASUREMENTS IN RADIATIONPROTECTION
Matjaž Štuheć', Saveta Miljanic and Branko Vekić2
'Jožef Stefan Institute, Jamova 39, SI-1000 Ljubljana, Slovenia2 Ruđer Bošković Institute, Bijenička c. 54, HR-10000 Zagreb, Croatia
e-mail: [email protected]
INTRODUCTIONRequirements for dose limits in radiation protection as expressed in the
Basic Safety Standards [1] are based on body quantities, defined as average dosesin organs and tissues of human body. The concept of the effective dose is used forestimation of whole body dose of internal as well as external exposure. Thedrawback of this definition is that the body quantities can not directly be measured.Operational quantities are used instead in measurements to approximate the bodyquantities.
In European countries new operational quantities were put in legislation in2000. Before joining EU Slovenian radiation protection legislation was harmonisedin 2004 with the international standards. All radiation protection doses should bereported in new quantities and new instruments purchased should comply with thenew legislation, although old instruments are allowed to be used till the end of theirIifespan. No specific instructions were given how to calibrate old instruments formeasurements in new quantities.
As a consequence of demands for harmonisation of measurements with thenew operational quantities, major concern of calibration service is how to changethe readings of old instruments with minimum costs for the users.
OPERATIONAL QUANTITIESIn radiation protection dosimetry the quantity exposure in the unit of
roentgens (R) can still be found on displays of older instruments in use. The factthat exposure in air measured in roentgens is close to 0,01 Sv of absorbed dose tosoft tissue or water was widely used in personal as well as environmentaldosimetry. In Germany the quantity photon dose equivalent //x, measured insieverts (Sv) was defined [2] in the 80's to legalize the use of old dosimeterscalibrated in units of R.
In the 90's ICRU developed new operational quantities for area andindividual monitoring of external radiation [3]. They were designed to be the bestconservative estimate of the effective dose. In the new concept ionising radiation isdivided according to its penetrating power to low penetrating and high penetratingradiation. The same operational quantities are used for all types of external
87
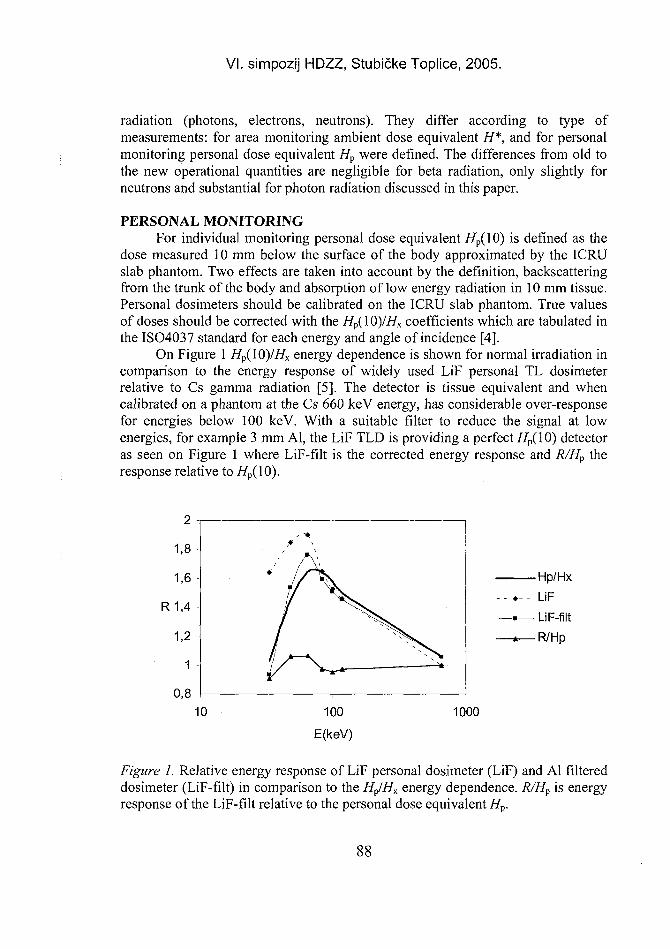
VI. simpozij HDZZ, Stubičke Toplice, 2005.
radiation (photons, electrons, neutrons). They differ according to type ofmeasurements: for area monitoring ambient dose equivalent H*, and for personalmonitoring personal dose equivalent Hp were defined. The differences from old tothe new operational quantities are negligible for beta radiation, only slightly forneutrons and substantial for photon radiation discussed in this paper.
PERSONAL MONITORINGFor individual monitoring personal dose equivalent Hp(\0) is defined as the
dose measured 10 mm below the surface of the body approximated by the ICRUslab phantom. Two effects are taken into account by the definition, backscatteringfrom the trunk of the body and absorption of low energy radiation in 10 mm tissue.Personal dosimeters should be calibrated on the ICRU slab phantom. True valuesof doses should be corrected with the HP(\O)/HK coefficients which are tabulated inthe ISO4037 standard for each energy and angle of incidence [4].
On Figure 1 Hp(l0)/HK energy dependence is shown for normal irradiation incomparison to the energy response of widely used LiF personal TL dosimeterrelative to Cs gamma radiation [5]. The detector is tissue equivalent and whencalibrated on a phantom at the Cs 660 keV energy, has considerable over-responsefor energies below 100 keV. With a suitable filter to reduce the signal at lowenergies, for example 3 mm Al, the LiF TLD is providing a perfect Hp(\0) detectoras seen on Figure 1 where LiF-filt is the corrected energy response and R/Hp theresponse relative to Hp(l0).
1000
Figure 1. Relative energy response of LiF personal dosimeter (LiF) and Al filtereddosimeter (LiF-filt) in comparison to the Hp/Hx energy dependence. R/Hp is energyresponse of the LiF-filt relative to the personal dose equivalent Hp.
88
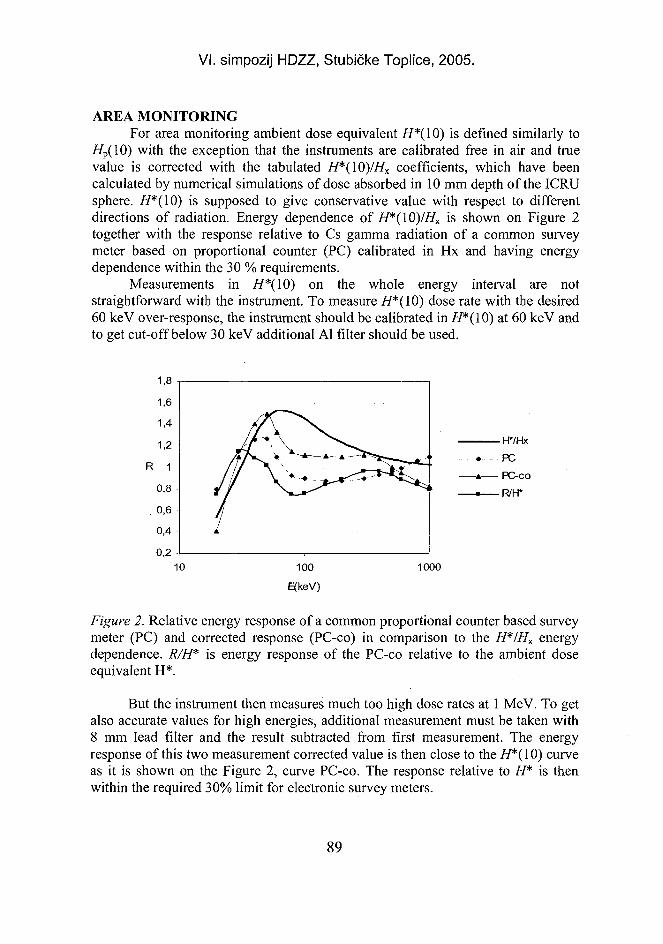
VI. simpozij HDZZ, Stubičke Toplice, 2005.
AREA MONITORINGFor area monitoring ambient dose equivalent //*(10) is defined similarly to
//p(10) with the exception that the instruments are calibrated free in air and truevalue is corrected with the tabulated //*(10)///x coefficients, which have beencalculated by numerical simulations of dose absorbed in 10 mm depth of the ICRUsphere. //*(10) is supposed to give conservative value with respect to differentdirections of radiation. Energy dependence of H*(10)/HK is shown on Figure 2together with the response relative to Cs gamma radiation of a common surveymeter based on proportional counter (PC) calibrated in Hx and having energydependence within the 30 % requirements.
Measurements in H*(\0) on the whole energy interval are notstraightforward with the instrument. To measure H*(\0) dose rate with the desired60 keV over-response, the instrument should be calibrated in //*(10) at 60 keV andto get cut-off below 30 keV additional Al filter should be used.
-H*/Hx
1000
Figure 2. Relative energy response of a common proportional counter based surveymeter (PC) and corrected response (PC-co) in comparison to the H*IHX energydependence. R/H* is energy response of the PC-co relative to the ambient doseequivalent H*.
But the instrument then measures much too high dose rates at 1 MeV. To getalso accurate values for high energies, additional measurement must be taken with8 mm lead filter and the result subtracted from first measurement. The energyresponse of this two measurement corrected value is then close to the H*(l0) curveas it is shown on the Figure 2, curve PC-co. The response relative to H* is thenwithin the required 30% limit for electronic survey meters.
89
VI. simpozij HDZZ, Stubičke Toplice, 2005.
CONCLUSIONHarmonisation of measurements to comply with the new operational
quantities is discussed for two types of instruments, one personal dosimeter andone ambient survey meter. Most of LiF base TLD-s are already capable formeasurements in //p(10). In principle it is possible to use old survey instruments aswell for measurements in H*(\0) in order to reduce the cost of buying new onesbut with paying extra time with more elaborate interpretation of results.
REFERENCES[1] International Atomic Energy Agency (IAEA). International Basic Safety Standards
for Protection against Ionising Radiation and for the Safety of Radiation Sources.Safety Series No. 115. Vienna: IAEA; 1996.
[2] Alberts W G, Ambrosi P, Boem J, Dietze G, Hohlfeld K and Will W. New dosequantities in radiation protection. PRB-Bericht PTB-Dos-23e. Braunschweig: PTB;August 1996.
[3] International Commision on Radiation Units and Measurements (ICRU).Measurements of Dose Equivalents from External Photon and Electron Radiations.ICRU Report 47. BethesdaMD: ICRU; 1992.
[4] International Organisation for Standardisation, X and Gamma Reference Radiationfor Calibrating Dosemeters and Doserate Meters and for Determining TheirResponse As A Function Of Photon Energy - Part 3: Calibration of Area and[lJPersonal Dosemeters and the Measurements of their Response as a Function ofEnergy and Angle of Incidence. ISO/DIS 4037-3. Geneva: ISO; 1999.
[5] Miljanić S, Knežević Ž, Štuhec M, Ranogajec-Komor M, Krpan K and Vekić B.Energy dependence of new thermoluminiscent detectors in terms of//p(10) values.Radiat Prot Dosim 2002; 100 (1-4): 253-256.
ABSTRACTNew operational quantities Hp(\0) and Hx(l0) are used in radiation
protection according to the Basic Safety Standards. While some termo luminescentdosimeters are ready to be used with new quantities with minor changes in thecalibration constant, in general response electronic survey meters differ over theenergy interval of interest from the response when calibrated in old units. Inprinciple, it is possible to use old survey instruments for measurements in H*(l0)in order to reduce the expenses of buying new ones, but this requires extra time formore elaborate interpretation of results.
90
VI. simpozij HDZZ, Stubičke Toplice, HR0500034
PorTL®- A COMPACT, PORTABLE TLD READER FORENVIRONMENTAL AND PERSONAL DOSIMETRY
Sdndor Deme, Istvdn Apathy, Ldszlo Bodndr, Antal Csoke, Istvdn Feherand Tamds Pdzmdndi
KFKI Atomic Energy Research Institute, H-1525 Budapest, P.O.Box 49, Hungarye-mail: [email protected]
INTRODUCTIONThe most known advantages of thermoluminescent detectors (TLDs) are
their independence of the power supply, small dimension, sensitivity, goodstability, wide measuring range, resistance to environmental effects and relativelylow cost. However, this method involves the disadvantage that the detectors mustbe transported for evaluation to a laboratory equipped by a large, heavy andexpensive TLD reader operated by qualified personal with considerably increasingthe costs and delaying the achievement of the results. To overcome the above-mentioned disadvantage, the KFKI Atomic Energy Research Institute (KFKIAEKI) with the contribution of BL Electronics Bt. (Hungary) and Eril Research,Inc. (USA) has developed a new and unique TLD system containing a small,portable, battery powered and moderate price reader (named "PorTL") forcommercial use and a series of dosimeters fitted to it. The construction was basedon their experience achieved by the unique "Pille" TLD system generations thatwere and are successfully applied on board spacecraft and space stations since1980 [1-4]. Last version of the "Pille" system is used as service instrument of theRussian segment of ISS. With regard to laboratory systems, PorTL has a number ofadvantages:- It is small, light, portable, and battery powered;- All of the measured data and operational parameters are stored in the reader
itself;- It is easy to handle, not requiring special qualification;- The dosimeters are much more durable than those of most traditional systems;- The dosimeters can be read out and evaluated at the place of exposure;- The reader can read out a dosimeter inserted in it automatically with a pre-
programmed cycle or initiated by a PC connected to it;- The reader and the dosimeters can be set and the measured data can be
downloaded by a PC via a standard serial interface.
91
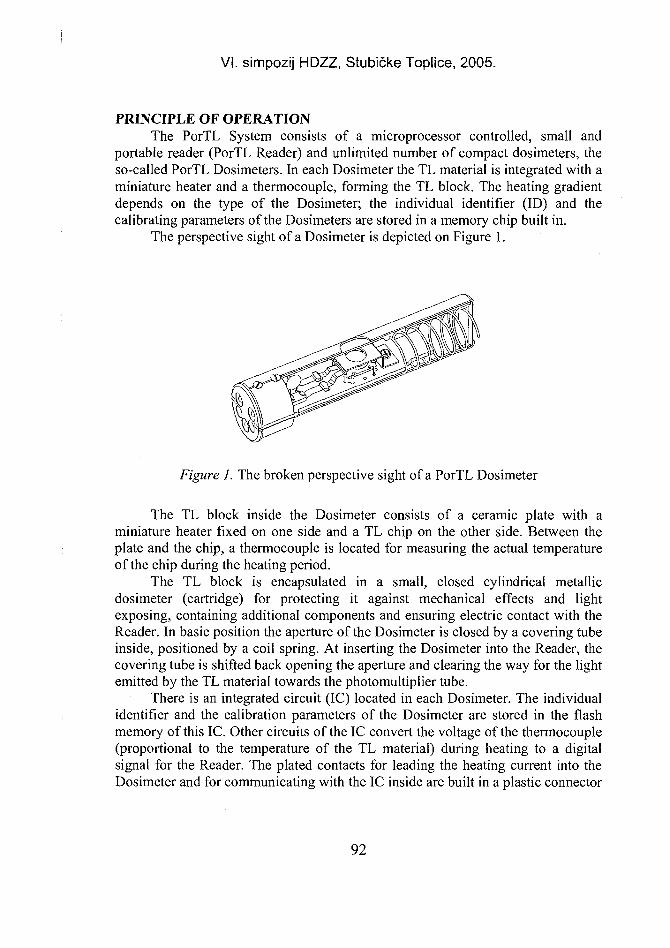
VI. simpozij HDZZ, Stubičke Toplice, 2005.
PRINCIPLE OF OPERATIONThe PorTL System consists of a microprocessor controlled, small and
portable reader (PorTL Reader) and unlimited number of compact dosimeters, theso-called PorTL Dosimeters. In each Dosimeter the TL material is integrated with aminiature heater and a thermocouple, forming the TL block. The heating gradientdepends on the type of the Dosimeter; the individual identifier (ID) and thecalibrating parameters of the Dosimeters are stored in a memory chip built in.
The perspective sight of a Dosimeter is depicted on Figure 1.
Figure 1. The broken perspective sight of a PorTL Dosimeter
The TL block inside the Dosimeter consists of a ceramic plate with aminiature heater fixed on one side and a TL chip on the other side. Between theplate and the chip, a thermocouple is located for measuring the actual temperatureof the chip during the heating period.
The TL block is encapsulated in a small, closed cylindrical metallicdosimeter (cartridge) for protecting it against mechanical effects and lightexposing, containing additional components and ensuring electric contact with theReader. In basic position the aperture of the Dosimeter is closed by a covering tubeinside, positioned by a coil spring. At inserting the Dosimeter into the Reader, thecovering tube is shifted back opening the aperture and clearing the way for the lightemitted by the TL material towards the photomultiplier tube.
There is an integrated circuit (IC) located in each Dosimeter. The individualidentifier and the calibration parameters of the Dosimeter are stored in the flashmemory of this IC. Other circuits of the IC convert the voltage of the thermocouple(proportional to the temperature of the TL material) during heating to a digitalsignal for the Reader. The plated contacts for leading the heating current into theDosimeter and for communicating with the IC inside are built in a plastic connector
92
VI. simpozij HDZZ, Stubičke Toplice, 2005.
shell fixed in one end of the Dosimeter. On the other end of the Dosimeter, itsindividual code is graved for visual identification.
More than twenty different types (using different TL materials, heatingparameters etc.) and 10,000 different species of each type of dosimeter (Dosimeter)can be identified automatically, read out and evaluated using their individualcalibration parameters. The identification codes and the individual parameters ofthe Dosimeters as a result of their calibration can be programmed via the Reader bya PC, using a special user SW developed for the PorTL.
During exposure and transportation the Dosimeters are stored in a strong,transparent and waterproof plastic case.
CONSTRUCTION OF THE PorTL READERThe PorTL Reader is a small, portable, microprocessor controlled equipment.
The rechargeable battery built in makes it suitable for outdoor measurements aswell. It is easy to handle using its few push buttons and menu system. The menucommands, parameters, and the results of measurements are visualised on a graphicliquid crystal display (LCD). Connecting it to the serial port of a PC and using thededicated PorTL PC SW the options of the system are multiplied. The data blocksof the measurements can be downloaded and listed; the glow curves of anymeasurement can be visualised in graphic and numeric form; the measuring andevaluating parameters can be modified and (re)stored in the memory of the Readeras well as the Dosimeter to make the system extremely flexible.
The perspective sight of the PorTL Reader can be seen on Figure 2. The shellof the box (side, top and bottom walls) is a single, massive unit extruded ofaluminium alloy and divided inside into rail profiles. The front and back plates ofthe box are die-cast aluminium.
The base printed circuit board containing the main and heating powersupplies and the microprocessor controlled control and measuring circuits isslipped into the rails of the box shell and fixed there. The lightproof crankcase,which admits the key containing the Dosimeter to read out, is fixed to the baseboard as well. The key is connected to the Reader electronics by a spiral cable. Thefront side printed circuit board carrying the graphic display and the push buttons aswell as the high voltage board supplying the PMT are connected at right angles tothe base board. The mounting of the rechargeable battery of the Reader is fixed inthe rails of the box shell as well.
The heating power supply, providing heating current for the Dosimeterinserted in the Reader, is controlled by the central processing unit (CPU) via a D/A(digital/analogue) converter. The programmed heating specified by the type of theDosimeter (dosimeter) provides for warming up the TL block to 200...300°Cduring 20. ..60 seconds. The final temperature of the heating as well as the durationof tempering the TL material for annealing, following the evaluation phase, can beprogrammed at each Dosimeter type, too. The voltage produced by the
93
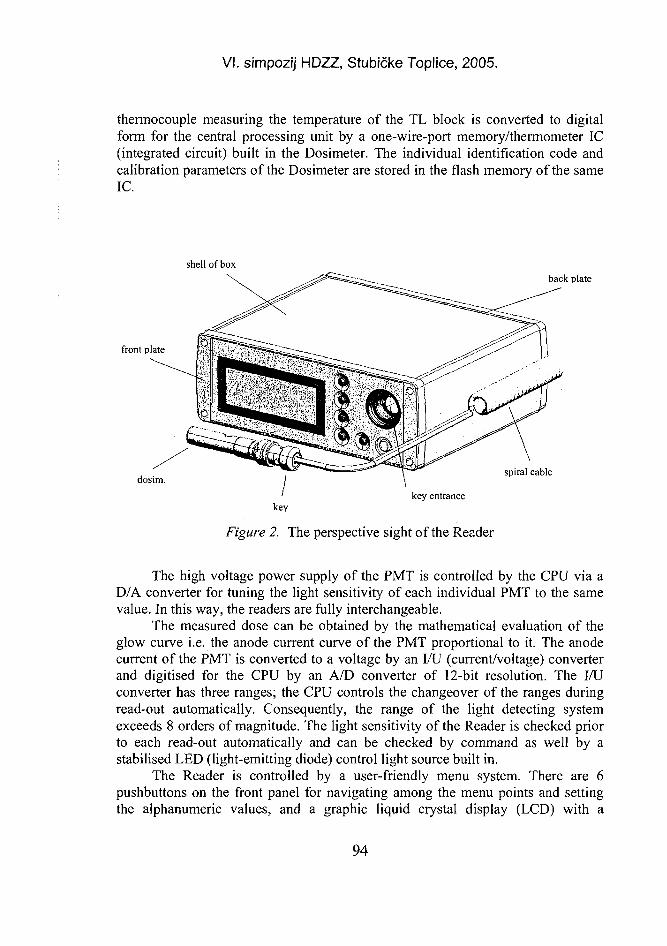
VI. simpozij HDZZ, Stubičke Toplice, 2005.
thermocouple measuring the temperature of the TL block is converted to digitalform for the central processing unit by a one-wire-port memory/thermometer IC(integrated circuit) built in the Dosimeter. The individual identification code andcalibration parameters of the Dosimeter are stored in the flash memory of the sameIC.
shell of box
front plate
dosim.
back plate
spiral cable
key entrance
Figure 2. The perspective sight of the Reader
The high voltage power supply of the PMT is controlled by the CPU via aD/A converter for tuning the light sensitivity of each individual PMT to the samevalue. In this way, the readers are fully interchangeable.
The measured dose can be obtained by the mathematical evaluation of theglow curve i.e. the anode current curve of the PMT proportional to it. The anodecurrent of the PMT is converted to a voltage by an I/U (current/voltage) converterand digitised for the CPU by an A/D converter of 12-bit resolution. The I/Uconverter has three ranges; the CPU controls the changeover of the ranges duringread-out automatically. Consequently, the range of the light detecting systemexceeds 8 orders of magnitude. The light sensitivity of the Reader is checked priorto each read-out automatically and can be checked by command as well by astabilised LED (light-emitting diode) control light source built in.
The Reader is controlled by a user-friendly menu system. There are 6pushbuttons on the front panel for navigating among the menu points and settingthe alphanumeric values, and a graphic liquid crystal display (LCD) with a
94
VI. simpozij HDZZ, Stubičke Toplice, 2005.
resolution of 192*64 for the visualisation of the result of measurements, theparameters and the menu system.
Using the digital thermometer built in the structure of the Reader theinfluence of the environmental temperature is taken into account by the operationalSW during the evaluation, allowing a wide operational ambient temperature range(-20...+40 °C). The real time clock functioning in power-off condition as wellprovides the Reader with the actual date and time at each read-out and activates it("wakes it up") at the pre-programmed time intervals in automatic mode. Theoperating SW, the reader-specific and partly the dosimeter-specific parameters aswell as the results of the measurements (about 2000 data blocks) are stored in theflash memory. The Reader can be connected to a personal computer (PC) via itsRS-232 standard serial port. In this way, the parameters can be programmed intothe Reader and into the Dosimeter inserted in the Reader, the data blocks can bedownloaded from the memory for additional processing or loading in a data baseand service functions can be accomplished. Optionally, the Reader can besupplemented by a serial port of other standard in order to connect it to a localcomputer network providing remote control and data read-out.
The high-efficiency main power supply (PS) provides the stabilised dc (directcurrent) voltages for the internal circuits. It is powered by a closed, safe andmaintenance-free battery (workable in any position) regularly connected to the line bymeans of the dedicated charger. In automatic mode, the PS is switched on by the timeronly during read-out. The timer is powered by a small stand-by supply during sleepphase allowing the very low power consumption of less than 0.1 W.
For reading, the Dosimeter is inserted into the connector of the key; and thenthe key containing the Dosimeter is inserted into the entrance of the Reader. Twistingthe key CW until latching the reading procedure is started by the terminating positionsensor automatically. The Dosimeter is contacted to the Reader electronics (throughthe key) via a flexible spiral cable.
MAIN CHARACTERISTICS OF THE SYSTEMRecent version of the system is dedicated for environmental dosimetry. TL
material used in Dosimeters is AhOy.C Measuring range of the system is 10 uSv -100 mSv with a < 5%. Size of cylindrical Dosimeters is diameter 14 mm, length 69mm, mass is 25 g. The Reader is capable to store results of 1800 readouts includingglow curves. Capacity of the rechargeable battery provides more than 100 readouts.Storage temperature of the Reader -40°C •*• +50°C, operating temperature -20°C ++40°C. Size of the Reader 210 mm (width), 80 mm (height) and 170 mm (depth),mass is about 2.6 kg.
95
VI. simpozij HDZZ, Stubičke Toplice, 2005.
REFERENCES[ 1 ] Feher I, Deme S, Szabo B, Vagvolgyi J, Szabo PP, Csoke A, Ranky M, Akatov YuA. A
new thermoluminescent dosimeter system for space research. Advances in SpaceResearch 1981; 1:61-66.
[2] Apathy I, Deme S, Feher I. Microprocessor controlled portable TLD system. Radiat ProtDosim 1996;66:441-444.
[3] Deme S, Reitz G, Apathy I, Hejja I, Lang E, Feher I.. Doses due to the South AtlanticAnomaly during the Euromir'95 Mission Measured by an On-board TLD System. RadiatProt Dosim 1999;85:301-304.
[4] Deme S, Apathy I, Hejja I, Lang E, Feher I. Extra dose due to EVA during theNASA4 mission measured by an on-board TLD system. Radiat Prot Dosim1999;85:121-124.
ABSTRACTThermoluminescent dosimeters (TLDs) are commonly used for
environmental monitoring, for personal and medical dosimetry, for dosimetry innuclear facilities, etc. Major advantages are their independence of the powersupply, small dimension, sensitivity, good stability, wide measuring range,resistance to environmental changes and relatively low cost. The disadvantage isthat the detector must be transported for evaluation to a laboratory equipped with alarge, heavy and expensive TLD Reader operated by qualified personnel, whichconsiderably increases the costs and delays results. To overcome this disadvantage,the KFKI Atomic Energy Research Institute (KFKI AEKI), in co-operation with BLElectronics (Hungary), has developed a new and unique TLD system containing asmall, portable, battery powered and moderate-price reader for commercial use. Thispaper gives a detailed description and parameters of this system.
96
VI. simpozij HDZZ, Stubičke Toplice, 2 HR0500035
ENERGY DEPENDANCE OF TL DOSEMETERS USINGCaF2:Mn PELLETS
Benjamin Zorko, David Jezeršek, Matjaž Štuhec and Sandi GobecJožef Stefan Institute, Jamova 39, SI-1000 Ljubljana, Slovenia
e-mail: [email protected]
INTRODUCTIONThe thermoluminescent dosimetry has a notable history at Jožef Stefan
Institute, Ljubljana, Slovenia. The very first reading and evaluation system forthermoluminescent dosimetry MR200 was developed at Jožef Stefan Institute (JSI)in 1985. After several upgrades the system has been successfully used for almost20 years in personal and environmental dosimetry. For its originality the TLdosimetry has used pellets made of CaF2:Mn material as radiation detectors. Thepellets have been also produced at the JSI. Today, the system is fully compliedwith the IEC international electrotechnical standards and the dosemeters forpersonal dosimetry can be used in mixed-energy fields in a straightforward mannerto measure the dose equivalents //p(10), //p(0,07) and H*(\0). An extra feature ofthe dosemeters' design is that the energy of the radiation field or source can bedetermined.
The aim of the present work was to investigate the energy dependence ofdosemeter's response in terms of//p(10) values for X and gamma rays for theroutine use of dosemeters in radiation protection. For such experiments the use ofphantom is recommended, which has the function of backscatter body. Thepersonal dose equivalent is an operational quantity and is intended to provide areasonable estimate of the radiation protection quantity.
DESCRIPTION OF TLD SYSTEMThe presented TL system MR200(C) can be classified as an ohmic heating
TL measurement systems. The system for TL dosimetry consists of a reader,dosemeters with detectors (pellets of CaF2:Mn), a vessel with nitrogen, an oven forannealing detectors, a lead container for storage of unused dosemeters and PCsoftware tools to control, manipulate and regulate the measuring process and toevaluate the measuring results. The system can be used for readings of doses of theionising radiation from 5 uSv to 5 Sv for the purpose of personal andenvironmental dosimetry. The photons are counted by sensitive photomultiplierwhich output is amplified by a floating resistor.
The linearity of the response of the measuring system lies in the interval of ±10 % regarding the nominal dose value [1]. The reproducibility of results is betterthan 5 % at 95 % confidence level [2]. The detection threshold is less than 6 uSv at95 % confidence level. The zero dose reading is less than 2 micro Sv. The system
97
VI. simpozij HDZZ, Stubičke Toplice, 2005.
itself has been proven to be stable for readings by altering the voltage of the powersupply. The energy dependence of the system lies in the interval of ± 30 %. Thefading of the dose is less than 10 %. The residue at high doses is below theprescribed value of the IEC 1066 standard [3], but usually the pellets that areirradiated with high dose are eliminated for next usage [4]. The uncertainty ofmeasurement results is 5.3 % for routine measurements at 95 % confidence interval[5].
Reading and evaluation system is fully controlled by the PC in the Windowsenvironment. Every measurement is performed in a clean nitrogen atmosphere.Commercial hardware modules for temperature control and digital input-outputwere used for the measurement and process control. The software was written inthe Lab View graphic programming language [6]. The measuring parameters can bechanged easily, which makes the system suitable for the experiments with differentthermoluminescent materials. For this purpose many different heating programmescan be used with prescribed intervals of preheating and heating interval. Each time-interval can be set for a duration and heating rate. Three basic evaluationprocedures of the glow curve can be selected, which are based either on the peakheight, integration within fixed interval, or integration in adaptable interval, basedon a certain fraction of the peak height. Essential data of each measurement arestored in the data base. Glow curves are saved and they can be reevaluated inseparate programs for detailed analysis.
RESULTS AND MEASUREMENTSRadiation protection dosimetry requires a dosemeter that complies with the
personal dose equivalent Hp(l0). For that reason the measured signal should notvary with the energy of the incident radiation more than ± 30 %. It is well knownthat the CaF2:Mn pellets are very sensitive at low photon energies [7].
To perform the measurements of the energy dependence of the measuringsystem, 5 dosemeters containing 15 pellets of CaF2:Mn were used. The dosemetersthat are used for personal dosimetry are designed to contain three pellets of thediameter of 5 mm and the thickness of 0.5 mm at positions PI, P2 and P3 inside theplastic cover of thickness of 1 mm, 3 mm and a metal filter of thickness of 4 mm,respectively. The metal filter is composed of 90 % Cu and 10 % Sn [8]. The pelletsat positions PI and P2 absorb X-ray and gamma rays (doses Di and D2). The metalfilter suppresses the passage of low energy photons (below 300 keV), and thispellet absorbs high energetic photons only (dose D3). The ratio - the energyresponse - between the dose collected by the pellet at the position P3 and theaverage dose collected by two pellets at PI and P2 gives the energy of theirradiation. During the irradiations the dosemeters were placed on the ISO waterslab phantom. The phantom has dimensions of 30 cm x 30 cm x 15 cm. It is filledwith water and the walls are made of PMMA. The front window is 2.5 mm thickand other windows are 10 mm thick. The dosemeters were calibrated in the energy
98
VI. simpozij HDZZ, Stubičke Toplice, 2005.
range from 33 keV to 1.2 MeV in the Laboratory for dosimetric standards at J.Stefan Institute (JSI).
First irradiations - calibration measurement - were carried out to determinethe individual sensitivity (IS) factors of the pellets. The pellets were irradiated in60Co radiation field at //p(10) = 500 p.Sv. The pellets were held in the plastic boxthat was placed on the phantom. The relative uncertainty of IS factors was 6 % at95 % confidence interval. Afterwards the pellets with known IS factors placed inthe dosemeters were irradiated in 60Co and 137Cs radiation fields and X-rayradiation fields with different effective energies (Table 1) that were generated by aPANTAK HF 160 C (150 kV). The distance between the source and thedosemeters was 1 m. The pellets were irradiated at Hp(l0) = of 500 uSv.Dosemeter holders were placed on the phantom as well.
The relative response (RR) at the effective energy E of the radiation field isdefined as a ratio between the average of the doses Di and D2, Davg(E), and theaverage of doses of the pellets at the same positions irradiated by 60Co, Davg(
60Co):
RR(E)=
The calculated values are presented in Table 1. The data were fitted with anexponential function:
**(£) = 0,9+ 31,4-expf-^-j (2)
The relative response is greater than 1 at energies below 300 keV (Figure 1). Forexample, the relative response at 33 keV is 16 times greater than that at the energyof 1250 keV - the energy of 60Co radiation field. If the measured dose is reportedcorrectly, the energy response must be compensated.
Special attention was paid to calculate the uncertainties of the doses andcalculated quantities. The relative standard uncertainty of the reading of the signalis equal to 3.1 % [9]. The relative standard uncertainty of the irradiation usingphantom is 3 %. Thus, the uncertainty of the calculated dose can be evaluated as acombined uncertainty that amounts to 10.6 % at 95 % confidence interval [10].After the experiment the averages of calculated doses Di, D2 and D3 (Davg,i(E),Davg,2(E), Davg]3(E)) at each energy were calculated. Their uncertainties werecalculated by considering the greater value between the aposteriori and aprioriuncertainties. Then the average of the doses Di and D2, D a v g (E), at each energywere calculated. The uncertainty of this average was calculated from the Equation:
u{Davg (£)) = 0,027 • plg,{E) + D2avg2{E) (3)
Using equations (1) and (3), the combined uncertainty of the relative response canbe calculated then as:
99
VI. simpozij HDZZ, Stubičke Toplice, 2005.
(4)The second parameter that was calculated from the measurement result was
the energy response (ER) of the dosemeters. It is defined as the ratio between theaverage dose, Davg(E), and the average dose accumulated in the pellets at thepositions P3, DaVg3(E):
The calculated values of the energy response are presented in Table 1. The datawere also fitted with an exponential function:
ER(E) = 1,07 +19367,4 -expf—— 1 (6)V 1 2 6
The calculated values with uncertainty bars and best fitted curve are shown inFigure2. For the convenience both axis are logarithmically scaled. To complete theevaluation of the energy response its uncertainty was calculated from the Equation(7):
HER) W2{Davg{E)) | u\Davgj{E)) ( 7 )
ER \ D2mg{E) Dl^iE)
The first term under the square root in Equation (7) was calculated by means of theEquation (3), while the second term was calculated by considering the greatervalue between the aposteriori and apriori uncertainty of the average over thenumber of the pellets.
When the relative response and the energy response of the dosemeters weredetermined, the procedure for a routine calculation of doses that are obtained by theexposure of the dosemeters to an unknown radiation field has to be established. Inthe first step, the energy response, ER(Emes), at unknown energy Emes, wascalculated using Equation (5). The energy of the radiation field was calculated thenfrom the Equation (6):
' en i n\
(8)12,6 ^ 19367,4
This value was taken into the Equation (2) that was used to calculate the relativeresponse (RR(Emes)). Finally, the average dose, Da v g(Em e s), was calculated bymultiplying the average readings of Dl and D2 by a factor (1/ RR(Emes))- Thisprocedure was validated for a group of 21 dosemeters that were irradiated in theN80 (effective energy = 65 keV) radiation field (Table 2) and for the group of 67dosemeters that were worn by people who work at the Oncological Institute (01) inLjubljana. For personal data safety the dosemeters are labeled with special codes.The results are shown in Figure 3. The average energy calculated from the inverseof the Equation (6) was 141 ± 5 keV. This is exactly the energy of the photonemission of the 99mTc source that is used in the laboratory at 01. In working places
100
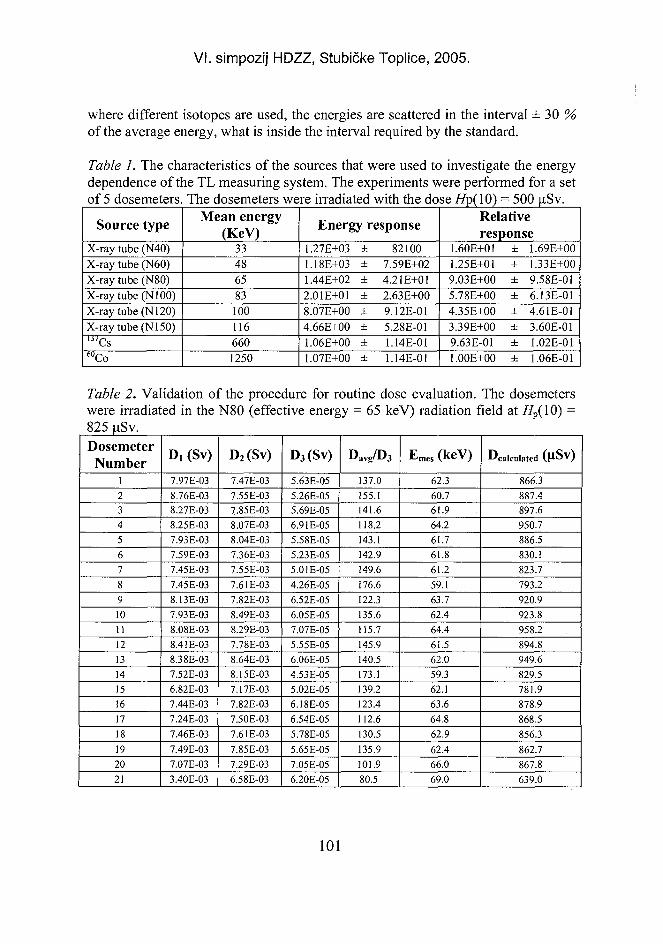
VI. simpozij HDZZ, Stubičke Toplice, 2005.
where different isotopes are used, the energies are scattered in the interval ± 30 %of the average energy, what is inside the interval required by the standard.
Table 1. The characteristics of the sources that were used to investigate the energydependence of the TL measuring system. The experiments were performed for a setof 5 dosemeters. The dosemeters were irradiated with the dose Hp( 10) = 500
Source type
X-ray tube (N40)X-ray tube (N60)X-ray tube (N80)X-ray tube (N100)X-ray tube (N120)X-ray tube (Nl 50)l j / Csb uCo
Mean energy(KeV)
334865831001166601250
Energy response
1.27E+031.18E+031.44E+022.01E+018.07E+004.66E+001.06E+001.07E+00
±±
±±±±
±±
821007.59E+024.21E+012.63E+009.12E-015.28E-011.14E-011.14E-01
Relativeresponse
1.60E+011.25E+019.03E+005.78E+004.35E+003.39E+009.63 E-011.00E+00
±±±
±±±±
±
1.69E+001.33E+009.58E-016.13E-014.61 E-013.60E-011.02E-011.06E-01
Table 2. Validation of the procedure for routine dose evaluationwere irradiated in the N80 (effective energy = 65 keV) radiation825 uSv.
The dosemetersfield at//p( 10) =
DosemeterNumber
i23456789101112131415161718192021
D,(Sv)
7.97E-038.76E-038.27E-038.25E-037.93E-037.59E-037.45E-037.45E-038.13E-037.93E-038.08E-038.41 E-038.38E-037.52E-036.82E-037.44E-037.24E-037.46E-037.49E-037.07E-033.40E-03
D2(Sv)
7.47E-037.55E-037.85E-038.07E-038.04E-037.36E-037.55E-037.61 E-037.82E-038.49E-038.29E-037.78E-038.64E-038.15E-037.17E-037.82E-037.50E-037.61 E-037.85E-037.29E-036.58E-03
D3(Sv)
5.63E-055.26E-055.69E-056.91E-055.58E-055.23E-055.01 E-054.26E-056.52E-056.05E-057.07E-055.55E-056.06E-054.53E-055.02E-056.18 E-056.54E-055.78E-055.65E-057.05E-056.20E-05
Davg/D3
137.0155.1141.6118.2143.1142.9149.6176.6122.3135.6115.7145.9140.5173.1139.2123.4112.6130.5135.9101.980.5
E m e s (keV)
62.360.761.964.261.761.861.259.163.762.464.461.562.059.362.163.664.862.962.466.069.0
D c a i c u l a t c d ( u S v )
866.3887.4897.6950.7886.5830.1823.7793.2920.9923.8958.2894.8949.6829.5781.9878.9868.5856.3862.7867.8639.0
101
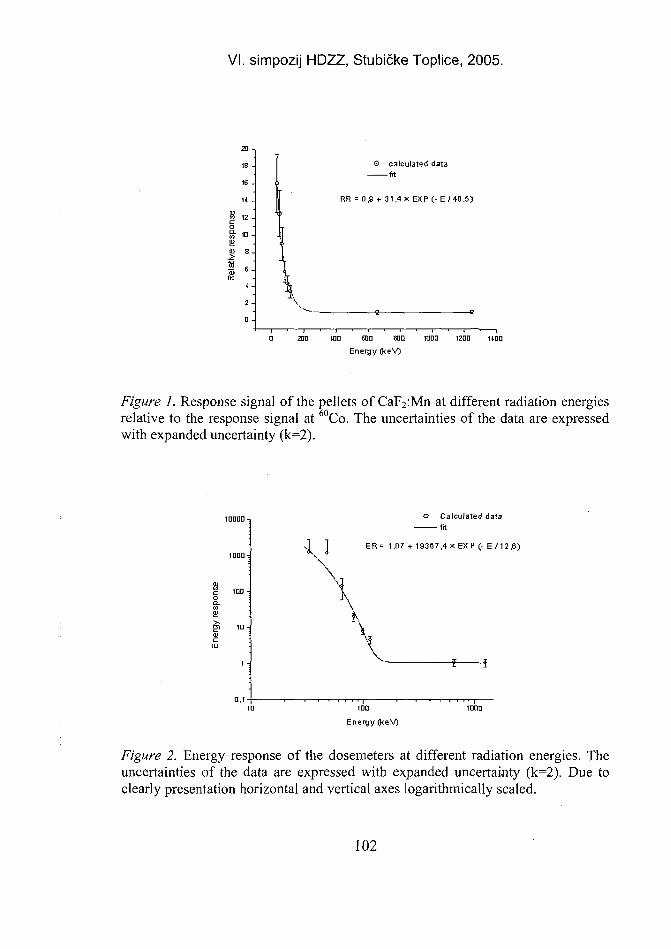
VI. simpozij HDZZ, Stubičke Toplice, 2005.
20 -.
18 -
16 -
1* -
12 -
ID -
0 calculated datafit
RR = 0.9 + 31.4 X EXP (- E/46.5)
Z I D U1D £00 SOD 10DD 120D H D D
Energy (keV^
Figure 1. Response signal of the pellets of CaF2:Mn at different radiation energiesrelative to the response signal at 60Co. The uncertainties of the data are expressedwith expanded uncertainty (k=2).
g.(0£
o Calculated datafit
ER= 1.07 + 19367,4 x EXP (- E/ 12.6)
1DD
Energy (ke
Figure 2. Energy response of the dosemeters at different radiation energies. Theuncertainties of the data are expressed with expanded uncertainty (k=2). Due toclearly presentation horizontal and vertical axes logarithmically scaled.
102
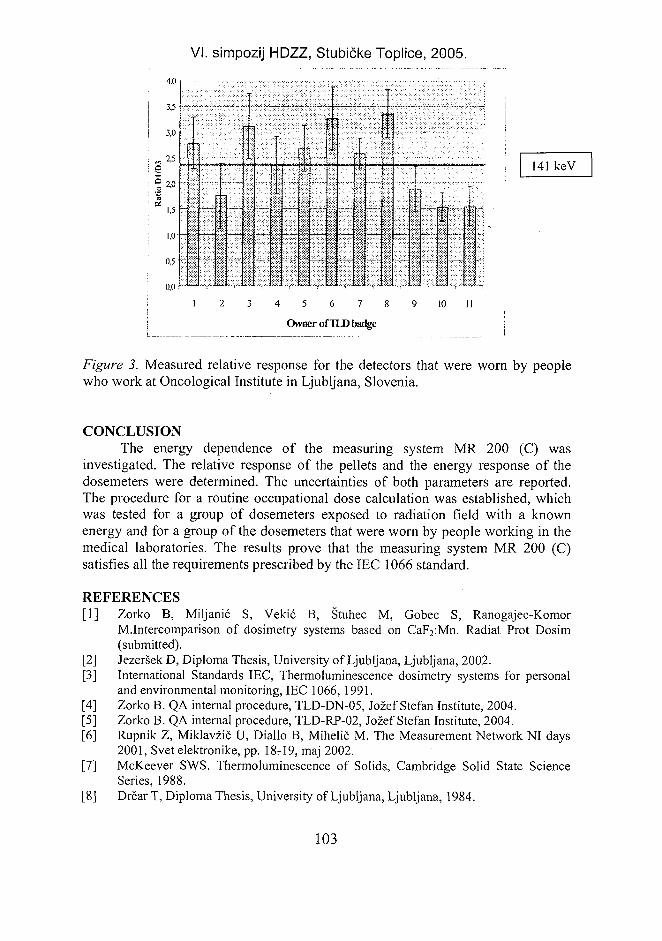
VI. simpozij HDZZ, Stubičke Toplice, 2005.
141 keV
4 5 6 7
Owner of TLD badge
10 11
Figure 3. Measured relative response for the detectors that were worn by peoplewho work at Oncological Institute in Ljubljana, Slovenia.
CONCLUSIONThe energy dependence of the measuring system MR 200 (C) was
investigated. The relative response of the pellets and the energy response of thedosemeters were determined. The uncertainties of both parameters are reported.The procedure for a routine occupational dose calculation was established, whichwas tested for a group of dosemeters exposed to radiation field with a knownenergy and for a group of the dosemeters that were worn by people working in themedical laboratories. The results prove that the measuring system MR 200 (C)satisfies all the requirements prescribed by the IEC 1066 standard.
REFERENCES[1] Zorko B, Miljanić S, Vekić B, Štuhec M, Gobec S, Ranogajec-Komor
M.Intercomparison of dosimetry systems based on CaF2:Mn. Radiat Prot Dosim(submitted).
[2] Jezeršek D, Diploma Thesis, University of Ljubljana, Ljubljana, 2002.[3] International Standards IEC, Thermoluminescence dosimetry systems for personal
and environmental monitoring, IEC 1066, 1991.[4] Zorko B. QA internal procedure, TLD-DN-05, Jožef Stefan Institute, 2004.[5] Zorko B. QA internal procedure, TLD-RP-02, Jožef Stefan Institute, 2004.[6] Rupnik Z, Miklavžič U, Diallo B, Mihelič M. The Measurement Network NI days
2001, Svet elektronike, pp. 18-19, maj 2002.[7] McKeever SWS. Thermoluminescence of Solids, Cambridge Solid State Science
Series, 1988.[8] Drčar T, Diploma Thesis, University of Ljubljana, Ljubljana, 1984.
103
VI. simpozij HDZZ, Stubičke Toplice, 2005.
[9] Dražič G, Miklavžič U, Mihelič M. The influence of TL glow curve evaluationalgorithms on the reproducibility of dosemeter readings. Radiat Prot Dosim1986; 17:343-346.
[10] BIPM, IEC, IFCC, ISO, IUPAC, OIML, Guide to the Expression of Uncertainty inMeasurement (GUM), ISO, Geneva, 1995.
ABSTRACTThe relative response of the pellets and the energy response of dosimeters
were determined for a TL measuring system from 33 keV to 1.25 MeV. Specialattention was paid to calculating the uncertainties of different quantities that gives asignificant meaning of the evaluation. The procedure established for routineoccupational dose calculation is described. The results prove that the measuringsystem MR 200 (C) satisfies IEC 1066 standard requirements.
104
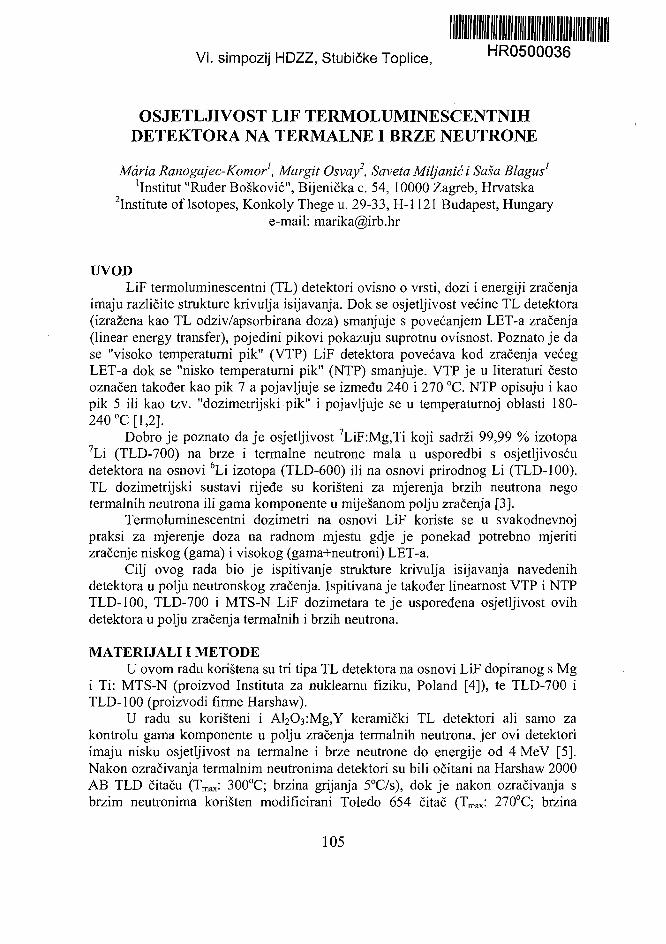
VI. simpozij HDZZ, Stubičke Toplice, HR0500036
OSJETLJIVOST LIF TERMOLUMINESCENTNIHDETEKTORA NA TERMALNE I BRZE NEUTRONE
Maria Ranogajec-Komor', Margit Osvay2, Saveta Miljanić i Šaša Blagus''institut "Ruđer Bošković", Bijenička c. 54, 10000 Zagreb, Hrvatska
institute of Isotopes, Konkoly Thege u. 29-33, H-l 121 Budapest, Hungarye-mail: [email protected]
UVODLiF termoluminescentni (TL) detektori ovisno o vrsti, dozi i energiji zračenja
imaju različite strukture krivulja isijavanja. Dok se osjetljivost većine TL detektora(izražena kao TL odziv/apsorbirana doza) smanjuje s povećanjem LET-a zračenja(linear energy transfer), pojedini pikovi pokazuju suprotnu ovisnost. Poznato je dase "visoko temperaturni pik" (VTP) LiF detektora povećava kod zračenja većegLET-a dok se "nisko temperaturni pik" (NTP) smanjuje. VTP je u literaturi čestooznačen također kao pik 7 a pojavljuje se između 240 i 270 °C. NTP opisuju i kaopik 5 ili kao tzv. "dozimetrijski pik" i pojavljuje se u temperaturnoj oblasti 180-240 °C [1,2].
Dobro je poznato da je osjetljivost 7LiF:Mg,Ti koji sadrži 99,99 % izotopa7Li (TLD-700) na brze i termalne neutrone mala u usporedbi s osjetljivosćudetektora na osnovi 6Li izotopa (TLD-600) ili na osnovi prirodnog Li (TLD-100).TL dozimetrijski sustavi rijeđe su korišteni za mjerenja brzih neutrona negotermalnih neutrona ili gama komponente u miješanom polju zračenja [3].
Termoluminescentni dozimetri na osnovi LiF koriste se u svakodnevnojpraksi za mjerenje doza na radnom mjestu gdje je ponekad potrebno mjeritizračenje niskog (gama) i visokog (gama+neutroni) LET-a.
Cilj ovog rada bio je ispitivanje strukture krivulja isijavanja navedenihdetektora u polju neutronskog zračenja. Ispitivana je također linearnost VTP i NTPTLD-100, TLD-700 i MTS-N LiF dozimetara te je uspoređena osjetljivost ovihdetektora u polju zračenja termalnih i brzih neutrona.
MATERIJALI I METODEU ovom radu korištena su tri tipa TL detektora na osnovi LiF dopiranog s Mg
i Ti: MTS-N (proizvod Instituta za nuklearnu fiziku, Poland [4]), te TLD-700 iTLD-100 (proizvodi firme Harshaw).
U radu su korišteni i A^C^MgjY keramički TL detektori ali samo zakontrolu gama komponente u polju zračenja termalnih neutrona, jer ovi detektoriimaju nisku osjetljivost na termalne i brze neutrone do energije od 4 MeV [5].Nakon ozračivanja termalnim neutronima detektori su bili očitani na Harshaw 2000AB TLD čitaču (Tmax: 300°C; brzina grijanja 5°C/s), dok je nakon ozračivanja sbrzim neutronima korišten modificirani Toledo 654 čitač (Tmax: 270°C; brzina
105
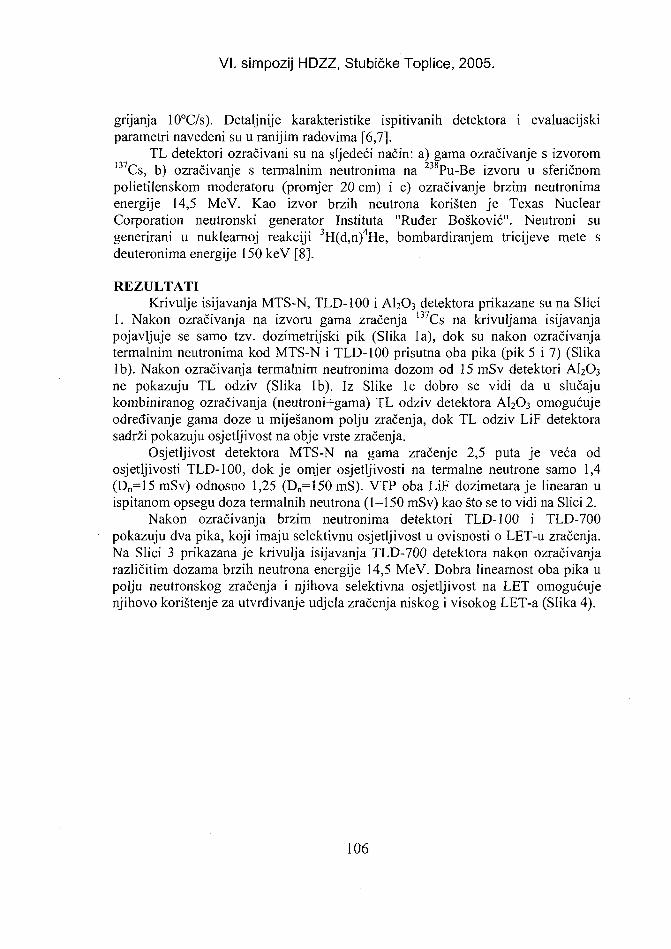
VI. simpozij HDZZ, Stubičke Toplice, 2005.
grijanja 10°C/s). Detaljnije karakteristike ispitivanih detektora i evaluacijskiparametri navedeni su u ranijim radovima [6,7].
TL detektori ozračivani su na sljedeći način: a) gama ozračivanje s izvorom137Cs, b) ozračivanje s termalnim neutronima na 23SPu-Be izvoru u sferičnompolietilenskom moderatoru (promjer 20 cm) i c) ozračivanje brzim neutronimaenergije 14,5 MeV. Kao izvor brzih neutrona korišten je Texas NuclearCorporation neutronski generator Instituta "Ruđer Bošković". Neutroni sugenerirani u nuklearnoj reakciji 3H(d,n)4He, bombardiranjem tricijeve mete sdeuteronima energije 150 keV [8].
REZULTATIKrivulje isijavanja MTS-N, TLD-100 i AI2O3 detektora prikazane su na Slici
1. Nakon ozračivanja na izvoru gama zračenja 137Cs na krivuljama isijavanjapojavljuje se samo tzv. dozimetrijski pik (Slika la), dok su nakon ozračivanjatermalnim neutronima kod MTS-N i TLD-100 prisutna oba pika (pik 5 i 7) (Slikalb). Nakon ozračivanja termalnim neutronima dozom od 15 mSv detektori A12O3
ne pokazuju TL odziv (Slika lb). Iz Slike lc dobro se vidi da u slučajukombiniranog ozračivanja (neutroni+gama) TL odziv detektora AL.O3 omogućujeodređivanje gama doze u miješanom polju zračenja, dok TL odziv LiF detektorasadrži pokazuju osjetljivost na obje vrste zračenja.
Osjetljivost detektora MTS-N na gama zračenje 2,5 puta je veća odosjetljivosti TLD-100, dok je omjer osjetljivosti na termalne neutrone samo 1,4(Dn=15 mSv) odnosno 1,25 (Dn=150 mS). VTP oba LiF dozimetara je linearan uispitanom opsegu doza termalnih neutrona (1-150 mSv) kao što se to vidi na Slici 2.
Nakon ozračivanja brzim neutronima detektori TLD-100 i TLD-700pokazuju dva pika, koji imaju selektivnu osjetljivost u ovisnosti 0 LET-u zračenja.Na Slici 3 prikazana je krivulja isijavanja TLD-700 detektora nakon ozračivanjarazličitim dozama brzih neutrona energije 14,5 MeV. Dobra linearnost oba pika upolju neutronskog zračenja i njihova selektivna osjetljivost na LET omogućujenjihovo korištenje za utvrđivanje udjela zračenja niskog i visokog LET-a (Slika 4).
106
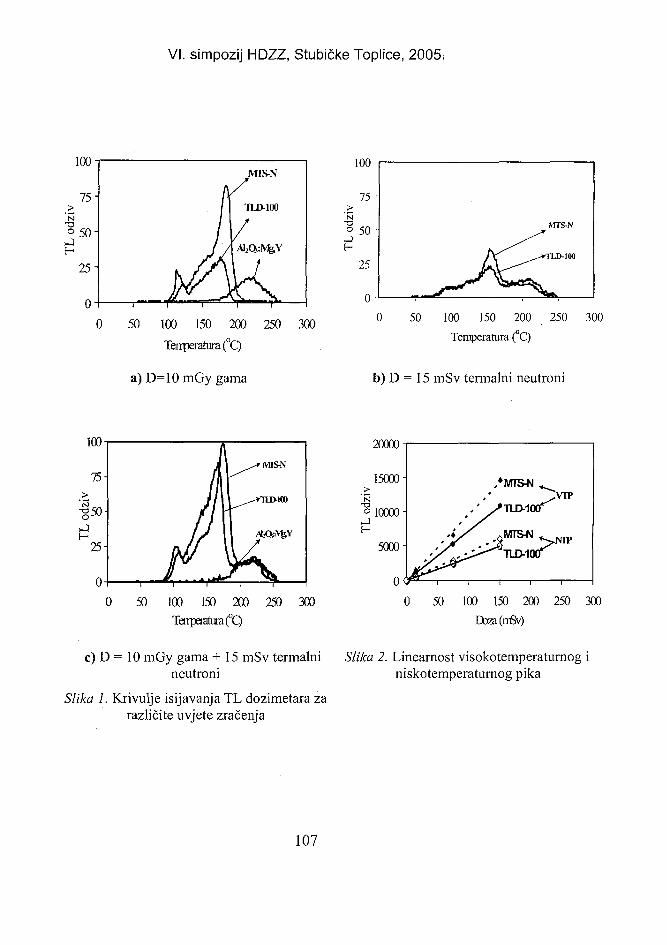
VI. simpozij HDZZ, Stubičke Toplice, 2005.
100
75-
25-
50 100 150 200 250 300
Tenperatura(°Q
a) D=10 mGy gama
0 50 100 150 200 250 300
Temperatura (°C)
b) D = 15 mSv termalni neutroni
20000
0 50 100 150 200 250 300Tenperatea(°Q
0 50 100 150 200 250 300
Dtea(rrSv)
c) D = 10 mGy gama + 15 mSv termalni Slika 2. Linearnost visokotemperaturnog ineutroni niskotemperaturnog pika
Slika 1. Krivulje isijavanja TL dozimetara zarazličite uvjete zračenja
107
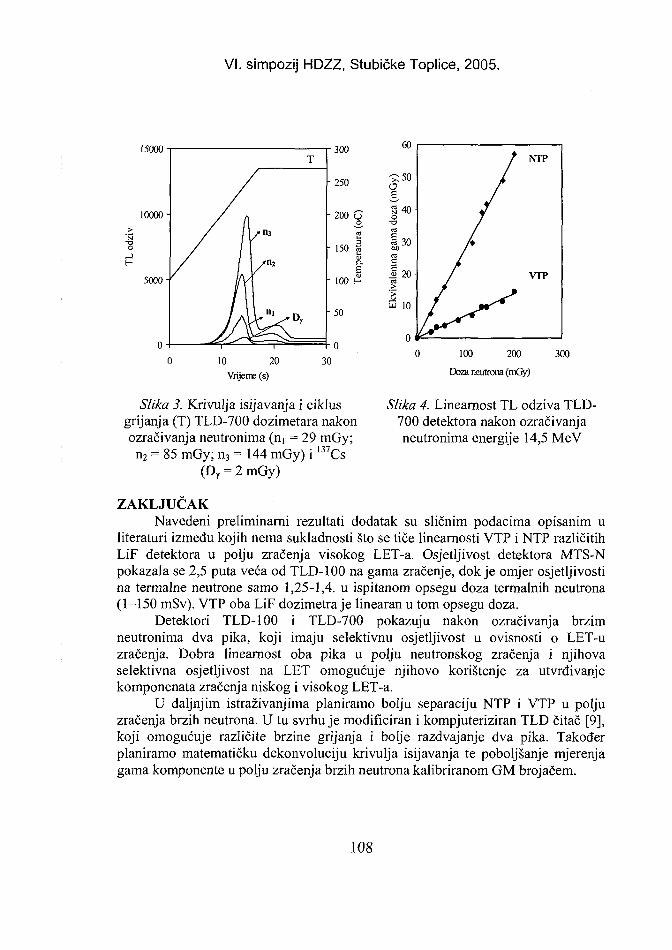
VI. simpozij HDZZ, Stubičke Toplice, 2005.
15000
10000
N
"8
5000-
30100 200
Doza neutrona (mGy)
300
Slika 3. Krivulja isijavanja i ciklusgrijanja (T) TLD-700 dozimetara nakonozračivanja neutronima (nj = 29 mGy;
Slika 4. Linearnost TL odziva TLD-700 detektora nakon ozračivanjaneutronima energije 14,5 MeV
n2 = 85 mGy; n3 = 144 mGy) i 1J/Cs(Dr = 2 mGy)
ZAKLJUČAKNavedeni preliminarni rezultati dodatak su sličnim podacima opisanim u
literaturi između kojih nema sukladnosti što se tiče linearnosti VTP i NTP različitihLiF detektora u polju zračenja visokog LET-a. Osjetljivost detektora MTS-Npokazala se 2,5 puta veća od TLD-100 na gama zračenje, dok je omjer osjetljivostina termalne neutrone samo 1,25-1,4. u ispitanom opsegu doza termalnih neutrona(1-150 mSv). VTP oba LiF dozimetra je linearan u tom opsegu doza.
Detektori TLD-100 i TLD-700 pokazuju nakon ozračivanja brzimneutronima dva pika, koji imaju selektivnu osjetljivost u ovisnosti o LET-uzračenja. Dobra linearnost oba pika u polju neutronskog zračenja i njihovaselektivna osjetljivost na LET omogućuje njihovo korištenje za utvrđivanjekomponenata zračenja niskog i visokog LET-a.
U daljnjim istraživanjima planiramo bolju separaciju NTP i VTP u poljuzračenja brzih neutrona. U tu svrhu je modificiran i kompjuteriziran TLD čitač [9],koji omogućuje različite brzine grijanja i bolje razdvajanje dva pika. Takođerplaniramo matematičku dekonvoluciju krivulja isijavanja te poboljšanje mjerenjagama komponente u polju zračenja brzih neutrona kalibriranom GM brojačem.
108
VI. simpozij HDZZ, Stubičke Toplice, 2005.
LITERATURA[1] Hoffman W. TL Dosimetiy in high LET radiotherapeutic fields. Radiat Prot Dosim
1996; 66:243-48.[2] Osvay M, Deme S. Comparative investigation of LiF TL dosimeters using low and high
LET radiation fields, Radiat Prot Dosim 1999;85:469-472.[3] Horowitz Y.S. Heavy charged particle relative TL response: Experimental results In:
Thermoluminescence and Thermoluminescent Dosimetry, Boca Raton, FL, CRC Press,1984. Vol. II. p. 114-129.
[4] Niewiadomski T. Lithium fluoride. In: Thermoluminescent Materials New Jersey,USA, Prentice Hall Inc, 1993. p. 142-180.
[5] Osvay M. Measurements on shielding experiments using A2O3:Mg,Y TL detectors.Radiat Prot Dosim 1996;66:217-219.
[6] Osvay M, Deme S. Linearity and LET dependence of LiF dosimeters. CD-ROM IV-6. Proceedings of IRPA Regional Congress on Radiation Protection in CentralEurope Sept 22-26, 2003; Bratislava, Slovakia. Zagreb: CRPA; 2004.
[7] Miljanić S, Ranogajec-Komor M, Knežević Ž, Vekić B. Main dosimetriccharacteristics of some tissue-equivalent TL detectors. Radiat Prot Dosim2002; 100:437-442.
[8] Ranogajec-Komor M, Miljanić S, Blagus S, Knežević Ž, Osvay M. Dozimetrijabrzih neutrona pomoću aktivacije AI2O3 TL detektora. U: Krajcar Bronić I, MiljanićS, Obelić B, ur. Zbornik radova Petog simpozija Hrvatskoga društva za zaštitu odzračenja; 9-11. travnja 2003; Stubičke Toplice, Hrvatska. Zagreb: HDZZ; 2003. str.108-114.
[9] Knežević Ž, Krpan K, Ranogajec-Komor M, Miljanić S, Vekić B, Rupnik Z.Povezivanje TL čitača s računalom te razvoj programa za obradu mjernih podataka.U: Zbornik radova Šestog simpozija Hrvatskoga društva za zaštitu od zračenja; 18-21. travnja 2005; Stubičke Toplice, Hrvatska. Zagreb: HDZZ; 2005 (u tisku).
109
VI. simpozij HDZZ, Stubičke Toplice, 2005.
SENSITIVITY OF LiF TL DETECTORS IN THERMAL ANDFAST NEUTRON IRRADIATION FIELDS
Maria Ranogajec-Komor1, Margit Osvay'', Saveta Miljanić'and Šaša Blagus1
'Ruder Bošković Institute, Bijenička 54, HR-10000 Zagreb, Croatiainstitute of Isotopes, Konkoly Thege ut 29-33, H-l 121 Budapest, Hungary
e-mail: [email protected]
The sensitivity of most TL dosimeters (expressed as TL response/absorbeddose) decreases with increasing LET. However, it is known that 'high temperaturepeak' (HTP or peak 7) of LiF detectors increases with increasing LET, while 'lowtemperature peak' of LiF (LTP or peak 5) decreases. There is no agreement inliterature on the linearity of LTP and HTP using high LET radiation field. Thereason in most cases is that the gamma background in the mixed field is not takeninto consideration as it should be. The aim of this study was to investigate thelinearity of LTP and HTP for TLD-100, TLD-700 (Harshaw) and MTS-N (Poland)LiF dosimeters and to compare LET sensitivity of these LiF using thermalisedneutron radiation in the dose range of 1-150 mSv and fast neutrons (14.5 MeV) inthe dose range of 25 mSv-200 mSv. The following irradiations of TLDs wereperformed: a) gamma with 137Cs source, b) thermal neutron with 238Pu-Be source(flux: 2xlO7 n/s) using a 20 cm diameter spherical polyethylene moderator, c) 14.5MeV fast neutrons produced by Texas Nuclear Corporation 300 keV electrostaticaccelerator using T(d,n)a nuclear reaction. The gamma component was measuredby Al2O3:Mg,Y ceramic TL dosimeters in the thermal neuron irradiation field andby Mg-Ar chamber in the fast neutron irradiation field, respectively. It was foundthat while the gamma sensitivity of LiF(P) to TLD-100 was about 2.5, thermalneutron sensitivity was 1.4 (at 15 mSv) and 1.25 (at 150 mSv). The hightemperature TL peak was linear for both types of LiF dosimeters in the thermal doserange of 1-150 mSv. In respect to selectivity, both LiF(P) and TLD-100 weresuitable for selective measurement of neutron dose in a mixed neutron-gammaradiation for the purposes of accidental dosimetry.
110
VI. simpozij HDZZ, Stubičke Toplice, ^wv,.
POVEZIVANJE TERMOLUMINESCENTNOG ČITAČA SRAČUNALOM TE RAZVOJ PROGRAMA ZA OBRADU
MJERNIH PODATAKA
Željka Knežević', Katarina Krpan', Maria Ranogajec-Komor',Saveta Miljanić , Branko Vekić i Zdravko Rupnikr
'institut "Ruđer Bošković", Bijenička c. 54, 10000 Zagreb, Hrvatska2Institut "Jožef Stefan", Jamova 39, 1000 Ljubljana, Slovenija
e-mail: [email protected]
UVODTermoluminescentni čitač tipa "TOLEDO 654" (Pitman, Engleska) je
instrument koji je uspješno korišten u području osobne dozimetrije u Institutu"Ruđer Bošković" već dugi niz godina. S obzirom da ovaj čitač nudi veći rasponeksperimentalnih mogućnosti u odnosu na već postojeći drugi čitač u institutu,pokrenut je projekt povezivanja instrumenta s računalom te razvoj programa zaobradu mjernih podataka. Osnovna prednost ovog čitača je mogućnost promjenabrzina grijanja uzorka prilikom očitavanja, što omogućuje prikupljanje višeinformacija prilikom očitavanja različitih TL materijala. Povezivanje čitača sračunalom omogućilo je da obrada podataka bude vođena računalom što doprinosijednostavnijem, bržem i preciznijem izvođenju eksperimenata i evaluacije mjerenihpodataka.
U radu je prikazan postupak povezivanja čitača s računalom, te su opisaneosnove programske podrške. Izneseni su prvi rezultati testiranja i mjerenja na TLčitaču za TLD-100 detektore pri različitim brzinama grijanja.
MJERNI SUSTAVTOLEDO TLD čitač model 654 je instrument, koji je bio razvijen i nabavljen
u godinama kad je područje mikroračunarstva bilo tek na svojim počecima. Sveparametre mjernog ciklusa i evaluacije rezultata jedino je moguće namjestiti prekoprekidača na prednjoj ploči instrumenta. Izmjerene vrijednosti čitač obradi internopomoću elektronskih logičkih sklopova. Rezultat mjerenja se ispisuje na glavnojploči kao numerička vrijednost. U svrhu povećanja funkcionalnosti i unapređenjaTLD čitača pristupili smo povezivanju čitača s računalom. Zato je bilo potrebno:razviti veznu jedinicu (interface) između čitača i računala (Slika 1) te u računaloinstalirati multifunkcijski modul s programskom podrškom. Bilo je potrebno razvitii računalni program za prikupljanje signala iz čitača, njihovu obradu, pohranjivanjei prikaz (Slika 1).
111

VI. simpozij HDZZ, Stubičke Toplice, 2005.
"TOLEDO" TLD READER
BOARD 6
TEMPERATURECYCLECONTROLBOARD
BOARD 1
CURRENTTO PULSECONVERTER
BOARD 7
CONTROLBOARD
OV
Pulses200ns
0 V
Sumssignals
Signal conditioning
unit INU1PC
analog IN
pulse IN__
status IN
Multifunction
DAQ board
A/D CONVERTER12-bit
COUNTER/TIMER24-bit
DIGITALINPUT/OUTPUT
Zdravko Rupnik. US. F-2Interfacing "TOLEDO" TLD reader to Personal Computer
Ljubljana, 09. 06. 2004
Sliku 1. Prikaz povezivanja signala iz čitača preko vezne jedinice namultifunkcijski modul u računalu
Čitač TOLEDO ima na zadnjoj strani tri konektora sa izlaznim signalima. Najednom od njih je dostupan naponski signal koji je proporcionalan temperaturi pećiza grijanje mjerenog dozimetra unutar čitača. U vrijeme grijanja dozimetar emitirasvjetlost u ovisnosti o prethodno primljenoj dozi. Frekvencija pulsnog signala naBNC konektoru proporcionalna je svjetlosnom intenzitetu i sa time dozi. Digitalnisignali na trećem konektoru daju informaciju o trenutnom stanju čitača.
Program TEMES (Slika 2) razvijen je u LabVIEW programskom okruženjutvrtke National Instruments. Sastavljen je od samostojećih programskih jedinica.Svaka od njih predstavlja vlastitu funkcionalnu cjelinu.Funkcije programa su:• testiranje čitača,• prikupljanje podataka iz čitača,• simultani numerički i grafički (vremenska skala) prikaz prikupljenih vrijednosti,• ispis rezultata pojedinog mjerenja, ispis grafičkog prikaza krivulje isijavanja i
temperaturne krivulje,• prikaz digitalnih statusa koji govore o stanju čitača,• grafička i numerička obrada izmjerenih vrijednosti (integriranje površine ispod
krivulje isijavanja, određivanje jednog ili više maksimuma krivulje, računanjedoze),
• automatska pohrana rezultata svakog mjerenja,
112
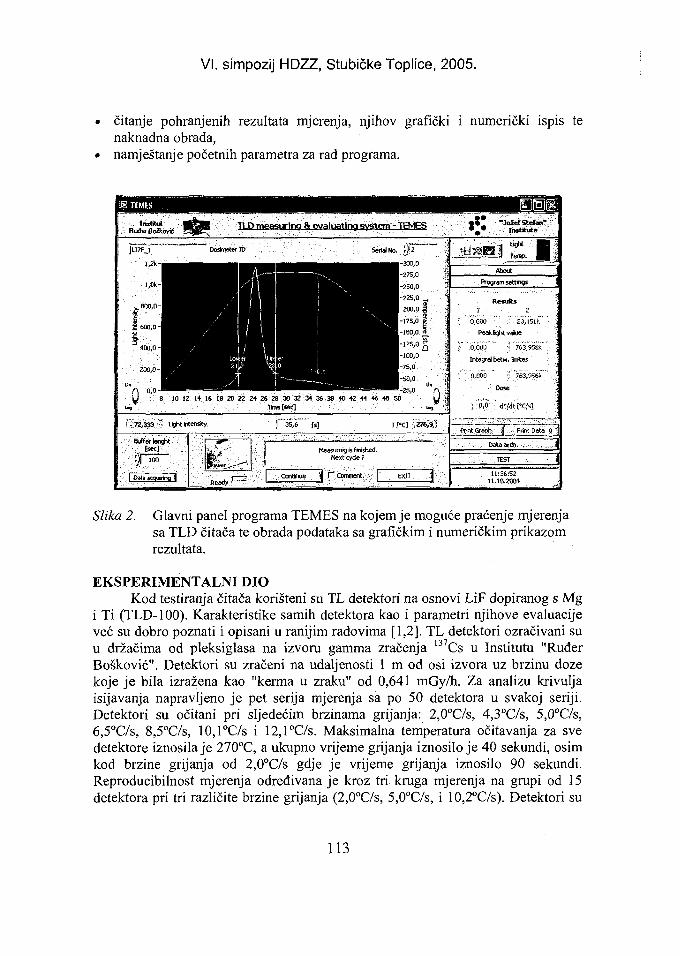
VI. simpozij HDZZ, Stubičke Toplice, 2005.
čitanje pohranjenih rezultata mjerenja, njihov grafički i numerički ispis tenaknadna obrada,namještanje početnih parametra za rad programa.
InstitutRuđ« Bo&ović TU) measurlncL&_£valuatina svstem - TEMES <S " "Jožcf Stefan"
JL17FJ
0,0 J ™-25,08 10 12. 14. 16 18 20 22 24 26 28 30 32 34 36 38 40 42 44 46 48 50
• .'• : ; ..• '• ;• ' : H m e [ s e c ] ' . : ' • • • • • . .
\ i ! Light Intensity 35,6 [s] T[«C] iŽ
Buffer lenght;: t] Measurnig is finished.
Next cyde ?
; Realty :Coritlnue 'j rcpmnent. 3.
Program settings
Resufts1 2
' 6,000 ' ". 2J,ISIk
Peakk^tvakjs
0,000 • ') "763,95Sk";
Integral betn. Mtes
o,ooo Y
IfTintGraph. j Print pata 0
Data arch....
11:36:52U.10.2004
Slika 2. Glavni panel programa TEMES na kojem je moguće praćenje mjerenjasa TLD čitača te obrada podataka sa grafičkim i numeričkim prikazomrezultata.
EKSPERIMENTALNI DIOKod testiranja čitača korišteni su TL detektori na osnovi LiF dopiranog s Mg
i Ti (TLD-100). Karakteristike samih detektora kao i parametri njihove evaluacijeveć su dobro poznati i opisani u ranijim radovima [1,2]. TL detektori ozračivani suu držačima od pleksiglasa na izvoru gamma zračenja 137Cs u Institutu "RuđerBošković". Detektori su zračeni na udaljenosti 1 m od osi izvora uz brzinu dozekoje je bila izražena kao "kerma u zraku" od 0,641 mGy/h. Za analizu krivuljaisijavanja napravljeno je pet serija mjerenja sa po 50 detektora u svakoj seriji.Detektori su očitani pri sljedećim brzinama grijanja: 2,0°C/s, 4,3°C/s, 5,0°C/s,6,5°C/s, 8,5°C/s, 10,l°C/s i 12,l°C/s. Maksimalna temperatura očitavanja za svedetektore iznosila je 270°C, a ukupno vrijeme grijanja iznosilo je 40 sekundi, osimkod brzine grijanja od 2,0°C/s gdje je vrijeme grijanja iznosilo 90 sekundi.Reproducibilnost mjerenja određivana je kroz tri kruga mjerenja na grupi od 15detektora pri tri različite brzine grijanja (2,0°C/s, 5,0°C/s, i 10,2°C/s). Detektori su
113
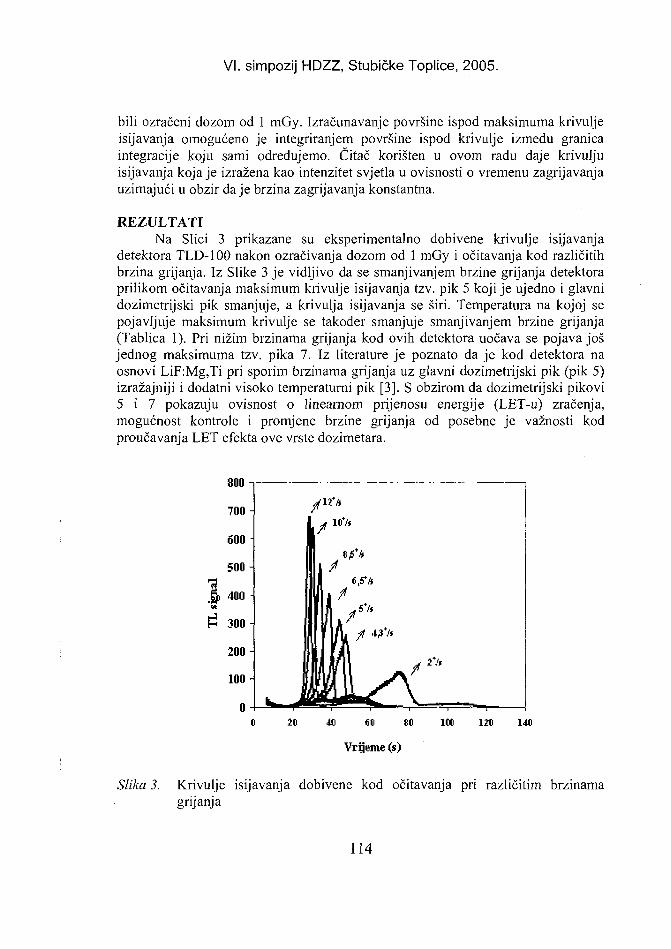
VI. simpozij HDZZ, Stubičke Toplice, 2005.
bili ozračeni dozom od 1 mGy. Izračunavanje površine ispod maksimuma krivuljeisijavanja omogućeno je integriranjem površine ispod krivulje između granicaintegracije koju sami određujemo. Čitač korišten u ovom radu daje krivuljuisijavanja koja je izražena kao intenzitet svjetla u ovisnosti o vremenu zagrijavanjauzimajući u obzir daje brzina zagrijavanja konstantna.
REZULTATINa Slici 3 prikazane su eksperimentalno dobivene krivulje isijavanja
detektora TLD-100 nakon ozračivanja dozom od 1 mGy i očitavanja kod različitihbrzina grijanja. Iz Slike 3 je vidljivo da se smanjivanjem brzine grijanja detektoraprilikom očitavanja maksimum krivulje isijavanja tzv. pik 5 koji je ujedno i glavnidozimetrijski pik smanjuje, a krivulja isijavanja se širi. Temperatura na kojoj sepojavljuje maksimum krivulje se također smanjuje smanjivanjem brzine grijanja(Tablica 1). Pri nižim brzinama grijanja kod ovih detektora uočava se pojava jošjednog maksimuma tzv. pika 7. Iz literature je poznato da je kod detektora naosnovi LiF:Mg,Ti pri sporim brzinama grijanja uz glavni dozimetrijski pik (pik 5)izražajniji i dodatni visoko temperaturni pik [3]. S obzirom da dozimetrijski pikovi5 i 7 pokazuju ovisnost o linearnom prijenosu energije (LET-u) zračenja,mogućnost kontrole i promjene brzine grijanja od posebne je važnosti kodproučavanja LET efekta ove vrste dozimetara.
800-
700-
600
500-
j}> 400w
$ 300-
200-
100-
o-0
if u'st
I
l im ,#«**
i IfjnVJUJrii ^^2Vj
20 Ml «d tO 10«
Vrijeme (s)
12« 14
Slika 3. Krivulje isijavanja dobivene kod očitavanja pri različitim brzinamagrijanja
114
VI. simpozij HDZZ, Stubičke Toplice, 2005.
Tablica I. Temperature maksimuma (Tmax) krivulja isijavnja pri različitim brzinagrijanja
Brzina grijanja(°C/s)12.010.18.56.55.04.32.0
T1 max
CO260,4252.3245
237,7233.4229.9221.7
TL odzivi za određenu brzinu grijanja i pripadajuće standardne devijacije zasvaki krug mjerenja prikazani su u Tablici 2. Rezultati mjerenja pokazuju da surasipanja vrijednosti po pojedinim krugovima i za pojedine brzine grijanja do oko4,5 %. Ujednačenost mjerenja unutar pojedinih krugova kao i kroz tri kruga jezadovoljavajuće reproducibilnosti. Iz rezultata je također vidljivo daje osjetljivostodziva kod očitavanja pri različitim brzinama grijanja ujednačena i odstupanja suunutar granica prihvatljive pogreške. TL odziv ove vrste detektora je neovisan obrzini grijanja prilikom očitavanja stoje u skladu s podacima iz literature [4].
Tablica 2.Brzina
grijanja(°C/s)
2,05,0
10,2
TL odziv TLD-100 detektora mjerenih pri različitim brzinama grijanjaTL odziv
(impuIsi/mGy) ± SD (%)
1. krug
25082 ± 2,4%24437 ± 4,0%
24982 ± 3,7%
2. krug
2A516 ± 2,2%23647 ± 4,2%
24231 ±3,3%
3. krug
24694 ± 2,5%
24288 ± 3,3%
24453 ± 4,3%
Srednjavrijednost
24555 ± 1,6%
24257 ± 2,5%
24784 ± 1 , 1 %
Srednja vrijednost ± SD (%) 24532 + 1,1%
ZAKLJUČAKPovezivanje TLD čitača s računalom i izrada programa za obradu podataka
omogućili su jednostavnije i brže izvođenje eksperimenata. Obzirom da ovaj čitačnudi mogućnost kontrole i promjene brzine grijanja, grafička i numerička obradaizmjerenih vrijednosti (integriranje površine ispod krivulje isijavanja, određivanjejednog ili više maksimuma krivulje, računanje doze) koja je vođena računalom
115
VI. simpozij HDZZ, Stubičke Toplice, 2005.
omogućuje prikupljanje više informacija prilikom očitavanja različitih TLmaterijala.
LITERATURA[1] Miljanić S, Ranogajec-Komor M, Knežević Ž, Vekić B. Main dosimetric
characteristics of some tissue-equivalent TL detectors, Radiat Prot Dosim2002; 100:437-442.
[2] Knežević Ž, Miljanić S, Ranogajec-Komor M, Vekić B, Štuhec M, Lakovič G,Martinčič R. Response of new TLDs to medium and low energy X-rays (paper no.7p-09). In: Obelić B, Ranogajec-Komor M, Miljanić S, Krajcar Bronić I, eds. CD-ROM. Proceedings of IRPA Regional Congress on Radiation Protection in CentralEurope "Radiation Protection and Health", May 20-25, 2001; Dubrovnik, Croatia.Zagreb: CRPA; 2002.
[3] Miljanić S, Ranogajec-Komor M, Blagus S, Miljanić Đ, Osvay M. TLD-700 forproton dosimetry in the presence of low-energy X-rays. NucI Inst and Meth in PhysResA2004;519:437-442.
[4] McKeever S WS, Moscovitch M, Townsend PD. Thermoluminescence DosimetryMaterials: Properties and Uses, Nuclear Technology Publishing, Ashford, 1995.ISBN 1870965191
INTERFACE AND SOFTWARE DEVELOPMENT FORTHERMOLUMINESCENT DOSIMETRY
Željka Knežević1, Katarina Krpan1 Maria Ranogajec-Komor1,Saveta Miljanić1, Branko Vekić1 and Zdravko Rupnik2
'Ruđer Bošković Institute, Bijenička c. 54, HR-10000 Zagreb, Croatia2Jožef Stefan Institute, Jamova 39, SI-1000 Ljubljana, Slovenia
e-mail: [email protected]
A thermoluminescent reader of "TOLEDO 654" type (Pitman, England)provides a number of experimental possibilities. This was the main reason to start aproject of connecting the instrument with a personal computer and of developingsupporting software in cooperation with the Jožef Stefan Institute. The mainadvantage of the reader is the possibility to use various heating rates, which makesthe system suitable for more detailed analysis of glow curves of different TLmaterials. Considering memory capabilities of the PC, all the essential data of eachmeasurement can be saved in a special database. Saved glow curves can be re-evaluated in separate programs for more detailed analysis. The new softwareenables an easier and more precise glow curve evaluation procedure. The aim ofthis work was to test the new measuring system with the well-known types of LiF:Mg,Ti (TLD-100). Different heating rates were used. The new measuring systemwas found suitable for research applications and user-friendly.
116
HR0500038VI. simpozij HDZZ, Stubičke Toplice, 2v^.
PROCJENA POUZDANOSTI KORIŠTENJATERMOLUMINISCENTNE DOZIMETRIJE SA TLD-100
Davorin Samek'', Begzada Bašić2 i Senada Halilović3
'Veterinarski fakultet Univerziteta u Sarajevu, Zmaja od Bosne 902Centar za zaštitu od jonizirajućeg zračenja Sarajevo,
3Klinički centar Univerziteta u Sarajevu, Bolnička 25,71000 Sarajevo, BiH
e-mail: [email protected]
UVODPred savremenu dozimetriju zračenja postavljaju se sve veći i složeniji
zahtjevi kao što su i mjerenja ekstremno niskih doza sa visokom tačnošću od 1-2%,te mjerenja doza različitih tipova i energija.
Prednosti termoluminiscentne dozimetrije u odnosu na ostale metode kojekoriste čvrste dozimetre uslovljene su činjenicom da termolumi-niscentnadozimetrija uvodi novi kvalitet u dozimetriju zračenja: visoku osjetljivost, tačnost ipouzdanost, registriranje širokog opsega doza pogodno za različite primjene,približnu tkivnu ili zračnu ekvivalentnost nekih tipova termoluminiscentnihdozimetara, veliku fleksibilnost oblika i dimenzija u odnosu na ostale tipove čvrstihdozimetara, mogućnost njihovog korištenja praktično neograničen broj puta kao ipogodnost za automatizaciju procesa mjerenja i mašinsku obradu rezultatamjerenja.
TL efikasnost kod TL dozimetara definira se kao emitirani TL intenzitetsvjetlosti na jedinicu apsorbirane doze. Tipični TL dozimetri imaju varijacije u TLefikasnosti od 10-15% (relativna standardna devijacija) [1]. Pošto svi TL dozimetrinemaju potpuno jednake TL efikasnosti, nužno je odrediti individualne korekcionekoeficijente (ECC) za svaki korišteni dozimetar, što može reducirati relativnustandardnu devijaciju na 1-2% [1]. Metod nalaženja ECC zasniva se na uspostaviodnosa TL efikasnosti svakog pojedinog dozimetra iz cijelog skupa korištenihdozimetara i srednje TL efikasnosti izdvojene skupine dozimetara koji će bitikorišteni samo za kalibriranje [3].
TL dozimetri pod kontroliranim radnim uvjetima ne bi trebali mijenjati svojeTL efikasnosti, tako da bi na eventualne dodatne greške u mjerenjima doze jedinomogao utjecati TLD čitač. Da bi TLD čitač mogao korektno konvertirati sačuvaneTL informacije u opservabilni električni signal, pogodno je uvesti novu varijablupreko koje bi se izrazio odnos između TL "odgovora" kalibracionih dozimetara iisporučene "količine" zračenja (tzv. kalibracioni faktor čitača - RCF). VrijednostRCF-a omogućava uspostavljnje osnovne veze između TL "odgovora" (u oblikuoslobođenog naboja) i apsorbirane (ili ekvivalentne) doze [3].
117
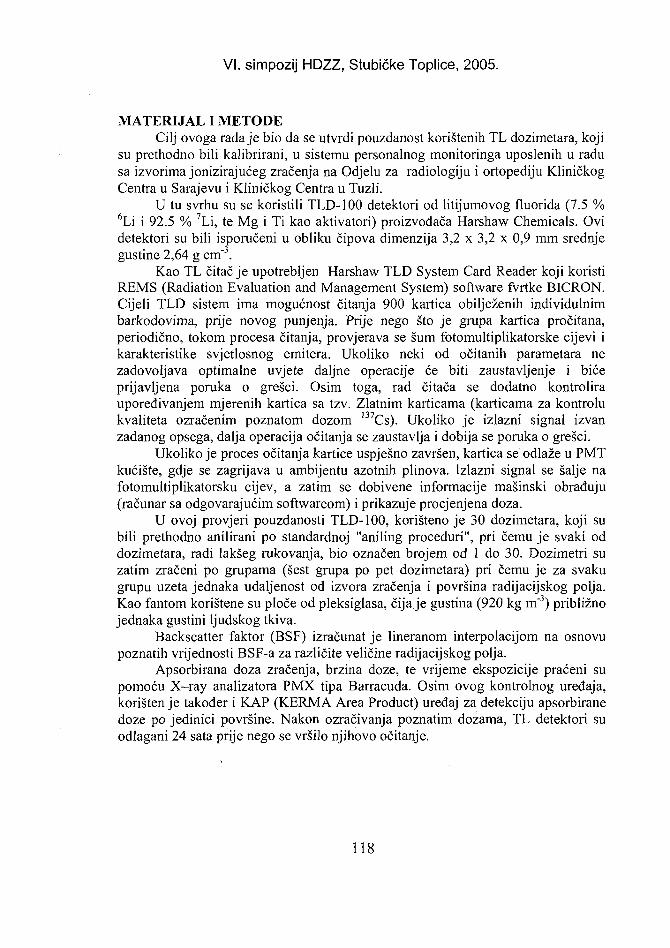
VI. simpozij HDZZ, Stubičke Toplice, 2005.
MATERIJAL I METODECilj ovoga rada je bio da se utvrdi pouzdanost korištenih TL dozimetara, koji
su prethodno bili kalibrirani, u sistemu personalnog monitoringa uposlenih u radusa izvorima jonizirajućeg zračenja na Odjelu za radiologiju i ortopediju KliničkogCentra u Sarajevu i Kliničkog Centra u Tuzli.
U tu svrhu su se koristili TLD-100 detektori od litijumovog fluorida (7.5 %6Li i 92.5 % 7Li, te Mg i Ti kao aktivatori) proizvođača Harshaw Chemicals. Ovidetektori su bili isporučeni u obliku čipova dimenzija 3,2 x 3,2 x 0,9 mm srednjegustine 2,64 g cm"3.
Kao TL čitač je upotrebljen Harshaw TLD System Card Reader koji koristiREMS (Radiation Evaluation and Management System) software fvrtke BICRON.Cijeli TLD sistem ima mogućnost čitanja 900 kartica obilježenih individulnimbarkodovima, prije novog punjenja. Prije nego što je grupa kartica pročitana,periodično, tokom procesa čitanja, provjerava se šum fotomultiplikatorske cijevi ikarakteristike svjetlosnog emitera. Ukoliko neki od očitanih parametara nezadovoljava optimalne uvjete daljne operacije će biti zaustavljenje i bićeprijavljena poruka o grešci. Osim toga, rad čitača se dodatno kontroliraupoređivanjem mjerenih kartica sa tzv. Zlatnim karticama (karticama za kontrolukvaliteta ozračenim poznatom dozom 137Cs). Ukoliko je izlazni signal izvanzadanog opsega, dalja operacija očitanja se zaustavlja i dobija se poruka o grešci.
Ukoliko je proces očitanja kartice uspješno završen, kartica se odlaže u PMTkućište, gdje se zagrijava u ambijentu azotnih plinova. Izlazni signal se šalje nafotomultiplikatorsku cijev, a zatim se dobivene informacije mašinski obrađuju(računar sa odgovarajućim softwareom) i prikazuje procjenjena doza.
U ovoj provjeri pouzdanosti TLD-100, korišteno je 30 dozimetara, koji subili prethodno anilirani po standardnoj "aniling proceduri", pri čemu je svaki oddozimetara, radi lakšeg rukovanja, bio označen brojem od 1 do 30. Dozimetri suzatim zračeni po grupama (šest grupa po pet dozimetara) pri čemu je za svakugrupu uzeta jednaka udaljenost od izvora zračenja i površina radijacijskog polja.Kao fantom korištene su ploče od pleksiglasa, čija je gustina (920 kg m~3) približnojednaka gustini ljudskog tkiva.
Backscatter faktor (BSF) izračunat je lineranom interpolacijom na osnovupoznatih vrijednosti BSF-a za različite veličine radijacijskog polja.
Apsorbirana doza zračenja, brzina doze, te vrijeme ekspozicije praćeni supomoću X-ray analizatora PMX tipa Barracuda. Osim ovog kontrolnog uređaja,korišten je također i KAP (KERMA Area Product) uređaj za detekciju apsorbiranedoze po jedinici površine. Nakon ozračivanja poznatim dozama, TL detektori suodlagani 24 sata prije nego se vršilo njihovo očitanje.
118
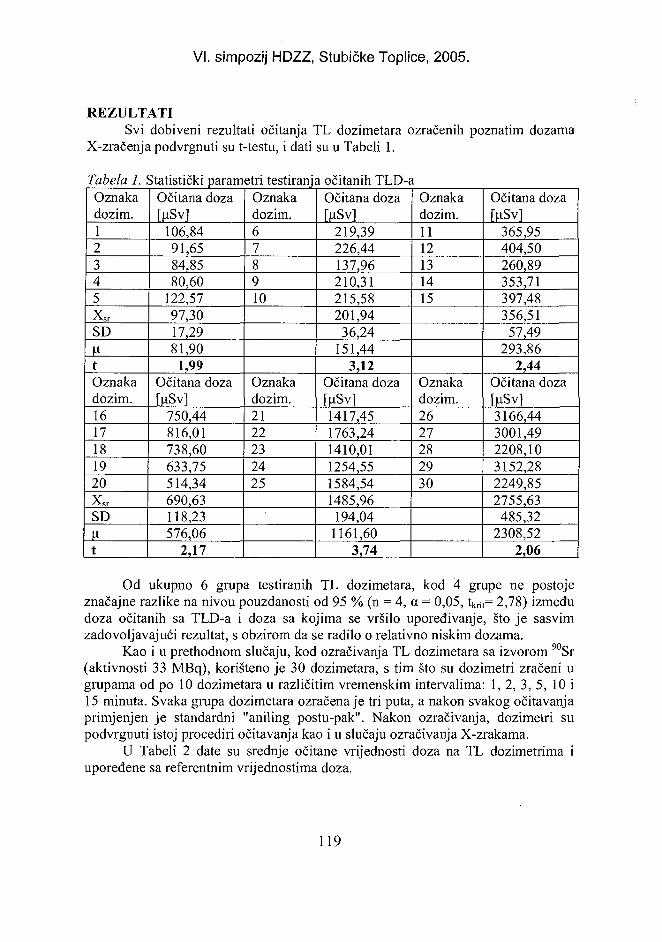
VI. simpozij HDZZ, Stubičke Toplice, 2005.
REZULTATISvi dobiveni rezultati očitanja TL dozimetara ozračenih poznatim dozama
X-zračenja podvrgnuti su t-testu, i dati su u Tabeli 1.
Tabela 1. iOznakadozim.12345x s rSD
tOznakadozim.1617181920
x s rSDV-t
statistički parametri testiranja očitanih TLD-£Očitana doza[uSv]
106,8491,6584,8580,60
122,5797,3017,2981,90
1,99Očitana doza[uSv]
750,44816,01738,60633,75514,34690,63118,23576,06
2,17
Oznakadozim.678910
Oznakadozim.2122232425
Očitana dozarusvi
219,39226,44137,96210,31215,58201,94
36,24151,44
3,12Očitana doza[uSvl1417,451763,241410,011254,551584,541485,96
194,041161,60
3,74
i
Oznakadozim.1112131415
Oznakadozim.2627282930
Očitana doza[uSv]
365,95404,50260,89353,71397,48356,51
57,49293,86
2,44Očitana doza[uSvl3166,443001,492208,103152,282249,852755,63
485,322308,52
2,06
Od ukupno 6 grupa testiranih TL dozimetara, kod 4 grupe ne postojeznačajne razlike na nivou pouzdanosti od 95 % (n = 4, a = 0,05, tkrit= 2,78) izmeđudoza očitanih sa TLD-a i doza sa kojima se vršilo upoređivanje, što je sasvimzadovoljavajući rezultat, s obzirom da se radilo o relativno niskim dozama.
Kao i u prethodnom slučaju, kod ozračivanja TL dozimetara sa izvorom 90Sr(aktivnosti 33 MBq), korišteno je 30 dozimetara, s tim što su dozimetri zračeni ugrupama od po 10 dozimetara u različitim vremenskim intervalima: 1, 2, 3, 5, 10 i15 minuta. Svaka grupa dozimetara ozračena je tri puta, a nakon svakog očitavanjaprimjenjen je standardni "aniling postu-pak". Nakon ozračivanja, dozimetri supodvrgnuti istoj procediri očitavanja kao i u slučaju ozračivanja X-zrakama.
U Tabeli 2 date su srednje očitane vrijednosti doza na TL dozimetrima iupoređene sa referentnim vrijednostima doza.
119
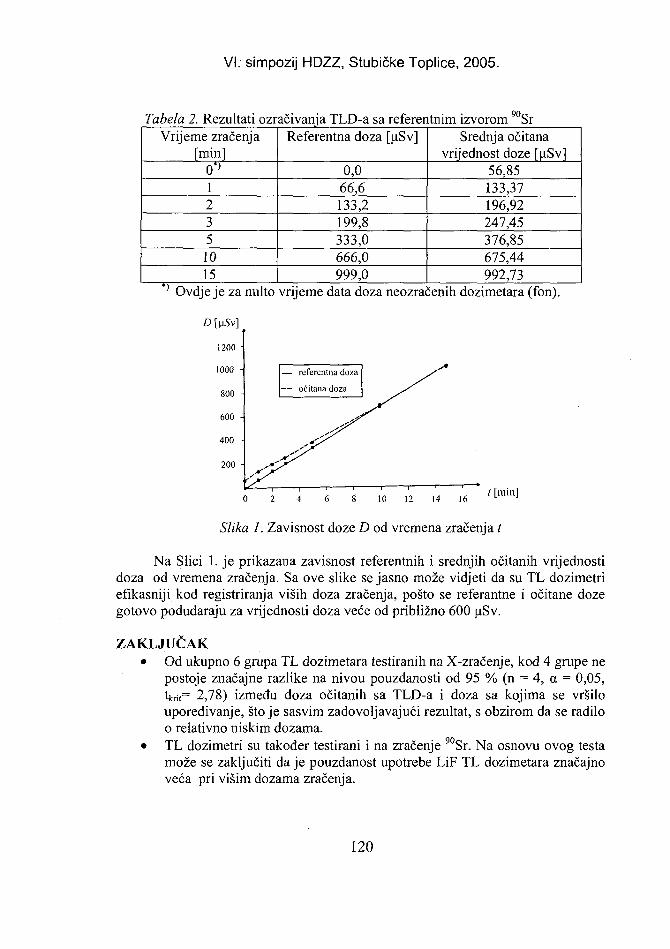
VI. simpozij HDZZ, Stubičke Toplice, 2005.
Tabela 2. Rezultati ozračivanja TLD-a sa referentnim izvorom SrVrijeme zračenja
[min]0*>12351015
Referentna doza [uSv]
0,066,6133,2199,8333,0666,0999,0
Srednja očitanavrijednost doze [uSv]
56,85133,37196,92247,45376,85675,44992,73
' Ovdje je za nulto vrijeme data doza neozračenih dozimetara (fon).
1200 -
000 -
800 -
600 -
400 •
200 -
^ 1—
— referentna doza
— očitana doza
1 1 1 1 i • ' *
10 12 14 16t [min]
Slika 1. Zavisnost doze D od vremena zračenja t
Na Slici 1. je prikazana zavisnost referentnih i srednjih očitanih vrijednostidoza od vremena zračenja. Sa ove slike se jasno može vidjeti da su TL dozimetriefikasniji kod registriranja viših doza zračenja, pošto se referantne i očitane dozegotovo podudaraju za vrijednosti doza veće od približno 600 uSv.
ZAKLJUČAK• Od ukupno 6 grupa TL dozimetara testiranih na X-zračenje, kod 4 grupe ne
postoje značajne razlike na nivou pouzdanosti od 95 % (n = 4, a = 0,05,tkrit= 2,78) između doza očitanih sa TLD-a i doza sa kojima se vršiloupoređivanje, što je sasvim zadovoljavajući rezultat, s obzirom da se radiloo relativno niskim dozama.
• TL dozimetri su također testirani i na zračenje 90Sr. Na osnovu ovog testamože se zaključiti daje pouzdanost upotrebe LiF TL dozimetara značajnoveća pri višim dozama zračenja.
120
VI. simpozij HDZZ, Stubičke Toplice, 2005.
• Kod personalnog monitoringa uposlenih na radu s izvorima jonizira-jućihzračenja, ne očekuje se izlagnje jako niskim dozama upore-divim saambijentalnim dozama (prirodno zračenje), već znatno višim. S toga, obaprovedena testa, i sa izlaganjem dozimetara X-zračenju i zračenju od 90Sr,potvrđuju da su TLD-100 prihvatljivi za kontrolu doza zračenja kojima jeizloženo medicinsko osoblje.
LITERATURA[1] Petterson JM. Dose Algorithm Determination for the Los Alamos National
laboratory Personnel Dosimetry System, Master of Science in the Depatment ofEnvironmental Sciences and Engineering, Chaptel Hill, 1995.
[2] Halilović S. Termoluminiscentna dozimetrija sa TLD-100, Diplomski rad, Prirodno-matematički Fakultet Sarajevo, Odsjek za fiziku, Sarajevo, 2004.
[3] Radiation Evaluation and Managment System (TLD-REMS and NET-REMS)Operator's Manual BICRON Harshaw TLD, Ohio, USA, 1997.
ESTIMATION OF THE USE CONFIDENCE OF THETHERMOLUMINISCENCE DOSIMETRY WITH TLD-100
Davorin Samek1, Begzada Basic2and Senada Halilović*'Veterinary College - University Sarajevo, Zmaja od Bosne 90
2Centre for Protection of Ionising Radiation Sarajevo3Clinical Centre - University Sarajevo, Bolnička 25
71000 Sarajevo, Bosnia and Herzegovinae-mail: [email protected]
The goal of radiation dosimetry is to estimate the quantity of energy depositedin a matter after interaction with incoming ionising radiation. Thermoluminiscencedosimetry is one of the most common techniques in measuring the received dose ofionising radiation. Accuracy and the ease of use are basic features of TL dosimetrywhich favour its clinical use. This study investigated the confidence of LiFthermoluminiscence dosimeters used by the staff of the Radiology andOrthopaedics Departments of Clinical Centres in Sarajevo and Tuzla. Thedosimeters were irradiated with known doses of 90Sr and X-rays. The statisticalanalysis of results suggests that recorded doses did not deviate more than ±5%. Asignificant increase in the reliability of LiF dosimeters was found at higherradiation doses.
121
VI. simpozij HDZZ, Stubičke Toplice, HR0500039
INTERKOMPORACIJA KAP-METRA, TL DOZIMETARA IBARRACUDE SA DETEKTOROM R-100
Begzada Bašić', Adnan Beganović2, Suad Džanić'i Advan Drljević2
'Zavod za javno zdravstvo FBiH, M. Tita 92Klinički centar Univerziteta u Sarajevu, Bolnička 25
71000 Sarajevo, Bosna i Hercegovinae-mail: [email protected]; [email protected]
UVODKerma Area Product Meter (KAP metar) je mjerni instrument kojim se mjeri
umnožak apsorbovane doze i površine polja zračenja. Ova vrijednost se možepreračunati u efektivnu dozu koju prime pacijenti pri utvrđenim dijagnostičkimpretragama. Zbog toga se sve više primjenjuje u dijagnostičkoj radiologiji.Pošto se stavljanjem jonizacione komore KAP-metra u snop promjeni kvalitetsnopa (atenuacijom snopa u zidovima komore); tj. ulazna doza se razlikuje odizlazne, postavlja se pitanje interpretacije očitanja KAP-metra. Da bismo bilisigurni u tačnost izmjerenih rezultata mjerenja izvršili smo interkomporaciju KAP-metra, termoluminescentnih dozimetara (TLD) i mjernog sistema Barracuda(detektor R-100).
MATERIJAL I METODE
Tabela 1. Podaci o kalibraciji korištenih instrumenataMjerni instrumentR-100KAP metarTLDČitač TLD
TipRTI Barracuda
RTIDoseguard 100TLD-100(LiF:Mg,Ti)
Harshaw 4500
Datum kalibracije21.05.2002.21.01.2004.
22.11.2004.
Dozimetri su zračeni na rendgen uređaju (Siemens Polyphos 50) na Institutuza radiologiju Kliničkog centra Univerziteta Sarajevo. Kontrola kvalitetarendgenskog uređaja urađena je u aprilu 2004. godine, gdje je utvrđen koeficijentvarijacije 0,005 kod reproducibilnosti doze sa filterskom poluvrijednošću (HVL)2,751 mmAl.
Referentnim detektorom (R-100) mjerili smo dozu sa i bez postavljenejonizacione komore KAP-metra (Tabela 2).
TL dozimetri su anilirani po standardnoj aniling proceduri prije nego što suizloženi x-zračenju. U tu svrhu koristili smo 40 TL dozimetara, koje smo podijeliliu pet grupa po 8 dozimetara. Svaku grupu smo postavljali na pleksiglas debljine
122
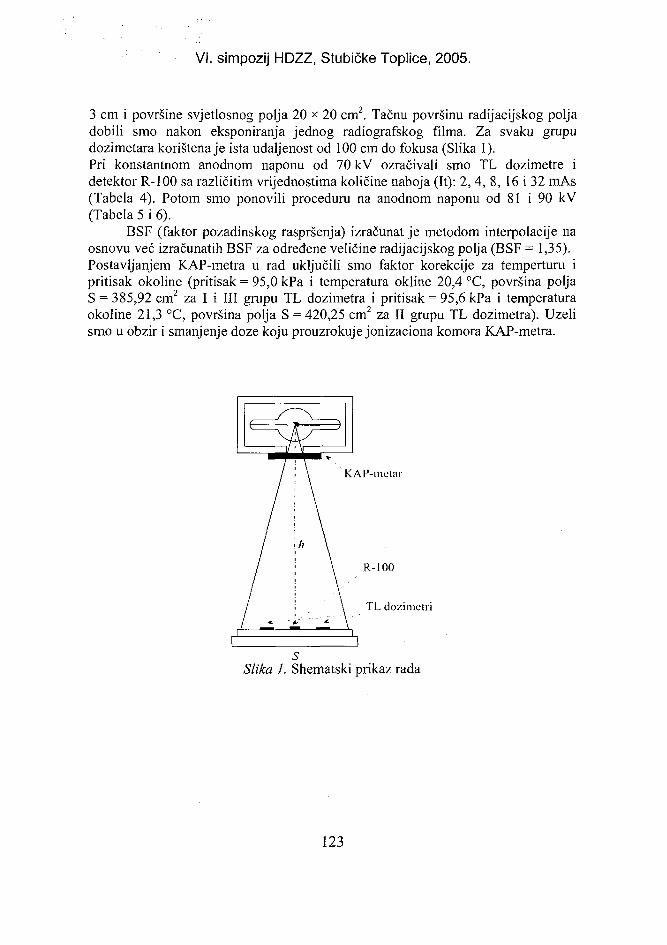
VI. simpozij HDZZ, Stubičke Toplice, 2005.
3 cm i površine svjetlosnog polja 20 x 20 cm2. Tačnu površinu radijacijskog poljadobili smo nakon eksponiranja jednog radiografskog filma. Za svaku grupudozimetara korištena je ista udaljenost od 100 cm do fokusa (Slika 1).Pri konstantnom anodnom naponu od 70 kV ozračivali smo TL dozimetre idetektor R-100 sa različitim vrijednostima količine naboja (It): 2,4, 8, 16 i 32 mAs(Tabela 4). Potom smo ponovili proceduru na anodnom naponu od 81 i 90 kV(Tabela 5 i 6).
BSF (faktor pozadinskog raspršenja) izračunat je metodom interpolacije naosnovu već izračunatih BSF za određene veličine radijacijskog polja (BSF = 1,35).Postavljanjem KAP-metra u rad uključili smo faktor korekcije za temperturu ipritisak okoline (pritisak = 95,0 kPa i temperatura okline 20,4 °C, površina poljaS = 385,92 cm2 za I i III grupu TL dozimetra i pritisak = 95,6 kPa i temperaturaokoline 21,3 °C, površina polja S = 420,25 cm2 za II grupu TL dozimetra). Uzelismo u obzir i smanjenje doze koju prouzrokuje jonizaciona komora KAP-metra.
KAP-mctar
R-100
TL dozi metri
Slika 1. Shematski prikaz rada
123
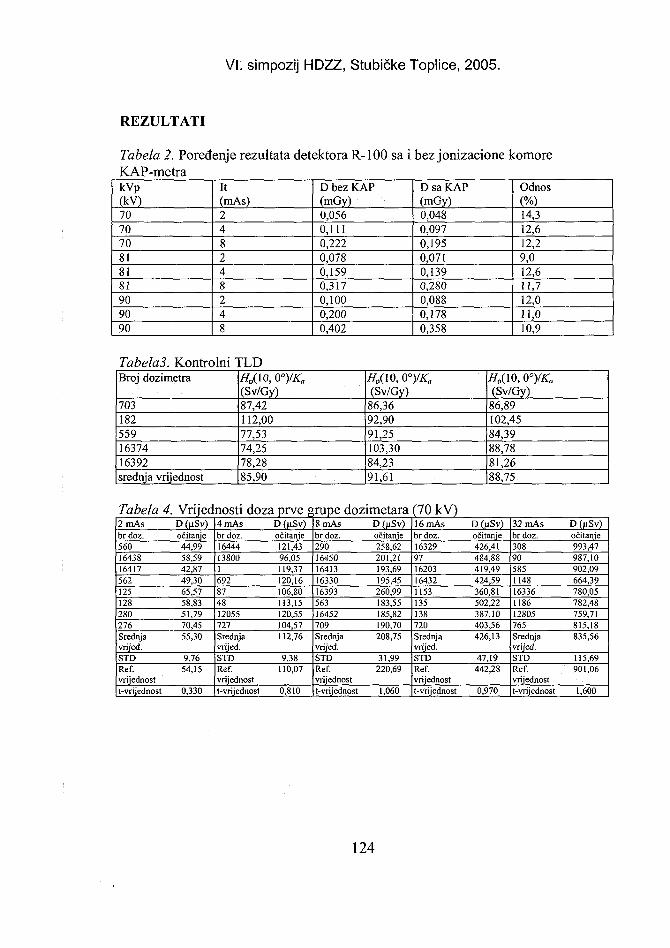
VI. simpozij HDZZ, Stubičke Toplice, 2005.
REZULTATI
Tabela 2. Poređenje rezultata detektora R-100 sa i bez jonizacione komoreKAP-metrakVp(kV)707070818181909090
It(mAs)248248248
D bez KAP(mGy)0,0560,1110,2220,0780,1590,3170,1000,2000,402
D sa KAP(mGy)0,0480,0970,1950,0710,1390,2800,0880,1780,358
Odnos(%)14,312,612,29,012,611,712,011,010,9
TabelaS. Kontrolni TLDBroj dozimetra
7031825591637416392srednja vrijednost
Hv{m,0°)IKa
(Sv/Gy)87,42112,0077,5374,2578,2885,90
tf„(10, V>)IKa
(Sv/Gy)86,3692,9091,25103,3084,2391,61
H„{l0,0yKa
(Sv/Gy)86,89102,4584,3988,7881,2688,75
Tabela 4.2 mAsbr doz.5601643816417562125128280276Srednjavrijed.STDRef.vrijednostt-vrijednost
Vrijednosti doza prveD(nSv)očitanje44,9958,5942,8749,3065,5758,8351,7970,4555,30
9,7654,15
0,330
4 mAsbr doz.16444138001692874812055727Srednjavrijed.STDRef.vrijednostt-vrijednost
D(nSv)očitanje121,4396,05119,37120,16106,80113,15120,55104,57112,76
9,38110,07
0,810
grupe dozimetara8 mAsbr doz.2901645016413163301639356316452709Srednjavrijed.STDRef.vrijednostt-vrijednost
D (jiSv)očitanje258,62201,21193,69195,45260,99183,55185,82190,70208,75
31,99220,69
1,060
(70 kV)16 mAsbr doz.163299716203164321153135138720Srednjavrijed.STDRef.vrijednostt-vrijednost
D(nSv)očitanje426,41484,88419,49424,59360,81502,22387,10403,56426,13
47,19442,28
0,970
32 mAsbr doz.30890585114816336118612805765Srednjavrijed.STDRef.vrijednostt-vrijednost
D (uSv)očitanje993,47987,10902,09664,39780,05782,48759,71815,18835,56
115,69901,06
1,600
124
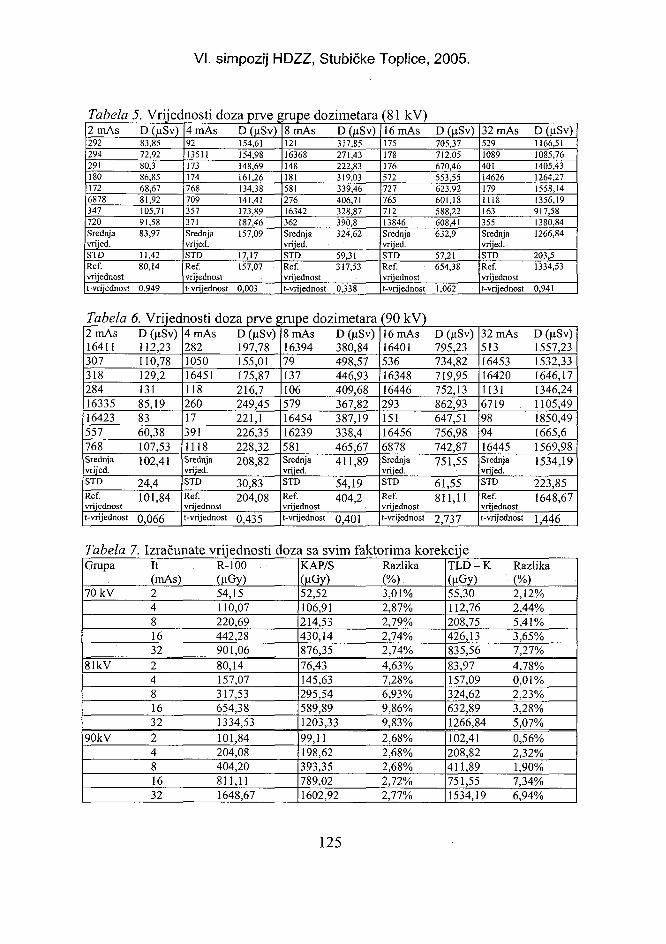
VI. simpozij HDZZ, Stubičke Toplice, 2005.
Tabela2mAs2922942911801726878347720Srednjavrijed.STDRef.vrijednostt-vrijednost
5. Vrijednosti doza prve grupe dozimetaraD (MSv)83,8572,9280,386,8568,6781,92105,7191,5883,97
11,4280,14
0,949
4 mAs9213511173174768709357371Srednjavrijed.STDRef.vrijednostt-vrijednost
D (uSv)154,61154,98148,69161,26134,38141,41173,89187,46157,09
17,17157,07
0,003
8 mAs1211636814818158127616342362Srednjavrijed.STDRef.vrijednostt-vrijednost
D GiSv)317,85271,43222,83319,03339,46406,71328,87390,8324,62
59,31317,53
0,338
(81 kV)16 mAs17517817657272776571213846Srednjavrijed.STDRef.vrijednostt-vrijednost
D (uSv)705,37712,05670,46553,55623,92601,18588,22608,41632,9
57,21654,38
1,062
32 mAs5291089401146261791118163355Srednjavrijed.STDRef.vrijednostt-vrijednost
D (uSv)1166,511085,761405,431264,271558,141356,19917,581380,841266,84
203,51334,53
0,941
Tabela2 mAs164113073182841633516423557768Srednjavrijed.STD
Ref.vrijednostt-vrijednost
6. Vrijednosti doza prve grupe dozimetaraD GiSv)112,23110,78129,213185,198360,38107,53102,41
24,4101,84
0,066
4 mAs282105016451118260173911118Srednjavrijed.STD
Ref.vrijednostt-vrijednost
D (uSv)197,78155,01175,87216,7249,45221,1226,35228,32208,82
30,83204,08
0,435
8 mAs16394791371065791645416239581Srednjavrijed.STD
Ref.vrijednostt-vrijednost
D(nSv)380,84498,57446,93409,68367,82387,19338,4465,67411,89
54,19404,2
0,401
(90 kV)16 mAs164015361634816446293151164566878Srednjavrijed.STD
Ref.vrijednostt-vrijednost
D (uSv)795,23734,82719,95752,13862,93647,51756,98742,87751,55
61,55.811,11
2,737
32 mAs513164531642011316719989416445Srednjavrijed.STD
Ref.vrijednostt-vrijednost
D GiSv)1557,231532,331646,171346,241105,491850,491665,61569,981534,19
223,851648,67
1,446
TabelaGrupa
70 kV
81kV
90kV
7. IzračunateIt(mAs)248163224816322481632
vrijednostiR-100(nGy)54,15110,07220,69442,28901,0680,14157,07317,53654,381334,53101,84204,08404,20811,111648,67
doza sa svimKAP/S(nGy)52,52106,91214,53430,14876,3576,43145,63295,54589,891203,3399,11198,62393,35789,021602,92
faktorima korekcijeRazlika(%)3,01%2,87%2,79%2,74%2,74%4,63%7,28%6,93%9,86%9,83%2,68%2,68%2,68%2,72%2,77%
T L D - K(nGy)55,30112,76208,75426,13835,5683,97157,09324,62632,891266,84102,41208,82411,89751,551534,19
Razlika(%)2,12%2,44%5,41%3,65%7,27%4,78%0,01%2,23%3,28%5,07%0,56%2,32%1,90%7,34%6,94%
125
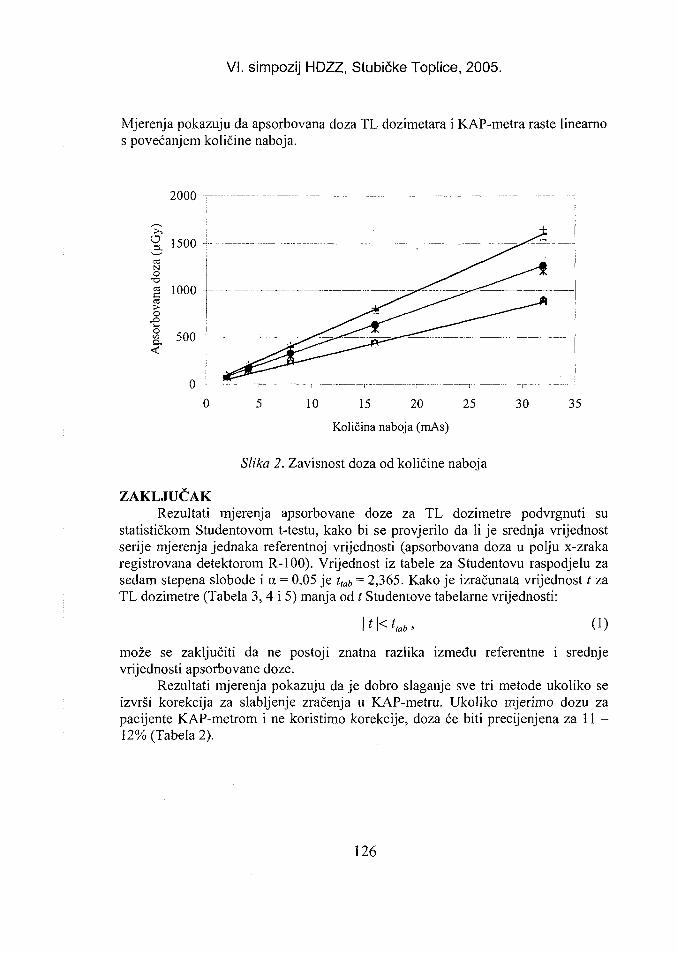
VI. simpozij HDZZ, Stubičke Toplice, 2005.
Mjerenja pokazuju da apsorbovana doza TL dozimetara i KAP-metra raste linearnos povećanjem količine naboja.
2000 -
o 1500
1CO>o
<
0 - i _ ~ r , ,
1000 —
500 - i - ~
0 5 10 15 20 25 30 35
Količina naboja (mAs)
Slika 2. Zavisnost doza od količine naboja
ZAKLJUČAKRezultati mjerenja apsorbovane doze za TL dozimetre podvrgnuti su
statističkom Studentovom t-testu, kako bi se provjerilo da li je srednja vrijednostserije mjerenja jednaka referentnoj vrijednosti (apsorbovana doza u polju x-zrakaregistrovana detektorom R-100). Vrijednost iz tabele za Studentovu raspodjelu zasedam stepena slobode i a = 0,05 je tlab = 2,365. Kako je izračunata vrijednost; zaTL dozimetre (Tabela 3, 4 i 5) manja od t Studentove tabelarne vrijednosti:
t\<t lab ' (1)
može se zaključiti da ne postoji znatna razlika između referentne i srednjevrijednosti apsorbovane doze.
Rezultati mjerenja pokazuju da je dobro slaganje sve tri metode ukoliko seizvrši korekcija za slabljenje zračenja u KAP-metru. Ukoliko mjerimo dozu zapacijente KAP-metrom i ne koristimo korekcije, doza će biti precijenjena za 11 -12% (Tabela 2).
126
VI. simpozij HDZZ, Stubičke Toplice, 2005.
LITERATURA[1] Tabakov S.D, Emerald - Physics of Diagnostic Radiology, X-ray Dosimetry and
Patient Dosimetry. King's College London - GKT School of Medicine 2001.[2] International Standard ISO 4037-3, International Organisation of Standardisation,
1999.
INTERCOMPARISON OF KAP-METER, TL DOSIMETERSAND BARRACUDA SYSTEM WITH R-100 DETECTOR
Begzada Bašić', Adnan Beganović2, Suad Džanić'and Advan Drljević2
'institute of Public Health of Federation of Bosnia and Herzegovina, M. Tita 92Clinical Centre of Sarajevo University, Bolnička 25
71000 Sarajevo, Bosnia and Herzegovinae-mail: [email protected]; [email protected]
The aim of this study was to check whether TLDs could be used for calibrationof a KAP-meter. We used 40 TLDs divided into 5 groups of 8 dosimeters. Theywere irradiated together with a Barracuda detector R-100 and KAP-meter.Dosimeters were placed on a 3 cm thick PMMA phantom using the same distanceof 100 cm from focal spot. Exposures were performed using various tube currentsand potentials. TLDs were read on Harshaw 4500 TLD-reader. Results obtained byTLDs were compared with known values given by KAP and Barracuda. We usedStudent's Mest to check whether the results were comparable. Student's /-testshowed that TLDs could be used to calibrate KAP-meter.
127
VI. simpozij HDZZ, Stubičke Toplic HR0500040
VALIDATION OF EFFICIENCY CALIBRATION OF HPGeCTOR USIN(SOLUTION
WELL-TYPE DETECTOR USING A 8 5Sr STANDARD
Arunas Gudelis, Benedikta Lukšiene, Vaida Kubarevičiene andArturas Žiukas
Institute of Physics, Savanoriq Ave. 231, LT-02300 Vilnius, Lithuaniae-mail: [email protected]
INTRODUCTIONApplication of near 4rc geometry for measuring a sample increases the
counting efficiency, lowers the detection limit and thus improves considerably aperformance of gamma-spectrometry system, especially in low-level measurements[1,2]. At the same time, a spectrometer involving a well-type counter requires a setof single-photon emitting radionuclides for efficiency calibration due topronounced coincidence-summing effect. Once an efficiency curve is properlydetermined the necessary corrections can be fulfilled either experimentally, usingknown activities of radionuclides in question [3], or calculated, usually by MonteCarlo simulations [4,5].
In the work [3], an efficiency calibration was performed for particular HPGewell-type detector using reference standard solutions with 57Co, l37Cs, 54Mn, 65Znand 40K. This set of radionuclides allowed constructing the five-points calibrationcurve that provided the dependence of counting efficiency on energy in the region(122-1461) keV. However, the first half of this region (122-662) keV experiencedthe lack of suitable calibration points.
In this work, the 85Sr reference standard solution was applied for validatingprevious efficiency calibration. The counting efficiency at 514 keV wasinvestigated taking into account the filling height of measuring container, too.
MATERIALS AND METHODSThe HPGe well-type detector (GWL-series) was coupled to spectroscopy
amplifier of model 672 and 16k multichannel buffer MCB 919. For dataacquisition and analysis the software Gamma Vision (v. 4.10) was used. Allequipment and analysis software was made by EG&G Ortec (now PerkinElmer).The sensitive volume of the germanium crystal was 170 cm3, the well couldaccommodate samples up to 4 cm3. The full-width at a half peak maximum(FWHM) resolution was 2.05 keV at 1333 keV, the relative efficiency 38%. Thedetector was installed in the low-background shield consisting of 101 mm certifiedlead with the graded liner of 0.5 mm of tin and 1.6 mm of copper to suppress theX-rays of lead. The minimum detectable activity (MDA) achievable for full
128
VI. simpozij HDZZ, Stubičke Toplice, 2005.
container sample counted for 100000 s, according to Currie's criterion [6] was 12mBq and 20 mBq, for 137Cs and 60Co, respectively.
The initial activity concentration of 85Sr reference standard solution was 100kBq/g on 1 January 2004 with associated uncertainty of 1.5%. The workingsolution was prepared in the 0.01 M HNO3 medium by appropriate dilutionprocedure. The activity concentration of working solution was 185.3 Bq/g on 12March 2004, the day of measurements. Four samples were prepared of differentfilling heights: 10, 20, 30 and 40 mm. Each sample was measured four times,counting time was set to 600 s, that rather short time was aimed to avoid aninterference with annihilation peak at 511 keV. A number of counts in the peakwere of the order of 22000 and 72000 for filling heights 10 and 40 mm,respectively, this ensured an error due to counting statistics less than 0.7%. Deadtime varied from 0.41% (h=10 mm) to 1.06% (h=40 mm).
The counting efficiency, or full-energy-peak efficiency was defined as theratio between count rate in the peak corresponding to the energy E and the rate atwhich photons of energy E were emitted from the source [7].
The validation of previous calibration was fulfilled by the followingprocedure. It was found earlier [3] that five points (122, 662, 835, 1116 and 1461keV) were best fitted to the exponential decay of the second order which providedless than 1% deviation from the experimental mean for each of 5 points. Theresponse at 514 keV was calculated using 5-points curve and compared to theexperimental mean at 514 keV. Later on, the value of the experimental mean at 514keV was added to the former set of 5 points, and these six points were fitted to theexponential decay of the second order again. The obtained 6-points curve wasexamined taking into account the differences between a fit and experimental meanat all six points.
In all calculations involving the fitting to the exponential decay of thesecond order the following values of energies, expressed in keV, were used: 122.06(57Co), 514.01 f1460.80 (40K) [9].(57Co), 514.01 (85Sr), 661.66 (137Cs), 834.84 (54Mn), 1115.55 (65Zn) [8] and
RESULTSExperimental values of counting efficiencies at 514 keV are shown in Table
1. The standard deviation of the mean is of the order of 1%, this indicates goodrepeatability of the results.
129
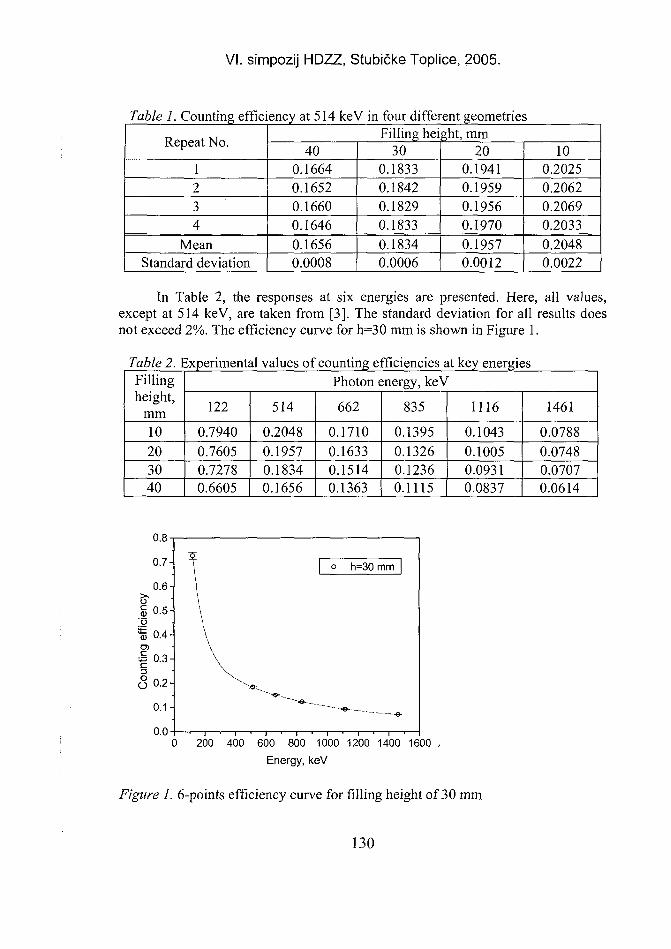
VI. simpozij HDZZ, Stubičke Toplice, 2005.
Table 1. Counting efficiency at 514
Repeat No.
1234
MeanStandard deviation
400.16640.16520.16600.16460.16560.0008
keV in four differentFilling height
300.18330.18420.18290.18330.18340.0006
geometriemm
200.19410.19590.19560.19700.19570.0012
100.20250.20620.20690.20330.20480.0022
In Table 2, the responses at six energies are presented. Here, all values,except at 514 keV, are taken from [3]. The standard deviation for all results doesnot exceed 2%. The efficiency curve for h=30 mm is shown in Figure 1.
Table 2. Experimental values of counting efficiencies iFillingheight,
mm10203040
it key energiesPhoton energy, keV
122
0.79400.76050.72780.6605
514
0.20480.19570.18340.1656
662
0.17100.16330.15140.1363
835
0.13950.13260.12360.1115
1116
0.10430.10050.09310.0837
1461
0.07880.07480.07070.0614
0.7-
0.6-
oS 0.5-o
% 0.4-
B 0.3-
<S0.2-
0.1-
0.0-
\
\\\\\
o h=30 mm |
&•
0 200 400 600 800 1000 1200 1400 1600 ,
Energy, keV
Figure 1. 6-points efficiency curve for filling height of 30 mm
130
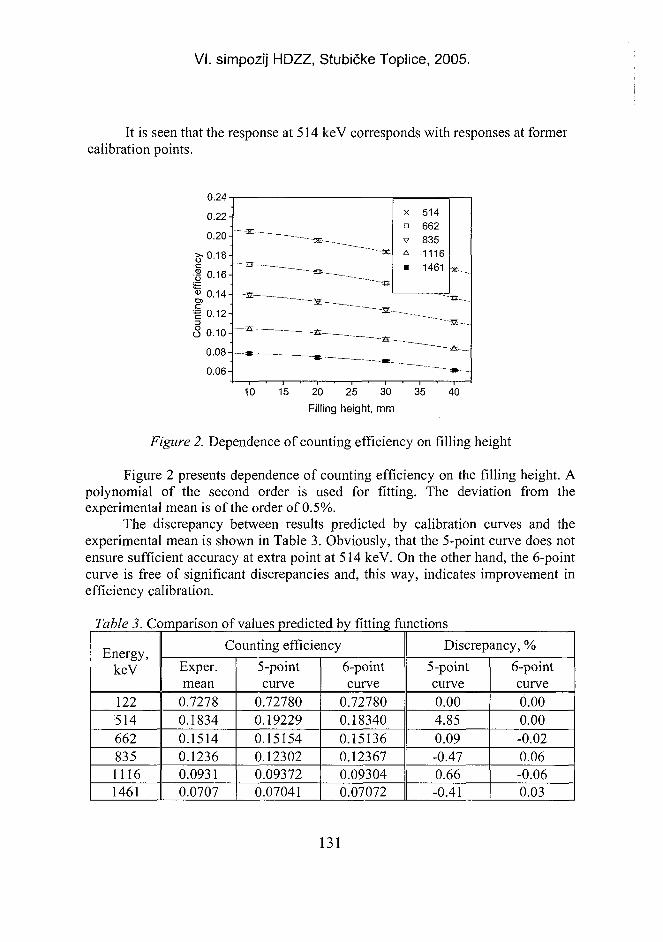
VI. simpozij HDZZ, Stubičke Toplice, 2005.
It is seen that the response at 514 keV corresponds with responses at formercalibration points.
15 20 25 30 35
Filling height, mm
40
Figure 2. Dependence of counting efficiency on filling height
Figure 2 presents dependence of counting efficiency on the filling height. Apolynomial of the second order is used for fitting. The deviation from theexperimental mean is of the order of 0.5%.
The discrepancy between results predicted by calibration curves and theexperimental mean is shown in Table 3. Obviously, that the 5-point curve does notensure sufficient accuracy at extra point at 514 keV. On the other hand, the 6-pointcurve is free of significant discrepancies and, this way, indicates improvement inefficiency calibration.
Table 3. Comparison of values predicted by fitting functions
Energy,keV
12251466283511161461
Counting efficiencyExper.mean
0.72780.18340.15140.12360.09310.0707
5-pointcurve
0.727800.192290.151540.123020.093720.07041
6-pointcurve
0.727800.183400.151360.123670.093040.07072
Discrepancy, %5-pointcurve0.004.850.09-0.470.66-0.41
6-pointcurve0.000.00-0.020.06-0.060.03
131
VI. simpozij HDZZ, Stubičke Toplice, 2005.
CONCLUSIONS
Efficiency calibration was validated by including an extra response at 514keV in a new efficiency curve construction for particular HPGe well-type detector.This procedure let to improve an accuracy of previous calibration, especially in theenergy region (122-662) keV. There is still a lack of precise responses in the region(122-514) keV necessary for accurate quantitative analysis.
ACKNOWLEDGEMENTS
This work was possible due to 85Sr reference standard solution obtained fromRise National Laboratory (dr. Sven P. Nielsen) in December 2003.
HPGe well-type detector was provided within the IAEA TC projectLIT/9/003 "Radioecology in the vicinity of the Ignalina NPP" in 1998.
REFERENCES
[1] Reyss JL, Schmidt S, Legeleux F, Bonte P. Large, low background well-typedetectors for measurements of environmental radioactivity. Nucl Instr Meth PhysRes 1995;A357:391-397.
[2] Gudelis A, Remeikis V, Gubachev I, Batalin J. Results on improved environmentalmonitoring at the Ignalina NPP site (paper no. 17p). In: CD-ROM Unedited papersof IAEA International Conference on Advances in Destructive and Non-DestructiveAnalysis for Environmental Monitoring and Nuclear Forensics, October 21-23,2002; Karlsruhe, Germany. Vienna: IAEA; 2003.
[3] Gudelis A, Remeikis V, Plukis A, Lukauskas D. Efficiency calibration of HPGedetectors for measuring environmental samples. Environmental and Chemical Phys2000;22(3/4):l 17-125.
[4] Sima O, Arnold D. Self-attenuation and coincidence-summing corrections calculatedby Monte Carlo simulations for gamma-spectrometric measurements with well-typegermanium detectors. Appl Radiat Isot 1996;47(9/10):889-893.
[5] Laborie JM, Le Petit G, Abt D, Girard M. Monte Carlo calculation of the efficiencycalibration curve and coincidence-summing corrections in low-level gamma-rayspectrometry using well-type HPGe detectors. Appl Radiat Isot 2000;53:57-62.
[6] Currie LA. Limits for qualitative detection and quantitative determination. AnalChem 1968;40(3):586-593.
[7] Debertin K, Helmer RG. Gamma- and X-ray spectrometry with semiconductordetectors. North Holland, Amsterdam, 1988. ISBN 0-444-87107-1.
[8] International Atomic Energy Agency (IAEA). X-ray and gamma-ray standards fordetector calibration. TECDOC Series No. 619. Vienna: IAEA; 1991.
[9] Magill J. Nuclides.net. An integrated environment for computations onradionuclides and their radiation. European Communities and Springer-Verlag,Berlin, Heidelberg, 2003. ISBN 3-540-43448-8.
132
VI. simpozij HDZZ, Stubičke Toplice, 2005.
ABSTRACTThe application of near 4n counting geometry for determining low-level
gamma-emitters improves detection limits considerably. At the same time, truecoincidence effect is pronounced in a well-type counter, and requires correction forloss of coincidence. Therefore, only single-photon emitting radionuclides can beused for efficiency calibration. An efficiency calibration was performed for aparticular HPGe well-type detector using reference standard solutions with 57Co,137Cs, 54Mn, 65Zn and 40K. This set of radionuclides allowed to construct acalibration curve that provided overall uncertainty of 6% in activity measurementsin the energy region of 122-1461 keV. However, the first half of this region (122-662 keV) lacked suitable calibration points; it was therefore expected that anyadditional point could enhance calibration. 85Sr reference standard solution wasapplied for this task where available. The counting efficiency was investigatedtaking into account the filling height of the measuring container. Detector responseat 514 keV was included in a new efficiency curve construction, which made itpossible to improve the precision of previous calibration.
133
VI. simpozij HDZZ, Stubičke Toplice HR0500041
CALIBRATION OF A GAMMAMED 12i 1 9 2 Ir HIGH DOSERATE SOURCE
Tomislav Bokulić, Mirjana Budanec, Iva Mrčela, Ana Frobe andZvonko Kusić
Department of Oncology and Nuclear Medicine, University Hospital"Sestre milosrdnice", Vinogradska c. 29, HR-10000 Zagreb, Croatia
e-mail: [email protected]
INTRODUCTIONHigh dose rate brachytherapy (HDRBT) with remote afterloading
Gammamed 12i unit has been used in Department of Oncology and NuclearMedicine for about three years. Current clinical applications involve intracavitarytreatment of the following localisations: cervix, endometrium, bronchus,oesophagus and nasopharinx.
The 192Ir miniature source in the form of a small pellet (1.1 mm outerdiameter and 5.6 mm length) is laser welded to a wire that pushes and pulls itthrough the plastic catheter to the desired location in an applicator.
One of essential steps in HDRBT quality assurance and safety programme iscalibration of the 192Ir source. The calibration is usually made with a well-typeionisation chamber or by a thimble type (Farmer) chamber free in air. The 192Ircalibration coefficient for Farmer type chambers can be obtained by interpolativetechnique with two beam qualities (250 kVp X rays and 60Co), recommended bythe IAEA [1]. Alternatively, 250 kVp X rays and l37Cs beam qualities, like in USAlaboratories [2], or even 11 beam qualities (nine X rays, 60Co and l37Cs) [3] can beutilised in a calibration technique.
In this work we present the results of calibration of 11 sources performedwith Standard Imaging HDR1000+ well chamber. We determined the axial mostsensitive measurement point in the chamber and investigated the effect of thescatter environment on the chamber's output- ionisation current (charge). Thecalibration results were compared to the measurements in air done by the 0.6 cm3
Farmer type chamber. However, we used the only available 60Co calibrationcoefficient. The conventional electrometer/chamber corrections and nonuniformity(exposure gradient) corrections due to finite dimensions of the chamber wereutilised. The influence of room scatter was also estimated.
MATERIAL AND METHODSSince the introduction of the HDRBT procedures in department, the
calibration of 192Ir source has been performed by the large volume (V=245 cm3) re-entrant well chamber HDR 1000+ attached to the Excalibur CDX 2000A (Standard
134
VI. simpozij HDZZ, Stubičke Toplice, 2005.
Imaging) electrometer. The voltage (+300 V) is applied through the triax cable tothe collecting electrode, a thin-walled aluminium tube. The moving HDR source ina plastic needle can be positioned in the chamber volume either by means of aplastic spacer of desired length or by programming the correct stopping position incombination with the origin displacement. The well type chamber calibration hasalways been performed the day after the source change and before any clinicalapplication. Together with the chamber constancy check and calculation inconvenient spreadsheet forms, the calibration takes about one hour. The constancycheck is done with a calibrated 137Cs (3.7 GBq) source in an appropriate sourceholder. Air kerma strength (AKS), or numerically equal reference air kerma rate(KR), of the source is determined from the following expression:
KR=NK-(Mu/t)-kT,pkrecomb-Nelec (1)
where iVK is the reference air kerma rate calibration factor of the well type chambersupplied by the accredited laboratory, Mu is the scale unit reading (charge collectedduring time t) and &T,P, &recomb and Ne\ec are corrections for the temperature andpressure, recombination losses and the electrometer calibration factor, respectively.The latter coefficient applies if the electrometer was calibrated separately.
The calibration point inside the chamber volume corresponds to the source atthe position of maximum response. At this point, the uncertainty in the referenceair kerma rate determination, due to positional uncertainty, is minimised. Thecalibration point measurements were performed at different positions of the sourcealong the axis of the chamber by programming the stopping positions with differentorigin definition. The chamber was also repeatedly positioned at various distancesfrom the wall and from the floor to determine relative increase in ionisation currentdue to scatter.
In free in air measurements, the AKS was determined for a number ofsources with 0.6 cm3 Fanner type chambers (30001, 30002 PTW-Freiburg) andUNIDOS electrometer. The catheter and straight metal applicator were attached toa special lightweight plastic holder (Figure 2). The holder has a calibrated ruler thatenables precise positioning of the chamber at the desired distance from the source.The KR in this measurement can be calculated at different source to chamberdistances from:
K R =NK-(Mu/t)-kair-kscal<kn-kT,p (d/drej)2 (2)
NK is the air kerma calibration factor of the ionisation chamber at the actualphoton energy, Ma is the measured charge collected during the time t, kair is thecorrection for attenuation of the primary photons by the air between the source andthe chamber, kscan is the correction for scattered radiation from the walls, floor,measurement set-up, air, etc. kn is the non-uniformity correction factor, accountingfor the non-uniform electron fluence within the air cavity, kTyP is the correction for
135
VI. simpozij HDZZ, Stubičke Toplice, 2005.
ambient temperature and pressure. Transit effects during source transfer areexcluded with the application of an interval measurement starting when the sourceis already exposed at the measuring position. The measurement distance d is thedistance between the centre of the source and the centre of the ionisation chamber;a ef is the reference distance of 1 m.
RESULTSFigure 1 shows the results of the well chamber calibration of 11 sources,
each received at approximately three monthly intervals. The relative deviation ofthe measured AKS from the manufacturer's certificate specification has alwaysbeen less than 3.4 %. After the introduction of more strict protocol (chamberposition and holder, longer thermal equilibration, own pressure measurement) thesedeviations were kept below 2%. The position of maximum ionisation current in thechamber is at 56 mm from the chamber's bottom. It is slightly higher compared tothe manufacturer's specification (48 mm). The lower row in Figure 1 indicates thenecessity to perform measurements at distances of more than 25 cm from the flooror nearest wall in order to have only a negligible increase of collected ionisationcharge (current). The well chamber charge measurements were highly reproducible(< 0.1%). The overall measurement uncertainty 2.67% (1SD) is conservativelyestimated from manufacturer's specification for the chamber and estimates forcorrection coefficients.
For determination of the AKS from the measured air kerma at the distance d,it is necessary to correct for the attenuation of the primary photons between thesource and the ionisation chamber. Factors kair at different distances between thesource and the ionisation chamber were interpolated from tables given in [1]. Fordistances smaller than 40 cm, this correction is less than 0.5%. The room scatterwas determined under the assumption that it is a constant contributor at allmeasurement distances, independent of the source to chamber distance. Equal timemeasurements were done at distances of 10, 15, 20, 25 and 30 cm. Regressionanalysis of measured primary and room scatter versus {do/df gave constant roomscatter and primary exposure at d0. The room scatter fraction was approximately0.58% at 20 cm source to chamber distance. We also applied Kondo and Randolph[4] nonuniformity kn corrections. Similar results can be obtained with Dove results[5] (Table 1). Large discrepancies between measured and specified AKS, seen onthe graph (Figure 2, right), indicate the problem of nonuniformity correction andpositional uncertainty at near source position, and weak signal as well as relativelylarger scatter influence at farther source positions.
136
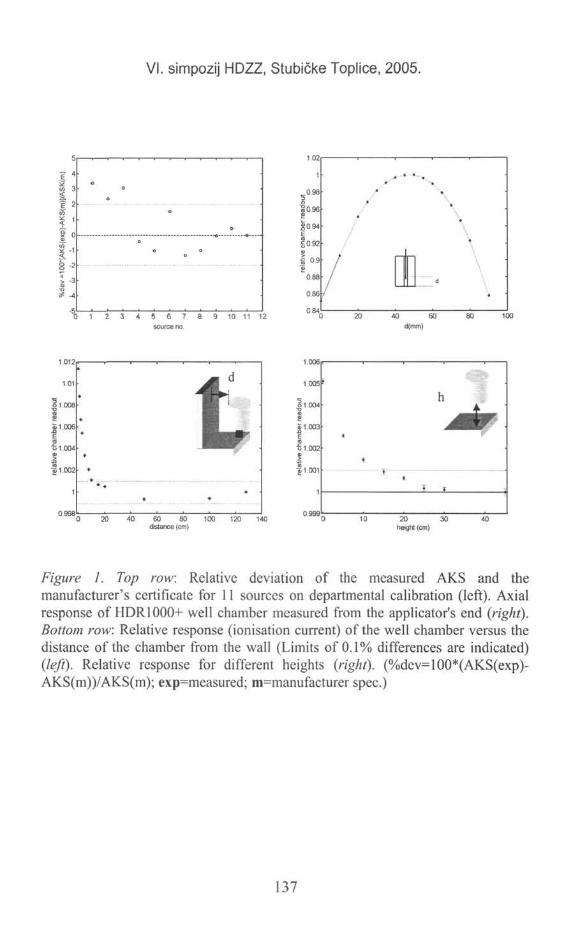
VI. simpozij HDZZ, Stubičke Toplice, 2005.
Figure 1. Top row: Relative deviation of the measured AKS and themanufacturer's certificate for 11 sources on departmental calibration (left). Axialresponse of HDR1000+ well chamber measured from the applicator's end (right).Bottom row: Relative response (ionisation current) of the well chamber versus thedistance of the chamber from the wall (Limits of 0.1% differences are indicated)(left). Relative response for different heights (right). (%dev=100*(AKS(exp)-AKS(m))/AKS(m); exp=measured; m=manufacturer spec.)
137
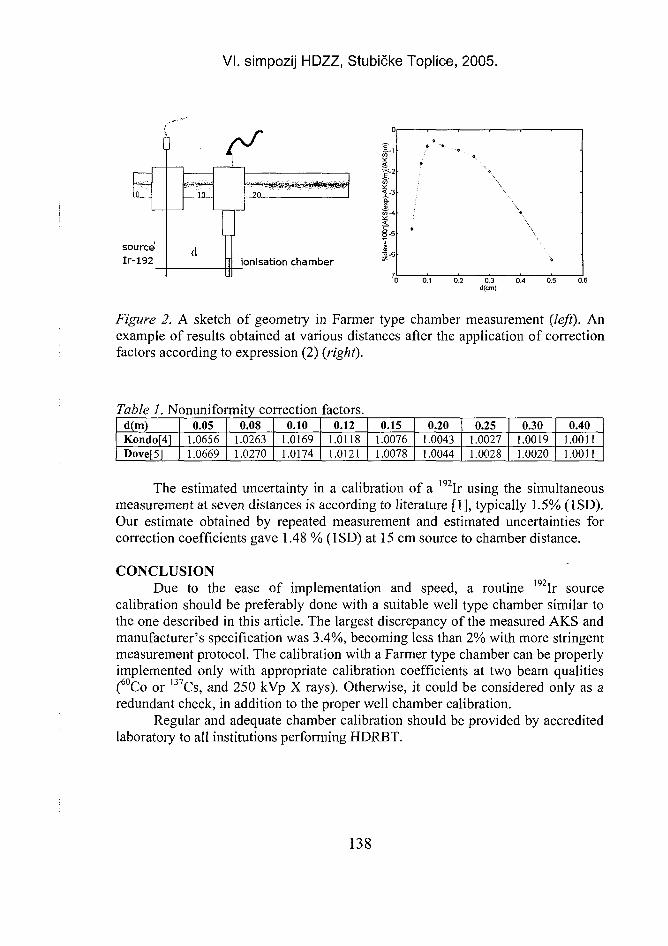
VI. simpozij HDZZ, Stubičke Toplice, 2005.
D
10
sourceIr-192
i. 20.
ionisation chamber
Figure 2. A sketch of geometry in Farmer type chamber measurement (left). Anexample of results obtained at various distances after the application of correctionfactors according to expression (2) (right).
Table 1. Nonuniformity correction factors.d(m)Kondo[41Dovef51
0.051.06561.0669
0.081.02631.0270
0.101.01691.0174
0.121.01181.0121
0.151.00761.0078
0.201.00431.0044
0.251.00271.0028
0.301.00191.0020
0.401.00111.0011
192TThe estimated uncertainty in a calibration of a Ir using the simultaneousmeasurement at seven distances is according to literature [1], typically 1.5% (1SD).Our estimate obtained by repeated measurement and estimated uncertainties forcorrection coefficients gave 1.48 % (1SD) at 15 cm source to chamber distance.
192,CONCLUSION
Due to the ease of implementation and speed, a routine i y zIr sourcecalibration should be preferably done with a suitable well type chamber similar tothe one described in this article. The largest discrepancy of the measured AKS andmanufacturer's specification was 3.4%, becoming less than 2% with more stringentmeasurement protocol. The calibration with a Farmer type chamber can be properlyimplemented only with appropriate calibration coefficients at two beam qualities(60Co or ulCs, and 250 kVp X rays). Otherwise, it could be considered only as aredundant check, in addition to the proper well chamber calibration.
Regular and adequate chamber calibration should be provided by accreditedlaboratory to all institutions performing HDRBT.
138
VI. simpozij HDZZ, Stubičke Toplice, 2005.
REFERENCES[1] International Atomic Energy Agency (IAEA). Calibration of photon and beta ray
sources used in brachytherapy, IAEA-TECDOC-1274, Vienna: IAEA; 2001.[2] Goetsch SJ, Attix FH, Pearson DW, Thomadsen BR. Calibration of l 9 2Ir high-dose-
rate afterloading systems, Med Phys 1991; 18:462^167.[3] Buermann L, Kramer HM, Schrader H, Selbach HJ. Activity determination of 192Ir
solid sources by ionisation chamber measurements using calculated corrections forself-absorption. Nucl Instr Meth Phys Res A 1994;339: 369-376.
[4] Kondo VS, Randolph ML. Effect of finite size of ionisation chambers onmeasurements of small photon sources. Rad Res 1960;13:37-60.
[5] Dove DB. Effect of dosemeter size on measurements close to a radioactive source,BrJRadiol 1959;62:202-204.
ABSTRACTHigh-dose-rate (HDR) brachytherapy has been used in our department for
cancer treatment for about three years. The HDR 192Ir source is usually calibratedusing a well-type ionisation chamber or a thimble chamber free in air. This paperpresents the calibration of 11 sources using Standard Imaging HDR1000 wellchamber. We investigated the effect of location of the chamber in the room andscatter environment on output ionisation current and determined the most sensitivemeasurement point in the chamber. The largest discrepancy between the measuredair kerma rate (AKR) and manufacturer's specification was 3.4%.These resultswere compared with calibration in the air done using the 0.6 ccm Farmer-typechamber, attached to a special lightweight holder. Instead of interpolativetechniques recommended by either the IAEA or authorised laboratories, we used acalibration coefficient for 60Co quality only. Beside the conventionalelectrometer/chamber corrections, the exposure gradient corrections due to thefinite dimensions of the chamber were employed. The influence of room scatterwas also estimated. Preliminary results of calibration in air indicated that wellchamber calibration and Farmer chamber calibration with 60Co calibration factorwere within 2%.
139
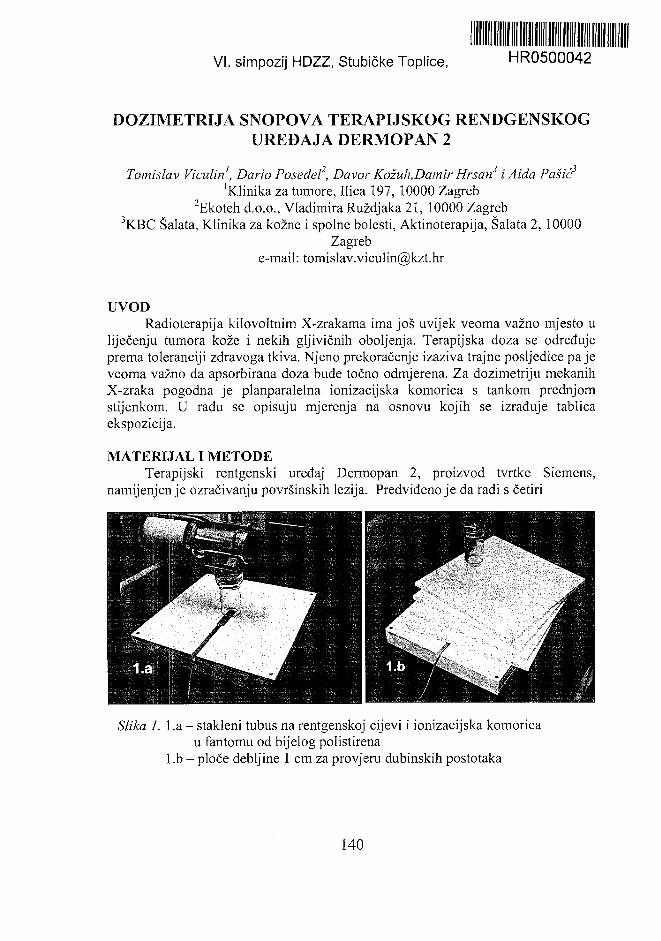
VI. simpozij HDZZ, Stubičke Toplice, HR0500042
DOZIMETRIJA SNOPOVA TERAPIJSKOG RENDGENSKOGUREĐAJA DERMOPAN 2
Tomislav Viculin , Dario Posedel, Đavo?' Kožuh,Damir Hrsan i Aida Pašić'Klinika za tumore, Ilica 197, 10000 Zagreb
2Ekoteh d.o.o., Vladimira Ruždjaka 21, 10000 Zagreb3KBC Salata, Klinika za kožne i spolne bolesti, Aktinoterapija, Salata 2, 10000
Zagrebe-mail: [email protected]
UVODRadioterapija kilovoltnim X-zrakama ima još uvijek veoma važno mjesto u
liječenju tumora kože i nekih gljivičnih oboljenja. Terapijska doza se određujeprema toleranciji zdravoga tkiva. Njeno prekoračenje izaziva trajne posljedice pa jeveoma važno da apsorbirana doza bude točno odmjerena. Za dozimetriju mekanihX-zraka pogodna je planparalelna ionizacijska komorica s tankom prednjomstijenkom. U radu se opisuju mjerenja na osnovu kojih se izrađuje tablicaekspozicija.
MATERIJAL I METODETerapijski rentgenski uređaj Dermopan 2, proizvod tvrtke Siemens,
namijenjen je ozračivanju površinskih lezija. Predviđeno je da radi s četiri
Slika 1. l .a- stakleni tubus na rentgenskoj cijevi i ionizacijska komoricau fantomu od bijelog polistirena
l.b - ploče debljine 1 cm za provjeru dubinskih postotaka
140
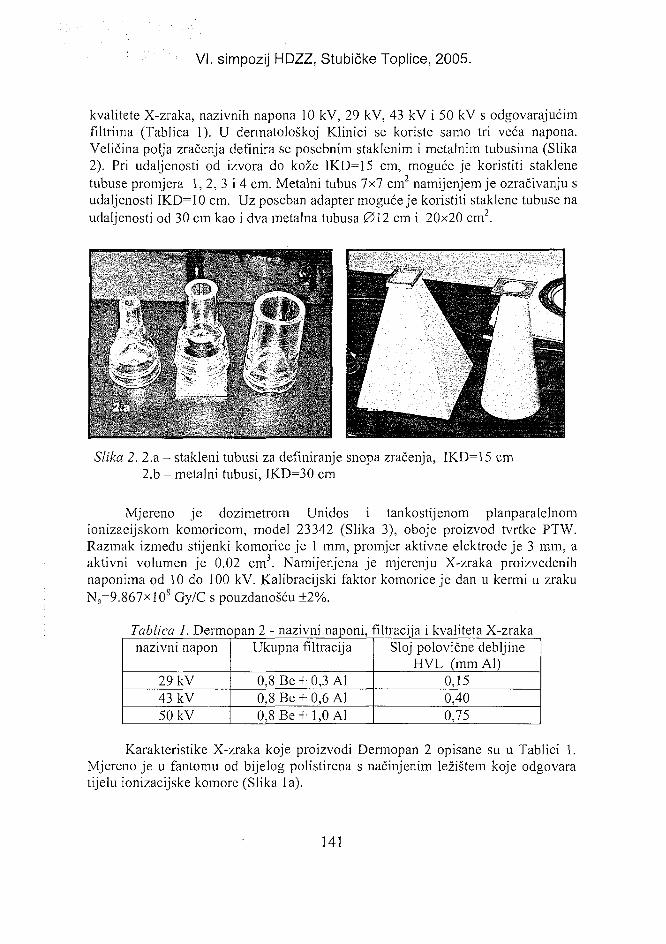
VI. simpozij HDZZ, Stubičke Toplice, 2005.
kvalitete X-zraka, nazivnih napona 10 kV, 29 kV, 43 kV i 50 kV s odgovarajućimfiltrima (Tablica 1). U dermatološkoj Klinici se koriste samo tri veća napona.Veličina polja zračenja definira se posebnim staklenim i metalnim tubusima (Slika2). Pri udaljenosti od izvora do kože IKD=15 cm, moguće je koristiti staklenetubuse promjera 1, 2, 3 i 4 cm. Metalni tubus 7x7 cm2 namijenjeni je ozračivanju sudaljenosti IKD=10 cm. Uz poseban adapter moguće je koristiti staklene tubuse naudaljenosti od 30 cm kao i dva metalna tubusa 012 cm i 20x20 cm2.
Slika 2. 2.a - stakleni tubusi za definiranje snopa zračenja, IKD=15 cm2.b - metalni tubusi, IKD=30 cm
Mjereno je dozimetrom Unidos i tankostijenom planparalelnomionizacijskom komoricom, model 23342 (Slika 3), oboje proizvod tvrtke PTW.Razmak između stijenki komorice je I mm, promjer aktivne elektrode je 3 mm, aaktivni volumen je 0.02 cm3. Namijenjena je mjerenju X-zraka proizvedenihnaponima od 10 do 100 kV. Kalibracijski faktor komorice je dan u kermi u zrakuNa=9.867xl08 Gy/C s pouzdanošću ±2%.
Tablica 1. Dermopan 2 - nazivni naponi,nazivni napon
29 kV43 kV50 kV
Ukupna filtracija
0,8 Be+ 0,3 Al0,8Be + 0,6Al0,8 Be + 1,0 Al
filtracija i kvaliteta X-zrakaSloj polovične debljine
HVL (mmAl)0,150,400,75
Karakteristike X-zraka koje proizvodi Dermopan 2 opisane su u Tablici 1.Mjereno je u fantomu od bijelog polistirena s načinjenim ležištem koje odgovaratijelu ionizacijske komore (Slika la).
141
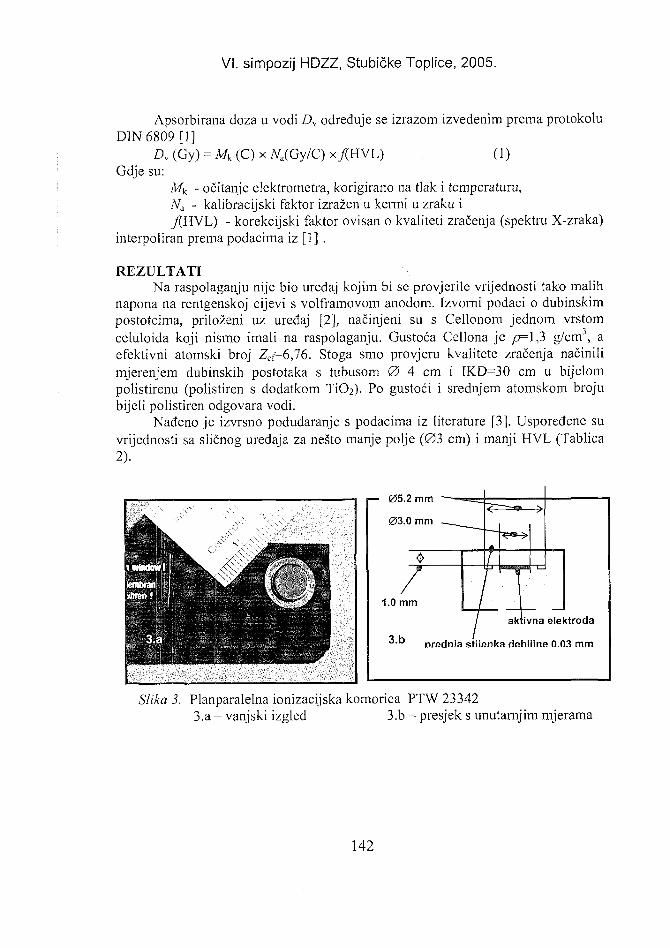
VI. simpozij HDZZ, Stubičke Toplice, 2005.
Apsorbirana doza u vodi Dv određuje se izrazom izvedenim prema protokoluD]N6809[l]
Dv(Gy) = Mk(C)xATa(Gy/C)x/HVL) (1)Gdje su:
Mk - očitanje elektrometra, korigirano na tlak i temperaturu,yVa - kalibracijski faktor izražen u kermi u zraku iJ[HVL) - korekcijski faktor ovisan o kvaliteti zračenja (spektru X-zraka)
interpoliran prema podacima iz [1] .
REZULTATINa raspolaganju nije bio uređaj kojim bi se provjerile vrijednosti tako malih
napona na rentgenskoj cijevi s volframovom anodom. Izvorni podaci o dubinskimpostotcima, priloženi uz uređaj [2], načinjeni su s Cellonom jednom vrstomceluloida koji nismo imali na raspolaganju. Gustoća Cellona je p=l,3 g/cm3, aefektivni atomski broj Zcf=6,76. Stoga smo provjera kvalitete zračenja načinilimjerenjem dubinskih postotaka s tubusom 0 4 cm i IKD=30 cm u bijelompolistirenu (polistiren s dodatkom TiO2). Po gustoći i srednjem atomskom brojubijeli polistiren odgovara vodi.
Nađeno je izvrsno podudaranje s podacima iz literature [3]. Uspoređene suvrijednosti sa sličnog uređaja za nešto manje polje (03 cm) i manji HVL (Tablica2).
— 05.2 mm — ~ . .
03.0 mm ^ _
1.0 mm /
V-" •—<st» s.
— - -
S-
V/ aktivna elektroda
^ Drednia stiienka debiiine 0.03 mm
Slika 3. Planparalelna ionizacijska komorica PTW 233423.a - vanjski izgled 3.b - presjek s unutarnjim mjerama
142
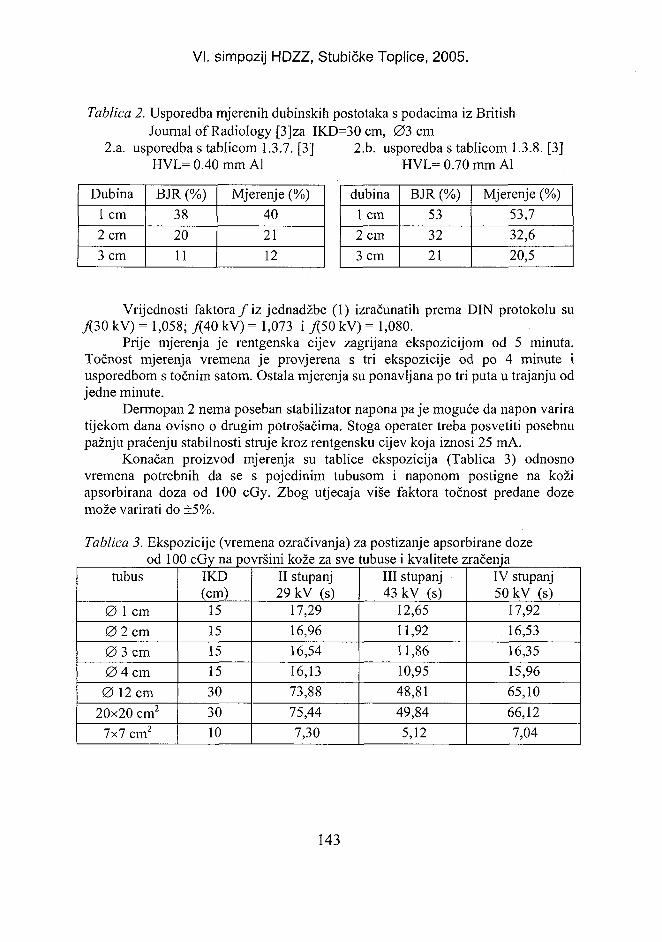
VI. simpozij HDZZ, Stubičke Toplice, 2005.
Tablica 2. Usporedba mjerenih dubinskih postotaka s podacima iz BritishJournal of Radiology [3]za IKD=30 cm, 0 3 cm
2.a. usporedba s tablicom 1.3.7. [3] 2.b. usporedba s tablicom 1.3.8. [3]HVL= 0.40 mm Al HVL= 0.70 mm Al
Dubina1 cm2 cm3 cm
BJR (%)382011
Mjerenje (%)402112
dubina1 cm2 cm3 cm
BJR (%)533221
Mjerenje (%)53,732,620,5
Vrijednosti faktora / iz jednadžbe (1) izračunatih prema DIN protokolu su/ 3 0 kV) = 1,058; / 4 0 kV) = 1,073 i / 5 0 kV) = 1,080.
Prije mjerenja je rentgenska cijev zagrijana ekspozicijom od 5 minuta.Točnost mjerenja vremena je provjerena s tri ekspozicije od po 4 minute iusporedbom s točnim satom. Ostala mjerenja su ponavljana po tri puta u trajanju odjedne minute.
Dermopan 2 nema poseban stabilizator napona pa je moguće da napon variratijekom dana ovisno o drugim potrošačima. Stoga operater treba posvetiti posebnupažnju praćenju stabilnosti struje kroz rentgensku cijev koja iznosi 25 mA.
Konačan proizvod mjerenja su tablice ekspozicija (Tablica 3) odnosnovremena potrebnih da se s pojedinim tubusom i naponom postigne na kožiapsorbirana doza od 100 cGy. Zbog utjecaja više faktora točnost predane dozemože varirati do ±5%.
Tablica 3. Ekspozicije (vremena ozračivanja) za postizanje apsorbirane dozeod 100 cGy na površini kože za sve tubuse i kvalitete zračenja
tubus
0 1 cm0 2 cm0 3 cm0 4 cm
0 12 cm20x20 cm2
7x7 cm2
IKD(cm)
15151515303010
II stupanj29 kV (s)
17,2916,9616,5416,1373,8875,447,30
III stupanj43 kV (s)
12,6511,9211,8610,9548,8149,845,12
IV stupanj50 kV (s)
17,9216,5316,3515,9665,1066,127,04
143
VI. simpozij HDZZ, Stubičke Toplice, 2005.
ZAKLJUČAKMjerenje snopova mekanih X-zraka, malog presjeka, zahtjeva uporabu
posebno konstruirane planparalelne ionizacijske komorice s veoma tankomprednjom stijenkom i malog aktivnog volumena. Kako se radi o malimudaljenostima od izvora do površine koja se zrači (10 do 30 cm), mjerenja suveoma ovisna o mehaničkoj točnosti namještanja. Također je otežavajuće što nekipoznati dozimetrijski protokoli (IAEA TR 398, AAPM TG51) ne sadrže potrebnekorekcijske faktore za zračenja nastala pri naponima manjim od 50 kV. Protokolkojim smo se poslužili [1], pokriva područje X-zračenja od 10 do 100 kV ali nemapodatke za identičnu kvalitetu zračenja. Mjerenjem dubinskih postotaka iusporedbom s podacima iz literature [3] nađena je njihova velika podudarnost.Načinjena mjerenja i tablice ekspozicija mogu se stoga smatrati vjerodostojnim uztočnost predane doze od ±5%.
LITERATURA[1] DIN 6809-4, Clinical dosimetry; Applications of X-rays with peak voltages between
10 and 100 kV in radiotherapy and soft tissue diagnostics. Berlin 1988.[2] Priručnik uz terapijski rentgenski uređaj Dermopan 2: Dosismessung bei der
Oberflachentherapie mit der Dermopan-Rohre am Dermopan 2. Oznaka izdavačaSl.0648.145.02.01, Siemens.
[3] BJR Supplement 25: Central Axis Depth Dose Data for Use in Radiotherapy: 1996;British Ionstitute of Radiology, London, 1996.
144
VI. simpozij HDZZ, Stubičke Toplice, 2005.
DOSIMETRY OF THE PHOTON BEAMS PRODUCED BY X-RAY MACHINE DERMOPAN 2
Tomislav Viculin'', Dario Posedef', Davor Kožuh2, Damir Hrsan3 and Aida Pašić3
'University Hospital for Tumors, Ilica 1972Ekoteh d.o.o., Vladimira Ruždjaka 21
3Clinical Center Salata, Clinic for Dermatological and Venereal Diseases, Salata 2,HR-10000 Zagreb, Croatia
e-mail: [email protected]
Superficial radiotherapy using soft X-rays is still very important in treatingskin carcinoma. This paper presents dosimetry for Siemens Dermopan 2 treatmentdevice. This device uses glass and metal applicators for beam definition, rangingfrom 01cm to 04cm for SSD=15cm, and 012cm or 20x20cm2 for SSD=30 cmtreatment modes. Available values for X-ray tube accelerating potential are 10, 29,43 or 50 kV. To perform dosimetry with these energies, a thin window plane-parallel ionisation chamber was used. Area of the chamber must be smaller than thebeam cross section. Measurements were performed using a PTW 23342 chamberwith 0.02 cm3 active volume, connected to Unidos dosimeter. Measurement wasperformed in white polystyrene phantom. Absorbed dose to water Dw wascalculated as specified by the DIN 6809 protocol: Dw (Gy) = Mk (C) x Na(Gy/C) xf(HVL), where Mk is the reading of the electrometer corrected on pressure andtemperature, Na is calibration factor in air kerma and f(HVL) is the correctingfactor, dependent of the beam quality. The values of this factor are f(30kV)=1.058,f(40kV)=1.073 and f(50kV)=1.080. Original depth dose curves were measured inCellon, with density p=1.3 g/cm3 and Zeff=6.76. Since this material was notavailable at the time of measurement, measurements were performed in whitepolystyrene, a water equivalent material. Results were in accordance with thosepublished in [3]. The final goal of these measurement was a table (Table 3.) withtimes of expositions necessary to get 100 cGy absorbed dose on skin surface withany combination of applicators and voltages. The accuracy of the absorbed dosewas ±5%.
145
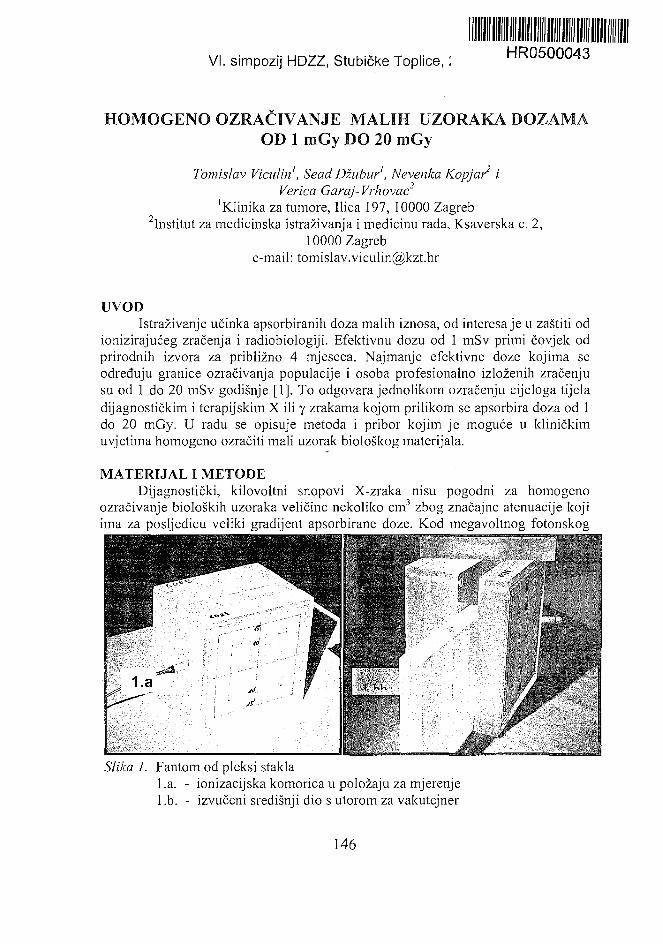
VI. simpozij HDZZ, Stubičke Toplice,: HR0500043
HOMOGENO OZRAČIVANJE MALIH UZORAKA DOZAMAOD 1 mGy DO 20 mGy
Tomislav Viculin', Sead Džubur', Nevenka Kopjai~2 iVerica Garaj- Vrhovac'
'Klinika za tumore, Ilica 197, 10000 Zagreb2Institut za medicinska istraživanja i medicinu rada, Ksaverska c. 2,
10000 Zagrebe-mail: [email protected]
UVODIstraživanje učinka apsorbiranih doza malih iznosa, od interesa je u zaštiti od
ionizirajućeg zračenja i radiobiologiji. Efektivnu dozu od 1 mSv primi čovjek odprirodnih izvora za približno 4 mjeseca. Najmanje efektivne doze kojima seodređuju granice ozračivanja populacije i osoba profesionalno izloženih zračenjusu od 1 do 20 mSv godišnje [1]. To odgovara jednolikom ozračenju cijeloga tijeladijagnostičkim i terapijskim X ili y zrakama kojom prilikom se apsorbira doza od 1do 20 mGy. U radu se opisuje metoda i pribor kojim je moguće u kliničkimuvjetima homogeno ozračiti mali uzorak biološkog materijala.
MATERIJAL I METODEDijagnostički, kilovoltni snopovi X-zraka nisu pogodni za homogeno
ozračivanje bioloških uzoraka veličine nekoliko cm3 zbog značajne atenuacije kojiima za posljedicu veliki gradijent apsorbirane doze. Kod megavoltnog fotonskog
Slika 1. Fantom od pleksi staklal.a. - ionizacijska komorica u položaju za mjerenjel.b. - izvučeni središnji dio s utorom za vakutejner
146
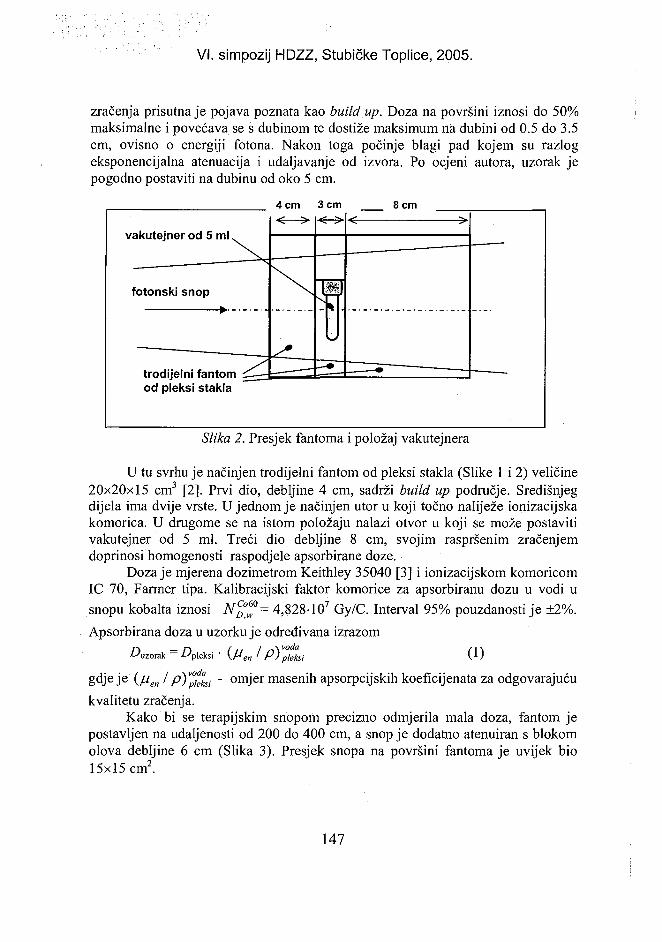
VI. simpozij HDZZ, Stubičke Toplice, 2005.
zračenja prisutna je pojava poznata kao build up. Doza na površini iznosi do 50%maksimalne i povećava se s dubinom te dostiže maksimum na dubini od 0.5 do 3.5cm, ovisno o energiji fotona. Nakon toga počinje blagi pad kojem su razlogeksponencijalna atenuacija i udaljavanje od izvora. Po ocjeni autora, uzorak jepogodno postaviti na dubinu od oko 5 cm.
4 cm 3 cm 8 cm
trodijelni fantomod pleksi stakla
Slika 2. Presjek fantoma i položaj vakutejnera
U tu svrhu je načinjen trodijelni fantom od pleksi stakla (Slike 1 i 2) veličine20x20x15 cm3 [2]. Prvi dio, debljine 4 cm, sadrži build up područje. Središnjegdijela ima dvije vrste. U jednom je načinjen utor u koji točno naliježe ionizacijskakomorica. U drugome se na istom položaju nalazi otvor u koji se može postavitivakutejner od 5 ml. Treći dio debljine 8 cm, svojim raspršenim zračenjemdoprinosi homogenosti raspodjele apsorbirane doze.
Doza je mjerena dozimetrom Keithley 35040 [3] i ionizacijskom komoricomIC 70, Farmer tipa. Kalibracijski faktor komorice za apsorbiranu dozu u vodi usnopu kobalta iznosi NC
D°™= 4,828-IO7 Gy/C. Interval 95% pouzdanosti je ±2%.Apsorbirana doza u uzorku je određivana izrazom
Aizorak = -Opleksi • {f^en ^ PYpletsi 0)
gdje je (Men / PYpiJ<si ' o r n J e r masenih apsorpcijskih koeficijenata za odgovarajućukvalitetu zračenja.
Kako bi se terapijskim snopom precizno odmjerila mala doza, fantom jepostavljen na udaljenosti od 200 do 400 cm, a snop je dodatno atenuiran s blokomolova debljine 6 cm (Slika 3). Presjek snopa na površini fantoma je uvijek bio15x15 cm2.
147
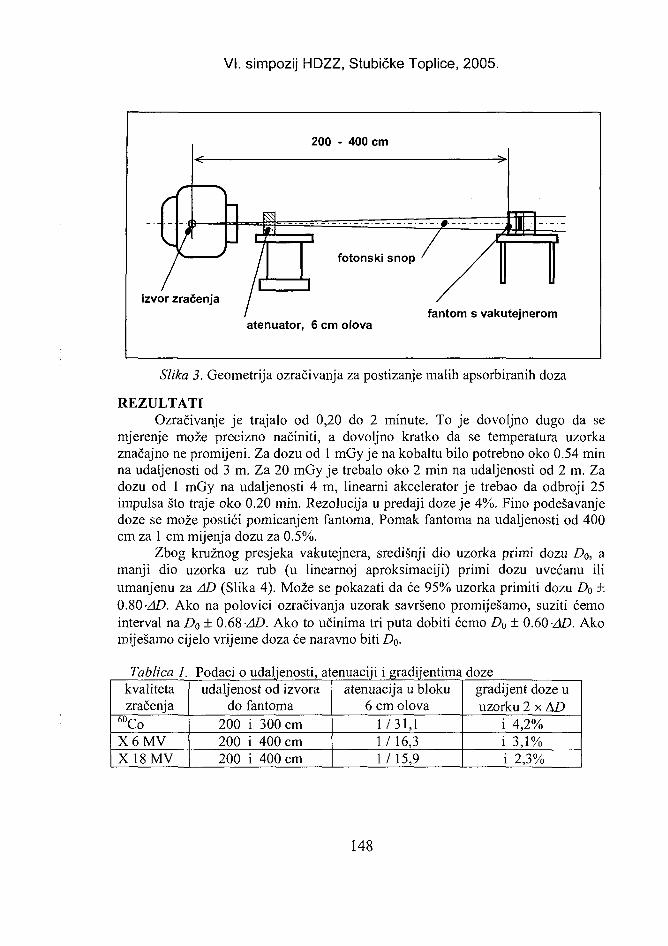
VI. simpozij HDZZ, Stubičke Toplice, 2005.
200 - 400 cm
fotonski snop
izvor zračenjaI 1
atenuator, 6 cm olovafantom s vakutejnerom
Slika 3. Geometrija ozračivanja za postizanje malih apsorbiranih doza
REZULTATIOzračivanje je trajalo od 0,20 do 2 minute. To je dovoljno dugo da se
mjerenje može precizno načiniti, a dovoljno kratko da se temperatura uzorkaznačajno ne promijeni. Za dozu od 1 mGy je na kobaltu bilo potrebno oko 0.54 minna udaljenosti od 3 m. Za 20 mGy je trebalo oko 2 min na udaljenosti od 2 m. Zadozu od 1 mGy na udaljenosti 4 m, linearni akcelerator je trebao da odbroji 25impulsa što traje oko 0.20 min. Rezolucija u predaji doze je 4%. Fino podešavanjedoze se može postići pomicanjem fantoma. Pomak fantoma na udaljenosti od 400cm za 1 cm mijenja dozu za 0.5%.
Zbog kružnog presjeka vakutejnera, središnji dio uzorka primi dozu Do, amanji dio uzorka uz rub (u linearnoj aproksimaciji) primi dozu uvećanu iliumanjenu za AD (Slika 4). Može se pokazati da će 95% uzorka primiti dozu Do ±0.80 -AD. Ako na polovici ozračivanja uzorak savršeno promiješamo, suziti ćemointerval na £>0 ± 0.68 -AD. Ako to učinima tri puta dobiti ćemo Do ± 0.60 AD. Akomiješamo cijelo vrijeme doza će naravno biti Do.
Tablica I. Podaci o udaljenosti, atenuaciji i gradijentima dozekvalitetazračenja
6 0CoX 6 M VX 18 MV
udaljenost od izvorado fantoma
200 i 300 cm200 i 400 cm200 i 400 cm
atenuacija u bloku6 cm olova
1/31,11 / 16,31/15,9
gradijent doze uuzorku 2 x AD
i 4,2%i 3,1%i 2,3%
148
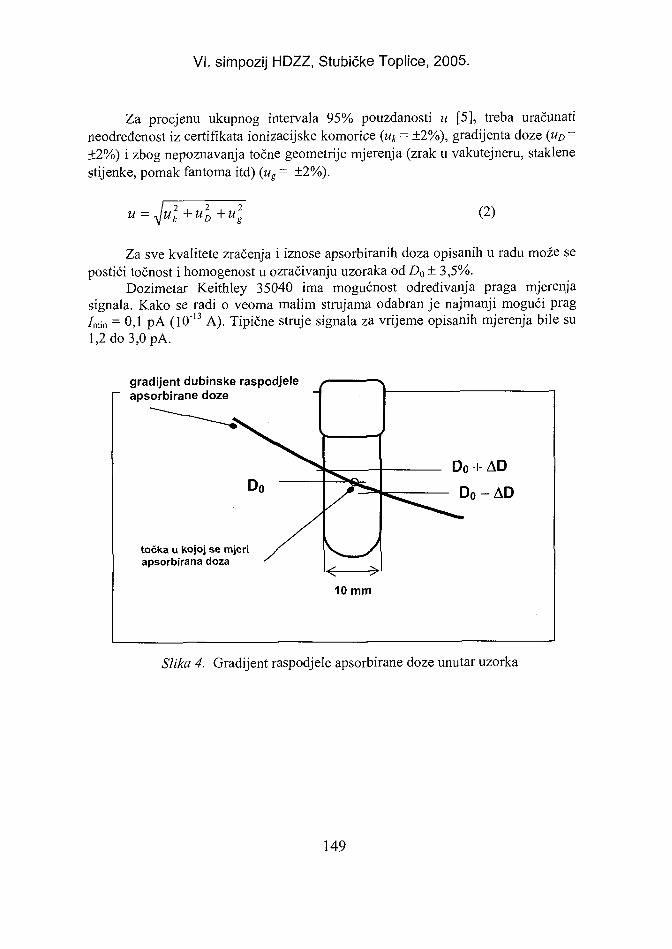
VI. simpozij HDZZ, Stubičke Toplice, 2005.
Za procjenu ukupnog intervala 95% pouzdanosti u [5], treba uračunatineodređenost iz certifikata ionizacijske komorice (uk = ±2%), gradijenta doze (uD =+2%) i zbog nepoznavanja točne geometrije mjerenja (zrak u vakutejneru, staklenestijenke, pomak fantoma itd) (ug = ±2%).
u - Jul + u 2D + U
2g (2)
Za sve kvalitete zračenja i iznose apsorbiranih doza opisanih u radu može sepostići točnost i homogenost u ozračivanju uzoraka od Z)o ± 3,5%.
Dozimetar Keithley 35040 ima mogućnost određivanja praga mjerenjasignala. Kako se radi o veoma malim strujama odabran je najmanji mogući prag/min = 0,1 pA (10"13 A). Tipične struje signala za vrijeme opisanih mjerenja bile su1,2 do 3,0 pA.
gradijent dubinske raspodjeleapsorbirane doze
točka u kojoj se mjeriapsorbirana doza
10 mm
Slika 4. Gradijent raspodjele apsorbirane doze unutar uzorka
149
VI. simpozij HDZZ, Stubičke Toplice, 2005.
ZAKLJUČAKTerapijskim snopovima X-zraka energija 6 i 18 MV i y- zrakama 60Co mogu
se opisanom metodom homogeno ozračiti uzorci biološkog materijala uvakutejneru od 5 ml. Točnost predane apsorbirane doze je D = Do ±3,5%, a vrijemeozračivanja kraće od 2 minuta.
LITERATURA[1] International Atomic Energy Agency (IAEA). International Basic Safety Standards
for Protection against Ionising Radiation and for the Safety of Radiation Sources.Safety Series No. 115. Vienna: IAEA; 1996.
[2] Viculin T, Garaj-Vrhovac V, Kopjar N, Gamulin M. Ozračivanje krviradioterapijskim fotonskim snopovima. U: Zbornik sažetaka Drugog kongresaHrvatskog društva za radioterapiju i onkologiju HLZ-a; 27-30. studenoga 2003.Opatija
[3] Model 35040 Therapy Dosimeter Instruction Manual, Manual No 378701 M,Keithley Instruments, Inc. Radiation Measurement Division, Cleveland, Ohio, 1994.
[4] Khan M. Faiz: The Physics of Radiation Therapy. 2nd edition. Baltimore,Williams&Wilkins 1992.
[5] International Atomic Energy Agency (IAEA). Absorbed Dose Determination inExternal Beam Radiotherapy, Technical Report Series No. 398. Vienna: IAEA;2000.
150
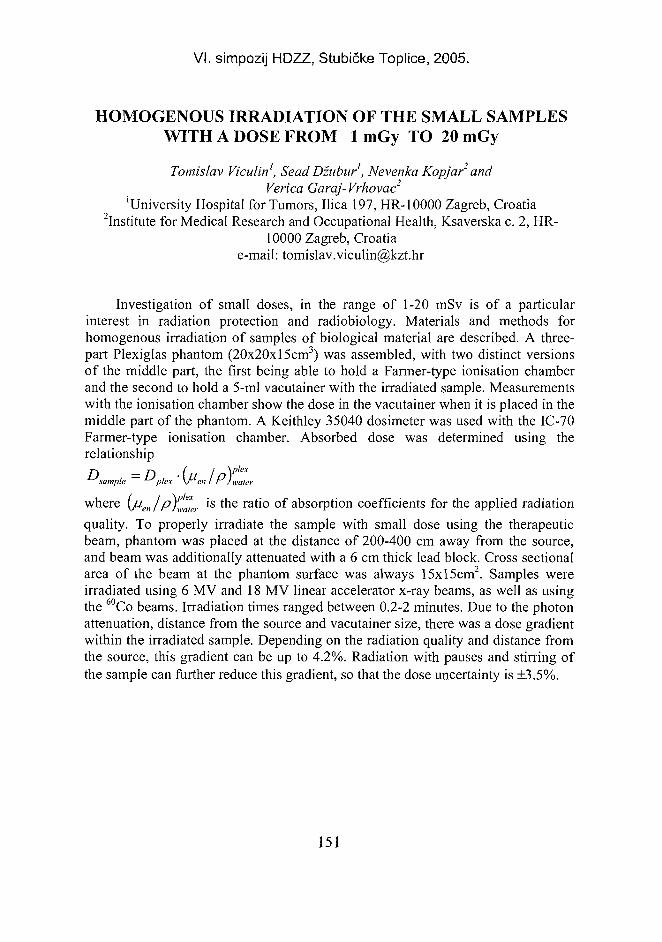
VI. simpozij HDZZ, Stubičke Toplice, 2005.
HOMOGENOUS IRRADIATION OF THE SMALL SAMPLESWITH A DOSE FROM 1 mGy TO 20 mGy
Tomislav Viculin1, Sead Džubiir1', Nevenka Kopjar2 andVerica Garaj- Vrhovac2
'University Hospital for Tumors, Ilica 197, HR-10000 Zagreb, Croatiainstitute for Medical Research and Occupational Health, Ksaverska c. 2, HR-
10000 Zagreb, Croatiae-mail: [email protected]
Investigation of small doses, in the range of 1-20 mSv is of a particularinterest in radiation protection and radiobiology. Materials and methods forhomogenous irradiation of samples of biological material are described. A three-part Plexiglas phantom (20x20x15cm3) was assembled, with two distinct versionsof the middle part, the first being able to hold a Farmer-type ionisation chamberand the second to hold a 5-mI vacutainer with the irradiated sample. Measurementswith the ionisation chamber show the dose in the vacutainer when it is placed in themiddle part of the phantom. A Keithley 35040 dosimeter was used with the IC-70Farmer-type ionisation chamber. Absorbed dose was determined using therelationship
T-, p. ( i \plexsample plex \Men I r /water
where \juen I PfJaier 1S * n e r a t ' ° of absorption coefficients for the applied radiationquality. To properly irradiate the sample with small dose using the therapeuticbeam, phantom was placed at the distance of 200-400 cm away from the source,and beam was additionally attenuated with a 6 cm thick lead block. Cross sectionalarea of the beam at the phantom surface was always 15x15cm2. Samples wereirradiated using 6 MV and 18 MV linear accelerator x-ray beams, as well as usingthe 60Co beams. Irradiation times ranged between 0.2-2 minutes. Due to the photonattenuation, distance from the source and vacutainer size, there was a dose gradientwithin the irradiated sample. Depending on the radiation quality and distance fromthe source, this gradient can be up to 4.2%. Radiation with pauses and stirring ofthe sample can further reduce this gradient, so that the dose uncertainty is ±3.5%.
151
... . ..,,___ _, .... _ .. HR0500044VI. simpozij HDZZ, Stubicke Toplic
KEMIJSKI DOZIMETRIJSKI SUSTAV ZA RADIJACIJSKENESREĆE
Saveta Miljanić1 i Boris Ilijaš2
'institut "Ruđer Bošković", Bijenička c. 54, 10000 Zagreb2Zapovjedništvo Hrvatske kopnene vojske, Domobranska 12,
47000 Karlovace-mail: [email protected]
UVODDozimetrijski sustav za radijacijske nesreće Instituta "Ruder Bošković"
(IRB) sastoji se od kemijskog dozimetra koji mjeri ukupnu dozu gama zračenja ineutrona i termoluminescentnog (TL) dozimetra za mjerenje doze gama zračenja.Dozimetrijska otopina sastoji se od smjese klorbenzena (10 vol.%) i etanola (10vol.%) u trimetilpentanu (kratica CET). U otopinu je dodan i indikatortimolsulfonftalein prethodno otopljen u etanolu. Ozračivanjem, radiolitičkistvorena HC1 protonira pH indikator, te se boja otopine CET mijenja od žute docrvene. Budući da crveni oblik indikatora ima visoku molarnu apsorptivnost na 552nm, mogu se mjeriti doze od 0,2 do 15 Gy koje odgovaraju područjimaradioterapijske i akcidentalne primjene. Važna dozimetrijska svojstva otopine CETsu linearni odziv s dozom, neovisnost o brzini doze i energiji zračenja, te približnojednak odziv na gama zračenje i neutrone za istu dozu u tkivu [I].
Dozimetar se sastoji od staklene ampule napunjene otopinom CET iumetnute u plastičnu penkalu. Eksperimentalno je pokazano daje odziv dozimetraneovisan o energijama fotona od 50 keV do 6 MeV [1,2], te energijama neutronado 5 MeV [1]. Iznad 5 MeV odziv na neutrone se smanjuje radi nepostojanjaravnoteže nabijenih čestica u otopini, odnosno gubitka odbijenih protona u stijenkeampule. Iznad 14 MeV visoki LET teških nabijenih čestica smanjuje radijacijsko-kemijski prinos HC1 [3]. Relativni odziv u ovisnosti o energiji neutrona prikazanjena Slici 1 (prema rezultatima iz referenci [1,4]).
Suradnici IRB-a sudjelovali su na "International Intercomparison ofCriticality Accident Dosimetry Systems at the SILENE Reactor, Valduc, June2002" s dozimetrijskim sustavom CET. Doze su mjerene kolorimetrijskim čitačem[1] (samo za brzu procjenu doze) i po prvi put s novo razvijenim optoelektronskimčitačem [5]. Za mjerenje doze gama zračenja korišteni su termoluminescentnidetektori TLD-700 (7LiF, Harshaw). U ovom radu prikazani su rezultati usporedbedoza IRB sustava s referentnim vrijednostima.
152
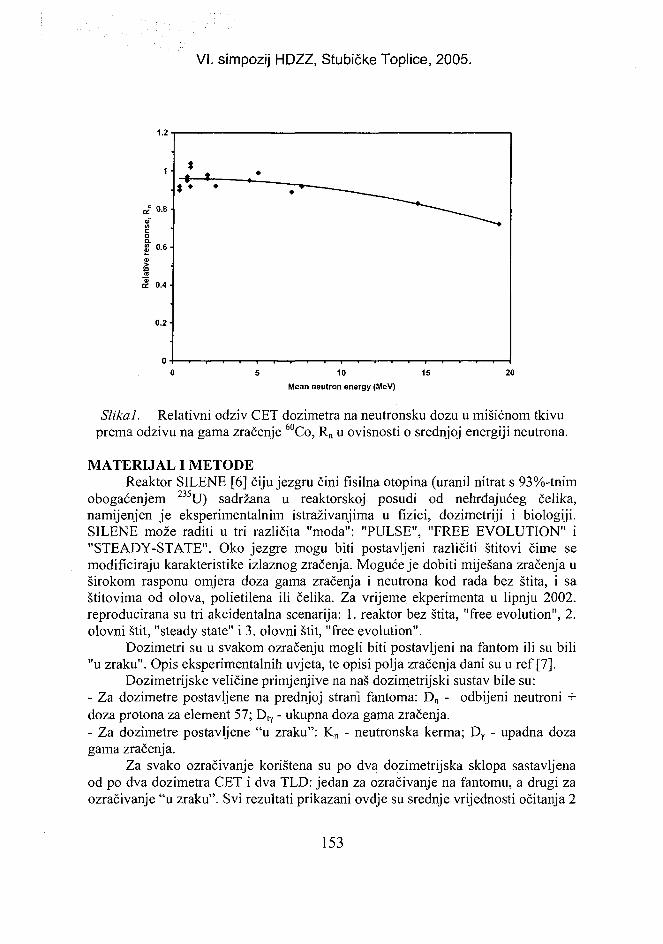
VI. simpozij HDZZ, Stubičke Toplice, 2005.
Mean neutron energy (MeV)
Slikal. Relativni odziv CET dozimetra na neutronsku dozu u mišićnom tkivuprema odzivu na gama zračenje 60Co, Rn u ovisnosti o srednjoj energiji neutrona.
MATERIJAL I METODEReaktor SILENE [6] čiju jezgru čini fisilna otopina (uranil nitrat s 93%-tnim
obogaćenjem 2 3 5U) sadržana u reaktorskoj posudi od nehrđajućeg čelika,namijenjen je eksperimentalnim istraživanjima u fizici, dozimetriji i biologiji.SILENE može raditi u tri različita "moda": "PULSE", "FREE EVOLUTION" i"STEADY-STATE". Oko jezgre mogu biti postavljeni različiti štitovi čime semodificiraju karakteristike izlaznog zračenja. Moguće je dobiti miješana zračenja uširokom rasponu omjera doza gama zračenja i neutrona kod rada bez štita, i saštitovima od olova, polietilena ili čelika. Za vrijeme ekperimenta u lipnju 2002.reproducirana su tri akcidentalna scenarija: 1. reaktor bez štita, "free evolution", 2.olovni štit, "steady state" i 3. olovni štit, "free evolution".
Dozimetri su u svakom ozračenju mogli biti postavljeni na fantom ili su bili"u zraku". Opis eksperimentalnih uvjeta, te opisi polja zračenja dani su u ref [7].
Dozimetrijske veličine primjenjive na naš dozimetrijski sustav bile su:- Za dozimetre postavljene na prednjoj strani fantoma: Dn - odbijeni neutroni +doza protona za element 57; D,Y - ukupna doza gama zračenja.- Za dozimetre postavljene "u zraku": Kn - neutronska kerma; Dr - upadna dozagama zračenja.
Za svako ozračivanje korištena su po dva dozimetrijska sklopa sastavljenaod po dva dozimetra CET i dva TLD: jedan za ozračivanje na fantomu, a drugi zaozračivanje "u zraku". Svi rezultati prikazani ovdje su srednje vrijednosti očitanja 2
153
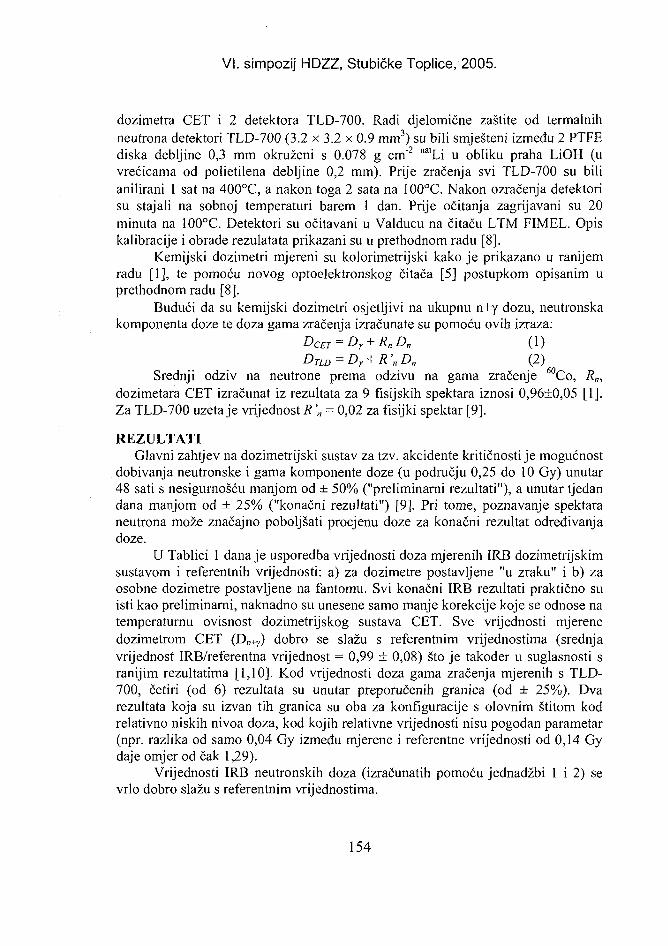
VI. simpozij HDZZ, Stubičke Toplice, 2005.
dozimetra CET i 2 detektora TLD-700. Radi djelomične zaštite od termalnihneutrona detektori TLD-700 (3.2 x 3.2 x 0.9 mm3) su bili smješteni između 2 PTFEdiska debljine 0,3 mm okruženi s 0.078 g cm"2 natLi u obliku praha LiOH (uvrećicama od polietilena debljine 0,2 mm). Prije zračenja svi TLD-700 su bilianilirani 1 sat na 400°C, a nakon toga 2 sata na I00°C. Nakon ozračenja detektorisu stajali na sobnoj temperaturi barem 1 dan. Prije očitanja zagrijavani su 20minuta na 100°C. Detektori su očitavani u Valducu na čitaču LTM FIMEL. Opiskalibracije i obrade rezulatata prikazani su u prethodnom radu [8].
Kemijski dozimetri mjereni su kolorimetrijski kako je prikazano u ranijemradu [1], te pomoću novog optoelektronskog čitača [5] postupkom opisanim uprethodnom radu [8].
Budući da su kemijski dozimetri osjetljivi na ukupnu n+y dozu, neutronskakomponenta doze te doza gama zračenja izračunate su pomoću ovih izraza:
DCET = Dr + R„Da (1)D1tD = Dr + R'„D„ (2)
Srednji odziv na neutrone prema odzivu na gama zračenje 60Co, R,„dozimetara CET izračunat iz rezultata za 9 fisijskih spektara iznosi 0,96±0,05 [1].Za TLD-700 uzeta je vrijednost R '„ = 0,02 za fisijki spektar [9].
REZULTATIGlavni zahtjev na dozimetrijski sustav za tzv. akcidente kritičnosti je mogućnost
dobivanja neutronske i gama komponente doze (u području 0,25 do 10 Gy) unutar48 sati s nesigurnošću manjom od ± 50% ("preliminarni rezultati"), a unutar tjedandana manjom od ± 25% ("konačni rezultati") [9], Pri tome, poznavanje spektaraneutrona može značajno poboljšati procjenu doze za konačni rezultat određivanjadoze.
U Tablici 1 dana je usporedba vrijednosti doza mjerenih IRB dozimetrijskimsustavom i referentnih vrijednosti: a) za dozimetre postavljene "u zraku" i b) zaosobne dozimetre postavljene na fantomu. Svi konačni IRB rezultati praktično suisti kao preliminarni, naknadno su unesene samo manje korekcije koje se odnose natemperaturnu ovisnost dozimetrijskog sustava CET. Sve vrijednosti mjerenedozimetrom CET (Dn+7) dobro se slažu s referentnim vrijednostima (srednjavrijednost IRB/referentna vrijednost = 0,99 ± 0,08) što je također u suglasnosti sranijim rezultatima [1,10]. Kod vrijednosti doza gama zračenja mjerenih s TLD-700, četiri (od 6) rezultata su unutar preporučenih granica (od ± 25%). Dvarezultata koja su izvan tih granica su oba za konfiguracije s olovnim štitom kodrelativno niskih nivoa doza, kod kojih relativne vrijednosti nisu pogodan parametar(npr. razlika od samo 0,04 Gy između mjerene i referentne vrijednosti od 0,14 Gydaje omjer od čak 1,29).
Vrijednosti IRB neutronskih doza (izračunatih pomoću jednadžbi 1 i 2) sevrlo dobro slažu s referentnim vrijednostima.
154
VI. simpozij HDZZ, Stubičke Toplice, 2005.
Tablica 1. Usporedba srednjih doza dobivenih IRB dozimetnjskim sustavom sreferentnim vrijednostima
a) Ozračenja "u zraku" (dozimetri u prostoru)
1. Bez štita
2. Olovništit
3. Olovništit
Neutronskakerma, Kn
(Gy)Referentnavrijednost
1,65
0,79
1,68
Omjer Kn
(IRB/Referentna)
0,96
1,06
1,03
Upadna ydoza, Dy
(Gy)Referentnavrijednost
2,49
0,14
3,30
Srednja vrijednost ± SD 1,02±0,05
Omjer D r
(IRB/Referentna)
0,84
1,29
1,23
l,12±0,24
Omjer Dn+T
(IRB/Referentna)
0,89
1,10
1,06
l,01±0,ll
b) Ozračenja na fantomu (osobni dozimetri)
1. Bez štita
2. Olovništit
3. Olovništit
Neutronskakerma, Kn
(Gy)Referentnavrijednost
1,83
0,85
1,80
Omjer Kn
(IRB/Referentna)
1,07
1,12
1,05
Upadna ydoza, Dy
(Gy)Referentnavrijednost
3,03
0,41
0,87
Srednja vrijednost ± SD 1,08±0,03
Omjer Dy
(IRB/Referentna)
0,86
0,76
0,74
0,78±0,07
Omjer Dn+)f
(IRB/Referentna)
0,94
1,00
0,95
0,96±0,03
Napomena: Nesigurnost svih referentnih vrijednosti procijenjena je na ± 10% [7].
155
VI. simpozij HDZZ, Stubičke Toplice, 2005.
ZAKLJUČAKRezultati dobiveni s kemijskim dozimetrijskim sustavom CET u ovoj
interkomparaciji potvrđuju da je ovaj sustav vrlo pogodan za mjerenje doza kodradijacijskih nesreća. Glavna prednost je mogućnost dobivanja rezultata vrlo brzonakon nesreće bez ikakvih podataka o spektru zračenja. Sustav je kalibriran tako dase mjeri ukupna (netronska + gama) doza približno ekvivalentna tkivu, a mjernatehnika je vrlo jednostavna. Zasebno mjerena komponenta gama doze sustava IRBse dobro slaže s rezultatima ostalih mjernih sustava dobivenih u ovojInterkomparaciji [7].
LITERATURA[1] Ražem D, Miljanić S, Dvornik I. Chemical dosimetry. In: Ionizing Radiation:
Protection and Dosimetry, ed. G. Paid. Boca Raton, FL: CRC Press, 1988. ISBN 0-8493-6713-1.
[2] Miljanić S, Ražem D. The response of the chlorobenzene-ethanol-trimethylpentanedosimeter to medium energy X-rays. J Radioanal Nucl Chem 1997; 222:215:217.
[3] Miljanić S. Doktorska disertacija, Sveučilište u Zagrebu, Zagreb 1996.[4] Miljanić S, Otte V A, Dvornik I, Miljanić Đ. Intercomparison of the chlorobenzene-
ethanol-trimethylpentane dosemeter and ionisation chamber in the M. D. Andersonhospital CP-42 cyclotron neutron field. Radiat Prot Dosim 1988;23:455-458.
[5] Ilijaš B, Ražem D, Miljanić S, Cerovac Z, and Orehovec Z. Optoelectronic readerfor CET dosimeter, a radiation accident chemical dosimetry system. Radiat PhysChem 2003;68:1005-1010.
[6] Tournier B, Barbry F, Verrey B. SILENE, a tool for neutron dosimetry. Radiat ProtDosim 1997;70:345-348.
[7] Medioni R. et al. (11 autora) Criticality accident dosimetry systems. An internationalintercomparison at the SILENE reactor. Radiat Prot Dosim 2004; 110:429-436.
[8] Miljanić S, Ilijaš B. Chemical dosimetry system for criticality accidents. Radiat ProtDosim 2004; 110: 477-481
[9] International Atomic Energy Agency (IAEA). Dosimetry for Criticality Accidents. AManual. IAEA Technical Report Series No 211. Vienna: IAEA; 1982.
[10] Delafield H J, Medioni R. An International Intercomparison of Criticality AccidentDosimetry Systems at the SILENE Reactor, Valduc, Dijon, France, 7-18 June 1993.Part 3: Description of the Experiment and Participants' Results. AEA TechnologyIPSN Report HPS/TR/H/3(95), 1995.
156
VI. simpozij HDZZ, Stubičke Toplice, 2005.
CHEMICAL DOSIMETRY SYSTEM FORCRITICALITY ACCIDENTS
Saveta Miljanić1 and Boris Ilijaš2
'Ruder Bošković Institute, Bijenička c. 54, HR-10000 Zagreb, Croatia2Headquarters of Croatian Land Forces, Domobranska 12,
HR-47000 Karlovac, Croatiae-mail: [email protected]
A criticality accident dosimetry system developed at the Ruđer BoškovićInstitute (RBI) consists of chemical dosimetry for the measurement of total(neutron + gamma) dose and of thermoluminescent (TL) dosirhetry for determiningthe gamma-ray component. The use of solution chlorobenzene-ethanol-trimethylpentane (CET) in chemical dosimeters is based on the radiolytic formationof hydrochloric acid which protonates a pH indicator thymolsulphonphthalein.High molar absorption of its red form at 552 nm is responsible for high sensitivityof the system; it can measure doses in the range 0.2-15 Gy. The dosimeter is as aglass ampoule filled with CET solution and inserted into a pen-shaped plasticholder. For dose determinations, a newly constructed optoelectronic reader hasbeen used. The RBI team participated with its CET dosimeter in the InternationalIntercomparison of Criticality Accident Dosimetry Systems at the SILENEReactor, Valduc in June 2002. For gamma-ray dose determination, TLD-700thermoluminescent detectors were used. The results obtained with CET dosimetershowed a very good agreement with reference values.
157
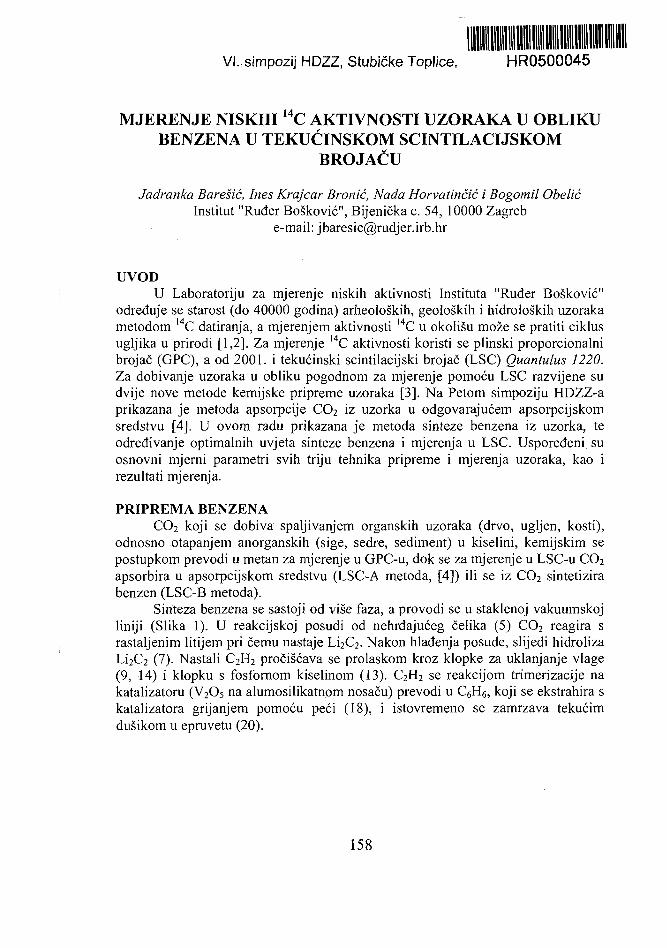
VI. simpozij HDZZ, Stubičke Toplice, HR0500045
MJERENJE NISKIH I 4C AKTIVNOSTI UZORAKA U OBLIKUBENZENA U TEKUĆINSKOM SCINTILACIJSKOM
BROJAČU
Jadranka Barešić, lnes Krajcar Bronić, Nada Horvatinčić i Bogomil ObelićInstitut "Ruđer Bošković", Bijenička c. 54, 10000 Zagreb
e-mail: [email protected]
UVODU Laboratoriju za mjerenje niskih aktivnosti Instituta "Ruđer Bošković"
određuje se starost (do 40000 godina) arheoloških, geoloških i hidroloških uzorakametodom l 4C datiranja, a mjerenjem aktivnosti I4C u okolišu može se pratiti ciklusugljika u prirodi [1,2]. Za mjerenje 14C aktivnosti koristi se plinski proporcionalnibrojač (GPC), a od 2001. i tekućinski scintilacijski brojač (LSC) Quantulus 1220.Za dobivanje uzoraka u obliku pogodnom za mjerenje pomoću LSC razvijene sudvije nove metode kemijske pripreme uzoraka [3]. Na Petom simpoziju HDZZ-aprikazana je metoda apsorpcije CO2 iz uzorka u odgovarajućem apsorpcijskomsredstvu [4]. U ovom radu prikazana je metoda sinteze benzena iz uzorka, teodređivanje optimalnih uvjeta sinteze benzena i mjerenja u LSC. Uspoređeni suosnovni mjerni parametri svih triju tehnika pripreme i mjerenja uzoraka, kao irezultati mjerenja.
PRIPREMA BENZENACO2 koji se dobiva spaljivanjem organskih uzoraka (drvo, ugljen, kosti),
odnosno otapanjem anorganskih (sige, sedre, sediment) u kiselini, kemijskim sepostupkom prevodi u metan za mjerenje u GPC-u, dok se za mjerenje u LSC-u CO2
apsorbira u apsorpcijskom sredstvu (LSC-A metoda, [4]) ili se iz CO2 sintetizirabenzen (LSC-B metoda).
Sinteza benzena se sastoji od više faza, a provodi se u staklenoj vakuumskojliniji (Slika 1). U reakcijskoj posudi od nehrđajućeg čelika (5) CO2 reagira srastaljenim litijem pri čemu nastaje Li2C2. Nakon hlađenja posude, slijedi hidrolizaLi2C2 (7). Nastali C2H2 pročišćava se prolaskom kroz klopke za uklanjanje vlage(9, 14) i klopku s fosfornom kiselinom (13). C2H2 se reakcijom trimerizacije nakatalizatoru (V2Os na alumosilikatnom nosaču) prevodi u C6H6, koji se ekstrahira skatalizatora grijanjem pomoću peći (18), i istovremeno se zamrzava tekućimdušikom u epruvetu (20).
158
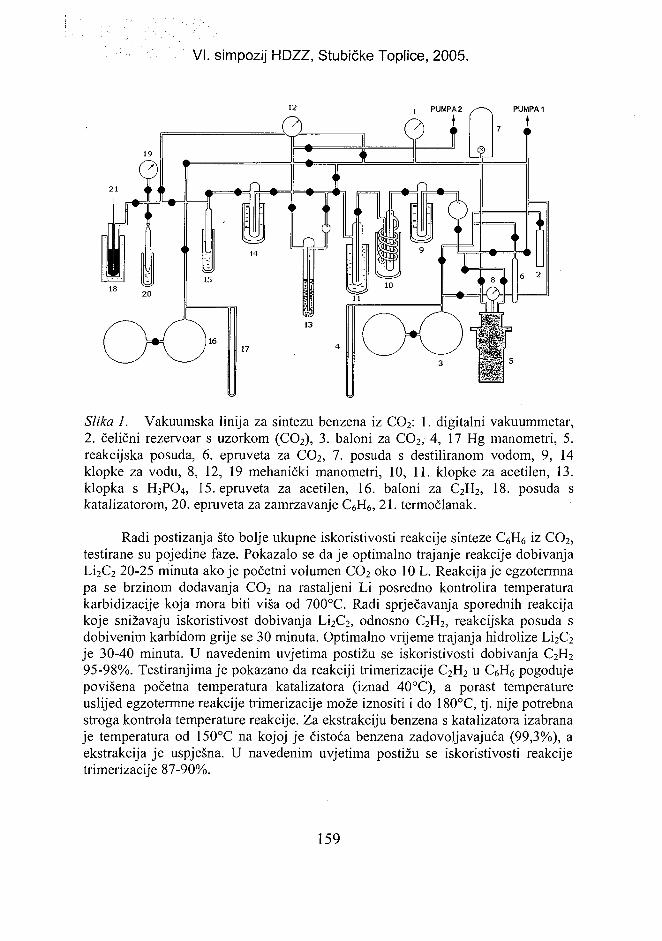
VI. simpozij HDZZ, Stubičke Toplice, 2005.
CX>Slika 1. Vakuumska linija za sintezu benzena iz CO2: 1. digitalni vakuummetar,2. čelični rezervoar s uzorkom (CO2), 3. baloni za CO2, 4, 17 Hg manometri, 5.reakcijska posuda, 6. epruveta za CO2, 7. posuda s destiliranom vodom, 9, 14klopke za vodu, 8, 12, 19 mehanički manometri, 10, 11. klopke za acetilen, 13.klopka s H3PO4, 15. epruveta za acetilen, 16. baloni za C2H2, 18. posuda skatalizatorom, 20. epruveta za zamrzavanje C6H6, 21. termočlanak.
Radi postizanja što bolje ukupne iskoristivosti reakcije sinteze C6H6 iz CO2,testirane su pojedine faze. Pokazalo se da je optimalno trajanje reakcije dobivanjaLi2C2 20-25 minuta ako je početni volumen CO2 oko 10 L. Reakcija je egzotermnapa se brzinom dodavanja CO2 na rastaljeni Li posredno kontrolira temperaturakarbidizacije koja mora biti viša od 700°C. Radi sprječavanja sporednih reakcijakoje snižavaju iskoristivost dobivanja Li2C2, odnosno C2H2, reakcijska posuda sdobivenim karbidom grije se 30 minuta. Optimalno vrijeme trajanja hidrolize Li2C2
je 30-40 minuta. U navedenim uvjetima postižu se iskoristivosti dobivanja C2H2
95-98%. Testiranjima je pokazano da reakciji trimerizacije C2H2 u C6H6 pogodujepovišena početna temperatura katalizatora (iznad 40°C), a porast temperatureuslijed egzotermne reakcije trimerizacije može iznositi i do 180°C, tj. nije potrebnastroga kontrola temperature reakcije. Za ekstrakciju benzena s katalizatora izabranaje temperatura od 150°C na kojoj je čistoća benzena zadovoljavajuća (99,3%), aekstrakcija je uspješna. U navedenim uvjetima postižu se iskoristivosti reakcijetrimerizacije 87-90%.
159
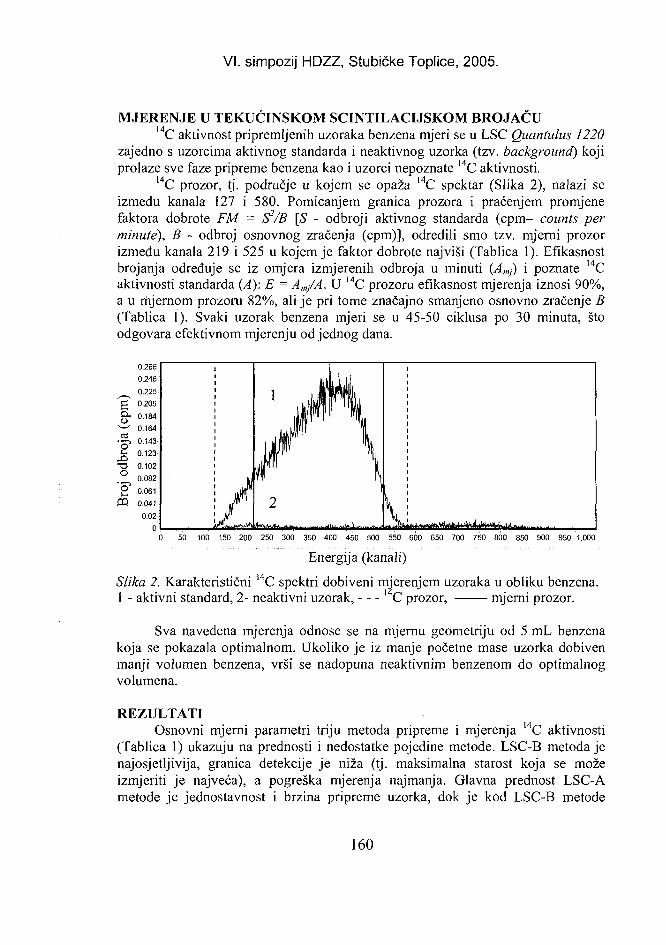
VI. simpozij HDZZ, Stubičke Toplice, 2005.
MJERENJE U TEKUĆINSKOM SCFNTILACIJSKOM BROJAČU14C aktivnost pripremljenih uzoraka benzena mjeri se u LSC Quantulus 1220
zajedno s uzorcima aktivnog standarda i neaktivnog uzorka (tzv. background) kojiprolaze sve faze pripreme benzena kao i uzorci nepoznate 14C aktivnosti.
14C prozor, tj. područje u kojem se opaža I4C spektar (Slika 2), nalazi seizmeđu kanala 127 i 580. Pomicanjem granica prozora i praćenjem promjenefaktora dobrote FM = S2/B [S - odbroji aktivnog standarda (cpm- counts perminute), B - odbroj osnovnog zračenja (cpm)], odredili smo tzv. mjerni prozorizmeđu kanala 219 i 525 u kojem je faktor dobrote najviši (Tablica 1). Efikasnostbrojanja određuje se iz omjera izmjerenih odbroja u minuti (Amj) i poznate 14Caktivnosti standarda (A): E = A,„/A. U 14C prozoru efikasnost mjerenja iznosi 90%,a u mjernom prozoru 82%, ali je pri tome značajno smanjeno osnovno zračenje B(Tablica 1). Svaki uzorak benzena mjeri se u 45-50 ciklusa po 30 minuta, štoodgovara efektivnom mjerenju od jednog dana.
0.266
0.246
^~, 0225
' g 1 0.205g - 0.184
0.164ca 0.143
T3 0.102
. ^ 0.082
g 0.061
CQ 0.041
0.02
0 50 100 150 200 250 300 350 400 450 500 550 600 650 700 750 800 850 900 950 1,000
Energija (kanali)
Slika 2. Karakteristični 14C spektri dobiveni mjerenjem uzoraka u obliku benzena.1 - aktivni standard, 2- neaktivni uzorak, ' C prozor, mjerni prozor.
Sva navedena mjerenja odnose se na mjernu geometriju od 5 mL benzenakoja se pokazala optimalnom. Ukoliko je iz manje početne mase uzorka dobivenmanji volumen benzena, vrši se nadopuna neaktivnim benzenom do optimalnogvolumena.
REZULTATIOsnovni mjerni parametri triju metoda pripreme i mjerenja 14C aktivnosti
(Tablica 1) ukazuju na prednosti i nedostatke pojedine metode. LSC-B metoda jenajosjetljivija, granica detekcije je niža (tj. maksimalna starost koja se možeizmjeriti je najveća), a pogreška mjerenja najmanja. Glavna prednost LSC-Ametode je jednostavnost i brzina pripreme uzorka, dok je kod LSC-B metode
160
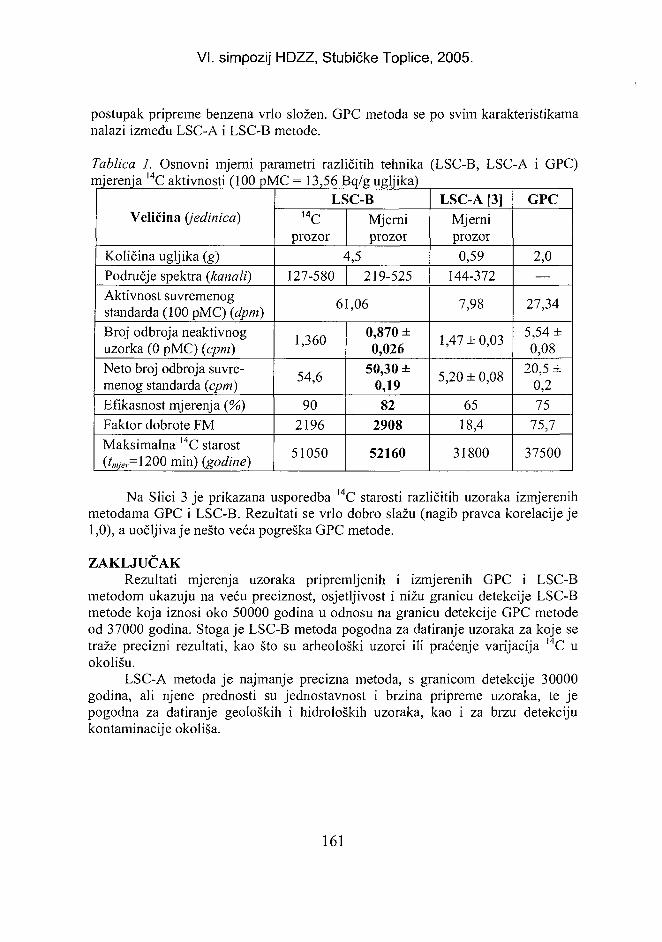
VI. simpozij HDZZ, Stubičke Toplice, 2005.
postupak pripreme benzena vrlo složen. GPC metoda se po svim karakteristikamanalazi između LSC-A i LSC-B metode.
Tablica 1. Osnovni mjerni parametri različitih tehnika (LSC-B, LSC-A i GPC)mjerenja I4C aktivnosti (100 pMC = 13,56 Bq/g ugljika)
Veličina (jedinica)
Količina ugljika (g)Područje spektra (kanali)Aktivnost suvremenogstandarda (100 pMC) (dpm)Broj odbroja neaktivnoguzorka (0 pMC) (cpm)Neto broj odbroja suvre-menog standarda (cpm)Efikasnost mjerenja (%)Faktor dobrote FMMaksimalna I4C starost(t,„jer= 1200 min) (godine)
LSC-B1 4C
prozorMjerniprozor
4,5127-580 219-525
61,06
1,360
54,6
902196
51050
0,870 ±0,026
50,30 ±0,1982
2908
52160
LSC-A [3]Mjerniprozor0,59
144-372
7,98
1,47 ±0,03
5,20 ± 0,08
6518,4
31800
GPC
2,0—
27,34
5,54 ±0,08
20,5 ±0,275
75,7
37500
Na Slici 3 je prikazana usporedba l 4C starosti različitih uzoraka izmjerenihmetodama GPC i LSC-B. Rezultati se vrlo dobro slažu (nagib pravca korelacije je1,0), a uočljiva je nešto veća pogreška GPC metode.
ZAKLJUČAKRezultati mjerenja uzoraka pripremljenih i izmjerenih GPC i LSC-B
metodom ukazuju na veću preciznost, osjetljivost i nižu granicu detekcije LSC-Bmetode koja iznosi oko 50000 godina u odnosu na granicu detekcije GPC metodeod 37000 godina. Stoga je LSC-B metoda pogodna za datiranje uzoraka za koje setraže precizni rezultati, kao što su arheološki uzorci ili praćenje varijacija 14C uokolišu.
LSC-A metoda je najmanje precizna metoda, s granicom detekcije 30000godina, ali njene prednosti su jednostavnost i brzina pripreme uzoraka, te jepogodna za datiranje geoloških i hidroloških uzoraka, kao i za brzu detekcijukontaminacije okoliša.
161
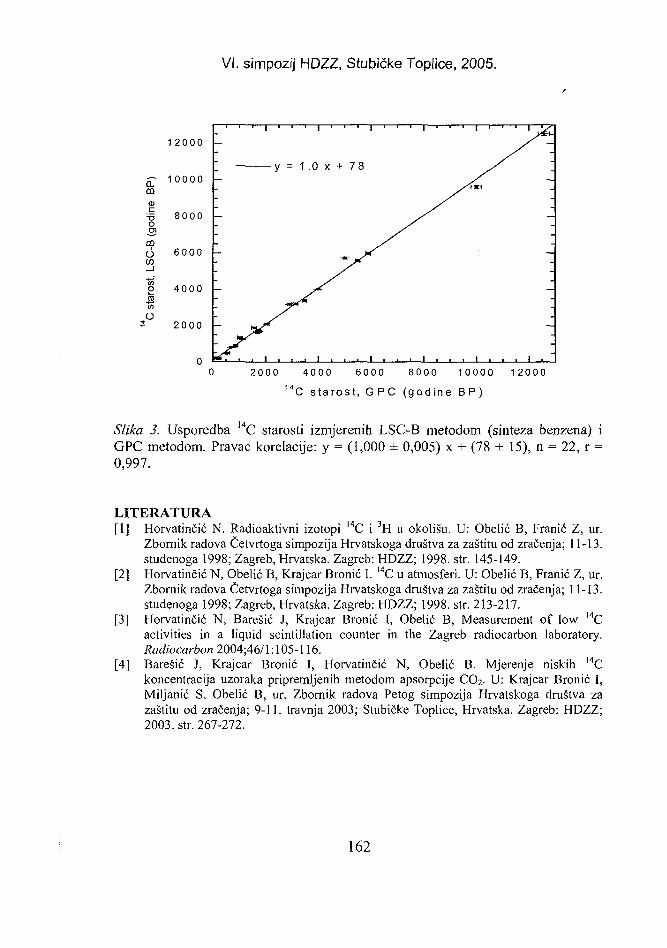
VI. simpozij HDZZ, Stubičke Toplice, 2005.
Q.m
TSoSCD
6CO
o
1 2 0 0 0 -
1 0 0 0 0 -
8000 -
6000 -
4000 -
2000 -
2 0 0 0 4 0 0 0 6 0 0 0 8 0 0 0 1 0 0 0 0 1 2 0 0 0
C s t a r o s t , G P C ( g o d i n e B P )
Slika 3. Usporedba l 4C starosti izmjerenih LSC-B metodom (sinteza benzena) iGPC metodom. Pravac korelacije: y = (1,000 ± 0,005) x + (78 ± 15), n = 22, r =0,997.
LITERATURA[1] Horvatinčić N. Radioaktivni izotopi I4C i 3H u okolišu. U: Obelić B, Franić Z, ur.
Zbornik radova Četvrtoga simpozija Hrvatskoga društva za zaštitu od zračenja; 11-13.studenoga 1998; Zagreb, Hrvatska. Zagreb: HDZZ; 1998. str. 145-149.
[2] Horvatinčić N, Obelić B, Krajcar Bronić I. ! 4C u atmosferi. U: Obelić B, Franić Z, ur.Zbornik radova Četvrtoga simpozija Hrvatskoga društva za zaštitu od zračenja; 11-13.studenoga 1998; Zagreb, Hrvatska. Zagreb: HDZZ; 1998. str. 213-217.
[3] Horvatinčić N, Barešić J, Krajcar Bronić I, Obelić B, Measurement of low I4Cactivities in a liquid scintillation counter in the Zagreb radiocarbon laboratory.Radiocarbon 2004;46/1:105-116.
[4] Barešić J, Krajcar Bronić I, Horvatinčić N, Obelić B. Mjerenje niskih I4Ckoncentracija uzoraka pripremljenih metodom apsorpcije CO2. U: Krajcar Bronić I,Miljanić S, Obelić B, ur. Zbornik radova Petog simpozija Hrvatskoga društva zazaštitu od zračenja; 9-11. travnja 2003; Stubičke Toplice, Hrvatska. Zagreb: HDZZ;2003. str. 267-272.
162
VI. simpozij HDZZ, Stubičke Toplice, 2005.
LSC MEASUREMENT OF LOW 1 4C ACTIVITIES OFSAMPLES PREPARED BY THE BENZENE SYNTHESIS
METHOD
Jadranka Barešić, Ines Krajcar Bronić, Nada Horvatinčićand Bogomil Obelić
Ruder Bošković Institute, Bijenička 54, HR-10000 Zagreb, Croatiae-mail: [email protected]
In the Laboratory for Low-Level Radioactivity at the Institute RuderBošković, archaeological, geological and hydrological samples have been datedusing the I4C method. Gas proportional counter (GPC) has been used for more thanthirty years to measure L4C activity, as well as a liquid scintillation counter (LSC)Quantulus 1220 since 2001. Two methods have been developed to preparechemical samples: benzene synthesis (LSC-B) and CO2 absorption (LSC-A). Herewe present benzene synthesis and compare it with GPC. CO2 obtained bycombustion of organic samples or by dissolving inorganic samples in hydrochloricacid is the basic reactant for all three methods. Benzene synthesis from CO2
consists of several stages: reaction between CO2 and Li (production of Li2C2),Li2C2 hydrolysis (production of C2H2) and C2H2 trimerisation into C6H6.Optimisation of individual processes resulted in total reaction yield of 80%.Optimal parameters for measurement in LSC were also determined: counting in 45-50 cycles of 30 minutes, the counting window between 219 and 525 channels, thetotal efficiency of 14C measurement of 82%. I4C activities measured by LSC werecompared with those measured by GPC and a good agreement was achieved (slopeof the regression line was 1.0 and the correlation coefficient r=0.997). Whencompared with GPC and LSC-A methods, LSC-B method had the highestsensitivity and precision and the lowest detection limit (i.e., the maximal age thatcan be determined is about 52000 years). Therefore, the LSC-B method is suitablefor dating archaeological samples and monitoring environmental 14C fluctuations.The disadvantage of the LSC-B method is relatively complex sample preparation.
163

BIOLOŠKI UČINCI ZRAČENJA
BIOLOGICAL EFFECTS OF RADI A TION

HR0500046VI. simpozij HDZZ, Stubičke Toplice,:
THE IMPACT OF 137Cs IONISING RADIATION ON THEBIOLOGICAL EFFECTS OF PLANTS
Danute Marčiulioniene , Dalius Kiponas , Benedikta Lukšiene and VygantasGaina1
'institute of Botany, Zalujq ežeru_ 49, LT-08406, Vilnius Lithuaniainstitute of Physics, Savanoriu. 231, LT-02300, Vilnius, Lithuania
e-mail: [email protected]
INTRODUCTIONAfter the Chernobyl NPP accident it was determined that in case of strong
ionising radiation doses, the impact efficiency of radionuclides, which get into theorganism, due to the atom decay in the cell can be 2-4 times higher than that ofexternal irradiation [1]. Biological impact of radionuclides, accumulated in theorganism, contrary to the external irradiation is conditioned by the radionuclideaccumulation level and their localization in the organism and cells, which can beinfluenced by various environmental factors and anthropogenic pollutants [2,3].But the plant response to the impact of the incorporated 137Cs, particularly at lowlevel ionising radiation doses, is not sufficiently investigated [4].
The aim of this study is to determine internal exposure doses of ionisingradiation in roots of test-organism Lepidium sativum L. caused by accumulatedl37Cs in laboratory experiments. The objective of the study also included thecomparison of the ionising radiation impact on the L. sativum seed germination androot growth, when the plant is exposed to internal and external irradiations.
MATERIAL AND METHODSEvaluation of the impact of l37Cs biological accumulation and its daughter
product external y irradiation on the biological effects was conducted using planttest-organism Lepidium sativum L. according to the modified Magone [5] method.This method is widely applied in the field of toxicologic investigations [6,7]. Theplant root meristem (a tissue the cells of which are actively dividing), due to theintensive metabolic processes is the most sensitive to the ionising radiation impact[8,9]. The biological effect was evaluated by the plant L. sativum seed germinationand root growth. The experiments were performed with 10 ml of treated solution inPetri dishes where 25 seeds were evenly distributed on the filter paper. Dishes wereplaced in thermostat at 24±1°C for 2 days. 137Cs activity concentration in studiedaquatic medium was (0.004; 0.04; 0.4; 4.4) xlO5 Bq/1 and medium pH 7.5. Forcontrol samples lake water with pH 7.5 was used. Presented data are thearithmetical means of 2-3 experimental series with calculated standard errors.Difference between statistically reliable results and control samples was assessedby test complex of two samples (when p<0.05) using Statgraphics plus Version 2.1
167
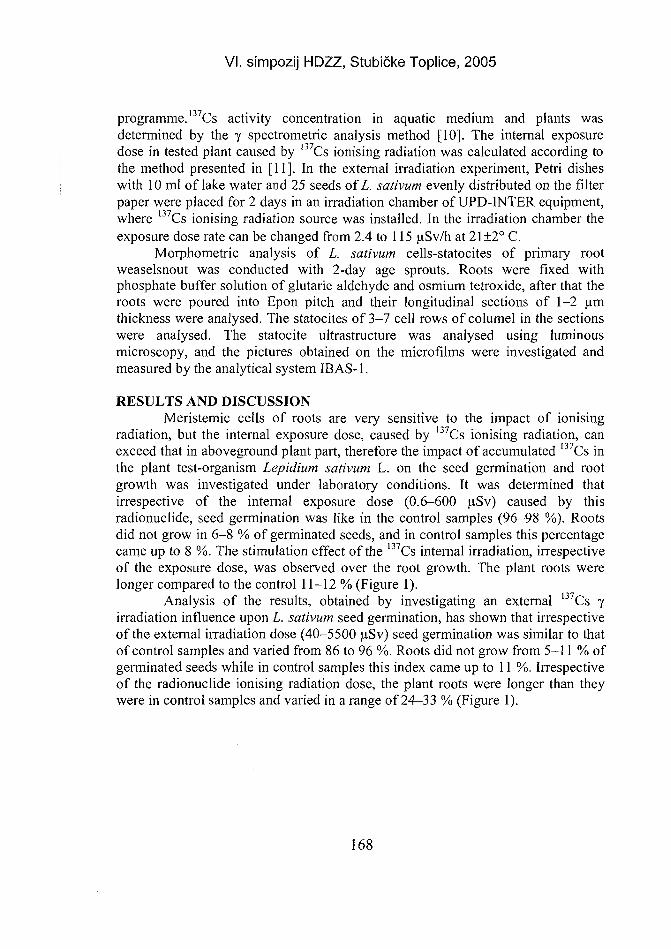
VI. simpozij HDZZ, Stubičke Toplice, 2005
programme. l37Cs activity concentration in aquatic medium and plants wasdetermined by the y spectrometric analysis method [10]. The internal exposuredose in tested plant caused by I37Cs ionising radiation was calculated according tothe method presented in [11]. In the external irradiation experiment, Petri disheswith 10 ml of lake water and 25 seeds of L. sativum evenly distributed on the filterpaper were placed for 2 days in an irradiation chamber of UPD-INTER equipment,where 137Cs ionising radiation source was installed. In the irradiation chamber theexposure dose rate can be changed from 2.4 to 115 uSv/h at 21 ±2° C.
Morphometric analysis of L. sativum cells-statocites of primary rootweaselsnout was conducted with 2-day age sprouts. Roots were fixed withphosphate buffer solution of glutaric aldehyde and osmium tetroxide, after that theroots were poured into Epon pitch and their longitudinal sections of 1-2 umthickness were analysed. The statocites of 3-7 cell rows of columel in the sectionswere analysed. The statocite ultrastructure was analysed using luminousmicroscopy, and the pictures obtained on the microfilms were investigated andmeasured by the analytical system IBAS-1.
RESULTS AND DISCUSSIONMeristemic cells of roots are very sensitive to the impact of ionising
radiation, but the internal exposure dose, caused by l37Cs ionising radiation, canexceed that in aboveground plant part, therefore the impact of accumulated l37Cs inthe plant test-organism Lepidium sativum L. on the seed germination and rootgrowth was investigated under laboratory conditions. It was determined thatirrespective of the internal exposure dose (0.6-600 uSv) caused by thisradionuclide, seed germination was like in the control samples (96-98 %). Rootsdid not grow in 6-8 % of germinated seeds, and in control samples this percentagecame up to 8 %. The stimulation effect of the 137Cs internal irradiation, irrespectiveof the exposure dose, was observed over the root growth. The plant roots werelonger compared to the control 11-12 % (Figure 1).
Analysis of the results, obtained by investigating an external 137Cs yirradiation influence upon L. sativum seed germination, has shown that irrespectiveof the external irradiation dose (40-5500 uSv) seed germination was similar to thatof control samples and varied from 86 to 96 %. Roots did not grow from 5-11 % ofgerminated seeds while in control samples this index came up to 11 %. Irrespectiveof the radionuclide ionising radiation dose, the plant roots were longer than theywere in control samples and varied in a range of 24-33 % (Figure 1).
168
VI. simpozij HDZZ, Stubičke Toplice, 2005
150 ;I o External exposure
140 j n Internal exposure
£ 130
I3 120 -o
110 J
100 -I—T~^-„-
_I _i_+__
0,1 1 10 100 1000 10000
Dose,10*Sv
Figure 1. Impact of internal and external irradiation (caused by 137Cs ionisingradiation) on the plant Lepidium sativum L. root growth
The obtained data indicate a negligible impact of tested internal andexternal l37Cs ionising radiation doses on the L. sativum seed germination. Bothinternal and external irradiation, irrespective of the exposure dose, stimulated theroot growth but stimulation was higher in a case of external irradiation. A non-rectilinear and not monotonic "dose-effect" dependence was determined byinvestigating the impact of low external doses (6-10"4—1,2 Gy) on animalbiophysical and biochemical characteristics [12] as well as genetic effects of barleyleaves meristemic tissues, induced by 4-10 cGy irradiation doses [13]. A diversityof obtained "dose-effect" dependences because of the impact of low irradiationdoses has been explained [12] as a change of ratio between genetic injures and theirreparations. Refering to [12], at the low doses, reparation systems are not activatedat all or they are weakly influenced because they are activated after a long time. Bycomparing the length, width and area of the primary root weaselsnout cells andarea of existing amiloplasts, gravitrophically sensitive organoids in those cells, adecrease in the cell length in rows from 7 th towards 3 rd, was determined i.e.towards the meristem in a case of both external and internal I37Cs ionising radiationexposure. The width of cells in all series of experiments was rather similar, andreliable difference from control samples was not observed. Evaluating a ratio of anarea of statocites and an area occupied by amiloplasts in them, it was determinedthat in all series of experiments the total area of columel cells after the internal andexternal irradiation was smaller than that in control samples. The largest differencefrom control samples was obtained for the ratio of 3-4 row cell area. The largestoccupational area of amiloplasts (at the same time, the starch amount in them) as incase of control samples occurred after roots got the external 180 uSv dose. Bygeneralising results of the morphometric investigation of the plant L. sativum cells
169
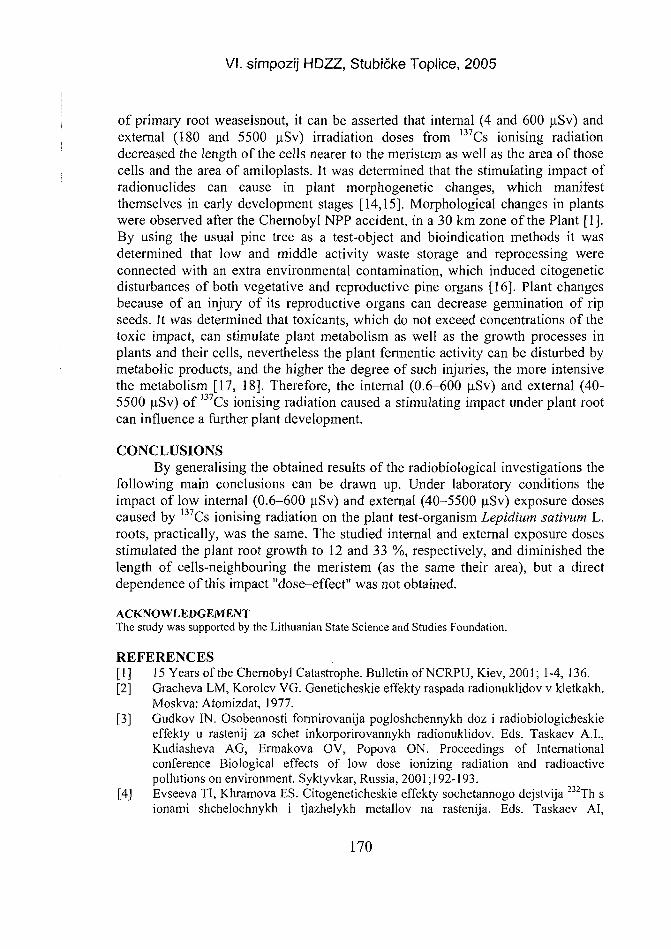
VI. simpozij HDZZ, Stubičke Toplice, 2005
of primary root weaselsnout, it can be asserted that internal (4 and 600 uSv) andexternal (180 and 5500 (iSv) irradiation doses from 137Cs ionising radiationdecreased the length of the cells nearer to the meristem as well as the area of thosecells and the area of amiloplasts. It was determined that the stimulating impact ofradionuclides can cause in plant morphogenetic changes, which manifestthemselves in early development stages [14,15]. Morphological changes in plantswere observed after the Chernobyl NPP accident, in a 30 km zone of the Plant [1].By using the usual pine tree as a test-object and bioindication methods it wasdetermined that low and middle activity waste storage and reprocessing wereconnected with an extra environmental contamination, which induced citogeneticdisturbances of both vegetative and reproductive pine organs [16]. Plant changesbecause of an injury of its reproductive organs can decrease germination of ripseeds. It was determined that toxicants, which do not exceed concentrations of thetoxic impact, can stimulate plant metabolism as well as the growth processes inplants and their cells, nevertheless the plant fermentic activity can be disturbed bymetabolic products, and the higher the degree of such injuries, the more intensivethe metabolism [17, 18]. Therefore, the internal (0.6-600 uSv) and external (40-5500 uSv) of J37Cs ionising radiation caused a stimulating impact under plant rootcan influence a further plant development.
CONCLUSIONSBy generalising the obtained results of the radiobiological investigations the
following main conclusions can be drawn up. Under laboratory conditions theimpact of low internal (0.6-600 uSv) and external (40-5500 uSv) exposure dosescaused by 137Cs ionising radiation on the plant test-organism Lepidium sativum L.roots, practically, was the same. The studied internal and external exposure dosesstimulated the plant root growth to 12 and 33 %, respectively, and diminished thelength of cells-neighbouring the meristem (as the same their area), but a directdependence of this impact "dose-effect" was not obtained.
ACKNOWLEDGEMENTThe study was supported by the Lithuanian State Science and Studies Foundation.
REFERENCES[1] 15 Years of the Chernobyl Catastrophe. Bulletin ofNCRPU, Kiev, 2001; 1-4, 136.[2] Gracheva LM, Korolev VG. Geneticheskie effekty raspada radionuklidov v kletkakh.
Moskva: Atomizdat, 1977.[3] Gudkov IN. Osobennosti formirovanija pogloshchennykh doz i radiobiologicheskie
effekty u rastenij za schet inkorporirovannykh radionuklidov. Eds. Taskaev A.I.,Kudiasheva AG, Ermakova OV, Popova ON. Proceedings of Internationalconference Biological effects of low dose ionizing radiation and radioactivepollutions on environment. Syktyvkar, Russia, 2001; [92-193.
[4] Evseeva TI, Khramova ES. Citogeneticheskie effekty sochetannogo dejstvija 232Th sionami shchelochnykh i tjazhelykh metallov na rastenija. Eds. Taskaev AI,
170
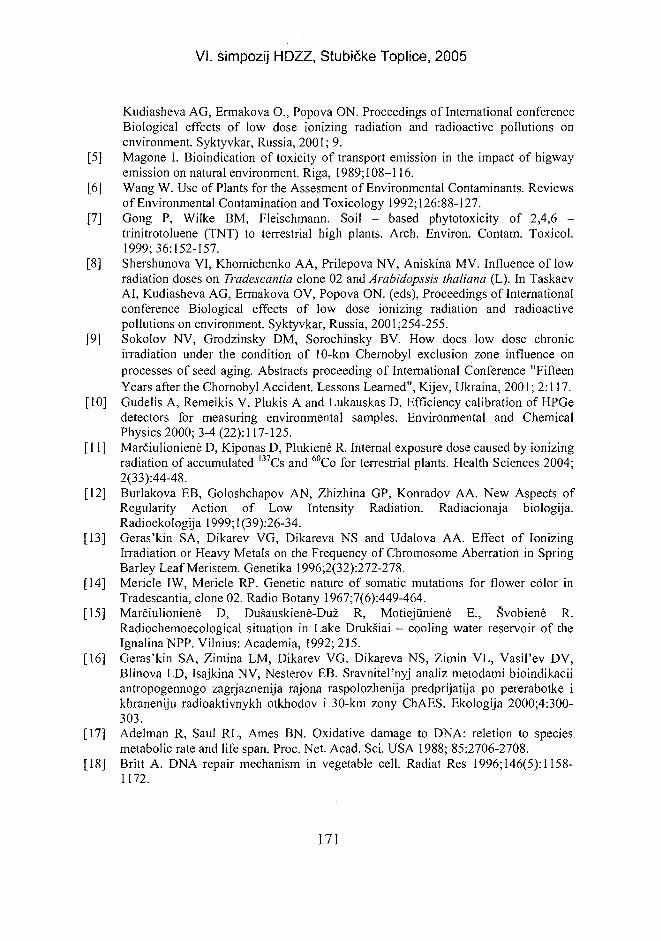
VI. simpozij HDZZ, Stubičke Toplice, 2005
Kudiasheva AG, Ermakova O., Popova ON. Proceedings of International conferenceBiological effects of low dose ionizing radiation and radioactive pollutions onenvironment. Syktyvkar, Russia, 2001; 9.
[5] Magone I. Bioindication of tqxicity of transport emission in the impact of higwayemission on natural environment. Riga, 1989; 108-116.
[6] Wang W. Use of Plants for the Assesment of Environmental Contaminants. Reviewsof Environmental Contamination and Toxicology 1992;126:88-127.
[7] Gong P, Wilke BM, Fleischmann. Soil - based phytotoxicity of 2,4,6 -trinitrotoluene (TNT) to terrestrial high plants. Arch. Environ. Contam. Toxicol.1999; 36:152-157.
[8] Shershunova VI, Khomichenko AA, Prilepova NV, Aniskina MV. Influence of lowradiation doses on Tradescantia clone 02 and Arabidopssis thaliana (L). In TaskaevAI, Kudiasheva AG, Ermakova OV, Popova ON. (eds), Proceedings of Internationalconference Biological effects of low dose ionizing radiation and radioactivepollutions on environment. Syktyvkar, Russia, 2001;254-255.
[9] Sokolov NV, Grodzinsky DM, Sorochinsky BV. How does low dose chronicirradiation under the condition of 10-km Chernobyl exclusion zone influence onprocesses of seed aging. Abstracts proceeding of International Conference "FifteenYears after the Chornobyl Accident. Lessons Learned", Kijev, Ukraina, 2001; 2:117.
[10] Gudelis A, Remeikis V, Plukis A and Lukauskas D. Efficiency calibration of HPGedetectors for measuring environmental samples. Environmental and ChemicalPhysics 2000; 3-4 (22): 117-125.
[11] Marčiulioniene D, Kiponas D, Plukiene R. Internal exposure dose caused by ionizingradiation of accumulated l37Cs and 60Co for terrestrial plants. Health Sciences 2004;2(33):44-48.
[12] Burlakova EB, Goloshchapov AN, Zhizhina GP, Konradov A A. New Aspects ofRegularity Action of Low Intensity Radiation. Radiacionaja biologija.Radioekologija 1999;l(39):26-34.
[13] Geras'kin SA, Dikarev VG, Dikareva NS and Udalova A A. Effect of IonizingIrradiation or Heavy Metals on the Frequency of Chromosome Aberration in SpringBarley Leaf Meristem. Genetika 1996;2(32):272-278.
[14] Mericle IW, Mericle RP. Genetic nature of somatic mutations for flower color inTradescantia, clone 02. Radio Botany 1967;7(6):449-464.
[15] Marčiulioniene D, Dušauskiene-Duž R, Motiejuniene E., Švobiene R.Radiochemoecological situation in Lake Drukšiai - cooling water reservoir of theIgnalina NPP. Vilnius: Academia, 1992; 215.
[16] Geras'kin SA, Zimina LM, Dikarev VG, Dikareva NS, Zimin VL, Vasil'ev DV,Blinova LD, Isajkina NV, Nesterov EB. Sravnitel'nyj analiz metodami bioindikaciiantropogennogo zagrjaznenija rajona raspolozhenija predprijatija po pererabotke ikhraneniju radioaktivnykh otkhodov i 30-km zony ChAES. Ekologija 2000;4:300-303.
[17] Adelman R, Saul RL, Ames BN. Oxidative damage to DNA: reletion to speciesmetabolic rate and life span. Proc. Net. Acad. Sci. USA 1988; 85:2706-2708.
[18] Britt A. DNA repair mechanism in vegetable cell. Radiat Res 1996;146(5):1158-1172.
171
VI. simpozij HDZZ, Stubičke Toplice, 2005
ABSTRACTBiological effects of exposure to low ionising radiation, especially of long-
lasting exposure, have not yet been investigated thoroughly .The goal of this studywas to determine internal irradiation doses caused by accumulated 137Cs in testplants and organisms. Environmental exposure of 11 test plant species to 137Csionising radiation reached internal irradiation doses of up to 32 |iSv, which canalready cause genotoxic changes in plants sensitive to ionising radiation.Laboratory experiments demonstrated that internal irradiation of the test organismTradescantia with 0.5 uSv of 137Cs was lethal for 25 % of nonviable stamen hairsand for 1.3 % of somatic cells.Under laboratory conditions, negligible internal(0.6-600 (iSv) and external (40-5500 uSv) ionising radiation doses of 137Csstimulated root growth in Lepidium sativum and reduced the length of the cellsnearest to the meristem, but no dose-dependent effect was observed.
172
HR0500047VI. simpozij HDZZ, Stubičke Toplice, 2C
AKTIVNOST TRANSFERAZA U KRVNOJ PLAZMI PILIĆAIZLEŽENIH IZ JAJA OZRAČENIH MALOM DOZOM GAMA-
ZRAČENJA TIJEKOM INKUBACIJE
Petar Kraljević', Marinko Vilić', Saveta Miljanić2 i Miljenko Šimpraga'1Zavod za fiziologiju i radiobiologiju,Veterinarski fakultet Sveučilišta u Zagrebu,
Heizelova 55, 10000 Zagreb2Institut "Ruđer Bošković", Bijenička c. 54, 10000 Zagreb
e-mail: [email protected]
UVODU našim ranijim radovima [1,2,3] pokazali smo daje rast pilića izleženih iz
jaja ozračenih gama-zračenjem dozom od 0,15 Gy prije inkubacije značajno većitijekom tova nego u pilića koji su izleženi iz neozračenih jaja. Osim toga, aktivnostaspartat-aminotransferaze (AST) i alanin-aminotransferaze (ALT), te koncentracijaglukoze u krvnoj plazmi istih pilića bila je veća nego u kontrolne skupine pilića.Ovi su rezultati, prema tome, potvrdili rezultate Todorova i Dijanovskog [4] damale doze gama-zračenja mogu stimulirati neke metaboličke procese u peradiizleženih iz jaja ozračenih prije inkubacije. Ovog puta, međutim, pokušali smoistražiti učinak male doze gama-zračenja na aktivnost transferaza u krvnoj plazmipilića izleženih iz jaja ozračenih sedmog dana inkubacije, dakle u vrijeme kada jeorganogeneza u pilića dovršena [5,6].
MATERIJAL I METODEPokuse smo načinili na pilićima hibridima tovne pasmine Avian (linija 34),
oba spola, koji su se izlegli iz jaja ozračenih sedmog dana inkubacije dozom od0,15 Gy gama-zračenja iz radioaktivnog izvora 60Co panoramskog tipa (pokusnaskupina). Zajedno s pokusnom skupinom imali smo i kontrolnu skupinu pilićaizleženu iz neozračenih jaja. Svi ostali uvjeti bili su isti za obje skupine pilića.Tijekom tova pilići su hranu i vodu uzimali ad libitum. Piliće obje skupine odabralismo nasumce, pa odnos spolova u pojedinoj skupini nismo točno utvrdili.
Krv za analizu uzimali smo iz srca, odnosno krilne vene u epruvete sheparinom kao antikoagulansom 1, 3, 5, 7, 10, 20, 30. i 42. dana pokusa.
Aktivnost obiju transferaza određivali smo spektrofotometrijski koristećigotove komplete reagencija proizvođača Boehringer Mannheim GmbH.
Rezultate smo statistički obradili i prikazali kao aritmetičku sredinu skupine(M) zajedno sa srednjom greškom srednje vrijednosti (SE), a značajnost međurazlikama provjerili smo t-testom po Studentu [7].
173
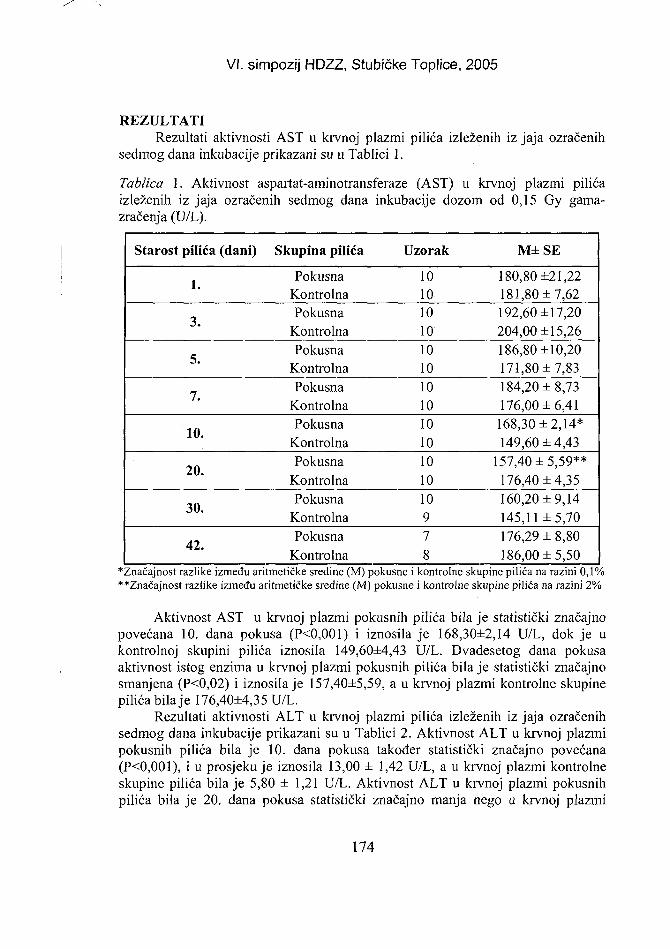
VI. simpozij HDZZ, Stubičke Toplice, 2005
REZULTATIRezultati aktivnosti AST u krvnoj plazmi pilića izleženih iz jaja ozračenih
sedmog dana inkubacije prikazani su u Tablici 1.
Tablica 1. Aktivnost aspartat-aminotransferaze (AST) u krvnoj plazmi pilićaizleženih iz jaja ozračenih sedmog dana inkubacije dozom od 0,15 Gy gama-zračenja (U/L).
Starost pilića (dani)
1.
3.
5.
7.
10.
20.
30.
42.
Skupina pilića
PokusnaKontrolnaPokusna
KontrolnaPokusna
KontrolnaPokusna
KontrolnaPokusna
KontrolnaPokusna
KontrolnaPokusna
KontrolnaPokusna
Kontrolna
Uzorak
10101010101010101010101010978
M±SE
180,80 ±21,22181,80 ±7,62192,60 ±17,20204,00 ±15,26186,80 ±10,20171,80 ±7,83184,20 ±8,73176,00 ±6,41
168,30 ±2,14*149,60 ±4,43
157,40 ±5,59**176,40 ±4,35160,20 ±9,14145,11 ±5,70176,29 ±8,80186,00 ±5,50
*Značajnost razlike između aritmetičke sredine (M) pokusne i kontrolne skupine pilića na razini 0,1%**Značajnost razlike između aritmetičke sredine (M) pokusne i kontrolne skupine pilića na razini 2%
Aktivnost AST u krvnoj plazmi pokusnih pilića bila je statistički značajnopovećana 10. dana pokusa (P<0,001) i iznosila je 168,30±2,14 U/L, dok je ukontrolnoj skupini pilića iznosila 149,60±4,43 U/L. Dvadesetog dana pokusaaktivnost istog enzima u krvnoj plazmi pokusnih pilića bila je statistički značajnosmanjena (P<0,02) i iznosila je 157,40±5,59, a u krvnoj plazmi kontrolne skupinepilića bila je 176,40±4,35 U/L.
Rezultati aktivnosti ALT u krvnoj plazmi pilića izleženih iz jaja ozračenihsedmog dana inkubacije prikazani su u Tablici 2. Aktivnost ALT u krvnoj plazmipokusnih pilića bila je 10. dana pokusa također statistički značajno povećana(P<0,001), i u prosjeku je iznosila 13,00 ± 1,42 U/L, a u krvnoj plazmi kontrolneskupine pilića bila je 5,80 ±1,21 U/L. Aktivnost ALT u krvnoj plazmi pokusnihpilića bila je 20. dana pokusa statistički značajno manja nego u krvnoj plazmi
174
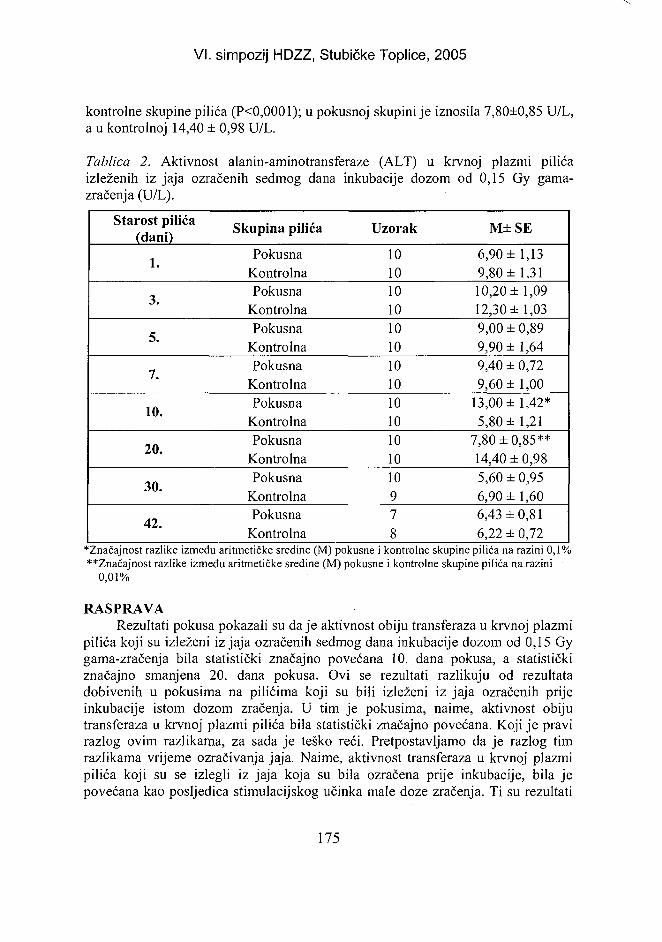
VI. simpozij HDZZ, Stubičke Toplice, 2Q05
kontrolne skupine pilića (P<0,0001); u pokusnoj skupini je iznosila 7,80±0,85 U/L,a u kontrolnoj 14,40 ± 0,98 U/L.
Tablica 2. Aktivnost alanin-aminotransferaze (ALT) u krvnoj plazmi pilićaizleženih iz jaja ozračenih sedmog dana inkubacije dozom od 0,15 Gy gama-zračenja (U/L).
Starost pilića(dani)
1.
3.
5.
7.
10.
20.
30.
42.
Skupina pilića
PokusnaKontrolnaPokusna
KontrolnaPokusna
KontrolnaPokusna
KontrolnaPokusna
KontrolnaPokusna
KontrolnaPokusna
KontrolnaPokusna
Kontrolna
Uzorak
10101010101010101010101010978
M±SE
6,90 ±1,139,80 ±1,3110,20 ±1,0912,30 ±1,039,00 ± 0,899,90 ± 1,649,40 ± 0,729,60 ±1,00
13,00 ± 1,42*5,80 ± 1,21
7,80 ±0,85**14,40 ± 0,985,60 ± 0,956,90 ± 1,606,43 ±0,816,22 ± 0,72
•Značajnost razlike između aritmetičke sredine (M) pokusne i kontrolne skupine pilića na razini 0,1%**Značajnost razlike između aritmetičke sredine (M) pokusne i kontrolne skupine pilića na razini
0,01%
RASPRAVARezultati pokusa pokazali su daje aktivnost obiju transferaza u krvnoj plazmi
pilića koji su izleženi iz jaja ozračenih sedmog dana inkubacije dozom od 0,15 Gygama-zračenja bila statistički značajno povećana 10. dana pokusa, a statističkiznačajno smanjena 20. dana pokusa. Ovi se rezultati razlikuju od rezultatadobivenih u pokusima na pilićima koji su bili izleženi iz jaja ozračenih prijeinkubacije istom dozom zračenja. U tim je pokusima, naime, aktivnost obijutransferaza u krvnoj plazmi pilića bila statistički značajno povećana. Koji je pravirazlog ovim razlikama, za sada je teško reći. Pretpostavljamo da je razlog timrazlikama vrijeme ozračivanja jaja. Naime, aktivnost transferaza u krvnoj plazmipilića koji su se izlegli iz jaja koja su bila ozračena prije inkubacije, bila jepovećana kao posljedica stimulacijskog učinka male doze zračenja. Ti su rezultati
175
VI. simpozij HDZZ, Stubičke Toplice, 2005
potvrdili rezultate autora koji su slične pokuse načinili na puranima i fazanima [4].U sadašnjim pokusima kada su jaja ozračena 7. dana inkubacije, aktivnosttransferaza u krvnoj plazmi pokusnih pilića bila je jednom povećana, a jednomsmanjena. Koji je uzrok tome, teško je pouzdano reći. Ipak pretpostavljamo da biuzroci mogli biti sljedeći: 1) to može biti posljedica stresa uzrokovanogozračivanjem jaja tijekom inkubacije. Iako je naime, organogeneza u pilića 7.danadovršena, razvoj plića ne samo da nije dovršen, već je tek u prvoj trećini pa je zbogtoga stresa, inače očekivani stimulacijski učinak male doze gama-zračenja naaktivnost transferaza, "oslabljen" 20. dana pokusa, u prvome redu, vakcinacijompilića protiv newcastelske bolesti 14. dana pokusa. Drugi pak razlog može biti učinjenici, koja usput podupire ovu prvu pretpostavku, da je koncentracija ukupnihbjelančevina u krvnoj plazmi pilića izleženih iz jaja ozračenih 7. dana inkubacijestatistički značajno smanjena u prvome tjednu života [8]. Budući da pilići tijekomtova intenzivno rastu, potreba za bjelančevinama je sve veća. Da bi se njihovasinteza povećala, povećava se aktivnost transferaza. Zato 10. dana pokusa imamopovećanu aktivnost obiju transferaza u krvnoj plazmi pokusnih pilića.
ZAKLJUČAKOzračivanje pilećih jaja dozom od 0,15 Gy gama-zračenja sedmog dana
inkubacije uzrokuje porast aktivnosti AST i ALT u krvnoj plazmi pilića izleženihiz tih jaja 10. dana pokusa (tova), a pad njihove aktivnosti 20. dana pokusa.Dobiveni rezultati razlikuju se od rezultata dobivenih na pilićima izleženim iz jajaozračenim istom dozom zračenja prije inkubacije, kada je aktivnost obijutransferaza bila povećana u krvnoj plazmi pilića izleženih iz tih jaja. Uzroknađenim razlika je, pretpostavljamo, vrijeme ozračivanja jaja.
LITERATURA[1] Kraljević P, Mas N, Poljak Z, Šimpraga M, Miljanić S. Tjelesna masa i prirast tovnih
pilića izvaljenih iz jaja ozračenih malom dozom gama zračenja prije inkubacije.Zbornik radova, Drugi hrvatski veterinarski kongres, Cavtat, 10.- 13. listopada, 2000.,Hrvatska veterinarska komora i Veterinarski fakultet Zagreb, 2000. str. 693-696.
[2] Kraljević P, Šimpraga M, Miljanić S, Ćović A, Stojević Z. Effect of Low DosesGamma- Radiation Upon Serum Amino Transferases Activity in Chickens. Book ofAbstracts, 30Ih Annual Meeting of European Society for Radiation Biology, Warszava,2000. str. 27-31.
[3] Kraljević P, Šimpraga M, Miljanić S, Vilić M. Effect of Low Doses Gamma- RadiationUpon some Biochemical Indicators in Blood Plasma of Chickens. Proceedings ofIRPA Regional Congress on Radiation Protection in Central Europe-RadiationProtecton and Health, Dubrovnik, 20.-25. svibnja 2001., Hrvatsko društvo za zaštitu odzračenja, Zagreb,2002.3p-12.
[4] Todorov B, Dijanovski P. Enzyme Activity in Blood Plasma of Turkey and PheasantReceived from Irradiated with Small Doses Gamma-Rays Eggs. Final Programme andBook of Abstracts of XVth Annual Meeting of European Society of Nuclear Methods inAgriculture. European Society of Nuclear Methods in Agriculture, Piacenza, 1984.
176
VI. simpozij HDZZ, Stubičke Toplice, 2005
[5] Hamburger V, Hamilton H L. A Series of Normal Stages in the Development of theChick Embryo. Developmental dynamics 1992; 195: 231-272.
[6] Bellairs R, Osmond M. The Atlas of Chick Development. Academic Press, San Diego,London, Boston, New York, Sidney, Tokio, Toronto, 1998.
[7] Renner E. Mathematisch-statistische Methoden in der praktischen Anwendung. VerlagPaul Parey, Berlin-Hamburg, 1970. 34-36.
[8] Vilić M, Kraljević P, Miljanić S, Šimpraga M. Koncentracija ukupnih bjelančevina ukrvnoj plazmi pilića izleženih iz jaja ozračenih malom dozom gama-zračenja tijekominkubacije. Zbornik radova Šestog simpozija Hrvatskoga društva za zaštitu od zračenja.18-20. travnja 2005; Stubičke Toplice, Hrvatska (u tisku).
TRANSFERASES ACTIVITY IN BLOOD PLASMA OF CHICKENSHATCHED FROM EGGS IRRADIATED DURING INCUBATION
BY LOW DOSE GAMMA RAYS
Petar Kraljević'', Marinko Vilić', Saveta Miljanić2 and Miljenko Šimpraga''Faculty of Veterinary Medicine, Heinzelova 55, HR-10000 Zagreb, Croatia
2Ruder Bošković Institute, Bijenička c. 54, HR-10000 Zagreb, Croatiae-mail: [email protected]
In our earlier studies chickens hatched from eggs irradiated with 0.15 Gygamma rays before incubation showed a significantly higher growth than controlsduring the fattening period (1-42 days). The activity of aspartate-aminotransferase(AST), alanine-aminotrasferase (ALT) and plasma glucose in the same chickenswere also significantly higher. These results suggested that low-dose gamma-radiation stimulated certain metabolic processes in chickens hatched from eggsirradiated before incubation. The goal of this study was to determine the effects oflow-dose ionising radiation on AST and ALT activity in the blood plasma ofchickens hatched from eggs irradiated during incubation. The eggs of heavybreeding chickens (Avian, line 34) were exposed to 0.15 Gy of gamma-radiation(60Co) on the seventh day of incubation, i.e. at the time when the organogenesis inchickens is completed. The control group of chickens hatched from non-irradiatedeggs. All other conditions were the same for both groups. After hatching, bloodsamples were taken from the wing vein on days 1, 3, 5, 7, 10, 20, 32 and 42. Theactivity of both enzymes was determined spectrophotometrically using BoehringerMannheim GmbH optimised kits. On day 10, AST and ALT activity weresignificantly higher in the blood plasma of chickens hatched from irradiated eggs,but it significantly dropped for both enzymes on day 20. Our results indicate thatexposure of eggs to low-dose gamma-radiation on the seventh day of incubationaffects AST and ALT activity in the blood plasma of chickens hatched fromirradiated eggs. However, this effect is somewhat different from the effects of eggexposure to low-dose gamma radiation before incubation.
177
VI. simpozij HDZZ, Stubičke Toplice,: HR0500048
KONCENTRACIJA UKUPNIH BJELANČEVINA U KRVNOJPLAZMI PILIĆA IZLEŽENIH IZ JAJA OZRAČENIH
MALOM DOZOM GAMA-ZRAČENJA TIJEKOMINKUBACIJE
MarinkoVilić', Petar Kraljević1, Saveta Miljanić2 i Miljenko Šimpraga1
'Veterinarski fakultet Sveučilišta u Zagrebu, Heinzelova 55, 10000 Zagreb2Institut "Ruđer Bošković", Bijenička c. 54, 10000 Zagreb
e-mail:[email protected]
UVODMale doze gama-zračenja mogu utjecati na aktivnost nekih enzima u krvnoj
plazmi peradi (purića i fazana) izleženih iz ozračenih jaja [1], odnosno mogupovećati masu pilića na kraju tova [2]. Do sličnih rezultata, u pokusima napilićima, došli su Kraljević i sur.[3]. Osim toga, isti autori pokazali su da postojeznačajne promjene u aktivnosti aspartat-aminotransferaze (AST), alanin-aminotransferaze (ALT) [4], odnosno značajne promjene u koncentraciji ukupnihbjelančevina, glukoze i kolesterola [5] u krvnoj plazmi pilića izleženih iz jajaozračenih dozom od 0,15 Gy prije inkubacije. Stoga smo u ovom radu htjeliistražiti utječu li male doze gama-zračenja na koncentraciju ukupnih bjelančevina ukrvnoj plazmi pilića izleženih iz jaja ozračenih 7. i 19. dana inkubacije.
MATERIJAL I METODEIstraživanje smo načinili u dva nezavisna pokusa i to: a) u prvom pokusu
rasplodna jaja, hibridne tovne pasmine Avian (linija 34) ozračili smo 7. danainkubacije dozom od 0,15 Gy gama-zračenja iz radioaktivnog izvora 60Copanoramskog tipa, i b) u drugom pokusu istom dozom zračenja ozračili smo jajahibridne tovne pasmine Gent (linija COBB 500) 19. dana inkubacije. U svakompokusu uz pokusnu skupinu imali smo i kontrolnu skupinu pilića izleženih izneozračenih jaja. Obje skupine pilića držali smo pod istim uvjetima. Tijekom tovapilići su hranu i vodu uzimali po volji. Krv za analizu uzimali smo iz srca, odnosnokrilne vene, u epruvete s heparinom kao antikoagulansom 1, 3, 5,7, 10, 20, 30. i42. dana pokusa. Koncentraciju ukupnih bjelančevina određivali smo u skupnomuzorku krvne plazme pilića biuret-metodom na spektrofotometru RA-1000(Technicon instruments corporation Tarrytown New york, USA) koristeći gotovekomplete reagencija proizvođača Boeringer Mannheim GmbH. Dobivene rezultateprikazali smo kao srednju vrijednost i pogrešku srednje vrijednosti (M±SE), aznačajnost razlika provjerili smo t-testom po Studentu.
178
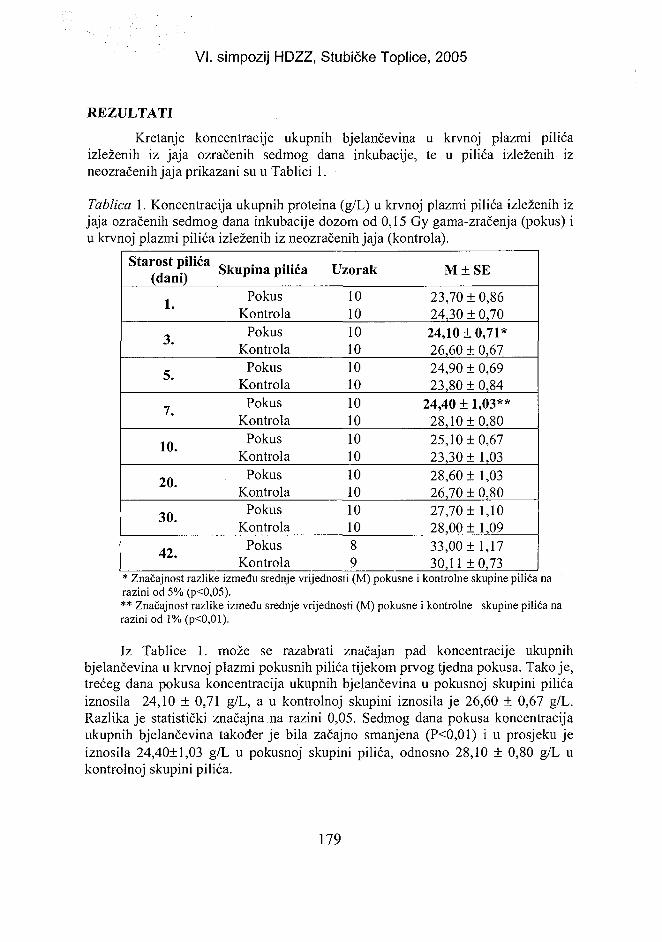
VI. simpozij HDZZ, Stubičke Toplice, 2005
REZULTATI
Kretanje koncentracije ukupnih bjelančevina u krvnoj plazmi pilićaizleženih iz jaja ozračenih sedmog dana inkubacije, te u pilića izleženih izneozračenih jaja prikazani su u Tablici 1.
Tablica 1. Koncentracija ukupnih proteina (g/L) u krvnoj plazmi pilića izleženih izjaja ozračenih sedmog dana inkubacije dozom od 0,15 Gy gama-zračenja (pokus) iu krvnoj plazmi pilića izleženih iz neozračenih jaja (kontrola).
Starost pilića(dani)
1.
3.
5.
7.
10.
20.
30.
42.
Skupina pilića
PokusKontrola
PokusKontrola
PokusKontrola
PokusKontrola
PokusKontrola
PokusKontrola
PokusKontrola
PokusKontrola
Uzorak
101010101010101010101010101089
M±SE
23,70 ±0,8624,30 ± 0,70
24,10 + 0,71*26,60 i 0,6724,90 ± 0,6923,80 ± 0,84
24,40 + 1,03**28,10 + 0,8025,1010,6723,3011,0328,6011,0326,70 i 0,8027,701 1,1028,0011,0933,00 ±1,1730,11 10,73
* Značajnost razlike između srednje vrijednosti (M) pokusne i kontrolne skupine pilića narazini od 5% (p<0,05).** Značajnost razlike između srednje vrijednosti (M) pokusne i kontrolne skupine pilića narazini od l%(p<0,01).
Iz Tablice 1. može se razabrati značajan pad koncentracije ukupnihbjelančevina u krvnoj plazmi pokusnih pilića tijekom prvog tjedna pokusa. Tako je,trećeg dana pokusa koncentracija ukupnih bjelančevina u pokusnoj skupini pilićaiznosila 24,10 i 0,71 g/L, a u kontrolnoj skupini iznosila je 26,60 i 0,67 g/L.Razlika je statistički značajna na razini 0,05. Sedmog dana pokusa koncentracijaukupnih bjelančevina također je bila začajno smanjena (P<0,01) i u prosjeku jeiznosila 24,40+1,03 g/L u pokusnoj skupini pilića, odnosno 28,10 1 0,80 g/L ukontrolnoj skupini pilića.
179
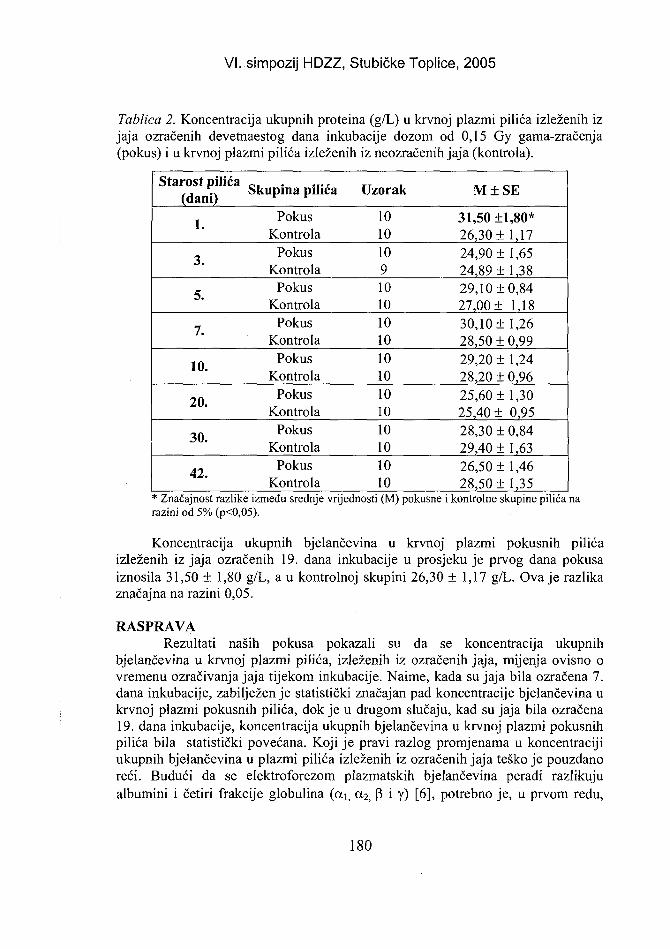
VI. simpozij HDZZ, Stubičke Toplice, 2005
Tablica 2. Koncentracija ukupnih proteina (g/L) u krvnoj plazmi pilića izleženih izjaja ozračenih devetnaestog dana inkubacije dozom od 0,15 Gy gama-zračenja(pokus) i u krvnoj plazmi pilića izleženih iz neozračenih jaja (kontrola).
Starost pilića(dani)
1.
3.
5.
7.
10.
20.
30.
42.
Skupina pilića
PokusKontrola
PokusKontrola
PokusKontrola
PokusKontrola
PokusKontrola
PokusKontrola
PokusKontrola
PokusKontrola
Uzorak
1010109101010101010101010101010
M±SE
31,50 ±1,80*26,30 ± 1,1724,90 ±1,6524,89 ± 1,3829,10 ±0,8427,00 ± 1,1830,10 ±1,2628,50 ± 0,9929,20 ± 1,2428,20 ± 0,9625,60 ±1,3025,40 ± 0,9528,30 ± 0,8429,40 ±1,6326,50 ± 1,4628,50 ±1,35
* Značajnost razlike između srednje vrijednosti (M) pokusne i kontrolne skupine pilića narazini od 5% (p<0,05).
Koncentracija ukupnih bjelančevina u krvnoj plazmi pokusnih pilićaizleženih iz jaja ozračenih 19. dana inkubacije u prosjeku je prvog dana pokusaiznosila 31,50 ± 1,80 g/L, a u kontrolnoj skupini 26,30 ± 1,17 g/L. Ova je razlikaznačajna na razini 0,05.
RASPRAVARezultati naših pokusa pokazali su da se koncentracija ukupnih
bjelančevina u krvnoj plazmi pilića, izleženih iz ozračenih jaja, mijenja ovisno ovremenu ozračivanja jaja tijekom inkubacije. Naime, kada su jaja bila ozračena 7.dana inkubacije, zabilježen je statistički značajan pad koncentracije bjelančevina ukrvnoj plazmi pokusnih pilića, dok je u drugom slučaju, kad su jaja bila ozračena19. dana inkubacije, koncentracija ukupnih bjelančevina u krvnoj plazmi pokusnihpilića bila statistički povećana. Koji je pravi razlog promjenama u koncentracijiukupnih bjelančevina u plazmi pilića izleženih iz ozračenih jaja teško je pouzdanoreći. Budući da se elektroforezom plazmatskih bjelančevina peradi razlikujualbumini i četiri frakcije globulina (ai, 0,2, P i y) [6], potrebno je, u prvom redu,
180
VI. simpozij HDZZ, Stubičke Toplice, 2005
svaku promjenu koncentracije ukupnih proteina usporediti s promjenamakoncentracije pojedinih frakcija osobito albumina i gama-globulina koji najvišepridonose ukupnoj koncentraciji proteina. Na koncentraciju proteina u krvnojplazmi peradi utječe, osim koncenracije navedenih frakcija, još i spol, razvojnistadij pilića, količina proteina u hrani, krvarenja te stanje dehidracije. Većinabjelančevina plazme, a isključivo albumini, sintetiziraju se u jetri. [7]. Stoga uzrokhiperproteinemije u krvnoj plazmi pilića izleženih iz jaja ozračenih 19. danainkubacije posljedica je značajnog povećanja koncentracije albumina i beta-globulina (vlastiti neobjavljeni rezultati). Možemo dakle predpostaviti da je jetrapri ozračivanju jaja 19 dana inkubacije bila stimulirana malom dozom gama-zračenja za sintezu bjelančevina. Uzrok padu koncentracije ukupnih proteina ukrvnoj plazmi pilića izleženih iz jaja ozračenih 7. dana inkubacije također jeposljedica statistički značajnog pada koncentracije albumina (vlastiti neobjavljenirezultati). No, pravi uzrok hipoalbuminemiji tj. padu koncentracije albumina ukrvnoj plazmi pilića tijekom 3. i 7. dana pokusa zaista je u ovom trenutku teškoobjasniti. Poznato je, naime, da pad albumina u krvnoj plazmi može biti zboginhibicije sinteze albumina, povećanja sinteze globulina, te brzog gubitka ilirazgradnje albumina [8]. Prema tome na osnovi predhodne činjenice te našihrezultata može se pretpostaviti da je mala doza gama-zračenja, korištena sedmogdana inkubacije jaja, inhibicijski djelovala na sintezu bjelančevina u pilića.
ZAKLJUČAKOzračivanje pilećih jaja sedmog dana inkubacije dozom od 0,15 Gy gama-
zarčenja uzrokuje pad koncentracije ukupnih bjelančevina u krvnoj plazmi pilićatijekom tova. Ozračivanje jaja devetnaestog dana inkubacije, istom dozom gama-zračenja, uzrokuje porast koncentracije ukupnih bjelančevina u krvnoj plazmipilića tijekom tova.
LITERATURA[1] Todorov B, Dijanovski P. Enzyme Activity in Blood Plasma of Turkey and Pheasant
Received from Irradiated with Small Doses Gamma-Rays Eggs. Final Programmeand Book of Abstracts of XVth Annual Meeting of European Society of NuclearMethods in Agriculture; 1984; Piacenza, Italy. European Society of Nuclear Methodsin Agriculture.
[2] Todorov B, Tchotinski D, Cvetanov I. Effect of low doses gamma radiation upon thehatchability of eggs and live weight of the broilers hatched. (Abstract). Finalprogramme and Books of abstracts of XVIIth annual meeting of European Society ofNuclear methods in Agriculture; 1986; Hannover, Germany. European Society ofNuclear methods in Agriculture.
[3] Kraljević P, Mas N, Poljak Z, Šimpraga M, Miljanić S. Tjelesna masa i prirast tovnihpilića izvalenih iz jaja ozračenih malom dozom gama zračenja prije inkubacije. U:Zbornik radova Drugi hrvatski veterinarski kongres; 10.-13. listopada 2000; Cavtat,Hrvatska. Hrvatska veterinarska komora i Veterinarski fakultet Zagreb; 2000. str.693-96.
181
VI. simpozij HDZZ, Stubičke Toplice, 2005
[4] Kraljević P, Šimpraga M, Miljanić S, Ćović A, Stojević Z. Effect of Low DosesGamma-Radiation Upon Serum Amino Transferases Activity in Chickens. In: Bookof Abstracts, 30th Annual Meeting of European Society for Radiation Biology; 27-31. August 2000;Warszava, Poland.
[5] Kraljević P, Šimpraga M, Miljanić S, Vilić M. Effect of low dose gamma radiationupon some biochemical indicators in blood plasma of chickens (paper no. 3p-12). In:Obelić B, Ranogajec-Komor M, Miljanić S, Krajcar Bronić I, eds. Cd-ROMproceedings og IRPA Regional Congress on Radiation Protection in Central Europe"Radiation Protection and Health", May 20-25, 2001; Dubrovnik, Croatia. Zagreb:CRPA;2002.
[6] Sturkie PD. Avian Physiology. 4Ih edition. Springer-Verlag, New York, 1986.[7] Štraus B. Medicinska biokemija.Drugo, obnovljeno i dopunjeno izdanje. Medicinska
naklada, Zagreb, 1992.[8] Coles EH.Veterinary clinical pathology. 3rd edition. Philadelphia-London-Toronto,
WB Saunders Company, 1980.
CONCENTRATION OF TOTAL PROTEINS IN BLOODPLASMA OF CHICKENS HATCHED FROM IRRADIATED
EGGS WITH LOW DOSE GAMMA RADIATION
Marinko Vilić', Petar Kraljević'', Saveta Miljanić2 and Miljenko Šimpraga1
'Faculty of Veterinary Medicine, Heinzelova 55, HR-10000 Zagreb, Croatia2Ruđer Bošković Institute, Bijenička cesta 54, HR-10000 Zagreb, Croatia
e-mail: [email protected]
It is known that low-dose ionising radiation may have stimulating effects onchickens. Low doses may also cause changes in the concentration of blood plasmatotal proteins, glucose and cholesterol in chickens. This study investigates theeffects of low dose gamma-radiation on the concentration of total proteins in theblood plasma of chickens hatched from eggs irradiated with a dose of 0.15 Gy onincubation days 7 and 19. Results were compared with the control group (chickenshatched from non-irradiated eggs). After hatching, all other conditions were thesame for both groups. Blood samples were drawn from the heart, and later from thewing vein on days 1, 3, 5, 7,10, 20, 30 and 42. The concentration of total proteinswas determined spectrophotometrically using Boehringer Mannheim GmbHoptimised kits. The concentration of total proteins in blood plasma in chickenshatched from eggs irradiated with 0.15 Gy on incubation day 7 showed astatistically significant decrease on the sampling day 3 (P<0.05) and 7 (P<0.01).The concentration of total proteins in blood plasma in chickens hatched from eggsirradiated with 0.15 Gy on incubation day 19 showed a statistically significantincrease only on sampling day 1 (P<0.05). These results suggest that exposure ofeggs to 0.15 Gy of gamma-radiation on the 7th and 19th day of incubation couldproduce different effects on the protein metabolism in chickens.
182
HR0500049VI. simpozij HDZZ, Stubičke Toplice,:
PRIMJENA ALKALNOG KOMET TESTA U PROCJENIOŠTEĆENJA DNA U BOLESNIKA SA SOLIDNIM
TUMORIMA LIJEČENIH RADIOTERAPIJOM
Marija Gamulin1, Vera Garaj-Vrhovac2i Nevenka Kopjar2
'KBC Zagreb, Klinika za onkologiju, Kišpatićeva 12, 10000 Zagreb2Institut za medicinska istraživanja i medicinu rada, Ksaverska c. 2,
10000 Zagrebe-mail: [email protected]
UVODU suvremenoj literaturi iz područja kliničke onkologije i radioterapije još
uvijek je nedovoljno razjašnjeno pitanje razmjera oštećenja nastalih u ne-tumorskim stanicama i tkivima nakon primjene zračenja kao terapijskog postupka.Ionizirajuće zračenje dokazani je mutagen koji, osim što dovodi do oštećenjatumorskog tkiva, izaziva i oštećenja genoma u ostalim stanicama. Genomskaoštećenja izazvana zračenjem ili drugim mutagenima najlakše se prate ulimfocitima periferne krvi [1]. U limfocitima onkoloških bolesnika liječenihzračenjem posebno je važno proučiti procese staničnog popravka te kvalitativne ikvantitativne promjene vrijednosti citogenetičkih biomarkera. Svi ti čimbenicimogu ukazivati na individualnu (pre)osjetljivost na zračenje, te moguću pojavnostsekundarnih tumora. Dosadašnja istraživanja nedvojbeno ukazuju da su pojedinicitogenetički i molekularno-biološki testovi korisni pokazatelji ili biomarkeriprikladni za kratkoročno [2] ili dugoročno citogenetičko praćenje u onkološkihbolesnika [3]. Rezultati citogenetičkih istraživanja ukazuju na porast učestalostinestabilnih kromosomskih aberacija te porast broja mikronukleusa u limfocitimaperiferne krvi zračenih onkoloških bolesnika [4,5]. Nadalje, rezultati osjetljivihmolekularno-bioloških testova, kao što je komet test, ukazuju na porast razineprimarnih oštećenja DNA u limfocitima periferne krvi bolesnika s malignimtumorima u usporedbi sa zdravom populacijom [6]. U ovom istraživanju pomoćukomet testa u alkalnim uvjetima istražene su razine primarnih oštećenja DNA uleukocitima periferne krvi kod 10 bolesnika koji su liječeni primarnom iliadjuvantnom radioterapijom (nakon operacijskog zahvata).
MATERIJAL I METODEIstraživanjem su obuhvaćeni bolesnici liječeni od solidnih tumora područja
glave i vrata, prostate, uterusa, pluća, dojke mozga i testisa. Podaci o ispitanicimanavedeni su u Tablici 1. Uzorci periferne krvi uzimani su u hepariniziranespremnike volumena 5 ml (BD Vacutainer). Uzokovanja su provedena prijezračenja, unutar 2 sata nakon primitka prve frakcije zračenja, sredinom ciklusazračenja, te unutar 2 sata nakon primitka zadnje frakcije zračenja. U istraživanju je
183
VI. simpozij HDZZ, Stubičke Toplice, 2005
primijenjena standardna izvedba komet testa u alkalnim uvjetima koju su predložiliSingh i sur. [7]. Svaki uzorak krvi uklopljen je u agarozni mikrogel i podvrgnut lizi(pH=10, 1 h na 4°C). Nakon liže, preparati su prebačeni u pufer za denaturaciju(pH=13). Denaturacija je trajala 20 minuta, zatim je u istom puferu provedenaelektroforeza pri jakosti struje od 300 mA i naponu od 25 V, u trajanju od 20minuta. Nakon elektroforeze, preparati su ispirani tri puta po 5 minuta uneutralizacijskom puferu (pH=7,5) i obojeni s etidij-bromidom (Sigma). Analizapreparata provedena je pomoću epifluorescencijskog mikroskopa, a mjerenja suprovedena pomoću programa za analizu slike Comet Assay II, (PerceptiveInstruments Ltd.).U svakom je uzorku izmjereno je po 100 kometa. Mjereni sudužina repa kometa (izražena u mikrometrima) i repni moment kometa. Rezultatimjerenja obrađeni su s pomoću programa Excel (deskriptivna statistika) i statističkivrednovani primjenom testa analize varijance (program Statistica 5.0, StatSoft).
REZULTATIDobiveni razultati ukazuju na postojanje značajnih interindividualnih razlika
između osnovnih razina oštećenja DNA utvrđenih prije radioterapije, uzevši uobzir oba promatrana parametra koje mjeri alkalni komet test (Tablica 1.). Nakonprimitka prve frakcije zračenja, u većine bolesnika uočeno je statistički značajnopovišenje razine oštećenja DNA u odnosu na predterapijske vrijednosti.Tijekomkasnijih uzorkovanja uočeni su specifični obrasci oštećenja DNA, koji se u nekihbolesnika mogu povezati s porastom učinkovitosti staničnih sustava za popravakradioterapijom-izazvanih oštećenja leukocitne DNA, pa čak i mogućim adaptivnimodgovorom na primijenjeno zračenje. Razlike u predterapijskim razinama oštećenjaDNA uočene između bolesnika s različitim vrstama solidnih tumora mogu seobjasniti i različitom osjetljivosti na dijagnostičku obradu provedenu prijeoperativnog zahvata i radioterapije.
ZAKLJUČAKRadioterapijsko liječenje povezano je sa značajnim razinama oštećenja DNA
u leukocitima periferne krvi. Utvrđene vrijednosti oba parametra komet testapokazatelji su individualnog odgovora na liječenje zračenjem, te ukazuju na razineindividualnog kapaciteta za popravak oštećenja izazvanih zračenjem u ne-tumorskim stanicama. U svih bolesnika nakon primjene prve frakcije zračenjautvrđen je porast primarnih oštećenja DNA. Sredinom ciklusa zračenja u većinebolesnika razina oštećenja DNA bila je niža u odnosu na onu utvrđenu neposrednonakon primitka prve frakcije zračenja, što ukazuje na mogući adaptivni odgovor.Obrasci oštećenja DNA utvrđeni krajem ciklusa zračenja bili su različiti, te ukazujuda se bolesnici s različitim vrstama solidnih tumora razlikuju prema genomskojstabilnosti.
184
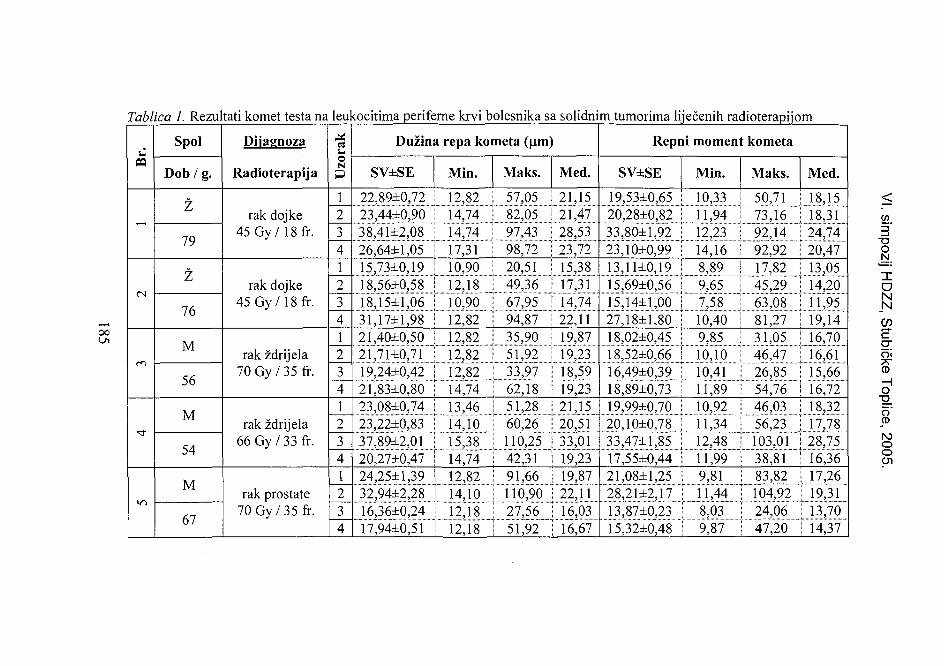
00
Tablica 1. Rezultati komet testa na
03
Spol
Dob / g.
L,
~7O/y
L
76
NI
J O
A/fIVI
54
cnbi
Dijagnoza
Radioterapija
rak dojke45 Gy /18 fr.
rak dojke45Gy/18fr.
rak ždrijela70Gy/35fr.
rak ždrijela66 Gy / 33 fr.
rak prostate70 Gy / 35 fr.
leukocitima periferne krvi bolesnika sa solidnim tumorima liječenih radioterapijom
rak
oN
12341234123412341234
Dužina repa kometa ((im
SV±SE Min.
22,89±0,72 I 12,8223,44±0,90 | 14,7438,41±2,08 | 14,7426,64±l,05 | 17,3115,73±0,19 10,9018,56±0,58 12,1818,15±l,06 10,9031,17±1,98 12,8221,40±0,50 •• 12,8221,71±0,71 12,8219,24±0,42 12,8221,83±0,80 | 14,7423,08±0,74 13,4623,22±0,83 I 14,1037,89±2,01 | 15,3820,27±0,47 i 14,7424,25±1,39 12,8232,94±2,28 14,1016,36±0,24 12,1817,94±0,51 12,18
Maks.
57,0582,0597,4398,7220,5149,3667,9594,8735,9051,9233,9762,1851,2860,26110,2542,3191,66110,9027,5651,92
Med.
21,1521,4728,5323,7215,3817,3114,7422,1119,8719,2318,5919,2321,1520,5133,0119,2319,8722,1116,0316,67
Repni moment
SV±SE
19,53±0,6520,28±0,8233,80±l,9223,10±0,9913,ll±0,1915,69±0,5615,14±l,0027,18±l,8018,02±0,4518,52±0,6616,49±0,3918,89±0,7319,99±0,7020,10±0,7833,47±1,8517,55±0,4421,08±l,2528,21±2,1713,87±0,2315,32±0,48
Min.
10,3311,9412,2314,168,899,657,5810,409,8510,1010,4111,8910,9211,3412,4811,999,8111,448,039,87
kometa
Maks.
50,7173,1692,1492,9217,8245,2963,0881,2731,0546,4726,8554,7646,0356,23103,0138,8183,82104,9224,0647,20
Med.
18,1518,3124,7420,4713,0514,2011,9519,1416,7016,6115,6616,7218,3217,7828,7516,3617,2619,3113,7014,37
3"-aoN
IDNN
CD
O
CD
N3OOcn
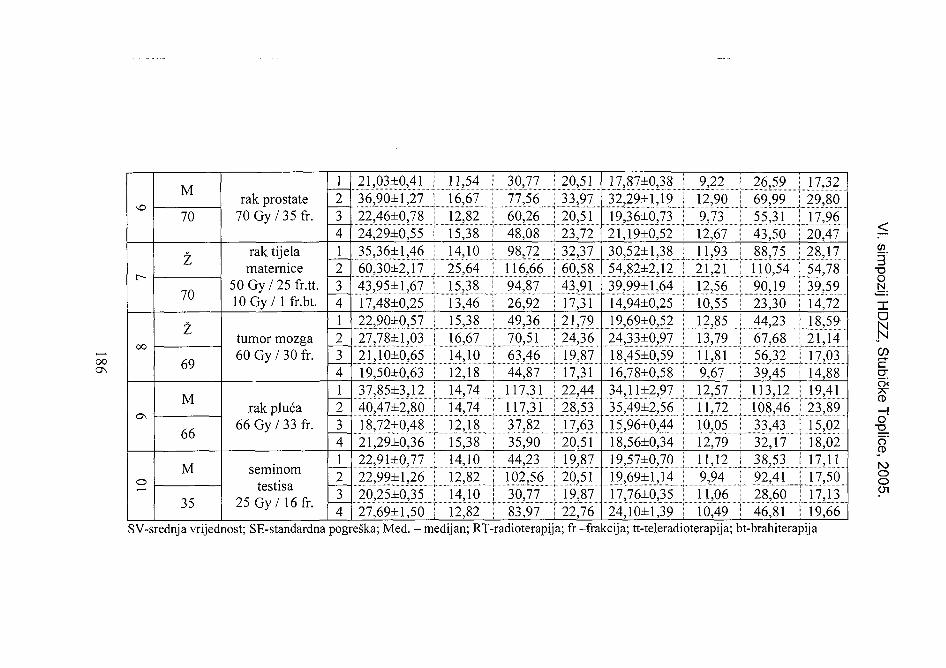
00os
o
M
70
Z
/O
ž
69
M
OO
M
o rj j
rak prostate70 Gy / 35 fr.
rak tijelamaternice
50 Gy / 25 fr.tt.10Gy/l fr.bt.
tumor mozga60 Gy / 30 fr.
rak pluća66 Gy / 33 fr.
seminomtestisa
25Gy/16fr.
12341234123412341234
21,03±0,4136,90±l,2722,46±0,7824,29±6,5535,36±1,4660,30±2,1743,95±1,6717,48±0,2522,90±0,5727,78±l,0321,10±0,6519,50±0,6337,85±3,1240,47±2,8018,72±0,4821,29±0,3622,91±0,7722,99±1,2620,25±0,3527,69±l,50
11,5416,6712,8215,3814,1025,6415,3813,4615,3816,6714,1012,1814,7414,7412,1815,3814,1012,8214,1012,82
30,7777,5660,2648,0898,72116,6694,8726,9249,3670,5163,4644,87117,31117,3137,8235,9044,23102,5630,7783,97
20,5133,9720,5123,7232,3760,5843,9117,3121,7924,3619,8717,3122,4428,5317,6320,5119,8720,5 i19,8722,76
17,87±0,3832,29±1,1919,36±0,7321,19±0,5230,52±l,3854,82±2,1239,99±1,6414,94±0,2519,69±0,5224,33±0,9718,45±0,5916,78±0,5834,11±2,9735,49±2,5615,96±0,4418,56±0,3419,57±0,7019,69±1,1417,76±0,3524,10±l,39
9,2212,909,7312,6711,9321,2112,5610,5512,8513,7911,819,6712,57U,1210,0512,7911,129,9411,0610,49
26,5969,9955,3143,5088,75110,5490,1923,3044,2367,6856,3239,45113,12108,4633,4332,1738,5392,4128,6046,81
17,3229,8017,9620,4728,1754,7839,5914,7218,5921,1417,0314,8819,4123,8915,0218,0217,1117,5017,1319,66
3•ooN.
DNtor-t-
O<
CD
51
Č5'
oo
SV-srednja vrijednost; SE-standardna pogreška; Med. - medijan; RT-radioterapija; fr -frakcija; tt-teleradioterapija; bt-brahiterapija
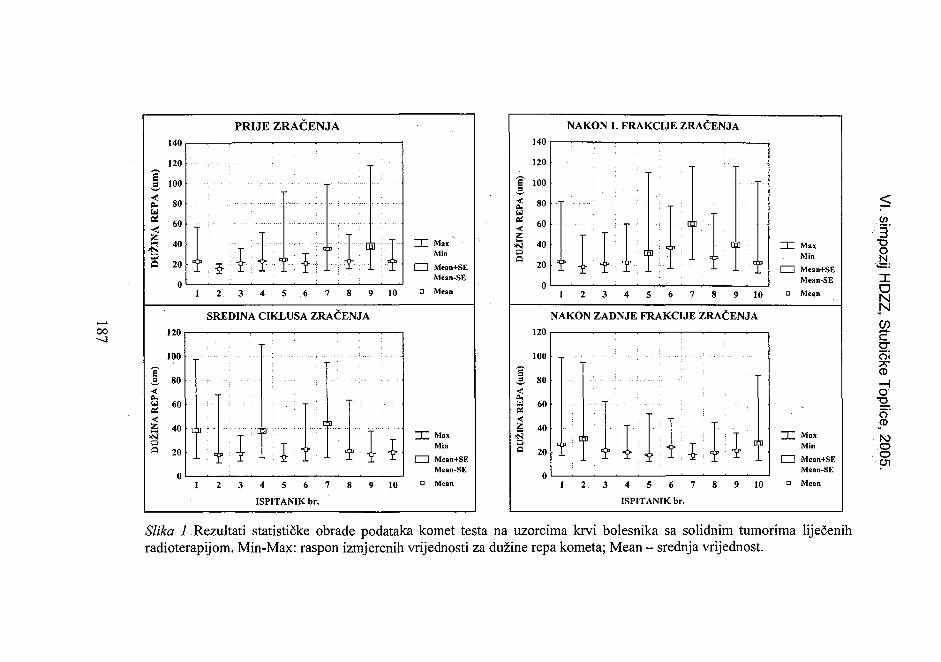
00
PRIJE ZRAČENJA
SREDINA CIKLUSA ZRAČENJA120
100
80
60
40
20
nil
i T i l10
~T~ MaxMin
I I Mean+SEMean-SE
• Mean
ISPITANIK br.
NAKON 1. FRAKCIJE ZRAČENJA140
120
100
80
60
40
20
08 10
MaxMin
Mean+SEMean-SE
Mean
NAKON ZADNJE FRAKCIJE ZRAČENJA
120
100
80
60
2 40
° 20 t I Y
4 5 6 7
ISPITANIK br.
10
~T~ MaxMin
I I Mcan+SEMean-SE
• Mean
Slika 1 Rezultati statističke obrade podataka komet testa na uzorcima krvi bolesnika sa solidnim tumorima liječenihradioterapijom. Min-Max: raspon izmjerenih vrijednosti za dužine repa kometa; Mean - srednja vrijednost.
co
3'
i
ICO
sO
K3OoCJl
VI. simpozij HDZZ, Stubičke Toplice, 2005
LITERATURA[1] Cheng L, Wang LE, Spitz MR, Wei Q. Cryopreserving whole blood for functional
assays using viable lymphocytes in molecular epidemiology studies. Cancer Lett2001;166,155-163.
[2] Kopjar N, Garaj-Vrhovac V, Milas I. Assessment of chemotherapy-induced DNAdamage in peripheral blood leukocytes of cancer patients using the alkaline cometassay. Teratogen Carcinogen Mutagen 2002; 22:13-30.
[3] Jagetia GC, Jayakrishan A, Fernandes D. Evaluation of micronuclei frequency in thecultured peripheral blood lymphocytes of cancer patients before and after radiationteratment. Mutat Res 2001; 491, 9-16.
[4] Naubauer S, Dunst J, Gebhart E. The impact of complex chromosomal rearragementson the detection of radiosensitivity in cancer patients. Radiotherapy Oncol 1997;43,189-195.
[5] Duffaud F, Orsiere T, Digue L, et al. Micronucleated lymphocyte rates from head-and-neck cancer patients. Mutat Res 1999;439, 259-266.
[6] Braybrooke JP, Houlbrook S, Crawley JE, Propper DJ, O'Byrne KJ, Stratford IJ, HarrisAL, Shuker DEG, Talbot DC. Evaluation of the alkaline comet assay and urinary 3-methyladenine excretion for monitoring DNA damage in melanoma patients treatedwith dacarbazine and tamoxifen. Cancer Chemother Pharmacol 2000; 45,111-119.
[7] Singh NP, McCoy MT, Tice RR, Schneider LL. A simple technique for quantitation oflow levels of DNA damage in individual cells. Exp Cell Res 1988; 175:184-191.
EVALUATION OF DNA DAMAGE IN RADIOTHERAPY-TREATEDCANCER PATIENTS USING THE ALKALINE COMET ASSAY
Marija Gamulin1, Vera Garaj-Vrhovac2 andNevenka Kopjar2
'University Hospital Zagreb, Department of Oncology, Kišpatićeva 12,institute for Medical Research and Occupational Health, Ksaverska c. 2,
HR-10000 Zagreb, Croatiae-mail: [email protected]
The alkaline comet assay was used to assess primary DNA damage in peripheral bloodleukocytes of ten cancer patients who received radiotherapy after were surgically removeddifferent solid tumours. This study included patients with head and neck cancer, prostatecancer, endometrial cancer, lung cancer, breast cancer, and brain and testicular tumour. Thelevels of DNA damage were evaluated in four blood samples taken before and afterreceiving the first dose of radiotherapy, in the middle of radiotherapy, and after the lastdose of radiotherapy. Two main comet parameters, namely the tail length and tail momentwere measured. The results indicate inter-individual differences in DNA damage inperipheral blood leukocytes between cancer patients before radiotherapy. After the firstdose significantly increased levels of DNA damage were recorded in all cancer patientscompared to their baseline values. Specific patterns of DNA damage were recorded insamples analysed in the middle of radiotherapy and after receiving the last dose, indicatingthe possibility of adaptive response in some patients. Our results indicate that radiotherapyis accompanied by significant DNA damage in peripheral blood leukocytes. They alsoconfirm damage in peripheral blood leukocytes of cancer patients.
188
VI. simpozij HDZZ, Stubičke Toplice,
FLUORESCENCIJSKA HIBRIDIZACIJA IN SITU UDETEKCIJI KROMOSOMSKIH OŠTEĆENJA ISPITANIKA
PROFESIONALNO IZLOŽENIH IONIZIRAJUĆEMZRAČENJU
Davor Želježić i Vera Garaj-VrhovacInstitut za medicinska istraživanja i medicinu rada, Ksaverska c. 2, 10000 Zagreb
e-mail: [email protected]
UVODUbrzo nakon što je IAEA 1986. na temelju istraživanja primjene analize
kromosomskih aberacija u zaštiti od zračenja, objavila opširno izvješće uz detaljanopis tehnike, ona je našla svoju primjenu i pokazala se učinkovitom u biološkojdozimetriji i praćenju genetičkog statusa populacija profesionalno izloženihionizirajućem zračenju [1-4]. Metoda je, također, preporučena od strane Svjetskezdravstvene organizacije kao citogenetička tehnika u nadzoru populacijaprofesionalno izloženih ionizirajućem zračenju [5]. Danas je prihvaćena spoznajada kromosomske aberacije nastaju, bilo izravnim djelovanjem ionizirajućegzračenja na molekulu DNA, bilo djelovanjem slobodnih radikala, nastalihionizacijom okolnih molekula. Primarno oštećenje koje pri tom nastaje je dvostrukilom [6]. Kasnije, uključivanjem različitih mehanizama popravaka, u određenimuvjetima kromosomski lomovi mogu biti prevedeni u teži oblik kromosomskihoštećenja kao što su dicentrični i prstenasti kromosom uz prateći acentričnifragment [6]. Iako se ti tipovi aberacija nazivaju nestabilnima, utvrđeno jepostojanje izravne veze između njihove učestalosti i razvoja malignog oboljenja[2,7,8]. Nestabilne aberacije pojavljuju se kratko vrijeme nakon izlaganja osobeionizirajućem zračenju, kako niskog tako i visokog LET-a. Međutim, one mogunastati i kao posljedica višegodišnjeg izlaganja niskim dozama zračenja [2,3].Nestabilni tipovi aberacija dovode do daljnje genomske nestabilnosti koja ima zaposljedicu nastanak stabilnih kromosomskih aberacija u vidu translokacija [3,9]. Zarazliku od nestabilnih kromosomskih aberacija, učestalost stabilnih kromosomskihaberacija povećava se s vremenom proteklim od ozračivanja [2,3]. Budući dastabilne kromosomske aberacije ne dovode do morfoloških promjena kromosomakoje bi bile vidljive bez primjene posebnih tehnika bojanja kromosoma, nije ihmoguće detektirati primjenom analize strukturnih aberacija kromosoma.
FLUORESCENCIJSKA HIBRIDIZACIJA IN SITUOd početka devedesetih godina prošlog stoljeća, fluorescencijska
hibridizacija in situ (FISH) koristi se kao citogenetička metoda u detekcijinasljednih oštećenja genetičkog materijala kao što su delecije, amplifikacije i
189
VI. simpozij HDZZ, Stubičke Toplice, 2005
translokacije sekvenci unutar DNA [10]. Tehnika se zasniva na hibridizacijivisokospecifične kratke dvolančane molekule DNA (sonda) na komplementaranslijed nukleotida unutar genoma. Sama sonda obilježena je fluorokromom te nakonhibridizacije, promatrana pod epifluorescentnim mikroskopom, uz korištenjepobudne svjetlosti točno određene valne dužine, daje jasan fluorescirajući signal namjestu svog vezivanja. Na taj način moguće je učiniti vidljivim točno određenisegment DNA unutar staničnog genoma [10]. Korištenjem sonde za jednuodređenu sekvencu može se dobiti informacija o broju kopija tog slijeda nukleotidaunutar genoma, ali i podatak o njihovom položaju na kromosomu. Koristi li seistovremeno nekoliko različitih sondi označenih različitim fluorokromima mogućeje pratiti međusobnu dinamiku odnosa položaja više različitih sekvenci unutargenoma i na taj način utvrditi da li je došlo do translokacije pojedine sekvence ilido njezine delecije ili amplifikacije [11].
U interakciji ionizirajućeg zračenja s genomom stanice nemoguće jepredvidjeti koji dio kromosoma će biti oštećen i time koja će sekvenca bitizahvaćena translokacijom. Stoga je, da bi se korištenjem fluorescencijskehibridizacije in situ, mogao pratiti učinak zračenja na učestalost stabilnihkromosomskih aberacija potrebno istovremeno čitav genom stanice učinitividljivim. U tu svrhu koristi se višebojna fluorescencijska hibridizacija in situ(multicolor FISH) [10].
Kombinatoričkim označavanjem sondi za čitave kromosome moguće jepostići da, nakon hibridizacije i računalne obrade slike, u vidnom poljuepifluorescentnog mikroskopa svaki od 22 para kromosoma uključujući i spolnebude obojen drugom bojom. Naime, to je moguće postići korištenjem triju ili višerazličitih fluorokroma, u različitim kombinacijama i omjerima, prilikom sintezesondi za svaki pojedini par kromosoma [12]. Ukoliko dođe do translokacije ona ćese očitovati u prekidu kontinuiteta obojenosti kromosoma na koji je određenasekvenca DNA translocirana i prisustvom umetnute translocirane sekvence,obojene emisijom fluorokroma tipičnom za kromosom s kojeg sekvenca potiče[13].
Uvođenjem fluorescencijske hibridizacije in situ u biološku dozimetrijutakođer je uočeno da mehanizam nastanka dicentričnog i prstenastog kromosoma,osim nastanka acentričnog fragmenta, ima za posljedicu i translokacije dijelovaDNA zahvaćenih mehanizmom popravka oštećenja. Na taj način utvrđeno je dazračenje dovodi do čitavog niza različitih translokacijskih mehanizama. Najčešćesu recipročne translokacije koje podrazumijevaju istovremenu zamjenu mjestadviju različitih sekvenci u genomu. Također su uočene jednosmjerne translokacijekoje mogu biti terminalne ili intersticijske translokacije. Međutim, utvrđeno je ipostojanje složenih mehanizama translokacija koji su uključivali izmjene sekvencis više od dva različita kromosoma i više od tri dvostruka loma [14]. Također jeustanovljeno da je u limfocitima periferne krvi osoba koje duži niz godinaprofesionalno rade s izvorima ionizirajućeg zračenja učestalost pojava
190
VI. simpozij HDZZ, Stubičke Toplice, 2005
translokacija sedam puta veća od učestalosti pojave dicentričnog kromosoma [2,14]. Uočeno je i da 10 - 40%, translokacija otpada na jednosmjerne translokacije[2], od toga ih je 76% intersticijskih, a 24% terminalnih. Korištenjem tehnike FISHutvrđeno je i da 65% translokacija uključuje i nastanak acentričnog fragmenta [15].Nadalje, utvrđeno je da lomovi nastali djelovanjem ionizirajućeg zračenja nisunasumično raspoređeni po kromosomima. Naime, lomovi su daleko češće nastajaliu području eukromatina. Ujedno, popravak oštećenja nastalih u tim dijelovimagenoma bio je brži i učinkovitiji. Primjenom fluorescencijske hibridizacijepokazano je da je, zbog svojih karakterističnih slijedova baza u telomernoj regiji,kromosom 8 osjetljiviji na ionizirajuće zračenje u usporedbi s ostalimkromosomima u stanici [16]. Uzevši u obzir da FISH pruža precizan uvid u stabilnekromosomske aberacije koje nastaju kao posljedica izlaganja ionizirajućemzračenju, primjenom te tehnike uspjelo se utvrditi precizan odnos doze i učestalostitranslokacija. Na temelju rezultata koji su polučeni primjenom fluorescencijskehibridizacije in situ, metoda polako nalazi primjenu u procjeni rizika od niskihdoza ionizirajućeg zračenja [17,18].
ZAKLJUČAKČinjenica je da FISH pruža uvid u stabilne tipove kromosomskih aberacija
koje nije moguće detektirati primjenom standardne metode kromosomskihaberacija. Međutim, pokazalo se da i učestalost translokacija s vremenomproteklim od ekspozicije ionizirajućem zračenju opada te je u svrhu dobivanjarelevantnih rezultata analize potrebno provesti korekciju rezultata QDR metodom(Quadratic Discriminant Rule). Ista korekcija provodi se i prilikom primjenestandardne tehnike analize aberacija tako daje obje metode moguće primjenjivati uretrospektivnoj biodozimetriji. Međutim, za razliku od kromosomskih aberacija,FISH tehnika pokazala se neučinkovitom u procjeni individualne doze prilikomekspozicija ispod 20 cGy i iznad 1,5 Gy [2]. Uzmu li se u obzir i izrazito visokitroškovi tehnike FISH te nesiguran ishod rezultata zbog nužnosti prilagodbe uvjetaizvođenja te tehnike svakoj pojedinoj seriji analize, korištenje FISHa ubiodozimetriji preporuča se samo u iznimnim slučajevima [2]. Za potreberutiniranog nadzora populacija koje rade s izvorima ionizirajućeg zračenja i daljestoji preporuka Svjetske zdravstvene organizacije za korištenje standardne metodeanalize strukturnih aberacija kromosoma [2, 4],
LITERATURA[1] International Atomic Energy Agency (IAEA). Biological Dosimetry: Chromosomal
Aberration Analysis for Dose Assessment. Vol. 260. IAEA: Vienna; 1986.[2] Natarajan AT. Chromosome aberrations: past, present and future. Mutat Res
2002;504:3-16.[3] Obe G, Pfeiffer P, Savage JRK, Johannes C, Goedecke W, Jeppesen P, Natarajan
AT, Martinez-Lopez W, Folloe GA, Drets ME. Chromosomal aberrations:formation, identification and distribution. Mutat Res 2002;504:17-36.
191
VI. simpozij HDZZ, Stubičke Toplice, 2005
[4] Garaj-Vrhovac V, Želježić D. Comet assay in the assessment of the human genomedamage induced by y-radiation in vitro. Radiol Oncol 2004;38(l):43-47.
[5] Albertini RJ, Anderson D, Douglas GR, Hagmar A, Hemminki K, Merlo F,Natarajan AT, Norppa H, Shuker DE, Tice R, Waters MD, Atio A. IPCS guidelinesfor the monitoring of genotoxic effects of carcinogens in humans. Mutat Res2000;463:l 11-172.
[6] Pfeiffer P, Goedecke W, Obe G. Mechanisms of DNA double strand break repairand their potential to induce chromosomal aberrations. Mutagenesis 2000; 15:289-302.
[7] Bonassi S, Abbondandolo A, Camurri L, Dal Pra L, De Ferrari M, Degrassi F, ForniA, Lamberti L, Lando C, Padovani P. Are chromosome aberrations in circulatinglymphocytes predictive of future cancer onset in humans? Preliminary results of anItalian cohort study. Cancer Genet Cytogenet 1995;79:133-135.
[8] Bonassi S, Hagmar L, Stromberg U, Montagud AH, Tinnerberg H, Forni A, HeikkilaP, Wanders S, Wilhardt P, Hansteen I-L, Knudson LE, Norppa H. Chromosomalaberrations in lymphocytes predict human cancer independently of exposure tocarcinogens. Cancer Res 2000;60:1619-1625.
[9] Darroudi F, Fomina J, Meijers M, Natarajan AT. Kinetics of the formation ofchromosome aberrations in X-irradiated human lymphocytes, using PCC and FISH.Mutat Res 1998;404:55-65.
[10] Emanuel BS. The use of fluorescence in situ hibridization to identify humanchromosomal abnormalities. Growth Genet Horm 1993;9:6-12.
[11] Ried T, Baldini A, Rand TC, Ward DC. Simultaneous visualization of sevendifferent DNA probes by in situ hybridization using combinatorial fluorescence anddigital imaging microscopy. Proc Natl Acad Sci USA 1992;89:1388-1392.
[12] Speicher MR, Ballard SG, Ward DC. Karyotyping human chromosomes bycombinatorial multi-fluor FISH. Natl Genet 1996;12: 368-375.
[13] Tanke HJ, Wiegant J, Van Gijlswijk RPM, Bezroookove V, Pattenier H, HeetebrijRJ, Talman EG, Raap AK, Vrolijk J. New strategy for multi-colour fluorescence insitu hybridization: COBRA: Combined Binary Ratio labeling. Eur J Hum Genet1999;7:2-11.
[14] Knehr S, Huber R, Braselmann H, Schraube H, Bauchinger M. Multicolour FISHpainting for the analysis of chromosomal aberrations induced by 220 kV X-rays andfission neutrons. Int J Radiat Biol I999;75:407-418.
[15] Fernandez JL, Campos A, Goyanes V, Losada C, Veiras C, Edwards AA. X-raybiological dosimetry performed by selective painting of human chromosomes 1 and2. Int J Radiat Biol 1995;67:295-302.
[16] Simpson PJ, Papworth DG, Savage JR. X-ray-induced simple, pseudosimple andcomplex exchanges involving two distinctly painted chromosomes. Int J Radiat Biol1999;75:11-18.
[17] Tawn EJ, Whitehouse CA. Stable chromosome aberration frequencies in menoccupational^ exposed to radiation, J Radioll Protect 2003;23(3):269-278.
[18] Cigarran S, Barquinero JF, Barrios L, Ribas M, Egozcue J, Caballin MR.Cytogenetic analyses by fluorescence in situ hybridization (FISH) in hospitalworkers occupationally exposed to low levels of ionizing radiation. Radiat Res2001;155(3):417-423.
192
VI. simpozij HDZZ, Stubičke Toplice, 2005
FLUORESCENCE /TV SI TU HYBRIDISATION INCHROMOSOME ABBERATION DETECTION IN SUBJECTSOCCUPATIONALLY EXPOSED TO IONISING RADIATION
Davor Želježić and Vera Garaj-VrhovacInstitute for Medical Research and Occupational Health, Ksaverska c. 2,
HR-10000 Zagreb, Croatiae-mail: [email protected]
For more than two decades, chromosomal aberration analysis has been used todetect structural chromosomal aberrations as sensitive biodosimeters ofoccupational exposure to ionising radiation. Its use is also recommended by theWorld Health Organisation. Changes in chromosome structure detected by thatmethod are considered to be early biomarkers of a possible malignant disease.Aberrations detected by the method are unstable and can be found in thelymphocytes of irradiated personnel only within a limited time after exposure. Todetect stable chromosomal aberrations, which persist after exposure, multicolourfluorescent in situ hybridisation has to be used. Using DNA probes labelled withdifferent fluorochromes, it dyes each pair of chromosomes with different colour.Due to the dynamic of unstable aberration formation, chromosomal aberrationanalysis is more suitable in genome damage assessment of recent exposures. Onthe other hand, fluorescence in situ hybridisation gives the information onchromosome instability caused by long-term occupational exposure to ionisingradiation. Considering the high costs of fluorescence in situ hybridisation and theuncertainty of the result, it should be used in biodosimetry only when it isabsolutely necessary.
193
VI. simpozij HDZZ, Stubičke Toplice,
IIIHR0500051
ASSESSMENT OF THE RADIOPROTECTIVE EFFECTS OFAMIFOSTINE AND MELATONIN ON HUMAN
LYMPHOCYTES IRRADIATED WITHy-RAYS IN VITRO
Nevenka Kopjar', Slavica Miočić2, Snjezana Ramić1, Mirta Milić'and Tomislav Viculin
'institute for Medical Research and Occupational Health, Ksaverska c. 22Faculty of Science, Rooseveltov trg 6
3The University Hospital for Tumors, Ilica 197HR-10000 Zagreb, Croatia
e-mail: [email protected]
INTRODUCTIONWhen interacting with living cells, ionising radiation causes a variety of
changes depending on exposed and absorbed dose, duration of exposure, interval ofexposure, and susceptibility of tissues. Interactions of ionising radiation with DNAconsist of the direct ionisation of DNA (direct effect) and its reaction withsurrounding water molecules (indirect effect), followed by DNA destruction by theinduced radicals. Majority of cellular DNA damage is estimated to be caused by"OH, formed from the radiolysis of water. The most significant DNA lesionsinduced by *OH are oxidised bases, abasic sites, DNA-DNA interstrand adducts,DNA single and double strand breaks and DNA-protein cross-links. If DNA repairmechanisms are inefficient, the damaged DNA strands that are copied duringreplication lead to mutagenesis and carcinogenesis [1]. Because radiation-inducedcellular damage is attributed primarily to harmful effects of free radicals, moleculeswith direct radical scavenging properties are particularly promising asradioprotectors [1,2]. The best known radioprotectors are the sulfhydril compounds(cysteine and cysteamine). However, most of them produce serious side effects,and some are considered to be toxic at the doses required for radioprotection [3,4].In the present study the radioprotective effects of cysteamine analogue amifostineand hormone melatonin on human peripheral blood irradiated with y-rays wereinvestigated. As a sensitive biomarkers micronucleus assay and the analysis ofsister chromatid exchanges (SCE) were chosen.
MATERIALS AND METHODSPeripheral blood sample (V=40 ml) was obtained from a healthy non-
smoking male donor (age: 25 years). Blood was collected by venipuncture intoheparinised tubes (Becton Dickinson, USA).
194
VI. simpozij HDZZ, Stubičke Toplice, 2005
Duplicate blood samples (V=5 ml) were pre-treated for 30 minutes withamifostine (7.7 mM, Sigma), melatonin (2 mM, Sigma) and their combination.Negative controls (untreated samples) were also included. After treatment withradioprotectors, one blood sample from each experimental group was exposed to y-rays from 60Co source (Alcyon, CGR-MeV). For this purpose, vacutainercontaining blood sample was mounted in an acrylic phantom (dimensions:20x20x15 cm3), in depth of 5.5 cm and it was placed transversally to the axis ofirradiation. Radiation field was 15x15 cm2, and the distance between the surfaceof phantom and source of radiation was 80 cm. Total exposure to radiation lastedfor 1.24 minutes, and the absorbed dose was 2 Gy. Other radioprotector-treatedblood samples were not irradiated, but they were handled in the same manner.From each blood sample lymphocyte cultures for the cytokinesis blockedmicronucleus (MN) assay and the sister chromatid exchange (SCE) analysis wereestablished.
Cytokinesis blocked micronucleus assay was performed according tostandard protocol [5,6]. Incidence of MN was evaluated by scoring of 1000binucleated cells per each experimental point. Total number of MN and thenumbers of cells having 0, 1, 2, 3 or more MN were recorded. Moreover, thenumber of lymphocytes with one to four nuclei (MI to MIV) was evaluated on1000 cells and nuclear division index (NDI) was calculated;NDI=(lMI+2MII+3MIII+4MIV)/1000 cells counted in total. Statisticalsignificance of differences between observed frequencies of MN was tested byusing the Chi - square test. The level of statistical significance was set at p < 0.05.The SCE analysis was performed according to standard protocols [7]. A total of100 second division metaphases from each experimental point were scored forSCE. The proliferation index (PRI) was calculated by analysing 100 cells asfollows: PRI=(Mi+2M2+3M3)/100, where M,-M3 represent the number oflymphocytes in the first, second and third generation. Statistical analyses werecarried out using Statistica software (StatSoft, USA). Multiple comparisonsbetween groups were done by means of ANOVA. Post-hoc analysis of differenceswas done by Scheffe test. The level of statistical significance was set at p < 0.05.
RESULTSOur results confirmed radioprotective efficacy of both radioprotectors in
tested concentrations. A clear reduction in total number of MN in pre-treatedirradiated blood samples was observed. Moreover, a reduction in the number ofcells bearing more than one MN was also observed (Table 1). All decreases in totalnumber of MN were statistically significant compared to control irradiated sample.However, differences in total number of MN recorded after treatments with singleradioprotectors and their combination were not statistically significant; indicatingthat both agents showed similar radioprotective effects in vitro. Based on theresults obtained both radioprotectors in tested concentrations did not induce
195
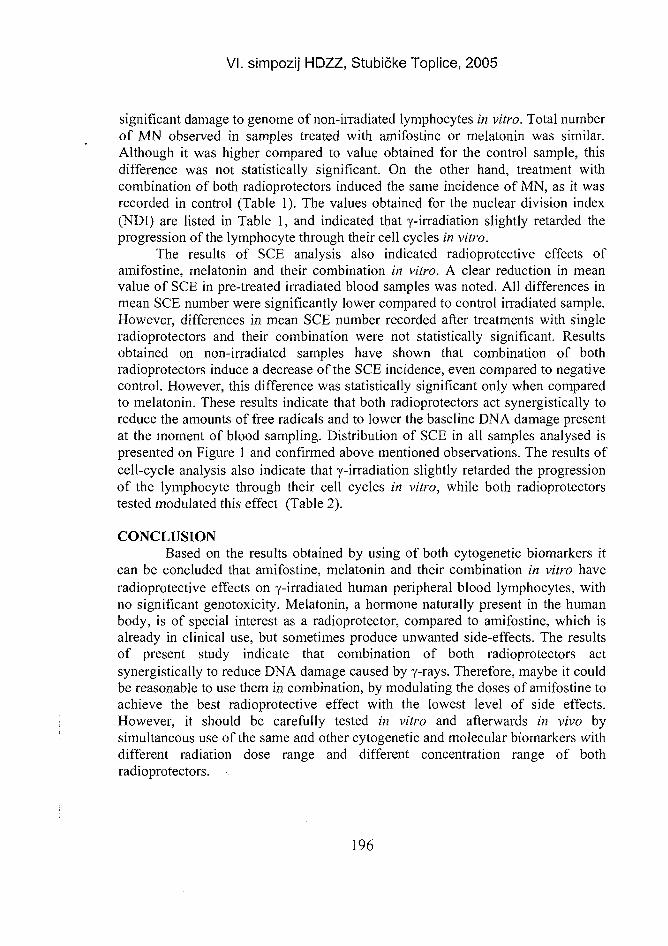
VI. simpozij HDZZ, Stubičke Toplice, 2005
significant damage to genome of non-irradiated lymphocytes in vitro. Total numberof MN observed in samples treated with amifostine or melatonin was similar.Although it was higher compared to value obtained for the control sample, thisdifference was not statistically significant. On the other hand, treatment withcombination of both radioprotectors induced the same incidence of MN, as it wasrecorded in control (Table 1). The values obtained for the nuclear division index(NDI) are listed in Table 1, and indicated that y-irradiation slightly retarded theprogression of the lymphocyte through their cell cycles in vitro.
The results of SCE analysis also indicated radioprotective effects ofamifostine, melatonin and their combination in vitro. A clear reduction in meanvalue of SCE in pre-treated irradiated blood samples was noted. All differences inmean SCE number were significantly lower compared to control irradiated sample.However, differences in mean SCE number recorded after treatments with singleradioprotectors and their combination were not statistically significant. Resultsobtained on non-irradiated samples have shown that combination of bothradioprotectors induce a decrease of the SCE incidence, even compared to negativecontrol. However, this difference was statistically significant only when comparedto melatonin. These results indicate that both radioprotectors act synergistically toreduce the amounts of free radicals and to lower the baseline DNA damage presentat the moment of blood sampling. Distribution of SCE in all samples analysed ispresented on Figure 1 and confirmed above mentioned observations. The results ofcell-cycle analysis also indicate that y-irradiation slightly retarded the progressionof the lymphocyte through their cell cycles in vitro, while both radioprotectorstested modulated this effect (Table 2).
CONCLUSIONBased on the results obtained by using of both cytogenetic biomarkers it
can be concluded that amifostine, melatonin and their combination in vitro haveradioprotective effects on y-irradiated human peripheral blood lymphocytes, withno significant genotoxicity. Melatonin, a hormone naturally present in the humanbody, is of special interest as a radioprotector, compared to amifostine, which isalready in clinical use, but sometimes produce unwanted side-effects. The resultsof present study indicate that combination of both radioprotectors actsynergistically to reduce DNA damage caused by y-rays. Therefore, maybe it couldbe reasonable to use them in combination, by modulating the doses of amifostine toachieve the best radioprotective effect with the lowest level of side effects.However, it should be carefully tested in vitro and afterwards in vivo bysimultaneous use of the same and other cytogenetic and molecular biomarkers withdifferent radiation dose range and different concentration range of bothradioprotectors. .
196
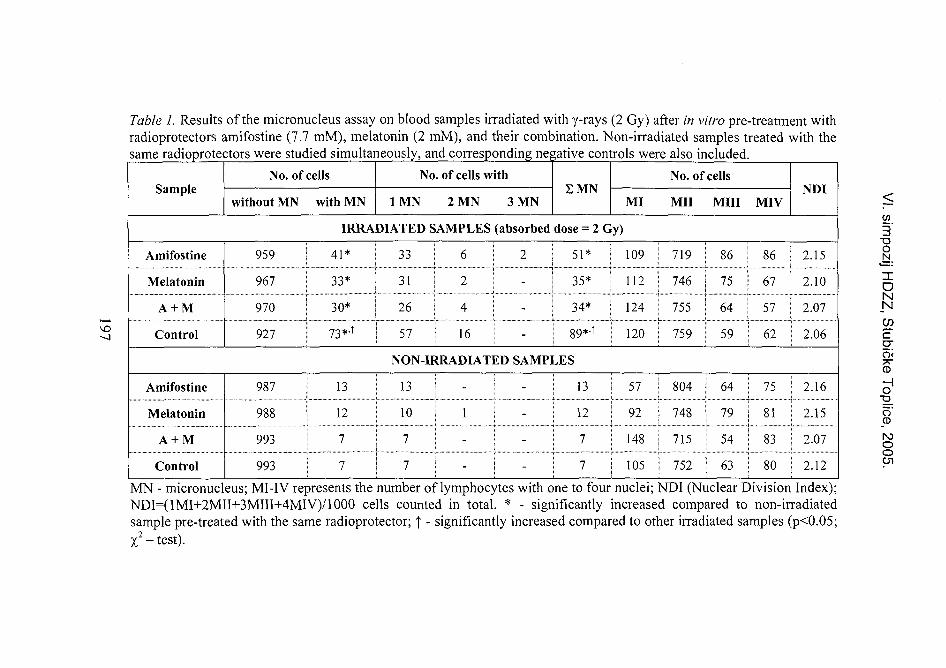
Table 1. Results of the micronucleus assay on blood samples irradiated with y-rays (2 Gy) after in vitro pre-treatment withradioprotectors amifostine (7.7 mM), melatonin (2 mM), and their combination. Non-irradiated samples treated with thesame radioprotectors were studied simultaneously, and corresponding negative controls were also included.
SampleNo. of cells
without MN with MN
No. of cells with
1MN 2 MN 3 MNSMN
No. of cells
MI Mil Mill MIVNDI
IRRADIATED SAMPLES (absorbed dose = 2 Gy)
Amifostine
Melatonin
A + M
Control
959
967
970
927
41*
33*
30*
73*.T
33
31
26
57
6 [ 2 51* 109
2 | - | 35* | 112
4 1 - I 34*
16 - 89*'T
124
120
719
746
755
759
86 | 86
75 | 67
64 | 57
59 62
2.15
2.10
2.07
2.06
NON-IRRADIATED SAMPLES
Amifostine
Melatonin
A + M
Control
987
988
993
993
13
12
7
7
13
10
7
7
I - 1 1 3 57
1 | - | 12 | 92
| - I 7 | 148
| 7 | 105
804
748
715
752
64 | 75
79 i 81i
54 i 83
63 1 80
2.16
2.15
2.07
2.12
MN - micronucleus; MI-IV represents the number of lymphocytes with one to four nuclei; NDI (Nuclear Division Index);NDI=(1MI+2MII+3MIII+4MIV)/1OOO cells counted in total. * - significantly increased compared to non-irradiatedsample pre-treated with the same radioprotector; \ - significantly increased compared to other irradiated samples (p<0.05;X2 - test).
3•oo
IEONN
oCD
oCDNJOO
VI. simpozij HDZZ, Stubičke Toplice, 2005
Table 2. Results of the SCE analysis in blood samples irradiated with y-radiationafter in vitro pre-treatment with radioprotectors amifostine, melatonin, and theircombination. Non-irradiated samples treated with the same radioprotectors werestudied simultaneously, and corresponding negative controls were also included.
Sample Mean SCE(100 cells)
SCErange
No. of celhM, M2
i inM3
PRI
IRRADIATED SAMPLES (absorbed dose = 2 Gy)AmifostineMelatonin
A + MControl
5.00 ±1.655.16± 1.454.721 1.736.97 + 2.24T
2-93-81-9
3-16
23222528
60675852
17111720
1.941.89L921.92
NON-IRRADIATED SAMPLESAmifostineMelatonin
A + MControl
4.05+ 1.344.42+ 1.723.73 ± 1.54*4.01 ± 1.40
1-81-91-71-8
22191715
62596564
16221821
1.942.032.012.06
For each sample mean SCE and standard deviations are listed. Mi, M2, and M 3 - number of cells infirst, second and third in vitro mitotic division. Proliferation Rate Index, PRI=(1M, +2M2. + 3M3)/!O0cells counted in total. | - significantly increased compared to other irradiated samples. *- significantlydecreased compared to non-irradiated sample pre-treated with melatonin; (p<0.05; ANOVA, post-hocScheffe test).
Distribution of SCE in irradiated (*) and non-irradiated samples
Figure 1. Distribution of SCE in blood samples pretreated with amifostine (A),melatonin (M), and their combination (A+M). (*) Irradiated samples; (C) negativecontrols.
198
VI. simpozij HDZZ, Stubičke Toplice, 2005
REFERENCES[1] Karbownik M and Reiter RJ. Antioxidative effects of melatoniri in protection against
cellular damage caused by ionizing radiation. Proc Soc Exp Biol Med 2000; 225:9-22.
[2] Vijayalaxmi, Reiter R, Tan DX, Herman TS and Thomas CR. Melatonin as aradioprotective agent: a review. Int J Radiation Oncology Biol Phys 2004;59(3):639-653.
[3] Lindegaard JC and Grau C. Has the outlook improved for amifostine as a clinicalradioprotector? Radiother Oncol 2000; 57:113-118.
[4] McCumber LM. The potential influence of cell protectors for dose escalation incancer therapy: an analysis of amifostine. Med Dosim 2004; 29(2):139-143.
[5] Fenech M, Morley AA. Measurement of micronuclei in lymphocytes. Mutat Res1985; 147:29-36.
[6] International Atomic Energy Agency (IAEA). Cytogenetic Analysis for RadiationDose Assessment. Technical Reports Series No. 405. Vienna: IAEA; 2001.
[7] Latt S, Allen J, Bloom SE, Carrano A, Falke E, Kram D, Schneider E, Schreck R,Tice R, Whitfield B and Wolff S. Sister chromatid exchanges: A report of the Gene-Tox Program. Mutat Res 1981; 87:17-62.
ABSTRACTRadioprotective effects of amifostine and melatonin on human peripheral
blood irradiated with y-rays were investigated using the micronucleus (MN) assayand the analysis of sister chromatid exchanges (SCE). Duplicate blood sampleswere pre-treated with amifostine (7.7 mM), melatonin (2 mM) and theircombination for 30 minutes. Negative controls were also included. After treatmentwith radioprotectors, one blood sample from each experimental group was exposedto y-rays from a 60Co source. The radiation dose absorbed was 2 Gy. Pre-treatedirradiated blood samples showed a decrease in the total number of MN and in thenumber of cells with more than one MN. Moreover, they also showed significantlylower mean SCE values. Our results indicate that amifostine, melatonin and theircombination in vitro have radioprotective effects on y-irradiated human peripheralblood lymphocytes, with no significant genotoxicity. Therefore, it may bereasonable to use them in combination, adjusting the doses of amifostine to achievethe best radioprotective effect with as few side effects as possible. Beforeemployment, this combination should be extensively tested in vitro and in vivo,using the same and other biomarkers for different radiation dose and concentrationranges of both radioprotectors.
199
VI. simpozij HDZZ, Stubičke Toplice,
EVALUATION OF CYTOGENETIC DAMAGE IN NUCLEARMEDICINE PERSONNEL OCCUPATIONALLY EXPOSED TO
LOW-LEVEL IONISING RADIATION
Vera Garaj-Vrhovac', Nevenka Kopjar1 and Mirjana Poropat2
'institute for Medical Research and Occupational Health, Ksaverska c. 2,HR-10000 Zagreb, Croatia
2Clinical Hospital Rebro, Kišpatićeva 12, HR-10000, Zagreb, Croatiae-mail: [email protected]
INTRODUCTIONOccupational exposure in nuclear medicine departments is mainly related to
low doses of particular ionising emissions from radioactive isotopes such as "mTc,1 3 1I, 3 2P, 67Ga, '"In, 201Tl, 59Fe, 57Co, 51Cr, 192Ir [1]. The source of this exposureconsists of two distinct types: (i) exposure to photon radiation that is emitted by theradioactivity retained by the patient that has not been absorbed within the patient,(ii) contact with radioactive secretions, excretions or tissue from the patient [2].Contrary to the patients, medical staff is usually exposed to much lower doses, butfor a longer period of time. All professional and technical staff in nuclear medicalfacilities are responsible for maintaining radiation exposure at ALARA (as low asreasonably achievable) levels. However, due to the ability of ionising radiation toinduce cellular damage, there is some level of risk for the development of geneticdamage after radiation exposure. The most fully developed biological indicators ofionising radiation exposure are unstable chromosomal aberrations (in particularlydicentrics) that can be detected in samples of peripheral blood lymphocytes [3,4].This methodology usually complements data obtained by physical dosimetry and isroutinely used whenever the individual dosimeter shows an exposure to penetratingradiation above its limit of detection. One of the advantages of cytogeneticdosimetry is that this biological dosimeter can be assessed at any moment, unlikephysical dosimeters that are not always present on the subject [5].
The aim of the present study was to provide data on the genetic hazards dueto the occupational exposure to low doses of ionising radiation in nuclear medicinedepartments by cytogenetic biodosimetry using the chromosome aberration test.
MATERIAL AND METHODSThe population under study was composed of 120 subjects: 60 of them had
been occupationally exposed to low-level ionising radiation and 60 wereunexposed control subjects. Exposed population was composed of 37 female and23 male subjects employed in the nuclear medicine departments, exposed toparticulate emissions from different radionuclides (most frequently 1 3 II and "mTc).The average age of the subjects was 42.5 years (range: 26-59 years). All exposed
200
VI. simpozij HDZZ, Stubičke Toplice, 2005
subjects completed a standardised questionnaire in which personal data, workingactivities, type and duration of occupational exposure at the time of the study, andinformation on exposure to possible confounding factors were recorded. Twentyexposed subjects were regular smokers (12 female and 8 male subjects), and 40 ofthem were non-smokers (25 female and 15 male subjects). Mean duration of theiroccupational exposure at the time of blood sampling was 15.8 years (range: 1-39years). All of them wore personal dosimeters. The effective dose received duringone month before blood sampling was 196 uSv per exposed subject (range: 0-1401uSv). The highest dose was recorded among technologists (305 uSv per subject;range: 0-1401 uSv), followed by cleaners (217 (iSv per subject; range: 0-1020uSv), engineers (149 uSv per subject; range: 0-360 uSv), nurses (64 uSv persubject; range: 0-270 uSv) and physicians (56 )nSv per subject; range: 0-500 uSv).The control population was composed of 60 matched blood donors (37 female and23 male subjects). They were chosen among healthy students and administrativeemployees. The average age of the control subjects was 41.8 (range: 25-59 years).20 of them were regular smokers (12 female and 8 male subjects), while 40 of themwere non-smokers (26 female and 14 male subjects). Peripheral blood sampleswere collected by venipuncture into heparinised tubes (Becton Dickinson, USA).The chromosome aberration test was performed in agreement with current IAEAguidelines [6]. Two hundred metaphases per subject were analysed forchromosomal aberrations. Total numbers and types of aberrations, as well as thepercentage of aberrant cells per each subject were evaluated. Statistical analyseswere carried out using Statistica software (StatSoft, Tulsa, USA). Multiplecomparisons between groups were done by means of multifactor ANOVA ontransformed data. Post-hoc analysis of differences was done by Scheffe test. Thelevel of statistical significance was set at p < 0.05. The correlations betweenconfounding factors and the parameters studied were also determined usingPearson's correlation matrices.
RESULTSIndividual results on the frequencies of chromosome aberrations (CA)
recorded in peripheral blood lymphocytes of occupationally exposed and controlsubjects have been displayed on Figure 1 (a,b). Table 1 reports group meanfrequencies of CA recorded among control and exposed subgroups.
There was a statistically significant difference between the mean frequenciesof CA in exposed medical workers (2.37 ±0.16 CA per 200 cells) and the controls(0.85 ± 0.09 CA per 200 cells) (p<0.01, ANOVA). Total percentage of aberrantcells was also significantly higher in exposed subjects (1.15 ± 0.08), compared tocontrol population studied (0.23 ± 0.06). Among the exposed group, marked inter-individual variations in aberration types were observed. Control subjects, on theother hand, had more homogenous distribution of CA in their peripheral bloodlymphocytes. Increased incidence of chromatid breaks was determined as a mean
201
VI. simpozij HDZZ, Stubičke Toplice, 2005
frequency of 1.40 ± 0.30 per 200 cells in exposed subjects, while controls had 0.55±0.08 chromatid breaks per 200 cells. The chromosome breaks were determinedwith a mean frequency of 0.33 ± 0.07 per 200 cells in exposed subjects, whilecontrols had 0.07 ± 0.03 chromosome breaks per 200 cells. The mean yield ofacentric fragments was 0.60 ± 0.09 per 200 cells in exposed subjects, whilecontrols had 0.23 ± 0.06 acentric fragments per 200 cells. Dicentrics were foundonly in two exposed technologists, while controls had no dicentrics at all. Themean yield of dicentric chromosomes in exposed subjects was 0.03 ± 0.02 per 200cells. The frequencies of chromosome aberrations were clearly enhanced in allexposed subjects. All categories of aberrations were found, but without significantinteraction between aberration type, gender, age and smoking habits. It should bestressed that between various occupations no statistically significant differences inmean frequencies of chromosome aberrations were found. Furthermore, nocorrelation was found between occupations, the time of exposure, whole-bodyradiation exposure records and the frequency of CA in individual cases. However,significant differences regarding to total number of CA recorded were seenbetween smoking (1.20 ± 0.19 CA / 200 cells) and non-smoking subpopulations(0.68 ± 0.10 CA / 200 cells) from the control.
CONCLUSIONIn present study a biomarker of effect (CA test) was used to evaluate initial
and residual lesions (unrepaired or erroneously repaired) in lymphocytes of nuclearmedicine workers. Despite of their limitations, our results indicate the possibility ofgenotoxic implications resulting from the occupational exposure to chronic lowdoses of ionising radiation in nuclear medicine departments. Staff from manydifferent specialties contribute to the work in nuclear medicine. Becausespecialized workers often tend to perform the same tasks, it is quite possible thatsome of them would exhibit higher levels of DNA damage. Therefore, nuclearmedicine physicians with higher percentage of CA, probably were involved insome specific procedures that could entail higher levels of exposures or they hadrepetitious high exposures. The results point to the significance of biologicalindicators providing information on the actual risk to the radiation exposedindividuals, as such data are lacking from physical dosimetry in many cases. Animportant advantage of biomarkers studied is that the individual radiation damageis measured which includes the variability of individual radiosensitivity. Accordingto our results, CA test is sensitive biomarker that can be used as additionalcomplement to physical dosimetry in regular health surveillances of occupationallyexposed radiation workers.
202
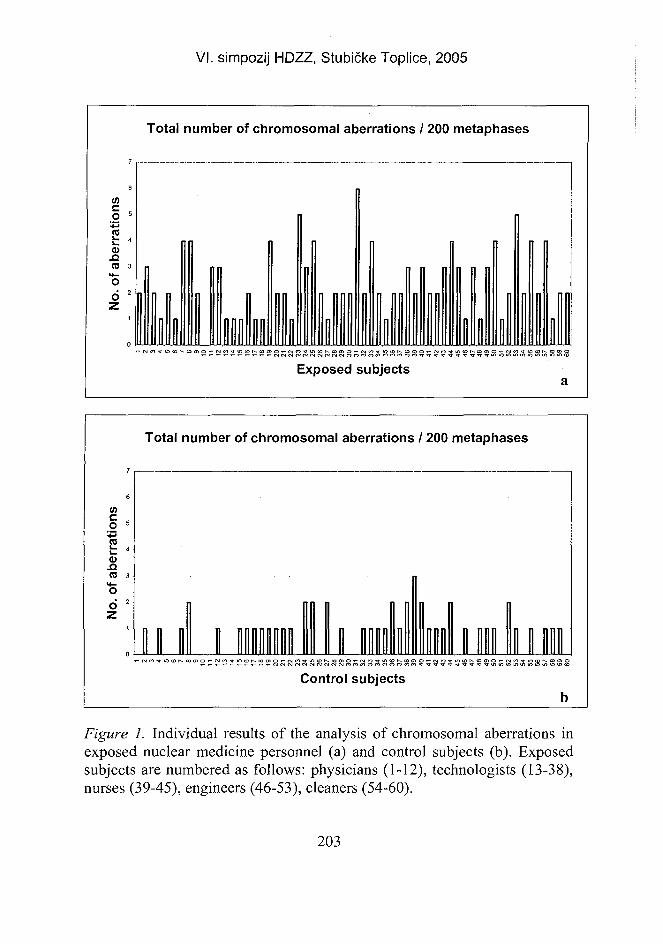
VI. simpozij HDZZ, Stubičke Toplice, 2005
Total number of chromosomal aberrations / 200 metaphases
7 _ ^ ,
in
1<D
TO 3
Oz
~]
Exposed subjects
Total number of chromosomal aberrations / 200 metaphases
(A
4
rat ••
re 3
o
Control subjects
Figure 1. Individual results of the analysis of chromosomal aberrations inexposed nuclear medicine personnel (a) and control subjects (b). Exposedsubjects are numbered as follows: physicians (1-12), technologists (13-38),nurses (39-45), engineers (46-53), cleaners (54-60).
203
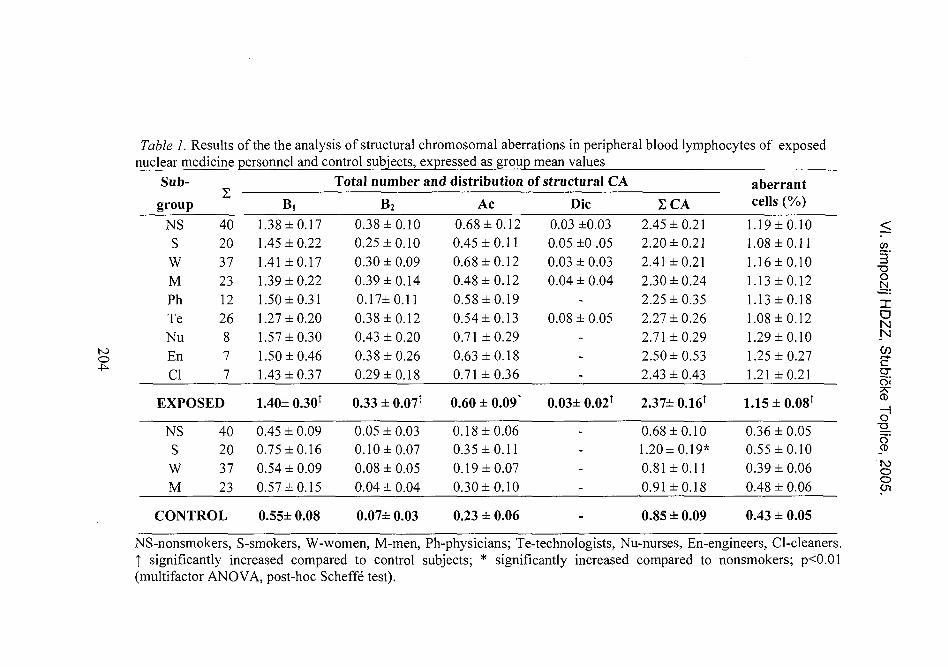
Table 1. Results of the the analysis of structural chromosomal aberrations in peripheral blood lymphocytes of exposednuclear medicine personnel and control subjects, expressed as group mean values
Sub-
groupNSS
wMPhTeNuEnCl
1
402037231226877
EXPOSED
NSS
wM
40203723
CONTROL
B,1.38 ± 0.171.45 ±0.221.41 ±0.171.39 ±0.221.50±0.311.27 ±0.201.57 ±0.301.50 ±0.461.43 ±0.37
1.40± 0.30T
0.45 ± 0.090.75 ±0.160.54 ±0.090.57 ±0.15
0.55± 0.08
Total number and
B2
0.38 ±0.100.25 ±0.100.30 ±0.090.39 ±0.140.17±0.110.38 ±0.120.43 ± 0.200.38 ±0.260.29 ±0.18
0.33 ± 0.07T
0.05 ± 0.030.10 ±0.070.08 ± 0.050.04 ± 0.04
0.07± 0.03
distribution
Ac0.68 ±0.120.45 ±0.110.68 ±0.120.48 ±0.120.58 ±0.190.54 ±0.130.71 ±0.290.63 ±0.180.71 ±0.36
0.60 ± 0.09r
0.18 ±0.060.35 ±0.110.19 ±0.070.30±0.10
0.23 ± 0.06
of structural CA
Die0.03 ±0.030.05 ±0 .050.03 ± 0.030.04 ± 0.04
-
0.08 ± 0.05---
0.03± 0.02T
----
-
ICA2.45 ±0.212.20 ±0.212.41 ±0.212.30 ±0.242.25 ±0.352.27 ±0.262.71 ±0.292.50 ±0.532.43 ± 0.43
2.37± 0.16T
0.68 ±0.101.20±0.19*0.81 ±0.110.91 ±0.18
0.85 ± 0.09
aberrantcells (%)
1.19 ± 0.101.08 ± 0.111.16 ± 0.101.13 ± 0.121.13 ± 0.181.08±0.121.29 ± 0.101.25 ±0.271.21 ±0.21
1.15±0.08T
0.36 ±0.050.55 ±0.100.39 ±0.060.48 ± 0.06
0.43 ± 0.05
<
co3oN
oNN
'a
oo
NS-nonsmokers, S-smokers, W-women, M-men, Ph-physicians; Te-technologists, Nu-nurses, En-engineers, Cl-cleaners.t significantly increased compared to control subjects; * significantly increased compared to nonsmokers; pO.Ol(multifactor ANOVA, post-hoc Scheffe test).
VI. simpozij HDZZ, Stubičke Toplice, 2005
REFERENCES[I] Bozkurt G, Yuksel M, Karabogaz G, Sut N, Savran OF, Palanduz S, Yigitbasi ON,
Algunes C. Sister chromatid exchanges in lymphocytes of nuclear medicinephysicians. Mutat Res 2003; 535:205-213.
[2] Mountford PJ, O'Doherty MJ. Exposure of critical groups to nuclear medicinepatients. Appl Radiat Isotopes 1999; 50: 89-111.
[3] Bender MA, Awa AA, Brooks AL, Evans HJ, Groer PO, Littlefield LG, Pereira C,Preston J, Wachholz BW. Current status of cytogenetic procedures to detect andquantify previous exposure to radiation. Mutat Res 1988; 196:103-159.
[4] Bauchinger M. Quantification of low-level radiation exposure by conventionalchromosome aberration analysis. Mutat Res 1995; 339:177-189.
[5] International Atomic Energy Agency (IAEA). Cytogenetic Analysis for RadiationDose Assessment. Technical Report Series No. 405. Vienna: IAEA; 2001.
[6] Ramalho AT, Costa MLP, Oliveira MS. Conventional radiation-biologicaldosimetry using frequencies of unstable chromosome aberrations. Mutat Res 1998;404:97-100.
ABSTRACTDespite intensive research over the last few decades, there still remains
considerable uncertainty as to the genetic impact of ionising radiation on humanpopulations, particularly at low levels. The aim of this study was to provide data ongenetic hazards associated with occupational exposure to low doses of ionisingradiation in nuclear medicine departments. The assessment of DNA damage inperipheral blood lymphocytes of medical staff was performed using thechromosome aberration (CA) test. Exposed subjects showed significantly higherfrequencies of CA than controls. There were significant inter-individual differencesin DNA damage within the exposed population, indicating differences in genomesensitivity. Age and gender were not confounding factors, while smoking enhancedthe levels of DNA damage only in control subjects. The present study suggests thatchronic exposure to low doses of ionising radiation in nuclear medicinedepartments causes genotoxic damage. Therefore, to avoid potential genotoxiceffects, the exposed medical personnel should minimise radiation exposurewherever possible. Our results also point to the significance of biological indicatorsproviding information about the actual risk to the radiation exposed individuals.
205
HR0500053VI.•simpozij HDZZ, Stubičke Toplice,
EVALUATION OF CHROMOSOMAL ABERRATIONS INRADIOLOGISTS AND MEDICAL RADIOGRAPHERS
CHRONICALLY EXPOSED TO IONISING RADIATION
Vilena Kašuba', Ružica Rozgaf and Anamarija Jazbec2
'institute for Medical Research and Occupational Health, Ksaverska c.2,HR-10000 Zagreb, Croatia
2Faculty of Forestry, University of Zagreb, Svetošimunska c. 25HR-10000 Zagreb, Croatia
e-mail: [email protected]
INTRODUCTIONFor several decades chromosome aberration analysis in human peripheral blood
lymphocytes has been successfully used to examine people working in ionisingradiation zone [1], and it is well established that they provide the most sensitiveand reliable method for biological dosimetry [2,3].
Literature data reported higher frequencies of chromosomal aberrations inradiation workers compared to controls, even if their exposure was lower thanpermissible level [4-6]. Several cytogenetic studies have shown an increase ofchromosome abnormalities in lymphocytes from radiologists exposed to low dosesof X- or gamma-rays [7-10].
In this work we want to evaluate the late cytogenetic effect that exposure tolow-doses of ionising X-radiation had on chromosomes of radiologists and medicalradiographers compared to control subjects.
MATERIAL AND METHODSThe subjects of in this study were selected according to a questionaire, detailing
personal, medical and occupational history such as age, sex, job title, years ofemployment, smoking habits, and diagnostic X-ray exposure. Smoking index foran individual was equal to product of the average number of cigarettes smoked perday and duration (in years) of tobacco smoking.The sample of exposed subjectswas divided into two groups. First group consited of 90 medical radiographers ( 41females and 49 males) and second group consists of 90 radiologists (38 femalesand 52 males) between the ages of 26 and 63. Nighty healthy adults (43 femalesand 47 males) age range: 27 - 57 years served as controls. For chromosomeanalysis, 48-hour cultures were prepared using standard cytogenetic method.Coded slides were stained with 5% Giemsa and scored 200 metaphases from eachperson for unstable chromosomal aberrations. Chromosomal aberrations wererecorded separately: chromatid and chromosome breaks, acentric fragments,dicentric and ring chromosomes and chromosomal exchanges (triradials and
206
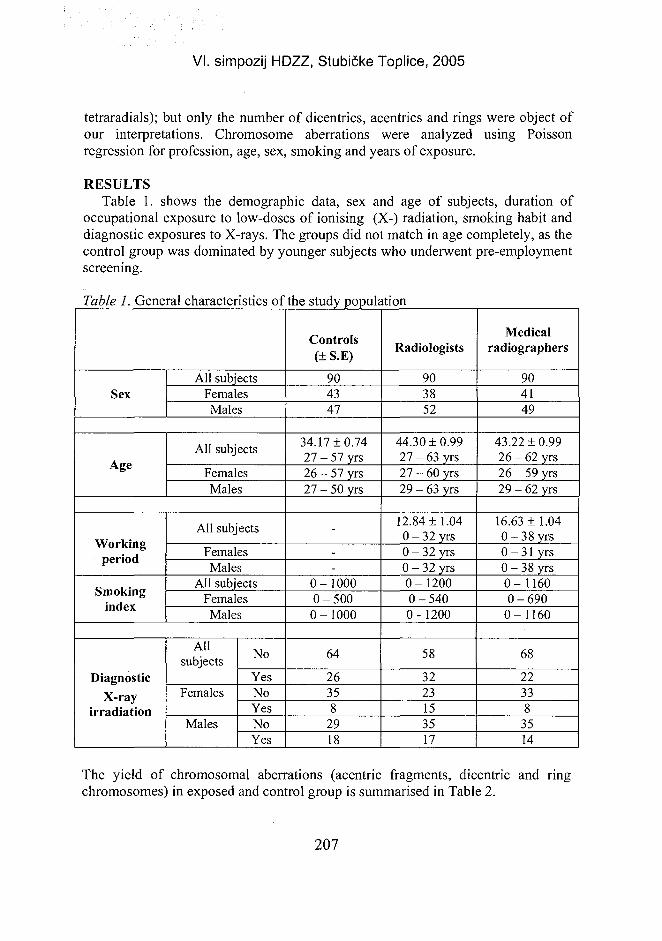
VI. simpozij HDZZ, Stubičke Toplice, 2005
tetraradials); but only the number of dicentrics, acentrics and rings were object ofour interpretations. Chromosome aberrations were analyzed using Poissonregression for profession, age, sex, smoking and years of exposure.
RESULTSTable 1. shows the demographic data, sex and age of subjects, duration of
occupational exposure to low-doses of ionising (X-) radiation, smoking habit anddiagnostic exposures to X-rays. The groups did not match in age completely, as thecontrol group was dominated by younger subjects who underwent pre-employmentscreening.
Table I. General characteristics of the study population
SexAll subjects
FemalesMales
AgeAll subjects
FemalesMales
Workingperiod
Smokingindex
All subjects
FemalesMales
All subjectsFemales
Males
DiagnosticX-ray
irradiation
Allsubjects
Females
Males
No
YesNoYesNoYes
Controls(±S.E)
904347
34.17 + 0.7427 - 57 yrs26 - 57 yrs27 - 50 yrs
-
--
0-10000-5000-1000
64
26358
2918
Radiologists
903852
44.30 ±0.9927 - 63 yrs27 - 60 yrs29 - 63 yrs
12.84 ± 1.040-32 yrs0 - 32 yrs0 - 32 yrs0-12000-5400- 1200
58
3223153517
Medicalradiographers
904149
43.22 ±0.9926 - 62 yrs26 - 59 yrs29 - 62 yrs
16.63 ±1.040-38 yrs0-31 yrs0-38 yrs0-11600-690
0-1160
68
22338
3514
The yield of chromosomal aberrations (acentric fragments, dicentric and ringchromosomes) in exposed and control group is summarised in Table 2.
207
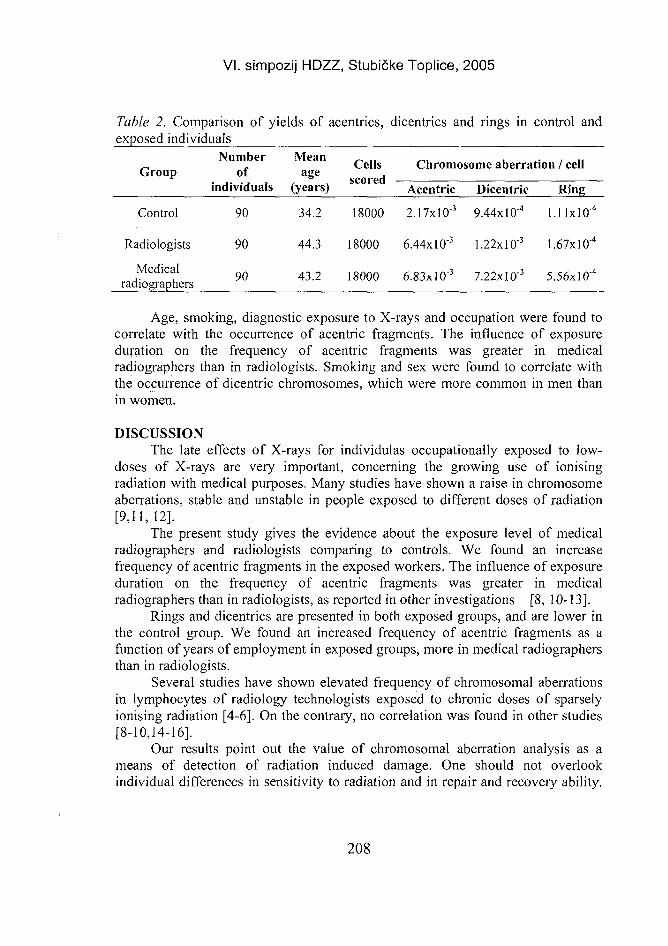
VI. simpozij HDZZ, Stubičke Toplice, 2005
Table 2. Comparison of yields of acentrics, dicentrics and rings in control andexposed individuals
GroupNumber
ofMean
ageindividuals (years)
Cellsscored
Chromosome aberration / cell
Acentric Dicentric Ring
Control
Radiologists
Medicalradiographers
90 34.2 18000 2.17xlO'3 9.44xlO4 1.11x10""
90 44.3 18000 6.44xlO-3 1.22xlO"3 1.67xlO"4
90 43.2 18000 6.83xl03 7.22xlO"3 5.56xlO"4
Age, smoking, diagnostic exposure to X-rays and occupation were found tocorrelate with the occurrence of acentric fragments. The influence of exposureduration on the frequency of acentric fragments was greater in medicalradiographers than in radiologists. Smoking and sex were found to correlate withthe occurrence of dicentric chromosomes, which were more common in men thanin women.
DISCUSSIONThe late effects of X-rays for individulas occupationally exposed to low-
doses of X-rays are very important, concerning the growing use of ionisingradiation with medical purposes. Many studies have shown a raise in chromosomeaberrations, stable and unstable in people exposed to different doses of radiation[9,11,12].
The present study gives the evidence about the exposure level of medicalradiographers and radiologists comparing to controls. We found an increasefrequency of acentric fragments in the exposed workers. The influence of exposureduration on the frequency of acentric fragments was greater in medicalradiographers than in radiologists, as reported in other investigations [8, 10-13].
Rings and dicentrics are presented in both exposed groups, and are lower inthe control group. We found an increased frequency of acentric fragments as afunction of years of employment in exposed groups, more in medical radiographersthan in radiologists.
Several studies have shown elevated frequency of chromosomal aberrationsin lymphocytes of radiology technologists exposed to chronic doses of sparselyionising radiation [4-6]. On the contrary, no correlation was found in other studies[8-10,14-16].
Our results point out the value of chromosomal aberration analysis as ameans of detection of radiation induced damage. One should not overlookindividual differences in sensitivity to radiation and in repair and recovery ability.
208
VI. simpozij HDZZ, Stubičke Toplice, 2005
That is why the pre-employment analysis for every subject who is going to startwork in controlled area should be also necessary.
REFERENCES[I] Romm H, Stephan G. Chromosome analysis - a routine method for quantitative
radiation dose assessment. Kerntechnick 1990; 55(4):2I9-225.[2] Bauchinger M. Quantification of low-level radiation exposure by conventional
chromosome aberration analysis. Mutat Res 1995; 339:177-189.[3] Edwards AA. The use of chromosomal aberrations in human lymphocytes for
biological dosimetry. RadiatRes 1997; 148:39-44.[4] Mozdarani H, Samavat H. Cytogenetic biomonitoring of 65 radiology
technologists occupationally exposed to chronic doses of X-irradiation in Iran.MedJIrn. 1996; 10:43-6.
[5] Kumagai E, Tanaka R, Kumagai T, Onomichi M, Sawada S. Effects of long-termradiation exposure on chromosomal aberrations in radiological technologists. JRadiatRes. 1990; 31:270-9.
[6] Paz-y-Mino C, Leone PE, Chavaz M, et al. Follow-up study of chromosomeaberrations in lymphocytes in hospital workers occupationally exposed to lowlevels of ionizing radiation. Mutat Res 1995; 335:245-51.
[7] Maznik NA. Cytogenetic study of peripheral blood lymphocytes in theoccupational irradiation of medical radiologists. Tsitol Genet 1987; 21:437-440.
[8] Bigatti P, Lamberti L, Ardito G, Armellino F. Cytogenetic monitoring of hospitalworkers exposed to low-level ionizing radiation. Mutat Res 1988; 204:343-347.
[9] Jha AN, Sharma T. Enhanced frequency of chromosome aberrations in workersoccupationally exposed to diagnostic X-rays. Mutat Res 1991; 260:343-348.
[10] Barquinero JF, Barrios L, Carballin MR, Ribas M, Subias A, Egozcue J.Cytogenetic analysis of lymphocytes from hospital workers occupationallyexposed to low levels of ionizing radiation. Mutat Res 1993; 286:275-279.
[II] Awa AA. Persistent chromosome aberrations in the somatic cells of A-bombsurvivors, Hiroshima and Nagasake, J Radiat Res suppl, 1991; 265-275.
[12] Bauchinger M, Eckerl H, Drexler G, Streng S, Schmid E. Chromosome dosimetryand occupational radiation exposure. Radiat Protect Dosimetry 1984; 9:93-97.
[13] Fuks Z, and Weichselbaum RR. Radiation therapy, In: Mendelson J, Howley P,Israel MA, Liotta LA. (Eds.), The molecular basis of cancer, Saunders,Philadelphia, 1995; pp.401-431.
[14] Bauchinger M, Kolin-Gerresheim J, Schmid E, Dresp J (1980) Chromosomeanalyses of nuclear power-plant workers. Int J Radiat Biol 38:577-581.
[15] Balasem AN, Ali A-Sk, Mosa HS, Hussain KO (1992) Chromosomal aberrationanalysis in peripheral lymphocyttes of radiation workers. Mutat Res 271:209-211.
[16] Braselmann H, Schmid E, Bauchinger M. Chromosome aberrations in nuclearpower plant workers: The influence of dose accumulation and lymphocyte life-time. Mutat Res 1994; 306:197-202.
209
Vi. simpozij HDZZ, Stubičke Toplice, 2005
ABSTRACTChromosomal aberrations are fairly reliable indicators of damage induced by
ionising radiation. This study included 180 radiologists and medical radiographers(technicians) and 90 controls who were not occupationally exposed to ionisingradiation. All exposed subjects were routinely monitored with film badge, and nonewas exposed to a radiation dose exceeding the limit for occupational exposurerecommended by the International Commission on Radiological Protection (ICRP).Two hundred metaphases for each person were scored. The frequencies of acentricfragments, dicentrics, ring chromosomes and chromosomal exchanges weredetermined and compared to those obtained in the control group. Chromosomeaberrations were analysed using Poisson regression for profession, age, sex,smoking and years of exposure. Age, smoking, diagnostic exposure to X-rays andoccupation were found to correlate with the occurrence of acentric fragments. Theinfluence of exposure duration on the frequency of acentric fragments was greaterin medical radiographers than in radiologists. Smoking and sex were found tocorrelate with the occurrence of dicentric chromosomes, which were more commonin men than in women. As chromosome aberrations exceeded the expected levelwith respect to the absorbed dose, our findings confirm the importance ofchromosome analysis as a part of regular medical check-up of subjectsoccupationally exposed to ionising radiation.
210
HR0500054
VI. simpozij HDZZ, Stubičke Toplice, *_v,v,~
CHROMOSOME ABERRATIONS - THE MOST RELIABLEBIOLOGICAL INDICATOR OF EXPOSURE TO LOW DOSES
OF IONISING RADIATION
Ružica Rozgaj and Vilena KašubaInstitute for Medical Research and Occupational Health, Ksaverska c. 2,
HR-10000, Croatiae-mail: [email protected]
INTRODUCTIONRecent years much effort has been made to define harmful exposure
conditions to ionising radiation and to monitor populations that could be sufferingexcessive exposure, to prevent adverse consequences. Radiation protectionstandards assume that radiation doses over natural background doses causeadditional health risks, notably increase in the induction of cancers [1]. The mainsource of data on radiation risk comes from studies on Hiroshima and Nagasakisurvivors, subjects exposed to high radiation doses in accidents or patientsirradiated for medical reasons. The effects of chronic exposure to low doses ofradiation are still not completely clear.
Monitoring of personnel occupationally exposed to ionising radiationconsists of regular film dosimetric control and periodic health examination. Thefollow-up of certain specific biological parameters provides additional informationwhich complements physical dosimetry and enables better evaluation of radiationeffects. Even very low radiation doses of several mSv may cause changes in tissuesand organs. While tissues greatly differ in sensitivity to irradiation, it is alsoimportant to distinguish whether an organism received a single, higher dose ofirradiation or several dose fractions. The tolerance to fractionated irradiation ishigher because most tissues have great capacity to recover unless permanentlyinjured. Therefore, minor damages will never be observed. Genetic material in aliving organism is particularly sensitive to irradiation. Mutagenic effect of ionisingradiation has been extensively described. Monitoring studies have been accepted asparameters to evaluate the damage caused by ionising radiation on exposedprofessionals [2]. DNA damage caused by ionising radiation may be detectedimmediately after the exposure by the comet assay. It may also turn intochromosome damage.
METHODSChromosomal aberration (CA) analysis in human peripheral blood
lymphocytes is an important technique for risk assessment in occupationalexposure. Chromosome aberrations may be divided into two categories: stable or
211
VI. simpozij HDZZ, Stubičke Toplice, 2005
symmetrical aberrations (pericentric inversions and translocations) which can passthrough repeated divisions and persist in a cell population, and are potentially moreserious, and unstable or asymmetrical aberrations (dicentrics, acentric fragmentsand ring chromosomes) in which the chromosome material does not divide equallybetween daughter cells so that damaged cells will be eliminated during successivecell divisions.
It is considered that stable and unstable aberrations are induced with equalfrequency, but unstable aberrations appear to be less frequent in subsequentdivisions because they lead to cell death [3,4]. As cells bearing dicentrics declineabout 60% per cell generation, it has been shown that translocations are also notcompletely stable. Translocations also decline in cells, but much more slowly thandicentrics [5]. Fluorescence in situ hybridization (FISH) using whole-chromosomepainting probes enables, in addition to asymmetrical aberrations, the detection ofsymmetrical aberrations, most notably translocations. But due to a high cost of thatmethod, it is not possible to use it for a routine examination of all professionalshandling ionising radiation sources.
RESULTSConventional chromosome aberrations analysis is limited to unstable
aberrations. Dicentric chromosomes were reported to increase at doses as low as 20mGy [6]. Chromosome damages are long lasting and are and are visible even yearsafter irradiation. Follow-up studies of subjects with partial body irradiationdemonstrated that these aberrations were present in lymphocytes even three yearsafter exposure. However, it has been shown that rate of unstable aberrationsdeclines 50% per year in the first 2-3 years [7]. Chromosome dosimetry isconsidered to be a useful biological technique in radiobiological protection notonly in accidental cases, but also in estimating exposure of medical and industrialworkers to ionising radiation when the physical dose is uncertain.
The analysis of chromosome aberrations has been obligatory in medicalexamination of personnel handling radiation sources in Croatia more than 20 years.According to the Croatian Public Health Act, a preemployment check-up forsubjects that are going to work in controlled area includes CA analysis. The resultsof several follow-up studies have been published. Our results show an increase inCA in exposed subjects when compared to control (Table 1.). Statistical evaluationof data showed the positive correlation with a dose and duration of exposure, butthe doses registered by dosimeters over the past year were below the annualmaximum permissible limit. Our results are in agreement with some other authorsresults [11,12].
212
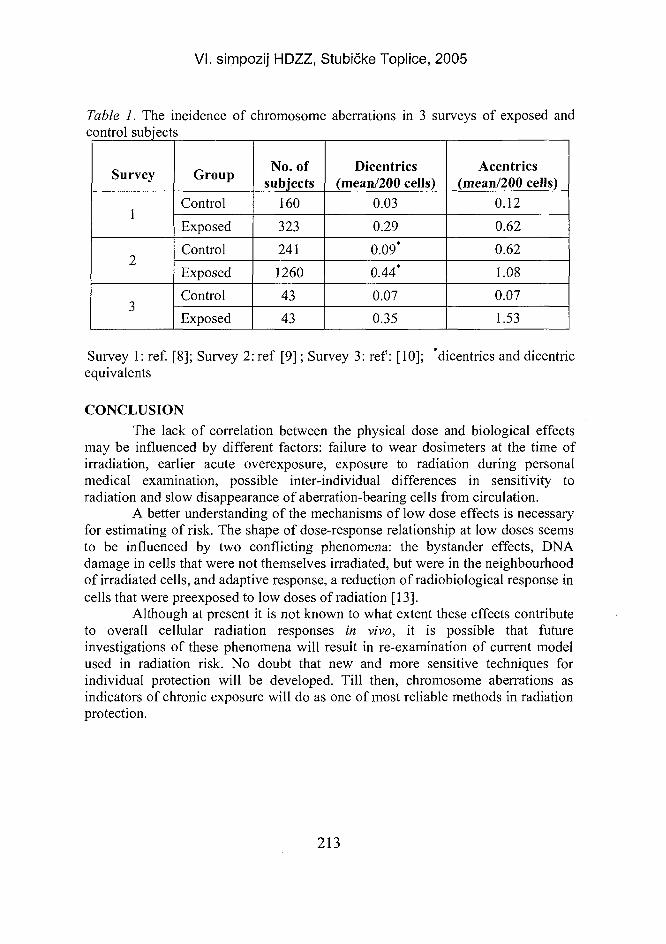
VI. simpozij HDZZ, Stubičke Toplice, 2005
Table 1. The incidence of chromosome aberrations in 3 surveys of exposed andcontrol subjects
Survey
1
2
3
Group
Control
Exposed
Control
Exposed
Control
Exposed
No. ofsubjects
160
323
241
1260
43
43
Dicentrics(mean/200 cells)
0.03
0.29
0.09*r 0.44*
0.07
0.35
Acentrics(mean/200 cells)
0.12
0.62
0.62
1.08
0.07
1.53
Survey 1: ref. [8]; Survey 2:ref [9]; Survey 3: ref: [10]; 'dicentrics and dicentricequivalents
CONCLUSIONThe lack of correlation between the physical dose and biological effects
may be influenced by different factors: failure to wear dosimeters at the time ofirradiation, earlier acute overexposure, exposure to radiation during personalmedical examination, possible inter-individual differences in sensitivity toradiation and slow disappearance of aberration-bearing cells from circulation.
A better understanding of the mechanisms of low dose effects is necessaryfor estimating of risk. The shape of dose-response relationship at low doses seemsto be influenced by two conflicting phenomena: the bystander effects, DNAdamage in cells that were not themselves irradiated, but were in the neighbourhoodof irradiated cells, and adaptive response, a reduction of radiobiological response incells that were preexposed to low doses of radiation [13].
Although at present it is not known to what extent these effects contributeto overall cellular radiation responses in vivo, it is possible that futureinvestigations of these phenomena will result in re-examination of current modelused in radiation risk. No doubt that new and more sensitive techniques forindividual protection will be developed. Till then, chromosome aberrations asindicators of chronic exposure will do as one of most reliable methods in radiationprotection.
213
VI. simpozij HDZZ, Stubičke Toplice, 2005
REFERENCES[J] Brenner DJ, Doll R, Goodhead DT, Hali EJ, Land CE, Little JB, Lubin JH, Preston
DL, Preston RJ, Puskin JS, Ron E, Sachs RK, Samet JM, Setlow RB, Zaider M.Cancer risks attributable to low doses of ionizing radiation: Assessing what we reallyknow. Appl Biol Sci 2003;100:13761-13766.
[2] Bonassi S, Forni A, Bigatti P, Canevarollo N, De Ferrari M, Lando C, Padovani P,Bevegni M, Stella M, Vecchio D, Puntoni R. Chromosome aberrations in hospitalworkers: evidence from surveillance studies in Italy. Am J Ind Med 1997;31:353-360.
[3] Natarajan AT, Balajee AS, Boei JJWA Darroudi F, Dominguez I, Hande MP,Meijers M, Slijepcevic P, Vermeulen S, Xiao Y. Mechanism of induction ofchromosomal aberrations and their detection by fluorescence in situ hybridization.MutatRes 1996;372:247-258.
[4] Stephan G, Pressl S 1997. Chromosome aberrations in human lymphocytes analysedby fluorescence in situ hybridization after in vitro irradiation, and in radiationworkers. Int J Radiat Biol 71:293-299
[5] Hoffmann GR, Sayer AM, Joiner EE, McFee AF, Littlefield G. Analysis by FISH ofthe Spectrum of the Chromosome aberrations induced by x-rays in Go humanlymphocytes and their fate through mitotic divisions in culture. Environ MolMutagen 1999;33:94-110.
[6] Lloyd DC, Edwards AA, Leonard A, Deknudt Gh, Verschaeve L, Natarajan A,Darroudi F, Obe G, Paliti F, Tanzarella C, Tawn EJ. Chromosomal aberrations inhuman lymphocytes induced in vitro by very low doses of X-rays. Int J Radiat Biol1992; 61:335-343.
[7] Evans HJ. Cytogenetic and allied studies in populations exposed to radiations andchemical agents, In: Woodhead AD,. Shellabarger CJ, Bond V, Hollander A eds.Assessment of Risk from Low-Level Exposure to Radiation and Chemicals, NewYork: Plenum, 1985. pp 429-451.
[8] Rozgaj R. Kašuba V, Šentija K, Prlić I Radiation-induced chromosome aberrationsand haematological alterations in hospital workers. Occup Med 1999;49: 353-360.
[9] Rozgaj R, Kašuba V. Šimić D. The frequency of dicentrics and acentrics and theincidence of rogue cells in radiation workers. Mutagenesis 2002;17: 135-139.
[10] Rozgaj R, Kašuba V, Trošić I, Jazbec A. chromosomal damages in industrialradiographers; unpublished results
[11] Lloyd DC, Purrot RJ, Reeder EJ. The incidence of unstable chromosome aberrationsin peripheral blood lymphocytes from unirradiated and occupationally exposedpeople. Mutat Res 1980;72:523-532.
[12] Paz-y-Mifio C, Leone PE, Chavez M, Bustamante G, Cordova A, Gutierrez S,Penaherrera MS Sanchez ME.) Follow up study of chromosome aberrations inlymphocytes in hospital workers occupationally exposed to low levels of ionizingradiation. Mutat Res 1995; 335:245-251.
[13] Zhou H, Randers-Pehrson G, Waldren CA, Hei TK. (2004Radiation-inducedbystander effect and adaptive response in mammalian cells. Advances in SpaceResearch 2004; 34:1368-1372.
214
VI. simpozij HDZZ, Stubičke Toplice, 2005
ABSTRACT
Numerous cytogenetic studies have shown an increase in lymphocytechromosome damages in radiation workers exposed to low doses (<0.1 Gy) ofionising radiation. Chromosome aberration frequency provides the most reliablebiomarker of radiation dose. Dosimetric studies in occupationally exposedpopulations in which cytogenetic markers were used showed contradictory results.Some showed a correlation between chromosomal aberration frequency and theabsorbed dose, whereas the majority found no correlation whatsoever. Most resultsshow that low doses produce more aberrations than expected when oneextrapolates dose-response curves from higher doses. It was shown that inpopulations exposed to low doses of ionising radiation different factors mightinfluence aberration yield such as the induction of DNA repair enzymes, half-lifeof lymphocytes, age, sex, smoking and duration of exposure. The analysis ofchromosome aberrations has a great importance in evaluating individual risk ofionising radiation. Periodic controls of professionals chronically exposed to lowdoses of ionising radiation significantly contribute to their protection.
215
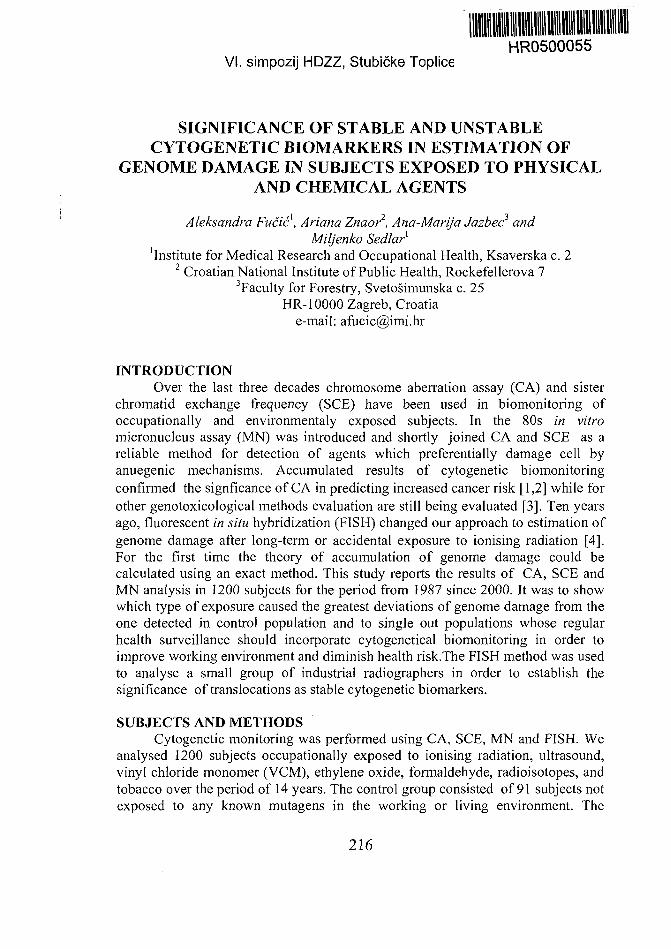
•11HR0500055
VI. simpozij HDZZ, Stubičke Toplice
SIGNIFICANCE OF STABLE AND UNSTABLECYTOGENETIC BIOMARKERS IN ESTIMATION OF
GENOME DAMAGE IN SUBJECTS EXPOSED TO PHYSICALAND CHEMICAL AGENTS
Aleksandra Fučićx, Ariana Znaor2, Ana-Marija Jazbec3 andMiljenko Sedlah
'institute for Medical Research and Occupational Health, Ksaverska c. 22 Croatian National Institute of Public Health, Rockefellerova 7
3Faculty for Forestry, Svetošimunska c. 25HR-10000 Zagreb, Croatia
e-mail: [email protected]
INTRODUCTIONOver the last three decades chromosome aberration assay (CA) and sister
chromatid exchange frequency (SCE) have been used in biomonitoring ofoccupationally and environmentaly exposed subjects. In the 80s in vitromicronucleus assay (MN) was introduced and shortly joined CA and SCE as areliable method for detection of agents which preferentially damage cell byanuegenic mechanisms. Accumulated results of cytogenetic biomonitoringconfirmed the signficance of CA in predicting increased cancer risk [1,2] while forother genotoxicological methods evaluation are still being evaluated [3]. Ten yearsago, fluorescent in situ hybridization (FISH) changed our approach to estimation ofgenome damage after long-term or accidental exposure to ionising radiation [4].For the first time the theory of accumulation of genome damage could becalculated using an exact method. This study reports the results of CA, SCE andMN analysis in 1200 subjects for the period from 1987 since 2000. It was to showwhich type of exposure caused the greatest deviations of genome damage from theone detected in control population and to single out populations whose regularhealth surveillance should incorporate cytogenetical biomonitoring in order toimprove working environment and diminish health risk.The FISH method was usedto analyse a small group of industrial radiographers in order to establish thesignificance of translocations as stable cytogenetic biomarkers.
SUBJECTS AND METHODSCytogenetic monitoring was performed using CA, SCE, MN and FISH. We
analysed 1200 subjects occupationally exposed to ionising radiation, ultrasound,vinyl chloride monomer (VCM), ethylene oxide, formaldehyde, radioisotopes, andtobacco over the period of 14 years. The control group consisted of 91 subjects notexposed to any known mutagens in the working or living environment. The
216
VI. simpozij HDZZ, Stubičke Toplice, 2005
exposed and control subjects included both sexes. Ionising radiation was monitoredby film dosimeters. None of the subjects included in the study was overexposed .The dose never exceeded 50 mSv per year. In the study 542 subjects wereoccupationally exposed to X rays, 96 to vinyl chloride monomer (VCM), 63 toantineoplastic drugs, 115 subjects worked on the jobs of non destructuve testing, 32were exposed to X rays and ultrasound in medicine, 134 to radioisotopes and 36subjects worked in nuclear plant during the maintance. The 48h cell cultures forCA were slides prepared according to the conventional method [5]. For SCEcultures were harvested after 72h. [6]. For the analysis of MN frequency the slideswere prepared according to Fenech and Morley [7]. FISH was performed on 48hcultures prepared using the same protocol as for CA. Probes (Cytocell, UK) wereused for chromosomes 1,2 and 4. Genome equivalent was calculated according toLucas et al [4]. For statistics we used Poisson regression. The control group servedas the baseline. Poisson regression was done for each type of chromosomeaberration. All analysis were performed using the SAS 6.12.
RESULTSIn populations occupationally exposed to physical agents the highest
frequency of chromosome aberrations was detected in those subjects exposed toionising radiation and ultrasound in industrial radiography. This group showed asignificant increase in chromatid breaks, chromosome breaks, acentrics, dicentricsand ring chromosomes (Table 1). Although all examined groups exposed tophysical and chemical agents had a significantly higher frequency of dicentric andring chromosomes, subjects with temporally assignment in nuclear plantmaintenance showed the highest frequency of 0.38%.
The Table 2 shows that the MN frequency was the highest in subjectsexposed to the combined action of ionising radiation and ultrasound. In regard toexposure to chemical agents siginificant deviations were observed in the groupexposed to VCM and antineoplastic drugs. Eight subjects occupationally exposedto gamma radiation (192Ir, I37Cs) were analysed using the chromosome aberrationassay over a period of two years. FISH was used when chromosome aberrationfrequencies did not deviated from control values. Our results show that the averageof translocation frequency was 0.022/ cell which is significantly different fromhistorical control 0.003/cell. Translocation frequency does not correlate with yearsof employment. The highest frequency of SCE was detected in the group ofsubjects exposed to VCM 9.2 per cell.
217
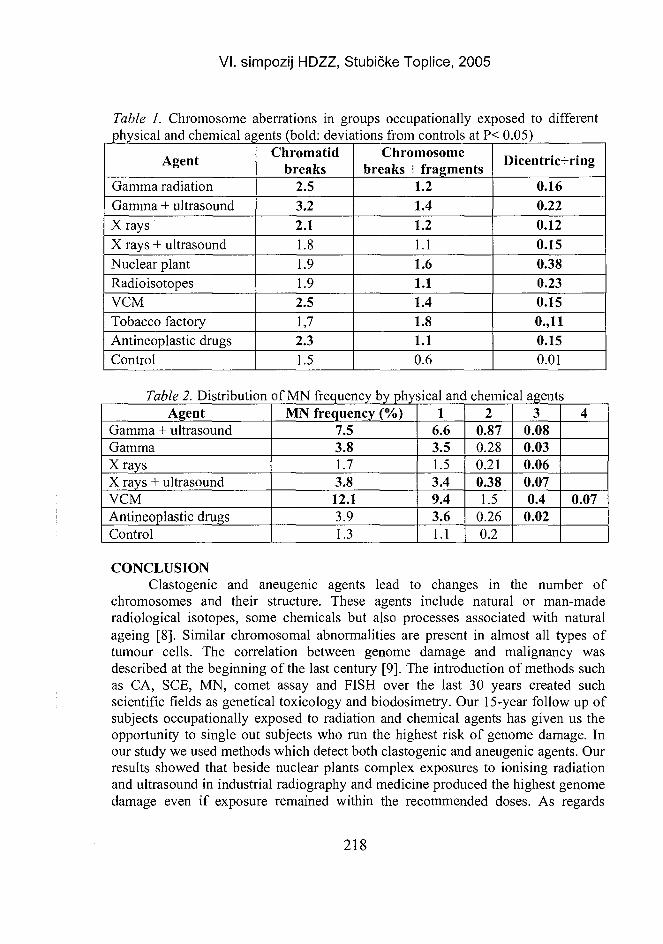
VI. simpozij HDZZ, Stubičke Toplice, 2005
Table 1. Chromosome aberrations in groups occupationally exposed to differentphysical and chemical agents (bold: deviations from controls at P< 0.05)
Agent
Gamma radiationGamma + ultrasoundX raysX rays + ultrasoundNuclear plantRadioisotopesVCMTobacco factoryAntineoplastic drugsControl
Chromatidbreaks
2.53.22.11.81.91.92.51,72.31.5
Chromosomebreaks + fragments
1.21.41.21.11.61.11.41.81.10.6
Dicentric+ring
0.160.220.120.150.380.230.150.,ll0.150.01
Table 2. Distribution of MN frequency by physical and chemical agentsAgent
Gamma + ultrasoundGammaXraysX rays + ultrasoundVCMAntineoplastic drugsControl
MN frequency (%)7.53.81.73.812.13.91.3
16.63.51.53.49.43.61.1
20.870.280.210.381.5
0.260.2
30.080.030.060.070.4
0.02
4
0.07
CONCLUSIONClastogenic and aneugenic agents lead to changes in the number of
chromosomes and their structure. These agents include natural or man-maderadiological isotopes, some chemicals but also processes associated with naturalageing [8]. Similar chromosomal abnormalities are present in almost all types oftumour cells. The correlation between genome damage and malignancy wasdescribed at the beginning of the last century [9]. The introduction of methods suchas CA, SCE, MN, comet assay and FISH over the last 30 years created suchscientific fields as genetical toxicology and biodosimetry. Our 15-year follow up ofsubjects occupationally exposed to radiation and chemical agents has given us theopportunity to single out subjects who run the highest risk of genome damage. Inour study we used methods which detect both clastogenic and aneugenic agents. Ourresults showed that beside nuclear plants complex exposures to ionising radiationand ultrasound in industrial radiography and medicine produced the highest genomedamage even if exposure remained within the recommended doses. As regards
218
VI. simpozij HDZZ, Stubičke Toplice, 2005
chemical agents the situation is much more complex as personal dosimeters forchemical agents are not available for all known carcinogens, or are too expensive.Our study showed significant deviations in CA, MN and SCE in the group exposedto VCM and antineoplastic drugs. In most cases CA and MN frequency are incorrelation. Occupational exposure in industry and medicine has become morecomplex due to application of new sources of ionising radiation, ultrasound andelectromagnetic fields posing increasing demands on biodosimetry. At the sametime biodosimetry is still unable to recognise causal relationship between types ofradiation and specific damage of DNA molecule. However, unlike to unstabledicentric and ring chromosomes, stabile translocations detected by FISH for firsttime gives an answer on cumulative effects of radiation. Biodosimetry curves arebased on the accepted hypothesis that the frequency of balanced translocationsequals the number of dicentrics [10], although there are some data which show thatthis relationship could be in some cases deviated [11]. Repeated analysis confirmedthe transient nature of dicentric and ring chromosomes. Our results show that eventhough unstable chromosome aberration frequency decreases the translocationfrequency remains significantly elevated and does not correlate with years ofemployment. In view of health risk assessment there is no possibility to makeextrapolations or predict the curve of accumulation of translocations as unstableaberrations show unequal distribution of exposure due to individual activity at thework place [12]. The rate of elimination, persistence and the accumulation ofgenetic damage are of great importance in epidemiologic studies. Our results showthat translocation frequency can increase and accumulate over years of employmenteven if annual doses of radiation measured by physical dosimeters are withinpermissible limits. An additional drawback of physical dosimetry is that excludes allother parameters which may damage living organism such as age, smoking habit,chemical substances and non-ionising radiation. In order to turn and translate theseevaluations into proactive measures, combined application of methods in clinicalcytogenetics and genetic toxicology, could give a new quality to the research of theaetiology of malignancies associated with exposure to environmental agents andintroduce preventive measures before the first clinical. We therefore suggest the newfield, "ecocytogenetics". The goal of this field would be to recognize environmentalagents causing specific genome damage located on certain chromosomes related todescribed neoplasms (using FISH and proteomics), to detect clones and to suggestfurther preclinical surveillance within preventive medicine. Ecocytogenetics couldbring together experts who currently work in completely different areas of medicalpractice as well as governmental institutions. They could give a new boost topreventive medicine. Ecocytogenetics could establish "risk profiles" for individualsand consequencies of exposure incorporating interindividual variability.
219
VI. simpozij HDZZ, Stubičke Toplice, 2005
REFERENCES[ 1 ] Bonassi S, Abbodondolo A, Camurri L, Dal Pra L, De Ferrari M, Degrassi F, Forni
A, Lambert L, Lando C, Padovani P, Sbrana I, Vecchio D, Puntoni R. Arechromosome aberrations in circulating lymphocytes predictive of a future canceronset in humans? Preliminary results of an Italian cohort study. Cancer GenetCytogenet 1995; 79:133-135.
[2] Bonassi S, Znaor A, Norppa H, Hagmar L. Chromosomal aberrations and risk ofcancer in humans: an epidemiological perspective, Cytogenet Genome Res2004;104: 376-382.
[3] Znaor A, Fučić A, Strnad M, Barković D, Škara M, Hozo I, Micronuclei inperipheral blood lymphocytes as a possible cancer risk biomarker: a cohort study ofoccupationally exposed workers in Croatia Croat Med J 2003; 44 (4):441-446.
[4] Lucas J, Awa A, Kodama Y, Nakano M, Ohtaki K, Pinkel D, Poggensee M, StraumeT, Weier U, Gray J. Rapid trasnlocation frequency analysis in humans decades afterexposure to ionizing radiation. Livermore, CA, Lawrence Livermore NationalLaboratory, Report UCRL-107165, 1991.
[5] International Atomic Energy Agency (IAEA).Biological dosimetry, Chromosomeaberration analysis for dose assessment, Technical Report Series, No 260,International Atomic Energy Agency, Vienna, 1986
[6] Perry P, Wolff S. New Giemsa method for different staining of sister chroamted.Nature 1974; 261:156-158.
[7] Fenech M, Morley A. Measurement of micronuclei in lymphocytes. Mutat Res 1985;147:29-36.
[8] Lucas J N, Deng W, Moore D, Hill F, Wade M, Lewis A, Sailes F, Burk C, Hsieh A,Galvan N. Background ionizing radiation plays a minor role in the production ofchromosome translocations in a control population. Int J Radiat Biol 1999; 75:819-827.
[9] Boveri T.Ueber mehrpolige Mitosen als Mittel zur Analyse des Zelkerns. WurzburgC. Kabitzsch und Verh d Phys Med Ges Zu Wurzburg N.F. Bd 35 1902
[10] Bauchinger M, Retrospective dose reconstruction of human radiation exposure byFISH/chromosome painting, Mutat Res 1998; 404:89-96.
[II] Sakamoto-Hojo ET, Natarajan AT, Curados MP, Chromosome translocations inlymphocytes from individuals exposed to l37Cs 7,5 years after the accident inGoiania (Brazil). Rad Prot Dosimetry 1999; 86(1):25-31.
[12] Fučić A, Lasan R, Mijić A, Hitrec V. Comparison of the elimination of unstablechromosome aberrations and frequency of stable chromosome aberrations inpopulation involved in industrial radiography. Mutat Res 2001; 483, S59.
Acknowledgment: Sedlar M. took part in this research as student of Faculty ofScience, University of Zagreb, Croatia.
220
VI. simpozij HDZZ, Stubičke Toplice, 2005
ABSTRACTThe last few years have shown that cytogenetic biomarkers do predict
increased cancer risk. The most frequently used biomarkers in genetic toxicologyare chromosome aberration assay (CA) and micronucleus (MN) assay. Fluorescentin situ hybridisation (FISH), in turn, enables analysis of translocation as a stablegenome damage. With technological development, working environment hasbecome associated with complex exposure to ionising and non-ionising radiationand chemical agents. A follow-up of 1200 subjects occupationally exposed toionising radiation and chemical agents using CA and MN showed that the highestdeviations from control values were detected in complex exposure to ionisingradiation and ultrasound or to radioisotopes in medicine and in industrialradiography and to ionising radiation in specific jobs in nuclear plants. FISH usedin a group of subjects exposed to gamma radiation and ultrasound showed thattranslocation frequency could rise even when CA frequency is within controlvalues. This example shows that health risk is present even when results obtainedby routine methods for the last few decades do not deviate from control values andthat a decrease in permissible doses does not protect from accumulated genomedamage during employment under different conditions. As biological effects ofcomplex exposure are not possible to monitor by physical measurements,cytogenetic biomarkers are the only reliable tools to evaluate of genome damageand significant parameters in regulating health surveillance of exposed subjects.
221
HR0500056VI. simpozij HDZZ, Stubičke Toplice
UČESTALOST KROMOSOMSKIH ABERACIJA KAOBIOMARKER RIZIKA ZA POJAVU RAKA
Ariana Znaor1 i Aleksandra Fučić2
'Hrvatski zavod za javno zdravstvo, Rockefellerova 7, Zagreb2Institut za medicinska istraživanja i medicinu rada,
Ksaverska c. 2, Zagrebe-mail:[email protected]
UVODKromosomske aberacije (CA) su oštećenja genoma nastala djelovanjem
klastogenih genotoksičnih agensa. Metoda određivanja kromosomskih aberacija ulimfocitima periferne krvi koristi se od 1960-ih godina za biomonitoring osobaprofesionalno izloženih genotoksičnim agensima. S obzirom da su oštećenjagenoma nastala djelovanjem mutagenih agensa vrlo slična onima opisanim umalignim stanicama, dugo se smatralo da pojava takvih oštećenja genoma možebiti povezana s razvojem raka, no tek početkom 1990-ih godina velike kohortnestudije u skandinavskim zemljama te u Italiji dokazale su da razina CA predstavljabiomarker rizika za rak [1-5]. Nastavak tih istraživanja s ciljem da se ispitapovezanost pojedinih tipova CA i rizika za pojavu raka kao i rizika za pojedinetipove raka odvija se u sklopu znanstveno-istraživačkog okvirnog programaEuropske Komisije "Citogenetički biomarkeri i rizik za pojavu raka" (čiji je dio ikohorta iz Republike Hrvatske).
MATERIJAL I METODEU retrospektivnom kohortnom istraživanju, kohortu je predstavljala skupina
od 1320 ispitanika iz Republike Hrvatske profesionalno izloženih fizikalnim ikemijskim genotoksičnim agensima kojima je u razdoblju 1987-2000. godineodređivana učestalost kromosomskih aberacija u limfocitima periferne krvi [6].
Uključni kriteriji bili su:dob 15 ili više godina, 100 ili više očitanih metafazapo analizi po osobi, a isključni kriterij bio je anamneza malignih bolesti.
Podaci o incidenciji malignih bolesti u kohorti (sijelo tumora, patohistološkadijagnoza, datum incidencije) dobiveni su praćenjem ispitanika putem Registra zarak Hrvatske, zaključno s datumom 31.12.2001, a podaci o vitalnom statusuispitanika dobiveni su putem liječnika medicine rada.
Za potrebe statističke analize, učestalost kromosomskih aberacijakategorizirana je prema percentilama u tri semikvantitativne kategorije: niska,srednja, visoka. Niska razina učestalosti CA bila je referentna razina. Zaizračunavanje rizika korištena je Coxova regresija kontrolirajući za eventualnikonfaunding zbog dobi, spola, profesionalne izloženosti i pušenja. Statističkaanaliza izvršena je u statističkom programu STATA.
222
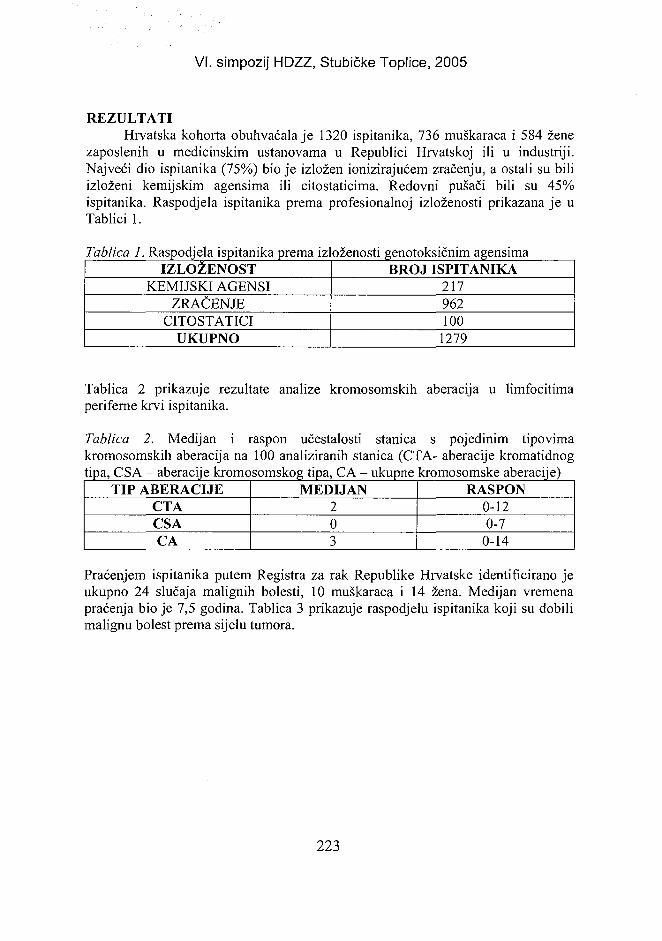
VI. simpozij HDZZ, Stubičke Toplice, 2005
REZULTATIHrvatska kohorta obuhvaćala je 1320 ispitanika, 736 muškaraca i 584 žene
zaposlenih u medicinskim ustanovama u Republici Hrvatskoj ili u industriji.Najveći dio ispitanika (75%) bio je izložen ionizirajućem zračenju, a ostali su biliizloženi kemijskim agensima ili citostaticima. Redovni pušači bili su 45%ispitanika. Raspodjela ispitanika prema profesionalnoj izloženosti prikazana je uTablici 1.
Tablica 1. Raspodjela ispitanika prema izloženosti genotoksičnim agensimaIZLOŽENOST
KEMIJSKI AGENSIZRAČENJE
CITOSTATICIUKUPNO
BROJ ISPITANIKA217962100
1279
Tablica 2 prikazuje rezultate analize kromosomskih aberacija u limfocitimaperiferne krvi ispitanika.
Tablica 2. Medijan i raspon učestalosti stanica s pojedinim tipovimakromosomskih aberacija na 100 analiziranih stanica (CTA- aberacije kromatidnogtipa, CSA - aberacije kromosomskog tipa, CA - ukupne kromosomske aberacije)
TIP ABERACIJECTACSACA
MEDIJAN203
RASPON0-120-7
0-14
Praćenjem ispitanika putem Registra za rak Republike Hrvatske identificirano jeukupno 24 slučaja malignih bolesti, 10 muškaraca i 14 žena. Medijan vremenapraćenja bio je 7,5 godina. Tablica 3 prikazuje raspodjelu ispitanika koji su dobilimalignu bolest prema sijelu tumora.
223
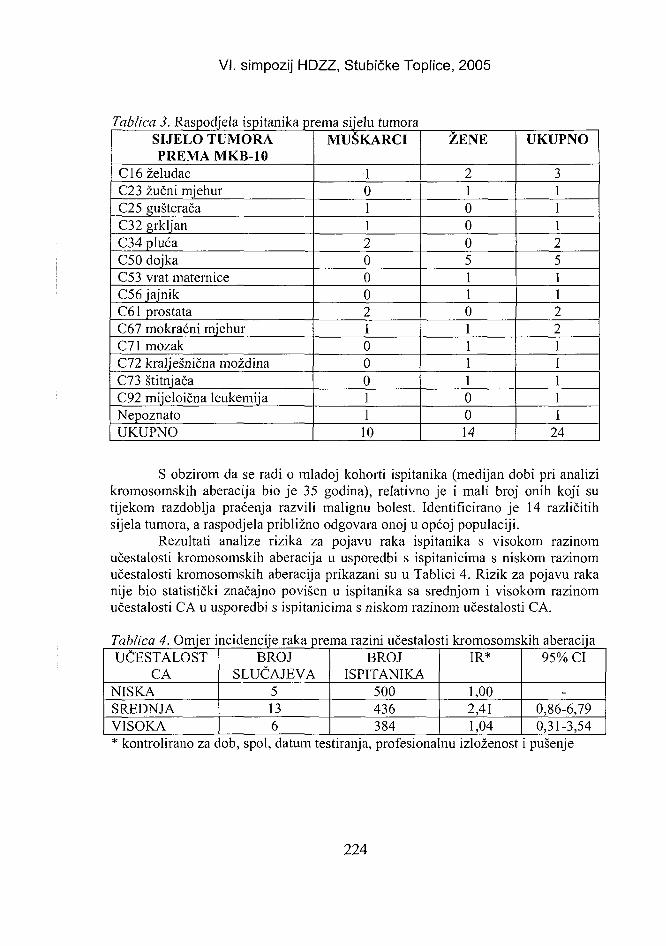
VI. simpozij HDZZ, Stubičke Toplice, 2005
Tablica 3. Raspodjela ispitanika prema sijelu tumoraSIJELO TUMORAPREMA MKB-10
C16 želudacC23 žučni mjehurC25 gušteračaC32 grkljanC34 plućaC50 dojkaC53 vrat materniceC56 jajnikC61 prostataC67 mokraćni mjehurC71 mozakC72 kralješnična moždinaC73 štitnjačaC92 mijeloična leukemijaNepoznatoUKUPNO
MUŠKARCI
101120002100011
10
ŽENE
21000511011110014
UKUPNO
311125112211111
24
S obzirom da se radi o mladoj kohorti ispitanika (medijan dobi pri analizikromosomskih aberacija bio je 35 godina), relativno je i mali broj onih koji sutijekom razdoblja praćenja razvili malignu bolest. Identificirano je 14 različitihsijela tumora, a raspodjela približno odgovara onoj u općoj populaciji.
Rezultati analize rizika za pojavu raka ispitanika s visokom razinomučestalosti kromosomskih aberacija u usporedbi s ispitanicima s niskom razinomučestalosti kromosomskih aberacija prikazani su u Tablici 4. Rizik za pojavu rakanije bio statistički značajno povišen u ispitanika sa srednjom i visokom razinomučestalosti CA u usporedbi s ispitanicima s niskom razinom učestalosti CA.
Tablica 4. Omjer incidencije raka prema razini učestalosti kromosomskih aberacijaUČESTALOST
CANISKASREDNJAVISOKA
BROJSLUČAJEVA
5136
BROJISPITANIKA
500436384
IR*
1,002,411,04
95% CI
-0,86-6,790,31-3,54
* kontrolirano za dob, spol, datum testiranja, profesionalnu izloženost i pušenje
224
VI. simpozij HDZZ, Stubičke Toplice, 2005
ZAKLJUČAKPreliminarni rezultati analize zajedničke kohorte europske studije od 6429
ispitanika iz pet zemalja među kojima je i Hrvatska pokazali su statistički značajnopovećanje rizika za pojavu raka od 60% za ispitanike sa srednjom razinomučestalosti CA, a od 80% za ispitanike s visokom razinom učestalosti CA u odnosuna one s niskom razinom, stoje u skladu s prethodno objavljenim rezultatima [7].
Iako zbog relativno malog broja osoba-godina u Hrvatskoj kohorti rezultatianalize rizika za pojavu raka nisu bili statistički značajni, analiza puliranihpodataka iz pet zemalja potvrdila je povezanost visoke razine učestalosti CA srizikom za pojavu raka. Rezultati istraživanja citogenetičkih biomarkera za sada semogu interpretirati samo na grupnoj razini, biomonitoring osoba izloženihgenotoksičnim agensima citogenetskim metodama ostaje jedini način dobivanjauvida u sumarno oštećenje genoma nakon djelovanja fizikalnih i kemijskih agensate procjene zdravstvenog rizika kojem su izložene osobe u pojedinimprofesionalnim okruženjima.
LITERATURA[ 1 ] Nordic study group on the Health Risk of Chromosome Damage: An inter-Nordic
prospective study on cytogenetic endpoints and cancer risk. Cancer Genet Cytogenet1990;45:85-92.
[2] Hagmar L, Bragger A, Hansteen I-L, Heim S, Hogsted B, Knudsen L, Lambert B etal. Cancer risk in humans predicted by increased levels of chromosomal aberrationsin lymphocytes: Nordic Study group on the Health Risk of Chromosome Damage.Cancer Res 1994;54:2919-2922.
[3] Bonassi S, Abbondandolo A, Camurri L, Dal Pra L, De Ferrari M, Degrassi F, ForniA et al. Are chromosome aberrations in circulating lymphocytes predictive of afuture cancer onset in humans? Preliminary results of an Italian cohort study. CancerGenet Cytogenet 1995;79:133-135.
[4] Hagmar L, Bonassi S, Stromberg U, Brogger A, Knuddsen LE, Norppa H,Reuterwahl C et al. Chromosomal aberrations in lymphocytes predict human cancer:A report from the European study group on cytogenetic biomarkers and health(ESCH). Mutat Res 1998;405:171-8.
[5] Bonassi S, Hagmar L, Stromberg U, Huici Montagud A, Tinnerberg H, Forni A,Heikkila P et al. Chromosomal aberrations in lymphocytes predict human cancerindependently of exposure to carcinogens. Cancer Res 2000;60:1619-1625.
[6] International Atomic Energy Agency (IAEA). Biological dosimetry, chromosomeaberration analysis for dose assessment, Technical Report Series, No 260,International Atomic Energy Agency, Vienna, 1986.
[7] Bonassi S, Znaor A, Norppa H, Hagmar L. Chromosomal aberrations and risk ofcancer in humans: an epidemiological perspective. Cytogenet Genome Res 2004;104(l-4):376-82.
225
VI. simpozij HDZZ, Stubičke Toplice, 2005
CHROMOSOMAL ABERRATIONS FREQUENCY AS ACANCER RISK BIOMARKER
Ariana Znaor' and Aleksandra Fučić2
'Croatian National Institute of Public Health, Rockefellerova 7,HR-10000 Zagreb, Croatia
esearch and Occupational MHR-10000 Zagreb, Croatia
2Institute for Medical Research and Occupational Medicine, Ksaverska c. 2,
Since the 1960s, chromosomal aberration frequency has been used tomonitor workers occupationally exposed to genotoxic agents. It was assumed thatgenome damage could be associated with cancer development, but there were nostudies to support this assessment due to a lack of cohorts large enough for areliable risk assessment. The results of a Nordic-Italian cohort study in the mid-90sshowed that chromosomal aberrations could predict cancer independently ofexposure to genotoxic agents. Efforts to assess cancer risk predictivity of specifictypes of chromosomal aberrations as well as the predictivity of risk for specificcancer sites have continued within the scope of the EC research programmeCytogenetic Biomarkers and Human Cancer Risk. A Croatian cohort of 1320workers monitored for CA between 1987 and 2000 formed a part of theinternational cohort. A follow-up of cancer incidence identified 24 cancer casesfrom the cohort. Relative risk of cancer in persons with high vs. low chromosomeaberration frequency was not statistically significant. The preliminary results of thepooled analysis of the international cohort show an increase in cancer risk of 80%in the group with highest chromosome aberration frequency, but it did not reachstatistical significance. In spite of the fact that the predictivity of cytogeneticbiomarkers for cancer risk can be interpreted only at a group level, biomonitoringremains the only means to assess the risk in specific occupational settings and toprotect populations exposed to genotoxic agents.
226
HR0500057
VI. simpozij HDZZ, Stubičke Toplice, k
UTJECAJ IONIZIRAJUCEG ZRAČENJA NA POJAVUMIKRONUKLEUSA U LIMFOCITIMA KONJA
Danica Hasanbašić1, Dunja Rukavina1, Avdo Sofradžija2, Nermina Obralić3 iLejla Saračević1
'Veterinarski fakultet Univerziteta u Sarajevu, Zmaja od Bosne 90Prirodno-matematički fakultet Univerziteta u Sarajevu, Zmaja od Bosne 35
3Medicinski fakultet Univerziteta u Sarajevu, Čekaluša bb71000 Sarajevo, BiH
e-mail: [email protected]
UVODVeoma značajan biološki problem je problem zaštite od zračenja, ali i od
drugih genotoksičnih agenasa. Ionizirajuće zračenje, ukoliko je iznad prirodnognivoa, svojim djelovanjem unosi elemente "kaosa" izazivajući "disharmoniju" uDNK molekuli koja je "dirigent" ogromnog superharmoničnog orkestra čija je"muzika" život [1].
Osnovni preduvjet za normalno funkcioniranje žive stanice je nenarušenacjelovitost DNK molekule. Nažalost, postoji ogroman broj fizičkih, kemijskih ibioloških agenasa koji, direktno ili indirektno, narušavaju integritet ovemakromolekule, što rezultira širokim rasponom strukturnih i funkcionalnihpromjena, sve do stanične smrti. Jedan od izazova suvremenog čovjeka jeidentificiranje i spriječavanje nepovratnih negativnih procesa u živim sustavima, aprvi korak u uspješnoj aplikaciji sustava zaštite od zračenja jeste kvalitetnadozimetrija ionizirajućeg zračenja. Kod slučajeva gdje postoji sumnja na izloženostionizirajućem zračenju, rutinski se koriste metode citogenetičke dozimetrije.
Za istraživanje procesa mutagenosti za ovaj rad odabran je jaki fizičkimutageni agens ionizirajuće zračenje. Citogenetička analiza genotoksičnostiionizirajućeg zračenja ostvarena je primjenom citohalazinom blokiranogmikronukleus testa. Mikronukleusi (MN), kao siguran pokazatelj eliminacijegenetičkog materijala su dislocirani dijelovi kromosoma, koji formiraju nuklearnumembranu oko sebe. Uporabom blokatora citokineze, citohalazina B, generiraju sebinuklearne stanice, isključivo u drugoj interfazi [2-5]. MN se formira za vrijememetafaze/anafaze staničnog ciklusa. Može nastati od cijelih kromosoma (aneugenislučaj) ili acentričnih kromosomskih fragmenata, koji su se odvojili od kromosomanakon pucanja (klastogeni slučaj) i nisu se integrirali u nukleus kćerke stanice. MNtest se može uspješno izvoditi na različitim tipovima stanica, od limfocita,fibroblasta, oguljenih epitelnih stanica, bez ekstra in vitro kultivacijskih postupaka.Mnoge laboratorije MN test koriste kao zamjenu za komplikovaniju i vremenskidulju analizu metafaznih kromosoma. 2003. godine od strane Fenech-a i suradnikausvojeni su glavni kriteriji za mjerenje mikronukleusa: Dijametar MN mora biti
227
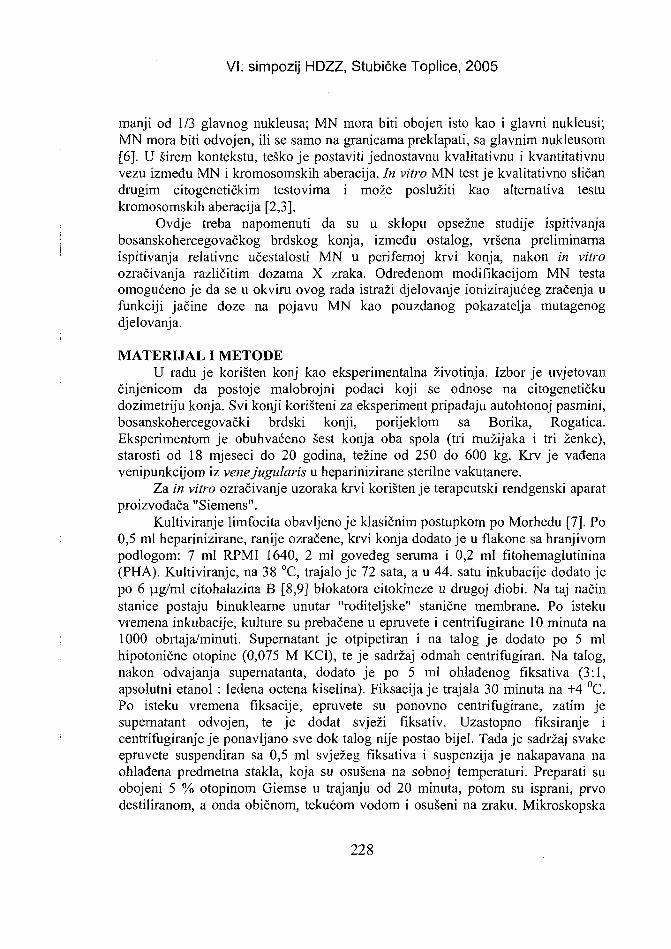
VI. simpozij HDZZ, Stubičke Toplice, 2005
manji od 1/3 glavnog nukleusa; MN mora biti obojen isto kao i glavni nukleusi;MN mora biti odvojen, ili se samo na granicama preklapati, sa glavnim nukleusom[6]. U širem kontekstu, teško je postaviti jednostavnu kvalitativnu i kvantitativnuvezu između MN i kromosomskih aberacija. In vitro MN test je kvalitativno sličandrugim citogenetičkim testovima i može poslužiti kao alternativa testukromosomskih aberacija [2,3],
Ovdje treba napomenuti da su u sklopu opsežne studije ispitivanjabosanskohercegovačkog brdskog konja, između ostalog, vršena preliminarnaispitivanja relativne učestalosti MN u perifernoj krvi konja, nakon in vitroozračivanja različitim dozama X zraka. Određenom modifikacijom MN testaomogućeno je da se u okviru ovog rada istraži djelovanje ionizirajućeg zračenja ufunkciji jačine doze na pojavu MN kao pouzdanog pokazatelja mutagenogdjelovanja.
MATERIJAL I METODEU radu je korišten konj kao eksperimentalna životinja. Izbor je uvjetovan
činjenicom da postoje malobrojni podaci koji se odnose na citogenetičkudozimetriju konja. Svi konji korišteni za eksperiment pripadaju autohtonoj pasmini,bosanskohercegovački brdski konji, porijeklom sa Borika, Rogatica.Eksperimentom je obuhvaćeno šest konja oba spola (tri mužijaka i tri ženke),starosti od 18 mjeseci do 20 godina, težine od 250 do 600 kg. Krv je vađenavenipunkcijom iz vene jugularis u heparinizirane sterilne vakutanere.
Za in vitro ozračivanje uzoraka krvi korišten je terapeutski rendgenski aparatproizvođača "Siemens".
Kultiviranje limfocita obavljeno je klasičnim postupkom po Morhedu [7]. Po0,5 ml heparinizirane, ranije ozračene, krvi konja dodato je u flakone sa hranjivompodlogom: 7 ml RPMI 1640, 2 ml goveđeg seruma i 0,2 ml fitohemaglutinina(PHA). Kultiviranje, na 38 °C, trajalo je 72 sata, a u 44. satu inkubacije dodato jepo 6 pg/ml citohalazina B [8,9] blokatora citokineze u drugoj diobi. Na taj načinstanice postaju binuklearne unutar "roditeljske" stanične membrane. Po istekuvremena inkubacije, kulture su prebačene u epruvete i centrifugirane 10 minuta na1000 obrtaja/minuti. Supernatant je otpipetiran i na talog je dodato po 5 mlhipotonične otopine (0,075 M KC1), te je sadržaj odmah centrifugiran. Na talog,nakon odvajanja supernatanta, dodato je po 5 ml ohlađenog fiksativa (3:1,apsolutni etanol : ledena octena kiselina). Fiksacija je trajala 30 minuta na +4 °C.Po isteku vremena fiksacije, epruvete su ponovno centrifugirane, zatim jesupernatant odvojen, te je dodat svježi fiksativ. Uzastopno fiksiranje icentrifugiranje je ponavljano sve dok talog nije postao bijel. Tada je sadržaj svakeepruvete suspendiran sa 0,5 ml svježeg fiksativa i suspenzija je nakapavana naohlađena predmetna stakla, koja su osušena na sobnoj temperaturi. Preparati suobojeni 5 % otopinom Giemse u trajanju od 20 minuta, potom su isprani, prvodestiliranom, a onda običnom, tekućom vodom i osušeni na zraku. Mikroskopska
228
VI. simpozij HDZZ, Stubičke Toplice, 2005
analiza preparata obavljena je na Olympus BX 44 svjetlosnom mikroskopuopremljenom s digitalnom kamerom, kojom su snimljene sve fotografije.Incidencija binuklearnih limfocita sa mikronukleusima utvrđena je na temeljuanaliziranih 1000 binuklearnih stanica po tretmanu.
REZULTATIRezultati analize praćenja DNK oštećenja u limfocitima konja izloženih
različitim dozama X zračenja (1, 2 i 3 Gy), korištenjem mikronukleus testa,prikazani su u Tablici 1, Grafu 1 i Slikama 1-6. Učestalost pojave MN posmatranaje u šest konja, i to u kontrolnim uzorcima periferne krvi, te na spomenutimdozama.
Tablica 1. Mikronukleusi u limfocitima konja (zbirni prikaz)Doza Gv
0,00123
Broj analiziranih6 0006 0006 0006 000
Broj MN26
293363378
BN stanice sa MN2,6
29,336,337,8
Frekvencija binuklearnih (BN) stanica sa MN utvrđena je na osnovianaliziranih 1000 BN stanica za svaku dozu. Analizom preparata u kontrolnimuzorcima evidentirano je prisustvo MN u BN stanicama (2,6 %). Veći broj BNstanica u kontrolnim uzorcima vjerojatno je posljedica starosti ispitivanih životinja(18 mjeseci do 20 godina) koja je u signifikantnoj korelaciji sa frekvencijompojave MN. Diskrepancija vezana za kontrolne vrijednosti MN, mogla bi biti iposljedica nepoznatih molekularnih interakcija između citohalazina B i staničnihstruktura, a pozadina mutagenog djelovanja ovog snažnog kemijskog agensa i daljeostaje nerazjašnjena [4,5,9]
Mikroskopskom analizom je zapažen porast broja MN na svim dozama.Povećanjem doze, povećavao se i broj BN stanica sa mikronukleusima, kao i brojMN u BN stanicama. Kod svih doza pored BN stanica s jednim MN, zapažene su ione sa dva ili tri MN različite veličine. Uočeno je i prisustvo većeg brojamononuklearnih stanica sa MN, te multinuklearnih stanica sa ili bez prisustva MN.Kod BN i multinuklearnih stanica neki nukleusi su bili sasvim odvojeni, ali sunajčešće međusobno bili povezani "nuklearnim mostovima" u vidu tankekromatinske niti. Ovi preliminarni rezultati ukazuju na postojanje odnosa izmeđuobrazovanja MN i induciranja kromosomskih aberacija, te da su ove aberacijevjerojatno jedan od uzroka nastanka MN. Mnogobrojni eksperimenti ukazuju daMN uglavnom potječu od acentričnih fragmenata, iako je generalno prihvaćeno dase u formiranje MN uključuju i one nastale genezom asimetričnih izmjenjivačkihaberacija, kromosomskog ili kromatidnog tipa. Mnogi autori navode visok nivokontrolnih vrijednosti za MN u poređenju sa istim za kromosomske aberacije. Ova
229
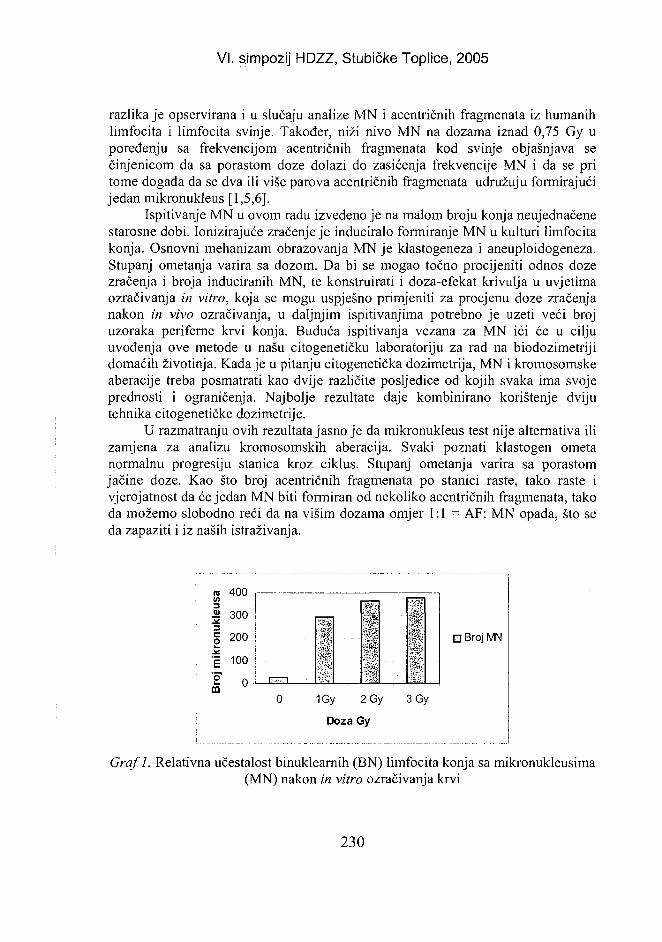
VI. simpozij HDZZ, Stubičke Toplice, 2005
razlika je opservirana i u slučaju analize MN i acentričnih fragmenata iz humanihlimfocita i limfocita svinje. Također, niži nivo MN na dozama iznad 0,75 Gy uporedenju sa frekvencijom acentričnih fragmenata kod svinje objašnjava sečinjenicom da sa porastom doze dolazi do zasićenja frekvencije MN i da se pritome događa da se dva ili više parova acentričnih fragmenata udružuju formirajućijedan mikronukleus [1,5,6].
Ispitivanje MN u ovom radu izvedeno je na malom broju konja neujednačenestarosne dobi. Ionizirajuće zračenje je induciralo formiranje MN u kulturi limfocitakonja. Osnovni mehanizam obrazovanja MN je klastogeneza i aneuploidogeneza.Stupanj ometanja varira sa dozom. Da bi se mogao točno procijeniti odnos dozezračenja i broja induciranih MN, te konstruirati i doza-efekat krivulja u uvjetimaozračivanja in vitro, koja se mogu uspješno primjeniti za procjenu doze zračenjanakon in vivo ozračivanja, u daljnjim ispitivanjima potrebno je uzeti veći brojuzoraka periferne krvi konja. Buduća ispitivanja vezana za MN ići će u ciljuuvođenja ove metode u našu citogenetičku laboratoriju za rad na biodozimetrijidomaćih životinja. Kada je u pitanju citogenetička dozimetrija, MN i kromosomskeaberacije treba posmatrati kao dvije različite posljedice od kojih svaka ima svojeprednosti i ograničenja. Najbolje rezultate daje kombinirano korištenje dvijutehnika citogenetičke dozimetrije.
U razmatranju ovih rezultata jasno je da mikronukleus test nije alternativa ilizamjena za analizu kromosomskih aberacija. Svaki poznati klastogen ometanormalnu progresiju stanica kroz ciklus. Stupanj ometanja varira sa porastomjačine doze. Kao što broj acentričnih fragmenata po stanici raste, tako raste ivjerojatnost da će jedan MN biti formiran od nekoliko acentričnih fragmenata, takoda možemo slobodno reći da na višim dozama omjer 1:1= AF: MN opada, što seda zapaziti i iz naših istraživanja.
ro 400U)
•Sj 300
I 200
E"2"
100
0 r !
i 1 . - * • % •
O Broj MN
1Gy 2Gy 3 Gy
Doza Gy
Graf 1. Relativna učestalost binuklearnih (BN) limfocita konja sa mikronukleusima(MN) nakon in vitro ozračivanja krvi
230
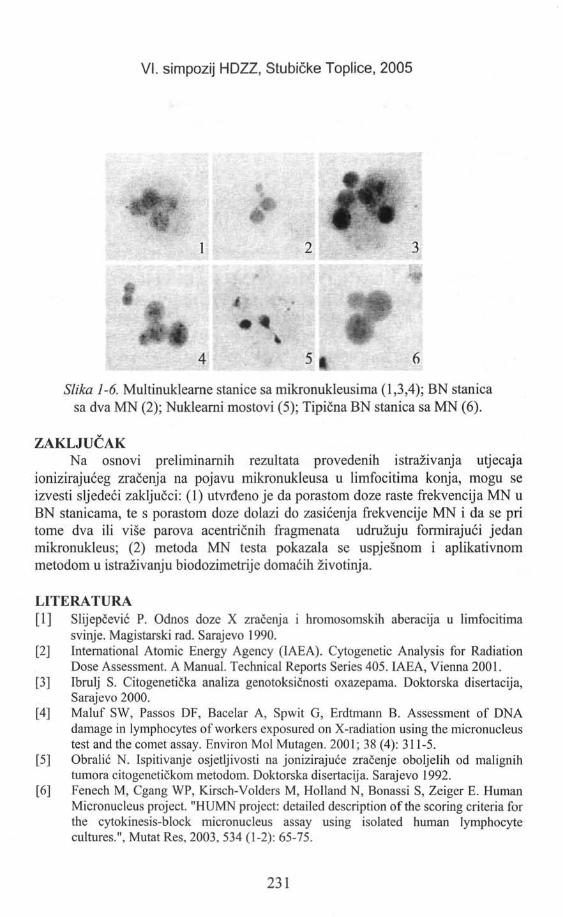
VI. simpozij HDZZ, Stubičke Toplice, 2005
wI
Slika 1-6. Multinukleame stanice sa mikronukleusima (1,3,4); BN stanicasa dva MN (2); Nuklearni mostovi (5); Tipična BN stanica sa MN (6).
ZAKLJUČAKNa osnovi preliminarnih rezultata provedenih istraživanja utjecaja
ionizirajućeg zračenja na pojavu mikronukleusa u limfocitima konja, mogu seizvesti sljedeći zaključci: (1) utvrđeno je da porastom doze raste frekvencija MN uBN stanicama, te s porastom doze dolazi do zasićenja frekvencije MN i da se pritome dva ili više parova acentričnih fragmenata udružuju formirajući jedanmikronukleus; (2) metoda MN testa pokazala se uspješnom i aplikativnommetodom u istraživanju biodozimetrije domaćih životinja.
LITERATURA[1] Slijepčević P. Odnos doze X zračenja i hromosomskih aberacija u limfocitima
svinje. Magistarski rad. Sarajevo 1990.[2] International Atomic Energy Agency (IAEA). Cytogenetic Analysis for Radiation
Dose Assessment. A Manual. Technical Reports Series 405. IAEA, Vienna 2001.[3] Ibrulj S. Citogenetička analiza genotoksičnosti oxazepama. Doktorska disertacija,
Sarajevo 2000.[4] Maluf SW, Passos DF, Bacelar A, Spwit G, Erdtmann B. Assessment of DNA
damage in lymphocytes of workers exposured on X-radiation using the micronucleustest and the comet assay. Environ Mol Mutagen. 2001; 38 (4): 311-5.
[5] Obralić N. Ispitivanje osjetljivosti na jonizirajuće zračenje oboljelih od malignihtumora citogenetičkom metodom. Doktorska disertacija. Sarajevo 1992.
[6] Fenech M, Cgang WP, Kirsch-Volders M, Holland N, Bonassi S, Zeiger E. HumanMicronucleus project. "HUMN project: detailed description of the scoring criteria forthe cytokinesis-block micronucleus assay using isolated human lymphocytecultures.", Mutat Res, 2003, 534 (1-2): 65-75.
231
VI. simpozij HDZZ, Stubičke Toplice, 2005
[7] Moorhead PS, Nowel PC, Mellman WJ, Batips DM, Hungerford DA. Chromosomepreparations of leucocytes cultured from human peripheral blood. Exp Cell Res1960; 20: 613-616
[8] Fenech M. The cytokinesis-block micronucleus method in human lymphocytes. MutRes 1993;161: 35-44.
[9] Fenech M, Morley AA. Cytokinesis-block micronucleus method in humanlymphocytes. Mutat Res 1986; 161: 193-198.
THE INFLUENCE OF IONISING RADIATION ONAPPEARANCE OF MICRONUCLEI IN LYMPHOCYTES OF
HORSES
Danica Hasanbasic1, Dunja Rukavina', Avdo Sofradzija2 Nermina Obralic3 andLejla Saracevic'
'Faculty of Veterinary Medicine University of Sarajevo, Zmaja od Bosne 902Faculty of Science, University of Sarajevo, Zmaja od Bosne 35
3Faculty of Medicine, University of Sarajevo, Čekaluša bb71000 Sarajevo, Bosnia and Herzegovina
e-mail: [email protected]
Within the framework of a wider investigation of Bosnian mountain horse, apreliminary study was conducted to assess the relative micronucleus frequencyafter in vitro irradiation of peripheral blood. The results of the micronucleus testare shown as micronucleus count per cell. In control samples the percentage ofmicronuclei is much lower than in irradiated samples. The effect was dose-dependent.
232
IZLOŽENOST STANOVNIŠTVA ZRAČENJU
PUBLIC EXPOSURE

HR0500058VI. simpozij HDZZ, Stubičke Toplice,
MEN AND RADON - A NOBLE GAS OF MANY DISGUISEParti
Berislav Momčilović1 and Glenn I. Lykken2
'institute for Medical Research and Occupational Health, Ksaverska c. 2,HR-10000 Zagreb, Croatia
department of Physics, University of North Dakota, Grand Forks,ND 58202, USA
e-mail: [email protected]
INTRODUCTIONIn regard to the health issues, radon appears to be an enigma. Since ancient
Roman times, people visited radon spas [1]; radon spas in Austria [2] andthroughout Europe [3] are still popular today. Old uranium mines in the UnitedStates have been converted into health spas [4,5]; even the United States Armyused a radon spa in Hot Springs, AK as a treatment center in the early 1900s. In hisreport on the effect of radioactive properties of natural spring waters Scully (1934)stated: "Radium emanation can be taken into the body by drinking water in which itis held in solution, or it can be breathed in with the air or vapors arising from theradioactive spring waters. The [radon] emanation has a special affinity for lipoids,and is therefore stored chiefly in the organs rich in lipoids, such as the nervoussystem and bone marrow." In the early 1900s commercial devices were introducedto provide radon-charged waters intended to duplicate that found at mineral hotsprings or health spas [6]. In a promotional pamphlet the recommendation for theRevigator [7] was "One should drink water from the Revigator at all times and atleast eight full glasses per day."
Radon-induced lung cancer has captured attention in the media over the past70 years, particularly in uranium miners [8]. However, "mountain sickness" a fataldisease of pitchblende miners, later identified as lung cancer, dates back tomedieval mines of the Erz Mountains in Germany (Lafavore 1987). Beginning inthe late 1980s, lung cancer in the general populace has been attributed toenvironmental radon exposure in dwellings [9]. In spite of a report that exhalationof environmental Rn originally inhaled from the home environment and stored inbody fluids and tissues increased after meal consumption [10]; there weresuggestions to the contrary. Common beliefs are: "Chemically, radon is a noblegas. As such, it is similar, for example to helium and neon. These gases do notreadily interact chemically with other elements and are relatively difficult,although NOT IMPOSSIBLE, TO TRAP. Like any other noble gas, radon iscolorless and odorless. If it is in the air, it is inhaled along with all other gases. Itis also EXHALED PROMPTLY, and were one dealing with radon alone there
235
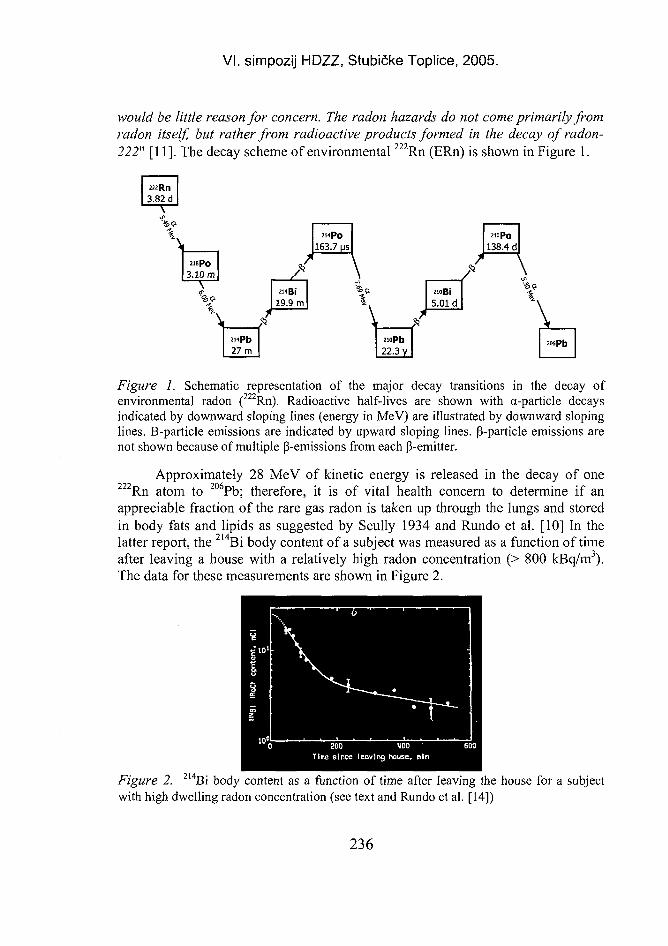
VI. simpozij HDZZ, Stubičke Toplice, 2005.
would be little reason for concern. The radon hazards do not come primarily fromradon itself, but rather from radioactive products formed in the decay of radon-222" [11]. The decay scheme of environmental 2 2 2 Rn (ERn) is shown in Figure 1.
3.82 d\
s21BP0
3.10 m\
\
] f27 m
214 B|
19.9 m
163.7 MS
\
\
210 P o
138.4 d
22.3 V
2-oBi
5.01 d
\
2 o e P b
Figure 1. Schematic representation of the major decay transitions in the decay ofenvironmental radon (222Rn). Radioactive half-lives are shown with cc-particle decaysindicated by downward sloping lines (energy in MeV) are illustrated by downward slopinglines. B-particle emissions are indicated by upward sloping lines, p-particle emissions arenot shown because of multiple p-emissions from each P-emitter.
Approximately 28 MeV of kinetic energy is released in the decay of one2 2 2 Rn atom to 2 0 6Pb; therefore, it is of vital health concern to determine if anappreciable fraction of the rare gas radon is taken up through the lungs and storedin body fats and lipids as suggested by Scully 1934 and Rundo et al. [10] In thelatter report, the 2 1 4Bi body content of a subject was measured as a function of timeafter leaving a house with a relatively high radon concentration (> 800 kBq/m3).The data for these measurements are shown in Figure 2.
Figure 2. 214Bi body content as a function of time after leaving the house for a subjectwith high dwelling radon concentration (see text and Rundo et al. [14])
236
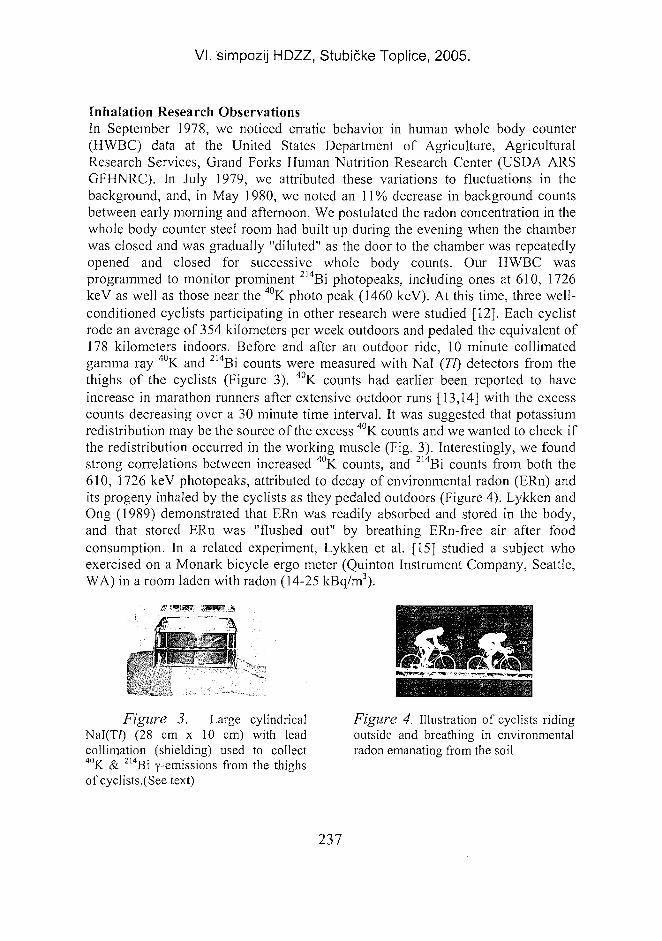
VI. simpozij HDZZ, Stubičke Toplice, 2005.
Inhalation Research ObservationsIn September 1978, we noticed erratic behavior in human whole body counter(HWBC) data at the United States Department of Agriculture, AgriculturalResearch Services, Grand Forks Human Nutrition Research Center (USDA ARSGFHNRC). In July 1979, we attributed these variations to fluctuations in thebackground, and, in May 1980, we noted an 11% decrease in background countsbetween early morning and afternoon. We postulated the radon concentration in thewhole body counter steel room had built up during the evening when the chamberwas closed and was gradually "diluted" as the door to the chamber was repeatedlyopened and closed for successive whole body counts. Our HWBC wasprogrammed to monitor prominent 2 l4Bi photopeaks, including ones at 610, 1726keV as well as those near the 40K photo peak (1460 keV). At this time, three well-conditioned cyclists participating in other research were studied [12]. Each cyclistrode an average of 354 kilometers per week outdoors and pedaled the equivalent of178 kilometers indoors. Before and after an outdoor ride, 10 minute collimatedgamma ray 40K and 214Bi counts were measured with Nal (77) detectors from thethighs of the cyclists (Figure 3). 40K counts had earlier been reported to haveincrease in marathon runners after extensive outdoor runs [13,14] with the excesscounts decreasing over a 30 minute time interval. It was suggested that potassiumredistribution may be the source of the excess 4 0K counts and we wanted to check ifthe redistribution occurred in the working muscle (Fig. 3). Interestingly, we foundstrong correlations between increased 40K counts, and 214Bi counts from both the610, 1726 keV photopeaks, attributed to decay of environmental radon (ERn) andits progeny inhaled by the cyclists as they pedaled outdoors (Figure 4). Lykken andOng (1989) demonstrated that ERn was readily absorbed and stored in the body,and that stored ERn was "flushed out" by breathing ERn-free air after foodconsumption. In a related experiment, Lykken et al. [15] studied a subject whoexercised on a Monark bicycle ergo meter (Quinton Instrument Company, Seattle,WA) in a room laden with radon (14-25 kBq/m3).
Figure 3. Large cylindrical Figure 4. Illustration of cyclists ridingNaI(T/) (28 cm x 10 cm) with lead outside and breathing in environmentalcollimation (shielding) used to collect radon emanating from the soil40K & 214Bi y-emissions from the thighsof cyclists.(See text)
237
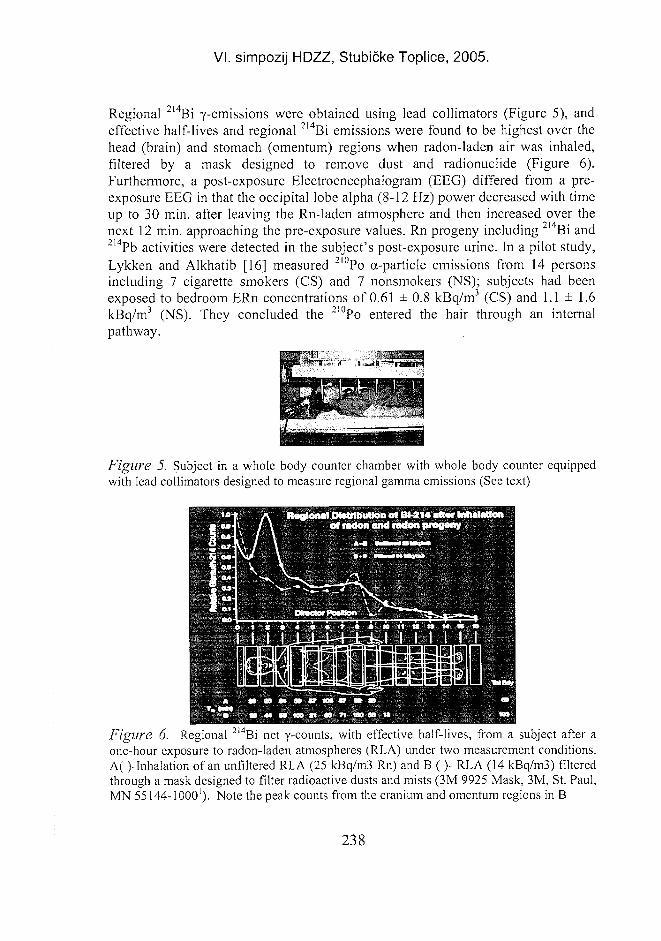
VI. simpozij HDZZ, Stubičke Toplice, 2005.
Regional Bi y-emissions were obtained using lead collimators (Figure 5), andeffective half-lives and regional 2 1 4Bi emissions were found to be highest over thehead (brain) and stomach (omentum) regions when radon-laden air was inhaled,filtered by a mask designed to remove dust and radionuclide (Figure 6).Furthermore, a post-exposure Electroencephalogram (EEG) differed from a pre-exposure EEG in that the occipital lobe alpha (8-12 Hz) power decreased with timeup to 30 min. after leaving the Rn-laden atmosphere and then increased over thenext 12 min. approaching the pre-exposure values. Rn progeny including 2 1 4Bi and2 1 4 Pb activities were detected in the subject's post-exposure urine. In a pilot study,Lykken and Alkhatib [16] measured 2 l 0 Po a-particle emissions from 14 personsincluding 7 cigarette smokers (CS) and 7 nonsmokers (NS); subjects had beenexposed to bedroom ERn concentrations of 0.61 ± 0.8 kBq/m3 (CS) and 1.1 ± 1.6kBq/m3 (NS). They concluded the 2 l 0 Po entered the hair through an internalpathway.
Figure 5. Subject in a whole body counter chamber with whole body counter equippedwith lead collimators designed to measure regional gamma emissions (See text)
Figure 6. Regional 2 l4Bi net y-counts, with effective half-lives, from a subject after aone-hour exposure to radon-laden atmospheres (RLA) under two measurement conditions.A( )-Inhalation of an unfiltered RLA (25 kBq/m3 Rn) and B ()- RLA (14 kBq/m3) filteredthrough a mask designed to filter radioactive dusts and mists (3M 9925 Mask, 3M, St. Paul,MN 55144-10001). Note the peak counts from the cranium and omentum regions in B
238
VI. simpozij HDZZ, Stubičke Toplice, 2005.
REFERENCES[I] Clarke D. The European day spa experience.
www.yourskinandsun.com/article 1071 .html; 2003.[2] www.salzburg.com/tourismus_e/badhofgastein/kur.html 2004[3] http://www.frommers.com/destinations/; 2004.[4] http://www.radonmine.com/contact.html: 2002.[5] http://www.merrywidowmine.com/; 2004[6] Landa ER, Miller CL, Birch RF. Radioactive and nonradioactive solutes in drinking
water from Rn-charging devices. Health Phys 1988: 99.[7] The Revigator Water Jar Co. (San Francisco, CA). Restoring of water's lost element.
1928; pl6.[8] Kreuzer M, Brachner A, Lehmann F, Martignoni K, Wichmann HE, Grosche B.
Characteristics of the German uranium miners cohort study. Health Phys 2002;26.[9] Van Pelt WR. Epidemiological associations among lung cancer, radon exposure and
elevation above sea level - A reassessment of Cohen's county level radon study.Health Phys 2003:397.
[10] Rundo J, Markum F, Plondke NJ. Postprandial changes in the exhalation ofradon from the environment. In: Argonne National Laboratory. Radiologicaland Environmental Research Division Annual Report; ANL-78-65, Part II;July 1977-June 1978. 1978:119-126;
[II] Bodansky D., Robkin MA, Stadler DR. Indoor radon and its hazards. University ofWashington Press. Seattle: 1987.
[12] Lykken GI, Lukaski, HC, Bolonchuk WW, Sandstead HH. Potential errors in bodycomposition as estimated by whole body scintillation counting. J Lab. Clin Med.(St.Louis). 1983; 101: 651-658.
[13] Lane HW, Roessler GS, Nelson EW, Cerda JJ. Effect of physical activity onhuman potassium metabolism in a hot and humid environment. Am J Clin Nutr1978;31:838-843.
[14] Londeree BR, Forkner L. Changes in 4 0K counts with exercise.Res.Q. 1978;49:95-100.
[15] Lykken GI, Ong HS, Penland JG. Radon in humans: more dynamic than wethought?. Health Phys 1990;58: S31.
[ 16] Lykken GI, Alkhatib HA. Analysis of hair for polonium-210 a-particleemissions. Proc 1993 International Radon Conference; 1993.
239
VI. simpozij HDZZ, Stubičke Toplice, 2005.
MEN AND RADON - A NOBLE GAS OF MANY DISGUISEPart II
Berislav Momčilović and Glenn I. Lykken'institute for Medical Research and Occupational Health, Ksaverska c. 2,
HR-10000 Zagreb, Croatiadepartment of Physics, University of North Dakota, Grand Forks,
ND 58202, USAe-mail: [email protected]
BRAIN RESEARCHMomčilović et al. [1] studied the occurrence of ERn progeny, 210Bi (P-
particle emitter) and 2 l 0Po (a-particle emitter) in the protein and lipid fractions ofcortical gray and subcortical white matter from frontal and temporal lobes ofhuman brains of persons with Alzheimer's Disease (AD), Parkinson's Disease(PD), cigarette smokers (S) or persons with no known neurological disease(controls, C). A ten-fold increase in 2 I 0Pb and 210Po radioactivity in the proteinfraction from both the cortical gray and subcortical white matter in AD and S and asimilar increase in the lipid fraction in PD was found (Figure 1). Thepathognomonic distribution of the radon progeny to the lipids in PD and theproteins in AD were inferred to reflect the increase in local chlorine availability towhich radon daughters bound selectively. We proposed the hypothesis that AD andPD are the systemic diseases of the cell membrane proteins (ionic pores, gates, andchannels) in AD and cell membrane lipids in PD (membrane phospho-lipidbilayer). We also found that radon distributes differently in the various anatomicalstructural compartments of the brain in an Alzheimer's disease victim (Figure 2).Evidently, these changes in the brain radon distribution are quite complex andremarkable. At this moment it suffices to say that radon notably accumulates in thehippocampus and amygdala, the two brain structures crucial for the human facultyof memory and emotional behavior, respectively. It should be noted that the levelof radioactivity recorded in amygdala may kill all the cells of that brain anatomicalstructure within a short period of time of only a few years. Indeed, every highenergy 5.3 to 7.69 MeV radon progeny a-particles may kill at least three cells in arow in whatever direction it may choose to go. Recent evidence showed that forhigh energy a-particle it is enough to pass through the cytoplasm without hittingthe nucleus to kill the cell [2].
240
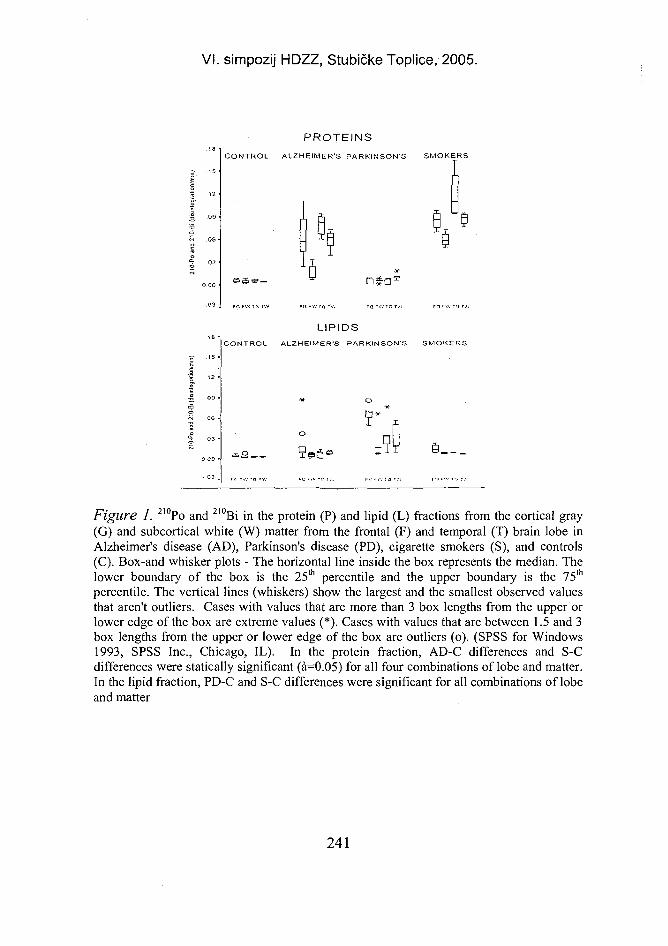
VI. simpozij HDZZ, Stubičke Toplice, 2005.
PROTEINS
CONTROL ALZHEIMER'S PARKINSON'S SMOKERS
0.00 •
-.03
LIPIDSCONTROL ALZHEIMER'S PARKINSON'S SMOKERS
Figure I. 210Po and 2 l 0Bi in the protein (P) and lipid (L) fractions from the cortical gray(G) and subcortical white (W) matter from the frontal (F) and temporal (T) brain lobe inAlzheimer's disease (AD), Parkinson's disease (PD), cigarette smokers (S), and controls(C). Box-and whisker plots - The horizontal line inside the box represents the median. Thelower boundary of the box is the 25th percentile and the upper boundary is the 75lh
percentile. The vertical lines (whiskers) show the largest and the smallest observed valuesthat aren't outliers. Cases with values that are more than 3 box lengths from the upper orlower edge of the box are extreme values (*). Cases with values that are between 1.5 and 3box lengths from the upper or lower edge of the box are outliers (o). (SPSS for Windows1993, SPSS Inc., Chicago, IL). In the protein fraction, AD-C differences and S-Cdifferences were statically significant (a=0.05) for all four combinations of lobe and matter.In the lipid fraction, PD-C and S-C differences were significant for all combinations of lobeand matter
241
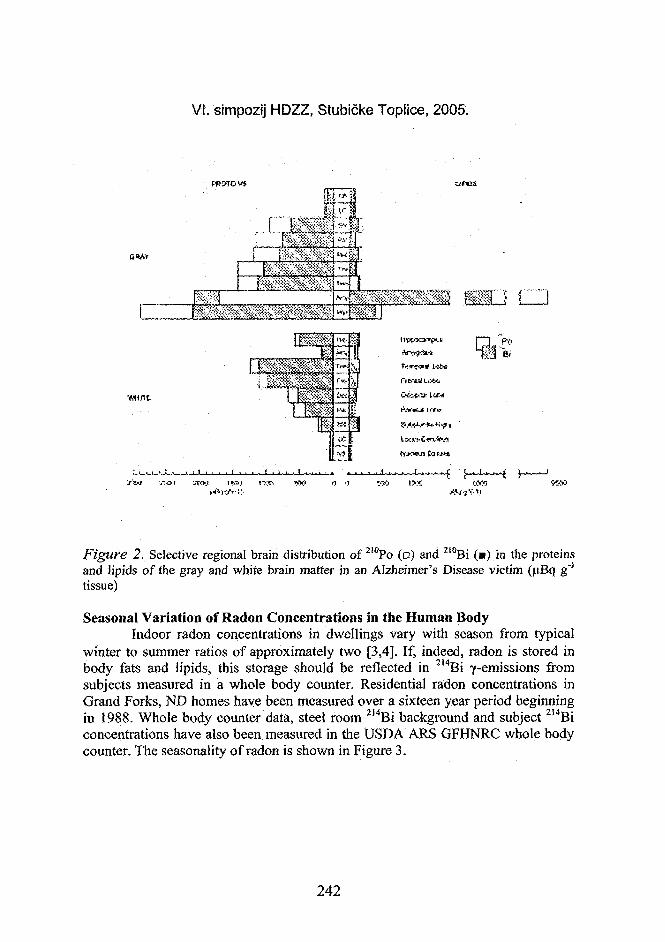
VI. simpozij HDZZ, Stubičke Toplice, 2005.
ilftii
' • •*'
. ,, i i „,-„, m-SXt32 vm&
Figure 2. Selective regional brain distribution of 2 ! 0 Po (o) and 210Bi (•) in the proteinsand lipids of the gray and white brain matter in an Alzheimer's Disease victim (uBq g"1
tissue)
Seasonal Variation of Radon Concentrations in the Human BodyIndoor radon concentrations in dwellings vary with season from typical
winter to summer ratios of approximately two [3,4]. If, indeed, radon is stored inbody fats and lipids, this storage should be reflected in 214Bi y-emissions fromsubjects measured in a whole body counter. Residential radon concentrations inGrand Forks, ND homes have been measured over a sixteen year period beginningin 1988. Whole body counter data, steel room 214Bi background and subject 2I4Biconcentrations have also been measured in the USDA ARS GFHNRC whole bodycounter. The seasonality of radon is shown in Figure 3.
242
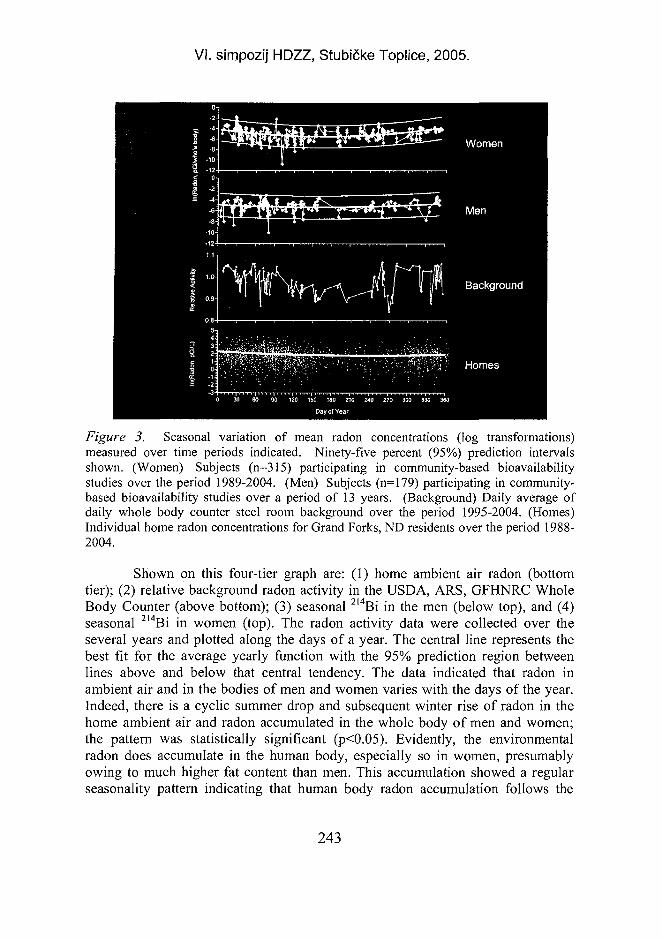
VI. simpozij HDZZ, Stubičke Toplice, 2005.
Figure 3. Seasonal variation of mean radon concentrations (log transformations)measured over time periods indicated. Ninety-five percent (95%) prediction intervalsshown. (Women) Subjects (n=315) participating in community-based bioavailabilitystudies over the period 1989-2004. (Men) Subjects (n=179) participating in community-based bioavailability studies over a period of 13 years. (Background) Daily average ofdaily whole body counter steel room background over the period 1995-2004. (Homes)Individual home radon concentrations for Grand Forks, ND residents over the period 1988-2004.
Shown on this four-tier graph are: (1) home ambient air radon (bottomtier); (2) relative background radon activity in the USDA, ARS, GFHNRC WholeBody Counter (above bottom); (3) seasonal 2 l 4Bi in the men (below top), and (4)seasonal 214Bi in women (top). The radon activity data were collected over theseveral years and plotted along the days of a year. The central line represents thebest fit for the average yearly function with the 95% prediction region betweenlines above and below that central tendency. The data indicated that radon inambient air and in the bodies of men and women varies with the days of the year.Indeed, there is a cyclic summer drop and subsequent winter rise of radon in thehome ambient air and radon accumulated in the whole body of men and women;the pattern was statistically significant (p<0.05). Evidently, the environmentalradon does accumulate in the human body, especially so in women, presumablyowing to much higher fat content than men. This accumulation showed a regularseasonality pattern indicating that human body radon accumulation follows the
243
VI. simpozij HDZZ, Stubičke Toplice, 2005.
changes of the environmental radon concentration. However, that equilibration wasnot passive, since the human body accumulates more radon than if the equilibrationwere a passive one. This is, to our knowledge, the first such conclusive evidence onradon accumulation in the human body and its seasonal pattern. Seasonal rhythmsof human nutrient intake and meal patterns in agricultural societies as well asaffluent societies have been reported to reflect seasonal changes in human bodyweight (de Castro 1991). Exceptionally high intake of carbohydrates was recordedin the fall. It would take some time for fat to deposit after the luxurious food intakeso that fat stores would be expected to peak during the winter time. Precisely thetime when the radon concentrations in the human body are the highest. Hence, ourseasonal dependent changes in whole body radon retention may reflect the natural,seasonal cycle of fat accumulation and depletion. Implying that the level of radonin the human body is higher then it is in the environment and that it would beconstant if there were no seasonal changes in either fat stores or environmentalradon concentrations. This synergism should be more pronounced in women thanin men due to the greater fat stores in women. Interestingly, Lykken et al. [5]reported correlation between body fat mass and total body radon to be statisticallysignificant in women (n = 40) but not in men (n = 57).
Radon Accumulation in Cancerous Breast Tissues (Initial Observations)Six weeks after second atomic bomb was dropped on Nagasaki, Japan, in
1945, Dr. Home was appointed chief medical officer in charge of civil population[6]. That event stimulated his life-long interest in radiation and its effects onhumans. We collaborated with Dr. Home and his colleagues in the Boston area in astudy designed to measure 210Po emissions from breast tissues of women who haddeveloped cancerous breasts (Table 1). The mean 210Po activity of 600 uBq/gcorresponds to 0.04 dis/min-g, a value that is in the lower range of that found inAD and PD brain proteins and lipids, respectively (Figure 1). Note the actualradiation dose to the tissue includes not only that due to 210Po a-particles (~5 ± 4pGy, mean ± standard deviation) but also from P-particles emitted by the parentnuclei, 210Pb and 210Bi. Furthermore, if radon is actually stored in breast tissue thetotal a-particle energy deposited locally would be approximately five times greaternot to mention the dose from 0- particles. Furthermore, the radiation dosesdelivered at the cellular level warrant a thorough micro dose analysis of data from a
f\ i f\ T i r\
case-controlled study of both Bi p-emissions and Po a-emissions fromcancerous breast tissues.
244
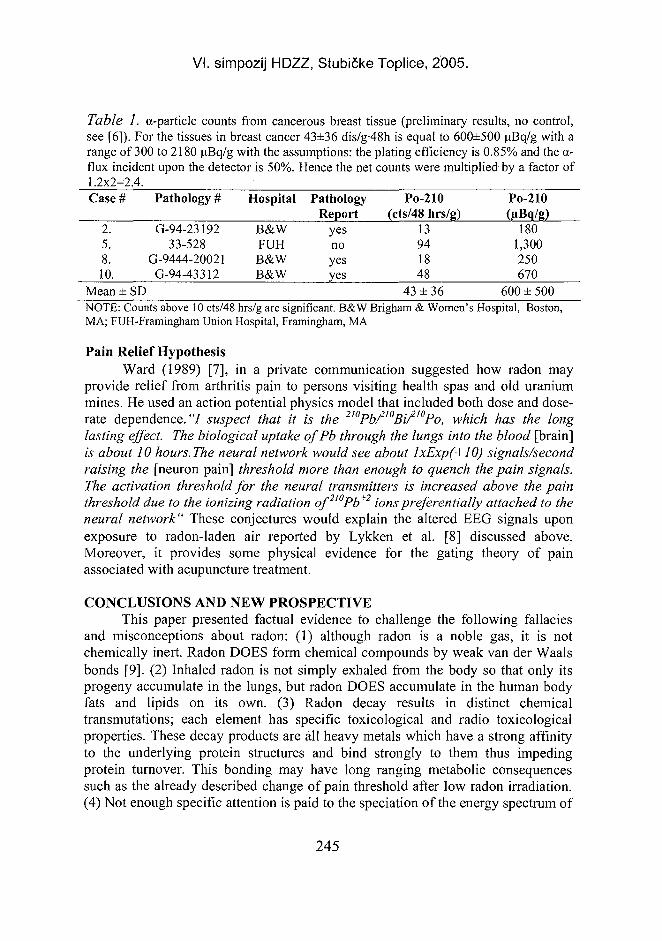
VI. simpozij HDZZ, Stubičke Toplice, 2005.
Table 1. a-particle counts from cancerous breast tissue (preliminary results, no control,see [6]). For the tissues in breast cancer 43±36 dis/g-48h is equal to 600±500 uBq/g with arange of 300 to 2180 uBq/g with the assumptions: the plating efficiency is 0.85% and the a-flux incident upon the detector is 50%. Hence the net counts were multiplied by a factor of1.2x2=2.4.Case
2.5.8.10.
Mean
# Pathology #
G-94-2319233-528
G-9444-20021G-94-43312
± S D
Hospital
B&WFUHB&WB&W
PathologyReport
yesnoyesyes
Po-210(cts/48 hrs/g)
13941848
43 ±36
Po-210(nBq/g)
1801,300250670
600 ±500NOTE: Counts above 10 cts/48 hrs/g are significant. B&W Brigham & Women's Hospital, Boston,MA; FUH-Framingham Union Hospital, Framingham, MA
Pain Relief HypothesisWard (1989) [7], in a private communication suggested how radon may
provide relief from arthritis pain to persons visiting health spas and old uraniummines. He used an action potential physics model that included both dose and dose-rate dependence."/ suspect that it is the 210Pb/l0Bi/'°Po, which has the longlasting effect. The biological uptake ofPb through the lungs into the blood [brain]is about 10 hours. The neural network would see about lxExp(+]0) signals/secondraising the [neuron pain] threshold more than enough to quench the pain signals.The activation threshold for the neural transmitters is increased above the painthreshold due to the ionizing radiation of2l0Pb+2 ions preferentially attached to theneural network" These conjectures would explain the altered EEG signals uponexposure to radon-laden air reported by Lykken et al. [8] discussed above.Moreover, it provides some physical evidence for the gating theory of painassociated with acupuncture treatment.
CONCLUSIONS AND NEW PROSPECTIVEThis paper presented factual evidence to challenge the following fallacies
and misconceptions about radon: (1) although radon is a noble gas, it is notchemically inert. Radon DOES form chemical compounds by weak van der Waalsbonds [9]. (2) Inhaled radon is not simply exhaled from the body so that only itsprogeny accumulate in the lungs, but radon DOES accumulate in the human bodyfats and lipids on its own. (3) Radon decay results in distinct chemicaltransmutations; each element has specific toxicological and radio toxicologicalproperties. These decay products are all heavy metals which have a strong affinityto the underlying protein structures and bind strongly to them thus impedingprotein turnover. This bonding may have long ranging metabolic consequencessuch as the already described change of pain threshold after low radon irradiation.(4) Not enough specific attention is paid to the speciation of the energy spectrum of
245
VI. simpozij HDZZ, Stubičke Toplice, 2005.
the radioactive decay products. Consideration of the average radiation from aspectrum of radiation energies may only lead to confounding and misinterpretingof the biological effects of radiation. The current misconceptions about radon arethe result of an overzealous reductionistic approach to what essentially is an issueof complexity. Many disguise of radon can not be booth-strapped into a humanmind "convenient" simple model, but require a simultaneous multidimensionalview of interactions such as may be seen in an esoteric mandala. Today, thereductionistic presentation of a complex systems of men and radon is bound to lookas an optical illusion.
REFERENCES[1] Momčilović. B, Alkhatib HA, Duerre JA, Cooley MA, Long WM, Harris RT,
Lykken GI. Preference of environmental radon progeny for brain proteins inAlzheimer's Disease and brain lipids in Parkinson's Disease. Alzheimer Disease andAssociated Disorders, 2001; 15:106-115.
[2] Day C. Alpha radiation can damage DNA even when it misses the cell nucleus. PhysToday 1999;52:19-20.
[3] Papastefanou C, Stoulos S, Manolopoulo M, Ioannidou A, Charalambous S. Indoorradon concentrations in Greek apartment dwellings. Health Phys 1994;66:270-273.
[4] Huber J, Ennemoser O, Schneider P. Quality control of mitigation methods forunusually high indoor radon concentrations. Health Phys 2001 ;81:156-162.
[5] Lykken GI, Ong HS, Alkhatib HA, Harris TR, Momčilović. B, Penland JG.Perquisite spin-off from twenty-two years of measuring background in the wholebody counter steel room. In vivo body composition studies. Annals of the NY AcadSci2000;904:267-271.
[6] Home HW. Dr.Horae died just before preliminary results from our pilot studybecame available and before control tissues could be obtained and measured.September; 1985.
[7 Ward T. (Current address Thomas Ward, PhD, Techsource Inc., 20251 CenturyBlvd., Suite 440, Germantown, MD 20874) Personal communications; 1989.
[8] Lykken GI, Ong HS, Penland JG. Radon in humans: more dynamic than wethought?. Health Phys 1990;58: S31.
[9] Stein L, Chemical properties of radon. In: Hopke PK ed. Radon and its decayproducts. Washington, DC, Am Chem. Soc. 1987; 240-251.
AcknowledgementsThe authors express gratitude to the USDA ARS Grand Forks Human Nutrition Research Center and to thesubjects who participated in the community-based studies for whole body counter data, Ms. LuAnn Johnson,USDA ARS Statistician, for help with data analyses; the USEPA, contract ND92-257; the Technical TrainingFoundation, North Andover, MA, U.S.A.; the Ministry of Science and Technology of the Republic of Croatia,grant 0022013 "Metal Metabolism"; and the support of RCS Trading Co. Ltd., Isle of Man, UK. All investigationsinvolving human subjects were approved by the University of North Dakota Radioactive Drug ResearchCommittee (UND RDRC 0119) and Institutional Review Board and by the USDA Human Studies Committeeafter each subject had given written consent.Mention of a trademark or proprietary product does not constitute aguarantee or warranty of the product by the University of North Dakota, the U.S. Department of Agriculture anddoes not imply its approval to the exclusion of other products that may be suitable.
246
VI. simpozij HDZZ, Stubičke Toplice, 2005.
ABSTRACTRadon-induced lung cancer can be traced back to the 16th century miners in
Europe, but recently there has been a world wide concern that elevated radonprogeny levels in dwellings may also be implicated in lung cancer. Historical andexperimental evidence is presented to document how inhaled radon is distributedthroughout the body and stored in fats and lipids. Background counts in a steelroom using a human whole-body counter (HWBC) progressively decreasedthroughout the day, which is attributed to a lowering of radon as subjects enteredthe steel room. The observed increases in potassium-40 (40K) counts in marathonrunners was attributed to inhalation of environmental radon, and radon progenywas verified by measuring contributions to the 40K photopeak by 214Bi in cyclistsand an untrained subject who exercised in a room with radon-laden air. Effectivehalf-lives and regional 2 l4Bi emissions were found to be the highest in the areas ofthe head (brain) and stomach (omentum) when filtered radon-laden air was inhaled.These observations prompted analyses for radon progeny (210Bi and 210Po) frombrain tissues of persons who suffered from Alzheimer's and Parkinson's Diseases(AD & PD). Protein in AD and lipids in PD were high in these progeny relative tothe control tissues. Whole body counts (214Bi emissions) of subjects over a periodof 24 years were analysed for radon body content (Rn-conc). Statisticallysignificant correlations were found between total body fat and Rn-conc in womenand between seasonal home radon concentrations and seasonal Rn-conc in subjectsparticipating in community-based studies. It is concluded that environmental radonis indeed stored in the body, that body concentration correlates with body fat inwomen, and that these reflect seasonal concentrations in their dwellings. Radondecay products include a number of alpha and beta particle emitters. Theseemissions produce a radiation risk and may play a role in multiple sclerosis andmammary cancer as well as in cancers of other fat-rich tissues. This paper presentsevidence that challenges current fallacies and misconceptions about radon uptakeby the body and subsequent in vivo behaviour.
247
HR0500059VI. simpozij HDZZ, Stubičke Toplice,
RADONSKE RAZINE U HRVATSKIM TOPLICAMA
Vonja Radolić, Branko Vuković, Denis Stanić i Josip PlaninićOdjel za fiziku Sveučilišta u Osijeku, Trg Ljudevita Gaja 6, 31000 Osijek
e-mail: [email protected]
UVODRadon (222Rn) je plemeniti radioaktivni plin koji nastaje radioaktivnim
raspadom atoma radija uz emisiju a-čestice. Radon je u plinovitom obliku topiv uvodi i u područjima bogatim izvorima geotermalne vode, nošen tzv. plinovimanosačima (CO2, CH4, N2), prolazi velike udaljenosti kroz unutrašnjost Zemlje te seakumulira na njenoj površini. Posljedice toga su vrlo visoke radonske koncentracijeu pojedinim geotermalnim toplicama koje mogu uzrokovati zdravstvene poteškoćekod radnog osoblja [1,2].
U Republici Hrvatskoj ima desetak termalnih toplica sa zatvorenimbazenima koje pružaju zdravstvene usluge pacijentima i posjetiteljima. Cilj ovogistraživanja je mjerenje radona u zraku i u vodi u hrvatskim toplicama sa svrhomprocjene doznog ekvivalenta kojeg prime zaposlenici, ali i posjetitelji.
EKSPERIMENTALNE METODEMjerenje koncentracije radona u zraku i u vodi (na izvoru i u zatvorenom
bazenu) kao i mjerenje određenih meteoroloških parametara (temperature zraka,barometarskog tlaka, relativne vlažnosti zraka) je provedeno uporabomAlphaGUARD PQ2000 PRO mjernog uređaja (Genitron Instruments GmbH,Njemačka). Središnji dio ovog modularnog sustava je uređaj kojemu je detektorradona pulsna ionizacijska komora aktivnog volumena 0,56 dm3. Uređaj možeraditi na dva operativna načina: difuzijski i pumpni. Koncentracija radona u zrakuje mjerena u difuzijskom načinu s mjernim ciklusom od 10 minuta dok jekoncentracija radona u vodi mjerena pumpnim načinom rada, a mjerenje je trajalo30 minuta.
Integralna mjerenja koncentracije radona i njegovih kratkoživućih potomakau zraku su provedena s detektorima nuklearnih tragova LR-115, tip II (KodakPathe, Francuska). U dvije cilindrične detektorske posude, promjera 9,6 cm i visine9 cm - od kojih je jedna zatvorena filter papirom površinske gustoće 0,078 kg/m2
(difuzijski detektor), a druga je bila otvorena - postavi se po jedan film LR-115.Koncentracija radona u zraku se dobije kao produkt koeficijenta osjetljivosti (k =28,7 Bq m"3/ tr cm"2d"') i gustoće tragova na filmu u difuzijskom detektoru. Metodamjerenja s dva detektora nuklearnih tragova (otvoreni i difuzijski) omogućujeodređivanje ravnotežnog faktora za radon i njegove kratkoživuće potomke [3].
Detektori su preliminarno izlagani na blagajnama toplica 1, 2 i 4 (Tablica 1)u zimskim mjesecima (studeni 2003 - ožujak 2004), a potom su jetkani u 10%
248
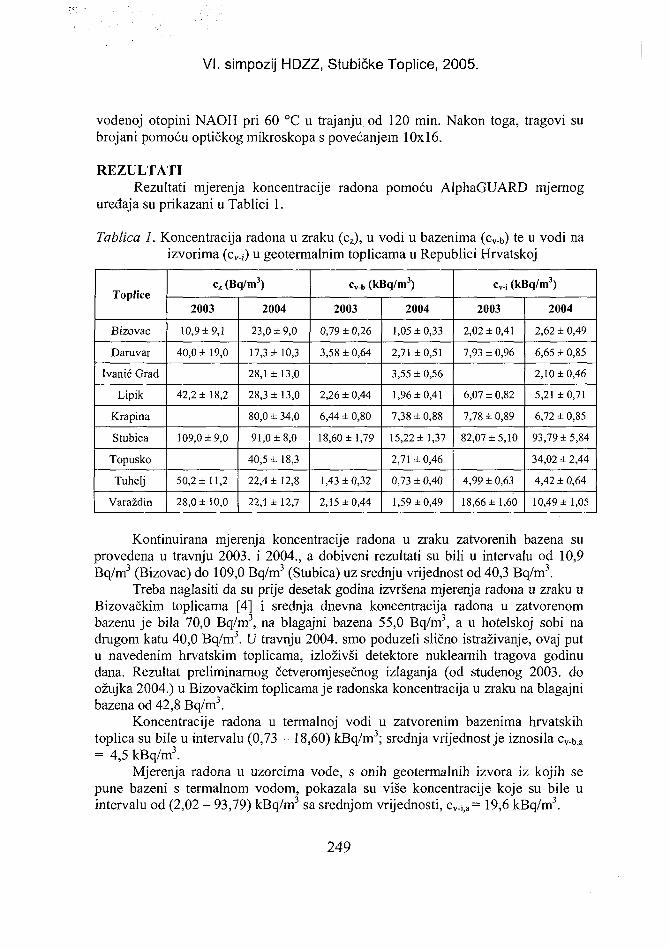
VI. simpozij HDZZ, Stubičke Toplice, 2005.
vodenoj otopini NAOH pri 60 °C u trajanju od 120 min. Nakon toga, tragovi subrojani pomoću optičkog mikroskopa s povećanjem 10x16.
REZULTATIRezultati mjerenja koncentracije radona pomoću AIphaGUARD mjernog
uređaja su prikazani u Tablici 1.
Tablica 1. Koncentracija radona u zraku (cz), u vodi u bazenima (cv.b) te u vodi naizvorima (cv_j) u geotermalnim toplicama u Republici Hrvatskoj
Toplice
Bizovac
Daruvar
Ivanić Grad
Lipik
Krapina
Stubica
Topusko
Tuhelj
Varaždin
c, (Bq/m3)
2003
10,9 ±9,1
40,0 ±19,0
42,2 ± 18,2
109,0 ±9,0
50,2 ± 11,2
28,0 ± 10,0
2004
23,0 ±9,0
17,3 ± 10,3
28,1 ± 13,0
28,3 ±13,0
80,0 ± 34,0
91,0 ±8,0
40,5 ±18,3
22,4 ± 12,8
22,1 ± 12,7
cv.„ (kBq/m3)
2003
0,79 ± 0,26
3,58 ±0,64
2,26 ± 0,44
6,44 ± 0,80
18,60± 1,79
1,43 ±0,32
2,15 ±0,44
2004
1,05 ±0,33
2,71 ±0,51
3,55 ± 0,56
1,96 ±0,41
7,38 ± 0,88
15,22 ± 1,37
2,71 ±0,46
0,73 ± 0,40
1,59 ±0,49
cv.i (kBq/m3)
2003
2,02 ±0,41
7,93 ± 0,96
6,07 ± 0,82
7,78 ± 0,89
82,07 ±5,10
4,99 ± 0,63
18,66 ± 1,60
2004
2,62 ± 0,49
6,65 ± 0,85
2,10 ±0,46
5,21 ±0,71
6,72 ± 0,85
93,79 ± 5,84
34,02 ± 2,44
4,42 ± 0,64
10,49 ± 1,05
Kontinuirana mjerenja koncentracije radona u zraku zatvorenih bazena suprovedena u travnju 2003. i 2004., a dobiveni rezultati su bili u intervalu od 10,9Bq/m3 (Bizovac) do 109,0 Bq/m3 (Stubica) uz srednju vrijednost od 40,3 Bq/m3.
Treba naglasiti da su prije desetak godina izvršena mjerenja radona u zraku uBizovačkim toplicama [4] i srednja dnevna koncentracija radona u zatvorenombazenu je bila 70,0 Bq/m3, na blagajni bazena 55,0 Bq/m3, a u hotelskoj sobi nadrugom katu 40,0 Bq/m3. U travnju 2004. smo poduzeli slično istraživanje, ovaj putu navedenim hrvatskim toplicama, izloživši detektore nuklearnih tragova godinudana. Rezultat preliminarnog četveromjesečnog izlaganja (od studenog 2003. doožujka 2004.) u Bizovačkim toplicama je radonska koncentracija u zraku na blagajnibazena od 42,8 Bq/m3.
Koncentracije radona u termalnoj vodi u zatvorenim bazenima hrvatskihtoplica su bile u intervalu (0,73 - 18,60) kBq/m3; srednja vrijednost je iznosila cv.b,a
= 4,5 kBq/m3.Mjerenja radona u uzorcima vode, s onih geotermalnih izvora iz kojih se
pune bazeni s termalnom vodom, pokazala su više koncentracije koje su bile uintervalu od (2,02 - 93,79) kBq/m3 sa srednjom vrijednosti, cv. i ia= 19,6 kBq/m3.
249
VI. simpozij HDZZ, Stubičke Toplice, 2005.
Ovako velika razlika između cv.b,a i tVu nastaje prvenstveno zbog dvarazloga. Prvo, ako se termalna voda u bazenu ne mijenja svakodnevno tadaradonska aktivnost značajno opada zbog radioaktivnog raspada, budući da jevrijeme poluraspada radona xy2 = 3,825 d. Drugi mogući razlog smanjenjakoncentracije radona u bazenima, u odnosu na izvore, je tehničke prirode: da bi seodržavala stalna temperatura vode u bazenima, geotermalna voda s izvora se miješas običnom vodovodnom vodom koja, uglavnom, ima manje radona od izvorske.Tako je, npr. u Bizovačkim toplicama temperatura vode na izvoru (prije miješanja sobičnom vodom) t; = 45 °C (318 K), temperature vode u bazenu tb = 35 °C (308 K),a temperature obične vode iz vodovoda t0 = 15 °C (288 K). Mjerenja koncentracijeradona u vodi, u travnju 2004, su dala sljedeće vrijednosti: cv.i = 2,02 kBq/m3 zavodu s izvora; cv-b = 1,05 kBq/m3 za vodu u bazenu; cv.o = 0,30 kBq/m3 za običnuvodu iz gradskog vodovoda. Buduća da se temperatura vode s izvora treba smanjitiza 10 °C, primjenom jednostavne kalorimetrijske jednadžbe se dobije omjer maseobične vode koju treba dodati vodi s izvora da se dobije voda za bazen: foi = (tj - tb)/ (tb - t0) = 0,5. Pretpostavimo li da postoji razmjer između mase i radioaktivnosti,iz zakona radioaktivnog raspada i opisanih relacija, vrijeme radioaktivnog raspadaradona u bazenu, t, se može izraziti formulom
(1)
gdje je fib = cv.i/cv_b = 2,02/1,05 = 1,925. Naravno, t predstavlja i vremenski intervalizmeđu punjenja bazena i trenutka uzorkovanja vode iz bazena, a u slučaju Bizovačkihtoplica ta "starost" vode u bazenu je iznosila t= 1,06 dana. Uprava Bizovačkih toplicanas je obavijestila da se voda u bazenu mijenja tri puta tjedno.
Usporedbom podataka o radonu u toplicama u Sloveniji [5], Mađarskoj [6],Njemačkoj [7], Grčkoj [8], Venezueli [9], Španjolskoj [10] i SAD-u [11] gdje suvrijednosti koncentracija radona bile u intervalu od 0,2 do 600 kBq/m3, radonskerazine u hrvatskim toplicama su niske.
Ako se uzme u razmatranje najviša vrijednost radonske koncentracije uzatvorenim bazenima od 109,0 Bq/m3 (Stubičke Toplice) te faktor konverzije zabrzinu doze od 3,2 nSv/h po Bq/m3 [2], zaposlenici godišnje (uz pretpostavljenih2000 radnih sati) prime efektivnu dozu od 0,7 mSv/g što je ispod granične doze od6 mSv/g za radna mjesta.
Za istu smo lokaciju (Stubičke Toplice) odredili transfer faktor, f^ = (cz - c0) /cv.b koji opisuje doprinos radona iz vode povećanju koncentracije radona u zraku.Koncentracija radona u hotelskoj sobi iznosi c0 = 17,3 Bq/m3 te uzimajući vrijednostiza cz i cv-b iz Tablice 1, transfer faktor za obje godine (2003 i 2004) iznosi 4,9-10"3. Toje približno 50 puta veća vrijednost od uobičajene (10^) u kućama, koja se dobijeuporabom vode iz gradskog vodovoda [11].
250
VI. simpozij HDZZ, Stubičke Toplice, 2005.
ZAKLJUČAKProvedena su mjerenja radona u hrvatskim toplicama i dobivene su vrijednosti
koncentracije radona u zraku i vodi u bazenima u intervalima od (10,9 - 109,0) Bq/m3
te (0,73 - 18,6) kBq/m3, s odgovarajućim srednjim vrijednostima od 40,3 Bq/m3
odnosno 4,5 kBq/m3; koncentracije radona na izvorima su bile u intervalu od (2,02 -93,79) kBq/m3, sa srednjom vrijednosti od 19,6 kBq/m3. U usporedbi sa drugimzemljama Europe kao i Srednje odnosno Sjeverne Amerike, radonske razine uhrvatskim toplicama su niske. Uočena je velika razlika između koncentracije radonau vodi bazena i na izvoru te su razmatrani mogući razlozi u obliku miješanja običnei termalne vode u bazenu te radioaktivnog raspada radona; izvedena je jednadžba(1) za određivanje starosti vode u bazenu.
Za Stubičke Toplice je procijenjena efektivna doza koju primi prosječanzaposlenik. Dobivena vrijednost od 0,7 mSv/g je manja od granične doze od 6mSv/g za radna mjesta. Za istu lokaciju, Stubičke Toplice, određen je transferfaktor radona iz termalne vode prema zraku u zatvorenom bazenu, a koji iznosi4,9-10"3.
LITERATURA[I] International Commission on Radiological Protection (ICRP). Protection against
radon-222 at home and at work, ICRP Publication 65. Oxford: Pergamon Press;1993.
[2] International Atomic Energy Agency (IAEA). Radiation Protection against Radon inWorkplaces other than Mines, Safety Reports Series No. 33, Vienna: IAEA; 2003.
[3] Planinić J, Faj Z, Radolić V, Šuveljak B. Radon equilibrium factor and aerosols,Nuclear Instruments and Methods A 1997; 396:414-417.
[4] Planinić J, Faj Z, Šuveljak B, Radolić V, Vaupotič J, Kobal I. Radon in the spa ofBizovac, J Radioanal Nucl Chem, Articles 1996; 210(l):227-231.
[5] Kobal I, Krista J, Ancik M, Jerencic S, Skofljanec M. Radioactivity of thermal andmineral springs in Slovenia, Health Phys 1979; 37:239-242.
[6] Szerbin P. Natural radioactivity of certain spas and caves in Hungary, Environ Int1996; 22(l):389-398.
[7] Steinhausler F. Radon spas: Source term, doses and risk assessment, Radiat ProtDosim 1988; 24:257-259.
[8] Vogiannis E, Niaounakis M, Halvadakis C. Contribution of 222Rn-bearing water tothe occupational exposure in thermal baths, Environ Int 2004 (in press).
[9] Horvath A, Bohus L.O, Urbani F, Marx G, Piroth A, Greaves E.D. Radonconcentration in hot spring waters in northern Venezuela. J Environ Radioact 2000;47:127-133.
[10] Soto J, Fernandez PL, Quindos LS, Gomez-Arozamena J. Radioactivity in Spanishspas, Sci Total Environ 1995; 162:187-192.
[II] Nazaroff W. Radon and its decay products in air, Nero, A. (Eds), John Wiley &Sons, New York. 1988.
251
VI. simpozij HDZZ, Stubičke Toplice, 2005.
RADON LEVELS IN CROATIAN SPAS
Vanja Radolić, Branko Vuković, Denis Stanić and Josip PlaninićDepartment of Physics, University in Osijek, Trg Ljudevita Gaja 6,
HR-31000 Osijek, Croatiae-mail: [email protected]
Average radon concentrations in the air and geothermal water of spa pools inCroatia were 40.3 Bq/m3 and 4.5 kBq/m3, respectively. Substantial differencebetween radon concentrations in pool and spring water is explained by the mixingnormal and geothermal water in the pool and with radon decay. The estimatedannual effective dose received by the personnel in the spa of Stubičke toplice,Croatia was 0.7 mSv. At the same location, the calculated transfer factor of radonfor the air and thermal water in the pool was 4.9-10"3.
252
HR0500060VI. simpozij HDZZ, Stubičke Toplice, 2
COSMIC RADIATION AND AIRCREW EXPOSURE
Branko Vuković1, Ivan Lisjak2, Vanja Radolić1, Branko Vekić3
and Josip Planinić''Department of Physics, University of Osijek, P.O. Box 144,
HR-31000 Osijek, Croatia2Croatia Airlines, HR-10000 Zagreb, Croatia
3Rudjer Bošković Institute, Bijenička c. 54, HR-10000 Zagreb, Croatiae-mail: [email protected]
INTRODUCTIONA discovery of increased radiation at high altitude revealed (in the first half
of the 20th century) that we are bombarded by ionising particles from outer space[1]. Cosmic radiation has a galactic component, which normally is dominant, and acomponent of solar radiation. Galactic radiation is modified during its passagethrough space by interactions with interstellar matter, and in the environment of thesolar system, it consists of protons (88 %), alpha particles (11%), other heavier ionsup to iron (-1%) and electrons (2%). The energy of nuclei ranges up to over 1014
MeV [2].Transient, unusually high levels of cosmic radiation can result from solar
particles, produced by sudden, sporadic releases of energy in the solar atmosphere(solar flares), and by coronal mass ejections. Only a small fraction of solarradiation, on average one per year, produce large numbers of high-energy protons,which cause an observable increased intensity in cosmic radiation fields at aviationaltitudes. The maximum solar activity duration my be hours to several days.
When the primary particles from space, mainly protons, enter theatmosphere, those with high energy interact with air nuclei to induce the cosmic-ray shower [3]. Lower-energy particles are deflected back into space by earth'smagnetic field, that occurs more at the equator than near the poles. Neutrons areproduced via multi-step reactions; they lose energy by elastic collisions and, whenthermalized, are absorbed by 14N to form 14C. From a few hundred meters abovethe earth to near the top of the atmosphere there is an approximate equilibriumestablished between neutron production and absorption.
The high-energy particles incident on the atmosphere produce also neutralpions (in proton - nucleon reaction), those decay into high-energy photons, whichproduce electron-positron pairs leading to the production of annihilation photonsand so on - the electron-photon cascade. Pions charged decay into muons (+ and -)and neutrinos.
The dose rate from the combination of attenuation and particle productionincreases with depth in the atmosphere reaching a maximum at ~20 km, thendecreasing down to the Earth's surface. The contribution to dose from each particle
253
VI. simpozij HDZZ, Stubičke Toplice, 2005.
type depends on altitude and also phase of solar cycle. At aircraft altitudes andtemperate latitudes, representative values of the main components of ambient doseequivalent are neutrons 55%, electrons and positrons 20%, protons 15%, photons5% and muons 5%. At see level, the dominant component of dose equivalent is themuon component.
The radiation field in aircraft at altitude is complex, with many types ofradiation of large energy range. There is not a significant contribution to doseequivalent from energetic primary heavy charged particles. For dosimetric purposethe field can be divided into the non-neutron component (low Linear EnergyTransfer, LET) and the neutron one (high LET >10 keV/|im) which includes theneutron-like dose equivalent contribution by strong interactions of high-energyprotons. The summed components give total dose equivalent.
At the aircraft altitude or flight level of 10 km, one can receive an equivalentdose rate of about 10 uSv/h, where the photon and electron components due nearly45 %, neutrons 40 % and protons 15 % of the total dose [2,4]. The dose rate of thenatural radiation (without a radon component) at the ground level in Croatia isnearly 0.2
MATERIAL AND METHODSThe cosmic radiation dose for crews of the aircrafts A320 and ATR42 was
measured with the TLD-100 (LiF:Mg,Ti) detectors those eight members of theaircrews carried as personal dosimeters. The reading of the TL signal was carriedout at the Rudjer Bošković Institute using a modified TOLEDO 654 reader whichenables the integration of the glow curves with variable integration limits.Detectors were preheated at the temperature of 100 °C for 6 s and then heated tothe maximal temperature of 270 °C [5]. The calibration was performed with 137Csgamma rays by the dose rate of 0.62 mGy h"1. The dose at the lower detection limit,defined as three times the standard deviation of the zero reading of unirradiateddosemeter, was lOuGy.
Also the cosmic radiation dose was measured with the semiconductordosimeter Mini 6100 (Saint-Gobain Crystal & Detectors Ltd, England) that wascalibrated for the equivalent dose in mSv. The dosimeter Mini 6100 was fixed inthe pilot cabin during flights of the aircrafts A320 (Airbus) and ATR42, which hadthe flight level up to 12 km and 8 km, respectively, in September and October2003.
The concentration of radioactive gas radon (222Rn) in air of the aircraft wasmeasured with the Alpha Guard PQ2000 PRO detector (Genitron Instrument,Germany), which also registered air temperature, barometric pressure andhumidity. This measuring system uses a principle of the ionisation chamber andalpha-spectrometric technique for radon measurement.
254
VI. simpozij HDZZ, Stubičke Toplice, 2005.
RESULTS AND DISCUSSIONThe crew members of the aircrafts A320 and ATR40 carried the personal
dosimeter TLD-100 in September and October 2003 when the crew was working513 h; nearly 84 % of this time or 429 h the crew was in the air and 40 % of thetime or 172 h at the flight level (12 or 8 km). However, the reading of the TL signalfor all the eight dosimeters didn't show any absorbed dose higher than the dose ofthe lower detection limit (10 \xGy).
So we concluded that the exposure time for the TLD-100 dosimeters duringthe flights was too short, or the sensitivity of the TL detector was too low for thehigh-energy cosmic radiation at the flight level (about 10 km).
By using the dosimeter Mini 6100, the radiation dose measurement in theaircraft gave the results presented in Table 1.
Table 1. The dose equivalent (H), exposure time (t) and dose rate (H* = H/t) forthe crew of the aircraft A 320
Datum of reading16-30 Sept. 2003
30 Sept. - 8 Oct. 20038-24 Oct. 2003
24 - 31 Oct. 2003
H (mSv)0.27420.17790.33560.158
t(h)288.37193.40388.28167.20
H*(nSv/h)0.950.920.860.94
The average dose rate for the Airbus A320 was H*A = 0.917 |uSv/h and theestimated standard deviation sA = 0.040 ; the relative error was H*A/sA = 4.3 %. Thedose rate of the natural radiation at the ground level was 0.2 (u.Sv/h (hereby anatural radiation dose of the radon in air was not included). During the workingtime of 513 h, the aircraft crew has received the equivalent dose of 0.917x513 |nSv= 0.47 mSv. The above measurements were performed by the dosimeter Mini 6100at the Zagreb Airport.
For an aircraft crew working 500 h per year (in reality: 300 - 400 h), thedose equivalent per year under the mentioned conditions (working and naturaldose) is as follows: HAy = (0.917x500 + 0.2x(8767.2 - 500)) uSv = 2.1 mSv.
Of course, the dose rate at the flight level (12 km) was higher than theaverage H*A value; because the average time at the flight level was 33 % of theworking time, we were able to estimate the dose rate at the flight level of 12 km asH*FL=3xH*A = 2.S[xSv/h.
How to explain that the TLD-100 detector has not registered the above doseof 470 u.Sv? The average dose rate measured in the aircraft was a 4.6 factor higherthan the natural dose rate and it was not unexpected that the TL detector had lesssensitivity by the same factor (4.6 or more) for the high-energy cosmic radiation atthe altitude of about 10 km (otherwise, a relative TL response of the TLD-100decreases 30 % when photon energy increases from 40 to 120 keV [5]).
255
VI. simpozij HDZZ, Stubičke Toplice, 2005.
The dose rate was also measured with the Mini 6100 dosimeter during theflight of the aircraft ATR40 (flight level up to 8 km) and the obtained results arepresented in Table 2.
Table 2.- The dose equivalent (//), exposure time (t) and dose rate (//* = H/t) forthe crew of the aircraft ATR40
Datum of reading18-30 Sept. 20033 0 - 8 Oct. 20038-24 Oct. 2003
24-31 Oct. 2003
H (mSv)0.05450.07220.09630.0630
t(h)238.24289.12387.23166.21
H* (uSv/h)0.2290.2500.2490.379
The average dose rate for the aircraft ATR40 was H*ATR - 0.277 (aSv/h andthe estimated standard deviation SATR = 0.069; the relative error was: H*ATR/SATR
=
27.7 %. Herby the high relative error came from the last measurement of the H (24-31 Oct. 2003) when the dose equivalent rate (0.379 uSv) was a factor 1.56 higherthan the average of the other measurements; one could suppose that in this timeinterval (the last week of the October 2003) the Sun had a high activity thatproduced the enhanced dose equivalent (about 50 % of the average dose).
For the crew of the aircraft ATR40 working 500 h per year, the estimateddose equivalent (working and natural annual dose) was: HATR), = (0.277x500 +0.2x(8767.2 - 500)) ^Sv =1.8 mSv.
Comparing the dose rates for the aircrafts A320 and ATR40 (HA*/HATR* =3.3) showed that increasing flight level from 8 km to 12 km increased 3.3 timesthe respective dose equivalent.
An experiment about radon concentration in the atmosphere was carried outby the flight of the aircraft A320 from Zagreb to Paris (ZAG - CDG), and return,in December 2003. The Alpha Guard radon detector traveled in the aircraft at thesame line, so the detector registered radon concentration in air of the airplane every10 min, that was later observed considering the flight time and the altitude, aspresented in Figure 1.
256
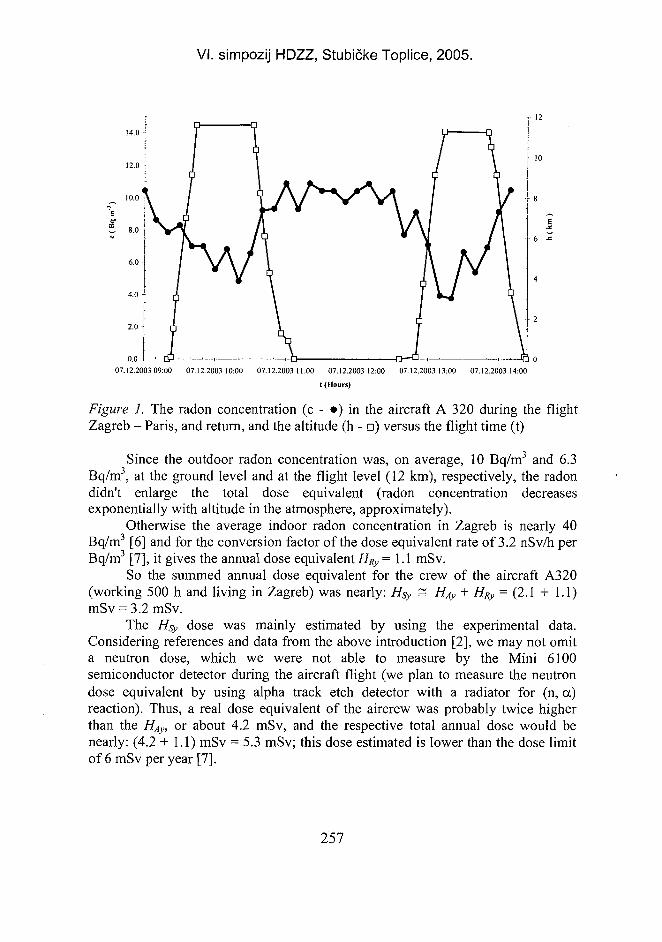
VI. simpozij HDZZ, Stubičke Toplice, 2005.
14.0
10.0 -•
2.0
0.007.12.2003 09:00 07.12.2003 10.00 07.12.2003 11:00 07.12.2003 12:00
t (Hours)
07.12.2003 13:00 07.12.2003 14:00
Figure 1. The radon concentration (c - •) in the aircraft A 320 during the flightZagreb - Paris, and return, and the altitude (h - •) versus the flight time (t)
Since the outdoor radon concentration was, on average, 10 Bq/m3 and 6.3Bq/m3, at the ground level and at the flight level (12 km), respectively, the radondidn't enlarge the total dose equivalent (radon concentration decreasesexponentially with altitude in the atmosphere, approximately).
Otherwise the average indoor radon concentration in Zagreb is nearly 40Bq/m3 [6] and for the conversion factor of the dose equivalent rate of 3.2 nSv/h perBq/m3 [7], it gives the annual dose equivalent HRy = 1.1 mSv.
So the summed annual dose equivalent for the crew of the aircraft A320(working 500 h and living in Zagreb) was nearly: Hsy = HAy + HRy = (2.1 + 1.1)mSv = 3.2mSv.
The HSy dose was mainly estimated by using the experimental data.Considering references and data from the above introduction [2], we may not omita neutron dose, which we were not able to measure by the Mini 6100semiconductor detector during the aircraft flight (we plan to measure the neutrondose equivalent by using alpha track etch detector with a radiator for (n, a)reaction). Thus, a real dose equivalent of the aircrew was probably twice higherthan the HAy, or about 4.2 mSv, and the respective total annual dose would benearly: (4.2 +1.1) mSv = 5.3 mSv; this dose estimated is lower than the dose limitof 6 mSv per year [7].
257
VI. simpozij HDZZ, Stubičke Toplice, 2005.
CONCLUSIONThe cosmic radiation dose for crews of the aircrafts A320 and ATR 42 was
measured with the TLD-100 (LiF:Mg,Ti) detectors during 45 days in September•and October 2003. Although 40 % of the time the crew was at the flight level (uptol2 km or 8 km), the reading of the TL signal for all the eight dosimeters didn'tshow any absorbed dose higher than the dose of the lower detection limit (10 uGy).We concluded that the exposure time for the TLD-100 dosimeters during the flightswas too short, or the sensitivity of the TL detector was too low for the high-energycosmic radiation at the flight level.
By using the dosimeter Mini 6100, the dose measurement gave the averagedose equilibrium of 0.917 uSv/h and 0.277 uSv/h in the aircrafts A320 andATR40, respectively. Since the average time at the flight level was 33 % of theworking time, we were able to estimate the dose rate for the aircraft crew (A320) atthe flight level of 12 km as 2.8 uSv/h.
Taking into account a dose rate of 0.20 uSv at the ground level, for anaircraft crew (A320) working 500 h per year, the dose equivalent per year was 2.1mSv. However it is to expect that a real dose at the flight level would be twicehigher than the dose measured with the Mini 6100 semiconductor dosimeter, whichdoesn't register any neutron dose.
Radon concentration measurement in the atmosphere showed that the radonlevel in aircraft decreased with altitude and it didn't enlarge the dose equivalent ofthe aircrew. The estimation of the total annual dose equivalent (including naturalradon dose of 1.1 mSv) of the crew of the aircraft A320 gave the value of 5.3 mSv,that was lower than the dose limit of 6 mSv per year.
REFERENCES[1] Anchordogui L, Paul T, Reucroft S, Swain J. Ultrahigh energy cosmic rays: the state
of the art before the Auger observatory. Int J Modern Phys 2003; 18:2229-2366.[2] Bartlett D. Radiation protection aspects of the cosmic radiation exposure of aircraft
crew. Radiat Protec Dosim 2004; 109:349-355.[3] Sheu R, Jiang S. Cosmic-ray-induced neutron spectra and effective dose rates near
air/ground and air/water interfaces in Taiwan. Health Phys 2003; 84:92-99.[4] Goldhagen P, Reginatto M, Kniss T, Wilson J, Singlettery J, Jones I, van Steveninck
W. Measurement of the energy spectrum of cosmic-ray induced neutrons aboard anER-2 high-altitude airpale. Nucl Instrum Meth A 2002; 476:42-51.
[5] Miljanić S, Ranogajec-Komor M, Knežević Ž, Vekić B. Main dosimetriccharacteristics of some tissue-equivalent TL detecors. Radiat Protec Dosim2002; 100:437-442.
[6] Planinić J, Lokobauer N, Franić Z, Bauman A. Radon dose in cellars during the warin Croatia. J Radioanal Nucl Chem Letters 1993; 176:91-101.
[7] International Atomic Energy Agency (IAEA). Radiation Protection against Radon inWorkplaces other than Mains, Safety Reports Series, No. 33. IAEA,Vienna: 2003.
258
VI. simpozij HDZZ, Stubičke Toplice, 2005.
ABSTRACTWhen the primary particles from space, mainly protons, enter the atmosphere,
they interact with the air nuclei and induce cosmic-ray shower. When an aircraft isin the air, the radiation field within includes many types of radiation of largeenergy range; the field comprises mainly photons, electrons, positrons andneutrons. Cosmic radiation dose for crews of aircrafts A320 and ATR 42 wasmeasured using TLD-100 (LiF: Mg, Ti) detectors and the Mini 6100semiconductor dosimeter; radon concentration in the atmosphere was measuredusing the Alpha Guard radon detector. The total annual dose estimated for theA320 aircraft crew, at altitudes up to 12000 meters, was 5.3 mSv (including naturalradon radiation dose of 1.1 mSv).
259
HR0500061VI. simpozij HDZZ, Stubičke Toplio
RAD S OTVORENIM IZVORIMA ZRAČENJA
Mihovil Hus! i Stipe Lulić2
'Sveučilište u Zagrebu, Šumarski fakultet, Svetošimunska c. 25,10000 Zagreb
2Institut "Ruđer Bošković", Bijenička c. 54, 10000 Zagrebe-mail: [email protected]
UVODRizik za eksperimentatora koji je izložen zračenju pri radu s izvorima
radioaktivnog zračenja moguće je procijeniti ako je poznata apsorbirana doza utijelu eksperimentatora. Ta se doza ne može mjeriti, već se može odrediti naodređenim mjestima u prostoru oko izvora zračenja, očitavanjem osobnogdozimetra eksperimentatora ili proračunom uz poznate podatke o izvoru zračenja.Ovisno o izvoru zračenja, radnim i drugim uvjetima, apsorbirane doze mogu serekonstruirati na različite načine [1,2].
Apsorbirana doza pri radu s otvorenim izvorima zračenja ovisi o mogućnostifizičke zaštite od zračenja, koja je uvjetovana razinom zračenja te radnimoperacijama pri izvođenju eksperimenta. U članku je prikazan rad s otvorenimizvorima zračenja, pri istraživanju adsorpcije kationa iz otopine na čvrstu fazu,primjenom tehnike radioaktivnih obilježivača [3-5]. Korišteni obilježivači bili suradionuklidi 152'154Eu i u manjoj mjeri 51Cr i I 3 I I. Iz podataka o radioaktivnostimaterijala s kojim ja rađeno, izračunate su približne doze zračenja, u prostoru radaeksperimentatora. Raspravljanje odnos izračunatih doza i podataka dozimetrijskognadzora primjenom osobnog film dozimetra eksperimentatora.
METODA RADA U EKSPERIMENTIMA
Eksperimentalna procedura ispitivanja adsorpcije sastoji se u pripremanjusistema, stajanju sistema za vrijeme uspostavljanja adsorpcijske ravnoteže,izdvajanju čvrste faze iz sistema, te mjerenja radioaktivnosti čvrste faze [3-5].
Pojedini ispitivani sistem je 100 mL vodene otopine dušične kiseline,natrijeve soli jodida, bromida ili klorida, ili sumporovodika, europijeva ili kromovanitrata i radioaktivnog obilježivača l52>154Eu, 5 lCr ili 1 3 l I, u standardnojlaboratorijskoj čaši volumena 250 mL. U otopini su istaloženi ili dodani unaprijedpripremljeni srebrovi halogenidi ili sulfid. Sistemi su pripremani na uobičajeninačin, dodavanjem u odmjereni volumen vode u čaši, određenih količinakoncentriranih otopina pipetiranjem, te na kraju dodavanjem 1 mL otopineradioaktivnog obilježivača također pipetiranjem. Na taj je način formiranradioaktivni izvor valjkastog oblika približnog promjera 5 cm i visine 5 cm.
260
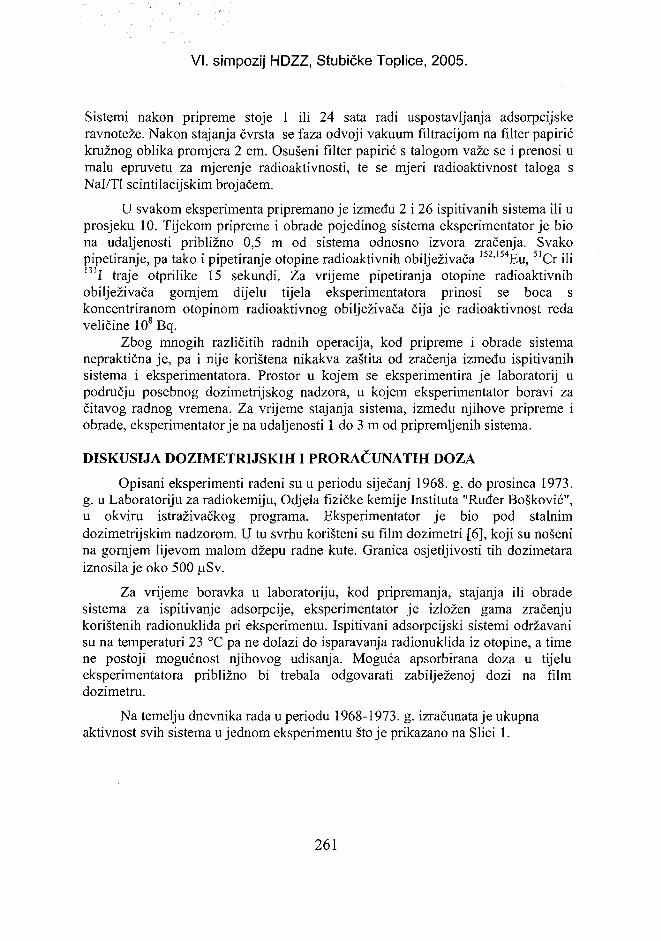
VI. simpozij HDZZ, Stubičke Toplice, 2005.
Sistemi nakon pripreme stoje 1 ili 24 sata radi uspostavljanja adsorpcijskeravnoteže. Nakon stajanja čvrsta se faza odvoji vakuum filtracijom na filter papirićkružnog oblika promjera 2 cm. Osušeni filter papirić s talogom važe se i prenosi umalu epruvetu za mjerenje radioaktivnosti, te se mjeri radioaktivnost taloga sNal/Tl scintilacijskim brojačem.
U svakom eksperimenta pripremano je između 2 i 26 ispitivanih sistema ili uprosjeku 10. Tijekom pripreme i obrade pojedinog sistema eksperimentator je biona udaljenosti približno 0,5 m od sistema odnosno izvora zračenja. Svakopipetiranje, pa tako i pipetiranje otopine radioaktivnih obilježivača 1 5 2 l l 5 4Eu, 5 lCr ili1 3 1I traje otprilike 15 sekundi. Za vrijeme pipetiranja otopine radioaktivnihobilježivača gornjem dijelu tijela eksperimentatora prinosi se boca skoncentriranom otopinom radioaktivnog obilježivača čija je radioaktivnost redaveličine IO8 Bq.
Zbog mnogih različitih radnih operacija, kod pripreme i obrade sistemanepraktična je, pa i nije korištena nikakva zaštita od zračenja između ispitivanihsistema i eksperimentatora. Prostor u kojem se eksperimentira je laboratorij upodručju posebnog dozimetrijskog nadzora, u kojem eksperimentator boravi začitavog radnog vremena. Za vrijeme stajanja sistema, između njihove pripreme iobrade, eksperimentator je na udaljenosti 1 do 3 m od pripremljenih sistema.
DISKUSIJA DOZIMETRIJSKIH I PRORAČUNATIH DOZA
Opisani eksperimenti rađeni su u periodu siječanj 1968. g. do prosinca 1973.g. u Laboratoriju za radiokemiju, Odjela fizičke kemije Instituta "Ruđer Bošković",u okviru istraživačkog programa. Eksperimentator je bio pod stalnimdozimetrijskim nadzorom. U tu svrhu korišteni su film dozimetri [6], koji su nošenina gornjem lijevom malom džepu radne kute. Granica osjetljivosti tih dozimetaraiznosila je oko 500 uSv.
Za vrijeme boravka u laboratoriju, kod pripremanja, stajanja ili obradesistema za ispitivanje adsorpcije, eksperimentator je izložen gama zračenjukorištenih radionuklida pri eksperimentu. Ispitivani adsorpcijski sistemi održavanisu na temperaturi 23 °C pa ne dolazi do isparavanja radionuklida iz otopine, a timene postoji mogućnost njihovog udisanja. Moguća apsorbirana doza u tijelueksperimentatora približno bi trebala odgovarati zabilježenoj dozi na filmdozimetru.
Na temelju dnevnika rada u periodu 1968-1973. g. izračunata je ukupnaaktivnost svih sistema u jednom eksperimentu stoje prikazano na Slici 1.
261
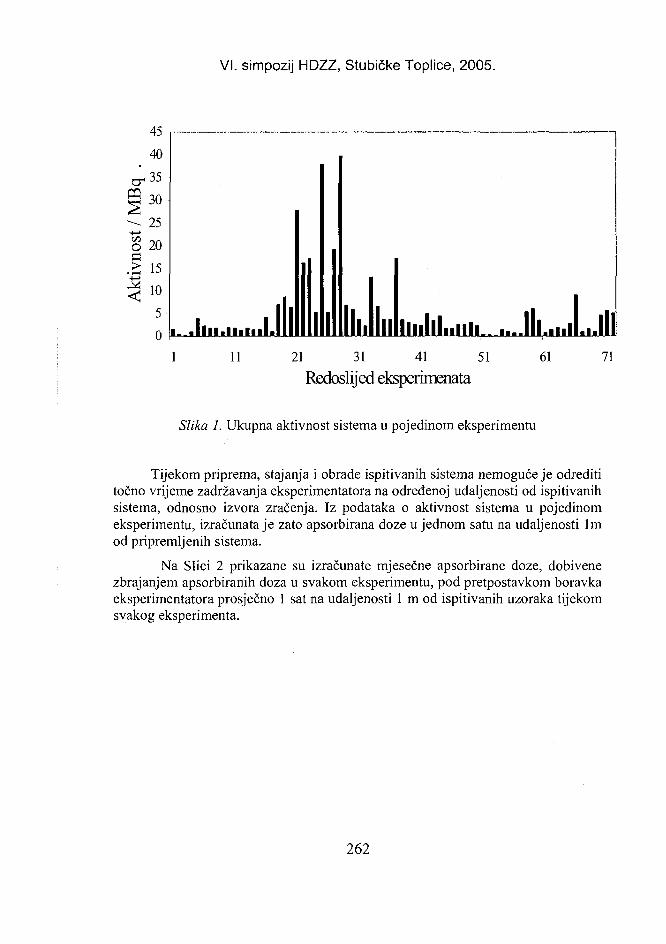
VI. simpozij HDZZ, Stubičke Toplice, 2005.
C/3O
45
40
35
30
25
20
15
10
5
0 • llll.llilnli liiiliLnii ••-.III.11 21 31 41 51
Redoslijed eksperimenata61 71
Slika 1. Ukupna aktivnost sistema u pojedinom eksperimentu
Tijekom priprema, stajanja i obrade ispitivanih sistema nemoguće je odredititočno vrijeme zadržavanja eksperimentatora na određenoj udaljenosti od ispitivanihsistema, odnosno izvora zračenja. Iz podataka o aktivnost sistema u pojedinomeksperimentu, izračunata je zato apsorbirana doze u jednom satu na udaljenosti lmod pripremljenih sistema.
Na Slici 2 prikazane su izračunate mjesečne apsorbirane doze, dobivenezbrajanjem apsorbiranih doza u svakom eksperimentu, pod pretpostavkom boravkaeksperimentatora prosječno 1 sat na udaljenosti 1 m od ispitivanih uzoraka tijekomsvakog eksperimenta.
262
VI. simpozij HDZZ, Stubičke Toplice, 2005.
500
400
300
200
100
0 I li II.. i I I I I I • I
11 21 31 41 51Redoslijed mjeseci
61 71
Slika 2. Izračunate mjesečne apsorbirane doze u periodusiječanj 1968. do prosinaca 1973. g
Iz Slike 2 vidljivo je da izračunate mjesečne apsorbirane doze ne prelazevrijednosti od 400 |aSv.
U dozimetrijskom nadzoru eksperimentatora, film dozimetri očitavani sumjesečno. U periodu 1968. do 1973. godine nadzorna služba nije izvijestila dajeeksperimentator primio bilo koju dozu zračenja. Ovo je razumljivo jer su približnoizračunate doze uvijek bile ispod granice osjetljivosti film dozimetra od 500 JISV.
Ukupna izračunata doza, na način kako je opisano, za 6 godina rada iznosi1311 |j.Sv, ili u prosjeku godišnje 218,5 |iSv, što je unutar godišnje dopuštenevrijednosti.
ZAKLJUČAKPrimjena tehnike radioaktivnih obilježivača u analizi malih količina
kemijskih tvari veoma je jednostavna metoda analize. U primjeni te tehnike radi ses otvorenim izvorima radioaktivnog zračenja, što zahtijeva da eksperimentator imaodgovarajuće obrazovanje za rad s otvorenim izvorima zračenja, te da je podstalnim dozimetrijskim nadzorom. Odvija li se rad na neodgovarajući način,postoji opasnost od primanja više od dozvoljenih doza zračenja. Izračunatevrijednosti doza tijekom rada s otvorenim izvorima zračenja, opisanima u ovomradu, niže su od maksimalno dozvoljenih. Njihove mjesečne vrijednosti nije bilomoguće zabilježiti film dozimetrom, jer je njihova granica osjetljivosti bilaprevisoka.
263
VI. simpozij HDZZ, Stubičke Toplice, 2005.
LITERATURA[]] Vrtar M, Rekonstrukcija adsorbirane doze vanjskog gama zračenja pri radijacijskom
akcidentu, U: Franić Z, Kubelka D. ur., Zbornik radova Drugog simpozija Hrvatskogdruštva za zaštitu od zračenja, 23-25. studenoga 1994. Zagreb, Hrvatska, HDZZ,Zagreb, 1994., str. 207-211.
[2] Janžeković H, Krizman M, Analysis of Workers' Doses in the Krško NPP, U:Krajcar Bronić I, Miljanić S, Obelić B. ur., Zbornik radova Petog simpozijaHrvatskog društva za zaštitu od zračenja, 9.-11. travnja 2003., Stubičke Toplice,Hrvatska, HDZZ, Zagreb, 2003. str. 183-186.
[3] Hus M, Herak MJ. Determination of the Ion-adsorption on the AgBr Systems by theRadioactive Tracer Tecnique Colloid and Polymer Science, 1976;254:903-906.
[4] Hus M, Herak MJ, Investigation of Ion Adsorption on Silver Sulfide, Iodide andBromide Precipitates by the Radioactive Tracer Technique, J Radioanal Nucl Chem1993;171:407-415.
[5] Hus M, On the Counterion Adsorption Equilibrium, Croat Chem Acta,1996;69:1149-1158.
[6] Vekić B, Ranogajec-Komor M, Miljanić S, Dvornik I. Dozimetrijske metode U:Andrić S. ur., Zbornik seminara "Klinička dozimetrija", 23-26. svibnja 1988.Beograd, Jugoslavija, Društvo za mjernu tehniku Srbije, Beograd, 1988. str.51-64.
[7] U.S. Nuclear Regulatory Commission Regulatory Guide (1976) Calculating ofAnnual Doses to Man from Routine Releases of Reactor Effluents for the Purpose ofEvaluating Compliance with 10 CFR Part 50, 1 109, Appendix I
WORK WITH OPEN RADIATION SOURCES
Mihovil Hus1 and Stipe Lulić2
'University of Zagreb, Faculty of Forestry, Svetošimunska c. 25,2Ruđer Bošković Institute, Bijenička 54,
HR-10000 Zagreb, Croatiae-mail: [email protected]
The risk for persons exposed to radiation during work with radioactivematerials can be estimated from the dose their body has absorbed. This parametercannot be measured exactly. Dose can be obtained from the dosimeter data or canbe calculated from specific features of the radiation source. This article describeslong-term work with open radiation sources and experimental studies of cationadsorption on solid/liquid interface using the radioactive tracer technique. Theexperiments included isotopes 152'154Eu, 1 3 II and 51Cr. Radiation doses in workingspace were calculated from data about source activity and exposure time. Theywere below 400 uSv per month. Film dosimeter could not detect these dosesbecause its detection limit is >500 uSv. The average total calculated dose for a six-year period was 1311 uSv or 218.5 uSv per year. This value is lower thanpermitted annual value.
264
VI. simpozij HDZZ, Stubičke Toplice, ^ HR0finnnB2
PRIMJERI PROCJENE EFEKTIVNE DOZE ZRAČENJA
Gordana Marović, Zdenko Franić i Jasminka SenčarInstitut za medicinska istraživanja i medicinu rada
Ksaverska c. 2, 10000 Zagrebe-mail: marovic(2>imi.hr
UVODOd vremena otkrića radioaktivnosti i postepenog ovladavanja i iskorištavanja
pojava vezanih uz radioaktivnost razvijala se i ideja o potrebi zaštite odionizirajućeg zračenja. Razvoj ideje zaštite od zračenja u sustavnu djelatnost -danas je to razvijena doktrina i disciplina koja holističkim pristupom briguje nesamo o ljudima izloženima zračenju već i o ljudskom okruženju, o okolini.Razvojni trendovi u znanstvenom i tehnološkom području neprestano unose novesastavnice u doktrinu zaštite od zračenja što vodi novim preporukama kaminimiziranju izlaganja zračenju i redukciji rizika.
Radiološke nesreće dodatno senzibiliziraju ljude na opasnosti odionizirajućeg zračenja. Nesreće, kao ona u Čornobilju 1986. godine, postavljajupred cjelokupnu zajednicu pitanja o granicama doza ionizirajućeg zračenja kako nalokalnoj tako i na međunarodnoj razini. Svakodnevni intenzivni promet roba, ljudi iusluga dodatno opterećuju probleme vezane uz ograničavanja koja su nužna uslučaju nesreće razmjera one Čornobiljske. No, postavlja se pitanje o uspostavi iodržavanju jednako vrijednih standarda radiološke zaštite.
Brojnim propisima i preporukama pokušava se urediti život i djelatnost ljudiu stvarnom životnom okruženju na način da se minimiziraju rizici i očuvaradiološka čistoća habitata.
RASPRAVAEuropska je zajednica odmah po nesreći u Čornobilju ograničila protok roba
uspostavom kriterija aktivnosti radiocezija od 1000 Bq/kg za mlječne proizvode i1250 Bq/kg za ostale namirnice. Ubrzo je međutim pooštrila te kriterije na 370Bg/kg za mliječne proizvode i 600 Bq/kg za ostale namirnice [1,2]. Svaku robuprate certifikati u kojima stoji:
265
VI. simpozij HDZZ, Stubičke Toplice, 2005.
18.1, undersigned, certify that the accumulated radioactivity level in terms ofcaesium 134 and 137 for Ihe products described above does not exceed:
370 Bq/kg for milk and milk products and for foodstuffs intended for thespecial feeding of infants, and 600 Bq/kg for all other products listed in (he currentCommission Regulation relating to Council Regulation (EEC) No 737/90 (1)
Place Date Name(in block letters) Signature(2) Stanpicachet c >
( 1 ) Delete as appropriate( 2 ) Signatures and stamps must be in a different colour from that of the text.
Potom su arapske zemlje ograničile uvoz roba podrijetlom iz Europe ukojima je koncentracija aktivnosti cezija veća od 50 Bq/kg (neke čak i od 20Bq/kg). Srbija i Crna Gora definirale su među ostalim i 5 Bq/kg l37Cs kaomaksimalno dozvoljenu vrijednost u napicima [3].
Jedinica za zaštitu od zračenja Instituta za medicinska istraživanja i medicinurada iz Zagreba (IMI), kao ovlaštene ustanova za poslove zaštite od zračenja (NNRH 100/2000), provodi gamaspektrometrijske analize uzoraka za utvrđivanjekoncentracije aktivnosti radiocezija uzorka namirnica kao i uzoraka opće uporabenamijenjenih izvozu ili onih uvezenih u Hravtsku. Izdaju se mišljenja - certifikati ukojima se poziva na preporuke i mišljenje Europske zajednice, kao i na nacionalnulegislativu.
Zbog uglavnom političke pozadine uredaba o graničnim vrijednostimaradiocezija u pojedinim namirnicama dolazi do situacija koje izgledaju aferaški inepovoljno se odražavaju na zajednicu znanstvenika i stručnjaka iz područja zaštiteod zračenja. Medijski napuhane priče o aktivnosti 137Cs u sokovima od borovnice (ito onima proizvedenima u Fructalu u Ajdovščini u Sloveniji) ili u biljnimmješavinama za čaj, rezultiraju uznemiravanjem javnosti i nepovjerenjem premanacionalnim autoritetima koji provode mjere zaštite od zračenja.
Područje zaštite od zračenja jedno je od zakonskim aktima uređenijihpodručja u Republici Hrvatskoj. Uvažavanjem međunarodnih preporuka i propisakao generičkih dokumenata [4], preporuke International Commission on RadiationProtection, ICRP, standardi International Atomic Energy Agency, IAEA, WorldHealth Organization, WHO, European Union, EU, uredilo se područje zaštite odzračenja. Donesen je Zakon o zaštiti od ionizirajućih zračenja (Narodne novine RH27/99) i iz njega slijede Pravilnici koji reguliraju posebna - specifična područjazaštite od zračenja.
Pravilnikom o granicama izlaganja ionizirajućim zračenjima, te o uvjetimaizlaganja u posebnim okolnostima i za provedbe intervencija u izvanrednomdogađaju (NN 108/99) definira se u članku 7: "Za osobe koje ne rade s izvorimaionizirajućih zračenja ozračenje ne smije biti više od: efektivna doza do 1 mSv ujednoj godini...." Također su člankom 12. i u tablici 10. definirane akcijske razinekoncentracija aktivnosti određenih radionuklida za hranu i vodu za piće. Za 137Cs
266
VI. simpozij HDZZ, Stubičke Toplice, 2005.
akcijska razina koncentracije aktivnosti za hranu i namirnice u općoj uporabi iznosi1 kBq/kg, isto kao i za mlijeko, dječju hranu i vodu za piće.
U Pravilniku o uvjetima, načinu, mjestima i rokovima sustavnih ispitivanjaionizirajućih zračenja, te vrste i aktivnosti radiokativnih tvari u okolišu (NN 86/00)u Prilogu III (članak 36.) definiraju se pretpostavke za proračun izloženostiionizirajućem zračenju, među inim, utvrđuje se maksimalno dopuštenakoncentracija aktivnosti za vodu kao koncentracija radionuklida vrste r (Cr) i onaprosječno u jednoj godini u volumnom metru vode ne smije biti veća od
Cr = Minr : — — (1)V ( 3 - l ) { ) { S B - x )
gdje je:Vg - količina konzumirane pitke vode u jednoj godini po osobi,er(g) - pretvorbeni koeficijent doze - očekivana efektivna doza po jedinici
unesene aktivnosti gutanjem sukladno Pravilniku o granicama izlaganjaionizirajućim zračenjima te o uvjetima izlaganja u posebnim okolnostima i zaprovedbe intervencija u izvanrednom događaju (NN 108/99).
Izračunamo li iz relacije (1) maksimalno dopuštenu koncentraciju aktivnosti137Cs za vodu uz pretpostavke za proračun izloženosti ionizirajućem zračenjuodrasle jedinke u općoj populaciji dobivamo koncentraciju aktivnosti 137Cs uvrijednosti od 524 Bq/1.
Svjetska je zdravstvena organizacija u svojim Preporukama za kvalitetu pitkevode (drugo izdanje iz 1993. godine) na temelju referentne vrijednosti od 0,1 mSvočekivane efektivne doze od jednogodišnjeg unosa pitke vode definiralakoncentracije aktivnosti različitih radionuklida u pitkoj vodi [5]. Referentnavrijednost efektivne doze od 0,1 mSv predstavlja manje od 5% prosječne efektivnedoze koju godišnje pripisujemo prirodnom pozadinskom zračnju. Proračuni suprovedeni za dnevni unos dvije litre vode. Vrijednost za 137Cs iznosi 10 Bq/1.
Pogledamo li sada prije spomenute "problematične" vrijednosti koncentracijaaktivnosti l37Cs nekih namirnica u Tablici 1 postavlja se pitanje da li za sokovevrijede iste granične ("dozvoljene") vrijednosti kao za pitku vodu, primjenjuju li sete vrijednosti na biljnu mješavinu ili na pripravak koji se po recepturi spravlja iunosi kao tekućina u organizam?
267
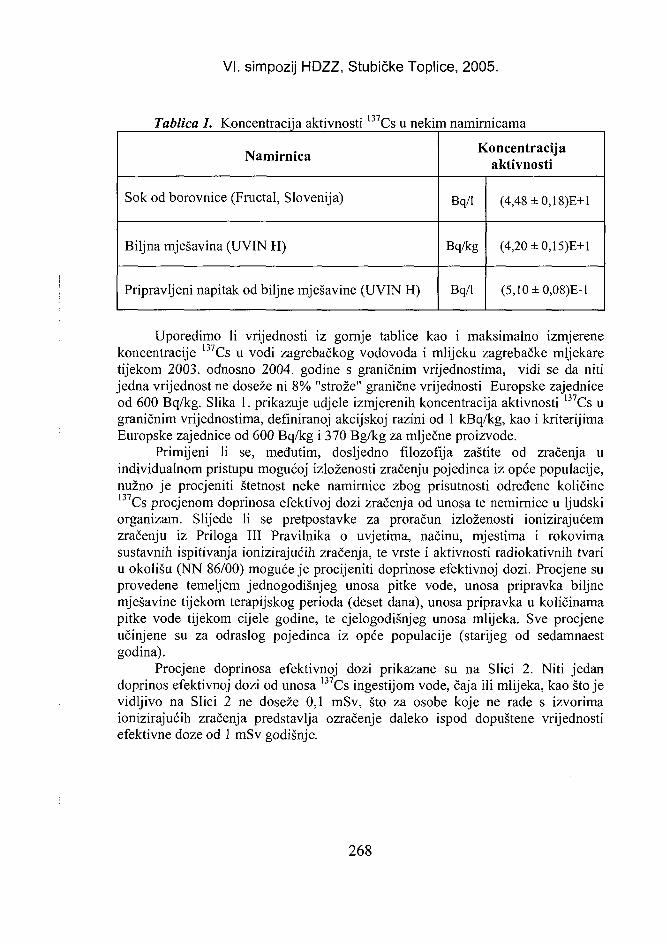
VI. simpozij HDZZ, Stubičke Toplice, 2005.
Tablica 1. Koncentracija aktivnosti 137Cs u nekim namirnicama
Namirnica
Sok od borovnice (Fructal, Slovenija)
Biljna mješavina (UVIN H)
Pripravljeni napitak od biljne mješavine (UVIN H)
Koncentracijaaktivnosti
Bq/1
Bq/kg
Bq/l
(4,48±0,18)E+l
(4,20±0,15)E+l
(5,10±0,08)E-l
Uporedimo li vrijednosti iz gornje tablice kao i maksimalno izmjerenekoncentracije 137Cs u vodi zagrebačkog vodovoda i mlijeku zagrebačke mljekaretijekom 2003. odnosno 2004. godine s graničnim vrijednostima, vidi se da nitijedna vrijednost ne doseže ni 8% "strože" granične vrijednosti Europske zajedniceod 600 Bq/kg. Slika 1. prikazuje udjele izmjerenih koncentracija aktivnosti l37Cs ugraničnim vrijednostima, definiranoj akcijskoj razini od I kBq/kg, kao i kriterijimaEuropske zajednice od 600 Bq/kg i 370 Bg/kg za mlječne proizvode.
Primijeni li se, međutim, dosljedno filozofija zaštite od zračenja uindividualnom pristupu mogućoj izloženosti zračenju pojedinca iz opće populacije,nužno je procjeniti štetnost neke namirnice zbog prisutnosti određene količine137Cs procjenom doprinosa efektivoj dozi zračenja od unosa te nemirnice u ljudskiorganizam. Slijede li se pretpostavke za proračun izloženosti ionizirajućemzračenju iz Priloga III Pravilnika o uvjetima, načinu, mjestima i rokovimasustavnih ispitivanja ionizirajućih zračenja, te vrste i aktivnosti radiokativnih tvariu okolišu (NN 86/00) moguće je procijeniti doprinose efektivnoj dozi. Procjene suprovedene temeljem jednogodišnjeg unosa pitke vode, unosa pripravka biljnemješavine tijekom terapijskog perioda (deset dana), unosa pripravka u količinamapitke vode tijekom cijele godine, te cjelogodišnjeg unosa mlijeka. Sve procjeneučinjene su za odraslog pojedinca iz opće populacije (starijeg od sedamnaestgodina).
Procjene doprinosa efektivnoj dozi prikazane su na Slici 2. Niti jedandoprinos efektivnoj dozi od unosa 137Cs ingestijom vode, čaja ili mlijeka, kao stojevidljivo na Slici 2 ne doseže 0,1 mSv, što za osobe koje ne rade s izvorimaionizirajućih zračenja predstavlja ozračenje daleko ispod dopuštene vrijednostiefektivne doze od 1 mSv godišnje.
268
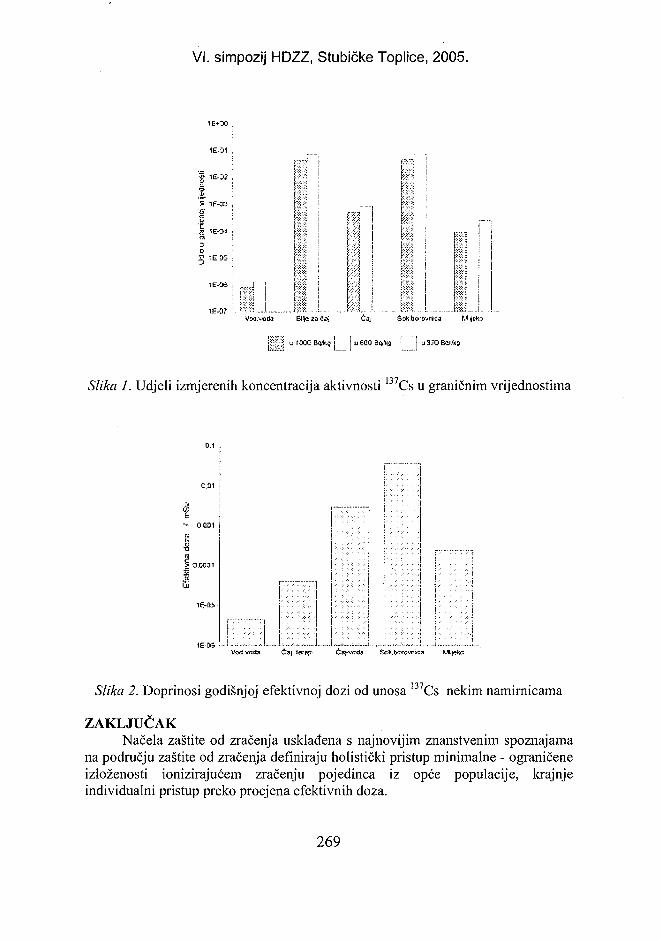
VI. simpozij HDZZ, Stubičke Toplice, 2005.
1E3i
IE-Si
fv::V:
; • • / :
: ; •!>
1.-• 5
>£$
I• : : . • • . • • : '
" : ; • : • . : : •
•.•••x>,
'•;•:".<
••
••
-
TIV?-!
:; :?rs
>•:::
•:•: •:•:
V-K
IXG B^fc; | u
/. Udjeli izmjerenih koncentracija aktivnosti Cs u graničnim vrijednostima
-- O0Q1
IV
ti
' • - ; : • . . • •
\:;v.r.
,', '. : .,.;
; : . ' ; . . ; ; • ; •
: - ' • : • • •••
- . ' '
;:.;.:..:
:. ;. ,. | j . , ,. ". . ;.. .
, • • : • . ' " : J
''• . . ' ''•• i
1
: : ; -. I:,;. •:.: j
. . . . . . . j
Slika 2. Doprinosi godišnjoj efektivnoj dozi od unosa 137Cs nekim namirnicama
ZAKLJUČAKNačela zaštite od zračenja usklađena s najnovijim znanstvenim spoznajama
na području zaštite od zračenja definiraju holistički pristup minimalne - ograničeneizloženosti ionizirajućem zračenju pojedinca iz opće populacije, krajnjeindividualni pristup preko procjena efektivnih doza.
269
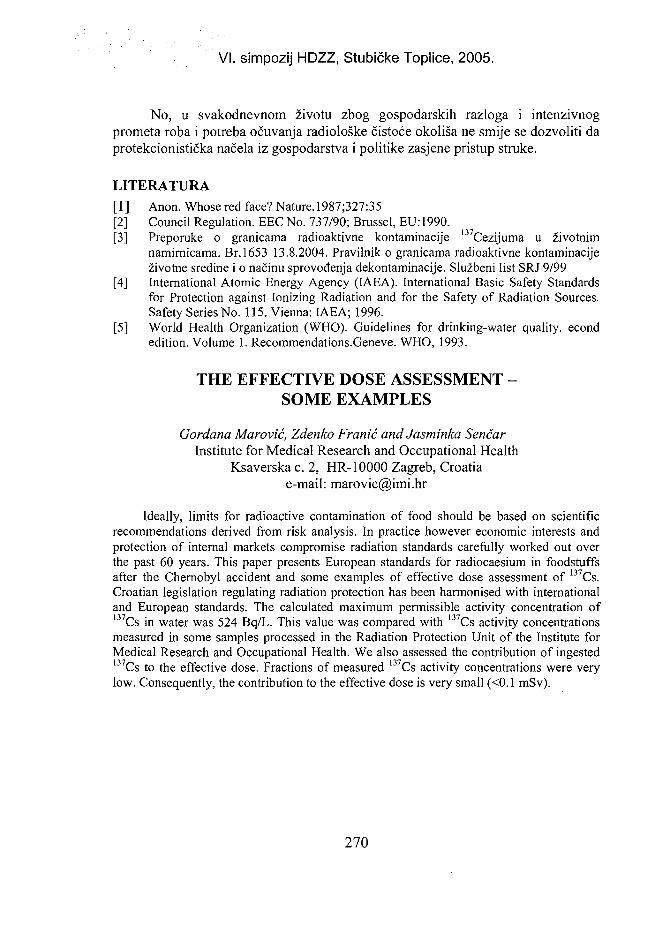
VI. simpozij HDZZ, Stubičke Toplice, 2005.
No, u svakodnevnom životu zbog gospodarskih razloga i intenzivnogprometa roba i potreba očuvanja radiološke čistoće okoliša ne smije se dozvoliti daprotekcionistička načela iz gospodarstva i politike zasjene pristup struke.
LITERATURA
[1] Anon. Whose red face? Nature. 1987;327:35[2] Council Regulation. EEC No. 737/90; Brussel, EU: 1990.[3] Preporuke o granicama radioaktivne kontaminacije 137Cezijuma u životnim
namirnicama. Br.1653 13.8.2004. Pravilnik o granicama radioaktivne kontaminaciježivotne sredine i o načinu sprovođenja dekontaminacije. Službeni list SRJ 9/99
[4] International Atomic Energy Agency (IAEA). International Basic Safety Standardsfor Protection against Ionizing Radiation and for the Safety of Radiation Sources.Safety Series No. 115. Vienna: IAEA; 1996.
[5] World Health Organization (WHO). Guidelines for drinking-water quality, econdedition. Volume 1. Recommendations.Geneve. WHO, 1993.
THE EFFECTIVE DOSE ASSESSMENT -SOME EXAMPLES
Gordana Marović, Zdenko Franić and Jasminka SenčarInstitute for Medical Research and Occupational Health
Ksaverska c. 2, HR-10000 Zagreb, Croatiae-mail: [email protected]
Ideally, limits for radioactive contamination of food should be based on scientificrecommendations derived from risk analysis. In practice however economic interests andprotection of internal markets compromise radiation standards carefully worked out overthe past 60 years. This paper presents European standards for radiocaesium in foodstuffsafter the Chernobyl accident and some examples of effective dose assessment of 137Cs.Croatian legislation regulating radiation protection has been harmonised with internationaland European standards. The calculated maximum permissible activity concentration of137Cs in water was 524 Bq/L. This value was compared with l37Cs activity concentrationsmeasured in some samples processed in the Radiation Protection Unit of the Institute forMedical Research and Occupational Health. We also assessed the contribution of ingested137Cs to the effective dose. Fractions of measured 137Cs activity concentrations were verylow. Consequently, the contribution to the effective dose is very small (<0.1 mSv).
270
VI. simpozij HDZZ, Stubičke Toplice, 2 HR0500063
KONCENTRACIJE AKTIVNOSTI 9 0Sr U MLIJEKU IOBORINAMA GRADA ZAGREBA
Manda Maračić, Nevenka Lokobauer i Zdenko FranićInstitut za medicinska istraživanja i medicinu rada
Ksaverska c. 2, 10000 Zagrebe-mail: [email protected]
UVODZnačajnije prisustvo umjetno stvorenih radionuklida u životnoj sredini datira
s početka nuklearnih proba krajem pedesetih i početkom šezdesetih godinaprošloga stoljeća. Drugi mehanizam oslobađanja umjetno stvorenih radionuklida uatmosferu jest rad nuklearnih postrojenja, tako da se pored prirodnih radionuklida uatmosferi nalaze i različiti fisijski produkti. Iz atmosfere, radioaktivni materijaldeponira se radioaktivnim oborinama (fallout) na površinu Zemlje i postajesastavni dio kružnog toka vode u biosferi.
Pri nuklearnim eksplozijama u atmosferu se ispušta više od 400radioaktivnih izotopa od kojih je njih četrdesetak potencijalno opasnih za zdravlječovjeka. Jedan od njih je radiostroncij. Nadzemnim nuklearnim eksplozijamaradioaktivni materijal dospijeva u više slojeve atmosfere odakle se lagano spušta uprizemne slojeve. Vrijeme boravka 90Sr u atmosferi ovisi od načina na koji jedospio u atmosferu; testovima nuklearnog oružja, ili neželjenim oslobađanjem iznuklearnih postrojenja.
Izotop 90Sr ubraja se u skupinu visoko toksičnih radionuklida (prva grupatoksičnosti). Uzimanjem hrane i vode kontaminirane radiostroncijem zbognjegovog vremena poluraspada (T1/2=29 godina) i mogućnosti zadržavanja uljudskom organizmu na duže vrijeme, može doći do zdravstvenih problema. Zbogsvojih kemijskih i fizikalnih karakteristika te metaboličkih svojstava sličan jekalciju pa se u nedostatku kalcija u organizmu ugrađuje na njegovo mjesto. Kakoljudske kosti imaju najveći sadržaj kalcija, ugrađeni 90Sr u stanicama koštanogtkiva može izazvati sarkom kosti.
U ciklusu radioaktivne kontaminacije produkata animalnog porijekla nužnoje praćenje koncentracije radiostroncij a u mlijeku. S obzirom da je mlijeko jednaod značajnih komponenti prehrane bogate kalcijem, osobito kod djece i dojenčadi[1] mlijeko je najpodesniji izvor preko kojeg može doći do radioaktivnekontaminacije čovjeka stroncijem putem namirnica animalnog podrijetla. UInstitutu za medicinska istraživanja i medicinu rada u Zagrebu u Jedinici za zaštituod zračenja provode se istraživanja radioaktivnosti u svim medijima biosfere patako i u mlijeku i oborinama [2,3].
U ovom radu praćena je koncentracija aktivnosti 90Sr u mlijeku i oborinamagrada Zagreba kroz period 1994 - 2003.
271
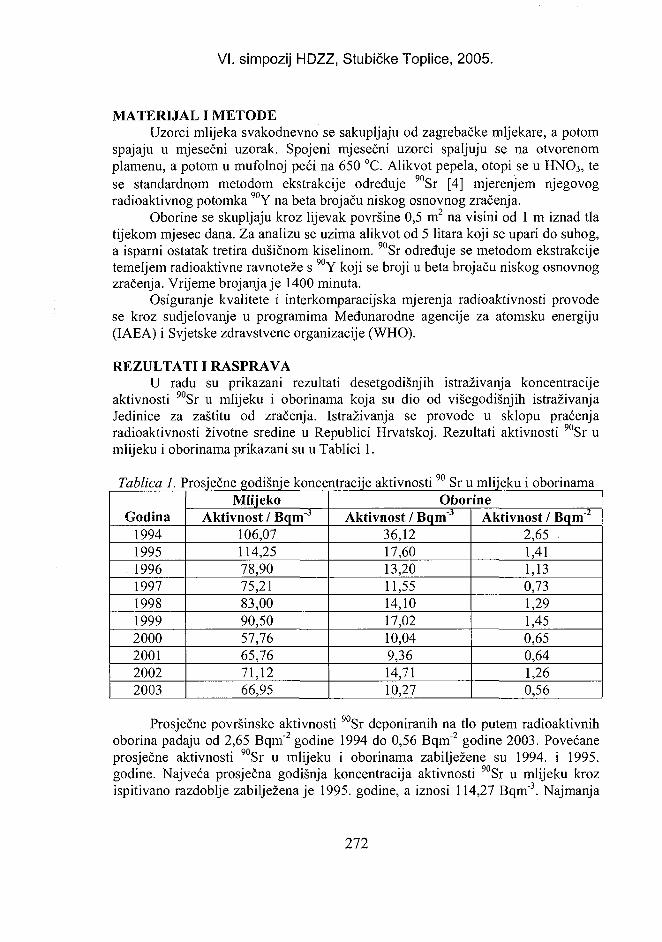
VI. simpozij HDZZ, Stubičke Toplice, 2005.
MATERIJAL I METODEUzorci mlijeka svakodnevno se sakupljaju od zagrebačke mljekare, a potom
spajaju u mjesečni uzorak. Spojeni mjesečni uzorci spaljuju se na otvorenomplamenu, a potom u mufolnoj peći na 650 °C. Alikvot pepela, otopi se u HNO3, tese standardnom metodom ekstrakcije određuje 90Sr [4] mjerenjem njegovogradioaktivnog potomka 90Y na beta brojaču niskog osnovnog zračenja.
Oborine se skupljaju kroz lijevak površine 0,5 m2 na visini od 1 m iznad tlatijekom mjesec dana. Za analizu se uzima alikvot od 5 litara koji se upari do suhog,a isparni ostatak tretira dušičnom kiselinom. 90Sr određuje se metodom ekstrakcijetemeljem radioaktivne ravnoteže s 90Y koji se broji u beta brojaču niskog osnovnogzračenja. Vrijeme brojanja je 1400 minuta.
Osiguranje kvalitete i interkomparacijska mjerenja radioaktivnosti provodese kroz sudjelovanje u programima Međunarodne agencije za atomsku energiju(IAEA) i Svjetske zdravstvene organizacije (WHO).
REZULTATI I RASPRAVAU radu su prikazani rezultati desetgodišnjih istraživanja koncentracije
aktivnosti 90Sr u mlijeku i oborinama koja su dio od višegodišnjih istraživanjaJedinice za zaštitu od zračenja. Istraživanja se provode u sklopu praćenjaradioaktivnosti životne sredine u Republici Hrvatskoj. Rezultati aktivnosti 90Sr umlijeku i oborinama prikazani su u Tablici 1.
Tablica 1. Prosječne godišnje koncentracije aktivnosti90 Sr u mlijeku i oborinama
Godina1994199519961997199819992000200120022003
MlijekoAktivnost / Bqm"3
106,07114,2578,9075,2183,0090,5057,7665,7671,1266,95
OborineAktivnost / Bqm"3
36,1217,6013,2011,5514,1017,0210,049,3614,7110,27
Aktivnost / Bqm"2
2,65 •1,411,130,731,291,450,650,641,260,56
Prosječne površinske aktivnosti 90Sr deponiranih na tlo putem radioaktivnihoborina padaju od 2,65 Bqm"2 godine 1994 do 0,56 Bqm"2 godine 2003. Povećaneprosječne aktivnosti 90Sr u mlijeku i oborinama zabilježene su 1994. i 1995.godine. Najveća prosječna godišnja koncentracija aktivnosti 90Sr u mlijeku krozispitivano razdoblje zabilježena je 1995. godine, a iznosi 114,27 Bqm"3. Najmanja
272
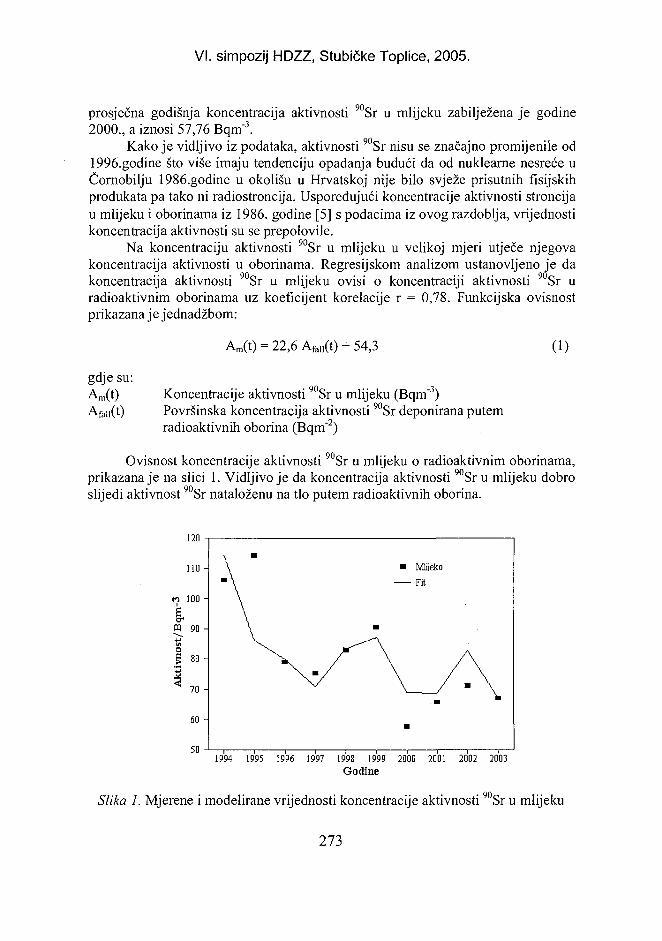
VI. simpozij HDZZ, Stubičke Toplice, 2005.
prosječna godišnja koncentracija aktivnosti 90Sr u mlijeku zabilježena je godine2000., a iznosi 57,76 Bqm'3.
Kako je vidljivo iz podataka, aktivnosti 90Sr nisu se značajno promijenile od1996.godine što više imaju tendenciju opadanja budući da od nuklearne nesreće uČornobilju 1986.godine u okolišu u Hrvatskoj nije bilo svježe prisutnih fisijskihprodukata pa tako ni radiostroncija. Uspoređujući koncentracije aktivnosti stroncijau mlijeku i oborinama iz 1986. godine [5] s podacima iz ovog razdoblja, vrijednostikoncentracija aktivnosti su se prepolovile.
Na koncentraciju aktivnosti 90Sr u mlijeku u velikoj mjeri utječe njegovakoncentracija aktivnosti u oborinama. Regresijskom analizom ustanovljeno je dakoncentracija aktivnosti 90Sr u mlijeku ovisi o koncentraciji aktivnosti 90Sr uradioaktivnim oborinama uz koeficijent korelacije r = 0,78. Funkcijska ovisnostprikazana je jednadžbom:
gdje su:Am(t)Afall(t)
Am(t) = 22,6 Afall(t) + 54,3
Koncentracije aktivnosti 90Sr u mlijeku (Bqm"3)Površinska koncentracija aktivnosti 90Sr deponirana putemradioaktivnih oborina (Bqm"2)
(1)
Ovisnost koncentracije aktivnosti Sr u mlijeku o radioaktivnim oborinama,prikazana je na slici 1. Vidljivo je da koncentracija aktivnosti 90Sr u mlijeku dobroslijedi aktivnost 90Sr nataloženu na tlo putem radioaktivnih oborina.
1994 1995 199« 1997 1998 1999 2000 2001 2002 2003Godine
Slika 1. Mjerene i modelirane vrijednosti koncentracije aktivnosti 90Sr u mlijeku
273
VI. simpozij HDZZ, Stubičke Toplice, 2005.
Valja napomenuti da se koncentracije aktivnosti 90Sr u oborinama i mlijekudanas približavaju osnovnom zračenju. To se posebice odnosi na oborine, avarijacije aktivnosti 90Sr u oborinama mogu se između ostaloga objasnitiraznolikošću fizikalnih i kemijskih čimbenika u okolišu koji sami po sebifluktuiraju.
ZAKLJUČAKRezultati istraživanja koncentracije aktivnosti 90Sr u mlijeku i oborinama
kroz ispitivani period ukazuju da koncentracije aktivnosti 90Sr u oborinama imlijeku imaju tendenciju opadanja..
Regresijskom analizom dobiveni faktor korelacije (r = 0,78) ukazuje nadobro slaganje odnosa ovisnosti koncentracije aktivnosti 90Sr u mlijeku okoncentraciji aktivnosti u radioaktivnim oborinama.
Koncentracije aktivnosti 90Sr u oborinama i mlijeku približavaju seosnovnom zračenju, a varijacije aktivnosti 90Sr su između ostaloga uzrokovaneraznolikošću mnogih fizikalnih i kemijskih čimbenika u okolišu koji sami po sebifluktuiraju.
LITERATURA[1] International Nuclear Safety Advisory Group (INSAG 1). Summary Report on the
Post Accident. Review Meeting on the Chernobyl Accident. Safety Series No.75.Vienna:IAEA;1986.
[2] Kovač J, Cesar D, Franić Z, Lokobauer N, Marović G, Maračić M. 1993 - 1998.Rezultati mjerenja radioaktivnosti životne sredine u Republici Hrvatskoj, godišnjiizvještaji, Institut za medicinska istraživanja i medicinu rada, Zagreb, 1992 - 1997.
[3] Marović G, Franić Z, Kovač J, Lokobauer N, Maračić M. 1999 - 2003 Rezultatimjerenja radioaktivnosti životne sredine u Republici Hrvatskoj, godišnji izvještaji,Institut za medicinska istraživanja i medicinu rada, Zagreb, 1998 - 2004.
[4] Environmental Measurements Laboratory (EML). Procedures Mannual. HASL 300.New.York: EML; 1972.
[5] Maračić M, Franić Z, Bauman A. Koncentracija 90Sr u mlijeku i padavinama. U:Kljajić R, ur. Zbornik radova XVI. simpozija Jugoslavenskog društva za zaštitu odzračenja; 28-31.svibnja 1991; Neum, Beograd: JDZZ; 1991. str. 72-75.
274
VI. simpozij HDZZ, Stubičke Toplice, 2005.
9 0Sr ACTIVITY CONCENTRATIONS IN MILK ANDFALLOUT IN THE CITY OF ZAGREB
Manda Maračić, Nevenka Lokobauer and Zdenko FranićInstitute for Medical Research and Occupational Health
Ksaverska c. 2, HR-10000 Zagreb, Croatiae-mail: [email protected]
As a fission by-product, 90Sr was widely dispersed in the fallout produced byatmospheric testing of nuclear weapons in the 1950s and 1960s. Since that time ithas been introduced into the food chain. Radiostrontium is a very toxicradionuclide and can be deposited into the bones, like calcium. This paper presentsthe results of the monitoring of 90Sr activity concentrations in samples of milk andwet fallout over a ten-year period. 90Sr activity concentrations in milk samplesranged from 57.76 to 114.27 Bqm"3. The values of 90Sr activity concentrations infallout samples ranged from 0.56 to 2.65 Bqm"2. A regression analysis was carriedout to model dependence of 90Sr activity concentrations in milk upon 90Sr surfacedeposit by fallout. The correlation coefficient of 0.78 shows a good linearcorrelation between 90Sr activity in milk and 90Sr activity in fallout.
275
VI. simpozij HDZZ, Stubičke Toplice, HR0500064
VIŠEGODIŠNJA IZLOŽENOST 2 2 6Ra PUTEM PIJENJA VODE
Maja Bronzović', Mladen Vrtar2 i Gordana Marović''institut za medicinska istraživanja i medicinu rada, Ksaverska c. 2,
2Klinički bolnički centar Zagreb, Klinika za onkologiju, Kišpatićeva 12,10000 Zagreb
e-mail: [email protected]
UVODOdređivanjem specifične koncentracije 226Ra u pitkoj vodi i poznavanjem
metaboličkog puta, može se odrediti specifična aktivnost 225Ra zadržanog u tijelu teprocijeniti 226Ra efektivna doza cijelog tijela, odnosno pojedinih organa. Osimdirektnog mjerenja 226Ra u kostima i drugim organima, prije više godina razvijen jematematički model retencije 226Ra u tijelu koji se odnosio na jednokratan unosodređene količine 226Ra [1,2].
Dosadašnji literaturni podaci procjene 226Ra efektivne doze putem pijenjavode temeljili su se na jednokratnom unosu godišnje količine 226Ra. U ovom radu,na temelju osnovnih dozimetrijskih definicija i upotrebom simulacije kontinuiranogunosa vode, prikazan je model izračunavanja godišnje 226Ra efektivne doze.Osnovna ideja temelji se na činjenici da je doza koju prima pojedini organ, uslijedretencije 226Ra, proporcionalna kumulativnoj aktivnosti A [3]:
00
A=\A{t)dt (1)o
Važan ulazni parametar je također i m(t) vrijednost [Bq Bq"1], odnosno udio 226Rakoji se zadržao u tijelu nakon jednokratnog unosa, a konkretne m(t) vrijednosti zaperiod od 20000 dana (oko 55 godina) mogu se naći u publikaciji koju je izdalaIAEA [4]. Na temelju m(t) vrijednosti i kumulativne aktivnosti u ovom raduprikazan je Simulink model računanja 226Ra efektivnih doza za različite unesenespecifične aktivnosti 226Ra.
MATERIJALI I METODEZa modeliranje, simulaciju i vizualizaciju procesa u ovisnosti o vremenu
korišten je program Simulink u okviru programskog paketa Matlab. Osnovamodela svakodnevnog unosa 226Ra je procjena kumulativne aktivnosti tijela, A.Ako je, a [Bq], aktivnost tijela nastala od jednog pijenja, A [Bq] aktivnost tijelanastala svakodnevnim pijenjem, A [Bq s], kumulativna aktivnost tijela zasvakodnevno pijenje, onda je at[Bq], aktivnost tijela nakon t dana od jednogpijenja, At [Bq] aktivnost nakon t dana za svakodnevno pijenje, At, kumulativnaaktivnost nakon t dana za svakodnevno pijenje, odnosno vrijedi:
276
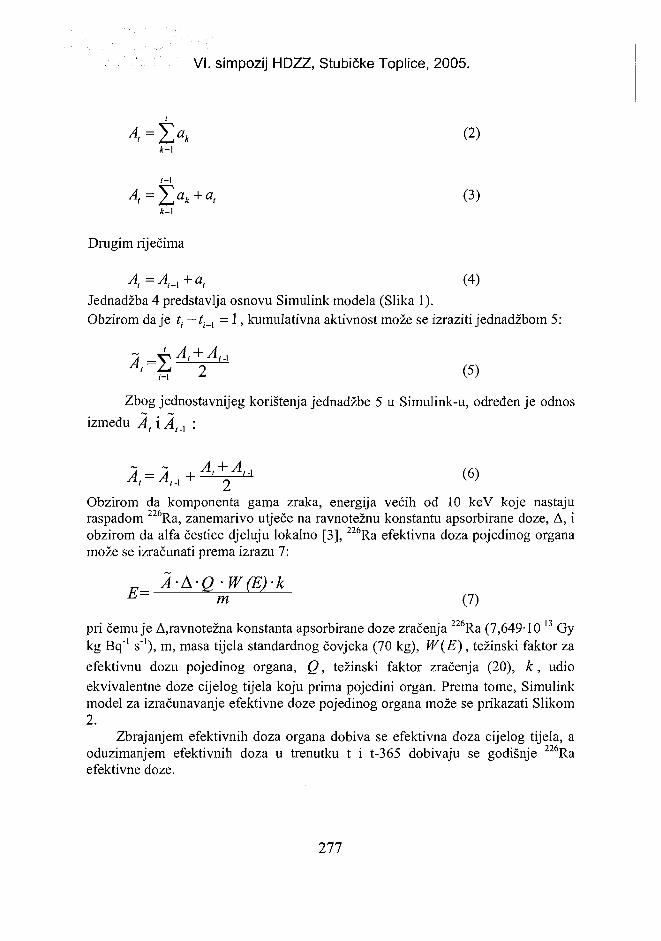
VI. simpozij HDZZ, Stubičke Toplice, 2005.
ak (2)
t-\
4=
Drugim riječima
Al=At_l+at (4)Jednadžba 4 predstavlja osnovu Simulink modela (Slika 1).Obzirom daje tt —ti_l = 1, kumulativna aktivnost može se izraziti jednadžbom 5:
~j _yi Aj+ AiAA< h 2 (5)
Zbog jednostavnijeg korištenja jednadžbe 5 u Simulink-u, određenje odnosizmeđu A,\AtA :
Obzirom da komponenta gama zraka, energija većih od 10 keV koje nastajuraspadom 226Ra, zanemarivo utječe na ravnotežnu konstantu apsorbirane doze, A, iobzirom da alfa čestice djeluju lokalno [3], 226Ra efektivna doza pojedinog organamože se izračunati prema izrazu 7:
^_ A-A-Q-W(E)-kh~ m (7)
pri čemu je A,ravnotežna konstanta apsorbirane doze zračenja 226Ra (7,649-IO"13 Gykg Bq"' s"1), m, masa tijela standardnog čovjeka (70 kg), W(E), težinski faktor zaefektivnu dozu pojedinog organa, Q, težinski faktor zračenja (20), k, udioekvivalentne doze cijelog tijela koju prima pojedini organ. Prema tome, Simulinkmodel za izračunavanje efektivne doze pojedinog organa može se prikazati Slikom2.
Zbrajanjem efektivnih doza organa dobiva se efektivna doza cijelog tijela, aoduzimanjem efektivnih doza u trenutku t i t-365 dobivaju se godišnje 226Raefektivne doze.
277
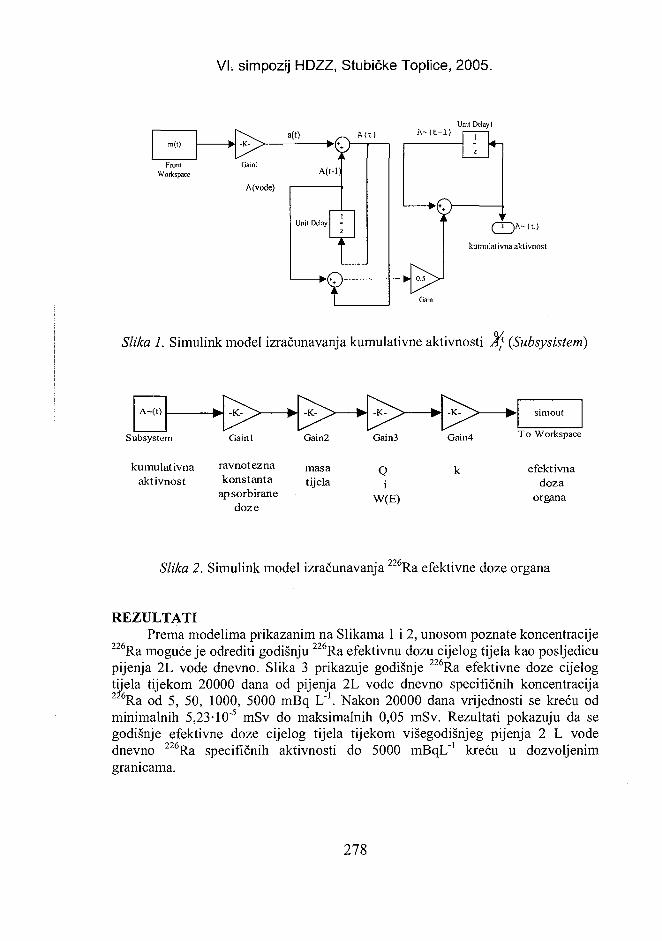
VI. simpozij HDZZ, Stubičke Toplice, 2005.
m(t)
FromWorkspace
-K-a(t) A-(t-l)
Unit Delay I
Gainl
A(vode)
A(t-l)
Unil Delay
I
0.5
Gain
(T)A-(t)
kumulativna aktivnost
Slika 1. Simulink model izračunavanja kumulativne aktivnosti Af (Subsysistem)
Subsystem
kumulativna ravnotežnaaktivnost konstanta
apsorbiranedoze
masatijela
Qi
W(E)
To Workspace
efektivnadoza
organa
Slika 2. Simulink model izračunavanja Ra efektivne doze organa
REZULTATIPrema modelima prikazanim na Slikama 1 i 2, unosom poznate koncentracije
225Ra moguće je odrediti godišnju 226Ra efektivnu dozu cijelog tijela kao posljedicupijenja 2L vode dnevno. Slika 3 prikazuje godišnje 226Ra efektivne doze cijelogtijela tijekom 20000 dana od pijenja 2L vode dnevno specifičnih koncentracija226Ra od 5, 50, 1000, 5000 mBq L"1. Nakon 20000 dana vrijednosti se kreću odminimalnih 5,23-IO"5 mSv do maksimalnih 0,05 mSv. Rezultati pokazuju da segodišnje efektivne doze cijelog tijela tijekom višegodišnjeg pijenja 2 L vodednevno 226Ra specifičnih aktivnosti do 5000 mBqL"1 kreću u dozvoljenimgranicama.
278
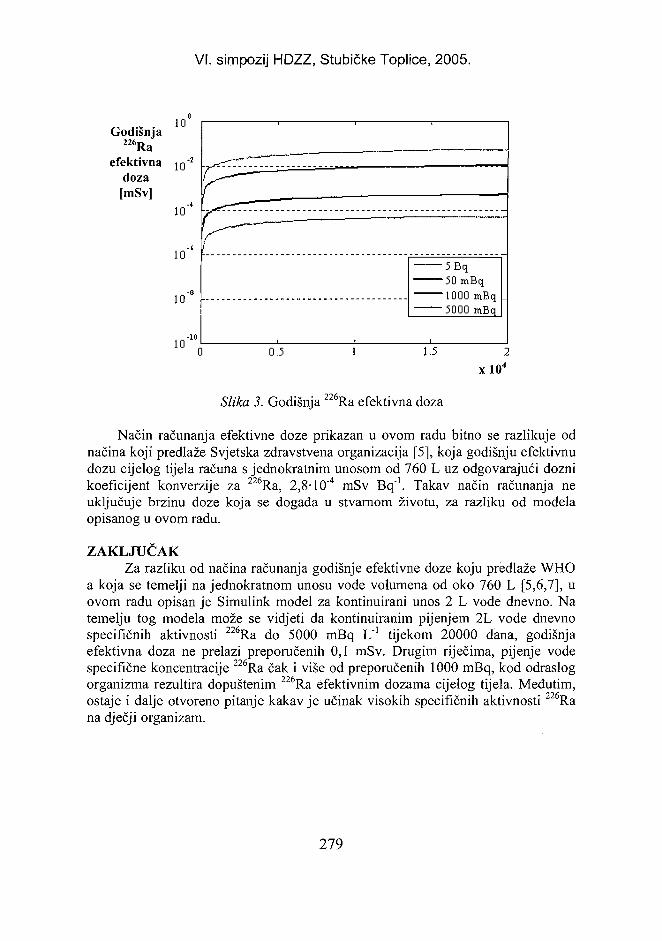
VI. simpozij HDZZ, Stubičke Toplice, 2005.
Godišnja226Ra
efektivnadoza[mSv]
1U
-2
IO"*
10"'
m"8
i n " 1 0
- ~ ' —
.^rrrrrzr..
i 15 Bq50 rtiBq1000 mBq _
1 5000 mBq
0.5 1.5xlO4
Slika 3. Godišnja 226Ra efektivna doza
Način računanja efektivne doze prikazan u ovom radu bitno se razlikuje odnačina koji predlaže Svjetska zdravstvena organizacija [5], koja godišnju efektivnudozu cijelog tijela računa s jednokratnim unosom od 760 L uz odgovarajući doznikoeficijent konverzije za 226Ra, 2,8-10"4 mSv Bq"\ Takav način računanja neuključuje brzinu doze koja se događa u stvarnom životu, za razliku od modelaopisanog u ovom radu.
ZAKLJUČAKZa razliku od načina računanja godišnje efektivne doze koju predlaže WHO
a koja se temelji na jednokratnom unosu vode volumena od oko 760 L [5,6,7], uovom radu opisan je Simulink model za kontinuirani unos 2 L vode dnevno. Natemelju tog modela može se vidjeti da kontinuiranim pijenjem 2L vode dnevnospecifičnih aktivnosti 226Ra do 5000 mBq L"1 tijekom 20000 dana, godišnjaefektivna doza ne prelazi preporučenih 0,1 mSv. Drugim riječima, pijenje vodespecifične koncentracije 226Ra čak i više od preporučenih 1000 mBq, kod odraslogorganizma rezultira dopuštenim 226Ra efektivnim dozama cijelog tijela. Međutim,ostaje i dalje otvoreno pitanje kakav je učinak visokih specifičnih aktivnosti 226Rana dječji organizam.
279
VI. simpozij HDZZ, Stubičke Toplice, 2005.
LITERATURA[1] International Commission on Radiological Protection (ICRP). Individual monitoring
for intakes of radionuclides by workers: design and interpretation. Oxford: PergamonPress; ICRP Publication 54, Ann ICRP 1988; 19(1-3).
[2] Schlenker RA, Keane AT, Holtzman RB. The retention of 226Ra in human soft tissueand bode; implications for the ICRP 20 alkaline earth model. Health Phys 1982;42(5): 671-693.
[3] Cherry SR, Sorenson JA, Phelps ME. Internal radiation dosimetry. In Physics innuclear medicine, 3rd ed., Saunders, 2003.
[4] International Atomic Energy Agency (IAEA). Methods for assessing occupationalradiation doses due to intakes of radionuclides. Safety reports series No. 37, Vienna:IAEA; 2004.
[5] World Health Organisation: Radiological quality of drinking water. In Guidelines fordrinking water quality, 3rd Edition, 2003. www.who.int/watersanitationhealth/dwq/gdwq3/en/
[6] Oliveira J, de Mazzilli BP, Oliveira Sampa MH, de Bambalas E. Naturalradionuclides in drinking water supplies of Sao Paulo State, Brazil and consequentpopulation dose. J Environ Radioactiv 2001; 53:99-109.
[7] Godoy MJ, Amaral ECS, Luiza M, Godoy DP. Natural radionuclides in Brazilianmineral water and consequent doses to the population. J Environ Radioact 2001;53:175-182.
LONG-TERM EXPOSURE TO 2 2 6Ra IN DRINKING WATER
Maja Bronzović1, Mladen Vrtar2 and Gordana Marović''institute for Medical Research and Occupational Health, Ksaverska c. 2
2Clinic of Oncology,Radiophysics Unit, University Hospital Centre, Kišpatićeva 12HR-10000 Zagreb, Croatia
e-mail: [email protected]
This paper presents a method of calculating 226Ra effective dose following continuousintake of water. In contrast to other authors who calculated the effective dose based on asingle intake of annual amount of 226Ra from water, this study observed continuous intakeof 2 L of water per day. The method was based on the assessment of accumulated activityincluding the fraction of a unit intake retained in the whole body over time (in days) afterintake. For modelling, simulation, and visualisation of the process depending on time, theSimulink program (Matlab program package) was used. The created Simulink models offera simple calculation of accumulated body activity and of the resulting effective dose over20,000 days. The dose assessment was performed for 226Ra specific activity of 5,50,1000and 5000 mBqL"1. In an adult organism, after 20,000 days, annual 226Ra effective dosesranged from 5.23-10"5 to 0.05 mSv, that is within limits of 0.1 mSv per year recommendedby the WHO. In general, it can be concluded that 226Ra specific activities above 1000mBqL"' could produce effective doses which are below recommended limit values, but theirpotential effect in children it is still unknown.
280
VI. simpozij HDZZ, Stubičke Toplice,: HR0500065
ATMOSPHERIC CONDITIONS IMPORTANT FOR THEASSESSMENT OF POPULATION EXPOSURE
Šonja VidičMeteorological and Hydrological Service of Croatia, Grič 3,
HR-10000 Zagreb, Croatiae-mail: [email protected]
INTRODUCTIONAfter the Cheraobil catastrophe on April 26th 1986 several meteorological
services have developed powerful models to forecast the movement of radioactiveclouds at a long distance range with activity specialisation on the provision ofatmospheric transport model products (ATM) for environmental emergencyresponse [1]. This provision can be related to nuclear accidents, radiologicalemergencies and transport of plumes of volcanic aches. Models have been tested inan European inter-comparison excercise [ATMES] for which the results ofEuropean tracer experiment has been conducted [2]. Experiments have providedinsight into the capabilities of present state models and their limitations.
ATMOSPHERIC CONDITIONS INFLUENCING TRANSPORT ANDDEPOSITION
The portion of the atmosphere where the earths surface (land or water) has adirect influence is called the atmospheric boundary layer (ABL). Since mostpollution releases occur in that layer it is important to understand its structure. Themain feature of the atmospheric boundary layer is the turbulent nature of the flow.Turbulence fortifies mixing mechanisms and tends to homogenise the properties ofthe atmosphere. Consequently, turbulent mixing is an important factor inpreventing local accumulation of pollutants. Meteorological parameters areaffected by the earth's surface through dynamical processes (friction of the air overthe surface) and through thermal processes (heating or cooling of the air in contactwith the ground), hence concept of turbulence ("stability of the atmosphere") thatreflects these processes and classifies conditions into neutral, unstable and stable isintroduced. This concept is used to determine dispersion of debris released into theatmosphere in x, y and z directions. The typical height of the ABL is about 1500meters and can vary from several hundred to 3000 meters.
Modelling of the transport and diffusion of a pollutant in the atmosphere isgoverned by the "advection-diffusion equation", that states that the time variationof the concentration of pollutant at a point depends on several different physicalprocesses: a) advection or transport by the mean wind; b) diffusion or mixing byturbulent wind eddies; or a transport process occurring at scales which cannot be
281
VI. simpozij HDZZ, Stubičke Toplice, 2005.
fully resolved and which must be parameterised. The combined processes ofadvection and diffusion are often commonly referred to as dispersion; c) emissiondescribing the processes by which pollutants are released in the atmosphere; d)depletion describing the processes by which pollutants are removed from theatmosphere. These generally take into account the effects of clouds andprecipitation (wet scavenging), radioactive decay, and deposition on the grounddue to the various capturing properties of the surface (dry deposition).
ATMOSPHERIC MODELSThere are several types of atmospheric models to simulate the long range
transport and diffusion of pollutants in the atmosphere: they mainly fall in twoclasses Lagrangian and Eulerian. Lagrangian models describe fluid elements thatfollow the instantaneous wind flow. In these models plumes can be broken downinto segments, puffs or particles. The advection is directly simulated by computingthe trajectories of the plume elements as they move in the mean wind field. Inmodels where the plume is modelled by a relatively low number of elements (puffsor plume segments) diffusion is usually simulated by a Gaussian model applied toeach plume elements, and where the standard deviation is calculated taking intoaccount the structure of atmospheric boundary layer ("atmospheric stability").Eulerian models directly solve the diffusion equation at every point of a grid, usingnumerical techniques that allow specific treatments for each physical process(finite difference method, splitting, finite elements method etc.). The turbulentfluxes are commonly assumed to be proportional to the mean gradient according tothe K gradient theory (first order closure). The horizontal and vertical Kcoefficients are generally dependent on the structure of atmospheric boundarylayer.
The modelling of the source of emission, the source term description, is anessential part of atmospheric transport models. In most cases, the processes bywhich pollutants are injected in the atmosphere (explosion, fire, high pressure jet,etc.) happen at scales well below those which are resolved by atmospherictransport models. The source effects have to be parameterised while the type ofparameterization will depend on whether the model is of Lagrangian or Euleriantype. Information on the initial release height and its vertical extent is importanttoo. Analysis of trajectories for different hights in the atmosphere show thattransport patterns can differ significantly, therefore leading to false conclusions ifthe release height is not correctly estimated. It affects the development andeffectiveness of the proper countermeasures to protect the population.
The time scenario is also very important since the state of the atmospherechanges considerably with time: frontal passages, movement of pressure systems,diurnal evolution of the atmospheric boundary layer, etc.. These scenarios willstrongly affect the evolution of the pollution cloud: if a front moves over the sourcearea, wet deposition could be a major factor for ground contamination; the
282
VI. simpozij HDZZ, Stubičke Toplice, 2005.
deposition areas would be completely different if the release had begun before orafter the arrival of the front. If the vertical structure and the time scenario of thesource term are well described, a rough estimate of the amount of pollutant isgenerally enough to decide on suitable countermeasures: protection of thepopulation, food restriction, etc. In certain cases, the area of maximum airconcentration and the deposition areas need only to be qualitatively known, andmore accurate estimation of the plume intensity would come out of groundmeasurements. If accurate estimates of the amount of pollutant released areavailable (which seems unlikely in a emergency), the atmospheric transport modelcould yield outputs of qualitative and quantitative interest.
Information on the radiological species released is important becauseparameters such as dry deposition velocity, scavenging ratio, and half life aredependent on the type of pollutant; all of the depletion terms of the diffusionequation are directly related to the nature of the released elements.
Generally, atmospheric transport models used during emergencies arediagnostic models, in order to allow for a fast and timely response. The dispersioncalculations are not performed within a full scale numerical weather prediction(NWP) grid, rather, the transport models are stand-alone models which must beprovided with meteorological data from numerical prediction models as input.
There is an impact of NWP models on the atmospheric transport models.NWP models provide data on a grid with a specific scale and all the informationproduced by NWP models is not necessarily available. Atmospheric transportmodels can only simulate phenomena of the same scale as the input data mesh andsub-grid scale phenomena have to be parametrised. That is the main reason whyprocesses such as convection or scavenging are treated in a cruder fashion inoperational transport models than in research models. Atmospheric transportmodels are dependent on the quality of the input meteorological data. A source ofuncertainty is the precipitation field. NWP models generally only provide rainfluxes at the ground, so estimation of the depth of the wet layer must be done bytransport models. The results for wet deposition may not be very accurate, evenwhen the precipitation areas are well estimated. ATMs will reproduce, andsometimes amplify, the NWP models errors. In the ATMES experiment,evaluation of different ATMs for the Chernobyl accident, has shown that theevolution of a pollution cloud can be depicted fairly well when analysed/observedmeteorological fields are used [3]. However there is a deterioration of the models'performance when using forecast meteorological fields. That is why an evaluationof the NWP forecasts by senior meteorologists is essential. Experienced forecasterscan advise the ATM specialists about the quality of the forecast meteorologicalfields so that the quality of the outputs of ATMs can be assessed.
283
VI. simpozij HDZZ, Stubičke Toplice, 2005.
MODEL OUTPUTSAtmospheric transport models provide two kinds of outputs: air
concentration of pollutant (in unit per cubic meter) at different time steps anddifferent levels, wet and dry deposition (in unit per square meter) at different timesteps. Air mass trajectories represent the motion of an air parcel within the threedimensional wind field. These trajectories can reveal interesting information aboutthe vertical structure of the atmosphere and the differences in the flow at 500 m,1500 m and 3000 m in the vicinity of the source of emission. It can also helpexplain the dispersing plume shapes. Trajectories can also provide informationabout differences in the predicted wind fields from different meteorologicalmodels.
The time integrated pollutant concentration parameter is obtained bycomputing the mean air concentration over the 500 first meters at each time step,and then integrating it over a predefined period. The results (in unit.second percubic meter) can then be easily related to the doses received by a human being whoremains at a given point during the considered period.
The total cumulated deposition parameter represents, for a radiologicalpollutant, the activity which is present at the ground at the end of the simulation.Usually, dry deposition due to the uptake of pollutant by the ground and wetdeposition due to the precipitations are added. Then respective charts represent theimpact at the ground of the radiological event.
CONCLUSIONSAtmospheric models are tools used to predict the evaluation of conditions
relevant for transport and deposition of a cloud of pollutants in emergencysituations, in a real-time. Experiments have shown that numerical weatherprediction models are able to forecast quite precisely the weather patterns thatinfluence concentrations and deposition. However, model performance with ashort-duration release may be less reliable in a forecast mode when themeteorological situation is changing rather rapidly. Small errors in timing either inthe movement and location of the pollutant cloud or of meteorological features canalter the wind field and precipitation the pollutant will experience.
Uncertainty is still very much connected to parametrisations used indispersion model calculations. The improvements can be obtained by linking themesoscale with the long-range evolution of an accidental emission. Meteorologicalparameters and conditions play a crutial role in these estimates and should bethoroughly examined in the whole area of interest.
284
VI. simpozij HDZZ, Stubičke Toplice, 2005.
REFERENCES[1] WM0, 1996: Documentation on RSMC support for environmental emergency
response, WMO-TD/No. 778.[2] Mosca S, Bianconi R, Bellasio R, Graziani G, Klug W. EUR 17756-ATMES II
Evaluation of Long-range dispersion models using data of the Is1 ETEX release,1998,252.
[3] Klug W, Graziani G, Grippa G, Pierce G, Tassone C. Evaluation of Long RangeAtmospheric Models using Environmental Radioactivity Data from the ChernobylAccident, ATMES Report; 366 pp., Elsevier Sci. Pub. 1992.
ABSTRACTAtmospheric distribution of a pollutant can be predicted using numerical
weather prediction models and atmospheric dispersion models. The first providesprediction on the evaluation of the meteorological fields for specified time periodand the second uses this information to determine the evolution of the dispersingcloud in time and space. There is a number of conditions and features that limit theperformance of both models, as they contain a degree of parameterisation that maybe a source of error. This paper discusses influential parameters and conditions.
285

ZAŠTITA OD ZRAČENJA U MEDICINI
RADI A TION PROTECTION IN MEDICINE

VI. simpozij HDZZ, Stubičke Toplice HR0500066
IMPROVEMENT OF THE RADIATION PROTECTION INMEDICINE BY IMPLEMENTATION OF THE COUNCIL
DIRECTIVE 97/43/EURATOM
Constantin Milu and Alina DumitrescuInstitute of Public Health, Str. Dr. Leonte No. 1-3, RO-050463 Bucharest 35,
Romaniae-mail: [email protected]
INTRODUCTIONThe European Council Directive No.97/43/EURATOM was approved on 30
June 1997 and refers to the health protection of individuals against the dangers ofionising radiation in relation to medical exposure and it is repealing Directive84/466/Euratom.
The 97/43/EURATOM Directive is now fully transposed into Romanianlegislation, by several norms and regulations, approved by the Nuclear RegulatoryAuthority (CNCAN) and/or by the Ministry of Health (MH).
Several improvements on the radiation protection in medical applicationscan be already observed, but also several practical problems arose.
MEDICAL RADIATION EXPOSURE IN ROMANIAAs in most European countries, the medical exposure is the main man-made
radiation exposure of the general population. It is given by:X-ray examinations (diagnostic radiology);
- Diagnostic and therapeutic administration of radiopharmaceuticals(nuclear medicine);
- Teletherapy and brachytherapy (radiotherapy);
Diagnostic radiologyAccording to the United Nations Scientific Committee on the Effects of
Atomic Radiation, UNSCEAR 2000 Report [1], at a population of 22.7 millionsinhabitants, 2529 X-ray medical generators, 37 mammographic units, 900 dentaland 35 CT scanners were available. About 600 medical radiation examinationswere reported per 1,000 persons.
In 2005, the total number of mammographic units and CT scanners areexpected to be double.
Diagnostic and therapeutic administration of radiopharmaceuticalsAnnual number of nuclear medicine procedures, reported in 2000:
diagnostic administration : 68,500;
289
VI. simpozij HDZZ, Stubičke Toplice, 2005.
therapeutic administration: 1,530 (mainly, for treatment of thyroidcancer, using 13II).
RadiotherapyIn UNSCEAR 2000 Report, 140 X-ray therapy machines, 21 60Co units and
3 LINACs are reported, as teletherapy facilities, and 4 LDR and 4 HDR remotes, asbrachytherapy afterloading units.
About 20,000 patients/year were treated by high energy external beamtherapy and 2,700 patients/year by brachythrapy. A great number of patients weretreated at superficial and ortovoltage X-ray machines.
In 2005, 19 60Co units, 6 LINACs and 11 remote afterloading systems are inoperation.
TRANSPOSITION OF EC DIRECTIVE 97/43/EURATOMWithin the transposition process of this Directives, two documents should be
mentioned:Norms regarding the radiation protection of persons from medical
exposure, jointly approved, in 2002, by the president of the nuclear regulatoryauthority and by the minister of health, which were published in MONITORULOFICIAL AL ROMANIEI No. 446 bis from 25 June 2002 [2];
Specific actions to health protection of individuals against the dangers ofionizing radiation in relation to medical exposure, a regulation of the MH,approved by Order 1334 and published in MONITORUL OFICIAL ALROMANIEI, Partea I, No.1014 from the 3rd of November 2004 [3].
IMPLEMENTATION PLANFor practical implementation of the 97/43 Directive, an inter-ministerial
implementation plan was elaborated, in 2003, including 43 actions and objectives.The national responsibility for this plan is of the Ministry of Health and
collaborating institutions are:Nuclear Regulatory Authority (CNCAN);Ministry of Education and Research;National House for Health Assurance;National Collegium of Physicians;Ministry of Justice.
PRACTICAL ASPECTS AND PROBLEMMESJustification
According to the Directive and its transposition into Romanian legislation,the medical exposure "shall show a sufficient net benefit against the individualdetriment that the exposure might cause ".
290
VI. simpozij HDZZ, Stubičke Toplice, 2005.
This means that any medical exposure must be well justified before. Twopractical aspects are valid here:
- the need of a general guidance on patient selection, approved by an orderof minister of health, followed by several codes of practice for each type ofradiological procedure;
appropriate education and training of both the prescribers andpractitioners.
In both directions, several activities already started in Romania (includingthe mentioned ministerial order No. 1334, from November 2004), but more actionsand efforts are still needed.
OptimisationAccording to the Directive, all doses due to medical exposure for
radiological purposes, except radiotherapeutic purposes, should be "kept as low asreasonable achievable".
Four practical aspects are related to:application of diagnostic reference levels for radiodiagnostic
examinations;use ofconcept "dose constraint";biomedical and medical research;medico-legal exposure.
The practical problems are given by:- availability of appropriate procedures, equipment and staff, for
assessment and evaluation of patient doses or administrated activities;setting-up of ethics committees for biomedical and medical research;elaboration of special rules for justification of exposure on medico-legal
grounds.
ProceduresAccording to the Directive, "written protocols for every type of standard
radiological practice shall be established for each equipment".With this aim, there are needed:- elaboration of several protocols, including also a procedure for clinical
audits;involvement of a medical physics expert, in different medical practices.
Several committees of specialists, belonging to the Ministry of Health,already started to elaborate the requested protocols. Also, it was initiated the legalprocedure for introduction of "medical physics expert" into the Romanian list ofprofessions, which seems not to be a simple task.
291
VI. simpozij HDZZ, Stubičke Toplice, 2005.
TrainingAccording to the Directive, introduction of a "course on radiation protection
in the basic curriculum of medical and dental schools" was proposed, by theMinistry of Health, to the Ministry of Education and Research (MER). There is notyet any reaction from MER.
With the aim of a "continuing education and training", particularlyregarding radiation protection requirements, several training courses are organisedby the Institute of Public Health-Bucharest, on specific topics: diagnostic radiologyand interventional radiology, radiotherapy and nuclear medicine.
EquipmentIn order to avoid "unnecessary proliferation of radiological equipment" in
Romania, for use any radiological equipment needs:to be registered as "medical device ", by the Ministry of Health;
- to have an ARS ("Assurance for Radiation Safety"), given by CNCAN.A "national up-to-date inventory of radiological equipment" is in operation
and a "quality control" is rather well organised, by the Ministry of Health.An urgent and, in the same time, very difficult action, is to replace or
upgrade the fluoroscopic equipment, existing without an image intensificationand/or a device to control the dose rate, before the 31 s t of December 2005.
Special practicesSpecial concerns are in Romania, regarding the need to improve the present
radiation protection of patients and of staff in: paediatrics, interventional radiologyand health screening programmes.
Many problems are not yet also solved on special protection duringpregnancy and breastfeeding.
ImprovementsThe implementation of the Council Directive 97/43/EURATOM already
proved to contribute to the improvement of the radiation protection in medicine:the national radiation protection legislation is now fully in agreement
with EU legislation;the awareness on the risks of medical exposures, by prescribers,
practitioners and public, already contributed to a small reduction of theunnecessary medical exposure;
- several radiology procedures were optimised, both regarding the qualityof image and patient dose.
We know that many other further actions are needed, for full practicalimplementation of this directive and for the achievement of a high standard ofradiation protection in medicine.
292
VI. simpozij HDZZ, Stubičke Toplice, 2005.
REFERENCES[1] United Nations Scientific Committee on the Effects of Atomic Radiation,
UNSCEAR 2000 Report, New York, 2000.[2] Norme privind radioprotectia persoanelor in cazul expunerilor medicale, Monitorul
Oficial al Romaniei, nr.446 bis din 25 iunie 2002.[3] Ordin al ministrului sanatatii cu privire la actiunile specifice pentru protectia
sanatatii persoanelor fizice impotriva radiatiilor ionizante in cazul expuneriimedicale, Monitorul Oficial al Romaniei, Partea I, nr. 1.014 din 3 noiembrie 2004.
ABSTRACTThe European Council Directive No. 97/43/EURATOM was approved on 30
June 1997 and refers to health protection of individuals against the damages ofionising radiation in relation to medical exposure, superseding the Directive84/466/Euratom. As in most European countries, medical exposure is the mainman-made radiation exposure of population. Of particular concern in radiationprotection in medicine is the use of X-rays for diagnostic purposes, involvingpotential radiation exposure of young population and of pregnant women. The97/43/EURATOM Directive is now fully adopted into Romanian legislation and aplan for its implementation has been established. Several practical issues havealready arisen and they are related to (1) justification of individual medicalexposure (patient selection) due to unclear distribution of responsibilities betweenthe prescriber and the practitioner; (2) justification of medical exposures with nodirect health benefit for the exposed person (reconsideration of health screeningprogrammes, exposure of individuals as part of medico-legal procedures); (3)patient dosimetry and the use of Diagnostic Reference Levels (need of proceduresand equipment); (4) QA/QC (procedure, training and test facilities); (5)examination of biomedical and medical research by an ethics committee; (6)application of Dose Constraints and Clinical Audit concepts; (7) prohibition offluoroscopy examinations without an image intensification. An intensive trainingprogramme of the personnel involved (practitioners, inspection) was started andspecial efforts for the acquisition of appropriate equipment are made with the aimto improve radiation protection in medicine, through the implementation of the EUDirective.
293
VI. simpozij HDZZ, Stubičke Toplice,'* HR0500067
LEKSELL GAMMA KNIFE I OSIGURANJE KAKVOĆEU STEREOTAKSIJSKOJ RADIOTERAPIJI
Hrvoje HršakJedinica za radiofiziku, Klinika za onkologiju, KBC Zagreb,
Kišpatićeva 12, 10000 Zagrebe-mail: [email protected]
UVODLeksell Gamma Knife stereotaksijska radioterapija (LGK SRT), poznata i
pod nazivom stereotaksijska radiokirurgija koristi prostornu koordinatizaciju zaprecizno određivanje intrakranijskih ciljeva. LGK SRT kombinira preciznojednokratno ozračivanje malih lezija (do minimalnog volumena od 0,05 cm3) sastrmim gradijentom doze kako bi se maksimalno smanjila doza na okolno tkivo [1].Ovakav oblik radioterapije učinkovit je uglavnom za arteriovenske malformacije,određene tipove tumora mozga i trigeminus neuralgiju [2].
Visoka konformalnost i strmi gradijent absorbirane doze postignut jerasporedom 201 izvora 60Co u polusferični prsten i uporabom konusnih kolimatorakoji u izocentru daju promjer snopa 4, 8, 14 i 18 mm. Snopovi se u izocentru sijeku(Slika 1) i daju približno sferičnu raspodjelu absorbirane doze. Udaljenost izvoraod izocentra iznosi 40 cm.
Leksell koordinatni prostor mozga, koji predstavlja prostornu osnovu zaplaniranje definira se postavljanjem stereotaksijkog okvira pomoću četiri vijka naglavu pacijenta.
Preciznost LGK SRT ovisi o preciznosti pojedinih karika u lancuterapijskog postupka i nikad ne može biti veća od preciznosti najslabije karike(Slika 2). U ovom radu predstavljen je Sistem test kao metoda kojom se možetestirati preciznost lanca LGK SRT postupka kao cjeline bez kontrole pojedinihkarika. Ovaj test procjenjuje ukupnu preciznost simulacijom terapijskog postupka sjednim izocentrom. Općenito se 3-D raspodjela absorbirane doze na ciljnomintrakranijskom volumenu postiže uporabom više izocentara (Leksell Gamma Plan- LGP dozvoljava maksimalno 50 izocentara u jednom planu).
Obzirom da se Sistem testom kontrolira, odnosno procjenjuje položajizocentra izračunat pomoću LGP-a, u odnosu na stvarni izocentar, dovoljno jepromatrati raspodjelu s jednim izocentrom.
294
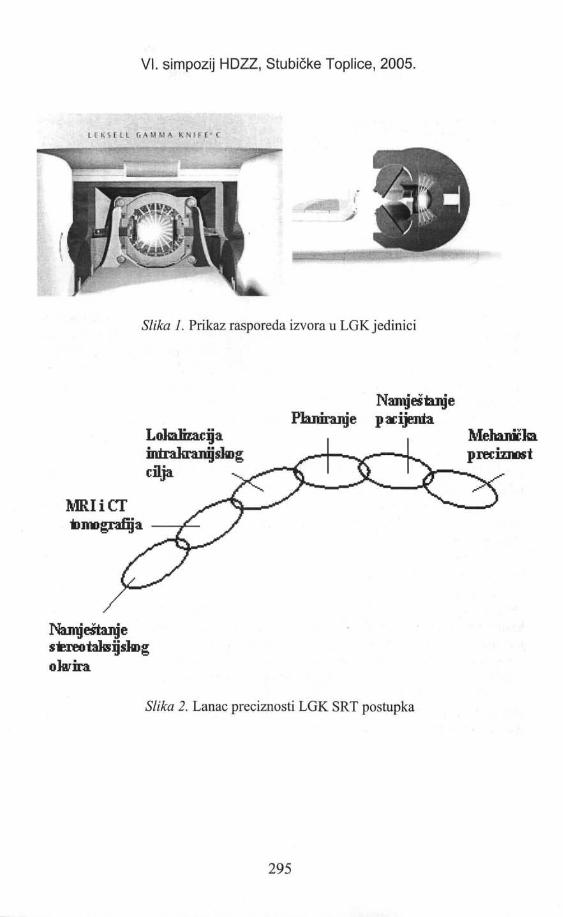
VI. simpozij HDZZ, Stubičke Toplice, 2005.
i , •, V " •• I •. I
Slika 1. Prikaz rasporeda izvora u LGK jedinici
LokalizacijanutraJtrani] sitogcilja
NamještanjePlaniranje pacijenta
MRIiCTtomo grafija
Mehaničkipreciznost
Namještanjesfera) taksijs&Dgofoira
Slika 2. Lanac preciznosti LGK SRT postupka
295

VI. simpozij HDZZ, Stubičke Toplice, 2005.
MATERIJALI I METODESimulacija LGK SRT postupka provedena je prema metodologiji
Sistem testa (Slika 3).
Fantom + film
Tomografija
Planiranje
Oziaeh<mje
.Analiza
•
1MRI h» CT
i
1
1
Slika 3. Metodologija Sistem testa Slika 4. Stereotaksijska definicija fantoma
Sferični tkivo ekvivalentni PMMA (polimetilmetakrilat) fantom koordinatno jedefiniran u Leksell stereotaksijskom okviru (Slika 4). Promjer fantoma iznosi 16cm i on se sastoji od dvije polusfere s kockastom šupljinom smještenom u centar(Slika 5). Markirani radiokromski film (Slika 6) dimenzija 29x29 mm smješten je ucentar fantoma između PMMA ploha debljine 5mm. Na plohama se nalaze dvauska kanala ispunjena otopinom bakar-sulfata kako bi centar filma bio vidljiv uprikazu magnetske rezonance (MRI).
Slika 5. Unutrašnjost fantoma Slika 6. Markirani i ozračeni radiokromskifilm
296
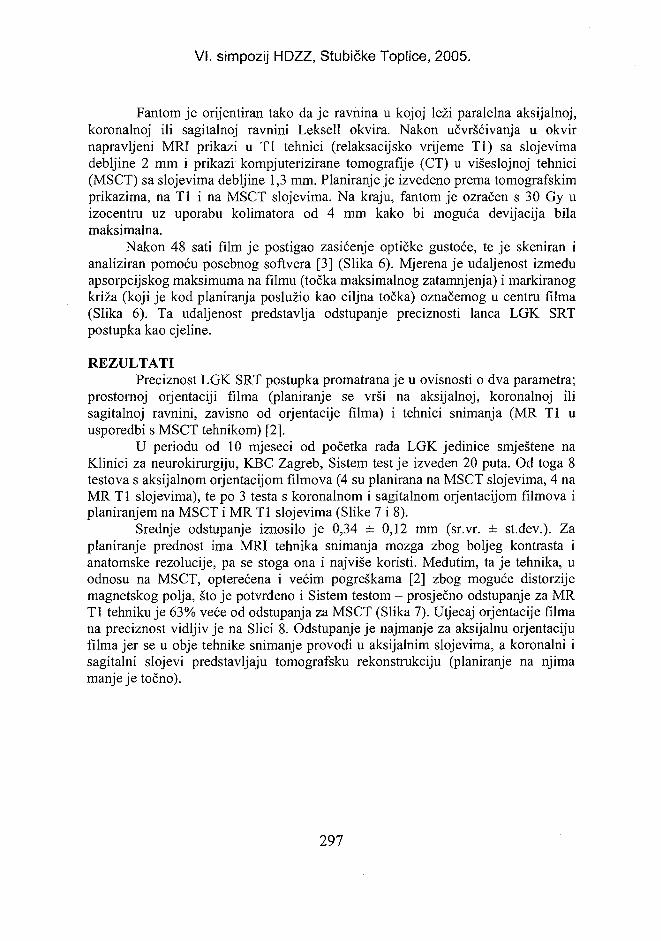
VI. simpozij HDZZ, Stubičke Toplice, 2005.
Fantom je orijentiran tako da je ravnina u kojoj leži paralelna aksijalnoj,koronalnoj ili sagitalnoj ravnini Leksell okvira. Nakon učvršćivanja u okvirnapravljeni MRI prikazi u TI tehnici (relaksacijsko vrijeme TI) sa slojevimadebljine 2 mm i prikazi kompjuterizirane tomografije (CT) u višeslojnoj tehnici(MSCT) sa slojevima debljine 1,3 mm. Planiranje je izvedeno prema tomografskimprikazima, na TI i na MSCT slojevima. Na kraju, fantom je ozračen s 30 Gy uizocentru uz uporabu kolimatora od 4 mm kako bi moguća devijacija bilamaksimalna.
Nakon 48 sati film je postigao zasićenje optičke gustoće, te je skeniran ianaliziran pomoću posebnog softvera [3] (Slika 6). Mjerena je udaljenost izmeđuapsorpcijskog maksimuma na filmu (točka maksimalnog zatamnjenja) i markiranogkriža (koji je kod planiranja poslužio kao ciljna točka) označemog u centru filma(Slika 6). Ta udaljenost predstavlja odstupanje preciznosti lanca LGK SRTpostupka kao cjeline.
REZULTATIPreciznost LGK SRT postupka promatrana je u ovisnosti o dva parametra;
prostornoj orjentaciji filma (planiranje se vrši na aksijalnoj, koronalnoj ilisagitalnoj ravnini, zavisno od orjentacije filma) i tehnici snimanja (MR TI uusporedbi s MSCT tehnikom) [2].
U periodu od 10 mjeseci od početka rada LGK jedinice smještene naKlinici za neurokirurgiju, KBC Zagreb, Sistem test je izveden 20 puta. Od toga 8testova s aksijalnom orjentacijom filmova (4 su planirana na MSCT slojevima, 4 naMR TI slojevima), te po 3 testa s koronalnom i sagitalnom orjentacijom filmova iplaniranjem na MSCT i MR TI slojevima (Slike 7 i 8).
Srednje odstupanje iznosilo je 0,34 ± 0,12 mm (sr.vr. ± st.dev.). Zaplaniranje prednost ima MRI tehnika snimanja mozga zbog boljeg kontrasta ianatomske rezolucije, pa se stoga ona i najviše koristi. Međutim, ta je tehnika, uodnosu na MSCT, opterećena i većim pogreškama [2] zbog moguće distorzijemagnetskog polja, što je potvrđeno i Sistem testom - prosječno odstupanje za MRTI tehniku je 63% veće od odstupanja za MSCT (Slika 7). Utjecaj orjentacije filmana preciznost vidljiv je na Slici 8. Odstupanje je najmanje za aksijalnu orjentacijufilma jer se u obje tehnike snimanje provodi u aksijalnim slojevima, a koronalni isagitalni slojevi predstavljaju tomografsku rekonstrukciju (planiranje na njimamanje je točno).
297
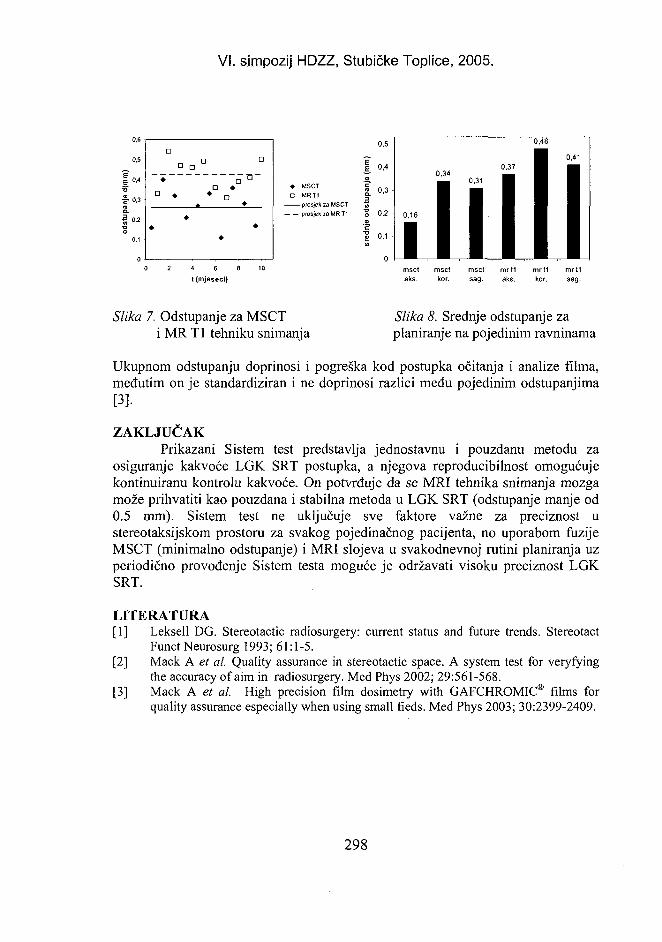
VI. simpozij HDZZ, Stubičke Toplice, 2005.
0.6
0.5
I"•a
f-0.3
od
stup
D
a a
• a B
a •° * * D
* •*
) 2 4 6 8 10
t (mjeseci)
• MSCTD MRT1
prosjek za MSCTprosjek za MR T1
0,5
1 0,4,2.I 0,3
o 0.2
* 0,1
0,16
1msctaks.
0,48
1 0.41
Millmsct msct mrt1 mrt1 mrt1
kor. sag. aks. kor. sag.
Slika 7. Odstupanje za MSCTi MR TI tehniku snimanja
Slika 8. Srednje odstupanje zaplaniranje na pojedinim ravninama
Ukupnom odstupanju doprinosi i pogreška kod postupka očitanja i analize filma,međutim on je standardiziran i ne doprinosi razlici među pojedinim odstupanjima[3].
ZAKLJUČAKPrikazani Sistem test predstavlja jednostavnu i pouzdanu metodu za
osiguranje kakvoće LGK SRT postupka, a njegova reproducibilnost omogućujekontinuiranu kontrolu kakvoće. On potvrđuje da se MRI tehnika snimanja mozgamože prihvatiti kao pouzdana i stabilna metoda u LGK SRT (odstupanje manje od0.5 mm). Sistem test ne uključuje sve faktore važne za preciznost ustereotaksijskom prostoru za svakog pojedinačnog pacijenta, no uporabom fuzijeMSCT (minimalno odstupanje) i MRI slojeva u svakodnevnoj rutini planiranja uzperiodično provođenje Sistem testa moguće je održavati visoku preciznost LGKSRT.
LITERATURA[1] Leksell DG. Stereotactic radiosurgery: current status and future trends. Stereotact
Funct Neurosurg 1993; 61:1-5.[2] Mack A et al. Quality assurance in stereotactic space. A system test for veryfying
the accuracy of aim in radiosurgery. Med Phys 2002; 29:561-568.[3] Mack A et al. High precision film dosimetry with GAFCHROMIC® films for
quality assurance especially when using small fieds. Med Phys 2003; 30:2399-2409.
298
VI. simpozij HDZZ, Stubičke Toplice, 2005.
LEKSELL GAMMA KNIFE AND QUALITY ASSURANCEIN STEREOTACTIC RADIOTHERAPY
Hrvoje HršakRadiophysics Unit, Clinic of Oncology, UHC Zagreb,
Kišpatićeva 12, HR-10000 Zagrebe-mail: [email protected]
The aim of the Leksell Gamma Knife stereotactic radiotherapy (LGK SRT) isto deliver a high single dose of radiation to a small complex-shaped intracraniallesion, often located close to critical structures. The main requirements on LGKSRT are to define the geometrical position of the lesion with high accuracy, toverify dose plans in order to reflect real physical dose distributions within thepatient's head and to perform with an extraordinary reliability because errorscannot be corrected (single fraction therapy) and interrupted treatments cannot becompleted later without negative effects on the distribution of the dose applied tothe patient. For minimal risk, it is necessary that geometrical positions are setprecisely with an overall deviation of less than 1 mm. This paper presents a test forverifying the accuracy of LGK SRT. The chain of items in terms of completepatient simulation was followed and stereotactic MRI and CT data were verifiedagainst a reference, which were stereotactically defined radiochromic films. Amarked radiochromic film, situated between inserts of the spherical fantom wasfixed parallel to either the xy, yz or zx plane of the Leksell stereotactic coordinatesystem. After imaging and planning, the fantom was adjusted and irradiated. At theend, the film, dyed by the irradiation field around the pre-marked cross, wasevaluated. The measured distance between the target point (centre of the shadow)and the centre of the film is the geometrical deviation of LGK SRT. In 10 months,20 system test were performed and deviations were found to be less than 0.5 mm.
299
VI. simpozij HDZZ, Stubičke Toplice, L . . HR0500068
CALIBRATION OF P-TYPE SILICON DIODES FORIN-VIVO DOSIMETRY IN 6 0Co BEAMS
Iva Mrčela, Tomislav Bokulić, Mirjana Budanec and Zvonko KusićDepartment of Oncology and Nuclear Medicine,
University Hospital "Sestre milosrdnice",Vinogradska c. 29, HR-10000 Zagreb
e-mail: [email protected]
INTRODUCTIONRadiation treatment accuracy is expressed as a comparison between
prescribed and delivered dose. Several studies suggest 3.5%, 1SD [1-2] as theoverall accuracy required and achievable in radiation treatment, based onradiobiological studies and measurements by in vivo dosimetry in clinicalconditions. Semiconductor diodes as detectors for in vivo dosimetry are consideredas very useful tool in clinical practice. Their main advantage over other detectors,such as TLDs, is a possibility of immediate readout and detection of errors whilepatient is still on a treatment couch. Moreover, diodes are known for their highsensitivity, small size, simplicity of operation and mechanical stability. However,for accurate dosimetry, diodes have to be individually characterised for conditionsother than referent.
In this work we present first results in implementation of in-vivo dosimetryin our department by calibration and characterisation of diodes designed for use in60Co beams. It is known from the literature [1,3] that ideal diode should have smalldependence, of about 1-2 %, on field size, source to skin distance (SSD) and use ofbeam modifying devices. These correction factors originate from the dependenceof diode response on beam energy, dose per pulse, dose rate, temperature anddirection of beam.
MATERIALS AND METHODSThree Scanditronix EDE-5 p-type silicon diodes connected to a DPD-3
electrometer were calibrated for measuring entrance dose. EDE-5 has an effectivethickness of measuring volume of 60 um and 1.5 mm detector diameter.Hemispherical build up cap consists of polystyrene and epoxy plastic and it isequivalent to 5 mm of water, which is the depth of maximum dose for 60Co. Diodeswere preirradiated with 10 MeV electrons to 8 kGy by manufacturer. Technicalspecifications state 1% signal deviation for changes in field sizes from 5x5 to30x30 cm2 and 0.4% per °C sensitivity variation with temperature.
A Farmer ionisation chamber 0.6 cm3 PTW type 30002 connected to thePTW Unidos electrometer was used as a reference detector for calibration. All
300
VI. simpozij HDZZ, Stubičke Toplice, 2005.
measurements were performed on a polystyrene phantom PTW type RW3 withspecial slab adapted in depth and dimensions of opening for this chamber.Dimensions of slices used are 30x30 cm and 1 cm thickness. Prior to calibration,intrinsic precision of diodes was measured as signal reproducibility of tenconsecutive irradiations at same dose when diode is placed on top of the phantom.In addition, to confirm linear dose response we tested our diodes in dose intervalfrom 0.5 Gy to 8 Gy.
The calibration of diodes for entrance dose measurements and evaluation ofvarious correction factors were performed according to the procedurerecommended by ESTRO [4-5] and Leunens [6]. Entrance dose is defined as thedose at the dmax from the incident plane on the beam axis:
(1)
Here, Rdiode is a diode reading, Fcal is calibration factor and CFi are correctionfactors.
Calibration factors were determined for each diode as the ratio of dosemeasured by ionisation chamber placed at dmax in plastic phantom and signal fromdiode placed at phantom surface, at standard reference conditions (10x10 cm2 fieldsize at isocenter, SSD=80 cm, gantry angle 0°).
R J ( 2 )
diode Jref.con.
Calibration has to be repeated on regular basis, because diode sensitivitychanges with accumulated dose. Some authors advise recalibration afteraccumulated dose of ikGy for p-type diodes [1].
Correction factors (CFs) for different field sizes, SSDs, wedges, tray andgantry angles were determined. Field size (denoted by FS = a) and SSD (r)correction factors were measured as a ratio of chamber and diode reading in givencondition normalised to the reference conditions [4]:
„ „ _ \ ic diode )(rS=ajSSD=S0) / - ^
V ic' diode )(FS=\O,SSD=SO)
\ ic ' diode )(FS=\O,SSD=r) /^s
"(D IR )\*^ic' diode J(FS=\O,SSD=BO)
Measurements for ten wedges available for our 60Co unit were normalised toappropriate open fields (open FS) to avoid double inclusion of field size correction,where a" is a wedge angle and a is a wedge length. The same approach was for tray
301
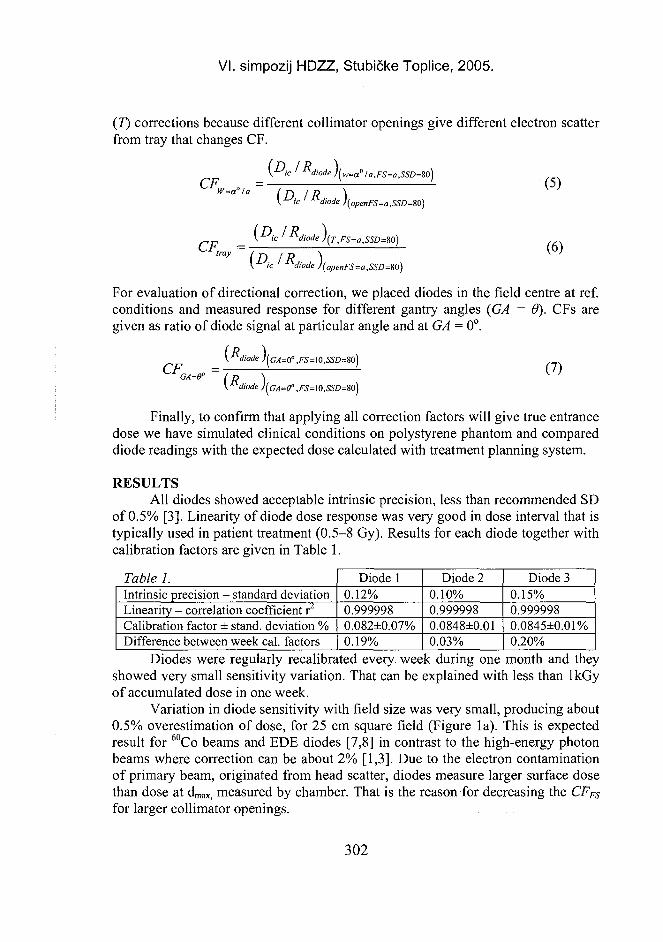
VI. simpozij HDZZ, Stubičke Toplice, 2005.
(7) corrections because different collimator openings give different electron scatterfrom tray that changes CF.
/ J\
CFd i o d e
W=a° la\ U i c ' Kdiode )(openFS=a,SSD=iO)
CF =
(5)
(6)(openFS=a,SSD=S0)
For evaluation of directional correction, we placed diodes in the field centre at ref.conditions and measured response for different gantry angles (GA = 8). CFs aregiven as ratio of diode signal at particular angle and at GA = 0°.
CF,\ ^diode )[ =0° ,FS=i0,SSD=B0)
GA=9°(7)
A=0",FS=l0,SSD=S0)
Finally, to confirm that applying all correction factors will give true entrancedose we have simulated clinical conditions on polystyrene phantom and compareddiode readings with the expected dose calculated with treatment planning system.
RESULTSAll diodes showed acceptable intrinsic precision, less than recommended SD
of 0.5% [3]. Linearity of diode dose response was very good in dose interval that istypically used in patient treatment (0.5-8 Gy). Results for each diode together withcalibration factors are given in Table 1.
Table 1.Intrinsic precision - standard deviationLinearity - correlation coefficient r2
Calibration factor ± stand, deviation %Difference between week cal. factors
Diode 10.12%0.9999980.082±0.07%0.19%
Diode 20.10%0.9999980.0848±0.010.03%
Diode 30.15%0.9999980.0845±0.01%0.20%
Diodes were regularly recalibrated every week during one month and theyshowed very small sensitivity variation. That can be explained with less than lkGyof accumulated dose in one week.
Variation in diode sensitivity with field size was very small, producing about0.5% overestimation of dose, for 25 cm square field (Figure la). This is expectedresult for 60Co beams and EDE diodes [7,8] in contrast to the high-energy photonbeams where correction can be about 2% [1,3]. Due to the electron contaminationof primary beam, originated from head scatter, diodes measure larger surface dosethan dose at dmax, measured by chamber. That is the reason for decreasing the CFFS
for larger collimator openings.
302
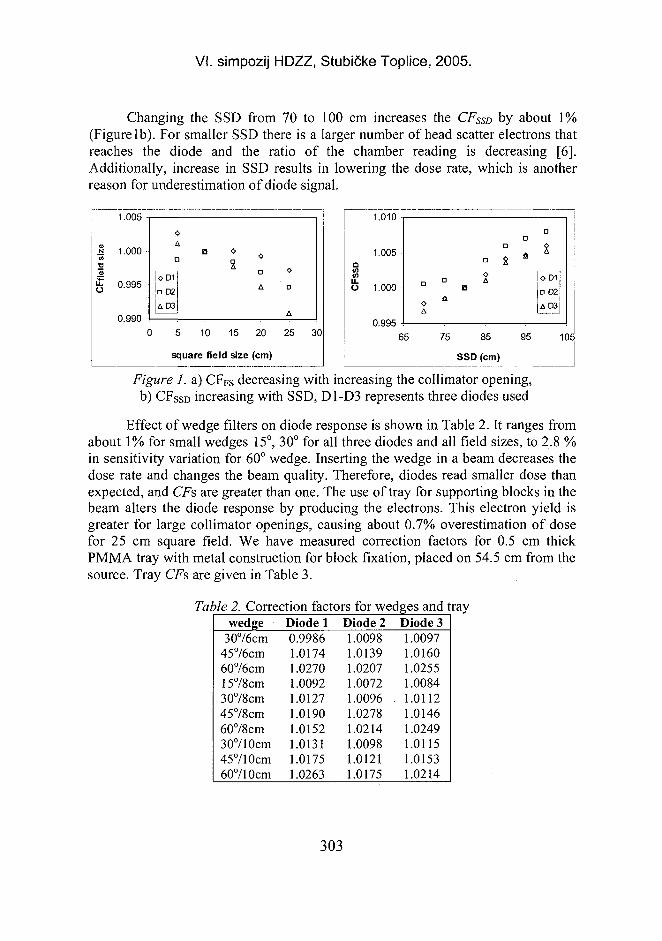
VI. simpozij HDZZ, Stubičke Toplice, 2005.
Changing the SSD from 70 to 100 cm increases the CFSSD by about 1%(Figurelb). For smaller SSD there is a larger number of head scatter electrons thatreaches the diode and the ratio of the chamber reading is decreasing [6].Additionally, increase in SSD results in lowering the dose rate, which is anotherreason for underestimation of diode signal.
1.005
£ 0.995
0.990
oA
D
•
!oD1n D2
AD3I ,
O
QA
O
a
A
o
O
A
5 10 15 20 25
square field size (cm)
30
Figure 1. a) CFFs decreasing with increasing the collimator opening,b) CFSSD increasing with SSD, D1-D3 represents three diodes used
Effect of wedge filters on diode response is shown in Table 2. It ranges fromabout 1% for small wedges 15°, 30° for all three diodes and all field sizes, to 2.8 %in sensitivity variation for 60° wedge. Inserting the wedge in a beam decreases thedose rate and changes the beam quality. Therefore, diodes read smaller dose thanexpected, and CFs, are greater than one. The use of tray for supporting blocks in thebeam alters the diode response by producing the electrons. This electron yield isgreater for large collimator openings, causing about 0.7% overestimation of dosefor 25 cm square field. We have measured correction factors for 0.5 cm thickPMMA tray with metal construction for block fixation, placed on 54.5 cm from thesource. Tray CFs are given in Table 3.
Table 2. Correction factors for wedges and traywedge
3076cm4576cm6076cm1578cm3078cm4578cm6078cm30710cm45710cm60710cm
Diode 10.99861.01741.02701.00921.01271.01901.01521.01311.01751.0263
Diode 21.00981.01391.02071.00721.00961.02781.02141.00981.01211.0175
Diode 31.00971.01601.02551.00841.01121.01461.02491.01151.01531.0214
303
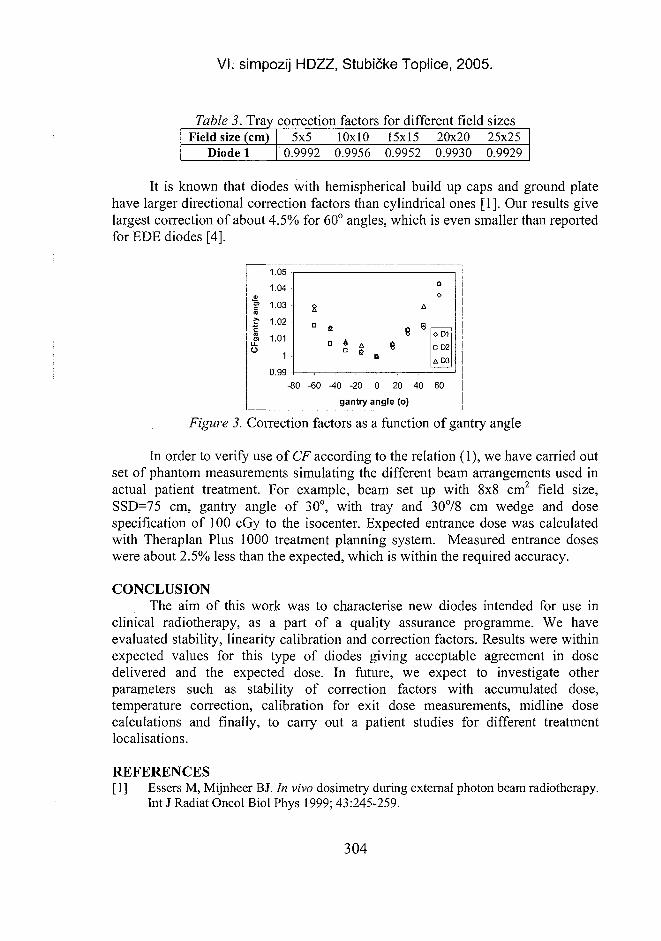
VI. simpozij HDZZ, Stubičke Toplice, 2005.
Table 3.Field size
Diode
Tray(cm)1
correction factors5x5
0.999210x10
0.9956
for different field15x15 20x200.9952 0.9930
sizes25x250.9929
It is known that diodes with hemispherical build up caps and ground platehave larger directional correction factors than cylindrical ones [1]. Our results givelargest correction of about 4.5% for 60° angles, which is even smaller than reportedfor EDE diodes [4].
-80 -60 -40 -20 0 20 40
gantry angle (o)
Figure 3. Correction factors as a function of gantry angle
In order to verify use of CF according to the relation (1), we have carried outset of phantom measurements simulating the different beam arrangements used inactual patient treatment. For example, beam set up with 8x8 cm2 field size,SSD=75 cm, gantry angle of 30°, with tray and 30°/8 cm wedge and dosespecification of 100 cGy to the isocenter. Expected entrance dose was calculatedwith Theraplan Plus 1000 treatment planning system. Measured entrance doseswere about 2.5% less than the expected, which is within the required accuracy.
CONCLUSIONThe aim of this work was to characterise new diodes intended for use in
clinical radiotherapy, as a part of a quality assurance programme. We haveevaluated stability, linearity calibration and correction factors. Results were withinexpected values for this type of diodes giving acceptable agreement in dosedelivered and the expected dose. In future, we expect to investigate otherparameters such as stability of correction factors with accumulated dose,temperature correction, calibration for exit dose measurements, midline dosecalculations and finally, to carry out a patient studies for different treatmentlocalisations.
REFERENCES[1] Essers M, Mijnheer BJ. In vivo dosimetry during external photon beam radiotherapy.
Int J Radiat Oncol Biol Phys 1999; 43:245-259.
304
VI. simpozij HDZZ, Stubičke Toplice, 2005.
[2] Loncol T, Greffe JL, Vynckier S, Scalliet P. Entrance and exit dose measurementwith semiconductors and TLD: a comparison of methods and in vivo results.Radiother Oncol 1996; 41:179-187.
[3] Jornet N, Ribas M, Eudaldo T. In vivo dosimetry: Intercomparison between p-typeand n-type based diodes for the 16-25 MV range. Med Phys 2000; 27:1287-1293.
[4] Van Dam J, Marinello G. Methods for in vivo dosimetry in external radiotherapy.Physics for clinical radiotherapy. ESTRO Booklet No.l; 1994.
[5] Huyskens D. et al. Practical guidelines for the implementation of in vivo dosimetrywith diodes in external radiotherapy with photon beams (entrance dose). Physics forclinical radiotherapy. ESTRO Booklet No.5; 2001.
[6] Leunens G, Van Dam J, Dutreix A, van der Schueren E. Quality assurance inradiotherapy by in vivo dosimetry. 1. Entrance dose measurements, a reliableprocedure. Radiother Oncol 1990; 17:141-151.
[7] Nilsson B, Ruden B-I, Sorcini B. Characterization of silicon diodes as patientdosemeters in external radiation therapy. Radiother Oncol 1988; 11:279-288.
[8] Voordeckers M, Goosens H, Rutten J, Van den Bogaert W. The implementation of/«vivo dosimetry in a small radiotherapy department. Radiother Oncol 1998; 47: 45-48.
Acknowledgement: This work has been supported in part by International Atomic Energy Agency(Research Project Contract No. 13115).
ABSTRACTSemiconductor detectors for entrance dose measurements were calibrated in
order to perform in vivo dosimetry as a part of a quality assurance programme forexternal beam radiotherapy at our department. Calibration included DPD-3Scanditronix basic unit and p-type silicon diodes EDE-5, designed for Co-60beams and calibrated using Farmer type ionisation chambers connected to a PTWUnidos electrometer. Entrance dose calibration factors were determined as a ratioof diode signal measured at phantom surface and ionisation chamber signal,measured at depth of maximum dose in a polystyrene phantom. We evaluateddifferent correction factors for various source to surface distances, collimatoropenings, beam directions or gantry angles and presence of wedges and trays inbeam set up. Polystyrene and Alderson Rando phantom were measured to comparemeasured doses with those calculated using Theraplan Plus 1000 computertreatment planning system.
305
VI. simpozij HDZZ, Stubičke Toplice,; HR0500069
DOZE ZA MAMOGRAFSKE PRETRAGE NA INSTITUTU ZARADIOLOGIJU
Adnan Beganović1, Suad Džanić2, Begzada Bašić2, Advan Drljević3 iAmra Skopljak4
'Klinički centar Univerziteta Sarajevo, Institut za radiologiju2Institut za javno zdravstvo, Centar za zaštitu od zračenja
3Klinički centar Univerziteta Sarajevo, Institut za onkologiju4Klinički centar Univerziteta Sarajevo, Institut za nuklearnu medicinu
71000 Sarajevo, BiHe-mail: [email protected]
UVODMamografija. Osnovna radiološka metoda za rano otkrivanje karcinoma
dojke.Srednja glandularna doza ili AGD [1]. Termin kojim se opisuje doza
zračenja kod mamografskog pregleda dojke. To je apsorbovana doza žljezdanogtkiva homogeno kompresovane dojke koja se sastoji od 50% žljezdanog i 50%masnog tkiva. Referentna debljina dojke mora biti navedena.
Standardna srednja glandularna doza ili standardna AGD. Ovu vrijednostdobijamo ako izračunamo srednju glandularnu dozu koristeći standardnimamografski fantom (45 mm PMMA).
Filterska poluvrijednost ili HVL. HVL (half value layer) je mjera kvalitetazračenja. Izražava se u mm Al i predstavlja debljinu aluminija potrebnu da intezitetupadnog snopa zračenja smanji za 50%.
Konverzioni faktor g [2] Faktori dobijeni numeričkim metodama, a služe zakonverziju ESAK u AGD.
Korištenje jonizirajućeg zračenja podrazumijeva i pridržavanje osnovnihprincipa zaštite od zračenja: opravdanost i optimizacija. U dijagnostičkojradiologiji, što uključuje i mamografiju, optimizacija znači ostvarivanje što boljekvalitete snimka uz najmanju moguću dozu zračenja.
Srednja glandularna doza direktno je povezana sa rizikom pojave tumora kaoposljedice samog pregleda. Mjerenjem ove veličine možemo i kvantitativnoodrediti taj rizik. Ipak, značajnije je izmjerenu dozu uporediti sa referentnimvrijednostima u svijetu, te na taj način ispitati kvalitet rada u određenoj instituciji.
MATERIJAL I METODEMjerenje je obavljeno na Institutu za radiologiju Kliničkog centra
Univerziteta Sarajevo. Korištenje mamografski aparat Siemens Mammomat 1000(Slika 1), koji je zadovoljio sve testove kontrole kvaliteta.
306
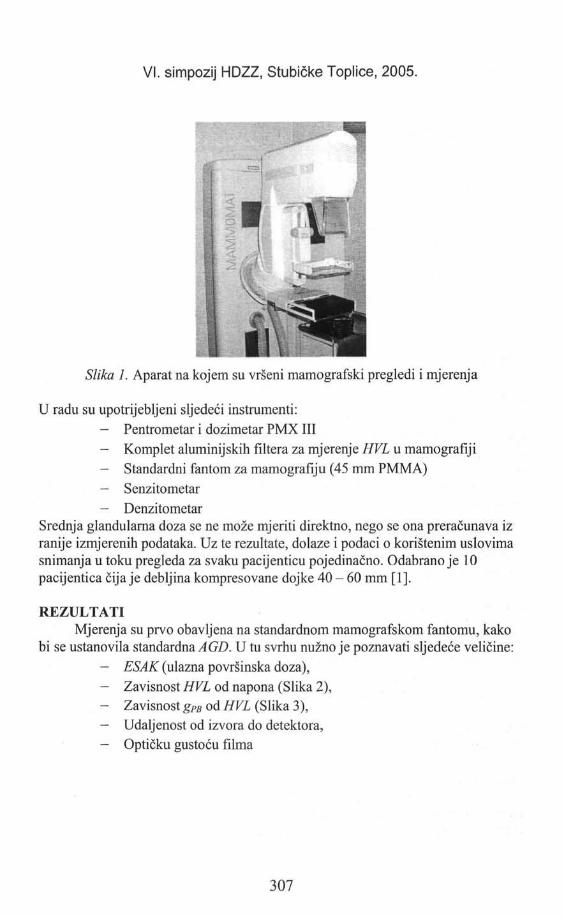
VI. simpozij HDZZ, Stubičke Toplice, 2005.
Slika 1. Aparat na kojem su vršeni mamografski pregledi i mjerenja
U radu su upotrijebljeni sljedeći instrumenti:- Pentrometar i dozimetar PMX III- Komplet aluminijskih filtera za mjerenje HVL u mamografiji- Standardni fantom za mamografiju (45 mm PMMA)- Senzitometar- Denzitometar
Srednja glandularna doza se ne može mjeriti direktno, nego se ona preračunava izranije izmjerenih podataka. Uz te rezultate, dolaze i podaci o korištenim uslovimasnimanja u toku pregleda za svaku pacijenticu pojedinačno. Odabrano je 10pacijentica čija je debljina kompresovane dojke 40 - 60 mm [1].
REZULTATIMjerenja su prvo obavljena na standardnom mamografskom fantomu, kako
bi se ustanovila standardna AGD. U tu svrhu nužno je poznavati sljedeće veličine:- ESAK (ulazna površinska doza),- Zavisnost HVL od napona (Slika 2), . . .- Zavisnost gPB od HVL (Slika 3),- Udaljenost od izvora do detektora,- Optičku gustoću filma
307
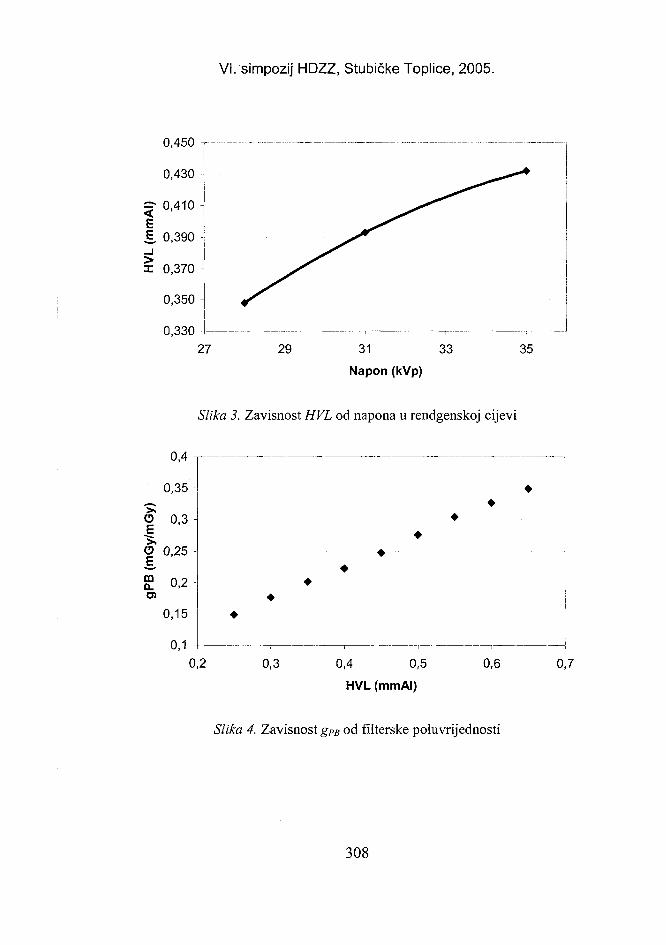
VI. simpozij HDZZ, Stubičke Toplice, 2005.
(IVU
E,_ i
I
0,450
0,430
0,410
0,390 -
0,370 -
0,350
0,3302
i
7i
29 31 33
Napon (kVp)
35
Slika 3. Zavisnost HVL od napona u rendgenskoj cijevi
0,4 n
0,35
O 0,3 -
O 0,25 -
O)0,2 -
0,15 -
0,10,2 0,3 0,4 0,5
HVL (mmAI)
0,6 0,7
Slika 4. Zavisnost gPB od filterske poluvrijednosti
308
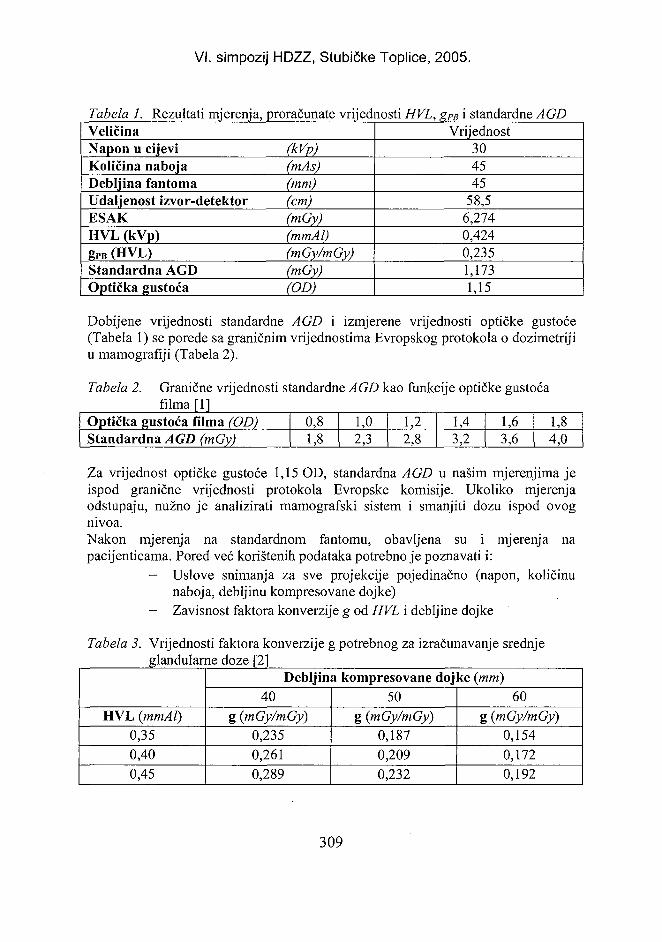
VI. simpozij HDZZ, Stubičke Toplice, 2005.
Tabela 1. Rezultati mjerenja,VeličinaNapon u cijeviKoličina nabojaDebljina fantomaUdaljenost izvor-detektorESAKHVL (kVp)SPB (HVL)Standardna AGDOptička gustoća
proračunate vrijednosti HVL,
(kVp)(mAs)(mm)(cm)(mGy)(mmAl)(mGy/mGy)(mGy)(OD)
gpB i standardne AGDVrijednost
304545
58,56,2740,4240,2351,1731,15
Dobijene vrijednosti standardne AGD i izmjerene vrijednosti optičke gustoće(Tabela 1) se porede sa graničnim vrijednostima Evropskog protokola o dozimetrijiu mamograflji (Tabela 2).
Tabela 2. Granične vrijednosti standardne AGD kao funkcije optičke gustoćafilma [11
Optička gustoća filma (OD)Standardna AGD (mGy)
0,81,8
1,02,3
1,22,8
1,43,2
1,63,6
1,84,0
Za vrijednost optičke gustoće 1,15 OD, standardna AGD u našim mjerenjima jeispod granične vrijednosti protokola Evropske komisije. Ukoliko mjerenjaodstupaju, nužno je analizirati mamografski sistem i smanjiti dozu ispod ovognivoa.Nakon mjerenja na standardnom fantomu, obavljena su i mjerenja napacijenticama. Pored već korištenih podataka potrebno je poznavati i:
- Uslove snimanja za sve projekcije pojedinačno (napon, količinunaboja, debljinu kompresovane dojke)
— Zavisnost faktora konverzije g od HVL i debljine dojke
Tabela 3. Vrijednosti faktora konverzije g potrebnog za izračunavanje srednjeglandularne doze [2]
HVL (mmAl)0,350,400,45
Debljina kompresovane dojke (mm)40
g (mGy/mGy)0,2350,2610,289
50g (mGy/mGy)
0,1870,2090,232
60g (mGy/mGy)
0,1540,1720,192
309
VI. simpozij HDZZ, Stubičke Toplice, 2005.
Konačni obrazac za dobijanje srednje glandularne doze izgleda ovako:/ \2
DPB ~lFFD
, "-FFD + ®FDD
gdje je:Ka - ulazna doza na koži, zavisi od količine naboja i napona,dFFD - udaljenost od fokusa do filma,<IFDD - udaljenost od fokusa do detektora,t - debljina kompresovane dojke,g - faktor konverzije očitan iz tabelarnih vrijednosti.
Kvadrirani član je korekcija za promjenu udaljenosti od fokusa do kože, kojanastaje kao posljedica različitih debljina kompresovane dojke.Primjer proračuna za jednu projekciju izgledao bi ovako:
= 27,4 mAs • 0,142
= 0,739 mGy
mAs 1 575 mm+ 55 mm-52 mm0,192
Izračunata je doza za jednu projekciju, u ovom slučaju KK snimak desne dojke.AGD ćemo dobiti sabiranjem doza iz sve četiri projekcije i dijeljenjem sa 2.
Tabela 4. Srednje glandularne doze za 10 pacijentica snimanih na Institutu zaradiologiju
Broj
12345678910
Sr. vr.
KK projekcijaAGDKKLD
(mGy)0,8650,6910,7470,8761,0380,5800,7190,8120,7790,877
0,798
AGDKKDD(mGy)0,7390,8060,7500,7650,7030,7500,7520,6920,8520,833
0,764
Lateralna projekcijaA G D L A T L D
(mGy)1,1311,1731,1350,9320,9430,7231,0201,0820,8321,808
1,078
AGDLATDD(mGy)1,1001,7010,9150,7891,1070,8411,2741,2440,7981,294
1,106
AGD(mGy)1,9172,1861,7731,6811,8961,4471,8821,9151,6312,405
1,873
310
VI. simpozij HDZZ, Stubičke Toplice, 2005.
ZAKLJUČAKIz Tabele 4 može se vidjeti da je srednja vrijednost AGD 1,873 mGy. Ova
vrijednost direktno je proporcionalna riziku pojave tumora kao posljedicemamografskog snimanja. Ovaj se rizik mora odrediti prije nego počnunesimptomatski pregledi određene populacije. Na taj način osigurava seopravdanost izlaganja ionizirajućem zračenju.
LITERATURA[1] Zoetelief J, Fitzgerald M, Leitz W, Sabel M. European Protocol on Dosimetry in
Mammography. Office for Official Publication of the European Communities, 1996.[2] Dance DR. Monte Carlo calculation of conversion factors for the estimation of mean
glandular breast dose. Phys Med Biol 1990;35(9): 1211-1219.
DOSES IN MAMMOGRAPHY AT INSTITUTE OFRADIOLOGY
Adnan Beganović', Suad Džanić2, Begzada Bašić2, Advan Drljević3 andAmra Skopljak4
'Clinical Centre of Sarajevo University, Institute of Radiologyinstitute of Public Health, Radiation Protection Centre
3Clinical Centre of Sarajevo University, Institute of Oncology4Clinical Centre of Sarajevo University, Institute of Nuclear Medicine, 71000
Sarajevo, Bosnia and Herzegovinae-mail: [email protected]
Mammography is a radiological technique used for early detection of breastcancer. Since it uses harmful ionising radiation, it is necessary to determine risksvs. benefits. The quantity commonly used to describe dose received by a breast isreferred to as average glandular dose (AGD). In order to get this value we need toknow: half value layer; output; correction factor g; and breast thickness. AGDcould be measured in real patients as well as using a standard breast phantom(45 mm PMMA). The standard AGD in our mammography unit is 1.173 mGy,which is well below the limit value. We measured average the glandular dose for10 patients. The mean value was 1.873 mGy and was directly proportional to therisk of radiation-induced illnesses.
311
VI. simpozij HDZZ, Stubičke Toplice, HR0500070
PROTOKOL RADIOLOŠKOG SNIMANJA TORAKALNIHORGANA U SVRHU ZAŠTITE OD ZRAČENJA
Đurđica Milković1, Maria Ranogajec-Komor2 i Saveta Miljanić2
'Specijalna bolnica za bolesti dišnog sustava djece i mladeži "Srebrnjak",Srebrnjak 100, 10000 Zagreb
2Institut "Ruđer Bošković", Bijenička c. 54, 10000 Zagrebe-mail: [email protected]
UVODStandardne snimke pluća osnovna su radiološka pretraga u dijagnostici
bolesti pluća djece i mladeži. Bolesnike snimamo u posterio-anteriornoj (PA) ilateralnoj projekciji. Na osnovu tih projekcija te uz ponekad dodane polukosesnimke odlučuje radiolog za daljnju radiološku pretragu uz adekvatnu kliničkuobradu.
U kliničkoj svakodnevnoj praksi ostale radiološke pretrage kojeprimjenjujemo na našim bolesnicima su: dijaskopija, konvencionalna tomografija,kompjuterizirana tomografija, radioizotopne pretrage, ultrazvučne metodepregleda, angiografija, magnetska rezonanca (MRI) te bronhografija (BGR).Znanje, iskustvo i stručnost radiologa kao i suradnja s kliničarom će odlučiti kad ikojim slijedom će se neka od ovih pretraga učiniti. Redoslijed nije bitan samo zbogdonošenja pravilne i točne dijagnoze nego i zbog smanjenja izloženosti pacijenatazračenju.
Kao što je poznato, najveći doprinos izloženosti zračenju iz umjetnih izvorazračenja imaju doze dobivene u medicinske svrhe. Najveći dio tog doprinosa dolaziiz dijagnostičke radiologije, te je zbog toga potrebno sve poduzeti da se smanještetne posljedice zračenja od dijagnostičkih rendgenskih pretraga. To je osobitoznačajno za rendgenske preglede dišnih puteva jer među rendgenskim metodamapregleda torakalni organi po učestalosti zauzimaju prvo mjesto. Komitet eksperataza zaštitu od ionizirajućeg zračenja Svjetske zdravstvene organizacije [1] je uokviru svojih preporuka skrenuo osobitu pozornost na ograničavanjerendgendijagnostičkih pregleda kod djece te na obvezu uporabe suvremene tehnikei zaštite. Razlog ove predostrožnosti proizlazi iz činjenice što su djeca budućireproduktivni dio stanovništva pa je stoga genetski rizik za cjelokupnu populacijuveći nego pri ozračivanju odraslih. Kod mlađe populacije je i somatski rizik uobliku leukemija i malignih tumora veći zbog duge latencije. Za odgovarajućuzaštitu od zračenja veoma je važno točno određivanje kvalitete i količine zračenja.
Zbog toga svrha rada je procjena izlaganja zračenju najmlađe populacijepomoću mjerenja doze zračenja djece i mladeži pri snimanju dišnog sustava. U tusvrhu upotrebljeni su različiti, prethodno dobro karakterizirani TLD sustavi [2-3].Na osnovu dobivenih podataka moguće je procjeniti kancerogeno i genetsko
312
VI. simpozij HDZZ, Stubičke Toplice, 2005.
oštećenje kojem su djeca izložena u radiološkoj dijagnostici torakalnih organa.Tijekom ispitivanja procjenjena je efikasnost radioloških metoda zaštite našihbolesnika.
MATERIJALI I METODEU našem istraživanju upotrebili smo LiF i CaF2:Mn detektore, a LiF bio je
dopiran s različitim aktivatorima. Detektori su bili sistematski ispitivani u poljuzračenja rendgen uređaja Thoracomat firme Siemens te Multix s rotacionom cijevii stojećim stativom. Karakteristike TL detektora i podaci o regeneraciji i evaluacijidani su u našim ranijim radovima [2,3].
Srednje doze zračenja mjerene su na 50 pacijenata. Pacijente smo podjelili upet dobnih skupina: 0-3 godine, 3-6 godina, 6-9 godina, 9-12 godina i od 12 godinanadalje i pregledali u PA i profilnoj projekciji. U svakoj dobnoj skupini bilo je 10pacijenata.
Slučajno uzorkovanje smatra se metodom kojom se najpouzdanije postižereprezentativnost uzorka. Izbor pacijenata učinili smo prema toj metodi [4] tj. svakije bolesnik imao jednaku priliku da bude izabran.
REZULTATI - PROTOKOL SNIMANJANajveći dio mjerenja je učinjen pri uobičajenim standardnim pretragama
toraksa i to u PA projekciji, te lijevoj ili desnoj profilnoj projekciji. Za analizugornjih regija pluća osobito kod sumnje na destruktivne lezije ili tumorozne tvorberadimo snimke u apiko-lordotičnoj projekciji.
Standardne snimke djece u dobi do 3 godine snimamo na Thoracomatu.Kako djeca te životne dobi ne sudjeluju pri pregledu, upotrebljavamo napravukojom imobiliziramo dijete, takozvani baby-fix. To je proziran, plastičanpoluvaljak raznih veličina, prilagođenih dobi i težini djeteta. Dijete se stavlja uvaljak i pričvrsti vezicama, a potom se objesi pred kameru. Iskustva su dobra. Kaduporaba ovog pomagala nije moguća, djecu drže roditelji ili netko odneradiološkog osoblja.
Nešto veću djecu snimamo na podesivom i rotacionom stolcu, a pridržava ihosoba koja se nalazi iza zaštitnog paravana što u svojoj konstrukciji sadrži olovo.Otvori za ruke omogućuju da se dijete drži. Veću djecu snimamo u stojećempoložaju na aparatu Multix.
Uvjeti snjimanja u našoj svakodnevnoj praksi, koji znatno utječu naizloženost djece, prikazani su u Tablici 1.
313

VI. simpozij HDZZ, Stubičke Toplice, 2005.
Tablica 1. Uvjeti snimanja toraksa djece
Rendgenskiuređaj
Thoracomat
Multix
Projekcija
PAProfilna
PA
Profilna
Napon(kV)
70-7575-80
90-120
100-120
Količina
(mAs)1,2-2,54,0-8,0
1,2-4,0
2,5-10
Vrijemeekspozicije (s)
0,01-0,020,01-0,02
0,01-0,02
0,01-0,4
Mjerili smo doze zračenja na različitim dijelovima tijela: leđima, prsima,štitnjači, desnom oku i desnoj gonadi tijekom snimanja torakalnih organa.Vrijednosti srednjih doza izmjerenih tijekom eksperimenta rasle su i padale ovisnoo udaljenosti od primarnog snopa. Srednja vrijednost doza izmjerena na koži 50pacijenta iznosila je na leđima 0,26 mSv, na prsima 0,20 mSv, na štitnjači 0,17mSv, u desnoj aksili 0,13 mSv, nad desnim okom 0,05 mSv, a u području desnegonade 0,04 mSv.
U djece starije dobi srednja doza zračenja izmjerena na leđima, prsima,štitčnjači i desnoj aksili bila je veća nego doze izmjerene na istim mjestima tj.organima u djece ispod 3 godine starosti.
Kožna doza zračenja u aksili raste s dobi od 0,05 - 0,18 mSv, dok dozazračenja na koži izmjerena na leđima nije bitno porasla u zadnje dvije dobneskupine tj. 0,33 mSv do 0,36 mSv. Doze na leđima su veće nego doze na prsima usvim grupama, budući da se zračenje apsorbira prolaskom kroz tijelo pacijenrta.Doze izmjerene u području štitne žlijezde uspoređene s dozama izmjerenim naprsima zanemarive su u zadnje tri dobne skupine. Kožne doze zračenja izmjerenena desnom oku i desnoj gonadi su u zadnje četiri dobne skupine male (0,02 -0,04mSv.).
Pomoću apsorbirane doze koju smo mjerili na 50 pacijenata te težinskogfaktora i faktora rizika prema ICRP60 [5] procijenili smo broj oboljelih odkarcinoma ili broj genetskih oštećenja na određeni broj snimljenih pacijenata [6].Na primjer na 5 000 000 djece pri pregledu torakalnih organa dolazi 1 pacijent soštećenjem karcinoma pluća. Iako procijenjeni rizici nisu alarmantni, valjaprovoditi sve mjere zaštite, kako pacijenata tako i osoblja. Pri planiranju zaštitetreba uvijek imati na umu analizu razumnog troška, kao i osnovne principe zaštiteod zračenja [5].
Kod procjene rizika cijele populacije treba uzeti u obzir broj pacijenata.Slika 1 pokazuje broj pacijenata kojima su učinjene snimke pluća i srca u dvijeprojekcije u razdoblju od 1969. do 2004. godine. Vidi se osjetan pad nakon 1990.godine što je posljedica domovinskog rata. Nakon 1991. broj pregledanihpacijenata ne mijenja se značajno, ostaje na nepromijenjenoj razini do 1998. Nakon
314
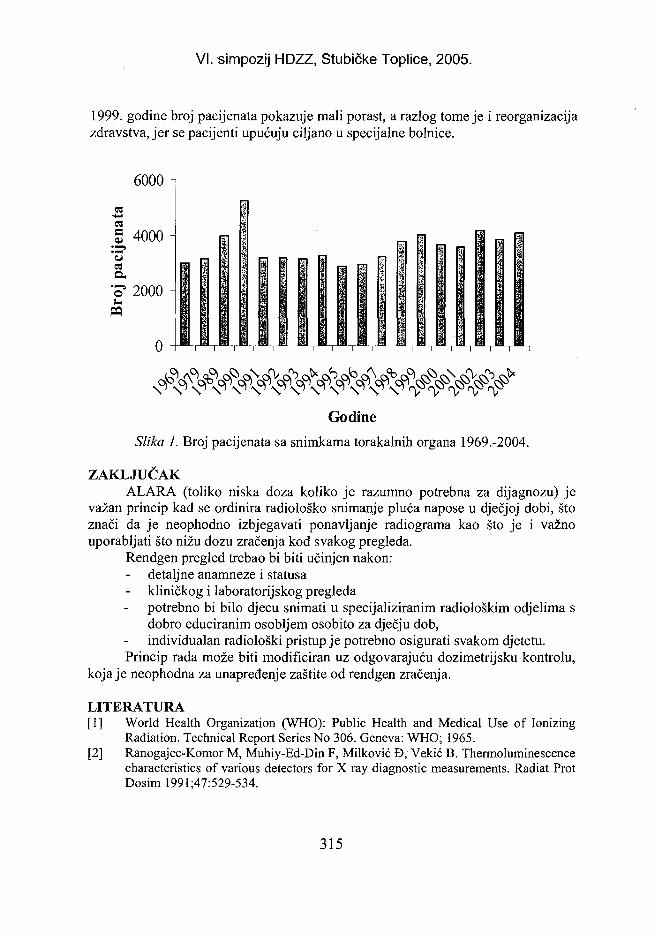
VI. simpozij HDZZ, Stubičke Toplice, 2005.
1999. godine broj pacijenata pokazuje mali porast, a razlog tome je i reorganizacijazdravstva, jer se pacijenti upućuju ciljano u specijalne bolnice.
6000
g 4000
2000
> o!° cO*0?= dP> c $ c \ ^ o>cv> c ^
GodineSlika 1. Broj pacijenata sa snimkama torakalnih organa 1969.-2004.
ZAKLJUČAKALARA (toliko niska doza koliko je razumno potrebna za dijagnozu) je
važan princip kad se ordinira radiološko snimanje pluća napose u dječjoj dobi, štoznači da je neophodno izbjegavati ponavljanje radiograma kao što je i važnouporabljati što nižu dozu zračenja kod svakog pregleda.
Rendgen pregled trebao bi biti učinjen nakon:detaljne anamneze i statusakliničkog i laboratorijskog pregledapotrebno bi bilo djecu snimati u specijaliziranim radiološkim odjelima sdobro educiranim osobljem osobito za dječju dob,individualan radiološki pristup je potrebno osigurati svakom djetetu.
Princip rada može biti modificiran uz odgovarajuću dozimetrijsku kontrolu,koja je neophodna za unapređenje zaštite od rendgen zračenja.
LITERATURA[1] World Health Organization (WHO): Public Health and Medical Use of Ionizing
Radiation. Technical Report Series No 306. Geneva: WHO; 1965.[2] Ranogajec-Komor M, Muhiy-Ed-Din F, Milković Đ, Vekić B. Thermoluminescence
characteristics of various detectors for X ray diagnostic measurements. Radiat ProtDosim 1991;47:529-534.
315
VI. simpozij HDZZ, Stubičke Toplice, 2005.
[3] Miljanić S, Ranogajec-Komor M, Knežević Ž, Vekić B. Main dosimetriccharacteristics of some tissue-equivalent TL detectors. Radiat Prot Dosim2002; 100:437-442.
[4] Ivanković D, Božikov J, Kern J, Kopljar B, Luković G, Vuletić S. Osnove statističkeanalize za medicinare, ur. Keros P., Zagreb, Medicinski fakultet Sveučilišta uZagrebu, 1988: 111-114.
[5] International Commission on Radiological Protection (ICRP): Recommendations ofthe International Commission on Radiological Protection. ICRP Publications 60.,Oxford, New York: Pergamon Press; 1991.
[6] Milković Đ. Izloženost zračenju, mogućnosti zaštite i procjena rizika pri snimanjudišnih puteva djec. Doktorski rad. Zagreb: Medicinski fakultet Sveučilišta uZagrebu; 1999.
PROTOCOL OF RADIOGRAPHIC EXAMINATION OFCHILDREN IN ORDER TO IMPROVE THE RADIATION
PROTECTION
Đurđica Milković , Maria Ranogajec-Komor and Saveta Miljanić'Srebrnjak, Specialized Hospital for Respiratory System Diseases in Children and
Youth, Srebrnjak 100, 10000 Zagreb2Ruđer Bošković Institute, Bijenička c. 54, 10000 Zagreb
e-mail: [email protected]
Pulmonary radiograms are essential in the diagnostics of lung diseases ofchildren and youth. Frontal and lateral chest radiographs are basic for radiologicalexamination of the thorax. Plain radiographic findings and presumptive clinicaldiagnosis will determine the need for further imaging. To estimate the risk ofvarious damages in children, in our earlier study we measured radiation dosesreceived during radiological examination of thoracic organs using differentthermoluminescent detectors (TLD) placed in different positions on the body.Results were obtained for 50 patients divided in groups by age. Although theevaluated risks were not alarming, taking into account the average annual numberof patients, all patient protection measures should be carried out. It is important tonote that X-ray examination should be performed only if detailed history isprovided, that clinical and laboratory tests are complete, that a good, specialisedchildren radiology department is available which employs well-trained staff andthat an individual radiological approach to every child is assured.
316
VI. simpozij HDZZ, Stubičke Toplice,: HR0500071
PODRUČJE NADZORA OKO RENDGEN UREĐAJA ZASLIKANJE ZUBI - Dozimetrijska studija
Marija Surić Mihić', Ivica Prlić2, Sanja Milković-Kraus2,Tomislav Meštrović2 i Frane Rojnica3
'Sveučilište u Zagrebu, Medicinski fakultet, Salata 2, 10000 Zagreb2Institut za medicinska istraživanja i medicinu rada, Ksaverska c. 2, 10000 Zagreb
'Sveučilište u Zagrebu, Stomatološki fakultet, Gundulićeva 5, 10000 Zagreb
e-mail: [email protected], [email protected]
UVODPodručje nadgledanja uz zubarske rendgene - izvore ionizirajućeg zračenja
[1-3] je prostor gdje uz normalan i redovan rad klasičnih zubnih rendgena koji su utom prostoru instalirani nije moguće tijekom jedne godine izmjeriti ukupnuekvivalentnu dozu vanjskog ozračenja djelatnika veću od 1 mSv. Djelatnici ilipripadnici opće populacije koji puno radno vrijeme rade u tim prostorima (upodručju nadgledanja) ne moraju se podvrgavati nikakvom sistematskommedicinskom nadzoru tj. ti ljudi temeljem Zakona [3] nisu profesionalci koji radesa i uz izvore ionizirajućih zračenja u zoni nadzora [1-3]. Kako bi to dozimetrijskiprimjereno obradili izvršili smo mjerenja raspršenog rendgenskog zračenja nafantomu za seriju zubarskih standardnih postupaka. Pokazati ćemo da su nekaradna mjesta uz definirane tipove zubarskih rendgenskih izvora zračenja jedinopodručja nadgledanja, a nikako ne područja nadzora. Djelatnici koji u njima radene moraju obavljati redovite godišnje zdravstvene preglede samo zbog činjenice darade uz izvore ionizirajućih zračenja i ne moraju biti podvrgnuti obaveznomdozimetrijskom nadzoru (što je zadano zakonskim propisima [3]). U ovom raduprikazujemo dio rezultata dobivenih mjerenjima na raznim tipovima zubarskihrendgena koja smo radili u sklopu kontrole kvalitete zračenja tih aparata i koja supodloga za opširnu dozimetrijsku studiju u stomatologiji.
MATERIJAL I METODEZa mjerenja raspršenja rendgenskog zračenja koristili smo standardne
rendgenske aparate za slikanja zubi (Tablica 1). U ovom radu prikazujemo samodva odabrana mjerna mjesta, dva rendgenska aparata - Slika 3 i jednudijagnostičku pretragu i mjerenja raspršenja za vrijeme slikanja gornjih prednjihpremolara na fantomu (Slike 1, 3i Tablica 1).
317
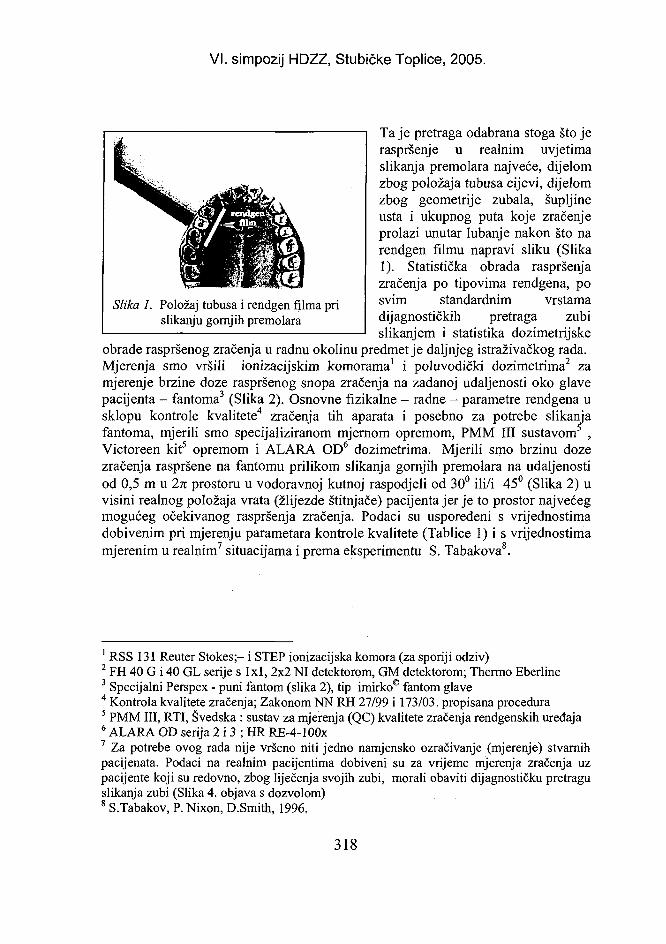
VI. simpozij HDZZ, Stubičke Toplice, 2005.
Slika 1. Položaj tubusa i rendgen filma prislikanju gornjih premolara
Ta je pretraga odabrana stoga što jeraspršenje u realnim uvjetimaslikanja premolara najveće, dijelomzbog položaja tubusa cijevi, dijelomzbog geometrije zubala, šupljineusta i ukupnog puta koje zračenjeprolazi unutar lubanje nakon što narendgen filmu napravi sliku (Slika1). Statistička obrada raspršenjazračenja po tipovima rendgena, posvim standardnim vrstamadijagnostičkih pretraga zubislikanjem i statistika dozimetrijske
obrade raspršenog zračenja u radnu okolinu predmet je daljnjeg istraživačkog rada.Mjerenja smo vršili ionizacijskim komorama1 i poluvodički dozimetrima2 zamjerenje brzine doze raspršenog snopa zračenja na zadanoj udaljenosti oko glavepacijenta - fantoma3 (Slika 2). Osnovne fizikalne - radne - parametre rendgena usklopu kontrole kvalitete4 zračenja tih aparata i posebno za potrebe slikanjafantoma, mjerili smo specijaliziranom mjernom opremom, PMM III sustavom5 ,Victoreen kit5 opremom i ALARA OD6 dozimetrima. Mjerili smo brzinu dozezračenja raspršene na fantomu prilikom slikanja gornjih premolara na udaljenostiod 0,5 m u 2n prostoru u vodoravnoj kutnoj raspodjeli od 30° ili/i 45° (Slika 2) uvisini realnog položaja vrata (žlijezde štitnjače) pacijenta jer je to prostor najvećegmogućeg očekivanog raspršenja zračenja. Podaci su uspoređeni s vrijednostimadobivenim pri mjerenju parametara kontrole kvalitete (Tablice 1) i s vrijednostimamjerenim u realnim7 situacijama i prema eksperimentu S. Tabakova8.
1 RSS 131 Reuter Stokes;- i STEP ionizacijska komora (za sporiji odziv)2 FH 40 G i 40 GL serije s 1x1, 2x2 NI detektorom, GM detektorom; Thermo Eberline3 Specijalni Perspex - puni fantom (slika 2), tip imirko® fantom glave4 Kontrola kvalitete zračenja; Zakonom NN RH 27/99 i 173/03. propisana procedura5 PMM III, RTI, Švedska : sustav za mjerenja (QC) kvalitete zračenja rendgenskih uređaja6 ALARA OD serija 2 i 3 ; HR RE-4-100x7 Za potrebe ovog rada nije vršeno niti jedno namjensko ozračivanje (mjerenje) stvarnihpacijenata. Podaci na realnim pacijentima dobiveni su za vrijeme mjerenja zračenja uzpacijente koji su redovno, zbog liječenja svojih zubi, morali obaviti dijagnostičku pretraguslikanja zubi (Slika 4. objava s dozvolom)8 S.Tabakov, P. Nixon, D.Smith, 1996.
318
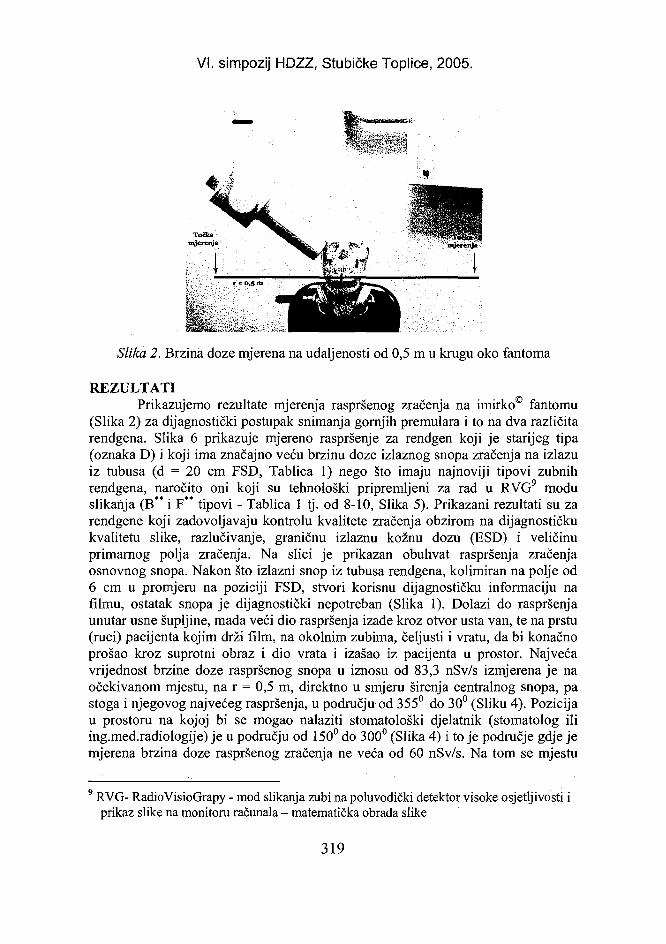
VI. simpozij HDZZ, Stubičke Toplice, 2005.
Slika 2. Brzina doze mjerena na udaljenosti od 0,5 m u krugu oko fantoma
REZULTATIPrikazujemo rezultate mjerenja raspršenog zračenja na imirko® fantomu
(Slika 2) za dijagnostički postupak snimanja gornjih premulara i to na dva različitarendgena. Slika 6 prikazuje mjereno raspršenje za rendgen koji je starijeg tipa(oznaka D) i koji ima značajno veću brzinu doze izlaznog snopa zračenja na izlazuiz rubusa (d = 20 cm FSD, Tablica 1) nego što imaju najnoviji tipovi zubnihrendgena, naročito oni koji su tehnološki pripremljeni za rad u RVG9 moduslikanja (B** i F** tipovi - Tablica 1 tj. od 8-10, Slika 5). Prikazani rezultati su zarendgene koji zadovoljavaju kontrolu kvalitete zračenja obzirom na dijagnostičkukvalitetu slike, razlučivanje, graničnu izlaznu kožnu dozu (ESD) i veličinuprimarnog polja zračenja. Na slici je prikazan obuhvat raspršenja zračenjaosnovnog snopa. Nakon što izlazni snop iz rubusa rendgena, kolimiran na polje od6 cm u promjeru na poziciji FSD, stvori korisnu dijagnostičku informaciju nafilmu, ostatak snopa je dijagnostički nepotreban (Slika 1). Dolazi do raspršenjaunutar usne šupljine, mada veći dio raspršenja izađe kroz otvor usta van, te na prstu(ruci) pacijenta kojim drži film, na okolnim zubima, čeljusti i vratu, da bi konačnoprošao kroz suprotni obraz i dio vrata i izašao iz pacijenta u prostor. Najvećavrijednost brzine doze raspršenog snopa u iznosu od 83,3 nSv/s izmjerena je naočekivanom mjestu, na r = 0,5 m, direktno u smjeru širenja centralnog snopa, pastoga i njegovog najvećeg raspršenja, u području od 355° do 30° (Sliku 4). Pozicijau prostoru na kojoj bi se mogao nalaziti stomatološki djelatnik (stomatolog iliing.med.radiologije) je u području od 150° do 300° (Slika 4) i to je područje gdje jemjerena brzina doze raspršenog zračenja ne veća od 60 nSv/s. Na tom se mjestu
' RVG- RadioVisioGrapy - mod slikanja zubi na poluvodički detektor visoke osjetljivosti iprikaz slike na monitoru računala - matematička obrada slike
319
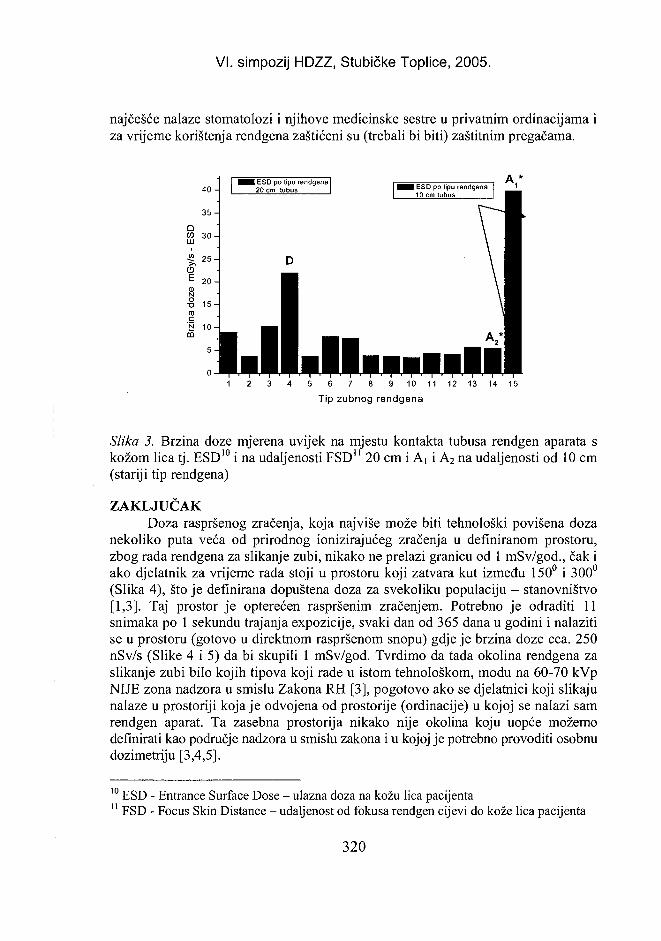
VI. simpozij HDZZ, Stubičke Toplice, 2005.
najčešće nalaze stomatolozi i njihove medicinske sestre u privatnim ordinacijama iza vrijeme korištenja rendgena zaštićeni su (trebali bi biti) zaštitnim pregačama.
1 2 3 4 5 6 7 8 9 10 11 12 13 14 15
Tip zubnog rendgena
Slika 3. Brzina doze mjerena uvijek na mjestu kontakta tubusa rendgen aparata skožom lica tj. ESD10 i na udaljenosti FSD11 20 cm i Ai i A2 na udaljenosti od 10 cm(stariji tip rendgena)
ZAKLJUČAKDoza raspršenog zračenja, koja najviše može biti tehnološki povišena doza
nekoliko puta veća od prirodnog ionizirajućeg zračenja u definiranom prostoru,zbog rada rendgena za slikanje zubi, nikako ne prelazi granicu od 1 mSv/god., čak iako djelatnik za vrijeme rada stoji u prostoru koji zatvara kut između 150° i 300°(Slika 4), što je definirana dopuštena doza za svekoliku populaciju - stanovništvo[1,3]. Taj prostor je opterećen raspršenim zračenjem. Potrebno je odraditi 11snimaka po 1 sekundu trajanja expozicije, svaki dan od 365 dana u godini i nalazitise u prostoru (gotovo u direktnom raspršenom snopu) gdje je brzina doze cea. 250nSv/s (Slike 4 i 5) da bi skupili 1 mSv/god. Tvrdimo da tada okolina rendgena zaslikanje zubi bilo kojih tipova koji rade u istom tehnološkom, modu na 60-70 kVpNIJE zona nadzora u smislu Zakona RH [3], pogotovo ako se djelatnici koji slikajunalaze u prostoriji koja je odvojena od prostorije (ordinacije) u kojoj se nalazi samrendgen aparat. Ta zasebna prostorija nikako nije okolina koju uopće možemodefinirati kao područje nadzora u smislu zakona i u kojoj je potrebno provoditi osobnudozimetriju [3,4,5].
10 ESD - Entrance Surface Dose - ulazna doza na kožu lica pacijenta" FSD - Focus Skin Distance - udaljenost od fokusa rendgen cijevi do kože lica pacijenta
320
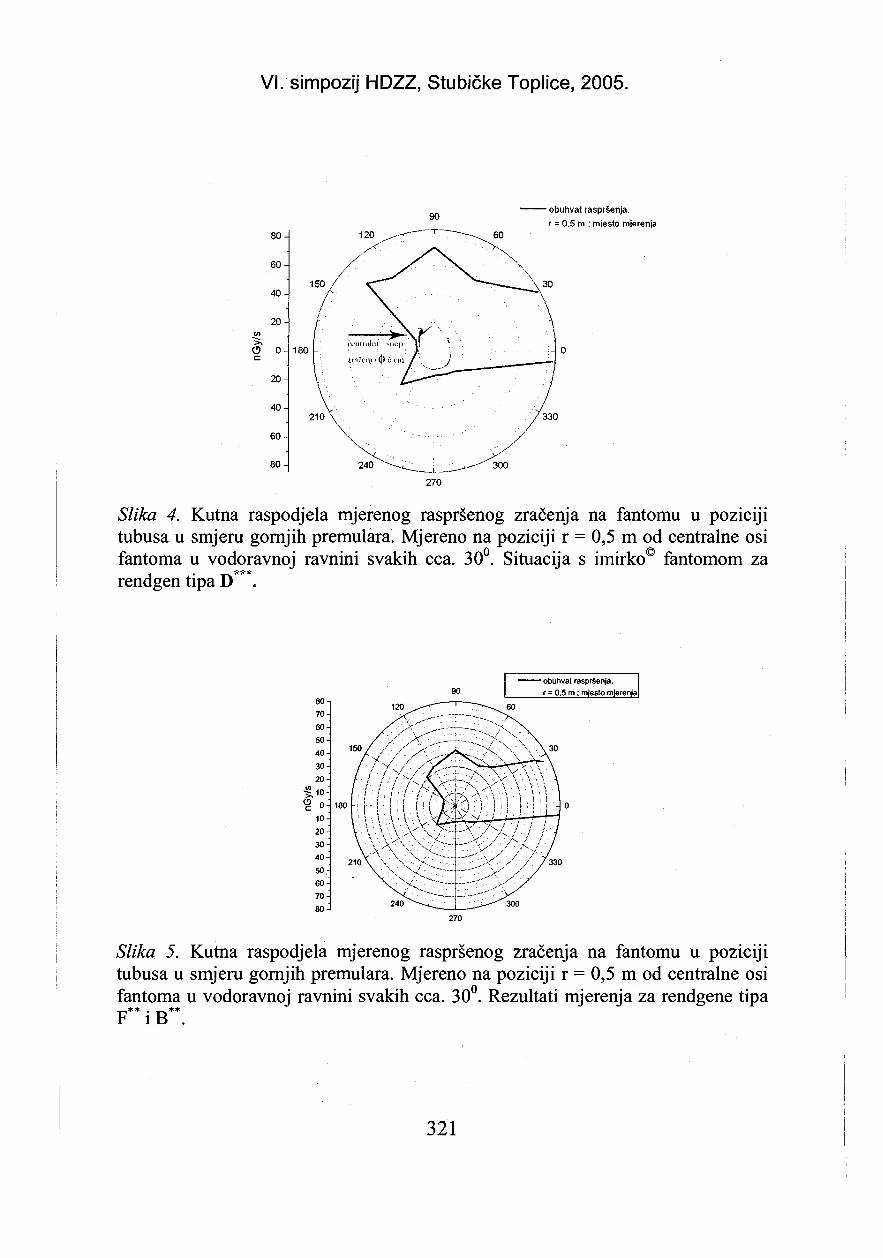
VI. simpozij HDZZ, Stubičke Toplice, 2005.
90
80-
60-
40-
20-
0 -
20-
40-
60-
80-
120
180 -
- obuhvat raspršenja,r = 0.5 m : mjesto mjerenja
30
330
300
270
Slika 4. Kutna raspodjela mjerenog raspršenog zračenja na fantomu u pozicijitubusa u smjeru gornjih premulara. Mjereno na poziciji r = 0,5 m od centralne osifantoma u vodoravnoj ravnini svakih cea. 30°. Situacija s imirko® fantomom zarendgen tipa D .
9080706050403020
1020304050607080
~ obuhvat raspršenja,0,5m; mjesto mjerenja
120
150
210
240 300
270
Slika 5. Kutna raspodjela mjerenog raspršenog zračenja na fantomu u pozicijitubusa u smjeru gornjih premulara. Mjereno na poziciji r = 0,5 m od centralne osifantoma u vodoravnoj ravnini svakih cea. 30°. Rezultati mjerenja za rendgene tipaF** i B**.
321
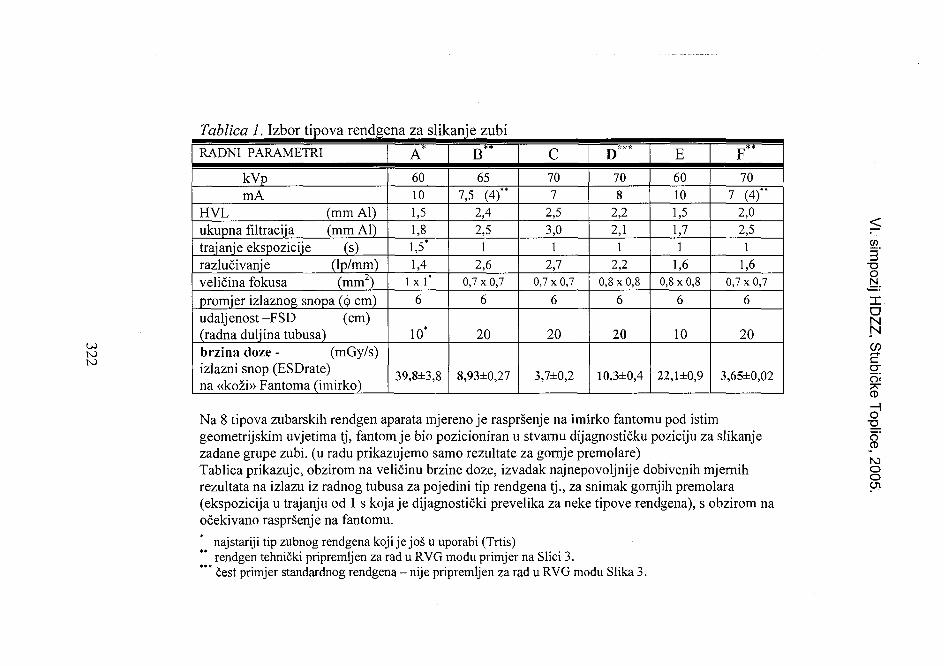
Tablica 1. Izbor tipova rendgena za slikanje zubi
NJNJ
RADNI PARAMETRI
kVpmA
HVL (mm Al)ukupna filtracija (mm Al)trajanje ekspozicije (s)razlučivanje (lp/mm)veličina fokusa (mm2)promjer izlaznog snopa (<j) cm)udaljenost-FSD (cm)(radna duljina tubusa)brzina doze - (mGy/s)izlazni snop (ESDrate)na «koži» Fantoma (imirko)
A'60101,51,81,5*1,4
1 x 1 '
6
10*
39,8±3,8
B „
657,5 (4)"
2,42,5
12,6
0,7x0,76
20
8,93±0,27
c707
2,53,0
12,7
0,7 x 0,7
6
20
3,7±0,2
D"""708
2,22,1
12,2
0,8 x 0,8
6
20
10,3±0,4
E60101,51,71
1,60,8 x 0,8
6
10
22,l±0,9
F "
707 (4)"
2,02,5
11,6
0,7x0,76
20
3,65±0,02
Na 8 tipova zubarskih rendgen aparata mjereno je raspršenje na imirko fantomu pod istimgeometrijskim uvjetima tj, fantom je bio pozicioniran u stvarnu dijagnostičku poziciju za slikanjezadane grupe zubi. (u radu prikazujemo samo rezultate za gornje premolare)Tablica prikazuje, obzirom na veličinu brzine doze, izvadak najnepovoljnije dobivenih mjernihrezultata na izlazu iz radnog tubusa za pojedini tip rendgena tj., za snimak gornjih premolara(ekspozicija u trajanju od 1 s koja je dijagnostički prevelika za neke tipove rendgena), s obzirom naočekivano raspršenje na fantomu.
najstariji tip zubnog rendgena koji je još u uporabi (Trtis)rendgen tehnički pripremljen za rad u RVG modu primjer na Slici 3.
* čest primjer standardnog rendgena - nije pripremljen za rad u RVG modu Slika 3.
3TJON.
liDNNU)r-h
CT7?CD
8"OO
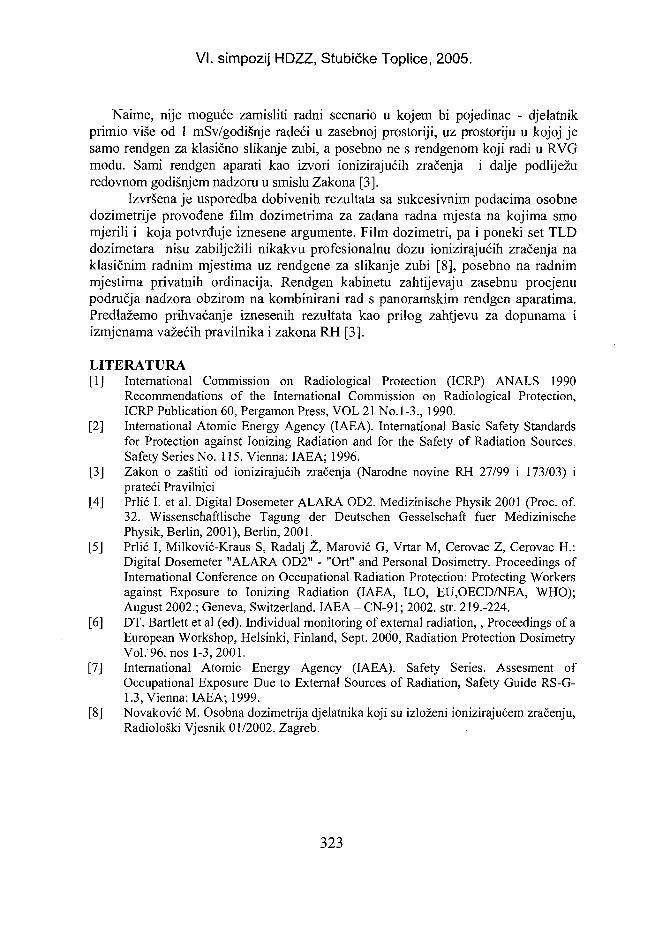
VI. simpozij HDZZ, Stubičke Toplice, 2005.
Naime, nije moguće zamisliti radni scenario u kojem bi pojedinac - djelatnikprimio više od 1 mSv/godišnje radeći u zasebnoj prostoriji, uz prostoriju u kojoj jesamo rendgen za klasično slikanje zubi, a posebno ne s rendgenom koji radi u RVGmodu. Sami rendgen aparati kao izvori ionizirajućih zračenja i dalje podliježuredovnom godišnjem nadzoru u smislu Zakona [3].
Izvršena je usporedba dobivenih rezultata sa sukcesivnim podacima osobnedozimetrije provođene film dozimetrima za zadana radna mjesta na kojima smomjerili i koja potvrđuje iznesene argumente. Film dozimetri, pa i poneki set TLDdozimetara nisu zabilježili nikakvu profesionalnu dozu ionizirajućih zračenja naklasičnim radnim mjestima uz rendgene za slikanje zubi [8], posebno na radnimmjestima privatnih ordinacija. Rendgen kabinetu zahtijevaju zasebnu procjenupodručja nadzora obzirom na kombinirani rad s panoramskim rendgen aparatima.Predlažemo prihvaćanje iznesenih rezultata kao prilog zahtjevu za dopunama iizmjenama važećih pravilnika i zakona RH [3].
LITERATURA[1] International Commission on Radiological Protection (ICRP) ANALS 1990
Recommendations of the International Commission on Radiological Protection,ICRP Publication 60, Pergamon Press, VOL 21 No. 1-3., 1990.
[2] International Atomic Energy Agency (IAEA). International Basic Safety Standardsfor Protection against Ionizing Radiation and for the Safety of Radiation Sources.Safety Series No. 115. Vienna: IAEA; 1996.
[3] Zakon o zaštiti od ionizirajućih zračenja (Narodne novine RH 27/99 i 173/03) iprateći Pravilnici
[4] Prlić I. et al. Digital Dosemeter ALARA OD2. Medizinische Physik 2001 (Proc. of.32. Wissenschaftlische Tagung der Deutschen Gesselschaft flier MedizinischePhysik, Berlin, 2001), Berlin, 2001.
[5] Prlić I, Milković-Kraus S, Radalj Ž, Marović G, Vrtar M, Cerovac Z, Cerovac H.:Digital Dosemeter "ALARA OD2" - "Ort" and Personal Dosimetry. Proceedings ofInternational Conference on Occupational Radiation Protection: Protecting Workersagainst Exposure to Ionizing Radiation (IAEA, ILO, EU,OECD/NEA, WHO);August 2002.; Geneva, Switzerland. IAEA-CN-91; 2002. str. 219.-224.
[6] DT. Bartlett et al (ed). Individual monitoring of external radiation,, Proceedings of aEuropean Workshop, Helsinki, Finland, Sept. 2000, Radiation Protection DosimetryVol. 96. nos 1-3, 2001.
[7] International Atomic Energy Agency (IAEA). Safety Series. Assesment ofOccupational Exposure Due to External Sources of Radiation, Safety Guide RS-G-1.3, Vienna: IAEA; 1999.
[8] Novaković M. Osobna dozimetrija djelatnika koji su izloženi ionizirajućem zračenju,Radiološki Vjesnik 01/2002. Zagreb.
323
VI. simpozij HDZZ, Stubičke Toplice, 2005.
CONTROL AREA AROUND DENTAL X-RAY UNITS - DOSIMETRICSTUDY I
Marija Surić Mihić1, Ivica Prlić2, Sanja Milković-Kraus2,Tomislav Meštrović2 and Frane Rojnica3
'University of Zagreb, Medical School, Salata 2institute for Medical Research and Occupational Health, Ksaverska c. 2
3University of Zagreb, Medical Dental School, Gundulićeva 5HR-10000 Zagreb, Croatia
e-mail: [email protected], [email protected]
The issue of prompt professional occupational dose reporting is raised when the intervalbetween doses is short or when the radiation source suffers a technical failure. Everyinvolved person should be able to recognised individual or group radiation exposure.Actual radiation quality of the source is to be taken into account. To optimise radiationprotection of dental radiologists, dental x-ray units were subject to Quality Controlmeasurements. Scattering radiation from the patient's dental structures was measured inorder to prove the results published by S. Tabakov, but using the modern RVG dental modeand several classical diagnostic positions. We used a special head phantom (real scull +Perspex + crown glass) and common dental x-ray units of various brands and types. Theradiation quality was measured using standard QA/QC equipment. We measured theradiation scattered from the phantom in the horizontal plane (at thyroid height) at 0.5 mdistance from the centre of the phantom. The measurement were done for a number ofstandard dental x-ray procedures, but this paper presents only the scattering caused by theupper premolars. The attenuation in the facial tissue was minimal and the majority ofincidental radiation passes through the open mouth of a patient directly into the room areacausing occupational exposure. The results we obtained are consistent with earlier reportson patient dosimetry. Occupational exposure is much lower if a modern RVG technique isused and no radiation protection threshold is exceeded in relation to Croatian laws. Muchmore important is the fact that the need for protective equipment and shielding is smaller ifQA warrants proper technical operation of the x-ray tube. The maintenance of dental unitsis essential and so is a proper training of staff using modern diagnostic techniques. Thecontrol area around the x-ray unit is to be calculated and established for every standarddental unit (this does not apply for panoramic x-rays). To conclude, there is no need foroverprotective measurements if a dental unit works in RVG mode, and the distance of 0.5-1m from the rear of the x-ray tube head is sufficiently safe for a dentist or technician,assuming that they are using adequate personal protection. Real time scattered radiationexposure dose rate pattern proves that any worker or other employee working near astandard RVG x-ray unit mounted on the dental chair is not required by law to undergo anyoccupational monitoring (dosimetry or health). The total annual dose per person willprobably not exceed 1 mSv under the worst working conditions. Hence, it is not necessaryto provide legally required, or even additional, occupational health care programme.
324
VI. simpozij HDZZ, Stubičke Toplice, 2 HR0500072
RADIATION TREATMENT PLANNING SYSTEMVERIFICATION
Mirjana Budanec, Tomislav Bokulić, Iva Mrčela and Zvonko KusićDepartment of Oncology and Nuclear Medicine, University Hospital"Sestre milosrdnice", Vinogradska c. 29, HR-10000 Zagreb, Croatia
e-mail: [email protected]
INTRODUCTIONThe optimal radiation treatment requires the delivery of the radiation dose
accurately and consistently. The main factor determining the required doseaccuracy is the shape of the tumour control probability and normal tissue damagecurves with respect to absorbed dose. The ICRU in its Report 24 [1] gave therecommendation that "the available evidence for certain types of tumor points tothe need for accuracy of ±5% in the delivery of an absorbed dose to a targetvolume if the eradication of the primary tumour is sought". To fulfil thisrequirement it is necessary to make quality checks of the equipment and softwareincluded in the radiation treatment planning process. One of the very importantparts of this process is treatment planning computer with the appropriate software,which is responsible for the calculation of the isodose distribution and accordingly,treatment times for the treatment of the patient [2].
MATERIALS AND METHODSThe Theraplan Plus V3.7 (MDS Nordion) treatment planning system (TPS)
is the Windows based programme. It comprises 11 modules. In our case the activemodules are Unit Modeling (UM), Patient Registration (PR), Patient DataAcquisition (PDA), Anatomy Modeling (AM), External Planning (EP) and DoseVolume Histograms (DVH).
We use Theraplan to make treatment plans for the irradiation of patients onthe 60Co unit (Cirus, CisBiointernational, France).
To run Theraplan Plus TPS, the mechanical and radiation information on thetreatment unit have to be inserted in the Unit Modeling module [3].
The calibration of the unit was made with the Farmer type chamber (30002,PTW, Freiburg) following the IAEA 277 protocol [4].The complete set of radiation data was measured by Wellhofer WP700 radiationfield scanning system. Percent Depth Doses (PDD) and Relative Dose Factors(RDF) were acquired for the quadratic field sizes from 4x4 cm2 to 32x32 cm2.Modifier Output Factors (MOF) were measured for the quadratic field sizes fromthe minimal to the maximal opening available for the certain wedge type (15, 30,45 or 60 degrees with the maximum width of 6, 8 or 10 cm). Off-Axis Ratios(OAR) were measured for the field sizes 4x4, 5x5, 8x8, 10x10, 15x15, 20x20 and
325
VI. simpozij HDZZ, Stubičke Toplice, 2005.
30x30 cm2. Peak Scatter Factors (PSF) were taken from the British Journal ofRadiology, Supplement 25 [5]. Chamber type IC4 (active volume 0.03 cm3) wasused for the acquisition of the profiles in the build up region (at the depth 0.3 cm)and on the depth of maximum dose (^max)- Chamber type IC15 (active volume 0.13cm3) was used for the PDDs, RDFs, MOFs and OARs on the depths 1.0, 2.0, 5.0,10.0 20.0 and 25.0 cm.
After the data input, the system has to calculate certain functions, which arenecessary for the algorithms calculating the dose distribution.
In order to verify the system calculation accuracy we used the system utilityfor comparison of measured and calculated central axis and off-axis ratio (profile)data. According to the ref. [7], the percentage deviation for the PDDs should bewithin ±2%, and for the OARs (in vertical direction) ±3%.
Additionally, we have constructed test cases representing different treatmentplanning conditions that are similar to the test cases in the AAPM Report No.55[6]. The treatment planning system was used to calculate treatment time (monitorunits, MU) for these test cases, by prescribing the dose at certain point. In order tocheck the calculation, we irradiated the Farmer type chamber (30002 PTW)positioned at the prescription point or at the specific point (depending on the testcase). Duration of the irradiation was defined by the treatment time that wascalculated for specific test case. The differences between prescribed dose,Ascribed (or, in the case of dose calculated at specific point £>Caicuiated) andmeasured (Z?d,mcasured) dose values for the dose prescription point at the depth dwere stated as percentage deviation ADđ(%), i.e.
ADi{%)= 100 * (/ .prescribed " Ai.measured) / Ai.measured (1)
ADA(%)= 100*(Al,calculated -Ai.measured) / Ai.measured (2)
In ref. [2] it is stated that the uncertainty for the treatment time calculation in thecase of single fields should be within ±2%. The overall uncertainty for thedetermination of the absorbed dose at reference point for the 60Co beam with theFarmer type chamber was estimated at 2.8% (1SD). For this reason we used thevalue of ±2.8% in the evaluation of the results.
RESULTSThe percentage difference between measured and calculated PDDs for the
square field sizes from 4x4 cm2 to 30x30 cm2 was within ±2%. The percentagedifference (in the vertical direction) in the profiles (OARs) for the fields 4x4, 5x5,8x8, 10x10, 15x15, 20x20 and 30x30 cm2 on the depths 0.3, 0.5, 1.0, 2.0, 5.0, 10.0,20.0 and 25.0 cm were in the range ±3%, with the exception of the penumbraregion for the fields 20x20 and 30x30 cm2 and depths 20 and 25 cm, where smallpart of the curves exceeded 3% difference.
326
VI. simpozij HDZZ, Stubičke Toplice, 2005.
The treatment plans were calculated for the square field sizes 5x5, 10x10,16x16, 20x20 and 25x25 cm2 and for the rectangular field sizes 5x15, 5x20, 5x25,10x20, 15x5, 20x5, 25x5 and 20x10 cm2. The source to skin distance (SSD) was 80cm. The monitor units (MU) were calculated for the absorbed dose of 100 cGy ondmax, 5 cm and 10 cm depth. For the case of the prescription point on 5 and 10 cmwe also calculated and measured the dose at the depth of dmax. The results can beseen in Table 1 and 2.
Table 1. The percentage deviation between the measured and calculated(prescribed) absorbed doses for the square fields
Field size5x510x1016x1620x2025x25
AD m a x. 5(%)-0.70.0-0.8-0.2-0.7
^ W K T / O )-0.4-0.4-0.3-0.2-0.7
-0.5-0.5-0.5-0.6-0.3
AD5(%)-0.50.40.00.6-0.2
ADl0(%)-0.30.10.60.6-0.8
Table 2. The percentage deviation between the measured and calculated(prescribed) absorbed doses for the rectangular fields
Field size5x155x205x2510x2015x520x525x520x10
ADmax_5(%)-1.9-2.3-2.9-1.2-2.3-2.7-3.31.6
ADmxA0(%)-1.8-2.3-3.0-1.2-2.1-2.7-3.4-1.5
AD m a x(%)-1.8-2.7-3.2-1.7-2.1-3.1-3.7-2.1
AD5(%)-1.7-2.0-2.5-0.7-2.0-2.4-2.8-1.0
AD]0(%)-1.6-2.0-2.7-0.6-2.1-2.5-2.9-0.8
The explanation of the symbols used in tables:•4Dmax,5(%) and ADmm]0(%) stand for the percentage deviation between the measured andcalculated dose in a point of maximum dose, with the prescription point on the depth of 5cm and 10 cm, respectively.-4Dmax(%)> AD5(%) and AD\o{%) stand for the percentage deviation between the measuredand prescribed dose at points on dmm, 5 cm and 10 cm, respectively.The change of the SSD to 75 cm and 70 cm at the point of isocenter gave the -0.2%difference in both cases. For the purpose of a block transmission checking, two testcases were constructed. In first test the untapered shielding block with its physicaldimensions 3x12.5x5.0 cm3 was placed centrally in the field 16x16 cm2 (see Figure1). In second test, a " L " shaped field was constructed by removing a 12x12 cm2
portion from one corner of the 16x16 cm2 field with the tapered block 5 cm inheight (see Figure 2).
327
VI. simpozij HDZZ, Stubičke Toplice, 2005.
The dose of 200 cGy was specified at point P on the open portion of the fieldon 5 cm depth. The dose was measured at the prescription point and at the pointunder the block, positioned on the central axis at the depth of 5 cm. The resultswere stated as the percentage transmission trough the block with respect to the doseat the prescription point P. The percentage deviation between ratios obtained bymeasurement and TPS generated ratios was 0.7% in both test cases.
p 1Figure 1. Field with central block Figure 2. "L" shaped field.
The check of the calculation for an oblique incidence was made with the 45°gantry angle. The chamber was positioned at 5 cm depth in water phantom at threepoints. One measuring point was placed on central axis and another two wereplaced symmetrically, left and right from that point, on a 3 cm distance. The fieldsize was 10x10 cm2. The percentage difference was 0.1%, -0.5% and 0.1%,respectively. The dose under the wedges was checked for 15°, 30° and 45° wedgeswith the maximum square field size that certain type of wedge allows (for instance,for the wedge 1578, we put the field size 8x8 cm2); the prescription point was at 5cm depth and the dose was 100 cGy. The results are presented in Table 3.
Table 3. The percentage deviation between the calculated and measured absorbeddoses for the wedged square field.
Wedge157830784578307645763071045710
Field size (cm2)8x88x88x86x66x6
10x1010x10
AD5(%)-0.50.91.30.1-0.30.20.7
328
VI. simpozij HDZZ, Stubičke Toplice, 2005.
CONCLUSIONThe Theraplan Plus treatment planning system was verified for its accuracy
in the calculation of PDDs, OARs and of the treatment time calculation in singlefield irradiation for specific test cases. The results show that the performance of theTPS was within the stated limits for the PDD and OAR calculation. The test casesare showing that larger percentage deviation appears between measured andprescribed (calculated) doses for the elongated fields. Still, those values are within±2.8% experimental uncertainty. The exceptions are the percentage deviation forthe field sizes 5x25 and 25x5 cm2, where it was slightly higher. The percentagedeviation for square and wedged fields, oblique incidence and SSD variation waswithin ±1.3%.
R E F E R E N C E S[1] International Commission on Radiation Units and Measurements (ICRU),
Determination of absorbed dose in patient irradiated by beams of x- or gamma-raysin radiotherapy procedures. ICRU Rep. 24, Bethesda, MD, 1976.
[2] Kutcher GJ et al. Comprehensive QA for radiation oncology. Report of AAPMRadiation Therapy Committee Task Group 40. Med Phys 1994;21:581-618.
[3] Theraplan Plus Technical Reference Manual, MDS Nordion, 2001.[4] International Atomic Energy Agency (IAEA). Absorbed dose determination in
photon and electron beams - An international code of practice. Technical Report No.277. Vienna: IAEA; 1997.
[5] British Journal of Radiology, Supplement 1; 1996.[6] American Association of Physicists in Medicine (AAPM). Radiation treatment
planning dosimetry verification. AAPM Report No.55, Task Group 23. Published byAmerican Institute of Physics, Woodbury, NY; 1995.
[7] Van Dyke J, Barnett R, Cygler J and Shragge P. Commissioning and qualityassurance of treatment planning computers. Int J Radiat Oncol Biol Phys 1993;26:261-273.
[8] Alam R, Ibbott GS, Pourang R, Nath R. Application of AAPM Radiation therapyCommittee Task Group 23 test package for comparison of two treatment planningsystems for photon external beam radiotherapy. Med Phys 1997; 24: 2043-2054.
[9] Wambersie A, Van Dam J, Hanks G, Mijnheer BJ, Battermann JJ. What accuracy jsneeded in dosimetry. IAEA-TECDOC-734, 1991; 11-35.
329
VI. simpozij HDZZ, Stubičke Toplice, 2005.
ABSTRACTOptimum radiotherapy requires accurate and consistent radiation doses. To
fulfil this requirement, it is necessary to make quality checks of the equipment andsoftware included in the planning process. Treatment planning system is used tocalculate monitor units required to deliver prescribed dose to a designated volumewith acceptable distribution of radiation dose. The aim of this study was to verifythe Theraplan Plus treatment program used in our Department to calculatetreatment times for radiation therapy with 60Co unit. To run a Theraplan Plussystem, it is necessary to input data describing mechanical and radiation aspects oftreatment unit. One of the checks included a comparison of the measured depthdoses and off-axis ratios with those calculated using the treatment program. Thesecond step included the measurement of the dose using ionisation chamber andthermoluminescent dosimeters (TLD), which was then compared with calculatedvalues for several treatment scenarios (central axis dose on specified depth ofsquare fields, elongated fields, under the block and wedges etc.). The third stepinvolved the comparison between the dose calculated for a specific treatment planwith the doses measured with TLD dosimeters in the Alderson phantom.
330
VI. simpozij HDZZ, Stubičke Toplice, HR0500073
PRORAČUN DOZE I EKSPOZICIJE ZRAČENJA KODSENTINEL NODUS STUDIJE
Amra Skopljak1, Elma Kučukalić-Selimović1\ Nermina Bešlić1,Amela Begić', Sadžida Begović-Hadžimuratović1, Zdenka Dražeta' i
Adnan Beganović'Klinički centar Univerziteta u Sarajevu, Institut za nuklearnu medicinu,
2Klinički centar Univerziteta u Sarajevu, Institut za radiologiju,Bolnička 25, 71000 Sarajevo, BiHe-mail: [email protected]
UVODUpotreba jonizirajućeg zračenja podrazumjeva pridržavanje osnovnih
principa zaštite od zračenja: opravdanost, optimizacija i limit doza za osoblje istanovništvo. Svrha ovog rada je bila da se odrede doze za osoblje koje je direktnouključeno u proces limfiscintigrafije i biopsije sentinel nodusa.
Limfoscitigrafija sentinel nodusa je nuklearno-medicinska studija kojom sedetektuje prvi drenažni limfni čvor određene regije. Koristi se u ranom stadijuonkoloških oboljenja te u planiranju terapije i predikcija. U Kliničkom centruUniverziteta u Sarajevu na Institutu za nuklearnu medicinu ova studija se trenutnoradi kod karcinoma dojke i kožnog malignog melanoma. Nakon ekstirpacije ipatohistološke obrade moguće je adekvatnije odrediti obim hirurškog zahvata(adekvatna prezervacija dojke).
Radioizotop koji upotrebljavamo pri studiji je tehnecijum-99m. 9 9 m Te jeradioizotop energije 140 keV i ima vrijeme poluraspada od 6,02 h. Nanokoloidalbumina se obilježava Te 99m-pertehnetatom i koristi kao tracer u scintigrafiji. Zaizvođenje studije koristi se aktivitet od 13 MBq 99mTc- albumin nanokoloida
Po protokolu Instituta za nuklearnu medicinu KCU Sarajevo da bi seuspješno izvela scintigrafija sentinel nodus studije moraju se zadovoljiti sljedećiuvjeti:1. Priprema radiofarmaka. Radiofarmak se priprema u vrućem laboratoriju
Instituta. 99mTc pertehnetat se proizvodi iz 99Mo/99m Te generatora. Bočica,koja sadrži čestice albumin kolida se stavlja u odgovarajući olovni kontejneri aseptičkim postupkom se u bočicu doda 1 - 5 ml 99mTc~Na-pertehnetataaktivnosti od 185 - 55550 MBq. Preparat ni u kojem slučaju ne smije doći ukontakt sa zrakom. Ovako pripremljen treba biti iskorišten u roku od 6 sati.
2. Aktivitet koji se koristi za scintigrafiju sentinel nodusa je 13 MBq uzapremini od 0,2 ml.
3. Apliciranje radiofarmaka za scintigrafiju sentinel nodusa kod karcinomadojke vrši se ili intratumoralno ili peritumoralno u smjeru aksile pod uglom
331
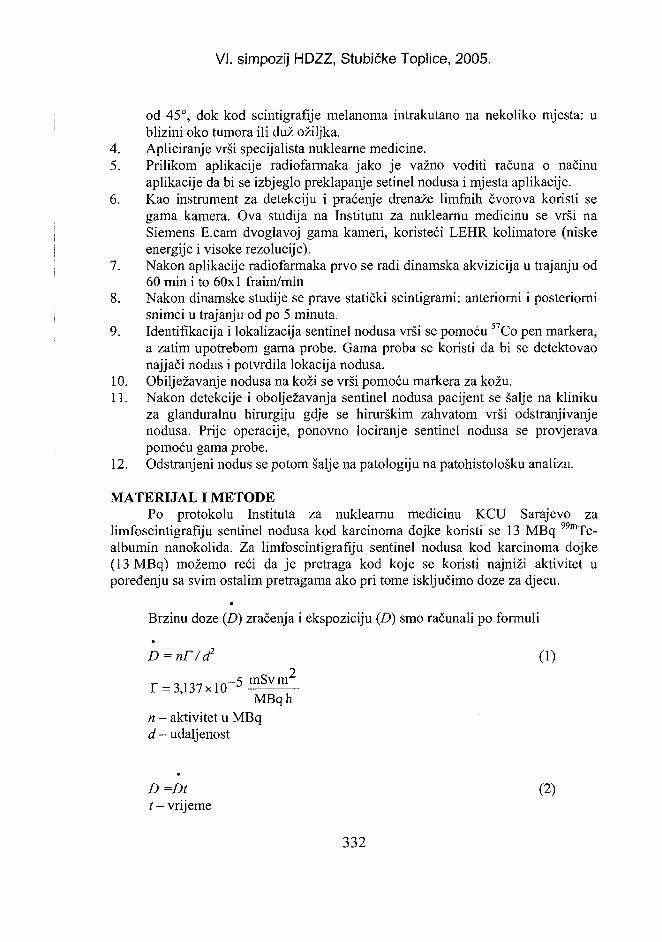
VI. simpozij HDZZ, Stubičke Toplice, 2005.
od 45°, dok kod scintigrafije melanoma intrakutano na nekoliko mjesta: ublizini oko tumora ili duž ožiljka.
4. Apliciranje vrši specijalista nuklearne medicine.5. Prilikom aplikacije radiofarmaka jako je važno voditi računa o načinu
aplikacije da bi se izbjeglo preklapanje setinel nodusa i mjesta aplikacije.6. Kao instrument za detekciju i praćenje drenaže limfnih čvorova koristi se
gama kamera. Ova studija na Institutu za nuklearnu medicinu se vrši naSiemens E.cam dvoglavoj gama kameri, koristeći LEHR kolimatore (niskeenergije i visoke rezolucije).
7. Nakon aplikacije radiofarmaka prvo se radi dinamska akvizicija u trajanju od60 min i to 60x 1 fraim/min
8. Nakon dinamske studije se prave statički scintigrami: anteriorni i posteriornisnimci u trajanju od po 5 minuta.
9. Identifikacija i lokalizacija sentinel nodusa vrši se pomoću 57Co pen markera,a zatim upotrebom gama probe. Gama proba se koristi da bi se detektovaonajjači nodus i potvrdila lokacija nodusa.
10. Obilježavanje nodusa na koži se vrši pomoću markera za kožu.11. Nakon detekcije i obolježavanja sentinel nodusa pacijent se šalje na kliniku
za glanduralnu hirurgiju gdje se hirurškim zahvatom vrši odstranjivanjenodusa. Prije operacije, ponovno lociranje sentinel nodusa se provjeravapomoću gama probe.
12. Odstranjeni nodus se potom šalje na patologiju na patohistološku analizu.
MATERIJAL I METODEPo protokolu Instituta za nuklearnu medicinu KCU Sarajevo za
limfoscintigrafiju sentinel nodusa kod karcinoma dojke koristi se 13 MBq 99mTc-albumin nanokolida. Za limfoscintigrafiju sentinel nodusa kod karcinoma dojke(13 MBq) možemo reći da je pretraga kod koje se koristi najniži aktivitet upoređenju sa svim ostalim pretragama ako pri tome isključimo doze za djecu.
Brzinu doze (D) zračenja i ekspoziciju (D) smo računali po formuli
D=nr/d2 (1)
r = 3,137x!0~5
MBqhn - aktivitet u MBqd - udaljenost
D =Dt (2)t - vrijeme
332
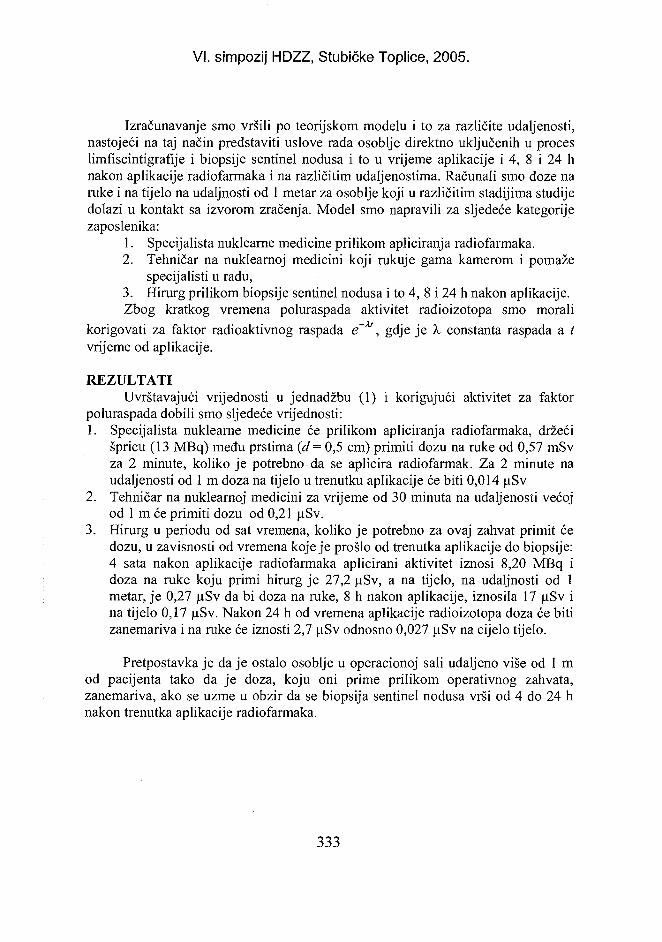
VI. simpozij HDZZ, Stubičke Toplice, 2005.
Izračunavanje smo vršili po teorijskom modelu i to za različite udaljenosti,nastojeći na taj način predstaviti uslove rada osoblje direktno uključenih u proceslimfiscintigrafije i biopsije sentinel nodusa i to u vrijeme aplikacije i 4, 8 i 24 hnakon aplikacije radiofarmaka i na različitim udaljenostima. Računali smo doze naruke i na tijelo na udaljnosti od 1 metar za osoblje koji u različitim stadijima studijedolazi u kontakt sa izvorom zračenja. Model smo napravili za sljedeće kategorijezaposlenika:
1. Specijalista nuklearne medicine prilikom apliciranja radiofarmaka.2. Tehničar na nuklearnoj medicini koji rukuje gama kamerom i pomaže
specijalisti u radu,3. Hirurg prilikom biopsije sentinel nodusa i to 4, 8 i 24 h nakon aplikacije.Zbog kratkog vremena poluraspada aktivitet radioizotopa smo morali
korigovati za faktor radioaktivnog raspada e~**, gdje je X constanta raspada a tvrijeme od aplikacije.
REZULTATIUvrštavajući vrijednosti u jednadžbu (1) i korigujući aktivitet za faktor
poluraspada dobili smo sljedeće vrijednosti:1. Specijalista nuklearne medicine će prilikom apliciranja radiofarmaka, držeći
špricu (13 MBq) među prstima (d= 0,5 cm) primiti dozu na ruke od 0,57 mSvza 2 minute, koliko je potrebno da se aplicira radiofarmak. Za 2 minute naudaljenosti od 1 m doza na tijelo u trenutku aplikacije će biti 0,014 uSv
2. Tehničar na nuklearnoj medicini za vrijeme od 30 minuta na udaljenosti većojod 1 m će primiti dozu od 0,21 jiSv.
3. Hirurg u periodu od sat vremena, koliko je potrebno za ovaj zahvat primit ćedozu, u zavisnosti od vremena koje je prošlo od trenutka aplikacije do biopsije:4 sata nakon aplikacije radiofarmaka aplicirani aktivitet iznosi 8,20 MBq idoza na ruke koju primi hirurg je 27,2 uSv, a na tijelo, na udaljnosti od 1metar, je 0,27 uSv da bi doza na ruke, 8 h nakon aplikacije, iznosila 17 uSv ina tijelo 0,17 u,Sv. Nakon 24 h od vremena aplikacije radioizotopa doza će bitizanemariva i na ruke će iznosti 2,7 ^Sv odnosno 0,027 uSv na cijelo tijelo.
Pretpostavka je daje ostalo osoblje u operacionoj sali udaljeno više od 1 mod pacijenta tako da je doza, koju oni prime prilikom operativnog zahvata,zanemariva, ako se uzme u obzir da se biopsija sentinel nodusa vrši od 4 do 24 hnakon trenutka aplikacije radiofarmaka.
333
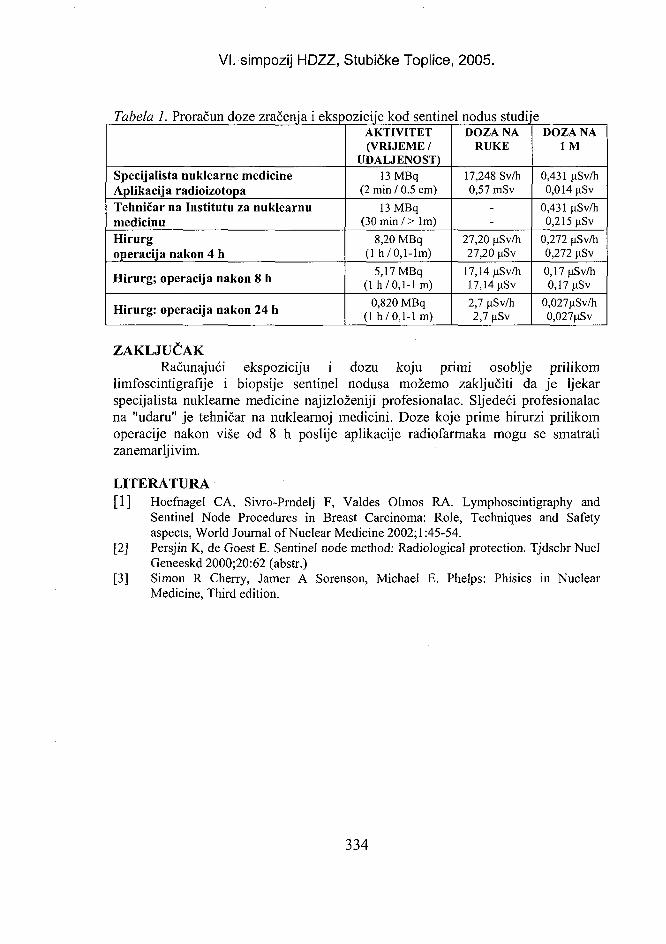
VI. simpozij HDZZ, Stubičke Toplice, 2005.
Tabela 1. Proračun doze zračenja i ekspozicije kod sentinel nodus studije
Specijalista nuklearne medicineAplikacija radioizotopaTehničar na Institutu za nuklearnumedicinuHirurgoperacija nakon 4 h
Hirurg; operacija nakon 8 h
Hirurg: operacija nakon 24 h
AKTIVITET(VRIJEME /
UDALJENOST)13 MBq
(2 min / 0.5 cm)13 MBq
(30min/> lm)8,20 MBq
(1 h/0,l-Im)5,17 MBq
(1 h/0,1-1 m)0,820 MBq
(1 h/0,1-1 m)
DOZA NARUKE
17,248 Sv/h0,57 mSv
-
27,20 uSv/h27,20 uSv
17,14 iiSv/h17,14 uSv2,7 uSv/h2,7 uSv
DOZA NAI M
0,431 uSv/h0,014 uSv
0,431 uSv/h0,215 uSv
0,272 uSv/h0,272 uSv0,17nSv/h0,17 uSv
0,027nSv/h0,027nSv
ZAKLJUČAKRačunajući ekspoziciju i dozu koju primi osoblje prilikom
limfoscintigrafije i biopsije sentinel nodusa možemo zaključiti da je ljekarspecijalista nuklearne medicine najizloženiji profesionalac. Sljedeći profesionalacna "udaru" je tehničar na nuklearnoj medicini. Doze koje prime hirurzi prilikomoperacije nakon više od 8 h poslije aplikacije radiofarmaka mogu se smatratizanemarljivim.
LITERATURA[1] Hoefhagel CA, Sivro-Prndelj F, Valdes Olmos RA. Lymphoscintigraphy and
Sentinel Node Procedures in Breast Carcinoma: Role, Techniques and Safetyaspects, World Journal of Nuclear Medicine 2002; 1:45-54.
[2] Persjin K, de Goest E. Sentinel node method: Radiological protection. Tjdschr NuclGeneeskd 2000;20:62 (abstr.)
[3] Simon R Cherry, Jamer A Sorenson, Michael E. Phelps: Phisics in NuclearMedicine, Third edition.
334
VI. simpozij HDZZ, Stubičke Toplice, 2005.
ESTIMATION OF DOSE AND EXPOSURE AT SENTINELNODE STUDY
Amra Skopljak1, Elma Kučukalić-Selimović' Nermina Bešlić1, Amela Begić1,Sadžida Begović-Hadžimuratović1, Zdenka Dražeta1 and Adrian Beganović2
'Clinical Centre University of Sarajevo, Institute of Nuclear Medicine2CIinical Centre University of Sarajevo, Institute of Radiology
Bolnička 25, 71000 Sarajevo, Bosnia and Herzegovinae-mail: [email protected]
The purpose of this study was to estimate the dose end exposure in staffinvolved in sentinel node procedure for breast cancer patients. The Institute ofNuclear Medicine in Sarajevo uses a protocol for lymphoscintigraphy of thesentinel node whereby 13 MBq of 99mTc nanocoll are used. In this study, wemeasured radiation doses and exposure of a nuclear medicine physician and atechnologist, as well as a surgeon performing sentinel node lymphoscintigraphyand biopsy. Dose and exposure were calculated using the equation:
D = nr/d2; Y = 3,137 x 10"5 mSvm2/MBqh is gamma constant for 99mTc.Calculations were made for different times of exposure and distance.
Table 1. Estimation of dose and exposure during sentinel node study
Nuclear medicine physicianApplication
Nuclear medicine technologist
Surgeonsurgery at 4 hSurgeonsurgery at 8 hSurgeonsurgery at 24 h
ACTIVITY(TIME / DISTANCE)
13 MBq(2 min / 0.5 cm)13 MBq(30 min, > lm)8.20 MBq(lh/0.1-lm)5.17 MBq(1 h/0.1-lm)0.820 MBq(lh/0.1- lm)
DOSE TOHANDS
17.248 mSv/h0.57 mSv
-
27.20 uSv/h27.20 uSv17.14 uSv/h17.14 uSv2.7 uSv/h2.7 uSv
DOSE AT1M
0.431 nSv/h0.014 uSv0.431 uSv/h0.215 uSv0.272 uSv/h0.272 uSv0.17uSv/h0.17 uSv0.027uSv/h0.027uSv
Radiation levels were very low and the most exposed hospitalsentinel node study were nuclear medicine physicians. The dosessurgeons were negligible 8 hours after exposure.
staff performingon the hands of
335

RADIOEKOLOGIJA
RADIOECOLOGY

VI. simpozij HDZZ, Stubičke Toplice, HR0500074
CHEMICAL AND RADIOLOGICAL CHARACTERISATIONOF TENORM DEPOSITED IN KAŠTEL GOMILICA
Višnja Oreščanin, Delko Barišić, Luka Mikelić, Ivanka Lovrenčić,Martina Rozmarić-Mačefat and Stipe Lulić
Ruđer Boskovic Institute, Bijenicka c.54, 10000 Zagreb, Croatiae-mail: [email protected]
INTRODUCTIONThe purpose of this paper was chemical and radiological characterisation of
the mixture of fly and bottom ash, the by-products of coal burning in thermoelectric unit of the ex-"Adriavinil" chemical factory. Since the year 1949, coal fromdifferent sources (Raša, Drinovci, Širitovci, Livanjsko polje) had been used as afuel in the power unit during almost five decade period of facility operation. All ofthe used coals have elevated concentrations of uranium and its naturally decayseries radionuclide products. During the combustion process and depending on theinorganic portion of the coal, content of 226Ra and 2 3 8U in fly and bottom ash wereelevated several times. Bottom and fly ash were, as a produced waste, deposited inthe vicinity of facility and remained there until 1973 when a proper depositionlocation was defined. The material was removed on selected location few hundredmeters farther away at the border of town Kaštel Gomilica and protected withplastic foil, layer of clay and humus. The area was fenced in and the grass wassown. That way the "old" depot was formed. In time, the area between the factoryand the "old" depot was covered up with waste materials, among it with mixture offly and bottom ash. At the end of 1980s and the beginning of 1990s, fly and bottomash are dumped directly into shallow seawater in the south-western part of thefacility. In the southern part, a little bit more to the west of the present fence offormer "Jugovinil", a floating dock is situated. Most of its parts are buried into thedeposited material which are in direct contact with the sea. In north-south directiona channel is also buried into the fly and bottom ash. At both sides of the channelthe mixture of fly and bottom ash is exposed on the surface. In south-western partof the area of the factory a pool separated from the sea is situated. Sea water in thepool is in direct contact with the waste material. It is visible from all documentsthat natural activity of both uranium isotopes (238U and 235U) as well as of 226Ra andtheir decay products is elevated both in fly and bottom ash (personalcommunications, data not published). Therefore, this waste material can becharacterised as TENORM (Technologically Enhanced Naturally OccurringRadioactive Material) because concentrations (activities) of natural radionuclides(238U, 2 3 5U and 226Ra) are elevated by a technological procedure. To obtain apreliminary data about the present state of new unregulated part of the depot, thirtythree samples of TENORM were collected and analysed in spring 2004.
339
VI. simpozij HDZZ, Stubičke Toplice, 2005.
MATERIAL AND METHODSActivity of 226Ra and 2 3 8U were determined in three samples of the mixture
of fly and bottom ash by gamma spectrometry [1], and concentrations of theelements Ca, Ti, V, Cr, Mn, Fe, Cu, Zn, Rb, Sr, Y, Zr, Pb and U in bulk ashsamples and V, Cr, Mn, Fe, Ni, Cu, Zn, Pb in different extract of compositesample of ash were determined using energy dispersive X-ray fluorescence,EDXRF method [1]. Extracts were prepared according to [2].
RESULTSActivities of 226Ra and 2 3 8U measured in the mixture of fly and bottom ash
from Kaštel Gomilica in collected samples were presented in Figure 1. Accordingto Shapiro-Wilks W test selected radionuclides expressed significant variations ofmeasured activities. This was expected because they originated from the coalcombustion delivered from five different sources. 226Ra and 2 3 8U were up to fiftytimes enriched compared to average activities characteristic for surrounding soilsdeveloped on the Middle and Upper Eocene flysch sediments.
Elemental concentrations measured in ash samples were presented in Figure2. On the basis of factor analyses and interelemental correlations three groups ofelements were identified. First group was represented with the elements Cu, Fe,Co, Ti, Y, Rb, Zr, second with Cr, V, U, Pb, Ni and third with Mn, Ca and Sr.Arsenic did not correlate either positively or negatively with any other element ofinterest and Zn showed only weak correlation with Pb. Uranium showed significantpositive correlation with the elements associated with oxides and sulfides (Cr, V,Pb, Ni) confirming prevalent terrestrial origin of coal deposits. Positive correlationwas also found between uranium and strontium which pointed to coal depositsformed in carbonate terrains.
Mean values (Table 1) of the elements uranium, nickel, vanadium,strontium, copper, lead and yttrium were approximately 36, 4.3, 3.7, 3.2, 1.8, 1.6and 1.5 times enriched in the TENORM compared to mean values of the sameelements characteristic for common soil. Zinc, iron, chromium, calcium and arsenicshowed similar concentrations in soil and TENORM, while manganese, rubidium,zirconium and titanium concentrations were from 5.5 to 1.7 times lower in theTENORM compared to their mean values determined in soil.
340
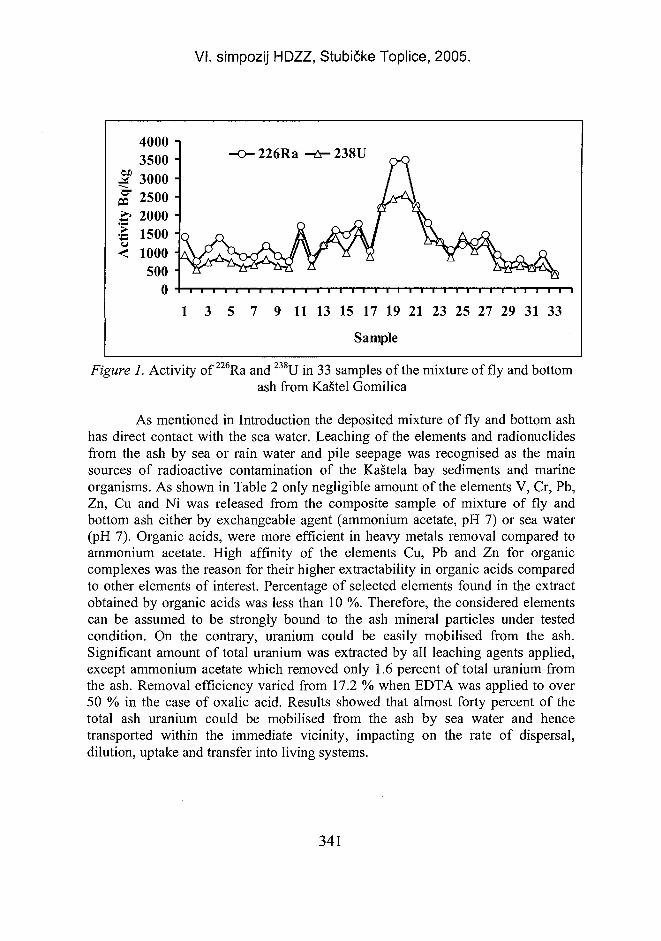
VI. simpozij HDZZ, Stubičke Toplice, 2005.
©D
&
•tiv
<
4000 -i3500 •3000 •2500 •2000 •1500 •1000 •500 •
Q
iu ~ •
1
-O- 226Ra -6- 238U __
A
3 5 7 9 11 13 15 17 19 21 23 25 27 29 31 33
Sample
Figure 1. Activity of 226Ra and 2 3 SU in 33 samples of the mixture of fly and bottomash from Kaštel Gomilica
As mentioned in Introduction the deposited mixture of fly and bottom ashhas direct contact with the sea water. Leaching of the elements and radionuclidesfrom the ash by sea or rain water and pile seepage was recognised as the mainsources of radioactive contamination of the Kaštela bay sediments and marineorganisms. As shown in Table 2 only negligible amount of the elements V, Cr, Pb,Zn, Cu and Ni was released from the composite sample of mixture of fly andbottom ash either by exchangeable agent (ammonium acetate, pH 7) or sea water(pH 7). Organic acids, were more efficient in heavy metals removal compared toammonium acetate. High affinity of the elements Cu, Pb and Zn for organiccomplexes was the reason for their higher extractability in organic acids comparedto other elements of interest. Percentage of selected elements found in the extractobtained by organic acids was less than 10 %. Therefore, the considered elementscan be assumed to be strongly bound to the ash mineral particles under testedcondition. On the contrary, uranium could be easily mobilised from the ash.Significant amount of total uranium was extracted by all leaching agents applied,except ammonium acetate which removed only 1.6 percent of total uranium fromthe ash. Removal efficiency varied from 17.2 % when EDTA was applied to over50 % in the case of oxalic acid. Results showed that almost forty percent of thetotal ash uranium could be mobilised from the ash by sea water and hencetransported within the immediate vicinity, impacting on the rate of dispersal,dilution, uptake and transfer into living systems.
341
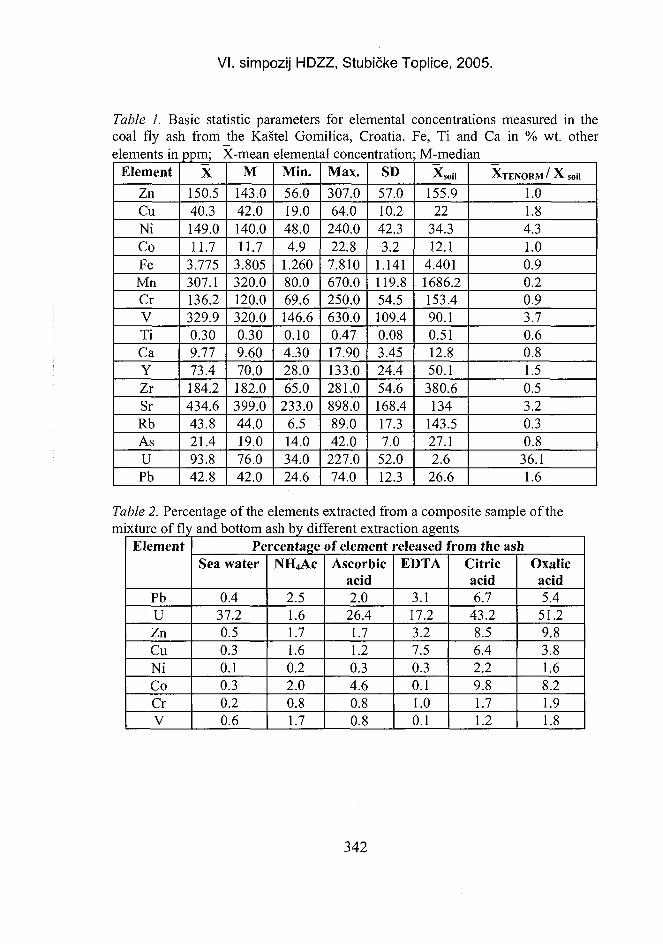
VI. simpozij HDZZ, Stubičke Toplice, 2005.
Table 1. Basic statistic parameters for elemental concentrations measured in thecoal fly ash from the Kaštel Gomilica, Croatia. Fe, Ti and Ca in % wt. otherelements in ppm; X-mean elemental concentration; M-median
ElementZnCuNiCoFeMnCrVTiCaYZrSrRbAsUPb
X150.540.3149.011.7
3.775307.1136.2329.90.309.7773.4184.2434.643.821.493.842.8
M143.042.0140.011.7
3.805320.0120.0320.00.309.6070.0182.0399.044.019.076.042.0
Min.56.019.048.04.9
1.26080.069.6146.60.104.3028.065.0
233.06.514.034.024.6
Max.307.064.0
240.022.87.810670.0250.0630.00.4717.90133.0281.0898.089.042.0
227.074.0
SD57.010.242.33.2
1.141119.854.5109.40.083.4524.454.6168.417.37.0
52.012.3
XSoil
155.922
34.312.1
4.4011686.2153.490.10.5112.850.1
380.6134
143.527.12.6
26.6
XjENORM / X s oii
1.01.84.31.00.90.20.93.70.60.81.50.53.20.30.8
36.11.6
Table 2. Percentage of the elements extracted from a composite sample of themixture of fly and bottom ash by different extraction agents
Element
PbUZnCuNiCoCrV
Percentage of element released from the ashSea water
0.437.20.50.30.10.30.20.6
NH4Ac
2.51.61.71.60.22.00.81.7
Ascorbicacid2.026.41.71.20.34.60.80.8
EDTA
3.117.23.27.50.30.11.00.1
Citricacid6.7
43.28.56.42.29.81.71.2
Oxalicacid5.4
51.29.83.81.68.21.91.8
342
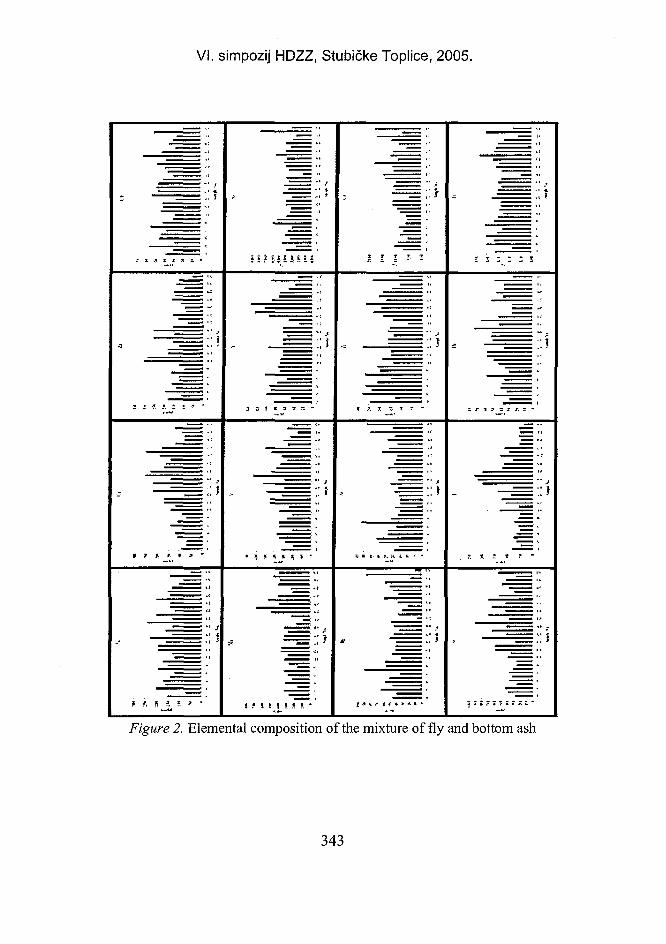
VI. simpozij HDZZ, Stubičke Toplice, 2005.
• •
1
_ _ _ _ _ v
- _ ^
it
lllllll
5
- •
ili
_ L .
_ _ _ _ = = .
~ *
• .
' ' '
_ _ _ _ _ - - _ _ _ _ < ,
. i ft ^ „
ri41 J
lllll lllll
i : 1 ; i ; i t : i
1 u 1 * * T r. -
lllll
l'l't.
,lll
1 • t t ! ft * •. "
1 j
•
•
- — = .
lliiili
I T T T T
—
T 7. T T. f - -
^_———.
- = = = •
lllljlll
= '
llllilllll
2 i ' : : s
— ;
lllll
— — — '
llllllllll
llllll
n X z r r. -
' •
— : : ,
: — ; -
— _ ^ •
i«
Figure 2. Elemental composition of the mixture of fly and bottom ash
343
VI. simpozij HDZZ, Stubičke Toplice, 2005.
CONCLUSIONThe analysed mixture of fly and bottom ash showed significant variability in
its chemical composition as well as in the activities of selected radionuclides due tothe different origin of coal used in a thermoelectric unit of the ex-"Jugovinil"factory. Mean elemental concentrations in the ash were elevated from 1.5 toapproximately 36 times compared to the common soil concentrations. The highestenrichment was found for uranium, nickel, vanadium and strontium. Activities ofthe radionuclides 226Ra and 2 3 8U in the ash were approximately fifty times higherthan those in the common soil. Extractable heavy metal portion under all testedconditions was found to be less than 10%, except for total uranium which showedhigh leachability either in the marine water or in weak organic acids.
REFERENCES[1] Oreščanin V, Barišić D, Mikelić L, Lovrenčić I, Rubčić M, Rožmarić-Mačefat M,
Lulić S. Environmental contamination assessment of the surroundings of the ex-Šibenik's ferro-manganese smelter Croatia. J Environ Sci Health Part A—Toxic/Hazard Subst Environ Engin 2004;39(9):2493-2506.
[2] Erdem M, Tumen F. A study on dissolution properties of the sludges from Cr(vi)reduction-precipitation processes. J Environ Sci Health Part A—Toxic/Hazard SubstEnviron Engin 2004;39(6):253 - 267.
ABSTRACTThe objective of this study was to make a chemical and radiological analysis
of fly and bottom ash produced in a thermoelectric power plant of a former factory("Jugovinil") deposited in Kaštel Gomilica, Croatia. The ash showing a highactivity of natural radionuclides 2 3 8 U, 2 3 5 U and 2 2 6 Ra was classified astechnologically enhanced naturally occurring radioactive material, that isTENORM. In addition, this material was highly enriched with heavy metals.Thirty-three ash samples were analysed. The bioavailable fraction of the ash wasestimated using different leaching tests. Most of the measured heavy metals were3-4 times and total U was almost 40 times as high in the ash as in the surroundingsoil. It was found that over 37 % of total U could be removed from the ash by seawater.
344
VI. simpozij HDZZ, Stubičke Toplice, HR0500075
RADIOCEZIJ U NEOBRAĐENOM TLU NA NEKIMLOKACIJAMA U REPUBLICI HRVATSKOJ
Branko Petrinec i Zdenko FranićInstitut za medicinska istraživanja i medicinu rada,
Ksaverska c. 2, 10000 Zagrebe-mail: [email protected]
UVODIz kontaminiranog tla preko biljaka ili vode radioaktivne tvari dolaze do ljudi
što može biti uzrok znatnog povećavanja doza zračenja koju primi pojedinac iliodređena populacijska skupina. Cilj ovog rada jest utvrditi kretanje aktivnostiradiocezija u tlu na dvije lokacije, Zagreb i Zadar, u posljednjih deset godina iistražiti njihov međusobni odnos. Radiocezij je naime jedan od najopasnijihumjetno stvorenih radionuklida prvenstveno stoga što tijekom fisije (bilo unuklearnim elektranama ili nuklearnim eksplozijama) nastaje u velikom postotku,ima relativno dugo vrijeme poluraspada a biološki je vrlo aktivan. Jedinica zazaštitu od zračenja Instituta za medicinska istraživanja i medicinu rada, kaoovlaštena ustanova za poslove zaštite od zračenja, neprekidno od 1959. godineprovodi istraživanja radioaktivne kontaminacije životne sredine na prostoruRepublike Hrvatske [1,2]. U sklopu tih istraživanja se, među ostalim, na odabranimlokacijama vrši uzorkovanje tala i oborina. Naime, primarni način radioaktivnekontaminacije tla jest putem radioaktivnih oborina (fallout).
MATERIJAL I METODEUzorkovanje tla provodi se bušaćem promjera 10 cm na površini od 1 m2 u
slojevima 0-5, 5-10 i 10-15 cm. Uzorci se suše i prosijavaju.Oborine se svakodnevno sakupljaju na lokaciji Instituta preko lijevaka
površine 1 m2, postavljenih na jedan metar iznad tla. Dnevni se uzorci spajaju uzbrojni uzorak koji se potom uparava na volumen 1 L.
Gamaspektrometrijsko mjerenje provodi se Ge(Li) detektorom ORTEC,rezolucije 1,78 keV na 1,33 MeV 60Co, relativne efikasnosti od 16,8% na 1,33MeV. Svi uzorci mjereni su u Marinelli posudama volumena 1 L. Vrijeme mjerenjasvakog uzorka bilo je najmanje 80000 sekundi. Osiguranje kvalitete iinterkomparacije mjerenja radioaktivnosti provode se kroz sudjelovanje uprogramima Međunarodne agencije za atomsku energiju (IAEA) i Svjetskezdravstvene organizacije (WHO).
REZULTATIU uzorcima tala zabilježene su samo aktivnosti 137Cs budući da 134Cs ima
vrijeme poluraspada 2,06 godina, te u Republici Hrvatskoj černobiljski 134Cs
345
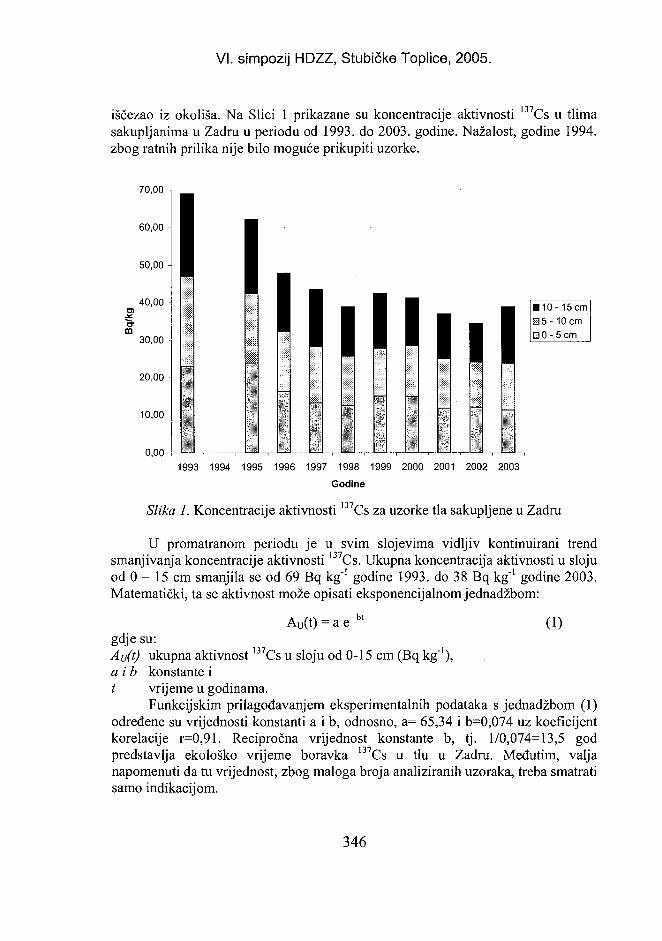
VI. simpozij HDZZ, Stubičke Toplice, 2005.
iščezao iz okoliša. Na Slici 1 prikazane su koncentracije aktivnosti l37Cs u tlimasakupljanima u Zadru u periodu od 1993. do 2003. godine. Nažalost, godine 1994.zbog ratnih prilika nije bilo moguće prikupiti uzorke.
70,00
60,00
50,00 -
40,00 -
30,00
20,00 -
10,00
0,00
i I • 10E35-E 0 -
-15 cm10 cm5 cm
1993 1994 1995 1996 1997 1998 1999 2000 2001 2002 2003
Godine
Slika 1. Koncentracije aktivnosti 137Cs za uzorke tla sakupljene u Zadru
U promatranom periodu je u svim slojevima vidljiv kontinuirani trendsmanjivanja koncentracije aktivnosti 137Cs. Ukupna koncentracija aktivnosti u slojuod 0 - 15 cm smanjila se od 69 Bq kg'1 godine 1993. do 38 Bq kg"1 godine 2003.Matematički, ta se aktivnost može opisati eksponencijalnom jednadžbom:
Au(t) = ae- b t (1)gdje su:Au(t) ukupna aktivnost 137Cs u sloju od 0-15 cm (Bq kg"1),a i b konstante it vrijeme u godinama.
Funkcijskim prilagođavanjem eksperimentalnih podataka s jednadžbom (1)određene su vrijednosti konstanti a i b, odnosno, a= 65,34 i b=0,074 uz koeficijentkorelacije r=0,91. Recipročna vrijednost konstante b, tj. 1/0,074=13,5 godpredstavlja ekološko vrijeme boravka 137Cs u tlu u Zadru. Međutim, valjanapomenuti da tu vrijednost, zbog maloga broja analiziranih uzoraka, treba smatratisamo indikacijom.
346
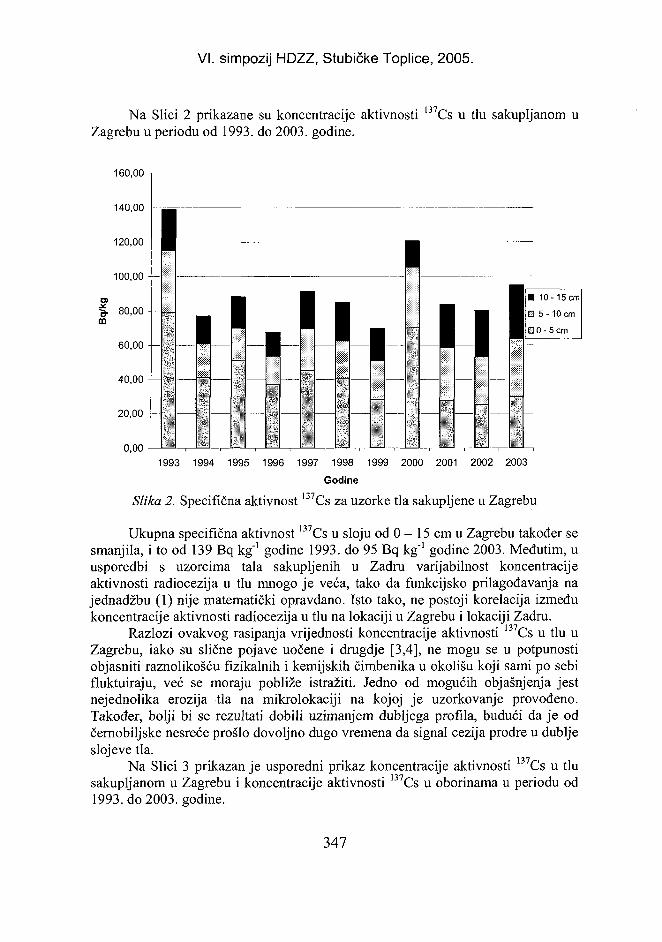
VI. simpozij HDZZ, Stubičke Toplice, 2005.
Na Slici 2 prikazane su koncentracije aktivnosti 137Cs u tlu sakupljanom uZagrebu u periodu od 1993. do 2003. godine.
160,00 -,
140,00
0,001993 1994 1995 1996 1997 1998 1999 2000 2001 2002 2003
Godine
Slika 2. Specifična aktivnost I37Cs za uzorke tla sakupljene u Zagrebu
Ukupna specifična aktivnost 137Cs u sloju od 0 - 15 cm u Zagrebu također sesmanjila, i to od 139 Bq kg'1 godine 1993. do 95 Bq kg"1 godine 2003. Međutim, uusporedbi s uzorcima tala sakupljenih u Zadru varijabilnost koncentracijeaktivnosti radiocezija u tlu mnogo je veća, tako da funkcijsko prilagođavanja najednadžbu (1) nije matematički opravdano. Isto tako, ne postoji korelacija izmeđukoncentracije aktivnosti radiocezija u tlu na lokaciji u Zagrebu i lokaciji Zadru.
Razlozi ovakvog rasipanja vrijednosti koncentracije aktivnosti 137Cs u tlu uZagrebu, iako su slične pojave uočene i drugdje [3,4], ne mogu se u potpunostiobjasniti raznolikošću fizikalnih i kemijskih čimbenika u okolišu koji sami po sebifluktuiraju, već se moraju pobliže istražiti. Jedno od mogućih objašnjenja jestnejednolika erozija tla na mikrolokaciji na kojoj je uzorkovanje provođeno.Također, bolji bi se rezultati dobili uzimanjem dubljega profila, budući da je odčernobiljske nesreće prošlo dovoljno dugo vremena da signal cezija prodre u dubljeslojeve tla.
Na Slici 3 prikazan je usporedni prikaz koncentracije aktivnosti 137Cs u tlusakupljanom u Zagrebu i koncentracije aktivnosti 137Cs u oborinama u periodu od1993. do 2003. godine.
347
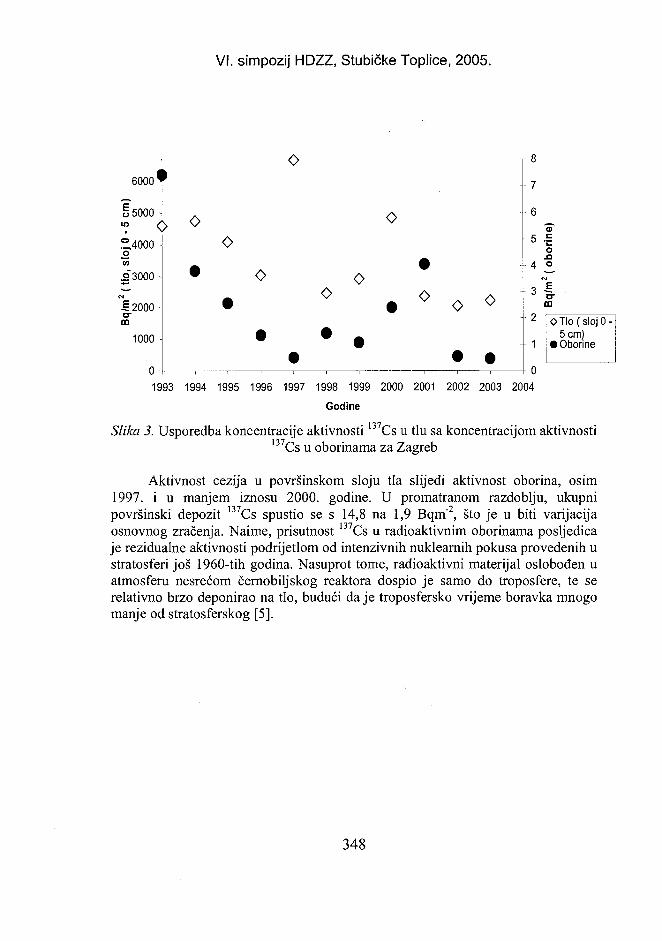
VI. simpozij HDZZ, Stubičke Toplice, 2005.
6000
iO
i 5000 -j
°4000_ov>2 3000 -
o o
m2000
1000
o
O
7
6
+ 5 .
oo
oo o o
--4
3
2
-- 1
m
OTIo(slojO-5 cm)
• Oborine
0
1993 1994 1995 1996 1997 1998 1999 2000 2001 2002 2003 2004Godine
Slika 3. Usporedba koncentracije aktivnosti 137Cs u tlu sa koncentracijom aktivnosti137Cs u oborinama za Zagreb
Aktivnost cezija u površinskom sloju tla slijedi aktivnost oborina, osim1997. i u manjem iznosu 2000. godine. U promatranom razdoblju, ukupnipovršinski depozit 137Cs spustio se s 14,8 na 1,9 Bqm"2, što je u biti varijacijaosnovnog zračenja. Naime, prisutnost 137Cs u radioaktivnim oborinama posljedicaje rezidualne aktivnosti podrijetlom od intenzivnih nuklearnih pokusa provedenih ustratosferi još 1960-tih godina. Nasuprot tome, radioaktivni materijal oslobođen uatmosferu nesrećom černobiljskog reaktora dospio je samo do troposfere, te serelativno brzo deponirao na tlo, budući da je troposfersko vrijeme boravka mnogomanje od stratosferskog [5].
348
VI. simpozij HDZZ, Stubičke Toplice, 2005.
ZAKLJUČAKPosljednjih desetak godina smanjuje se koncentracija aktivnosti 137Cs u
uzorcima tala na lokacijama Zadar i Zagreb. Međutim, dok se u uzorcima iz Zadrato smanjivanje može opisati ekponencijalnom jednadžbom uz ekološko vrijemeboravka 137Cs u tlu od oko 13,5 godina, u uzorcima tla iz Zagreba takvo ponašanjenije zabilježeno.
Razlozi rasipanja vrijednosti koncentracije aktivnosti 137Cs u tlu u Zagrebune mogu se u potpunosti objasniti raznolikošću fizikalnih i kemijskih čimbenika uokolišu koji sami po sebi fluktuiraju, već se moraju pobliže istražiti.
Kako aktivnosti l37Cs u tlu prodiru prema dubljim slojevima, u budućimistraživanjima morali bi se uzimati uzorci tla iz dubljih slojeva.
LITERATURA[1] Kovač J, Cesar D, Franić Z, Lokobauer N, Marović G, Maračić M. 1993 - 1998.
Rezultati mjerenja radioaktivnosti životne sredine u Republici Hrvatskoj, godišnjiizvještaji, Institut za medicinska istraživanja i medicinu rada, Zagreb, 1992 - 1997.
[2] Marović G, Franić Z, Kovač J, Lokobauer N, Maračić M. 1999 - 2003. Rezultatimjerenja radioaktivnosti životne sredine u Republici Hrvatskoj, godišnji izvještaji,Institut za medicinska istraživanja i medicinu rada, Zagreb, 1998 - 2004.
[3] Dahlgaard H. (Ed). Nordic radioecology: The transfer of radionuclides throughNordic ecosystems to man. Elsevier, Amsterdam, 1994.
[4] European Commission JRC, Environmental Institute. Atlas of caesium deposition onEurope after the Chernobyl accident. Office for Official Publications of theEuropean Communities, Luxembourg, 2001.
[5] Franić Z. I37Cs u radioaktivnim oborinama u Zagrebu. Hrvatski meteorološkičasopis, 1992:27:63-68.
349
VI. simpozij HDZZ, Stubičke Toplice, 2005.
RADIOCAESIUM IN UNCULTIVATED SOIL ON SOMELOCATIONS IN CROATIA
Branko Petrinec and Zdenko FranićInstitute for Medical Research and Occupational Health
Ksaverska c. 2, HR-10000 Zagreb, Croatiae-mail: [email protected]
Institute for Medical Research and Occupational Health carries out aprogramme of long-term monitoring of radioactive contamination of humanenvironment in Croatia, which involves investigation of man-made fissionradionuclides in soil. Contaminated soil can significantly increase exposure dosesdue to the indirect contamination of edible plants entering the human food chain.This article reports the specific activity of 137Cs in soil on two locations in Croatiamonitored over the last decade. Soil samples were taken from three different layers,0-5 cm, 5-10 cm, and 10-15 cm, in the cities of Zagreb and Zadar. A gamma-rayspectrometry system based on a low-level ORTEC Ge(Li) detector (FWHM 1.82keV at 1.33 MeV) coupled to a computerized data acquisition system was used todetermine radiocaesium levels in the samples from their gamma-ray spectra. Theexponential decline was found in soil samples collected in Zadar with the estimatedecological half-life of 13.5 years, while no such behaviour was observed in thesamples collected near Zagreb. Transient increases in 137Cs specific activityconcentrations in Zagreb soil, such as those in 1997 and 2000, can only be partiallyexplained by a variety of environmental physical factors that naturally fluctuate,which calls for further investigations. As with time radiocaesium signal inundisturbed soils penetrated deeper layers, it would be appropriate to study deepersoil cores in the future. No direct correlation was found between falloutradioactivity and soil radioactivity in the first layer. However, 137Cs activityconcentrations in fallout could now be regarded as no more than backgroundvariations, having no deeper impact on the existing caesium levels in soil.
350
VI. simpozij HDZZ, Stubičke Toplice, HR0500076
INVESTIGATION OF PLUTONIUM CHEMICALCOMPOUNDS SORPTION IN SOIL
Ruta Druteikiene and Benedikta LukšieneInstitute of Physics, Savanoriu av. 231, 02300 Vilnius, Lithuania
e-mail: [email protected]
INTRODUCTIONThe investigations of plutonium behaviour in the environment are of
particular concern from several aspects: the firs one is radioecological aspectbecause of the necessity to evaluate the influence of ionizing radiation caused byplutonium isotopes on the animate organisms and among them to on man as well asthe consequences resulting from it. The second important aspect is geophysicalwhen peculiarities of the distribution of radionuclides are applied to theinvestigations of geophysical processes occurring in lithosphere.
Contaminant migration and accumulation processes in soil are dependent onvarious factors. Numerous research investigations are carried out in the field ofradionuclide migration to depth. The results of a study of the plutonium isotopesvertical distribution dynamics in the profile of peaty-podzolic-gley soil and mobileforms within 30 km Chernobyl zone have shown that maximum specific activitiesof Pu are characteristic of the upper soil layer (at a depth of 4 cm) [1]. The authorsassume, that the presence of 238Pu and2 3 9 '2 4 0 Pu in a layer of 5-10 cm in 1988 and ina layer of 10-15 cm in 1991 is caused by migration of the most mobile plutoniumforms. The measurements of soil samples taken in the 30 km area of Chernobyl in1994 showed that 238Pu, 239'240Pu, 241Pu, 241Am and 243'244Cm activity remainedretained in the soil between 0 and 5 cm [2]. A similar situation for Chernobylderived and fallout radionuclides was observed in the other regions. In soil withhigh humus amount 96 % of plutonium was accumulated [3]. The accumulation ofplutonium in the first centimeters of soil and its negligible downward migrationlead to its concentration in the upper horizons. The retention of plutonium inorganic horizon may vary according to the content of organic matter, mineralcomposition, and other geochemical and geophysical characteristics of soil. On theother hand, processes of migration and accumulation of plutonium in soil arerelated to its initial chemical form. From the point of view of radiation protectiondue to the slow migration of strong radiotoxity of technogenic radioelements in thedeep layers of soil, the risk of possible pollution of the ground water orradionuclide transfer via plant roots is decreased. However, on the other hand theupper soil layer can be attributed to the secondary source of radioactive pollutionbecause of resuspension processes.
351
VI. simpozij HDZZ, Stubičke Toplice, 2005.
FIELD EXPERIMENTSThe open-air ground with soddy soil and the other one in mixed forest soil
with poor leaf litter in rural locality in Southeastern Lithuania were chosen for thefield experiment. Three plastic columns of 10 cm in diameter and 20 cm lengthwere sticked into soddy soil while the column surface came up with the soilsurface, as well as three analogous columns in the same manner were sticked in theforest soil. The soil surface of each column was contaminated with 30 Bq of 239Pu ,which was in the form of 239Pu(NO3)4,
239PuCl3, and 239PuO2.The field experiment study with 239Pu(NO3)4 started on 23 July, 1996, the
other experiments were prepared on 21 November, 1997. All the experiments werefinished on the 22 September, 1998. Thus the columns with 239Pu(NO3)4 wereexposed to natural meteorological conditions for 418 days and the residual part ofstudied columns were exposed for 326 days.
MATERIALS AND METHODSAfter exposition each column was divided into 4 layers (5cm). The soil was
dried at room temperature, the plants and roots were separated from soil. The soilwas precisely grinded and mixed. The amount of organic matter in the soil samplewas obtained by a loss-on-ignition analysis (550°).
Atomic absorption spectroscopy (AAS) measurement was applied to the Fe,K, Mg and Mn determination. The soil reaction (pH) was measured with a glasselectrode in the 25 ml IM KC1 solution which was intensively agitated with 10 g ofsoil. The physicochemical properties of the soddy and forest soil are shown inTables 1 and 2.
For determination of the total plutonium content in the soil sample, 50g ofsoil was heated at 550° C overnight in a muffle furnace. The soil sample wasspiked with 242Pu as a radiochemical yield tracer. Plutonium was isolated from thesoil matrix by digestion with 8M HNO3. Plutonium isotopes were separated andpurified by means of strong basic anion exchange resin DOWEX 1x8 and thenelectrodeposited on a stainless steel disc from the Na2SO4/H2SO4 electrolytesolution for 1 hour using a current density of 0.6 A.cm2.
352
VI. simpozij HDZZ, Stubičke Toplice, 2005.
Table 1. Physicochemical properties of the soddy soil
Depthcm
0-55-1010-1515-20
Organicmatter
%17.13.63.03.6
pH
4.44.54.14.3
Fe 2 + / 3 +
g/kg
5.86.07.76.6
Mn 2 +
g/kg
0.40.50.40.4
K+
g/kg
14.315.914.313.8
Mg2 +
g/kg
1.60.80.81.7
Table 2. Physicochemical properties of the forest soil
Depthcm
0-55-1010-1515-20
Organicmatter
%12.65.04.44.0
PH
4.64.14.24.1
Fe2+/3+
g/kg
5.76.86.0
-
Mn 2 +
g/kg
0.10.50.3
-
K+
g/kg
13.312.713.2
-
Mg2+
g/kg
1.81.92.4
-
Plutonium isotopes were determined by alpha-spectrometry, using aCAMBERA PD type detector (area 450 mm2, resolution 17 keV (FWHM) at 4-6keV). Alpha-efficiency was 25%, the detection limit to the counting time at 86400seconds was about 10 "3 Bq of 239'240Pu.
RESULTS AND DISCUSSIONThe distribution of 239Pu in different chemical forms (239PuCl3,
239Pu(NO3)4,239PuC>2) during the field research study is shown in Figures land 2. The largestquantity of 239Pu released on the sample surface in each case was obtained in theupper 0-5 cm soil layer. An analysis of the soil samples indicated the decrease inthe plutonium level with the depth and an accumulation of plutonium nitrate in thetop soil horizon of the soddy soil came up to 81.0 % while in the 15-20 cm layer itreached only 2.5 %. 239Pu of the same chemical form in the forest soil (0-5 cm) wasfound to be 82.2% and in the 15-20 cm horizon only 0.6% of it was distributed. Asmaller amount of 239Pu in chloride form (44.1%) was observed in 0-5 cm soddysoil layer and through all deeper layers its quantity was very similar to that of 239Puin nitrate form. The similar partition of 239Pu in chloride form was obtained for theforest soil (60.7 % of 239Pu in 0-5 cm horizon and 4.1 % in 15-20 cm horizon).Vertical migration of insoluble 239PuC>2 had an analogous tendency as in the case ofsoluble 239Pu compounds. The largest quantity of 239PuC>2 was obtained in the upper0-5 cm soddy (92 %) and forest (88 %) soil layers. A sudden decrease in theplutonium oxide in soil horizon began from the second 5-10 cm layer and reachedonly 1-6%.
353
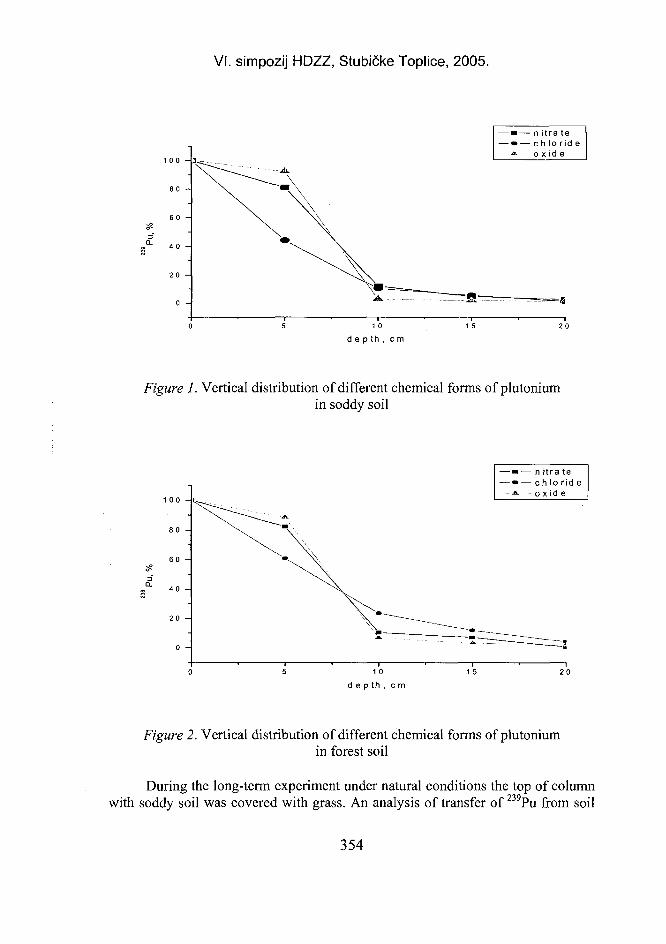
VI. simpozij HDZZ, Stubičke Toplice, 2005.
SS
Q_
1 0d e p t h , cm
• n itra te- c h l o r i d e
o x i d e
Figure 1. Vertical distribution of different chemical forms of plutoniumin soddy soil
- n itra te- ch lo r id e
o x i d e
1 od e p t h , cm
Figure 2. Vertical distribution of different chemical forms of plutoniumin forest soil
During the long-term experiment under natural conditions the top of columnwith soddy soil was covered with grass. An analysis of transfer of 239Pu from soil
354
VI. simpozij HDZZ, Stubičke Toplice, 2005.
to grass was carried out. The investigation has shown that an accumulation ofplutonium nitrate, plutonium chloride and plutonium oxide in grass came up to11.7 %, 39 % and 2 %, respectively.
The long-term field experiment has show the relevance of chemical form ofplutonium, and the type of soil is evident as well. A significant role in verticaldistribution of Pu in soil horizon can be attributed to the presence of a higheramount of organic matter. As can be seen from the content of organic matter in theupper 0-5 cm layers, it changes in the range of 17-30 % in soddy soil and 9-12 % inforest soil. A sudden decrease in organic matter begins from the second 5-10 cmlayer and further a consistent decrease is observed. The organic content in the 15-20 cm layer of soddy and forest soil reaches only 2-5 % and 3-5 %, respectively.The top layers of investigated undisturbed grass-land-soddy soil accumulated 92 %of 239PuO2, 81.0% of 239Pu(NO3)4 and 44 % of 239PuCl3. Thus, about 61 % of239PuCl3, 82 % of 239Pu(NO3)4 and 88 % of 239PuO2 were accumulated in top thelayer of forest soil.
An analysis of results lets us assume that reduced mobility of 239Pu in solublenitrate form can be related to the formation of insoluble products of hydrolysis andPu(IV) interaction with the mineral and organic fractions of soil. A smaller amountof 239Pu (III) in chloride form (44 %) was observed in the 0-5 cm soddy soil layerand a higher amount in grass (39 %) and through all deeper layers its quantity wasvery similar to that of 239Pu in nitrate form. Taking into account that a similarpartition of 239Pu in chloride form was obtained for the forest soil (61 % of 239Pu in0-5 cm horizon and 4 % in 15-20 cm horizon), it can be stated that 239Pu chloridebelongs to the compounds which are easier transferred to the plants and are moremobile in soil. It allows us to assume that Pu(IV) is the most stable valence formwhich forms stable complex compounds which immediately influence verticalmigration. Referring to [3] the mobility of valence forms decreases in the followingorder: Pu(V) > Pu(VI) > Pu(III) > Pu(IV). On the other hand, the constants of thestability of complex compounds decrease in the cations (metals) line M(IV) >MO2(II) > M(III) > MO2(I) and in the anions line F "> NO3" > Cl~ > CIO4" [4].
Partition of insoluble 2 3 9PuO2 through all studied soil horizons (0-20 cm)confirms the statement that insoluble and heavily mobile plutonium compoundsreleased onto the soil present for a long time in soil and affected by variousenvironmental factors are transformed to the mobile forms [1,4] and some part ofthem migrate to depth.
Plutonium distribution in soil horizon can be under the influence of micro andmacro elements present in soil. For instance, Fe reduction process can influence theparallel reduction of Pu(IV) to Pu(III) [4]. We suppose that one of the reasons oftransport of a relatively large amount of 239Pu(NO3)4 to deeper soil layers can berelated to the plutonium reduction process because the Pu(III) compounds aredistinquished as more mobile.
355
VI. simpozij HDZZ, Stubičke Toplice, 2005.
The role of pH, which is a relevant factor to the adsorption of radionuclides insoil, was not observed, and it is evident because both soddy soil and forest soil hadpH in the range of 4.1-4.6 throughout all the profile of horizons.
CONCLUSIONSThe long- range field research study has shown that soluble and insoluble
forms of plutonium (239PuCl3, 239Pu (NO3)4,
239PuO2) to a significant extent (from44 to 92 %) were retained in the top (0-5 cm) horizon of the undisturbed grassland-soddy soil and forest soil, although the percolation of 239Pu chloride into the deepersoil was observed to be higher and insoluble 239PuO2 showed the least mobility.The mobility of studied 239Pu compounds can be written in the following order:239PuCl3>
239Pu(NO3)4> 239PuO2.
The largest part of plutonium released to the environment is accumulated in thetop ground layer. Therefore the upper ground layer can be assumed as a newpotential source from which repartition of this radionuclide in the biosphere underthe influence of different mechanisms (vertical and horizontal migration,accumulation, resuspension) takes place.
REFERENCES[1] Kochan IG, Shuktomova II. Soil factor influence on the plutonium isotope
distribution among soil profile layers and mobile forms in the 30 km Chernobylzone. J Radioanal Nucl Chem, Letters, 201;5;371-379.
[2] OUui M., Hurtgen C, Hofkens K., Vandecasteele C. (1998) Vertical distributions inthe Kapachi soil of the plutonium isotopes (238Pu, 2 3 9 ' 2 4 0 p u , 2 4 lPu), of 24IAm, and of243>244Cm, eight years after the Chernobyl accident. J Environ Radioactivity 1995;39;l;231-239.
[3] Pavlotskaya FI, Myasoedov BF. Behaviour of plutonium in the groundbiogeocenoses. Radiochimya 1984;4;554-567 (in Russian).
[4] Hanson WC, ed. Transuranic elements in the environment. A Summary ofEnvironmental Research on Transuranium Radionuklides Funded by the U.S.Department of Energy Through Calendar Year 1979. 1985; 49 (in Russian).
356
VI. simpozij HDZZ, Stubičke Toplice, 2005.
ABSTRACTMigration and accumulation of contaminants in soil and other environmental
systems are related to the stability and change of chemical form of either pollutantsthemselves or their natural carrier. Therefore, the objectives of this study were toevaluate the possibility of sorption of different plutonium chemical forms (solubleand insoluble) in soil and to determine their ability to migrate into the depth aswell. A field experiment was performed for this purpose. An outdoor soil surfacewas artificially contaminated with 239Pu in the form of 239Pu(NO3)4,
239PuCl3 and239PuC>2. The experiment lasted 326 and 418 days. The experiment showed thatmost of the released plutonium accumulated in the top layer. This process did notdepend on the baseline chemical forms of 239Pu compounds. Result analysisshowed that 44 % to 92 % of soluble and insoluble forms of plutonium remained inthe top 0-5 cm of the soil. Plutonium chloride was more mobile in soil thanplutonium nitrate, which was related to the valence form of the radionuclide thatformed stable complex compounds. The content of organic matter in the upper soillayer played a significant role in this process. The insoluble plutonium compound239PuC>2 bound to a greater extent (92 %) with the top, 0-5 cm layer. The results ofthe field experiment suggest that the top soil layer is a new potential source ofartificial radionuclides. From the radioecological point of view, the top layer of soilplays a critical role in the formation of human irradiation dose.
357
VI. simpozij HDZZ, Stubičke Toplice, HR0500077
RADIOAKTIVNOST U UZORCIMA ZEMLJE NAPODRUČJU FBiH
Delveta Deljkić', Alfred Vidić', Stjepan Marić2, Zorana llić1 i Divna Sirko''Zavod za javno zdravstvo FBiH, M.Tita 9
2Mašinski fakultet Sarajevo, Vilsonovo šetalište 971000 Sarajevo, Bosna i Hercegovina
e-mail: [email protected]
UVODRadionuklidi imaju biološke, radiotoksične i radiopatogene efekte na
čovjeka. Zbog toga je neophodno utvrditi sadržaj radionuklida u okolini i naosnovu toga proračunati doze koje čovjek prima. Proračunate doze daju mogućnostprocjene potencijalnog radijacionog rizika po čovjeka.
Tlo je osnovna komponenta ekološkog, lanca tlo-hrana-čovjek, i kao takvoima veoma značajnu ulogu u preraspodjeli i transferu radionuklida. Radionuklidikoji se nalaze u zemlji putem inhalacije i ingestije mogu ući u ljudski organizam istoga predstavljaju potencijalni rizik po ljudsko zdravlje.
Potreba ispitivanja kontaminacije zemlje osiromašenim uranom ili drugimradionuklidima, u Federaciji Bosne i Hercegovine, uslijedilo je kao posljedicabombardovanja NATO snaga ovog područja, te ratnih i poratnih dešavanja na ovimprostorima.
MATERIJAL I METODETrideset i sedam uzoraka zemlje je prikupljeno sa dvadeset dvije lokacije na
području Federacije Bosne i Hercegovine u 2003. godini. Mjesta uzorkovanja bilasu unaprijed određena postojanjem sumnje u eventualno moguću kontaminacijuterena radionuklidima uslijed djelovanja snaga NATO na područje Bosne iHercegovine u toku 1995. godine. Na Slici 1 prikazane su općine na području kojihje vršeno uzorkovanje.
Prije uzorkovanja zemlje na mjestima uzorkovanja mjerena je brzina dozemultinamjenskim prenosivim uređajem RADOS model RDS 110 na 1 m iznad tla.Metoda uzorkovanja zasnivala se na principu slučajnog uzorka. Uzorkovanje jeobavljeno cilidričnim uzorkivačem (dijametar 5 cm, visina 15 cm) prikupljanjempet poduzoraka sa površine 25 m2. Uzorkovanje je vršeno na dubini 0-5 cm.Potrebno je istaći da su uzorci bili sa različitih tipova zemljišta - obradivog ineobradivog, različite kemijske sastava i strukture zemljišta. Miješanjem ihomogeniziranjem pravljen kompozitni uzorak za to mjesto uzorkovanja.Homogenizirani uzorci su sušeni na sobnoj temperaturi, prosijani, a zatim sušeni na105°C do konstantne mase [1,2]. Poslije toga uzorci zemlje su preneseni u lOOg
358
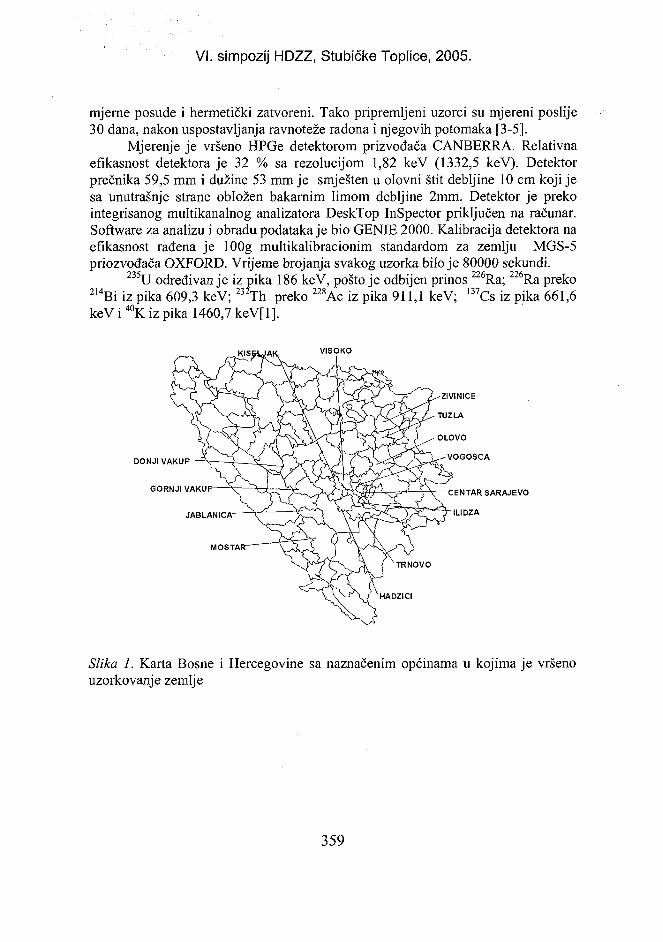
VI. simpozij HDZZ, Stubičke Toplice, 2005.
mjerne posude i hermetički zatvoreni. Tako pripremljeni uzorci su mjereni poslije30 dana, nakon uspostavljanja ravnoteže radona i njegovih potomaka [3-5].
Mjerenje je vršeno HPGe detektorom prizvođača CANBERRA. Relativnaefikasnost detektora je 32 % sa rezolucijom 1,82 keV (1332,5 keV). Detektorprečnika 59,5 mm i dužine 53 mm je smješten u olovni štit debljine 10 cm koji jesa unutrašnje strane obložen bakarnim limom debljine 2mm. Detektor je prekointegrisanog multikanalnog analizatora DeskTop InSpector priključen na računar.Software za analizu i obradu podataka je bio GENIE 2000. Kalibracija detektora naefikasnost rađena je lOOg multikalibracionim standardom za zemlju MGS-5priozvođača OXFORD. Vrijeme brojanja svakog uzorka bilo je 80000 sekundi.
2 3 5U određivanje iz pika 186 keV, pošto je odbijen prinos 226Ra; 226Ra preko214Bi iz pika 609,3 keV; 232Th preko 228Ac iz pika 911,1 keV; 137Cs iz pika 661,6keV i 4 0K iz pika 1460,7 keV[l].
VISOKO
DONJI VAKU
GORNJI VAKUF
JABLANICA-
MOSTAI
CENTAR SARAJEVO
ILI DZ A
Slika 1. Karta Bosne i Hercegovine sa naznačenim općinama u kojima je vršenouzorkovanje zemlje
359
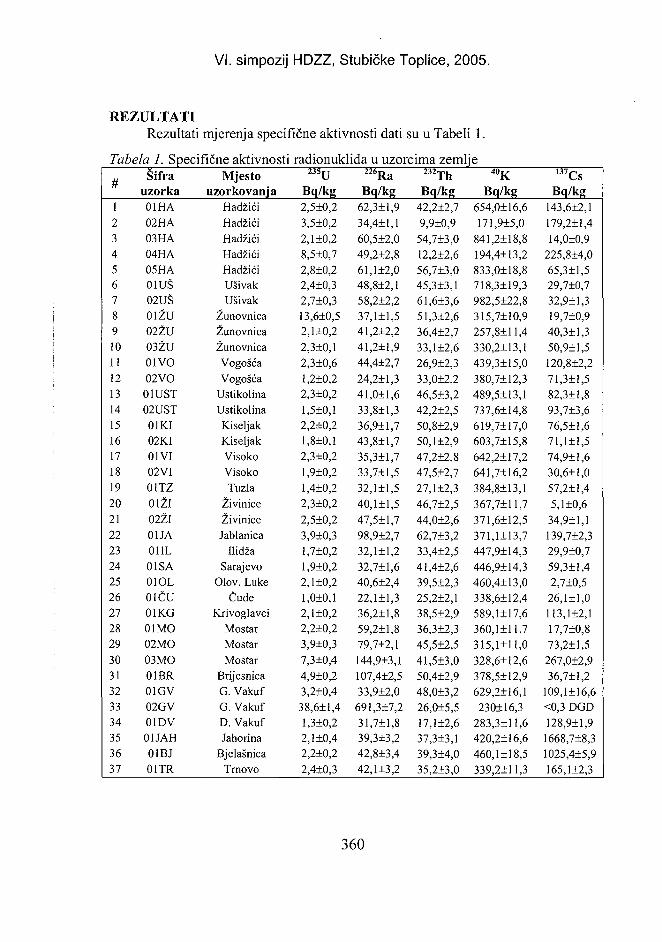
VI. simpozij HDZZ, Stubičke Toplice, 2005.
REZULTATIRezultati mjerenja specifične aktivnosti dati su u Tabeli 1.
Tabela 1. Specifične aktivnostiuTT
12345678910111213141516171819202122232425262728293031323334353637
Šifrauzorka01HA02HA03HA04HA05HA01UŠ02UŠ01ŽU02ŽU03ŽU01VO02VO
01UST02UST
01KI02KI01VI02VI01TZ01ŽI02ŽI01JA01IL01SA01OL01ČU01KG01MO02MO03MO01BR01GV02GV01DV01JAH01BJ01TR
Mjestouzorkovanja
HadžićiHadžićiHadžićiHadžićiHadžićiUšivakUšivak
ŽunovnicaŽunovnicaŽunovnicaVogošćaVogošća
UstikolinaUstikolinaKiseljakKiseljakVisokoVisokoTuzla
ŽiviniceŽivinice
JablanicaIlidža
SarajevoOlov. Luke
ČudeKrivoglavci
MostarMostarMostar
BrijesnicaG. VakufG. VakufD. VakufJahorina
BjelašnicaTrnovo
radionuklida u uzorcima zemlje2 3 5 U
Bq/kg2,5+0,23,5±0,22,l±0,28,5±0,72,8±0,22,4±0,32,7±0,313,6+0,52,l±0,22,3±0,l2,3±0,61,2+0,22,3±0,21,5+0,12,2±0,2l,8±0,l2,3±0,2l,9±0,2l,4±0,22,3±0,22,5±0,23,9+0,31,7+0,21,9+0,22,l±0,21,0+0,12,1+0,22,2±0,23,9±0,37,3±0,44,9±0,23,2+0,4
38,6+1,41,3+0,22,1+0,42,2±0,22,4±0,3
2 2 6 R aBq/kg
62,3±1,934,4+1,160,5±2,049,2+2,861,l±2,048,8±2,158,2±2,237,1+1,541,2±2,241,2±1,944,4±2,724,2±1,341,0+1,633,8±1,336,9±1,743,8±1,735,3±1,733,7±1,532,1+1,540,l±l,547,5+1,798,9±2,732,1±1,232,7±1,640,6+2,422,1 + 1,336,2+1,859,2+1,879,7±2,1144,9+3,1107,4±2,533,9±2,0
691,3±7,231,7+1,839,3±3,242,8±3,442,1 ±3,2
2 3 2 T h
Bq/kg42,2±2,79,9±0,9
54,7+3,012,2+2,656,7±3,045,3+3,161,6+3,651,3±2,636,4+2,733,1+2,626,9±2,333,0+2,246,5±3,242,2±2,550,8±2,950,1+2,947,2+2,847,5+2,727,1 ±2,346,7±2,544,0±2,662,7±3,233,4+2,541,4±2,639,5±2,325,2+2,138,5±2,936,3+2,345,5±2,541,5+3,050,4±2,948,0+3,226,0+5,517,1 ±2,637,3+3,139,3±4,035,2±3,0
Bq/kg654,0±16,6171,9±5,0
841,2±18,8194,4+13,2833,0±18,8718,3±19,3982,5±22,8315,7+10,9257,8±11,4330,2+13,1439,3±15,0380,7±12,3489,5+13,1737,6±14,8619,7+17,0603,7±15,8642,2±17,2641,7±16,2384,8+13,1367,7+11,7371,6+12,5371,1+13,7447,9+14,3446,9±14,3460,4+13,0338,6±12,4589,1+17,6360,1+11,7315,1+11,0328,6+12,6378,5±12,9629,2±16,1
230+16,3283,3+11,6420,2±16,6460,1+18,5339,2+11,3
1 3 7 CsBq/kg
143,6±2,1179,2+1,414,0±0,9
225,8±4,065,3+1,529,7+0,732,9±1,319,7±0,940,3+1,350,9+1,5120,8±2,271,3+1,582,3±1,893,7±3,676,5±1,671,1+1,574,9±1,630,6+1,057,2+1,45,1+0,6
34,9+1,1139,7+2,329,9+0,759,3±1,42,7±0,5
26,1+1,0113,1+2,117,7±0,873,2±1,5
267,0±2,936,7±1,2
109,1 + 16,6<0,3 DGD128,9+1,9
1668,7+8,31025,4±5,9165,1±2,3
360
VI. simpozij HDZZ, Stubičke Toplice, 2005.
Očitane vrijednosti brzine doze pored na mjestima uzorkovanja kretale su seod 0,05 do 0,12 uSv/h. Vrijednosti specifičnih aktivnosti radionuklida date su uokviru 2a statističke greške brojanja.
Kod uzoraka iz Hadžića (02HA, 04HA) i Žunovnice (01ŽU) primjetan jedebalans specifične aktivnosti 2 3 5U i 226Ra u odnosu na njihov prirodan odnos[3,6], što je posljedica prisustva osiromašenog urana na tom području [7]. Koduzorka 02GV radilo se o uzorku koji je najvećim dijelom sadržavao ugljenu šljaku,i predstavlja tehnološki obogaćen otpad prirodnim radionuklidima. Prilikom daljihrazmatranja i proračuna srednjih vrijednosti specifičnih aktivnosti pojedinihradionuklida ova četiri uzorka nisu uzeta.
Specifične aktivnost 2 3 5U se kretala od 1,0 Bq/kg do 7,3 Bq/kg srednjomvrijednošću 2,1±0,03 Bq/kg, za 226Ra od 24,2 Bq/kg do 144,9 Bq/kg sa srednjomvrijednošću 42,0±0,3 Bq/kg, za 232Th od 25,2 Bq/kg do 62,7 Bq/kg sa srednjomvrijednošću 33,7±0,4 Bq/kg, za 40K od 257,8 Bq/kg do 982,5 Bq/kg, sa srednjomvrijednošću 394,0±2,2 Bq/kg i za 137Cs od 5,1 Bq/kg do 1668,7 Bq/kg sa srednjomvrijednošću 39,3+0,2 Bq/kg. Specifične aktivnosti prirodnih radinuklida zanekontaminirane uzorke su u okviru normalnih granica za prirodne radionuklide uzemlji [7,8], i u saglasnosti su sa rezultatima ranijih mjerenja provedenih u Bosni iHercegovini [7,9] i okolnim zemljama [10,11]. Izmjerene vrijednosti za specifičnuaktivnost l37Cs u zemlji su u saglasnosti sa objavljenim rezultatima okolnihzemalja (Slovenije, Srbije i Crne Gore) [10,11] izuzev uzoraka sa Jahorine(01JAH) i Bjelašnice (01BJ) u kojima je izmjereno 1668,7+8,3 i 1025,4±5,9 Bq/kg.
ZAKLJUČAKTlo je analizirano na 2 3 5U, 226Ra, 232Th, 40K i 137Cs. Rezultati rada daju
osnovne podatke o specifičnim aktivnostima prirodnih radionuklida i I37Cs u zemljina području Federacije Bosne i Hercegovine. Izmjerene vrijednosti su u nivouočekivanih vrijednosti. Odnos specifičnih aktivnosti 235U/226Ra u uzorcima izHadžića i Žunovnice je posljedica prisustva osiromašenog urana. Povišenevrijednosti za 137Cs u uzorcima sa Jahorine i Bjelašnice su najvjerovatnijeposljedica mikro-klimatskih uslova koji su vladali u vrijeme Černobilske nesrećenad tim područjem. Rezultati mogu poslužiti kao baza za daljnja istraživanja napodručju Bosne i Hercegovine.
361
VI. simpozij HDZZ, Stubičke Toplice, 2005.
LITERATURA[I] International Atomic Energy Agency (IAEA). Measurement of Radionuclides in
Food and the Environmental, Technical reports Series No.295, Vienna: IAEA, 1989.[2] International Atomic Energy Agency (IAEA). Generic procedures for assessment
and response during a radiological emergency, IAEA-TECDOC No. 1162, Vienna:IAEA; 2000.
[3] Barišić D. Određivanje U2 3 5 i U 2 3 8 gamaspektrometrijskom metodom na energijamaoko 186 keV, Zbornik radova XI Jugoslovenskog simpozijuma; 6-9 juna 1989;Priština str. 140-146.
[4] Annunziata MFL. Handbook of Radioactivity analysis, Academic Press, USA 1998.[5] Eisenbud M. Environmental Radioactivity, Academic Press, USA 1997.[6] Bleise A, Danesi PR, BurkartW. Properties, use and health effects of depleted
uranium (DU): a general overview, J Environ Radioact 2003; 64:.93-112.[7] UNEP, Depleted Uranium in Bosnia and Herzegovina, Post-conflict Environmental
Assessment, UNEP 2003.[8] UNSCEAR 2000 Report to the General Assembly,Volume 1 ANNEX B,
Exposuresof Natural Radiation Sources.[9] Instituto Technologico e Nuclear, Departamento de Proteccao Nuclear Report of the
Portuguese Scientific Mission to Kosovo and to Bosnia and Herzegovia forassessment of radioactive contamination and of the radiological risk due to the use ofdepleted uranium ammunitions, Final Report, Portugal: April 17th, 2001.
[10] Bkit I et al. Radioactivity of the soil in Vojvodina, J Environ Radioact 2004; 11-19.[II] Zavod za varstvo pri delu,Radioaktivnost u živeljskem oko Iju Slovenije za leto 1999,
ZVD Ljubljana 2000.
RADIOACTIVITY OF THE SOIL IN FEDERATION BOSNIAAND HERZEGOVINA
Delveta Deljkić', Alfred Vidic', Stjepan Marić2,Zorana.Ilić' and Divna Sirko1
'PublicHealth Institute of FB&H, M. Tita 9, 71000 Sarajevo,Bosnia and Herzegovina
2Faculty of Mechanical Engineering, Vilsonovo šetalište 9, 71000 Sarajevo,Bosnia and Herzegovinae-mail: [email protected]
Soil samples collected at different locations of the Federation of Bosniaand Herzegovina were analysed for 2 3 5U, 226Ra, 232Th, 4 0K and 137Cs using high-resolution gamma spectrometry. Results were consistent with literature data for theregion for most of the samples. Two foci were found at locations where the usageof depleted uranium was confirmed. High levels of l37Cs were found at twolocations as a result of microclimatic conditions at the time of the Chernobylaccident. TENORM {technologically enhanced naturally occurring radioactivematerial) materials were identified at one location arising issues of theirmanagement. Future analysis should include more locations.
362
VI. simpozij HDZZ, Stubičke Toplic« HR0500078
DETERMINATION OF URANIUM IN SOIL WITH EMPHASISON DOSE ASSESSMENT
Alfred Vidic', Zor ana Ilić1, Delveta Deljkić'', Urška Repine2,Ljudmila Benedik2and Stjepan Marić1
'PublicHealth Institute of FB&H, M. Tita 9, 71000 Sarajevo,Bosnia and Herzegovina
2Jožef Stefan Institute, Jamova 39, 1000 Ljubljana, Slovenia3Faculty of Mechanical Engineering, Vilsonovo šetalište 9, 71000 Sarajevo,
Bosnia and Herzegovinae-mail: [email protected]
INTRODUCTIONUranium is naturally occuring element and is found at an average
concentration of 3mg/kg in the Earth's crust. Typical cocentration range from 0.3 to11.7mg/kg [1]. Naturally occuring uranium contains three isotopes, 2 3 8U (99.3% byweight), 2 3 5U (0.72%) and 2 3 4U (0.006%).
The major use of uranium is as a fuel for nuclear reactors and in nuclearweapons. 2 3 5U is fissile and for production of nuclear fuel the relative concentrationof 2 3 5U has to be increased. A byproduct of this enrichment process is depleteduranium (DU). DU is distinguished from natural uranium by lower concentration of2 3 5U (<0.7%, typically 0.2-0.3) and 2 3 4U. DU in civilian applications is employed incounterweights or ballasts in aircraft, radiation shields in medical equipment, ascontainers for the transport of radioactive material and as chemical catalysts. DUhas also been used in glassware and ceramics and in dentistry. In militaryapplications DU is used as kinetic energy penetrators due to its high density, itspyrophoric nature and its property of becoming sharper as it penetrates armourplating [2].
During conflict in Bosnia about 10,000 DU rounds (approximately 3 tons ofDU) were fired during NATO air strikes in Bosnia and Herzegovina in 1994 and1995, mainly around Sarajevo. 1500 of the 30-mm DU rounds were used at thelocation Tank Repair Facility near town Hadžići [3]. On impact of penetrator withtarget typically 10-35% (maximum 70%) becomes an aerosol and spread in theenvironment [2]. The majority of the penetrators that impact on soft targets (eg.sand or clay) penetrate the ground remaining intact for a longtime.
Inhalation of dust is considered the major pathway for DU exposure bothduring and after attack [2,4]. A possible exposure pathway for those working orliving in DU affected areas after aerosols have settled is the inhalation of the DUparticles in the soil that are resuspended through the action of the wind or humanactivities.
363
VI. simpozij HDZZ, Stubičke Toplice, 2005.
MATERIAL AND METHODSDuring our mission former Tank Repair Facility was investigated. It is a
large complex consisting of buildings, storage barns, workshops and yards. At theinvestigated site there were clear marks and holes caused by projectile impactseasily detectable visually and confirmed with hand held dose rate meters. Foundpenetrators at the surface had been removed at the time of the survey. Beside DUpenetrators the area contained several hundred unexploded landmines.
The sampling campaign took place in April and September 2003. Tensamples of surface soil (0-5 cm) were collected. The selection of soil sampling sitescan be roughly divided into two groups: undisturbed ground surfaces covered withgrass within or close to the Facility; and contaminated debris contaning dust andsand from the yards where tanks were hit and gama/beta radioactivity weredetected above environmental levels with portable instrumentation.
Soil samples were collected using stainless steel coring sampler (a tube ofdiameter 5 cm and 15 cm length). Surface vegetation was removed and five coresof subsamples were taken. Debris samples were collected from five subsamplescollected with metallic spatula. The subsamples were mixed and homogenized. Thesamples were dried at 105 C and then sieved. To remove organic carbon ~5g of thesample were ashed at 500 C. Aliquots of 0.5 g were used for radiochemicaltreatment.
In all experiments analytical grade reagents and deionised water was used.The 2 3 2U tracer was obtained from Isotrak, AEA Technology, QSA. The 2 3 2U spikewas added to serve as an internal tracer from which the chemical recovery could bedetermined. Total dissolution of the samples was done with sequential addition ofmineral acids (HNO3, then HN0 3 and HC1O4, and finally HNO3, HCIO4, and HF).The residue, containing uranium, was dissolved in 7M hydrochloric acid andpassed through an anion exchange column (DOWEX AG l-x8). Thorium and ironwere removed with 7M hydrochloric acid and 8M nitric acid respectively. Uraniumwas eluted from the column with 0.5M hydrochloric acid. Source preparation forcounting was done by electrodeposition. The electrodeposition cell, produced byTracerlab GMBH, was Teflon made of conical shape with active diameter of 19mm. Platinum anode, circle shaped, was positioned in the centre of the cell, 0.5 cmfrom the SS planchet. The uranium solution is transferred to an electrolytic cellwith 5.7% ammonium oxalate and electrodeposited on stainless steel disk. Theelectrolysis is maintained for 2 hours with current of 0.3A. After electrodepositionstainless steel planchet was heated for 30 seconds in the flame of the Bunsenburner.
Samples are counted on the alpha spectrometer "OASIS" - Oxford AlphaSpectrometry Integrated System (Tennelec) equipped with ULTRA ion-implantedsilicon detectors with an active area of 450mm2 (resolution 25keV FWHM at5.486MeV). The energy resolution and detection efficiency were determined using
364
VI. simpozij HDZZ, Stubičke Toplice, 2005.
a calibrated mixed source, consisting of 239Pu, 241Am and 23OTh purchased from TheSource Incorporated.
The exposure pathway included in the assessment was inhalation of soilresuspended by the action of the wind or by human activities. According to data foruranium found in soil and estimated in air we calculated the annual dose that couldbe received by an individual worker at the site and the people from thesurroundings. Radionuclide concentrations in air due to resuspension weredetermined using a simple dust loading approach:
C a i r , i=SE-C s o i U (1)
Where:Cairj is the activity concentration of radionuclide i in air (Bq/m3);SE is the dust loading factor, 2.0E-6kg/m3 for wind driven resuspension, 3.0E-5kg/m3 for human made resuspension (kg/m3) [5];Csou.i - is the activity concentration of radionuclide i in soil from table 1 (Bq/kg);
Estimated doses are commited effective doses from inhalation and werecalculated using a formula: [6]
^ • I i n h • (1 - Occ)J+ [C a i r i • I i n h • Occ • I/Of DC (2)
Where:E is commited effective dose (Sv/a);/,„/, is inhalation rate; we used value of 7,300 [1] (m3/a);Occ is indoor occupancy; we used 0.5 and 0.75 values;I/O is indoor/outdoor concentration ratio, for this report value of 0.5 was chosen;DC is committed effective dose coefficients [7], we used coefficients for class Scompounds, 8.0E-6 for 2 3 8U, 8.5E-6 for 2 3 5U, 9.4E-6 for 2 3 4U, (Sv/Bq);
365
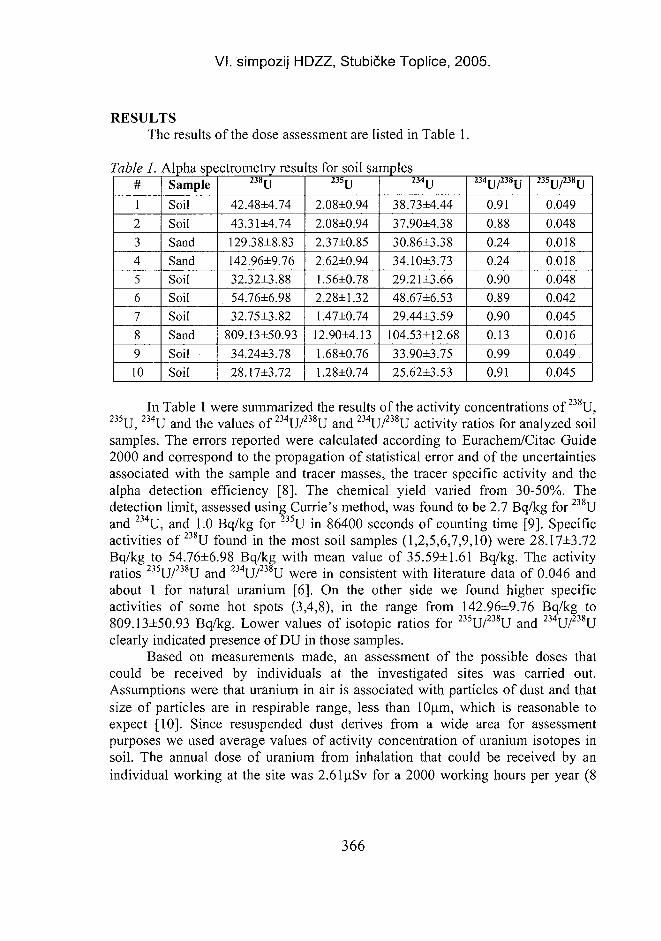
VI. simpozij HDZZ, Stubičke Toplice, 2005.
RESULTSThe results of the dose assessment are listed in Table 1.
Table 1. Alpha spectrometry results for soil samples#12345678910
SampleSoilSoilSandSandSoilSoilSoilSandSoilSoil
2 3 8 U42.48±4.7443.31±4.74129.38±8.83142.96±9.7632.32±3.8854.76±6.9832.75±3.82
809.13±50.9334.24±3.7828.17±3.72
2 3 5 U2.08±0.942.08±0.942.37±0.852.62±0.941.56±0.782.28±1.321.47±0.74
12.90±4.131.68±0.76I.28±0.74
2 3 4 U38.73±4.4437.90±4.3830.86±3.3834.10±3.7329.21±3.6648.67±6.5329.44±3.59
104.53±12.6833.90±3.7525.62±3.53
234U/238U
0.91
0.88
0.24
0.24
0.90
0.89
0.90
0.13
0.99
0.91
2 3 5 U/ 2 3 8 U
0.049
0.048
0.018
0.018
0.048
0.042
0.045
0.016
0.049
0.045
i-238TIn Table 1 were summarized the results of the activity concentrations of U,2 3 5U, 2 3 4U and the values of 234U/238U and 234U/238U activity ratios for analyzed soilsamples. The errors reported were calculated according to Eurachem/Citac Guide2000 and correspond to the propagation of statistical error and of the uncertaintiesassociated with the sample and tracer masses, the tracer specific activity and thealpha detection efficiency [8]. The chemical yield varied from 30-50%. Thedetection limit, assessed using Currie's method, was found to be 2.7 Bq/kg for 2 3 8Uand 2 3 4U, and 1.0 Bq/kg for 2 3 5U in 86400 seconds of counting time [9]. Specificactivities of 2 3 8U found in the most soil samples (1,2,5,6,7,9,10) were 28.17±3.72Bq/kg to 54.76±6.98 Bq/kg with mean value of 35.59±1.61 Bq/kg. The activityratios 235U/238U and 234U/238U were in consistent with literature data of 0.046 andabout 1 for natural uranium [6]. On the other side we found higher specificactivities of some hot spots (3,4,8), in the range from 142.96±9.76 Bq/kg to809.13±50.93 Bq/kg. Lower values of isotopic ratios for 235U/238U and 234U/238Uclearly indicated presence of DU in those samples.
Based on measurements made, an assessment of the possible doses thatcould be received by individuals at the investigated sites was carried out.Assumptions were that uranium in air is associated with particles of dust and thatsize of particles are in respirable range, less than 10(am, which is reasonable toexpect [10]. Since resuspended dust derives from a wide area for assessmentpurposes we used average values of activity concentration of uranium isotopes insoil. The annual dose of uranium from inhalation that could be received by anindividual working at the site was 2.61)uSv for a 2000 working hours per year (8
366
VI. simpozij HDZZ, Stubičke Toplice, 2005.
hours, 250days). While people residing in the area could receive doses of the orderof 7.84 u.Sv/a assuming 50% indoor occupancy time.
CONCLUSIONThe results for soil samples with 2 3 8U activity concentration bellow
54.76±6.98 Bq/kg were of natural origin since isotopic ratios were natural.Collected debris samples from concrete and cobblestone yards contained 238U up to809,13±50.93 Bq/kg. Ativity ratio of 235U/238U were as low as 0,016 and 0,018clearly indicating presence of DU. Accumulation of DU was result of washing outcorroded fragments of DU penetrator and dust from the concrete surface andaccumulating in the lowest part of yards. Generally, it can be concluded that thereis not wide spread contamination which is in consistent with already publisheddata. A conservative approach was adopted to estimate the possible annual dosesthat could be associated with DU. Annual doses that could arise to any members ofthe public residing in the area would be less than 10 p.Sv. Doses to workers in theTank Repair Facility would be less then 5 |nSv/y assuming that a person workscontinuously for one year (8 hours, 250 days) outdoors. The estimated doses in thisassessment should be considered theoretical doses received in the areasinvestigated. Even with uncertainties of the assumed scenario it can be concludedthat contribution to the annual dose from inhalation of uranium is insignificant forpeople working or spending time nearby.
REFERENCES[1] UNSCEAR. United Nations Scientific Committee on the Effect of Atomic
Radiation. The 2000 report to the general Assembly. Annexe A.Annexe B.Unitednations, New York, 2000.
[2] Bleise A, Danesi PR, Burkhart W. Properties, use and health effects of depleteduranium (DU): a general overview. Journal of Environmental Radioactivity 64,2003;93-112.
[3] http://www.nato.int/du/docu/d010124b.htm[4] Giannardi C, Dominici D. Military use of DU: assessment of prolonged population
exposure. Journal of Environmental Radioactivity 64, 2003;227-236.[5] The Royal Society, The health hazards of depleted uranium munitions, Part II, 2002.[6] United Nations Environment Programme (UNEP). Depleted uranium in Bosnia and
Herzegovina, post-conflict environmental assessment. Geneva: UNEP; 2003.[7] International Atomic Energy Agency (IAEA). International Basic Safety Standards
for Protection against Ionizing Radiation and for the Safety of Radiation Sources.Safety Series 115. Vienna:IAEA;1996.
[8] EURACHEM/CITAC Guide 2000. Quantifying uncertainty in analyticalmeasurements. 2nd Edition, 2000.
[9] Currie, LA, Limits for qualitative detection and quantitative determination,Anal.Chem.l968;40:586.
367
VI. simpozij HDZZ, Stubičke Toplice, 2005.
[10] Danesi PR, Markowicz A, Chinea-Cano E, Burkart W, Salbu B, Donohue D,Ruedenauer F, Hedberg M, Vogt S, Zahradnik P, Ciurapinski A. Depleted uraniumparticles in selected Kosovo Samples, J Environ Radioact. 64.2003.143-154.
ABSTRACTUranium is present naturally in the earth crust and has three isotopes with
long half-lives. These isotopes are 23SU (99.27% natural abundance), 2 3 5U (0.72%natural abundance) and 2 3 4U (0.006% natural abundance). Isotope 2 3 5U is a valuablefuel for nuclear power plants. During the manufacture of nuclear fuel theconcentration of 2 3 5U is increased. Depleted uranium (DU) is a waste product ofthis enrichment process and typically contains about 99.8% 23SU, 0.2% 2 3 5U and0.0006% 234U in mass. Due to its high density and other physical properties, DU isused in munitions designed to penetrate armour plate. DU weapons were usedduring the Balkan war in Bosnia and Herzegovina. It was estimated, that nearly10,000 projectiles were fired or 3 tonnes of DU used in B&H. The aim of this workwas to determine uranium radioisotopes in soil and air collected in Hadžići (nearSarajevo). The investigated area is a former military base used for the productionand maintenance of tanks and other heavy military vehicles. During a NATO attackin 1995, about 1,500 rounds were fired at the site. The specific activities of 2 3 8Ufound in soil ranged from 28 Bq/kg to 55 Bq/kg. We found higher specificactivities in some foci, in the range from 143 Bq/kg to 810 Bq/kg. The specificactivities of uranium isotopes in the air were determined using simple dust loadingapproach. The results served to calculate the annual effective dose that could bereceived by individual workers at the site and by general population from thesurrounding area. Radioactivity measurements in the environment of Hadžićishowed that the annual effective dose for general population was less than 20 uSv.
368
VI. simpozij HDZZ, Stubičke Toplice, HR0500079
DETERMINATION OF ACTINIDES IN SAVA RIVERSEDIMENTS UPSTREAM AND DOWNSTREAM OF NPP
KRŠKO BY LOW-LEVEL ALPHA-SPECTROMETRY
Stipe Lulic', Luka Mikelić1, Višnja Oreščanin' and Gordana Pavlović2
'Ruder Bošković Institute, Laboratory for radioecology,Bijenička c. 54, HR-10000 Zagreb, Croatia
2Faculty of Science, Institute for mineralogy and petrography,Horvatovac bb, HR-10000 Zagreb, Croatia
e-mail: lulic(S)irb.hr
INTRODUCTIONReliable determination of alpha-emitting radionuclides requires well-
prepared sources. Electrodeposition technique is the best method for preparationuniform sources for high resolution alpha-spectrometry measurements. Plutoniumand higher actinides are frequently plated from solution of ammonium sulfate [1],ammonium chloride [2] or ammonium chloride-ammonium oxalate [3]. Inpresented study simple and quantitative technique was developed for directelectroplating U and Pu from ammonium oxalate-ammonium sulfate electrolytecontaining diethyl triamino pentaacetic acid (DTPA) [4]. Optimum conditions forplating actinides were determined by varying plating time and current. Totalactivity of actinides in Sava river sediments upstream and downstream of NPPKrško was investigated. The optimised method was validated by application toenvironmental samples. Microwave digestion system was used for totaldecomposition of sediment samples. The chemical yield of plated actinides wasdetermined by 2 3 2U.
EXPERIMENTALThe filtered solution with 2 3 2U tracer obtained after sample (2.6 g) attack was
evaporated to near dryness and dissolved in 10 mL of 3M HNO3/IM A1(NO3)3.The solution was passed through a pre-conditioned (5 mL 5M HNO3) UTEVAresin. The resin was then rinsed with 5 mL of 3M HNO3 to remove the polonium.To converts the resin to the chloride system 5 mL of 9M HC1 was added intocolumn. 20 mL of 5M HC1/0.05 H2C2O4 was added to strip plutonium and 15 mLof IM HC1 to strip uranium.
The electroplating solution used in this procedure was prepared as follows:43 g ammonium oxalate, 53 g ammonium sulfate, 18 g hydroxylammonium sulfateand 2 g DTPA were dissolved in one litre of H2O and adjusted to pH 1.8 withH2SO4. The effective area of electrodeposition was 1.7 cm2. The anode waspolished platinum wire.
369
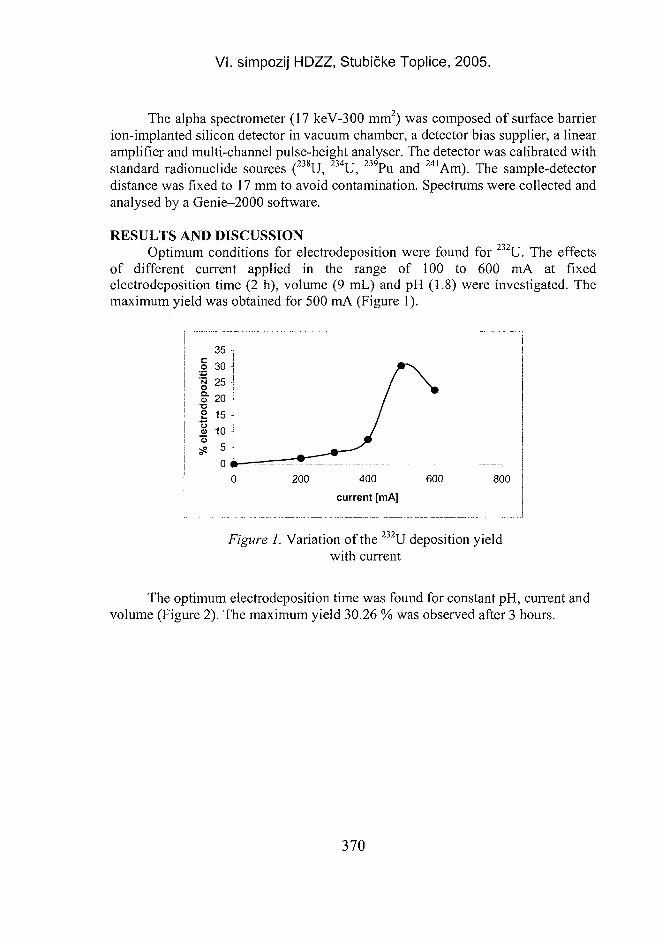
VI. simpozij HDZZ, Stubičke Toplice, 2005.
The alpha spectrometer (17 keV-300 mm2) was composed of surface barrierion-implanted silicon detector in vacuum chamber, a detector bias supplier, a linearamplifier and multi-channel pulse-height analyser. The detector was calibrated withstandard radionuclide sources (238U, 2 3 4U, 239Pu and 241Am). The sample-detectordistance was fixed to 17 mm to avoid contamination. Spectrums were collected andanalysed by a Genie-2000 software.
RESULTS AND DISCUSSIONOptimum conditions for electrodeposition were found for 2 3 2U. The effects
of different current applied in the range of 100 to 600 mA at fixedelectrodeposition time (2 h), volume (9 mL) and pH (1.8) were investigated. Themaximum yield was obtained for 500 mA (Figure 1).
200 400
current [mA]
600 800
. 232 TFigure 1. Variation of the U deposition yieldwith current
The optimum electrodeposition time was found for constant pH, current andvolume (Figure 2). The maximum yield 30.26 % was observed after 3 hours.
370
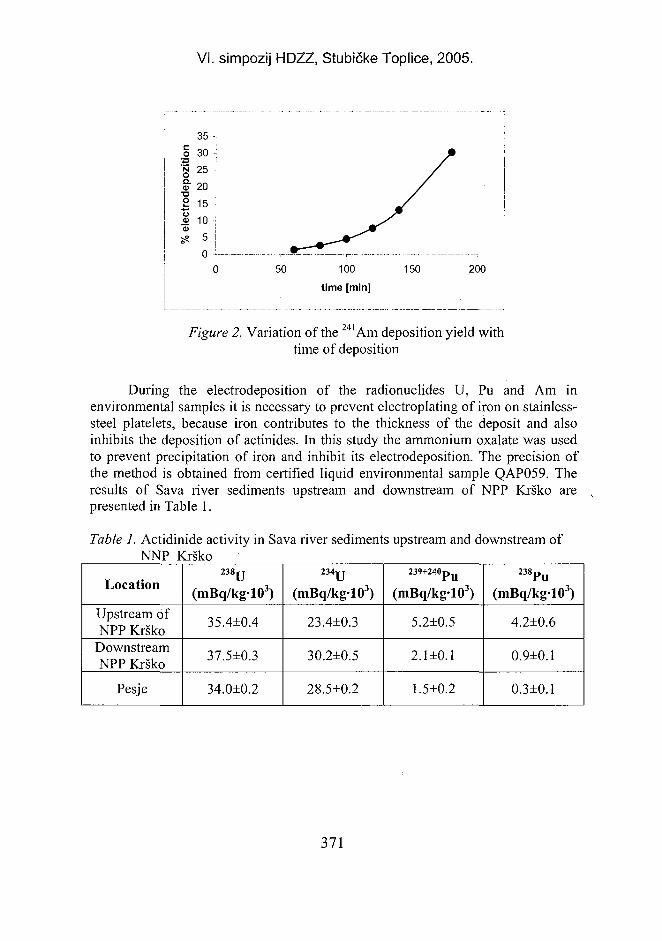
VI. simpozij HDZZ, Stubičke Toplice, 2005.
ion
:rode
pozit
% e
leci
35 -
3 0 •;
2 5 •!
20 l
15 J10
5 !n !
u —0
• -
501
100
time [min]
/
150
"" '
200
_ _
Figure 2. Variation of the 241Am deposition yield withtime of deposition
During the electrodeposition of the radionuclides U, Pu and Am inenvironmental samples it is necessary to prevent electroplating of iron on stainless-steel platelets, because iron contributes to the thickness of the deposit and alsoinhibits the deposition of actinides. In this study the ammonium oxalate was usedto prevent precipitation of iron and inhibit its electrodeposition. The precision ofthe method is obtained from certified liquid environmental sample QAP059. Theresults of Sava river sediments upstream and downstream of NPP Krško arepresented in Table 1.
Table 1. Actidinide activity in Sava river sediments upstream and downstream ofNNP Krško
Location
Upstream ofNPP Krško
DownstreamNPP Krško
Pesje
2 3 8U(mBq/kg-103)
35.4±0.4
37.5±0.3
34.0±0.2
2 3 4U(mBq/kg-103)
23.4±0.3
30.2±0.5
28.5±0.2
239+240pu
(mBq/kg-103)
5.2±0.5
2.1 ±0.1
1.5±0.2
238pu
(mBq/kg-103)
4.2±0.6
0.9±0.1
0.3±0.1
371
VI. simpozij HDZZ, Stubičke Toplice, 2005.
REFERENCES[1] Talvitie NA. Electrodeposition of actinides for alpha spectrometric determination.
Anal Chem 1972;44:280-283.[2] Mitchell RF. Electrodeposition of actinide elements at tracer concentrations. Anal
Chem 1960;32:326-328.[3] Puphal WK, Olsen D R. Electrodeposition of alpha-emitting nuclides from a mixed
oxalate-chloride electrolyte. Anal Chem 1972;44:284-289.[4] Lee MH, Pimpl M. Development of a new electrodeposition method for Pu-
determination in environmental samples. Applied Radiation and Isotopes1991;50:851-857.
ABSTRACTThis paper describes a quick, sensitive and selective electrodeposition
method for determining Pu, Am, and U in environmental samples. To determineoptimum conditions for plating actinides, we studied the parameters affectingelectrodeposition such as plating time and current. Actinides were plated fromammonium oxalate-ammonium sulfate electrolyte containing diethyltriamminopentaacetic acid (DTPA). Total actidine activity was investigated in the Sava Riversediments, upstream and downstream of the Nuclear Power Plant Krško. Theoptimised method was validated by application to environmental samples.Microwave digestion was used for total decomposition of sediment samples. Thechemical yield of plated actinides was determined using 2 3 2U.
372
VI. simpozij HDZZ, Stubičke Toplice HR0500080
ANALIZA OSJETLJIVOSTI MODELA ZA PROCJENUSREDNJEG VREMENA BORAVKA MORSKE VODE UJADRANSKOM MORU ZASNOVANOM NA 90Sr KAO
RADIOAKTIVNOM OBILJEŽIVAČU
Zdenko FranićInstitut za medicinska istraživanja i medicinu rada,
Ksaverska c. 2, 10000 Zagrebe-mail: [email protected]
UVODCirkulacije vode Jadranskoga mora uvelike je određena specifičnim oblikom
i zemljopisnim položajem Jadranskog bazena (dugačak zaljev sa svih stranaomeđen velikim planinskim lancima) i njegovom vrlo malom dubinom usjevernom dijelu. Posljedično, jedna jaka bura izmiješa cjelokupni sadržajsjevernog Jadrana. Tako nastaje gusta hladna voda koja potom u dubinskoj strujiputuje duž talijanske obale i kroz Otrantska vrata napušta Jadran, čineći osnovutzv. istočno-mediteranske dubinske vode.
Poznavanje vremena potrebnog za izmjenu cjelokupne vode Jadranskogmora (volumen od oko 35000 km3) izuzetno je bitno za svaku procjenu rizika kojesa sobom nose razne gospodarske aktivnosti, turizam i svakojake intervencije uprostoru. Ujedno, taj je podatak važan i za procjenu opterećenja Jadranskog moraotpadom te balastnim i drugim otpadnim vodama. Naime, to je najmanje mogućevrijeme kroz koje bi se Jadran spontanim procesima sam oporavio od nekogglobalnog zagađenja.
Izmjena morske vode između Jadranskog i Jonskog mora kroz Otrantskavrata je proteklih dvadesetak godina bila predmetom mnogih oceanografskihistraživanja, kao i matematičkog modeliranja [1,2,3,7]. Iz podataka o transportuvodene mase kroz vertikalni presjek Otrantskih vrata, lako se može izračunativrijeme potrebno za izmjenu cjelokupnog volumena Jadranske vode tako da seukupna masa vode koja tijekom godine dana uđe (ili izađe) iz Jadrana podijeli snjegovim volumenom. Ta vrijednost ujedno pretstavlja i vrijeme boravka morskevode u Jadranskom moru.
Literaturni podaci za vrijeme boravka morske vode u Jadranskom moruprikazani su u Tablici 1.
373
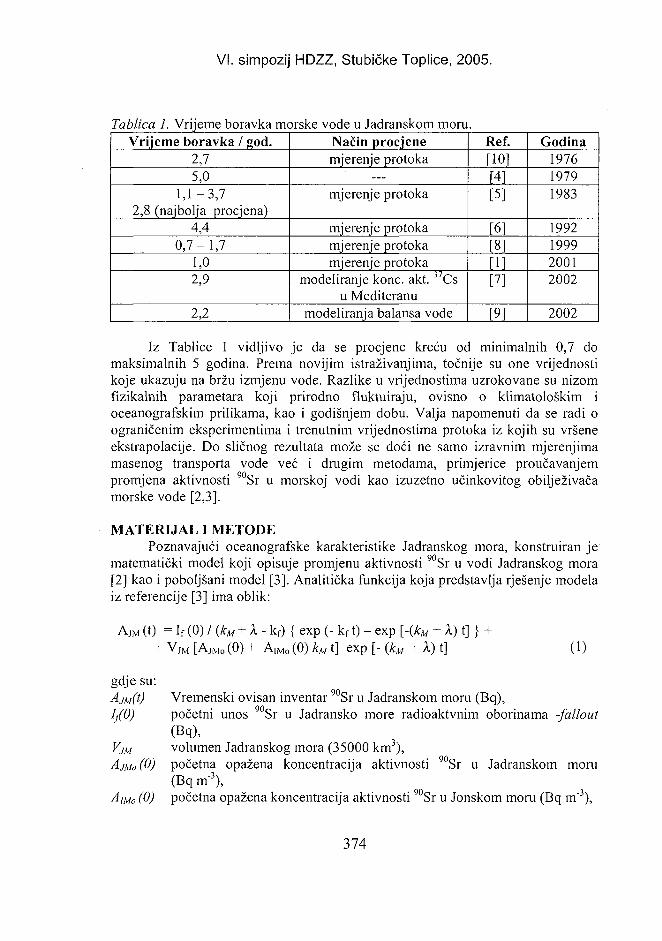
VI. simpozij HDZZ, Stubičke Toplice, 2005.
Tablica 1. Vrijeme boravka morske vode u Jadranskom moru.Vrijeme boravka / god.
2,75,0
1,1-3,72,8 (najbolja procjena)
4,40,7-1,7
1,02,9
2,2
Način procjenemjerenje protoka
•
mjerenje protoka
mjerenje protokamjerenje protokamjerenje protoka
modeliranje konc. akt. 3 7Csu Mediteranu
modeliranja balansa vode
Ref.[10][4][5]
[6][8][1][7]
[9]
Godina197619791983
1992199920012002
2002
Iz Tablice 1 vidljivo je da se procjene kreću od minimalnih 0,7 domaksimalnih 5 godina. Prema novijim istraživanjima, točnije su one vrijednostikoje ukazuju na bržu izmjenu vode. Razlike u vrijednostima uzrokovane su nizomfizikalnih parametara koji prirodno fluktuiraju, ovisno o klimatološkim ioceanografskim prilikama, kao i godišnjem dobu. Valja napomenuti da se radi oograničenim eksperimentima i trenutnim vrijednostima protoka iz kojih su vršeneekstrapolacije. Do sličnog rezultata može se doći ne samo izravnim mjerenjimamasenog transporta vode već i drugim metodama, primjerice proučavanjempromjena aktivnostimorske vode [2,3].
90,Sr u morskoj vodi kao izuzetno učinkovitog obilježivača
MATERIJAL I METODEPoznavajući oceanografske karakteristike Jadranskog mora, konstruiran je
matematički model koji opisuje promjenu aktivnosti 9 0Sr u vodi Jadranskog mora[2] kao i poboljšani model [3]. Analitička funkcija koja predstavlja rješenje modelaiz referencije [3] ima oblik:
AJM (t) = I f (0) f(kM + X- kf) { exp (- k f t) - exp [-{kM + X) t]+ VJM [AJMO (0) + A,MO (0) kM t] exp [- (JcM + X) t] (1)
gdje su:AJM(I) Vremenski ovisan inventar 9 0Sr u Jadranskom moru (Bq),1/0) početni unos 9 0Sr u Jadransko more radioaktvnim oborinama -fallout
(Bq),VJM volumen Jadranskog mora (35000 km3),AJMO(O) početna opažena koncentracija aktivnosti 9 0Sr u Jadranskom moru
(Bq m-3),diMo (0) početna opažena koncentracija aktivnosti 9 0Sr u Jonskom moru (Bq m"3),
374
VI. simpozij HDZZ, Stubičke Toplice, 2005.
X konstanta raadioaktivnog raspada za 90Sr (0,0238 god"1),kf konstanta koja opisuje godišnje smanjivanje koncentracije aktivnosti 90Sr
u radioaktivnim oborinama (god"') il/kM srednje vrijeme boravka 90Sr u Jadranskom moru (god), koje reflektira i
srednje vrijeme boravka morske vode u Jadranu.Funkcija (1) je potom prilagođena ekperimentalnim podacima iz
četrdesetogodišnje baze podataka o koncentracijama aktivnosti radiostroncija uvodi Jadranskog mora te je nepoznati parametar l/kM, koji reprezentira brzinuizmjene morske vode, procijenjen na 3,3 godine. Ova vrijednost stoga predstavlja isrednje vrijeme boravka morske vode u Jadranu, usrednjeno preko perioda odčetrdesetak godina.
REZULTATIStandardna devijacija srednjeg vremena boravka morske vode u Jadranu
određena je Monte Carlo analizom. U proračunu je pretpostavljeno da za aktivnosti90Sr u morskoj vodi oko mjerenih vrijednosti u pojedinim godinama vrijediuniforma razdioba. Za svaku je godinu stoga generatorom slučajnih brojevagenerirana nasumična vrijednost aktivnosti morske vode unutar intervala [A - a, A+ a], gdje je o standardna devijacija mjerenih vrijednosti te je iz svakogodgovarajućeg niza podataka funkcijskim prilagođavanjem na analitičku funkciju(1) određena vrijednost l/kM. Nakon stoje postupak ponovljen 100 puta, izračunatesu srednja vrijednost i standardna devijacija, u iznosu 3,3 ± 0,4 godine.
Kako bi se odredilo koji parametar iz jednadžbe (1) najviše utječe naprocjenu srednjeg vremena boravka vode u Jadranu, tj. na vrijednost l/kM,provedena je analiza osjetljivosti. Ona uključuje perturbaciju svakoga parametra umodelu za određeni iznos, dok se ostali parametri drže na nominalnim, unaprijedzadanim vrijednostima, te se kvantificira relativni učinak na predikciju modela.Obično se pri tome svaki parametar povećava ili smanjuje preko cijelogočekivanog područja, za određeni postotak nominalne vrijednosti. Na slici 1.prikazano je kako za model (1) na konačni rezultat utječu ukupni unos(kombinirani utjecaj radioaktivnih oborina i vode koja se s kopna.slijeva u more)90Sr u morsku vodu, unos 90Sr iz Jonskoga mora i ukupni inventar 90Sr uJadranskom moru.
Svaki od kritičnih parametara modela, tj. AjM, A|M i If, mijenjani su zavrijednost ±25% oko svoje nominalne vrijednosti. Povećavanjem unosa 90Srfalloutom za 25%, jednadžba (1) daje za srednje vrijeme boravka 90Sr u Jadranuvrijednost od 3,0 godine S druge strane, smanjivanje vrijednosti unosa za 25%,povećava srednje vrijeme boravka na 3,6 godina. Koristeći sličnu proceduru zaunos 90Sr transportom vodene mase iz Jonskoga mora dobivaju se vrijednosti od2,9 i 3,7 godina za povećavanje odnosno smanjivanje volumena od 25%. Konačno,povećavanje i smanjivanje ukupne aktivnosti 90Sr u Jadranu vodi vrijednostima od3,5 i 2,9 godina.
375
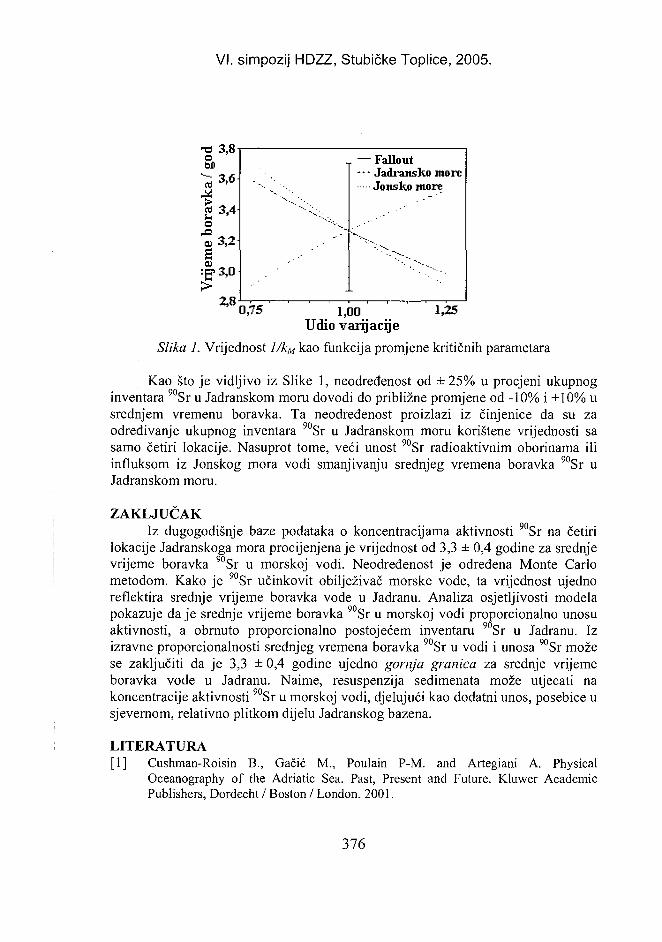
VI. simpozij HDZZ, Stubičke Toplice, 2005.
o
eu 3,2-
s: | 3 , 0
2,8
— Fallout--- Jadransko more
Jonsko more
0,75 1,00 1,25Udio varijacije
Slika 1. Vrijednost l/kM kao funkcija promjene kritičnih parametara
Kao što je vidljivo iz Slike 1, neodređenost od ± 2 5 % u procjeni ukupnoginventara 90Sr u Jadranskom moru dovodi do približne promjene od -10% i +10% usrednjem vremenu boravka. Ta neodređenost proizlazi iz činjenice da su zaodređivanje ukupnog inventara 90Sr u Jadranskom moru korištene vrijednosti sasamo četiri lokacije. Nasuprot tome, veći unost 90Sr radioaktivnim oborinama iliinfluksom iz Jonskog mora vodi smanjivanju srednjeg vremena boravka 90Sr uJadranskom moru.
ZAKLJUČAKIz dugogodišnje baze podataka o koncentracijama aktivnosti 90Sr na četiri
lokacije Jadranskoga mora procijenjena je vrijednost od 3,3 ± 0,4 godine za srednjevrijeme boravka 90Sr u morskoj vodi. Neodređenost je određena Monte Carlometodom. Kako je 90Sr učinkovit obilježivač morske vode, ta vrijednost ujednoreflektira srednje vrijeme boravka vode u Jadranu. Analiza osjetljivosti modelapokazuje daje srednje vrijeme boravka 90Sr u morskoj vodi proporcionalno unosuaktivnosti, a obrnuto proporcionalno postojećem inventaru 90Sr u Jadranu. Izizravne proporcionalnosti srednjeg vremena boravka 90Sr u vodi i unosa 90Sr možese zaključiti da je 3,3 ± 0,4 godine ujedno gornja granica za srednje vrijemeboravka vode u Jadranu. Naime, resuspenzija sedimenata može utjecati nakoncentracije aktivnosti 90Sr u morskoj vodi, djelujući kao dodatni unos, posebice usjevernom, relativno plitkom dijelu Jadranskog bazena.
LITERATURA[1] Cushman-Roisin B., Gačić M., Poulain P-M. and Artegiani A. Physical
Oceanography of the Adriatic Sea. Past, Present and Future. Kluwer AcademicPublishers, Dordecht / Boston / London. 2001.
376
VI. simpozij HDZZ, Stubičke Toplice, 2005.
[2] Franić Z. Proračun brzine izmjene intermedijarne vode Jadranskoga i Jonskog morakoristeći 90Sr kao radioaktivni obilježivao. U: Z. Franić i D. Kubelka (urednici)Zbornik radova drugoga simpozija Hrvatskoga društva za zaštitu od zračenja,Zagreb 1994.
[3] Franić Z. Estimation of the Adriatic sea water turnover time using fallout 90Sr as aradioactive tracer. Journal of Marine Systems, accepted for publication. (2005)
[4] Leksikografski institut "Miroslav Krleža" (LIMK), 1979. Članak Jadransko more.Pomorska enciklopedija. 3, 135-214. LIMK, Zagreb.
[5] Mosetti F. A tentative attempt at determining the water flow through the OtrantoStrait: The mouth of the Adriatic Sea, Criterion for applying the computation ofdynamic height anomalies on the water budget problems. Boll Oceanol Teor Appl1983; 1:143-163.
[6] Orlić M, Gačić M, La Violette PE. The currents and circulation of the Adriatic sea.Oceanol Acta 1992;15(2),109-123.
[7] Sanchez-Cabeza, JA, Ortega M, Merino J, Masque P. Long-term box modelling ofl37Cs in the Mediterranean Sea. J Marine Syst 2002;33-34:457-472.
[8] Vetrano A, Gačić M, Kovačević M. Water fluxes through the Strait of Otranto. TheAdriatic Sea. Hopkins T. S. et al., eds., Ecosystem Research Report No. 32,EUR18834, European Commission, Bruxelles, 127-140. 1999.
[9] Vilibić I, Orlić M. Adriatic water masses, their rates of formation and transportthrough Otranto Strait, Deep-Sea Res 2002; 49:1321-1340.
[10] Zore-Armanda M, Pulcher-Petkovic T. Some dynamic and biological characteristicsof the Adriatic and other basins of the Eastern Mediterranean Sea. Acta Adriat 1976;18,17-27.
377
VI. simpozij HDZZ, Stubičke Toplice, 2005.
SENSITIVITY ANALYSIS OF THE MODEL FORESTIMATION OF THE ADRIATIC SEA TURNOVER TIME
USING FALLOUT 9 0Sr AS A RADIOACTIVE TRACER
Zdenko FranićInstitute for Medical Research and Occupational Health, Ksaverska c. 2
HR-10000 Zagreb, Croatiae-mail: [email protected]
Reliable data on the turnover time of water in the Adriatic Sea(approximately 35000 cubic kilometres) is extremely important for any riskanalysis involving various economic activities, tourism, etc. Water exchangethrough the Strait of Otranto between the Adriatic and the Ionian seas has been thesubject of a series of experimental investigations and more recently, of somenumerical studies, is extensively presented by Cushman-Roisin et al. [1]. Theturnover time of the Adriatic sea water can be easily calculated from the data onwater fluxes through the Strait by calculating annual water mass flowing throughthe Strait and dividing it by the total volume of the Adriatic sea. Literature data onthe Adriatic Sea water turnover time range from minimal 0.7 to maximal 5.0 years.Using a model describing the rate of change of 90Sr activity concentrations in theAdriatic Sea water by function minimisation to long-term experimental data, theturnover time for 90Sr in the Adriatic was calculated to be 3.3±0.4 years. Theuncertainty was estimated by Monte Carlo analysis. As 90Sr is a reliable radiotracerfor seawater, this value also reflects the sea water turnover time. Sensitivityanalysis of the model, applied by varying critical parameters over their nominalvalues, showed that ±25% uncertainty in the estimation of the Adriatic sea wateractivity results in approximately ±10% change in 90Sr mean residence time. On theother hand, a larger input of 90Sr, either by fallout or water influx from the IonianSea may lead to a shorter mean residence time.Direct proportionality between 90Srinput into the Adriatic sea and its mean residence time in the sea water suggeststhat 3.3 years is the upper limit of the Adriatic sea water turnover time. Namely, re-suspension from sediments could affect 90Sr activity concentrations, acting asadditional input, especially in the northern, relatively shallow part of the Adriatic.
378
VI. simpozij HDZZ, Stubičke Toplice HR0500081
ODREĐIVANJE 8 9 '9 0Sr U MORSKOJ VODI
Martina Rožmarić Mače/at, Katarina Košutić i Željko GrahekInstitut "Ruđer Bošković", Bijenička c. 54, 10000 Zagreb
e-mail: [email protected]
UVODAntropogeni radionuklidi nastaju u nuklearnim katastrofama, upotrebom
nuklearnog oružja te kao ispust pri normalnom radu nuklearnih postrojenja.Obzirom na to da 71% površine Zemlje zauzimaju mora i oceani oni su i najvećirecipijent radioaktivne kontaminacije. 89Sr i 90Sr su visoko radiotoksični fisijskiprodukti čije se ponašanje u prirodnim sustavima kao i utjecaj na ljudsko zdravljeintenzivno proučava [1].
Određivanje radioaktivnog stroncija je složen i dugotrajan postupak,posebno ako je u uzorku prisutan izotop 89Sr. Oba izotopa su čisti p-emiteri štozahtijeva kemijsko odjeljivanje od ostalih elemenata (ionska izmjena, ekstrakcijai/ili taloženje) i detekciju na prikladnom instrumentu (plinski proporcionalni ilitekući scintilacijski detektor).
Razvijene su mnoge metode za određivanje stroncija u različitim uzorcima,ali u literaturi osim par izuzetaka [2,3] gotovo da se ne spominje određivanje umorskoj vodi, pa je svrha ovog rada razviti postupak za izolaciju stroncija izmorske vode. U radu je prikazano kako se pomoću kromatografskih metodastroncij može uspješno izolirati iz morske vode i odrediti na tekućemscintilacijskom brojaču (LSC).
MATERIJALI I METODEZa izolaciju stroncija upotrebljavana je Sr smola (50-100 i 100-150 um) i
otopine HNO3 u morskoj vodi (Jadransko more). Određena je brzina sorpcije ikrivulje prodora.
Brzina vezanja stroncija na Sr smolu određena je koristeći 100 ml otopine i 2g smole, a promjena koncentracije stroncija u otopinama mjerena je pomoćuatomskog apsorpcijskog spektrometra (AAS Perkin Elmer 3110).
Krivulje prodora snimane su mjerenjem koncentracije stroncija na izlazu izkolone za morsku vodu u kojoj je koncentracija HNO3 1 i 3 mol dm'3, akoncentracija stroncija određena je pomoću AAS.
U 1 L morske vode dodano je 270 ml konc. HNO3 (3M HNO3). Pripremljenaotopina je propuštena kroz kolonu, radijusa 1 cm, punjenu sa 6 g Sr smole (100-150 um) koja je prije propuštanja uzorka kondicionirana s 30 ml 5M HNO3. Protokuzorka kroz kolonu iznosio je 1 mL min"1. Nakon uzorka kroz kolonu je propušteno50 ml 3M HNO3 (za odvajanje itrija) i nakon toga je s 50 ml destilirane vodeeluiran stroncij. Eluat je uparen do volumena 1-2 mL i tome je dodano 18 mL 5M
379
VI. simpozij HDZZ, Stubičke Toplice, 2005.
HNO3. Otopina je prenesena u teflonsku bočicu za brojanje te je određen stroncijna tekućem scintilacijskom brojaču (Packard Tri-Carb 2770 TR/SL).
REZULTATIPoznato je da se stroncij veže na Sr smolu iz otopine HNO3 te da jakost
vezanja ovisi 0 koncentraciji kiseline (raste s porastom koncentracije kiseline). Dabi se odredili optimalni uvjeti za izolaciju i odjeljivanje stroncija od ostalihelemenata napravljeni su ranije opisani eksperimenti. Za eksperimente suupotrebljavane 1 M i 3 M HNO3 u morskoj vodi jer se pri tim koncentracijamakiselina stroncij dobro veže na Sr smolu za razliku od većine elemenata (a i Pemitera).
Krivulje prodora (Slika 1) pokazuju istovremeni izlazak stroncija iz kolonekod obje otopine, međutim kod otopine koncentracije 1 M brže dolazi do zasićenjašto znači da će se iz 3 M HNO3 vezati više stroncija na kolonu. Isto tako je vidljivoda jakost vezanja ovisi o veličini čestica, odnosno kolona punjena česticamaveličine 50-100 um vezat će više stroncija no zbog manje poroznosti i protok ćebiti manji što produžava vrijeme potrebno za eksperiment.
Dobivene krivulje prodora nisu simetrične kao kod vezanja stroncija iz čistihotopina kiseline, a razlog je najvjerojatnije utjecaj velikih količina ostalih kationa ikloridnih iona, koji se nalaze u morskoj vodi. Na pojavu stroncija u početnimfrakcijama osim kationa i klorida iz morske vode utječe i kinetika [4,5]. Iz krivuljaprikazanih na Slici 2 vidljivo je da se "ravnoteža" postiže relativno brzo, ali semogu primijetiti blage fluktuacije oko neke vrijednosti. Zbog istovremenog vezanjai eluiranja stroncija kod danih dimenzija kolona kao i zbog veće količine uzorkaiskorištenje će biti manje, a može se povećati povećanjem koncentracije kiseline,mase smole i/ili dimenzija kolone.
380
VI. simpozij HDZZ, Stubičke Toplice, 2005.
oO
200 400 600
V(mL)
•3 M (100-150)
•1 M (100-150)
•3 M (50-100)
800
Slika I: Krivulja prodora stroncija na koloni punjenoj Sr smolom (50-100 um i100-150 um); masa smole 3 g, (j) = 1 cm, visina stupca kolone (h5o-ioo= 11,4 cm,hioo-150 = 14,5 cm), brzina protoka (vso.ioo ~ 0,25 mL/min, v1Oo-i5o = 1 mL/min.Koncentracije HNO3U morskoj vodi iznose 1 i 3 mol dm"3
o.0"o
1
0,8
0,6-
0,4-
0,2
0
^ - . »
•3M
•1 M
0 500 1000 1500 2000 2500 3000
t(s)
Slika 2: Brzina vezanja stroncija na Sr smolu (100-150 um) iz otopine HNO3 (1 i 3moldm"3) u morskoj vodi
U Tablici 1 dani su rezultati određivanja 89>90Sr u morskoj vodi u koju jedodana poznata aktivnost radioizotopa. Izolacija je provedena na prethodno opisani
381
VI. simpozij HDZZ, Stubičke Toplice, 2005.
način tako da je iz 1 L morske vode stroncij vezan direktno na Sr kolonu (uziskorištenje oko 50%), odvojen od ostalih elemenata, eluiran i nakon togadetektiran na LSC-u Čerenkovljevim brojanjem.
Tablica /.Rezultati određivanja 89l90Sr nakon direktne izolacije na Sr koloniveličina čestica
(nm)
50-100100-150
Rsr(%)
5045
89Sr
poznata1'140±5140±5
(dpm P1)
određenab
132±10129±12
90Sr
poznataa
66±3122±5
(dpm I"1)
određena15
59±5l l l i l l
R- iskorištenje: dpm-broj raspada u minutia odstupanje je izraženo kao ukupna nepouzdanost standardab odstupanje je izraženo kao prosječna vrijednost tri određivanja
Rezultati pokazuju dobro slaganje što znači da se na taj način može provestiizolacija i određivanje. Beta emiteri koji se mogu naći u frakciji stroncija ne utječuna konačni rezultat jer je njihova aktivnost u 1 Lvode niža od granice detekcije, aisto vrijedi i za aktivnost 90Sr u morskoj vodi koja je trenutno oko 2mBq L"'.Obzirom na to daje granica detekcije oko 0,3 Bq L"1 za određivanje niže aktivnostipotrebna je veća količina uzorka. U tom slučaju izolacija se provodikoncentriranjem (taloženjem) i nakon toga odjeljivanjem na koloni punjenoj Srsmolom.
ZAKLJUČAKStroncij iz morske vode moguće je vezati na Sr smolu i odijeliti ga od većine
smetajućih elemenata, a optimalna koncentracija HNO3 u morskoj vodi za izolacijustroncija je 3 mol dm"3.
Metoda direktne izolacije stroncija na Sr smolu pogodna je za određivanjestroncija u uzorcima kod kojih se očekuje viša aktivnost (potreban je manjivolumen uzorka) i prisutnost S9Sr koji zbog kratkog vremena poluraspada zahtijevabrzo određivanje.
382
VI. simpozij HDZZ, Stubičke Toplice, 2005.
LITERATURA[1] Heilgeist M. Use of extraction chromatography, ion cbromatography and liquid
scintillation spectrometry for rapid determination of strontium-89 and strontium-90in food in cases of increased release of radionuclides. J Radioanal Nucl Chem2000;245(2):249-254.
[2] International Atomic Energy Agency (IAEA). Reference Methods for MarineRadioactivity Studies. Technical report series 118. Vienna: IAEA, 1970.
[3] Horwitz EP, Chiarzia R, Dietz ML. A novel strontium-selective extractionchromatographic resin. Solvent Extract Ion Exch 1992; 10(2):313-336.
[4] Grahek Ž, Zečević N, Lulić S. Possibility of rapid determination of low-level Sr-90activity by combination of extraction chromatography separation and Cherenkovcounting. Anal Chim Acta 1999;399(3):237-247.
[5] Chen Q, Hou X, Yu Y, Dahlgaard H, Nielsen SP. Separation of Sr from Ca, Ba andRa by means of Ca(OH)(2) and Ba(Ra)Cl-2 or Ba(Ra)SO4 for the determination ofradiostrontium. Anal Chim Acta 2002;466(l): 109-116.
DETERMINATION OF 89'90Sr IN SEA WATER
Martina Rožmarić Mačefat, Katarina Kohdić and Željko GrahekRuder Bošković Institute, Laboratory for Radioecology, Bijenička c. 54,
HR-10000 Zagreb, Croatiae-mail: [email protected]
The development of new chromatographic methods for separation ofstrontium from calcium and other elements as well as the development of LSCinstrumentation which allows quick and simple detection has substantiallysimplified and shortened the time required for strontium determination. Seawater isa complex mixture of large amount of different kinds of salts (especially sodium,magnesium and calcium salts) and there is a problem of simple and quick isolationof small amounts of strontium. Determination of low 89l90Sr activity in seawaterrequires great amounts of water (up to 200 L), which is a problem in developingthe method. Seawater contains approximately 8 mg/L of dissolved strontium.Therefore, more than 100 mg of strontium will be isolated from the above volumeof water. This quantity practically hinders determination of 89'90Sr with gasproportional counter because of the self-absorption effect. This paper describes anew method for determining 89>90Sr in seawater samples, the possibility to isolatestrontium and yttrium from large amounts of sample using chromatographicmethods and the application of Cherenkov counting for simultaneous determinationofS9-90Sr.
383
VI. simpozij HDZZ, Stubičke Toplice, HR0500082
COMPARISON BETWEEN THE DISTRIBUTION OF 137Cs AND4 0K IN FIR-TREE (ABIES ALBA)
Ivanka Lovrenčić', Delko Barišić', Nikola Kezić2, Ivan Seletković3,Matija Volne/, Marina Popijač5 and Stipe Lulić1
1 Ruder Bošković Institute, Bijenička c. 542Faculty of Agriculture, University of Zagreb, Svetošimunska 25
HR-10000 Zagreb, Croatia3Forest Research Institute, Cvjetno naselje 41, HR-10450 Jastrebarsko, Croatia
4ZSC "Ivo Pevalek", 53 231 Plitvička jezera, Croatia5Hrvatske šume, Ljudevita Farkaša Vukotinovića 2, HR-10000 Zagreb, Croatia
e-mail: ivanka.lovrencic(S)irb.hr
INTRODUCTIONIt is known that radionuclides that occur naturally in soil are incorporated
metabolically into plants. Man-made radionuclides introduced into soil behave in asimilar manner. In forest ecosystems radionuclides remain available for longerperiods than in agricultural ecosystems [1].
40K is a naturally occurring primordial radionuclide while the presence of137Cs in soils and plants is of anthropogenic origin. It is a consequence of globalatmospheric radioactive pollution. The cesium isotope i37Cs was produced as a by-product of the atmospheric testing of thermonuclear weapons during the periodextending from the 1950s to the 1970s. The last significant release of l37Cs wascaused by the Chernobyl accident.
Cesium, as well as other radionuclides that behave like cations, can bemoved upward by plant uptake. That way plants can provide a means of detectingand monitoring radionuclide pollution. Cesium is a homologue of potassium.Because of its exchange capability it can substitute for K where there is a lack ordeficiency of the later. So the presence of l37Cs in plants may be caused by itsuptake through soil as well as by K uptake. The roots of plants are unable todistinguish between chemical congeners in the uptake process [2]. Certain plantspecies are known as cesium pollution indicators, but the uptake by each individualplant can be very different. It depends to a considerable degree on whether theyremain within reach of the roots of plants, the extent to which they are bioavailable[2] and competitive effects of potassium [3]. Different soil types show differencesin cesium transfer from soil to plants [3]. It seems that youngest parts of coniferoustrees' branches could be used as a long term indicator of cesium pollution. For thatreason, the distribution of l37Cs in fir-tree was studied and the comparison with 40Kwas made.
So far, soil-to-plant transfer and the distribution of radionuclides in soil werestudied mostly, while the distribution in plants themselves was studied less. Some
384
VI. simpozij HDZZ, Stubičke Toplice, 2005.
work has been done for Pb [4], Pu [5,6] and l37Cs in tree rings [7] as well as for thedistribution of 137Cs in onion plants (Allium cepa) [8] and spruce and oak forests[9,10]. Behaviour of 40K in tree rings of spruce has also been researched [10] aswell as its concentration in some other plant species [11].
MATERIAL AND METHODSThe distribution of 137Cs and 40K among different parts of Abies alba at six
sites (Lividraga, Tršće, Milanov Vrh, Brloško, Suha Rečina and Zalesina) locatedin the area of Gorski Kotar was studied. The samples of needles grown on branchsegments of different age were taken annually between 1994 and 1998 while thesamples of bark and tree rings of the trunk at the height of 8 m were taken only inSeptember 1994 at three sites in Gorski Kotar (Lividraga, Milanov Vrh and Lie).
All samples were dried at 105°C to a constant weight, homogenised, storedin counting vessels of volume 125 cm3 and known geometry. Activities of l37Csand 40K were determined by gamma-spectrometry method, using a low-backgroundhyper-pure germanium (HPGe) semiconductor detector system coupled to a 4096channel analyser. Spectra were recorded for 80 000 seconds and analysed with apersonal computer using GENIE Canberra software. The activities of l37Cs insamples were calculated from the 661.6 keV peak and of 40K from the 1461.0 keVpeak and recalculated on July 1 each year of the sample's collection.
RESULTSThe distribution for all locations shows the same pattern so, for the clarity of
review, only the results for the samples taken at Milanov Vrh are shown here. Thedistribution of l37Cs in needles grown on branch segments of different age is shownin Figure 1 and the distribution of 40K in the same samples is shown in Figure 2.Comparison of l37Cs and 40K activities between needles and the bark is given inFigure 3.
385
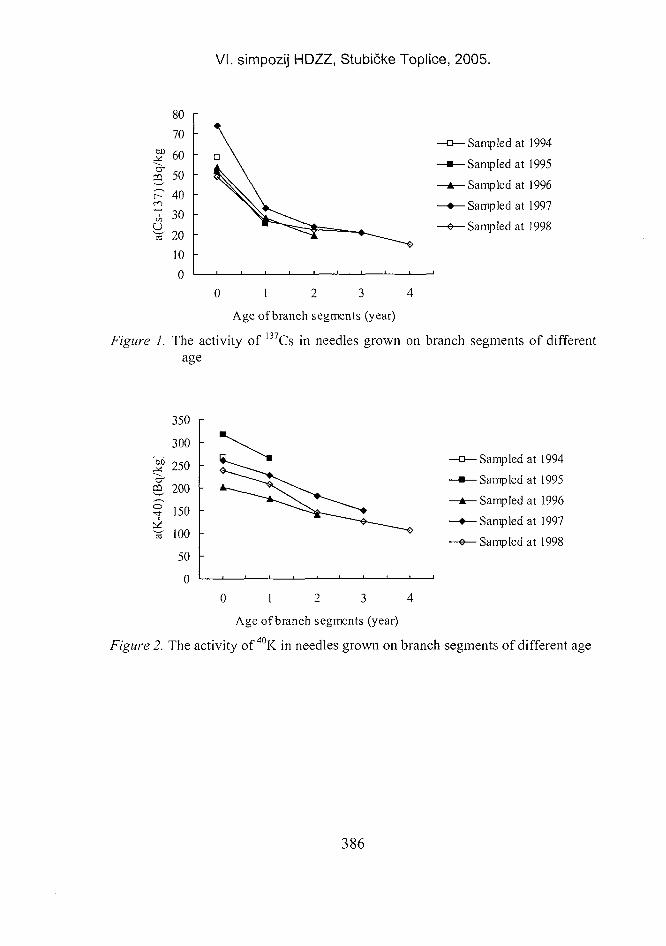
VI. simpozij HDZZ, Stubičke Toplice, 2005.
CD
a
80
70
60
50
40
30
20
10
0
•Sampled at 1994
-Sampled at 1995
-Sampled at 1996
-Sampled at 1997
-Sampled at 1998
0 1 2 3 4
Age of branch segments (year)
Figure I. The activity of 137Cs in needles grown on branch segments of differentage
350
300
250
200
150
100
50
0
0 1 2 3 4
Age of branch segments (year)
f 4 0
-Sampled at 1994
-Sampled at 1995
-Sampled at 1996
-Sampled at 1997
-Sampled at 1998
Figure 2. The activity of 40K in needles grown on branch segments of different age
386
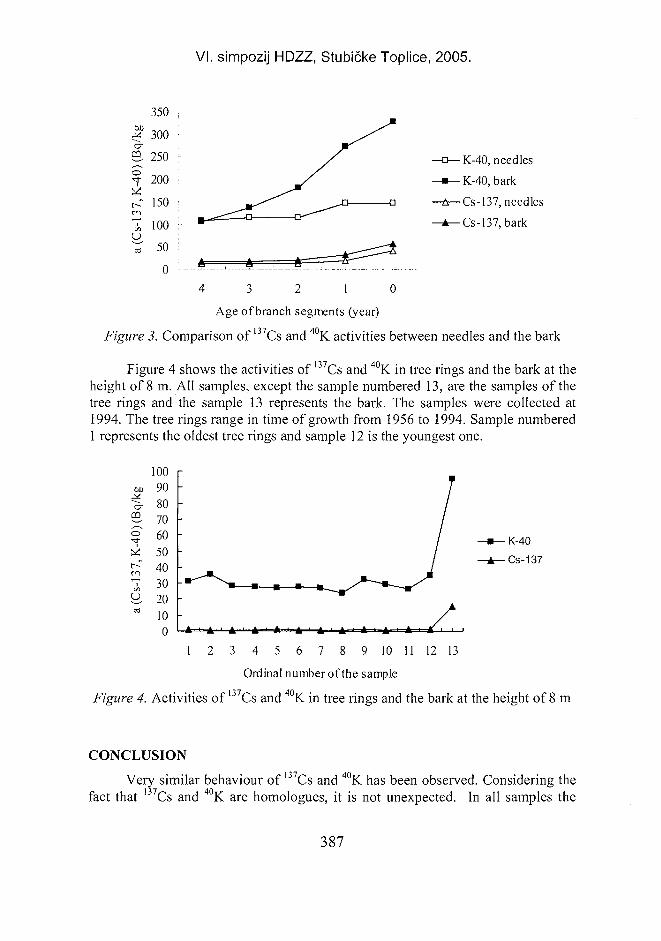
VI. simpozij HDZZ, Stubičke Toplice, 2005.
OD:-4
0)
i
u,a
350
300
250
200
150
100
50
0
Figure
-K-40, needles- K-40, bark-Cs-137, needles-Cs-137,bark
4 3 2 1 0
Age of branch segments (year)
3. Comparison of l37Cs and 40K activities between needles and the bark
Figure 4 shows the activities of 137Cs and 40K in tree rings and the bark at theheight of 8 m. All samples, except the sample numbered 13, are the samples of thetree rings and the sample 13 represents the bark. The samples were collected at1994. The tree rings range in time of growth from 1956 to 1994. Sample numbered1 represents the oldest tree rings and sample 12 is the youngest one.
-K-40
-Cs-137
1 2 3 4 5 6 7 8 9 10 11 12 13
Ordinal number of the sample
Figure 4. Activities of 137Cs and 40K in tree rings and the bark at the height of 8 m
CONCLUSION
Very similar behaviour of 137Cs and 40K has been observed. Considering thefact that 137Cs and 40K are homologues, it is not unexpected. In all samples the
387
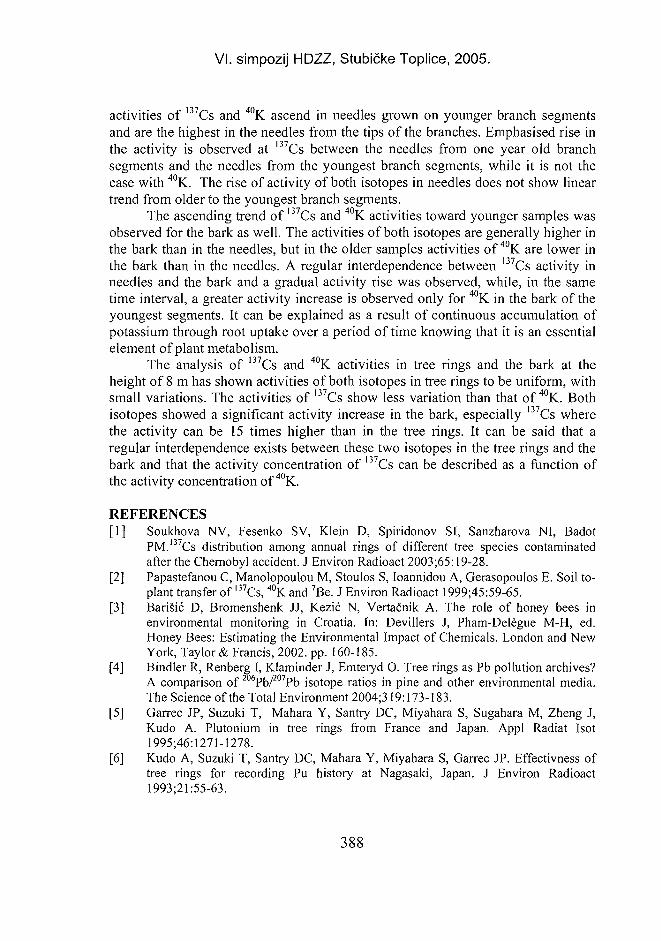
VI. simpozij HDZZ, Stubičke Toplice, 2005.
activities of 137Cs and 40K ascend in needles grown on younger branch segmentsand are the highest in the needles from the tips of the branches. Emphasised rise inthe activity is observed at l37Cs between the needles from one year old branchsegments and the needles from the youngest branch segments, while it is not thecase with 40K. The rise of activity of both isotopes in needles does not show lineartrend from older to the youngest branch segments.
The ascending trend of l37Cs and 40K activities toward younger samples wasobserved for the bark as well. The activities of both isotopes are generally higher inthe bark than in the needles, but in the older samples activities of 40K are lower inthe bark than in the needles. A regular interdependence between I37Cs activity inneedles and the bark and a gradual activity rise was observed, while, in the sametime interval, a greater activity increase is observed only for 40K in the bark of theyoungest segments. It can be explained as a result of continuous accumulation ofpotassium through root uptake over a period of time knowing that it is an essentialelement of plant metabolism.
The analysis of 137Cs and 40K activities in tree rings and the bark at theheight of 8 m has shown activities of both isotopes in tree rings to be uniform, withsmall variations. The activities of l37Cs show less variation than that of 40K. Bothisotopes showed a significant activity increase in the bark, especially 137Cs wherethe activity can be 15 times higher than in the tree rings. It can be said that aregular interdependence exists between these two isotopes in the tree rings and thebark and that the activity concentration of 137Cs can be described as a function ofthe activity concentration of 40K.
REFERENCES[1] Soukhova NV, Fesenko SV, Klein D, Spiridonov SI, Sanzharova NI, Badot
PM.'37Cs distribution among annual rings of different tree species contaminatedafter the Chernobyl accident. J Environ Radioact 2003;65:19-28.
[2] Papastefanou C, Manolopoulou M, Stoulos S, loannidou A, Gerasopoulos E. Soil to-plant transfer of IJ7Cs, 40K and 7Be. J Environ Radioact 1999;45:59-65.
[3] Barišić D, Bromenshenk JJ, Kezić N, Vertačnik A. The role of honey bees inenvironmental monitoring in Croatia. In: Devillers J, Pham-Delegue M-H, ed.Honey Bees: Estimating the Environmental Impact of Chemicals. London and NewYork, Taylor & Francis, 2002. pp. 160-185.
[4] Bindler R, Renberg I, Klaminder J, Emteryd O. Tree rings as Pb pollution archives?A comparison of 206Pb/207Pb isotope ratios in pine and other environmental media.The Science of the Total Environment 2004;319:173-183.
[5] Garrec JP, Suzuki T, Mahara Y, Santry DC, Miyahara S, Sugahara M, Zheng J,Kudo A. Plutonium in tree rings from France and Japan. Appl Radiat Isot1995;46:1271-1278.
[6] Kudo A, Suzuki T, Santry DC, Mahara Y, Miyahara S, Garrec JP. Effectivness oftree rings for recording Pu history at Nagasaki, Japan. J Environ Radioact1993;21:55-63.
388
VI. simpozij HDZZ, Stubičke Toplice, 2005.
[7] Kohno M, Koizumi Y, Okumura K, Mito I. Distribution of environmental Cesium-137 in tree rings. J Environ Radioact 1988;8:15-19.
[8] Bystrzejewska-Piotrowska G, Urban P. L. Accumulation and translocation ofcesium-137 in onion plants (Allium cepa). Environ Exp Bot2004;51:3-7.
[9] Sombre L, Vanhouche M, de Brouwer S, Ronneau C, Lambotte JM, Myttenaere C.Long-term radiocesium behaviour in spruce and oak forests. The Science of theTotal Environment 1994; 157:59-71.
[10] Haas G, Schupfner R, MuIIer A. Radionuclide uptake and long term behaviour ofCs-137, Cs-134 and K-40 in tree rings of spruce. J Radioanal Nucl Chem1995;194(2):277-282.
[11] Karunakara N, Somashekarappa HM, Narayana Y, Avadhani DN, Mahesh HM,Siddappa K. 226Ra, 40K and 7Be activity concentrations in plants in the environmentof Kaiga, India. J Environ Radioact 2003;65:255-266.
ABSTRACTThis study investigated and compared the distribution of 137Cs and 40K in
different parts of the fir (Abies alba). Samples consisted of needles removed frombranch sections of different age, of bark and of tree rings at the height of 8 m. Bothisotopes showed a very similar behaviour. The behaviour of l37Cs was more regularthan that of 40K. The activities of l37Cs and 40K were higher in needles grown onyounger branches and were the highest in needles from the tips of the branches.The distribution of I37Cs and 40K was compared between needles and the bark aswell as between tree rings and the bark. The ascending trend of both isotopeactivities in younger samples was observed for needles and the bark. A regularinterdependence between 137Cs activity in needles and the bark was also observed.In all tree rings 137Cs activities were even and with small variations. Compared tothe tree rings, the bark showed a great rise in 137Cs and 40K activities, which wasmore prominent for 137Cs than for 40K.
389
VI. simpozij HDZZ, Stubičke Toplice, HR0500083
TRANSFER FAKTORI 137Cs U LANCU TLO-LUCERKA
Nedžad Gradaščević, Lejla Saračević, Anto Mihalj i Davorin SamekVeterinarski fakultet, Univerzitet u Sarajevu, Zmaja od Bosne 90,
71000 Sarajevo, Bosna i Hercegovinae-mail: [email protected]
UVODMigracija radionuklida u lancu ishrane predstavlja proces od značaja za
procjenu akcidentalnih situacija kao i za izbor protumjera koje je u takvimsituacijama neophodno poduzeti. Shodno tome, transfer vještačkog radionuklidaradiocezija u lancu tlo-biljke bio je predmetom brojnih naučnih istraživanja tijekomposljednjih desetljeća dvadesetog stoljeća.Pregledom istraživanja transfera radiocezija iz tla u različite biljne vrste zapaža sevrlo visoka varijabilnost dobivenih rezultata [1]. Ova varijabilnost uzrokovana jebrojnim fizikalno-kemijskim osobinama tla kao što su veličina čestica tla, sadržajminerala gline, sadržaj organske materije, pH vrijednost tla, redoks potencijal tla,kapacitet kationske izmjene i prisutni elementi [2]. Prisustvo kalija u tlu značajnoutječe na migraciju i biološku iskoristljivost radiocezija iz tla te je stoga upotrebakalijevih fertilizera preporučena kao jedna od preventivnih mjera u cilju smanjenjanjegovog transfera u biljke [3].Također je važna i činjenica da različite biljne vrste pokazuju različit afinitet zasorpciju radiocezija iz tla. Ruski autori su utvrdili različitu sposobnost razlikovanjakemijski sličnih elemenata kalija i cezija kod različitih biljnih vrsta pa čak i kodrazličitih sorti unutar iste biljne vrste [4].Za istraživanje transfer faktora l37Cs iz tla u biljke i utjecaja kalija tla na procesvertikalne migracije l37Cs odabrana je lucerka kao biljna vrsta sa izrazitimafinitetom za sorpciju kalija iz tla. Pored toga, lucerka u visokom procentuučestvuje u sastavu ljetnog obroka goveda što u slučaju kontaminacije radiocezijemmože rezultirati visokim nivoima u dnevnom obroku i animalnim proizvodimagoveda.
390
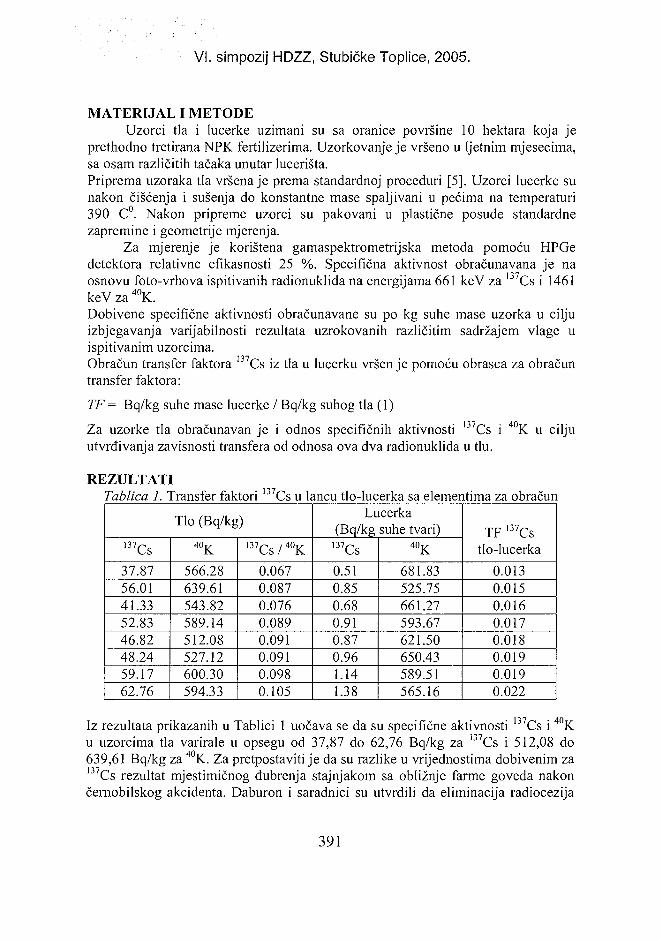
VI. simpozij HDZZ, Stubičke Toplice, 2005.
MATERUAL I METODEUzorci tla i lucerke uzimani su sa oranice površine 10 hektara koja je
prethodno tretirana NPK fertilizerima. Uzorkovanje je vršeno u ljetnim mjesecima,sa osam različitih tačaka unutar lucerišta.Priprema uzoraka tla vršena je prema standardnoj proceduri [5]. Uzorci lucerke sunakon čišćenja i sušenja do konstantne mase spaljivani u pećima na temperaturi390 C°. Nakon pripreme uzorci su pakovani u plastične posude standardnezapremine i geometrije mjerenja.
Za mjerenje je korištena gamaspektrometrijska metoda pomoću HPGedetektora relativne efikasnosti 25 %. Specifična aktivnost obračunavana je naosnovu foto-vrhova ispitivanih radionuklida na energijama 661 keV za l 3 7 Cs i 1461keV za 4 0 K.Dobivene specifične aktivnosti obračunavane su po kg suhe mase uzorka u ciljuizbjegavanja varijabilnosti rezultata uzrokovanih različitim sadržajem vlage uispitivanim uzorcima.Obračun transfer faktora 1 3 7Cs iz tla u lucerku vršenje pomoću obrasca za obračuntransfer faktora:
TF = Bq/kg suhe mase lucerke / Bq/kg suhog tla (1)
Za uzorke tla obračunavan je i odnos specifičnih aktivnosti 1 3 7Cs i 4 0 K u ciljuutvrđivanja zavisnosti transfera od odnosa ova dva radionuklida u tlu.
REZULTATITablica 1. Transfer faktori 1 3 7Cs u lancu tlo-lucerka sa elementima za obračun
Tlo (Bq/kg)
1 3 7Cs37.8756.0141.3352.8346.8248.2459.1762.76
4 0 K
566.28639.61543.82589.14512.08527.12600.30594.33
l 3 7 C s / 4 0 K0.0670.0870.0760.0890.0910.0910.0980.105
Lucerka(Bq/kg suhe tvari)
1 3 7Cs0.510.850.680.910.870.961.141.38
40K681.83525.75661.27593.67621.50650.43589.51565.16
TF 1 3 7Cstlo-lucerka
0.0130.0150.0160.0170.0180.0190.0190.022
Iz rezultata prikazanih u Tablici 1 uočava se da su specifične aktivnosti 1 3 7Cs i 4 0 Ku uzorcima tla varirale u opsegu od 37,87 do 62,76 Bq/kg za Cs i 512,08 do639,61 Bq/kg za 4 0K. Za pretpostaviti je da su razlike u vrijednostima dobivenim zal 3 7 Cs rezultat mjestimičnog đubrenja stajnjakom sa obližnje farme goveda nakončernobilskog akcidenta. Daburon i saradnici su utvrdili da eliminacija radiocezija
391
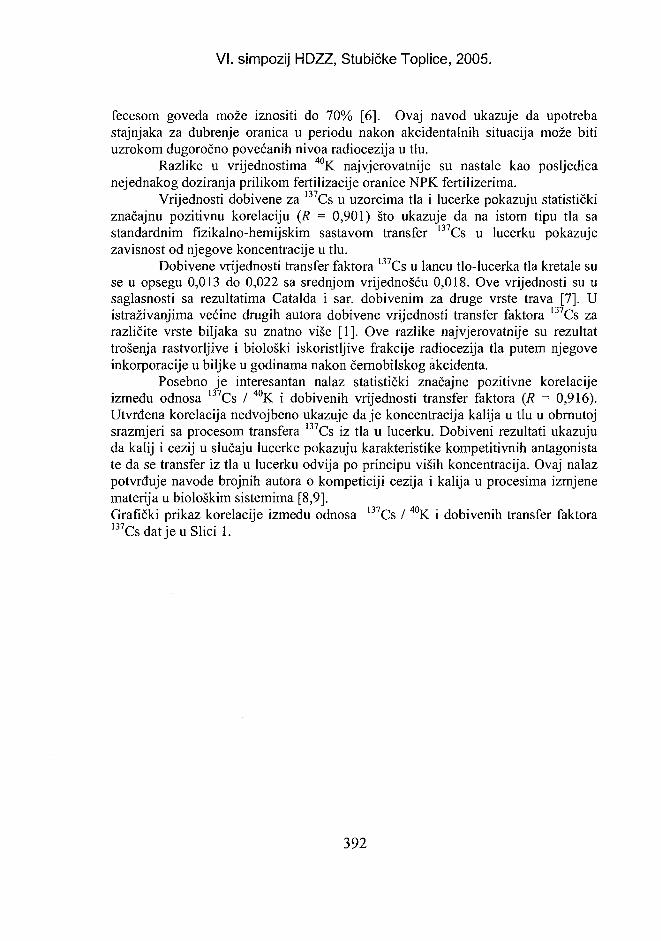
VI. simpozij HDZZ, Stubičke Toplice, 2005.
fecesom goveda može iznositi do 70% [6]. Ovaj navod ukazuje da upotrebastajnjaka za đubrenje oranica u periodu nakon akcidentalnih situacija može bitiuzrokom dugoročno povećanih nivoa radiocezija u tlu.
Razlike u vrijednostima 40K najvjerovatnije su nastale kao posljedicanejednakog doziranja prilikom fertilizacije oranice NPK fertilizerima.
Vrijednosti dobivene za 137Cs u uzorcima tla i lucerke pokazuju statističkiznačajnu pozitivnu korelaciju (R = 0,901) što ukazuje da na istom tipu tla sastandardnim fizikalno-hemijskim sastavom transfer 137Cs u lucerku pokazujezavisnost od njegove koncentracije u tlu.
Dobivene vrijednosti transfer faktora 137Cs u lancu tlo-lucerka tla kretale suse u opsegu 0,013 do 0,022 sa srednjom vrijednošću 0,018. Ove vrijednosti su usaglasnosti sa rezultatima Catalda i sar. dobivenim za druge vrste trava [7]. Uistraživanjima većine drugih autora dobivene vrijednosti transfer faktora l37Cs zarazličite vrste biljaka su znatno više [1]. Ove razlike najvjerovatnije su rezultattrošenja rastvorljive i biološki iskoristljive frakcije radiocezija tla putem njegoveinkorporacije u biljke u godinama nakon černobilskog akcidenta.
Posebno je interesantan nalaz statistički značajne pozitivne korelacijeizmeđu odnosa 137Cs / 40K i dobivenih vrijednosti transfer faktora (R = 0,916).Utvrđena korelacija nedvojbeno ukazuje da je koncentracija kalija u tlu u obrnutojsrazmjeri sa procesom transfera 137Cs iz tla u lucerku. Dobiveni rezultati ukazujuda kalij i cezij u slučaju lucerke pokazuju karakteristike kompetitivnih antagonistate da se transfer iz tla u lucerku odvija po principu viših koncentracija. Ovaj nalazpotvrđuje navode brojnih autora o kompeticiji cezija i kalija u procesima izmjenematerija u biološkim sistemima [8,9].Grafički prikaz korelacije između odnosa l37Cs / 40K i dobivenih transfer faktora1 3 7CsdatjeuSlici 1.
392
VI. simpozij HDZZ, Stubičke Toplice, 2005.
0,120 -,
0,100
0,080
0,060
0,040
0,020 -
0,000
CS-137/K-40 TFCs-137
Slika 1. Grafički prikaz korelacije između odnosa 137Cs / 40K i transfer faktora 137Csu lancu tlo-lucerka
ZAKLJUČCI1. Dobivene vrijednosti transfer faktora 137Cs u lancu tlo-lucerka kretale su se u
opsegu 0.013 do 0.022 sa srednjom vrijednošću 0.018.2. Transfer faktor 137Cs u lancu tlo-lucerka daje pozitivnu korelaciju s odnosom
1 3 7Cs/4 0K.3. 137Cs i 40K u lancu tlo-lucerka pokazuju karakteristike kompetitivnih
antagonista.4. Upotreba kalijevih fertilizera predstavlja pouzdanu zaštitnu mjeru u svrhu
redukcije vertikalne migracije l37Cs iz tla u biljke.
LITERATURA[1] Robertson DE, Cataldo DA, Napier BA, Krupka KM, Sasser LB. Literature Review
and Assessment of Plant and Animal Transfer Factors Used in PerformanceAssessment Modeling. PNNL-14321, Pacific Northwest Laboratory, Richland, WA.2003.
[2] Yamamoto Y. Soil-Borne Radionuclides, Radionuclides in the Food Chain 1988; 10:•• 120-132.
393
VI. simpozij HDZZ, Stubičke Toplice, 2005.
[3] Hove K, Strand P, Voigt G, Jones BEV, Howard BJ, Segal MG, Pollaris K, Pearce J.Countermeasures for Reducing Radioactive Contamination of Farm Animals andFarm Animal Products, The Science of the Total Environment, 1993. 261-271.
[4] Tikhomirov FA. Long- Lived man-made Radionuclides in the Soil-Plant System,Radionuclides in the Food Chain 1988., 12, 136-144
[5] International Atomic Energy Agency (IAEA). Measurement of Radionuclides inFood and the Environment - A Guidebook, Technical Reports, Series No: 295,1989.Vienna; IAEA, 1989.
[6] Daburon F, Fayart G, Tricaud Y. Caesium and Iodine Metabolism in LactatingCows Under Chronic Administration, The Science of the Total Environment, 85, SciTotal Environ 1989;85:253-261.
[7] Cataldo DA, Routson RC, Paine D, Garland TR. Reationships Between Propeties ofHanford Area Soils and the Availability of l34Cs and 85Sr for Uptake by Cheatgrassand Tumbleweed. PNL-2496 1978b, Pacific Northwest Laboratory, Richland, WA.
[8] Sanchez AL, Wright SM, Smolders E, Naylor C, Stevens PA, Kennedy VH, DoddBA, Singleton DL, Barnett CL. High Plant Uptake of Radiocesium from OrganicSoils Due to Cs Mobility and Low Soil K Content, Environ Sci Technol 1999;33:2752-2757.
[9] Smolders E, Van Den Brande K, Merckx R. Concentrations of 137Cs and K in SoilSolution Predict the plant Availability of l37Cs in Soils, Environ Sci Technol 1997:31:3432-3438.
TRANSFER FACTORS OF 137Cs IN CHAIN SOIL-ALFALFA
Nedžad Gradaščević, Lejla Saračević, Anto Mihalj and Davorin SamekVeterinary Faculty, University of Sarajevo
Zmaja od Bosne 90, 71 000 Sarajevo, Bosnia and Herzegovinae-mail: [email protected]
Transfer factors of artificial radionuclides are significant parameters for theassessment of accidental exposure as well as the basis for a model of evaluation ofenvironmental contamination in post-accidental period. Migration of radionuclidesfrom soil to plants as one of primary phases in food chain contamination isimportant for scientific research in terms of defining countermeasures to reducefood chain contamination in years following nuclear accident. This paper describestransfer factors of 137Cs in chain soil-lucerna (alfalfa) obtained at a ploughed fieldtreated with mineral fertilisers. Obtained transfer factors for l37Cs ranged between0.01 and 0.02 and showed dependence of potassium content in soil.
394
VI. simpozij HDZZ, Stubičke Topli« HR0500084
MED KAO BIOINDIKATOR KONTAMINACIJE OKOLIŠACEZIJEM
Delko Barišić', Ivanka Lovrenčić'', Višnja Oreščanin', Nikola Kezić2,Dragan Bubalo2, Marina Popijač3 i Malija Volner4
'institut "Ruđer Bošković", Bijenička c. 54, 10000 Zagreb2Agronomski fakultet Sveučilišta u Zagrebu, Svetošimunska C. 25, 10000 Zagreb
3Hrvatske šume d.o.o., Vukotinovićeva 2, 10000 Zagreb4Nacionalni park Plitvička jezera, Mukinje P7, 53231 Plitvička jezera
e-mail: [email protected]
UVODPodručje Republike Hrvatske je ranih šezdesetih godina prošlog stoljeća kao
i tijekom akcidenta u Černobilu 1986. godine kontaminirano procesima suhog imokrog taloženja iz atmosfere, među inima, i radioaktivnim izotopom cezija - 137Cs[1-2]. Deponirani cezij se tijekom vremena sorbira na čestice tala, a dijelompenetrira u dublje slojeve [3], te dospijeva u zone u kojima su razvijeni korijenisustavi bilja. Poput ostalih biogenih elemenata uključujući i homologni kalij, cezijse preko korijenog sustava ugrađuje u biljke ("uptake") ovisno o brojnim faktorima[4-8]. Stoga je moguće, prateći aktivnost l37Cs u pojedinim biljnim vrstama koje subioindikatori u pogledu cezija, zaključivati o kontaminaciji danog područja. Pritome valja naglasiti da se uvijek, radilo se to o uzorcima tala ili biljnog materijala,radi o točkasto uzetim uzorcima.
S druge pak strane, u potrazi za hranom pčele pokrivaju područje do nekih50 km2, od toga relativno dobro područje približno oblika kruga od nekih 15 do 20km2 s pčelinjakom u sredini. Pčele u prosječnoj pčelinjoj zajednici od nekolikodesetaka tisuća pčela radilica, dnevno poduzmu stotinjak tisuća letova u potrazi zanektarom i peludom. Da bi popunila medni mjehur, pčela posjeti između 80 i 150pojedinačnih cvjetova [9] pri čemu je za proizvodnju jednog kilograma medapotreban sadržaj 100 - 150 tisuća mednih mjehura [10]. Stoga med kojeg pčeleprikupe u košnici predstavlja slučajni uzorak sakupljen sa nekoliko desetakamilijuna točaka raspršenih na prostoru od dvadesetak kvadratnih kilometara. Posvemu sudeći uzorak meda vjerojatno je njabolji kompozitni slučajni uzorak te kaotakav sadržava najreprezentativnije vrijednosti prosječnih koncentracijabiodostupnih elemenata u promatranom segmentu okoliša. Istraživanja aktivnosti137Cs u različitim tipovima meda provedena su u cilju ocjene bioindikatorskihosobina pojedinih tipova meda u praćenju stanja okoliša kontaminiranog cezij em.
395
VI. simpozij HDZZ, Stubičke Toplice, 2005.
MATERIJALI I METODEUzorci meda su sakupljani na području Republike Hrvatske u periodu od
2000. do 2003. godine mehanički tijekom vrcanja meda iz košnica. Tipovi meda(različite vrste nektarnih medova, medljikovaca i miješani tipovi) su određeni natemelju standardnih analiza polenovih zrnaca [11] i mjerenja elektrovodljivosti[12] instrumentom HI 8733 (Hanna Instruments). Kod medljikovaca su izdvojeničisti jelovi i/ili smrekovi medljikovci kao i miješani medljikovci. U čistimmedljikovcima nije ustanovljeno prisustvo polenovih zrnaca, a elektrovodljivostmeda je bila veća od 1,0 mScm"1. Kod mješanih se je medljikovacaelektrovodljivost kretala u rasponu od 0,7 - 1,0 mScm"1, a u uzorcima je redovitoustanovljeno prisustvo polenovih zrnaca. Tipovi nektarnog meda (elektrovodljivostmanja od 0,7 mScm"') određeni su na temelju analize polenovih zrnaca pri čemu jeuziman standardni uzorak od 300 polenovih zrnaca.
Aktivnosti 40K i l37Cs određene su gamaspektrometrijskom metodombrojenjem na HPGe detektoru «Canberra» povezanim s 8192 kanalnimanalizatorom. Spektri su sakupljani 80 000 sekundi, a analizirani su pomoću Genie2K software-a. Za određivanje aktivnosti 40K korištenje foto vrh na 1460,75 keV-a, a za određivanje 137Cs foto vrh na 661,6 keV-a. Sve izmjerene aktivnosti 137Cspreračunate su na 01. srpnja 2003. godine.
REZULTATIRezultati mjerenja aktivnosti 40K i l37Cs u izdvojenim tipovima meda
prikazani su u Tablici 1. Petnaestak i više godina nakon akcidenta u Černobilu jošje uvijek moguće pratiti aktivnost 137Cs u nekim tipovima meda. To se prije svegaodnosi na crnogorične medij ikovce i kestenov med, pogotovo u slučaju kada sumedovi čisti (Tablica 1). U miješanim crnogoričnim medljikovcima i miješanimmedovima od kestena aktivnosti 137Cs su približno upola manje. Interesantno jeprimjetiti kako je u svim uzorcima miješanog lipovog meda detektiran cezij zarazliku od čistog lipovog meda u kojem cezij nije niti u jednom slučaju detektiran.U livadnim tipovima meda, kako čistim tako i miješanim, 137Cs je detektiran svegau nekoliko slučajeva, a u bagremovom medu niti u jednom uzorku.
396
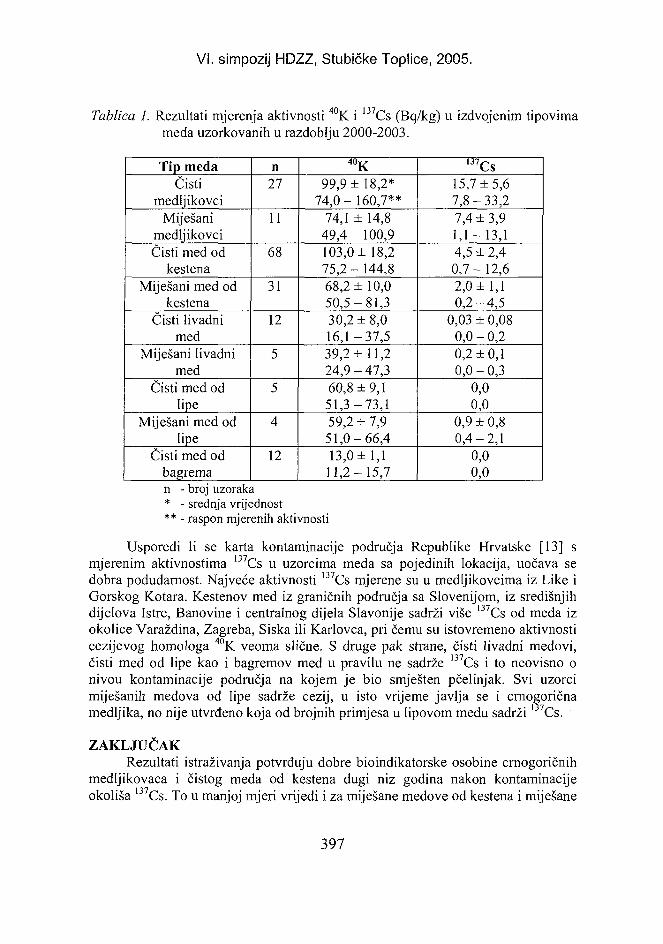
VI. simpozij HDZZ, Stubičke Toplice, 2005.
Tablica 1. Rezultati mjerenja aktivnosti 40K i 137Cs (Bq/kg) u izdvojenim tipovimameda uzorkovanih u razdoblju 2000-2003.
Tip medaCisti
medij ikovciMiješam
medljikovciCisti med od
kestenaMiješani med od
kestenaCisti livadni
medMiješani livadni
medCisti med od
lipeMiješani med od
lipeČisti med od
bagrema
n27
11
68
31
12
5
5
4
12
4 0K99,9 ± 18,2*
74,0-160,7**74,1 ± 14,8
49,4-100,9103,0 ±18,275,2- 144,868,2 ± 10,050,5-81,330,2 ±8,016,1-37,539,2 ± 11,224,9 - 47,360,8 ±9,151,3-73,159,2 ± 7,951,0-66,413,0 ± 1,111,2-15,7
I 3 7Cs15,7 ±5,67,8-33,27,4 ±3,91,1-13,14,5 ± 2,40,7-12,62 , 0 ± l , l0,2-4,5
0,03 ± 0,080,0 - 0,20,2 ±0,10,0 - 0,3
0,00,0
0,9 ± 0,80,4-2,1
0,00,0
n - broj uzoraka* - srednja vrijednost** - raspon mjerenih aktivnosti
Usporedi li se karta kontaminacije područja Republike Hrvatske [13] smjerenim aktivnostima 137Cs u uzorcima meda sa pojedinih lokacija, uočava sedobra podudarnost. Najveće aktivnosti 137Cs mjerene su u medijikovcima iz Like iGorskog Kotara. Kestenov med iz graničnih područja sa Slovenijom, iz središnjihdijelova Istre, Banovine i centralnog dijela Slavonije sadrži više 137Cs od meda izokolice Varaždina, Zagreba, Siska ili Karlovca, pri čemu su istovremeno aktivnosticezijevog homologa 40K veoma slične. S druge pak strane, čisti livadni medovi,čisti med od lipe kao i bagremov med u pravilu ne sadrže l37Cs i to neovisno onivou kontaminacije područja na kojem je bio smješten pčelinjak. Svi uzorcimiješanih medova od lipe sadrže cezij, u isto vrijeme javlja se i crnogoričnamedljika, no nije utvrđeno koja od brojnih primjesa u Iipovom medu sadrži l37Cs.
ZAKLJUČAKRezultati istraživanja potvrđuju dobre bioindikatorske osobine crnogoričnih
medljikovaca i čistog meda od kestena dugi niz godina nakon kontaminacijeokoliša l37Cs. To u manjoj mjeri vrijedi i za miješane medove od kestena i miješane
397
VI. simpozij HDZZ, Stubičke Toplice, 2005.
medljikovce. Čisti livadni medovi kao i čisti lipov odnosno bagremov medpetnaestak ili više godina nakon kontaminacije u sebi više ne sadržavaju l 3 7Cs. Zarazliku od cezijevog homologa 4 0K čije su aktivnosti u pojedinim analiziranimtipovima meda sa različitih lokaliteta međusobno slične, aktivnosti 1 3 7Cs u meduodražavaju nivo kontaminacije na odgovarajućim područjima.
LITERATURA[I] Barišić D, Lulić S. The contamination of ground surface layer in Republic Croatia as
the consequence of Chernobyl accident. Proc. Int. Symp. Post-Chernobyl Environ.Radioac. Stud, in East European Countries, Kazimierz, Poland, 1990; 20-25.
[2] Barišić D, Lulić S, Vertačnik A. "Pred-Černobilski" l 37Cs na području RepublikeHrvatske u tlu do dubine 262.5 mm. Zbornik radova XVI Simpozija Jugoslavenskogdruštva za zaštitu od zračenja, Neum, 1991; 15-18.
[3] Barišić D, Vertačnik A, Lulić S. Caesium contamination and vertical distribution inundisturbed soils in Croatia. J Environ Radioact 1999;46:361 -374.
[4] Livens FR, Horrill AD, Singleton DL. Distribution of radio-cesium in the soil-plantsystem of upland areas of Europe. Health Phys 1991 ;60:539-545.
[5] Shenber MA, Eriksson A. Sorption behaviour of caesium in various soils. J EnvironRadioact. 1993;19:41-51.
[6] Hird AB, Rimmer DL, Livens FR. Total caesium-fixing potentials of acid organicsoils. J Environ Radioact. 1995;26:103-118.
[7] Gerzabek MH, Mohamad SA, Muck K. Cesium-137 in soil texture fractions and itsimpact on cesium-137 soil-to-plant transfer. Commun Soil Sci Plant Anal1992:23:321-330.
[8] Bilo M, Steffens W, Fuhr F, Pfeffer KH. Uptake of l 3 4 / l 3 7Cs in soil by cereals as afunction of several soil parameters of three soil types in Upper Swabia and NortRhine-Westphalia (FRG). J Environ Radioact 1993;19:496-511.
[9] Free J.B. Insect Pollination of Crops. Academic Press, London, UK, 1993; p. 684.[10] Tomašec I. Biologija pčela. Naknadni zavod Hrvatske, Zagreb, 1949, p. 94.[II] Louveaux J, Mauruzio A, Vorwohl G. Methods of melissopaly-nology. Bee World
1978;59:139-157.[12] Vorwohl G. Messung der elektrischen Leitfahigkeit des Honigs und der Verwendung
der Messwerte zur Sortendiagnose und zum Nachweis von Verfalschungen mitZuckerfiitterungshonig. Z Bienenforsch 1964;7: 37-47.
[13] Barišić D, Bromenshenk JJ, Kezić N, Vertačnik A. The role of honey bees inenvironmental monitoring in Croatia. (160-185) In: Honey Bees: Estimating theEnvironmental Impact of Chemicals. Devillers J. & Pham-Delegue M.H. (eds),Taylor & Francis, London and New York, 2002, pp. 160-185.
398
VI. simpozij HDZZ, Stubičke Toplice, 2005.
HONEY AS A BIOINDICATOR OF ENVIRONMENTCONTAMINATION WITH CAESIUM
Delko Barišić1, Ivanka Lovrenčlć1, Višnja Oreščanin', Nikola Kezić2,Dragan Bubalo2, Marina Popijač3 and Matija Volner4
'Ruđer Bošković Institute, Bijenička c. 54,2Faculty of Agriculture, University of Zagreb, Svetošimunska c. 25,
3Hrvatske šume d.o.o., Vukotinovićeva 2,HR-10000 Zagreb, Croatia
4ZSC "Ivo Pevalek", HR-53231 Plitvička jezera, Croatiae-mail: [email protected]
Collecting nectar and pollen, bees cover area of approximately 20 km2.Honey from a beehive represents a composite sample collected from severalhundreds of millions of points and is probably one of the most representativerandom samples possible to collect in the environment. Therefore, informationcontained in honey gives good reflection of an average environment conditionconsidering bioavailable elements and/or chemical compounds. Results ofmeasured l37Cs activities in different types of honey collected on the area ofRepublic of Croatia in period from 2000 to 2003 are given in this paper. Theactivity of 137Cs is measured with gammaspectrometric method and the types ofhoney are defined on the basis of pollen analysis and from measuringelectroconductivity. More than 15 years after the accident in Chernobyl, it is stillpossible to monitor I37Cs activity in several types of honey. The greatest l37Csactivities are detected in pure fir-tree and spruce honey-dew honey (15.7 ± 5.6Bq/kg), mixed honey containing honey-dew (7.4 ± 3.9 Bq/kg) and in pure chestnuthoney (4.5 ±2.4 Bq/kg). On the other side, 137Cs has not been found in any of thesamples of pure lime- and locust-tree honeys, while in the meadow honey it hasbeen detected only twice. Considering that measured activities of 137Cs in honeycorrespond with the levels of contamination of particular areas, coniferous honey-dew honeys, as well as pure chestnut honey, can be used as bioindicators inmonitoring the environment contaminated with 137Cs.
399
VI. simpozij HDZZ, Stubičke Toplice HR0500085
PRAĆENJE RADIOAKTIVNOSTI NA PLINSKOM POLJUMOLVE
Jadranka Kovač, Gordana Marović and Jasminka SenčarInstitut za medicinska istraživanja i medicinu rada, Ksaverska c. 2, 10000 Zagreb
e-mail: [email protected]
UVODPrirodni plin je, uz ugljen, jedini primarni oblik energije koji se može
izravno upotrijebiti, izgara većom iskoristivosti od drugih goriva, te stoga vrlo brzoraste njegova upotreba u kućanstvima, za proizvodnju toplinske i električneenergije, a koristi se i kao sirovina u kemijskoj industriji.
Prirodni plin je plinska smjesa različitih ugljikovodika od kojih je najvećiudio (veći od 90%) metana. U manjim količinama prisutni su ostali ugljikovodici,ugljični dioksid i dušik, te određena količina radioaktivnih elemenata. Zbogsigurnosti rada samih procesnih postrojenja, kao i radi zadovoljenja kvaliteteizlaznog proizvoda, potrebno je te primjese izdvojiti i zbrinuti bez štetnog utjecajana zdravlje ljudi i na okoliš.
U našim krajevima prirodni plin otkrivenje 1917. godine u Bujavici, stojepratilo izgradnju mreže magistralnih plinovoda na cijelom sjeverno-istočnomteritoriju Hrvatske, do današnje ukupne duljine od oko 2000 km. Današnjomeksploatacijom prirodnog plina zadovoljava se gotovo jedna trećina ukupneprimarne energije Republike Hrvatske.
Prirodni plin iz proizvodnih bušotina ležišta "duboke Podravine", preko 6plinskih stanica, zatvorenim sabirno-transportnim sustavom doprema se na obraduu centralnu plinsku stanicu Molve. Štetne primjese izdvajaju se i zbrinjavaju da bise izbjegao štetan utjecaj na zdravlje ljudi i okoliš.
Već niz godina suradnici Jedinice za zaštitu od zračenja Instituta zamedicinska istraživanja i medicinu rada iz Zagreba provode mjerenjaradioaktivnost na plinskom polju Molve, u sklopu projekta "Monitoring okolišaCPS Molve" [1-4]. U ovom radu je prikazan dio tih istraživanja, posebno suobuhvaćena mjerenja provedena tijekom 2003. i 2004. godine.
MATERIJAL I METODEMetode mjerenja radioaktivnosti kao i lokacije mjerenja odabrane su
suradnjom suradnika Jedinice za zaštitu od zračenja Instituta za medicinskaistraživanja i medicinu rada i stručnjaka iz "Naftaplina" u Zagrebu i Zavoda zajavno zdravstvo Koprivničko-Križevačke županije. Lokacije su bile: centralnaplinska stanica (CPS), aktivna plinska bušotina (M-9) i zatvorena plinska bušotina(M-10). Metode mjerenja koje se provode na terenu obuhvaćaju in-situgamaspektrometrijska mjerenja, neprekidno mjerenje ekspozicijske doze zračenja
400
VI. simpozij HDZZ, Stubičke Toplice, 2005.
TL dozimetrima, neprekidno mjerenje brzine ekspozicijske doze zračenjaelektronskim dozimetrima "ALARA", kao i trenutna mjerenja brzine dozeterenskim brojačem brzine doze.
In-situ gamaspektrometrijska mjerenja provedena su pomoću poluvodičkogdetektora (HPGe), višekanalnog analizatora (16k kanala) i pripadajućegelektroničkog sklopa s računalom. Karakteristike HPGe detektora su: rezolucija na1,33 MeV 60Co je 1,75 keV; relativna efikasnost na 1,33 MeV 60Co iznosi 21%.Dužina mjerenja iznosila je 1000 sekundi. Mjerenja su provedena prilikom ljetnogobilaska, na sve tri lokacije.
Neprekidno mjerenje ekspozicijske doze zračenja provedeno jetermoluminiscentnim dozimetrima (TLD) proizvodnje Victoreen, tip "Hot PressChit" (CaF2:Mn), koji su očitavani na čitaču Victoreen 2810. TLD-i su biliizloženi od listopada 2002. godine do srpnja 2004. godine.
Neprekidno mjerenje brzine ekspozicijske doze zračenja elektronskimdigitalnim dozimetrima "ALARA" provedeno je na lokacijama bušotina M-9 i M-10 tijekom 2003. i 2004. godine po mjesec dana u zimskom i ljetnom periodu..Uzto, jedan je dozimetar bio uz terensku ekipu od odlaska na teren, tijekomprovođenja mjerenja na lokacijama plinskih bušotina i do povratka u IMI. Svipohranjeni podaci iščitani su računalnim programom koji izračunava vrijednostibrzina apsorbiranih doza.
Trenutna mjerenja brzine doze gama zračenja provedena su terenskimbrojačem brzine doze uzastopnim jednokratnim mjerenjima na pet točaka na svakojlokaciji.
REZULTATIIz in-situ gamaspektrometrijskih spektara izračunate su koncentracije
prirodnih radionuklida u tlu, uz pretpostavku njihove jednolike raspodjele u tlu.Izračunati su doprinosi apsorbiranoj dozi nađenih radionuklida iz pojedinogprirodnog radioaktivnog niza, kao i prirodnog kalija. Kako je ustanovljen i l37Cs, zaizračun njegovog doprinosa apsorbiranoj dozi, pretpostavila se površinskaraspodjela uz eksponencijalnu penetraciju u dubinu tla. Na Slici 1 prikazani suizračunati doprinosi brzini apsorbirane doze prirodnih radionuklida i 137Cs ,usrednjeno za svaku lokaciju iz nekoliko mjerenja.
401
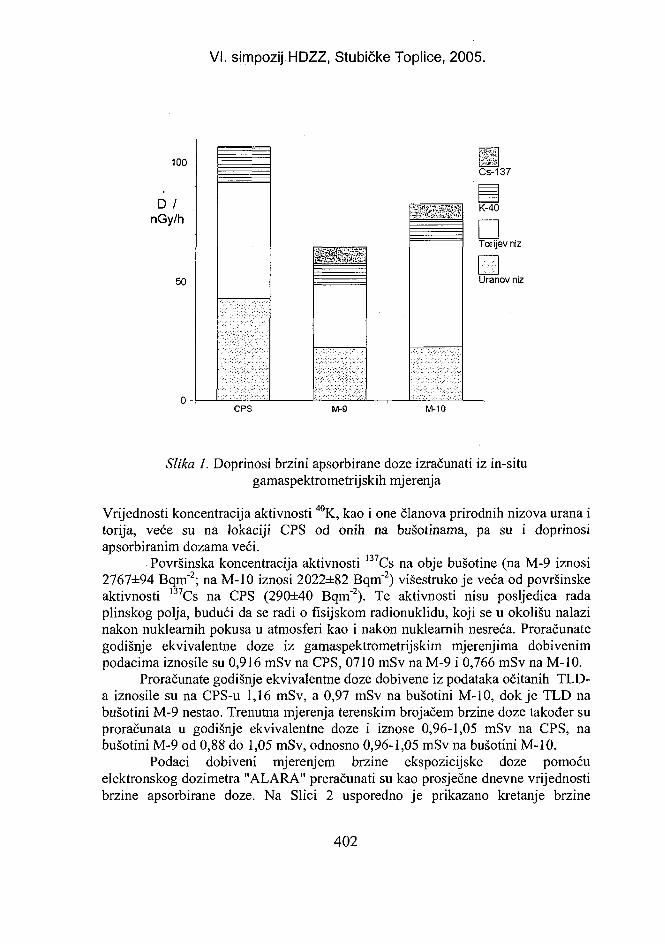
VI. simpozij HDZZ, Stubičke Toplice, 2005.
100
D /nGy/h
50
mCs-137
K-40
Torijev niz
Uranov niz
CPS M-9 M-10
Slika 1. Doprinosi brzini apsorbirane doze izračunati iz in-situgamaspektrometrijskih mjerenja
Vrijednosti koncentracija aktivnosti 40K, kao i one članova prirodnih nizova urana itorija, veće su na lokaciji CPS od onih na bušotinama, pa su i doprinosiapsorbiranim dozama veći.
Površinska koncentracija aktivnosti )37Cs na obje bušotine (na M-9 iznosi2767±94 Bqm"2; na M-10 iznosi 2022±82 Bqm~2) višestruko je veća od površinskeaktivnosti 137Cs na CPS (290±40 Bqm"2). Te aktivnosti nisu posljedica radaplinskog polja, budući da se radi o fisijskom radionuklidu, koji se u okolišu nalazinakon nuklearnih pokusa u atmosferi kao i nakon nuklearnih nesreća. Proračunategodišnje ekvivalentne doze iz gamaspektrometrijskim mjerenjima dobivenimpodacima iznosile su 0,916 mSv na CPS, 0710 mSv na M-9 i 0,766 mSv na M-10.
Proračunate godišnje ekvivalentne doze dobivene iz podataka očitanih TLD-a iznosile su na CPS-u 1,16 mSv, a 0,97 mSv na bušotini M-10, dok je TLD nabušotini M-9 nestao. Trenutna mjerenja terenskim brojačem brzine doze također suproračunata u godišnje ekvivalentne doze i iznose 0,96-1,05 mSv na CPS, nabušotini M-9 od 0,88 do 1,05 mSv, odnosno 0,96-1,05 mSv na bušotini M-10.
Podaci dobiveni mjerenjem brzine ekspozicijske doze pomoćuelektronskog dozimetra "ALARA" preračunati su kao prosječne dnevne vrijednostibrzine apsorbirane doze. Na Slici 2 usporedno je prikazano kretanje brzine
402
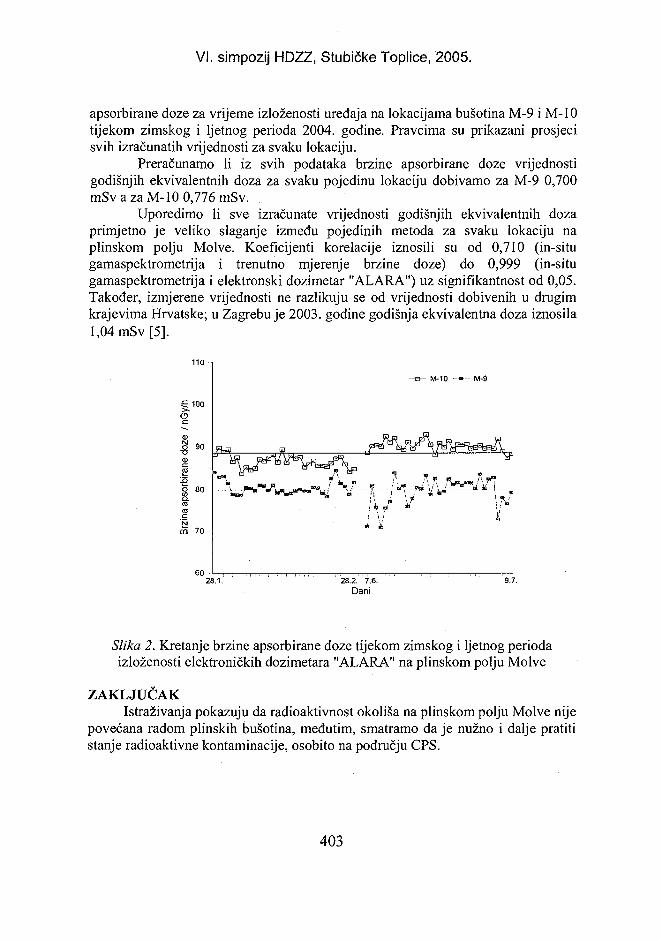
VI. simpozij HDZZ, Stubičke Toplice, 2005.
apsorbirane doze za vrijeme izloženosti uređaja na lokacijama bušotina M-9 i M-10tijekom zimskog i ljetnog perioda 2004. godine. Pravcima su prikazani prosjecisvih izračunatih vrijednosti za svaku lokaciju.
Preračunamo li iz svih podataka brzine apsorbirane doze vrijednostigodišnjih ekvivalentnih doza za svaku pojedinu lokaciju dobivamo za M-9 0,700mSvazaM-10 0,776mSv.
Uporedimo li sve izračunate vrijednosti godišnjih ekvivalentnih dozaprimjetno je veliko slaganje između pojedinih metoda za svaku lokaciju naplinskom polju Molve. Koeficijenti korelacije iznosili su od 0,710 (in-situgamaspektrometrija i trenutno mjerenje brzine doze) do 0,999 (in-situgamaspektrometrija i elektronski dozimetar "ALARA") uz signifikantnost od 0,05.Također, izmjerene vrijednosti ne razlikuju se od vrijednosti dobivenih u drugimkrajevima Hrvatske; u Zagrebu je 2003. godine godišnja ekvivalentna doza iznosila1,04 mSv [5].
^ 1 0 0
90
i
70
60
• M-10 - » _ M-9
26.2. 7.6.Dani
9.7.
Slika 2. Kretanje brzine apsorbirane doze tijekom zimskog i ljetnog periodaizloženosti elektroničkih dozimetara "ALARA" na plinskom polju Molve
ZAKLJUČAKIstraživanja pokazuju da radioaktivnost okoliša na plinskom polju Molve nije
povećana radom plinskih bušotina, međutim, smatramo da je nužno i dalje pratitistanje radioaktivne kontaminacije, osobito na području CPS.
403
VI. simpozij HDZZ, Stubičke Toplice, 2005.
LITERATURA[1] Monitoring okoliša CPS Molve: 2003.-2004. godina. Zavod za javno zdravstvo
Koprivničko-Križevačke županije. Sumarna izvješća, Koprivnica, listopad 2004.[2] IMI-P-199. Rezultati mjerenja radioaktivnosti plinskog polja Molve. Izvještaj za
2004. godinu. Zagreb, 2004.[3] IMI-P-188. Rezultati mjerenja radioaktivnosti plinskog polja Molve. Izvještaj za
2002. i 2003. godinu. Zagreb, 2003.[4] IMI-P-180. Rezultati mjerenja radioaktivnosti plinskog polja Molve. Izvještaj za
2000. godinu. Zagreb, 2001.[5] IMI-CRZ-79. Praćenje stanja radioaktivnosti životne sredine u Republici Hrvatskoj.
Izvještaj za 2003. godinu. Zagreb, 2004.
RADIATION MONITORING AT NATURAL GAS FIELDMOLVE
Jadranka Kovač, Gordana Marović and Jasminka SenčarInstitute for Medical Research and Occupational Health
Ksaverska c. 2 HR-10000 Zagreb, Croatiae-mail: [email protected]
Natural gas is an extremely important source of energy, especially inCroatia, where its use exceeds other sources by one third. Natural gas is composedprimarily of methane, but it also contains small amounts of radioactive elements.The process of getting natural gas from underground wells to the end users has thepotential of being environmentally destructive, and could cause harmful effects onpopulation living near. This study was carried out by the Radiation Protection Unitof Institute for Medical Research from Zagreb on a natural gas field at Molve, as apart of monitoring program "Monitoring okoliša CPS Molve (MolveEnvironmental Monitoring)". The purpose of this paper was to compare differentradioactivity measuring techniques and population exposure to ionising radiation.
404
VI. simpozij HDZZ, Stubičke Toplice, HR0500086
RASPODJELA IZOTOPNOG SASTAVA VODIKA, KISIKA IUGLJIKA U ATMOSFERI HRVATSKE I SLOVENIJE
Ines Krajcar Bronić', Polona Vreča2, Nada Horvatinčić', Nives Ogrinc2,Jadranka Barešić', Bogomil Obelić' i Tjaša Kanduč2
'institut "Ruđer Bošković", Bijenička c. 54, 10000 Zagreb, Hrvatska2Institut Jožef Stefan, Jamova 39, 1000 Ljubljana, Slovenija
e-mail: [email protected]
UVODCiklusi vode i ugljika u prirodi mogu se proučavati praćenjem izotopnog
sastava molekule vode, odnosno atmosferskog CO2, što uključuje praćenjeradioaktivnog izotopa 3H i stabilnih izotopa 2H i 18O u oborinama, te izotopaugljika (MC i !3C) u atmosferskom CO2. Na dosadašnjim simpozijima HDZZ-apredstavili smo neke naše rezultate [1-4], a u ovom su radu prikazani rezultatipraćenja izotopnog sastava atmosfere na području Hrvatske i Slovenije tijekomposljednjih nekoliko godina (2000-2004), te su uspoređeni sa starijim rezultatima[5].
UZORKOVANJE I MJERENJEMjesečni uzorci oborine u Zagrebu i Ljubljani sakupljaju se redovno od
1976., odnosno 1981. godine. Postaje su uključene u međunarodnu mrežu zapraćenje izotopnog sastava oborina, Global Network for Isotopes in Precipitation(GNIP) koju su organizirale Međunarodna agencija za atomsku energiju (IAEA) iSvjetska meteorološka organizacija (WM0) [6]. U razdoblju 2000-2003 mrežapostaja je proširena na jadransku obalu [7,8]. Mjesečni uzorci atmosferskog CO2
sakupljaju se u Zagrebu i na Plitvičkim jezerima. Mjerenja aktivnosti radioaktivnihizotopa 3H i I4C odvijaju se na Institutu "Ruđer Bošković" u Zagrebu, a stabilnihizotopa 2H, I3C i i 8O na Institutu Jožef Stefan u Ljubljani.
REZULTATIAktivnosti tricija u mjesečnim oborinama (Slika 1) pokazuje sezonske
varijacije tipične za sjevernu Zemljinu polutku na kontinentalnim postajamaZagreb i Ljubljana, te na sjevernojadranskim postajama Portorož, Kozina iMalinska. Aktivnost 3H je najviša u rano ljeto (oko 2,1 Bq/L), a najniža zimi.Sezonske varijacije su u razdoblju 1976-1990 [2,3,5] bile znatno izraženije, aprosječna godišnja aktivnost 3H u oborinama je stalno opadala nakon 1963. godine,kad je aktivnost 3H u atmosferi bila najviša [6]. Tijekom posljednjih desetak godinaprosječne godišnje aktivnosti iznose oko 1 Bq/L. Srednje- i južnojadranske postaje(Zadar, Komiža, Dubrovnik), kao i planinska postaja Zavižan pokazuju slabije
405
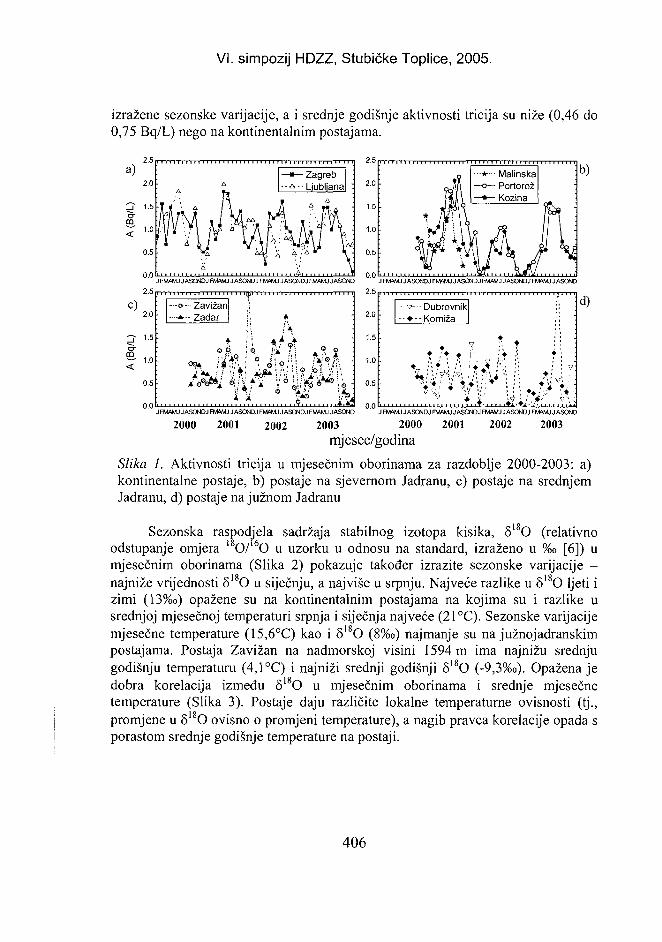
VI. simpozij HDZZ, Stubičke Toplice, 2005.
izražene sezonske varijacije, a i srednje godišnje aktivnosti tricija su niže (0,46 do0,75 Bq/L) nego na kontinentalnim postajama.
a)2.0
1.b
1.0
0.5
on
hhnf\l\ I M F**
:. 1
• Zagreb•-&-• Ljubljana
A
• • • i >
2.5
2.0
1.5
1.0
0.5
nn ti *
•-•*••• M a l i n s k a
—o— Portorož—•— Kozina
\A /^^....A^ :
b)
JFM«MJJASONOJFWAMJJASO«JFMIiMJJASCNDJfMnMJJASOND J FMAMJ JASCNDJ FM«MJ JASONDJFM0MJJASONDJFM0MJ JASOND
2.5 .ni,,, „„„inu,, ni 2.5
c) -•- Dubrovnik-••- Komiža
» 7 ? t
d)
J FMAMJ JASONDJ FI*MJ JASONOJ FM«MJ JASONDJ R*MJ JASOND JFHOMJJASCNDJFMiMJJASCNDJFMnMJJASCNDjnBUMJJASOND
2000 2001 2002 2003 2000mjesec/godina
2001 2002 2003
Slika 1. Aktivnosti tricija u mjesečnim oborinama za razdoblje 2000-2003: a)kontinentalne postaje, b) postaje na sjevernom Jadranu, c) postaje na srednjemJadranu, d) postaje na južnom Jadranu
Sezonska raspodjela sadržaja stabilnog izotopa kisika, 818O (relativnoodstupanje omjera 18O/16O u uzorku u odnosu na standard, izraženo u %o [6]) umjesečnim oborinama (Slika 2) pokazuje također izrazite sezonske varijacije -najniže vrijednosti 5I8O u siječnju, a najviše u srpnju. Najveće razlike u 8I8O ljeti izimi (13%o) opažene su na kontinentalnim postajama na kojima su i razlike usrednjoj mjesečnoj temperaturi srpnja i siječnja najveće (21°C). Sezonske varijacijemjesečne temperature (15,6°C) kao i §'8O (8%o) najmanje su na južnojadranskimpostajama. Postaja Zavižan na nadmorskoj visini 1594 m ima najnižu srednjugodišnju temperaturu (4,1°C) i najniži srednji godišnji 518O (-9,3%o). Opažena jedobra korelacija između 518O u mjesečnim oborinama i srednje mjesečnetemperature (Slika 3). Postaje daju različite lokalne temperaturne ovisnosti (tj.,promjene u 818O ovisno o promjeni temperature), a nagib pravca korelacije opada sporastom srednje godišnje temperature na postaji.
406
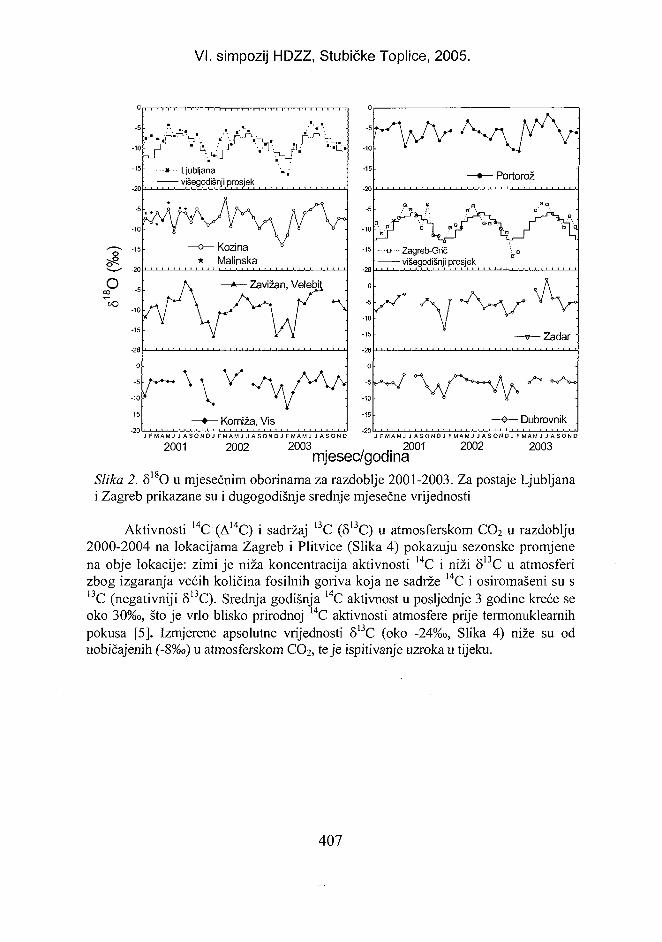
VI. simpozij HDZZ, Stubičke Toplice, 2005.
o5?
•-»•• L jub l jana
7777 višegodišnji prosjek
-o— Kozina* Malinska
v
- Komiža, Vis
- Portorož
• o ••• Z a g r e b - G r i č
višegodišnji prosjek
- Zadar
- DubrovnikJ F M A M J J A S O N O J F M A M J J A S O N D J F M A M J J A S O N D J F M A M J J A S O N D J F M A M J J A S O N O J F M A M J J A S O N D
2001 2002 2003 . , ,. 2001 2002 2003mjesec/godina
Slika 2. 818O u mjesečnim oborinama za razdoblje 2001-2003. Za postaje Ljubljanai Zagreb prikazane su i dugogodišnje srednje mjesečne vrijednosti
Aktivnosti I4C (A14C) i sadržaj 13C (5I3C) u atmosferskom CO2 u razdoblju2000-2004 na lokacijama Zagreb i Plitvice (Slika 4) pokazuju sezonske promjenena obje lokacije: zimi je niža koncentracija aktivnosti 14C i niži 513C u atmosferizbog izgaranja većih količina fosilnih goriva koja ne sadrže I4C i osiromašeni su s13C (negativniji 8I3C). Srednja godišnja I4C aktivnost u posljednje 3 godine kreće seoko 30%o, što je vrlo blisko prirodnoj I4C aktivnosti atmosfere prije termonuklearnihpokusa [5]. Izmjerene apsolutne vrijednosti 513C (oko -24%o, Slika 4) niže su oduobičajenih (-8%o) u atmosferskom CO2, te je ispitivanje uzroka u tijeku.
407
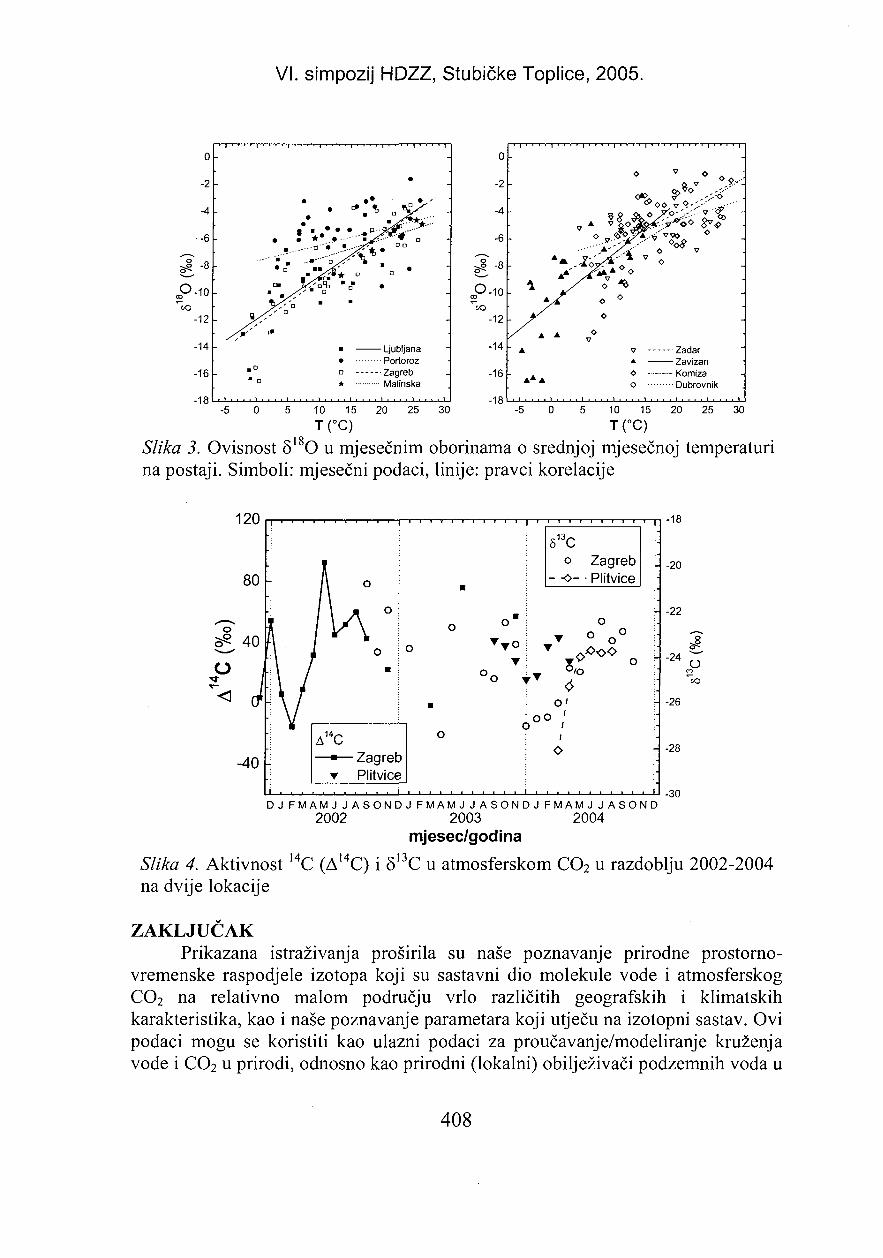
VI. simpozij HDZZ, Stubičke Toplice, 2005.
0
-2
-4
-6
g-8P-10*~lo
-12
-14
-16
-X~r-vi-r | i i i -i ( i i i i | i i i i | r i i i i i
• a" :*« J k ^ ' _ • •
• Ljubljana• PortorožD Zagreb* Malinska
0
-2
-4
-6
g-8P-10"to
-12
-14
-16
1fi
-
-
- * A
/ A A
- A
" A * A
i • •
O
^ >
. ooo
ov
o - --o
-
-
-
ZadarZavizanKomizaDubrovnik
i
-5 10 15T(°C)
20 25 30 -5 10 15T(°C)
20 25 30
Slika 3. Ovisnost 518O u mjesečnim oborinama o srednjoj mjesečnoj temperaturina postaji. Simboli: mjesečni podaci, linije: pravci korelacije
D J F M A M J J A S O N D J F M A M J J A S O N D J F M A M J J A S O N D
2002 2003 2004mjesec/godina
Slika 4. Aktivnost 14C (A14C) i 513C u atmosferskom CO2 u razdoblju 2002-2004na dvije lokacije
ZAKLJUČAKPrikazana istraživanja proširila su naše poznavanje prirodne prostorno-
vremenske raspodjele izotopa koji su sastavni dio molekule vode i atmosferskogCO2 na relativno malom području vrlo različitih geografskih i klimatskihkarakteristika, kao i naše poznavanje parametara koji utječu na izotopni sastav. Ovipodaci mogu se koristiti kao ulazni podaci za proučavanje/modeliranje kruženjavode i CO2 u prirodi, odnosno kao prirodni (lokalni) obilježivači podzemnih voda u
408
VI. simpozij HDZZ, Stubičke Toplice, 2005.
različitim regijama naših država. Prikupljeni podaci također imaju primjenu umeteorološkim i klimatološkim istraživanjima, posebno na područjima na kojimadolazi do miješanja zračnih masa različitog podrijetla. Praćenjem izotopa uatmosferi može se pratiti utjecaj ljudskog djelovanja na promjenu izotopnogsastava, što znači da se mogu otkriti i povišene aktivnosti radioaktivnih izotopa 3Hi 14C do kojih bi moglo doći uslijed redovitog rada nuklearnih postrojenja ilinuklearnih akcidenata.
ZAHVALAIstraživanja su financirana projektima MZOŠ Republike Hrvatske i MVŠZT
Republike Slovenije, hrvatsko-slovenskim projektima "Izotopi u oborinama" i"Izotopni sastav atmosferskog CO2", te IAEA projektima RC-11265 i RC-11267.
LITERATURA[1] Obelić B, Horvatinčić N, Krajcar Bronić I. Koncentracija 14C u godovima drveta na
području Nacionalnog parka Plitvice. Zbornik radova Prvog simpozija Hrvatskogdruštva za zaštitu od zračenja; 24-26. studenoga 1992; Zagreb, Hrvatska. Zagreb:HDZZ; 1992. str. 247-252.
[2] Horvatinčić N, Krajcar Bronić I, Obelić B. Tricij u atmosferi. Zbornik radova Prvogsimpozija Hrvatskog društva za zaštitu od zračenja; 24-26. studenoga 1992; Zagreb,Hrvatska. Zagreb: HDZZ; 1992. str. 303-308.
[3] Horvatinčić N. Radioaktivni izotopi 14C i 3H u okolišu. U: Obelić B, Franić Z, ur.Zbornik radova Četvrtoga simpozija Hrvatskoga društva za zaštitu od zračenja; 11-13. studenoga 1998; Zagreb, Hrvatska. Zagreb: HDZZ; 1998. str. 145-150.
[4] Horvatinčić N, Obelić B, Krajcar Bronić I, Vokal B. I4C u atmosferi. U: Obelić B,Franić Z, ur. Zbornik radova Četvrtoga simpozija Hrvatskoga društva za zaštitu odzračenja; 11-13. studenoga 1998; Zagreb, Hrvatska. Zagreb: HDZZ; 1998. str. 213-218.
[5] Krajcar Bronić I, Horvatinčić N, Obelić B. Two decades of environmental isotoperecord in Croatia: Reconstruction of the past and prediction of future levels.Radiocarbon 1998;40:399-416.
[6] International Atomic Energy Agency (IAEA). Isotope Hydrology InformationSystem. The ISOHIS Database, http://isohis.iaea.org/
[7] Horvatinčić N, Krajcar Bronić I, Barešić J, Obelić, Vidič S. Tritium and stableisotope distribution in the atmosphere at the coastal region of Croatia. Final Reportof the CRP. IAEA-TECDOC; IAEA: 2005, in press.
[8] Vreća P, Kanduč T, Žigon S, Trkov Z. Isotopic composition of precipitation inSlovenia. Final Report of the CRP. IAEA-TECDOC; IAEA: 2005, in press.
409
VI. simpozij HDZZ, Stubičke Toplice, 2005.
DISTRIBUTION OF ISOTOPIC COMPOSITION OFHYDROGEN, OXYGEN AND CARBON IN THEATMOSPHERE OF CROATIA AND SLOVENIA
Ines Krajcar Bronić', Polona Vreča2, Nada Horvatinčić', Nives Ogrinc2,Jadranka Barešić'', Bogomil Obelić' and Tjaša Kanduč2
'Ruđer Bošković Institute, Bijenička 54, HR-10000 Zagreb, Croatia2Jožef Stefan Institute, Jamova 39, SI-1000 Ljubljana, Slovenia
e-mail: [email protected]
Natural cycles of water and carbon can be studied by monitoring the isotopiccomposition of H2O and CO2 in the atmosphere. The monitoring includes isotopes2H, 3H and I8O in precipitation, and 13C and l 4C in atmospheric CO2. Here wepresent the results of such a monitoring of the atmosphere over Croatia andSlovenia for the last several years. Monthly precipitation samples at Zagreb andLjubljana have been collected since 1976 and 1981, respectively. In the period2000-2003 the sampling network was extended to seven stations along the Adriaticcoast of the two countries. Tritium activity in precipitation shows seasonalvariations that are most pronounced at inland stations (Zagreb, Ljubljana) followedby the north-Adriatic (Portorož, Kozina, Malinska) and mid-Adriatic stations(Zadar, Zavižan), and the smallest are at the south-Adriatic stations (Komiža,Dubrovnik). The mean annual tritium activity also decreases from the north to thesouth of the Adriatic coast. Seasonal variations in 52H and 518O in precipitationfollow temperature variations at the sampling stations, and the mean annual 8ISOvalues follow mean annual temperatures. Thus, the south-Adriatic stations showthe smallest variations in 818O and highest mean 518O values. Atmospheric CO2
was collected on a monthly basis in Zagreb and Plitvice to record seasonalvariations in both A14C and 8]iC. Mean annual 14C activities in Zagreb decreasedafter their peak in the 1960s and approached natural pre-bomb activities. For thelast three years, the mean 14C activity A14C has remained about 30%o. This studyextended our knowledge about natural spatial and temporal distributions of 2H, 3H,13C, 14C and I8O in the atmosphere over a relatively small yet rather diverse area interms of climate and geographic features.
410
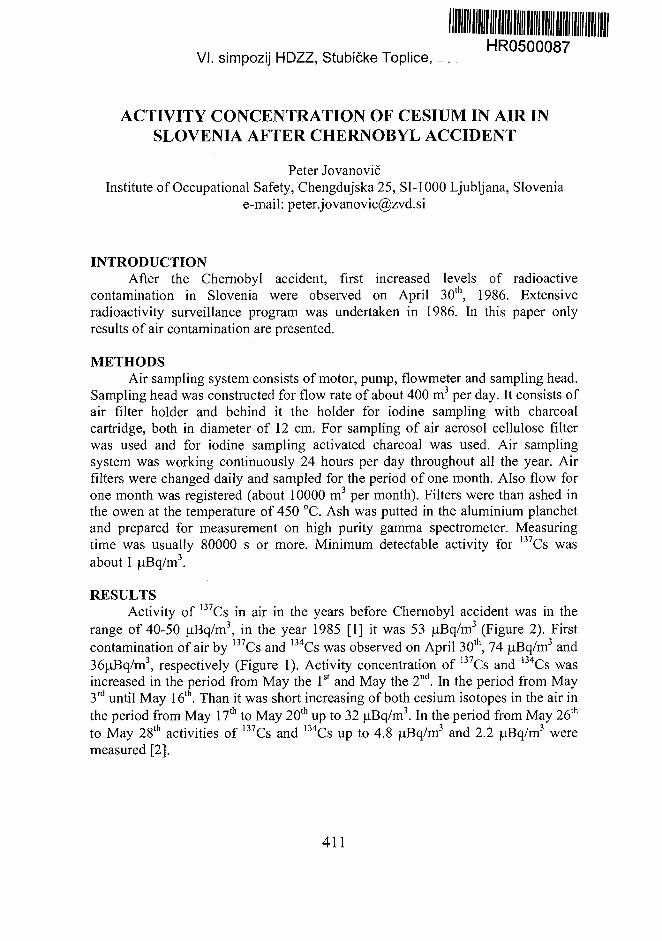
HR0500087VI. simpozij HDZZ, Stubičke Toplice, __
ACTIVITY CONCENTRATION OF CESIUM IN AIR INSLOVENIA AFTER CHERNOBYL ACCIDENT
Peter JovanovičInstitute of Occupational Safety, Chengdujska 25, SI-1000 Ljubljana, Slovenia
e-mail: [email protected]
INTRODUCTIONAfter the Chernobyl accident, first increased levels of radioactive
contamination in Slovenia were observed on April 30th, 1986. Extensiveradioactivity surveillance program was undertaken in 1986. In this paper onlyresults of air contamination are presented.
METHODSAir sampling system consists of motor, pump, flowmeter and sampling head.
Sampling head was constructed for flow rate of about 400 m3 per day. It consists ofair filter holder and behind it the holder for iodine sampling with charcoalcartridge, both in diameter of 12 cm. For sampling of air aerosol cellulose filterwas used and for iodine sampling activated charcoal was used. Air samplingsystem was working continuously 24 hours per day throughout all the year. Airfilters were changed daily and sampled for the period of one month. Also flow forone month was registered (about 10000 m3 per month). Filters were than ashed inthe owen at the temperature of 450 °C. Ash was putted in the aluminium planchetand prepared for measurement on high purity gamma spectrometer. Measuringtime was usually 80000 s or more. Minimum detectable activity for 137Cs wasabout 1 uBq/m3.
RESULTSActivity of 137Cs in air in the years before Chernobyl accident was in the
range of 40-50 uBq/m3, in the year 1985 [1] it was 53 uBq/m3 (Figure 2). Firstcontamination of air by l37Cs and I34Cs was observed on April 30lh, 74 ^Bq/m3 and36uBq/m3, respectively (Figure 1). Activity concentration of 137Cs and 134Cs wasincreased in the period from May the 1st and May the 2nd. In the period from May3rd until May 16th. Than it was short increasing of both cesium isotopes in the air inthe period from May 17th to May 20th up to 32 uBq/m3. In the period from May 26th
to May 28th activities of 137Cs and 134Cs up to 4.8 jiBq/m3 and 2.2 uBq/m3 weremeasured [2].
411
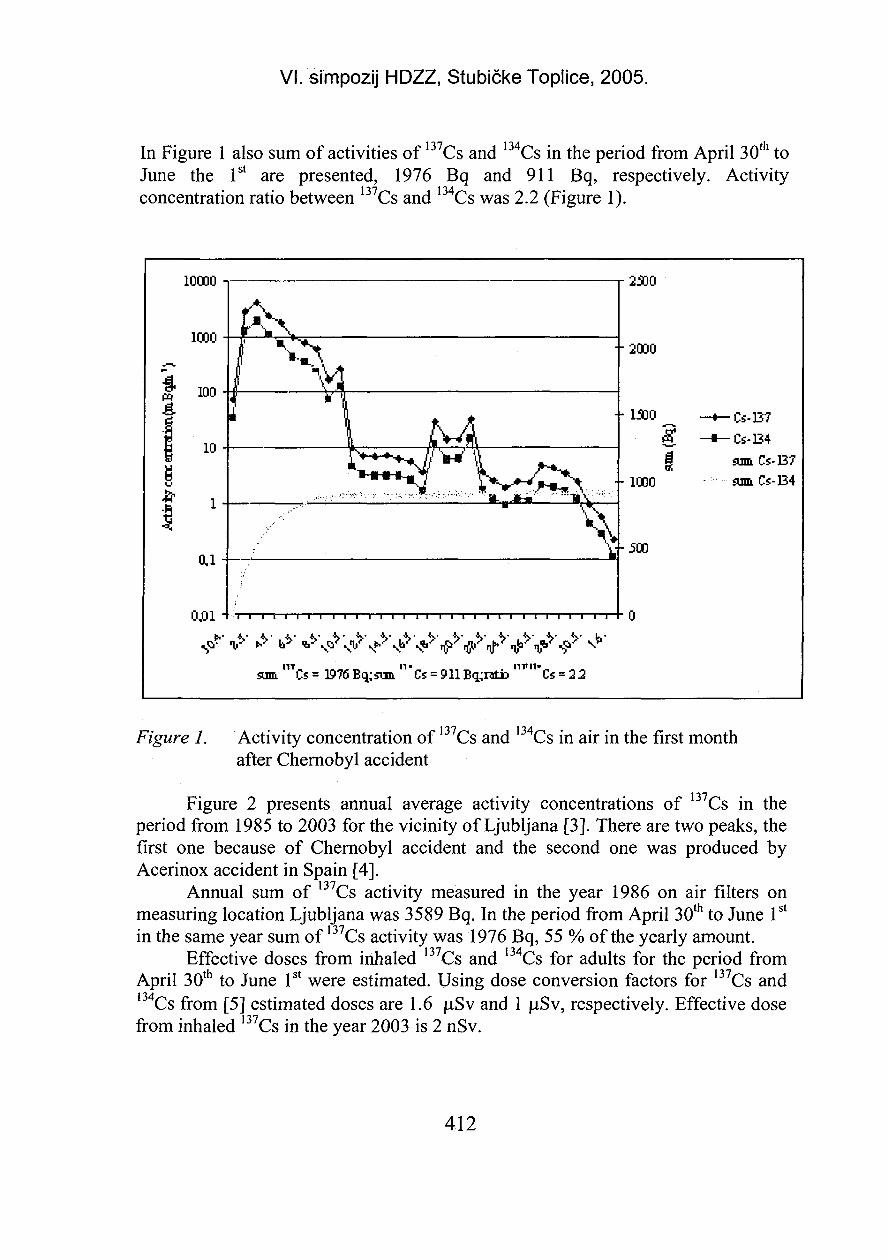
VI. simpozij HDZZ, Stubičke Toplice, 2005.
In Figure 1 also sum of activities of 137Cs and 134Cs in the period from April 30th toJune the 1st are presented, 1976 Bq and 911 Bq, respectively. Activityconcentration ratio between 137Cs and 134Cs was 2.2 (Figure 1).
10000 25)0
•2000
• 1500
•• 1000
-Cs-137-Cs-134sum Cs-B7sum Cs-134
OJ01 H
I1T II"
sum Cs= 1976 Bq; sun.ITPII"
Figure 1. Activity concentration of 137Cs and 134Cs in air in the first monthafter Chernobyl accident
Figure 2 presents annual average activity concentrations of 137Cs in theperiod from 1985 to 2003 for the vicinity of Ljubljana [3]. There are two peaks, thefirst one because of Chernobyl accident and the second one was produced byAcerinox accident in Spain [4].
Annual sum of 137Cs activity measured in the year 1986 on air filters onmeasuring location Ljubljana was 3589 Bq. In the period from April 30th to June 1st
in the same year sum of 137Cs activity was 1976 Bq, 55 % of the yearly amount.Effective doses from inhaled 137Cs and 134Cs for adults for the period from
April 30th to June 1st were estimated. Using dose conversion factors for 137Cs and134Cs from [5] estimated doses are 1.6 JLISV and 1 juSv, respectively. Effective dosefrom inhaled 137Cs in the year 2003 is 2 nSv.
412
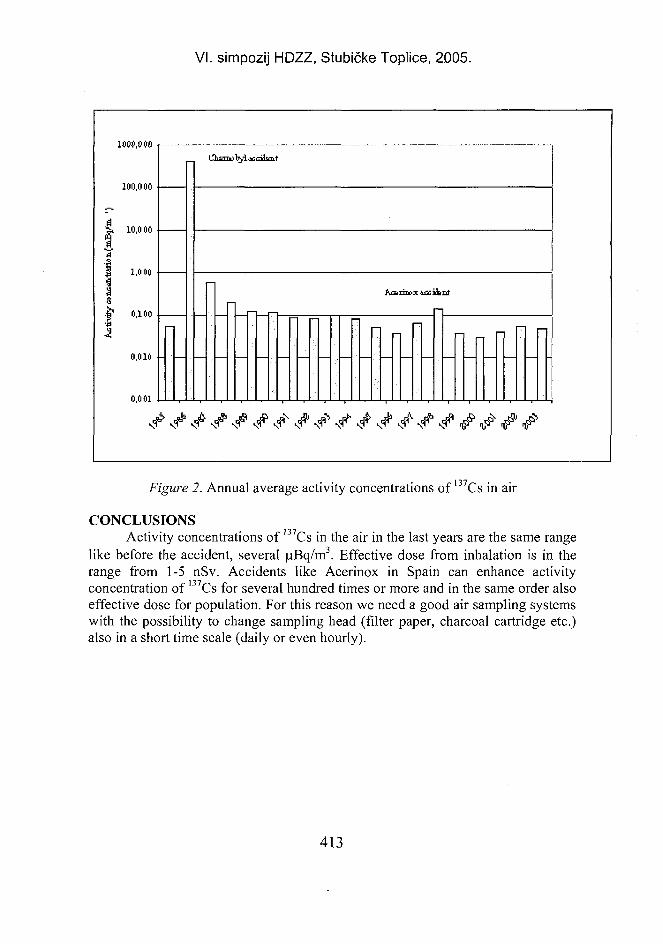
VI. simpozij HDZZ, Stubičke Toplice, 2005.
1000.000
100,000
10,0 00
1.000
0,100
0,010
0,001
-
i t
-
-
Figure 2. Annual average activity concentrations of l37Cs in air
CONCLUSIONSActivity concentrations of 137Cs in the air in the last years are the same range
like before the accident, several |iBq/m3. Effective dose from inhalation is in therange from 1-5 nSv. Accidents like Acerinox in Spain can enhance activityconcentration of l37Cs for several hundred times or more and in the same order alsoeffective dose for population. For this reason we need a good air sampling systemswith the possibility to change sampling head (filter paper, charcoal cartridge etc.)also in a short time scale (daily or even hourly).
413
VI. simpozij HDZZ, Stubičke Toplice, 2005.
REFERENCES[1] Radioactivity in living environment in Slovenia for 1985 (in Slovenian), Ljubljana,
1986.[2] Radioactivity in living environment in Slovenia for 1986 (in Slovenian), Ljubljana,
1987[3] Radioactivity in living environment in Slovenia for years 1987-2003 (in Slovenian),
Ljubljana, 1987-2004[4] Jovanovič P. Radiological incident in Spain and its influence in Slovenia, Proc of
the 4th Symp. of the CRPA, Zagreb, 1998[5] Decree on dose limits, radioactive contamination and intervention levels, Ur.list RS,
St. 49, 2004 (in Slovenian).
ABSTRACT
This article presents activity concentration of caesium in the air in the firstmonth after Chernobyl accident and annual averages from 1986 to 2003. The airwas sampled on cellulose filter papers on different locations in Slovenia. Thecumulative activity concentration in the first month after Chernobyl accident was15 Bq/m3, in the year 2003 only 45 uBq/m3.
414
HR0500088VI. simpozij HDZZ, Stubičke Toplice, 2
PRIRODNA RADIOAKTIVNOST TERMALNOG IZVORA USELU BANJA, OPĆINA FOJNICA
Auto Mihalf, Lejla Saračević'', Davorim Samek', Nedžad Gradaščević'i Eldar Lokmić2
'Veterinarski fakultet Sarajevo, Zmaja od Bosne 90, 71000 Sarajevo, BiH2Centar za medicinsku rehabilitaciju Reumal, 71270 Fojnica, BiH
e-mail: [email protected]
UVODZbog svoje mobilnosti i sposobnosti otapanja, vode su najugroženiji dio
životne okoline. Količine tvari koje se otapaju u vodi ovise o porijeklu vode.Podzemne vode imaju ključnu ulogu u migraciji i preraspodjeli elemenata uZemljinoj kori. Sadržaj prirodnih radionuklida u vodama diktiran je osobinamapojedinih radionuklida, te koncentracijama radionuklida u stijenama kroz koja vodaprotiče. Područje centralne Bosne i Hercegovine bogato je izvorima podzemnihvoda, termalnih, geotermalnih i mineralnih. Za naše dalje razmatranje od posebnoginteresa su termalne vode, osobito stoga što su istraživanja pokazala da pojedinevode sadrže koncentracije nekih radionuklida daleko iznad onih dopuštenih zapitku vodu [1].
Za cilj našeg rada odabrana je termalna voda koja se koristi kao tehničkavoda, odnosno kao voda namijenjena za hidroterapiju i rekreaciju u Centru zamedicinsku rehabilitaciju Reumal, Fojnica.
MATERIJAL I METODEUzorci vode i tla za laboratorijska mjerenja nivoa radioaktivnosti uzimani su
u 6-om i 10-om mjesecu 2003. godine, tj. poslije dugotrajnih padavina i u sušnomperiodu. Uzorci termalne vode uzimani su u plastične posude u količini od 25 litaraiz preliva bušotine u selu Banja, općina Fojnica. Voda je uparena na odgovarajućivolumen, pakovana u mjerne posude i nakon uspostavljene radiokemijskeravnoteže mjerena na odgovarajućem instrumentu. U momentu uzimanja T v o d e = 30°C.
Pored uzoraka vode iz stare bušotine u selu Banja uzeti su i uzorci tla iznepostedne okoline bušotine. Uzorci tla su uzimani na udaljenosti oko 2 m s desnestrane (Lokacija 1.) i na oko 4 metra s lijeve strane bušotine (Lokacija 2.) gledajućis pristupnog puta. Uzorkovanje tla vršeno je metalnom bušilicom na ravnomnekultivisanom tlu s površine od 1 m2 i dubine od 0 - 15 cm. Po dopremi ulaboratorij uzorci su obrađeni prema metodologiji utvrđenoj za radiometrijskeanalize prirodnih i umjetnih radionuklida [2].
Za određivanje nivoa aktivnosti prirodnih i umjetnih radionuklida uispitivanim uzorcima korištena je gamaspektrometrijska metoda. Mjerenja su
415
VI. simpozij HDZZ, Stubičke Toplice, 2005.
vršena na koaksijalnom HPGe detektoru, p-tipa, vertikalne konfiguracije "POP-TOP" model "GEM 25195-P", relativne efikasnosti 25% i energetske rezolucije1.95 keV na 1.33 MeV, proizvođača "EG&G ORTEC". Detektor je smješten uolovno kućište debljine 10 cm i preko visokonaponskog i spektroskopskog pojačalapovezan sa 4096 kanalnom analizatorskom karticom (916 ADCAM) istogproizvođača smještenom u PC kompatibilni računar.
Specifična aktivnost 2 3 5U u uzorcima tla određena je na energiji 185.7 keV,dok je sadržaj 2 3 8U izračunat na osnovu prirodnog odnosa aktivnosti 235U/238U [3].Specifična aktivnost 232Th, 226Ra i 228Ra u ispitivanim uzorcima određena je izgama linija njihovih potomaka (za 226Ra: 214Pb i 2 l4Bi, a za 232Th i 228Ra: 228Ac i2O8T1). Pored navedenih radionuklida određivani su 40K, kao jedan odnajrasprostranjenijih prirodnih radioaktivnih elemenata i umjetni radionuklid 137Cs.Vrijeme mjerenja svakog uzoraka bilo je 80000 sekundi.
REZULTATIRezultati gamaspektrometrijskih mjerenja specifičnih aktivnosti pojedinih
prirodnih radionuklida u uzorcima termalne vode iz stare bušotine u selu Banja sudati u tablici 1.
Najviša srednja vrijednost prirodnih radionuklida od 261,03 ± 3,48 mBq/l jedobivena za 226Ra, a najniža od 30,91 ± 2,82 mBq/l za 228Ra.
Specifične aktivnosti prirodnih radionuklida u ispitivanoj vodi pokazujuslaganje sa literaturnim podacima za neke termalne vode. Tako na primjer, kod 12podzemnih termalnih i mineralnih izvora u Hrvatskoj utvrđeno je da se srednjavrijednost specifične aktivnosti 226Ra kreće u širokom rasponu koji iznosi od 0,104(izvor mineralne vode Jamnica) do 3,199 Bq/1 (Bizovičke toplice) (1). Specifičneaktivnosti 228Ra su od 1 do 8,5 puta niža, a u Istarskim toplicama čak 93,2 puta nižeod one za 226Ra [4].
Upoređujući nalaze 226Ra i 228Ra u Hrvatskim toplicama i Fojnici uočljivo jeslaganje naših nalaza sa većim brojem nalaza za hrvatske toplice.
416
VI. simpozij HDZZ, Stubičke Toplice, 2005.
Tabela 1. Specifične aktivnosti u uzorcima vode
Radio-nuklid
226Ra228Ra
4 o K
Aktivnost (mBq/l)Prvo
uzorkovanje258,75 ±4,5133,10 + 3,26
78,89 ± 8,97
Drugouzorkovanje263,30 ± 2,4428,71+2,37
45,97 ± 8,68
Srednjavrijednost
261,03 ±3,48
30,91 +2,8262,43 ± 8,83
Kako se ispitivana termalna voda koristi kao osnovno terapeutsko sredstvopri balneološkim liječenjima, te za rekreativno kupanje, a imajući u viduradiotoksičnost 226Ra i 228Ra, usporedili smo dobivene vrijednosti nivoa aktivnostisa maksimalno dozvoljenim vrijednostima propisanim legislativom.
Termalna voda iz stare bušotine u selu Banja, općina Fojnica je po osnoviradioaktivnosti unutar dopuštenih granica za pitku vodu prema Pravilniku omaksimalnim granicama radioaktivne kontaminacije čovjekove okoline i oobavljanju dekontaminacije [5]. Također, ispitivana voda je u skladu spreporukama Svjetske zdravstvene organizacije (WHO) u kojima stoji dakoncentracija 226Ra u pitkoj vodi ne smije preći vrijednost od 1 Bq/1 [6].
U Tabeli 2. dati su rezultati istraživanja nivoa aktivnosti najvažnijihprirodnih i umjetnih radionuklida u tlu dubine 0-15 cm na dvije mikro lokacije uzbušotinu termalne vode u selu Banja, općina Fojnica.
Rezultati mjerenja nivoa aktivnosti u tlu na lokaciji br. 1. pokazuju za redveličine više vrijednosti za radionuklide urana i radija i one iznose 735,59 ± 31,98za 2 3 8U i 731,69 ± 6,26 Bq/kg za 226Ra, dok te vrijednosti na lokaciji br. 2. iznose39,91 ± 7,67 za 2 3 8U i 66,41 + 1,75 Bq/kg za 226Ra. Dobiveni rezultati dvauzorkovanja tla s dvije različite mikro lokacije ukazuju da je lokacija br. 1najvjerovatnije obogaćena radionuklidima iz dubljih slojeva tla deponiranim tokombušenja bušotine ili obogaćena- prirodnim radionuklidima sadržanim u vodidugotrajnim plavljenjem tla u okolini bušotine, obzirom daje ova mikro lokacija udepresiji. Prisustvo fisionog radionuklida 137Cs u tlu je vjerovatno posljedicaradioaktivne kontaminacije tla nakon akcidenta na nuklearnoj elektrani uČernobilju 1986. godine.
417
VI. simpozij HDZZ, Stubičke Toplice, 2005.
Tabela 2. Specifične aktivnosti u uzorcima tla
Radio-nuklid
2 3 5 U2 3 8 U
2 3 2 T h
2 2 6 R a40K
1 3 7 C s
Aktivnost (Bq/kg)Lokacija 1.33,87+ 1,47
735,59 ±31,98
79,20 + 3,23
731,69 + 6,26
523,25+17,20
60,10 ± 1,80
Lokacija 2.1,84 ±0,35
39,91 ±7,67
31,92 ± 1,91
66,41 ± 1,75
369,46 + 9,02
49,95 ± 1,43
ZAKLJUČAKNa osnovi dobivenih rezultata istraživanja termalne vode iz stare bušotine u
selu Banja, općina Fojnica može se zaključiti da je najviša srednja vrijednostprirodnih radionuklida od 261,03 + 3,48 mBq/l dobivena za 226Ra, a najniža od30,91 ± 2,82 mBq/l za 228Ra, iz čega proizilazi da te vrijednosti ne prelazemaksimalno dozvoljene vrijednosti za pitku vodu propisane važećom legislativom.
Upoređujući literaturne podatke i naše nalaze, može se zaključiti da termalnavoda iz stare bušotine u selu Banja, općina Fojnica spada u kategoriju srednjeradioaktivnih termalnih voda pogodnih za hidroterapiju i rekreaciju.
LITERATURA
[1]
[2]
[3]
[4]
[5]
[6]
Marović G, Senčar J, Franić Z, Nevenka Lokobauer N. Radium-226 in Thermaland Mineral Springs of Croatia and Associated Health Risks. J. Environ.Radioactivity 1996; 33: 309-317.International Atomic Energy Agency (IAEA). Basic Safety Standards forRadiation Protection. Safety Series No. 9, 1982.Vienna: IAEA; 1982.Barišić D. Određivanja U i U gamaspektrometrijskom metodom naenergijama oko 186 keV, Zbornik radova JDZZ, 140-146, Priština, 1989.Marović G, Senčar J, Cesar D. Prirodna radioaktivnost termalnih izvora uHrvatskoj. U: Obelić B, Franić Z, ur. Zbornik radova Četvrtoga simpozijaHrvatskoga društva za zaštitu od zračenja; 11-13. studenoga 1998; Zagreb,Hrvatska. Zagreb: HDZZ; 1998. str. 207-12.Pravilnik o maksimalnim granicama radioaktivne kontaminacije čovjekoveokoline i o obavljanju dekontaminacije (Sl.l.SFRJ br. 8/87, Uredba SLI. RBiH br.2/92).World Health Organization (WHO). Guidelines for drinking-water quality.Geneva: WHO; 1993. pp. 114-121.
418
VI. simpozij HDZZ, Stubičke Toplice, 2005.
NATURAL RADIOACTIVITY OF THERMAL SPRING INVILLAGE BANJA, MUNICIPALITY FOJNICA
Anto Mihalf', Lejla Saračević', Davorin Samek', Nedžad Gradašćević1
and Eldar Lokmić2
'Veterinary Faculty, University of Sarajevo, Zmaja od Bosne 90, 71000 Sarajevo,Bosnia and Herzegovina
2Centre of Medical Rehabilitation "REUMAL"71270 Fojnica, Bosnia and Herzegovina
This study was performed in 2003 at the spring of a thermal water in thevillage of Banja, district of Fojnica, Bosnia and Herzegovina. This water is used forhydrotherapy and recreation in the Centre for Medical Rehabilitation REUMAL inFojnica. This paper describes the levels of natural radioactivity in water and in thesurrounding soil. Gammaspectrometry was used to determine the most significantnatural radionuclides in the water and soil. Natural radioactivity of radium in waterranged from 30.91 mBq/1 for 228Ra to 261.03 mBq/1 for 226Ra. In the soilsurrounding the spring, radioactivity ranged from 31.92 Bq/kg for 232Th to 735.59Bq/kg for 2 3 8U.
419
VI. simpozij HDZZ, Stubičke Toplice, HR0500089
UTJECAJ MATRIKSA NA ODABIR METODE IZOLACIJERADIOAKTIVNOG STRONCIJA
Katarina Košutić, Željko Grahek, Martina Rožmarić Mačefat i Stipe LulićInstitut Ruđer Bošković, Bijenička c. 54, 10000 Zagreb
e-mail: [email protected]
UVODOdređivanje radioaktivnog stroncija sastavni je dio radiološkog monitoringa.
S obzirom da je radioaktivni stroncij čisti beta emiter ne može se određivatidirektnim mjerenjem bez prethodne kemijske izolacije iz uzoraka.
Za određivanje niskih aktivnosti 90Sr ključna su dva parametra. To su sastavi količina uzorka uzetog za analizu. O njima ovisi efikasnost izolacije stroncija izuzorka odnosno kemijsko iskorištenje.
U uzorcima sedimenta i tla određivanje je komplicirano jer zahtijevaspecifičnu obradu uzorka te odjeljivanje stroncija od velikih količina kalcija,željeza te drugih elemenata. Obrada uzoraka može se provesti na nekoliko načina[1-3]. Najbolji je potpuno razaranje (otapanje) jer tada je sigurno daje sav stronciju otopini. Međutim to je teško postići kad se radi s velikim količinama uzorka (višeod 10 grama). Drugi načinje djelomično otapanje odnosno izluživanje (leaching) skiselinama i/ili ionskim izmjenjivačima [3]. Izluživanje s kiselinama zahtijevautrošak velikih količina kiselina i puno vremena za razliku od obrade s ionskimizmjenjivačima. Isto tako količina drugih elemenata koji se izluče u otopinu znatnoje veća kod izluživanja nego kod obrade ionskim izmjenjivačima. To je osobitovažno kad se radi izolacija i kromatografsko odjeljivanje stroncija s ionskimizmjenjivačima i Sr specifičnom smolom [4,5].
U radu će stoga biti pokazano kako se i pod kojim uvjetima može koristitiionski izmjenjivač u obradi krutih uzoraka, kao što su tlo i sedimenti.
REZULTATI I RASPRAVAU literaturi opisane metode izolacije stroncija iz uzoraka tla i sedimenata
bazirane su na raščinjavanju uzorka sa raznim kiselinama. Ti postupci najčešće suograničeni na količinu uzorka (cea 10 g), što kod određivanja niskih aktivnostimože dovesti do nepouzdanog i netočnog rezultata. Povećanje količine uzorkanužno zahtijeva upotrebu velikih količina agresivnih kiselina i znatno produljujevrijeme izolacije. To se može izbjeći upotrebom jakih kationskih izmjenjivača zaizolaciju stroncija iz spomenutih vrsta uzoraka. Pri tome je potrebno da uzorakbude hidratiziran. Praktično se to izvodi tako da se uzorak tla ili sedimenta dobrorazmulji u redesti li ranoj vodi uz dodatak nosača stroncija. U uzorak se dodajeizmjenjivač u H+ formi koji onda veže na sebe katione. Pri tome se izmjenjivačponaša kao kiselina tj. tijekom izmjene kationa otpušteni H+ djeluje kao kiselina iotapa dio uzorka (uglavnom karbonate). Međutim izmjenjivač veže katione
420
VI. simpozij HDZZ, Stubičke Toplice, 2005.
neselektivno. Kako je kapacitet izmjenjivača ograničen potrebno je uzeti količinuizmjenjivača dovoljnu za vezanje stroncija i svih ostalih kationa. Količina dodanogizmjenjivača ovisi prije svega o količini uzorka potrebnog za analizu te o njegovomsastavu.
Zbog toga je napravljeno niz eksperimenata sa izmjenjivačem Amberlite IR-120 (kationski izmjenjivač), kako bi se dobili odgovori pod kojim uvjetima trebaprovoditi izolaciju stroncija.
U Tablici 1 prikazani su rezultati količine izoliranog stroncija u ovisnosti okoličini uzorka i izmjenjivača.
Tablica 1. Efikasnost izolacije stroncija u ovisnosti o masi korištenogizmjenjivača
SE (g) + Izmj. (IR-120)g +20 mg Sr nosač1 0 g + 1 0 g10g+ 3g3 0 g + lOg5 0 g + 1 0 g
(%) izoliranog Sr60304533
Ovi rezultati pokazuju da količina uzorka određuje količinu izmjenjivačaodnosno da iskorištenje raste s porastom količine izmjenjivača. Iskustvo jepokazalo da optimalni omjer izmjenjivač/uzorak iznosi 1:1. Dodavanje većekoličine izmjenjivača ne znači nužno i povećanje iskorištenja stroncija. Potrebno jenaglasiti da se na ovaj način izoliraju oni ioni stroncija (i ostali kationi) koji suadsorbirani na česticama tla i oslobođeni djelovanjem H+ iona izmjenjivača.Međutim za analizu radiaktivnog stroncija bitna je činjenica da je većina aktivnihstroncijevih iona u dostupnom obliku s obzirom na njihovo porijeklo odnosno dajeadsorbirana na površini čestica tla ili sedimenta. Isto tako bitno je i vrijemekontakta sedimenta i izmjenjivača. Na Slici 1 prikazana je brzina vezanja stroncijana izmjenjivač. Iz tog rezultata proizlazi daje minimalno vrijeme kontakta 1 sat.
421
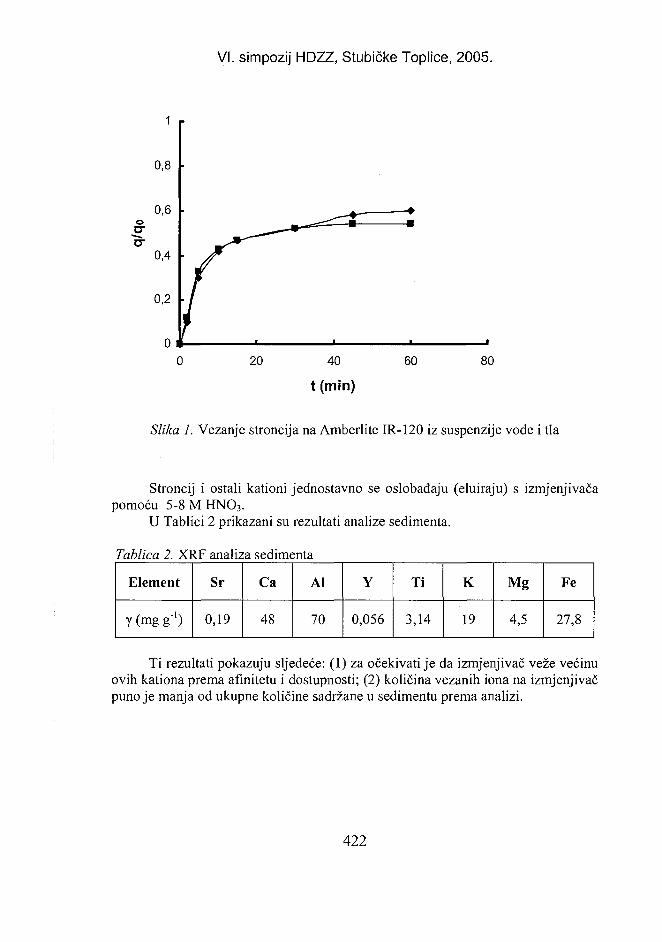
VI. simpozij HDZZ, Stubičke Toplice, 2005.
o
a-
1
0,8
0,6
0,4
0,2
0 i20 40
t (min)
60 80
Slika 1. Vezanje stroncija na Amberlite IR-120 iz suspenzije vode i tla
Stroncij i ostali kationi jednostavno se oslobađaju (eluiraju) s izmjenjivačapomoću 5-8 M HN03.
U Tablici 2 prikazani su rezultati analize sedimenta.
Tablica 2. XRF analiza sedimenta
Element
y (mg g'1)
Sr
0,19
Ca
48
Al
70
Y
0,056
Ti
3,14
K
19
Mg
4,5
Fe
27,8
Ti rezultati pokazuju sljedeće: (1) za očekivati je da izmjenjivač veže većinuovih kationa prema afinitetu i dostupnosti; (2) količina vezanih iona na izmjenjivačpuno je manja od ukupne količine sadržane u sedimentu prema analizi.
422
VI. simpozij HDZZ, Stubičke Toplice, 2005.
To je važno u daljnjem postupku izolacije kad se radi kromatografskoodjeljivanje stroncija od ostalih elemenata. Naime količina iona koju je potrebnoodijeliti puno je manja nego kada se sediment potpuno razara i u tome je prednostovog postupka.
ZAKLJUČAKIz prethodnog proizlazi da se kationski izmjenjivači mogu koristiti za
izolaciju stroncija iz uzoraka tla i sedimenta. Rezultati pokazuju da količina uzorkaodređuje količinu izmjenjivača odnosno da iskorištenje raste s porastom količineizmjenjivača. Optimalni omjer izmjenjivač/uzorak iznosi lg/lg. U ovom postupkukoličina vezanih iona na izmjenjivač puno je manja od ukupne količine sadržane usedimentu. To je važno kad se u daljnjem postupku kromatografski odjeljujestroncij od kalcija i ostalih elemenata. Naime količina smetajućih iona koju jepotrebno odijeliti puno je manja što rezultira boljim iskorištenjem.
LITERATURA[1] International Atomic Energy Agency (IAEA). Measurement of Radionuclides in
Food and the Environment. Technical Report Series No. 295, Vienna: IAEA; 1989.[2] JuznicK, Fedsina S, Fresenius Z. Radiochemical determination of Sr-90 and Sr-89
in soil. Anal Chem 1986;323:261-263.[3] De Regge P, Radecki Z. The IAEA proficiency test on evaluation of methods for9 0
Sr measurement in a mineral matrix. J Radioanal and Nucl Chem 2000;246(3):511-519.
[4] Horwitz EP, Chiarizia R, Dietz M. A novel strontium-selektive extractionchromatographic resin. Solvent extraction and ion exchange 1992; 10(2):313-336.
[5] Grahek Ž, Eškinja I. Isolation of ytrium and strontium from soil samples and rapiddetermination of 90Sr, Croat Chem Acta 2000;73(3):795-807.
423
VI. simpozij HDZZ, Stubičke Toplice, 2005.
INFLUENCE OF MATRIX ON METHOD SELECTION FORRADIOACTIVE STRONTIUM ISOLATION
Katarina Košutić, Željko Grahek, Martina Rožmarić Mačefat and Stipe LulićRuder Bošković Institute, Bijenička c. 54, HR-10000 Zagreb, Croatia
e-mail: [email protected]
Sample composition and mass affect strontium isolation and chemicalrecovery. The isolation of small amounts of strontium from complex samples (soilsand sediments) is difficult because it requires separation from large amounts ofcalcium, iron and other elements. There are a few options to treat samples such ascomplete decomposition, leaching with acids and/or ion exchanger. Completedecomposition (dissolving) is possible with samples not heavier than 10 g.Leaching with acids requires large amounts of acids and a lot of time. This paperdescribes the influence of sample treatment on determination of low activities ofradioactive strontium. The strong cation exchanger can be used for the strontiumisolation from soil and sediment samples. Separation of soil from exchanger andcation elution with HNO3 are followed. Exchanger quantity used in the analysisdepends on sample quantity. Efficiency of isolation depends on exchanger quantityand contact time between exchanger and suspension. The cation exchangeprocedure used in strontium isolation methods enables simple subsequentchromatographic separation of strontium from calcium and other elements withhigher recovery on the chromatographic column.
424
HR0500090VI. simpozij HDZZ, Stubičke Toplice,
UVOĐENJE SUSTAVA ZA NADZOR RADIOAKTIVNOSTI UPROCESIMA PROIZVODNJE ČELIKA
Tahir Sofilić', Tihana Marjanović1 i Alenka Rastovčan-Mioč2
'Valjaonica cijevi Sisak d.o.o., 44000 Sisak2Sveučilište u Zagrebu, Metalurški fakultet, 44000 Sisak
e-mail: [email protected]
UVODPotpuno poznavanje fizikalnih i kemijskih svojstava čeličnog otpada koji
kao sirovina u proizvodnim procesima čeličana i ljevaonica ima vrlo veliki značaj,danas podrazumijeva i poznavanje sadržaja radionuklida u ovom materijalu.Naime, poznato je da pojedine primjese iz uloška elektropeći za vrijeme procesaproizvodnje čelika pri taljenju i rafinaciji potpuno prelaze u trosku (Ca, Al, Si, Ti)ili u plin (Zn, Cd), odnosno da neke samo djelomično prelaze u trosku (Mn, Cr, S,P) ili pak ostaju u talini (Cu, Ni, Mo, Sn...). Manje je poznato da čelični otpadmože sadržavati i primjese iz grupe radioaktivnih metala i to najčešće 60Co, 90Sr,137Cs, 192Ir, 226Ra, 232Th, i 241Am, koji se također sukladno svojim fizikalnim ikemijskim svojstvima za vrijeme trajanja procesa proizvodnje čelika raspodjeljujuizmeđu čelične taline, troske i dimnih plinova. Sagledavajući problem mogućeprisutnosti radioaktivnih elemenata u čeličnom otpadu, poluproizvodima i gotovimproizvodima metalurške i metaloprerađivačke industrije, nužno je uvođenje sustavanadzora i kontrole prisutnosti radionuklida i u proizvodnim procesima hrvatskihproizvođača čelika.
RADIOAKTIVNO ONEČIŠĆENJE ČELIČNOG OTPADAZbog vrlo široke primjene radioaktivnih elemenata u industriji, medicini,
nuklearnoj tehnici, vojnoj industriji i si. javlja se i radioaktivni otpad u oblikuodbačene opreme, koji na različite načine dospijeva u čelični otpad ("staroželjezo") i onečišćuje ga. Kod priprave čeličnog otpada za potrebe čeličana iljevaonica primjenjuju se različite metode drobljenja, prešanja i rezanja pa postojivelika opasnost da eventualno prisutni odbačeni dijelovi opreme koji sadržeradionuklide budu razgrađeni, a radionuklidi dispergirani, što može predstavljativeliku opasnost po okoliš. Prema literaturnim podacima [1], broj slučajevaradioaktivnog onečišćenja metalnog otpada namijenjenog uporabi u čeličanama iljevaonicama, posljednjih je godina značajno porastao, iako nije izvjesno je li toposljedica povećanog nadzora nad pripravom i uporabom čeličnog otpada ili pakporasta nekontroliranog odlaganja otpada različitog podrijetla koji sadržiradionuklide. U čeličnom otpadu se najčešće pojavljuju radionuklidi 137Cs, 60Co,226Ra, 192Ir,241Am, 232Th i 90Sr koji tijekom procesa proizvodnje čelika bivajuraspodijeljeni između čelične taline, troske i dimnih plinova, a što ovisi o
425
VI. simpozij HDZZ, Stubičke Toplice, 2005.
kemijskim i fizikalnim svojstvima prisutnih radionuklida [1,2]. U cilju rješavanjaovog značajnog problema proizvođači čelika su u posljednjih 10-15 godinapristupili sustavnom praćenju prisutnosti radionuklida u čeličnom otpadu i sirovomčeliku. Glede normi i propisa kojima bi se odredile granične vrijednosti za sadržajradionuklida u čeličnom otpadu, čeliku i čeličnim proizvodima još uvijek ne postojiusklađenost niti među članicama EU, iako se intenzivno radi na donošenjujedinstvene legislative. U međuvremenu se koriste smjernice i preporuke koje jeizdala Međunarodna agencija za atomsku energiju {International Atomic EnergyAgency, IAEA). Grupa specijalista pri UN-Gospodarskom Povjerenstvu za Europu{United Nations Economic Commission for Europe, UN-ECE) zadužena zaproblem radioaktivnog onečišćenja metalurškog otpada sugerira dragovoljnoprihvaćanje kao granične vrijednosti (tzv. bussiness level) aktivnost od najviše 100Bqkg"1, iako se u većini europskih zemalja ova vrijednost kreće u intervalu od 100Bq'kg"1 do 300 Bqkg"1. Uvoz čeličnog otpada u zemlje članice EU također je podstrogim nadzorom te je ulaz otpada moguć samo ako onečišćenost radionuklidimane prelazi vrijednosti brzine doze zračenja od 5 uSvh"' ili vrijednost aktivnostipovršine3 ne prelazi 0,4 Bqcm"2 (P- i y-zračenja) odnosno 0,04 Bqcm"2 (<x-zračenje). Preporuča se da isti čelični otpad ne sadrži aktivnost iznad 100 Bqkg"1.U zemljama proizvođača čelika izvan EU također postoji neujednačenost kako upristupu ovom problemu i njegovom rješavanju, tako i u definiranju graničnih ilimaksimalno dopuštenih vrijednosti [3] aktivnosti radionuklida u čeliku i čeličnimproizvodima (npr. Japan 500 Bqkg"1, Rusija 370 Bqkg'1). Imajući u vidu značajovog problema, a zbog nedostatka vlastitih normi i propisa kojima bi se osiguralakontrola uvoznog i domaćeg čeličnog otpada, poluproizvoda i gotovih proizvoda,nužno je započeti s aktivnostima u području kontrole i uvođenja sustava zapraćenje radionuklida u ovim materijalima uz korištenje postojećih međunarodnihpreporuka i propisa, sve dok se ne donese odgovarajuća legislativa na razini RH.
RADIONUKLIDI U DOMAĆIM METALURŠKIM PROCESIMA INJIHOV NADZOR
Na temelju dostupnih literaturnih podataka do sada u Hrvatskoj nijezabilježen slučaj pojave radionuklida u čeličnom otpadu ili sirovom čeliku čime bise ugrozilo zdravlje ljudi i onečistio okoliš. Prva sustavna istraživanja ovogproblema kao i istraživanje eventualne pojave radionuklida u sirovinama zaproizvodnju čelika i samom čeliku provedena su u Željezari Sisak. Rezultati y-spektrometrijske analize [4,5] nekih uzoraka čelika proizvedenih u čeličani i pritome upotrijebljenim nemetalnim dodacima, te nastalom tehnološkom otpadu,ukazuju na prisutnost radionuklida koji po podrijetlu i izmjerenim aktivnostima nepredstavljaju opasnost, ali svakako ukazuju na potrebu za kontrolom njihovogsadržaja u ovim materijalima. Čelični otpad koji se koristi za potrebe proizvodnječelika obično je vlastiti tehnološki otpad tj. povrat iz tehnološkog procesa i čeličniotpad nabavljen na tržištu. Otpad nabavljen na tržištu, nabavlja se obično sukladno
426
VI. simpozij HDZZ, Stubičke Toplice, 2005.
tzv. tehničkim uvjetima za prijem i pripremu čeličnog otpada koji uglavnomobuhvaćaju oblik otpada, dimenzije pojedinih komada i štetne primjese. Osimnavedenih zahtjeva ne postoje drugi zahtjevi kojima bi čelični otpad trebaozadovoljavati, a eventualno upozorenje da čelični otpad ne smije sadržavatiradioaktivne tvari je samo deklarativne prirode s obzirom da se kontrola prisutnostiradionuklida uglavnom ne provodi niti pri sakupljanju i pripravi čeličnog otpada zaisporuku potrošačima, kao niti kod potrošača pri prijemu odnosno uporabi umetalurškim procesima. Postojeći sustavi upravljanja kvalitetom u domaćimčeličanama propisuju aktivnosti u svezi prijema i kontrole čeličnog otpada priulazu u skladište kao i pripreme čeličnog otpada te njegovo ulaganje u elektropeć.Ovakav sustav je u usporedbi sa sustavima europskih proizvođača čelikanedostatan te je neophodno pristupiti njegovoj dogradnji uvođenjem kontroleprisutnosti radionuklida u čeličnom otpadu.
Sustavi za nadzorIzgradnjom sustava za nadzor i praćenje (monitoring) radionuklida u
hrvatskim čeličanama osigurala bi se zaštita zdravlja ljudi i otklonila mogućnostonečišćenja okoliša uporabom čeličnog otpada koji sadrži radioaktivne tvari.Istovremeno bi se posredno utjecalo i na uvođenje kontrole čeličnog otpada u"dvorištu sakupljača", koji je često i isporučitelj toga otpada odnosno dobavljač. Zanadzor i praćenje radionuklida u čeličnom otpadu, gotovim proizvodima,tehnološkom otpadu kao i materijalima korištenim u procesu proizvodnje čelika,primjenjuju se obično dva osnovna tipa instrumenata i to mobilni (prijenosni) istacionarni automatski uređaji. Prednost prijenosnih uređaja ogleda se prije svega ucijeni i mogućnosti korištenja, odnosno, mogućnosti primjene na različitimmjestima u procesu proizvodnje čelika i njegove prerade. Istodobno nedostatakovog instrumenta je njegova ograničena mogućnost korištenja u kontroli velikihpošiljki čeličnog otpada isporučenog u kontejnerima, kamionskim prikolicama,vagonima i si. Najčešći zahtjevi koje trebaju ispunjavati prijenosni uređaji zamonitoring radionuklida u čeličnom otpadu prikazani su u Tablici 1.
427
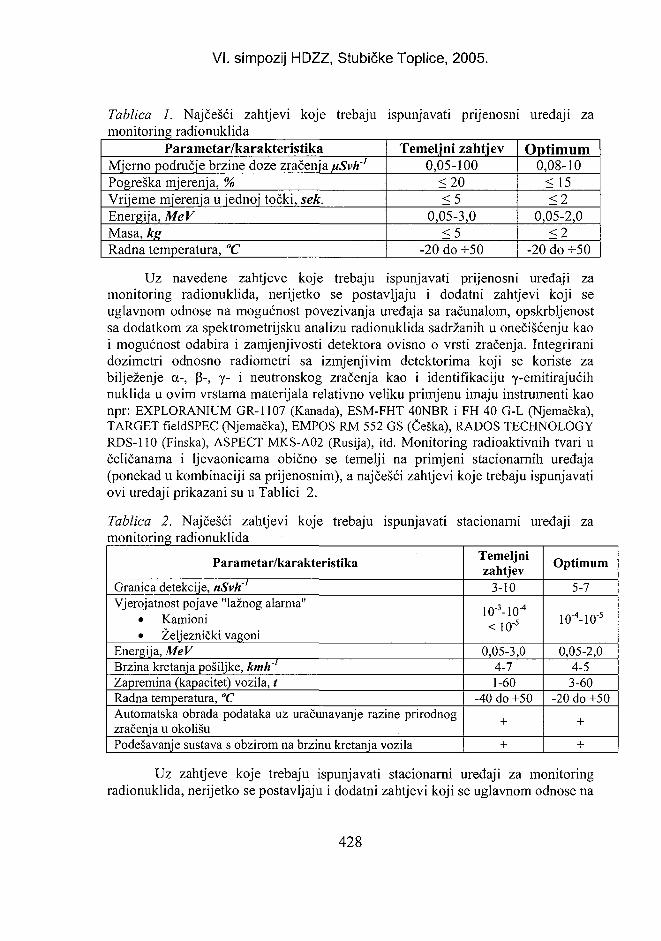
VI. simpozij HDZZ, Stubičke Toplice, 2005.
Tablica 1. Najčešći zahtjevi koje trebaju ispunjavati prijenosni uređaji zamonitoring radionuklida
Parametar/karakteristikaMjerno područje brzine doze zračenja uSvh'Pogreška mjerenja, %Vrijeme mjerenja u jednoj točki, sek.Energija, MeVMasa, kgRadna temperatura, °C
Temeljni zahtjev0,05-100
<20<5
0,05-3,0< 5
-20 do +50
Optimum0,08-10
<15<2
0,05-2,0<2
-20 do +50
Uz navedene zahtjeve koje trebaju ispunjavati prijenosni uređaji zamonitoring radionuklida, nerijetko se postavljaju i dodatni zahtjevi koji seuglavnom odnose na mogućnost povezivanja uređaja sa računalom, opskrbljenostsa dodatkom za spektrometrijsku analizu radionuklida sadržanih u onečišćenju kaoi mogućnost odabira i zamjenjivosti detektora ovisno o vrsti zračenja. Integriranidozimetri odnosno radiometri sa izmjenjivim detektorima koji se koriste zabilježenje a-, (3-, y- i neutronskog zračenja kao i identifikaciju y-emitirajućihnuklida u ovim vrstama materijala relativno veliku primjenu imaju instrumenti kaonpr: EXPLORANIUM GR-1107 (Kanada), ESM-FHT 40NBR i FH 40 G-L (Njemačka),TARGET fieldSPEC (Njemačka), EMPOS RM 552 GS (Češka), RADOS TECHNOLOGYRDS-110 (Finska), ASPECT MKS-A02 (Rusija), itd. Monitoring radioaktivnih tvari učeličanama i ljevaonicama obično se temelji na primjeni stacionarnih uređaja(ponekad u kombinaciji sa prijenosnim), a najčešći zahtjevi koje trebaju ispunjavatiovi uređaji prikazani su u Tablici 2.
Tablica 2. Najčešći zahtjevi koje trebaju ispunjavati stacionarni uređaji zamonitoring radionuklida
Parametar/karakteristika
Granica detekcije, nSvh'1
Vjerojatnost pojave "lažnog alarma"• Kamioni• Željeznički vagoni
Energija, MeVBrzina kretanja pošiljke, kmh~Zapremina (kapacitet) vozila, tRadna temperatura, "CAutomatska obrada podataka uz uračunavanje razine prirodnogzračenja u okolišuPodešavanje sustava s obzirom na brzinu kretanja vozila
Temeljnizahtjev
3-10
10"3-IO"4
<10" 5
0,05-3,04-71-60
-40 do +50
+
+
Optimum
5-7
10""-IO"5
0,05-2,04-53-60
-20 do +50
+
+
Uz zahtjeve koje trebaju ispunjavati stacionarni uređaji za monitoringradionuklida, nerijetko se postavljaju i dodatni zahtjevi koji se uglavnom odnose na
428
VI. simpozij HDZZ, Stubičke Toplice, 2005.
mogućnost prijenosa informacija telekomunikacijskim sustavima, mogućnostprovjere radne zapremine vozila, mogućnost identificiranja radionuklida prisutnihu onečišćenom otpadu i si. Stacionarni uređaji u obliku portala (između kojih sekreće vozilo) ili kranova i rampi (ispod kojih se kreće vozilo) najčešći su oblici kojise danas nalaze instalirani u europskim čeličanama i ljevaonicama kao i u tvrtkamakoje se bave sakupljanjem i pripravom čeličnog otpada. Danas postoji nizrazvijenih i komercijaliziranih sustava stacionarnog tipa za monitoringradionuklida u čeličnom otpadu, a vrlo često se susreću sustavi poput: BICRONASM III (SAD), NUSCAFE-Puma ES (SAD), EXPLORANIUM GR-510, GR-526, AT-900 (Kanada), BERTHOLD LB-128 (Njemačka), ESM -FHT 1388(Njemačka), ASPECT-Yantar 2L (Rusija), itd. Među stacionarne uređaje ubrajajuse i oni koji se koriste u kontrolnim laboratorijima metalurške industrije, a služe zaanalizu radionuklida u uzorcima materijala različitog podrijetla i oblika (prašina,strugotine, folije,...). Jedan od predstavnika ovog tipa uređaja je EXPLORANIUMGR-320 LAB (Kanada).
Instaliranje, mjerenje i dojavljivanjeOprema koja sačinjava stacionarne sustave po svojoj konfiguraciji
predstavlja visoko sofisticiranu spregu vrlo osjetljivih detektora za sve vrstezračenja i mikroprocesorsku tehnologiju uz izraženu jednostavnost za rukovanje.Mjerenja brzine doze zračenja provode se kontinuirano uz pohranjivanje podatakao razini prirodnog zračenja potrebnih za postupak evaluacije izmjerenog zračenjaza danu pošiljku čeličnog otpada. Na temelju provedenog mjerenja sustav dajeupute za nastavak aktivnosti: a) istovar, b) vraćanje pošiljke isporučitelju ili c)dodatnu kontrolu, što ovisi o razini eventualno utvrđene i izmjerene brzine dozezračenja (Slika 1). Stacionarni monitoring sustavi najčešće se upotrebljavaju zaotkrivanje srednje jakih i jakih y - emitera uključujući 60Co, I37Cs, l92Ir, 226Ra,232Th, i 241Am. Pri instalaciji ovih sustava, potrebno je voditi računa da detektoribudu što bliže vozilu koje se kontrolira (kamion, vagon). Na ovaj se načinsprječava smanjenje osjetljivosti za određivanje brzine doze zračenja izvora učeličnom otpadu koja je obično od 0,2 do 0,3 uSvh"1 ili uGyh"' na udaljenosti 1 mod stjenke vagona ili kamiona i jednaka je dvostrukom ili trostrukom višekratnikurazine prirodnog zračenja [6]
U slučaju pojave radioaktivnog onečišćenja čeličnog otpada koje poizmjerenoj razini zračenja predstavlja neposrednu opasnost po zdravlje ljudi uneposrednoj blizini, odnosno pojava poprima oblik izvanrednog događaja, nužno jepošiljku odmah izdvojiti i na propisnoj udaljenosti staviti pod nadzor te označiti ionemogućiti pristup zaposlenicima i drugim osobama. O ovome odmah izvijestitiUpravno nadležno tijelo za zaštitu od zračenja pri Ministarstvo zdravstva isocijalne skrbi (Inspektor za zračenje) i poštivati izdane naloge i upute u svezidaljnjeg postupanja sa onečišćenim čeličnim otpadom. Provedba ovih mjera mora
429
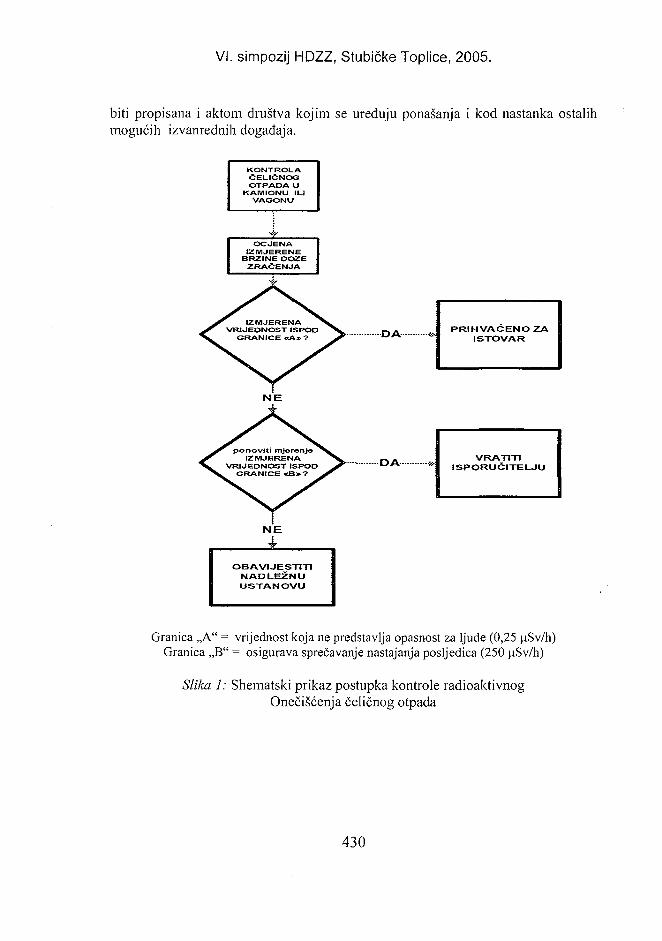
VI. simpozij HDZZ, Stubičke Toplice, 2005.
biti propisana i aktom društva kojim se uređuju ponašanja i kod nastanka ostalihmogućih izvanrednih događaja.
KONTROLAČELIČNOGOTPADA U
KAMIONU ILIVAGONU
OCJENAIZMJERENE
BRZINE DOZEZRAČENJA
• D APRIHVAĆENO ZA
ISTOVAR
D A - VRATITIISPORUČITELJU
OBAVIJESTITINADLEŽNUUSTANOVU
Granica „A" = vrijednost koja ne predstavlja opasnost za ljude (0,25 |iSv/h)Granica ,,B" = osigurava sprečavanje nastajanja posljedica (250 uSv/h)
Slika 1: Shematski prikaz postupka kontrole radioaktivnogOnečišćenja čeličnog otpada
430
VI. simpozij HDZZ, Stubičke Toplice, 2005.
ZAKLJUČAKUvođenjem sustava za nadzor i praćenje radionuklida u procesima proizvodnje
čelika i čeličnih odljevaka u hrvatskim čeličanama i ljevaonicama, unaprijedio bi sesustav upravljanja kvalitetom i okolišem bez kojeg se ne može zamisliti niti jedansuvremeni proizvođač čelika, te bi se istovremeno osigurala konkurentnosthrvatskih proizvoda na europskom tržištu gdje se uz uobičajene certifikate okvaliteti sve češće traže podaci i o (ne)prisutnosti radionuklida u čeliku i čeličnimproizvodima. Kako ne postoje hrvatske norme i propisi o graničnim vrijednostimasadržaja radionuklida u čeličnom otpadu, čeliku i čeličnim proizvodima, predlažese korištenje smjernica i preporuka izdanih od Međunarodne agencije za atomskuenergiju {International Atomic Energy Agency, IAEA).
LITERATURA[1] Sofilić T, Rastovčan-Mioč A, Cerjan-Stefanović Š. Strojarstvo 2001;43(l-3):65-70.[2] Sofilić T, Rastovčan-Mioč A, Cerjan-Stefanović Š, Grahek Ž Strojarstvo 2001; 43
(4-6):203-209[3] Isakov MG, Valuev NP, Moish YV, Nikonenkov NV: Monitoring and
Recovery of Contaminated Metallurgical Scrap, Proc. of the Workshop onRadioactive Contaminated Metallurgical Scrap Eds.:UN,ECE, Prague, CzechRepublic 26-28 May,1999, 191-197.
[4] Sofilić T, Cerjan-Stefanović Š, Rastovčan-Mioč, Mioč B. Application of DifferentAnalytical Methods to the Characterization of Metallurgical Waste, M. Pellei and A.Porta (Eds.), Proceedings of the second International Conference on Remediation ofContaminated Sediments - 2003, Eds.: A. Porta, Venice, Italy, 30. Sep-03.Oct 2003,ISBN 1-57477-143-4, Paper G-04, published by Batelle Press, Columbus, OH,http://www.battelle.org/bookstore
[5] Sofilić T, Barišić D, Grahek Ž, Cerjan-Stefanović Š, Rastovčan-Mioč A, Mioč B.Acta Metallurgica Slovaca 2004; 10(1): 29-35.
[6] http://www.taek.gov. tr/taek/tudnaem/yayinlar_pdf/nuclear/Nuclear
431
VI. simpozij HDZZ, Stubičke Toplice, 2005.
INTRODUCING RADIOACTIVITY MONITORING SYSTEMS INTHE PRODUCTION OF STEEL
Tahir Sofilić1 .Tihana Marjanović1 and Alenka Rastovčan-Mioč2
'Sisak Tube Mill Ltd., HR-44000 Sisak, Croatia2University of Zagreb, Faculty of Metallurgy, HR-44000 Sisak, Croatia
e-mail: [email protected]
Over the last twenty years, a significant number of cases of radioactivepollution has been recorded in metallurgical processes. However, it is not certainwhether the pollution was caused by increased uncontrolled disposal of wastecontaining radionuclides or whether it was the result of increased radioactivitymonitoring and control of metallic scrap. Many metal producers in the world havetherefore implemented systematic monitoring of radioactivity in their productionprocesses. Special attention was given to monitoring radioactivity in steel makingprocesses, which is still the most applied construction material with an annualoutput of over billion tonnes all over the world. Drawing on the experience of thebest known steel producers in Europe and world, Croatian steel mills find itnecessary and justified to introduce radioactivity monitoring and control systems ofradioactive elements in steel scrap, semi-finished and finished products. The aim ofthis paper is to point out the need to introduce the radioactivity monitoring andcontrol in steel and steel-casting production, and to inform experts in Croatian steelmills and foundries about potential solutions and current systems. At the sametime, we wanted to demonstrate how implementation of monitoring equipment canimprove quality management and environmental management systems. This wouldrender Croatian products competitive on the European market both in terms ofphysical and chemical properties and in terms of product quality certificates andradioactivity information. Since we lack our own standards and regulations tocontrol both domestic and imported steel scrap, semi-finished products (crude steel,hot and cold rolled strip) and finished products, we need apply current internationalrecommendations and guidelines, until we design our own monitoring system andadopt relevant legislation on the national level. This paper describes basic types ofradioactivity monitoring and control systems, the most frequent requirementsmonitoring equipment has to meet, as well as the measurement and informationflow in their application in steel and steel casting production.
432
VI. simpozij HDZZ, Stubičke Toplic HR0500091
DETERMINATION OF CHROMIUM(III), CHROMIUM(VI),MANGANESE(II) AND MANGANESE(VII) BY EDXRF
METHOD
Luka Mikelić1, Višnja Oreščanin', Stipe Lulić' and Mirta Rubčić2
'Ruđer Bošković Institute, Bijenička c. 54, HR-10000 Zagreb, Croatia2Faculty of Science, Zvonimirova 8, HR-10000 Zagreb, Croatia
e-mail: lmikelic(S>irb.hr
INTRODUCTIONIt is well known that metal exists in several forms in nature, each one with a
specific bio-toxicological activity. For this reason, it is necessary to use a sensitivemethod for determination different metal species. In solutions chromium may existin Cr(III) and Cr(VI) oxidation state and manganese dominantly in Mn(II) andMn(VII) oxidation state. In literature are various techniques for their determinationrecommended. The most employed techniques include UV-VIS spectrophotometry[1], high-performance liquid chromatography (HPLC) [2,3], capillaryelectrophoresis (CE) [4], catalytic cathodic stripping voltammetry [5], flame andfurnace atomic adsorption spectroscopy (AAS) [6-8] and mass spectrometry [9].
In the spectrophotometric methods several conditions such as temperatureand amount of reagent must be kept strictly constant in order to achieve goodreproducibility. Mayor disadvantage of these methods including AAS is inhandling complex sample matrices which have to be combined with a conversionstep of Cr(III) to Cr(VI) or Mn(VII) to Mn(II). Separation of chromium andmanganese species using chromatographic techniques often results in inadequatesensitivity for trace concentration of Cr and Mn present in real samples because oflow sample loading. In all flow injection techniques the objective is to separate asingle analyt or group of analytes from interfering components or matrices, oftensimultaneously achieving some degree of preconcentration and therefore gainingsensitivity at the expense of separation power. Electrochemical methods werehighly sensitive, but disadvantage of these methods is in poor selectivity forchromium determination especially in the presence of other metals and also insmall linear dynamic ranges. Disadvantage of capillary electrophoresis is in opticaldetection because the optical path length (diameter of the capillary) is generallyless than 100 um in order to favour better dissipation of Joule heat during theseparation process.
We report here a method for the determination of chromium and manganesevalence states in liquid samples. The method is based on the preconcentration ofCr(III), Cr(VI), Mn(II) and Mn(VII) with APDC followed by the energy dispersiveX-ray fluorescence (EDXRF) analysis.
433
VI. simpozij HDZZ, Stubičke Toplice, 2005.
EXPERIMENTALAll solutions were prepared using analytical reagents grade chemicals and
distilled water.APDC solution was prepared daily by dissolving APDC (Aldrich) in
distilled water to produce 1% (w/v) solution. Cr(III), Cr(VI), Mn(II) and Mn(VII)(1 ppm) stock solutions were prepared from Cr(NO3)3, K2Cr207, Mn(NO3)2 andKMnO4 (Merck). One thousand micrograms per liter solutions of EDTA wasprepared from KOMPLEKSAL II (Kemika). One hundred microgram per litrestandard solutions of Fe2+, Mn2+, V4+ were prepared from Merck standard solutionsfor AAS.
One hundred millilitres of a solutions containing 1000 ug/L of Cr(III) orCr(VI) or Mn(II) or Mn(VII) was adjusted to pH values 3-11 by addinghydrochloride acid and ammonium hydroxide to estimate the effect of pH on therecovery of chromium and manganese species. All pH measurements were madewith Mettler Toledo digital pH meter. The influence of organic meter, carbonate ormetal ions on the recovery of each specie over whole pH range was also tested.This was carried out to stimulate conditions occurring in natural waters. After pHadjustment 2 mL of 1% APDC solution was added into each flask. Aftercomplexation lasted for 20 minutes, the suspension was filtered through MilliporeHAWP (pore size 0.45 um, diameter 25 mm). A Millipore micro filtration systemwas used for that purpose. Prepared thin targets were air dried, protected by thinmylar foil, inserted into a plastic carrier and placed above the X-ray source of theX-ray spectrometer.
All targets were analysed with energy dispersive X-ray fluorescence(EDXRF) [10]. Instrumental and measurement conditions were presented in Table1. Spectrums were collected by Genie 2000 software (Canberra). Spectral datawere analysed by a WinAxil software (Canberra). The IR spectra of all compoundswere recorded using Perkin-Elmer FT Spectrum RX1 as KBr pellets in the regionof 4000-450 cm"1.
434
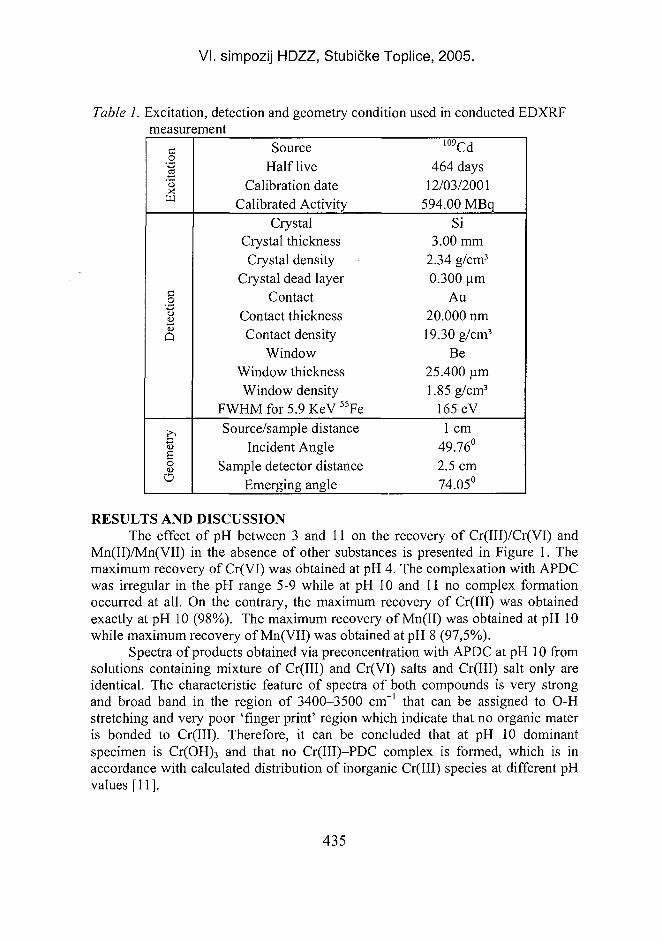
VI. simpozij HDZZ, Stubičke Toplice, 2005.
Table 1. Excitation, detection and geometry condition used in conducted EDXRFmeasurement
co
1'oXUJ
ion
tect
<L>Q
neti
reor
u
SourceHalf live
Calibration dateCalibrated Activity
CrystalCrystal thickness
Crystal densityCrystal dead layer
ContactContact thickness
Contact densityWindow
Window thicknessWindow density
FWHM for 5.9 KeV 5 5 FeSource/sample distance
Incident AngleSample detector distance
Emerging angle
1 0 9Cd464 days
12/03/2001594.00 MBq
Si3.00 mm
2.34 g/cm3
0.300 urnAu
20.000 nm19.30 g/cm3
Be25.400 um1.85 g/cm3
165 eV1 cm
49.76°2.5 cm74.05°
RESULTS AND DISCUSSIONThe effect of pH between 3 and 11 on the recovery of Cr(III)/Cr(VI) and
Mn(II)/Mn(VII) in the absence of other substances is presented in Figure 1. Themaximum recovery of Cr(VI) was obtained at pH 4. The complexation with APDCwas irregular in the pH range 5-9 while at pH 10 and 11 no complex formationoccurred at all. On the contrary, the maximum recovery of Cr(III) was obtainedexactly at pH 10 (98%). The maximum recovery of Mn(II) was obtained at pH 10while maximum recovery of Mn(VII) was obtained at pH 8 (97,5%).
Spectra of products obtained via preconcentration with APDC at pH 10 fromsolutions containing mixture of Cr(III) and Cr(VI) salts and Cr(III) salt only areidentical. The characteristic feature of spectra of both compounds is very strongand broad band in the region of 3400-3500 cm"' that can be assigned to O-Hstretching and very poor 'finger print' region which indicate that no organic materis bonded to Cr(III). Therefore, it can be concluded that at pH 10 dominantspecimen is Cr(OH)3 and that no Cr(III)-PDC complex is formed, which is inaccordance with calculated distribution of inorganic Cr(III) species at different pHvalues [11].
435
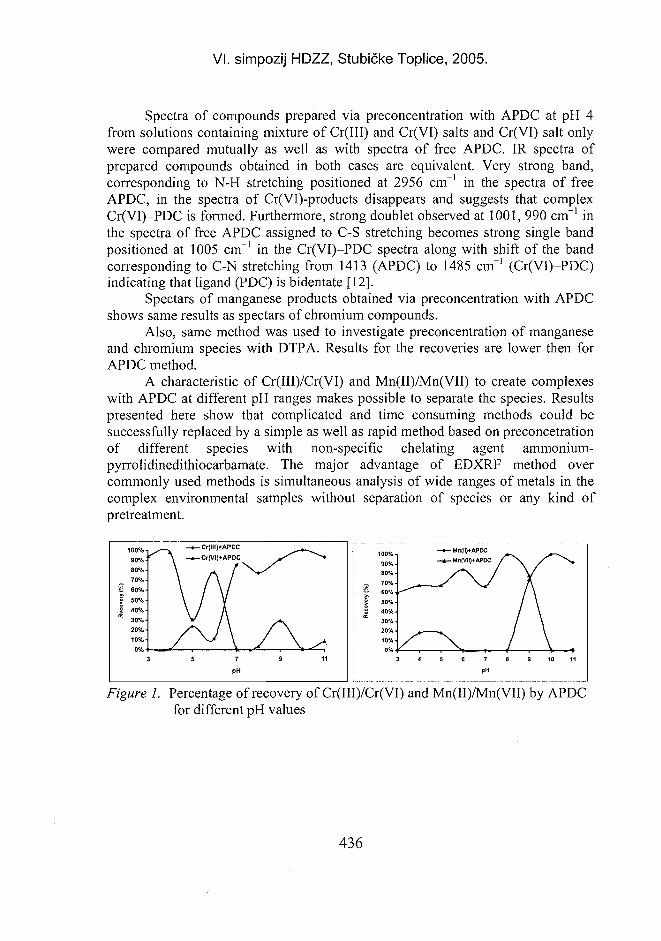
VI. simpozij HDZZ, Stubičke Toplice, 2005.
Spectra of compounds prepared via preconcentration with APDC at pH 4from solutions containing mixture of Cr(III) and Cr(VI) salts and Cr(VI) salt onlywere compared mutually as well as with spectra of free APDC. IR spectra ofprepared compounds obtained in both cases are equivalent. Very strong band,corresponding to N-H stretching positioned at 2956 cm"1 in the spectra of freeAPDC, in the spectra of Cr(VI)-products disappears and suggests that complexCr(VI)-PDC is formed. Furthermore, strong doublet observed at 1001, 990 cm"1 inthe spectra of free APDC assigned to C-S stretching becomes strong single bandpositioned at 1005 cm"1 in the Cr(VI)-PDC spectra along with shift of the bandcorresponding to C-N stretching from 1413 (APDC) to 1485 cm"1 (Cr(VI)-PDC)indicating that ligand (PDC) is bidentate [12].
Spectars of manganese products obtained via preconcentration with APDCshows same results as spectars of chromium compounds.
Also, same method was used to investigate preconcentration of manganeseand chromium species with DTPA. Results for the recoveries are lower then forAPDC method.
A characteristic of Cr(III)/Cr(VI) and Mn(II)/Mn(VII) to create complexeswith APDC at different pH ranges makes possible to separate the species. Resultspresented here show that complicated and time consuming methods could besuccessfully replaced by a simple as well as rapid method based on preconcetrationof different species with non-specific chelating agent ammonium-pyrrolidinedithiocarbamate. The major advantage of EDXRF method overcommonly used methods is simultaneous analysis of wide ranges of metals in thecomplex environmental samples without separation of species or any kind ofpretreatment.
1 0 0 % •
9 0 % •
7 0 % •
2 60% •• 50%-Š 40% •
" 3 0 % •
2 0 % •
1 0 % •
0 % •
—»—Cr(lll)*APDC\ -*-Cr(VI)+APDC
\ / \
\ A/\ / \/\ / Y\ / Av A/ \ J \
/ v/ \5 7
PH
/ \
/ \ /•*
9 11
Figure I. Percentage of recovery of Cr(III)/Cr(VI) and Mn(II)/Mn(VII) by APDCfor different pH values
436
VI. simpozij HDZZ, Stubičke Toplice, 2005.
REFERENCES[I] Llobat-Estelles M, Mauri-Aucejo AR, Lopez-Catalan MD. J Anal Chem 2001; 371:
358.[2] Ou-Yang GL, Jen JF. Anal Chim Acta 1993; 279: 329.[3] Collins CH, Pezzin SH, Rivera JFL, Bonato PS, Windmeller CC, Archundia C,
Collins KE. J Chromatogr A 1997; 789: 469.[4] Himeno S, Nakashima Y, Sano K. Anal Sci 1998; 14: 369.[5] Li Y,XueH. Anal Chim Acta 2001; 448: 121-134.[6] M.J. Marques, A. Morales-Rubio, A. Salvador, M. De la Guardia, Talanta 2001;
53:1229.[7] Gaspar A, Posta J. Anal Chim Acta 1997; 354: 151.[8] Pasullean B, Davidson CM, Littlejohn D. J Anal Atom Spectrom. 1995; 10: 241.[9] Andrle CM, Jakubowski N, Broekaert JAC. Spectrochim Acta B 1997;52: 189.[10] Oreščanin V, Mikelić L, Lulić S, Rubčić M.Anal Chim Acta 2004;527: 125-129.[II] Sperling M, Xu S, Welz B. Anal Chem 1992; 64: 3105.[12] Bernal C, Almeida Neves E, Cavalheiro ETG. Thermochim Acta 2001; 370: 50.
ABSTRACTThis paper describes EDXRF, a quick, sensitive and selective method for
determining Cr(III), Cr(VI), Mn(II) and Mn(VII) in environmental and industrialliquid samples via preconcentration with ammonium pyrrolidinedithiocarbamate(APDC) and diethylenetriaminepentaacetic acid (DTPA). The effect of pH in therange of 3-11 on the recovery of Cr(III), Cr(VI), Mn(II) and Mn(VII) wasinvestigated separately and in combination. The influence of organic matter,carbonate species and elements V and Fe was also tested on the recovery of eachchromium and manganese species (separately/in combination) over the whole pHrange in order to simulate conditions in natural waters that usually contain a certainamount of dissolved organic matter and carbonate ions. Characteristic of differentspecies to create complexes with APDC and DTPA in the different pH rangesmakes possible to separate those two species. All created complexes of Cr(III),Cr(VI), Mn(II) and Mn(VIII) with APDC and DTPA were characterised by IRspectroscopy.
437

NEIONIZIRAJUCA ZRAČENJA
NON-IONISING RADI A TIONS

HR0500092VI. simpozij HDZZ, Stubičke Toplice,
INSTRUMENTATION FOR ELECTROMAGNETIC FIELDGENERATION IN BIOLOGICAL MEASUREMENTS
Krešimir Malarić'', Roman Malarić', Mirta Tkalec2, Ivan Leniček1 and Alan Šala''University of Zagreb, Faculty of Electrical Engineering and Computing,
Unska 3, HR-10000 Zagreb, Croatia2University of Zagreb, Faculty of Science, Rooseveltov trg 6,
HR-10000 Zagreb, Croatiae-mail: [email protected]
INTRODUCTIONToday, there is a growing cooperation of scientist from different fields such
as medicine, biology, physics and electrical engineering. The research inbiomedicine is impossible without the use of technological advances from differentareas. Ensuring controlled and well known exposition conditions is of utmostimportance for successfull experiment. Simulation of the surrounding conditions isnot an easy task and good preparation as well as the use of numerical methods andmeasurements is needed. The experient with biological material include thecreation of the conditions similar to the real one. People are exposed daily todifferent types of electromagnetic fields. This exposure includes both professional(workers) and every day (ordinary people) type.
Electromagnetic sources to which humans are exposed have different powersand frequency. On extra low frequencies (50 Hz), this includes power systems,home electrical appliances such as TV, electrical rasors, machine washes and soon. The most widely spread sources of electromagnetic radiation are broadcastingtransmitters and mobile base station. FM transmitters are working in the frequencyrange 88-108 MHz, while TV operate on 47-68 MHz, 174-230 MHz and 470-862MHz. The mobile base station operate in the frequency range about 900 and 1800MHz. The power of base station can be several hundred watts, while mobilephones can have as much as 2 W.
For the creation of ELF fields (50 Hz) separate sources for electrical andmagnetic fields are used, while for higher frequencies (900 - 1800 MHz) onestructure can be used for both electric and magnetic field creation.
441
VI. simpozij HDZZ, Stubičke Toplice, 2005.
NEAR AND FAR FIELDElectromagnetic field consists of electric and magnetic component. They can
exist separately only in the far field region where wave impedance is
=377 Q (1)
In the near field, it is not possible to know whether the source is of electric ormagnetic origin. For point sources, the far field is when R> Xlln, where R is thedistance from the source and A is the wavelength defined as
(2)
where c is the speed of light (300000 km/s) and/is the frequency of the signal.For frequency of 50 Hz, the far field is 955 km away from the source, while
at 900 MHz the far field is 5 cm from the point source. This means that at highfrequency, the same source for generation of electric or magnetic field can be usedfor practical purposes, while at the low frequencies, we need separateinstrumentation for electric or magnetic field.
U
a.E
1
.001377k100k
37.7k10k
3.77k1k
377100
37.710
3.77
Wave Impedance vs. Distance.003 .01 .03 .1 .3 1 3 10
377m
^ — ^ 7 —
tn
.001 .003 .01 .03 .1 .3 1Distance in units of R=yj2%
10
377k100k^37.7k|10k e3.77kj-1k N377 S100 ra37.7 S
3.771 |377m
Figure I. Wave impedance versus distance
Knowing electric field, in the far field region, we can calculate the magneticfield and vice versa. For ELF (extra low frequency) this does not make sense, butfor VHF (very high frequency) it is valid.
442
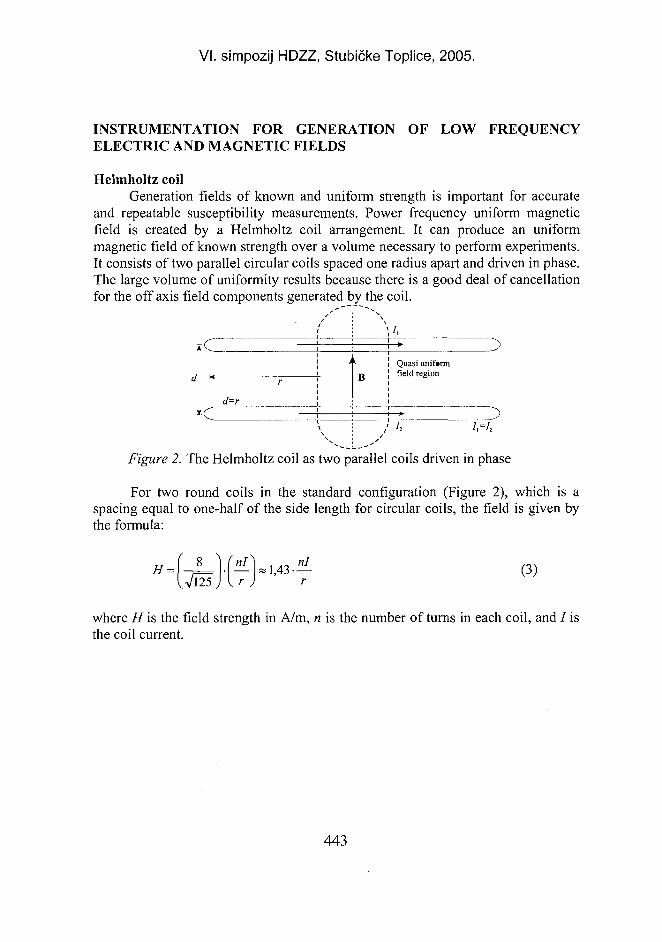
VI. simpozij HDZZ, Stubičke Toplice, 2005.
INSTRUMENTATION FOR GENERATION OF LOW FREQUENCYELECTRIC AND MAGNETIC FIELDS
Helmholtz coilGeneration fields of known and uniform strength is important for accurate
and repeatable susceptibility measurements. Power frequency uniform magneticfield is created by a Helmholtz coil arrangement. It can produce an uniformmagnetic field of known strength over a volume necessary to perform experiments.It consists of two parallel circular coils spaced one radius apart and driven in phase.The large volume of uniformity results because there is a good deal of cancellationfor the off axis field components generated by the coil.
AC
d !-
d=r
r
>''
i
\\
Ns.
\
BQuasi uniformfield region
Figure 2. The Helmholtz coil as two parallel coils driven in phase
For two round coils in the standard configuration (Figure 2), which is aspacing equal to one-half of the side length for circular coils, the field is given bythe formula:
H = (3)
where H is the field strength in A/m, n is the number of turns in each coil, and / isthe coil current.
443
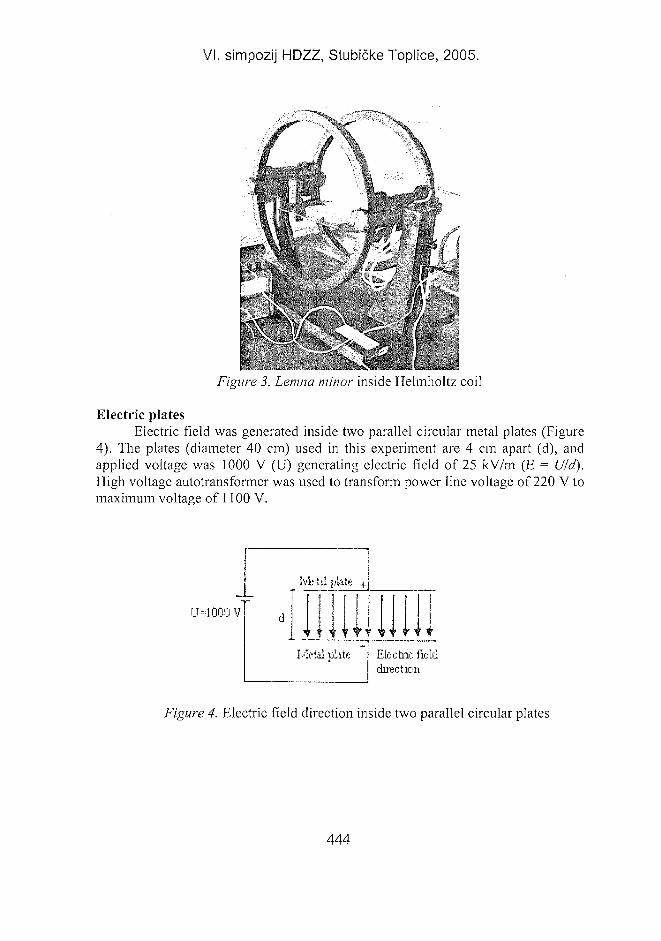
VI. simpozij HDZZ, Stubičke Toplice, 2005.
A" \
J. Lemna minor inside Helmholtz coil
Electric platesElectric field was generated inside two parallel circular metal plates (Figure
4). The plates (diameter 40 cm) used in this experiment are 4 cm apart (d), andapplied voltage was 1000 V (U) generating electric field of 25 kV/m (E = Uld).High voltage autotransformer was used to transform power line voltage of 220 V tomaximum voltage of 1100 V.
»lit«
tElectric fielddirection
Figure 4. Electric field direction inside two parallel circular plates
444
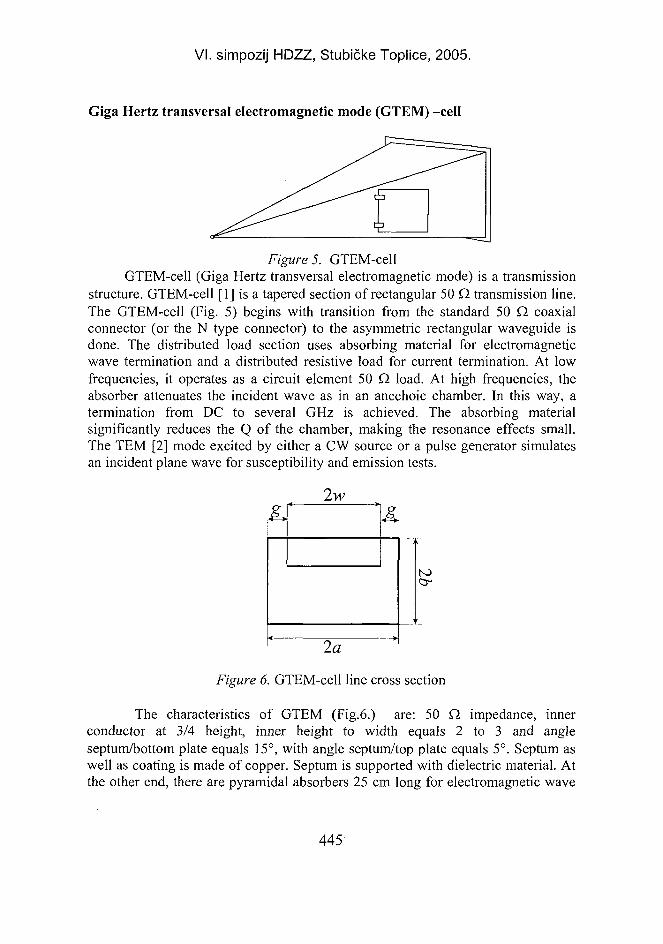
VI. simpozij HDZZ, Stubičke Toplice, 2005.
Giga Hertz transversal electromagnetic mode (GTEM) -cell
Figure 5. GTEM-cellGTEM-cell (Giga Hertz transversal electromagnetic mode) is a transmission
structure. GTEM-cell [1] is a tapered section of rectangular 50 Q transmission line.The GTEM-cell (Fig. 5) begins with transition from the standard 50 Q coaxialconnector (or the N type connector) to the asymmetric rectangular waveguide isdone. The distributed load section uses absorbing material for electromagneticwave termination and a distributed resistive load for current termination. At lowfrequencies, it operates as a circuit element 50 Q. load. At high frequencies, theabsorber attenuates the incident wave as in an anechoic chamber. In this way, atermination from DC to several GHz is achieved. The absorbing materialsignificantly reduces the Q of the chamber, making the resonance effects small.The TEM [2] mode excited by either a CW source or a pulse generator simulatesan incident plane wave for susceptibility and emission tests.
to
2a
Figure 6. GTEM-cell line cross section
The characteristics of GTEM (Fig.6.) are: 50 Q. impedance, innerconductor at 3/4 height, inner height to width equals 2 to 3 and angleseptum/bottom plate equals 15°, with angle septum/top plate equals 5°. Septum aswell as coating is made of copper. Septum is supported with dielectric material. Atthe other end, there are pyramidal absorbers 25 cm long for electromagnetic wave
445
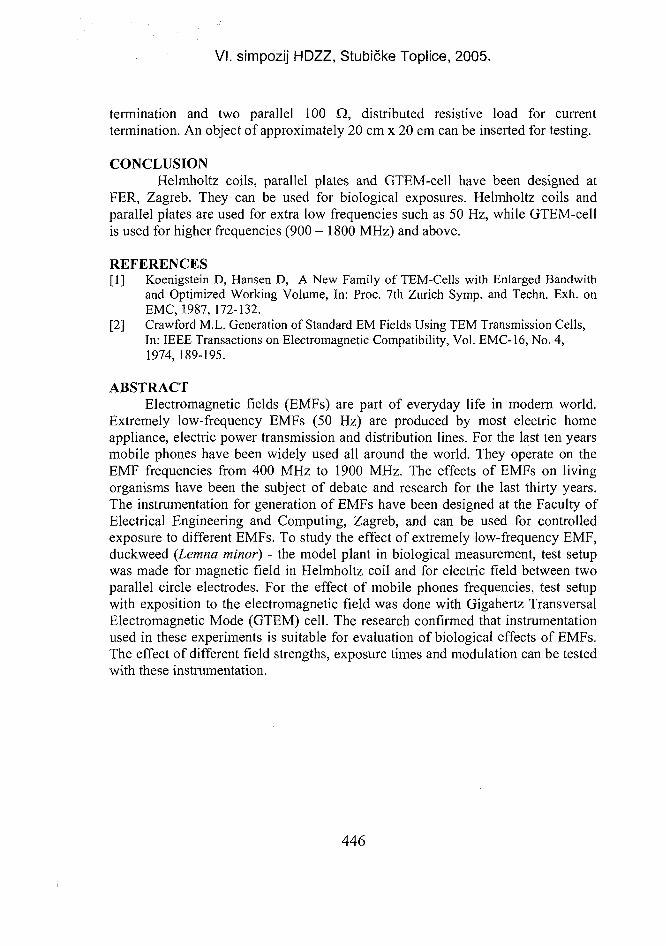
VI. simpozij HDZZ, Stubičke Toplice, 2005.
termination and two parallel 100 Cl, distributed resistive load for currenttermination. An object of approximately 20 cm x 20 cm can be inserted for testing.
CONCLUSIONHelmholtz coils, parallel plates and GTEM-cell have been designed at
FER, Zagreb. They can be used for biological exposures. Helmholtz coils andparallel plates are used for extra low frequencies such as 50 Hz, while GTEM-cellis used for higher frequencies (900 - 1800 MHz) and above.
REFERENCES[1] Koenigstein D, Hansen D, A New Family of TEM-Cells with Enlarged Bandwith
and Optimized Working Volume, In: Proc. 7th Zurich Symp. and Techn. Exh. onEMC, 1987, 172-132.
[2] Crawford M.L. Generation of Standard EM Fields Using TEM Transmission Cells,In: IEEE Transactions on Electromagnetic Compatibility, Vol. EMC-16, No. 4,1974, 189-195.
ABSTRACTElectromagnetic fields (EMFs) are part of everyday life in modern world.
Extremely low-frequency EMFs (50 Hz) are produced by most electric homeappliance, electric power transmission and distribution lines. For the last ten yearsmobile phones have been widely used all around the world. They operate on theEMF frequencies from 400 MHz to 1900 MHz. The effects of EMFs on livingorganisms have been the subject of debate and research for the last thirty years.The instrumentation for generation of EMFs have been designed at the Faculty ofElectrical Engineering and Computing, Zagreb, and can be used for controlledexposure to different EMFs. To study the effect of extremely low-frequency EMF,duckweed (Lemna minor) - the model plant in biological measurement, test setupwas made for magnetic field in Helmholtz coil and for electric field between twoparallel circle electrodes. For the effect of mobile phones frequencies, test setupwith exposition to the electromagnetic field was done with Gigahertz TransversalElectromagnetic Mode (GTEM) cell. The research confirmed that instrumentationused in these experiments is suitable for evaluation of biological effects of EMFs.The effect of different field strengths, exposure times and modulation can be testedwith these instrumentation.
446
w , . .. 1 J r v , . , o* u-, T i- n HR0500093VI. simpozij HDZZ, Stubicke Toplice, 2
EFFECT OF ELECTROMAGNETIC FIELDS ON DUCKWEED(LEMNA MINOR) AND ALGA (CHLORELLA KESSLERI)
Mirta Tkalec', Krešimir Malarić2, Roman Malarić2,Željka Vidaković-Cifrek' and Branka Pevalek-Kozlina'
'University of Zagreb, Faculty of Science, Rooseveltov trg 6,HR-10000 Zagreb, Croatia
2University of Zagreb, Faculty of Electrical Engineering and Computing, Unska 3,HR-10000 Zagreb, Croatia
e-mail: [email protected]
INTRODUCTIONExtremely low frequency (ELF) electromagnetic fields (EMFs) of 50-60 Hz
are produced by almost every electric home appliance as well as by electric powertransmission and distribution lines while various kinds of radiofrequency fields (10MHz - 300 GHz) are used to transmit information (TV, radio, mobile phones andsatellite communications). Although ELF waves and radiofrequency waves arelacking energy to break chemical bonds, a wide range of EMF bioeffects werefound including changes in the cell membrane's permeability and interference withions and molecules like DNA and proteins [1-2].
Plants are essential components of healthy ecosystem. They are eucaryoticmulticellular organisms sensitive to different kind of stresses. Many of them areeasy to grow in aseptic and controlled laboratory conditions. Therefore they can beuseful test organisms [3]. However, there is still lack of investigations of EMFsefect on plants.
In this work the effect of extremely low EMFs and radiofrequency EMFson growth of duckweed Lemna minor and photosynthesis of green alga Chlorellakessleri has been investigated. Instrumentation for controlled exposure to EMFswas designed at the Faculty of Electrical Engineering and Computing, Universityof Zagreb.
MATERIAL AND METHODSPlant material
Unicellular green algae, Chlorella kessleri Fott et Novak, strand LARG/1were grown in plastic Petri dishes on PRATT's solid nutrient solution withmodifications [4] to the late logarithmic phase when they were exposed to EMFs.Duckweed Lemna minor L. was maintained under axenic conditions on themodified Pirson-Seidel's nutrient solution [5]. Experimental cultures were startedby transferring 10 plants with 2-3 fronds to plastic Petri dish (diameter 9 cm), onthe fresh nutrient solution containing 0.8% (w/w) agar. Both, duckweeds and algae
447
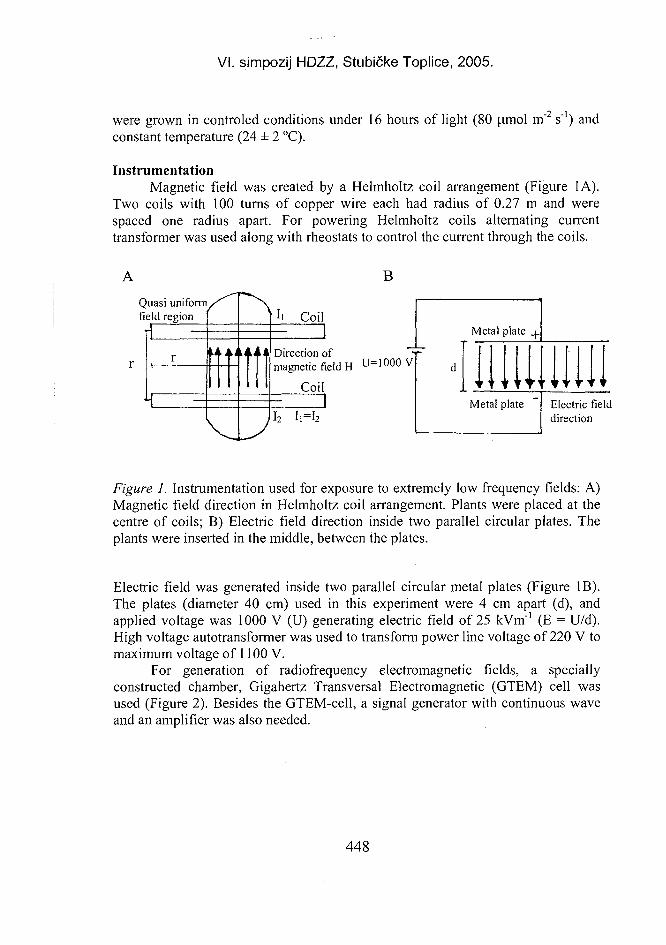
VI. simpozij HDZZ, Stubičke Toplice, 2005.
were grown in controled conditions under 16 hours of light (80 (amol m"2 s"1) andconstant temperature (24 ± 2 °C).
InstrumentationMagnetic field was created by a Helmholtz coil arrangement (Figure 1A).
Two coils with 100 turns of copper wire each had radius of 0.27 m and werespaced one radius apart. For powering Helmholtz coils alternating currenttransformer was used along with rheostats to control the current through the coils.
A
Quasi uniformfield region
B
Coil
Direction of ""•magnetic field H U=I000V
Coil
h=h
Metal plate
II WiMetal plate Electric field
direction
Figure 1. Instrumentation used for exposure to extremely low frequency fields: A)Magnetic field direction in Helmholtz coil arrangement. Plants were placed at thecentre of coils; B) Electric field direction inside two parallel circular plates. Theplants were inserted in the middle, between the plates.
Electric field was generated inside two parallel circular metal plates (Figure IB).The plates (diameter 40 cm) used in this experiment were 4 cm apart (d), andapplied voltage was 1000 V (U) generating electric field of 25 kVm"1 (E = U/d).High voltage autotransformer was used to transform power line voltage of 220 V tomaximum voltage of 1100 V.
For generation of radiofrequency electromagnetic fields, a speciallyconstructed chamber, Gigahertz Transversal Electromagnetic (GTEM) cell wasused (Figure 2). Besides the GTEM-cell, a signal generator with continuous waveand an amplifier was also needed.
448
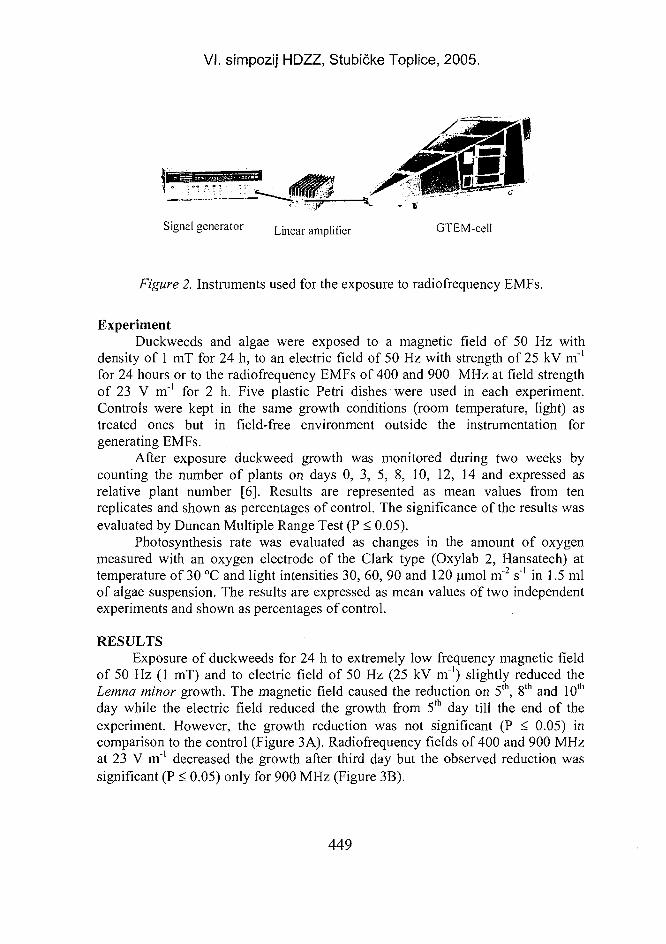
VI. simpozij HDZZ, Stubičke Toplice, 2005.
~F ^ - tSignal generator L j n e a r a m p | i f i e r GTEM-cell
Figure 2. Instruments used for the exposure to radiofrequency EMFs.
ExperimentDuckweeds and algae were exposed to a magnetic field of 50 Hz with
density of 1 mT for 24 h, to an electric field of 50 Hz with strength of 25 kV irf'for 24 hours or to the radiofrequency EMFs of 400 and 900 MHz at field strengthof 23 V m"1 for 2 h. Five plastic Petri dishes were used in each experiment.Controls were kept in the same growth conditions (room temperature, light) astreated ones but in field-free environment outside the instrumentation forgenerating EMFs.
After exposure duckweed growth was monitored during two weeks bycounting the number of plants on days 0, 3, 5, 8, 10, 12, 14 and expressed asrelative plant number [6]. Results are represented as mean values from tenreplicates and shown as percentages of control. The significance of the results wasevaluated by Duncan Multiple Range Test (P < 0.05).
Photosynthesis rate was evaluated as changes in the amount of oxygenmeasured with an oxygen electrode of the Clark type (Oxylab 2, Hansatech) attemperature of 30 °C and light intensities 30, 60, 90 and 120 umol m"2 s"1 in 1.5 mlof algae suspension. The results are expressed as mean values of two independentexperiments and shown as percentages of control.
RESULTSExposure of duckweeds for 24 h to extremely low frequency magnetic field
of 50 Hz (1 mT) and to electric field of 50 Hz (25 kV m"') slightly reduced theLemna minor growth. The magnetic field caused the reduction on 5th, 8th and 10th
day while the electric field reduced the growth from 5th day till the end of theexperiment. However, the growth reduction was not significant (P < 0.05) incomparison to the control (Figure 3 A). Radiofrequency fields of 400 and 900 MHzat 23 V m"1 decreased the growth after third day but the observed reduction wassignificant (P < 0.05) only for 900 MHz (Figure 3B).
449
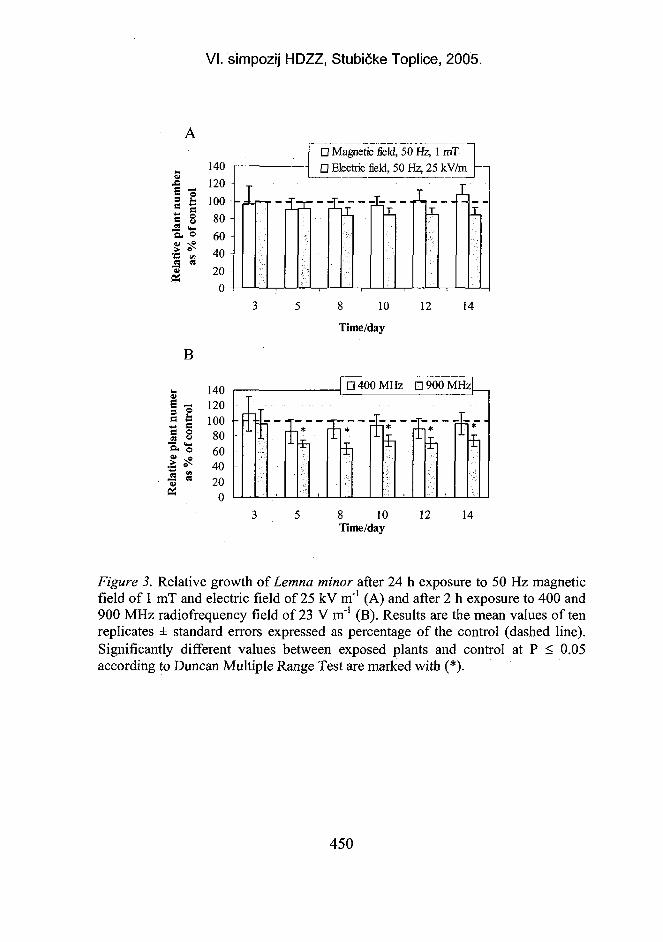
VI. simpozij HDZZ, Stubičke Toplice, 2005.
B
14012010080 -6040 -20 -0
C
C
'a.
1ej
"o! •
eo
Vi
a
14012010080604020
0
D Magnetic field, 50 Hz, 1 mT 1D Electric field, 50 Hz, 25 kV/mJ-
7 T "L
5 8 10 12 14
Time/day
• 400 MHz • 900 MHz
^ rPi * 7-Pr* "rn *"
5 8 10 12 14Time/day
Figure 3. Relative growth of Lemna minor after 24 h exposure to 50 Hz magneticfield of 1 mT and electric field of 25 kV m*1 (A) and after 2 h exposure to 400 and900 MHz radiofrequency field of 23 V m"1 (B). Results are the mean values of tenreplicates ± standard errors expressed as percentage of the control (dashed line).Significantly different values between exposed plants and control at P < 0.05according to Duncan Multiple Range Test are marked with (*).
450
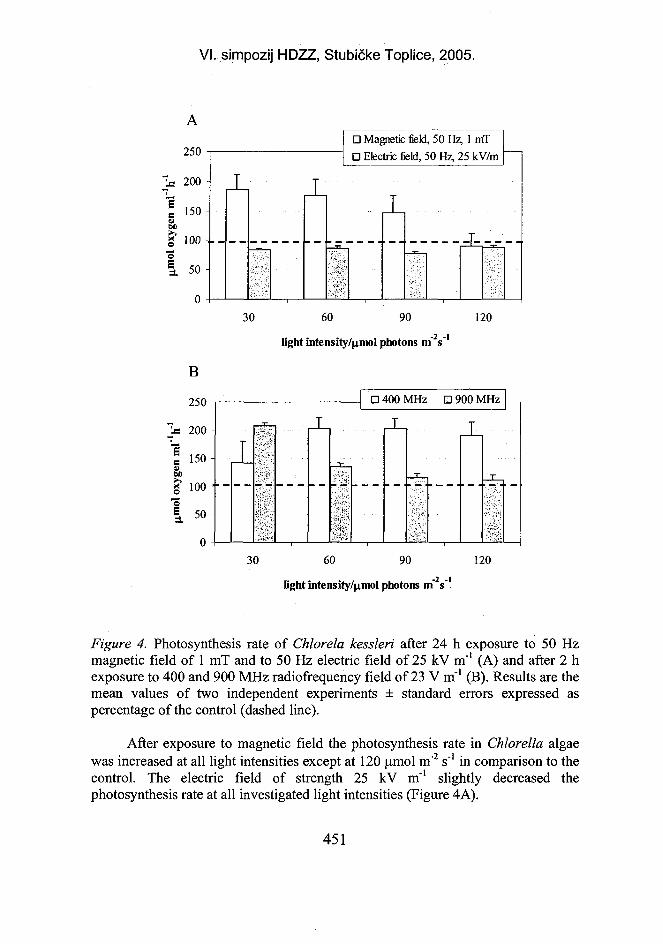
VI. simpozij HDZZ, Stubičke Toplice, 2005.
250
200 -
E§CD^ >
150 -
100 -•
50 -
!
1
B
250
200
150 -
100
50
0
D Magnetic field, 50 Hz, 1 mT• Electric field, 50 Hz, 25 kV/m I
30 60 90 120-2 -1light intensity/|imol photons m" s
i
•'i
T• 400 MHz
T
•
D 900 MHz
T_
T
30 60 90 120
light intensity/^mol photons m" s"
Figure 4. Photosynthesis rate of Chlorela kessleri after 24 h exposure to 50 Hzmagnetic field of 1 mT and to 50 Hz electric field of 25 kV m'1 (A) and after 2 hexposure to 400 and 900 MHz radiofrequency field of 23 V m"1 (B). Results are themean values of two independent experiments ± standard errors expressed aspercentage of the control (dashed line).
After exposure to magnetic field the photosynthesis rate in Chlorella algaewas increased at all light intensities except at 120 (imol m"2 s'1 in comparison to thecontrol. The electric field of strength 25 kV m"1 slightly decreased thephotosynthesis rate at all investigated light intensities (Figure 4A).
451
VI. simpozij HDZZ, Stubičke Toplice, 2005.
The photosynthesis rate of Chlorella kessleri exposed for 2 h to EMF of 400MHz with strength of 23 V m"1 increased at all light intensities in comparison withthe control while at 900 MHz photosynthesis increased at 30 and 60 p.mol m"2 s"1
(Figure 4B).
CONCLUSIONThe fields applied in this work were in order of magnitude as would be
expected from home appliances (magnetic field) as well as those expected justbelow high voltage power lines (electric field). Investigated radiofrequency EMFs(400 and 900 MHz) are similar to frequencies used in mobile communicationsystems.
Our results showed that radiofrequency EMF of 400 MHz at 23 Vm~'significantly affected the growth of Lemna minor. Magnetic field of 50 Hz andradiofrequency EMFs (400 and 900 MHz) stimulated the photosynthesis ofChlorella kessleri while 50 Hz electric field decreased it.
REFERENCES[1] Easterly CE. A perspective on electromagnetic field bioeffects and risk assessment.
Bioelectrochem Bioenerg 1994;35:1-11.[2] Berg H. Possibilities and problems of low frequency weak electromagnetic fields in
cell biology. Bioelectrochem Bioenerg 1995;38:153-159.[3] Wang W. Literature review on duckweed toxicity testing. Environ. Res 1991 ;52:7-
22.[4] Horvatić J, Vidaković-Cifrek Ž, Regula I. Limnol Report 2000;33:89-94.[5] Pirson A, Seidel F. Zell- und stoffwechselphysiologiche Untersuchungen an der
Wurzel von Lemna minor unter besonderer Berucksichtigung von Kalium- undCalciummangel. Planta 1950;38:431-473.
[6] Ensley HE, Barber JT, Polito MA, Oliver AI. Toxicity and metabolism of 2,4-diclorophenol by the aquatic angiosperm Lemna gibba. Environ Toxicol Chem1994;13(2):325-331.
452
VI. simpozij HDZZ, Stubičke Toplice, 2005.
ABSTRACT
Electricity produces extremely low frequency fields (50-60 Hz) whilevarious kinds of radiofrequency fields (10 MHz-300 GHz) are used to transmitinformation (TV, radio, mobile phones and satellite communications). Duckweed(Lemna minor) and green algae {Chlorella kessleri) were exposed to the magneticfield of 50 Hz in a Helmholtz coil, to an electric field of 50 Hz between twoparallel circle electrodes, and to electromagnetic fields of 400 and 900 MHz in aGigahertz Transversal Electromagnetic Mode cell. The relative growth of Lemnaminor exposed to extremely low frequency alternating magnetic field of 50 Hz (1mT) for 24 hours was slightly reduced at the beginning of the experiment while a50 Hz electric field (25 kV/m) slightly reduced its growth during the second weekof the experiment. Radiofrequencies of 400 and 900 MHz (23 V/m) applied for twohours decreased the duckweed growth after the third day, but only 900 MHzaffected it significantly. The rate of photosynthesis in green algae increased afterexposure to the magnetic field of 50 Hz, but decreased after exposure to the electricfield of 50 Hz. Radiofrequencies of 400 and 900 MHz generally increased its rateof photosynthesis.
453
VI. simpozij HDZZ, Stubičke Toplice, 2 HR0500094
USPOREDBA DJELOVANJA MIKROVALNOG ZRAČENJAFREKVENCIJA 864 I 935 MHz NA STANICE U KULTURI
Ivan Pavičić'', Ivančica Trošić1 i Antonio Šarolić2
'institut za medicinska istraživanja i medicinu rada,Ksaverska c. 2, 10000 Zagreb
2Fakultet elektrotehnike i računarstva, Sveučilište u Zagrebu,Unska 3, 10000 Zagrebe-mail: [email protected]
UVODIzvori radiofrekvencijskog mikrovalnog (RF/MW) zračenja naročito iz
sustava mobilne telefonije su sveprisutni. Iz često proturječnih rezultataobjavljenih studija teško je dobiti jasnu predodžbu o biološkom potencijaluRF/MW zračenja. Imajući na umu veliki broj korisnika usluga mobilnetelefonije jasno je da bi i mali nepovoljni zdravstveni učinci mogli imatinepredvidive posljedice po ljudsko zdravlje [1]. In vivo istraživanja biološkihpokazatelja djelovanja RF/MW zračenja pokazala su jasan utjecaj na rast, razvoj isazrijevanje stanica hematopoieze [2-6]. Rezultati in vitro istraživanja nedvojbenoukazuju na promjene staničnog rasta i razvoja, morfologije stanice, i ekspresijegena [7-,9].
Svrha ovog rada je uvid i usporedba djelovanja RF/MW polja frekvencija864 i 935 MHz na osnovne parametre rasta stanica u kulturi.
MATERIJALI I METODEStanična linija V79 (fibroblasti pluća kineskog hrčka), izlagana je 1, 2 i 3
sata poljima frekvencija od 864 i 935 MHz. Tretirani uzorci i odgovarajućikontrolni uzorci stanica držani su u kontroliranim uvjetima na 37°C, 5% CO2 ivisokom postotku vlage. Jakost električnog polja frekvencije 864 MHz iznosila je7,3 ± 3 V/m, a za 935 MHz jakost polja iznosila je 8,2 ± 0,3 V/m. Korištene sutransverzna elektromagnetska (TEM) komora i gigahercna transverznaelektromagnetska (GTEM) komora. Izvor signala frekvencije od 864 MHz bio jePHILIPS PM 5508 generator s pripadajućim pojačalom, a izvor frekvencije od 935MHz bio je signalni generator Hellwet Packard HP8657A. U svrhu dobivanjavrijednosti specifične brzine apsorpcije (SAR) za živu stanicu procijenjene suvrijednosti dielektričnih osobina staničnih komponenata u skladu s njihovimpojedinačnim volumnim udjelom [10]. Prosječni SAR je iznosio 0,08 W/kg za 864MHz te 0,12 W/kg za 935 MHz. Za praćenje rasta stanične kulture nasađeno jelxlO4 stanica po mililitru hranjivog medija. Tijekom pet dana pratio se raststanične kulture brojanjem stanica nakon svakog vremenskog perioda zračenjapomoću svjetlosnog mikroskopa [11]. Za određivanje sposobnosti stvaranja
454
VI. simpozij HDZZ, Stubičke Toplice, 2005.
kolonija stanice su nasađene u koncentraciji 40 st/ml hranjivog medija. Nakonpočetne lag-faze stanice su izlagane 1, 2 i 3 sata određenim uvjetima RF/MWpolja. Nakon sedam dana uzgoja određenje broj nastalih kolonija [11]. Vijabilnoststanica određena je pomoću Tripan Blue testa. Omjer između mrtvih i živih stanicautvrđenje neposredno nakon izlaganja i tijekom svih pet dana trajanja pokusa [11].Rezultati su analizirani ANO VA/M ANO VA testom u statističkom programuStatistica 5.5.
REZULTATI I RASPRAVAKrivulje staničnog rasta nakon 1, 2 i 3 sata izlaganja RF poljima frekvencija
864 i 935 MHz prikazane su na Slikama 1-3. U odnosu na odgovarajuće kontrolneuzorke, statistički značajni pad u broju stanica izloženih polju 864 MHz primijećen uuzoraka zračenih 2 i 3 sata trećeg dana uzgoja (p<0,05). Primjenom polja frekvencije935 MHz na kulturu stanica u trajanju od 3 sata, u odnosu na kontrolne staničneuzorke, nađen je značajni pad u broju stanica treći dan nakon zračenja (p<0,05). Uodnosu na kontrolne uzorke, izlaganje stanica u kulturi 1, 2 i 3 sata RF/MW poljimafrekvencija 864 i 935 MHz nije značajno utjecalo na sposobnost stvaranja novihkolonija. Vijabilnost staničnih kultura izloženih poljima frekvencija 864 i 935 MHzkretala se u fiziološkom rasponu od 98-100 % živih stanica za sve vremenskeperiode zračenja. Uvjeti izlaganja nisu utjecali na vrijeme udvostručenja staničnekulture. Svaka točka na grafikonima predstavlja srednju vrijednost dobivenu iz šestodvojenih staničnih uzoraka. Rezultati dobiveni izlaganjem kulture fibroblastakineskog hrčka RF/MW poljima frekvencija 864 i 935 MHz su u skladu srezultatima iz 1998. autora Kwee i Rasmarka koji su našli značajno smanjenje stoperasta ljudskih epitelnih stanica izloženih RF/MW polju frekvencije 960 MHz ivrijednosti SAR-a od 0,021 do 2.1 W/kg [12]. Autori su ukazali na tzv. "efektprozora", odnosno, da se maksimalni učinak na proliferaciju stanica javlja samo naodređenim frekvencijama RF/MW polja. U skladu s time objavljene su promjene urastu kulture V79 stanica izloženih RF/MW polju frekvencije od 846 MHz,prosječnom SAR-u 0,08 W/kg [13]. Djelovanje RF/MW polja frekvencije 835 MHz,snage 40 i 8,1 mW/cm2 na kulturu ljudskih astrocitoma izazvalo je promjene staničneproliferacije samo pri snazi polja 8.1 mW/cm2 [14]. Prolazni pad ukupnog brojastanica bez narušavanja vijabilnosti i sposobnosti stvaranja kolonija nakon 1, 2 i 3sata izlaganja kulture RF/MW poljima frekvencija 864 MHz, prosječne vrijednostiSAR-a 0,08 W/kg, i 935 MHz, prosječnog SAR-a 0,12 W/kg upućuju na gotovoistovjetan način djelovanja RF/MW zračenja dvaju primjenjenih frekvencijskih poljana procese rasta i razvoja stanica u kulturi.
455
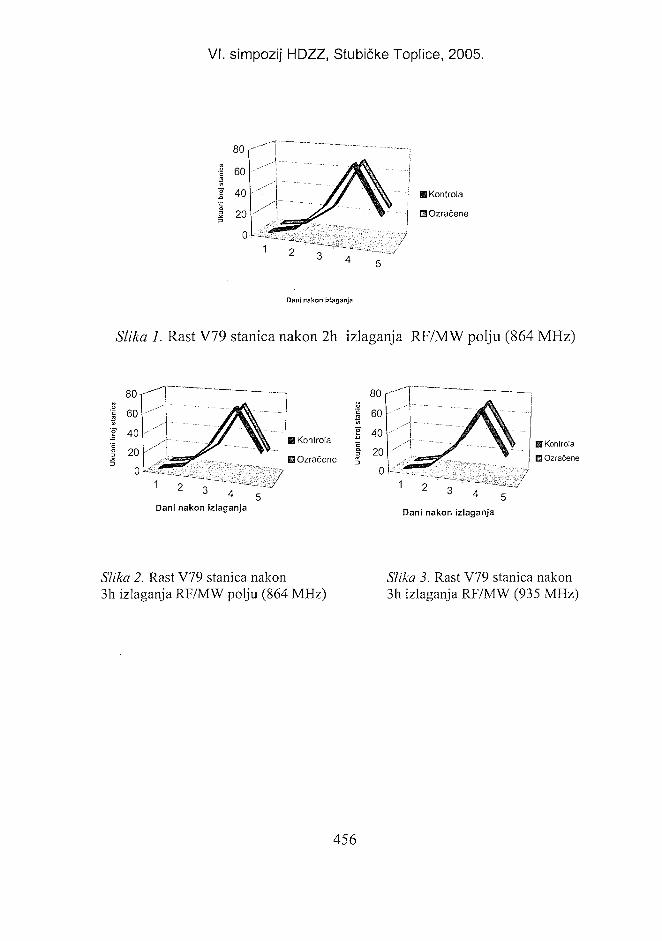
VI. simpozij HDZZ, Stubičke Toplice, 2005.
80
i 6 0
1 40
1 20 / j
Dani nakon izlaganja
Slika 1. Rast V79 stanica nakon 2h izlaganja RF/MW polju (864 MHz)
Dani nakon izlaganja
80 """f"60
40
20
0
M Kontrola
M Ozračene
Dani nakon izlaganja
Slika 2. Rast V79 stanica nakon3h izlaganja RF/MW polju (864 MHz)
Slika 3. Rast V79 stanica nakon3h izlaganja RF/MW (935 MHz)
456
VI. simpozij HDZZ, Stubičke Toplice, 2005.
ZAHVALARad je izrađen za projekt "Biomedicinski učinci RF/MW zračenja" MZOŠ-
RH. TEM komora korištena je ljubaznošću Doc.dr.sc. K. Malarića, Zavod zaradiokomunikacije i visokofrekvencijsku elektroniku, FER u Zagrebu
LITERATURA[I] Elwood JM. Epidemiological studies of radio frequency exposures and human
cancer, Bioelectromagnetics, S6, 2003;63-73[2] Trosic I, Busljeta I, Pavicic I. Blood-forming system in rats after whole-body
microwave exposure : reference to the lymphocytes. Tox Lett 2004; 154: 125-132[3] Trošić I, Bušljeta I, Modlic B. Investigation of the genotoxic effect of microwave
irradiation in rat bone marrow cells: in vivo exposure. Mutagenesis 2004;19:5;361-4[4] Trošić I, Bušljeta I, Kašuba V, Rozgaj R. Micronucleus induction after whole-body
microwave irradiation of rats. Mutat Res 2002;521;73-79[5] Trosic I, Busljeta I.Frequency of micronucleated erythrocytes in the rat bone marrow
exposed to 2.45 GHz radiation. Phys Scripta 2004. (u tisku)[6] Busljeta I, Trosic,I, Milkovic-Kraus S. Erythropoietic changes in rats after 2.45 GHz
nonthermal irradiation. Int J Hyg Environ Health 2004;207:l-6[7] Stagg RB, Thomas WJ, Jones RA, Adey WR. DNA Synthesis and Cell Proliferation
in C6 Glioma and Primary Glial Cells Exposed to a 836.55 MHz ModulatedRadiofrequency Field, Bioelectromagnetics 1997; 18:230-236.
[8] Pacini S, Ruggiero M, Iacopo S, Aterini S, Gulisano F, Gulisano M. Exposure toglobal system for mobile communication [GSM] cellular phone radiofrequencyalters gene expression, proliferation, and morphology of human skin fibroblasts,Oncol Res/Anticancer drug design 2002;13:19-24.
[9] Port M, Abend M, Romer B, Van Beuningen D. Influence of high-frequencyelectromagnetic fields on different modes of cell death and gene expression, Int JRadiat Biol 2003;79[9]:701-708.
[10] Steffensen KV, Raskmark P, GF Penersen, FDTD calculations of the EM-fielddistribution in a microtiter suspension well, COST 244: Biomedical Effects ofElectromagnetic fields, Kuopio, Finska. 1995;80-87.
[II] Freshney RI. Culture of animal cells, 4 izdanje, NY, USA, Willey-Liss Press, 2000.ISBN 0-471-34889-9.
[12] Kwee S, Rasmark P. Changes in cell proliferation due to environmental non-ionizingradiation 2. Microwave radiation, Bioelectrochem Bioenergetics 1998;44:251-255.
[13] Pavičić I, Trošić I. Influence of 864 MHz electromagnetic field on growth kinetics ofestablished cell line. U: Kos T, Grgić M, ur. Proceedings Elmar-2004.; 16-18. 06.2004; Zadar, Hrvatska, Zagreb: ELMAR: 2004: str. 396-401.
[14] French PW, Donnellan M, McKenzie DR. Electromagnetic radiation at 835 MHzchanges morphology and inhibits proliferation of a human astrocytoma cell line,Bioelectrochem Bioenergetics 1997;43:13-18.
457
VI. simpozij HDZZ, Stubičke Toplice, 2005.
COMPARISON OF 864 AND 935 MHz MICROWAVERADIATION EFFECTS ON CELL CULTURE
Ivan Pavičić', Ivančica Trošić1 and Antonio Šarolić2
'institute for Medical Research and Occupational Health, Ksaverska c. 2,HR-10000 Zagreb, Croatia
2Faculty of Electrical Engineering and Computing, University of Zagreb,Unska 3, HR-10000 Zagreb, Croatia
e-mail: [email protected]
The aim of our study was to evaluate and compare the effect of 864 and 935MHz microwave radiation on proliferation, colony forming and viability ofChinese hamster lung cells, cell line V79. Cell cultures were exposed both to the864 MHz microwave field in transversal electromagnetic mode cell (TEM-cell) andto the 935 MHz field in gigahertz transversal electromagnetic mode cell (GTEM-cell) for 1, 2 and 3 hours. Philips PM 5508 generator connected with a signalamplifier generated the frequency of 864 MHz, whereas Hewlett PackardHP8657A signal generator was used to generate the frequency of 935 MHz. Theaverage specific absorption rate (SAR) was 0.08 W/kg for 864 MHz and 0.12 W/kgfor 935 MHz. To determine the cell growth, V79 cells were plated in theconcentration of lxl04cells per milliliter of nutrient medium. Cells were cultured ina humidified atmosphere at 37 °C in 5% CO2. Cell proliferation was determined bycell counts for each hour of exposure during the five post-exposure days. Toidentify colony-forming ability, cells were cultivated in the concentration of 40cells/mL of medium and incubated as described above. Colony-forming ability wasassessed for each exposure time by colony count on post-exposure day 7. Trypanblue exclusion test was used to determine cell viability. On post-exposure day 3,the growth curve of 864 MHz irradiated cells showed a significant decrease(p<0.05) after 2 and 3 hours of exposure in comparison with control cells. Cellsexposed to 935 MHz radiation showed a significant decrease (p<0.05) after 3 hoursof exposure on post-exposure day 3. Both the colony-forming ability and viabilityof 864 MHz and 935 MHz exposed cells did not significantly differ from matchedcontrol cells. In conclusion, both applied RF/MW fields have shown similar effectson cell culture growth, colony forming and cell viability of the V79 cell line.
458
... . .. u ___ _. .... _ .. , HR0500095VI. simpozij HDZZ, Stubicke Toplice, i
KINETIKA MIKRONUKLEARNIH STANICA KOŠTANE SRŽII PERIFERNE KRVI ŠTAKORA TIJEKOM SUBKRONIČNOG
IZLAGANJA MIKROVALOVIMA
Ivančica Trošić'', Ivana Bušljeta', Ivan Pavičić' i Borivoj Modlic2
'institut za medicinska istraživanja i medicinu rada, Ksaverska c. 2., 10000 Zagreb2Fakultet elektrotehnike i računarstva, Sveučilište u Zagrebu, Unska 3,
10000 Zagrebe-mail: itrosic(2),imi.hr
UVODUnatoč istraživačkim izvješćima o biološkim učincima radiofrekvencijskog
mikrovalnog zračenja (RF/MW) do danas nije jasno kolika je stvarna opasnost odtog zračenja po ljudsko zdravije [1]. Neke in vivo studije genotoksičkog učinkapolja frekvencije 2.45 GHz daju pozitivne [2], upitne [3] ili negativne [4] rezultate.Nađena je povišena incidencija mikronuklearnih stanica i učestalost kromosomskihaberacija u humanih limfocita izloženih poljima 956 MHz, 2.45 GHz i 7.7 GHz[5,6]. Vijayalaxami i sur., su proveli niz kroničnih in vivo i in vitro studija koristećiviše polja RF/MW frekvencija, te su zaključili da ni pod kojim uvjetima RF/MWzračenje ne uzrokuje biološki značajnu genototoksičnost [7-10]. Objavljenirezultati su često zbunjujući pa valja reći da dio istraživanja potiču i novčanopodupiru zainteresirane industrije što može izazvati sumnju u vjerodostojnostobjavljenih rezultata. Stoga postoji stalna potreba za nezavisnim i objektivnimpodacima o utjecaju RF/MW polja na biološke sustave. Neophodan je, dakle,intermitentni nadzor pozitivnih učinaka kako bi se utvrdilo jesu li oni kronični,akutni, i nestaju li nakon prestanka izloženosti. Svrha ovog rada je procjenasubkroničnog intermitentnog djelovanja 2,45 GHz RF/MW zračenja na krvotvornotkivo i perifernu krv pokusnih životinja.
MATERIJALI I METODEPlan i provedba pokusa su nedavno objavljeni [11,12]. Wistar štakori su po
grupama (n=10) izlagani RF/MW polju 2,45 GHz i snage 5-10 mW/cm2 po 2 satadnevno, 7 dana u tjednu. Prosječna specifična brzina apsorpcije (SAR) bila je 1,25± 0,36 W/kg. Grupe ozračenih i kontrolnih životinja su žrtvovane drugog, osmog,petnaestog i tridesetog dana pokusa. Svakog krajnjeg dana pokusa životinje suubijene, a koštana je moždina uzeta iz femura [13]. Razmazi periferne krvi ikoštane srži su supravitalno obojeni [14]. Učestalost pojave mikronukleusa (MN) ukrvi i u srži određena je mikroskopskom pretragom 1000 polikromatskih stanica(PCE). Statistička obrada provedena je programom Statistica for Win. (StatSoft1995, package rel 5.5).
459
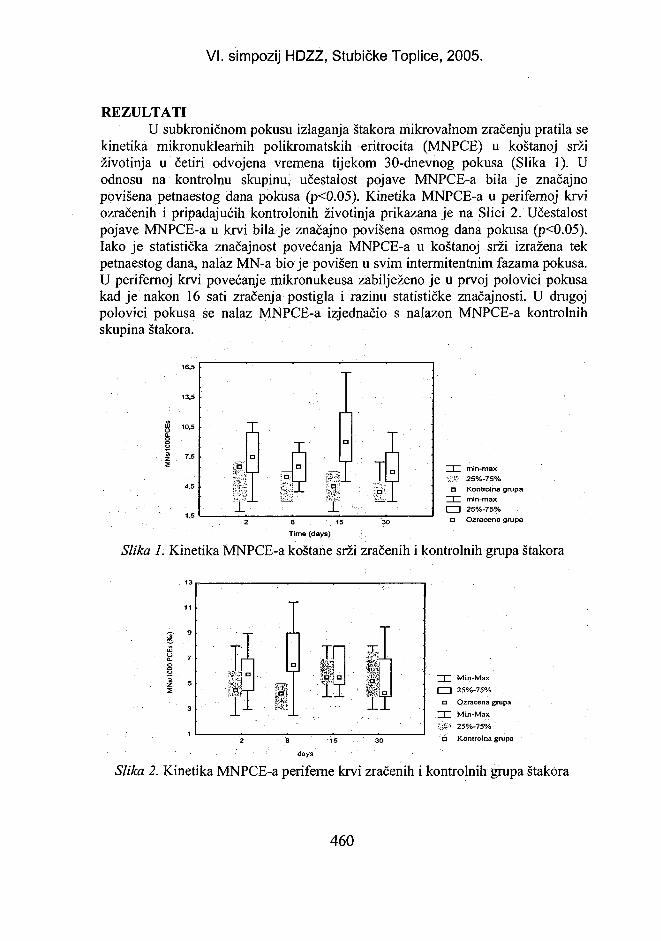
VI. simpozij HDZZ, Stubičke Toplice, 2005.
REZULTATIU subkroničnom pokusu izlaganja štakora mikrovalnom zračenju pratila se
kinetika mikronuklearhih polikromatskih eritrocita (MNPCE) u koštanoj sržiživotinja u četiri odvojena vremena tijekom 30-dnevnog pokusa (Slika 1). Uodnosu na kontrolnu skupinu, učestalost pojave MNPCE-a bila je značajnopovišena petnaestog dana pokusa (p<0.05). Kinetika MNPCE-a u perifernoj krviozračenih i pripadajućih kontrolonih životinja prikazana je na Slici 2. Učestalostpojave MNPCE-a u krvi bila je značajno povišena osmog dana pokusa (p<0.05).Iako je statistička značajnost povećanja MNPCE-a u koštanoj srži izražena tekpetnaestog dana, nalaz MN-a bio je povišen u svim intermitentnim fazama pokusa.U perifernoj krvi povećanje mikronukeusa zabilježeno je u prvoj polovici pokusakad je nakon 16 sati zračenja postigla i razinu statističke značajnosti. U drugojpolovici pokusa se nalaz MNPCE-a izjednačio s nalazon MNPCE-a kontrolnihskupina štakora.
l min-max'?;Z$ 25%-75%
• Kontrolna grupai min-max
I 1 25%-75%• Ozračena grupa
Time (days)
Slika L Kinetika MNPCE-a koštane srži zračenih i kontrolnih grupa štakora
15 30
I Min-Max
I 1 25%-75%
• Ozračena grupa
I Min-Max
£i£t 25%-75%
• Kontrolna grupa
days
Slika 2. Kinetika MNPCE-a periferne krvi zračenih i kontrolnih grupa štakora
460
VI. simpozij HDZZ, Stubičke Toplice, 2005.
RASPRAVASmatra se da RF/MW zračenje (30 MHz-300 GHz) nema primarni
mutageni učinak [15-16]. Ipak studije koje uključuju stanične kulture, ljudsku krv ipokusne životinje pokazuju da to zračenje može uzrokovati primarna oštećenjaDNK [17-20]. U prilog tome su i epidemiološke studije koje pokazuju povećanuincidenciju karcinoma, spontanih pobačaja i drugih štetnih učinaka u ljudi [21,22].U ovom radu prikazana je kinetika mikronuklearnih stanica koštane srži i perfernekrvi štakora nakon svakodnevnog dvosatnog izlaganja RF/MW polju tijekommjesec dana pokusa. Značajno povećanje mikronulearnih nezrelih eritrocita ukoštanoj srži zabilježeno je 15-og dana pokusa (Slika 1), što je vjerojatnaposljedica djelovanja zračenja na ravnotežu u sazrijevanju i/ili diobi eritrocita [23].Eritropoieza je uravnoteženi proces u neprekidnom tijeku, a svaki disbalanssazrijevanja ili diobe eritropoietskih stanica aktivira homeostatski mehanizampovratne sprege [24]. Iako se statistički značajno povećanje broja MNPCE-a uperifernoj krvi pokazalo samo nakon 16 sati kumulativnog zračenja životinja,povišeni nalaz MNPCE-a u krvi tijekom cijelog pokusa smatra se odrazomdogađanja na razini koštane srži (Slika 2). Važnu ulogu u kompleksnoj mrežidogađanja ima mononuklearno-fagocitni sustav koji eliminira promjenjene stanice,i istovremeno daje poticaj za popravak brzine sazrijevanja prekursorskih stanicaproizvodeći hematopoetske faktore staničnog rasta [25,26]. Za razliku od miševa, uštakora kao i u ljudi mikronuklearne se stanice ne akumuliraju već ih odstranjujemononuklearno-fagocitni sustav putem slezene [27]. Pojava mikronukleusa ukoštanoj srži i u perifernoj krvi u odnosu na ponavljano zračenje i vrijeme upućujena učinkovito uklanjanje promijenjenih stanica iz krvi. Kinetika nalazamikronukleusa u koštanoj srži i perifernoj krvi u četiri odvojena vremena tijekompokusa upućuje također na vjerojatnost aktiviraja mehanizama prilagodbe pokusnihživotinja na uvjete zračenja u subkroničom pokusu.
ZAHVALARad je izrađen za projekt "Biomedicinski učinci RF/MW zračenja" MZOŠ-RH.
LITERATURA[1] Elwood JM. A Critical Review of Epidemiological Studies of Radiofrequency
Exposure and Human Cancer. Environ Health Perspect 1999; 107:155-168.[2] Szmigielski S, Szudzinski A, Pletraszek A, Bielec M, Janiak M, Wrembel JK.
Accelerated development of spontaneous and benzopyrene-induced skin cancer in miceexposed to 2450 MHz microwave radiation. Bioelectromagnetics 1982;3179-3191.
[3] Chou CK, Guy AW, Kunz LL, Johnson RB, Crowley JJ, Krupp JH. Long-term low-level irradiation in rats. Bioelectromagnetics 1992; 13:469-496.
[4] Frei MR, Berger RE, Dusch SJ, Guel V, Jauchem JR, Merrit JH, Stedman M. Chronicexposure of cancer-prone mice to low-level 2450 MHz radiofrequency radiation.Bioelectromagnetics 1998; 19:20-31.
461
VI. simpozij HDZZ, Stubičke Toplice, 2005.
[5] Maes A, Verchaeve L, Arroyo A, Dewagter C, Vercruyssen. In vitro cytogenetic effectof 2450 MHz waves on human peripheral blood lymphocytes. Bioelectromagnetics1993;14:495-50I.
[6] Zotti-Martelli L, Peccatory M, Scarpato R, Miglore L. Induction of micronuclei inhuman lymphocytes exposed in vitro to microwave radiation. Mutat Res 2000;72:51-58.
[7] Vijayalaxami, Frei MR, Dusch SJ, Guel V, Meltz ML, Jauchem JR. Frequency ofmicronuclei in the peripheral blood and bone marrow of cancer-prone mice chronicallyexposed to 2450 MHz radiofrequency radiation. Radiat Res 1997; 147:495-500.
[8] Vijayalaxami, Leals BZ, Szilagyi M, PrihodaTJ, Meltz ML. Primary DNA damage inhuman blood lymphocytes exposed In vitro to 2450 MHz radiofrequency radiation.Radiat Res 2000; 153:479-486.
[9] Vijayalaxami, Pickard WF, Bisht KS, Prihoda TJ, Meltz ML, LaRegina MC, Roti RotiJL, Straube WL, Moros EG. Micronuclei in the peripheral blood and bone marrowcells of rats exposed to 2450 MHz radiofrequency radiation. Int J Radiat Biol2001;77:1109-1115.
[10] Vijayalaxmi, Sasser LB, Morris JE, Wilson BW, Anderson LE. Genotoxic Potential of1.6 GHz Wireless Communication Signal: In Vivo Two-Year Bioassay. Radiat Res2003; 159:558-564.
[ll]Trosic I, Busljeta I, Pavicic I. Blood-forming system in rats after whole-bodymicrowave exposure; Reference to the lymphocytes. Tox Lett 2004;l54:125-32.
[12]Trosic I, Busljeta I, Kasuba V, Rozgaj R. Micronuclei induction after whole-bodymicrowave irradiation of rats. Mutat Res 2002;521:73-79.
[13]Mazur L. Induction of micronucleated erythrocytes by MEA, AET, WR-2721 and X-rays. Mutat Res 1995;334:317-322.
[14]Hayashi M, Sofuni JI, Ishidate M. An application of acridine orange fluorescentstaining to the micronucleus test. Mutat Res 1983;120:241-247.
[15] World Health Organization (WHO), International EMF Project. The page accessed on14th April 2004. Website: URL:http://who.int/peh-emf/
[16]Vijayalaxami, Logani MK, Bhanushali A, Ziskin MC, Prihoda TJ. Micronucleus inPeripheral Blood and Bone Marrow Cells of Mice Exposed to 42 GHz ElectromagneticMillimeter Waves. Radiat Res 2004; 161:341-345.
[17]Timchenko OI, Ianchevskaia NV. The cytogenetic action of electromagnetic fields inthe short-wave range. Psychopharmacology Series 1995;7-8:37-39.
[18]Balode Z. Assessment of radio-frequency electromagnetic radiation by themicronucleus test in Bovine peripheral erythrocytes. Sci Total Environ 1996; 180:81-6.
[19]Haider T, Knasmueller S, Kundi M, Haider M. Clastogenic effects of radiofrequencyradiation on chromosomes of Tradescantia. Mutat Res 1994;324:65-68.
[20] Lai H, Singh NP. Single- and double-strand DNA breaks in rat brain cells after acuteexposure to radiofrequency electromagnetic radiation. Int J Radiat Biol 1996;69:513-521.
[21] Goldsmith JR. TV Broadcast Towers and Cancer: The end of innocence forRadiofrequency exposures. Am J Ind Med 1997;32:689-692.
[22] Goldsmith JR. Epidemiologic evidence relevant to radar (microwave) effects. EnvironHealth Perspect 1997;105:1579-1587.
462
VI. simpozij HDZZ, Stubičke Toplice, 2005.
[23]Trosic I, Busljeta I, Modlic B. Investigation of the genotoxic effects of microwaveirradiation in rat bone marrow cells; in vivo exposure. Mutagenesis 2004; 19:361-364.
[24]Guyton AC. Textbook of Medical Physiology, 10'" Edition. WB Saunders CO,Philadelphia, PA, 2000.
[25] Busljeta I, Trosic I, Milkovic-Kraus S. Erythropoietic changes in rats after 2.45 GHznonthermal irradiation. Int J Environ Health 2004;207:l-6.
[26]Trošić I. Multinucleated giant cell appearance after whole body microwave irradiationof rats. Int J Hyg Environ Health 2001;204:133-138.
[27] Heddle JA, Hite M, Kirkhart B, Mavourin K, MacGregor JT, Newell GW, SalamoneMF. The induction of micronuclei as a measure of genotoxicity. Mut Res1983;123:161-118.
KINETICS OF INDUCTION OF MICRONUCLEATEDPOLYCHROMATIC ERYTHROCYTES IN BONE MARROWAND PERIPHERAL BLOOD FOLLOWING SUBCHRONIC
MICROWAVE EXPOSURE
Ivančica Trošić', Ivana Bušljetajvan Pavičić and Borivoj Modlic2
"institute for Medical Research and Occupational Health2Faculty of Electrical Engineering and Computing, University of Zagreb
HR-10000 Zagreb, Croatiae-mail: [email protected]
The aim of this study was to investigate the induction kinetics ofmicronucleated polychromatic erythrocytes (MNPCEs) in bone marrow (BM) andperipheral blood (PB) of rats during intermittent subchronic exposure to selectedradiofrequency microwave (RF/MW) radiation. Rats were exposed to RF/MW2.45GHz, power density 5-10 mW/cm2 2 hours a day, 7 days a week. The specificabsorption rate (SAR) was 1.25±0.36 W/kg. The study included control groups.After the animals were killed, BM and PB smears were supravitally stained andMN frequency was recorded for both PB and BM by scoring 1000 PCEs/slides.The results were analysed using StatSoft 95 package. In comparison with controls,the MN frequency in BM significantly increased on experimental day 15. BM MNfrequencies were elevated in each experimental phase. The incidence of MNPCEsin PB significantly increased after eight two-hour exposures. From that point on,MNPCEs declined to reach control values by the end of the experiment. Thesefindings could indicate radiation effects on BM erythropoiesis and their reflectionon PB. The kinetics MNPCE induction in BM and PB of irradiated rats revealed acomplex chain of events, including temporary imbalance in erythrocyte maturationand/or proliferation processes, followed by a feedback mechanism of thehomeostatic control system, and possible elimination of MNPCEs from PB bymononuclear phagocytes. This points to an adaptive mechanism in rats in responseto experimental subchronic RF/MW exposure.
463
HR0500096VI. simpozij HDZZ, Stubičke Toplice, 2
ZDRAVSTVENE TEGOBE OPERATERA NAVIDEOTERMINALIMA - POSLJEDICA
ELEKTROMAGNETSKOG ZRAČENJA ILI ŠTOGODDRUGO?
Vlatka Brumen', Vera Garaj-Vrhovac2, Jasna Franekić Čolić3iŽeljko Radalf
'Medicinski fakultet Sveučilišta u Zagrebu, Salata 32Institut za medicinska istraživanja i medicinu rada Zagreb, Ksaverska c. 23Prehrambeno-biotehnoIoški fakultet Sveučilišta u Zagrebu, Kršnjavoga 25
4ANT, d.o.o., Medarska 6910000 Zagreb
UVODPosljednjih desetljeća videoterminali su postali gotovo nezaobilaznim
dijelom niza radnih mjesta, što je osuvremenilo radne procese i povećalo njihovuučinkovitost, ali i potaklo niz znanstveno-stručnih i javnih debata o mogućimzdravstvenim učincima takvih profesionalnih izlaganja [1,2]. Među najčešćenavođenim tegobama ovih djelatnika jesu tegobe sa strane oka [3] iosteomuskulamog sustava [4] te psihološki problemi vezani uz monotoni,repetitivni rad [5]. Činjenicom daje poznato da visokofrekventna elektromagnetskapolja u profesionalno izloženih osoba mogu izazvati kataraktu, obično stražnjegpola leće, javila su se promišljanja može li i svakodnevno osmosatno izlaganjeelektromagnetskim poljima koja generira zaslon računala izazvati isti učinak.
CILJ RADA I METODOLOGIJAU odgovor na izravni upit operatera na videoterminalima jedne velike
hrvatske tvrtke, koji su učestalo navodili tegobe sa strane oka, o tome je li mogućeda je uzrok njihovih tegoba izračivanje zaslona računala, provedena su mjerenjaodnosnih polja. Fizikalna mjerenja provedena su pomoću prijenosnog mjeračaPMM 8051, serijskog broja 0182 (PMM Costruzioni Elettroniche Centro MisureRadioelettriche s.r., Milano, Italija), uporabom triju različitih sondi, sa i bez filtera.Mjerilo se s udaljenosti od 10,20, 30, 40, 50 i 60 cm.
464
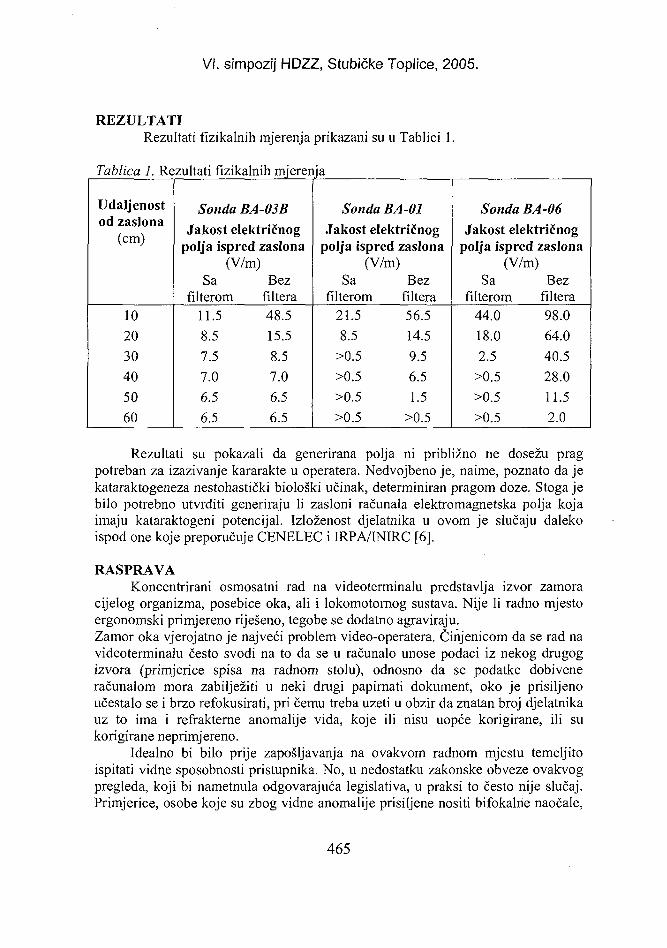
VI. simpozij HDZZ, Stubičke Toplice, 2005.
REZULTATIRezultati fizikalnih mjerenja prikazani su u Tablici 1.
Tablica 1. Rezultati fizikalnih mjerenja
Udaljenostod zaslona
(cm)
102030405060
Sonda BA-03BJakost električnog
polja ispred zaslona(V/m)
Sa Bezfilterom filtera
11.58.57.57.06.56.5
48.515.58.57.06.56.5
Sonda BA-01Jakost električnog
polja ispred zaslona(V/m)
Sa Bezfilterom filtera
21.58.5
>0.5>0.5>0.5>0.5
56.514.59.56.51.5
>0.5
Sonda BA-06Jakost električnog
polja ispred zaslona(V/m)
Sa Bezfilterom filtera
44.018.02.5
>0.5>0.5>0.5
98.064.040.528.011.52.0
Rezultati su pokazali da generirana polja ni približno ne dosežu pragpotreban za izazivanje kararakte u operatera. Nedvojbeno je, naime, poznato da jekataraktogeneza nestohastički biološki učinak, determiniran pragom doze. Stoga jebilo potrebno utvrditi generiraju li zasloni računala elektromagnetska polja kojaimaju kataraktogeni potencijal. Izloženost djelatnika u ovom je slučaju dalekoispod one koje preporučuje CENELEC i IRPA/INIRC [6].
RASPRAVAKoncentrirani osmosatni rad na videoterminalu predstavlja izvor zamora
cijelog organizma, posebice oka, ali i lokomotornog sustava. Nije li radno mjestoergonomski primjereno riješeno, tegobe se dodatno agraviraju.Zamor oka vjerojatno je najveći problem video-operatera. Činjenicom da se rad navideoterminalu često svodi na to da se u računalo unose podaci iz nekog drugogizvora (primjerice spisa na radnom stolu), odnosno da se podatke dobiveneračunalom mora zabilježiti u neki drugi papirnati dokument, oko je prisiljenoučestalo se i brzo refokusirati, pri čemu treba uzeti u obzir da znatan broj djelatnikauz to ima i refrakterne anomalije vida, koje ili nisu uopće korigirane, ili sukorigirane neprimjereno.
Idealno bi bilo prije zapošljavanja na ovakvom radnom mjestu temeljitoispitati vidne sposobnosti pristupnika. No, u nedostatku zakonske obveze ovakvogpregleda, koji bi nametnula odgovarajuća legislativa, u praksi to često nije slučaj.Primjerice, osobe koje su zbog vidne anomalije prisiljene nositi bifokalrie naočale,
465
VI. simpozij HDZZ, Stubičke Toplice, 2005.
ne smatraju se primjerenim za rad na videoterminalu, jer isti od njih zahtijeva da,nemaju li odgovarajuće naočale, ruke drže u vrlo zamornom fiksnom položaju.Olakotna je okolnost ako se zaslon može pomicati tijekom rada, što jest odlikasuvremenih videoterminala.
Osvijetljenost ekrana u odnosu na okolni radni prostor od posebnog jeznačaja za vidni komfor. Iako na prvi pogled paradoksalna, postoji čak i preporukada djelatnici koji tijekom rada na videoterminalu ne moraju skretati pogled sazaslona, rade u zatamnjenim radnim prostorima.
Izrazito blještanje u radnom prostoru, refleksije s radne površine i treperenjeslike mogu ne samo izazvati zamor oka, već i glavobolje, a u epileptičara čak inapadaj.Međutim, uza sve ove neprijeporne tegobe sa strane vida, većina autora se slaže datemeljem izračivanja zaslona nema elemenata za zaključivanje na mogućnostnastanka aktiničke katarakte u ovih djelatnih kategorija.
Potaknuta zabrinutošću korisnika glede mogućih zdravstvenih učinaka radana videoterminalu, odnosna industrija krenula je u proizvodnju i distribucijuračunalne opreme koja nudi "zaštitu od zračenja". Ponuđena je čak i uporabazaštitnih pregača. No, mjerodavne organizacije kakve su Svjetska zdravstvenaorganizacija (World Health Organisation -WHO) i Međunarodna organizacija rada(International Labour Organisation - ILO), ne preporučaju uporabu takve drastičnezaštite, jer stoje na stajalištu da su emisije ekrana, posebice suvremenih računala,tako niske da je ovakva drastična osobna zaštita bespredmetna. Ostaje jedinopreporuka da se pri prethodnom pregledu pristupnika za ovakva radna mjesta uzmeciljana anamneza i, uz ostalo, učini i detaljan oftalmološki pregled.
LITERATURA[1] World Health Organisation(WHO). Electromagnetic fields 300 Hz - 300 GHz.
Environmental Health Criteria No. 137. Comprehensive review of the physics andbiological effects of electromagnetic fields emitted by VDUs. Geneva : WHO;1993.
[2] Matthes R. Non-Ionizing Radiation. Baden, Austria : ICNIRP, 1996.[3] Rosner M, Belkin M. Video display units and visual function. Survey of
Ophtalmol 1989; 33 (6): 515-522.[4] World Health Organisation (WHO). Visual Display Terminals and Worker's
Health. Publication No.99. Geneva: WHO; 1987.[5] Socrates G. Health and Safety. Video Display Units.
http://www.geocites.com/Axiom43/vdutopic.html[6] Campos LL. Measurement of the exposure rate due to low energy X-rays emitted
from video display terminals. Int J Radiat Appl&Instr. Part A. Appl Radiat Isotop1988; 39 (2): 173-174.
466
VI. simpozij HDZZ, Stubičke Toplice, 2005.
HEALTH ISSUES OF THE OPERATERS ON VIDEO DISPLAYUNITS - THE CONSEQUENCE OF ELECTROMAGNETIC
RADIATION OR SOMETHING ELSE?
Vlatka Brumeri', Vera Garaj-Vrhovac2, Jasna Franekić Čolić3andŽeljko Radalf
'Medical College University of Zagreb, Salata 3institute for Medical Research and Occupational Health Ksaverska c. 23 Faculty of Food Technology and Biotechnology, University of Zagreb,
Kršnjavoga 254ANT,Ltd., Medarska 69
HR-10000 Zagreb, [email protected]
Over the last few decades, video display units (VDUs) have becomeinevitable in a number of workplaces. This raised a debate on possible healtheffects of occupational exposure to VDUs. Most frequently reported complaints areeyestrain, bone/muscle disorders and psychological problems related tomonotonous, repetitive work. Questions have been raised whether regular exposureto electromagnetic fields generated by the screen could induce cataract. In responseto a direct inquiry of VDU operators from a large Croatian company, whether theireye discomforts could be attributed to screen irradiation, we measuredelectromagnetic fields generated by screens. Measurements were performed using aportable measuring device PMM 8051, serial number 0182 (PMM CostruzioniElettroniche Centro Misure Radioelettriche s.r. Milan, Italy) with three differentprobes, with and without a filter. The results showed that screen-generated fieldswere far bellow the threshold required for a causing a cataract, which overruled thepossibility that the actinic effect should produce eye discomfort.
467
HR0500097VI. simpozij HDZZ, Stubičke Toplice, 2i
UTJECAJ OPTIČKE RADIJACIJE - UV A i BNA POJAVU A.M.D. - MAKULARNE DEGENERACIJE
Bozo VojnikovićPoliklinika "Dr. Bozo Vojniković", Antuna Barca 3B, 51000 Rijeka
e-mail: [email protected]
UVODProblem makularne degeneracije tipa A.M.D. - Age Related Macular
Degeneration danas u čitavom svijetu zaokuplja velik broj oftalmologa zbognekoliko milijuna praktički slijepih osoba. To su osobe s lošim vidom, Low Vision,oštrine vida ispod 0.4, koje ne mogu obavljati svoju profesiju. U simptomatologijije izražen zamućen centralni vid i iskrivljenje ravnih linija. Oftalmolog nalazi nafundusu najprije grublji makularni crtež, disgrupaciju pigmenta, i zatim pojavu"druza", točkaste bijele nakupine u makuli, tipa "dry".
Postavlja se pitanje uzroka ove bolesti. Već samim nazivom označuje se dabolest nastaje u poznoj dobnoj skupini, iza 65. godine, međutim, danaszamjećujemo da se navedena bolest pojavljuje sve ranije, već oko četrdesetih, štoznači da pored degenerativnih procesa starenja, postoje i drugi uzroci kojeakceleriraju bolest.
Poznato je da povećano ultravioletno zračenje (UV A i B), premda i plavopodručje vidljivog dijela spektra, dovodi do oštećenja na oku [1,2] u smisluzamućenja očne leće i promjena na retini. Poznato je također da se poddjelovanjem UV A i B zračenja stvaraju biološka oštećenja DNA, umitohondrijima i jezgri stanica, s kumulativnim efektom [3, 4].
Danas se sve više smatra da je pojačano UV zračenje, u promjenjivimklimatskim uvjetima smanjenog ozonskog sloja [5], moguć važan faktor uprogresiji nastajanja katarakte i makularne degeneracije, što je upravo predmetstudije u ovom radu.
MATERIJAL I METODENa otoku Rabu pregledano je 1350 osoba od strane oftalmologa. Izdvojeno
je 730 bolesnika u starosnoj dobi od 40 do 65 godina, kod kojih nije postignuturedan vid uobičajenom refrakcijskom preskripcijom. Od tog broja izdvojeni su onibolesnici koji imaju arterijelnu hipertenziju, dijabetes, uznapredovalu kataraktu, ilineko drugo oboljenje organa vida koje može kompromitirati uredan vid. Na tajnačin uključeno je 511 ispitanika kod kojih su izvršena slijedeća funkcionalnaispitivanja: a) fundus u midrijazi, b) standardno izopteričko vidno polje, c)"meridian tresholds", d) glaukomska obrada: gonioskopija, očni tlak, tonografija.
468
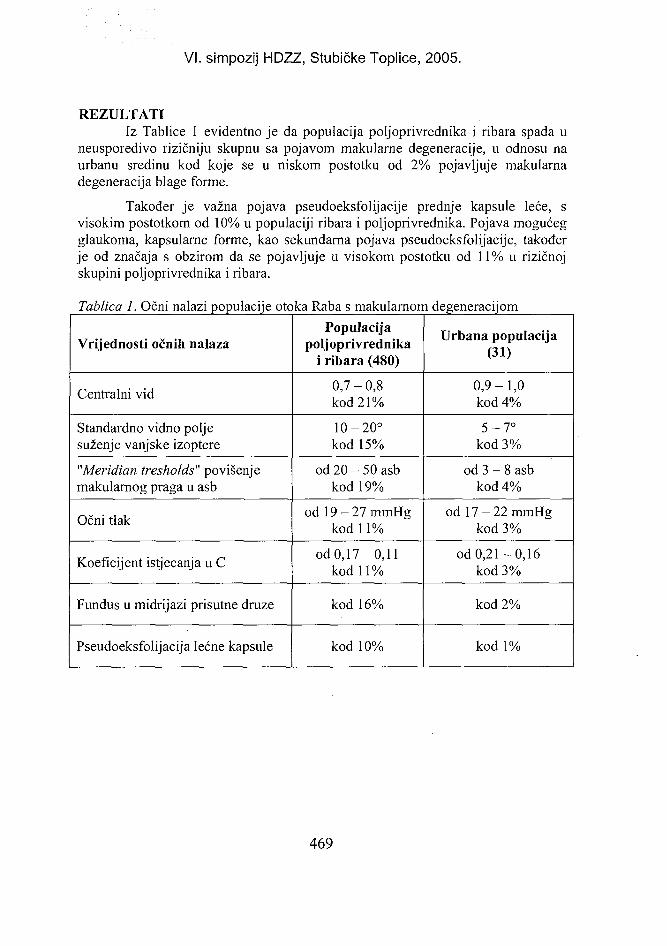
VI. simpozij HDZZ, Stubičke Toplice, 2005.
REZULTATIIz Tablice 1 evidentno je da populacija poljoprivrednika i ribara spada u
neusporedivo rizičniju skupnu sa pojavom makularne degeneracije, u odnosu naurbanu sredinu kod koje se u niskom postotku od 2% pojavljuje makularnadegeneracija blage forme.
Također je važna pojava pseudoeksfolijacije prednje kapsule leće, svisokim postotkom od 10% u populaciji ribara i poljoprivrednika. Pojava mogućegglaukoma, kapsularne forme, kao sekundarna pojava pseudoeksfolijacije, takođerje od značaja s obzirom da se pojavljuje u visokom postotku od 11% u rizičnojskupini poljoprivrednika i ribara.
Tablica 1. Očni nalazi populacije otoka Raba s makularnom degeneracijom
Vrijednosti očnih nalaza
Centralni vid
Standardno vidno poljesuženje vanjske izoptere
"Meridian tresholds" povišenjemakularnog praga u asb
Očni tlak
Koeficijent istjecanja u C
Fundus u midrijazi prisutne druže
Pseudoeksfolijacija lećne kapsule
Populacijapoljoprivrednika
i ribara (480)
0,7-0,8kod 21%
10-20°kod 15%
od 20 - 50 asbkod 19%
od 19-27mmHgkod 11%
od 0,17-0,11kod 11%
kod 16%
kod 10%
Urbana populacija(31)
0,9-1,0kod 4%
5-7°kod 3%
od 3 - 8 asbkod 4%
od 17-22mmHgkod 3%
od 0,21-0,16kod 3%
kod 2%
kod 1%
469
VI. simpozij HDZZ, Stubičke Toplice, 2005.
ZAKLJUČAKZaključno se može konstatirati da je pojava makularne degeneracije
prisutna u daleko većem postotku u skupini ribara i poljoprivrednika, u odnosu naurbanu sklupinu, što se uzročno može povezati s izloženošću velikim dozamaultravioletnog zračenja A i B, kao i plavog svjetla vidljivog spektra, kao i njihovenezaštićenosti u toku obavljanja svoje profesije.
LITERATURA[1] Hightawer K, McCready J. Comparative effect of UVA and UVB on cultured rabbit
lens. Photochemistry and Photobiology; 58(6): 827-830.[2] Čupak K, Oftalmologija. Nakladni zavod Globus. 2004. str. 672-675.[3] Valenzo DP, Pottier RH, Mathis D, Douglas RH. Photobiological Techniques. Series
A: Life Sciences, 216. ISBN 0-306-44057-1. 1991; str. 165-167.[4] Kohen E, Santus R, Hirschberg J. G. Photobiology. Academic Press, San Diego,
Boston, London. 1991; str. 137-157.[5] Bojkov R.D. Estimating the global ozone characteristics during the last 30 years. J
Geophys Res 1995; 100(98): 537-550.
INFLUENCE OF OPTICAL RADIATIONS ONDEVELOPMENT OF AGE RELATED MACULAR
DEGENERATION (AMD)
Bozo VojnikovićPolyclinic "Dr. Bozo Vojniković", A. Barca 3B, HR-51000 Rijeka, Croatia
e-mail: [email protected]
It is known that millions of people have impaired vision because of age-related macular degeneration (AMD). Our goal was to study possible association ofultraviolet radiation with the development of AMD. Clinical examination wascarried out on small island of Rab in Croatia with a high UV-index in the summer,ranging from 9 to 11 around noon. Subjects were classified in two groups, the firstconsisting of fanners and fishermen and the second of urban population. Fundusanalysis showed AMD in 16% of people from the first group and only in 2% ofpeople in the second group. Pseudoexfoliation syndrome was found in 10% ofsubjects from the first group and only in 1% of subjects from the second group. Inthe first group, temporary AMD was observed in young people, aged between 40and 45 years.
470
POPIS AUTORA
AUTHOR INDEX

VI. simpozij HDZZ, Stubičke Toplice, 2005.
AApathy, I.
B
91
Ban, R.Barešić, J.
Barišić, D.
Bašić, B.
Beganović, A.
Begić, A.
Begović-
Hadžimuratović, S
Benedik, Lj.
Bešlić, N.
Blagus, S.
Bodnar, L.
Bokulić, T.
Bronzović, M.
Brumen, V.
Bubalo, D.
Budanec, M.
40158,405
339, 384,395
117,122,306
122, 306,331
331
331
363
331
105
91
134, 300,325
276
464
395
134,300,325
Bušljeta, I.
cCsoke, A.
459
91
cČižmek, A.
DDeljkić, D.
Deme, S.
Dražeta, Z.
Drljević, A.
Druteikiene, R.
Dumitrescu, A.
DŽDžanić, S.
Džubur, S.
FFeher, I.
Franekić Čolić, J.
Franić, Z.
Frobe, A.
Fučić, A.
GGaina, V.
Galjanić, S.
Gamulin, M.
Garaj-Vrhovac, V.
69
358,363
91
331
122,306
351
289
122, 306
146
91
464
34, 64, 265,271,345,373
134
216, 222
167
34
183
146,183,189,200,464
473
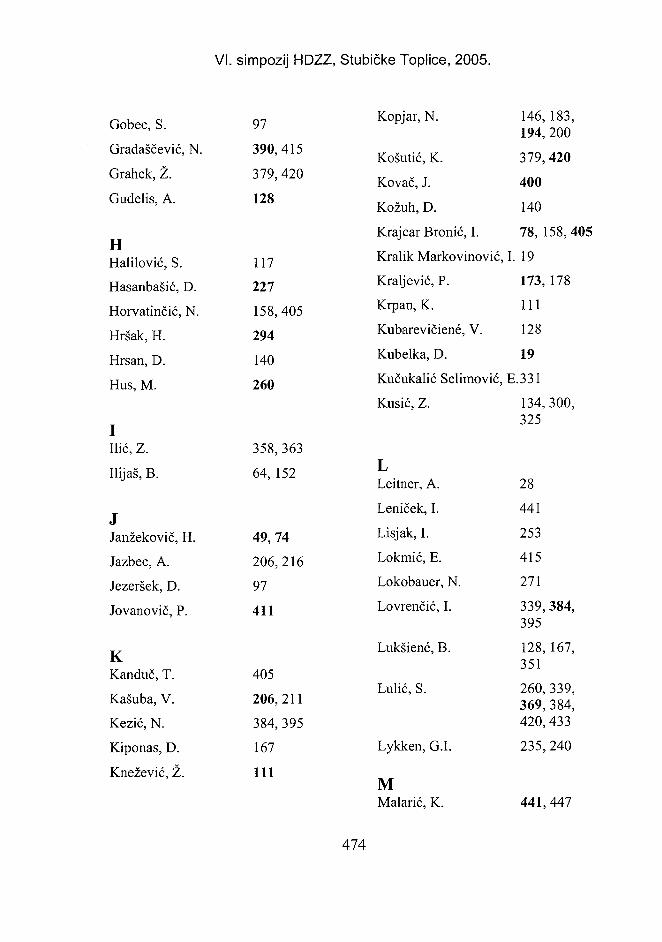
VI. simpozij HDZZ, Stubičke Toplice, 2005.
Gobec, S.Gradaščević, N.
Grahek, Ž.
Gudelis, A.
HHalilović, S.
Hasanbašić, D.
Horvatinčić, N.
Hršak, H.
Hrsan, D.
Hus, M.
IIlić, Z.
Ilijaš, B.
JJanžekovič, H.
Jazbec, A.
Jezeršek, D.
Jovanovič, P.
KKanduč, T.
Kašuba, V.
Kezić, N.
Kiponas, D.
Knežević, Ž.
97390,415
379, 420
128
117
227
158,405
294
140
260
358,363
64,152
49,74
206,216
97
411
405
206,211
384,395
167
111
Kopjar, N.
Košutić, K.
Kovač, J.
Kožuh, D.
Krajcar Bronić, I.
Kralik Markovinović, I.
Kraljević, P.
Krpan, K.
Kubarevičiene, V.
Kubelka, D.
Kučukalić Selimović, E
Kusić, Z.
LLeitner, A.
Leniček, I.
Lisjak, I.
Lokmić, E.
Lokobauer, N.
Lovrenčić, I.
Lukšiene, B.
Lulić, S.
Lykken, G.I.
MMalarić, K.
146,183,194, 200379, 420
400
140
78, 158,405
19
173, 178
111
128
19
.331
134, 300,325
28
441
253
415
271
339, 384,395
128, 167,351
260, 339,369, 384,420,433
235, 240
441,447
474
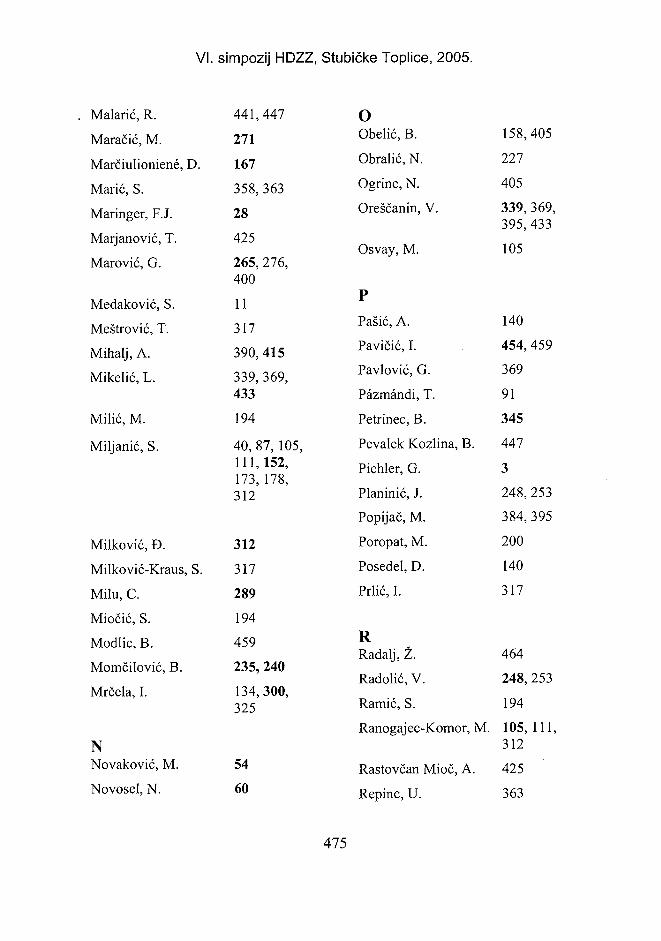
VI. simpozij HDZZ, Stubičke Toplice, 2005.
Malanc, R.Maračić, M.
Marčiulioniene, D.
Marić, S.
Maringer, F.J.
Marjanović, T.
Marović, G.
Medaković, S.
Meštrović, T.
Mihalj, A.
Mikelić, L.
Milić, M.
Miljanić, S.
Milković, Đ.
Milković-Kraus, S.
Milu, C.
Miočić, S.
Modlic, B.
Momčilović, B.
Mrčela, I.
NNovaković, M.
Novosel, N.
441,447271
167
358,363
28
425
265, 276,400
11
317
390,415
339, 369,433
194
40, 87, 105,111,152,173, 178,312
312
317
289
194
459
235,240
134,300,325
54
60
oObelić, B.
Obralić, N.
Ogrinc, N.
Oreščanin, V.
Osvay, M.
PPašić, A.
Pavičić, I.
Pavlović, G.
Pazmandi, T.
Petrinec, B.
Pevalek Kozlina, B.
Pichler, G.
Planinić, J.
Popijač, M.
Poropat, M.
Posedel, D.
Prlić, I.
RRadalj, Ž.
Radolić, V.
Ramić, S.Ranogajec-Komor, M.
Rastovčan Mioč, A.
Repine, U.
158,405
227
405
339, 369,395,433
105
140
454,459
369
91
345
447
3
248,253
384,395
200
140
317
464
248, 253
194105, 111,312
425
363
475
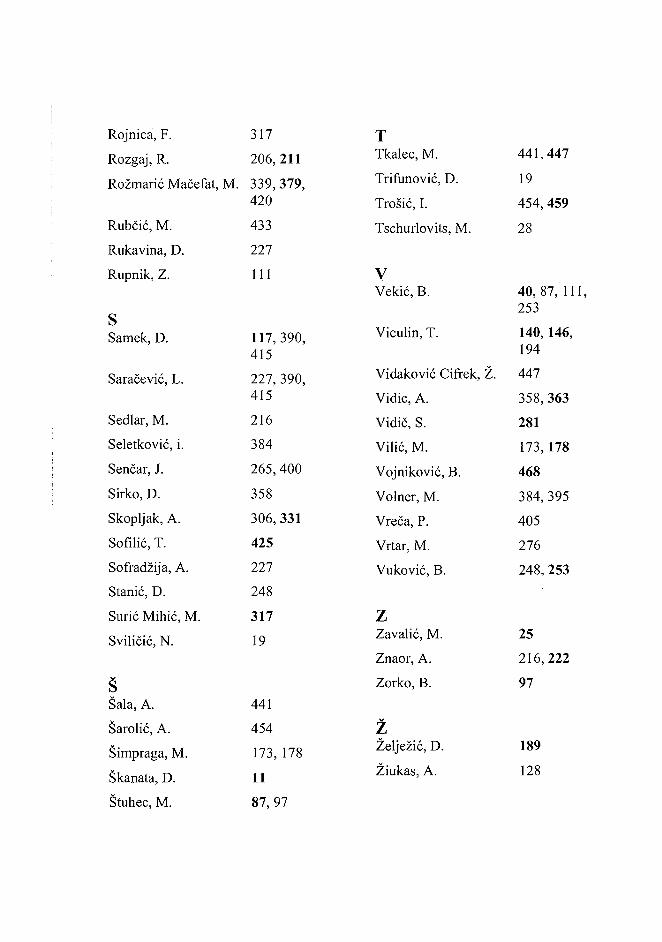
Rojnica, F.Rozgaj, R.
Rožmarić Mačefat, M.
Rubčić, M.
Rukavina, D.
Rupnik, Z.
sSamek, D.
Saračević, L.
Sedlar, M.
Seletković, i.
Senčar, J.
Sirko, D.
Skopljak, A.
Sofilić, T.
Sofradžija, A.
Stanić, D.
Surić Mihić, M.
Sviličić, N.
ŠŠala, A.
Šarolić, A.
Šimpraga, M.
Škanata, D.
Štuhec, M.
317206,211
339, 379,420
433
227
111
117, 390,415
227, 390,415
216
384
265,400
358
306,331
425
227
248
317
19
441
454
173,178
11
87,97
TTkalec, M.
Trifunović, D.
Trošić, I.
Tschurlovits, M.
VVekić, B.
Viculin, T.
Vidaković Cifrek, Ž.
Vidic, A.
Vidič, S.
Vilić, M.
Vojniković, B.
Volner, M.
Vreča, P.
Vrtar, M.
Vuković, B.
zZavalić, M.
Znaor, A.
Zorko, B.
zŽelježić, D.
Žiukas, A.
441,447
19
454,459
28
40,87, 111,253
140, 146,194447
358,363
281
173,178
468
384, 395
405
276
248, 253
25
216,222
97
189
128
VI. simpozij HDZZ, Stubičke Toplice, 2005.
IZOLACIJA POTKROVLJA IZOLACIJA VANJSKOG ZIDA
i[tU.!
IZOLACIJA PREGRADNIH ZIDOVA IZOLACIJA PODOVA
MOC IZOLACIJE
N. termika.hr
477

ISBN 953-96133-5-3
Related Documents