Implementing Lean Material Management in an Extended Value Stream By Justin Harper B.S. Naval Architecture and Marine Engineering, Webb Institute of Naval Architecture 1997; M.S. Naval Architecture, Massachusetts Institute of Technology 2003 Submitted to the Sloan School of Management and the Department of Mechanical Engineering in partial fulfillment of the requirements for the degrees of Master of Business Administration and Master of Science in Ocean Systems Management In conjunction with the Leaders for Manufacturing Progrmn at the Massachusetts Institute of Technology June 2007 © Massachusetts Institute of Technology, 2007. All rights reserved Signature of Author Certified by Certified by Signature reda1cted Sloan School of ManagClnent Department of Mechanical Engineering Signature redacted May 1,2007 ----(j Stanley Gershwin Senior Research Scientist __ Thesis Supervisor Signature redacted John CarroU--"" /----- Professor of Behavioral and Policy Sciences __ ,,'l}lesis Supervisor Signature redacted Accepted by ............... Accepted by 'MASSACHUSETTS INSTITUTE OF JUL 1 S 2007 ! '----___ --1 1 , ! A Sloan School of Managelnent Signature redacted Lallit Anand, CommitrebCJraduate Students Department of Mechanical Engineering

Welcome message from author
This document is posted to help you gain knowledge. Please leave a comment to let me know what you think about it! Share it to your friends and learn new things together.
Transcript
Implementing Lean Material Management in an Extended Value Stream
By
Justin Harper
B.S. Naval Architecture and Marine Engineering, Webb Institute of Naval Architecture 1997; M.S. Naval Architecture, Massachusetts Institute of Technology 2003
Submitted to the Sloan School of Management and the Department of Mechanical Engineering in partial fulfillment of the requirements for the degrees of
Master of Business Administration
and
Master of Science in Ocean Systems Management
In conjunction with the Leaders for Manufacturing Progrmn at the Massachusetts Institute of Technology
June 2007
© Massachusetts Institute of Technology, 2007. All rights reserved
Signature of Author
Certified by
Certified by
Signature reda1cted
Sloan School of ManagClnent Department of Mechanical Engineering
Signature redactedMay 1,2007
----(j Stanley Gershwin
Senior Research Scientist __ Thesis Supervisor
Signature redacted John CarroU--""
/----- Professor of Behavioral and Policy Sciences __ ,,'l}lesis Supervisor
Signature redacted ~ Accepted by ............... D~bbi'~ 'B'~;~~~~~: 'E'~~~~~i~~ il~'~~~~~' ~i~h~'M'~~~~~~' p~~~~~~~
Accepted by
'MASSACHUSETTS INSTITUTE
OF ~~:,~~~:~:.:~~~2:.ll' JUL 1 S 2007 !
'----___ --11 ,
!
A Sloan School of Managelnent
Signature redacted Lallit Anand, ~airmat\ CommitrebCJraduate Students
Department of Mechanical Engineering

Implementing Lean Material Management in an Extended ValueStream
By
Justin Harper
Submitted to the Sloan School of Management and the Department of MechanicalEngineering on May 1, 2007 in partial fulfillment of the requirements for the degrees ofMaster of Business Administration and Master of Science in Ocean SystemsManagement.
Abstract
American Axle & Manufacturing, Inc. (AAM) is still in the process of transitioning to aculture of "lean manufacturing" as opposed to the current culture of "mass production".This thesis involved working with AAM employees and suppliers at various locations tounderstand how material flows between and within AAM's plants, the reasons for andanalysis of the current state of material management, and opportunities for improvement.Attention is also given to the cultural and business context in which this work takes place,and the issues relating to efforts to implement change in large industrial organizations.
This work produced two strategic-level products and one tactical-level product toimprove lean material management at AAM described herein. Cultural observations arealso provided.
At the strategic level, one project focused upon making extended value stream maps ofmaterial flow between AAM plants and suppliers/processors. This information allows alldecision-makers at AAM to objectively examine a common set of information,information which was previously unavailable to any one individual. Extended valuestream mapping allowed supply chain inventory and lead time-reduction opportunities tobe identified.
The focus upon extended value streams increased awareness of the need to more fullyaccount for costs in making part procurement decisions. Therefore, a second strategicproject involved the development of a total cost decision tool, and its use in makingsourcing decisions. This computer spreadsheet-based tool uses simple inputs to quicklyproduce a more all-encompassing estimate of the total costs of purchasing parts from agiven supplier. Traditionally, only piece-price plus freight costs were used to determinesources of supply. Other, additional factors may alter the decision of which supplier touse if they are considered.
The tactical-level project involved implementation of a lean pull system. This projectinvolved coordinating teams at two separate axle shaft manufacturing plants to
3
implement a more effective visual pull system between and within the plants, using leanconcepts for material management and flow.
A final aspect of the thesis was to examine the current business context in which the leansystems are to operate, as well as the strategic, cultural, and political aspects thatinfluence change management in large organizations.
One conclusion drawn from the internship is that the firm should start emphasizing visualcontrol on the plant floor, and less supervisor work on paper in their offices after theirshifts end. If the production boards and visual controls are in constant disarray, this needsto be resolved as quickly as a failed customer delivery, because it is fundamentallyundercutting the ability of the organization to improve what it provides to customersthrough better quality and productivity. It also hinders efforts to reduce costs to bid fornew work. Failing to attract new work is as damaging as a failed customer delivery,except that it will happen a year from now rather than today.
Thesis Advisor: Stanley GershwinTitle: Senior Research Scientist
Thesis Advisor: John CarrollTitle: Professor of Behavioral and Policy Sciences
4
Acknowledgements
I would like to thank the following people for their teaching and support during the
internship and thesis preparation period, in addition to the support from many persons
throughout American Axle & Manufacturing, Inc. and the Leaders for Manufacturing
program:
" Rick Dauch, Tom Delanoy, Donald Joseph, Michael Gray, Heather Lindell-Klish,
Tim McNelis, Alison Gould, Robert Zokoe
" Professors Stanley Gershwin, John Carroll, Jan Klein, and Jonathan Byrnes
" HLS Consultant Earl Wilson
5
Note on Proprietary Information
In order to preserve confidentiality, the data presented throughout this thesis have been
altered and do not represent the actual values at American Axle & Manufacturing, Inc.
The financial and operational information have been disguised to protect competitive
information.
6
Table of Contents
A b stra c t ............................................................................................................................... 3Acknowledgem ents....................................................................................................... 5N ote on Proprietary Inform ation...................................................................................... 6Table of Contents......................................................................................................... 7List of Figures..................................................................................................................... 9List of Tables .................................................................................................................... 101. Introduction................................................................................................................... 11
1.1 Thesis M otivation ................................................................................................ 121.2 Thesis Overview .................................................................................................. 141.3 Thesis Outline..................................................................................................... 15
2. Com pany and Industry Background .......................................................................... 172.1 U .S. Autom obile Industry OEM s........................................................................ 172.2 Supply Chain........................................................................................................... 192.3 Com pany Background ......................................................................................... 212.4 Lean Initiatives at AAM ..................................................................................... 242.5 Project Goals ........................................................................................................... 25
3. Literature Review .......................................................................................................... 273.1 Lean M anufacturing............................................................................................ 273.2 Extended Value Stream Mapping and Supply Chains.................... 293.3 Total or Lean Purchased Parts Cost..................................................................... 313.4 Pull System ............................................................................................................. 323.5 Change M anagem ent ............................................................................................ 33
4. Extended V alue Stream M apping ................................................................................. 374.1 Current State of Supply Chain ............................................................................ 374.2 Extended V alue Stream M apping of Supply Chain................................................ 384.3 Results and Future Opportunities........................................................................ 39
Family (a) parts flowing into Detroit Gear & Axle Plant Six (DGA 6) ......... 39Fam ily (b) full-float axle shafts flowing out of Detroit Forge............................... 43
5. Total Cost D ecision Tool.......................................................................................... 475.1 Traditional Procurem ent Cost Estim ating.......................................................... 475.2 Lean or Total Cost Estim ating ............................................................................ 475.3 Total Cost Decision Tool..................................................................................... 485.4 Exam ple Business Case ....................................................................................... 51
6. Pull System Im plem entation......................................................................................... 556.1 Current State ........................................................................................................... 566.2 Future State ............................................................................................................. 606 .3 D e sig n ..................................................................................................................... 6 16.4 Training................................................................................................................... 686.5 Im plem entation ..................................................................................................... 68
7. Lean and Organizational Behavior ............................................................................ 757.1 Culture: Current and Future State ....................................................................... 75
Lean Initiatives.......................................................................................................... 75Focus Upon Local Interests .................................................................................. 76
7
Com m unication...................................................................................................... 78Historical Contributors........................................................................................... 79S u m m ary ................................................................................................................... 8 0
7 .2 T rain in g ................................................................................................................... 8 17.3 Compensation and Measurement/Management Systems.................................... 82
U sing the Right M easures...................................................................................... 82A u d its ........................................................................................................................ 8 4Production A nalysis Boards.................................................................................... 84D isc ip lin e .................................................................................................................. 8 5
7.4 Change M anagem ent .......................................................................................... 85Self-Reinforcing Cycles........................................................................................ 85P o w e r ........................................................................................................................ 8 6Roadblocks................................................................................................................ 87Critical M ass of U nderstanding ............................................................................. 88Locations of Successful Change ............................................................................. 89
7.5 Recommendations For Transitioning to Lean Manufacturing............................. 90O v erv iew ................................................................................................................... 9 0Cultural Change ..................................................................................................... 91Detailed Change Plan............................................................................................. 94
8. Conclusions and Recom m endations .......................................................................... 978 .1 R e su lts ..................................................................................................................... 9 78.2 K ey Lessons Learned .......................................................................................... 978.3 Recom m endations for Future W ork.................................................................... 98
9. Bibliography ................................................................................................................. 99
8
List of Figures
Figure 2.1: Automotive Assembly Plant Locations in the U.S. and Canada................. 18Figure 2.2: Motor vehicle supplier plant locations and Delphi plant locations............. 20
Figure 2.3: Rear axles manufactured by AAM ............................................................ 22
Figure 4.1: DGA Plant 6 part families simplified flow diagram .................................. 40Figure 4.2: Long Output Shaft extended value stream map ............................................. 41
Figure 4.3: Full-float axle shaft simplified value stream flow diagram ............. 44
Figure 4.4: Full-float axle shaft extended value stream map (detailed) ............. 46
Figure 6.1: Weekday demand, production, and raw material shipments for Group F...... 58Figure 6.2: Weekday production of all part numbers at Group F ................................. 59Figure 6.3: Group F current state m ap .......................................................................... 60Figure 6.4: Group F future state m ap............................................................................ 61Figure 6.5: WIP/FG Material Loop From DGA Plant 3 Group F and ExternalCustom ers/A xle A ssem bly Line ................................................................................... 63Figure 6.6: Group F Weekly Inventory Forecast Chart ................................................. 67Figure 6.7: Finished Goods Material Market................................................................. 69Figure 6.8: Trigger (or pull) B oard ................................................................................. 70Figure 6.9: Sequence (or schedule) Board..................................................................... 70Figure 6.10: Weekday Production of High-Volume Part .............................................. 71Figure 6.11: Weekday Production of Low-Volume Parts ............................................ 73Figure 6.12 Weekday Production of All Parts .............................................................. 74
Figure 7.1: Formal Structure of the Organization and the Intern's Position Relative to KeyIn d iv id u als......................................................................................................................... 8 7
9
List of Tables
Table 1.1: Project Overview .......................................................................................... 14V iste o n .............................................................................................................................. 2 3Table 2.1: AAM Axle Competitors .................................................................................. 23Table 2.2: GM Truck Competitors.................................................................................... 23Table 4.1: Extended Value Stream Map Scorecard ...................................................... 43Table 5.1: Input to the Total Cost Model...................................................................... 49Table 5.2: Summary total costs for sourcing from two different sources of supply......... 53Table 5.3: Summary financial and other information for sourcing from two differentso u rces o f su p p ly ............................................................................................................... 54Table 6.1: Material M arket Sizing................................................................................. 65
10
1. Introduction
American Axle & Manufacturing, Inc. (AAM) is a world leader in the manufacture,
engineering design, and validation of driveline systems, chassis systems and forged
products for trucks, buses, sport utility vehicles, and passenger cars. A consistently
profitable tier-one supplier to both domestic and foreign OEM automobile manufacturers
as well as other suppliers, AAM had revenues of approximately $3.4 billion in 2005. In
addition to its U.S. locations in Michigan, New York, and Ohio, AAM also has offices or
facilities in Brazil, the UK, China, Germany, Poland, India, Japan, Mexico, and South
Korea.
AAM is organized into two product divisions: the Driveline Division and the Metal
Formed Products Division. The Driveline Division generates the majority of AAM's
revenue through the manufacture of front axles, rear axles, differentials, drive shafts,
crankshafts, steering and suspension systems and integrated modules and systems. The
Metal Formed Products Division generates revenue through the forging and machining of
automotive components such as axle shafts, differential gear components, hypoid pinions
and ring gears, stabilizer bars and other components [American Axle & Manufacturing,
2006].
The objective of this thesis was to understand material management for some of the value
streams for AAM's products, and to implement the tools of lean material management to
improve operating performance. Extended value stream mapping was used to define the
11
current state of product flow between plants, suppliers, processors and customers. A total
cost decision tool was developed to determine which suppliers to use for part
procurement decisions, and used for actual business cases. A lean pull system and
material markets were implemented at one plant location.
1.1 Thesis Motivation
AAM faces increasing global competition and cost pressures in both the driveline and the
metal formed products businesses. Declining sales and market share of AAM's largest
OEM customer, General Motors Corporation (GM), presents a major challenge. While
22% of AAM's revenue is non-GM derived and is growing [American Axle &
Manufacturing, 2006], the long time span between new program concepts and production
(up to four years) and the competitiveness of the industry mean that rapid increases in
revenue cannot be achieved by developing new customers, although longer-term
possibilities exist. Costs for many commodities and freight are increasing, and labor costs
are difficult to reduce because of existing labor contracts (although buy-out offers
recently presented to the hourly associates are intended to help reduce labor and benefits
costs in the long-term). In this challenging business environment, use of "lean
manufacturing" management practices offers one way to reduce inventory costs, improve
productivity, and create a continuous-improvement culture that can adapt faster than the
competition.
A major initiative of AAM's corporate operations management team is to implement lean
manufacturing on a company-wide basis. The immediate goals are to achieve the so-
12
called "50-in-5 goals" (Lean Manufacturing Challenge 2006-2010) over the next five
years:
0 50% Reduction in hours per axle
0 $50 M inventory reduction
* 50% reduction in dock-to-dock time
0 50% fewer direct suppliers
* 50% of sales from non-GM customers
0 500,000 ft2 of floor space made available
The longer-term goals are to achieve a continuous, self-sustaining competitive advantage
through the implementation of lean manufacturing and lean management principles.
Over the past one and one-half years, AAM has developed a lean group in the Corporate
Materials Department to assist with training, the development of company-wide lean
standards, and to provide guidance on initial implementation steps at the local plant level.
The Corporate Materials group also works with other departments to identify
opportunities for lean initiatives at the strategic level, such as for supplier sourcing
decisions. AAM has reached the point where routine use of lean manufacturing principles
has become common at many facilities, although inconsistent across the company as a
whole. Substantial improvements towards the "50-in-5 goals" have been achieved. Many
opportunities remain.
13
The goal of this thesis was to understand material management for some of the value
streams for AAM's products, and to implement the tools of lean material management to
improve operating performance.
1.2 Thesis Overview
The author made use of value stream and extended value stream mapping techniques,
inventory theory and supply chain theory, lean manufacturing principles, basic financial
analysis, and strategic sourcing analysis. Extended value stream mapping was used to
define the current state of product flow between plants, suppliers, processors and
customers. A total cost decision tool was developed to determine which suppliers to use
for part procurement decisions, and used for actual business cases. A lean pull system and
material markets were implemented at one plant location. An overview of the thesis
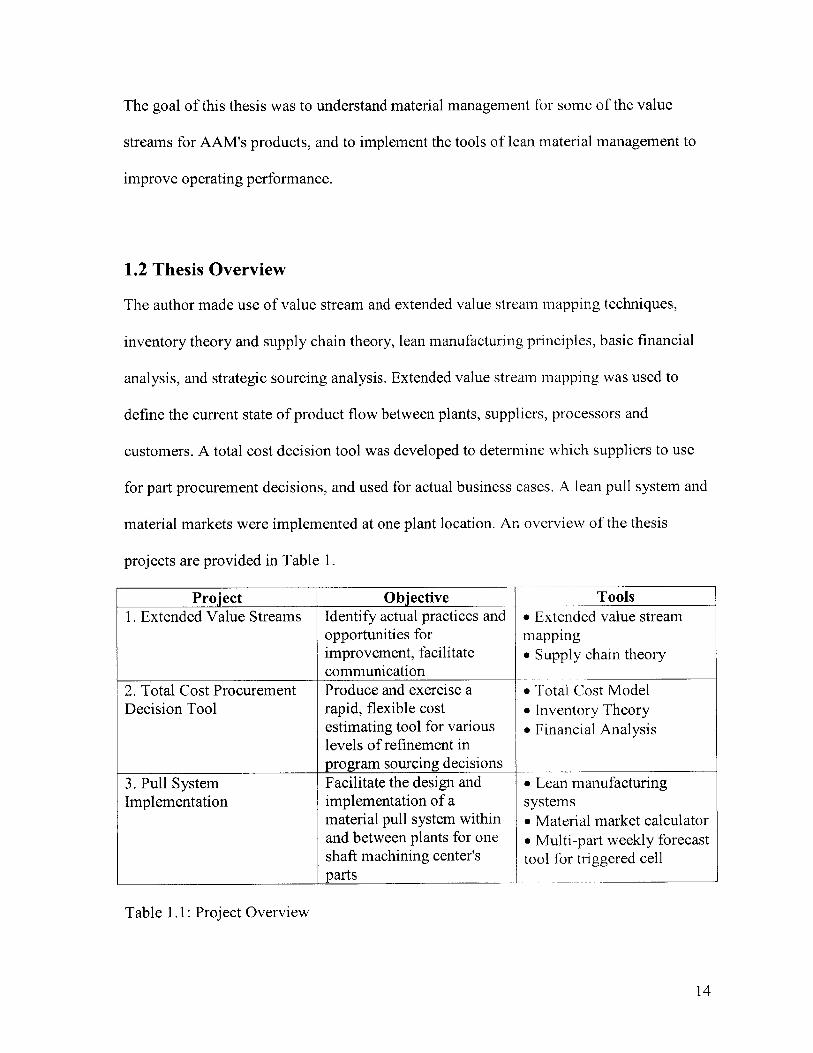
projects are provided in Table 1.
Project Objective1. Extended Value Streams Identify actual practices and '
opportunities forimprovement, facilitatecommunication
2. Total Cost ProcurementDecision Tool
3. Pull SystemImplementation
Produce and exercise arapid, flexible costestimating tool for variouslevels of refinement inprogram sourcing decisionsFacilitate the design andimplementation of amaterial pull system withinand between plants for oneshaft machining center'sparts
I
I
I
ToolsExtended value stream
nappingSupply chain theory
Total Cost Model'Inventory Theory'Financial Analysis
* Lean manufacturingsystems" Material market calculator" Multi-part weekly forecasttool for triggered cell
Table 1.1: Project Overview
14
I
Key insights of this project included:
" Extended value stream mapping, and the communication that is required toperform it, is a valuable exercise for management. It is a valuable tool forhighlighting opportunities for supply chain improvement and for providingobjective means to evaluate the state of current operations, and highlightsorganizational "blind spots".
" Total cost analysis tools are useful, but their real value lies in engaging indialogue with various departments to encourage teamwork and long-rangethinking about supply chains and sourcing decisions.
* Some major lean accomplishments are visible, but not consistent across thefirm
" Vital to obtaining the paradigm shift to a lean manufacturing culture andsuccessful plant floor implementation are: training; compensation andmeasurement/management systems; and removing roadblocks.
" Stay objective, focus on the data and on communicating constantly in anhonest, calm and open manner.
" Stay flexible.
1.3 Thesis Outline
This thesis is organized into eight chapters:
Chapter 1: An overview of the thesis, company, research approach and lessons learned.
Chapter 2: A description of the project setting including the industry, supply chain andcompany, and the motivation for the emphasis upon supply chains and leanmanufacturing principles at AAM.
Chapter 3: This chapter provides a literature review for value stream mapping, leanconcepts related to supply chains, lean manufacturing practices, and change management.
Chapter 4: A description of the extended value stream mapping of several supply chains,and opportunities for improvement.
Chapter 5. Description of total landed cost or "lean costs" for sourcing decision-making,development of the model used to evaluate total cost, and examples of its use.
15

Chapter 6: Presents the background of the pull system implementation effort, its design,tools developed to assist with the design, and the implementation.
Chapter 7: Consists of an overview of organizational and cultural aspects of leanmanufacturing, change management, and policy deployment.
Chapter 8: Contains conclusions and recommendations for future work.
16
2. Company and Industry Background
This chapter provides a context for the thesis. The chapter describes the state of the
domestic motor vehicle industry and its supply base. Major trends are discussed, and how
they affect AAM. Most importantly, we focus on AAM and the reasons for an emphasis
upon supply chains and lean manufacturing management.
2.1 U.S. Automobile Industry OEMs
The business environment for U.S. domestic automobile manufacturers has become
increasingly challenging and competitive in recent years. The traditional "Big Three"
domestic manufacturers, General Motors, Ford, and Chrysler (now Daimler Chrysler)
have been consistently losing domestic market share, sliding from about 70% in 1998 to
about 55% in 2006 [Ward's Auto, 2006]. Part of the decline in market share has been
attributable to the declining sales of Sport Utility Vehicles and trucks, which the "Big
Three" have traditionally focused upon producing and marketing more heavily than
foreign firms. Quality, design, operations, and labor/benefit costs have also contributed to
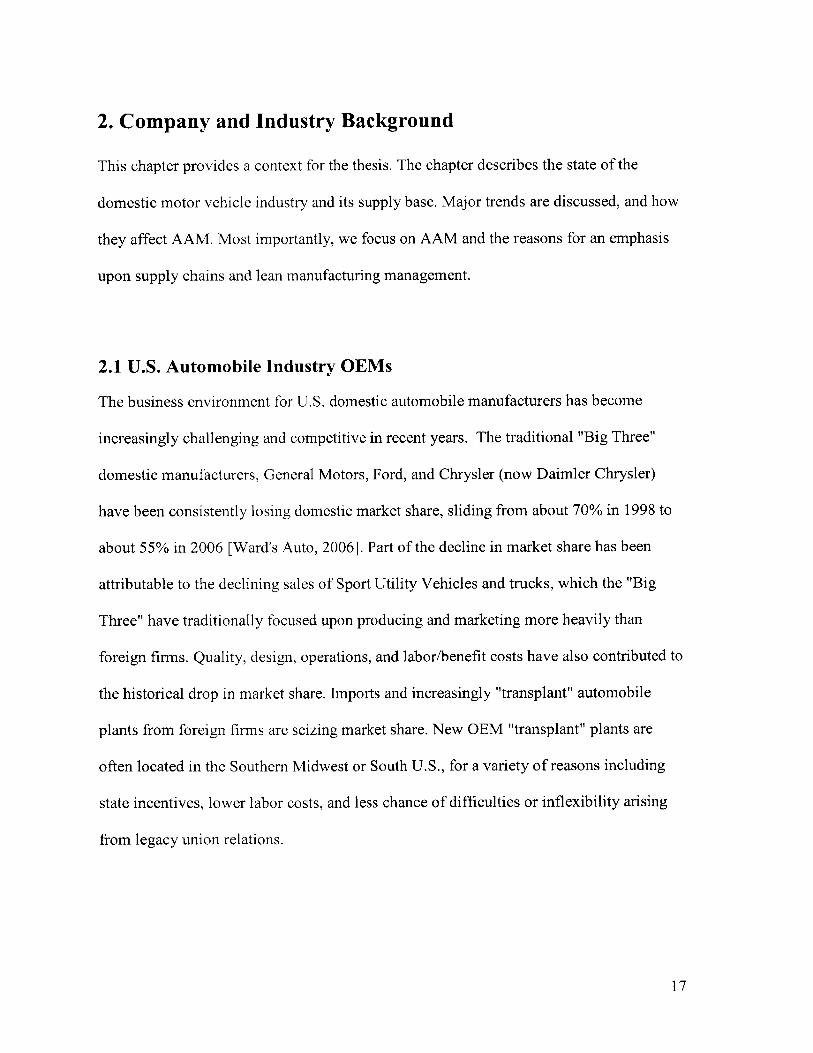
the historical drop in market share. Imports and increasingly "transplant" automobile
plants from foreign firms are seizing market share. New OEM "transplant" plants are
often located in the Southern Midwest or South U.S., for a variety of reasons including
state incentives, lower labor costs, and less chance of difficulties or inflexibility arising
from legacy union relations.
17
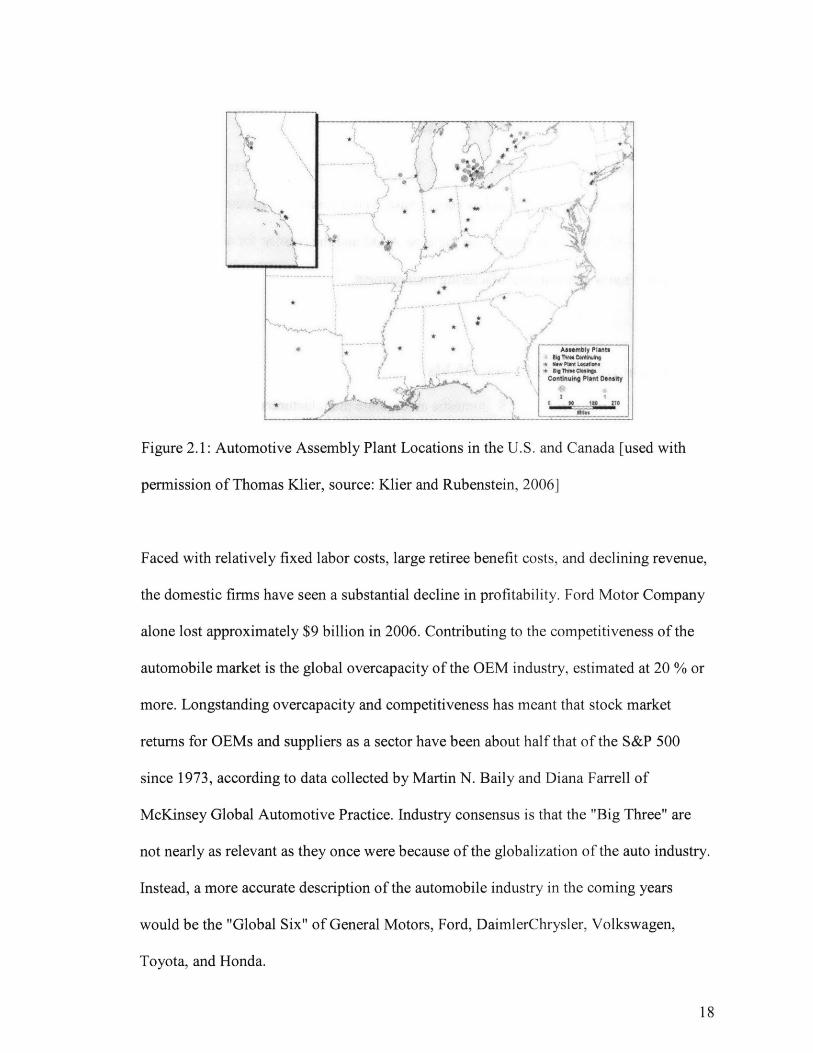
Figure 2.1: Automotive Assembly Plant Locations in the U.S. and Canada [used with
permission of Thomas Klier, source: Klier and Rubenstein, 2006]
Faced with relatively fixed labor costs, large retiree benefit costs, and declining revenue,
the domestic firms have seen a substantial decline in profitability. Ford Motor Company
alone lost approximately $9 billion in 2006. Contributing to the competitiveness of the
automobile market is the global overcapacity of the OEM industry, estimated at 20 % or
more. Longstanding overcapacity and competitiveness has meant that stock market
returns for OEMs and suppliers as a sector have been about half that of the S&P 500
since 1973, according to data collected by Martin N. Baily and Diana Farrell of
McKinsey Global Automotive Practice. Industry consensus is that the "Big Three" are
not nearly as relevant as they once were because of the globalization of the auto industry.
Instead, a more accurate description of the automobile industry in the coming years
would be the "Global Six" of General Motors, Ford, DaimlerChrysler, Volkswagen,
Toyota, and Honda.
18
2.2 Supply Chain
The automotive industry supply chain is a major enterprise. Sixty two percent of the total
motor vehicle and parts manufacturing industry employment is in parts [BLS, 2006]. By
the end of the twentieth century the "Big Three" had spun-off many of their captive parts
makers into independent firms. Additionally, the supply base is being reduced through
competition, and through the desire of firms to more selectively develop suppliers who
will assume more responsibility for product design and integration. The number of North
American tier one suppliers is projected to shrink from several thousand in the 1970's to
about 300 in the near future. "OESA estimates that there were 30,000 firms in the North
American automotive supply chain tiers in 1990, but just 10,000 in 2000 and 8,000 in
2004. By 2010, their numbers may dwindle to no more than 5,000" [ITA, 2005]
The difficulties faced by the domestic OEMs have translated into great distress for the
domestic supply chain, because as a supplier there is little that can be done in the short-
term to increase sales if a major OEM customer faces decreased sales (unlike an OEM
which can decrease price or increase functionality to stimulate sales). "The Original
Equipment Suppliers Association, OESA, cites separate studies in 2003 by Plante &
Moran and by A.T.Kearney that found that only 20% of a surveyed universe of small,
medium, and large North American suppliers were generating operating margins above
8%. 15% of each group were losing money." [ITA, 2005] Dozens of major suppliers have
declared bankruptcy over the past ten years because of these difficulties, most notable
Delphi. While in the long-term possibilities do exist to increase sales to "transplant"
19
OEM plants, these relationships require time to develop and are often difficult to obtain if
foreign firms already have preferred supplier firms that have also established new
operations in North America.
Ilk
* ~-4-4
*W SU.'r %0 0*"
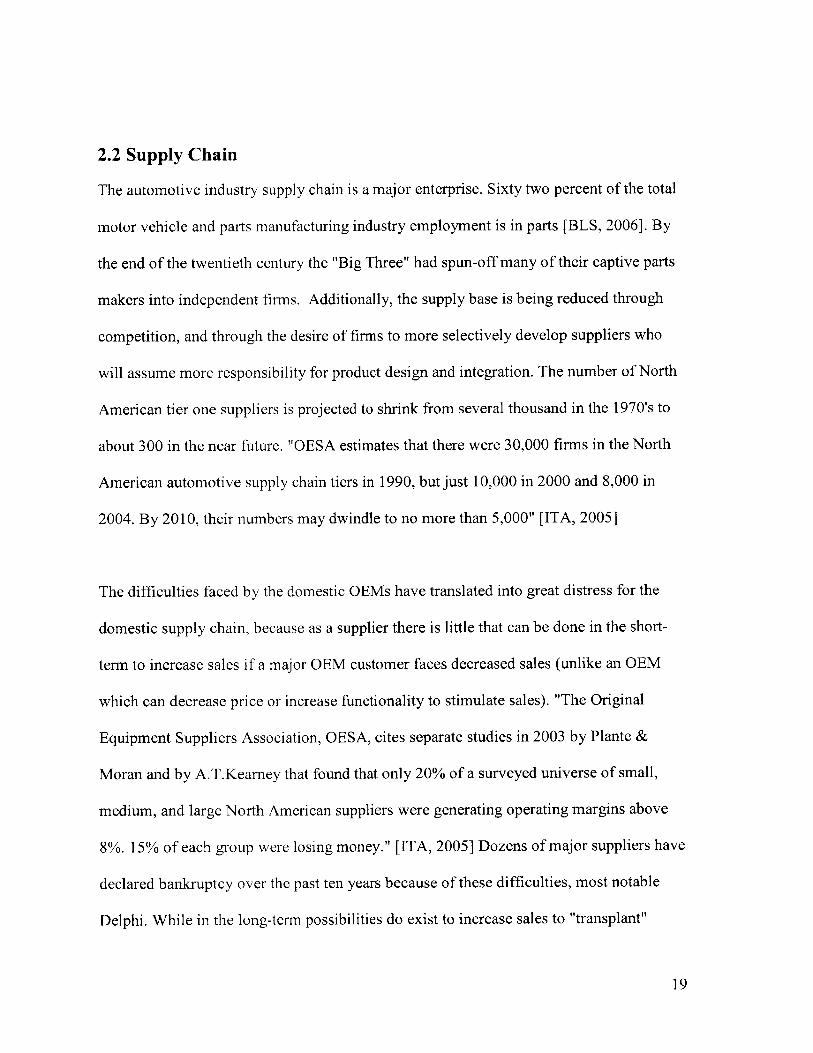
Figure 2.2: Motor vehicle supplier plant locations and Delphi plant locations [used with
permission of Thomas Klier, source: Klier and Rubenstein, 2006]
The southward movement of new assembly plants and supplier firms is a major trend in
the North American auto industry. Detroit was the traditional center of the motor vehicle
and parts manufacturing industry, and 22% of all automobile or part manufacturing jobs
are still located in Michigan [BLS, 2006]. Many of the newer supplier facilities have been
located further south than the traditional Detroit/Midwest-based auto industry, in order to
better serve the new "transplant" OEM plants within one day's driving distance.
20
A second major trend is the regionalization of supply chains, as foreign "transplants"
work to develop regional (intra-continental) sources of supply to reduce supply chain
risks, costs, and inventory in-line with lean principles. As a result of these efforts, many
foreign firms produce vehicles with an equal or higher "domestic content" than domestic
firms. For example, the Toyota Camry has been variously reported to have a domestic
content of 70-85% depending upon model year, while total General Motors domestic
content for all models is about 80% on average.
2.3 Company Background
American Axle & Manufacturing, Inc. (AAM) was founded in 1994 by Richard E.
Dauch, Chairman, Co-founder and CEO, and his partners through an asset buyout from
GM. AAM went public on January 29, 1999 and its stock is traded on the New York
Stock Exchange under the ticker symbol AXL. The workforce is unionized, represented
by the United Auto Workers (UAW) or the International Association of Machinists
(IAM) in the United States locations.
AAM is a world leader in the manufacture, engineering design, and validation of
driveline systems, chassis systems and forged products for trucks, buses, sport utility
vehicles, and passenger cars. A consistently profitable tier-one supplier to both domestic
and foreign OEM automobile manufacturers as well as other suppliers, AAM had
revenues of approximately $3.4 billion in 2005. In addition to its U.S. locations in
21
Michigan, New York, and Ohio, AAM also has offices or facilities in Brazil, the UK,
China, Germany, Poland, India, Japan, Mexico, and South Korea.
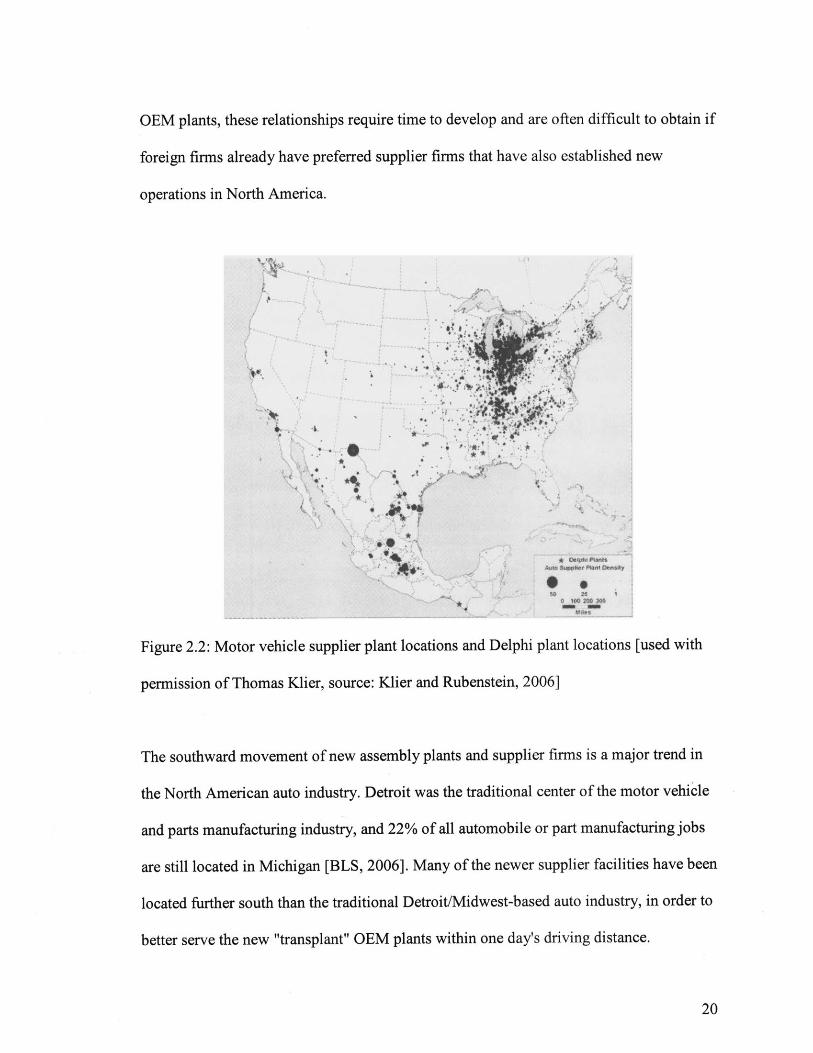
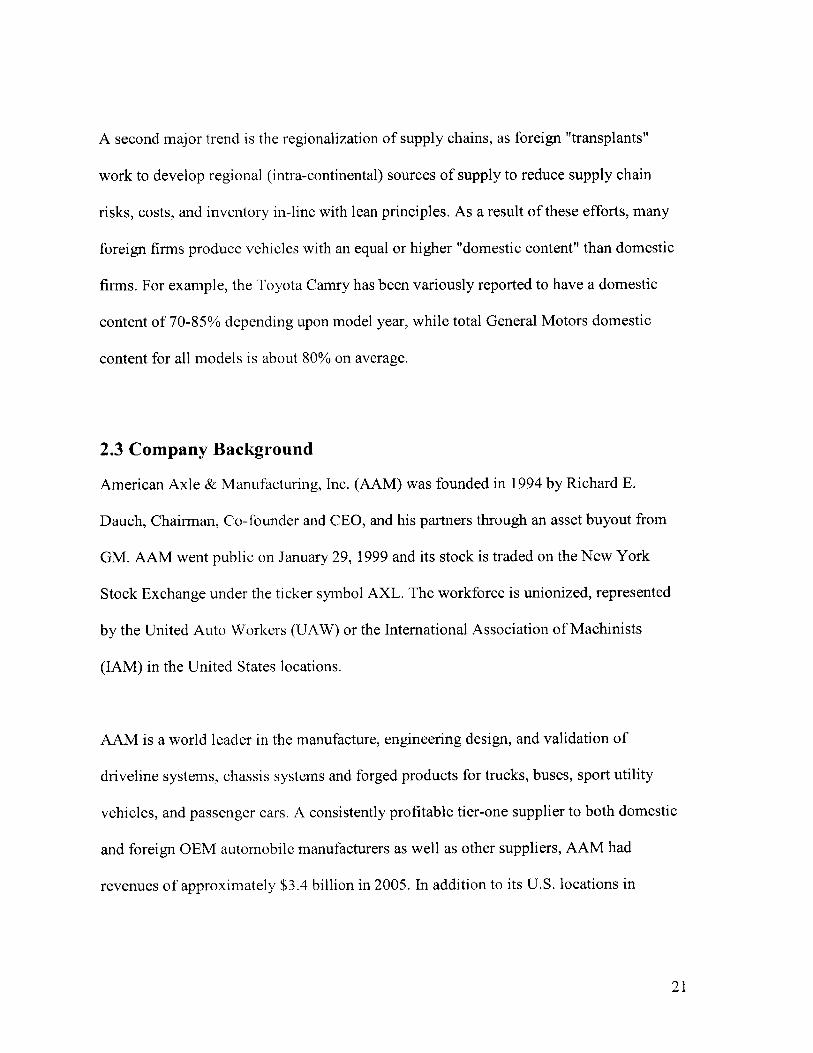
AAM is organized into two product divisions: the Driveline Division and the Metal
Formed Products Division. The Driveline Division generates the majority of AAM's
revenue through the manufacture of front axles, rear axles, differentials, drive shafts,
crankshafts, steering and suspension systems and integrated modules and systems. The
Metal Formed Products Division generates revenue through the forging and machining of
automotive components such as axle shafts, differential gear components, hypoid pinions
and ring gears, stabilizer bars, truck hitch balls, and other components [American Axle &
Manufacturing, 2006].
Figure 2.3: Rear axles manufactured by AAM [AAM internal corporate web site]
AAM has core competencies in:
" Engineering
* Forging
* Machining
22
" Assembly
" Welding
" Heat Treating
" Product Validation
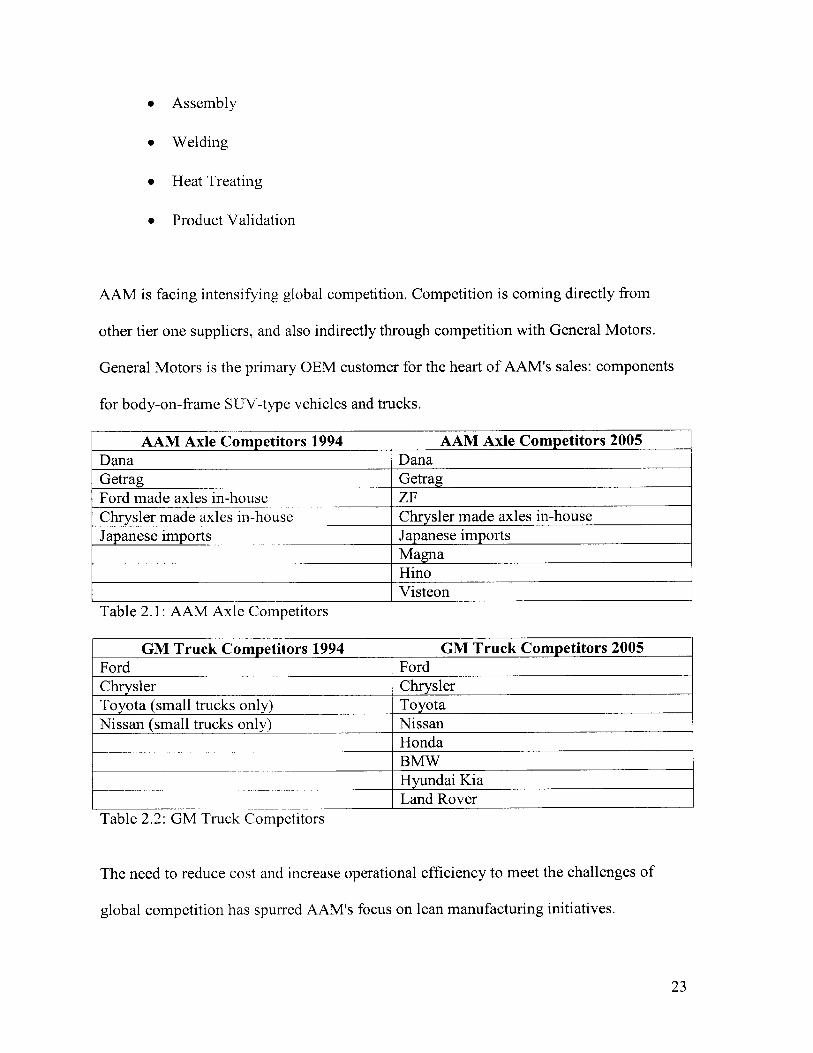
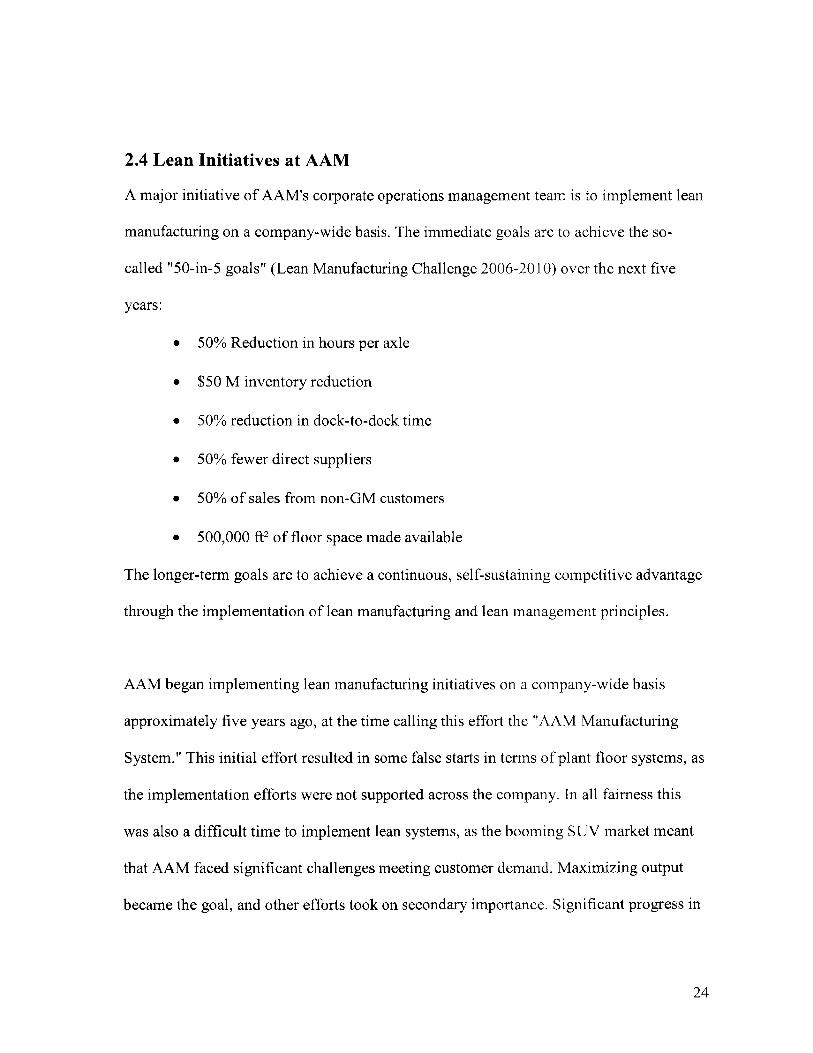
AAM is facing intensifying global competition. Competition is coming directly from
other tier one suppliers, and also indirectly through competition with General Motors.
General Motors is the primary OEM customer for the heart of AAM's sales: components
for body-on-frame SUV-type vehicles and trucks.
AAM Axle Competitors 1994 AAM Axle Competitors 2005Dana DanaGetrag GetragFord made axles in-house ZFChrysler made axles in-house Chrysler made axles in-houseJapanese imports Japanese imports
MagnaHinoVisteon
Table 2.1: AAM Axle Competitors
GM Truck Competitors 1994 GM Truck Competitors 2005Ford FordChrysler ChryslerToyota (small trucks only) ToyotaNissan (small trucks only) Nissan
HondaBMWHyundai KiaLand Rover
Table 2.2: GM Truck Competitors
The need to reduce cost and increase operational efficiency to meet the challenges of
global competition has spurred AAM's focus on lean manufacturing initiatives.
23
2.4 Lean Initiatives at AAM
A major initiative of AAM's corporate operations management team is to implement lean
manufacturing on a company-wide basis. The immediate goals are to achieve the so-
called "50-in-5 goals" (Lean Manufacturing Challenge 2006-2010) over the next five
years:
* 50% Reduction in hours per axle
0 $50 M inventory reduction
0 50% reduction in dock-to-dock time
* 50% fewer direct suppliers
* 50% of sales from non-GM customers
* 500,000 ft2 of floor space made available
The longer-term goals are to achieve a continuous, self-sustaining competitive advantage
through the implementation of lean manufacturing and lean management principles.
AAM began implementing lean manufacturing initiatives on a company-wide basis
approximately five years ago, at the time calling this effort the "AAM Manufacturing
System." This initial effort resulted in some false starts in terms of plant floor systems, as
the implementation efforts were not supported across the company. In all fairness this
was also a difficult time to implement lean systems, as the booming SUV market meant
that AAM faced significant challenges meeting customer demand. Maximizing output
became the goal, and other efforts took on secondary importance. Significant progress in
24
productivity, quality, and cost was made, however, due to a continuous management
focus on operations.
More recently Harris Lean Systems, a management consultant firm comprised of former
employees of Toyota and other firms well-versed in lean manufacturing methods, has
been advising AAM. Over the past one and one-half years, AAM has developed a lean
group in the Corporate Materials Department to assist with training, the development of
company-wide lean standards, and to provide guidance on initial implementation steps at
the local plant level. The Corporate Materials group also works with other departments to
identify opportunities for lean initiatives at the strategic level, such as for supplier
sourcing decisions. AAM has reached the point where routine use of lean manufacturing
principles has become common at many facilities, although inconsistent across the
company as a whole. Substantial improvements towards the "50-in-5 goals" have been
achieved. Many opportunities remain.
2.5 Project Goals
The expected product of the project will include strategic, tactical, and
organizational (non-technical) components. Supply chain inventory and lead time-
reduction opportunities will be identified via extended value stream mapping. A total cost
part procurement decision tool will be developed and used in test business cases. Internal
and interplant pull loops will be created, and material markets will be sized to handle
typically experienced supply and demand variability. Finally, observations on the
strategic, cultural, and political aspects of the organization will be provided.
25

Recommendations will be made regarding approaches to the continued adoption of lean
manufacturing at AAM.
26
3. Literature Review
This chapter reviews basic concepts of lean manufacturing. This includes the origins of
lean, the seven major forms of waste, and tools to identify and reduce waste. Major tools
such as extended value stream mapping are discussed. The concept of total or lean
purchased parts cost is introduced. Basic pull system concepts are referenced. Finally,
issues revolving around change management in organizations are addressed.
3.1 Lean Manufacturing
"Lean manufacturing" is the label widely used to describe a set of practices and operating
philosophies best exemplified by the Toyota Production System, but used by many firms
throughout the world. Lean manufacturing had its origins in several developments from
the mid-twentieth century, which came together in the Toyota Production System.
Japanese firms such as Toyota were initially highly vulnerable and seeking forms of
operational advantage in post-World War-I Japan. Making intelligent use of quality
control, work modularization/breakdown, a focus on product flow, and other techniques
(many of which were heavily utilized in U.S. industry during the war years but were
subsequently de-emphasized), Japanese firms developed sustaining operational
advantages.
Toyota especially recognized that traditional "mass manufacturing" techniques as
practiced in the U.S. and epitomized by Ford would not be practical in Japan. The very
capital-intensive, inventory-intensive approach of U.S. "mass producers" of the time
27
utilized large dedicated machines with long changeover times between parts and large
batch production runs for each part. Toyota recognized that these processes, while locally
efficient in terms of maximizing utilization of expensive assets (large machinery), might
be wasteful in macro or enterprise-wide terms. The waste could come from many forms:
excess inventory, excess or uncoordinated production before it was necessary,
unnecessarily time-consuming tooling changeover times to run different parts on one
machine, etc.
The system developed by Toyota was later labeled "lean manufacturing" by John Krafcik
[Marchwinski and Shook, 2004]. Toyota developed a series of systems and tools to:
highlight waste and material flow through visual control; encourage the work force to
work together to identify root causes of problems to avoid reoccurrence; and to
standardize work and training to stabilize operations and quality. Especially helpful to
this effort was the adoption and modernization of the Training Within Industry (TWI)
methodology which had been developed in the U.S. during World War-I [Dinero, 2005].
TWI was developed to teach people how to effectively, consistently, perform on-the-job
training for hourly associates, and to teach continuous improvement methods.
Over the long-term Toyota's efforts in highlighting and seeking forms of waste,
addressing the root causes, and systematizing the process of doing so reaped enormous
dividends. The long changeover times of machines and the large inventories traditionally
needed to run a large motor vehicle manufacturing operation were dramatically reduced,
and quality, cash flow and profitability was increased. "Lean manufacturing" received
28
widespread recognition after the publication of a book about the global automobile
industry titled The Machine That Changed the World, [Womack et al, 1991].
Lean strives for stability, reduced set-up times, and one-piece flow of material. Lean
emphasizes building to the pace of customer demand, or takt time, and building only
what is needed, when, and in the desired quantity. Lean manufacturing emphasizes
striving to eliminate the "seven forms of waste":
" Excess inventory
" Overproduction
* Motion
" Handling
" Correction of Defects
" Overprocessing
* Waiting
3.2 Extended Value Stream Mapping and Supply Chains
Rother and Shook [2003] describe the lean tool of value stream mapping. Value stream
mapping consists of a broad outline mapping of the material handling and the information
flow within a plant. The intended purpose is to have a group of plant personnel walk the
entire "value stream" within a plant, from receiving dock to shipping dock, collecting
actual operational information along the way. Every major process, inventory
accumulation, or handling step is outlined on the map with relevant lean measures such
29
as days of inventory on-hand, cycle times, etc. Information flow describing how
scheduling or customer interactions are accomplished is also included on the map.
The final result of in-plant value stream mapping is an accurate depiction of the "current
state" of the operation, along with a description of customer demand, shipment
information and takt time (for lean terms refer to Marchwinski and Shook [2004]).
Opportunities for changing the value stream to a flow that is better oriented towards lean
operating principles are identified and then used to make a "future state" map. This
"future state" map can then be used to guide improvement efforts.
Jones and Womack [2003] demonstrate an extension of value stream mapping that is
intended to cover the entire extended value stream. Extended value stream mapping
should cover as much of the entire supply chain as possible, from the raw material
provider to the final end customer. The extended value stream maps treat each individual
plant as a single, simplified process. In this way the complexity of the in-plant value
stream maps described above are reduced to a summary of the plant's contribution to
supply chain material and information flow.
Extended value stream maps are powerful tools because they often map value streams
that no one person has ever seen in its entirety. Extended value stream maps also involve
the collection of different kinds of data. Variations in demand, standard pack sizes, travel
distances, and other factors become of great interest in extended value streams. Major
strategic and operational opportunities are usually made apparent by the development of
30
extended value stream maps. Some of these opportunities might involve the re-sourcing
of work to closer facilities or in-sourcing of work to reduce lead time and handling.
3.3 Total or Lean Purchased Parts Cost
Womack [2003] discusses the multiple added costs that can occur when sourcing
components from distant locations or complex supply chains. Traditional sourcing
decisions in large firms are made based on comparing piece price plus freight costs
between foreign and local suppliers. Looked at only in this way, sourcing parts to distant
countries with low labor costs often makes sense. Making a more thorough appraisal of
the expected costs and risks involved in these long supply chains may change this
perspective, however.
Costs for expediting, for dealing with quality spills, inventory holding costs, and other
factors, become significant when sourcing from distant suppliers. In many cases sourcing
parts to a distant, low-wage country such as China does not always make business sense
when total, or lean supply chain, costs are considered. This may be one reason that lean
manufacturing-oriented firms such as Toyota work to increase their local supply base and
to improve the operations of local suppliers: shorter supply chains tend to have less risk
and overhead. Short supply chains also allow for more opportunity for improvement in
the form of frequent "milk-run" deliveries. Reducing the number of suppliers is another
means to reduce risk (Womack and Jones, [2003]), although even a single, well-run
supplier can pose substantial supply chain risks if located at a great distance from the
customer.
31
D'Avanzo et al [2004] discuss supply chain strategy and its business implications. They
note that research shows a positive correlation between firms with superior supply chain
management strategies and positive compound annual growth rate (CAGR) of market
capitalization compared to their industry's average CAGR. They also observe that leading
firms make supply chain design part of their business strategy.
3.4 Pull System
Rother and Harris [2001] discuss the manufacturing cell or tactical-level aspects of lean
manufacturing. The focus is on creating continuous flow through manufacturing cells by
first making sure that the appropriate products are assigned to a cell or group of cells, and
that production is arranged according to the pace of customer demand (takt time).
Operator work balance, and machine capacity and arrangement, should be arranged to
achieve both a balanced work load and improved material flow through the cell.
Automation should be applied sensibly, and in many cases less automation should be
considered rather than more because this allows for greater operational flexibility.
Buffers of finished goods reduce variations in production orders at the pacemaker
operation, which is the operation used to schedule production. Cells should be designed
to allow gradual changes in staffing to accommodate gradual changes in customer
demand. Implementation should begin with a small core team but as the project is
deployed and adapts, continuous improvement and sustainment should rely on maximum
operator involvement.
32
Harris et al [2003] presents a plant-level description of how to ensure material flow. This
involves making a plan for every part (PFEP), a basic database or table listing major
demand and physical storage attributes for every part handled in a plant. The
development of this central repository of information allows for rapid planning and
adaptation to changes in requirements. Material market sizing, locations, conveyance
strategies, and continuous improvement efforts are also addressed.
Smalley [2004] reviews the steps needed to implement a plant-wide system for leveling
pull across multiple part families. Pacemaker, market sizing, and production control are
reviewed in detail in the context of batch production. Cycle stock, buffer stock and safety
stock sizing is explained. Most useful in this discussion is a review of the many types of
approaches available for handling a mix of high- and low-volume products, and the
appropriateness of different types of kanban (pull) card signals.
3.5 Change Management
Many firms around the world have successfully applied lean manufacturing techniques to
improve their businesses[Womack and Jones, 2003], and foreign "transplant" automobile
industry plants in the U.S. have successfully applied these techniques with a domestic
work force [Womack et al, 1991]. Also, TWI efforts were first developed and very
successfully applied in the U.S [Dinero, 2005]. Therefore there is no intrinsic cultural
element preventing the adoption of lean techniques to any firm in any country. Rather,
management and company-specific cultural factors represent the issues to be resolved
when deploying a lean manufacturing system at a firm.
33
When a strong pull or need is recognized by many stakeholders at a firm, as was the case
in early post-World War-I Toyota, then alignment and change can come about more
easily. When a strong unifying need is not present, or when cultural, political or strategic
incentives may not be aligned - as in the case with labor and management at U.S.
automobile OEMs in the recent past - change can be more difficult to implement. As
[Klein, 2004] points out, organizational change seems most effective when a critical mass
of company "insider-outsiders" develop sufficient exposure to new facts and ideas to
remove their organizational blinders, allowing them to see the compelling need to change
the organization while still respecting the ways in which the organization functions.
Byrnes [2006] notes that paradigm shifts in business operations tend to be most
successful with extensive training, and with changes in compensation schemes.
Employees tend to need both general familiarization training with new concepts, and
specific training regarding their new functions. People will do what they are actually paid
and promoted to do, so the "real litmus test" for change in a firm is: are you willing to
change your compensation systems? [Byrnes, 2006]
Womack and Jones make the point that some individuals will not be able to make the
transition to a new operating paradigm, and that a small portion of the managers and
workforce will need to be removed for firms to successfully transition to lean
manufacturing [Womack and Jones, 2003]. Collins focuses on the common factors
behind companies that successfully transitioned from mediocre performance to sustained
34
greatness. He found that getting the right people involved in management and removing
those not capable of adapting to be important in these firms, even before deciding what
direction to take [Collins, 2001].
Collins [2001] also found other important elements common to all firms that made a
transition to great performance: a leader with humility and teamwork, not a larger-than-
life personality; having the ability to acknowledge current realities while seeing a path
towards success; selecting a business that you can be passionate about, best in the world
at, and can establish an economic measurement system for; having a culture of discipline
(discipline of people, thought, and action) that allows a firm to avoid the need for
bureaucracy; and avoiding technology bandwagons, since technology is rarely the cause
of greatness, but is only harnessed to help a company that is already headed in the right
direction.
Organizational structure and management practices are also important factors in
implementing change. Organizational structure affects how the change is deployed, who
loses and who gains from operational change, and how many key managers must support
the changes or have their compensation changed to support them. Organizational
structure also directly affects the important element of accountability.
35

[This page is intentionally blank]
36
4. Extended Value Stream Mapping
This chapter discusses the extended value stream mapping component of the thesis.
4.1 Current State of Supply Chain
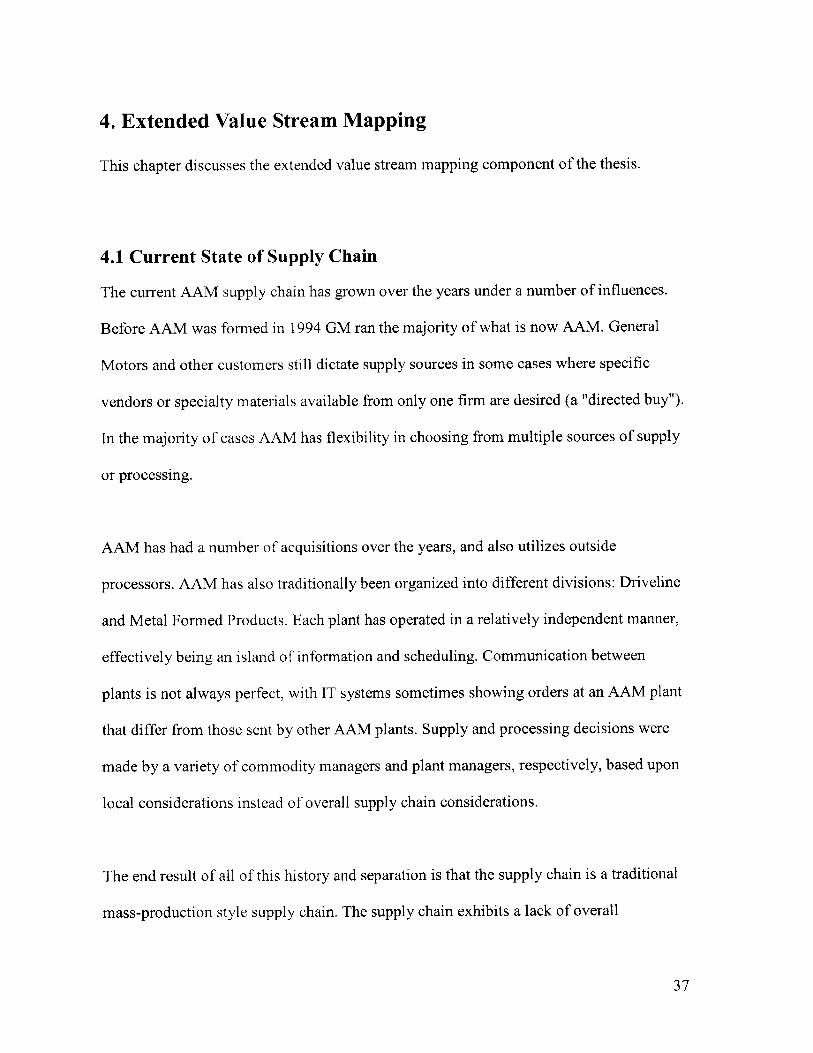
The current AAM supply chain has grown over the years under a number of influences.
Before AAM was formed in 1994 GM ran the majority of what is now AAM. General
Motors and other customers still dictate supply sources in some cases where specific
vendors or specialty materials available from only one firm are desired (a "directed buy").
In the majority of cases AAM has flexibility in choosing from multiple sources of supply
or processing.
AAM has had a number of acquisitions over the years, and also utilizes outside
processors. AAM has also traditionally been organized into different divisions: Driveline
and Metal Formed Products. Each plant has operated in a relatively independent manner,
effectively being an island of information and scheduling. Communication between
plants is not always perfect, with IT systems sometimes showing orders at an AAM plant
that differ from those sent by other AAM plants. Supply and processing decisions were
made by a variety of commodity managers and plant managers, respectively, based upon
local considerations instead of overall supply chain considerations.
The end result of all of this history and separation is that the supply chain is a traditional
mass-production style supply chain. The supply chain exhibits a lack of overall
37
understanding or planning, best exhibited by the fact that even the part number
designation for the same product may change at every location throughout the value
stream. This means that individuals at separate plants have difficulty understanding the
specific part or product that is being talked about by employees at other locations.
4.2 Extended Value Stream Mapping of Supply Chain
American Axle & Manufacturing, Inc. has a major initiative underway to improve
operations and achieve truly "lean manufacturing". As part of this initiative, value stream
mapping activities have been perfonned for many local value streams within individual
plants by materials and operations associates. During the internship it was decided that
efforts should also be applied to mapping extended value streams between all of the
AAM and supplier/processor plants. Managers at AAM felt that major strategic
opportunities existed for identifying waste or misalignment in the value stream.
Two families of extended value streams were selected for the initial mapping effort: (a)
parts flowing into Detroit Gear & Axle Plant Six (DGA 6); and (b) full-float axle shafts
flowing out of Detroit Forge. DGA 6 assembly operations were deemed to have a large
effect on the entire supply chain upstream of the plant, and therefore it was felt to be
important to understand this set of value streams. DF shafts are sent to a variety of plants,
processors, and customers, and a value stream mapping exercise was therefore though to
be useful. There was also a nice tie-in to the tactical pull system implementation project,
which involved machining of these full-float axle shafts in Detroit Gear & Axle Plant
Three.
38
The extended value stream mapping was intended to capture high-level strategic
information, not tactical-level details within the plants. The goal of the effort was to
highlight major alignment and operating issues. In addition to focusing on traditional
value stream mapping measures, such as inventory and communication paths, special
focus was given to information more relevant to the extended value stream. Delivery
schedules, standard package sizes, part number nomenclature, and order variability were
some of the factors that were collected when available.
Mapping of extended value streams was accomplished using local information available
in Detroit and also with extensive telephone conversations and e-mail exchanges.
4.3 Results and Future Opportunities
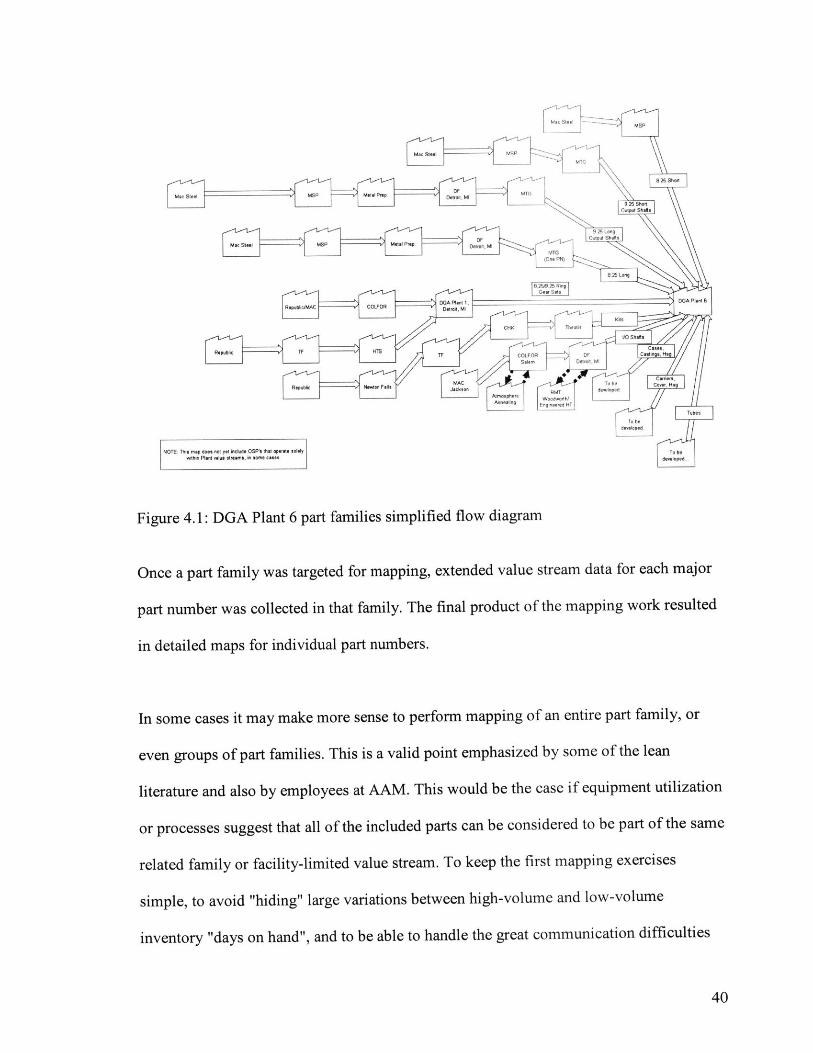
Family (a) parts flowing into Detroit Gear & Axle Plant Six (DGA 6)
The parts families that flow through DGA Plant 6 which were mapped are shown in the
simplified flow diagram below.
Extended value stream maps were created for many specific parts flowing into DGA
Plant 6. Major part families were selected for mapping, as shown in the simplified
diagram below. Each path represents one major part family on the diagram. In some cases
a part family consists of several medium- or high-volume parts.
39
Mac Steel S
-SPP
G
Sh d8 2 ShorlM.9.2 ShortM
Output ShF
p 25
Sd SsLong
8~ 2252 LongF uGear Sets4 DGAaf i s i d
CHK ThO shafts
Css
HTS TF COfOR t/ ma n wakns su
in ~ ~ ~ ~ ~~ ae detailed masfridiiulprtnmes
o h l o Newon Falls a rtscn bte pao e
To beTbsd-vloped
NOTE: This map does not yet inclde OPsthat operate solely e.
Figure 4. 1: DGA Plant 6 part families simplified flow diagram
Once a part family was targeted for mapping, extended value stream data for each major
part number was collected in that family. The final product of the mapping work resulted
in detailed maps for individual part numbers.
In some cases it may make more sense to performn mapping of an entire part family, or
even groups of part families. This is a valid point emphasized by some of the lean
literature and also by employees at AAM. This would be the case if equipment utilization
or processes suggest that all of the included parts can be considered to be part of the same
related family or facility-limited value stream. To keep the first mapping exercises
simple, to avoid "hiding" large variations between high-volume and low-volume
inventory "days on hand", and to be able to handle the great communication difficulties
40
experienced when dealing with parts that had changing part numbers and sometimes
divergent paths throughout the value stream, mapping was done for individual part
numbers on the final detailed maps, not for whole families of parts.
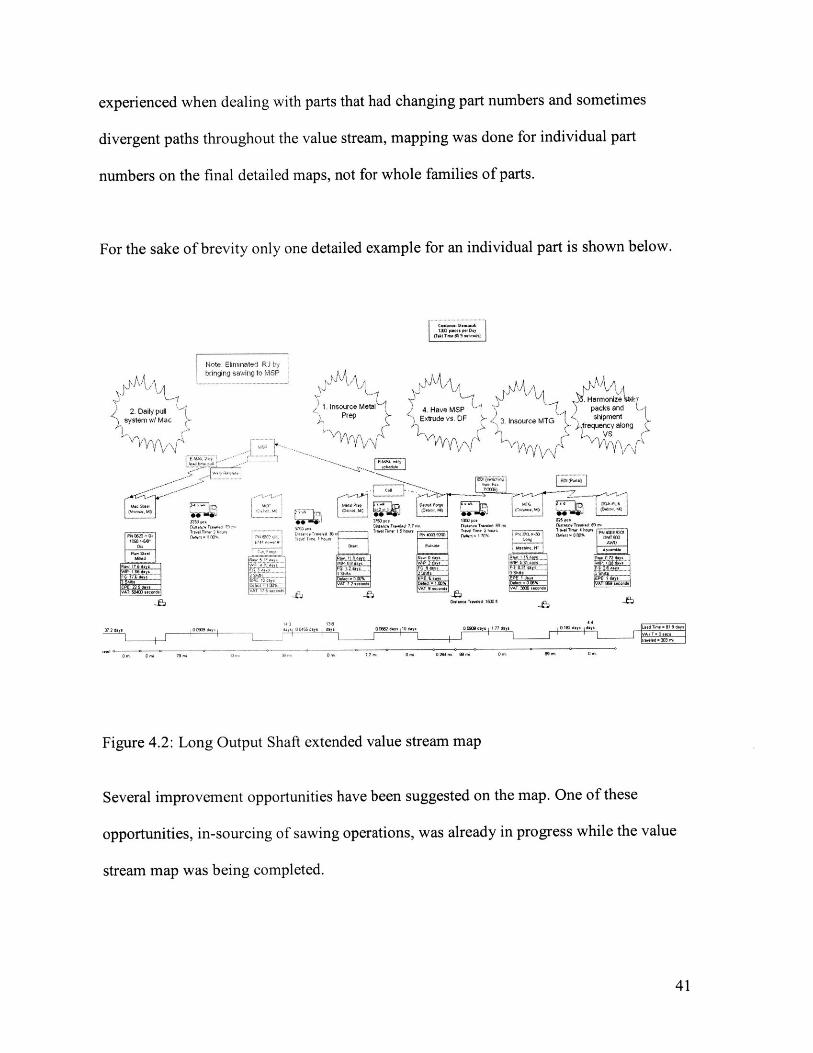
For the sake of brevity only one detailed example for an individual part is shown below.
( 9 .. 9 . .....d.
f'fr2. Daily pull
system W/ Mac
37.2 day. 0 M days
Note: Eliminated RJ bybringing sawing to MSP
1 Insource Met'lPrep V
0*
|VA: ..4!Ieond.
V 1 d
1A U1 JtA'k.A.4. Have MSP packs and
Extrude vs. DF 3. tnsource MTG shipnentfrequency along
Yvs
13M L. G'kyC
3,22.9,9..Irn'. N,,,T, ,..99d 99n-- Tr IT_ -i.1 h0,r T!" Timn. 2 - -1Tr.4hou . PMm 4,--4 vo o
13as ExsdeMuhne. K A'demnb a
2T1.9. dy 49d
VA a d is tn raed:1f
day 0466 day, da. 0 02" dy91O dy.ays 1.77 day. 0.182 days d.y. Lead T.m. - 81.9 day,
trvld =3M3 m
-Ive C 0 m, 0 m- 79 m- 0"m.'6m D mi 77.7 am. 0.2B4. O..Mm m 89 mn. 0 mn.
Figure 4.2: Long Output Shaft extended value stream map
Several improvement opportunities have been suggested on the map. One of these
opportunities, in-sourcing of sawing operations, was already in progress while the value
stream map was being completed.
41
EANWidy
3 -641-4-7.,cs(No .... Te.:..lT-I t!".
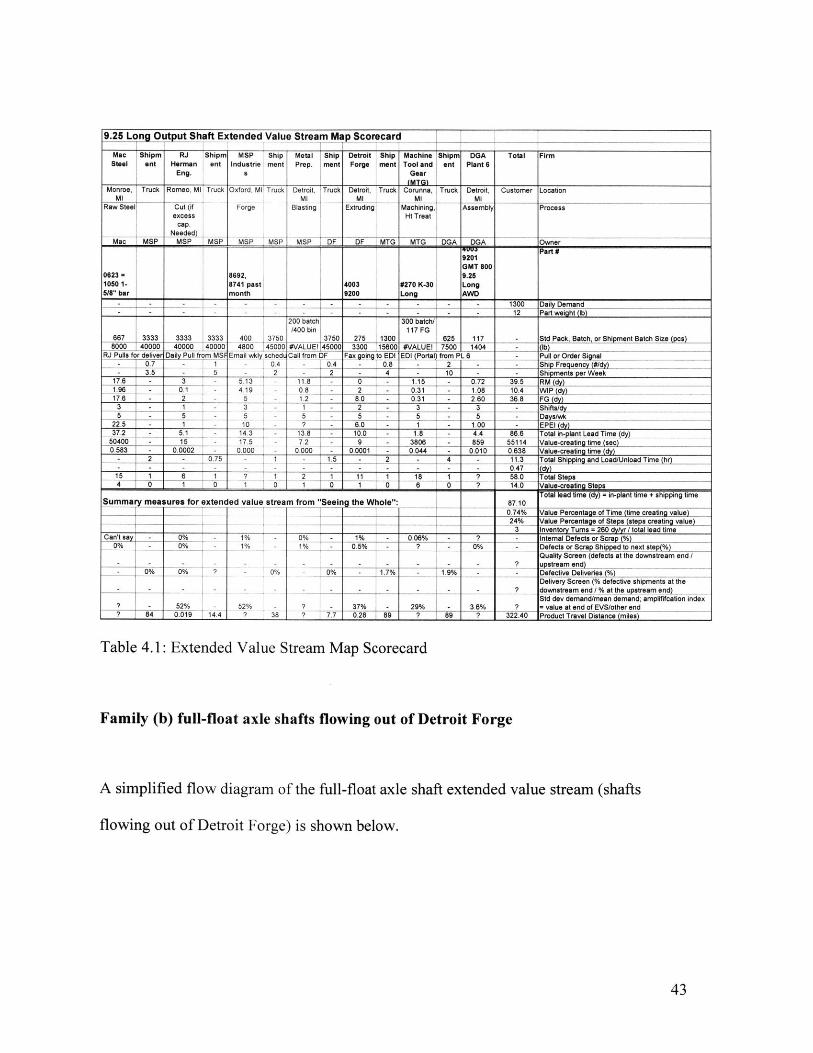
Data tables were also assembled for each value stream. These tables were developed to
present information suggested both at AAM and by Jones et al [2003] which is not
typically included on local value stream maps and is not conveniently presented in the
IGrafx value stream mapping software used. The detailed table for this value stream is
shown below. Note especially the uncoordinated standard package and shipment size
throughout the value stream. Also note that variability in order sizes tends to increase the
farther upstream one looks. More transparent ordering and inventory management
systems would help to reduce the magnitude of this "bullwhip effect" (see Sterman
[2000]).
42
9.25 Long Output Shaft Extended Value Stream Map Scorecard
Mac Shipm RJ Shipm MSP Ship Metal Ship Detroit Ship Machine Shipm DGA Total FirmSteel ent Herman ent Industrie ment Prep. ment Forge ment Tool and ant Plant 6
Eng. s Gear(MTGl
Monroe, Truck Romeo, MI Truck Oxford, MI Truck Detroit, Truck Detroit, Truck Corunna, Truck Detroit, Customer LocationMI _ _ I MI MI MI M
Raw Steel Cut (if - Forge Blasting Extruding Machining, Assembly Processexcess Ht Treat
cap.Needed)
Mac MSP MSP MSP MSP MSP MSP DF DF MTG MTG DGA DGA OwnerT11-11 Part #9201GMT 800
0623 = 8692, 9.2510501- 8741 past 4003 #270 K-30 Long518" bar month 9200 Long AWD
- - - - -- - -- - 1300 Daily Demand- - - - - - - 12 Part weight (ib)
200 batch 300 batch//400 bin 117 FG
667 3333 3333 3333 400 3750 3750 275 1300 625 117 - Std Pack, Batch, or Shipment Batch Size (pcs)8000 40000 40000 j40000 4800 45000 #VALUEI 45000 3300 15600 #VALUEI 7500 1404 - Ib)
RJ Pulls for deliver Daily Pull from MSF Email wkly schedu Call from DF Fax going to EDI EDI (Portal) from PL S - Pull or Order Signal- 0.7 - 1 - 0.4 0.4 - 0.8 - 2 - - Ship Frequency (#/dy)- 3.5 - 5 - 2 2 - 4 - 10 - - Shipments per Week
17.6 - 3 - 5.13 - 11.8 - 0 - 1.15 - 0.72 39.5 RM (dy)1.96 - 0.1 - 419 - - 2 - 0.31 - 1.08 10.4 WIP (dy)17.6 - 2 - 5 1.2 - 8.0 - 0.31 - 2.60 36.8 FG (dy)
3 - 1 - 3 1 - 2 - 3 - 3 - Shifts/dy5 - 5 5 5 - 5 - 5 - 5 - Days/wk
22.5 - 1 - 10 ? - 6.0 - 1 - 1.00 - EPEI (dy)37.2 - 5.1 - 14.3 13.8 - 10.0 - 1.8 - 4.4 86.6 Total in-plant Lead Time (dy)
50400 - 15 - 17.5 7 - 9 - 3806 - 859 55114 Value-creating time (sec)0.583 - 0.0002 - 0.000 - 0.000 - 0.0001 - 0.044 - 0.010 0.638 Value-creating time (dy)
- 2 - 0.75 - 1.5 - 2 - 4 - 11.3 Total Shipping and Load/Unload Time (hr)- - - - - - - - - 0.47 (dy)15 1 6 1 ? |1 2 1 11 1 18 1 7 58.0 Total Steps4 0 1 0 - J 0 1 0 1 0 6 0 7 14.0 Value-creating Steps
Total lead time (dy) = in-plant time + shipping timeSummary measures for extended value stream from "Seeing the Whole": 87.10
0.74% Value Percentage of Time (time creating value)24% Value Percentage of Steps (steps creating value)
_ _ _ _ _ _ _ _ _3 Inventory Tums = 260 dy/yr / total lead timeCan't say - 0% 1% % - 0.06% - ? - Intemal Defects or Scrap (%)
0% - 0% 1% 1% - 0.5% - 7 - 0% - Defects or Scrap Shipped to next step(%)Quality Screen (defects at the downstream end /
- - - - - - - - - 7 upatream end)- 0% 0% ? - 0 0% - 1.7% - 1.9% - - Defective Deliveries (%)
Delivery Screen (% defective shipments at the- - - - - - - - 7 downstream end / % at the upstream end)
Std dev demand/mean demand; amplififcation index? - 52% - 52% ? - 37% - 29% - 3.6% 7 = value at end of EVS/other end7 84 0.019 14.4 ? 38 7 7. 0.28 89 7 89 7 322.40 Product Travel Distance (miles)
Table 4.1: Extended Value Stream Map Scorecard
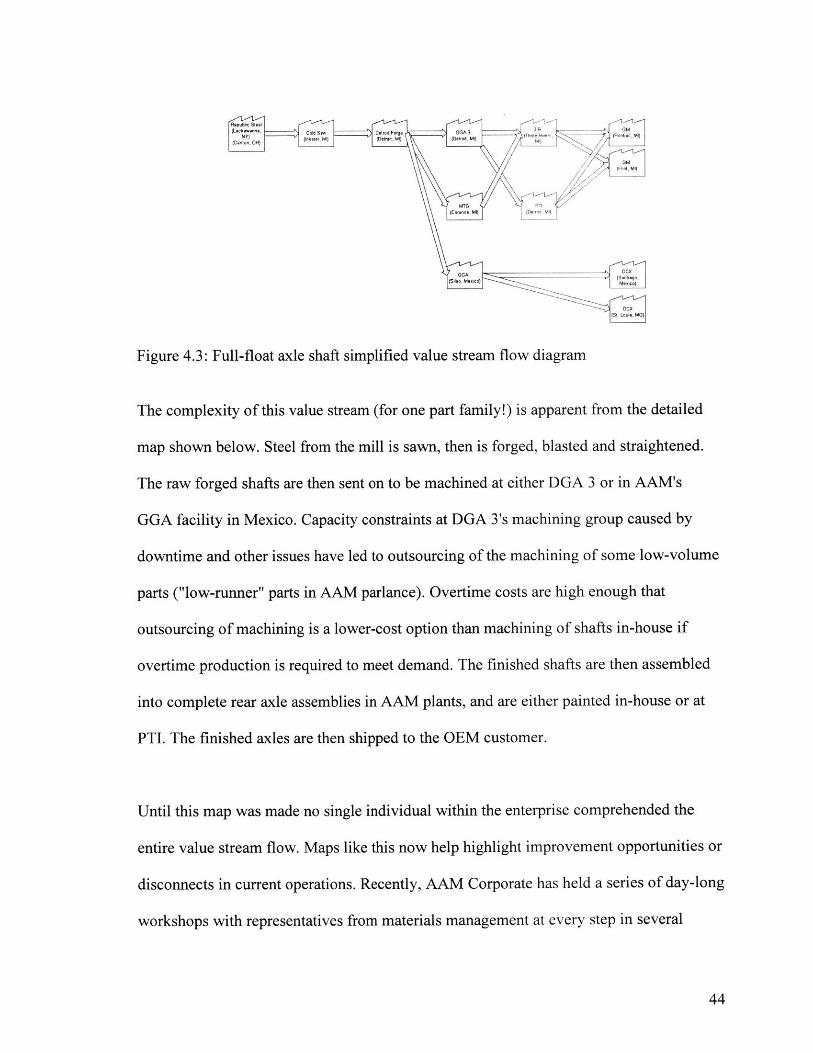
Family (b) full-float axle shafts flowing out of Detroit Forge
A simplified flow diagram of the full-float axle shaft extended value stream (shafts
flowing out of Detroit Forge) is shown below.
43
Call (Thr e s , (Pon t.MNY)t M) (CO.TM, MI) (D1hro Mt)
XC
(C-rinSt LMt. MO)1,M
Figure 4.3: Full-float axle shaft simplified value stream flow diagram
The complexity of this value stream (for one part family!) is apparent from the detailed
map shown below. Steel from the mill is sawn, then is forged, blasted and straightened.
The raw forged shafts are then sent on to be machined at either DGA 3 or in AAM's
GGA facility in Mexico. Capacity constraints at DGA 3's machining group caused by
downtime and other issues have led to outsourcing of the machining of some low-volume
parts ("low-runner" parts in AAM parlance). Overtime costs are high enough that
outsourcing of machining is a lower-cost option than machining of shafts in-house if
overtime production is required to meet demand. The finished shafts are then assembled
into complete rear axle assemblies in AAM plants, and are either painted in-house or at
PTI. The finished axles are then shipped to the OEM customer.
Until this map was made no single individual within the enterprise comprehended the
entire value stream flow. Maps like this now help highlight improvement opportunities or
disconnects in current operations. Recently, AAM Corporate has held a series of day-long
workshops with representatives from materials management at every step in several
44
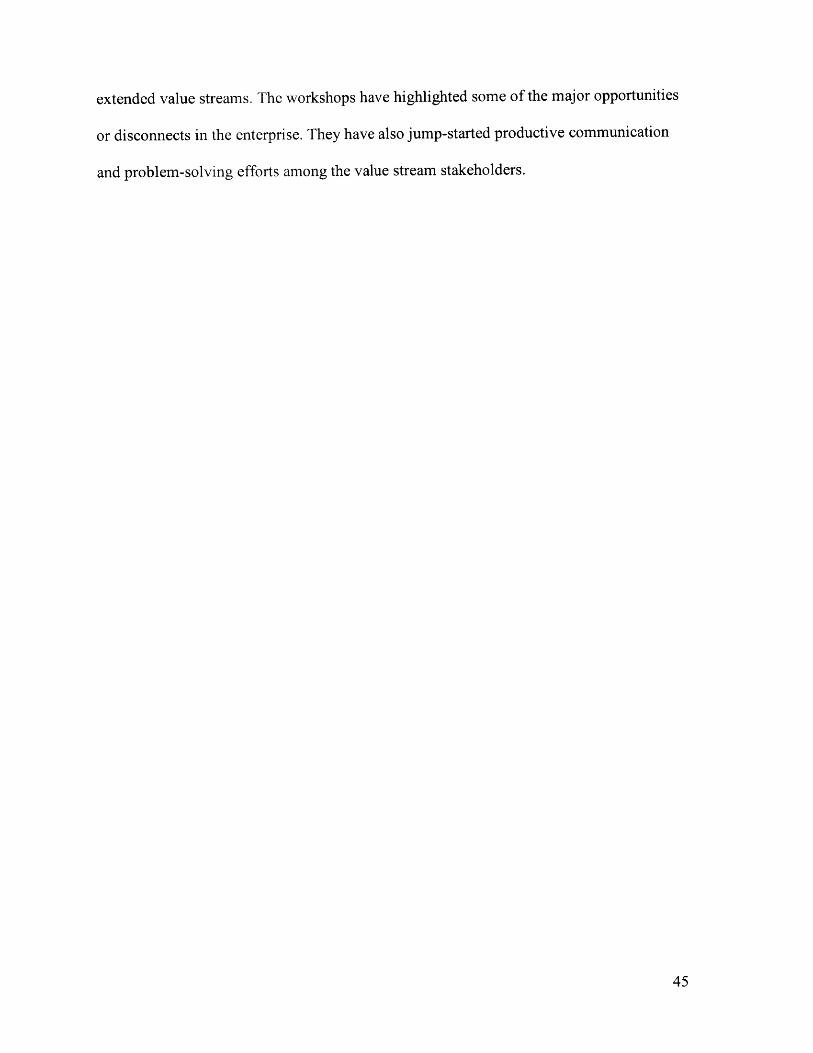
extended value streams. The workshops have highlighted some of the major opportunities
or disconnects in the enterprise. They have also jump-started productive communication
and problem-solving efforts among the value stream stakeholders.
45
.... ... ..-rg J - g E!( fa dn ui.-- 0G
F c 16m S --
T-I~ -* ---- or V'% T- --, , T -
Elvaleia Male'T!awI T. A W-u
.......... G Id aN 4.w o dAGlAkd 1 4'.a m ~ g 1
N PN m... -~~~~~~ ........... P.a 10x! KAH"w filvN 4I % I~ r !tF
54. it., nis/~R-w 314 . das on M i t 3.3 .41,, - 4 d ed n
T x .1- o>m <~xwj - -
PP A Wk 1.0' ......-..
F.0 a %. t - ------ - E
- 13 F"Trui T,-e 2 9d
--- . I-I ---nco--
N4M) 0413 1N 4 IZ?061
-- d -- . ------ ----- --
PN 401 2M7? iW M
o'k, IN' me MFu
1120= ~ ~ ~ wr 7-4 1 1 .1e - --- -- -
.1 - '
n
------ ---------------"" E
.. ....y......
Figure 4.4: Full-float axle shaft extended value stream map (detailed)
46
5C-
PN~~~- ----C- --------------- 1-- --Fa 0104 1WFu
La ~ ~ ~ ~ R 4 &1 ~sd,
5. Total Cost Decision Tool
This chapter discusses the total cost decision tool component of the thesis. The focus at
AAM upon extended value streams has also raised awareness of the need to more fully
account for costs in making part procurement decisions. Therefore a second strategic
project involved examining total costs of purchased parts from suppliers.
5.1 Traditional Procurement Cost Estimating
Traditionally, only piece-price plus freight costs were used to determine sources of
supply at AAM and most other "mass-production"-style firms. Commodity managers and
buyers operated under goal costs per part for raw material or supplier part cost, freight
cost, etc. There was no centralized approach to cost of sourced material: interested parties
were allotted percentages of total part costs and asked to stay within these targets.
Tooling costs sometimes factored into sourcing decisions, or suppliers would offer
discounts on other parts already supplied to AAM if a new part was sourced in such a
way as to more fully utilize a supplier firm's plants. Communication between various
departments regarding engineering, dunnage, logistics, and other parties was slow and did
not lead to a strong, holistic understanding of sourcing decisions.
5.2 Lean or Total Cost Estimating
Lean manufacturing emphasizes taking an enterprise-wide, or holistic view of a given
business or value stream. As part of this perspective, lean thinking emphasizes that piece
47
price and freight are but two of many sourcing-related costs (Womack, [2006]). Other,
additional factors may alter the decision of which supplier to use - if they are considered.
These factors include such items as: the costs of expediting from far-away suppliers;
unreliable supply chains; and reusable dunnage requirements, to name a few.
Materials Management has been taking a lead role in fostering better communication
between interested parties at AAM regarding total cost (sometimes known as total landed
cost). As part of this effort, a simple tool was desired to allow for rapid appraisals of total
cost for making more informed sourcing decisions. This effort is described below.
5.3 Total Cost Decision Tool
A total cost supplier decision tool has been developed to allow more rapid, thorough
evaluation of true costs of parts coming from suppliers. The tool was used in making
several sourcing decisions, and is now required as part of all sourcing council decisions.
This computer spreadsheet-based tool uses simple inputs to quickly produce a more all-
encompassing estimate of the total costs of purchasing parts from a given supplier.
The tool provides an estimate of the total system cost to obtain a part from a supplier. It
includes piece price and standard freight, as well as other items including the following
examples: other standard costs (repack); internal costs (inventory and in-transit carrying
cost, floor space, capital and repair costs for dunnage); overhead costs (legal or customs,
logistics scheduling); risk or containment (supplier visits, expedite, quality spill, etc.)
48
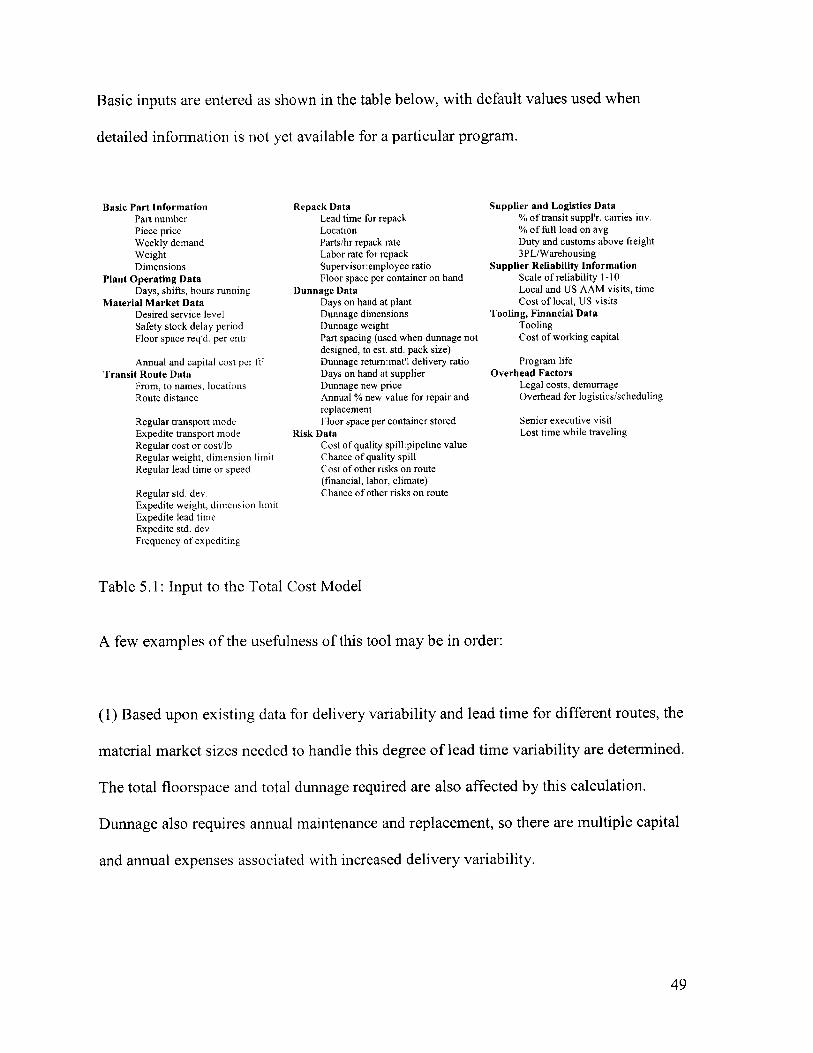
Basic inputs are entered as shown in the table below, with default values used when
detailed information is not yet available for a particular program.
Basic Part InformationPart numberPiece priceWeekly demandWeightDimensions
Plant Operating DataDays, shifts, hours running
Material Market DataDesired service levelSafety stock delay periodFloor space req'd. per entr.
Annual and capital cost per ft2
Transit Route DataFrom, to names, locationsRoute distance
Regular transport modeExpedite transport modeRegular cost or cost/lbRegular weight, dimension limitRegular lead time or speed
Regular std. dev.Expedite weight, dimension limitExpedite lead timeExpedite std. dev.Frequency of expediting
Repack DataLead time for repackLocationParts/hr repack rateLabor rate for repackSupervisor:employee ratioFloor space per container on hand
Dunnage DataDays on hand at plantDunnage dimensionsDunnage weightPart spacing (used when dunnage notdesigned, to est. std. pack size)Dunnage return:mat'l delivery ratioDays on hand at supplierDunnage new priceAnnual % new value for repair andreplacementFloor space per container stored
Risk DataCost of quality spill:pipeline valueChance of quality spillCost of other risks on route(financial, labor, climate)Chance of other risks on route
Supplier and Logistics Data% of transit suppl'r. carries mv.% of full load on avg.Duty and customs above freight3PL/Warehousing
Supplier Reliability InformationScale of reliability 1-10Local and US AAM visits, timeCost of local, US visits
Tooling, Financial DataToolingCost of working capital
Program lifeOverhead Factors
Legal costs, demurrageOverhead for logistics/scheduling
Senior executive visitLost time while traveling
Table 5.1: Input to the Total Cost Model
A few examples of the usefulness of this tool may be in order:
(1) Based upon existing data for delivery variability and lead time for different routes, the
material market sizes needed to handle this degree of lead time variability are determined.
The total floorspace and total dunnage required are also affected by this calculation.
Dunnage also requires annual maintenance and replacement, so there are multiple capital
and annual expenses associated with increased delivery variability.
49
(2) Interviews with AAM employees allowed approximate estimates to be made of the
number of personnel, the length of stay, and the costs for visiting suppliers with various
stability ratings. A rating of 1 signifies a large, reliable, stable supplier, while a rating
closer to ten might indicate a new, small, unreliable supplier or a very compressed launch
of a new product at a supplier. By simply assigning a rough grading of supplier stability,
the tool automatically calculates the cost of annual supplier visits.
(3) When choosing a source of supply and a mode of transit, a drop-down menu lists
available modes of transit, or allows the user to enter in a custom mode. If a default mode
of transit is selected, the approximate cost per shipment is provided from known default
values (which must be updated on a routine basis). If a custom mode of transit is selected,
the user may enter in a quote of their own, and provide the dimensions of the cargo
container. Then, based upon either dunnage size and capacity provided by engineering, or
using an estimate of dunnage size and capacity based upon part size and pallet size, the
shipment weight or volume limit is automatically calculated. Total shipments per year,
shipment frequency in days, and annual freight costs are automatically determined.
This approach was compared with known data for a route to AAM's facility in Mexico,
and the difference between estimated shipment capacity determined by the tool, and the
exact values was found to be less than 5%. It is expected that the total freight costs could
vary by 30-50% from default estimate values due to fuel surcharges, route-specific fare
changes, etc. Nevertheless, the fact that capacity estimates are close to actual values, and
that freight represents only a few percent of total landed cost for most programs, means
50
that the estimates provided even using default values provide a good general estimate of
total landed costs. This estimate is also available at a much earlier stage of program
decision-making than previously.
The purpose of the tool is to determine if there are large differences between total costs
for two sourcing options - say greater than 10% or perhaps $100,000. The accuracy of the
tool is not sufficient to allow decisions to be made with the fidelity of a few percent or
just a few tens of thousands of dollars. When total cost differences between two options
start to become small, qualitative factors relating to perceived risks for different sources
of supply can become paramount. For example, the cost to resolve a quality spill issue
(return and repair all affected material) can amount to approximately half of the dollar
value of all material in the pipeline, according to observations of experienced employees.
Also, customs issues can cause weeks or delays and tens of thousands of dollars of legal
expenses.
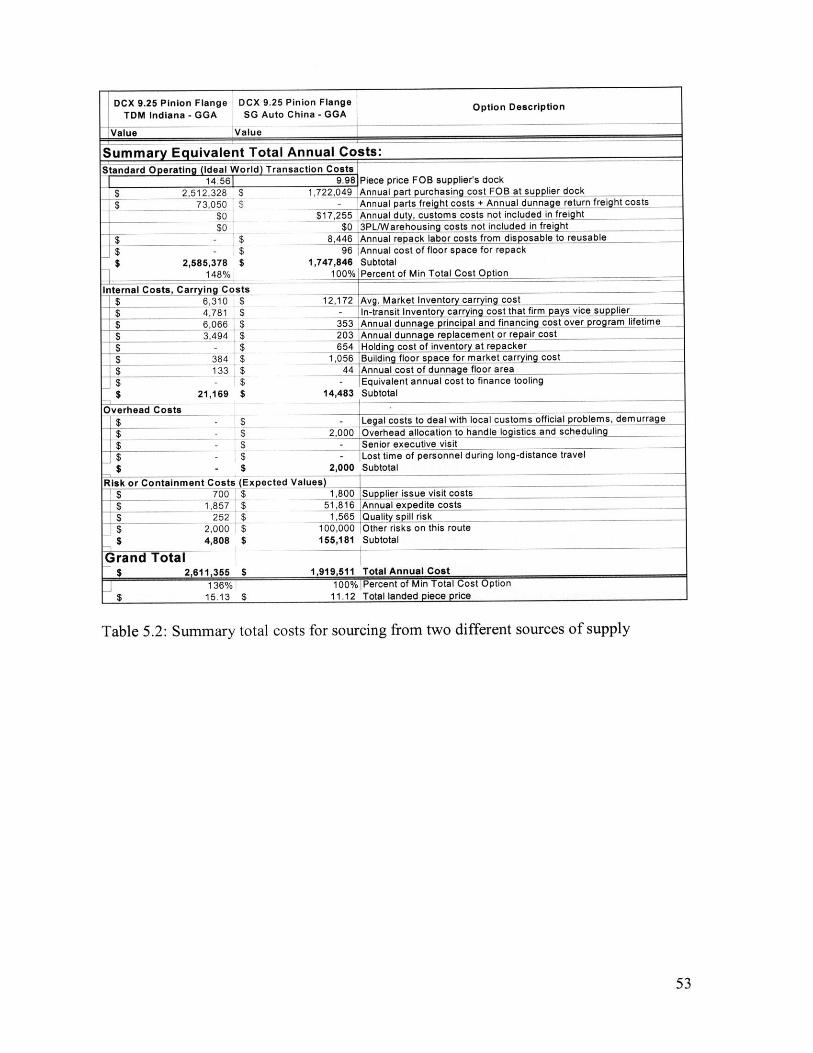
5.4 Example Business Case
An example used to illustrate the use of the total cost tool is presented below. The part
used here is a pinion flange sourced either from the US or from China.
This example highlights the complexity in making sourcing decisions: for instance, the
more local supplier has higher dunnage costs because dunnage travels throughout the
value stream back to the supplier. The China supplier sends material in disposable
packaging that requires repacking at a local site into AAM dunnage. The repacking costs
51
are somewhat uncertain, depending upon how well utilized and managed the repacking
staff is. The China option also had delivery freight costs built into the piece price
quotation (it was actually quoted under DDU, not FOB INCO terms).
What is apparent from this example total cost analysis is that the China sourcing option is
less expensive - regardless of whether the traditional costs of piece-price plus freight are
evaluated, or whether the total costs are evaluated. Even with a low value commodity
item (heavy metal parts are not microprocessors), the total cost analysis reduced the cost
differential between the options from 48% to 36%. There is also a great deal of
uncertainty in the "other risks" category for China: labor, financial, and political issues.
Overall, this example highlights the complexity of the problem, and the need to consider
factors external to the analysis, such as risk and capacity utilization.
52
DCX 9.25 Pinion Flange DCX 9.25 Pinion Flange Option DescriptionTDM Indiana - GGA SG Auto China - GGA
Value JValue
Summary Equivalent Total Annual Costs:Standard Operating (ideal World) Transaction Costs
14.561 9.98 Piece price FOB suppliers dock
$ 2,512,328 $ 1,722,049 -Annual part purchasing cost FOB at supplier dock
$ 73,050 $ - Annual parts freight costs + Annual dunnage return freight costs
_$0 $17,255 Annual duty, customs costs not included in freight$0 $0 3PL/Warehousing costs not included in freight
$ $ 8,446 Annual repack labor costs from disposable to reusable
$ $ 96 Annual cost of floor space for repack
$ 2,585,378 $ 1,747,846 Subtotal148%: 100% Percent of Min Total Cost Option
Internal Costs, Carrying Costs$ 6,310 $ 12,172 Avg. Market Inventory carrying cost
$ 4,781 $ - In-transit Inventory carrying cost that firm pays vice supplier
$ 6,066 $ 353 Annual dunnage principal and financing cost over program lifetime
$ 3,494 $ 203 Annual dunnage replacement or repair cost
$ $_ 654 Holding cost of inventory at repacker
$ 384 $ 1,056 Building floor space for market carrying cost
$ 133 $ 44 Annual cost of dunnage floor area
$ $ - Equivalent annual cost to finance tooling
$ 21,169 $ 14,483 Subtotal
oerhead Costs C ($ 1 $ - Legal costs to deal with local customs official problems, demurrage
$ $ 2,000 Overhead allocation to handle logistics and scheduling$ 5- Senior executive visit
$$ - Lost time of personnel during long-distance travel
$ 42,000 Subtotal
Risk or Containment Costs (Expected Values)$ 700 $ 1,800 Supplier issue visit costs$ _ 1,857 $51,816 Annual expedite costs
$ 252 $ 1,565 Quality spill risk$ 2,000 $ 100,000 Other risks on this route
$ 4,808 $ 156,181 Subtotal
Grand Total$ 2,611,355 $ 1,919,511 Total Annual Cost
136% 100% Percent of Min Total Cost Option
$ 15.13 $ 11.12 Total landed piece price
Table 5.2: Summary total costs for sourcing from two different sources of supply
53
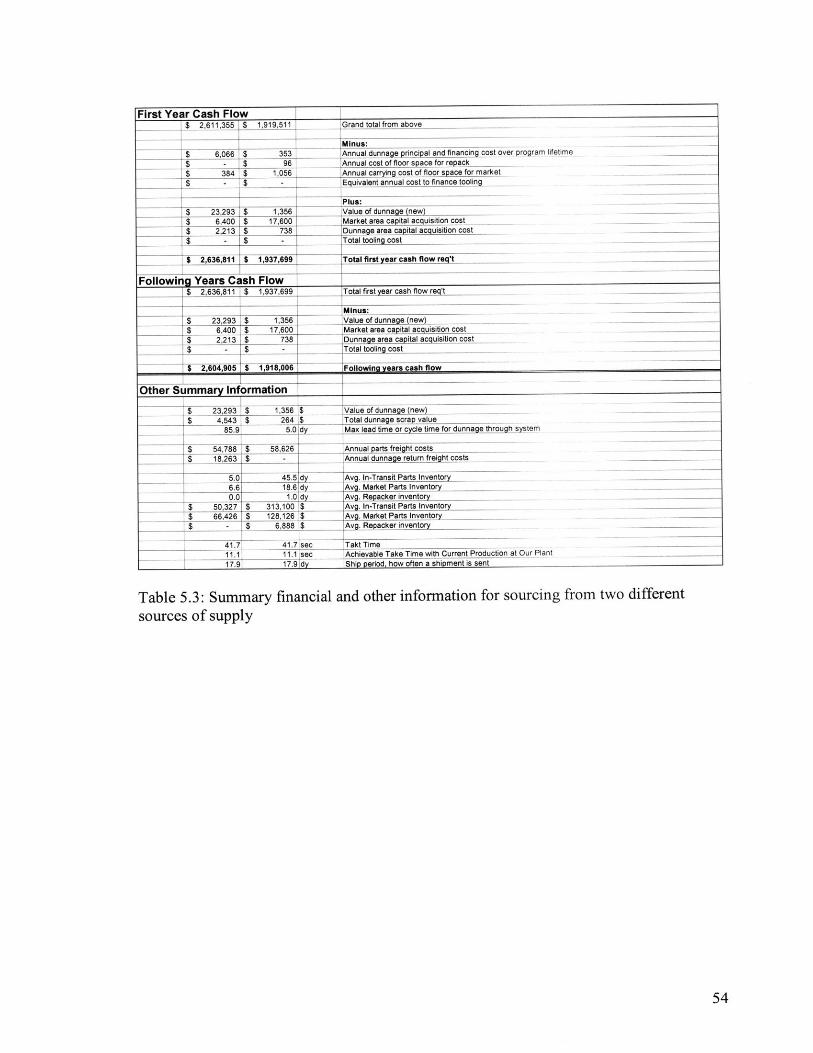
First Year Cash Flow$ 2,611,355 $ 1,919,511 Grand total from above
Minus:
$ 6,066 $ 353 Annual dunnage principal and financing cost over program lifetime$ - $ 96 Annual cost of floor space for repack$ 384 $ 1,056 Annual carrying cost of floor space for market$ - $ - Equivalent annual cost to finance tooling
Plus:
$ 23,293 $ 1,356 Value of dunnage (new)$ 6,400 $ 17,600 Market area capital acquisition cost$ 2,213 $ 738 Dunnage area capital acquisition cost$ - $ - Total tooling cost
$ 2,636,811 $ 1,937,699 Total first year cash flow req't
Following Years Cash Flow1 $ 2,636,811 $ 1,937,699 Total first year cash flow req't
Minus:$ 23,293 $ 1,356 Value of dunnage (new)
$ 6,400 $ 17,600 Market area capital acquisition cost$ 2,213 $ 738 Dunnage area capital acquisition cost$ - $ - Total tooling cost
$ 2,604,905 $ 1,918,006 Following years cash flow
Other Summary Information
$ 23,293 $ 1,356 $ Value of dunnage (new)$ 4,543 $ 264 $ Total dunnage scrap value
85.9 5.0 dy Max lead time or cycle time for dunnage through system
$ 54,788 $ 58,626 Annual parts freight costs
$ 18,263 $ - Annual dunnage return freight costs
5.0 45.5 dy Avg. In-Transit Parts Inventory6.6 18.6 dy Avg. Market Parts Inventory0.0 1.0 dy Avg. Repacker inventory
$ 50,327 $ 313,100 $ Avg. In-Transit Parts Inventory$ 66,426 $ 128,126 $ Avg. Market Parts Inventory$ - $ 6,888 $ __ Avg. Repacker inventory
41.7 41.7 sec Takt Time11.1 11.1 sec Achievable Take Time with Current Production at Our Plant
17.9 17.9 dy |Ship period, how often a shipment is sent
Table 5.3: Summary financial and other information for sourcing from two different
sources of supply
54
6. Pull System Implementation
This chapter describes the tactical-level design and implementation of a pull system at
Detroit Gear & Axle Plant 3, Group F (10.5" Full float axle shaft machining job). This
project involved coordinating teams at two separate axle shaft manufacturing plants to
implement a more effective visual pull system between and within the plants, using lean
concepts for material management and flow.
One goal of the tactical project was to improve the stability of operations within the
plants. Raw and finished goods material markets were sized and deployed to
accommodate typical demand and production variability. An internal pull system was
introduced to limit WIP levels and to rationalize the production changeover schedule.
Continuous improvement efforts, especially efforts focused on downtime and material
delivery from the supplying plant, still need be used to reduce inventory and overtime.
Buffer sizes within the processing group at one of the plants may need to be increased to
help increase overall production. Currently there is insufficient buffer space available
between operations to handle typical downtimes (on the order of fifteen to twenty five
minutes or longer). Some improvements were made to the lathes during the last two
months of the project which reduced unplanned downtime at those operations.
Another goal was to smooth the flow of material between the plants by using pull signals
and regular scheduled deliveries, reducing the "bullwhip effect" (amplification of demand
variation) through several stages of material handling. This has not yet been
accomplished, primarily due to middle management resistance and delay in obtaining the
55

necessary tugger carts, and the lack of priority this project had relative to other initiatives
at the site. The carts need to be custom ordered months ahead of time, since they must be
designed to handle heavy loads of axle shafts.
The approach used was to gather baseline information about existing operations, discuss
current practices with teams from the plants of interest, and develop future state goals
that can be implemented. Plans were then developed for the operating system and the
daily auditing of the system. After training the workforce, an initial implementation was
made. Some refinements were suggested based upon operational lessons learned, and
should be implemented by management in the future.
6.1 Current State
The Group F shaft job was selected as a candidate for implementation of a pull system for
several reasons.
Firstly, the operation receives very erratic shipments of raw materials. The shaft
machining job (Group F) receives raw forged shafts from the Detroit Forge facility.
Group F stores several days of raw material from a neighboring plant (Detroit Forge) that
is physically connected by a roof to the building housing Group F (DGA Plant 3). There
is little obvious need to store several days of material when deliveries can be made in ten
minutes from the sister plant. Currently the Forge sends trucks with highly variable
quantities of raw shafts to DGA Plant 3, based upon pull signals sent over an electronic
system. These signals are manually adjusted by schedulers at DGA Plant 3.
56
Second, the internal material management and production management of the job could
be improved. All of this is exacerbated by high unplanned downtime, which means that
daily crisis-management overshadows longer-term planning and improvement efforts.
As shown in the figure below, the communication systems around Group F's operations
are causing a classic "bullwhip effect" in the supply chain (Sterman [2000]). Daily and
especially weekly demand for each of the four different part numbers machined in Group
F does not vary greatly. The only exception is when long-term ramp-up or ramp-down of
models occurs (but this is known in advance from 16-week customer projections).
Production varies much more than customer demand for several reasons. Demand is not
clearly indicated through visual control systems. Instead, area managers and production
supervisors make personal production decisions based upon required build numbers on a
printout that primarily they see. This printout is in turn the product of an MRP system
and some possible manual schedule manipulation by the Materials Department.
Raw material delivery is even more erratic than the production in Group F. Raw material
is theoretically ordered whenever material is consumed by Group F, or "scanned empty"
in the company-wide electronic pull system. A variety of factors can cause problems with
this process, including missed scans, manual manipulation of the pull signals to handle
expected weekend or shutdown periods, or other errors.
57
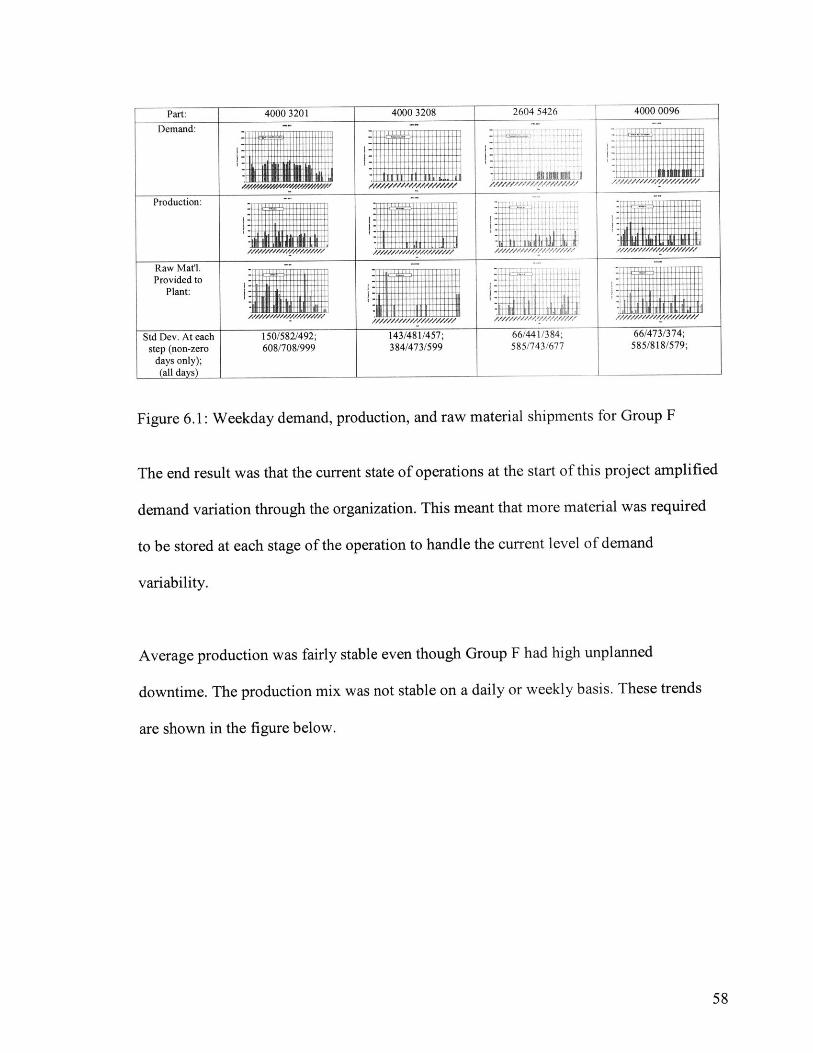
Demand:
Production: -
Raw MatiProvided to
Plant:
Std Dev. At eachstep (non-zero
days only);(all days)
150/582/492;608/708/999
143/481/457;384/473/599
Figure 6.1: Weekday demand, production, and raw material shipments for Group F
The end result was that the current state of operations at the start of this project amplified
demand variation through the organization. This meant that more material was required
to be stored at each stage of the operation to handle the current level of demand
variability.
Average production was fairly stable even though Group F had high unplanned
downtime. The production mix was not stable on a daily or weekly basis. These trends
are shown in the figure below.
58
4000 3208 12604 5426 4000 0096Part: | 4000 3201
66/441/384;585/743/677
66/473/374;585/818/579;
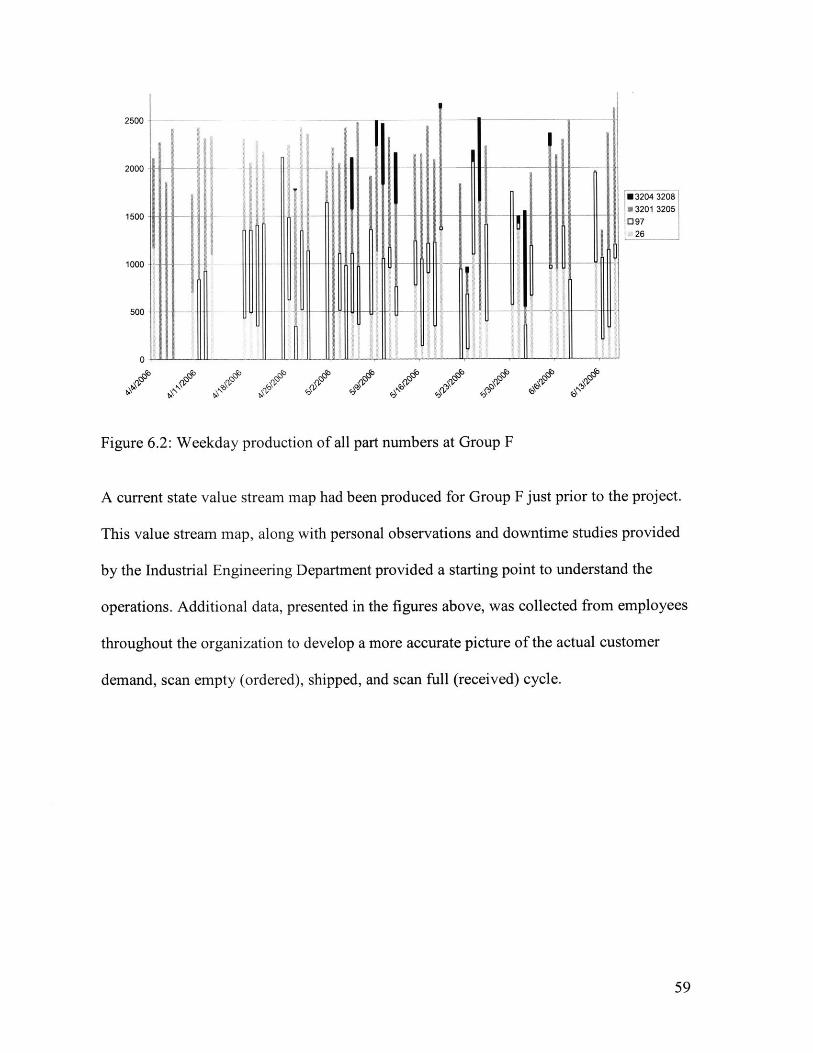
2500 -
2000 - -
03204 3208
n3201 32051500- [3 97
26
1000 - -7 - -i
500 -
0-
Figure 6.2: Weekday production of all part numbers at Group F
A current state value stream map had been produced for Group F just prior to the project.
This value stream map, along with personal observations and downtime studies provided
by the Industrial Engineering Department provided a starting point to understand the
operations. Additional data, presented in the figures above, was collected from employees
throughout the organization to develop a more accurate picture of the actual customer
demand, scan empty (ordered), shipped, and scan full (received) cycle.
59
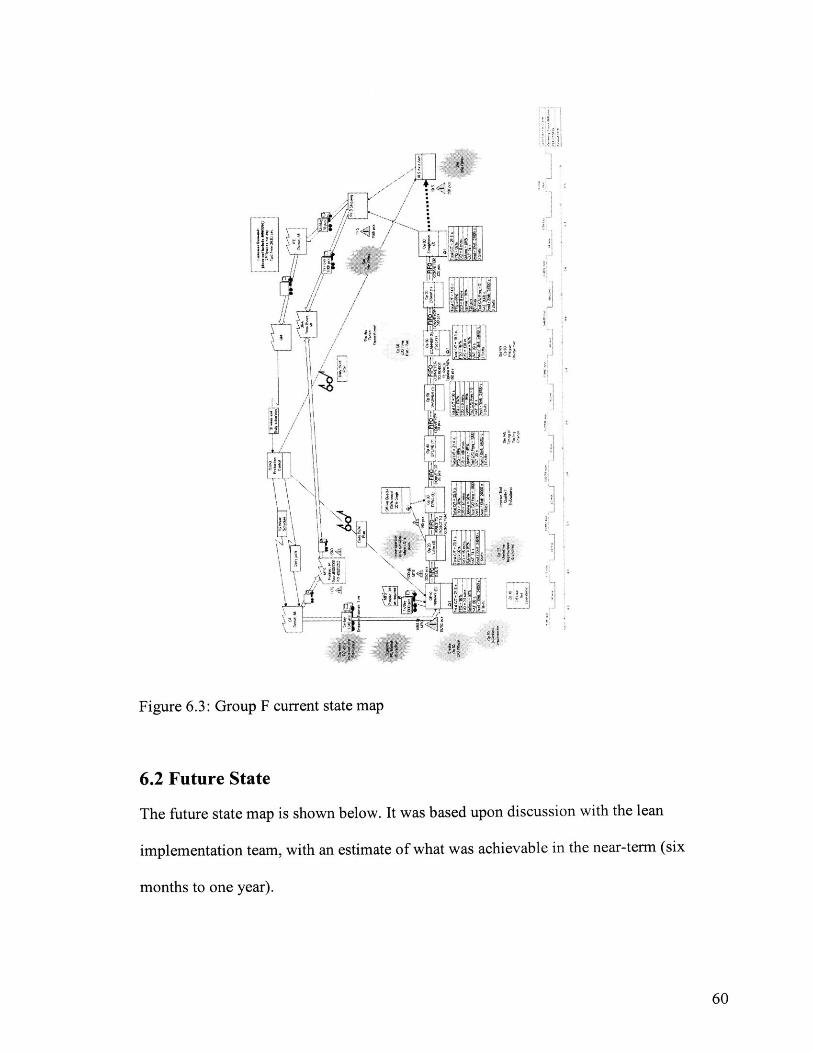
q I/
it
fle
L'. i tf
6.2~~ Fuur Stt
The future state map is shown below. It was based upon discussion with the lean
implementation team, with an estimate of what was achievable in the near-termn (six
months to one year).
60
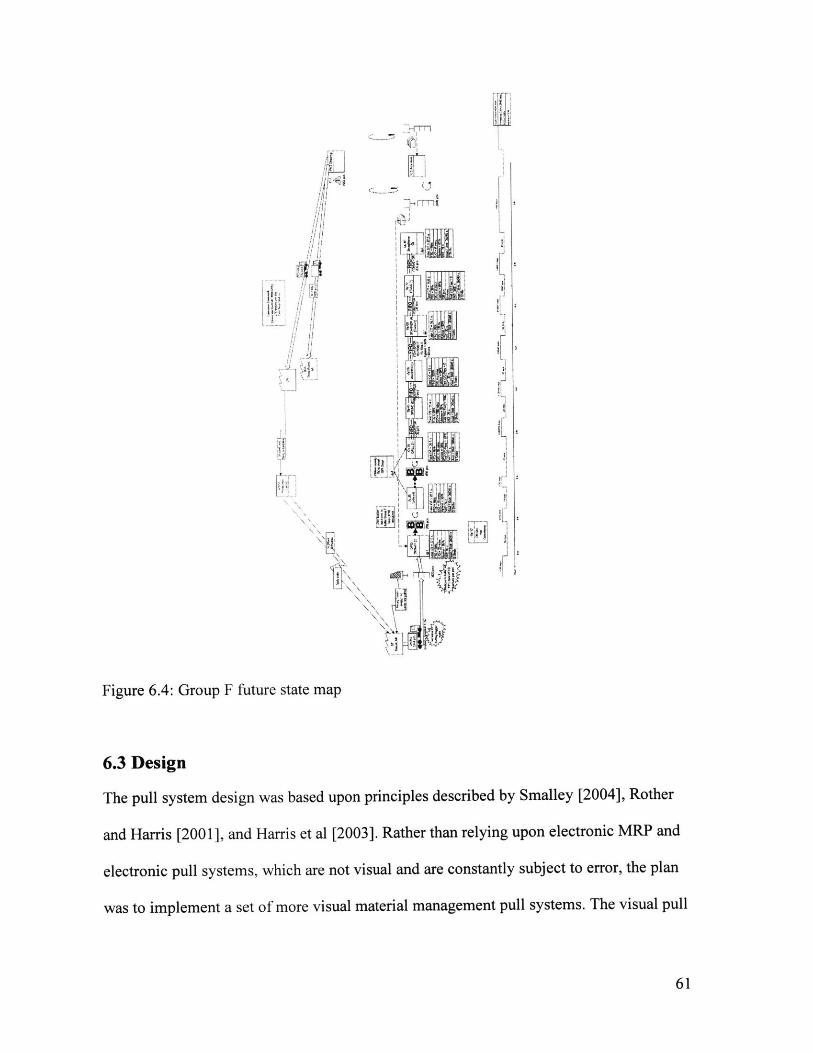
......
I r
ell
1,41
"iL51 n
UPC
IL
!L
Figure 6.4: Group F future state map
6.3 Design
The pull system design was based upon principles described by Smalley [2004], Rother
and Harris [2001], and Harris et al [2003]. Rather than relying upon electronic MRP and
electronic pull systems, which are not visual and are constantly subject to error, the plan
was to implement a set of more visual material management pull systems. The visual pull
61
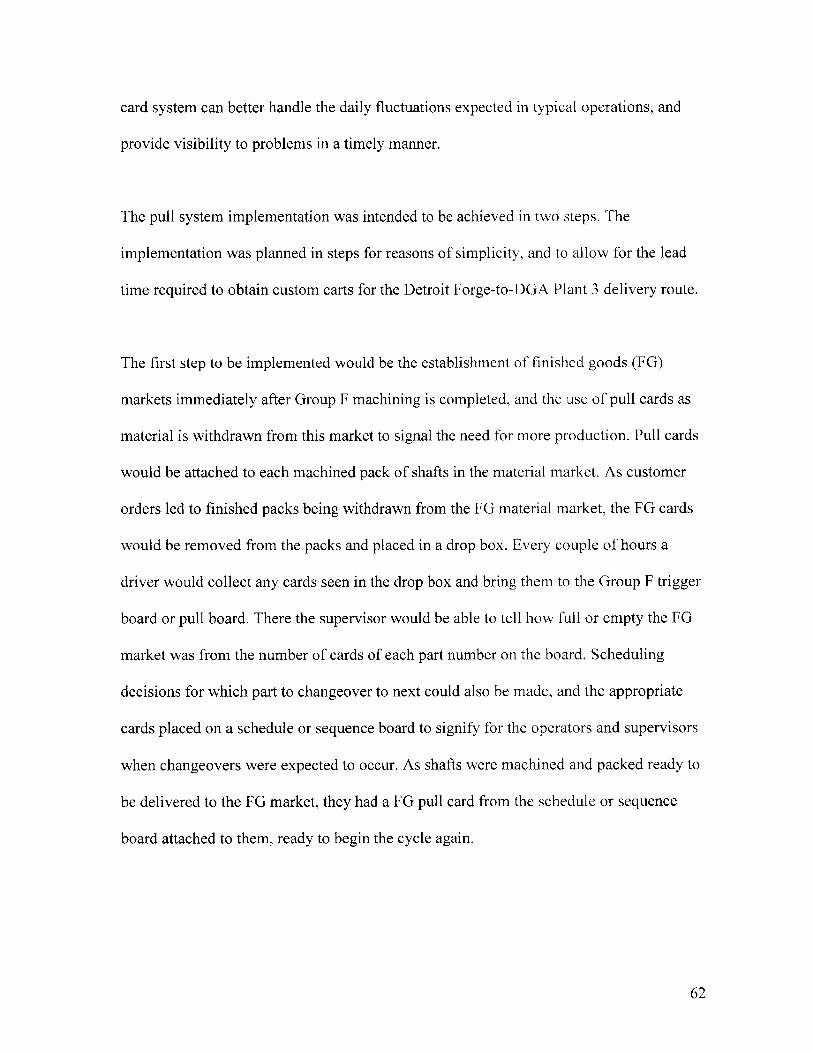
card system can better handle the daily fluctuations expected in typical operations, and
provide visibility to problems in a timely manner.
The pull system implementation was intended to be achieved in two steps. The
implementation was planned in steps for reasons of simplicity, and to allow for the lead
time required to obtain custom carts for the Detroit Forge-to-DGA Plant 3 delivery route.
The first step to be implemented would be the establishment of finished goods (FG)
markets immediately after Group F machining is completed, and the use of pull cards as
material is withdrawn from this market to signal the need for more production. Pull cards
would be attached to each machined pack of shafts in the material market. As customer
orders led to finished packs being withdrawn from the FG material market, the FG cards
would be removed from the packs and placed in a drop box. Every couple of hours a
driver would collect any cards seen in the drop box and bring them to the Group F trigger
board or pull board. There the supervisor would be able to tell how full or empty the FG
market was from the number of cards of each part number on the board. Scheduling
decisions for which part to changeover to next could also be made, and the appropriate
cards placed on a schedule or sequence board to signify for the operators and supervisors
when changeovers were expected to occur. As shafts were machined and packed ready to
be delivered to the FG market, they had a FG pull card from the schedule or sequence
board attached to them, ready to begin the cycle again.
62
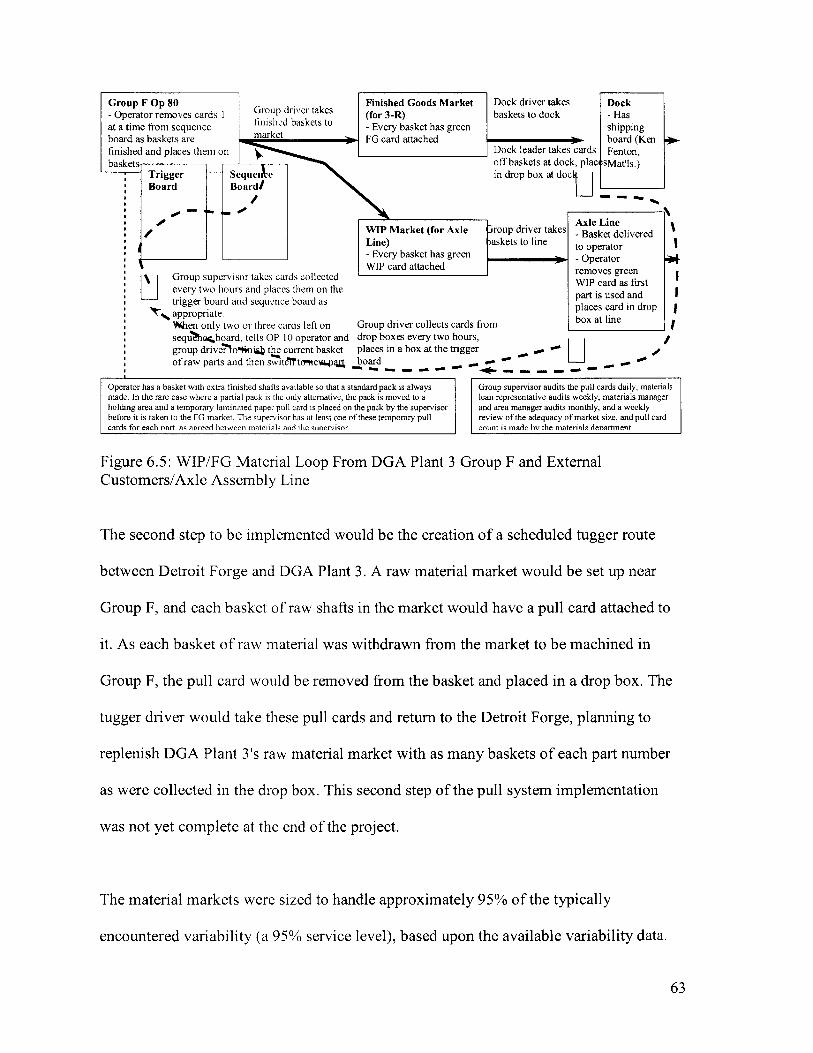
Group F Op 80 Finished Goods Market Dock driver takes Dock- Operator removes cards G rsed ve takes (for 3-R) baskets to dock - Hasat a time from sequence t - Every basket has green shippingboard as baskets are FG card attached ) board (Ken )finished and places them on Dock leader takes cards Fenton,baskets off baskets at dock, plactsMat'ls.)
Trigger ~- Sequene in drop box at docBoard Board/ I-
WIP Market (for Axle iroup driver takes Axle LineLine )aketsto ine - Basket delivered
Line) >askets to line to operator I- Every basket has green - OperatorWIP card attached removes green
Group supervisor takes cards collected WIP card as firstLi ~ ~ ~ ~ ~ ~ ~ ~ ~ ~ ~ ~ I cVI W IU~ai ia~ I~I 1 S arusd andfrsevery two hours and places them on thati ue ntrigger board and sequence board as places card in dropappropriate.When only two or three cards left on Group driver collects cards from box at linesequlocboard, tells OP 10 operator and drop boxes every two hours,group drive'Thoani.b the current basket places in a box at the trigger 0 Iof raw parts and then switct"te.p4 board S - - - '
Operator has a basket with extra finished shafts available so that a standard pack is alwaysmade. In the rare case where a partial pack is the only alternative, the pack is moved to aholding area and a temporary laminated paper pull card is placed on the pack by the supervisorbefore it is taken to the FG market. The supervisor has at least one of these temporary pullcards for each nart. as agreed between materials and the snnervisor.
Group supervisor audits the pull cards daily, materialslean representative audits weekly, materials managerand area manager audits monthly, and a weeklyreview of the adequacy of market size, and pull cardcount is made hv the materials denartment
Figure 6.5: WIP/FG Material Loop From DGA Plant 3 Group F and ExternalCustomers/Axle Assembly Line
The second step to be implemented would be the creation of a scheduled tugger route
between Detroit Forge and DGA Plant 3. A raw material market would be set up near
Group F, and each basket of raw shafts in the market would have a pull card attached to
it. As each basket of raw material was withdrawn from the market to be machined in
Group F, the pull card would be removed from the basket and placed in a drop box. The
tugger driver would take these pull cards and return to the Detroit Forge, planning to
replenish DGA Plant 3's raw material market with as many baskets of each part number
as were collected in the drop box. This second step of the pull system implementation
was not yet complete at the end of the project.
The material markets were sized to handle approximately 95% of the typically
encountered variability (a 95% service level), based upon the available variability data.
63
This represents short-term, daily variability. Any major changes in the following would
require resizing the markets, changing the number of pull cards in the systems and also
changing the signs and production trigger levels: longer-term (weekly) average demand,
daily variability of use, supplier delivery or performance, or production uptime.
Trigger levels were also calculated to provide a 95% service level. Example calculations
for material market sizing and reorder point (trigger point) are shown below.
It should be noted that several complications made this job less amenable to simple pull
system implementation than might be expected. The job could be arranged to produce
two different parts in parallel for much of the line, meaning that most of the time the
highest-volume part was produced on half of the line. Equipment problems meant that the
theory of two independent, parallel production operations was not always achieved in
practice. Many unplanned downtime issues (which were being slowly resolved over the
course of this project) reduced productivity on certain machines. Changes in downtime
patterns over several months also led to changing opinions on the best way to handle
certain situations which might occur when using the pull system. Many of these issues
were still being resolved and improved upon as the project ended.
64
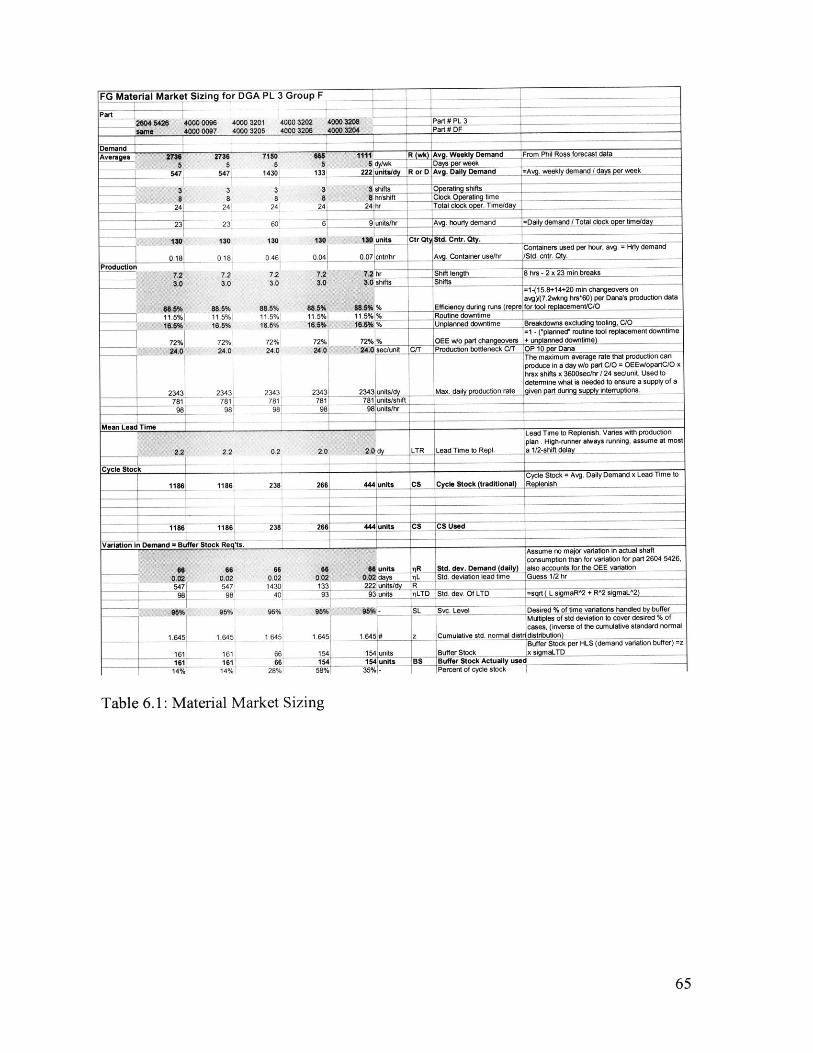
FG Material Market Sizing for DGA PL 3 GroupF
r 204 5426 400 0 4000 3201 4000 3202 4000 3208 Part # PL 3
400000097 4000 3206 40003206 400M 3204 Part # DF
DemandAverages 2736 Z735 7180 6" R (wk) Avg. Weekly Demand From Phil Ross forecast data
5 5 5 8 6 dy/wk Daysperweek
547' 547 1430 133 222 unitad R or D Avg. Daily Demand =Avg. weekly demand / days per week
3 3 3 3 3 shifts Operating shifts. 8 8 8 8 hr/shift Clock Operating time
24 24 24 24 24 hr Total clock oper. Time/day
23 23 60F 6 9 units/hr Avg. h-urty demand =Daily demand / Total clock oper time/day
13 130 130 13.0 130 units Ctr Qt Std.Cntr.Qty.Containers used per hour, avg. =Hrty demand
0.18 0 18 0.46 0.04 0.07 cntr/hr Avg. Container use/hr /Std. cntr. Qty.ProductionI I
7.2 7.2 7.2 7,2 7.2hr Shift length 8 hrs - 2 x 23 min breaks
3.0 3,0 3.0 3.0 .0 shifts Shifts=1-15.8+14+20 min changeovers onavgy(7.2wkng hrs*60) per Dana's production data
84.5% 88.5% 88.5% 86.5% 8.4% % Efficiency during runs (repre for tool replacement/C/O
11.5% 11 5% 11.5% 11.5%1 11. 5% % Routine downtime1.6% 16.5% 16.5% 16.8% 16.6% % Unplanned downtime Breakdowns excluding tooling, C/O
=1 - ("planned" routine tool replacement downtime
72% 72% 72% 72% 72% % OEE w/o part changeovers + unplanned downtime)
240 24.0 24.0 24.0 24.0 sec/unit C/T Production bottleneck C/T OP 10 per DanaThe maximum average rate that production canproduce in a day w/o part C/O = OEEw/opartC/O xhrsx shifts x 3600sec/hr / 24 seclunit. Used todetermine what is needed to ensure a supply of a
2343 2343 2343 2343 2343 units/dy Max. daily production rate given part during supply interruptions.
781 781! 781' 781 781 units/shift
98 981 98 98 98 units/hr
Mean Lead Time __________________ _____Lead Time to Replenish. Varies with produclionplan .High-runner atways running, assume at moat
22 22 02 20 dy LTR Lead Time to Repl. a 1/2-shift delay
Cycle Stock
1186 238 2661 444 units
1186
547 54798 98
96% 295%
1.645 1.645
161 161161 16114% 14%
238 - 266 44 units
95% 95%
1.645 1.645
66662 154
58%1
CS
CS
Cycle Stock (tradi)oai
CS Used
Cycile Stock = Avg. DaiRnenish
Ii ____ I __________________ t ________________________________Assume no major variation in actual shaft
units iR Std. dev. Demand (daily)ays ilL Sid. deviation lead time
jnits/dy RIll93 units
1.6l -
1.645 #
14 15i4 uinits14 154 units 8 ufrSokAtalue
154 units35%|..
iLTD Std. dev. Of LTD
SL ISvc. Level
z Cumulative std. normal distr
Buffer StockPert ocyActually usedPercent of cycle Stock
Assume no major variation in actual shaftconsumption than for variation for part 2604 5426,also accounts for the OEE variationGuess 1/2 hr
=sgrt ( L sigmaR^2 + R^2 sigmaL^2)
Desired % of time variations handled by bufferMultiples of std deviation to cover desired % ofcases, (inverse of the cumulative standard normaldistribution)Buffer Stock per HLS (demand variation buffer) =zx siamaLTD
Table 6.1: Material Market Sizing
65
Vaio I 1186
____ 1186
VarIation in Demand * Buffer Sto
CS Cvcle Stock Itraditlonall
BS
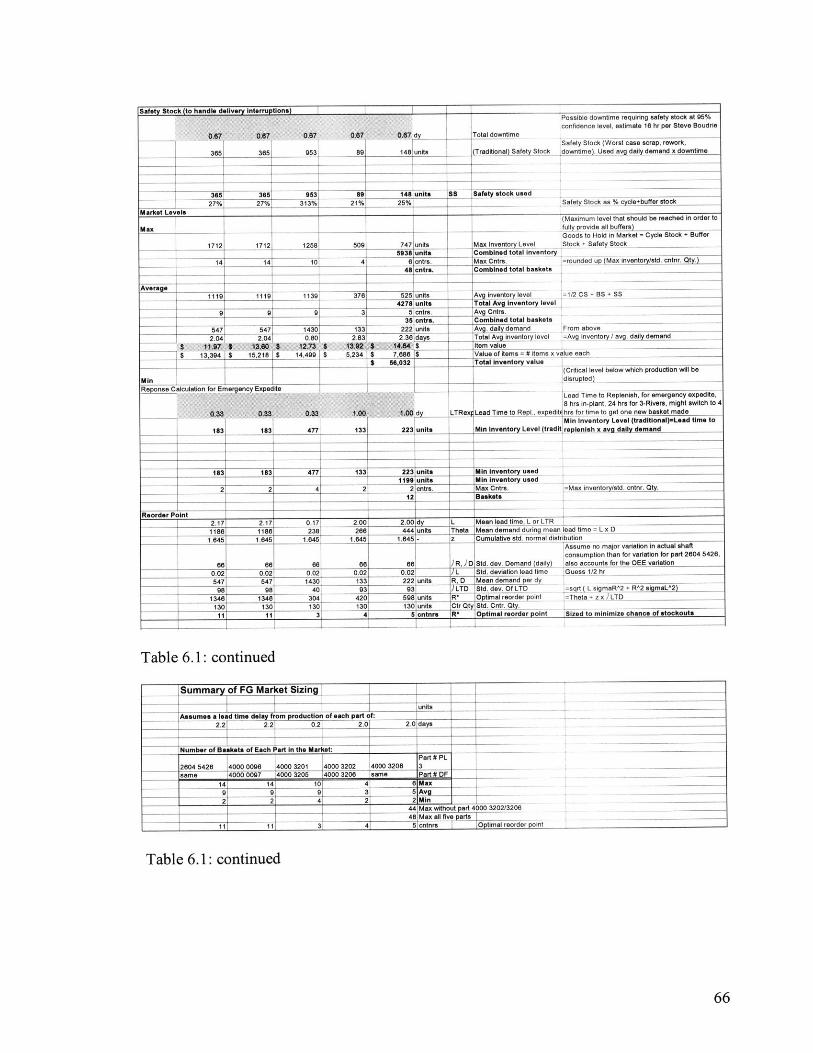
deliverv interruntionsi I IIII
35
27%
Max
365 953 89 148 units
Total downtime
(Traditional) Safety Stock
365 365 953 89 148 units SS Safety stock used
27%
akM eve 11
1712 125tt 509 747 lunits5938 unIts
14 14 10 4 61cntrs.48 nr.
111 i
9
$$
1119
9
1139
9
3vr 5
1119rn
II I 235 untrs _
5471 547 1430 133 32 unt.2.041
11.7 $13.394 1 $
MinReponse
2.041 0.801 2.83)132 1$ 14.93 $ 1312 $
15.218 1 $ 14.499 1$ 5,234 1$
2.361days14,14 S7,686 $
I ______ ______ $ 5,9321
Possible downtime requiring safety stock at 95%confidence level, estimate 16 hr per Steve Boudrie
Safety Stock (Worst case scrap, rework,downtime). Used avg daily demand x downtime
Safety Stock as % cycle+buffer stock
(Maximum level that should be reached in order tofully provide all buffers)Goods to Hold in Market = Cycle Stock + Buffer
Max Inventory Level Stock + Safety StockCombined total inventoryMax Cntrs. =rounded up (Max inventory/std. cntnr. Qty.)Combined total baskets -
Avg Inventory level =1/2 CS + BS + SSTotal Avg inventory levelAvg Cntrs.Combined total basketsAvg. daily demand From aboveTotal Avg inventory level =Avg inventory /avg. daily demandItem value I=Value of items = # items x value eachTotal Inventory value
'(Critical level below which production will bedisrupted)
Lead Time to Replenish, for emergency expedite,8 hrs in-plant, 24 hrs for 3-Rivers, might switch to 4
dy LTRext Lead Time to Repl., expedit( hrs for time to get one new basket maden riven ry
183 183 477 133 223 units Min Inventory Level (tradit replenish x avg daily demsnd
183 183 477 133 223 units Mn inventory used1199 units Min inventory used
2 2 4 2 2 ontrs. Max Cntrs. =Max inventory/std. cntnr. Oty.12 Baskets
Reorder Point2.17 2.17 0.17 2.00 2.00 dy L Mean lead time, L or LTR
1186 1186 238 266 444 units Theta Mean demand during mean lead time = L x D1.645 1.645 1.645 1.6451 1.645 - z Cumulative aid. normal distribution
Assume no major variation in actual shaftconsumption than for variation for part 2804 5426,
66 66 66 66 66 J R, ) D Std. dev. Demand (daily) also accounts for the GEE variation0.02 0.02 0.02 0.02 0.02 )L Std. deviation lead time Guess 1/2 hr547 547 1430 133 222 units R, D Mean demand per dy
98 98 40 93 93 ) LTD Std. dev. Of LTD =sqrt ( L sigmaR^2 + R^2 sigmaLv2)
1346 1346 304 420 598 units R Optimal reorder point =Theta + z x )LTD130 130 130 130 130 units Ctr Cty Std. Cntr. ity
11 11 3 4 5 cntnre R* Optimal reorder polnt Sized to minimize chance of stockouts
Table 6.1: continued
Summary of FG Market Sizing
unitsAssumes a lead time delay from production of each part of:
2.2 2.2 0.2 2.0 2.0 day _
Number of Baskets of Each Part In the Market:Part# PL
2604 5426 4000 0096 40003201 4000 3202 40003208 3same 40000097 4000 3205 4000 3206 same Part # DF
14 14 10 4 8 Max
9 9 9| 3 5 Avg2 2 4 2 2 Min
44 Max without part 4000 3202/320648 Max all five parts
1 l 31 4 5 cntnrs I I eptnimal reordar poinI
Table 6.1: continued
66
I I 1 1 $ 66,032 1
Safety :
25%313% 21%
1712
376 55units
4278 units5 1cntrs.3
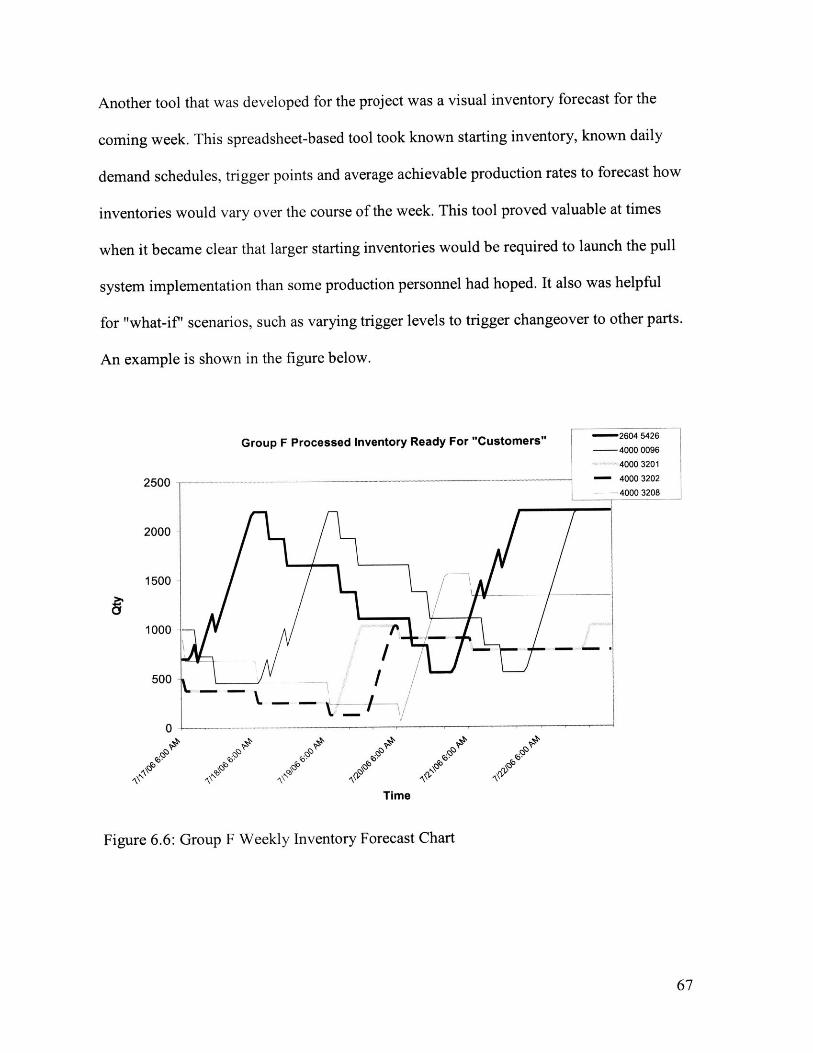
Another tool that was developed for the project was a visual inventory forecast for the
coming week. This spreadsheet-based tool took known starting inventory, known daily
demand schedules, trigger points and average achievable production rates to forecast how
inventories would vary over the course of the week. This tool proved valuable at times
when it became clear that larger starting inventories would be required to launch the pull
system implementation than some production personnel had hoped. It also was helpful
for "what-if' scenarios, such as varying trigger levels to trigger changeover to other parts.
An example is shown in the figure below.
Group F Processed Inventory Ready For "Customers" 2604 5426
- 4000 0096
4000 3201
2500 ------- -- ----- 4000 3202
-40003208
2000
1500
1000
500 -
0
Time
Figure 6.6: Group F Weekly Inventory Forecast Chart
67
6.4 Training
Training for the new pull system involved several steps. First, introductory sessions were
held to explain the basic concept of pull systems to operators and supervisors, and
suggestions were sought. Helpful in this regard was a miniature pull board and pull cards,
which allowed demonstration of the pull loop system in meetings.
Next, as the time approached to implement the pull system, each shift was requested to
stay for one extra hour for training. In this way, all three shifts could be trained within a
ten or twelve hour period of time by a group of several lean coordinators and the intern.
Training involved briefly discussing the system, walking the floor to demonstrate the use
of pull cards and the locations of the drop boxes and boards, and providing a simple flow
diagram describing the system.
As the boards and cards were deployed in anticipation of implementing the pull system
several suggestions were provided to improve the system. One in particular made the
trigger board much clearer to those not highly familiar with the concept from past
experience. The suggestion which was implemented involved providing green, yellow,
and red striping on the trigger board to indicate: no need to produce, tripped and produce
when done with current part, and danger zone with risk of starving customer of parts.
6.5 Implementation
Implementation of the pull system's first step - establishment of FG markets and a trigger
board pull card loop - was accomplished during the internship period. Material markets
68
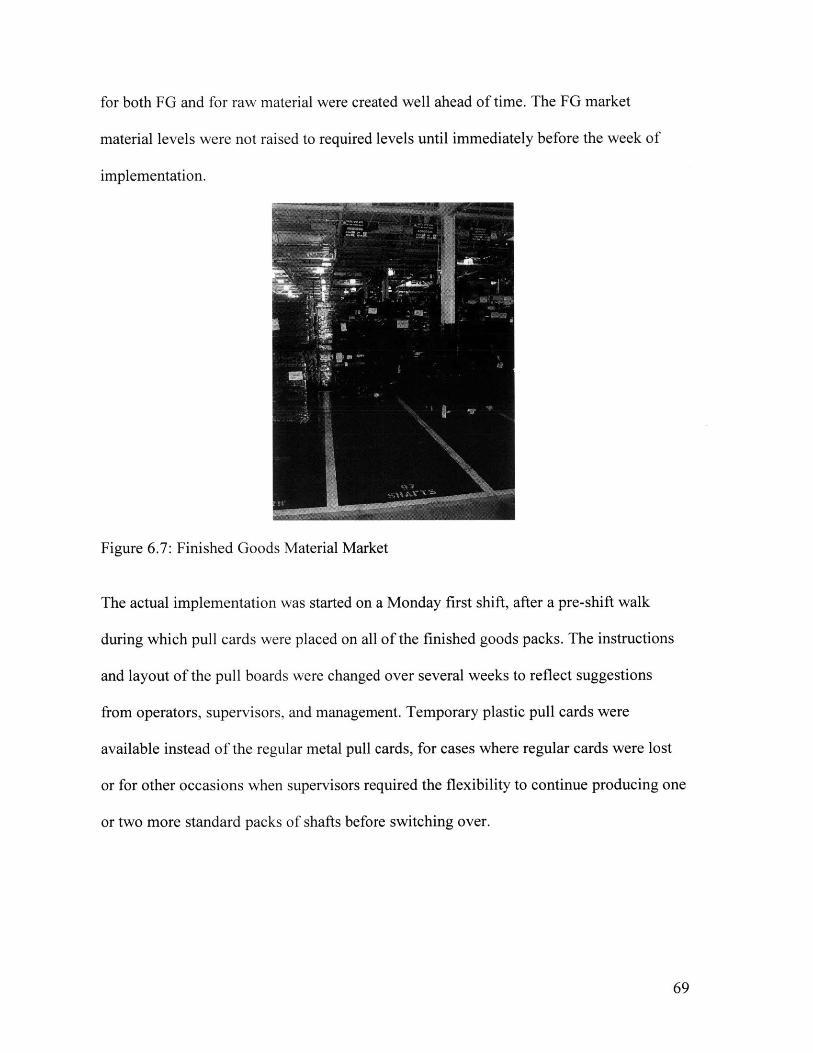
for both FG and for raw material were created well ahead of time. The FG market
material levels were not raised to required levels until immediately before the week of
implementation.
Figure 6.7: Finished Goods Material Market
The actual implementation was started on a Monday first shift, after a pre-shift walk
during which pull cards were placed on all of the finished goods packs. The instructions
and layout of the pull boards were changed over several weeks to reflect suggestions
from operators, supervisors, and management. Temporary plastic pull cards were
available instead of the regular metal pull cards, for cases where regular cards were lost
or for other occasions when supervisors required the flexibility to continue producing one
or two more standard packs of shafts before switching over.
69
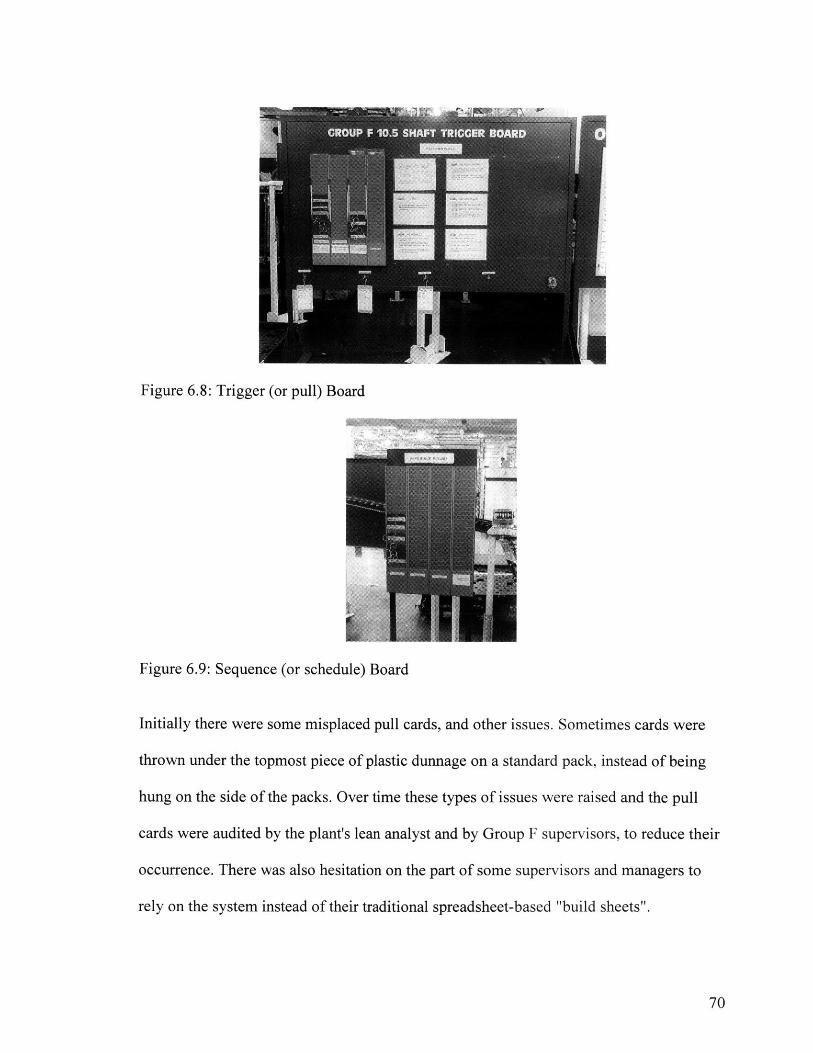
Figure 6.8: Trigger (or pull) Board
Figure 6.9: Sequence (or schedule) Board
Initially there were some misplaced pull cards, and other issues. Sometimes cards were
thrown under the topmost piece of plastic dunnage on a standard pack, instead of being
hung on the side of the packs. Over time these types of issues were raised and the pull
cards were audited by the plant's lean analyst and by Group F supervisors, to reduce their
occurrence. There was also hesitation on the part of some supervisors and managers to
rely on the system instead of their traditional spreadsheet-based "build sheets".
70
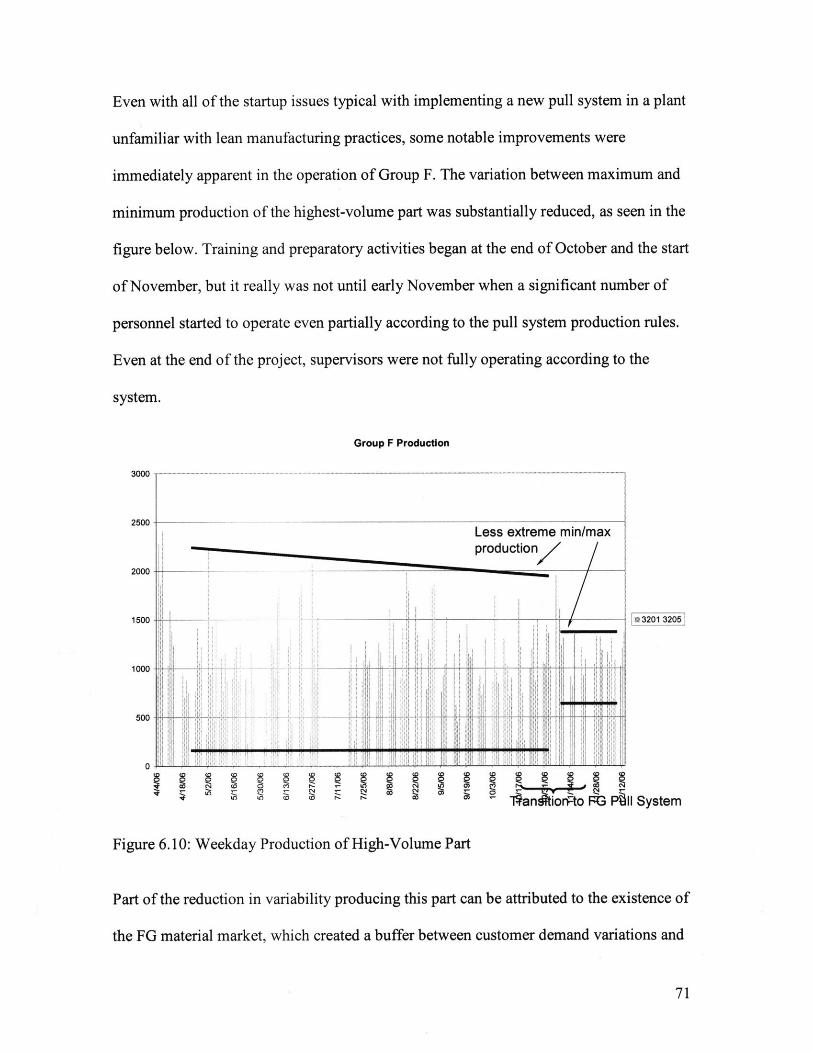
Even with all of the startup issues typical with implementing a new pull system in a plant
unfamiliar with lean manufacturing practices, some notable improvements were
immediately apparent in the operation of Group F. The variation between maximum and
minimum production of the highest-volume part was substantially reduced, as seen in the
figure below. Training and preparatory activities began at the end of October and the start
of November, but it really was not until early November when a significant number of
personnel started to operate even partially according to the pull system production rules.
Even at the end of the project, supervisors were not fully operating according to the
system.
Group F Production
3000 - - .- . - - - ----- - ------ --
2500-Less extreme min/maxproduction/
2000
1500 - 3201 3205
1000
500 -_-
0
lanion o PG PbiI System
Figure 6.10: Weekday Production of High-Volume Part
Part of the reduction in variability producing this part can be attributed to the existence of
the FG material market, which created a buffer between customer demand variations and
71
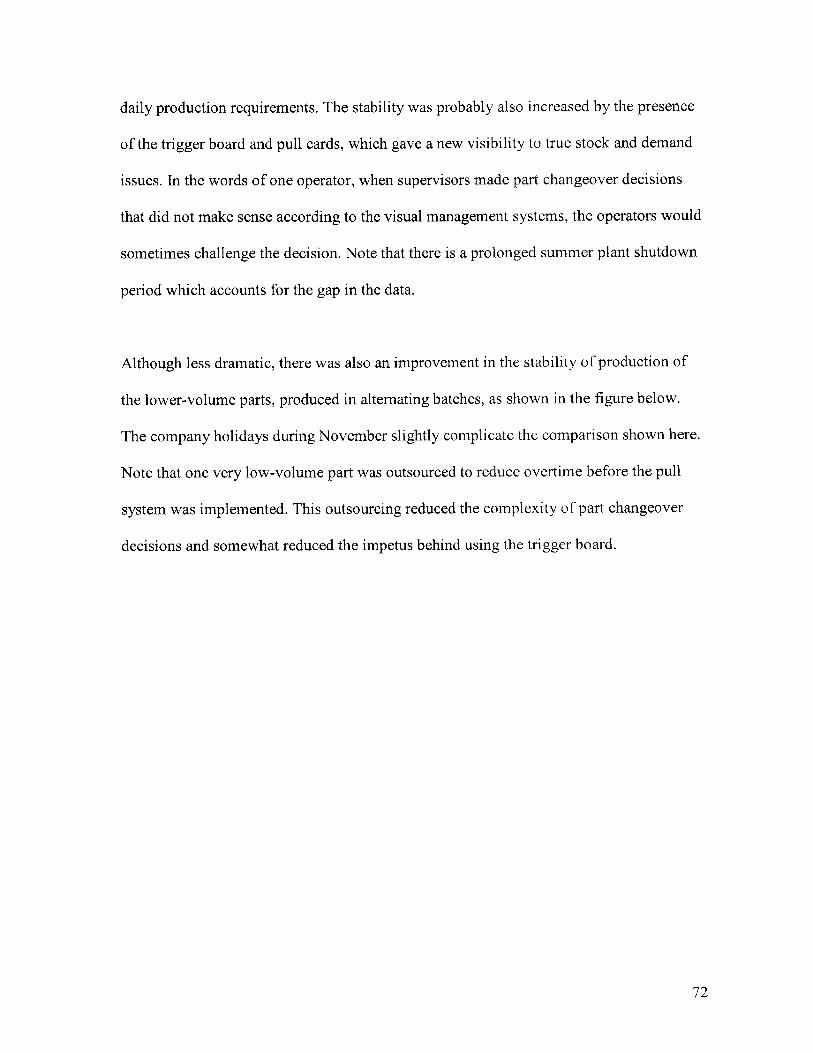
daily production requirements. The stability was probably also increased by the presence
of the trigger board and pull cards, which gave a new visibility to true stock and demand
issues. In the words of one operator, when supervisors made part changeover decisions
that did not make sense according to the visual management systems, the operators would
sometimes challenge the decision. Note that there is a prolonged summer plant shutdown
period which accounts for the gap in the data.
Although less dramatic, there was also an improvement in the stability of production of
the lower-volume parts, produced in alternating batches, as shown in the figure below.
The company holidays during November slightly complicate the comparison shown here.
Note that one very low-volume part was outsourced to reduce overtime before the pull
system was implemented. This outsourcing reduced the complexity of part changeover
decisions and somewhat reduced the impetus behind using the trigger board.
72
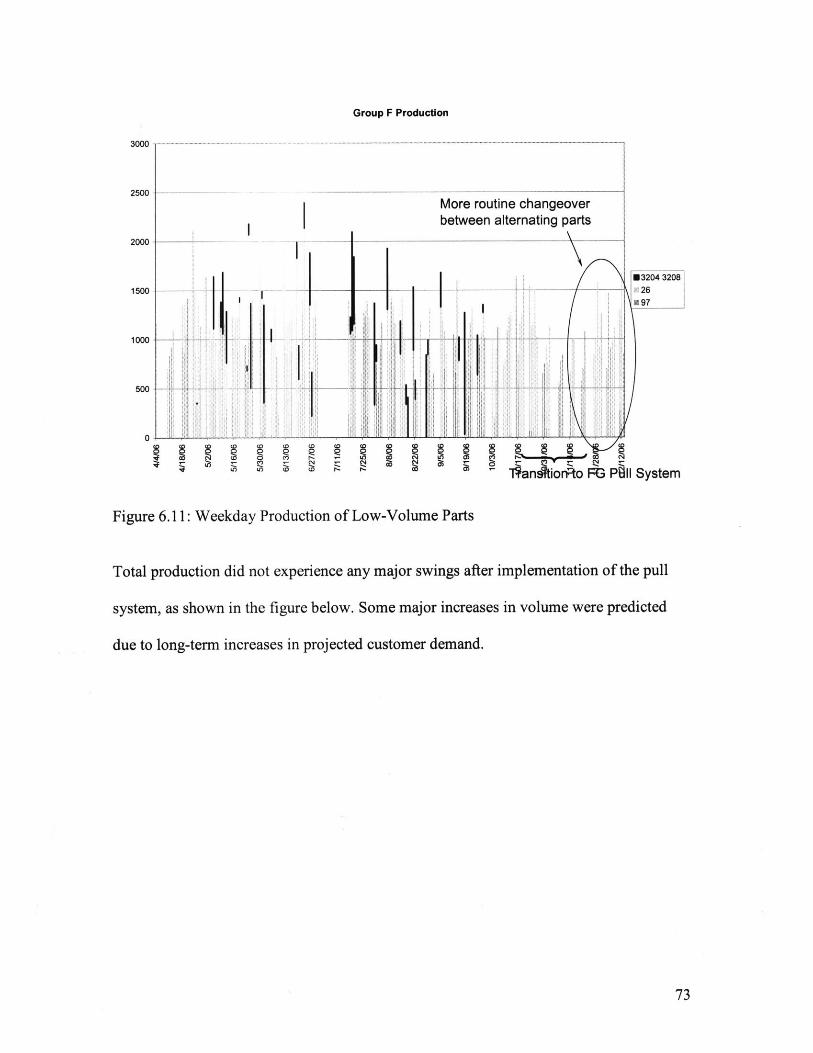
Group F Production
3000
2500
2000 -
1500 -
1000 -
500-
0 I-In
(D
0C.,
More routine changeoverbetween alternating parts
-I
~- ~-c.~1Co
-I ----
-T1ansionto FG PU
Figure 6.11: Weekday Production of Low-Volume Parts
Total production did not experience any major swings after implementation of the pull
system, as shown in the figure below. Some major increases in volume were predicted
due to long-term increases in projected customer demand.
73
_ I -
*3204 320826
597
11 System§ § 9as as
I
I
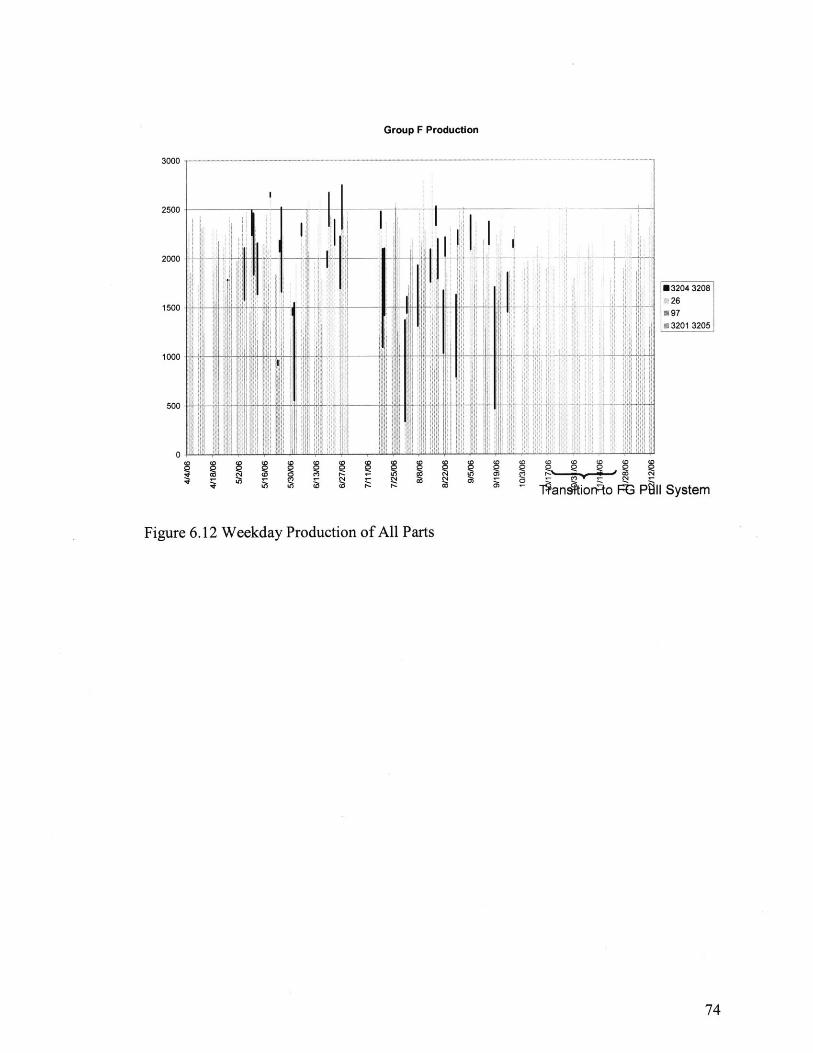
Group F Production
-wA-A
1... ..P. Ii
~~~1
I.. ~ !. I.IIL-
N i2
*3204 320826
u3201 3205
1%nftiorRto FG P6II System
Figure 6.12 Weekday Production of All Parts
74
2500
2000
1500
1000
500
0-
M
- - --
7. Lean and Organizational Behavior
A final aspect of the thesis was to examine the current business context in which the lean
systems are to operate, as well as the strategic, cultural, and political aspects that
influence change management in large organizations. These represent the non-technical
yet vitally important features of how and why organizations operate the way that they do.
Observations on the strategic, cultural, and political aspects of the organization are
provided below. Recommendations are also made regarding approaches to the continued
adoption of lean manufacturing at AAM.
7.1 Culture: Current and Future State
Lean Initiatives
AAM began implementing lean manufacturing initiatives on a company-wide basis
approximately five years ago, at the time calling this effort the "AAM Manufacturing
System." This initial effort resulted in some false starts in terms of plant floor systems, as
the implementation efforts were not supported across the company. Total landed cost
models were also developed several years ago to allow more informed sourcing decisions
to be made. These models fell by the wayside. In all fairness this was also a difficult time
to implement lean systems, as the booming Sport Utility Vehicle (SUV) market meant
that AAM faced significant challenges meeting customer demand. Maximizing output
became the goal, and other efforts took on secondary importance. Significant progress in
productivity, quality, and cost was made, however, due to a continuous management
focus on operations.
75
More recently Harris Lean Systems, a management consultant firm comprised of former
employees of Toyota and other firms well-versed in lean manufacturing methods, has
been advising AAM. Over the past one and one-half years, AAM has developed a lean
group in the Corporate Materials Department to assist with training, the development of
company-wide lean standards, and to provide guidance on initial implementation steps at
the local plant level. The Corporate Materials group also works with other departments to
identify opportunities for lean initiatives at the strategic level, such as for supplier
sourcing decisions. AAM has reached the point where routine use of lean manufacturing
principles has become common at many facilities, although inconsistent across the
company as a whole. Substantial improvements towards the "50-in-5 goals" have been
achieved. Many opportunities remain.
Focus Upon Local Interests
The strategy of the work unit at Corporate Materials is to deploy lean manufacturing
principles company-wide, to gain continuous productivity improvements and therefore a
competitive advantage. The strategy of much of the management at the local plants is to
"meet the numbers" for their local facilities (as opposed to the enterprise as a whole),
which can pit them against other AAM plants or principles of lean manufacturing.
Politically, the interests of stakeholders in lean implementation efforts at some of the
plants are not compatible in the short-term. Changing the incentive system would help to
encourage teamwork and flexibility across the enterprise. Power is broken up at a very
76
high level within the organization by divided departmental and plant lines of authority.
Little coordination is forced upon the various participants on a daily basis. Disputes about
how to implement lean systems sometimes are not effectively resolved because strong
leadership sometimes does not exists at the working level, and because there is little
sense of teamwork. Value stream managers have been "injected" in a parallel chain of
management by corporate headquarters, instead of in a line-command position, so their
power is very limited without the existence of highly cooperative plant or area managers.
The value stream managers have a role that is more similar to corporate staff rather than
line management. They are placed within a culture that most highly values direct line
management rather than advisory corporate staff employees.
The legacy culture and operations that AAM inherited still exhibit some of the
characteristics of the past. One important characteristic is decentralization and fiefdoms,
resulting in a lack of seeing or understanding the entire operation. Every plant is run, to a
great extent, as its own firm. Every scheduler, every area and plant manager, follows a
different procedure. Decisions are personality-driven rather than being standardized and
systems-driven. Decisions are sometimes not made objectively according to the data in
hand.
As suggested by Womack and Jones [2003], the company can establish dedicated product
teams responsible for an entire value stream. These teams should then focus on a few
simple goals or processes for improvement, and slowly roll this across other processes.
To some extent this is already underway, as evidenced by the extended value stream
77
meetings and other strategic meetings held between stakeholders from many plants and
supplier facilities. Substantial progress is also being made in mapping the extended value
streams. This mapping will allow everyone to understand the operations and to see
opportunities for improvement.
Communication
Communication is very poor at some levels of the organization. There does not appear to
be much communication from less powerful parties to much higher-power parties. For
example, it is unlikely that executive management would really think that lean
implementation projects are being perceived as a priority by some middle managers when
timely maintenance response and resolution, cleanliness, and other workplace discipline
issues are still in need of improvement in certain locations. There is little effort to clearly
depict issues on boards during group meetings at some plants. People like to hoard
information at many levels throughout the company. This is just one example of how
wide dissemination of information is lacking. True dialogue and understanding is also
lacking at many plant-level meetings. Also, there is a lack of complete honesty and
openness about the true state of operations among some managers and employees: ask
how something is done and depending upon the level of the hierarchy you ask, one will
get a very different answer.
These breakdowns in communications are probably a result of a very hierarchical
management style, a very large organization, and the intense daily pressure to keep the
customer supplied with sufficient product at almost any cost. Individuals do not have
78
much power and so they have both negative reasons to block communication (fear of
reprisal for sticking out) and positive reasons to block communication (increased power
or leverage). Greatly reducing the number of management layers would help improve
communication within the company. Company incentives and management tactics
probably also need to be altered to achieve a true lean culture.
Historical Contributors
Several employees noted that the current culture was a result of the needs of the past.
When first formed, the company desperately needed to achieve basic stability, control,
and authority. In other words, power-type management tools were necessary to drive
through needed improvements. By installing a strong, hierarchical culture, a bias for
accomplishing short-term, pressing goals was achieved. Operational performance
measures were greatly improved over what they had been in the past under GM's
management. However, two trends have occurred since then.
One trend is that these original managers have been promoted. Some of the newer
managers have not had the business pressure, the micro and macro-level pull, to perform
with the same level of discipline. Some of the newer managers also were not mentored or
trained as well as their predecessors were. Supervisors on the plant floor are often no
longer knowledgeable in the jobs that their subordinates are performing. The supervisors
are therefore less effective. This deficiency has been identified and other recent
internship projects have been focused upon understanding the current state of training and
79
knowledge in the plants, and devising a more standardized training plan for the entire
firm.
The other trend is that the management style and organizational structure has not
significantly changed. To paraphrase one employee: "We had the right system for the
founding of the company, but the business situation has changed since then. We should
be on like our fifth management style by this point in the company's life." The employee's
point seems to have been that basic stability and discipline was needed in the beginning,
but the need now is for more refined forms of continuous improvement rather than
managing to achieve basic stability of results. While AAM as a whole is moving towards
lean manufacturing, some individuals are greatly retarding this transition. The lack of a
change in upper management's style - towards one better suited to lean manufacturing -
makes it harder for management to properly identify and handle the roadblocks to lean
implementation.
Summary
In summary, the current culture at AAM could be characterized in the following manner:
Personality-driven, hierarchical, own-plant focused, with imperfect communication and
teamwork, and management time-frames of weeks and often months. The goal of
achieving a "lean culture" would be achieved by driving the culture towards: systems-
driven management, managing objectively according to the data at hand, with a high
degree of communication and teamwork, and an enterprise-wide viewpoint. A continuous
improvement culture that can improve faster than the competition is the ultimate goal.
80
7.2 Training
Byrnes [2006] notes that paradigm shifts in business operations tend to be most
successful with extensive training, and with changes in compensation schemes.
Employees tend to need both general familiarization training with new concepts, and
specific training regarding their new functions. DeLuca [1999] stresses that from a
practical viewpoint, new ideas should not be raised in group meetings unless the majority
of those present already understand the idea being discussed. On some occasions this rule
was violated during lean meetings at AAM, as many of those present either had not been
trained or had not fully understood and incorporated the training.
Some of the lean practitioners at AAM believe that they should use a training element of
lean manufacturing: the Training Within Industry (TWI) program. The TWI program was
developed in the U.S. during World War 1I (Dinero [2005]). It was developed to teach
people how to effectively and consistently perform on-the-job training for hourly
associates, and to teach continuous improvement methods. Like Deming's quality-control
methods, TWI was adopted by Japanese industry. In fact, it became integral to Toyota's
operations. TWI represents the tactical-level heart of lean operations - what the associate
and trainer on the floor needs to understand and use on a daily basis. To better implement
lean manufacturing, AAM should identify the best trainers in the firm and then use them
to train others how to instruct in TWI methods.
81
A goal should be to develop a lean, problem-solving culture at AAM, to become a
learning organization that adapts faster than any competitor. AAM can create strong
support for a lean culture by driving lean through leadership from the top-down. This
means starting at the top of the organization with executive training, and successively
requiring each management layer below to receive training, demonstrate understanding of
the training, and be managed according to lean manufacturing measures of performance.
Basic lean concepts training should be required for the entire organization at the plants as
well, working from the top-down at each plant. (One suggestion provided from managers
was to hold multi-day, off-site training sessions that guarantee better attention from
attendees.) TWI-style training should be deployed at the operating level to teach the
basics of a lean culture.
7.3 Compensation and Measurement/Management Systems
Using the Right Measures
Compensation and measurement systems at AAM are still oriented towards traditional
"mass-production" operations. A switch to more transparency, and more incentives and
compensation according to lean measures, would be very helpful in the journey to lean.
People will do what they are actually paid and promoted to do, so the "real litmus test"
for change in a firm is: are you willing to change your compensation systems? (Byrnes
[2006]) The key is to get performance measures that relate to lean concepts on the plant
floor, and to manage to them.
82
In all fairness, the use of lean measurement systems for a large company relates to major
issues revolving around finance, accounting, and how Wall Street analysts assess firm
performance. An issue that was only barely mentioned so far during AAM's transition to
lean manufacturing is that lean really requires that a new kind of accounting system be
implemented in the long run, in order to provide incentives for the right "lean" behaviors
at even the corporate finance level (Womack and Jones [2003]).
Currently, managers are evaluated by build attainment numbers. While these build
attainment numbers are intended to faithfully reflect how well the plants are fabricating
according to actual daily customer quantity and product mix demand, they can be
somewhat misleading. The numbers can be misleading in that a major under-build of a
low-runner part might not result in a major slip in aggregated build attainment
percentages for a plant as a whole, even if it is a major event for the customer. Machine
performance is measured using Overall Equipment Efficiency (OEE) numbers that
combine planned and unplanned downtime into one measure. An emphasis upon OEE is
prevalent at all of the plants. These measures are both in opposition to lean principles.
One should strive to produce exactly what your customer wants when they want it.
Measurements of unplanned downtime (which cannot be controlled except by long-term
equipment improvement efforts) should be separated from planned downtime (which can
be controlled). A basic concept of lean manufacturing is that total system efficiency may
be increased even if that results in reducing the total uptime of any one machine.
83
Audits
Most importantly, layered, frequent management audits of each layer in the organization
should be performed to identify successes and also areas that require immediate attention.
Audits represent a key element of successful lean enterprises. As lean practitioners such
as Harris Lean Systems emphasize, you get the type of performance out of a plant that
reflect what you measure and audit on a frequent basis. Measurement and auditing
represent feedback that is critical to sustaining continuous improvement in any firm.
Production Analysis Boards
An area in which AAM is making advances in measurement is in the use of production
analysis boards at each manufacturing cell. These boards compare hourly planned versus
actual production, and the reasons for shortfalls or overages. The boards also include top
action items and schedules for completion by responsible parties. The production analysis
boards are helpful tools for highlighting problem areas and for keeping everyone goal-
oriented on the top performance issues of the cells.
One problem with the current use of production analysis boards is that their use is not
uniform throughout the company: some boards are up-to-date and prove helpful in
addressing issues, while other boards are not properly maintained. Better auditing by
management would help to instill a sense of discipline in these cases.
84
Discipline
A necessary ingredient for many highly successful companies has been the creation of a
culture of discipline (Collins [2001]). By discipline, Collins does not imply a mindless
adherence to commands. Instead, what is meant by discipline is enough discipline of
thought and action instilled by management and culture that a company can run itself.
Bureaucracy is not necessary when the employees of a company have enough discipline
to take care of daily matters and follow up on minor tasks. This discipline leaves
management free to focus on more important issues. Better training and management
auditing would help instill more discipline. Management by objectivity and systems, not
personality, is the goal. It is this tactical-level discipline that represents a fundamental
part of efforts to transition to lean manufacturing on the plant floor.
7.4 Change Management
Self-Reinforcing Cycles
Collins [2001] identifies a virtuous cycle apparent in many firms that make sustained
transitions to great performance. The cycle consists of maintaining stability in
management long enough to accumulate visible results or improvements. Once these
improvements become apparent, other people recognize the potential for further
improvement along the same line of action, and become aligned with the initiative. More
and more progress is made, further increasing the visible results. A self-sustaining
virtuous cycle, dubbed the "flywheel effect" by Collins, results. This is also the sort of
self-sustaining effect that is seen in manufacturing facilities that effectively make the
transition to lean manufacturing (Womack and Jones [2003]).
85
In contrast, Collins [2001] notes that many firms suffer from the opposite sort of effect,
wherein management increasingly frustrated by disappointing results reacts without
understanding, making decisions that are erratic and fail to maintain alignment or
direction. The result is dubbed the "doom loop".
Power
One possible contributing factor to this style of management was described by Kanter
[1979]. Kanter suggests that employees at all levels, even executives, may feel that they
occupy positions of powerlessness. The feelings of powerlessness can be caused by lack
of supplies, support, or information. It is possible that this sense of powerlessness
(whether conscious or unconscious) is at work for some of the individuals trying to
implement lean manufacturing. There are several possible reasons.
The organization is very hierarchical and divided along many lines of authority at a very
high level. This makes it difficult to rapidly martial support for integral changes to
operating practices. The high degree of hierarchy (and also the current culture) act against
free flows of information and transparency. Politically, company tradition has been that
those who don't push for radical change are promoted. Issues relating to unionization,
such as the large number of job classifications (and the concomitant number of people
who are required to perform some seemingly simple tasks such as fabricating and posting
signs) can cause frustrating delays (on the order of months). Also, the plants have a long
history and many close personal relations among members at all levels of the
86
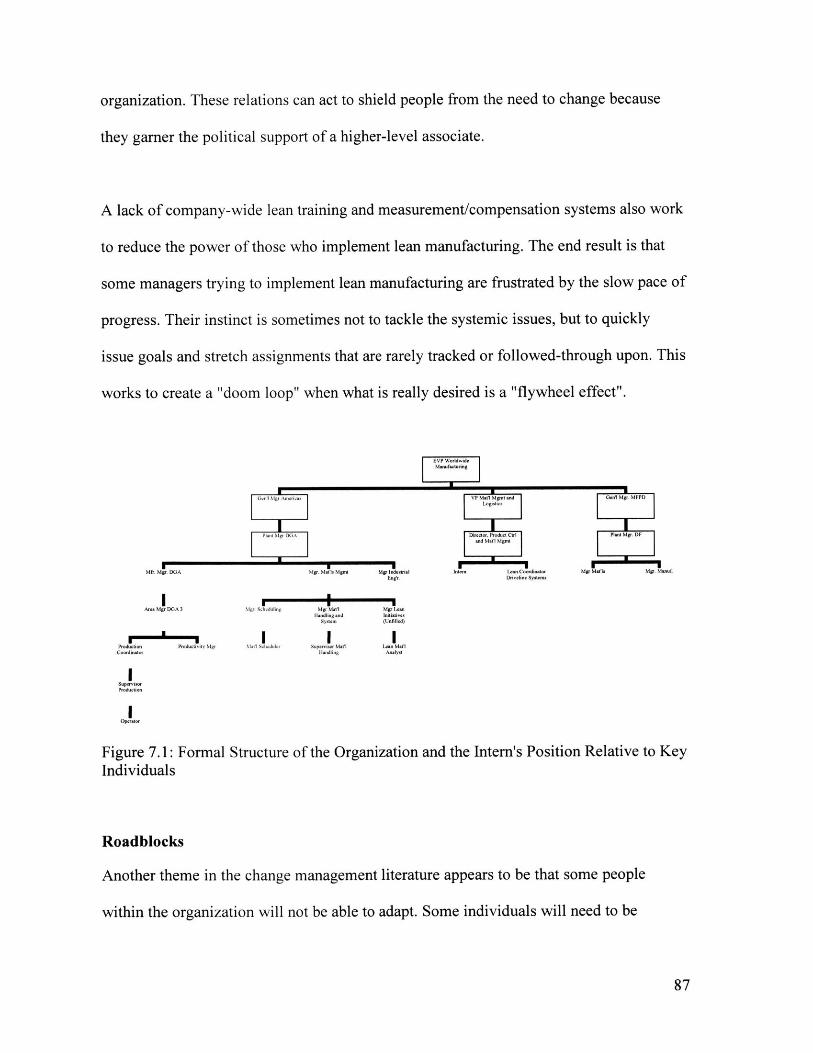
organization. These relations can act to shield people from the need to change because
they garner the political support of a higher-level associate.
A lack of company-wide lean training and measurement/compensation systems also work
to reduce the power of those who implement lean manufacturing. The end result is that
some managers trying to implement lean manufacturing are frustrated by the slow pace of
progress. Their instinct is sometimes not to tackle the systemic issues, but to quickly
issue goals and stretch assignments that are rarely tracked or followed-through upon. This
works to create a "doom loop" when what is really desired is a "flywheel effect".
G- N91A3VP M'l and Gen1 Mgr. MFP
ILogiefics
Plan MgTDGADirectwr Product Curi Plant Mgr. DF
Milt. M1r. DGA Mgr. Met')s Mgmt Mgr Inustrial Intern Lan Coordinatr Mgr Mat'l. Mgr. Manuf
Are. Mgr DGA 3 Mg. Sl duling Mg a Mg L.-at
Syse i(Unfillod)
r--u- I I IProut Productivity Mgr M.11 Schduler Sup-ms' .t'1 Matl
Coodintorlissfg A.Iy.1
Poduction
Figure 7.1: Formal Structure of the Organization and the Intern's Position Relative to KeyIndividuals
Roadblocks
Another theme in the change management literature appears to be that some people
within the organization will not be able to adapt. Some individuals will need to be
87
replaced if they are unwilling to be flexible and to work together towards new goals
important to the survival of the firm [Womack and Jones, 2003] [Collins, 2001]. AAM
has been hesitant to make this sort of hiring and firing decision. The result is that major
roadblocks to change exist in the organization. Despite the flagging profits of traditional
"mass-production" firms and the success of many "lean manufacturing" firms, these
individuals are unwilling to entertain the possibility that lean manufacturing may offer
substantial operational improvements. Until these roadblocks are removed or
marginalized, true organizational change will be very difficult indeed.
Critical Mass of Understanding
Another theme of change management from Klein [2004] is that effective organizational
change seems to be most effective when a critical mass of company "insider-outsiders"
develop sufficient exposure to new facts and ideas to remove their organizational
blinders, allowing them to see the compelling need to change the organization while still
respecting the ways in which the organization functions.
Observations of managers throughout the organization suggest that the "seeds of change"
have been planted in the form of many insiders who see the value in at least some aspects
of lean manufacturing principles. They are hindered, however, by problems with
measurement, compensation, and training.
For example, hundreds of employees have received lean management training. Often,
these individuals readily understand the concepts and believe in their efficacy, but
88
vocalize their frustration at management practices that hinder true change towards lean
manufacturing. One major example of this problem is with how higher management and
finance treats material markets. Material markets should be maintained within specific
levels according to lean principles. If markets are not properly maintained, even at the
cost of spending some overtime budget, then the entire advantage of having these markets
to buffer other customers, and to stabilize one's own production, is lost. Management
does not treat material markets like the customer, instead treating markets as a luxury.
Sometimes overtime work is not approved by management to allow maintenance of
proper market sizes. A vicious cycle of crisis management is begun wherein a short-term
avoidance of overtime to maintain these valuable buffer stocks causes more costly long-
term overtime and production issues.
The organization is very hierarchical in nature so these "insider-outsiders" or agents of
change are not able to make major, independent steps towards lean manufacturing and are
limited in their abilities to align and incentivize others. Until the organization is better
aligned towards training for and encouraging lean behaviors, the effectiveness of these
"insider-outsiders" is limited. Another concern is that delays in aligning the organization
towards lean management principles will alienate the "insider-outsiders", driving them
away to other firms in a case of adverse selection.
Locations of Successful Change
Visual inspection and discussions with employees suggested that the greatest headway in
lean implementation appears to have been made in AAM plants that felt the need or pull
89
for change in the form of great business pressure, and that tended to be further away from
the Detroit union culture (although plants are still unionized at other locations). New
plants probably also had an easier time adopting lean because there was no pre-existing
culture to change. The least success has been at the Detroit area plants, where a sense of
entitlement and a long history of work have provided a sense of relative security.
7.5 Recommendations For Transitioning to Lean Manufacturing
Overview
Much of what determines how a firm runs eventually comes back to what incentives and
feedback employees receive. People and culture are important factors as well, but these
also relate to incentives and feedback. Culture is based upon employees' perspectives and
habits forged over a long history of incentives, feedbacks, and tasks or challenges. In a
large organization, most tasks that employees see are not direct tasks provided to the
customer, but are internally-defined tasks that hopefully result in an end product or
service for the customer.
The culture, incentives and feedback that the firm has in place are appropriate for
meeting past challenges. They may not be as appropriate for meeting the challenges that
AAM is likely to face in the future. The challenge for the future is to have a continuous
improvement culture that improves faster than the competition. Attempting to implement
a very different operating procedure - lean manufacturing - without making similarly
large changes to incentive and feedback procedures will probably be ineffective. While
AAM as a whole is moving towards lean manufacturing, some individuals are greatly
90
retarding this transition. The lack of a change in upper management's style - towards one
better suited to lean manufacturing - makes it harder for management to properly identify
and handle the roadblocks to lean implementation.
Cultural Change
Christensen discusses organizational culture and the means to change it in a series of
research notes drawing on his work and that of Schein and others [Christensen (2006
Culture, 2006 Capabilities, 2005 Cooperation)]. Paraphrasing these notes, the major
points are as follows. Culture is a learned response to a set of recurring problems faced
by an organization. When an organization faces a set of problems and tasks often enough,
employees develop solutions and at some point no longer explicitly question what the
right approach is. It is at this point that a culture develops.
Culture becomes very difficult to change in a head-on manner. Instead, culture can be
more easily changed through other methods. One method to change a culture is to create
a crisis, forcing the organization to acknowledge that past solutions are no longer
appropriate to the new challenges which the organization faces. Another method is to
create a new business unit, which must face new challenges and develop a new culture.
Christensen emphasized that the task is the starting point for cultural change, because
culture is a response to recurring tasks. Shifting the level of accountability in an
organization is another good means for driving cultural change, because it changes the
nature of tasks employees must perform [Christensen (2006 Culture, 2006 Capabilities,
2005 Cooperation)].
91
AAM could use the following approaches to create a culture more inclined to embrace
lean manufacturing:
" Give employees new tasks different than the old, such as building to material
bank sizes or to level production boards, rather than to truck shipments.
Emphasize that the bank is now their customer, not the outbound truck
shipments. Overtime should be required to maintain the banks. When this is
done no one will need to work overtime to meet outbound truck shipments,
and the entire operation will be much more stable and robust.
" Shift the levels of accountability in the organization. Push responsibility as
close to the floor, to the operators, as possible. Most of the operators quickly
understood the broad outline of the visual pull systems even when their
supervisors resisted or when training was incomplete. It also helped to have
more eyes focused on the visual control systems than only one set of eyes on
the supervisor's paper build plans.
* Give the managers new tasks and responsibilities, such as two-level pull
system audits of those below them on a frequent basis, and make their
performance auditing just as important as their other roles. The results
achieved are what you measure for and what you pay for.
* Deliver on promises and mandates instead of letting them slide. In other
words, follow just a few key mandates and make sure that they are achieved
before moving onto others. This will change the problems and solutions
required of middle managers from head-ducking and paper solutions
presented at operating reviews, towards better long-term progress.
92
" Incentivize employees with new measures of evaluation and new management
approaches. Stop judging performance based on very broad measures such as
total production. Start focusing on lean measures that directly relate to what is
happening on the plant floor. Start using objectivity and systems in
management, removing personality from decision-making.
" Start emphasizing visual control on the plant floor, and less supervisor work
on paper in their offices after their shifts end. If the production boards and
visual controls are in constant disarray, this needs to be resolved as quickly as
a failed customer delivery, because it is fundamentally undercutting the ability
of the organization to improve what it provides to customers through better
quality and productivity. It also hinders efforts to reduce costs to bid for new
work. Failing to attract new work is as damaging as a failed customer
delivery, except that it will happen a year from now rather than today.
" Set new long-term expectations and therefore tasks. Ask not only for
production quotas, but also for evidence of continuous improvement. Is the
plant not showing quality or productivity improvement, or is it varying
substantially each day, week, or month? Is this happening even though
resources are provided that are similar to those of other plants? Are the
managers really devoted to continuous improvement? If so, why do effective
lean manufacturing firms like Pratt & Whitney and Harley Davidson manage
to move on the order of 1000 machines in each of their plants in a couple of
years, but virtually no machines have been moved in the past two years in one
of AAM's Detroit plants?
93
" Have managers require open communication and do everything possible to
help in this regard. Reduce the number of management layers. Emphasize the
use of visual tools such as white boards or paper easels in meetings to get
people focused on objective items rather than on individuals' comments.
* Build awareness of the coming crisis in competitiveness. Emphasize that the
crisis-management practices of the past were appropriate for old problems, but
will not be as effective at tackling the competitiveness problems of the future.
Emphasize the achievements, both within the company and at other US and
foreign firms, in using lean manufacturing methods. Take people on plant
tours. It costs only $500-$ 1000 to take people to Mexico or to other US plants,
but it could save thousands or millions of dollars if it changes the behavior of
just a few managers.
" Consider using new forms of teams, such as true heavyweight value stream
teams that are given responsibility and authority for cross-functional
collaboration and delivery of an entire product line that might span several
plants.
Detailed Change Plan
There are many good sources for detailed lean manufacturing action plans. These include
Womack and Jones [2003], the Lean Enterprise Institute guide books, and operator-level
training described in Dinero [2005]. Collins [2001] also has some good high-level
management commentary which another CEO who successfully turned a company
around recommended as a good read. A detailed lean manufacturing change plan could
94

be based upon these references and others, and should be tailored to the business and
cultural context of the finm.
95

[This page is intentionally blank]
96
8. Conclusions and Recommendations
8.1 Results
The major strategic accomplishments of this project included the following:
" Highlighted improvement opportunities in value streams, developed detailedknowledge of eight extended value streams
" Developed a tool to allow evaluation of the true costs of sourcing, applied it tofive business cases
The major tactical accomplishments included:
* Facilitated creation of a pull system that brings visual management to DGAPlant 3, Group F
Various supporting tasks and roles were also accomplished, including assisting in the
development and deployment of training material, and participating in workshops and
operations reviews.
8.2 Key Lessons Learned
Key insights of this project included:
* Extended value stream mapping, and the communication that is required toperform it, is a valuable exercise for management. It is a valuable tool forhighlighting opportunities for supply chain improvement and for providingobjective means to evaluate the state of current operations, and highlightsorganizational "blind spots".
" Total cost analysis tools are useful, but their real value lies in engaging indialogue with various departments to encourage teamwork and long-rangethinking about supply chains and sourcing decisions.
" Some major lean accomplishments are visible, but not consistent across thefirm.
" Vital to obtaining the paradigm shift to a lean manufacturing culture andsuccessful plant floor implementation are: training; compensation andmeasurement/management systems; and removing roadblocks.
97
* Stay objective, focus on the data and on communicating constantly in anhonest, calm and open manner.
" Stay flexible.
8.3 Recommendations for Future Work
Future work regarding the transformation to lean manufacturing at AAM could be
pursued in a number of areas. Although tactical-level, plant floor techniques and tools
often garner the most attention when lean is discussed, other issues may be more
profitably pursued as well. In some cases, focusing on the details of implementing lean
manufacturing may be premature. Investigation of the higher-level cultural and
management practices lying behind successful cases of lean implementation, both at
AAM and at other firms, could be a profitable area of research.
Taking more employees on tours of very "lean" facilities at AAM and elsewhere may
also be helpful to generate ideas and dialogue.
98
9. Bibliography
American Axle & Manufacturing Web Site, www.aam.com, available: November, 2006.
Bureau of Labor Statistics, U.S. Department of Labor, Career Guide to Industries, 2006-07 Edition, Motor Vehicle and Parts Manufacturing, on the Internet athttp://www.bls.gov/oco/cg/cgs012.htm (visited November 27, 2006).
Byrnes, Jonathan, Course notes and lectures, ESD.261J, "Case Studies in Logistics andSupply Chain Management," Massachusetts Institute of Technology, Spring,2006.
Castilla, Emilio J., Course notes, 15.660, "Strategic Human Resource Management,"Massachusetts Institute of Technology, Spring, 2006.
Christensen, Clayton, "What Is an Organization's Culture?", Harvard Business SchoolNote No. 9-399-104, Rev: Aug. 2, 2006.
Christensen, Clayton, "Assessing Your Organization's Capabilities: Resources, Processesand Priorities," Harvard Business School Note No. N9-607-014, Rev: Sept. 13,2006.
Christensen, Clayton, and Stevenson, Howard, "The Tools of Cooperation," HarvardBusiness School Note No. 9-399-080, Rev: Aug. 31, 2005.
Collins, Jim, Good to Great. Why Some Companies Make the Leap... and Others Don't,Harper Collins, 2001.
D'Avanzo, Robert L., Starr, C. Edwin, and Lewinski, Hans Von, "Supply Chain and theBottom Line: A critical Link," Accenture Outlook, No. 1, 2004, pp. 38-45.(Available: www.accenture.com/outlook)
DeLuca, Joel, Politically Savvy: Systematic Approaches to Leadership Behind-the-Scenes, EBG Publications, 1999.
Dinero, Donald A., Training Within Industry: The Foundation of Lean, ProductivityPress, New York, NY, 2005.
Gershwin, Stanley B., Manufacturing Systems Engineering, 2nd printing, 2002.
Goodson, Eugene R., "Read a Plant - Fast," Harvard Business Review, May, 2002,pp. 10 5 -1 13.
99
Harris, Rick, Harris, Chris, and Wilson, Earl, Making Materials Flow: A Lean Material-Handling Guide for Operations, Production-Control, and EngineeringProfessionals, Lean Enterprise Institute, 2003.
Hopp, Wallace J., and Spearman, Mark L., Factory Physics, 2nd. ed., McGraw-Hill,2002.
International Trade Administration web site, available Nov. 29, 2006:www.ita.doc.gov/td/auto/domestic/SupplyChain.pdf, Prepared:MAS/MFG/OAAI/AIT/RMiller/ 03-11-2004/Revised 04-29-2005.
Jones, Dan, and Womack, Jim, Seeing the Whole: Mapping the Extended Value Stream,Lean Enterprise Institute, 2003.
Kanter, Rosabeth Moss, "Power failure in management circuits," Harvard BusinessReview, July-Aug. 1979.
Klein, Janice A., True Change: How Outsiders on the Inside Get Things Done inOrganizations, Jossey-Bass, 2004.
Klier, Thomas H., and Rubenstein, James M., "The New Geography of the U.S. AutoIndustry," The Supplier Industry In Transition, Detroit, MI, April 18-19, 2006.Available: http://www.chicagofed.org/, November 22, 2006.
Marchwinski, Chet, and Shook, John, editors, Lean Lexicon: A Graphical GlossaryforLean Thinkers, 2nd. ed., Lean Enterprise Institute, 2004.
Rother, Mike, and Harris, Rick, Creating Continuous Flow: An Action GuideforManagers, Engineers and Production Associates, Lean Enterprise Institute, 2001.
Rother, Mike, and Shook, John, Learning to See: Value-Stream Mapping to Create Valueand Eliminate Muda, version 1.3, Lean Enterprise Institute, 2003.
Smalley, Art, Creating Level Pull: A Lean Production-System Improvement Guide forProduction-Control, Operations, and Engineering Professionals, Lean EnterpriseInstitute, 2004.
Stearman, John D., Business Dynamics: Systems Thinking and Modeling for a ComplexWorld, Irwin McGraw-Hill, 2000.
Ward's Auto Web Site, www.wardsauto.com, available: November, 2006.
Womack, James P., "Move Your Operations to China? Do some lean math first.", LeanEnterprise Institute, Jim Womack's E-letters, Jan. 10, 2003, Available:http://www.lean.org/, December 11, 2006.
100
Womack, James P., and Jones, Daniel T., Lean Thinking: Banish Waste and CreateWealth in Your Corporation, revised ed., 2003.
Womack, James P., Jones, Daniel T., and Roos, Daniel, The Machine That Changed theWorld: The Story ofLean Production, HarperCollins, 1991.
101
Related Documents