SCIENCE & TECHNOLOGY IN SOCIETY ••• , 1 - 0 ~

Welcome message from author
This document is posted to help you gain knowledge. Please leave a comment to let me know what you think about it! Share it to your friends and learn new things together.
Transcript

SCIENCE &TECHNOLOGYIN SOCIETY
• • •
,1-
0~

\\
ABOUT SATIS
Science and Technology in Society units are designed to be used in conjunction withconventional science courses, particularly those leading to GCSE examinations.Each unit has links to major science topics as well as exploring important social andtechnological applications and issues.
The units are self-contained and generally require about 2 periods (around 75minutes) of classroom time. Each unit comprises Teachers' Notes (blue sheets) andStudents' materials (white sheets). Full guidance on use is given in the Teachers'Notes accompanying each unit, which also include background information andsuggest further resources.
Each SATIS book contains ten units. The units are numbered in a system giving thenumber of the book followed by the number of the unit within that book. Thus thefirst unit in the first SATIS book is numbered 10l.
In addition to the SATIS books, a general Teacher's Guide to the project isavailable, giving guidance on some of the teaching techniques involved as well asideas for further activities.
Many people from schools, universities,. industry and the professions havecontributed to the writing, development and trials of the SATIS project. A full listof contributors appears in the Teachers' Guide.
The material which follows may be reproduced without infringing copyright providedreproduction isfor student use only. The permission of the publishers must be obtainedbefore reproducing the material for any other purpose.
First published 1986 by The Association for Science Education© The Association for Science Education
Designed by P&PS (Cambridge) Ltd. Tel: (0353) 740389

.SATIS 6List of units in this book
601 ELECTRICITY ON DEMANDDecision-making task concerning electricity generation and the use of different types of powerstations
602 THE LIMESTONE INQUIRYA role-play exercise concerning the quarrying of limestone
603 THE HEART PACEMAKERReading, questions and discussion concerning electronic heart pacemakers and their use intreating heart defects
604 METALS AS RESOURCESData analysis exercises on the prices, abundance and reserve lifetimes of metals, and problemsassociated with their depletion
60S THE GREAT CHUNNEL DEBATEInformation, questions and debate concerning the building of a fIXedChannel link
r / I -7" T) ~ D ()\f C? :. 1f 0 Lj l- .P IT 1\ ~ '0) I{'~ -:
606 THE TRISTAN DA CUNHA DENTAL SURVEYSA data analysis exercise concerning the effect of diet on dental decay
607 SCALE AND SCUMQuestions based on an advertising leaflet concerning water softening
608 SHOULD WE BUILD A FALLOUT SHELTER?A role-play exercise concerning the building of a nuclear fallout shelter
609 HITTING THE TARGET - with monoclonal antibodiesReading and questions concerning the production and uses of monoclonal antibodies
610 ROBOTS AT WORKReading, questions and discussion on industrial robots and their future implications
The Association for Science EducationCollege LaneH~tfieldHerts ALtO 9AA
ISBN 0 86357 042 9

List of units in the SATIS series
SATIS 1101 Sulphurcrete102 Food from Fungus103 Controlling Rust104" What's in our Food? - a look at food labels105 The Bigger the Better106 The Design Game107 Ashton Island - a problem in renewable
energy108 Fibre in your Diet109 Nuclear Power110 Hilltop - an agriCulturalproblem
SATlS2201 Energy from Biomass202 Electric Vehicles203 Drinking Alcohol204 Using Radioactivity205 Looking at Motor Oil206 Test-tube Babies207 The Story of Fritz Haber208 The Price of Food209 Spectacles and Contact Lenses210 The Pesticide Problem
SATIS 3301 Air Pollution - where does it come from?302 Living with Kidney Failure303 Physics and Cooking304 A Medicine to Control Bilharzia - Part 1305 A Medicine to Control Bilharzia - Part 2306 Fibre Optics and Telecommunications307 Chemicals from Salt308 The Second Law of - What?309 Microbes Make Human InsUlin310 RecyclingAluminium
SATlS4401 Fluoridation of Water Supplies402 DDT and Malaria403 Britain's Energy Sources404 How would you Survive?- an exercise in
simple technology405 The Label at the Back - a look at clothing
fibres406 Blindness407 Noise408 Industrial Gases409 Dam Problems410 Glass
SATIS 5501 Bridges502 The Coal Mine Project503 Paying for National Health504 How Safe is·YourCar?505 Making Fertilizers506 Materials for Life - new parts for old507 Comppters and Jobs508 Risks509 Homoeopathy - an alternative kind of
medicine .-510 Perkin's Mauve
SATlS6601 Electricity on Demand602 The Limestone Inquiry603 The Heart Pacemaker604 Metals as Resources605 The Great Chunnel Debate606 The Tristan da Cunha Dental Surveys607 Scale and Scum608 Should we Build a Fallout Shelter?609 Hitting the Target - with monoclonal
antibodies610 Robots at Work
SATIS 7 and Indo: .701 Electricity in Your Home702 The Gas Supply Problem703 Vegetarianism704 Electric Lights705 Physics in Playgrounds706 Dry Cells707 ArtificialLimbs708 Appropriate Pumps709 Which Anti-Acid?710 What is Biotechnology?Index

SATIS 601 Electricity on-Demand
Electricity on Demand
Teachers' notes i
Contents: Decision-making task concerning electricity generation and the use of different types of powerstations.
Time: 2 periods.
Intended use: GCSE Physics and Integrated Science. Links with work on electricity generation andtransmisson, energy transformation and power.
Aims:• To complement prior work on electricity generation and energy changes
• To describe the different types of power stations in use in Britain, and their relative advantages anddisadvantages
• To show the planning and decisions that have to be made to ensure a reliable and economic supply ofelectricity on demand
• To provide opportunities to practise skills in planning and decision-making.
Requirements: Students' worksheets No. 601. Scissors.
The unit is in two parts.
Part 1 gives information on electricity generation, with particular reference to the North West Region oftheCEGB.
Part 2 is a decision-making task in which students plan which power stations to use at different times in order togenerate sufficient electricity at an economic price.
Background informationIn part 1 a certain number of simplifications have been made. Some of the power stations can in fact run onmore than one type offuel- for example, Padiham can use oil or coal. For simplicity on~yone fuel cost is given.
At some stations there are sets. of equipment which use gas turbines. These are very expensive to run but indifficult situations they can be used to 'top up' the system. The gas turbines can be used in an emergency to startup the power stations themselves. The combined capacity is only 0.2 per cent of total capacity.
In Part 2 it is probably best if students work in pairs. With able students, teachers may wish to withholdFigure 11, which gives help with the answer.
Students should not fmd it hard to arrange power stations in order of cost to meet the demand. The most difficultpart of the task is using the pumped storage capacity in the most cost-effective way, since it is difficult to quantifyhow much capacity is spare. Most students will do this approximately, by eye, but some may realize that thequantity of available spare energy is given by the area above the graph (the shaded area in Figure 11). Forsimplicity it is assumed that the pumped storage stations are 100 per cent efficient - in other words, they convertall the stored energy back into electricity. Their efficiency is in fact about 85 per cent, so this is not a badapproximation.

SATIS No. 601 Electricity on Demand Teachers' notes ii
Further resourcesUnderstanding Electricity, the educational service of the electricity supply industries, has a wide range ofresource materials available which relate to electricity generation and distribution. Catalogue from:Understanding Electricity, Electricity Council, 30 Millbank, London· SW IP 4RD. These resource· materialsinclude Power Package, a computer simulation of electricity generation and supply.
The Granada TV series Physics inAction includes two very useful programmes relating to electricity generationand supply, which can be recorded off-air for school use. Transmission times can be found in the lTV for Schoolsprogramme schedule.
Acknowledgements Figure 1 supplied by the Electricity Council; Figure 2 is reproduced by permission from Science by Graham Hill and John Holman(Nelson); Figures 3, 5 and 7 supplied by CEGB: Figure 4 supplied by the United Kingdom Atomic Energy Authority. .

SATIS No. 601 Electricity on Demand 1
ELECTRICITY ON DEMAND
Part 1 Generating electricityWhen you turn an electric switch, you expet!t an instant supply ofelectricity, at a constant voltage. You also expect the electricity tobe cheap.
The Central Electricity Generating Board (CEGB) has the job ofgenerating electricity in England and Wales. The CEGB is split upinto r,egions (Figure 1). In this unit we will be concerned with theNorth West Region.
Electricity comes from a mix of different types of power station. Inthe North West Region, these are:
NuclearCoalOilHydro-electricPumped storage.
Electricity supply and the National GridAll Britain's power stations are linked into the National Grid(Figure 2). This is a network of power lines that feeds electricity toall parts. of the country. Electricity is moved around at400 000 volts, 275 000 volts and 132 000 volts. It is transformedto lower voltages for use by the consumer.
Figure 1 Regions oj the CEGB
gridsystem
132000V
transformer
or400000v
275000V
supergrid systemtransformerpower station(boilers,' turbines,alternators andcooling towers)
schools
240Vshops
240V
homes
240V
transformersubstation
transformer'substation
transformersubstation
Figure 2 The National Grid
8 9 10 II 12TIME (hours) am pm
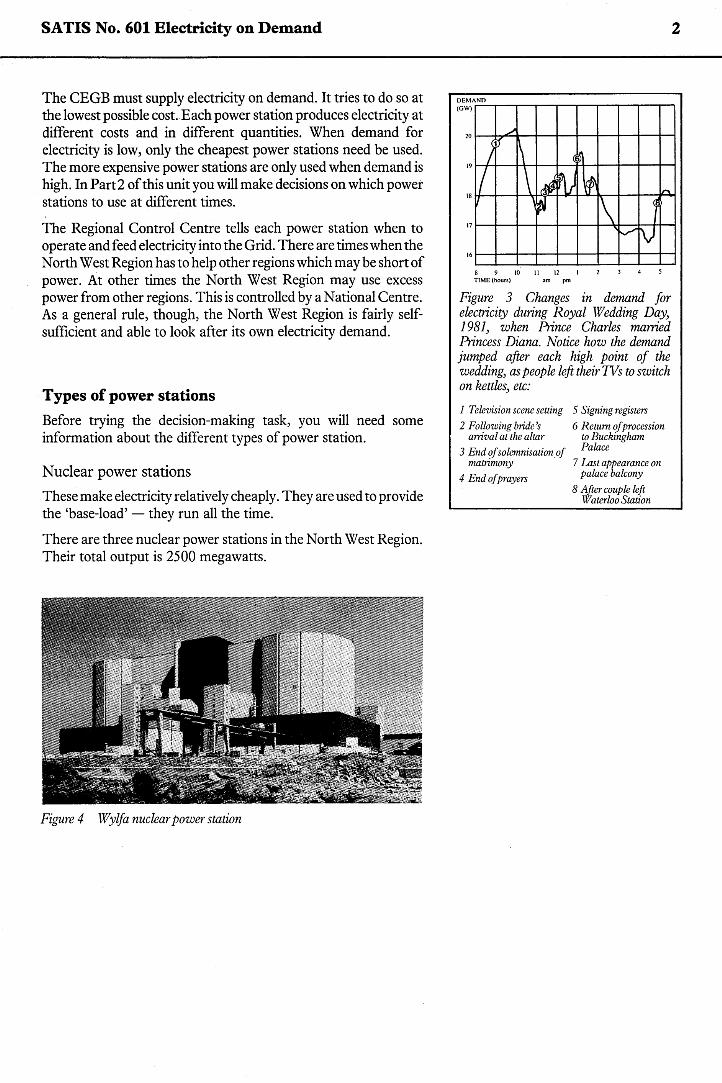
Figure 3 Changes in demand forelectricity during Royal Wedding Day,1981, when Prince Charles marriedPrincess Diana. Notice how the demandjumped after each high point of thewedding, aspeople lRfttheir TVs to switchon kettles, etc:
SATIS No. 601 Electricity on Demand
The CEGB must supply electricity on demand. It tries to do so atthe lowest possible cost. Each power station produces electricity atdifferent costs and in different quantities. When demand forelectricity is low, only the cheapest power stations need be used.The more expensive power stations are only used when demand ishigh. In Part 2 of this unit you will make decisions on which powerstations to use at different times.
The Regional Control Centre tells each power station when tooperate and feed electricity into the Grid. There are times when theNorth West Region has to help other regions which may be short ofpower. At other times the North West Region may use excesspower from other regions. This is controlled by a National Centre.As a general rule, though, the North West Region is fairly self-sufficient and able to look after its own electricity demand.
Types of power stationsBefore trying the decision-making task, you will need someinformation about the different types of power station.
Nuclear power stations
These make electricity relatively cheaply. They are used to providethe 'base-load' - they run all the time.
There are three nuclear power stations in the North West Region.Their total output is 2500 megawatts.
Figure 4 Wlylfa nuclear power station
1 Television scene seuing2 Following bride's
amval at the altar3 End of solemnisation of
matrimony .4 End of prayers
5 Signing registers6 Return of procession
to BuckinghamPalace
7 Last appearance onpalace balcony
8 After couple leftWaterloo Station
2
SATIS No. 601 Electricity on Demand
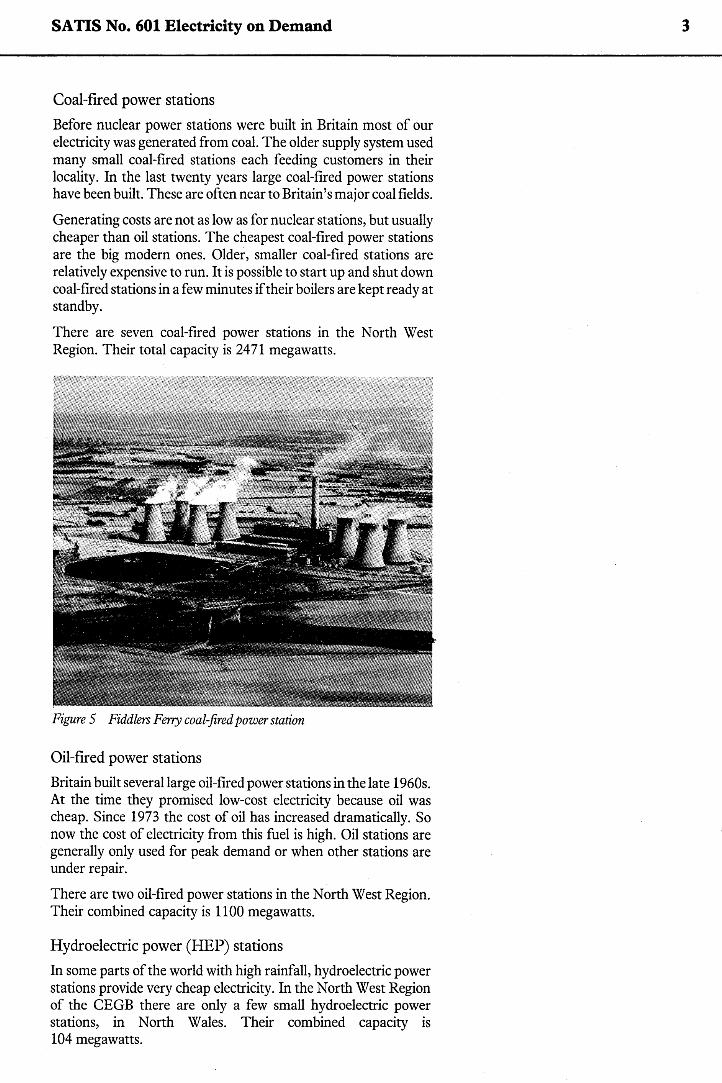
Coal-fired power stations
Before nuclear power stations were built in Britain most of ourelectricity was generated from coal. The older supply system usedmany small coal-fired stations each feeding customers in theirlocality. In the last twenty years large coal-fired power stationshave been built. These are often near to Britain's major coal fields.
Generating costs are not as low as for nuclear stations, but usuallycheaper than oil stations. The cheapest coal-fired power stationsare the big modern ones. Older, smaller coal-fired stations arerelatively expensive to run. It is possible to start up and shut downcoal-fired stations in a few minutes if their boilers are kept ready atstandby.
There are seven coal-fired power stations in the North WestRegion. Their total capacity is 2471 megawatts.
Figure 5 Fiddlers Ferry coal-fired power station
Oil-fired power stations
Britain built several large oil-fired power stations in the late 1960s.At the time they promised low-cost electricity because oil wascheap. Since 1973 the cost of oil has increased dramatically. Sonow the cost of electricity from this fuel is high. Oil stations aregenerally only used for peak demand or when other stations areunder repair.
There are two oil-fired power stations in the North West Region.Their combined capacity is 1100 megawatts.
Hydroelectric power (REP) stations
In some parts of the world with high rainfall, hydroelectric powerstations provide very cheap electricity. In the North West Regionof the CEGB there are only a few small hydroelectric powerstations, in North Wales. Their combined capacity is104 megawatts.
3

,SATIS No. 601 Electricity on Demand
Pumped storage
The North West Region has two pumped-storage schemeswhich "are the envy of the rest of the world. They provide a way ofstoring electrical energy when demand is low, ready to use whendemand is high.
Figure 6 illustrates how the scheme works.
TOPRESERVOIR
4
generator+
electric pump
electricity~used
electricity~generated
1 LOW DEMAND Surplus electricityused to pump water to top reservoir
2 HIGH DEMAND Water in top reservoirruns to bottom, generating HEP
Figure 6 Pumped storage
At low demand times, there is spare electricity from other powerstations. This is usually during the night. This electrical energy isused to pump water to the top reservoir. In this way energy is storedas gravitational potential energy. When demand is high, extraelectricity is needed. The potential energy is converted back toelectrical energy by allowing the water to flow back down, drivingthe generators.
There are two pumped-storage stations in the North West Region,both in the mountains of Snowdonia. The bigger of the two is atDinorWig. The top reservoir at Dinorwig takes 5 to 6 hours to fill.When it is full, Dinorwig can generate 1800 megawatts for up to5 hours. The combined capacity of the two pumped-storagestations is 2160 megawatts.
Figure 7 Dinorwig pumped-storage station - the bottom reservoir

SATIS No. 601 Electricity on Demand 5
Details of power stations in the North West RegionTable 1 gives information about all the stations.
Table 1 Power stations in the North West Region
Name ofpower station Type Nonnaloutput Fuel costper/megawatts megawatt-hour
Heysham 1 .Nuclear 1320 £7.50Trawsfynydd Nuclear 380 £7.50Wylfa Nuclear 800 £7.50
Agecroft Coal 215 ,. £18.50Bold Coal 160 £21.00Carrington Coal 230 £21.00Fiddlers Ferry Coal 1700 £20.00Huncoat Coal 80 £2f~00Roosecote Coal 60 £27.00Westwood Coal 26 £27.00
Ince B Oil 1000 £26.00Padiham Oil/Coal 100 £26.00
CwmDyli Hydro 5 nilDolgarrog Hydro 25 nilMaentwrog Hydro 24 nilRheidol Hydro 50 nil
Dinorwig Hydro/Pumped-storage 1800 nil*Ffestiniog Hydro/Pumped-storage 360 nil*
* For the pumped-storage stations, fuel costs are. nil when generating. When pumping water up, fuel costsdepend on which other power stations are running.
The location of these power stations is shown on the map in Figure 8.
KEY@] Coal-fired
[E] Nuclear
[Q] Oil-fired
[E] Hydro
~ Pumped Storage,
II,,----
"'\,\
,
[E] Heysham:,
[Q] P~adiham@] Hun~oat
Westwood "@] • MANCHESTER
Bold @] [9 AgecroftfCl @J Carrington .~ Fiddlers Ferry'"
[Q] Ince ,,:,
,,'
Roosecote@]
LIVERPOOLWylfa
~ [ill Doigarrog
Dinorwig [§] ffi] Cwm Dyli
~ Ffestiniog
[illMaentwrog
[E] Trawsfynydd ,/I,,'-;,......
Rheidol ,/ ..
[ill/"Figure 8 Power stations in North- West Region

SATIS No. 601 Electricity on Demand
Part 2 Task: Deciding <which powerstations to useIt is best to work on this task in pairs.
Imagine you are engineers in the Regional Control Centre. Yourjob is to make sure enough electricity is generated, at the lowestpossible cost.
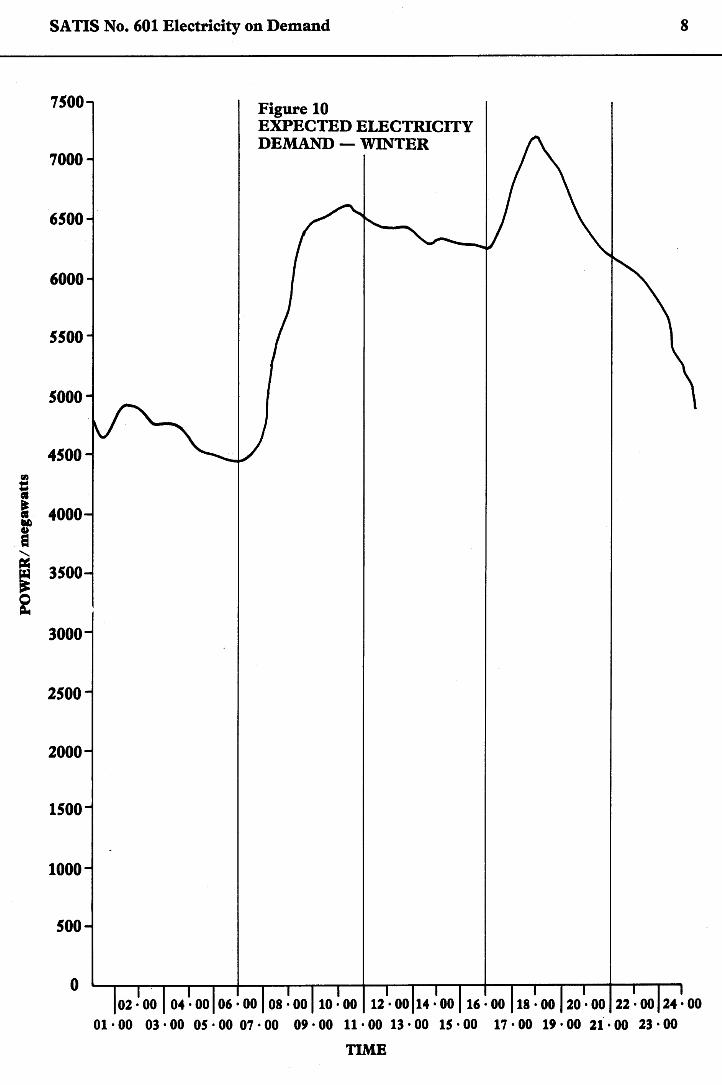
Look at the graphs in Figures 9 and 10 on the next two pages. Theyshow the expected demand for electricity at different times of day.Figure 9 is for a typical summer day, and Figure 10 is for a typicalwinter day.
Your task is to plan which power stations to use during eachfive-hour period. You must choose your power stations to givethe lowest cost electricity. At any time you must have a slightsurplus over the expected demand. Do the task for the summerfirst, then for winter.
In Figure 11 an example has been done for you to show the idea.
Figure 12 has blocks to represent the capacities of the differentpower stations. The blocks are drawn to the same scale as thedemand graphs. You can cut out the blocks and place them on thegraphs to help with your planning. When you have planned eachperiod, write in the power stations on the graph.
Remember to use the pumped-storage stations. When demand islow, you can use surplus electricity to store energy in them. Youcan then use this stored energy at high demand times.
6

SATIS No. 601 Electricity on Demand
7500
7000
6500
6000
5500
7
Figure 9EXPECTED ELECTRICITYDEMAND - SUMMER
3500
5000
4500iI 4000i
I3000
2500
2000
1500
1000
500
o
TIME
SATIS No. 601 Electricity on Demand 8
7500
7000
6500
6000
5500
5000
4500(I)
iI 4000M)u.s
.•••..•..
" 3500;~
3000
2500
2000
1500
1000
500
o
Figure 10EXPECTED ELECTRICITYDEMAND - WINTER
TIMB

SATIS No. 601 Electricity on Demand
7500
7000
6500
6000
5500
9
Figure. 11EXPECTED ELECTRICITYDEMAND - SUMMER
5000
4500
3000
::2500
2000
1500
1000
500
o
SURPLUSUSED FORPUMPEDSTORAGE
li!I!!!l!!!!!!!!!!!!!!!!i!i:~: FERRY :~:~~:~ 1700 MW Coal ~:~:
jl jj l ~IIIl1111:1:1:1:1:::::::1:1::::1:1::: iii iIiI~AGECROFT215 MWCoal
TRA WSFYNYDD380 MW Nuclear
WYLFA800 MW Nuclear
HEY SHAM 11320 MW Nuclear
11· 00 13· 00 15· 00 17 · 00 '19· 00 21· 00 23· 00
TIME

SATIS No. 601 Electricity on Demand
Figure 12 Scale blocks to representpower station capacities. Cut them out to help you with the Task.
NUCLEAR
HEYSHAM 11320MWNuclear WYLFA
800 MW NuclearTRA WSFYNYDD380 MW Nuclear
COALI BOLD 160 MW Coal I WESTWOOD
26 MWCoal
FIDDLERSFERRY ROOSECOTE1700MW
AGECROFT60 MW Coal215 MWCoal
Coal
HUNCOATCARRINGTON 80 MW Coal230 MWCoal
OIL
INCEB1000 MW Oil
PADIHAM100MWOil
10
HYDRO
CWMDYLIDOLGARROGMAENTWROGRHEIDOLCOMBINED
104 MW Hy._dr_o _
PUMPED STORAGE
DINORWIG1800MWPumpedStorage
FFESTINIOG360 MW P. Storage
Related Documents