education sciences Article Predicting Learning Outcomes with MOOC Clickstreams Chen-Hsiang Yu 1, *, Jungpin Wu 2 and An-Chi Liu 1 1 Department of Information Engineering and Computer Science, Feng Chia University, Taichung 40724, Taiwan; [email protected] 2 Department. of Statistics, Feng Chia University, Taichung 40724, Taiwan; [email protected] * Correspondence: [email protected] Received: 6 March 2019; Accepted: 7 May 2019; Published: 14 May 2019 Abstract: Massive Open Online Courses (MOOCs) have gradually become a dominant trend in education. Since 2014, the Ministry of Education in Taiwan has been promoting MOOC programs, with successful results. The ability of students to work at their own pace, however, is associated with low MOOC completion rates and has recently become a focus. The development of a mechanism to effectively improve course completion rates continues to be of great interest to both teachers and researchers. This study established a series of learning behaviors using the video clickstream records of students, through a MOOC platform, to identify seven types of cognitive participation models of learners. We subsequently built practical machine learning models by using K-nearest neighbor (KNN), support vector machines (SVM), and artificial neural network (ANN) algorithms to predict students’ learning outcomes via their learning behaviors. The ANN machine learning method had the highest prediction accuracy. Based on the prediction results, we saw a correlation between video viewing behavior and learning outcomes. This could allow teachers to help students needing extra support successfully pass the course. To further improve our method, we classified the course videos based on their content. There were three video categories: theoretical, experimental, and analytic. Different prediction models were built for each of these three video types and their combinations. We performed the accuracy verification; our experimental results showed that we could use only theoretical and experimental video data, instead of all three types of data, to generate prediction models without significant differences in prediction accuracy. In addition to data reduction in model generation, this could help teachers evaluate the effectiveness of course videos. Keywords: learning and teaching; MOOCs; clickstream; behavior pattern; machine learning; N-gram 1. Introduction The rapid development of information technology has had a huge influence on education, and the application of the technology to maximize learning outcomes has always been a topic of discussion among scholars. Massive Open Online Courses (MOOCs) [1] have aroused interest in educational circles and, currently, there are many mature MOOC learning platforms, including the US’ Coursera [2], Udacity, edX [3], Australia’s Open2Study, and the UK’s Futurelearn. MOOC refers to the establishment of learning communities through unrestricted participation and readily available online courses. Its characteristics include open sharing, expandability, open authorization of content, open architecture, and learning objectives. Some students are easily distracted in traditional classrooms, which leads to a lot of time spent on review and homework after returning home. MOOCs are different from traditionally taught courses in that students can play back content if they do not understand the course. MOOCs provide online peer assistance for learners and opportunities to interact online with course teachers [4]. Compared with Educ. Sci. 2019, 9, 104; doi:10.3390/educsci9020104 www.mdpi.com/journal/education

Welcome message from author
This document is posted to help you gain knowledge. Please leave a comment to let me know what you think about it! Share it to your friends and learn new things together.
Transcript
education sciences
Article
Predicting Learning Outcomes withMOOC Clickstreams
Chen-Hsiang Yu 1,*, Jungpin Wu 2 and An-Chi Liu 1
1 Department of Information Engineering and Computer Science, Feng Chia University, Taichung 40724,Taiwan; [email protected]
2 Department. of Statistics, Feng Chia University, Taichung 40724, Taiwan; [email protected]* Correspondence: [email protected]
Received: 6 March 2019; Accepted: 7 May 2019; Published: 14 May 2019�����������������
Abstract: Massive Open Online Courses (MOOCs) have gradually become a dominant trend ineducation. Since 2014, the Ministry of Education in Taiwan has been promoting MOOC programs,with successful results. The ability of students to work at their own pace, however, is associated withlow MOOC completion rates and has recently become a focus. The development of a mechanismto effectively improve course completion rates continues to be of great interest to both teachers andresearchers. This study established a series of learning behaviors using the video clickstream recordsof students, through a MOOC platform, to identify seven types of cognitive participation modelsof learners. We subsequently built practical machine learning models by using K-nearest neighbor(KNN), support vector machines (SVM), and artificial neural network (ANN) algorithms to predictstudents’ learning outcomes via their learning behaviors. The ANN machine learning method hadthe highest prediction accuracy. Based on the prediction results, we saw a correlation between videoviewing behavior and learning outcomes. This could allow teachers to help students needing extrasupport successfully pass the course. To further improve our method, we classified the course videosbased on their content. There were three video categories: theoretical, experimental, and analytic.Different prediction models were built for each of these three video types and their combinations.We performed the accuracy verification; our experimental results showed that we could use onlytheoretical and experimental video data, instead of all three types of data, to generate predictionmodels without significant differences in prediction accuracy. In addition to data reduction in modelgeneration, this could help teachers evaluate the effectiveness of course videos.
Keywords: learning and teaching; MOOCs; clickstream; behavior pattern; machine learning; N-gram
1. Introduction
The rapid development of information technology has had a huge influence on education, andthe application of the technology to maximize learning outcomes has always been a topic of discussionamong scholars. Massive Open Online Courses (MOOCs) [1] have aroused interest in educationalcircles and, currently, there are many mature MOOC learning platforms, including the US’ Coursera [2],Udacity, edX [3], Australia’s Open2Study, and the UK’s Futurelearn. MOOC refers to the establishmentof learning communities through unrestricted participation and readily available online courses.Its characteristics include open sharing, expandability, open authorization of content, open architecture,and learning objectives.
Some students are easily distracted in traditional classrooms, which leads to a lot of time spent onreview and homework after returning home. MOOCs are different from traditionally taught courses inthat students can play back content if they do not understand the course. MOOCs provide online peerassistance for learners and opportunities to interact online with course teachers [4]. Compared with
Educ. Sci. 2019, 9, 104; doi:10.3390/educsci9020104 www.mdpi.com/journal/education
Educ. Sci. 2019, 9, 104 2 of 15
the previous form of online education, MOOCs are closer to personalized learning—there is no teachersupervision, no entry threshold, and no need to pay expensive fees. MOOCs facilitate self-regulatedand individualized learning in order to enable learners to achieve better learning results. Many studiesare now focusing on analyzing the learning history records left by users of MOOCs [5] in order topredict students’ possible achievements through analytical methods [6] and to provide early guidanceto students who need help.
MOOC courses are mainly based on video viewing and quizzes, which take the majority of thelearners’ time. Many problems have been gradually found. First, many students neither continue toparticipate in learning after enrolling in a course nor meet the standards for passing the course afterthe course ends. This behavior of students not completing the courses [7] prompts the question of howto stimulate the completion rate, which is a problem that every MOOC platform wants to solve [8].One reason for the low completion rates may be the students’ own problems, and some students mayneed more proper supervision [9]. It may also be a problem with the video material, which may needto be adjusted or supplemented. There is no clear answer at present, thus, stimulating the completionrate is a major challenge for MOOCs [10,11].
Moreover, as the number of students taking MOOCs is much higher than that of traditionalcourses, it is difficult for teachers to cater to each student’s personal learning situation. At present,the simplest way is to engage more teaching assistants to solve the learning problems of the manystudents. However, as the number of students continues to increase, this is obviously not cost-effective.Therefore, helping students with poor participation rates and low motivation is an important issue.
The nature of this type of course is different. The style of the course videos depends on the teachers’preference and the feasibility, or on the institutional guidelines other than structured theory [12].Moreover, there are significant characteristics that can be adapted, with respect to learners passing orfailing a course, if the course videos are properly classified by their nature [13].
This study used the course materials on the OpenEdu platform, which is a MOOC platform basedon the edX open-source program. Because the platform provides a complete teaching environment,including course details and learning history records, we learned about the behavior patterns ofstudents by browsing videos and processing and analyzing the collected data. We also classified thecourse videos and provided possible links between video viewing behaviors and learning outcomesthrough analysis of a combination of different video types. In our research, we used the videoclickstream behavioral actions of the first two semesters of a course to normalize the clickstream featuresequences and build learning outcome prediction models based on the selected feature set. We thendivided the videos into different types and used machine learning to establish the accuracy of eachindividual type and different combinations. A 2 × 2 contingency table was used to test and analyzethe prediction accuracy. Then, the data of the third semester for the same course was used to makepredictions with the best overall prediction model. In addition, we identified which type of videomost affected whether students passed the course and will make this available to the instructors forreference. This will enable teachers to implement timely counseling measures for students with poorlearning results.
2. Related Research
The experimental environment of this study adapts the OpenEdu platform, as established bythe Chinese Open Education Consortium [14] and based on edX open source software. The platformaims to continuously promote open courses, increase the level of influence of teaching innovation,follow the development trend of international digital learning, and narrow the gap between urbanand rural areas, thus ensuring equal rights to education. To this end, the Chinese Open EducationConsortium has joined many schools and institutions interested in developing MOOCs—includingthe organization’s fundraising and human operations—by providing construction guidance, teachingplatform maintenance, promotion, and other services through the construction of the alliance system.
Educ. Sci. 2019, 9, 104 3 of 15
In their discussions of the low completion rate of the MOOCs course, the researchers analyzed thelearners’ video viewing, scores [15], and forum behavior records [16]. In Anderson [17], the students’activity behavior patterns were divided into five types: Viewers, Solvers, All-rounders, Collectors,and Bystanders. In Rebecca [18], the students’ activity behavior patterns were divided into seventypes: Samplers, Strong Starters, Returners, Mid-way Dropouts, Nearly There, Late Completers, andKeen Completers. In Khalil [19], the students’ activity behavior patterns were divided into four types:Dropout, Perfect Students, Gaming the System, and Social. In Sinha [20], a cognitive video watchingmodel was applied to explain the dynamic process of cognition involved in MOOC video clickstreaminteraction. The students’ activity behavior patterns were divided into seven types: Rewatch, Skipping,Fast Watching, Slow Watching, Clear Concept, Checkback Reference, and Playrate Transition. Thepurpose of the above discussion is to improve students’ participation in learning, to help solve theproblem of the low course completion rate.
N-gram [21] is easy to access with a rapid calculation and without any complicated algorithm.Therefore, such a method is used in natural language processing to increase calculation efficiency.Articles or sentences are segmented into many small parts when applying the N-gram method, andonly a few parts will be affected in the case of an error in an article or a sentence. As such, the N-grammethod provides a good error-tolerant rate in natural language processing, can be applied in correctingwrongly written or misspelled characters, and is often applied in calculating the similarity betweendifferent articles and sentences or retrieval of texts. Articles or sentences are segmented into manysmall parts, such that many text combinations of different lengths are also produced if a corpus withsmall data volume is used. Identical sentences in an article can be segmented into text combinations ofdifferent lengths to achieve the effect of multi-segmentation and to obtain more text combinations [22].In addition, N-gram extraction methods consist of N-gram by character and N-gram by term.
Machine learning is to classify collected data or train a prediction model through an algorithm, andwhen new data is obtained in the future, it can be predicted through the trained model. Machine learningtechniques such as Naive Bayes, Random Forest, Decision Tree, and SVM (Support Vector Machine)can be used to predict the performance of students, which can help instructors to improve their coursedesign accordingly [23]. Dropout prediction used machine learning of SVM, Logistics Regression,Random Forest, and Gradient Boosting Decision Tree to make dropout predictions [7]. Two types ofneural network, Feedforward Neural Network (FFNN) and Self-Organised Map (SOM), were employedto predict if learners would receive certifications at the end of the course [24]. The machine learningdata is composed of feature data and real categories in the process of model training. For example, thefirst algorithm of KNN (K-Nearest Neighbor) in this study is generally used to classify data, whereK represents a constant, and KNN takes the K points of the nearest distance to determine to whichcategory the object belongs. The second algorithm of SVM [25] is for supervised learning models,which is often used for pattern recognition, classification, and regression analysis. The third one is anANN (Artificial Neural Network) [26], composed of many neuron nodes, which can be divided into aninput layer, an output layer, and a network model consisting of many hidden layers [27]. The output ofthe result can only be in the two states of yes or no, while the traditional artificial neural network cantrain the model by way of back-propagation, thereby obtaining a neural network model to effectivelysolve the problem.
3. Research Method
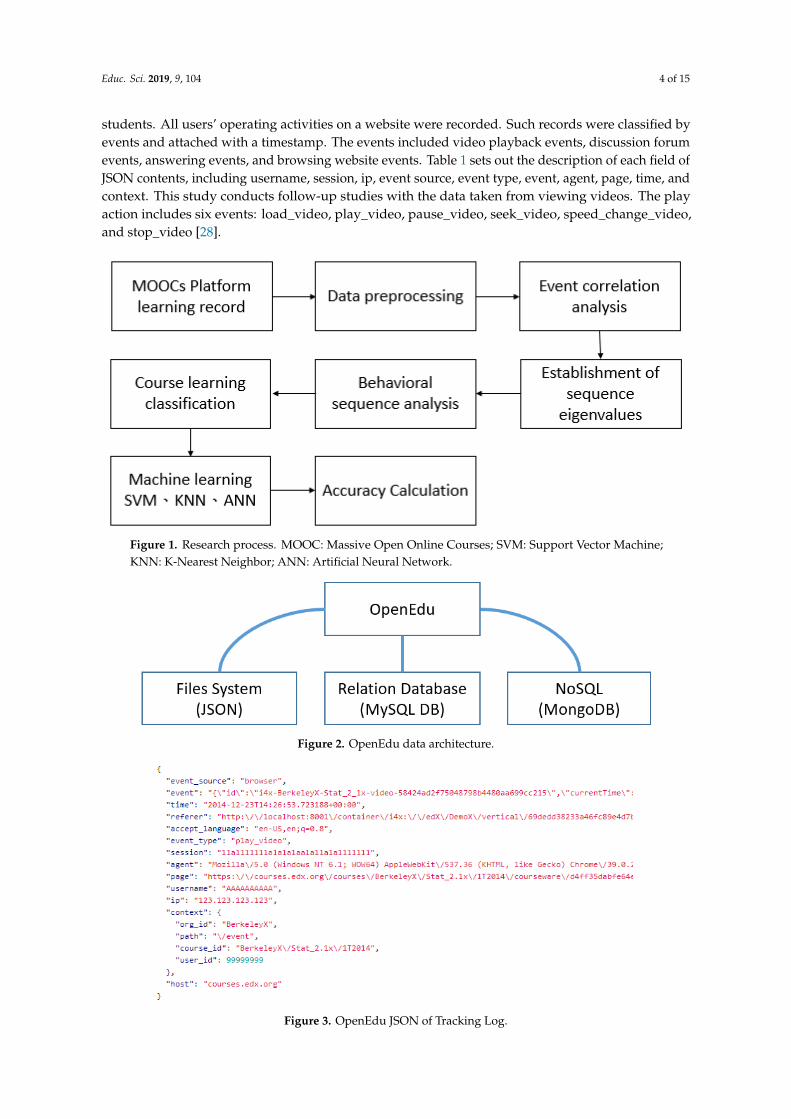
The process of this study is shown in Figure 1. MOOCs platform learning records are OpenEduMOOCs platform data stored in MySQL and MongoDB (Figure 2), while the Tracking Log is storedon the server end in the JSON files format. The contents of the MySQL relational database includeuser profile, course records, course basic data, etc. The contents stored in the MongoDB NoSQLdatabase include course discussion area content, course videos, course exercises, etc. The TrackingLog records the user’s behavior on the website, where the records are distinguished by events andhave a time stamp. Figure 3 shows the record contents in JSON format when videos are played for
Educ. Sci. 2019, 9, 104 4 of 15
students. All users’ operating activities on a website were recorded. Such records were classified byevents and attached with a timestamp. The events included video playback events, discussion forumevents, answering events, and browsing website events. Table 1 sets out the description of each field ofJSON contents, including username, session, ip, event source, event type, event, agent, page, time, andcontext. This study conducts follow-up studies with the data taken from viewing videos. The playaction includes six events: load_video, play_video, pause_video, seek_video, speed_change_video,and stop_video [28].
Educ. Sci. 2019, 9, x FOR PEER REVIEW 4 of 15
events and attached with a timestamp. The events included video playback events, discussion forum
events, answering events, and browsing website events. Table 1 sets out the description of each field
of JSON contents, including username, session, ip, event source, event type, event, agent, page, time,
and context. This study conducts follow-up studies with the data taken from viewing videos. The
play action includes six events: load_video, play_video, pause_video, seek_video,
speed_change_video, and stop_video [28].
Figure 1. Research process. MOOC: Massive Open Online Courses; SVM: Support Vector Machine;
KNN: K-Nearest Neighbor; ANN: Artificial Neural Network.
Figure 2. OpenEdu data architecture.
Figure 1. Research process. MOOC: Massive Open Online Courses; SVM: Support Vector Machine;KNN: K-Nearest Neighbor; ANN: Artificial Neural Network.
Educ. Sci. 2019, 9, x FOR PEER REVIEW 4 of 15
events and attached with a timestamp. The events included video playback events, discussion forum
events, answering events, and browsing website events. Table 1 sets out the description of each field
of JSON contents, including username, session, ip, event source, event type, event, agent, page, time,
and context. This study conducts follow-up studies with the data taken from viewing videos. The
play action includes six events: load_video, play_video, pause_video, seek_video,
speed_change_video, and stop_video [28].
Figure 1. Research process. MOOC: Massive Open Online Courses; SVM: Support Vector Machine;
KNN: K-Nearest Neighbor; ANN: Artificial Neural Network.
Figure 2. OpenEdu data architecture.
Figure 2. OpenEdu data architecture.Educ. Sci. 2019, 9, x FOR PEER REVIEW 5 of 15
Figure 3. OpenEdu JSON of Tracking Log.
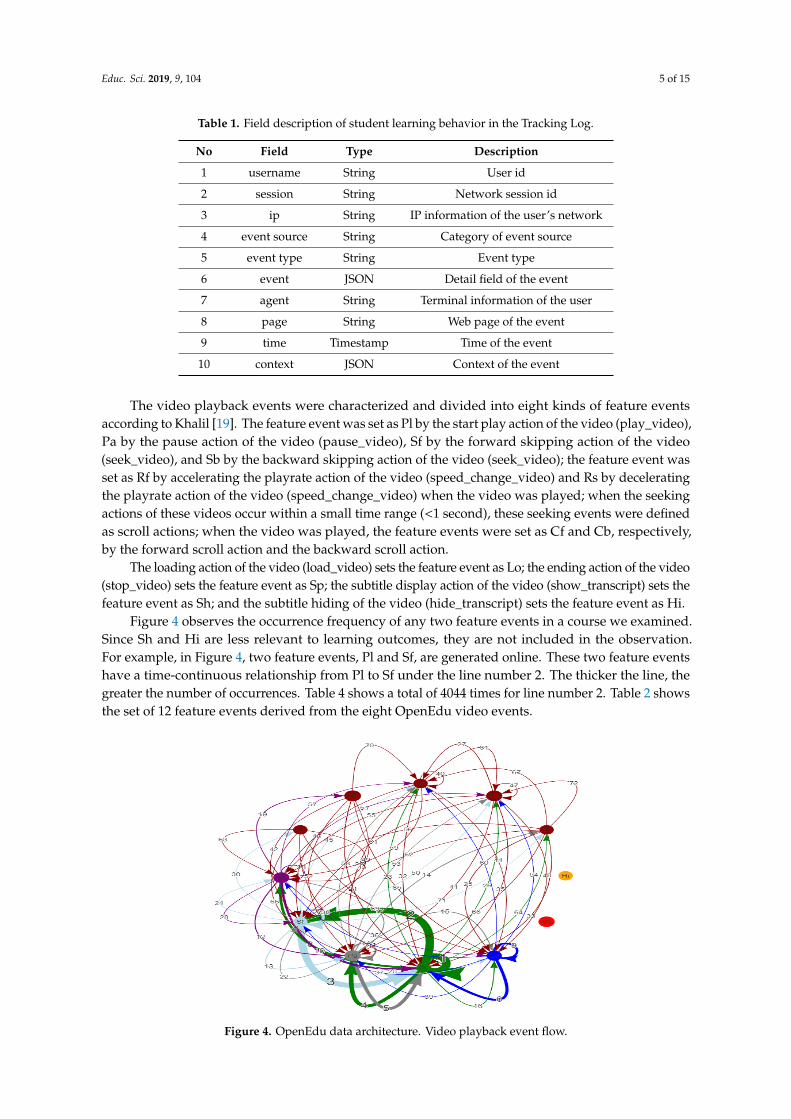
Table 1. Field description of student learning behavior in the Tracking Log.
No Field Type Description
1 username String User id
2 session String Network session id
3 ip String IP information of the user’s network
4 event source String Category of event source
5 event type String Event type
6 event JSON Detail field of the event
7 agent String Terminal information of the user
8 page String Web page of the event
9 time Timestamp Time of the event
10 context JSON Context of the event
The video playback events were characterized and divided into eight kinds of feature events
according to Khalil [19]. The feature event was set as Pl by the start play action of the video
(play_video), Pa by the pause action of the video (pause_video), Sf by the forward skipping action of
the video (seek_video), and Sb by the backward skipping action of the video (seek_video); the
feature event was set as Rf by accelerating the playrate action of the video (speed_change_video)
and Rs by decelerating the playrate action of the video (speed_change_video) when the video was
played; when the seeking actions of these videos occur within a small time range (<1 second), these
seeking events were defined as scroll actions; when the video was played, the feature events were set
as Cf and Cb, respectively, by the forward scroll action and the backward scroll action.
The loading action of the video (load_video) sets the feature event as Lo; the ending action of
the video (stop_video) sets the feature event as Sp; the subtitle display action of the video
(show_transcript) sets the feature event as Sh; and the subtitle hiding of the video (hide_transcript)
sets the feature event as Hi.
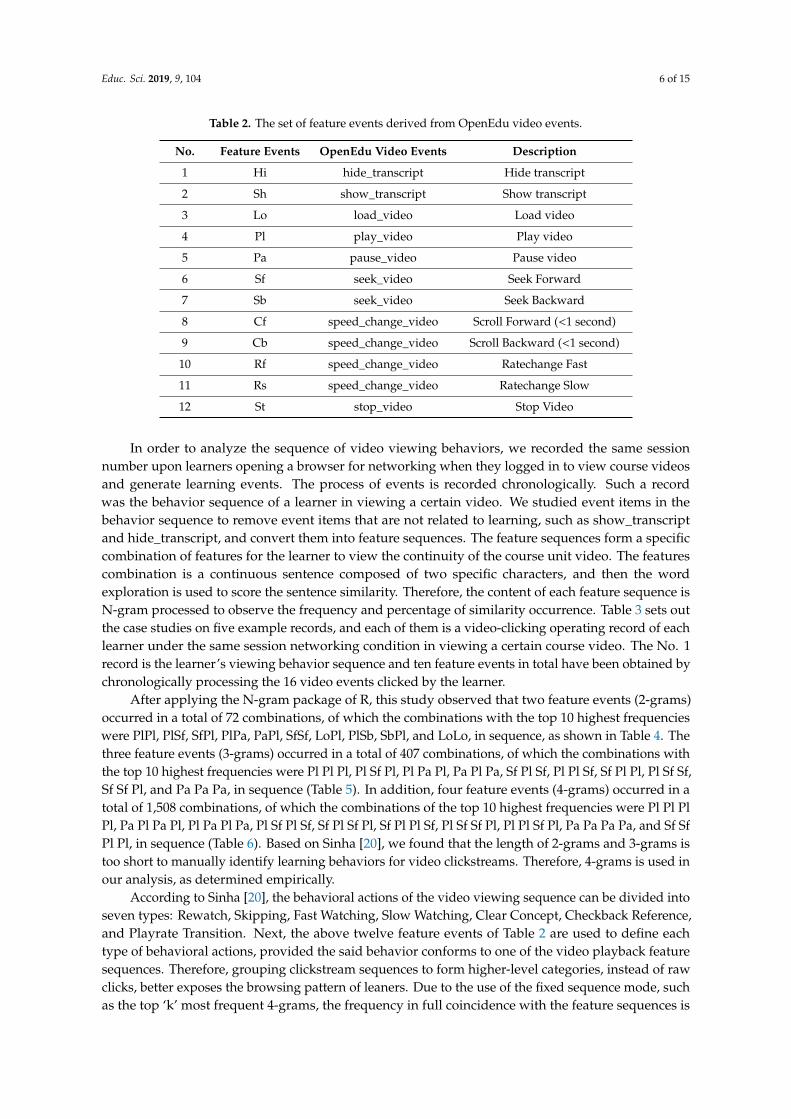
Figure 4 observes the occurrence frequency of any two feature events in a course we examined.
Since Sh and Hi are less relevant to learning outcomes, they are not included in the observation. For
example, in Figure 4, two feature events, Pl and Sf, are generated online. These two feature events
have a time-continuous relationship from Pl to Sf under the line number 2. The thicker the line, the
greater the number of occurrences. Table 4 shows a total of 4,044 times for line number 2. Table 2
shows the set of 12 feature events derived from the eight OpenEdu video events.
Figure 3. OpenEdu JSON of Tracking Log.
Educ. Sci. 2019, 9, 104 5 of 15
Table 1. Field description of student learning behavior in the Tracking Log.
No Field Type Description
1 username String User id
2 session String Network session id
3 ip String IP information of the user’s network
4 event source String Category of event source
5 event type String Event type
6 event JSON Detail field of the event
7 agent String Terminal information of the user
8 page String Web page of the event
9 time Timestamp Time of the event
10 context JSON Context of the event
The video playback events were characterized and divided into eight kinds of feature eventsaccording to Khalil [19]. The feature event was set as Pl by the start play action of the video (play_video),Pa by the pause action of the video (pause_video), Sf by the forward skipping action of the video(seek_video), and Sb by the backward skipping action of the video (seek_video); the feature event wasset as Rf by accelerating the playrate action of the video (speed_change_video) and Rs by deceleratingthe playrate action of the video (speed_change_video) when the video was played; when the seekingactions of these videos occur within a small time range (<1 second), these seeking events were definedas scroll actions; when the video was played, the feature events were set as Cf and Cb, respectively,by the forward scroll action and the backward scroll action.
The loading action of the video (load_video) sets the feature event as Lo; the ending action of the video(stop_video) sets the feature event as Sp; the subtitle display action of the video (show_transcript) sets thefeature event as Sh; and the subtitle hiding of the video (hide_transcript) sets the feature event as Hi.
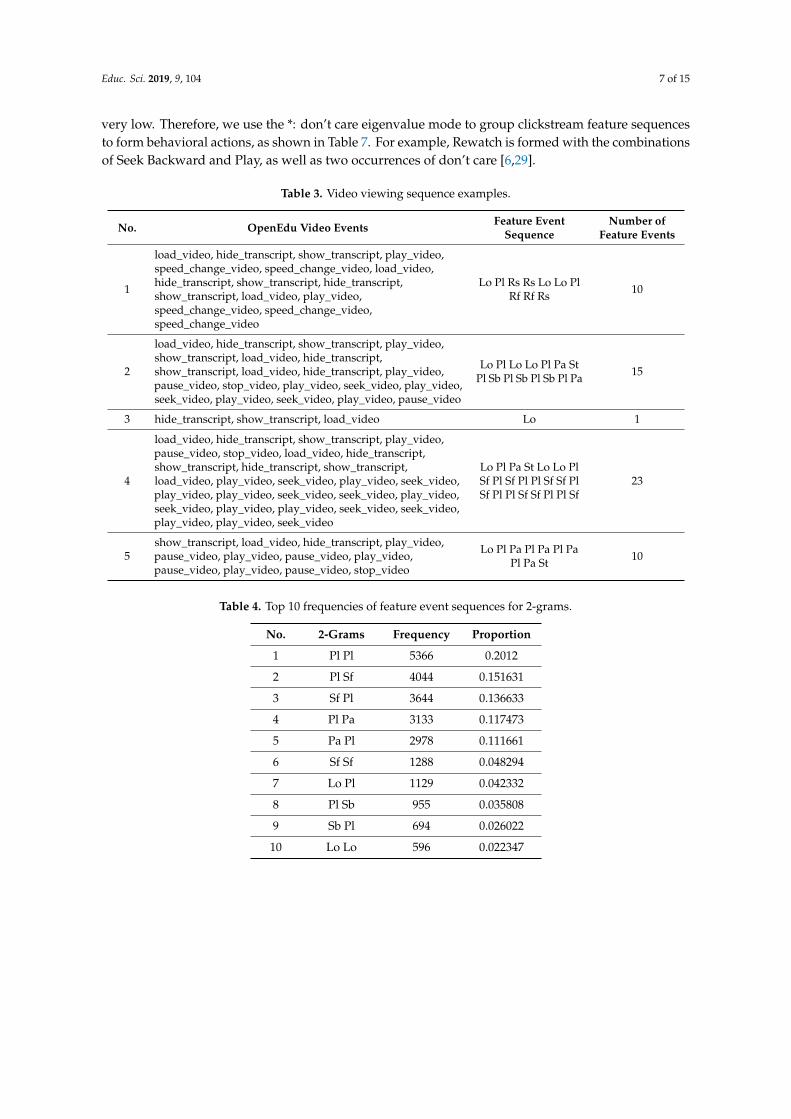
Figure 4 observes the occurrence frequency of any two feature events in a course we examined.Since Sh and Hi are less relevant to learning outcomes, they are not included in the observation.For example, in Figure 4, two feature events, Pl and Sf, are generated online. These two feature eventshave a time-continuous relationship from Pl to Sf under the line number 2. The thicker the line, thegreater the number of occurrences. Table 4 shows a total of 4044 times for line number 2. Table 2 showsthe set of 12 feature events derived from the eight OpenEdu video events.Educ. Sci. 2019, 9, x FOR PEER REVIEW 6 of 15
Figure 4. OpenEdu data architecture. Video playback event flow.
Table 2. The set of feature events derived from OpenEdu video events.
No. Feature events OpenEdu video events Description
1 Hi hide_transcript Hide transcript
2 Sh show_transcript Show transcript
3 Lo load_video Load video
4 Pl play_video Play video
5 Pa pause_video Pause video
6 Sf seek_video Seek Forward
7 Sb seek_video Seek Backward
8 Cf speed_change_video Scroll Forward (<1 second)
9 Cb speed_change_video Scroll Backward (<1 second)
10 Rf speed_change_video Ratechange Fast
11 Rs speed_change_video Ratechange Slow
12 St stop_video Stop Video
In order to analyze the sequence of video viewing behaviors, we recorded the same session
number upon learners opening a browser for networking when they logged in to view course videos
and generate learning events. The process of events is recorded chronologically. Such a record was
the behavior sequence of a learner in viewing a certain video. We studied event items in the behavior
sequence to remove event items that are not related to learning, such as show_transcript and
hide_transcript, and convert them into feature sequences. The feature sequences form a specific
combination of features for the learner to view the continuity of the course unit video. The features
combination is a continuous sentence composed of two specific characters, and then the word
exploration is used to score the sentence similarity. Therefore, the content of each feature sequence is
N-gram processed to observe the frequency and percentage of similarity occurrence. Table 3 sets out
the case studies on five example records, and each of them is a video-clicking operating record of
each learner under the same session networking condition in viewing a certain course video. The
No. 1 record is the learner’s viewing behavior sequence and ten feature events in total have been
obtained by chronologically processing the 16 video events clicked by the learner.
Figure 4. OpenEdu data architecture. Video playback event flow.
Educ. Sci. 2019, 9, 104 6 of 15
Table 2. The set of feature events derived from OpenEdu video events.
No. Feature Events OpenEdu Video Events Description
1 Hi hide_transcript Hide transcript
2 Sh show_transcript Show transcript
3 Lo load_video Load video
4 Pl play_video Play video
5 Pa pause_video Pause video
6 Sf seek_video Seek Forward
7 Sb seek_video Seek Backward
8 Cf speed_change_video Scroll Forward (<1 second)
9 Cb speed_change_video Scroll Backward (<1 second)
10 Rf speed_change_video Ratechange Fast
11 Rs speed_change_video Ratechange Slow
12 St stop_video Stop Video
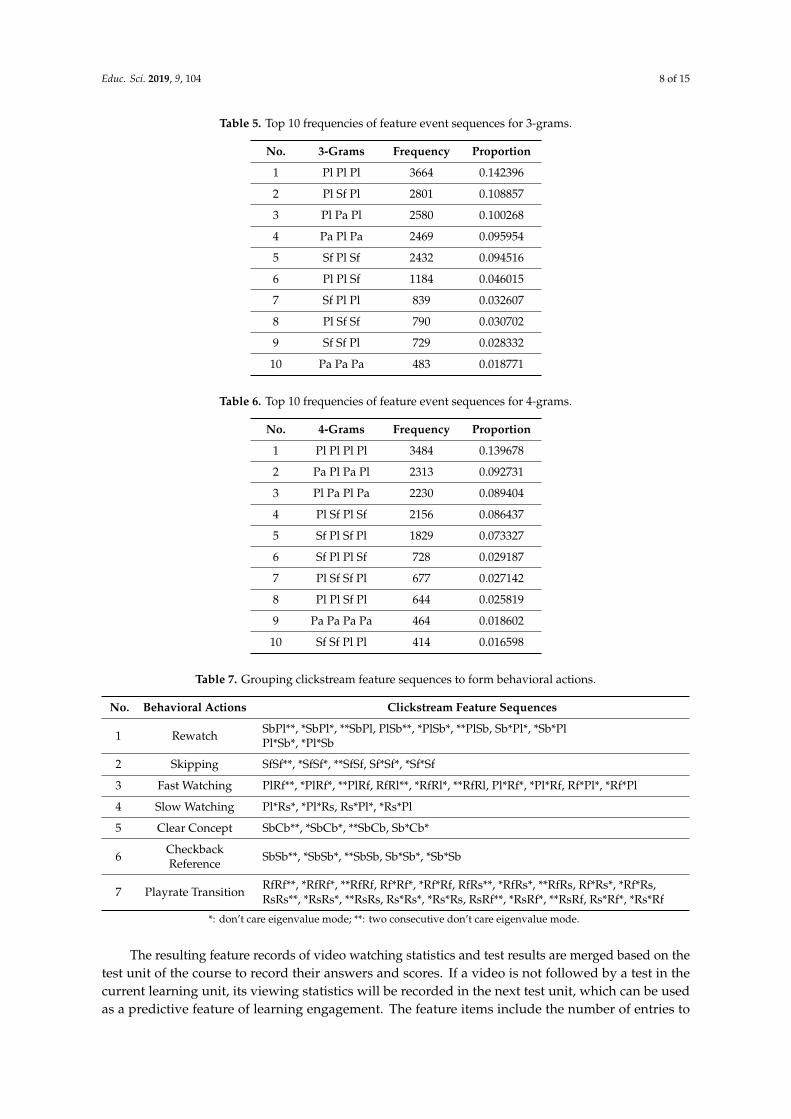
In order to analyze the sequence of video viewing behaviors, we recorded the same sessionnumber upon learners opening a browser for networking when they logged in to view course videosand generate learning events. The process of events is recorded chronologically. Such a recordwas the behavior sequence of a learner in viewing a certain video. We studied event items in thebehavior sequence to remove event items that are not related to learning, such as show_transcriptand hide_transcript, and convert them into feature sequences. The feature sequences form a specificcombination of features for the learner to view the continuity of the course unit video. The featurescombination is a continuous sentence composed of two specific characters, and then the wordexploration is used to score the sentence similarity. Therefore, the content of each feature sequence isN-gram processed to observe the frequency and percentage of similarity occurrence. Table 3 sets outthe case studies on five example records, and each of them is a video-clicking operating record of eachlearner under the same session networking condition in viewing a certain course video. The No. 1record is the learner’s viewing behavior sequence and ten feature events in total have been obtained bychronologically processing the 16 video events clicked by the learner.
After applying the N-gram package of R, this study observed that two feature events (2-grams)occurred in a total of 72 combinations, of which the combinations with the top 10 highest frequencieswere PlPl, PlSf, SfPl, PlPa, PaPl, SfSf, LoPl, PlSb, SbPl, and LoLo, in sequence, as shown in Table 4. Thethree feature events (3-grams) occurred in a total of 407 combinations, of which the combinations withthe top 10 highest frequencies were Pl Pl Pl, Pl Sf Pl, Pl Pa Pl, Pa Pl Pa, Sf Pl Sf, Pl Pl Sf, Sf Pl Pl, Pl Sf Sf,Sf Sf Pl, and Pa Pa Pa, in sequence (Table 5). In addition, four feature events (4-grams) occurred in atotal of 1,508 combinations, of which the combinations of the top 10 highest frequencies were Pl Pl PlPl, Pa Pl Pa Pl, Pl Pa Pl Pa, Pl Sf Pl Sf, Sf Pl Sf Pl, Sf Pl Pl Sf, Pl Sf Sf Pl, Pl Pl Sf Pl, Pa Pa Pa Pa, and Sf SfPl Pl, in sequence (Table 6). Based on Sinha [20], we found that the length of 2-grams and 3-grams istoo short to manually identify learning behaviors for video clickstreams. Therefore, 4-grams is used inour analysis, as determined empirically.
According to Sinha [20], the behavioral actions of the video viewing sequence can be divided intoseven types: Rewatch, Skipping, Fast Watching, Slow Watching, Clear Concept, Checkback Reference,and Playrate Transition. Next, the above twelve feature events of Table 2 are used to define eachtype of behavioral actions, provided the said behavior conforms to one of the video playback featuresequences. Therefore, grouping clickstream sequences to form higher-level categories, instead of rawclicks, better exposes the browsing pattern of leaners. Due to the use of the fixed sequence mode, suchas the top ‘k’ most frequent 4-grams, the frequency in full coincidence with the feature sequences is
Educ. Sci. 2019, 9, 104 7 of 15
very low. Therefore, we use the *: don’t care eigenvalue mode to group clickstream feature sequencesto form behavioral actions, as shown in Table 7. For example, Rewatch is formed with the combinationsof Seek Backward and Play, as well as two occurrences of don’t care [6,29].
Table 3. Video viewing sequence examples.
No. OpenEdu Video Events Feature EventSequence
Number ofFeature Events
1
load_video, hide_transcript, show_transcript, play_video,speed_change_video, speed_change_video, load_video,hide_transcript, show_transcript, hide_transcript,show_transcript, load_video, play_video,speed_change_video, speed_change_video,speed_change_video
Lo Pl Rs Rs Lo Lo PlRf Rf Rs 10
2
load_video, hide_transcript, show_transcript, play_video,show_transcript, load_video, hide_transcript,show_transcript, load_video, hide_transcript, play_video,pause_video, stop_video, play_video, seek_video, play_video,seek_video, play_video, seek_video, play_video, pause_video
Lo Pl Lo Lo Pl Pa StPl Sb Pl Sb Pl Sb Pl Pa 15
3 hide_transcript, show_transcript, load_video Lo 1
4
load_video, hide_transcript, show_transcript, play_video,pause_video, stop_video, load_video, hide_transcript,show_transcript, hide_transcript, show_transcript,load_video, play_video, seek_video, play_video, seek_video,play_video, play_video, seek_video, seek_video, play_video,seek_video, play_video, play_video, seek_video, seek_video,play_video, play_video, seek_video
Lo Pl Pa St Lo Lo PlSf Pl Sf Pl Pl Sf Sf PlSf Pl Pl Sf Sf Pl Pl Sf
23
5show_transcript, load_video, hide_transcript, play_video,pause_video, play_video, pause_video, play_video,pause_video, play_video, pause_video, stop_video
Lo Pl Pa Pl Pa Pl PaPl Pa St 10
Table 4. Top 10 frequencies of feature event sequences for 2-grams.
No. 2-Grams Frequency Proportion
1 Pl Pl 5366 0.2012
2 Pl Sf 4044 0.151631
3 Sf Pl 3644 0.136633
4 Pl Pa 3133 0.117473
5 Pa Pl 2978 0.111661
6 Sf Sf 1288 0.048294
7 Lo Pl 1129 0.042332
8 Pl Sb 955 0.035808
9 Sb Pl 694 0.026022
10 Lo Lo 596 0.022347
Educ. Sci. 2019, 9, 104 8 of 15
Table 5. Top 10 frequencies of feature event sequences for 3-grams.
No. 3-Grams Frequency Proportion
1 Pl Pl Pl 3664 0.142396
2 Pl Sf Pl 2801 0.108857
3 Pl Pa Pl 2580 0.100268
4 Pa Pl Pa 2469 0.095954
5 Sf Pl Sf 2432 0.094516
6 Pl Pl Sf 1184 0.046015
7 Sf Pl Pl 839 0.032607
8 Pl Sf Sf 790 0.030702
9 Sf Sf Pl 729 0.028332
10 Pa Pa Pa 483 0.018771
Table 6. Top 10 frequencies of feature event sequences for 4-grams.
No. 4-Grams Frequency Proportion
1 Pl Pl Pl Pl 3484 0.139678
2 Pa Pl Pa Pl 2313 0.092731
3 Pl Pa Pl Pa 2230 0.089404
4 Pl Sf Pl Sf 2156 0.086437
5 Sf Pl Sf Pl 1829 0.073327
6 Sf Pl Pl Sf 728 0.029187
7 Pl Sf Sf Pl 677 0.027142
8 Pl Pl Sf Pl 644 0.025819
9 Pa Pa Pa Pa 464 0.018602
10 Sf Sf Pl Pl 414 0.016598
Table 7. Grouping clickstream feature sequences to form behavioral actions.
No. Behavioral Actions Clickstream Feature Sequences
1 Rewatch SbPl**, *SbPl*, **SbPl, PlSb**, *PlSb*, **PlSb, Sb*Pl*, *Sb*PlPl*Sb*, *Pl*Sb
2 Skipping SfSf**, *SfSf*, **SfSf, Sf*Sf*, *Sf*Sf
3 Fast Watching PlRf**, *PlRf*, **PlRf, RfRl**, *RfRl*, **RfRl, Pl*Rf*, *Pl*Rf, Rf*Pl*, *Rf*Pl
4 Slow Watching Pl*Rs*, *Pl*Rs, Rs*Pl*, *Rs*Pl
5 Clear Concept SbCb**, *SbCb*, **SbCb, Sb*Cb*
6 CheckbackReference SbSb**, *SbSb*, **SbSb, Sb*Sb*, *Sb*Sb
7 Playrate Transition RfRf**, *RfRf*, **RfRf, Rf*Rf*, *Rf*Rf, RfRs**, *RfRs*, **RfRs, Rf*Rs*, *Rf*Rs,RsRs**, *RsRs*, **RsRs, Rs*Rs*, *Rs*Rs, RsRf**, *RsRf*, **RsRf, Rs*Rf*, *Rs*Rf
*: don’t care eigenvalue mode; **: two consecutive don’t care eigenvalue mode.
The resulting feature records of video watching statistics and test results are merged based on thetest unit of the course to record their answers and scores. If a video is not followed by a test in thecurrent learning unit, its viewing statistics will be recorded in the next test unit, which can be usedas a predictive feature of learning engagement. The feature items include the number of entries to
Educ. Sci. 2019, 9, 104 9 of 15
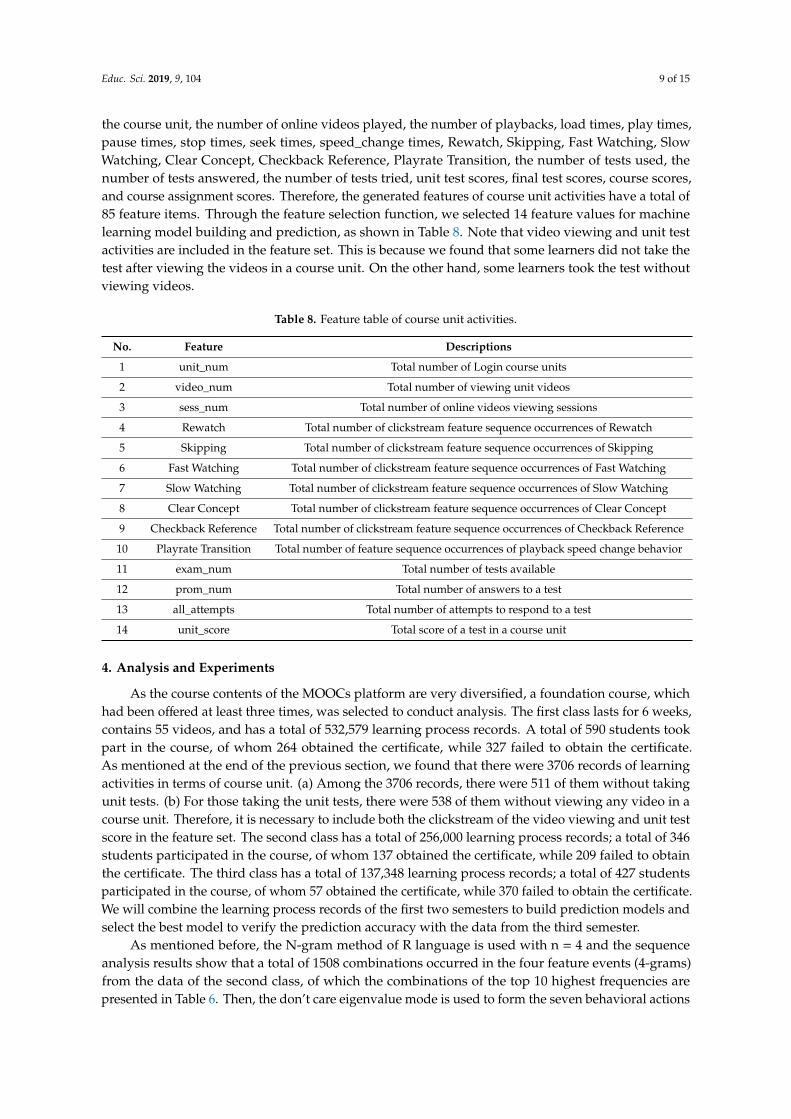
the course unit, the number of online videos played, the number of playbacks, load times, play times,pause times, stop times, seek times, speed_change times, Rewatch, Skipping, Fast Watching, SlowWatching, Clear Concept, Checkback Reference, Playrate Transition, the number of tests used, thenumber of tests answered, the number of tests tried, unit test scores, final test scores, course scores,and course assignment scores. Therefore, the generated features of course unit activities have a total of85 feature items. Through the feature selection function, we selected 14 feature values for machinelearning model building and prediction, as shown in Table 8. Note that video viewing and unit testactivities are included in the feature set. This is because we found that some learners did not take thetest after viewing the videos in a course unit. On the other hand, some learners took the test withoutviewing videos.
Table 8. Feature table of course unit activities.
No. Feature Descriptions
1 unit_num Total number of Login course units
2 video_num Total number of viewing unit videos
3 sess_num Total number of online videos viewing sessions
4 Rewatch Total number of clickstream feature sequence occurrences of Rewatch
5 Skipping Total number of clickstream feature sequence occurrences of Skipping
6 Fast Watching Total number of clickstream feature sequence occurrences of Fast Watching
7 Slow Watching Total number of clickstream feature sequence occurrences of Slow Watching
8 Clear Concept Total number of clickstream feature sequence occurrences of Clear Concept
9 Checkback Reference Total number of clickstream feature sequence occurrences of Checkback Reference
10 Playrate Transition Total number of feature sequence occurrences of playback speed change behavior
11 exam_num Total number of tests available
12 prom_num Total number of answers to a test
13 all_attempts Total number of attempts to respond to a test
14 unit_score Total score of a test in a course unit
4. Analysis and Experiments
As the course contents of the MOOCs platform are very diversified, a foundation course, whichhad been offered at least three times, was selected to conduct analysis. The first class lasts for 6 weeks,contains 55 videos, and has a total of 532,579 learning process records. A total of 590 students tookpart in the course, of whom 264 obtained the certificate, while 327 failed to obtain the certificate.As mentioned at the end of the previous section, we found that there were 3706 records of learningactivities in terms of course unit. (a) Among the 3706 records, there were 511 of them without takingunit tests. (b) For those taking the unit tests, there were 538 of them without viewing any video in acourse unit. Therefore, it is necessary to include both the clickstream of the video viewing and unit testscore in the feature set. The second class has a total of 256,000 learning process records; a total of 346students participated in the course, of whom 137 obtained the certificate, while 209 failed to obtainthe certificate. The third class has a total of 137,348 learning process records; a total of 427 studentsparticipated in the course, of whom 57 obtained the certificate, while 370 failed to obtain the certificate.We will combine the learning process records of the first two semesters to build prediction models andselect the best model to verify the prediction accuracy with the data from the third semester.
As mentioned before, the N-gram method of R language is used with n = 4 and the sequenceanalysis results show that a total of 1508 combinations occurred in the four feature events (4-grams)from the data of the second class, of which the combinations of the top 10 highest frequencies arepresented in Table 6. Then, the don’t care eigenvalue mode is used to form the seven behavioral actions
Educ. Sci. 2019, 9, 104 10 of 15
of learners’ learning engagement, as shown in Table 7. Table 8 presents the feature set of course unitactivities for building prediction models.
First, when the KNN method of R language is used, the library(ISLR) suite should be loadedbeforehand using the knn() function, including 70% of the feature data set for training, 30% of thefeature data set for testing, and the real classification factors are pass (1) and fail (0) of the course,where the K value (# of neighbors) is calculated as the square root of the number of click counts, andthe accuracy is 0.8624535.
As the accuracy of the KNN model is poor, we use the SVM method next. The library(e1071) suiteshould be loaded beforehand in R language, and svm() is used to train the classification model of SVM,including 70% data for training, 30% data for testing, and the target values are pass (1) and fail (0) aswell. The accuracy of the built model is 0.9442379.
For further improvement, we use the ANN method of R language and the library(nnet) suitesshould be loaded beforehand using the ann() function, including 70% data for training, 30% data fortesting, and the target values are pass (1) and fail (0). The number of units in the hidden layer was setfrom 1 to 10, the parameter of the specific gravity attenuation was 0.001, and the maximum number ofrepetitions was 1000. When the numbers of units in the hidden layer were 1 to 5, the highest accuracyof the model was 0.9516729. The ANN model has the highest average accuracy as well.
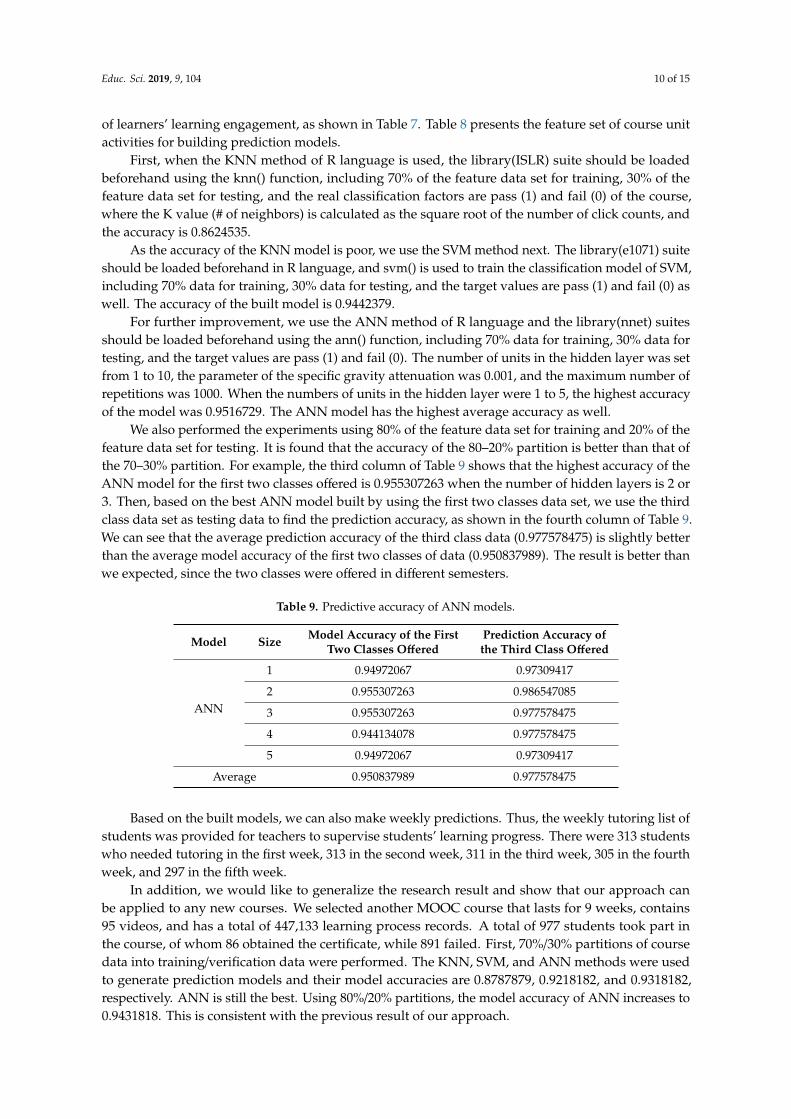
We also performed the experiments using 80% of the feature data set for training and 20% of thefeature data set for testing. It is found that the accuracy of the 80–20% partition is better than that ofthe 70–30% partition. For example, the third column of Table 9 shows that the highest accuracy of theANN model for the first two classes offered is 0.955307263 when the number of hidden layers is 2 or3. Then, based on the best ANN model built by using the first two classes data set, we use the thirdclass data set as testing data to find the prediction accuracy, as shown in the fourth column of Table 9.We can see that the average prediction accuracy of the third class data (0.977578475) is slightly betterthan the average model accuracy of the first two classes of data (0.950837989). The result is better thanwe expected, since the two classes were offered in different semesters.
Table 9. Predictive accuracy of ANN models.
Model Size Model Accuracy of the FirstTwo Classes Offered
Prediction Accuracy ofthe Third Class Offered
ANN
1 0.94972067 0.97309417
2 0.955307263 0.986547085
3 0.955307263 0.977578475
4 0.944134078 0.977578475
5 0.94972067 0.97309417
Average 0.950837989 0.977578475
Based on the built models, we can also make weekly predictions. Thus, the weekly tutoring list ofstudents was provided for teachers to supervise students’ learning progress. There were 313 studentswho needed tutoring in the first week, 313 in the second week, 311 in the third week, 305 in the fourthweek, and 297 in the fifth week.
In addition, we would like to generalize the research result and show that our approach canbe applied to any new courses. We selected another MOOC course that lasts for 9 weeks, contains95 videos, and has a total of 447,133 learning process records. A total of 977 students took part inthe course, of whom 86 obtained the certificate, while 891 failed. First, 70%/30% partitions of coursedata into training/verification data were performed. The KNN, SVM, and ANN methods were usedto generate prediction models and their model accuracies are 0.8787879, 0.9218182, and 0.9318182,respectively. ANN is still the best. Using 80%/20% partitions, the model accuracy of ANN increases to0.9431818. This is consistent with the previous result of our approach.
Educ. Sci. 2019, 9, 104 11 of 15
5. Further Improvements
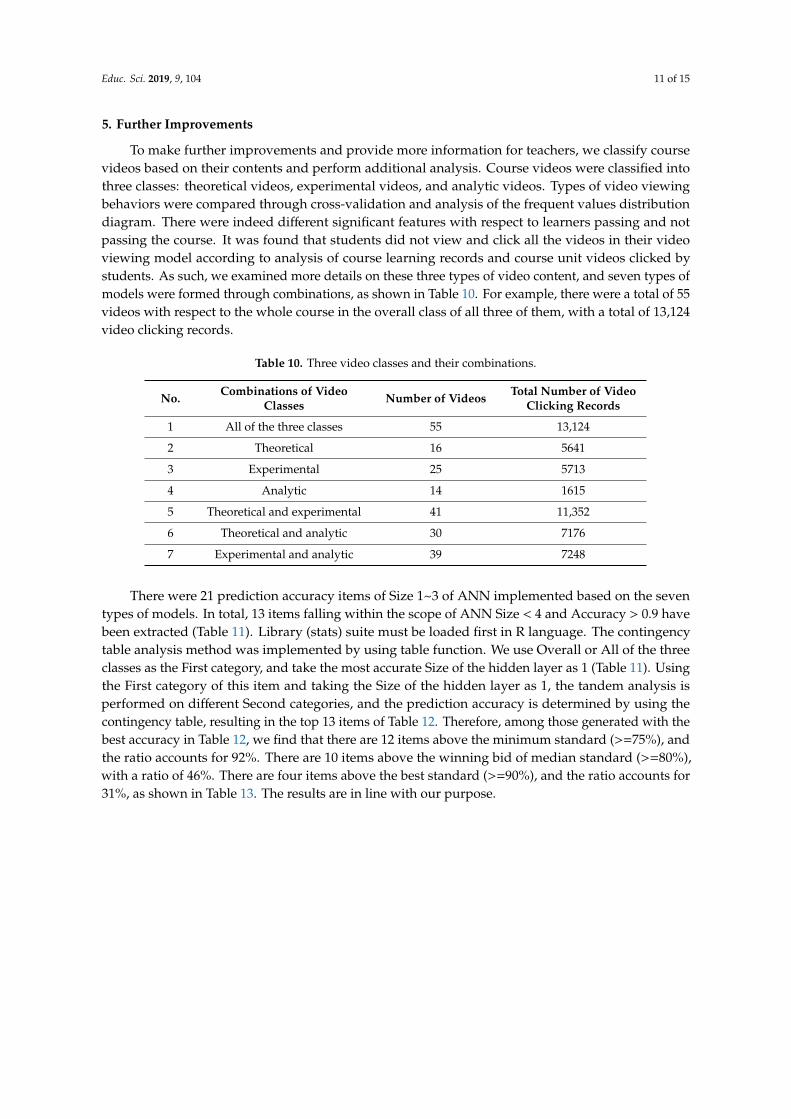
To make further improvements and provide more information for teachers, we classify coursevideos based on their contents and perform additional analysis. Course videos were classified intothree classes: theoretical videos, experimental videos, and analytic videos. Types of video viewingbehaviors were compared through cross-validation and analysis of the frequent values distributiondiagram. There were indeed different significant features with respect to learners passing and notpassing the course. It was found that students did not view and click all the videos in their videoviewing model according to analysis of course learning records and course unit videos clicked bystudents. As such, we examined more details on these three types of video content, and seven types ofmodels were formed through combinations, as shown in Table 10. For example, there were a total of 55videos with respect to the whole course in the overall class of all three of them, with a total of 13,124video clicking records.
Table 10. Three video classes and their combinations.
No. Combinations of VideoClasses Number of Videos Total Number of Video
Clicking Records
1 All of the three classes 55 13,124
2 Theoretical 16 5641
3 Experimental 25 5713
4 Analytic 14 1615
5 Theoretical and experimental 41 11,352
6 Theoretical and analytic 30 7176
7 Experimental and analytic 39 7248
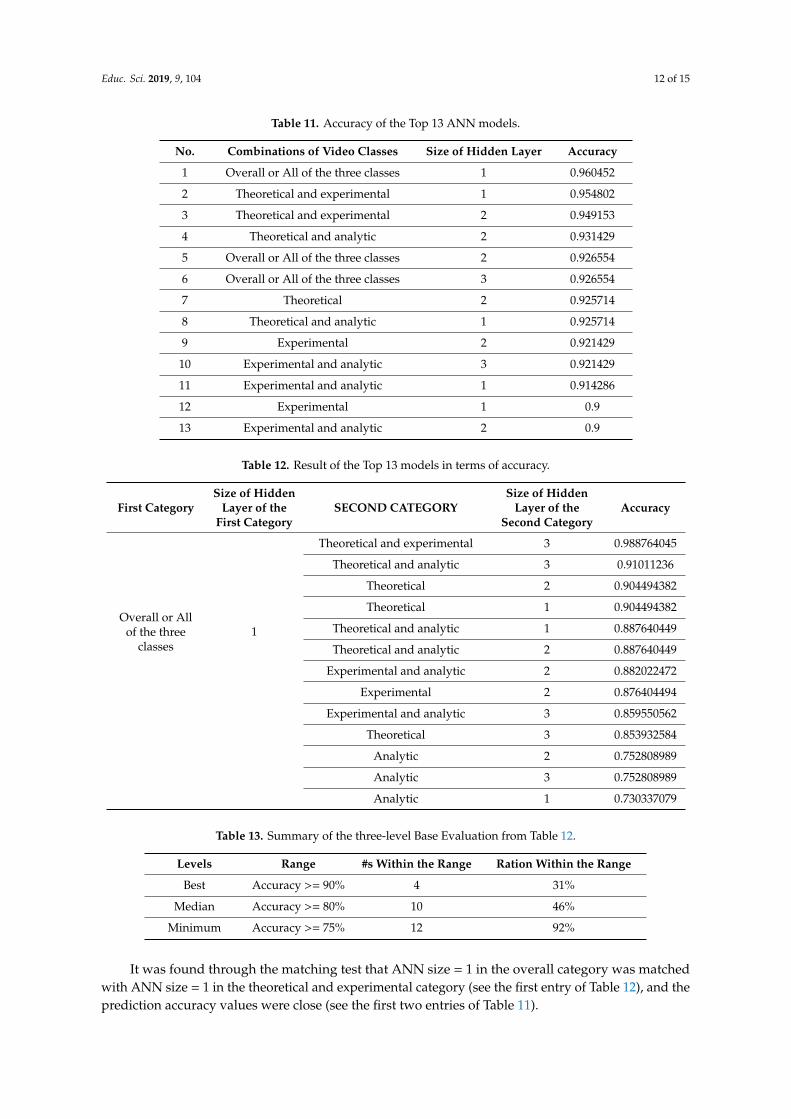
There were 21 prediction accuracy items of Size 1~3 of ANN implemented based on the seventypes of models. In total, 13 items falling within the scope of ANN Size < 4 and Accuracy > 0.9 havebeen extracted (Table 11). Library (stats) suite must be loaded first in R language. The contingencytable analysis method was implemented by using table function. We use Overall or All of the threeclasses as the First category, and take the most accurate Size of the hidden layer as 1 (Table 11). Usingthe First category of this item and taking the Size of the hidden layer as 1, the tandem analysis isperformed on different Second categories, and the prediction accuracy is determined by using thecontingency table, resulting in the top 13 items of Table 12. Therefore, among those generated with thebest accuracy in Table 12, we find that there are 12 items above the minimum standard (>=75%), andthe ratio accounts for 92%. There are 10 items above the winning bid of median standard (>=80%),with a ratio of 46%. There are four items above the best standard (>=90%), and the ratio accounts for31%, as shown in Table 13. The results are in line with our purpose.
Educ. Sci. 2019, 9, 104 12 of 15
Table 11. Accuracy of the Top 13 ANN models.
No. Combinations of Video Classes Size of Hidden Layer Accuracy
1 Overall or All of the three classes 1 0.960452
2 Theoretical and experimental 1 0.954802
3 Theoretical and experimental 2 0.949153
4 Theoretical and analytic 2 0.931429
5 Overall or All of the three classes 2 0.926554
6 Overall or All of the three classes 3 0.926554
7 Theoretical 2 0.925714
8 Theoretical and analytic 1 0.925714
9 Experimental 2 0.921429
10 Experimental and analytic 3 0.921429
11 Experimental and analytic 1 0.914286
12 Experimental 1 0.9
13 Experimental and analytic 2 0.9
Table 12. Result of the Top 13 models in terms of accuracy.
First CategorySize of Hidden
Layer of theFirst Category
SECOND CATEGORYSize of Hidden
Layer of theSecond Category
Accuracy
Overall or Allof the three
classes1
Theoretical and experimental 3 0.988764045
Theoretical and analytic 3 0.91011236
Theoretical 2 0.904494382
Theoretical 1 0.904494382
Theoretical and analytic 1 0.887640449
Theoretical and analytic 2 0.887640449
Experimental and analytic 2 0.882022472
Experimental 2 0.876404494
Experimental and analytic 3 0.859550562
Theoretical 3 0.853932584
Analytic 2 0.752808989
Analytic 3 0.752808989
Analytic 1 0.730337079
Table 13. Summary of the three-level Base Evaluation from Table 12.
Levels Range #s Within the Range Ration Within the Range
Best Accuracy >= 90% 4 31%
Median Accuracy >= 80% 10 46%
Minimum Accuracy >= 75% 12 92%
It was found through the matching test that ANN size = 1 in the overall category was matchedwith ANN size = 1 in the theoretical and experimental category (see the first entry of Table 12), and theprediction accuracy values were close (see the first two entries of Table 11).
Educ. Sci. 2019, 9, 104 13 of 15
6. Conclusions
This study used the click records of MOOCs videos. Firstly, the feature sequence of the viewinglearning behavior is established by using the 4-gram approach, and the feature sequence was definedwith the don’t care mode as the type of learner’s cognitive participation. Then, we used the K-NearestNeighbor Classification (KNN) method, Support Vector Machines (SVM), and Artificial Neural Network(ANN) to predict whether students pass the course. Using the course data from two semesters, thepredicted results of the built models were KNN accuracy 0.8624535, SVM accuracy 0.9442379, andANN accuracy up to 0.955307263.
In addition, the weekly tutoring list of students was provided for teachers to supervise students’learning progress. There were 313 students who needed tutoring in the first week, 313 in the secondweek, 311 in the third week, 305 in the fourth week, and 297 in the fifth week.
Then, the prediction accuracy of the course data from the third semester was obtained, and theprediction accuracy of ANN under two hidden layers was as high as 0.986547085. We also used asecond course to show that our approach can be generalized for application to any new courses.
The prediction of learning outcomes can be presented through an analysis of learning records,course video clicking, and testing records. Due to the different natures of course videos, however,we have classified overall course videos into three types, i.e., theoretical, experimental, and analytic,and seven types of models were formed through combinations. There were 21 items of predictionaccuracy of size 1~3 of ANN implemented based on the seven models. Items falling within the scopeof ANN size < 4 and Accuracy > 0.9 were extracted. Using the simple accuracy verification, thestudy verified through video classification that the overall, theoretical, and experimental predictionaccuracy values are close through matching. Therefore, the prediction effect can be achieved by usingthe clicking records of certain course videos (such as theoretical and experimental ones) instead of thewhole data set.
Therefore, through the inference and prediction mechanism, this study analyzed the behavioralpatterns and features of students’ video browsing behaviors to determine the correlation betweenthe video viewing behavior and learning outcomes, understand the features of students’ learningbehaviors with good or poor learning outcomes, and make predictions, which will provide a referencefor teachers, so that teachers can implement tutoring measures in a timely fashion for students withpoor learning outcomes and the course completion rate can be improved. As for future work, we willcontinue to analyze different types of courses and those on the other MOOC platforms. It will also beuseful to study the effect of improving course completion rates.
Author Contributions: Conceptualization, C.-H.Y. and J.W.; methodology, C.-H.Y.; software, C.-H.Y.; validation,J.W.; formal analysis, C.-H.Y.; investigation, C.-H.Y.; resources, C.-H.Y.; data curation, C.-H.Y.; writing—originaldraft preparation, C.-H.Y.; writing—review and editing, C.-H.Y.; visualization, C.-H.Y.; supervision, A.-C.L.;project administration, A.-C.L.
Funding: This research received no external funding.
Acknowledgments: This research is partially supported by the Ministry of Education, Taiwan. Thanks to Don-LinYang and the OpenEdu team who developed the system and provided the open data.
Conflicts of Interest: The authors declare no conflict of interest.
References
1. Kay, J.; Reimann, P.; Diebold, E.; Kummerfeld, B. MOOCs: So Many Learners, So Much Potential.IEEE Intell. Syst. 2013, 28, 70–77. [CrossRef]
2. Severance, C. Teaching the World: Daphne Koller and Coursera. Computer 2012, 45, 8–9. [CrossRef]3. Breslow, L.; Pritchard, D.E.; DeBoer, J.; Stump, G.S.; Ho, A.D.; Seaton, D.T. Studying Learning in the
Worldwide Classroom: Research into edX’s First MOOC. Res. Pract. Assess. 2013, 8, 13–25.4. Kim, J.; Guo, P.J.; Seaton, D.T.; Mitros, P.; Gajos, K.Z.; Miller, R.C. Understanding in-video dropouts and
interaction peaks in online lecture videos. In Proceedings of the First ACM Conference on Learning @ ScaleConference, Atlanta, GA, USA, 4–5 March 2014; pp. 31–40.
Educ. Sci. 2019, 9, 104 14 of 15
5. Shi, C.; Fu, S.; Chen, Q.; Qu, H. VisMOOC: Visualizing Video Clickstream Data from Massive Open OnlineCourses. In Proceedings of the IEEE Pacific Visualization Symposium (PacificVis) 2015, Hangzhou, China,14–17 April 2015; pp. 159–166.
6. Brinton, C.G.; Buccapatnam, S.; Chiang, M.; Poor, H.V. Mining MOOC clickstreams: Video-watching behaviorvs. in-video quiz performance. IEEE Trans. Signal Process. 2016, 64, 3677–3692. [CrossRef]
7. Liang, J.; Li, C.; Zheng, L. Machine Learning Application in MOOCs: Dropout Prediction. In Proceedings ofthe 11th International Conference on Computer Science & Education (ICCSE), Nagoya, Japan, 23–25 August2016; pp. 52–57.
8. Li, X.; Xie, L.; Wang, H. Grade prediction in MOOCs. In Proceedings of the 2016 IEEE Intl Conference onComputational Science and Engineering (CSE) and IEEE Intl Conference on Embedded and UbiquitousComputing (EUC) and 15th Intl Symposium on Distributed Computing and Applications for BusinessEngineering (DCABES), Paris, France, 24–26 August 2016; pp. 386–392.
9. Dekker, G.W.; Pechenizkiy, M.; Vleeshouwers, J.M. Predicting students drop out: A case study. In Proceedingsof the 2nd International Conference on Educational Data Mining, Cordoba, Spain, 1–3 July 2009; pp. 41–50.
10. Elbadrawy, A.; Polyzou, A.; Ren, Z.; Sweeney, M.; Karypis, G.; Rangwala, H. Predicting Student PerformanceUsing Personalized Analytics. Computer 2016, 49, 61–69. [CrossRef]
11. Brinton, C.G.; Chiang, M. MOOC Performance Prediction via Clickstream Data and Social Learning Networks.In Proceedings of the 2015 IEEE Conference on Computer Communications (INFOCOM), Hong Kong, China,26 April–1 May 2015; pp. 2299–2307.
12. Chorianopoulos, K. A Taxonomy of Asynchronous Instructional Video Styles. Int. Rev. Res. OpenDistrib. Learn. 2018, 19, 294–311. [CrossRef]
13. Yu, C.H.; Wu, J.; Yang, D.L.; Liu, M.C.; Liu, A.C. Video Watching Behavior Pattern Comparison of MOOCsClickstream. In Proceedings of the Taiwan E-Learning Forum 2018, Taipei, Taiwan, 23–25 May 2018.
14. OpenEdu. Available online: https://www.openedu.tw/ (accessed on 2 February 2019).15. Romero, C.; López, M.-I.; Luna, J.-M.; Ventura, S. Predicting students’ final performance from participation
in on-line discussion forums. Comput. Educ. 2013, 68, 458–472. [CrossRef]16. Meier, Y.; Xu, J.; Atan, O.; van der Schaar, M. Predicting grades. IEEE Trans. Signal Process. 2016, 64, 959–972.
[CrossRef]17. Anderson, A.; Huttenlocher, D.; Kleinberg, J.; Leskovec, J. Engaging with Massive Online Courses.
In Proceedings of the 23rd International Conference on World Wide Web 2014, Seoul, Korea, 7–11 April 2014;pp. 687–698.
18. Rebecca, F.; Doug, C. Examining Engagement: Analysing Learner Subpopulations in Massive Open OnlineCourses (MOOCs). In Proceedings of the 5th International Learning Analytics and Knowledge Conference(LAK15), New York, NY, USA, 16–20 March 2015; pp. 1–8.
19. Khalil, M.; Ebner, M. Clustering Patterns of Engagement in Massive Open Online Courses (MOOCs): TheUse of Learning Analytics to Reveal Student Categories. J. Comput. High. Educ. 2016, 29, 114–132. [CrossRef]
20. Sinha, T.; Jermann, P.; Li, N.; Dillenbourg, P. Your Click Decides Your Fate: Inferring Information Processingand Attrition Behavior from MOOC Video Clickstream Interactions. In Proceedings of the 2014 Conferenceon Empirical Methods in Natural Language Processing (EMNLP), Doha, Qatar, 25–29 October 2014; pp. 3–14.
21. Cavnar, W.B.; Trenkle, J.M. N-Gram-Based Text Categorization. In Proceedings of the SDAIR-94, 3rd AnnualSymposium on Document Analysis and Information Retrieval, Las Vegas, NV, USA; 1994; Volume 48113,pp. 161–175.
22. Bailin, A.; Grafstein, A. The linguistic assumptions underlying readability formulae: A critique. Lang. Commun.2001, 21, 285–301. [CrossRef]
23. Kashyap, A.; Nayak, A. Different Machine Learning Models to predict dropouts in MOOCs. In Proceedingsof the 2018 International Conference on Advances in Computing, Melbourne, Australia, 24–25 November2018; pp. 80–85.
24. Raghad, A.-S.; Abir, H.; Andy, L.; Robert, K.; Janet, L.; Naeem, R. Machine Learning Approaches to PredictLearning Outcomes in Massive Open Online Courses. In Proceedings of the 2017 International JointConference on Neural Networks (IJCNN), Anchorage, AK, USA, 14–19 May 2017; pp. 713–720.
25. Xu, B.; Yang, D. Motivation Classification and Grade Prediction for MOOCs Learners. Comput. Intell.Neurosci. 2016. [CrossRef] [PubMed]

Educ. Sci. 2019, 9, 104 15 of 15
26. Fauvel, S.; Yu, H. A Survey on Artificial Intelligence and Data Mining for MOOCs. arXiv 2016,arXiv:1601.06862.
27. Yang, T.Y.; Brinton, C.G.; Carlee, J.W.; Chiang, M. Behavior-Based Grade Prediction for MOOCs Via TimeSeries Neural Networks. IEEE J. Sel. Top. Signal Process. 2017, 11. [CrossRef]
28. Liu, M.C.; Yu, C.H.; Wu, J.; Liu, A.C.; Chen, H.M. Applying learning analytics to deconstruct user engagementby using log data of MOOCs. J. Inf. Sci. Eng. 2018, 34, 1175–1186.
29. Yu, C.H.; Wu, J.; Liu, A.C. Predicting Learning Outcomes with MOOCs Clickstreams. In Proceedings of the2nd Eurasian Conference on Educational Innovation 2019, Singapore, 27–29 January 2019.
© 2019 by the authors. Licensee MDPI, Basel, Switzerland. This article is an open accessarticle distributed under the terms and conditions of the Creative Commons Attribution(CC BY) license (http://creativecommons.org/licenses/by/4.0/).
Related Documents