CHEMICAL ENGINEERING TRANSACTIONS VOL. 41, 2014 A publication of The Italian Association of Chemical Engineering www.aidic.it/cet Guest Editors: Simonetta Palmas, Michele Mascia, Annalisa Vacca Copyright © 2014, AIDIC Servizi S.r.l., ISBN 978-88-95608-32-7; ISSN 2283-9216 Photo-Electrochemical Production of H 2 Using Solar Energy Anna Hankin a , Geoff H. Kelsall* a , Chin Kin Ong b , Fabien Petter a a Department of Chemical Engineering, Imperial College London, London, SW7 2AZ, UK b PIPDEV Ltd., PO Box 36522, London, W4 2XF, UK [email protected] Ti | Sn IV -Fe 2 O 3 photo-anodes are implemented in a photo-electrochemical reactor for photo-assisted splitting of water into hydrogen and oxygen. Attention is focused on the issues concerning electrode scale- up with the aim of addressing the present need for the design, optimisation and demonstration of the commercial feasibility of photo-electrochemical reactors. 1. Introduction Synthetic hematite has attracted considerable attention as a photo-anode in photo-electrochemical reactors for solar water splitting. Theoretically, its band gap of 1.9 - 2.2 eV (Akl, 2004), enables it to absorb up to ca. 37 - 30 % of solar photons, as determined by integrating the AM 1.5 solar irradiance spectrum (ASTM G173-03 Reference Spectra (NREL)) with respect to wavelength, λ, for λ ≤ λ band gap . However, the low conductivity of hematite, even when doped, requires a conductive substrate to serve as a current feeder plate. Typically, for use in small scale reactors, hematite films are deposited onto glass substrates coated with a thin layer of conductive fluorine-doped tin oxide (FTO). However, the sheet resistivity of ca. 0.2-1.5 Ω cm 2 renders this substrate unsuitable for scale-up. Hence the development of Ti | Fe 2 O 3 photo-anodes (Ong et al., 2014) for implementation in alkaline aqueous electrolytes was motivated by the high conductivity of titanium as well as its chemical stability in such media. The possible formation of a TiO 2 layer between Ti and Fe 2 O 3 during the fabrication process is not considered disadvantageous, provided the thickness of this layer does not exceed several nanometres. The principal disadvantage of a metallic substrate in comparison to a glass substrate is that it is not transparent and hence the electrode configuration geometries are more limited. Here, we explore the performance of 0.1×0.1 m 2 Ti | Sn IV -Fe 2 O 3 photo-anodes in two configurations. 2. Experimental All electrochemical measurements were performed in 1 M NaOH solution (pH ca. 13.7, T ca. 298 K) at Ti | Sn IV -Fe 2 O 3 working electrodes, with a Ti | Pt mesh (ca. 50 % open area, The Expanded Metal Company) counter electrode and an HgO | Hg reference electrode measuring at 0.12 V against the standard hydrogen electrode (SHE). 2.1 Photo-anode preparation Tin doped iron oxide films were deposited by spray pyrolysis (Ong et al., 2014) on 0.1 × 0.1 m 2 titanium foil substrates (Alfa Aesar), previously polished using alumina powder on an automated polishing machine (Buehler), degreased with acetone, ultrasonicated and washed in de-ionised water. Titanium rods (Alfa Aesar) were pre-welded to the edges of the samples as electrical contacts. Each clean substrate was placed onto a hotplate and heated to 480 °C. The precursor solution for spray pyrolysis comprised 0.1 M FeCl 3 (Sigma Aldrich, UK) and 6×10 -4 M SnCl 2 (Sigma Aldrich, UK) dissolved in ethanol absolute (AnalaRNormapur, VWR BDH Prolabo). A quartz nebuliser (Meinhard, US) which acted as the spray nozzle was attached onto a CNC machine (Heiz T-720, Germany) and was maintained at a height of ca. 150 mm above the surface of the substrate. The DOI: 10.3303/CET1441034 Please cite this article as: Hankin A., Kelsall G., Ong C.K., Petter F., 2014, Photo-electrochemical production of hydrogen using solar energy, Chemical Engineering Transactions, 41, 199-204 DOI: 10.3303/CET1441034 199

Welcome message from author
This document is posted to help you gain knowledge. Please leave a comment to let me know what you think about it! Share it to your friends and learn new things together.
Transcript
CHEMICAL ENGINEERING TRANSACTIONS
VOL. 41, 2014
A publication of
The Italian Association of Chemical Engineering
www.aidic.it/cet Guest Editors: Simonetta Palmas, Michele Mascia, Annalisa VaccaCopyright © 2014, AIDIC Servizi S.r.l., ISBN 978-88-95608-32-7; ISSN 2283-9216
Photo-Electrochemical Production of H2 Using Solar Energy
Anna Hankina, Geoff H. Kelsall*a, Chin Kin Ongb, Fabien Pettera a Department of Chemical Engineering, Imperial College London, London, SW7 2AZ, UK b PIPDEV Ltd., PO Box 36522, London, W4 2XF, UK [email protected]
Ti | SnIV-Fe2O3 photo-anodes are implemented in a photo-electrochemical reactor for photo-assisted splitting of water into hydrogen and oxygen. Attention is focused on the issues concerning electrode scale-up with the aim of addressing the present need for the design, optimisation and demonstration of the commercial feasibility of photo-electrochemical reactors.
1. Introduction Synthetic hematite has attracted considerable attention as a photo-anode in photo-electrochemical reactors for solar water splitting. Theoretically, its band gap of 1.9 - 2.2 eV (Akl, 2004), enables it to absorb up to ca. 37 - 30 % of solar photons, as determined by integrating the AM 1.5 solar irradiance spectrum (ASTM G173-03 Reference Spectra (NREL)) with respect to wavelength, λ, for λ ≤ λband gap. However, the low conductivity of hematite, even when doped, requires a conductive substrate to serve as a current feeder plate. Typically, for use in small scale reactors, hematite films are deposited onto glass substrates coated with a thin layer of conductive fluorine-doped tin oxide (FTO). However, the sheet resistivity of ca. 0.2-1.5 Ω cm2 renders this substrate unsuitable for scale-up. Hence the development of Ti | Fe2O3 photo-anodes (Ong et al., 2014) for implementation in alkaline aqueous electrolytes was motivated by the high conductivity of titanium as well as its chemical stability in such media. The possible formation of a TiO2 layer between Ti and Fe2O3 during the fabrication process is not considered disadvantageous, provided the thickness of this layer does not exceed several nanometres. The principal disadvantage of a metallic substrate in comparison to a glass substrate is that it is not transparent and hence the electrode configuration geometries are more limited. Here, we explore the performance of 0.1×0.1 m2 Ti | SnIV-Fe2O3 photo-anodes in two configurations.
2. Experimental All electrochemical measurements were performed in 1 M NaOH solution (pH ca. 13.7, T ca. 298 K) at Ti | SnIV-Fe2O3 working electrodes, with a Ti | Pt mesh (ca. 50 % open area, The Expanded Metal Company) counter electrode and an HgO | Hg reference electrode measuring at 0.12 V against the standard hydrogen electrode (SHE).
2.1 Photo-anode preparation Tin doped iron oxide films were deposited by spray pyrolysis (Ong et al., 2014) on 0.1 × 0.1 m2 titanium foil substrates (Alfa Aesar), previously polished using alumina powder on an automated polishing machine (Buehler), degreased with acetone, ultrasonicated and washed in de-ionised water. Titanium rods (Alfa Aesar) were pre-welded to the edges of the samples as electrical contacts. Each clean substrate was placed onto a hotplate and heated to 480 °C. The precursor solution for spray pyrolysis comprised 0.1 M FeCl3 (Sigma Aldrich, UK) and 6×10⁻⁴ M SnCl2 (Sigma Aldrich, UK) dissolved in ethanol absolute (AnalaRNormapur, VWR BDH Prolabo). A quartz nebuliser (Meinhard, US) which acted as the spray nozzle was attached onto a CNC machine (Heiz T-720, Germany) and was maintained at a height of ca. 150 mm above the surface of the substrate. The
DOI: 10.3303/CET1441034
Please cite this article as: Hankin A., Kelsall G., Ong C.K., Petter F., 2014, Photo-electrochemical production of hydrogen using solar energy, Chemical Engineering Transactions, 41, 199-204 DOI: 10.3303/CET1441034
199
movement of the CNC was software-automated (WinPC-NC CNC Software, BobCad-CAM, USA) to facilitate the formation of a homogeneous coating. The FeIII precursor was delivered to the nebuliser by a syringe pump at 2 cm3 min-1; pressurised air was supplied at 50 psig. 40 passes of the nebuliser over the heated substrate generated hematite coatings of ca. 200 nm in thickness, which was measured using a stylus profilometer (TencorAlphastep 200 Automatic Step Profiler). Subsequently, the sample was heat treated in air at 500 °C (Elite Thermal Systems Ltd) for 1 hour to form SnIV-Fe2O3. The reverse side of the electrode, as well as the wetted portion of the titanium contacts were coated in electrochemically inert, insulating lacquer (RS components).
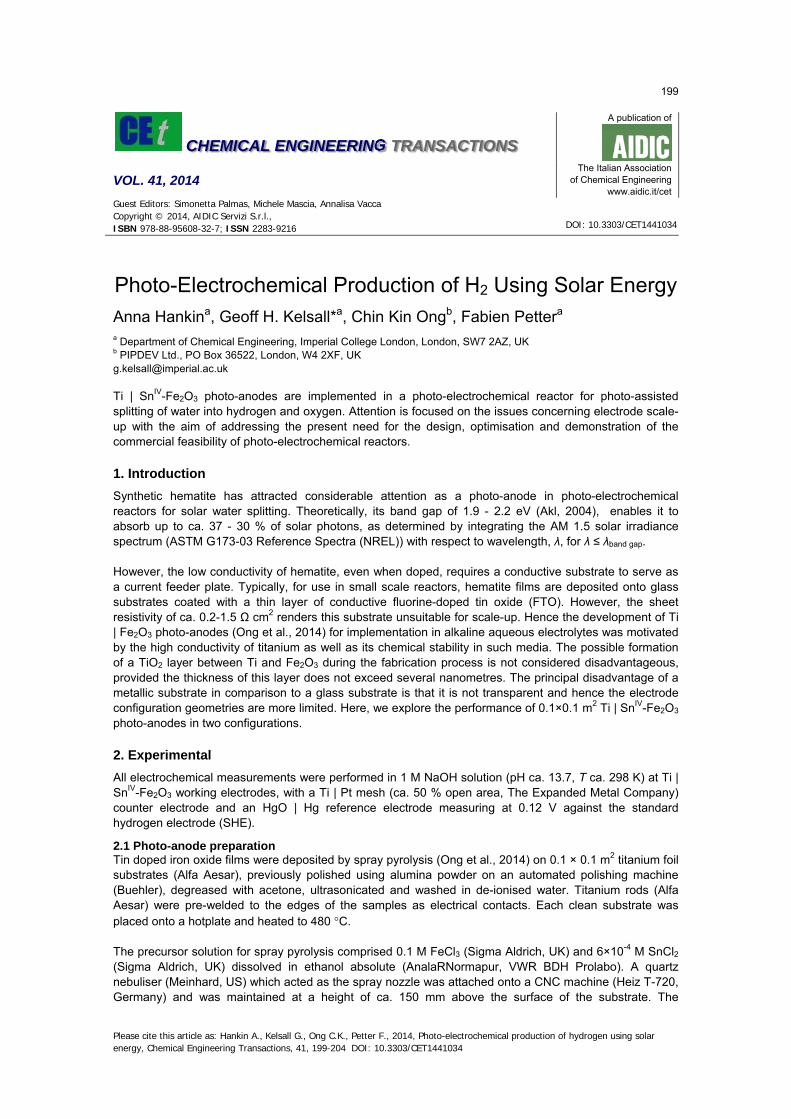
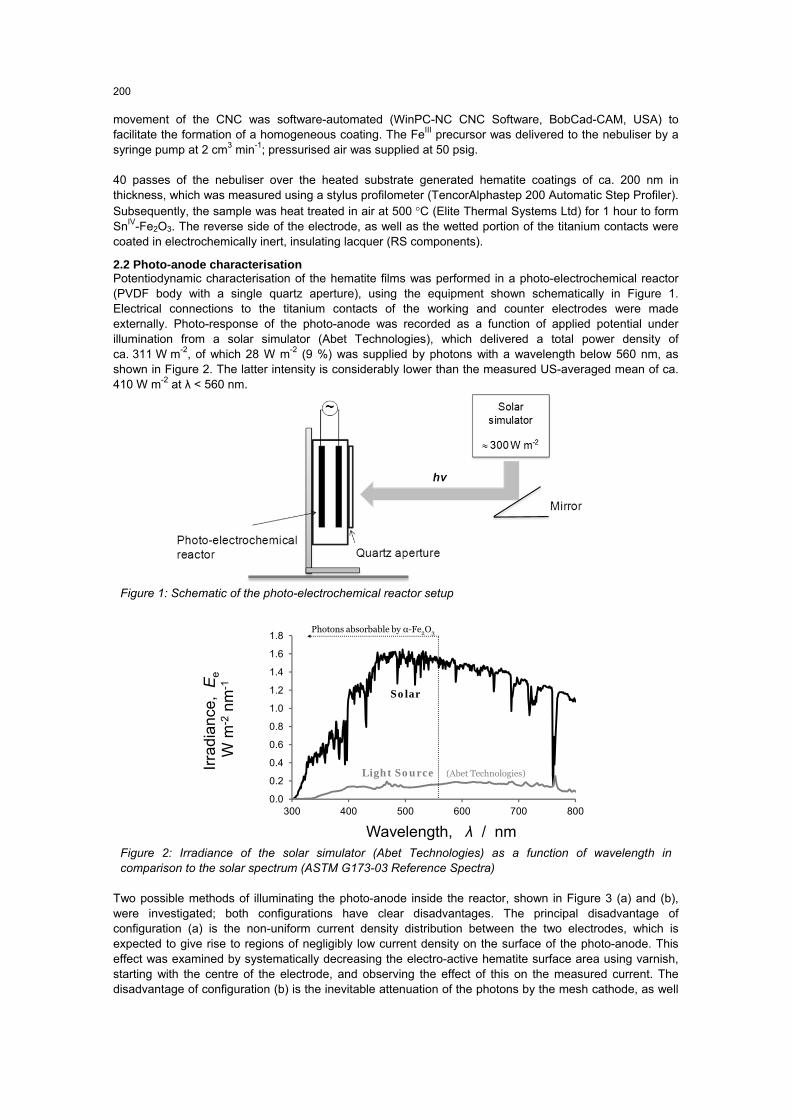
2.2 Photo-anode characterisation Potentiodynamic characterisation of the hematite films was performed in a photo-electrochemical reactor (PVDF body with a single quartz aperture), using the equipment shown schematically in Figure 1. Electrical connections to the titanium contacts of the working and counter electrodes were made externally. Photo-response of the photo-anode was recorded as a function of applied potential under illumination from a solar simulator (Abet Technologies), which delivered a total power density of ca. 311 W m-2, of which 28 W m-2 (9 %) was supplied by photons with a wavelength below 560 nm, as shown in Figure 2. The latter intensity is considerably lower than the measured US-averaged mean of ca. 410 W m-2 at λ < 560 nm.
Figure 1: Schematic of the photo-electrochemical reactor setup
f
Figure 2: Irradiance of the solar simulator (Abet Technologies) as a function of wavelength in comparison to the solar spectrum (ASTM G173-03 Reference Spectra)
Two possible methods of illuminating the photo-anode inside the reactor, shown in Figure 3 (a) and (b), were investigated; both configurations have clear disadvantages. The principal disadvantage of configuration (a) is the non-uniform current density distribution between the two electrodes, which is expected to give rise to regions of negligibly low current density on the surface of the photo-anode. This effect was examined by systematically decreasing the electro-active hematite surface area using varnish, starting with the centre of the electrode, and observing the effect of this on the measured current. The disadvantage of configuration (b) is the inevitable attenuation of the photons by the mesh cathode, as well
0.0
0.2
0.4
0.6
0.8
1.0
1.2
1.4
1.6
1.8
300 400 500 600 700 800
Irra
dian
ce,
Ee
W m
-2nm
-1
Wavelength, λ / nm
Solar
Light Source (Abet Technologies)
Photons absorbable by α-Fe2O3
200

as by the membrane which, although not shown, would be necessary in practice. Since the open area of the mesh was ca. 50 % of the geometric area, it would decrease the mean photon flux proportionally. The rate of hydrogen gas evolution under an applied reactor potential difference of 1.5 V, corresponding to a cathode potential of -1 V (SHE) and photo-anode potential of +0.5 V (SHE) was measured as a function of time using a burette; prior to the measurements, the catholyte was saturated with H2. For this measurement, a membrane (Nafion 424, Du Pont) was introduced between the electrodes to minimise cross-over of oxygen (and hydrogen).
(a)
(b)
Figure 3: Electrode configurations in the photo-electrochemical reactor
3. Results and Discussion 3.1 Voltammetry Figure 4 shows the performance of the Ti | SnIV-Fe2O3 photo-anode, positioned as shown in Figure 3 (a), as a function of applied potential in the dark and under illumination, which resulted in a shift of ca. -0.6 V in the potential of the oxygen evolution current onset relative to the behaviour in the dark. The photocurrent reached a plateau of ca. 0.02 A, prior to the onset of dark current at ca. 0.6 V (SHE).
3.2 Electrode configurations The effect of electrode configuration on the current distribution was investigated by masking portions of the hematite surface. The results are shown in Figure 5, from which it is apparent that the flow of current was localised to the edges of the hematite film that were closest to the surface of the photo-cathode. It was concluded that almost no current passed through the central 25 % of the hematite surface as the coverage of this area with lacquer had no impact on the measured current. The effect of masking became more pronounced as areas closer to the edges were coated in lacquer, although the decrease in the current was not proportional to the decrease in the electro-active surface area. In spite of the evident problems caused by the configuration in Figure 3 (a), the performance of the photo-anode was better than in the case of configuration Figure 3 (b); Figure 6 shows a comparison between front-side illumination of the SnIV-Fe2O3 photo-anode when positioned in front of, and behind the Ti | Pt cathode mesh of approximately 50 % open area. It can be seen that the presence of the mesh between the light source and the hematite surface resulted in the decrease in the photocurrent which is clearly dependent on the geometry of the mesh and the extent to which it obscured the light. The decrease in the current by a factor of ca. 2 is consistent with the 50 % solid area of the mesh. In principle, the extent of attenuation could be obviated by employing a mesh cathode with a larger open area. However, regardless of this, the presence of a membrane, required to minimise cross-over losses, is likely to cause prohibitively strong attenuation. Hence, resolution of issues with configuration (a) in Figure 3 should be the focus. Figure 7 shows an image of a custom-designed partially expanded titanium mesh (The Expanded Metal Company); pre-expansion punctures have been introduced at an angle, such that the surface would not transmit light, yet would allow for greater uniformity in the flow of ionic current between the cathode and photo-anode.
201
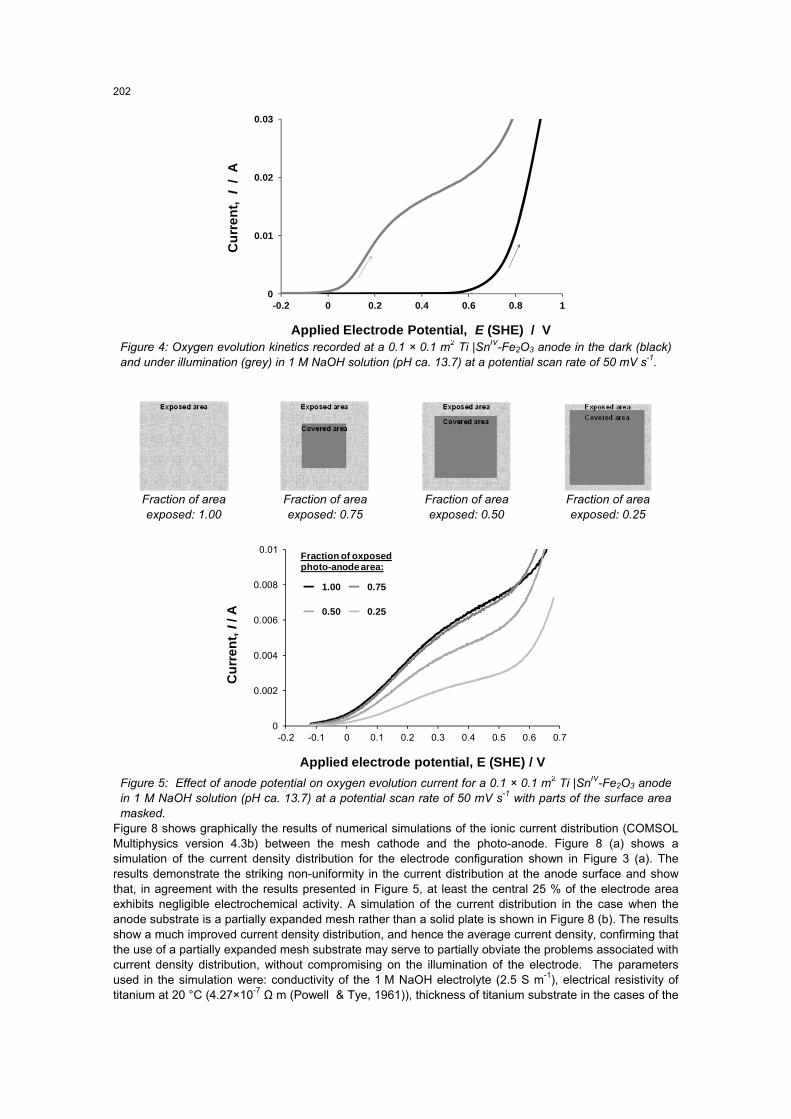
Figure 4: Oxygen evolution kinetics recorded at a 0.1 × 0.1 m2 Ti |SnIV-Fe2O3 anode in the dark (black) and under illumination (grey) in 1 M NaOH solution (pH ca. 13.7) at a potential scan rate of 50 mV s-1.
M
Fraction of area exposed: 1.00
Fraction of area exposed: 0.75
Fraction of area exposed: 0.50
Fraction of area exposed: 0.25
Figure 5: Effect of anode potential on oxygen evolution current for a 0.1 × 0.1 m2 Ti |SnIV-Fe2O3 anode in 1 M NaOH solution (pH ca. 13.7) at a potential scan rate of 50 mV s-1 with parts of the surface area masked.
Figure 8 shows graphically the results of numerical simulations of the ionic current distribution (COMSOL Multiphysics version 4.3b) between the mesh cathode and the photo-anode. Figure 8 (a) shows a simulation of the current density distribution for the electrode configuration shown in Figure 3 (a). The results demonstrate the striking non-uniformity in the current distribution at the anode surface and show that, in agreement with the results presented in Figure 5, at least the central 25 % of the electrode area exhibits negligible electrochemical activity. A simulation of the current distribution in the case when the anode substrate is a partially expanded mesh rather than a solid plate is shown in Figure 8 (b). The results show a much improved current density distribution, and hence the average current density, confirming that the use of a partially expanded mesh substrate may serve to partially obviate the problems associated with current density distribution, without compromising on the illumination of the electrode. The parameters used in the simulation were: conductivity of the 1 M NaOH electrolyte (2.5 S m-1), electrical resistivity of titanium at 20 °C (4.27×10⁻⁷ Ω m (Powell & Tye, 1961)), thickness of titanium substrate in the cases of the
0
0.01
0.02
0.03
-0.2 0 0.2 0.4 0.6 0.8 1
Cur
rent
, I
/ A
Applied Electrode Potential, E (SHE) / V
0
0.002
0.004
0.006
0.008
0.01
-0.2 -0.1 0 0.1 0.2 0.3 0.4 0.5 0.6 0.7
Cur
rent
, I/ A
Applied electrode potential, E (SHE) / V
1.00 0.75
0.50 0.25
Fraction of oxposedphoto-anode area:
202

cathode and the anode (7.4×10⁻⁴ m), the cathodic transfer coefficient and exchange current density for hydrogen oxidation/reduction at platinum (0.5 and 0.87 A m-2 (Appleby et al., 1982)), the anodic transfer coefficient for oxygen evolution at hematite (0.6 (Ong et al., 2014)) and the exchange current density of oxygen oxidation/reduction at hematite (0.2 A m-2 (Boumaza et al., 2010)).
Figure 6: Oxygen evolution kinetics at a 0.1 × 0.1 m2 Ti |SnIV-Fe2O3 anode in 1 M NaOH solution (pH ca. 13.7) at a potential scan rate of 50 mV s-1 when positioned in front of (grey) and behind the Ti | Pt cathode (dashed black); the ratio between the currents recorded for the two configurations is also shown (solid black).
Figure 7: Partially expanded Ti mesh
(a) SnIV-Fe2O3 deposited onto a Ti plate
(b) SnIV-Fe2O3 deposited onto a partially expanded Ti mesh
Figure 8: Ionic current density distribution in 1 M NaOH electrolyte as a function of spatial co-ordinates in the photo-electrochemical reactor at an applied reactor potential difference of 1.5 V, modelled using COMSOL Multiphysics 4.3b.
0
0.5
1
1.5
2
2.5
0
0.005
0.01
0.015
0.02
0.025
-0.2 0 0.2 0.4 0.6 0.8
Rat
io I f
ont:
I beh
ind
Cur
rent
, I/ A
Applied Electrode Potential, E (SHE) / V
203

Figure 9: Time dependences of rate and charge yield of hydrogen evolution at Ti | Pt mesh cathode at an applied reactor potential difference of 1.5 V, which corresponded to a cathode potential of -1 V (SHE) and photo-anode potential of +0.5 V (SHE), in stationary 1 M NaOH solution.
3.3 cHydrogen evolution Figure 9 shows the time dependences of hydrogen production rates and yields in the presence of a membrane and at an applied cell potential difference of 1.5 V. It is anticipated that, in the presence of an improved light source, the magnitude of the anodic photocurrent and hence the current measured at the cathode will increase, thereby increasing the production rate and charge yield. The low values of charge yields for hydrogen were due to oxygen transport from anode to cathode, even with a membrane, such that the cathode potential was insufficiently negative for hydrogen evolution rather than oxygen reduction to be the predominant cathode reaction. Assuming that the photocurrent density is linearly dependent on the photon power density, an increase in the anodic photocurrent by a factor of ca. 8 may be expected if the photo-anode was exposed to the AM1.5 spectrum in Figure 2. This increase is expected to be sufficient to increase the cathodic hydrogen charge yield to ≈ 1.
4. Conclusions It has been demonstrated that the geometric configuration of electrodes may exhibit a strong effect on the performance of a photo-electrochemical reactor and hence represents one of the key design aspects for reactor scale-up. We have proposed a photo-electrode geometry which allows simultaneously for maximum electrode illumination and maximum uniformity in current distribution.
References
Akl A.A., 2004, Optical properties of crystalline and non-crystalline iron oxide thin films deposited by spray pyrolysis, Appl. Surf. Sci. 233, 307-319
Appleby A.J., Chemla M., Kita H., Bronoel G., 1982,. Encyclopedia on Electrochemistry of the Elements, vol. IX, Ed. Bard A.J., Marcel Dekker, New York, 383-597
Boumaza S., Boudjemaa A., Omeiri S., Bouarab R., Bouguelia A., Trari M., 2010, Solar Energy, 84, 715-721
NREL (National Renewable Energy Laboratory), ASTM G173-03 Reference Spectra, http://rredc.nrel.gov/solar/spectra/am1.5/ASTMG173/ASTMG173.html accessed on 31.08.2013 Ong C.K., Dennison S., Fearn S., Hellgardt K., Kelsall G.H., 2014, Behaviour of titanium-based Fe2O3
photo-anodes in photo-electrochemical reactors for water splitting, Electrochim. Acta 125, 266-274 Powell R.W., Tye R.P., 1961, The thermal and electrical conductivity of titanium and its alloys, J. Less.-
Common Met. 3, 226-233
204
Related Documents