Elsevier Editorial System(tm) for Sensors & Actuators: B. Chemical Manuscript Draft Manuscript Number: SNB-D-13-00461 Title: Insights into photo-electrochemical sensing of herbicides driven by Chlamydomonas reinhardtii cells Article Type: Research Paper Keywords: biosensors, Chlamydomonas reinhardtii, screen-printed electrode, Photosystem II D1 protein, plastoquinone binding niche, herbicide detection Corresponding Author: Dr. Giuseppina Rea, Corresponding Author's Institution: Institute of Crystallography First Author: Ivan Husu Order of Authors: Ivan Husu; Giuseppe Rodio; Eleftherios Touloupakis; Maya Dimova Lambreva; Katia Buonasera; Simona Carmen Litescu; Maria Teresa Giardi; Giuseppina Rea Abstract: Photosynthetic organisms share a natural ability to bind anthropogenic pollutants impairing distinctly detectable photochemical processes. This property allowed us to exploit whole photosynthetic cells for the construction of an electrochemical biosensor targeted to environmental monitoring. Among photosynthetic organisms sensitive to pesticide classes, the unicellular green alga Chlamydomonas reinhardtii revealed to be a smart bio-sensing element useful for the realization of amperometric analytical devices. To preserve the algal photosynthetic functionality when integrated with non-biological electronic components, C. reinhardtii cells were entrapped in an alginate gel directly onto the surface of a screen-printed carbon nanotube working electrode. Amperometric measurements were performed recording the output current signals originated by the reduction of photosynthetically evolved oxygen, and the biosensor response expressed as a ratio between the current intensities registered in the absence and in the presence of herbicides. As competitive inhibitors of the plastoquinone (QB) binding to the reaction center D1 protein, triazine and urea-type herbicides block the photosynthetic electron transport leading to a reduction of the biosensor output currents in a concentration-dependent manner. For linuron and simazine the limits of detection resulted 6 ×10⁻⁹ and 9×10⁻⁸ M, respectively, while the inhibition constant values (I50) were (1.2±0.1)×10-7 and (2.3±0.2) ×10-6 M. The operational half-life of the bio-recognition element lasted approximately 9 hours, while room temperature storage stability tests indicated a 2 and 24% signal loss after 3 and 20 days, respectively. The inhibition of the biosensor photosynthetic activity was irreversible at low herbicide concentrations, and highly reversible at medium-high doses. These results were discussed considering the presence in the Photosystem II pigment-protein complex of two herbicide binding niches with different binding affinities. Beyond introducing a promising prototype for commercial applications, this research shed light on current functional issues related to the not yet fully explored plastoquinone/herbicide binding site. Suggested Reviewers: László Nagy [email protected] Expert of photosynthetic reacton center-based biosensors Eugenio Martinelli

Welcome message from author
This document is posted to help you gain knowledge. Please leave a comment to let me know what you think about it! Share it to your friends and learn new things together.
Transcript
Elsevier Editorial System(tm) for Sensors & Actuators: B. Chemical Manuscript Draft Manuscript Number: SNB-D-13-00461 Title: Insights into photo-electrochemical sensing of herbicides driven by Chlamydomonas reinhardtii cells Article Type: Research Paper Keywords: biosensors, Chlamydomonas reinhardtii, screen-printed electrode, Photosystem II D1 protein, plastoquinone binding niche, herbicide detection Corresponding Author: Dr. Giuseppina Rea, Corresponding Author's Institution: Institute of Crystallography First Author: Ivan Husu Order of Authors: Ivan Husu; Giuseppe Rodio; Eleftherios Touloupakis; Maya Dimova Lambreva; Katia Buonasera; Simona Carmen Litescu; Maria Teresa Giardi; Giuseppina Rea Abstract: Photosynthetic organisms share a natural ability to bind anthropogenic pollutants impairing distinctly detectable photochemical processes. This property allowed us to exploit whole photosynthetic cells for the construction of an electrochemical biosensor targeted to environmental monitoring. Among photosynthetic organisms sensitive to pesticide classes, the unicellular green alga Chlamydomonas reinhardtii revealed to be a smart bio-sensing element useful for the realization of amperometric analytical devices. To preserve the algal photosynthetic functionality when integrated with non-biological electronic components, C. reinhardtii cells were entrapped in an alginate gel directly onto the surface of a screen-printed carbon nanotube working electrode. Amperometric measurements were performed recording the output current signals originated by the reduction of photosynthetically evolved oxygen, and the biosensor response expressed as a ratio between the current intensities registered in the absence and in the presence of herbicides. As competitive inhibitors of the plastoquinone (QB) binding to the reaction center D1 protein, triazine and urea-type herbicides block the photosynthetic electron transport leading to a reduction of the biosensor output currents in a concentration-dependent manner. For linuron and simazine the limits of detection resulted 6 ×10⁻⁹ and 9×10⁻⁸ M, respectively, while the inhibition constant values (I50) were (1.2±0.1)×10-7 and (2.3±0.2) ×10-6 M. The operational half-life of the bio-recognition element lasted approximately 9 hours, while room temperature storage stability tests indicated a 2 and 24% signal loss after 3 and 20 days, respectively. The inhibition of the biosensor photosynthetic activity was irreversible at low herbicide concentrations, and highly reversible at medium-high doses. These results were discussed considering the presence in the Photosystem II pigment-protein complex of two herbicide binding niches with different binding affinities. Beyond introducing a promising prototype for commercial applications, this research shed light on current functional issues related to the not yet fully explored plastoquinone/herbicide binding site. Suggested Reviewers: László Nagy [email protected] Expert of photosynthetic reacton center-based biosensors Eugenio Martinelli

[email protected] Expert of sensors and electrochemistry Erwin Reisner [email protected] Expert of Photosystem II, biosensors, electrochemistry Petr Herman [email protected] Expert of optical and amperometric biosensors Belen B Rodriguez [email protected] Expert in amperometric biosensors

1
Insights into photo-electrochemical sensing of herbicides driven by Chlamydomonas
reinhardtii cells 2
I. Husua,§
, G. Rodioa,1, §
, E. Touloupakisb, M.D. Lambreva
a, K. Buonasera
a, S.C.Litescu
c, M.T. 4
Giardia, G. Rea
a,*
6
a Institute of Crystallography (IC), National Research Council of Italy (CNR), Via Salaria km 8
29.300, 00015 Monterotondo Scalo (Rome), Italy
10 b
Department of Chemistry, University of Crete, PO BOX 2208, 71003 Voutes (Heraklion), Greece
12 c Centre of Bioanalysis, National Institute for Biological Sciences, 060031, 296 Splaiul
Independentei Bucharest 6, Romania 14
1 Present address: Biosensor srl, Via degli Olmetti 44, 00060 Formello (Rome), Italy 16
§ These authors equally contributed to the paper 18
*Corresponding author: Giuseppina Rea, Institute of Crystallography, National Research Council 20
of Italy, Via Salaria Km 29.300, 00015 Monterotondo Scalo (Rome), Italy
e-mail: [email protected], Phone: +390690672631; Fax: +390690672630
22
Author and co-authors e-mail addresses: 24
Dr. I. Husu [email protected] 26 Dr. G. Rodio [email protected]
Dr. E. Touloupakis [email protected] 28 Dr. M.D. Lambreva [email protected]
Dr. K. Buonasera [email protected] 30
Dr. S.C.Litescu [email protected]
Dr. Maria Teresa Giardi [email protected] 32
34
*ManuscriptClick here to view linked References

2
Abstract 36
Photosynthetic organisms share a natural ability to bind anthropogenic pollutants impairing
distinctly detectable photochemical processes. This property allowed us to exploit whole 38
photosynthetic cells for the construction of an electrochemical biosensor targeted to environmental
monitoring. Among photosynthetic organisms sensitive to pesticide classes, the unicellular green 40
alga Chlamydomonas reinhardtii revealed to be a smart bio-sensing element useful for the
realization of amperometric analytical devices. To preserve the algal photosynthetic functionality 42
when integrated with non-biological electronic components, C. reinhardtii cells were entrapped in
an alginate gel directly onto the surface of a screen-printed carbon nanotube working electrode. 44
Amperometric measurements were performed recording the output current signals originated by the
reduction of photosynthetically evolved oxygen, and the biosensor response expressed as a ratio 46
between the current intensities registered in the absence and in the presence of herbicides. As
competitive inhibitors of the plastoquinone (QB) binding to the reaction center D1 protein, triazine 48
and urea-type herbicides block the photosynthetic electron transport leading to a reduction of the
biosensor output currents in a concentration-dependent manner. For linuron and simazine the limits 50
of detection resulted 6 ×10⁻⁹
and 9×10⁻⁸
M, respectively, while the inhibition constant values (I50)
were (1.2±0.1)×10-7
and (2.3±0.2) ×10-6
M. The operational half-life of the bio-recognition element 52
lasted approximately 9 hours, while room temperature storage stability tests indicated a 2 and 24%
signal loss after 3 and 20 days, respectively. The inhibition of the biosensor photosynthetic activity 54
was irreversible at low herbicide concentrations, and highly reversible at medium-high doses. These
results were discussed considering the presence in the Photosystem II pigment-protein complex of 56
two herbicide binding niches with different binding affinities. Beyond introducing a promising
prototype for commercial applications, this research shed light on current functional issues related 58
to the not yet fully explored plastoquinone/herbicide binding site.
60
Keywords: biosensors, Chlamydomonas reinhardtii, screen-printed electrode, Photosystem II D1
protein, plastoquinone binding niche, herbicide detection 62

3
1. Introduction 64
Recent improvements in the nanoscience and biotechnology fields empowered the development of 66
novel and highly sensitive analytical systems able to efficiently transduce biological events by
means of rapid, label-free electronic devices. This progress has led to the development of many 68
bioanalytical methods and biosensing technologies based on biosensors and biochips useful for
various environmental applications [1,2]. In this context, biosensors based on photosynthetic 70
material as bio-recognition element, including whole cells, thylakoidal membranes (TMs),
photosystem II (PSII) complexes, or reaction center proteins (RCs) revealed a valid tool for the 72
detection of herbicides [3-7]. The proof-of-principle relies on the capability of some classes of
herbicides, including triazines and ureas, to interact with a specific niche of the PSII D1 protein, 74
leading to physico-chemical changes, which can be easily converted into measurable electrical
signals [8]. 76
Thanks to their high efficiency, purified photosynthetic sub-components (e.g. PSII-enriched
thylakoidal membranes from green plants) have been frequently exploited [9-11], although their 78
purification is a laborious, expensive and time-consuming procedure. Moreover, objective
experimental difficulties occur when working with purified TMs, or PSII-enriched particles or 80
reaction centres, the main constrain being the high instability of extracted material. These
limitations can be overcome using whole photosynthetic microorganisms, such as unicellular algae 82
and cyanobacteria, which in addition offer the possibility to explore whole biochemical processes
operated by complex macromolecular assemblies (e.g. respiration, photosynthesis, etc.) [12-14]. 84
Furthermore, microorganisms are suitable of reliable genetic engineering procedures, so paving the
way to the fine tuning of selectivity and sensitivity proprieties of the biosensing element [15]. 86
Taking all this into account, C. reinhardtii was selected for the present study as sensing element for
the development of a new biosensor configuration with high stability features. 88
C. reinhardtii is a well-known unicellular alga, whose genome, proteome, and metabolism have
been extensively investigated. Since 1980s, indeed, thanks to the plenty of available molecular 90
biology tools, this alga has been widely employed as a model system for genetic manipulations and
for the study of photosynthesis and PSII [16-17]. The PSII is a multi-subunit protein complex 92
embedded within thylakoidal membranes of plants, algae and cyanobacteria. Acting as a light-
driven water-plastoquinone oxidoreductase, it catalyzes the highly endoergonic reaction of water 94
splitting into molecular oxygen, protons and electrons, thereby sustaining aerobic atmosphere on
earth and providing the reducing equivalents necessary to transform carbon dioxide into organic 96
4
molecules. Within PSII, light is absorbed by chlorophyll-protein harvesting complexes, and
funnelled to the photochemically active reaction centre, made of the D1 and D2 proteins and the 98
Oxygen Evolving Complex subunits. Photoexcitation here converts a special dimer of Chl a
molecules (P680) into its oxidized form (P680
+), thus triggering a single electron transfer first to a 100
pheophytin cofactor, then to the QA plastoquinone molecule on D2, and finally to QB, a second
plastoquinone in D1. The electron transfer chain goes beyond PSII, up to other proteins such as 102
cytochrome b6f, plastocyanine and Photosystem I, to store the absorbed light energy in the chemical
bonds of NADPH and ATP molecules. Herbicides competitively displace the native plastoquinone 104
at the QB binding niche site of D1, thus blocking oxidation of the reduced primary quinone, QA,
leading to electron transfer impairment [18,19]. 106
So far, several computational and molecular biology studies have been carried out on C. reinhardtii
strains for the design and realization of sensitive and real time PSII-based biosensing devices [20-108
22]. However, if C. reinhardtii whole cell biosensors were successfully coupled to many optical
transduction systems [23, 24, 25], few data are available on its application to amperometric devices 110
[26].
In this paper, we provide in-depth insights into the development of a sensitive, compact and 112
disposable amperometric biosensor exploiting C. reinhardtii cells for a fast evaluation of herbicide
toxicity. In addition to its function in herbicide monitoring, the presented configuration allowed to 114
deepen the knowledge on special features of protein-ligand interaction. The results are discussed
considering different herbicide binding affinities to different herbicide binding niches of PSII D1 116
protein and demonstrate the usefulness of the developed prototype as a promising instrument for
commercial applications. Besides, the exploited C. reinhardtii phenotype is the target of reliable 118
genetic engineering procedures paving the way to the exploration of computational and synthetic
biology approaches to design novel, more selective and sensitive strains. 120
2. Experimental 122
2.1 Chemicals and solutions
All reagents were purchased as high purity grade products from Sigma-Aldrich (St. Louis, Mo, 124
USA). The herbicides linuron (3-(3,4-dichlorophenyl)-1-methoxy-1-methylurea) and simazine (6-
chloro-N,N'-diethyl-1,3,5-triazine-2,4-diamine) were purchased as analytical purity grade powders 126
and dissolved in methanol (HPLC grade, 99.9% minimum purity) to obtain concentrated stock
solutions. Herbicides working solutions were diluted with deionized water and the residual 128
5
methanol concentration kept lower than 0.4% V/V, the minimum assessed value not impairing
photosynthetetic performance (Supporting Information Figure S1). 130
The measuring buffer consisted of 50 mM Tricine, 20 mM CaCl2, 5 mM MgCl2, 50 mM NaCl, 70
mM sucrose, pH=7.2. The storage buffer consisted of 50 mM Tricine, 20 mM CaCl2, 5 mM MgCl2, 132
70 mM sucrose pH=7.2
134
2.2 Growth conditions of the algal cultures
The Intron-Less (IL) C. reinhardtii strain was exploited throughout the work [27]. Cell cultures 136
were grown in Tris–Acetate-Phosphate (TAP) medium, pH 7.2 [28], at 25°C and 150 rpm stirring,
under continuous 50 μmol photons m-2
s-1
white light intensity. 138
2.3 Characterization of the algal cultures 140
Cell density was determined spectrophotometrically by the culture absorbance (Abs) at 750 nm.
Cell number was determined by a Bio-Rad TC-10 automated counter (Hemel Hempstead, U.K.). 142
All experiments were performed exploiting cell cultures in early mid-exponential growth phase, e.g.
Abs750~0.5, corresponding to (8±2)×105 cells/ml. Before each immobilization, the biological 144
material was characterized in terms of chlorophyll concentration, cells number and fluorescence
yield to ensure reproducible procedures on viable cells. Total chlorophyll concentration was 146
determined spectrophotometrically in 80% acetone as previously reported [29]. The fluorescence
yield was evaluated measuring the chlorophyll fluorescence induction curve by a Plant Efficiency 148
Analyzer (PEA, Hansatech Instr. Ltd, Kings Lynn, Norfolk, UK). Measurements were carried out at
room temperature on liquid cultures after 10 min of dark adaptation. The excitation light, a 5 s 150
saturating pulse (600 W/m2), was provided by an array of six red light emitting diodes (650 nm
peak) focused on the sample surface. As indicator of the cell photosynthetic performance the 152
maximum quantum yield of PSII photochemical reaction, Fv/Fm= (Fm-F0)/Fm, was used, where F0
and Fm indicate the minimum (50 µs after onset of the excitation light) and the maximum 154
fluorescence intensities, respectively. The variable fluorescence Fv, calculated as Fm-F0, represents
the fraction of photosynthetically active PSII complexes [30]. 156
2.4 Immobilization of cells on screen-printed electrodes 158
Approximately 1.2×10⁷ cells were harvested by means of 5 min centrifugation at 2000 g and
15°C. The cell pellet was washed, resuspended in 50 mM Tricine-NaOH pH 7.2 to a final volume 160
of 50 µl, and mixed with 100 µl of a 2% w/V sodium alginate solution in the same buffer. Later on,
6
5 µl of this viscous suspension, containing ~4×10⁵
cells, were deposited over a Multi-Walled 162
Carbon Nanotube (CNT) working electrode surface (diameter 4.0 mm) of a commercial Screen-
Printed Electrode (SPE, by DRP-110CNT, DropSens, Oviedo, Spain), equipped with a CNT-made 164
counter electrode and an Ag/AgCl reference electrode). Finally, the CNT-SPE hosting C.
reinhardtii cells (hereafter referred as SPEC) was immersed 20 minutes in 50 mM Tricine-NaOH 166
containing 200 mM CaCl2 to allow the physical gelation of the alginate and the consequent
entrapment of cells on the working electrode. 168
2.5 Biosensor measuring set-up 170
In addition to the previously described SPEC, the whole measuring set-up included a
potentiostat (PG581 model, Uniscan Instruments Ltd, Buxton, UK); and an electro-mechanical 172
portable device (the AMPBIO-SPE instrument, Biosensor s.r.l., Rome, Italy) equipped with a
peristaltic pump and a Delrin®-made flow chamber (30 mm in diameter and 25 mm height), hosting 174
the slit for SPEC insertion. In the flow chamber, two red LEDs (λ= 650 nm, 325 μmol m-2
s-1
total
light intensity) placed at the bottom surface, periodically stimulate the photosynthetic activity of 176
immobilized algal cells during electrochemical tests. For dynamic mode measurements, the
chamber was connected in aspiration mode to the measuring buffer reservoir by chemically inert 178
polytetrafluoroethylene tubes (to avoid possible not specific adsorption of herbicides) [31] and to
disposal container by silicone (Masterflex) tubes (Figure 1). 180
The above mentioned apparatus was equipped also with an electronic control board for data read-
out, processing, storage and transfer to a PC laptop, and was exploited for both voltammetric (static 182
mode) and amperometric (dynamic mode) tests on SPEC. Displayed programmable parameters
were LED intensity, photoperiod (light/dark sequence), flow rate, other than specific 184
electrochemical parameters.
186
2.6 Cyclic voltammetry on screen-printed biosensors
Cyclic voltammetry (CV) tests in both dark and light conditions were carried out at room 188
temperature in steady-state (static) mode, stopped-flow, on a SPEC inserted in the measurement
chamber. The applied potential ranged from -1.0 to +0.5 V, at 0.02 V/s scan rate. Measurements 190
were performed on SPECs wetted by 70 µl of measurement buffer solution. Three consecutive
scans were done on each SPEC to prove the electrochemical stability of the signal. CV 192
measurements at different scan rates (0.01÷0.15 V/s) were also performed.
194

7
2.7 Chronoamperometry on SPECs
Chronoamperometric (CA) tests were performed measuring the current intensity against time at 196
the constant potential of -0.7 V vs Ag/AgCl and room temperature. According to CV tests, this
potential corresponds to reduction of the photosynthetically generated O2 on the electrode. In 198
dynamic mode system, the flow rate of the measuring buffer solution was 0.1 ml/min. The
measurement protocol consisted of repetitive cycles of 30s light/5min dark. The current intensities 200
generated by algae upon illumination were in the microamperes (A) range, and were calculated as
difference between current intensities produced in dark and light conditions. 202
A two steps-working protocol was adopted. First, the time evolution of the current signal was
recorded in the absence of herbicide (i0). After stabilization of the signal, a herbicide solution 204
suitably diluted in the measuring buffer was pumped through the biosensor chamber, and the
residual photosynthetic activity was measured as the intensity of the residual current peak (iH). The 206
reversibility of the inhibition signal was measured by registering a recovered current peak (iR) once
i0 and iH were acquired. After each herbicide addition, the biosensor apparatus was extensively 208
washed with the measuring buffer. The flow chamber and the tubes were daily washed with a 25%
V/V ethanol/water solution and extensively rinsed with distilled water. The intensity of i0, iH and iR 210
currents was averaged at least on three stable peaks as difference between the peak intensity and the
previous baseline. Measurements were repeated at least three times. 212
2.8 Storage and operational stability 214
Storage stability tests were performed by leaving a wide set of freshly prepared SPECs immersed in
storage buffer at room temperature and 10 μmol m-2
s-1
light intensity (standard indoor 216
illumination), for 40 days. The current signal of each SPEC was checked at the onset of the test,
obtaining a maximum 5% variation around the average value. At defined time intervals, at least two 218
SPECs were drawn from storage buffer for CA tests of the current signal, obtaining reproducibility
within 5%. The SPEC operational stability instead was evaluated by standard CA tests running for 220
many hours at room temperature and under the usual light/dark cycle.
222
2.9 Determination of inhibition ratio percentage, I50 and LOD
The inhibition ratio percentage (Inh%) of the signal was given by: 224
(1) 𝐼𝑛ℎ% = 1 −
𝑖𝐻𝑖0
× 100

8
where i0 and iH were reduction currents (i.e. peak amplitudes from the baseline level) before and 226
after the injection of the herbicide, respectively. Inh % values referred to individual analysed SPECs
and were drawn from an average of at least three stable and comparable peaks (standard error being 228
lower than 3%). For the dose-response curve at least three independently prepared SPEC were used
for each concentration: the reproducibility on Inh % values was obtained within 5%. 230
The dose-response curves were analysed by fitting the experimental points to typical isothermal
binding equations considering one and two herbicide binding sites. The inhibition ratio percentage 232
(Inh%) of the oxygen reduction current for algal SPECs treated with triazine or urea herbicides of
concentration [H] is estimated by : 234
(2a)
for a single binding site, and by: 236
(2b)
for two binding sites, where IMAX and I50 are the maximum inhibition induced by high 238
concentrations of herbicide, and the concentration of herbicide leading to a 50% signal decrease,
respectively. The indexes 1 and 2 indicate the independent contributions of the two binding sites to 240
maximum total inhibition and I50 values. In order to observe distinguishable binding sites, the
unique constraint to the fit operation was that the imposition of the two inhibition constants (I50,1 242
and I50,2), differ for at least one order of magnitude, as previously reported [32]. The limits of
detection (LOD) of our biosensors in the determination of linuron and simazine were derived by the 244
two-sites fitting curve, more accurate, according to:
502.6 ILOD =
100 2.6
(3) 246
where 2.6×σ represents the mean standard error of the measurements increased by factor of 2.6.
This latter value corresponds to a 99% confidence interval for a normal statistical distribution of 248
values [33].
250
2.10 Oxygen evolution rate measurements
The oxygen evolution rate in the presence of herbicides was measured on algal cultures containing 252
15 µg/ml chlorophyll by a Clark-type oxygen electrode (Chlorolab 2, Hansatech Instr. Ltd, Kings
Lynn, Norfolk, UK). The measurements were performed at 24 °C under continuous stirring and 254
illumination (350 µmol/m2/s
1) in the presence of 10 mM NaHCO3 as an additional carbon source
𝐼𝑛ℎ% =𝐼𝑀𝐴𝑋 × 𝐻
𝐼50 + 𝐻
𝐼𝑛ℎ% = IMAX ,1 × H
I50,1 + H +
IMAX ,2 × H
I50,2 + H

9
[34]. The registration started immediately after the herbicide solution supply in the electrode 256
chamber and continued for 5 min. The final concentration of methanol (from herbicide solutions) in
algal samples was always kept lower than 0.02% V/V, recognized as not interfering with algal 258
performances.
260
2.11 Fluorescence induction transient
The herbicide toxicity was also evaluated by registering chlorophyll a fluorescence induction 262
curves. The measurements were performed on liquid cultures containing 15 µg/ml chlorophyll, after
10 min incubation with the corresponding herbicide concentration for 10 min under 50 µmol/m2/s
1 264
irradiation, 24 °C temperature and 150 rpm agitation. The inhibition of the electron transport
efficiency between PSII primary (QA) and secondary (QB) quinone acceptors was estimated by the 266
decrease of parameter 1-VJ, where 1-VJ=1-[(F2ms-F0)/(Fm-F0)] [30]. F2ms is the fluorescence level at
2 ms after the onset of the excitation, the so called J step in the fluorescence transient. In the 268
presence of herbicides, the relative variable fluorescence at J step (VJ) increase proportionally to the
herbicide concentration, revealing the progressive inhibition of the QA-QB electron transfer and 270
accumulation of QA reduced form. The final methanol concentration in algal samples was always
kept lower than 0.02% V/V, recognized as not interfering with algal performances. 272
2.12 Statistical analysis 274
Data from at least three separate experiments were analyzed and presented as the mean ± standard
deviation. For a given experiment, each condition was tested in triplicate. One-way ANOVA 276
analysis with a statistical significance level of 0.05 was used to examine the effect of electrode
loading and SPECs responses to herbicides. 278
3. Results and Discussion 280
A whole cell-based biosensor integrating C. reinhardtii intact cells has been developed to
amperometrically detect toxic herbicides. Typically, drawbacks of whole cells as biosensing 282
elements are low sensitivity and poor selectivity. However, some recent advances in
microelectronic and nanotechnology fields offer new opportunities to smooth these weaknesses, 284
mainly through the development of supporting photoactive materials, microelectrode arrays, or
microfluidic miniaturization [35]. In a similar manner, the adoption of a proper immobilization 286
technique for the biological material can help to overcome response instability and short-term
viability, and increase sensitivity and selectivity. In this research, we utilized the C. reinhardtii 288

10
strain IL, previously exploited for the production of PSII-D1 mutants efficiently working in optical
devices. Standing out on the others, IL provided lots of strengths to assemble the current measuring 290
set-up detecting different classes of herbicides.
3.1 Immobilization of algae cells 292
In an attempt to preserve maximal photosynthetic functionality when in contact with solid state
device, C. reinhardtii cells were immobilized on the surface of SPEs by physical entrapment in a 294
calcium alginate matrix. This highly biocompatible polysaccharide is well-known to induce
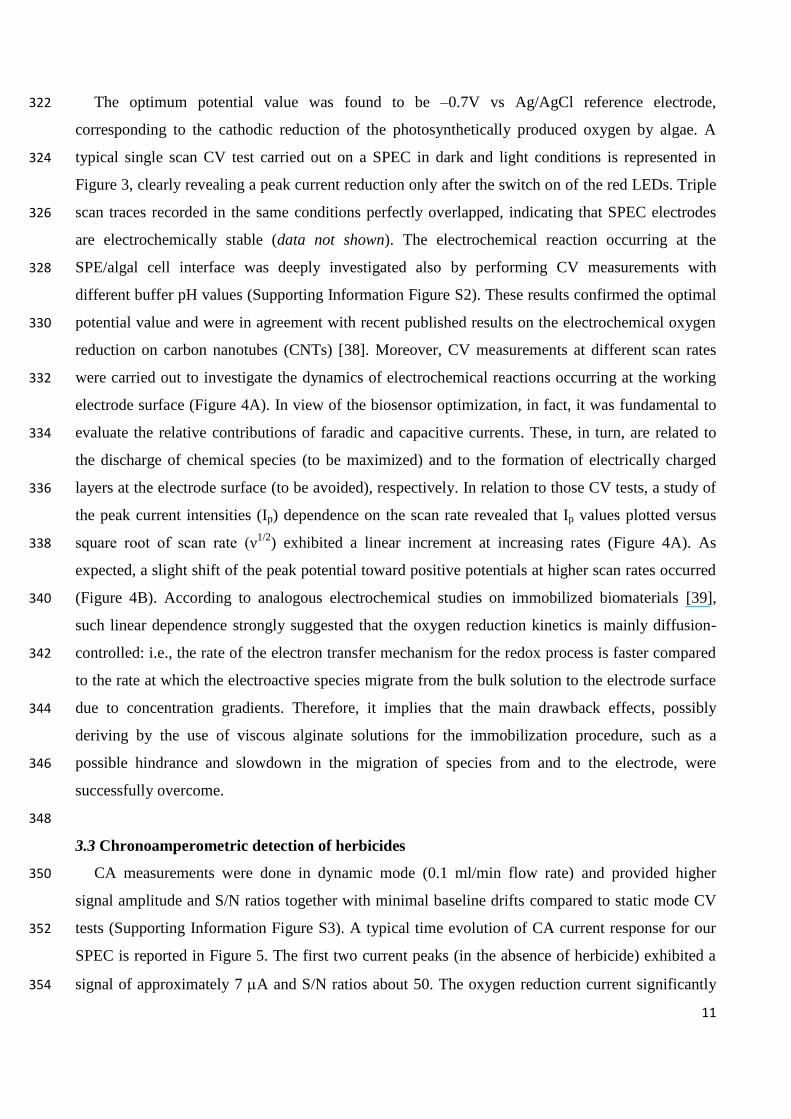
minimum collateral adverse effects on C. reinhardtii metabolism, mainly with respect to respiratory 296
and photosynthetic activities. Furthermore, the open lattice structure provides a porous network
with high diffusion rates for efficient exchange of substrates and products [36]. 298
The alginate-based immobilization procedure developed in the actual study offered a higher
performance compared to alternative materials such as nafion [26]. Specifically, C. reinhardtii 300
cultures on a SPE should provide the electroactive species necessary to reveal toxicants affecting
the photosynthetic performance. Working with oxygenic photosynthetic organisms, the research 302
was directed towards the detection of reduction currents produced by light-induced oxygen
evolution. Because the latter is strictly related to the cell population features within the unit area of 304
the working electrode, the algal cell density and related chlorophyll content were the first set-up
parameters. Several SPEs with different number of immobilized cells (and related chlorophyll 306
content) were tested to optimize the electrochemical signal in terms of peak current intensity and
signal to noise ratio (S/N). Figure 2 shows that the highest signal is reached when approximately 308
4×10⁵ cells (containing 5-10 µg chlorophyll) are immobilized on a single SPEC (SPE hosting C.
reinhardtii cells). Data points were fitted with a quadratic function and followed an inverted U-310
shaped trend, typical of hormetic models describing a biphasic dose/response curves [37].
Accordingly, the reported cell density represents the threshold value in order to maintain functional 312
and efficient biosensing elements.
314
3.2 Cyclic voltammetry experiments
Cyclic voltammetry (CV) tests were carried out in dark and light conditions aiming to: i) select 316
the best working electrode material; ii) find out the optimal potential value to maximize the current
signal in chronoamperometry experiments; iii) identify the electrochemical reaction occurring at the 318
electrode surface. Among the common tested materials, CNT SPEs allowed electrochemical
measurements with less interferences and improved response compared to graphite, which provided 320
parasite currents, and gold, which revealed to be sensitive to discharge of contaminant species.
11
The optimum potential value was found to be –0.7V vs Ag/AgCl reference electrode, 322
corresponding to the cathodic reduction of the photosynthetically produced oxygen by algae. A
typical single scan CV test carried out on a SPEC in dark and light conditions is represented in 324
Figure 3, clearly revealing a peak current reduction only after the switch on of the red LEDs. Triple
scan traces recorded in the same conditions perfectly overlapped, indicating that SPEC electrodes 326
are electrochemically stable (data not shown). The electrochemical reaction occurring at the
SPE/algal cell interface was deeply investigated also by performing CV measurements with 328
different buffer pH values (Supporting Information Figure S2). These results confirmed the optimal
potential value and were in agreement with recent published results on the electrochemical oxygen 330
reduction on carbon nanotubes (CNTs) [38]. Moreover, CV measurements at different scan rates
were carried out to investigate the dynamics of electrochemical reactions occurring at the working 332
electrode surface (Figure 4A). In view of the biosensor optimization, in fact, it was fundamental to
evaluate the relative contributions of faradic and capacitive currents. These, in turn, are related to 334
the discharge of chemical species (to be maximized) and to the formation of electrically charged
layers at the electrode surface (to be avoided), respectively. In relation to those CV tests, a study of 336
the peak current intensities (Ip) dependence on the scan rate revealed that Ip values plotted versus
square root of scan rate (ν1/2
) exhibited a linear increment at increasing rates (Figure 4A). As 338
expected, a slight shift of the peak potential toward positive potentials at higher scan rates occurred
(Figure 4B). According to analogous electrochemical studies on immobilized biomaterials [39], 340
such linear dependence strongly suggested that the oxygen reduction kinetics is mainly diffusion-
controlled: i.e., the rate of the electron transfer mechanism for the redox process is faster compared 342
to the rate at which the electroactive species migrate from the bulk solution to the electrode surface
due to concentration gradients. Therefore, it implies that the main drawback effects, possibly 344
deriving by the use of viscous alginate solutions for the immobilization procedure, such as a
possible hindrance and slowdown in the migration of species from and to the electrode, were 346
successfully overcome.
348
3.3 Chronoamperometric detection of herbicides
CA measurements were done in dynamic mode (0.1 ml/min flow rate) and provided higher 350
signal amplitude and S/N ratios together with minimal baseline drifts compared to static mode CV
tests (Supporting Information Figure S3). A typical time evolution of CA current response for our 352
SPEC is reported in Figure 5. The first two current peaks (in the absence of herbicide) exhibited a
signal of approximately 7 A and S/N ratios about 50. The oxygen reduction current significantly 354

12
increased under illumination, since oxygen concentration increased at the electrode surface as a
result of the algal photosynthesis. A saturation steady state was rapidly reached after 30 s of 356
illumination, probably due to the small thickness of the alginate/algae cells layer which allowed a
steady state oxygen accumulation in a short time. Subsequently, a dark time interval of 5 min was 358
applied for relaxation of the bio-recognition element. During this interval, the reduction current
suddenly decreased, due to dissipation of photosynthetic oxygen from the electrode surface and its 360
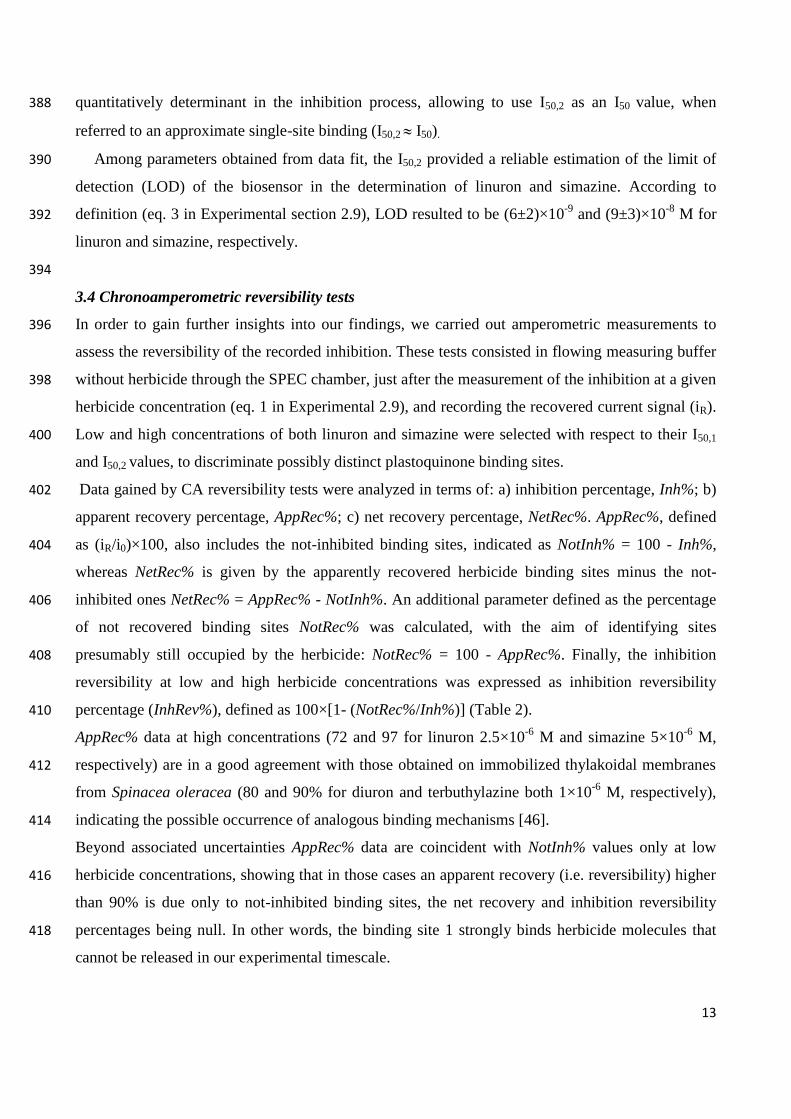
consumption by the dark respiration of algae. Such results further demonstrate that immobilized
algae retained sufficient photosynthetic activity. The set-up of this photoperiod allowed to optimise 362
the S/N ratio and was applied throughout the experiments.
Figure 5 also shows that the oxygen reduction current decreased in response to the addition of 364
linuron herbicide. Hence, the sensitivity of the developed biosensor was evaluated at different
concentrations of linuron and simazine, a urea-derivative and a triazine-type herbicide, respectively. 366
Such herbicides bind to the D1 protein of the algal PSII complex blocking the photosynthetic
electron transfer from QA to QB [40]. The dose-response curves reporting the inhibition ratio 368
percentage of the oxygen reduction current (Inh%) vs. molar herbicide concentration are depicted in
Figure 6 (black circles). Figure 6A shows the linuron dose-response curve obtained exploiting two 370
conventional experimental methods, namely oxygen evolution rate (grey x-shaped crosses) and
fluorescence yield (hollow circles). Both data sets are in good agreement with amperometric results, 372
and as a whole share a common experimental trend.
The dose-response curves were analysed by fitting the amperometric experimental points to 374
typical isothermal binding equations, hypothesizing alternatively one and two herbicide binding
sites (eq. 2a and 2b, Experimental section 2.9, respectively). At low concentrations, corresponding 376
to the intervals 1×10⁻⁹
÷ 5×10⁻⁸
M for linuron, and 1×10⁻⁸
÷ 5×10⁻⁷
M for simazine, the equation
(2a) provided an unsatisfying fit of experimental CA data (dashed line, Figure 6). On this basis, and 378
to take into account the existence of an additional plastoquinone binding site, the QC site, proved by
crystallographic and biophysical data [41-45], the herbicide inhibition dose-response experimental 380
points were fitted also to a two sites binding equation. The obtained curves, represented by the solid
lines in Figures 6A and 6B, were characterized by the functional parameters reported in Table 1. 382
The two sites fit equation clearly exhibits a much better agreement with experimental data than the
single site option, hence supporting the issue of a biphasic binding of herbicides to algal PSII 384
immobilized in SPECs. The fit uncertainty is more significant on IMAX,1 and I50,1 values which bear
50% relative errors. On the other side, the more accurately determined I50,2 parameter was 386
responsible of at least 90% total inhibition. Therefore, the second site is by far the most
13
quantitatively determinant in the inhibition process, allowing to use I50,2 as an I50 value, when 388
referred to an approximate single-site binding (I50,2 I50).
Among parameters obtained from data fit, the I50,2 provided a reliable estimation of the limit of 390
detection (LOD) of the biosensor in the determination of linuron and simazine. According to
definition (eq. 3 in Experimental section 2.9), LOD resulted to be (6±2)×10-9
and (9±3)×10-8
M for 392
linuron and simazine, respectively.
394
3.4 Chronoamperometric reversibility tests
In order to gain further insights into our findings, we carried out amperometric measurements to 396
assess the reversibility of the recorded inhibition. These tests consisted in flowing measuring buffer
without herbicide through the SPEC chamber, just after the measurement of the inhibition at a given 398
herbicide concentration (eq. 1 in Experimental 2.9), and recording the recovered current signal (iR).
Low and high concentrations of both linuron and simazine were selected with respect to their I50,1 400
and I50,2 values, to discriminate possibly distinct plastoquinone binding sites.
Data gained by CA reversibility tests were analyzed in terms of: a) inhibition percentage, Inh%; b) 402
apparent recovery percentage, AppRec%; c) net recovery percentage, NetRec%. AppRec%, defined
as (iR/i0)×100, also includes the not-inhibited binding sites, indicated as NotInh% = 100 - Inh%, 404
whereas NetRec% is given by the apparently recovered herbicide binding sites minus the not-
inhibited ones NetRec% = AppRec% - NotInh%. An additional parameter defined as the percentage 406
of not recovered binding sites NotRec% was calculated, with the aim of identifying sites
presumably still occupied by the herbicide: NotRec% = 100 - AppRec%. Finally, the inhibition 408
reversibility at low and high herbicide concentrations was expressed as inhibition reversibility
percentage (InhRev%), defined as 100×[1- (NotRec%/Inh%)] (Table 2). 410
AppRec% data at high concentrations (72 and 97 for linuron 2.5×10⁻⁶
M and simazine 5×10⁻⁶
M,
respectively) are in a good agreement with those obtained on immobilized thylakoidal membranes 412
from Spinacea oleracea (80 and 90% for diuron and terbuthylazine both 1×10⁻⁶
M, respectively),
indicating the possible occurrence of analogous binding mechanisms [46]. 414
Beyond associated uncertainties AppRec% data are coincident with NotInh% values only at low
herbicide concentrations, showing that in those cases an apparent recovery (i.e. reversibility) higher 416
than 90% is due only to not-inhibited binding sites, the net recovery and inhibition reversibility
percentages being null. In other words, the binding site 1 strongly binds herbicide molecules that 418
cannot be released in our experimental timescale.
14
On the contrary, high herbicide concentrations leading to significant inhibition (70÷80%) exhibit 420
high AppRec% values which, corrected for the not-inhibited (NotInh%) site percentages, indicate
high net recovery (NetRec% column) and inhibition reversibility (InhRev%) results, reaching almost 422
100% reversibility for simazine. The latter interacts less strongly with the binding site 2 compared
to linuron, as revealed by the difference of more than one order of magnitude between their I50,2 424
parameters (Table 2). In fact, a lower affinity of the binding site 2 for a specific herbicide compared
to the binding site 1 leads to a higher degree of inhibition reversibility. 426
Table 2 results confirm that two binding sites are involved in the inhibition process: (i) a higher
affinity site intervening at very low inhibitor concentrations (1÷10×10-9
M for linuron, 10÷100×10-9
428
M for simazine), and (ii) a lower affinity site, interacting with herbicides only at concentrations of
10 and 100×10-9
M for linuron and simazine, respectively. Assuming the I50 parameter equivalent to 430
the KD dissociation constant for the binding process [12], our data provide evidence of a higher
affinity of the binding site 1 compared to the binding site 2. 432
Similarly, a recent computational analysis predicted different binding and interaction energies of
plastoquinone to the QA, QB and QC sites [45]. Actually, to our knowledge, it is not clear if simazine 434
and linuron bind to the novel identified QC sites. However, alternative interpretations for the
biphasic binding of herbicides have been reported, including the existence of a heterogeneous 436
occupancy of the QB site, specific illumination effects on the QB quinones population, influence of
the chemical environment on the QB binding niche herbicide affinity, type of herbicides, or the 438
redox state of the electron transport carriers [43,44,47]. These factors could contribute to the high
uncertainties of the reported IMAX,1 and I50,1. 440
3.5 Storage and operational stability
For the first 3 days after preparation, SPECs stored at (25±2)°C under environmental illumination in 442
storage buffer, exhibited no detectable loss of photosynthetic activity, expressed as percentage of
residual oxygen reduction current, hence referred as percentage of storage stability. After 10 days in 444
the same conditions, SPEC retained 90% of their initial activity, and 75% within 20 days (Figure 7).
In the following period, a more pronounced drop of the current signal and S/N ratio occurred, with 446
20% of the original current still detectable after 40 days.
In relation to operational stability, SPEC were 100% active, reliable and reproducible for the first 3 448
hours. Later on, a progressive drop of signal and S/N ratio took place due to a decrease of algal
photosynthetic activity. The slope of the bio-recognition element decomposition was biphasic with 450
half-life reached in 9 hours. Such results guarantee a reliable use of SPECs even 10÷20 days after
preparation, and prompt their exploitation for in field monitoring of herbicides. 452

15
4. Conclusions 454
All the above illustrated features largely encourage the use of our algal amperometric biosensor
for environmental monitoring purposes. A comparison with similar biosensing devices [13,14,46] 456
indicates improved operational features, in terms of signal amplitude, S/N ratio, and sensitivity
parameters, including I50 and LOD (Table 3). Although conventional techniques, such as HPLC and 458
GC, still represent the best solution for more accurate analyses, most of them are time consuming,
especially in the case of routine analyses, and require very expensive equipment. Our biosensor, on 460
the contrary, has been specifically designed for an easy, low-cost, and fast pre-screening of
photosynthetic herbicides and could be adopted to support laboratory analyses in the evaluation of 462
water samples toxicity.
Besides the set-up of a smart device, our chronoamperometric data gain renewed interest on the 464
unsolved question of the QB occupancy and/or the occurrence of different herbicides binding sites
with different binding affinities, that is of great relevance for the assessment of herbicides 466
monitoring reliability.
468
Acknowledgments
This work was supported by the EU grant FP7-SME-2008-1, 232522, SENSBIOSYN Project 470
(2009-2011) and was implemented through the COST action TD1102: Phototsynthetic proteins for
technological applications (2012-2015). The authors are grateful to Dr. Amina Antonacci for 472
technical assistance in oxygen evolution and fluorescence data measurements, and manuscript and
artwork preparation. 474
Figure and Table Captions 476
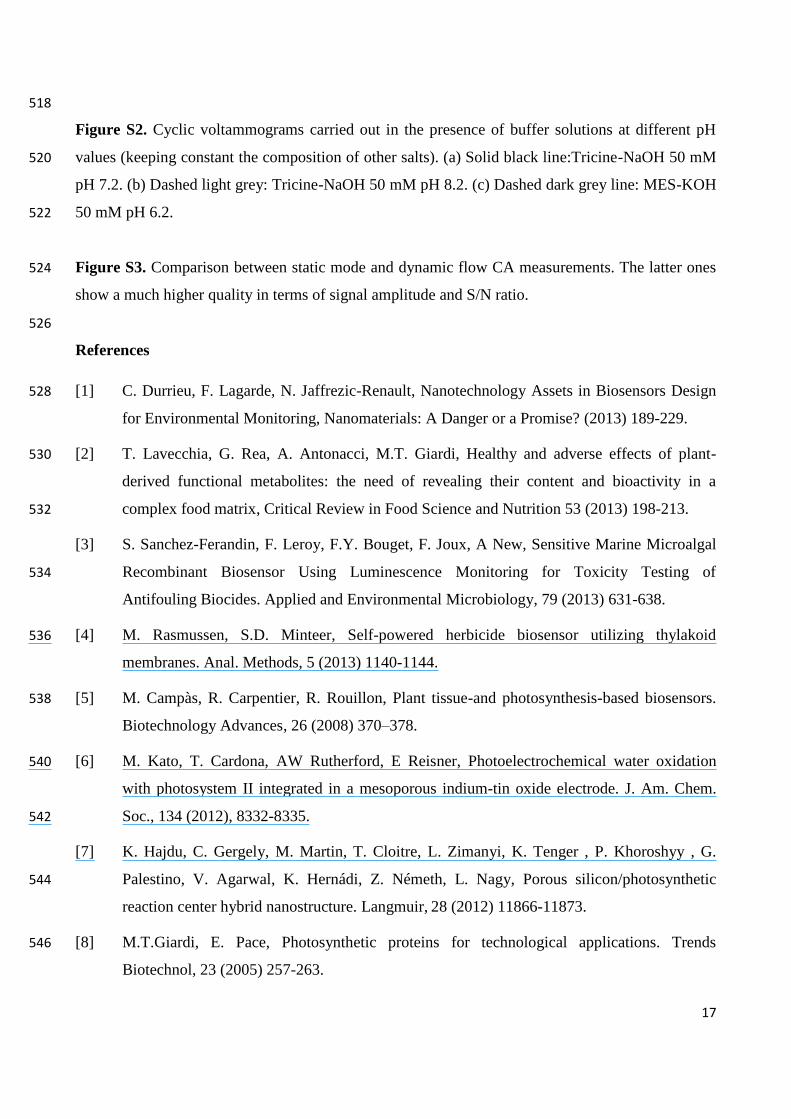
Figure 1. A) Whole biosensor set-up: a) AMPBIO-SPE electrochemical instrument; b) flow 478
chamber; c) potentiostat. The apparatus is interfaced with a laptop computer. B) Enlargement of the
flow chamber, with switched on red light, and SPEC (back white surface shown) ready to be 480
inserted.
482
Figure 2. Photo-electrochemical current intensity as a function of immobilised cells number.
484
16
Figure 3. Cyclic voltammograms (0.02 V/s scan rate) of C. reinhardtii cells immobilized onto CNT
SPEs wetted with 70 µl 50 mM Tricine, 20 mM CaCl2, 5 mM MgCl2, 50 mM NaCl, 70 mM sucrose 486
buffer pH 7.2, in dark (dashed trace) and continuous light conditions (650 nm LED, solid) overlaid.
488
Figure 4. A) Cyclic voltammograms obtained at different scan rates (ν) from 0.020 to 0.150 V/s
under dark/light conditions. For the sake of clarity, only the 0.020 V/s trace is reported among very 490
similar, overlapped dark adapted ones. B) Peak current intensities (Ip) linearly increase with the
square root of the corresponding scan rates (ν1/2
). 492
Figure 5. Current measurements in the presence of red light (dark line) and after addition of linuron 494
5×10⁻⁷
M.
496
Figure 6. Data fitting of the dose-response curves of SPECs to linuron (A) and simazine (B).
Amperometric data are indicated as black circles. Data fitting by isothermal binding equations at 498
one (dashed line) and two sites (solid line) are both represented. In addition, panel A also shows
oxygen evolution rate (grey x-shaped crosses) and fluorescence induction (hollow circles) 500
measurements in the presence of linuron.
502
Figure 7. Percentage of SPEC storage stability in 50mM Tricine, 20 mM CaCl2, 5 mM MgCl2, 70
mM sucrose buffer pH 7.2, at room temperature and standard indoor illumination (10 μmol m-2
s-1
504
light intensity).
506
Table 1. Fitting parameters obtained for linuron and simazine by CA measurements.
508
Table 2. Inhibition parameters derived by chronoamperometric reversibility tests.
510
Table 3. Comparison of technical and analytical features of the actual SPEC biosensor and similar
devices reported in literature. 512
Supporting information. 514
Figure S1. Effect of different methanol concentrations on photo-electrochemical current 516
measurements.
17
518
Figure S2. Cyclic voltammograms carried out in the presence of buffer solutions at different pH
values (keeping constant the composition of other salts). (a) Solid black line:Tricine-NaOH 50 mM 520
pH 7.2. (b) Dashed light grey: Tricine-NaOH 50 mM pH 8.2. (c) Dashed dark grey line: MES-KOH
50 mM pH 6.2. 522
Figure S3. Comparison between static mode and dynamic flow CA measurements. The latter ones 524
show a much higher quality in terms of signal amplitude and S/N ratio.
526
References
[1] C. Durrieu, F. Lagarde, N. Jaffrezic-Renault, Nanotechnology Assets in Biosensors Design 528
for Environmental Monitoring, Nanomaterials: A Danger or a Promise? (2013) 189-229.
[2] T. Lavecchia, G. Rea, A. Antonacci, M.T. Giardi, Healthy and adverse effects of plant-530
derived functional metabolites: the need of revealing their content and bioactivity in a
complex food matrix, Critical Review in Food Science and Nutrition 53 (2013) 198-213. 532
[3] S. Sanchez-Ferandin, F. Leroy, F.Y. Bouget, F. Joux, A New, Sensitive Marine Microalgal
Recombinant Biosensor Using Luminescence Monitoring for Toxicity Testing of 534
Antifouling Biocides. Applied and Environmental Microbiology, 79 (2013) 631-638.
[4] M. Rasmussen, S.D. Minteer, Self-powered herbicide biosensor utilizing thylakoid 536
membranes. Anal. Methods, 5 (2013) 1140-1144.
[5] M. Campàs, R. Carpentier, R. Rouillon, Plant tissue-and photosynthesis-based biosensors. 538
Biotechnology Advances, 26 (2008) 370–378.
[6] M. Kato, T. Cardona, AW Rutherford, E Reisner, Photoelectrochemical water oxidation 540
with photosystem II integrated in a mesoporous indium-tin oxide electrode. J. Am. Chem.
Soc., 134 (2012), 8332-8335. 542
[7] K. Hajdu, C. Gergely, M. Martin, T. Cloitre, L. Zimanyi, K. Tenger , P. Khoroshyy , G.
Palestino, V. Agarwal, K. Hernádi, Z. Németh, L. Nagy, Porous silicon/photosynthetic 544
reaction center hybrid nanostructure. Langmuir, 28 (2012) 11866-11873.
[8] M.T.Giardi, E. Pace, Photosynthetic proteins for technological applications. Trends 546
Biotechnol, 23 (2005) 257-263.

18
[9] E. Touloupakis, C. Boutopoulos, K. Buonasera, I. Zergioti, M.T. Giardi, A photosynthetic 548
biosensor with enhanced electron transfer generation realized by laser printing technology.
Analytical and bioanalytical chemistry, 402 (2012) 3237-3244. 550
[10] R. Rouillon, P. Euzet, R. Carpentier, Stabilization of photosynthetic materials. Methods Mol
Biol. 274 (2004) 261-269. 552
[11] V.E. Piletska, S.A. Piletsky, Application of Chloroplast D1 Protein in Biosensors for
Monitoring Photosystem II-Inhibiting Herbicides, In: M.T.Giardi, E.V. Piletska (Eds), 554
Biotechnological Applications of Photosynthetic Proteins: Biochips, Biosensors and
Biodevices, Landes Bioscience. Georgetown, TX: Springer publishers, (2006), pp.130-146. 556
[12] I. Shitanda, K. Takada, Y. Sakai, T. Tatsuma, Compact Amperometric Algal Biosensors for
the Evaluation of Water Toxicity Analytica Chimica Acta 530 (2005) 191–197. 558
[13] I. Shitanda, S. Takamatsu, K. Watanabe, M. Itagaki. Amperometric Screen-Printed Algal
Biosensor with Flow Injection Analysis System for Detection of Environmental Toxic 560
Compounds Electrochim. Acta, 54 (2009) 4933- 4936.
[14] C. Vedrine, J.C. Leclerc, C. Durrieu, C. Tran-Minh, Optical whole-cell biosensor using 562
Chlorella vulgaris designed for monitoring herbicides. Biosens. Bioelectron., 18 (2003) 457-
463. 564
[15] S. Buchinger, G. Reifferscheid, Whole cell biosensors: applications to environmental health,
In: Biosensors and Environmental Health, V.R. Preedy, V. Patel (Eds), CRC Press, Taylor & 566
Francis Group (2012) pp. 107-126.
[16] E.H. Harris, “The Genus Chlamydomonas”, In: The Chlamydomonas sourcebook, E.H. 568
Harris (Ed), 2nd edn., Elsevier, Oxford, U.K. (2009) pp. 1-24.
[17] S.S. Merchant, S.E. Prochnik, O. Vallon, E.H. Harris, S.J. Karpowicz, et al., The 570
Chlamydomonas genome reveals the evolution of key animal and plant functions. Science,
318 (2007) 245-250. 572
[18] S. Wilski, U. Johanningmeier, S. Hertel, W. Oettmeier, Herbicide binding in various mutants
of the photosystem II D1 protein of Chlamydomonas reinhardtii. Pesticide Biochemistry and 574
Physiology, 84 (2006) 157–164.
[19] W. Oettmeier, Herbicide resistance and supersensitivity in photosystem II. Cell Mol Life 576
Sci, 55 (1999) 1255–1277.

19
[20] W. Oettmeier, U. Hilp, W. Draber, C. Fedtke, R.R. Schmidt, Structure-activity relationships 578
of triazinone herbicides on resistant weeds and resistant Chlamydomonas reinhardtii. Pest
Sci, 33 (1991) 399–409. 580
[21] S. Wilski, U. Johanningmeier, S. Hertel, W. Oettmeier, Herbicide binding in various mutants
of the photosystem II D1 protein of Chlamydomonas reinhardtii. Pest Biochem Physiol, 84 582
(2006) 157–164.
[22] G. Rea, F. Polticelli, A. Antonacci,V. Scognamiglio, P. Katiyar, S. A. Kulkarni, U. 584
Johanningmeier, M. T. Giardi, Structure-based design of novel Chlamydomonas reinhardtii
D1-D2 photosynthetic proteins for herbicide monitoring, Protein Sci., 18 (2009) 2139-2151. 586
[23] V. Scognamiglio, D. Raffi, M. Lambreva, G. Rea, A. Tibuzzi, et al., Chlamydomonas
reinhardtii genetic variants as probes for fluorescence sensing system in detection of 588
pollutants, Anal. Bioanal. Chem., 394 (2009) 1081-1087.
[24] M. T. Giardi, V. Scognamiglio, G. Rea, G. Rodio, A. Antonacci, et al., Optical biosensors 590
for environmental monitoring based on computational and biotechnological tools for
engineering the photosynthetic D1 protein of Chlamydomonas reinhardtii, Biosensors and 592
Bioelectronics, 25 (2009) 294-300.
[25] K. Buonasera, G. Pezzotti, V. Scognamiglio, A. Tibuzzi, M. T. Giardi, A new platform of 594
biosensors for pre-screening of pesticide residues to support laboratory analyses, J. Agric.
Food Chem., 58 (2010) 5982–5990. 596
[26] V. Scognamiglio, I. Pezzotti, G. Pezzotti, J. Cano, I. Manfredonia, et al., Towards an
integrated biosensor array for simultaneous and rapid multi-analysis of endocrine disrupting 598
chemicals, Analytica Chimica Acta, 751 (2012) 161–170.
[27] U. Johanningmeier, S. Heiss, Construction of a Chlamydomonas reinhardtii mutant lacking 600
introns in the psbA gene, Plant Mol. Biol., 22 (1993) 91-99.
[28] E. H. Harris, The Chlamydomonas Sourcebook. A comprehensive guide to biology and 602
laboratory use, 1st edn. E. H. Harris (Ed), Acad. Press, Inc., San Diego (1989).
[29] D. A. Walker, Preparation of higher plant chloroplasts, In: Methods in Enzymology, San 604
Pietro A (Ed.), Academic Press, New York, (1980) pp. 94-104.
[30] R. J. Strasser, A. Srivastava, M. Tsimilli-Michael, The fluorescence transient as a tool to 606
characterize and screen photosynthetic samples, In: Probing Photosynthesis: Mechanism,
20
regulation and adaptation, M. Yunus, U. Pathre, P. Mohanty (Eds.) London: Taylor and 608
Francis, UK, (2000) pp. 443–480.
[31] E. Topp, W. Smith, Sorption of the herbicides atrazine and metolachlor to selected plastics 610
and silicone rubber, J. Environ. Qual., 21 (1992) 316-317.
[32] J.W.A. Findlay, R.F. Dillard, Appropriate Calibration Curve Fitting in Ligand Binding 612
Assays. AAPS Journal, 9 (2007) E260-E267.
[33] J. Maly, J. Masojidek, A. Masci, M. Ilie, E. Cianci, V. et al., Direct mediatorless electron 614
transport between the monolayer of photosystem II and poly (mercapto-p-benzoquinone)
modified gold electrode-new design of biosensor for herbicide detection, Biosensors and 616
Bioelectronics, 21 (2005) 923–932.
[34] A. Melis, J. Neidhardt, J.R. Benemann, Dunaliella salina (Chlorophyta) with small 618
chlorophyll antenna sizes exhibit higher photosynthetic productivities and photon use
efficiencies than normally pigmented cells, J. Appl. Phycol., 10 (1999) 515-525. 620
[35] L.G. Turdean, Design and development of biosensors for the detection of heavy metal
toxicity, International Journal of Electrochemistry (2011) 1-15. 622
[36] I. Garbayo, E. Forjàn, A. Salguero, M. Cuaresma, J. M. Vega, C. Vılchez, Enhancement of
photorespiration in immobilized Chlamydomonas reinhardtii cells, Biotechnology Letters, 624
27 (2005) 265–267.
[37] E.J. Calabrese, K.A. Bachmann, A.J. Bailer, P.M. Bolgerd, J. Borake, et al., Biological 626
stress response terminology: Integrating the concepts of adaptive response and
preconditioning stress within a hormetic dose–response framework. Toxicology and Applied 628
Pharmacology, 222 (2007), 122–128.
[38] I. Kruusenberg, L. Matisen, H. Jiang, M. Huuppola, K. Kontturi, K. Tammeveski, 630
Electrochemical reduction of oxygen on double-walled carbon nanotube modified glassy
carbon electrodes in acid and alkaline solutions, Electrochem. Commun., 12 (2010), 920-632
923.
[39] I. S. Lima, A. M. Lazarin, C. Airoldi, Cyclic voltammetric investigations on copper α-N,O-634
succinated chitosan interactions, Carbohydrate Polymers, 64 (2006) 385–390.

21
[40] M. Koblitzek, J. Maly, J. Masojidek, J. Komenda, T. Kucera, et al., A Biosensor for the 636
detection of triazine and phenylurea herbicides designed using photosystem II coupled to a
screen-printed electrode, Biotechnol. Bioeng., 78 (2002) 110-116. 638
[41] A. Guskov, J. Kern, A. Gabdulkhakov, M. Broser, A. Zouni, W. Saenger, Cyanobacterial
photosystem II at 2.9-A resolution and the role of quinones, lipids, channels and chloride. 640
Nat. Struct. Mol. Biol., 16 (2009) 334-342.
[42] J. Kruk, K. Strzalka, Redox changes of cytochrome b(559) in the presence of 642
plastoquinones, J. Biol. Chem. 276 (2001) 86-91.
[43] O. Kaminsakaya, V. A. Shuvalov, G. Renger, Evidence for a novel quinone-binding site in 644
the photosystem II (PS II) complex that regulates the redox potential of cytochrome b559,
Biochemistry, 46 (2007) 1091-1105. 646
[44] M. Broser, C. Glöckner, A. Gabdulkhakov, A. Guskov, J. Buchta, et al., A. Zouni, Structural
basis of cyanobacterial photosystem II Inhibition by the herbicide Terbutryn, J Biol Chem. 648
286 (2011) 15964-15972.
[45] K. Hasegawa & T. Noguchi, Molecular interactions of the quinone electron acceptors Q (A), 650
Q (B), and Q (C) in photosystem II as studied by the fragment molecular orbital method.
Photosynth Res. (2012). DOI 10.1007/s11120-012-9787-9 652
[46] E. Touloupakis, L. Giannoudi, SA Piletsky, L. Guzzella, F. Pozzoni, et al., A multi-
biosensor based on immobilized Photosystem II on screen-printed electrodes for the 654
detection of herbicides in river water. Biosens Bioelectron 20 (2005) 1984-1992.
[47] Z. Drechsler & J. Neumann, A differential effect of 3-(3'4' dichlorophenyl)-l,1 dimethyl urea 656
and atrazine on fluorescence kinetics in chloroplasts. Photosynth Res 31 (1992), 139-148.
658

22
Vitae
Ivan Husu, Macromolecular Chemist, PhD in Chemistry (biochemistry/biophysics of lipid-
photosynthetic membrane protein interactions) at the University of Rome “La Sapienza”. After two
years of postdoctoral research activity in Hungary (spectroscopic studies on photosynthetic
membrane protein Reaction Centre) and U.K. (biochemistry of cytochrome c -cardiolipin lipid
interaction effects) he spent 4 years of research between the Univ. of Rome (Reaction Centre and
cytochrome c-lipid interactions) and the Italian National Research Council (CNR, biochemistry of
algal photosynthesis and biosensor chemistry). Among scientific publications, he is author of a
chemistry book in Italian and a biochemistry book in English on his PhD studies.
Giuseppe Rodio, PhD in Plant Biotechnology, works for Biosensor Srl as expert in the
development of engineered photosynthetic biomediators, new methods of biomediators
immobilization onto transducer and other support and in testing new type of biosensors.
Touloupakis Eleftherios, teaching assistant at University of Crete. Graduated in Biological
Sciences at the University of Padova (Italy), he received his diploma (M.Sc.) and Doctorate (Ph.D.)
in Biochemistry, from the University of Crete (Greece). From 2006 to 2009 he worked as Post-
Doctoral fellow on the European project NUTRA-SNACKS at the Department of Chemistry,
University of Crete. From 2009 to 2010 he had a Post-doctoral research fellowship on the European
project BEEP-C-EN at the National Council of Research (Italy).
Maya Dimova Lambreva, biologist, experienced in biophysical and biochemical characterization
of photosynthetic reactions: registration and interpretation of prompt chlorophyll a fluorescence
signal, fluorescence quenching analyses, OJIP-test, oxygen evolution in gas- and liquid-phase,
photosynthetic gas-exchange, determination of oxidative stress markers and antioxidant enzymes
activity. (Institute of Crystallography, CNR, Italy).
Katia Buonasera, Pharmaceutical Chemist, PhD in Food Safety and Chemistry. Expert in
innovative analytical techniques and biosensors with full knowledge in liquid chromatography,
nano-liquid chromatography, electrochromatography, and electrochemistry applied to amperometric
biosensors for the detection of pesticides in food and water. Researcher at CNR since 2009,
working as analytical chemist on the development of new generation biosensors and immobilization
methods of different biological materials.
Simona Carmen Litescu, Chemist with PhD in Chemistry, and senior researcher at Centre of
Bioanalysis –NIB. She has acquired extended skills in bioanalytical techniques, mainly electro-
analytical and spectrochemical ones (infrared/FTIR); high-performance liquid chromatography and
basics on surface analysis (AFM and XPS analysis); she developed and validates methods devoted
to active compounds (active principles from plants, drugs etc) characterisation and enzyme
immobilisation. She was involved in several multidisciplinary teams working in to the
accomplishment of 20 different national and bilateral research projects and scientific responsible of
2 EU projects (FP6 and FP7).
Maria Teresa Giardi, research manager at the National Council of Research (CNR) in Rome,
Italy. Her background is in organic-industrial chemistry and she has extensive experience in
biochemistry; development of signal transduction systems for optical and electrochemical
biosensors; protein stabilization and utilization in biosensor design. She is a referee for the US
Department of Agriculture for industrial projects. She has worked in various research institutions

23
and research and development companies both in Europe and the USA. She is a supervisor or
coordinator of a number of national and international projects in the field of biosensors.
Giuseppina Rea, PhD in Biology, studies the molecular mechanisms and signal networks involved
in the light events of photosynthesis and the structure/function relationships of the pigment-protein
complexes involved in these processes. She has experience in plant molecular biology,
biochemistry, biotechnology and protein engineering applied to fundamental research and
technological transfer. Actually, she is leading the COST Action TD1102: Photosynthetic protein
for technological application: biosensors and biochips, and CNR institutional project
Biotechnological applications of oxygenic photosynthetic organisms in the agro-food field:
nutraceutics, biosensors and space biochips. She has been scientific responsible of national and
trans-national programmes, including: FP7-SME-2008-1, SENSBIOSYN; EUROTRANS-BIO,
ETB-2007-34, MULTIBIOPLAT; ASI-NASA, VUS-2009-004, BIOKIS-PHOTOEVOLUTION.
She is Member of the Scientific Committee of the Italian Platform in Organic Farming, PTBio
Italia.

Herbicide IMAX,1 (%) I50,1 (M) IMAX,2 (%) I50,2 (M)
Linuron 6 ± 3 (1.0 ± 0.5)×10-9
89 ± 4 (1.2 ± 0.2)×10-7
Simazine 6 ± 2 (1.0 ± 0.5)×10-8
94 ± 2 (2.3 ± 0.2)×10-6
Table 1
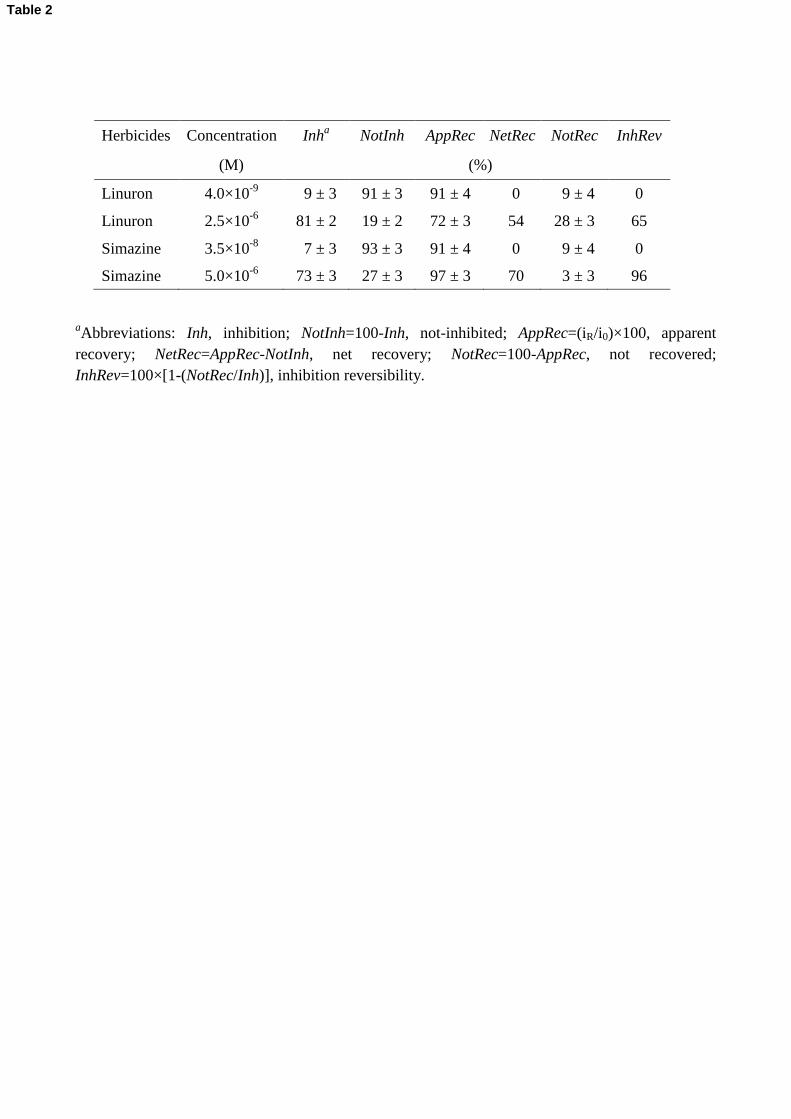
Herbicides Concentration Inha NotInh AppRec NetRec NotRec InhRev
(M) (%)
Linuron 4.0×10⁻⁹
09 ± 3 91 ± 3 91 ± 4 0 09 ± 4 0
Linuron 2.5×10⁻⁶
81 ± 2 19 ± 2 72 ± 3 54 28 ± 3 65
Simazine 3.5×10⁻⁸
07 ± 3 93 ± 3 91 ± 4 0 09 ± 4 0
Simazine 5.0×10⁻⁶
73 ± 3 27 ± 3 97 ± 3 70 03 ± 3 96
aAbbreviations: Inh, inhibition; NotInh=100-Inh, not-inhibited; AppRec=(iR/i0)×100, apparent
recovery; NetRec=AppRec-NotInh, net recovery; NotRec=100-AppRec, not recovered;
InhRev=100×[1-(NotRec/Inh)], inhibition reversibility.
Table 2

a Spinacia oleracea, depending on the immobilization procedure [46].
b Approximation explained in the text: I50,2 I50.
Biosensor features C. reinhardtii SPECs C. vulgaris biosensor Thylakoid Biosensor
Electrochemical signal (A) 5÷7 0.2÷0.3 0.020÷0.040
Measurement signal/noise > 20 5 ≥20
Assay time (min) ≤ 30 4 50
Storage stability 60 % after 25 days at 25°C 60% after 8 weeks at 4
°C ND
Half-life (h) 9 ND 10÷17a
I50 (M) 2.3×10⁻⁶
(simazine)b
1.2×10⁻⁵
(atrazine) 1.0×10⁻⁷
(simazine)
1.2×10⁻⁷
(linuron)b 1×10
-6 (diuron) 1.0×10
-7 (diuron)
LOD (M) 9×10⁻⁸
(simazine) 1×10⁻⁶
(atrazine) 4.1×10⁻⁸
(simazine)
6×10⁻⁹
(linuron) ND 1.5×10⁻⁸
(diuron)
Table 3
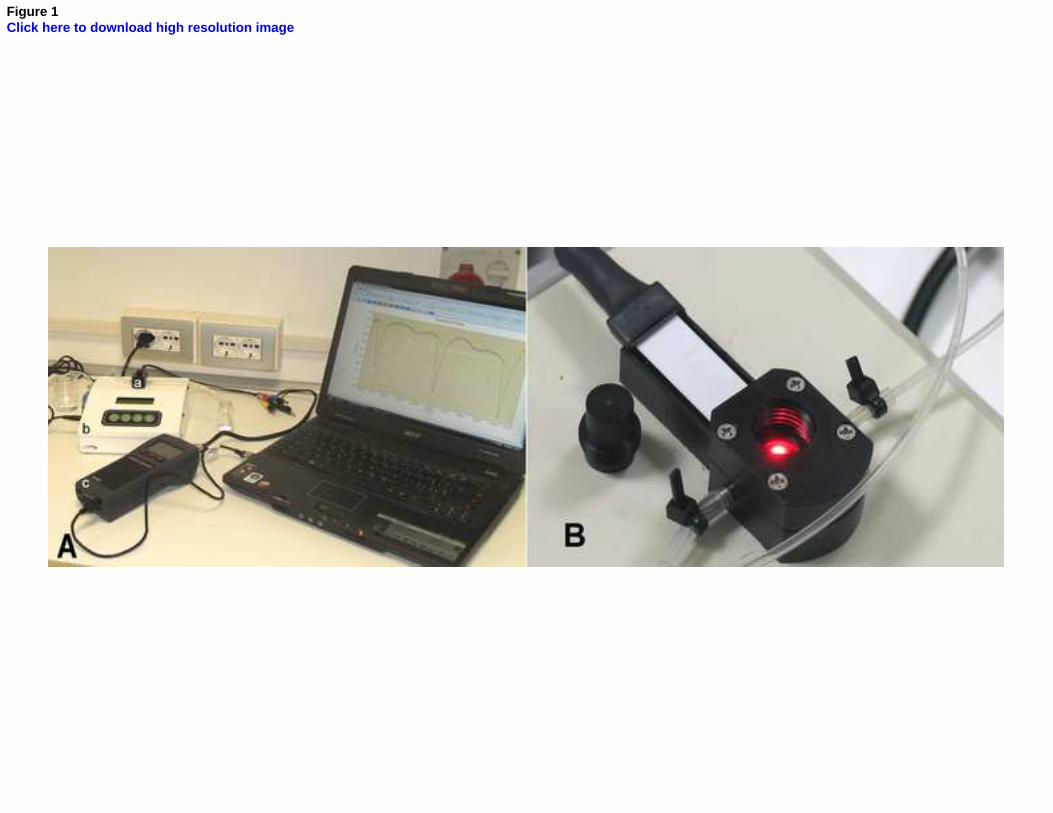
Figure 1Click here to download high resolution image
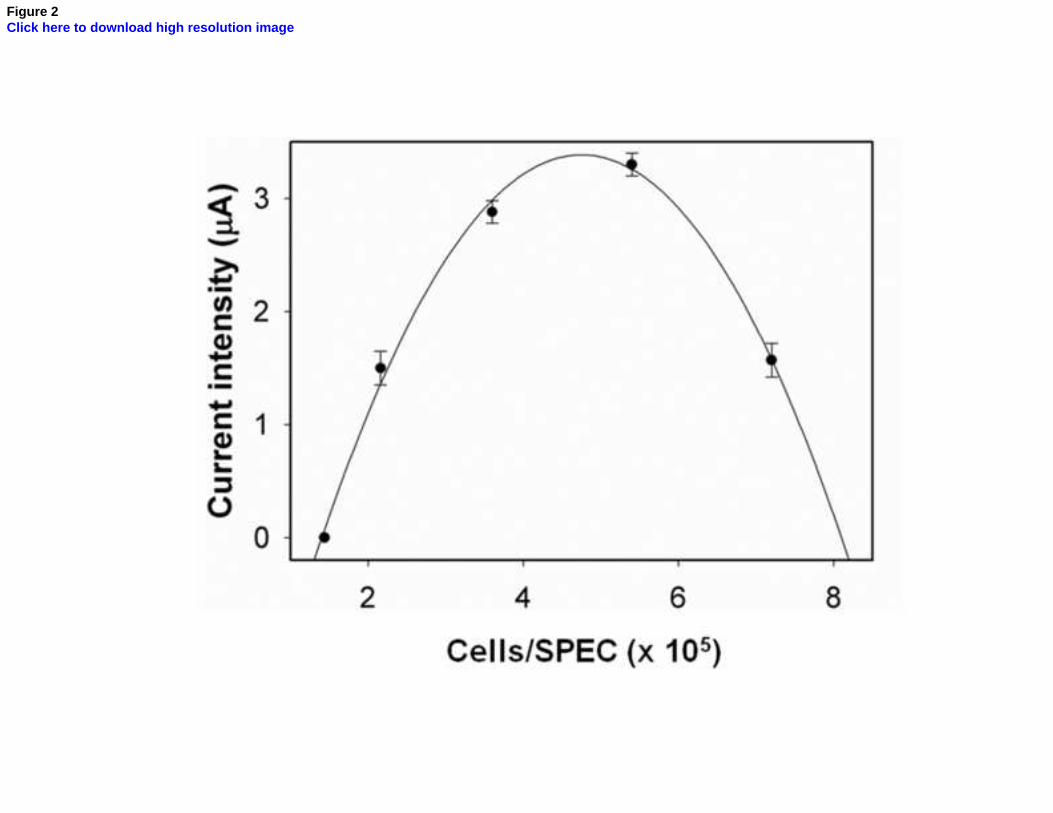
Figure 2Click here to download high resolution image

Figure 3Click here to download high resolution image

Figure 4Click here to download high resolution image

Figure 5Click here to download high resolution image

Figure 6Click here to download high resolution image

Figure 7Click here to download high resolution image

Figure S1Click here to download Supplementary Material: Fig.S1.tif

Figure S2Click here to download Supplementary Material: Fig.S2.tif

Figure S3Click here to download Supplementary Material: Fig.S3.TIF
Related Documents


