Electrochemical production of sustainable hydrocarbon fuels from CO2 co-electrolysis in eutectic molten melts Al-Juboori, O., Sher, F., Khalid, U., Niazi, M.B.K., Chen, G.Z.

Welcome message from author
This document is posted to help you gain knowledge. Please leave a comment to let me know what you think about it! Share it to your friends and learn new things together.
Transcript

Electrochemical production of sustainable
hydrocarbon fuels from CO2 co-electrolysis in
eutectic molten melts
Al-Juboori, O., Sher, F., Khalid, U., Niazi, M.B.K., Chen, G.Z.

University of Nottingham Ningbo China, 199 Taikang East Road, Ningbo,
315100, Zhejiang, China.
First published 2020
This work is made available under the terms of the Creative Commons
Attribution 4.0 International License:
http://creativecommons.org/licenses/by/4.0
The work is licenced to the University of Nottingham Ningbo China under the Global University Publication Licence: https://www.nottingham.edu.cn/en/library/documents/research-support/global-university-publications-licence-2.0.pdf
1
Electrochemical production of sustainable hydrocarbon fuels
from CO2 co-electrolysis in eutectic molten melts
Ossama Al-Juboori1, Farooq Sher2,*, Ushna Khalid3, Muhammad Bilal Khan Niazi4, George Z.
Chen1,5,*
1Department of Chemical and Environmental Engineering, University of Nottingham,
University Park, Nottingham NG7 2RD, UK.
2School of Mechanical, Aerospace and Automotive Engineering, Faculty of Engineering,
Environment and Computing, Coventry University, Coventry CV1 5FB, UK
3Department of Chemistry, University of Agriculture, Faisalabad 38000, Pakistan
4School of Chemical and Materials Engineering, National University of Sciences and
Technology, Islamabad 44000, Pakistan
5Department of Chemical and Environmental Engineering, Faculty of Science and
Engineering, University of Nottingham Ningbo China, University Park, Ningbo 315100, China
*Corresponding authors:
E-mail address: [email protected] (F.Sher), [email protected] (G.Chen)
Abstract
Due to the heavy reliance of people on the limited fossil fuel as energy resources, global
warming has increased to severe levels due to huge CO2 emission into the atmosphere. To
mitigate this situation, a green method is presented here for the conversion of CO2/H2O into
sustainable hydrocarbon fuels via electrolysis in eutectic molten salts ((KCl-LiCl; 41:59
mol%), (LiOH-NaOH; 27:73 mol%), (KOH-NaOH; 50:50 mol%), (Li2CO3-Na2CO3-K2CO3;
43.5:31.5:25 mol%)) at the conditions of 1.5–2 V and 225–475 oC depending upon molten
electrolyte used. Gas chromatography (GC) and GC-MS techniques were employed to analyse
the content of gaseous products. The electrolysis results in hydrocarbon production with
maximum 59.30, 87.70 and 99% faraday efficiency in case of molten chloride, molten
hydroxide and molten carbonate electrolytes under the temperature of 375, 275 and 425 oC
2
respectively. The Gas chromatography (GC) with FID and TCD detectors and GC-MS analysis
confirmed that the H2 and CH4 were the main products in case of molten chlorides and
hydroxides at 2 V applied voltage while longer hydrocarbons (>C1) were obtained only in
molten carbonates at 1.5 V. Through this manner, electricity is transformed into chemical
energy. The heating values obtained from the produced hydrocarbon fuels are satisfactory for
further application. The practice of molten salts could be a promising and encouraging
technology for further fundamental investigation for sustainable hydrocarbon fuel formation
with more product concentrations due to its fast-electrolytic conversion rate without the use of
catalyst.
Keywords: Sustainable fuels; Molten salts; Co-electrolysis; Hydrocarbon fuels, Electrolyte
mixture; CH4 and H2 production.
Introduction
Over the past few decades, two major issues have captured the attention of scientists and
policymakers: global warming due to the increasing levels of carbon dioxide gas (CO2) in the
atmosphere, and the rapid depletion of fossil fuels as an energy resource. To tackle these
complications, two solutions were proposed 1, 2. The first solution is the use of renewable
energy resources such as wind, solar, nuclear or geothermal energy to minimize the greenhouse
gases’ emission. While the second solution is the consumption of CO2 to remove its excessive
concentration from the atmosphere and to enhance energy resources by converting it into
hydrocarbon fuels 3, 4. Renewable energy resources do not involve CO2 sequestration 5. So to
tackle CO2 emissions 6, it was considered preferable to introduce some of the renewable energy
resources into an existing energy infrastructure as a “drop-in” form of energy. Examples of this
can include the synthesis of fuels or fertilizers from CO2 or biomass 7, 8.
3
At present, technologies studied for transforming CO2 include chemical, photochemical,
electrochemical 9 and biological transformation into hydrocarbons 10, nano-carbons 11,
nanotubes, and alcohols (methanol and ethanol) 4. However, these low-value hydrocarbons and
methanol produced at low system efficiencies undermine the rationale of this approach. The
process of CO2 and water co-electrolysis at low temperatures (<100 oC) in aqueous media to
convert CO2 to CO or hydrocarbon species was employed by scientists 12, 13. However, a
suitable catalyst is necessary for this conversion process in order to reduce energy
consumption, improve reaction kinetics and product selectivity 14, 15. Which results in low
hydrocarbon gas production due to the poor solubility of CO2 in aqueous media and the
proximity of the electro-reduction potential of both water and CO2. Consequently, limiting the
future use of this process.
Using high temperature electrolysis between 800 and 1000 oC, provided both thermodynamic
and kinetic advantages throughout the reduction of both CO2 and H2O. One thing to mention
here is that this process not only converts CO2 into hydrocarbons but also able to produce
hydrogen fuel by the splitting of water. Hydrogen gas has been produced by various methods
such as plasma arc decomposition, bio-photolysis, coal gasification, dark fermentation,
artificial photosynthesis, electrolysis etc 16. But the electrolysis has proved successful among
all due to the good energy efficiency and low cost 17. Two types of cells were used for high
temperature electrolysis: those with solid oxide electrolytes and with molten salts 18, 19.
Recently the use of solid oxide electrolysis cells (SOEC) has gained much interest in the
preparation of syngas (CO+H2), hydrogen or methane gas from the CO2-H2O co-electrolysis
20, 21. However, certain limitations such as low production rate, specific electrode materials,

4
higher production costs, lower durability and high energy utilization, became the reason for
their rejection on industrial scale implementation 22. Molten salts exhibit the same chemistry
regarding CO2 and H2O reduction as in SOEC except that CO2 can be also reduced to carbon
23 in addition to carbon monoxide depending on the operating conditions. Which can thereby
affect the products. Deposited carbon on cathode can facilitate the formation of different kinds
of hydrocarbons (rather than CO) in case of molten salt electrolysis. Because as soon as the
fresh carbon deposit on cathode it reacts immediately with hydrogen gas produced via water
reduction on the metal cathode surface itself, resulting in the formation of hydrocarbons 24.
Molten salts are preferred over solid oxides regarding CO2-H2O co-electrolysis for a variety of
reasons. Besides a wide electrochemical window, high electric conductivity, relatively low
cost, reactivity with CO2 and no need of specific electrode materials (Ni-YSZ, La1-x
SrxMnO3/YSZ) make them suitable candidates for this process. Moreover, the possibility of
carbon or CO hydrogenation after electrolysis in molten salts is much more significant 25, 26.
Molten salts with some limitations such as slight corrosion activity particularly at high
temperature and relatively high energy utilisation to maintain the heat for molten salt to avoid
the solidification 27, can still be employed to produce hydrocarbon gas or liquid fuels 28, 29.
Recently carbon nanotubes (CN) and carbon nano-fibrils (CNF) have been produced by using
molten chlorides 30, molten carbonates 31, 32 and molten hydroxides with sufficient conditions
of electrolyte combinations, electrode materials, current and temperature etc. 33-35.
Moreover, recent investigations also showed the production of syngas (CO, H2) and methane
by employing molten carbonates (Li2CO3‐Na2CO3‐K2CO3) 24, 36. There is lack of literature of
finding suitable molten salt electrolyte for the co-electrolysis of CO2 and H2O to produce
hydrocarbon fuels (CH4 or longer chain). To the best of our knowledge, molten hydroxides
5
((LiOH-NaOH; 27:73 mol%), (KOH-NaOH; 50:50 mol %)) and molten chlorides (LiCl-KCl;
58.5:41.5 mol%) have never been evaluated for CO2 to methane conversion. And molten
carbonates (Li2CO3‐Na2CO3‐K2CO3; 43.5:31.5:25 mol%) have never been studied particularly
for higher hydrocarbon fuel (>C1) production via CO2-H2O co-electrolysis. So this study aims
to fill the research gap in the literature.
This study systematically investigates the hydrocarbon fuel production by employing CO2-H2O
co-electrolysis by using different types of molten electrolytes: molten chloride (LiCl-KCl;
58.5:41.5 mol%), molten hydroxide ((LiOH-NaOH; 27:73 mol%), (KOH-NaOH; 50:50
mol%)) and molten carbonate (Li2CO3-Na2CO3-K2CO3; 43.5:31.5:25 mol%) at variable
conditions of temperature and voltage depending upon the molten salt. Two feed gas insertion
methods are also employed; gas flowing over the electrolyte surface (GFOE) and gas flowing
inside the electrolyte (GFIE). The effect of different variables including; faradays efficiency,
energy consumption and heating values at variable conditions of temperature and voltage are
studied. Moreover, the product formation by electrolysis is confirmed by GC (using FID and
TCD detectors) and GC-MS.
Experimental
Chemicals
Lithium carbonate (Li2CO3; ≥99%), sodium carbonate (Na2CO3; ≥99.5%), potassium
carbonate (K2CO3; ≥99%), lithium chloride (LiCl; 99%), potassium chloride (KCl; >99.9%),
lithium hydroxide (LiOH; ≥98% powder), sodium hydroxide (NaOH; ≥98% pellets), and
potassium hydroxide (KOH; 90% flakes) were purchased from Sigma-Aldrich, USA. Carbon
dioxide (CO2; 99.99%) and argon (Ar; 99.99%) were procured from Air products. Labovac 10
mineral oil was got from Jencons.

6
Electrochemical performance measurement
The electrochemical processes were performed by using four combinations of molten salts as
electrolytes. The key point of choosing these combinations of molten salts is due to their low
melting points and the ability to work at operating temperatures, as low as possible, keeping
them in liquid state to enable electrolysis and promote hydrocarbon formation. The
composition selection of binary mixtures (LiCl-KCl, LiOH-NaOH and KOH-NaOH) was done
on the basis of thermodynamic phase diagrams as illustrated from the Fig. S1. The ternary
phase diagram (Fig. S2) is clearly indicating the composition selection of ternary molten salt
mixture (Li2CO3-Na2CO3-K2CO3). Therefore, the salts selected for this study along with their
compositions are: LiCl-KCl (58.5: 41.5 mol%), LiOH-NaOH (27: 73 mol%), KOH-NaOH (50:
50 mol%) and Li2CO3-Na2CO3-K2CO3 (43.5: 31.5: 25 mol%), having eutectic melting
temperatures of 361, 218, 170 and 397 oC respectively. The electrolyte salts were dried in an
oven at 200 oC for 4 h at atmospheric pressure before their mixing to remove any sort of water
impurity.
Then electrolytes were poured into a crucible present inside a corrosion resistant electrolyser’s
retort. Which was built in house with a flange type cover using the 316-grade stainless steel to
shape the reactor to provide and control the environment needed for the molten salt electrolysis.
The dimensions of the retort were 130 mm internal diameter, 7.5 mm wall thickness and 800
mm vertical length. On the flange cover, there were some holes drilled for the insertion of
ceramic tubes (for anode and cathode gas collection), observation purposes and sealing. The
retort was inserted centrally in the furnace. In the retort, a stainless-steel stand was placed and
a refractory brick mounted on it and above its alumina crucible containing pre-melted molten
salt electrolyte (about 100 g) was placed. The two-electrode mode experimental set-up used
here is a continuous system with small scale for electrolysis and hydrocarbon production. The

7
electrolysis is conducted by using titanium metal (Purity: 99.99%, Good fellow Cambridge
Ltd) as cathode and graphite (Purity: 99.99%, Advent Research Materials) as anode 37, 38.
A small rate of gas (CO2; 48.4%, + H2O; 3.2% + Ar; 48.4%) flows continuously inside the
reactor where hydrocarbons and O2 gases are produced inside the molten salts on the cathode
and anode surfaces respectively during the electrolysis. And the products are collected at
different time intervals. This process is done by employing the Agilent E3633A 20A/10V
Auto-Ranging DC Power Supply and a laptop with an EXCEL add-in to collect the
instrumentation data. Two electrode tube gas outlets were present, each connected to another
Dreschel bottle containing the mineral oil to observe the outlet gases produced and reduce
electrolyte contamination. Gas product samples were collected using a tedler 1 L (SKC Ltd.)
gas bag via a connection from the cathodic gas tube. The electrolyser setup is a modified form
of previously used setups 39.The schematic representation of experimental setup is shown in
Fig. 1
To avoid their mixing, the argon gas was used which pushed the gaseous products into their
respective bags. Moreover, the study is carried out with two modes of feed gas insertion inside
the reactor for each electrolyte; gas flowing over the electrolyte surface (GFOE) and gas
flowing inside the electrolyte (GFIE) for the comparison of hydrocarbon production in both
cases. The first method (GFOE) has been used to minimize the chances of solid material’s
production (carbon, carbon nanotubes, graphene, carbonates solidification) 35, 40 and to produce
gaseous hydrocarbon products preferably. The current efficiency was calculated from the Eqs.
(1-2):
Current efficiency =
Qx
QT× 100
(1)
8
Qx = nNF (2)
where Qx is the charge required for the amount of individual product produced, n is the number
of electrons required, F is the charge of one electron which equals 96485 col and QT is the total
charge calculated from the area under the current vs time curve.
Characterization
Gas chromatography (GC) (PerkinElmer Clarus 580) was used to analyse the gas products
generated from electrolysis with detectors such as the flame ionization detector (FID) and
thermal conductivity detector (TCD) for organic compound analysis and a wide range of both
organic and inorganic species respectively. The gaseous product species in the sample were
identified and quantified by comparison with two different calibration gas standards. The first
one is the permanent gas standard with composition of H2 10%, CO2 10% and CO 40% for
TCD detector and the second standard calibration gas contains ethene (C2H4) 0.2%, propylene
(C3H6) 0.2%, 1-butene (C4H8) 0.2%, 1-pentene (C5H10) 0.2%, methane (CH4) 20%, ethane
(C2H6) 10%, propane (C3H8) 5%, n-butane (C4H10) 2%, n-pentane (C5H12) 1% for the FID
detector.
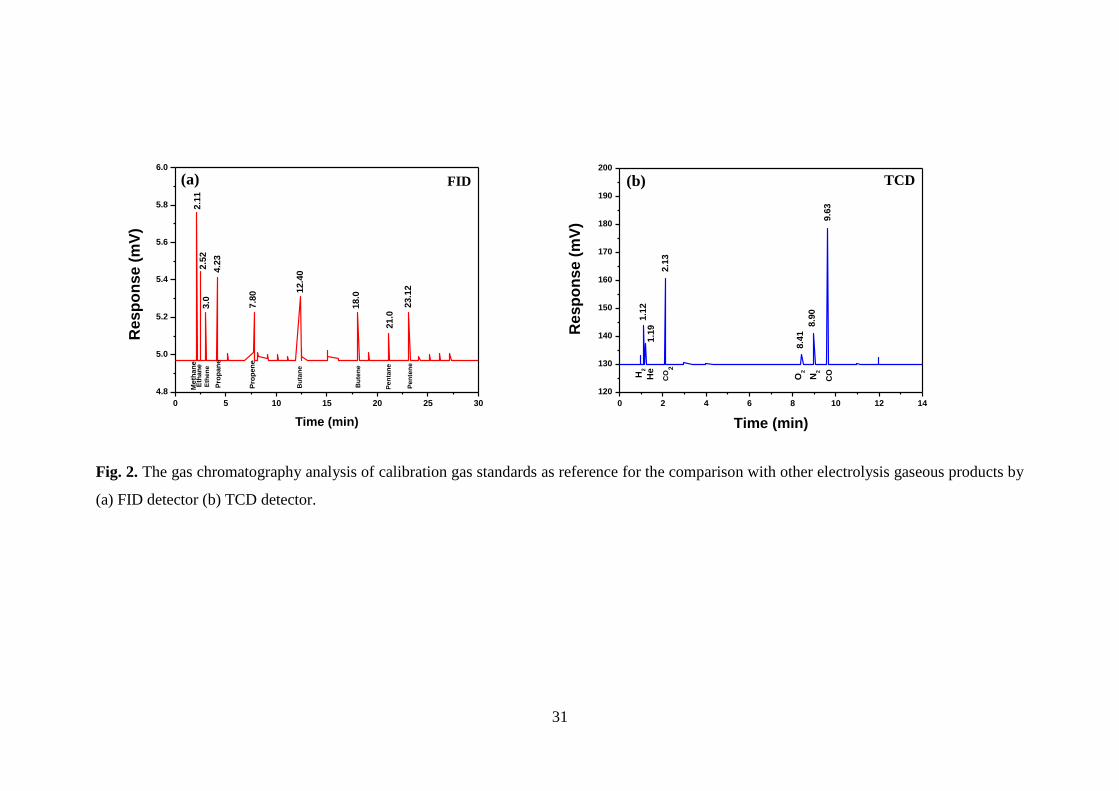
The remaining composition of both gas standards was balanced with helium gas. The GC
graphs for different calibration gas standards are shown in Fig. 2 for the comparison of
electrolysis gaseous products. Furthermore, the samples were analysed by a different
sophisticated GC instrument (Agilent 7890B) attached with a mass spectrometer (JEOL
AccuTOF GCX) for longer chain hydrocarbons detection. Gas detecting tubes from GASTEC
(ai-cbss Ltd.) were used to analyse the feed gas compositions for CO2 and H2O contents. The
feed gas composition with CO2 (48.4%) + H2O (3.2%) + Ar (48.4%) was kept same for all the
experiments. GASTEC 2HH is characterised to detect the higher contents of CO2 from 5 to
40% of the feed gas, with the change in colour from orange to yellow.

9
The GASTEC30 tube can analyse water content in the range of 0–18 mg/L, and it contains
Mg(ClO4)2. However, the colour here will change from yellowish green to purple. After the
analysis of cathodic gas sample, the concentration of each gas compound (Mgas) was calculated
as followed by the Eq. (3):
Mgas =
Agas F̅i̇⁄
As Ms⁄
(3)
where Mgas is the concentration (%) of individual gas in the sample. Ms is the concentration
(%) of the specific standard gas in the sample. Agas is the area under the peak resulting from the
FID analysis for the individual gas (C2-C5) in the sample. As is the area under the peak resulting
from the analysis of the specific gas standard (CH4). Fi̅ is the response factor for each gas.
Results and discussion
Optimization of electrolytes
The selection of the molten salt is done based on the ability to generate hydrocarbon fuels from
the co-reduction of CO2 and H2O (Eq. (4)). The combination of a hydrocarbon molecule starts
ideally from the two known element sources: carbon (C) and hydrogen (H). Both of these
elements can be effectively formed from electrochemical conversion via an appropriate molten
salt.
xCO2 + y 2H2O⁄ → CxHy + (x + y 4⁄ )O2 (4)
Generally, the presence of moisture with CO2 gas in molten salt experiments is the basis for
generating H2 and CH4 during electrolysis in most cases and provide feasibility to the reactions
41, 42.
10
Molten chloride electrolyte
The attractive characteristic in the molten chloride case is the probability of producing CO or
C directly from CO2 reduction in the presence or absence of a carbonate ion 42. Carbonate ions
(if added externally) are used as an important additive to molten chlorides to provide the oxide
ions required for performing CO2 reduction 43, 44. For absorbing more CO2 gas into the molten
salt leading to increase in product yield from electrolysis, the addition of oxides or carbonate
salts into the molten chloride is considered preferable. But one drawback exhibited by this
process was the increase in applied voltage and working temperature of resulting molten salt
mixture. Which is not the favourable condition for hydrocarbon production 45. So to tackle this
problem, molten chloride electrolyte is used in this study for hydrocarbon production without
any externally added oxide or carbonate salts. In the absence of H2O and carbonate ions, the
reduction of CO2 to carbon or CO can be done in several steps as seen from the Eqs. (5-7) 32.
CO2 + 2e− → CO22− (5)
CO22− → CO + O2− (6)
CO + 2e− → C + O2− (7)
In the presence of steam beside CO2 in the feed gas, the reduction of CO2 becomes more
feasible as CO2 can react with hydroxide ions released from the primary reduction of H2O
through to the one-electron transfer reaction. Moreover, carbonate ions can be generated even
from molten chloride through the reaction of CO2 with oxide ions emitted in turn after the
direct reduction of H2O to H2 gas (Eq. (9)) 46. The carbonate ions can then be electro-reduced
in turn to carbon or CO and produce hydrocarbon by reacting with H2. The overall reaction
occurring at electrodes can be summarised from the Eqs. (11-13).
H2O + e− → H + OH− (8)
11
H2O + 2e− → H2 + O2− (9)
CO2 + OH− → CO32− + H2O (10)
Overall reaction
At cathode: CO32− + 4OH− + 8e− → CH4 + 7O2− (11)
2OH− + 2e− → H2 + 2O2− (12)
At anode: 2O2− → O2 + 2e− (13)
It is preferable to perform CO2-H2O co-electrolysis at temperatures even lower than the 400 oC
to form the hydrocarbons feasibly. For that purpose, electrolysis was performed at 375 oC and
2V using molten chloride (LiCl-KCl; 41: 59 mol%) with two modes of gas insertion: GFOE
and GFIE. The feed gas in GFOE mode containing H2O, CO2 and Ar, was kept flowing over
the LiCl-KCl (41: 59 mol%) at 1.3 bar. The feed gas pressure was applied slightly over 1 atm
to increase CO2 activity and thus the opportunity of improving reduction inside the molten
chloride.
The same experiment was performed at the above conditions using a feed gas containing H2O
with no CO2. Both experiments in GFOE mode are performed to see the solubility of CO2 and
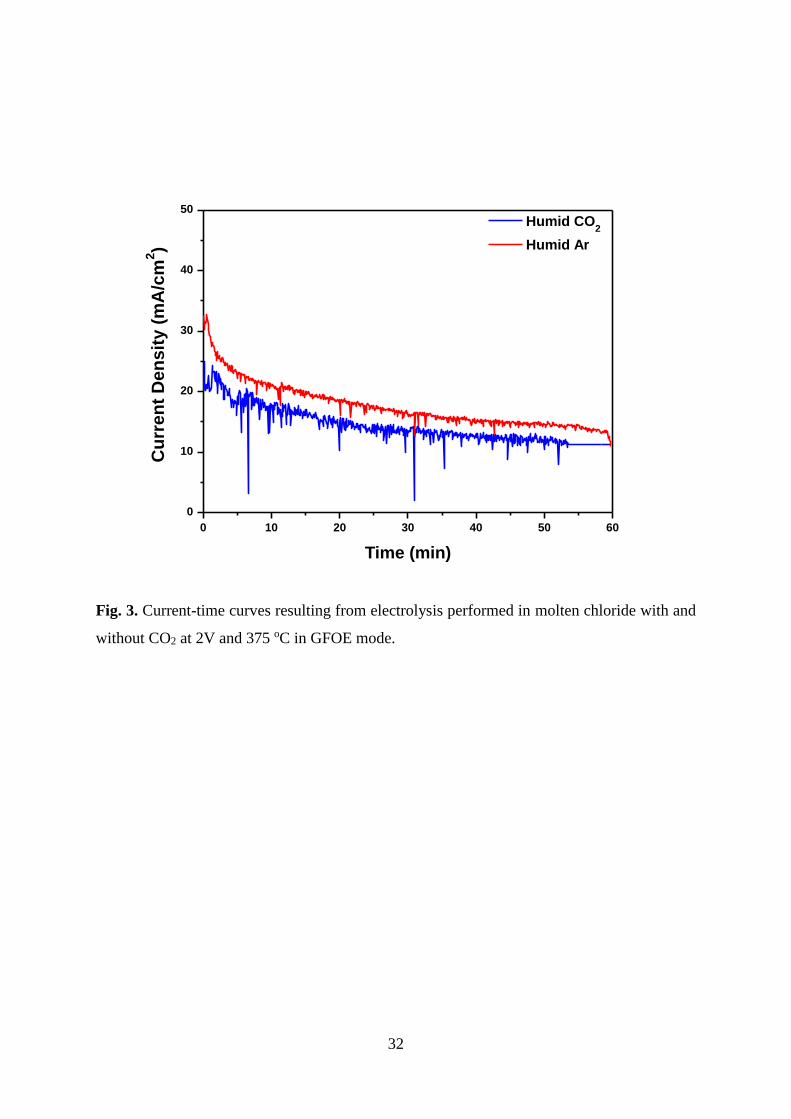
thus its activity inside molten chlorides. Carrying out electrolysis at 2 V and 375 oC, it can be
seen from Fig. 3 that there is a small difference between the two current curves resulting from
electrolysis in both cases. However, the current was still relatively high in both cases and
gradually decreased with time. The decline in current can be imputed generally to the drop of
oxidant concentration (H2O, CO2) that is reduced on the cathode surface due to the
accumulation of new products (such as H or H2 bubbles) as there is no renewal action on the
cathode surface during electrolysis. Also, it can be noted that the current was slightly higher in
the case where CO2 gas was absent basically due to the obstruction of CO2 gas against H2O

12
reduction on the electrode, particularly at high pressures through the possible reduction of CO2
to CO22− (Eq. (5)).
Despite some spikes noticed in the red curve in Fig. 3, it can be seen that the drop of the curves
in both cases was quite the same confirming the weak effect of CO2 inside the molten chloride
in GFOE mode. So due to CO2 weak effect, the hydrocarbon could not be produced in this case
(GFOE mode). The GFIE mode of gas feed introduction was chosen as an appropriate way to
increase CO2 concentration and solubility (and reactivity) inside the molten chloride and collect
the maximum rates of hydrocarbon products at atmospheric pressure. The rates of H2 and CH4
production, collected from the cathodic tube, changed significantly after the first 30 and 60 min
of electrolysis due to the process of carbonate ions formation as can be seen by the comparison
of Fig. 4(a) and (b). Where the higher production rates of CH4 (0.67 µmol/h cm2) and H2 (32.00
µmol/h cm2) with higher faraday efficiency (59.30%) were found after the first 30 min of
electrolysis (Fig. 4(a)). While the lower production rates of CH4 (0.39 µmol/h cm2) and H2
(19.10 µmol/h cm2) with faraday efficiency (30.50%) were obtained after 60 min of electrolysis
(Fig. 4(b)) in molten chloride (LiCl-KCl; 41: 59 mol%).
The lower faraday efficiency (30.50%) was attributed due to the higher CO32−ion formation
leading to the subsequent conversion to C or CO with more energy consumption. The formation
of a carbonate ion can be justified due to the reaction of CO2 with OH- generated in the molten
chloride after the persistent reduction of H2O as stated previously in Eq. (10) 46. It is interesting
to note that there is a clear increasing trend of CH4 production in both Fig. 4(a) and (b) at a
lower current density of 20 mA/cm2, which starts dropping off beyond this limit. The increase
in current density affects the products content. With the current density increase, the CH4
production reached to an optimal value. After that further rise in current density results in

13
adverse effects on CH4 production, greatly exceeding the minimum energy requirement of H2
production that keeps CH4 production at a lower level 24, 36. Deng et al. 31 stated that LiCl-KCl
electrolyte containing Li2CO3/CaCO3 showed highest current efficiency of 80–85% at the
current density of 25 mA/cm2, which dropped off by increasing current density for the
conversion of CO2 to carbon.
Comparing results for the two occasions as two gas samples were taken after 30 and 60 min, it
can be noted that the production rates of both gases (CH4 and H2) were higher in the first sample
after first 30 min of electrolysis as the electro-reduction of the carbonate ions (to carbon for
instance) had not commenced yet. Thus, the reduction of H2O to H2 was not significantly
affected. The reaction of CO2 with OH- can be confirmed in the molten chloride for the second
sample as the concentration of CO2 reduced from 34.80 to 4.80% (Table 1).The hydrocarbon
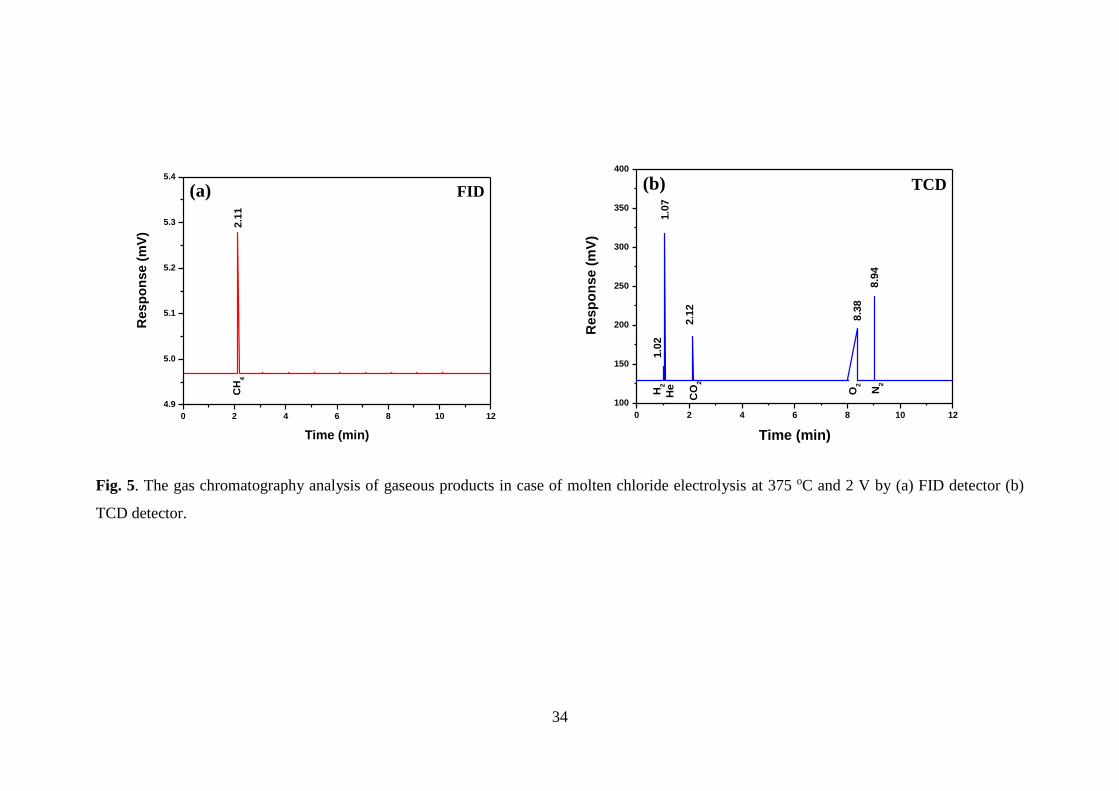
production confirmed through GC analysis (with FID and TCD detectors) is shown in Fig. 5
where the FID signals are showing the production of methane with the peak at 2.11 retention
time while TCD signals are clearly representing the peaks of H2, O2 and CO2. No CO can be
detected in the molten chloride in both cases.
Thus, the best product concentrations are obtained in case of LiCl-KCl (41: 59 mol%)
electrolyte from GFIE mode at the first 30 min of electrolysis rather than prolonged electrolysis
(60 min). This is because of the formation of carbonate ions in case of prolonged electrolysis,
which are reduced to the C or CO gases with the consumption of more energy (Table 1). Ijije
et al. 47 reported the CO2 conversion into carbon films or CO in LiCl‐KCl‐CaCl2‐CaCO3 molten
salt at 520 oC. Similarly, the absorption and conversion of CO2 was also employed in molten
chloride electrolytes (CaCl2‐CaO and LiCl‐Li2O) at 900 and 650 oC respectively 48. Jianbang
et al. 30 has converted CO2 by electrolysis in LiCl molten salt at 650 oC.

14
Molten hydroxide electrolyte
The molten hydroxide salt is preferred in the case of hydrogen production leading to
hydrocarbons formation. Hydrocarbon molecules can be formed basically through a H2
reaction with either C or CO as the same mechanism for molten chlorides 49. In most
experiments using molten hydroxides, the conversion of CO2 was very high but the
hydrocarbon yields were still low. This can be attributed generally to the reaction of CO2 with
hydroxide ions 50.
2OH− + CO2 → CO32− + H2O (14)
Therefore, CO2 must be diluted to lower concentrations by mixing with argon gas before
introduction to the electrolyte, as this action can help to reduce the reactivity of CO2 with the
salt, driving reaction (Eq. (14)) to the left side. The formation of carbonate ions need to be
reduced to provide enough time for the prospect of electro-reduction during electrolysis.
However, CH4 gas can be formed by another way in case of molten hydroxide electrolysis (Eq.
(15)) 51.
CO2 + 4H2 → CH4 + 2H2O (15)
Thus, the abundance of hydrogen gas from rapid H2O reduction in molten hydroxides can
contribute towards driving reaction (Eq. (15)) to CH4 formation. The hydrocarbon production
in molten hydroxide (LiOH-NaOH: 27: 73 mol%) performed in two modes: GFOE and GFIE
at the conditions of 2 V applied voltage and 275 oC, is shown in Fig. 6 (a) and (b). The results
indicate a distinct variation in the production rates due to the variation in gas feed modes. This
outcome can be attributed to the weak reduction of CO2 in the salt in GFOE mode. The
hydrocarbon production rate was significantly improved when the feed gas insertion method
was changed from GFOE to GFIE. It can be seen from the Fig. 6 (a) to (b) that the CH4 rate

15
increased largely from 1.02 to 6.12 μmol/h cm2 by moving from GFOE to GFIE mode as CO2
was promoted to dissolve in the salt.
Therefore, the prospect of direct reduction of CO2 to CO22− and CO can occur in the LiOH-
NaOH salt. At the same time, the H2 rate decreased from 1142.80 µmol/h cm2 to just 185.00
µmol/h cm2, confirming the possible transformation of CO2 or CO to hydrocarbons.
Nevertheless, high faraday efficiency (87.70%) in the GFOE mode rather than (15.00%) in the
GFIE mode was due to the higher H2 production rate. On the other hand, low faraday
efficiencies in GFIE mode were obviously because of their lower production values from the
slow reduction of CO2 to CO compared with rapid H2 production. Moreover, the optimal
current density range found for hydrocarbon production in case of LiOH-NaOH salt was 80–
85 mA/cm2.
Hydrocarbon production inside the molten hydroxide can be confirmed actually by the
existence of CO fuel with the cathode gas product. CO can be formed from CO2 reduction as
in molten chloride experiments. But the scarcity of CO gas found in the cathodic products in
both electrolytes can be interpreted due to (1) a lack of CO2 direct reduction to CO but the
formation of CH4 occurs by the reaction of CO2 with excess H2 and (2) the produced amount
of CO during electrolysis in all cases was too little as CO can rapidly react with excess H2 to
produce CH4. The formation of gaseous product (CH4) was confirmed from GC analysis with
FID detector while H2, O2 and CO2 were confirmed by TCD detectors for the GFIE mode (Fig.
7). And obtained values are presented in Table 2. The presence of very small peak of CO in
Fig. 7 (b) is providing the indication of higher methane production rates than molten chloride
case.
16
As the GFIE mode provided higher production values of methane in case of molten hydroxide
so the experiment was repeated using KOH-NaOH (50:50 mol%) due to its low working
temperature, under the conditions of 2V applied cell voltage and 225 oC with GFIE mode only.
Although the temperature used here was slightly lower than 275 oC as used for LiOH-NaOH
(27: 73 mol%) molten salt but the production rates of H2 (164.70 µmol/h cm2) and CH4 (6.12
µmol/h cm2) with faradaic efficiencies (17.90%) were almost same (Fig. 6 (c)). Moreover, the
composition and concentration (vol%) of other cathodic product gases were also same (Table
2). But one limiting factor was the lower resulting current in the case of KOH-NaOH (50:50
mol%) molten salt than LiOH-NaOH (27: 73 mol%) (Fig. 8). Moreover, the potentials for
carbon deposition or carbon monoxide evolution are more positive than the deposition
potentials of Li metal for the case of LiOH.
In contrast, in the case of KOH, the potential for the formation of C or CO is more negative
than the deposition potential of potassium. The comparison suggests that carbon/CO evolution
leading to the formation of methane is the more preferential product in the presence of LiOH
as also observed in the previous study 45. Therefore, the KOH-NaOH (50:50 mol%) electrolyte
use was not preferred for hydrocarbon production. Consequently, the fuel production (H2, CH4)
was achieved in all cases of molten hydroxide electrolytes with different product composition
and concentration (vol%) as can be seen from Table 2 but the best results were provided by
the LiOH-NaOH (27: 73 mol%) molten salt with GFIE mode than the other cases.
Molten carbonate electrolyte
The third kind of electrolyte used for hydrocarbon production is a ternary molten carbonate
mixture (Li2CO3-Na2CO3-K2CO3; 43.5: 31.5: 25.0 mol%) that is used in this research due to its
relatively low melting point of 394 oC. The formation of hydrocarbons can occur directly or
indirectly in a molten carbonate through the reaction of C with H2 or CO with H2 respectively

17
which are produced primarily from the independent reductions of CO2 and H2O 28, 52.
Subsequently, experiments conducted on this salt at a range of 400–450 oC, can be perfect
conditions for efficient hydrocarbon formation. In the case of electrolysis applied at conditions
of 1.5 V cell voltage and 425 oC, the maximum CH4 production rate was achieved. It can be
seen from Fig. 9 that a significant amount of CH4 (1.10 µmol/h cm2), H2 (4.40 µmol/h cm2)
and CO (11.70 µmol/h cm2) were obtained at the lower current density range of 4–6 mA/cm2.
The relevant faraday efficiency obtained was 56.20% for the production of CH4, CO and H2,
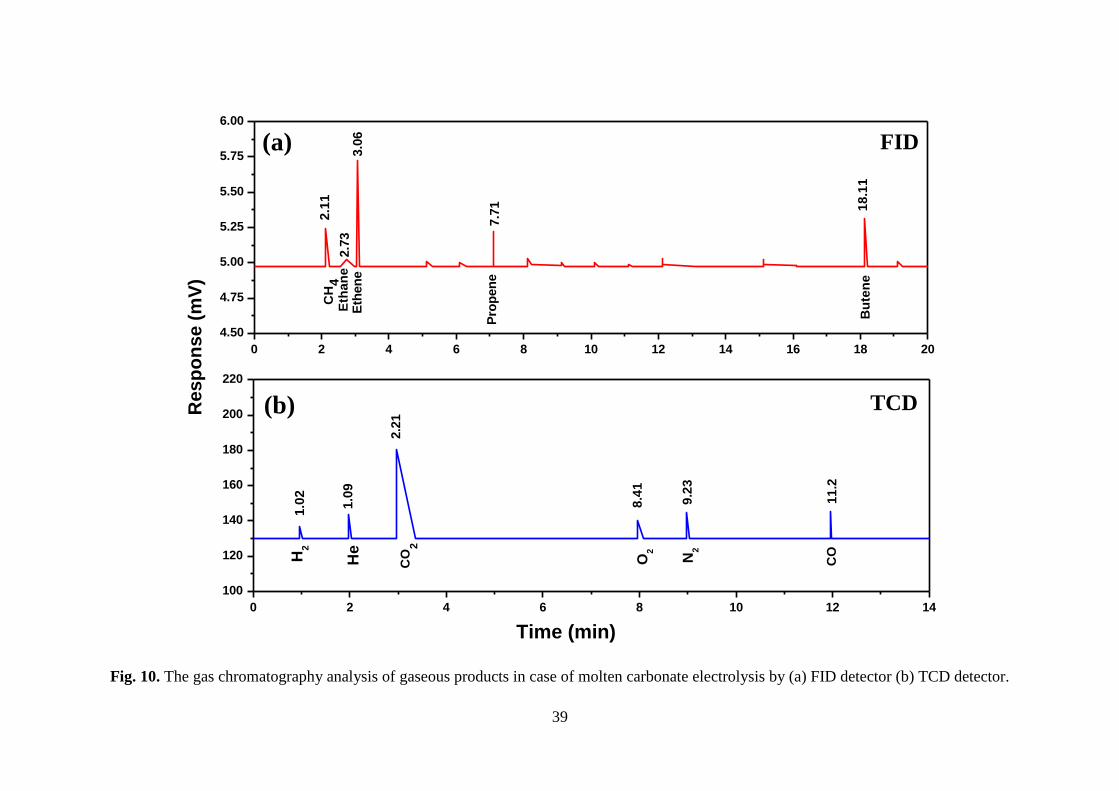
which were confirmed through GC analysis using FID and TCD detectors (see Fig. 10) with
production concentration values mention in Table 3. These production results are in agreement
with previous studies 24, 25. Wu et al. 10 provided support to the conversion of CO2 and H2O to
methane in case of molten carbonate electrolysis. It is worth mentioning that H2 and CO were
the predominant gases during the experiment. Moreover, the existence of CO as clearly noted
from Fig. 9 and confirmed through GC analysis with TCD detector (see Fig. 10 (b)) in a
relatively significant amount (in comparison to CH4), can be imputed to the individual
reduction of CO2 to CO. Previous studies stated that CO itself cannot be expected in molten
carbonates at temperatures below 775 oC in cases where H2O is absent 41.
However, some other authors have claimed that the formation of CO molecules can occur on
the cathode by CO2 reduction at low temperatures (≤ 650 °C) 53. If the reduction of CO2 to CO
is preferred, then H2 gas will also be formed according to the water gas shift reaction (WGSR)
which occurs due to higher temperature (< 600 oC). In contrast, CO can be generated by the
reverse water gas shift reaction (RWGS) 50. However, WGSR is more feasible at temperatures
below 817 oC particularly in the event of high partial pressures of H2O (up to 16.1 mmHg)
which is not the condition of present study case, so CO formation is preferred case than the H2
18
production leading to the hydrocarbon production. The only GFIE mode is presented here due
to the same results obtained in both cases (GFOE and GFIE mode) because of the excessive
CO32− ions already present in Li2CO3-Na2CO3-K2CO3 (43.5: 31.5: 25.0 mol%).
The existence of CO2 gas in the cathodic gas products in all the molten electrolyte cases can be
due to the reasons as (1) some of the absorbed CO2 from the molten carbonates can come out
with the cathodic product gas (2) CO2 can be produced accompanying the various hydrocarbon
species (3) The difference between the inlet and outlet amounts of CO2 cannot be ultimately
accounted as the transferred CO2 to CO and hydrocarbon products. Some other amounts of CO2
can be absorbed chemically in the molten salts (4) The 100 % CO2 gas conversion cannot be
done. However, in large scale applications, the cathodic product gas with accompanied
amounts of CO2 can be recycled repeatedly with feed gas to increase the ultimate CO2
conversion rate. Ji et al. 36 was able to convert CO2 and H2O into CO, H2 and CH4 products at
600 oC with the current efficiency of 51% in Li-Na-KCO3-0.3LiOH electrolyte.
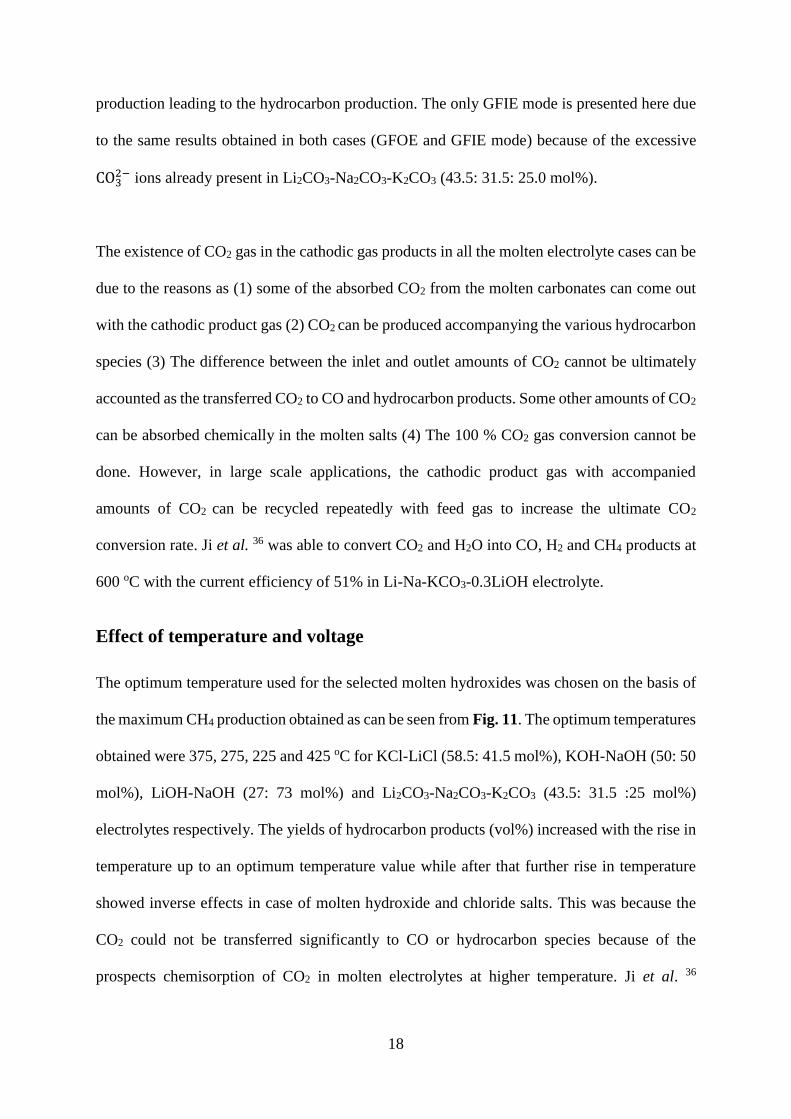
Effect of temperature and voltage
The optimum temperature used for the selected molten hydroxides was chosen on the basis of
the maximum CH4 production obtained as can be seen from Fig. 11. The optimum temperatures
obtained were 375, 275, 225 and 425 oC for KCl-LiCl (58.5: 41.5 mol%), KOH-NaOH (50: 50
mol%), LiOH-NaOH (27: 73 mol%) and Li2CO3-Na2CO3-K2CO3 (43.5: 31.5 :25 mol%)
electrolytes respectively. The yields of hydrocarbon products (vol%) increased with the rise in
temperature up to an optimum temperature value while after that further rise in temperature
showed inverse effects in case of molten hydroxide and chloride salts. This was because the
CO2 could not be transferred significantly to CO or hydrocarbon species because of the
prospects chemisorption of CO2 in molten electrolytes at higher temperature. Ji et al. 36
19
provided the support to the obtained results by reporting that the reduction of co-electrolysis
of CO2 and H2O decreases by increasing the temperature.
While in the case of Li2CO3-Na2CO3-K2CO3, the highest CH4 production increased up to 425
oC while after this temperature CH4 production starts decreasing which might be due to the
increase in production values of other longer chain hydrocarbons (C2-C4) rather than CH4 only.
This can be due to the increase in CO2 gas solubility inside molten chloride at high temperature
(475 oC) 54. The cell voltage is a key variable that can affect energy consumption or current
efficiency but it can also improve the product properties at the same time 17, 55. In case of molten
chlorides and hydroxides, the average current density increased drastically (20 to 70 mA/cm2)
and (70 to 120 mA/cm2) by increasing cell voltage from 2V to 3V as shown in Fig. 12(a) and
(b). Likewise, CH4 concentration (vol%) increased but with slower production rates.
However, the alkali metal electrodeposition starts occurring at a high cell voltage, consequently
affecting the current efficiencies of the products. So, at higher voltage, there is more waste of
energy due to the solid metal accumulation than the desired products 56. Therefore, the optimum
voltage selected for molten chlorides and hydroxides was 2V rather than 3V. To show the effect
of increasing cell voltage in molten carbonates, Fig. 12(c) illustrates the high difference
between the average current (4 to 25 mA/cm2) resulting from electrolysis applied at 1.5 and 2
V. The hydrocarbon formation was confirmed only at 1.5 V while carbon deposition occurred
due to the rise of voltage up to 2 V as also confirmed by previous studies 54, 57. Performing both
runs at 425 oC, hydrocarbon formation at 2 V was rare and not noticeable. Consequently, the
optimum voltage selected for molten chloride and molten hydroxide was 2 V while 1.5 V for
molten carbonates.

20
Formation of higher hydrocarbons
The GC analysis performed using FID detector (Fig. 10(a)) showed that along with methane
production, various higher hydrocarbons were also detected in the case of molten carbonate
electrolyte. Which is further confirmed by GC-MS analysis (Fig. 14). The formation of
methane gas product can be justified due to the reaction of carbon or CO with H2 as follows:
C + 2H2 → CH4 ∆G425C = −49.5 kJmol−1 (16)
CO + 3H2 → CH4 + H2O (g) ∆G425C = −49.5 kJmol−1 (17)
2CO + 2H2 → CH4 + CO2 (g) ∆G425C = −68.4 kJmol−1 (18)
The Gibbs Energy values were determined at 425 oC (HSC Chemistry software, version 6.12;
Outokumpu Research) as this was the temperature of the experiment. It can be seen from the
first mechanism that the production of general hydrocarbons occurs basically from reaction in
Eq. (16) with the fresh deposit of carbon and adsorbed atomic hydrogen (H), produced in turn
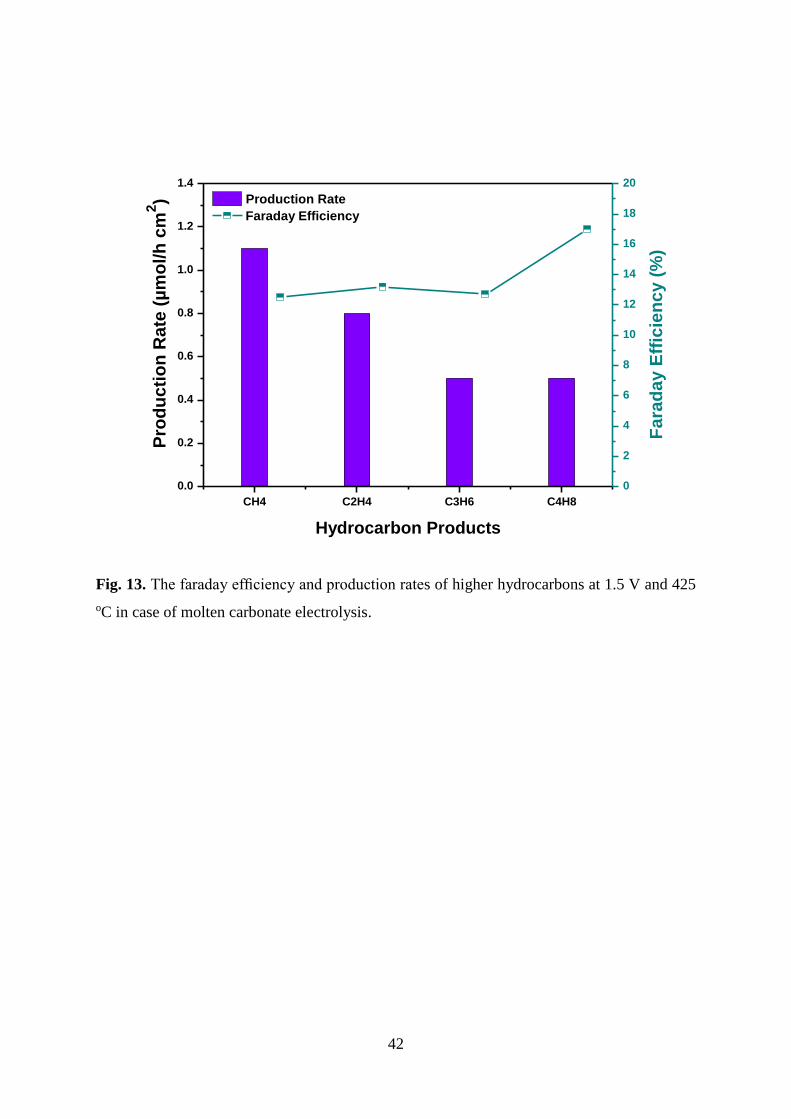
from the individual reduction of CO2 and H2O respectively. On the other hand, the C2, C3 and
C4 hydrocarbons, detected by GC analysis (with FID detector) are shown in Fig. 13 along with
their production rate values (0.80, 0.50, 0.50 µmol/h.cm2) and faradays efficiency (total =
55.20%). It is important to note that the accumulative faraday efficiency for all products (C1,
C2, C3, C4, CO and H2) obtained in case of molten carbonates electrolysis reached to the 95%
(Table 3).
The dominant peaks were of alkene products rather than alkanes in the GC analysis when
detected with FID detector, such as for ethene, propene, butene and pentene at 2.73, 3.06, 7.71
and 18.11 of retention times respectively. However, GC-MS analysis are also showing the
detection for some alkane products. The formation of alkene or alkanes can be justified due to

21
the (1) reaction of C or CO with hydrogen or (2) partial oxidation of methane in molten
carbonate. Furthermore, in the first mechanism the CO produced in excess can react with H2
gas to produce higher hydrocarbons (C2, C3, and C4) through two different routes. The first set
of reactions (Eqs. (19-20)) results in H2O generation 58, 59 whereas the second set (Eqs. (21-
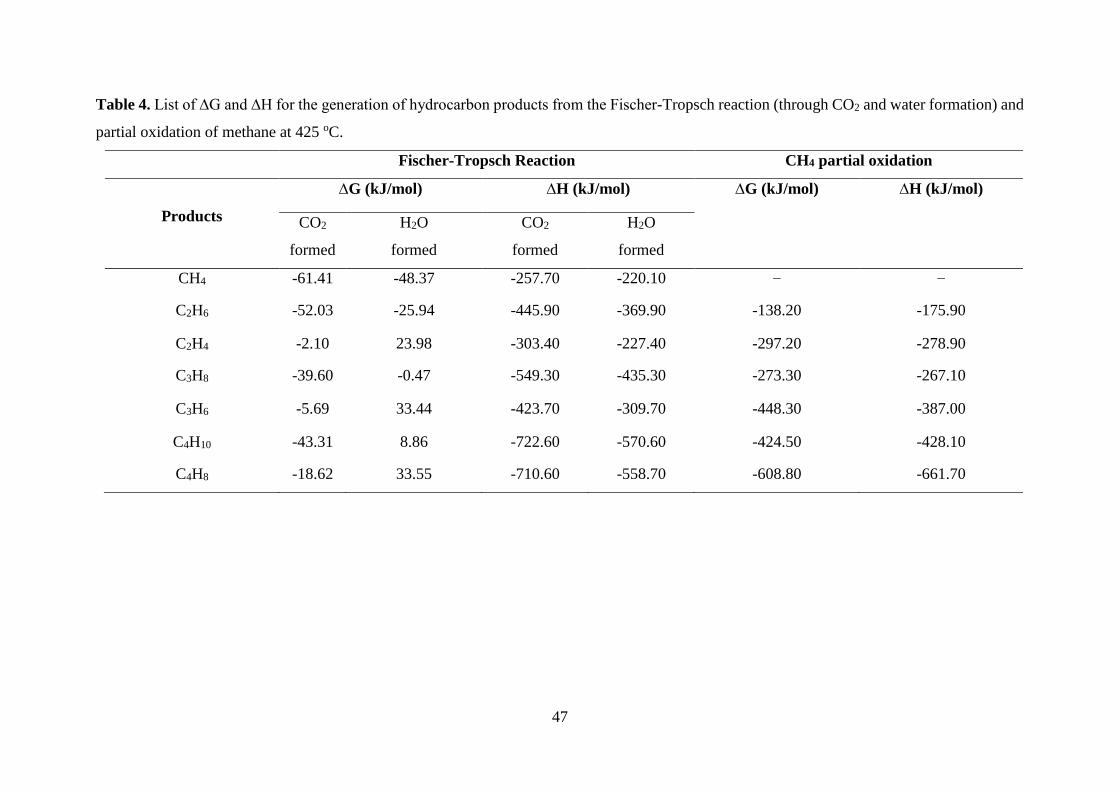
22)) produces CO2 instead 60. The CO2 by-product method is more feasible than the method
with H2O formation as shown in Table 4.
nCO + (2n + 1)H2 → CnH2n+2 + nH2O (19)
nCO + 2nH2 → CnH2n + nH2O (20)
2nCO + (n + 1)H2 → CnH2n+2 + nCO2 (21)
2nCO + nH2 → CnH2n + nCO2 (22)
Alkane and alkene products in general are generated primarily through the CO2 route
particularly in media where CO2 is highly absorbed (molten carbonates). The absorption of
some amounts of generated CO2 can be sustained in the molten salt, driving the reactions (Eqs.
(21-22)) to the right side and increasing hydrocarbon formation. Moreover, due to the primary
production of higher CO rates and in contrast lower H2 rates, alkene hydrocarbons were found
in a higher proportion than the corresponding alkanes in the final cathodic product. The ∆G
data values (Table 4) confirm that the formation of higher hydrocarbon molecules (C2-C4) was
possible through the production of CO2 for alkanes rather than alkenes by the process of Fischer
Tropsch reaction.
Therefore, as far as adequate amounts of CO and H2 gases are produced from electrolysis, there
is sufficient availability for combining on the cathode surface producing alkanes. While the
justification for the formation of alkenes such as C2H4, C3H6, C4H8, rather than alkanes can be

22
provided by the partial oxidation of CH4 gas. These conditions hold true particularly at a lower
CO2 absorption level due to the feasible partial oxidation of CH4 to C2H4 rather than C2H6.
2CH4 + O2 → C2H4 + 2H2O ∆G425C = −297 kJmol−1 (23)
2CH4 + 1 2⁄ O2 → C2H6 + H2O ∆G425C = −138 kJmol−1 (24)
The oxidation of CH4 can be performed in two ways. Firstly, CH4 gas can react directly with
O2 formed at the anode during the co-electrolysis of CO2 and H2O (Eqs. (23-24)) or also can
react with O2 absorbed inside the molten salt for a short time prior to passing through the anode
ceramic tube or being eluted with the cathodic gas product by the draft of feed gas. Secondly,
the absorbed O2 can be transferred to a more reactive oxide anion like peroxide (diatomic O22-
or monoatomic O-), playing a significant role in the methane oxidation mechanism particularly
in the case of low CO2 concentration levels. It can also be seen from Table 4 that the formation
of higher molecular weight hydrocarbons (>C2) will be more feasible (resulting in a more
negative ∆G) by this mechanism with the priority on alkenes rather than alkanes.
The formation of C2H6, C3H8 and C4H10 was relatively small compared with the corresponding
alkenes as also seen by GC-MS analysis (Fig. 14) as the peaks 57, 43 and 29 stands for the
mass of fragments lost from C4H10 (CH3CH2CH2CH3), C3H8 (CH3CH2CH3) and C2H6
(CH3CH3) respectively. The last peaks (43 and 29) are produced from the further fragmentation
of C3H8 and C4H10. Peaks 55 and 41 stands for the mass of fragments lost from 1-C4H8 (for
instance) and C3H6 respectively. Peak 15 is showing the mass fragment (methyl) lost from
C4H10, C3H8 and C2H6. Branco et al. 61, 62 also stated the higher hydrocarbon production (C2-
C4) through partial oxidation of methane in molten salt electrolytes.

23
Energy consumption and heating values
The energy required for the conversion of CO2 to carbon/hydrocarbons will be that needed to
carry out the electrolysis and heating up of the molten salt 32. If the heating values or energy
supplied from the produced fuels are able to compensate some or all the energy consumed
while performing electrolysis, the process feasibility increases63. This is because the yield of
heat generated from the produced hydrocarbon fuel can compensate or substitute some of the
normal electricity employed in large scale industrial applications. In the case of molten chloride
(KCl-LiCl; 41–59 mol%) electrolyte, the heating value obtained is 162 J from the produced
fuel (H2 and CH4) with the energy consumption of 278 J. While the heating values obtained
are 136 and 170 J from the produced fuels (H2 and CH4) by using KOH-NaOH (50: 50 mol%)
and LiOH-NaOH (27:73 mol%) respectively. And with the energy consumption of 1200 and
1000 J in KOH-NaOH (50: 50 mol%) and LiOH-NaOH (27:73 mol%) electrolysis respectively
(see Table 2).
The greater the production of higher hydrocarbons (C1-C4), the greater the faraday efficiency
and subsequent energy profit attained due to their ability to produce more heating energy
(Table 3). It is very interesting to note that the energy obtained from the summation of heating
values of cathodic products in Li2CO3-Na2CO3-K2CO3 (43.5 : 31.5 : 25 mol%) case was 94.6 J
while the total consumed energy was 114.2 J with about 100% of faraday efficiency (Table 3).
The higher total efficiency results in significantly lower energy consumption of 114 J for the
total fuel produced or just 0.157 kWh per mole of fuel. This value is apparently less than the
energy consumed for an optimum deposit carbon operation of 0.456 kWh per mole of carbon
64. As in all the cases, the produced hydrocarbon fuels are able to provide sufficient heating
values so the CO2-H2O co-electrolysis processes are considered successful. Tang et al. 54 has
24
optimized energy consumption for producing 1 kg of carbon from CO2 as low as 35.59 kW h
with a current efficiency of 87.86% under a constant cell voltage of 3.5 V in molten carbonates.
Conclusions
This study presents a new method of CO2-H2O conversion into hydrocarbon fuel via molten
salts electrolysis at relatively low temperature that is a dire need of hydrocarbon production.
The synthesis method generated methane and hydrogen gases by a direct simultaneous splitting
of CO2 and H2O in LiCl-KCl (58.5: 41.5 mol%), LiOH-NaOH (27: 73 mol%), KOH-NaOH
(50 : 50 mol%) and Li2CO3-Na2CO3-K2CO3 (43.5 : 31.5 : 25 mol%) electrolyte mixtures. The
optimization of each electrolyte was done in the gas feed introduction method (GFOE and
GFIE) for obtaining more fuel production. In the case of KCl-LiCl (41: 59 mol%), CH4 (0.67
µmol/h.cm2) and H2 (32 µmol/h.cm2) were produced with GFIE mode at atmospheric pressure.
While in molten hydroxide (LiOH-NaOH; 27: 73 mol %), the H2 was the predominant gas due
to H2O electrolysis which contributed majorly to the production of CH4 by reacting with CO2.
The hydrocarbon production rate increased (CH4: 1.02 to 6.12 µmol h/cm2) by changing the
feed gas insertion mode from GFOE to GFIE by using a ceramic tube. In case of molten
carbonate, the production rate of CO (11.70 µmol/h.cm2) was significantly higher than H2 (4.40
µmol/h.cm2) in cathodic gas product. Along with H2 and CO, other hydrocarbon species such
as CH4 and olefins were also produced in molten carbonate case with 99 % of faraday efficiency
while other being 59.30% and 87.70% in molten chloride and molten hydroxides respectively.
Moreover, the suitable conditions at which the fuel production was achievable are 375 oC, 275
oC and 475 oC for molten chlorides, molten hydroxides and molten carbonates under the cell
voltage of 2V, 2V and 1.5 V respectively. The proposed technique holds promise as a method
for converting electrical energy produced from renewable power sources into conventional
fuel, this should be used in future with increased production concentrations.

25
Acknowledgement
The authors are grateful for the financial supports from the EPSRC (EP/J000582/1 and
EP/F026412/1) and Ningbo Municipal People’s Governments (3315 Plan and 2014A35001-1).

26
References
1. Lei, L.; Liu, T.; Fang, S.; Lemmon, J. P.; Chen, F., The co-electrolysis of CO 2–H 2
O to methane via a novel micro-tubular electrochemical reactor. Journal of Materials
Chemistry A 2017, 5 (6), 2904-2910.
2. Ren, J.; Yu, A.; Peng, P.; Lefler, M.; Li, F.-F.; Licht, S., Recent Advances in Solar
Thermal Electrochemical Process (STEP) for Carbon Neutral Products and High Value
Nanocarbons. Accounts of chemical research 2019, 52 (11), 3177-3187.
3. Christensen, E.; Petrushina, I.; Nikiforov, A. V.; Berg, R. W.; Bjerrum, N. J.,
CsH2PO4 as Electrolyte for the Formation of CH4 by Electrochemical Eeduction of CO2.
Journal of The Electrochemical Society 2020, 167 (4), 044511.
4. Skafte, T. L.; Blennow, P.; Hjelm, J.; Graves, C., Carbon deposition and sulfur
poisoning during CO2 electrolysis in nickel-based solid oxide cell electrodes. Journal of Power
Sources 2018, 373, 54-60.
5. Sher, F.; Iqbal, S. Z.; Liu, H.; Imran, M.; Snape, C. E., Thermal and kinetic analysis
of diverse biomass fuels under different reaction environment: A way forward to renewable
energy sources. Energy Conversion and Management 2020, 203, 112266.
6. Hassan, M. H. A.; Sher, F.; Zarren, G.; Suleiman, N.; Tahir, A. A.; Snape, C. E.,
Kinetic and thermodynamic evaluation of effective combined promoters for CO2 hydrate
formation. Journal of Natural Gas Science and Engineering 2020, 78, 103313.
7. Kumaravel, V.; Bartlett, J.; Pillai, S. C., Photoelectrochemical conversion of carbon
dioxide (CO2) into fuels and value-added products. ACS Energy Letters 2020.
8. Anwar, M.; Fayyaz, A.; Sohail, N.; Khokhar, M.; Baqar, M.; Yasar, A.; Rasool, K.;
Nazir, A.; Raja, M.; Rehan, M., CO2 utilization: Turning greenhouse gas into fuels and
valuable products. Journal of Environmental Management 2020, 260, 110059.
9. Sastre, F.; Muñoz‐Batista, M. J.; Kubacka, A.; Fernández‐García, M.; Smith, W. A.;
Kapteijn, F.; Makkee, M.; Gascon, J., Efficient Electrochemical Production of Syngas from
CO2 and H2O by using a Nanostructured Ag/g‐C3N4 Catalyst. ChemElectroChem 2016, 3 (9),
1497-1502.
10. Wu, H.; Ji, D.; Li, L.; Yuan, D.; Zhu, Y.; Wang, B.; Zhang, Z.; Licht, S., A new
technology for efficient, high yield carbon dioxide and water transformation to methane by
electrolysis in molten salts. Advanced Materials Technologies 2016, 1 (6), 1600092.
11. Li, Z.; Zhang, W.; Ji, D.; Liu, S.; Cheng, Y.; Han, J.; Wu, H., Electrochemical
Conversion of CO2 into Valuable Carbon Nanotubes: The Insights into Metallic Electrodes
Screening. Journal of The Electrochemical Society 2020, 167 (4), 042501.
12. Long, C.; Li, X.; Guo, J.; Shi, Y.; Liu, S.; Tang, Z., Electrochemical reduction of
CO2 over heterogeneous catalysts in aqueous solution: recent progress and perspectives. Small
Methods 2019, 3 (3), 1800369.
13. Moura de Salles Pupo, M.; Kortlever, R., Electrolyte effects on the electrochemical
reduction of CO2. ChemPhysChem 2019, 20 (22), 2926-2935.
14. Chen, Y.; Wang, M.; Lu, S.; Tu, J.; Jiao, S., Electrochemical graphitization conversion
of CO2 through soluble NaVO3 homogeneous catalyst in carbonate molten salt.
Electrochimica Acta 2020, 331, 135461.
15. Kusama, S.; Saito, T.; Hashiba, H.; Sakai, A.; Yotsuhashi, S., Crystalline copper (II)
phthalocyanine catalysts for electrochemical reduction of carbon dioxide in aqueous media.
ACS Catalysis 2017, 7 (12), 8382-8385.
16. Acar, C.; Dincer, I., Review and evaluation of hydrogen production options for better
environment. Journal of Cleaner Production 2019, 218, 835-849.

27
17. Al-Shara, N. K.; Sher, F.; Iqbal, S. Z.; Curnick, O.; Chen, G. Z., Design and
optimization of electrochemical cell potential for hydrogen gas production. Journal of Energy
Chemistry 2021, 52, 421-427.
18. Luo, Y.; Shi, Y.; Chen, Y.; Li, W.; Jiang, L.; Cai, N., Pressurized Tubular Solid
Oxide H2O/CO2 Co‐electrolysis Cell for Direct Power‐to‐Methane. AIChE Journal 2020,
e16896.
19. Kamali, A. R., Production of Advanced Materials in Molten Salts. In Green Production
of Carbon Nanomaterials in Molten Salts and Applications, Springer: 2020; pp 5-18.
20. Dogu, D.; Gunduz, S.; Meyer, K. E.; Deka, D. J.; Ozkan, U. S., CO 2 and H 2 O
Electrolysis Using Solid Oxide Electrolyzer Cell (SOEC) with La and Cl-doped Strontium
Titanate Cathode. Catalysis Letters 2019, 149 (7), 1743-1752.
21. Wu, H.; Liu, Y.; Ji, D.; Li, Z.; Yi, G.; Yuan, D.; Wang, B.; Zhang, Z.; Wang, P.,
Renewable and high efficient syngas production from carbon dioxide and water through solar
energy assisted electrolysis in eutectic molten salts. Journal of Power Sources 2017, 362, 92-
104.
22. Xu, H.; Chen, B.; Irvine, J.; Ni, M., Modeling of CH4-assisted SOEC for H2O/CO2
co-electrolysis. International Journal of Hydrogen Energy 2016, 41 (47), 21839-21849.
23. Tang, D.; Dou, Y.; Yin, H.; Mao, X.; Xiao, W.; Wang, D., The capacitive
performances of carbon obtained from the electrolysis of CO2 in molten carbonates: Effects of
electrolysis voltage and temperature. Journal of Energy Chemistry 2019.
24. Ji, D.; Li, Z.; Li, W.; Yuan, D.; Wang, Y.; Yu, Y.; Wu, H., The optimization of
electrolyte composition for CH4 and H2 generation via CO2/H2O co-electrolysis in eutectic
molten salts. International Journal of Hydrogen Energy 2019, 44 (11), 5082-5089.
25. Liu, Y.; Ji, D.; Li, Z.; Yuan, D.; Jiang, M.; Yang, G.; Yu, Y.; Wang, Y.; Wu, H.,
Effect of CaCO3 addition on the electrochemical generation of syngas from CO2/H2O in
molten salts. International Journal of Hydrogen Energy 2017, 42 (29), 18165-18173.
26. Xiao, W.; Wang, D.-H., Rare metals preparation by electro-reduction of solid
compounds in high-temperature molten salts. Rare Metals 2016, 35 (8), 581-590.
27. Ijije, H. V.; Sun, C.; Chen, G. Z., Indirect electrochemical reduction of carbon dioxide
to carbon nanopowders in molten alkali carbonates: Process variables and product properties.
Carbon 2014, 73, 163-174.
28. Liu, Y.; Yuan, D.; Ji, D.; Li, Z.; Zhang, Z.; Wang, B.; Wu, H., Syngas production:
diverse H 2/CO range by regulating carbonates electrolyte composition from CO 2/H 2 O via
co-electrolysis in eutectic molten salts. RSC advances 2017, 7 (83), 52414-52422.
29. Weng, W.; Tang, L.; Xiao, W., Capture and electro-splitting of CO2 in molten salts.
Journal of Energy Chemistry 2019, 28, 128-143.
30. Ge, J.; Hu, L.; Wang, W.; Jiao, H.; Jiao, S., Electrochemical Conversion of CO2 into
Negative Electrode Materials for Li‐Ion Batteries. ChemElectroChem 2015, 2 (2), 224-230.
31. Deng, B.; Chen, Z.; Gao, M.; Song, Y.; Zheng, K.; Tang, J.; Xiao, W.; Mao, X.;
Wang, D., Molten salt CO2 capture and electro-transformation (MSCC-ET) into capacitive
carbon at medium temperature: effect of the electrolyte composition. Faraday discussions
2016, 190, 241-258.
32. Ijije, H. V.; Lawrence, R. C.; Chen, G. Z., Carbon electrodeposition in molten salts:
electrode reactions and applications. RSC advances 2014, 4 (67), 35808-35817.
33. Ren, J.; Johnson, M.; Singhal, R.; Licht, S., Transformation of the greenhouse gas
CO2 by molten electrolysis into a wide controlled selection of carbon nanotubes. Journal of
CO2 Utilization 2017, 18, 335-344.
34. Douglas, A.; Carter, R.; Muralidharan, N.; Oakes, L.; Pint, C. L., Iron catalyzed
growth of crystalline multi-walled carbon nanotubes from ambient carbon dioxide mediated by
molten carbonates. Carbon 2017, 116, 572-578.

28
35. Arcaro, S.; Berutti, F.; Alves, A.; Bergmann, C., MWCNTs produced by electrolysis
of molten carbonate: Characteristics of the cathodic products grown on galvanized steel and
nickel chrome electrodes. Applied Surface Science 2019, 466, 367-374.
36. Ji, D.; Liu, Y.; Li, Z.; Yuan, D.; Yang, G.; Jiang, M.; Wang, Y.; Yu, Y.; Wu, H., A
comparative study of electrodes in the direct synthesis of CH4 from CO2 and H2O in molten
salts. International Journal of Hydrogen Energy 2017, 42 (29), 18156-18164.
37. Li, L.; Shi, Z.; Gao, B.; Hu, X.; Wang, Z., Electrochemical conversion of CO2 to
carbon and oxygen in LiCl–Li2O melts. Electrochimica Acta 2016, 190, 655-658.
38. Kaplan, V.; Wachtel, E.; Gartsman, K.; Feldman, Y.; Lubomirsky, I., Conversion of
CO2 to CO by electrolysis of molten lithium carbonate. Journal of the Electrochemical Society
2010, 157 (4), B552-B556.
39. Ijije, H. V. Electrochemical conversion of carbon dioxide to carbon in molten carbonate
salts. University of Nottingham, Cenrtal Store, 2015.
40. Hu, L.; Song, Y.; Ge, J.; Zhu, J.; Han, Z.; Jiao, S., Electrochemical deposition of
carbon nanotubes from CO 2 in CaCl 2–NaCl-based melts. Journal of Materials Chemistry A
2017, 5 (13), 6219-6225.
41. Lorenz, P. K.; Janz, G. J., Electrolysis of molten carbonates: anodic and cathodic gas-
evolving reactions. Electrochimica Acta 1970, 15 (6), 1025-1035.
42. Halmann, M.; Zuckerman, K., Electroreduction of carbon dioxide to carbon monoxide
in molten LiCl + KCl, LiF + KF + NaF, Li2CO3 + Na2CO3 + K2CO3 and AlCl3 + NaCl.
Journal of Electroanalytical Chemistry and Interfacial Electrochemistry 1987, 235 (1), 369-
380.
43. Song, Q.; Xu, Q.; Wang, Y.; Shang, X.; Li, Z., Electrochemical deposition of carbon
films on titanium in molten LiCl–KCl–K2CO3. Thin Solid Films 2012, 520 (23), 6856-6863.
44. Al-Shara, N. K.; Sher, F.; Yaqoob, A.; Chen, G. Z., Electrochemical investigation of
novel reference electrode Ni/Ni (OH) ₂ in comparison with silver and platinum inert quasi-
reference electrodes for electrolysis in eutectic molten hydroxide. International Journal of
Hydrogen Energy 2019.
45. Deng, B.; Tang, J.; Gao, M.; Mao, X.; Zhu, H.; Xiao, W.; Wang, D., Electrolytic
synthesis of carbon from the captured CO2 in molten LiCl–KCl–CaCO3: Critical roles of
electrode potential and temperature for hollow structure and lithium storage performance.
Electrochimica Acta 2018, 259, 975-985.
46. Kamali, A. R.; Fray, D. J., Large-scale preparation of graphene by high temperature
insertion of hydrogen into graphite. Nanoscale 2015, 7 (26), 11310-11320.
47. Ijije, H. V.; Lawrence, R. C.; Siambun, N. J.; Jeong, S. M.; Jewell, D. A.; Hu, D.;
Chen, G. Z., Electro-deposition and re-oxidation of carbon in carbonate-containing molten
salts. Faraday discussions 2014, 172, 105-116.
48. Otake, K.; Kinoshita, H.; Kikuchi, T.; Suzuki, R. O., CO2 gas decomposition to carbon
by electro-reduction in molten salts. Electrochimica Acta 2013, 100, 293-299.
49. Al-Shara, N. K.; Sher, F.; Iqbal, S. Z.; Sajid, Z.; Chen, G. Z., Electrochemical study
of different membrane materials for the fabrication of stable, reproducible and reusable
reference electrode. Journal of Energy Chemistry 2020.
50. Graves, C.; Ebbesen, S. D.; Mogensen, M.; Lackner, K. S., Sustainable hydrocarbon
fuels by recycling CO2 and H2O with renewable or nuclear energy. Renewable and Sustainable
Energy Reviews 2011, 15 (1), 1-23.
51. Pardo, P.; Deydier, A.; Anxionnaz-Minvielle, Z.; Rougé, S.; Cabassud, M.; Cognet,
P., A review on high temperature thermochemical heat energy storage. Renewable and
Sustainable Energy Reviews 2014, 32, 591-610.
52. Groult, H.; Le Van, K.; Lantelme, F., Electrodeposition of carbon-metal powders in
alkali carbonate melts. Journal of The Electrochemical Society 2014, 161 (7), D3130-D3138.

29
53. Chery, D.; Albin, V.; Meléndez-Ceballos, A.; Lair, V.; Cassir, M., Mechanistic
approach of the electrochemical reduction of CO2 into CO at a gold electrode in molten
carbonates by cyclic voltammetry. International Journal of Hydrogen Energy 2016, 41 (41),
18706-18712.
54. Tang, D.; Yin, H.; Mao, X.; Xiao, W.; Wang, D., Effects of applied voltage and
temperature on the electrochemical production of carbon powders from CO2 in molten salt
with an inert anode. Electrochimica Acta 2013, 114, 567-573.
55. Tang, D.; Yin, H.; Mao, X.; Xiao, W.; Wang, D. H., Effects of applied voltage and
temperature on the electrochemical production of carbon powders from CO2 in molten salt
with an inert anode. Electrochimica Acta 2013, 114, 567-573.
56. Novoselova, I. A.; Kuleshov, S. V.; Volkov, S. V.; Bykov, V. N., Electrochemical
synthesis, morphological and structural characteristics of carbon nanomaterials produced in
molten salts. Electrochimica Acta 2016, 211, 343-355.
57. Yin, H.; Mao, X.; Tang, D.; Xiao, W.; Xing, L.; Zhu, H.; Wang, D.; Sadoway, D.
R., Capture and electrochemical conversion of CO 2 to value-added carbon and oxygen by
molten salt electrolysis. Energy & Environmental Science 2013, 6 (5), 1538-1545.
58. Torrente-Murciano, L.; Mattia, D.; Jones, M. D.; Plucinski, P. K., Formation of
hydrocarbons via CO2 hydrogenation – A thermodynamic study. Journal of CO2 Utilization
2014, 6, 34-39.
59. Akhmedov, V.; Ismailzadeh, A., The Role of CO 2 and H 2 O in the Formation of Gas-
Oil Hydrocarbons: Current Performance and Outlook. Journal of Mathematics 2020, 7 (1).
60. Jafarbegloo, M.; Tarlani, A.; Mesbah, A. W.; Sahebdelfar, S., Thermodynamic
analysis of carbon dioxide reforming of methane and its practical relevance. International
Journal of Hydrogen Energy 2015, 40 (6), 2445-2451.
61. Branco, J. B.; Lopes, G.; Ferreira, A. C.; Leal, J. P., Catalytic oxidation of methane
on KCl-MClx (M= Li, Mg, Co, Cu, Zn) eutectic molten salts. Journal of Molecular Liquids
2012, 171, 1-5.
62. Branco, J. B.; Lopes, G.; Ferreira, A. C., Catalytic oxidation of methane over KCl-
LnCl3 eutectic molten salts. Catalysis Communications 2011, 12 (15), 1425-1427.
63. Al-Juboori, O.; Sher, F.; Hazafa, A.; Khan, M. K.; Chen, G. Z., The effect of variable
operating parameters for hydrocarbon fuel formation from CO2 by molten salts electrolysis.
Journal of CO2 Utilization 2020, 40, 101193.
64. Yin, H.; Mao, X.; Tang, D.; Xiao, W.; Xing, L.; Zhu, H.; Wang, D.; Sadoway, D.
R., Capture and electrochemical conversion of CO2 to value-added carbon and oxygen by
molten salt electrolysis. Energy & Environmental Science 2013, 6 (5), 1538-1545.

30
List of Figures
Fig. 1. A schematic representation of the experimental setup.
31
Fig. 2. The gas chromatography analysis of calibration gas standards as reference for the comparison with other electrolysis gaseous products by
(a) FID detector (b) TCD detector.
0 5 10 15 20 25 30
4.8
5.0
5.2
5.4
5.6
5.8
6.0
Pe
nte
ne
Pe
nta
ne
Bu
tan
e
Pro
pan
e
Re
sp
on
se
(m
V)
Time (min)
2.1
12.5
23.0
4.2
3
7.8
0 12.4
0
18.0
21.0
23.1
2
(a) FID
Bu
ten
e
Meth
an
eE
than
eE
then
e
Pro
pen
e
0 2 4 6 8 10 12 14
120
130
140
150
160
170
180
190
200
He
1.1
9
Resp
on
se (
mV
)
Time (min)
1.1
2
2.1
3
9.6
3
8.9
0
8.4
1
(b) TCD
CON2
O2
CO
2
H2
32
Fig. 3. Current-time curves resulting from electrolysis performed in molten chloride with and
without CO2 at 2V and 375 oC in GFOE mode.
0 10 20 30 40 50 60
0
10
20
30
40
50 Humid CO
2
Humid Ar
Cu
rre
nt
De
ns
ity
(m
A/c
m2)
Time (min)

33
Fig. 4. The faraday efficiency and production rates of gaseous products at 2 V and 375 oC under
different current density in case of molten chloride electrolysis during GFIE mode after (a) 30
min (b) 60 min.
10 20 30 40 500.0
0.3
0.6
0.9
1.2
30
35
40
45
50
H2
CH4
Faraday Efficiency
Current Density (mA/cm2)
Pro
du
cti
on
Ra
te (
µm
ol/
h c
m2) 59.30%
(a)
0
10
20
30
40
50
60
70
Fa
rad
ay
Eff
icie
nc
y (
%)
10 20 30 40 50
0.0
0.3
0.6
0.9
1.2
20
30
40
50
H2
CH4
Faraday Efficiency
Current Density (mA/cm2)
Pro
du
cti
on
Ra
te (
µm
ol/
h c
m2)
(b)
30.50%
0
10
20
30
40
50
60
70
Fa
rad
ay
Eff
icie
nc
y (
%)
34
Fig. 5. The gas chromatography analysis of gaseous products in case of molten chloride electrolysis at 375 oC and 2 V by (a) FID detector (b)
TCD detector.
0 2 4 6 8 10 12
4.9
5.0
5.1
5.2
5.3
5.4
(a) FID
2.1
1C
H4
Resp
on
se (
mV
)
Time (min)
0 2 4 6 8 10 12
100
150
200
250
300
350
400
8.9
4
8.3
8
2.1
2
1.0
71
.02
H2
He
CO
2
O2
N2
TCD
Resp
on
se (
mV
)
Time (min)
(b)

35
Fig. 6. The faraday efficiency and production rates of gaseous products at 2 V under different
current density after electrolysis in; (a) LiOH-NaOH with GFOE mode at 275 oC(b) LiOH-
NaOH with GFIE mode at 275 oC (c) KOH-NaOH with GFIE mode at 225oC.
20 40 60 80 100
0.0
0.5
1.0
1.5
1000
1100
1200
1300
1400
H2
CH4
Faraday Efficiency
Current Density (mA/cm2)
Pro
du
cti
on
Rate
(µ
mo
l/h
cm
2)
0
10
20
30
40
50
60
70
80
90
100
87.70%
Fa
rad
ay
Eff
icie
nc
y (
%)
(a)
20 40 60 80 100
0
1
2
3
4
5
6
200
400
600
800
1000
1200
1400
H2
CH4
Faraday Efficiency
Current Density (mA/cm2)
Pro
du
cti
on
Ra
te (
µm
ol/h
cm
2)
0
10
20
30
40
50
60
70
80
90
100
(b)
15% Fara
day
Eff
icie
ncy
(%
)
20 40 60 80 100
0
1
2
3
4
5
6
200
400
600
800
1000
1200
1400
H2
CH4
Faraday Efficiency
Current Density (mA/cm2)
Pro
du
cti
on
Ra
te (
µm
ol/h
cm
2)
0
10
20
30
40
50
60
70
80
90
100
17.90% Fa
rad
ay
Eff
icie
nc
y (
%)
(c)

36
Fig. 7. The gas chromatography analysis of gaseous products in case of molten hydroxide (LiOH-NaOH) electrolysis by (a) FID detector (b) TCD
detector.
0 1 2 3 4 5 6 7 8 9 10 11 12
4.9
5.0
5.1
5.2
5.3
5.4
5.5
FID
CH
42
.12
Resp
on
se (
mV
)
Time (min)
(a)
0 1 2 3 4 5 6 7 8 9 10 11 12
0
100
200
300
400
500
600
700
800
9.6
3C
O
(b)
N2
9.2
3
8.4
1O
2
2.2
2C
O2
He
H2
1.0
31.0
7
TCD
Re
sp
on
se
(m
V)
Time (min)

37
Fig. 8. Current-time curves resulting from electrolysis performed in two different molten
hydroxides at 2V.
0 10 20 30 40 50 60
30
40
50
60
70
80
90
KOH-NaOH
LiOH-NaOH
Cu
rre
nt
De
ns
ity
(m
A/c
m2)
Time (min)

38
Fig. 9. The faraday efficiency and production rate of gaseous products at 1.5 V and 425 oC
under different current density in molten carbonate electrolyte.
2 4 6 8 10
0.0
0.5
1.0
1.5
4
8
12
16
56.20%
H2
CH4
CO
Faraday Efficiency
Current Density (mA/cm2)
Pro
du
cti
on
Ra
te (
µm
ol/h c
m2)
0
10
20
30
40
50
60
70
Fa
rad
ay
Eff
icie
nc
y (
%)
39
Fig. 10. The gas chromatography analysis of gaseous products in case of molten carbonate electrolysis by (a) FID detector (b) TCD detector.
0 2 4 6 8 10 12 14
100
120
140
160
180
200
220
0 2 4 6 8 10 12 14 16 18 20
4.50
4.75
5.00
5.25
5.50
5.75
6.00
(b)
1.0
9
Resp
on
se (
mV
)
TCD
9.2
3
11
.2C
ON2
O2
CO
2
He
H2
8.4
1
2.2
1
1.0
2
Time (min)
(a)
Bu
ten
e
CH
4
FID
3.0
62.7
3
2.1
1
7.7
1 18
.11
Eth
an
eE
then
e
Pro
pen
e

40
Fig. 11. The selection of optimum temperatures for all electrolytes on the basis of CH4
production.
200 250 300 350 400 450 500
-0.02
0.00
0.02
0.04
0.06
0.08
0.10
0.12
0.14
0.16
Li2CO
3-Na
2CO
3-K
2CO
3
KCl-LiCl
LiOH-NaOH
KOH-NaOH
Pro
du
cti
on
of
CH
4 (
Vo
l%)
Temperature (oC)

41
Fig. 12. The current density vs time plot at different voltages for three types of electrolytes; (a)
molten chloride, (b) molten hydroxide and (c) molten carbonate.
20
40
60
80
100
30
60
90
120
150
0 10 20 30 40 50 60
0
5
10
15
20
25
30(c)
(b)
2 V
3V
(a)
2 V
3 V
Cu
rre
nt
De
ns
ity (
mA
/cm
2)
1.5 V
2 V
Time (min)
42
Fig. 13. The faraday efficiency and production rates of higher hydrocarbons at 1.5 V and 425
oC in case of molten carbonate electrolysis.
CH4 C2H4 C3H6 C4H8
0.0
0.2
0.4
0.6
0.8
1.0
1.2
1.4
Hydrocarbon Products
Pro
du
cti
on
Ra
te (
µm
ol/h
cm
2)
0
2
4
6
8
10
12
14
16
18
20
Production Rate
Faraday Efficiency
Fa
rad
ay
Eff
icie
nc
y (
%)

43
Fig. 14. The mass spectrum of compounds showing hydrocarbon after electrolysis in molten
carbonate electrolyte under 1.5 V at 425 ℃.
10 15 20 25 30 35 40 45 50 55 60 65 70
0
1x10³
2x10³
3x10³
4x10³
5x10³
Inte
ns
ity
(a
.u)
m/z
C3H
6
C4H
8
57.1
55
43
41
29
15
C4H
10
C3H
8
C2H
6
CH3

44
List of Tables
Table 1.Specification of cathodic gas products in molten chloride salt with GFIE mode of electrolysis at 2V and 375 oC by using GC analysis.
Products
Gas product composition
(vol. %)
Uncertainty of gas
composition
Faraday efficiency
(%)
Energy consumption
(J)
(30 min) (60 min) (30 min) (60 min) (30 min) (60 min) (30 min) (60 min)
H2 2.40 2.48 ±0.10 ± 0.10 54.80 28.20
278.00
311.00
CH4 0.05 0.05 ±0.005 ±0.005 4.50 2.30
CO 0.00 0.00 0.00 0.00 0.00 0.00
CO2 34.80 4.84 – – – –
H2O 2.00 2.00 – – – –
Ar 60.70 90.60 – – – –

45
Table 2. Specification of cathodic gas products during electrolysis in molten hydroxide (LiOH-NaOH) at 275 oC and (KOH-NaOH) at 225 oC
under 2V applied voltage using GC analysis.
* After electrolysis with GFOE mode
** After electrolysis with GFIE mode
Products
Gas product composition
(vol. %)
Uncertainty of gas
composition
Faraday efficiency
(%)
Heating values
(J)
Energy
consumption
(J)
*LiOH-
NaOH
**LiOH-
NaOH
**KOH-
NaOH
*LiOH-
NaOH
**LiOH-
NaOH
**KOH
-NaOH
*LiOH-
NaOH
**LiOH
-NaOH
**KOH
-NaOH
**LiOH-
NaOH
**KOH-
NaOH
**LiOH-
NaOH
**KOH-
NaOH
H2 27.3 4.44 3.94 ± 0.90 ± 0.10 ± 0.10 87.30 13.00 15.60 130.00 116.00
1200.00
1000.00
CH4 0.03 0.15 0.15 ± 0.004 ± 0.01 ± 0.01 0.40 2.00 2.30 14.00 12.00
CO 0.00 0.00 0.00 0.00 0.00 0.00 0.00 0.00 0.00 0.00 0.00
CO2 0.480 0.750 0.580 – – – – – – – –
H2O 0.00 0.00 0.00 – – – – – – – –
Ar 72.20 94.70 95.30 – – – – – – – –

46
Table 3. Specification of cathodic gas products after electrolysis in molten carbonate at 1.5 V and 425 oC by using GC and mass spectrometric
analysis.
Product Gas product composition
(vol. %)
Uncertainty of gas
composition
Faraday efficiency
(%)
Heating value
(J)
Energy consumption
(J)
H2 0.22 ±0.04 11.90 11.40
114.20
CH4 0.06 ±0.005 12.50 10.40
C2H4 0.04 ±0.003 13.20 12.00
C3H6 0.03 ±0.005 12.70 11.00
C4H8 0.03 ±0.002 17.00 14.50
CO 0.58 ±0.09 31.80 35.30
CO2 52.70 – – –
H2O 2.40 – – –
Ar 44.00 – – –
47
Table 4. List of ∆G and ∆H for the generation of hydrocarbon products from the Fischer-Tropsch reaction (through CO2 and water formation) and
partial oxidation of methane at 425 oC.
Fischer-Tropsch Reaction CH4 partial oxidation
Products
∆G (kJ/mol) ∆H (kJ/mol) ∆G (kJ/mol) ∆H (kJ/mol)
CO2
formed
H2O
formed
CO2
formed
H2O
formed
CH4 -61.41 -48.37 -257.70 -220.10 – –
C2H6 -52.03 -25.94 -445.90 -369.90 -138.20 -175.90
C2H4 -2.10 23.98 -303.40 -227.40 -297.20 -278.90
C3H8 -39.60 -0.47 -549.30 -435.30 -273.30 -267.10
C3H6 -5.69 33.44 -423.70 -309.70 -448.30 -387.00
C4H10 -43.31 8.86 -722.60 -570.60 -424.50 -428.10
C4H8 -18.62 33.55 -710.60 -558.70 -608.80 -661.70
48
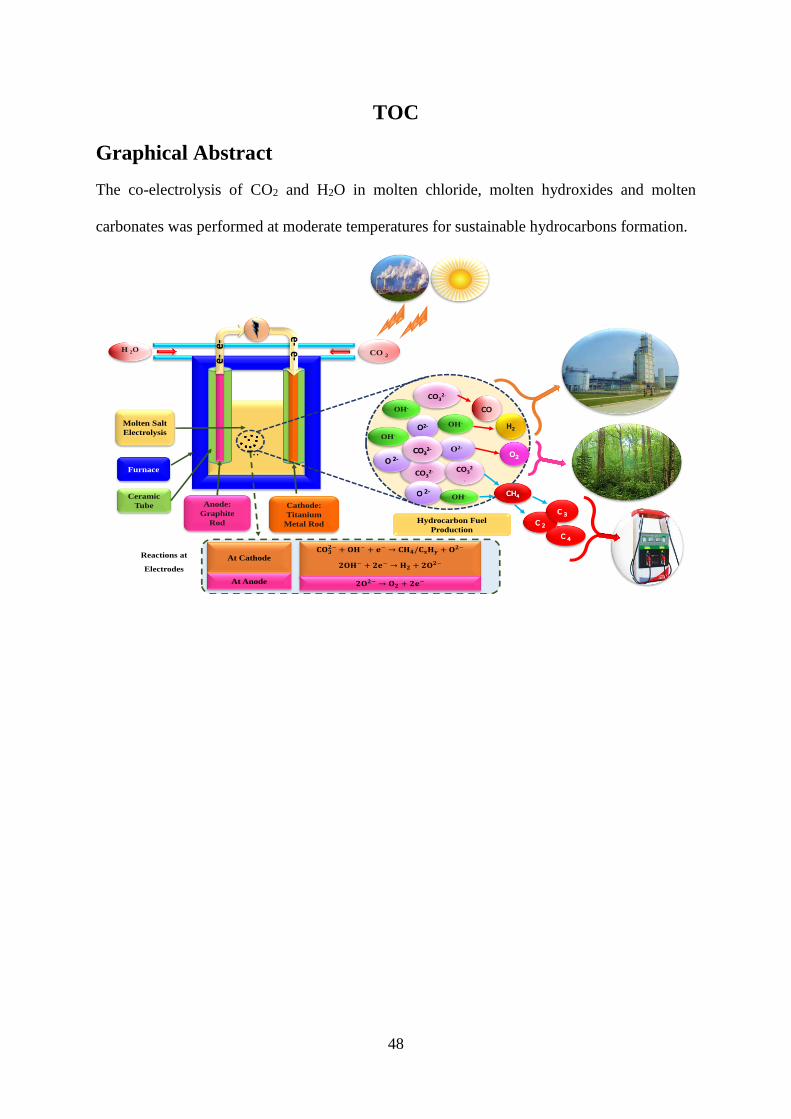
TOC
Graphical Abstract
The co-electrolysis of CO2 and H2O in molten chloride, molten hydroxides and molten
carbonates was performed at moderate temperatures for sustainable hydrocarbons formation.
..:
Anode:
Graphite
Rod
Cathode:
Titanium
Metal Rod
Ceramic
Tube
Furnace
Molten Salt
Electrolysis
CO32-
CO32- CO3
2
-
O2-
O 2-
O 2-
O2-
OH-
OH-
OH-
OH-
CH4
O2
CO
H2
C 2
C 4
C 3
.
H 2O CO 2
e-e-
e-e-
Hydrocarbon Fuel
Production
At Cathode
At Anode
Reactions at
Electrodes
CO32-
Related Documents