applied sciences Article Performance of Filter Bags Used in Industrial Pulse-Jet Baghouses in Wood-Based Panels Furniture Factory Czeslaw Dembi ´ nski 1 , Zbigniew Potok 1 , Stanislaw Dolny 1 , Richard Kminiak 2 and Tomasz Rogozi´ nski 1, * Citation: Dembi ´ nski, C.; Potok, Z.; Dolny, S.; Kminiak, R.; Rogozi´ nski, T. Performance of Filter Bags Used in Industrial Pulse-Jet Baghouses in Wood-Based Panels Furniture Factory. Appl. Sci. 2021, 11, 8965. https:// doi.org/10.3390/app11198965 Academic Editors: Stefano Invernizzi, Réh Roman, L’uboš Krišt’ák and Petar Antov Received: 2 September 2021 Accepted: 22 September 2021 Published: 26 September 2021 Publisher’s Note: MDPI stays neutral with regard to jurisdictional claims in published maps and institutional affil- iations. Copyright: © 2021 by the authors. Licensee MDPI, Basel, Switzerland. This article is an open access article distributed under the terms and conditions of the Creative Commons Attribution (CC BY) license (https:// creativecommons.org/licenses/by/ 4.0/). 1 Department of Furniture Design, Faculty of Wood Technology, Pozna´ n University of Life Sciences, 60-637 Pozna ´ n, Poland; [email protected] (C.D.); [email protected] (Z.P.); [email protected] (S.D.) 2 Department of Woodworking, Faculty of Wood Sciences and Technology, Technical University in Zvolen, 96001 Zvolen, Slovakia; [email protected] * Correspondence: [email protected]; Tel.: +48-61-848-7483 Abstract: The study specifies the value of the dust resistance coefficient in the process of wood dust filtration in a pilot-scale test stand. The experiments were carried out for one type of filter material— polyester with a PP film previously used in different production lines. Filter bags from the filtering installation of the processing line for narrow surfaces of furniture panels of the honeycomb structure with a chipboard frame, HDF, natural veneer cladding, and a line of CNC drilling machines, were taken into account. Before the pilot-scale tests, the bags had been in use in industrial installations from zero to nine months. All tests were performed under identical filtration conditions. The values of the dust resistance coefficient depend on the operating time and the conditions in which filtration is carried out in an industrial plant, and increased from 6507 s -1 to 10,208 s -1 for the bags from the filter of the narrow surfaces processing line and to 29,729 s -1 for the bags from the filter of the drilling line. The most important factor influencing the properties of the filter bag in the process of wood dust filtration in an industrial filter is the cleaning pulses frequency. Keywords: wood dust; pilot-scale filter; dust resistance; filtration time 1. Introduction Wood dust dispersed in the air at processing stations causes deterioration of working conditions in the wood industry. Occupational exposure to hardwood and mixed wood dust can cause cancers of the nasal cavity, paranasal sinuses, and nasopharynx as well as various human health problems, including skin, nose, and eye irritation, asthma, and allergic reactions [1–5]. This is because wood dust has been recognized as a carcinogenic substance and, therefore, a limit of the permissible dust concentration of air has been set. Wood dust has been classified as carcinogenic to humans (Group 1) by the International Agency for Research on Cancer (IARC) [6]. According to European requirements, the limit is currently 3 mg·m -3 or 2 mg·m -3 (oak and beech), and from 19 January 2023, this limit will be tightened to 2 mg·m -3 [7]. Therefore, filtering dust collectors operating in filtering installations in wood plants must be characterized by separation efficiency ensuring air purity required in the recirculation cycle. For these reasons, it is necessary to carefully select and control the operating conditions of filter dust collectors for wood dust, so that the required separation efficiency does not cause excessive air flow resistance [8–15]. Each increase in the air flow resistance is associated with an increase in energy consumption to overcome this resistance, which generates additional operating costs [16]. The air flow resistance through a filter is reflected by the total pressure drop Δp c which consists of the pressure drop Δp 0 across the clean filter fabric, and the pressure drop Δp p across the dust cake formed on this material [17–19]. They can be calculated from Formula (1). Δp c = Δp 0 + Δp p , (1) Appl. Sci. 2021, 11, 8965. https://doi.org/10.3390/app11198965 https://www.mdpi.com/journal/applsci

Welcome message from author
This document is posted to help you gain knowledge. Please leave a comment to let me know what you think about it! Share it to your friends and learn new things together.
Transcript
applied sciences
Article
Performance of Filter Bags Used in Industrial Pulse-JetBaghouses in Wood-Based Panels Furniture Factory
Czesław Dembinski 1, Zbigniew Potok 1 , Stanisław Dolny 1, Richard Kminiak 2 and Tomasz Rogozinski 1,*
�����������������
Citation: Dembinski, C.; Potok, Z.;
Dolny, S.; Kminiak, R.; Rogozinski, T.
Performance of Filter Bags Used in
Industrial Pulse-Jet Baghouses in
Wood-Based Panels Furniture Factory.
Appl. Sci. 2021, 11, 8965. https://
doi.org/10.3390/app11198965
Academic Editors: Stefano Invernizzi,
Réh Roman, L’uboš Krišt’ák and
Petar Antov
Received: 2 September 2021
Accepted: 22 September 2021
Published: 26 September 2021
Publisher’s Note: MDPI stays neutral
with regard to jurisdictional claims in
published maps and institutional affil-
iations.
Copyright: © 2021 by the authors.
Licensee MDPI, Basel, Switzerland.
This article is an open access article
distributed under the terms and
conditions of the Creative Commons
Attribution (CC BY) license (https://
creativecommons.org/licenses/by/
4.0/).
1 Department of Furniture Design, Faculty of Wood Technology, Poznan University of Life Sciences,60-637 Poznan, Poland; [email protected] (C.D.); [email protected] (Z.P.);[email protected] (S.D.)
2 Department of Woodworking, Faculty of Wood Sciences and Technology, Technical University in Zvolen,96001 Zvolen, Slovakia; [email protected]
* Correspondence: [email protected]; Tel.: +48-61-848-7483
Abstract: The study specifies the value of the dust resistance coefficient in the process of wood dustfiltration in a pilot-scale test stand. The experiments were carried out for one type of filter material—polyester with a PP film previously used in different production lines. Filter bags from the filteringinstallation of the processing line for narrow surfaces of furniture panels of the honeycomb structurewith a chipboard frame, HDF, natural veneer cladding, and a line of CNC drilling machines, weretaken into account. Before the pilot-scale tests, the bags had been in use in industrial installationsfrom zero to nine months. All tests were performed under identical filtration conditions. The valuesof the dust resistance coefficient depend on the operating time and the conditions in which filtrationis carried out in an industrial plant, and increased from 6507 s−1 to 10,208 s−1 for the bags fromthe filter of the narrow surfaces processing line and to 29,729 s−1 for the bags from the filter of thedrilling line. The most important factor influencing the properties of the filter bag in the process ofwood dust filtration in an industrial filter is the cleaning pulses frequency.
Keywords: wood dust; pilot-scale filter; dust resistance; filtration time
1. Introduction
Wood dust dispersed in the air at processing stations causes deterioration of workingconditions in the wood industry. Occupational exposure to hardwood and mixed wooddust can cause cancers of the nasal cavity, paranasal sinuses, and nasopharynx as wellas various human health problems, including skin, nose, and eye irritation, asthma, andallergic reactions [1–5]. This is because wood dust has been recognized as a carcinogenicsubstance and, therefore, a limit of the permissible dust concentration of air has been set.Wood dust has been classified as carcinogenic to humans (Group 1) by the InternationalAgency for Research on Cancer (IARC) [6]. According to European requirements, the limitis currently 3 mg·m−3 or 2 mg·m−3 (oak and beech), and from 19 January 2023, this limitwill be tightened to 2 mg·m−3 [7]. Therefore, filtering dust collectors operating in filteringinstallations in wood plants must be characterized by separation efficiency ensuring airpurity required in the recirculation cycle. For these reasons, it is necessary to carefullyselect and control the operating conditions of filter dust collectors for wood dust, so thatthe required separation efficiency does not cause excessive air flow resistance [8–15]. Eachincrease in the air flow resistance is associated with an increase in energy consumption toovercome this resistance, which generates additional operating costs [16].
The air flow resistance through a filter is reflected by the total pressure drop ∆pcwhich consists of the pressure drop ∆p0 across the clean filter fabric, and the pressure drop∆pp across the dust cake formed on this material [17–19]. They can be calculated fromFormula (1).
∆pc = ∆p0 + ∆pp, (1)
Appl. Sci. 2021, 11, 8965. https://doi.org/10.3390/app11198965 https://www.mdpi.com/journal/applsci
Appl. Sci. 2021, 11, 8965 2 of 15
The pressure drop across the clean filter fabric is calculated by multiplying the filtrationvelocity wf by the K0 coefficient defined as the clean fabric resistance coefficient accordingto Formula (2).
∆p0 = K0wf, (2)
During dust filtration, dust is deposited on the surface of the filter medium in a dustcake, causing an increase in air flow resistance. The value of the pressure drop across thedust cake depends on many factors, such as, for example, the volume of air flowing intothe filter, the amount and type of dust, or the pulse-jet cleaning parameters that determinethe thickness of the dust cake. Thus, the pressure drop across the dust cake accumulated onthe filtering surface depends on the filtration speed wf, the dust load of the filter mediumsurface, and the dust resistance coefficient in accordance with Formula (3):
∆pp = wfsK2, (3)
where: wf—filtration velocity, s—dust deposit areal density, K2—dust cake resistance coefficient.Coefficient K2 reflecting individual properties of the dust cake on the surface of the
filter medium can only be determined experimentally. The research conducted so farhas usually concerned a short-term process of air filtration in laboratory conditions, inwhich a clean filter fabric or artificially aged media were used, often in small-scale researchequipment and the samples of filter media used [20–22]. Given the growing problemof polluted air, there is a growing need not only to design and improve dust separationtechnology, but also to extend the research to include methods that refer to the actualsources of pollution. This generates the need to use research material used in the realconditions of the wood industry.
So far, ceramic dust [23], limestone [24–26], fly ash [21,22,25], and coal dust [27–29]have been subjects of the study of filtration processes, or wood test dusts [30,31] whichare finer and more uniform in size and shape compared to wood dust produced underreal production conditions in woodworking factories. For this reason, the results of thesestudies are not sufficient to fully understand the phenomena occurring during the filtrationof wood dust from the wood industry and cannot be related to the filtration of this dust.Bearing in mind the above, there was a need to use wood dust generated as processingwaste in wood factories as a research material in the study of filtration processes. It isespecially important to take into account the influence of a dust cake made of such duston the filter medium in order to evaluate the effects of long-term filtration in industrialconditions. The assessment of the course of the filtration process and changes in the prop-erties of the filter medium operating in industrial conditions for a long period of wooddust separation should be confirmed by the objectivity of laboratory tests results. Filterbags operating in industrial conditions, in contrast to laboratory-aged bags, are exposedduring operation to the impact of industrial waste dust with a diversified dimensionalstructure and, depending on the conditions of their formation, also differing in terms ofparticle shape. An additional difference between the laboratory and industrial aging ofthe filter medium is its operation in changing climatic conditions over a longer periodof time, taking into account temperature changes and humidity of the filtered air. Thebags used in previous studies were conditioned in strictly defined laboratory conditionswith the use of specialized chambers in which the filter material was subjected, depend-ing on the test method, from 2500 up to 10,000 filtration cycles under constant climaticconditions [21,32–34].
Therefore, to compare the influence of various operating conditions of filter bags infilter baghouses for wood dust on their operational properties, we use a reference dust thatwould not differ from industrial dusts. In order to compare the dust resistance coefficientduring the filtration processes, it was decided to carry out an experiment with use of thefilter bags obtained after long-term operation from two different filtering installationsoperating in one furniture factory.
Appl. Sci. 2021, 11, 8965 3 of 15
2. Materials and Methods2.1. General Assumption
The filter bags were installed in two filter baghouses operating in two different filteringinstallations in one furniture factory. The dust cake resistance coefficient K2 was determinedon the basis of testing the air flow resistance through the filter medium in a process carriedout on the pilot-scale. One type of wood dust was used in the flow resistance tests.
2.2. Place and Conditions of Conditioned of Filter Materials
The IKEA Industry factory in Lubawa (Poland) with a very large production scalewas selected for the tests. The factory produces furniture worth approximately EUR220 million annually. It is characterized by a high degree of automation and very moderntechnology of manufacturing furniture panels in the honeycomb structure. Due to the scaleof production, the plant has several filtering installations, each for a different productionline. It created very good conditions for the analysis of the influence of various types ofdust on the properties of filter fabric during its operation. In order to obtain specimens inthe form of filter bags, sets of bags of the same type were installed in two filter baghousesof two filtering installations:
• In the processing line for the processing of narrow surfaces of furniture panels;• In the processing line of CNC drilling machines.
Each installation is connected to an individual filter baghouse (Tables 1 and 2). Theinstallations use filter baghouses of the SBF-140-5.0S-1A type (for narrow planes processinglines) (Filter 1) and SBF-160-5.0S-1A (for processing centers lines) (Filter 2) by JKF (Berzyna,Poland). The filter baghouses were equipped with bags supplied by the same manufacturer,Gutsche (Fulda, Germany) (Table 3). The use of one type of filter bags ensured the resultsof air flow resistance formed only by different filtration conditions and types of dust foreach installation. The simultaneous assembly of the filter bags in both installations allowedfor the elimination of various weather conditions for the results obtained. The filter bagswere installed in both of the filter baghouses on the same day and at equal, approximatelytwo-month, intervals and they were disassembled on the same day for both installations.The working time of the bags in the filters was 67, 133 and 272 days. A new bag (0 workingdays) was also used for the tests.
Table 1. Basic technical parameters of filtration installations.
Parameter Unit
Parameter Value
Dust Extraction Installation in theProcessing Line of Narrow Surfaces
Dust Extraction Installation in theLine of Drilling Centers
Factory installation identification Main pipeline Auxiliary pipeline Main pipeline Auxiliary pipelineFactory labeling of the filter Filter No. 1—SBF-140-5.0S-1A Filter No. 2—SBF-160-5.0S-1A
Pipeline length m 144.3 34.4 120 99Air velocity in the pipeline m·s−1 24 2.5 26 24
Air demand m3·h−1 55,450 26,600 33,250Fan type JK-90 MT (1 pcs)
Fan efficiency m3·h−1 60,000
2.2.1. Production LinesA Line for Processing Narrow Surfaces of Furniture Panels
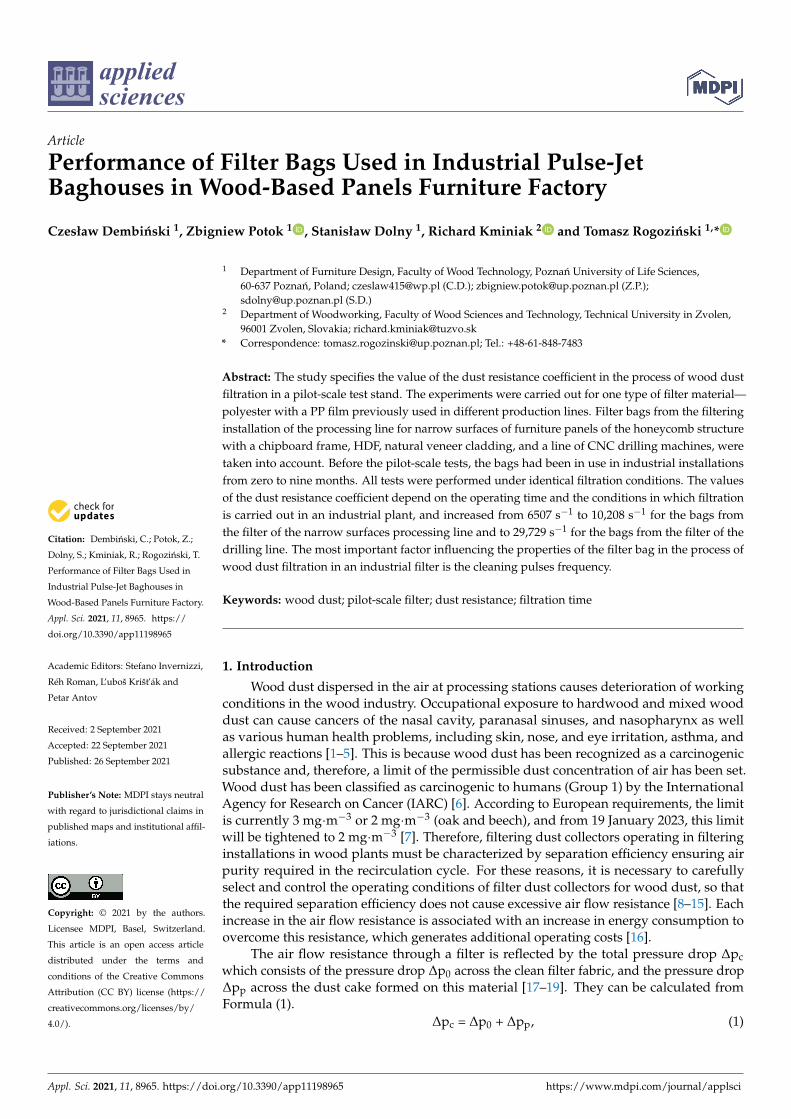
The processing of narrow surfaces is used for formatting and veneering furniturepanels with rectilinear shapes. The processing takes place on two lines (main and auxiliary),where the machines performing processing operations related to the formation of fine dustwaste are connected to one filtering installation. Chipboard, fibreboard and solid wood areprocessed on the main line.
The diagram of the line with the dust extraction pipeline is shown in Figure 1.
Appl. Sci. 2021, 11, 8965 4 of 15
Table 2. Basic technical parameters of the filter baghouses.
Parameter Unit
Parameter Value
Filter No.1—SBF-140-5,0S-1A
Filter No.2—SBF-160-5,0S-1A
Number of bags pcs 140 162Bag length m 4.68
Bag diameter m 0.15The area of the working surface of the bag m2 2.205
Total working surface area of the bags in the filter m2 313.166 357.274Air demand in the installation m3·h−1 55,450 59,850
Filtration velocity cm·s−1 4.918 4.653The amount of waste generated during processing (wood dust) kg·h−1 250 100
Average particle size µm 140.88 168.64Dust load g·m−3 4.509 1.671
The interval between the regeneration pulses for one bag s 606 690The number of changes in the work of the bag during the day changes 3 3
Estimated number of regenerative impulses per day pcs 143 125
Table 3. Basic technical properties of the filter bags according to the manufacturer.
Parameter Unit Parameter Value
Bag producer GutsheFabric type Polyester with PP film
Material weight g·m−2 400Material thickness mm 1.5
Tensile strength—lengthwise daN·5cm 40Tensile strength—across daN·5cm 50
Air permeability dm3·min·dm−2 250
Surface finishing Thermal stabilization,calendering
High temperature resistance ◦C 90Acid resistance Good
Alkali resistance SufficientWater resistant Weak
Declared filtration efficiency forparticles >2.5 µm % 99.998
Declared filtration efficiency forparticles <2.5 µm % 99.957
The stages of processing panels on the main narrow surface processing line are as follows:
1. Longitudinal cutting of the block—a four-element block is cut into two two-elementones, cutting with the use of the FL module (longitudinal saw). Feed 35 m·min−1;
2. Formatting from the width—cutting with a circular saw with the simultaneous align-ment of longitudinal, narrow surfaces and veneering. Feed 35 m·min−1;
3. Formatting panels from length and processing short, narrow surfaces. Alignment andveneer. Feed 15 m·min−1;
4. Multi-spindle through-feed drilling machines—drilling holes in wide surfaces of panels;5. Longitudinal cut—a two-piece block is cut into two ready-made panels. Cutting with
a rip saw. Feed 35 m·min−1.
Narrow panels of furniture joints are processed in an auxiliary, one-sided narrowsurface processing line. This line is used for processing narrow panels for which thedouble-sided line is not suitable due to design constraints.
The technological process of furniture panels on this line is as follows:
1. Manual loading of panels.2. Processing the first narrow longitudinal surface and veneering. Feed 20 m·min−1.
Appl. Sci. 2021, 11, 8965 5 of 15
3. Gravity turntable of panels—rotation of the element by 90◦ around the longitudinal axis.4. Processing the second narrow longitudinal surface and veneering. Feed 20 m·min−1.5. Manual unloading and arranging panels.
Appl. Sci. 2021, 11, x FOR PEER REVIEW 4 of 16
Figure 1. Scheme of the narrow surface treatment line.
The stages of processing panels on the main narrow surface processing line are as
follows:
1. Longitudinal cutting of the block—a four-element block is cut into two two-element
ones, cutting with the use of the FL module (longitudinal saw). Feed 35 m·min−1;
2. Formatting from the width—cutting with a circular saw with the simultaneous
alignment of longitudinal, narrow surfaces and veneering. Feed 35 m·min−1;
3. Formatting panels from length and processing short, narrow surfaces. Alignment
and veneer. Feed 15 m·min−1;
4. Multi-spindle through-feed drilling machines—drilling holes in wide surfaces of
panels;
5. Longitudinal cut—a two-piece block is cut into two ready-made panels. Cutting
with a rip saw. Feed 35 m·min−1.
Narrow panels of furniture joints are processed in an auxiliary, one-sided narrow
surface processing line. This line is used for processing narrow panels for which the
double-sided line is not suitable due to design constraints.
The technological process of furniture panels on this line is as follows:
1. Manual loading of panels.
2. Processing the first narrow longitudinal surface and veneering. Feed 20 m·min−1.
3. Gravity turntable of panels—rotation of the element by 90° around the longitudinal
axis.
4. Processing the second narrow longitudinal surface and veneering. Feed 20 m·min−1.
5. Manual unloading and arranging panels.
The dust extraction pipeline operating in the narrow surface processing line is con-
nected to filter no. 1. The estimated amount of generated dust is up to 250 kg·h−1. The line
of CNC drilling machines is serviced by a dust extraction pipeline connected to filter no.
2. The estimated amount of waste generated in this line is about 100 kg·h−1. The charac-
teristics of both extraction systems and filter baghouses are presented in Tables 1 and 2.
CNC Drilling Machines Line
Some types of furniture panel are processed on the line of CNC drilling machines.
This is a group of five identical Homag machining and drilling centers with a gantry
structure with numerically controlled spindles used mainly as drilling machines for
structural holes in the furniture panels. The spindles can also cut curvilinear shapes in
furniture panels using cutters. In addition, these machine tools are adapted to veneering
narrow surfaces. The line of drilling centers produces dust in the amount of about 100
kg·h−1.
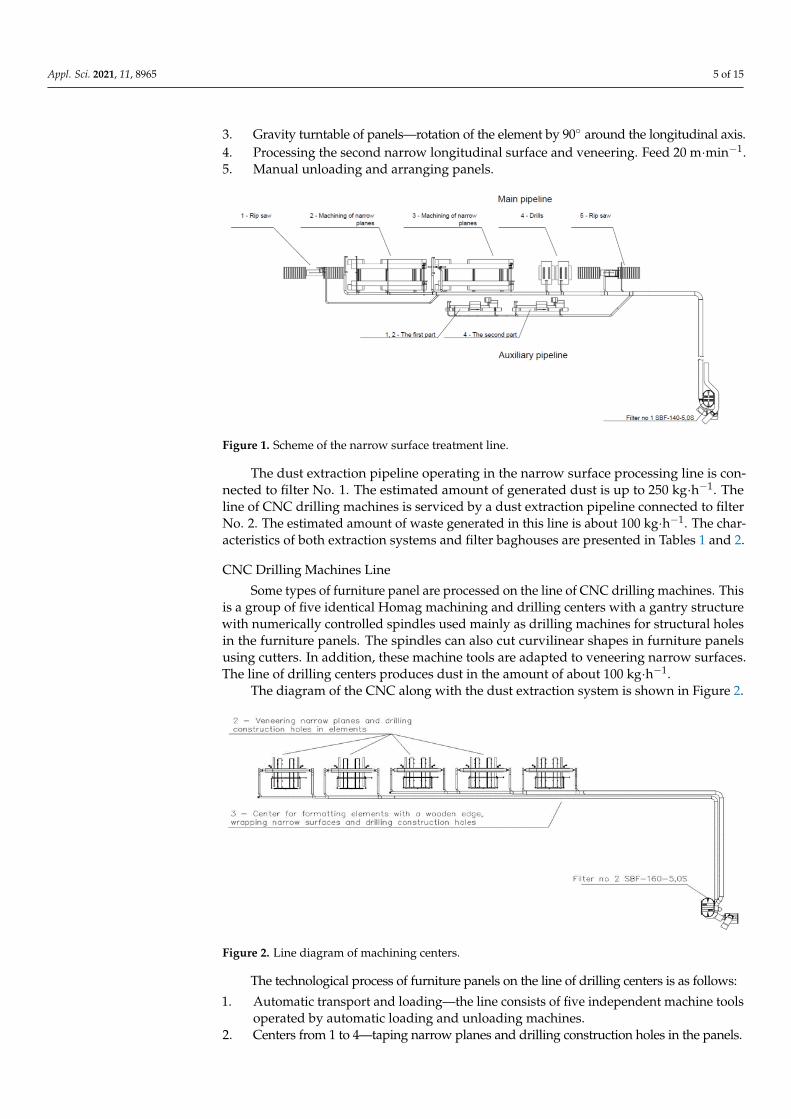
Figure 1. Scheme of the narrow surface treatment line.
The dust extraction pipeline operating in the narrow surface processing line is con-nected to filter No. 1. The estimated amount of generated dust is up to 250 kg·h−1. Theline of CNC drilling machines is serviced by a dust extraction pipeline connected to filterNo. 2. The estimated amount of waste generated in this line is about 100 kg·h−1. The char-acteristics of both extraction systems and filter baghouses are presented in Tables 1 and 2.
CNC Drilling Machines Line
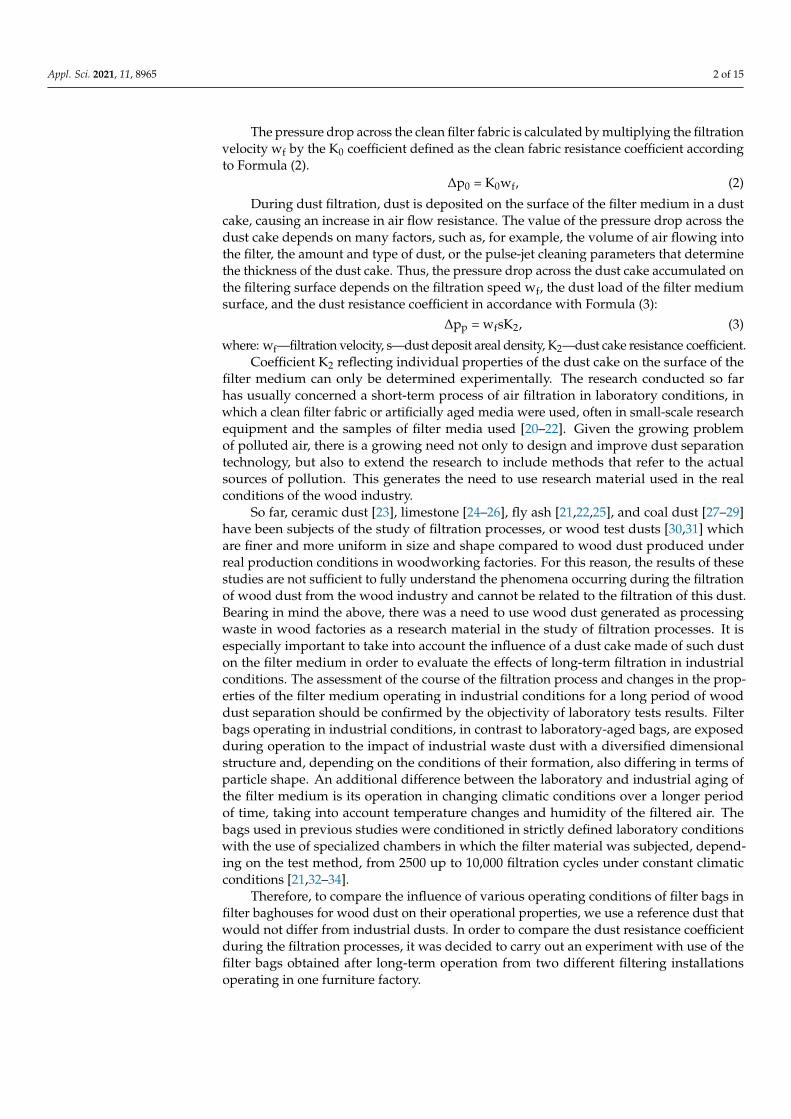
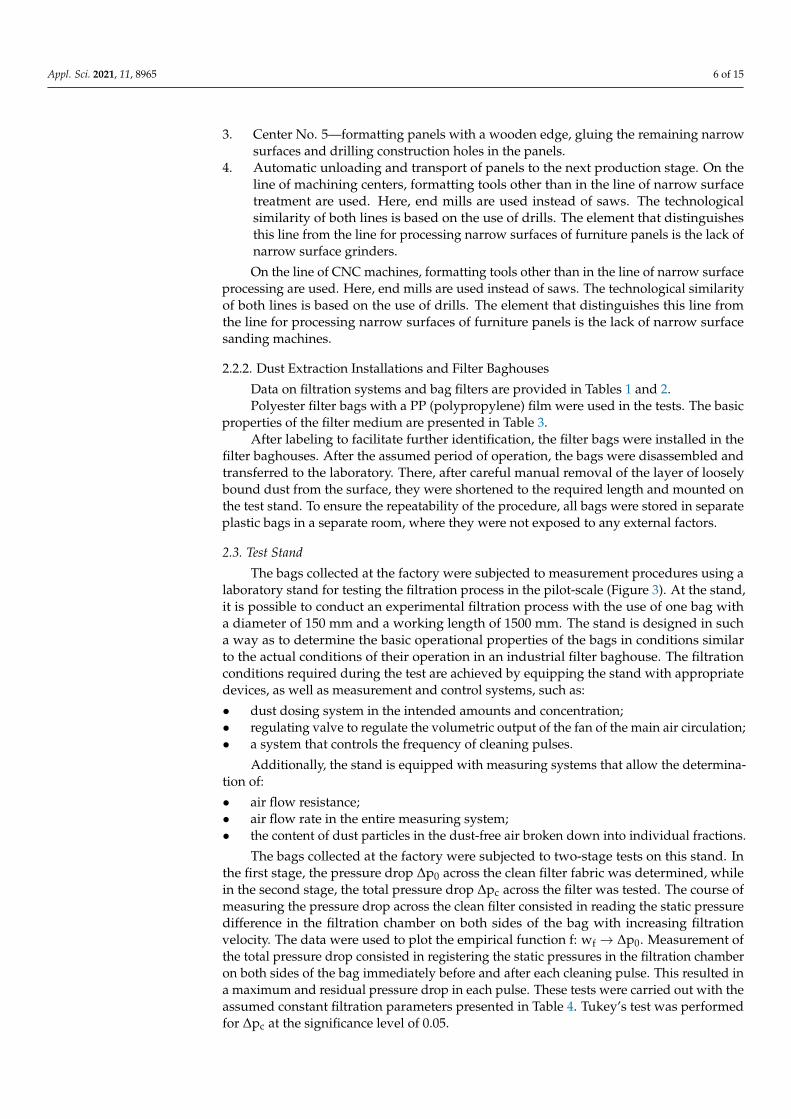
Some types of furniture panel are processed on the line of CNC drilling machines. Thisis a group of five identical Homag machining and drilling centers with a gantry structurewith numerically controlled spindles used mainly as drilling machines for structural holesin the furniture panels. The spindles can also cut curvilinear shapes in furniture panelsusing cutters. In addition, these machine tools are adapted to veneering narrow surfaces.The line of drilling centers produces dust in the amount of about 100 kg·h−1.
The diagram of the CNC along with the dust extraction system is shown in Figure 2.
Appl. Sci. 2021, 11, x FOR PEER REVIEW 5 of 16
The diagram of the CNC along with the dust extraction system is shown in Figure 2.
Figure 2. Line diagram of machining centers.
The technological process of furniture panels on the line of drilling centers is as fol-
lows:
1. Automatic transport and loading—the line consists of five independent machine
tools operated by automatic loading and unloading machines.
2. Centers from 1 to 4—taping narrow planes and drilling construction holes in the
panels.
3. Center No. 5—formatting panels with a wooden edge, gluing the remaining narrow
surfaces and drilling construction holes in the panels.
4. Automatic unloading and transport of panels to the next production stage. On the
line of machining centers, formatting tools other than in the line of narrow surface
treatment are used. Here, end mills are used instead of saws. The technological
similarity of both lines is based on the use of drills. The element that distinguishes
this line from the line for processing narrow surfaces of furniture panels is the lack
of narrow surface grinders.
On the line of CNC machines, formatting tools other than in the line of narrow sur-
face processing are used. Here, end mills are used instead of saws. The technological
similarity of both lines is based on the use of drills. The element that distinguishes this
line from the line for processing narrow surfaces of furniture panels is the lack of narrow
surface sanding machines.
2.2.2. Dust Extraction Installations and Filter Baghouses
Data on filtration systems and bag filters are provided in Tables 1 and 2.
Table 1. Basic technical parameters of filtration installations.
Parameter Unit
Parameter Value
Dust Extraction Installation in the Pro-
cessing Line of Narrow Surfaces
Dust Extraction Installation in the
Line of Drilling Centers
Factory installation identification Main pipeline Auxiliary pipeline Main pipeline Auxiliary pipeline
Factory labeling of the filter Filter no. 1—SBF-140-5.0S-1A Filter no. 2—SBF-160-5.0S-1A
Pipeline length m 144.3 34.4 120 99
Air velocity in the pipeline m·s−1 24 2.5 26 24
Air demand m3·h−1 55,450 26,600 33,250
Fan type JK-90 MT (1 pcs)
Fan efficiency m3·h−1 60,000
Figure 2. Line diagram of machining centers.
The technological process of furniture panels on the line of drilling centers is as follows:
1. Automatic transport and loading—the line consists of five independent machine toolsoperated by automatic loading and unloading machines.
2. Centers from 1 to 4—taping narrow planes and drilling construction holes in the panels.
Appl. Sci. 2021, 11, 8965 6 of 15
3. Center No. 5—formatting panels with a wooden edge, gluing the remaining narrowsurfaces and drilling construction holes in the panels.
4. Automatic unloading and transport of panels to the next production stage. On theline of machining centers, formatting tools other than in the line of narrow surfacetreatment are used. Here, end mills are used instead of saws. The technologicalsimilarity of both lines is based on the use of drills. The element that distinguishesthis line from the line for processing narrow surfaces of furniture panels is the lack ofnarrow surface grinders.
On the line of CNC machines, formatting tools other than in the line of narrow surfaceprocessing are used. Here, end mills are used instead of saws. The technological similarityof both lines is based on the use of drills. The element that distinguishes this line fromthe line for processing narrow surfaces of furniture panels is the lack of narrow surfacesanding machines.
2.2.2. Dust Extraction Installations and Filter Baghouses
Data on filtration systems and bag filters are provided in Tables 1 and 2.Polyester filter bags with a PP (polypropylene) film were used in the tests. The basic
properties of the filter medium are presented in Table 3.After labeling to facilitate further identification, the filter bags were installed in the
filter baghouses. After the assumed period of operation, the bags were disassembled andtransferred to the laboratory. There, after careful manual removal of the layer of looselybound dust from the surface, they were shortened to the required length and mounted onthe test stand. To ensure the repeatability of the procedure, all bags were stored in separateplastic bags in a separate room, where they were not exposed to any external factors.
2.3. Test Stand
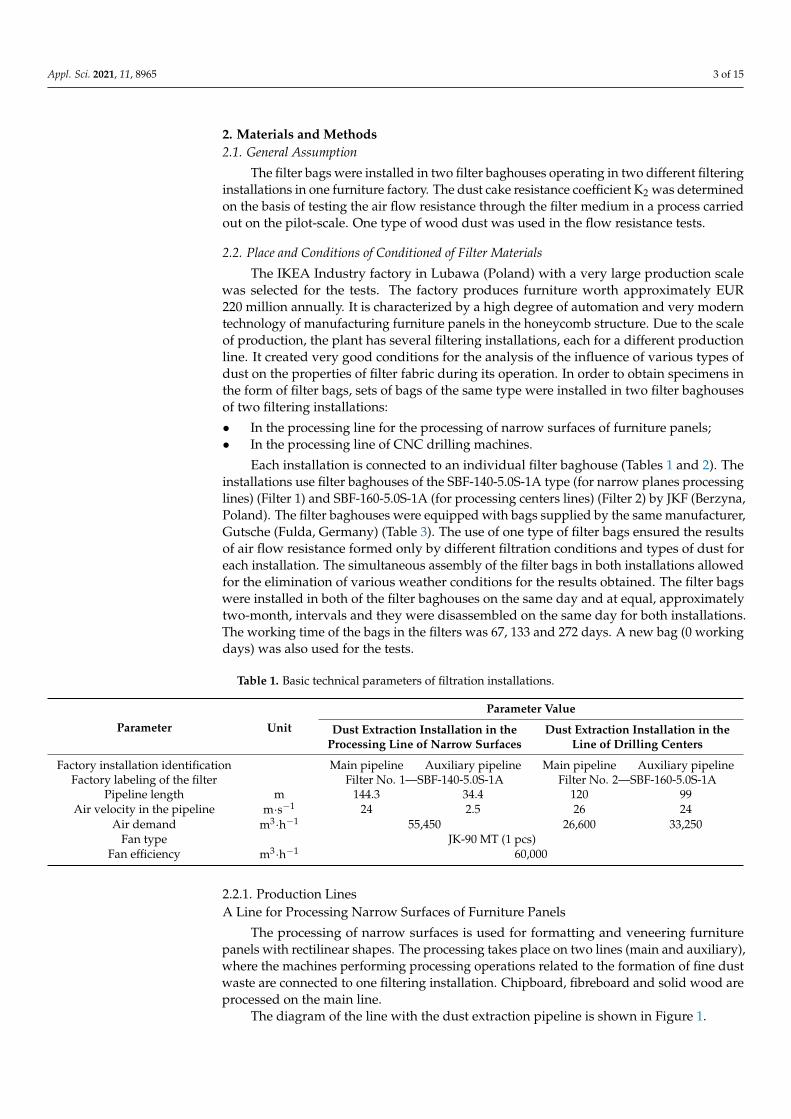
The bags collected at the factory were subjected to measurement procedures using alaboratory stand for testing the filtration process in the pilot-scale (Figure 3). At the stand,it is possible to conduct an experimental filtration process with the use of one bag witha diameter of 150 mm and a working length of 1500 mm. The stand is designed in sucha way as to determine the basic operational properties of the bags in conditions similarto the actual conditions of their operation in an industrial filter baghouse. The filtrationconditions required during the test are achieved by equipping the stand with appropriatedevices, as well as measurement and control systems, such as:
• dust dosing system in the intended amounts and concentration;• regulating valve to regulate the volumetric output of the fan of the main air circulation;• a system that controls the frequency of cleaning pulses.
Additionally, the stand is equipped with measuring systems that allow the determina-tion of:
• air flow resistance;• air flow rate in the entire measuring system;• the content of dust particles in the dust-free air broken down into individual fractions.
The bags collected at the factory were subjected to two-stage tests on this stand. Inthe first stage, the pressure drop ∆p0 across the clean filter fabric was determined, whilein the second stage, the total pressure drop ∆pc across the filter was tested. The course ofmeasuring the pressure drop across the clean filter consisted in reading the static pressuredifference in the filtration chamber on both sides of the bag with increasing filtrationvelocity. The data were used to plot the empirical function f: wf → ∆p0. Measurement ofthe total pressure drop consisted in registering the static pressures in the filtration chamberon both sides of the bag immediately before and after each cleaning pulse. This resulted ina maximum and residual pressure drop in each pulse. These tests were carried out with theassumed constant filtration parameters presented in Table 4. Tukey’s test was performedfor ∆pc at the significance level of 0.05.
Appl. Sci. 2021, 11, 8965 7 of 15
Appl. Sci. 2021, 11, x FOR PEER REVIEW 7 of 16
the test stand. To ensure the repeatability of the procedure, all bags were stored in sepa-
rate plastic bags in a separate room, where they were not exposed to any external factors.
2.3. Test Stand
The bags collected at the factory were subjected to measurement procedures using a
laboratory stand for testing the filtration process in the pilot-scale (Figure 3.). At the
stand, it is possible to conduct an experimental filtration process with the use of one bag
with a diameter of 150 mm and a working length of 1500 mm. The stand is designed in
such a way as to determine the basic operational properties of the bags in conditions
similar to the actual conditions of their operation in an industrial filter baghouse. The
filtration conditions required during the test are achieved by equipping the stand with
appropriate devices, as well as measurement and control systems, such as:
dust dosing system in the intended amounts and concentration;
regulating valve to regulate the volumetric output of the fan of the main air circula-
tion;
a system that controls the frequency of cleaning pulses.
Additionally, the stand is equipped with measuring systems that allow the deter-
mination of:
air flow resistance;
air flow rate in the entire measuring system;
the content of dust particles in the dust-free air broken down into individual frac-
tions.
The bags collected at the factory were subjected to two-stage tests on this stand. In
the first stage, the pressure drop Δp0 across the clean filter fabric was determined, while
in the second stage, the total pressure drop Δpc across the filter was tested. The course of
measuring the pressure drop across the clean filter consisted in reading the static pres-
sure difference in the filtration chamber on both sides of the bag with increasing filtration
velocity. The data were used to plot the empirical function f: wf → Δp0. Measurement of
the total pressure drop consisted in registering the static pressures in the filtration
chamber on both sides of the bag immediately before and after each cleaning pulse. This
resulted in a maximum and residual pressure drop in each pulse. These tests were carried
out with the assumed constant filtration parameters presented in Table 4. Tukey’s test
was performed for Δpc at the significance level of 0.05.
Figure 3. Test rig set-up; 1—filtration chamber, 2—filter bag, 3—supporting cage, 4—Venturi tube,
5—dust feeder, 6—dust inlet tube, 7—clean air chamber, 8—tube with cleaning nozzle,
9—compressed air tank, 10—cleaning control device, 11—outlet tube, 12—Prandtl tube,
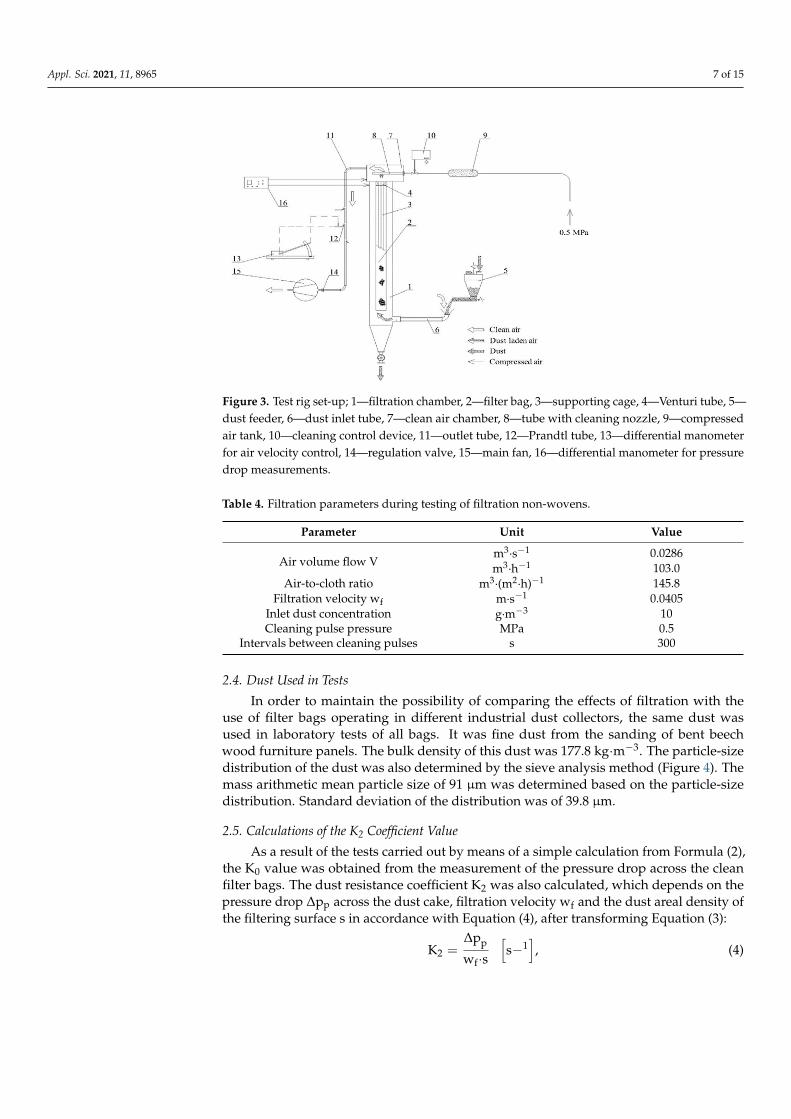
Figure 3. Test rig set-up; 1—filtration chamber, 2—filter bag, 3—supporting cage, 4—Venturi tube, 5—dust feeder, 6—dust inlet tube, 7—clean air chamber, 8—tube with cleaning nozzle, 9—compressedair tank, 10—cleaning control device, 11—outlet tube, 12—Prandtl tube, 13—differential manometerfor air velocity control, 14—regulation valve, 15—main fan, 16—differential manometer for pressuredrop measurements.
Table 4. Filtration parameters during testing of filtration non-wovens.
Parameter Unit Value
Air volume flow Vm3·s−1 0.0286m3·h−1 103.0
Air-to-cloth ratio m3·(m2·h)−1 145.8Filtration velocity wf m·s−1 0.0405
Inlet dust concentration g·m−3 10Cleaning pulse pressure MPa 0.5
Intervals between cleaning pulses s 300
2.4. Dust Used in Tests
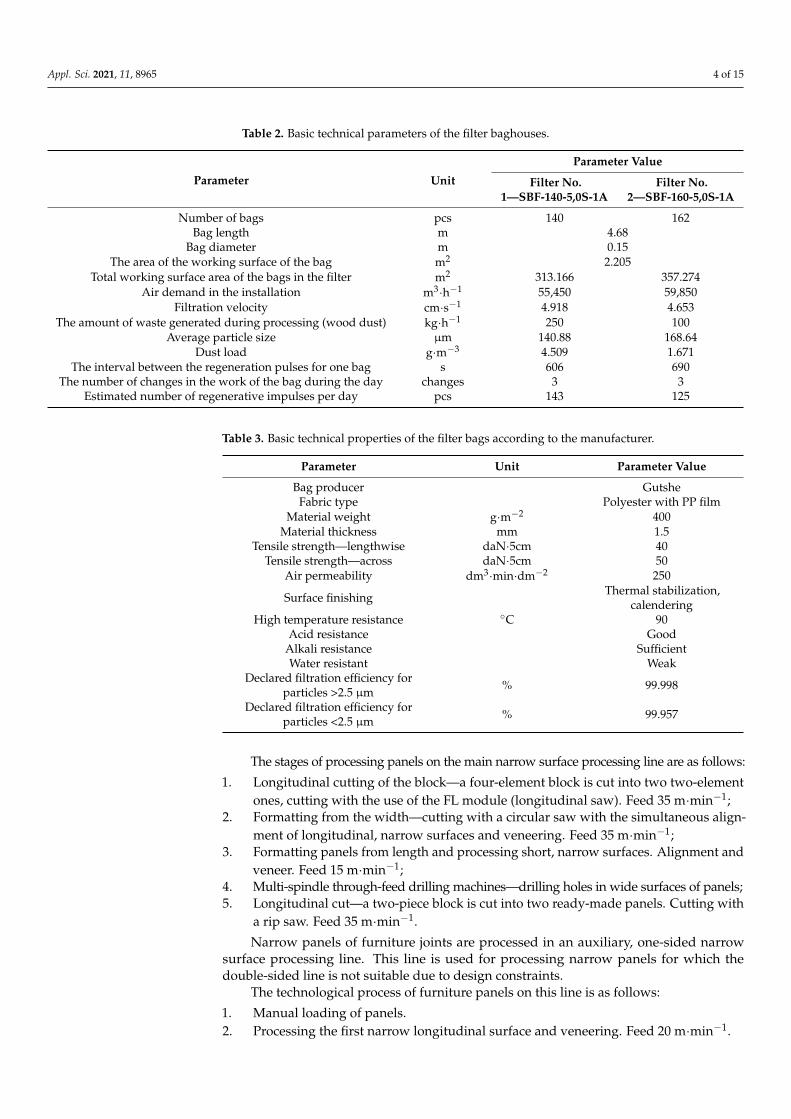
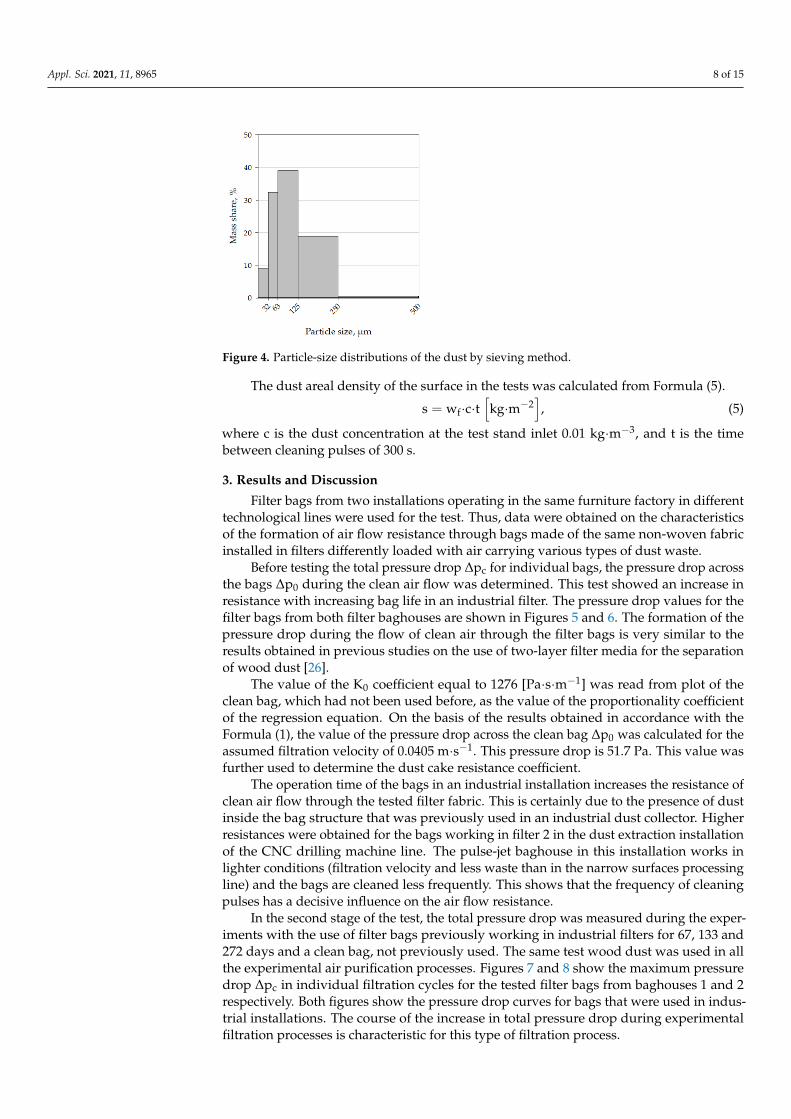
In order to maintain the possibility of comparing the effects of filtration with theuse of filter bags operating in different industrial dust collectors, the same dust wasused in laboratory tests of all bags. It was fine dust from the sanding of bent beechwood furniture panels. The bulk density of this dust was 177.8 kg·m−3. The particle-sizedistribution of the dust was also determined by the sieve analysis method (Figure 4). Themass arithmetic mean particle size of 91 µm was determined based on the particle-sizedistribution. Standard deviation of the distribution was of 39.8 µm.
2.5. Calculations of the K2 Coefficient Value
As a result of the tests carried out by means of a simple calculation from Formula (2),the K0 value was obtained from the measurement of the pressure drop across the cleanfilter bags. The dust resistance coefficient K2 was also calculated, which depends on thepressure drop ∆pp across the dust cake, filtration velocity wf and the dust areal density ofthe filtering surface s in accordance with Equation (4), after transforming Equation (3):
K2 =∆pp
wf·s
[s−1
], (4)
Appl. Sci. 2021, 11, 8965 8 of 15
Appl. Sci. 2021, 11, x FOR PEER REVIEW 8 of 16
13—differential manometer for air velocity control, 14—regulation valve, 15—main fan,
16—differential manometer for pressure drop measurements.
Table 4. Filtration parameters during testing of filtration non-wovens.
Parameter Unit Value
Air volume flow V m3.s−1 0.0286
m3.h−1 103.0
Air-to-cloth ratio m3.(m2.h)−1 145.8
Filtration velocity wf m.s−1 0.0405
Inlet dust concentration g.m−3 10
Cleaning pulse pressure MPa 0.5
Intervals between cleaning pulses s 300
2.4. Dust Used in Tests
In order to maintain the possibility of comparing the effects of filtration with the use
of filter bags operating in different industrial dust collectors, the same dust was used in
laboratory tests of all bags. It was fine dust from the sanding of bent beech wood furni-
ture panels. The bulk density of this dust was 177.8 kg·m−3. The particle-size distribution
of the dust was also determined by the sieve analysis method (Figure 4.). The mass
arithmetic mean particle size of 91 μm was determined based on the particle-size distri-
bution. Standard deviation of the distribution was of 39.8 μm.
Figure 4. Particle-size distributions of the dust by sieving method.
2.5. Calculations of the K2 Coefficient Value
As a result of the tests carried out by means of a simple calculation from formula (2),
the K0 value was obtained from the measurement of the pressure drop across the clean
filter bags. The dust resistance coefficient K2 was also calculated, which depends on the
pressure drop Δpp across the dust cake, filtration velocity wf and the dust areal density of
the filtering surface s in accordance with Equation (4), after transforming Equation (3):
K2 =∆pp
wf∙s [s−1], (4)
The dust areal density of the surface in the tests was calculated from formula (5).
s = wf ∙ c ∙ t [kg·m−2], (5)
where c is the dust concentration at the test stand inlet 0.01 kg·m−3, and t is the time be-
tween cleaning pulses of 300 s.
3. Results and Discussion
Figure 4. Particle-size distributions of the dust by sieving method.
The dust areal density of the surface in the tests was calculated from Formula (5).
s = wf·c·t[kg·m−2
], (5)
where c is the dust concentration at the test stand inlet 0.01 kg·m−3, and t is the timebetween cleaning pulses of 300 s.
3. Results and Discussion
Filter bags from two installations operating in the same furniture factory in differenttechnological lines were used for the test. Thus, data were obtained on the characteristicsof the formation of air flow resistance through bags made of the same non-woven fabricinstalled in filters differently loaded with air carrying various types of dust waste.
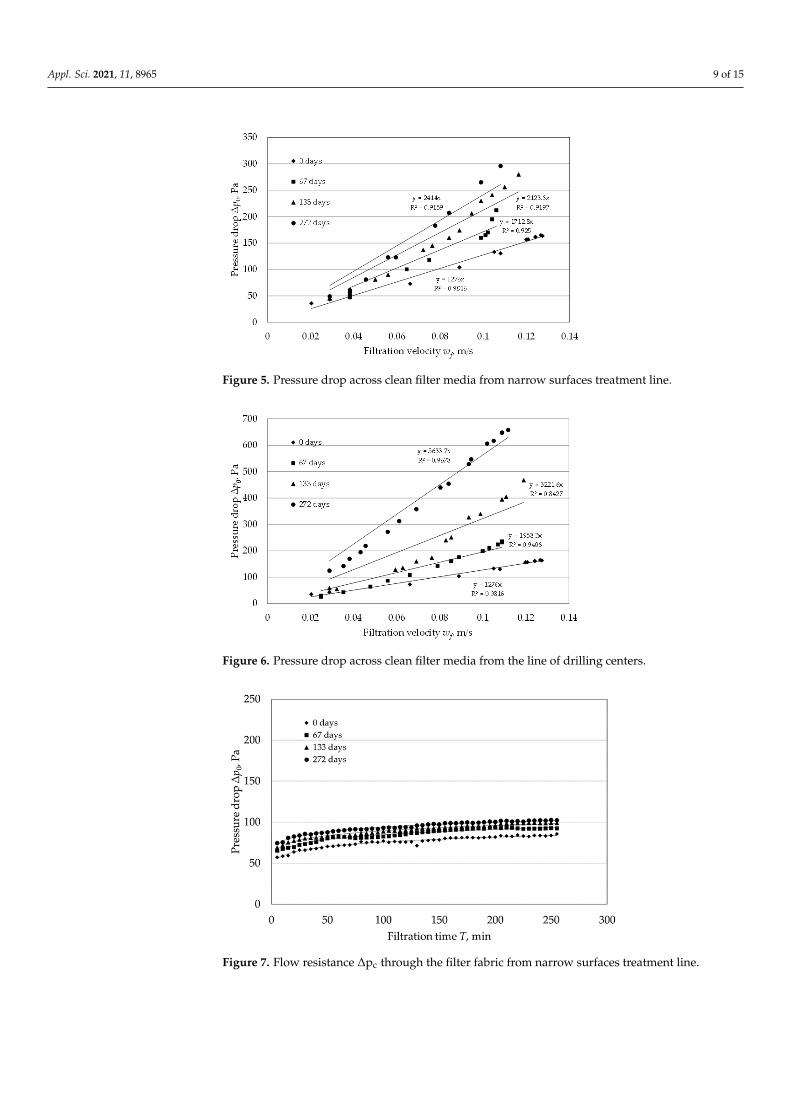
Before testing the total pressure drop ∆pc for individual bags, the pressure drop acrossthe bags ∆p0 during the clean air flow was determined. This test showed an increase inresistance with increasing bag life in an industrial filter. The pressure drop values for thefilter bags from both filter baghouses are shown in Figures 5 and 6. The formation of thepressure drop during the flow of clean air through the filter bags is very similar to theresults obtained in previous studies on the use of two-layer filter media for the separationof wood dust [26].
The value of the K0 coefficient equal to 1276 [Pa·s·m−1] was read from plot of theclean bag, which had not been used before, as the value of the proportionality coefficientof the regression equation. On the basis of the results obtained in accordance with theFormula (1), the value of the pressure drop across the clean bag ∆p0 was calculated for theassumed filtration velocity of 0.0405 m·s−1. This pressure drop is 51.7 Pa. This value wasfurther used to determine the dust cake resistance coefficient.
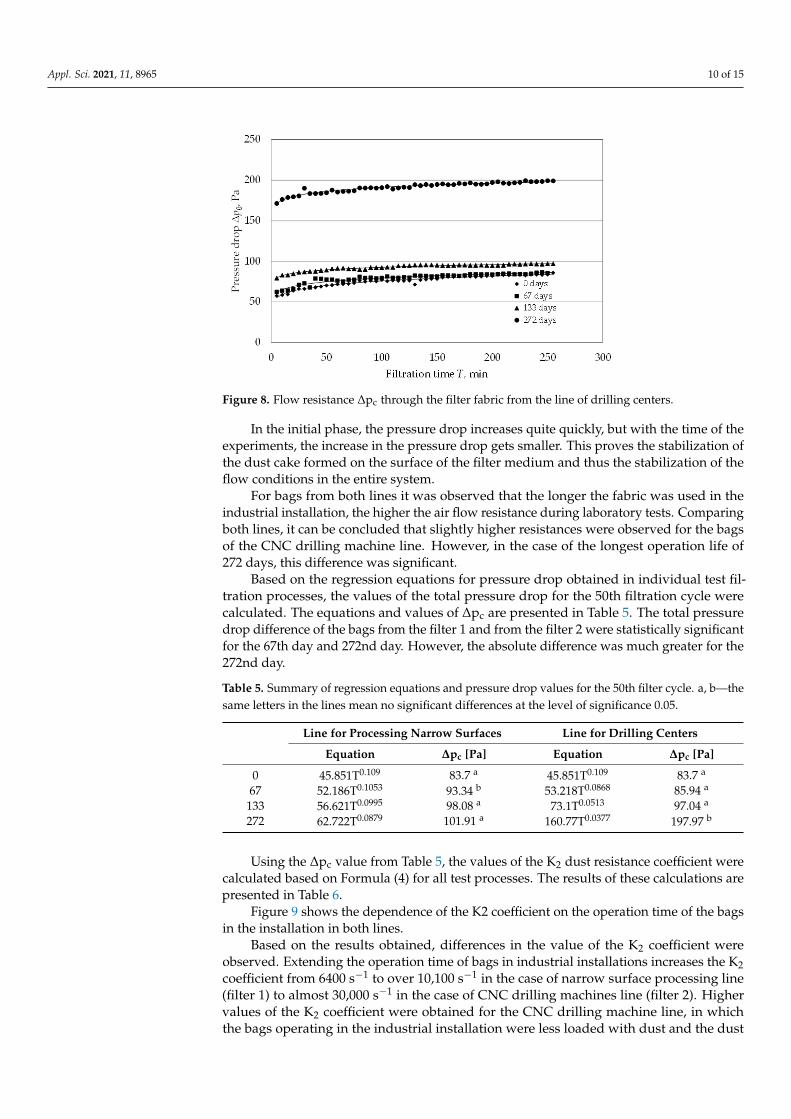
The operation time of the bags in an industrial installation increases the resistance ofclean air flow through the tested filter fabric. This is certainly due to the presence of dustinside the bag structure that was previously used in an industrial dust collector. Higherresistances were obtained for the bags working in filter 2 in the dust extraction installationof the CNC drilling machine line. The pulse-jet baghouse in this installation works inlighter conditions (filtration velocity and less waste than in the narrow surfaces processingline) and the bags are cleaned less frequently. This shows that the frequency of cleaningpulses has a decisive influence on the air flow resistance.
In the second stage of the test, the total pressure drop was measured during the exper-iments with the use of filter bags previously working in industrial filters for 67, 133 and272 days and a clean bag, not previously used. The same test wood dust was used in allthe experimental air purification processes. Figures 7 and 8 show the maximum pressuredrop ∆pc in individual filtration cycles for the tested filter bags from baghouses 1 and 2respectively. Both figures show the pressure drop curves for bags that were used in indus-trial installations. The course of the increase in total pressure drop during experimentalfiltration processes is characteristic for this type of filtration process.
Appl. Sci. 2021, 11, 8965 9 of 15
Appl. Sci. 2021, 11, x FOR PEER REVIEW 9 of 16
Filter bags from two installations operating in the same furniture factory in different
technological lines were used for the test. Thus, data were obtained on the characteristics
of the formation of air flow resistance through bags made of the same non-woven fabric
installed in filters differently loaded with air carrying various types of dust waste.
Before testing the total pressure drop Δpc for individual bags, the pressure drop
across the bags Δp0 during the clean air flow was determined. This test showed an in-
crease in resistance with increasing bag life in an industrial filter. The pressure drop
values for the filter bags from both filter baghouses are shown in Figures 5 and 6. The
formation of the pressure drop during the flow of clean air through the filter bags is very
similar to the results obtained in previous studies on the use of two-layer filter media for
the separation of wood dust [26].
Figure 5. Pressure drop across clean filter media from narrow surfaces treatment line.
Figure 6. Pressure drop across clean filter media from the line of drilling centers.
The value of the K0 coefficient equal to 1276 [Pa·s·m−1] was read from plot of the
clean bag, which had not been used before, as the value of the proportionality coefficient
of the regression equation. On the basis of the results obtained in accordance with the
formula (1), the value of the pressure drop across the clean bag Δp0 was calculated for the
assumed filtration velocity of 0.0405 m·s−1. This pressure drop is 51.7 Pa. This value was
further used to determine the dust cake resistance coefficient.
The operation time of the bags in an industrial installation increases the resistance of
clean air flow through the tested filter fabric. This is certainly due to the presence of dust
inside the bag structure that was previously used in an industrial dust collector. Higher
resistances were obtained for the bags working in filter 2 in the dust extraction installa-
Figure 5. Pressure drop across clean filter media from narrow surfaces treatment line.
Appl. Sci. 2021, 11, x FOR PEER REVIEW 9 of 16
Filter bags from two installations operating in the same furniture factory in different
technological lines were used for the test. Thus, data were obtained on the characteristics
of the formation of air flow resistance through bags made of the same non-woven fabric
installed in filters differently loaded with air carrying various types of dust waste.
Before testing the total pressure drop Δpc for individual bags, the pressure drop
across the bags Δp0 during the clean air flow was determined. This test showed an in-
crease in resistance with increasing bag life in an industrial filter. The pressure drop
values for the filter bags from both filter baghouses are shown in Figures 5 and 6. The
formation of the pressure drop during the flow of clean air through the filter bags is very
similar to the results obtained in previous studies on the use of two-layer filter media for
the separation of wood dust [26].
Figure 5. Pressure drop across clean filter media from narrow surfaces treatment line.
Figure 6. Pressure drop across clean filter media from the line of drilling centers.
The value of the K0 coefficient equal to 1276 [Pa·s·m−1] was read from plot of the
clean bag, which had not been used before, as the value of the proportionality coefficient
of the regression equation. On the basis of the results obtained in accordance with the
formula (1), the value of the pressure drop across the clean bag Δp0 was calculated for the
assumed filtration velocity of 0.0405 m·s−1. This pressure drop is 51.7 Pa. This value was
further used to determine the dust cake resistance coefficient.
The operation time of the bags in an industrial installation increases the resistance of
clean air flow through the tested filter fabric. This is certainly due to the presence of dust
inside the bag structure that was previously used in an industrial dust collector. Higher
resistances were obtained for the bags working in filter 2 in the dust extraction installa-
Figure 6. Pressure drop across clean filter media from the line of drilling centers.
Appl. Sci. 2021, 11, x FOR PEER REVIEW 10 of 16
tion of the CNC drilling machine line. The pulse-jet baghouse in this installation works in
lighter conditions (filtration velocity and less waste than in the narrow surfaces pro-
cessing line) and the bags are cleaned less frequently. This shows that the frequency of
cleaning pulses has a decisive influence on the air flow resistance.
In the second stage of the test, the total pressure drop was measured during the ex-
periments with the use of filter bags previously working in industrial filters for 67, 133
and 272 days and a clean bag, not previously used. The same test wood dust was used in
all the experimental air purification processes. Figures 7 and 8 show the maximum
pressure drop Δpc in individual filtration cycles for the tested filter bags from baghouses
1 and 2 respectively. Both figures show the pressure drop curves for bags that were used
in industrial installations. The course of the increase in total pressure drop during ex-
perimental filtration processes is characteristic for this type of filtration process.
In the initial phase, the pressure drop increases quite quickly, but with the time of
the experiments, the increase in the pressure drop gets smaller. This proves the stabiliza-
tion of the dust cake formed on the surface of the filter medium and thus the stabilization
of the flow conditions in the entire system.
For bags from both lines it was observed that the longer the fabric was used in the
industrial installation, the higher the air flow resistance during laboratory tests. Com-
paring both lines, it can be concluded that slightly higher resistances were observed for
the bags of the CNC drilling machine line. However, in the case of the longest operation
life of 272 days, this difference was significant.
Figure 7. Flow resistance Δpc through the filter fabric from narrow surfaces treatment line. Figure 7. Flow resistance ∆pc through the filter fabric from narrow surfaces treatment line.
Appl. Sci. 2021, 11, 8965 10 of 15Appl. Sci. 2021, 11, x FOR PEER REVIEW 11 of 16
Figure 8. Flow resistance Δpc through the filter fabric from the line of drilling centers.
Based on the regression equations for pressure drop obtained in individual test fil-
tration processes, the values of the total pressure drop for the 50th filtration cycle were
calculated. The equations and values of Δpc are presented in Table 5. The total pressure
drop difference of the bags from the filter 1 and from the filter 2 were statistically signif-
icant for the 67th day and 272nd day. However, the absolute difference was much greater
for the 272nd day.
Table 5. Summary of regression equations and pressure drop values for the 50th filter cycle. a,
b—the same letters in the lines mean no significant differences at the level of significance 0.05.
Line for Processing Narrow Surfaces Line for Drilling Centers
Equation Δpc [Pa] Equation Δpc [Pa]
0 45.851T0.109 83.7 a 45.851T0.109 83.7 a
67 52.186T0.1053 93.34 b 53.218T0.0868 85.94 a
133 56.621T0.0995 98.08 a 73.1T0.0513 97.04 a
272 62.722T0.0879 101.91 a 160.77T0.0377 197.97 b
Using the Δpc value from Table 5, the values of the K2 dust resistance coefficient
were calculated based on formula (4) for all test processes. The results of these calcula-
tions are presented in Table 6.
Table 6. Summary of the resistance values Δpp and the K2 coefficient for individual test variants.
Filter 1 A Line for Processing Narrow Surfaces Filter 2 A Line for Drilling Centers
Δpp [Pa] K2 [s−1] Δpp [Pa] K2 [s−1]
0 32.022 6507.545 32.022 6507.545
67 41.662 8466.596 34.262 6962.76
133 46.402 9429.863 45.362 9218.513
272 50.232 10,208.2 146.292 29,729.61
Figure 9 shows the dependence of the K2 coefficient on the operation time of the
bags in the installation in both lines.
Figure 8. Flow resistance ∆pc through the filter fabric from the line of drilling centers.
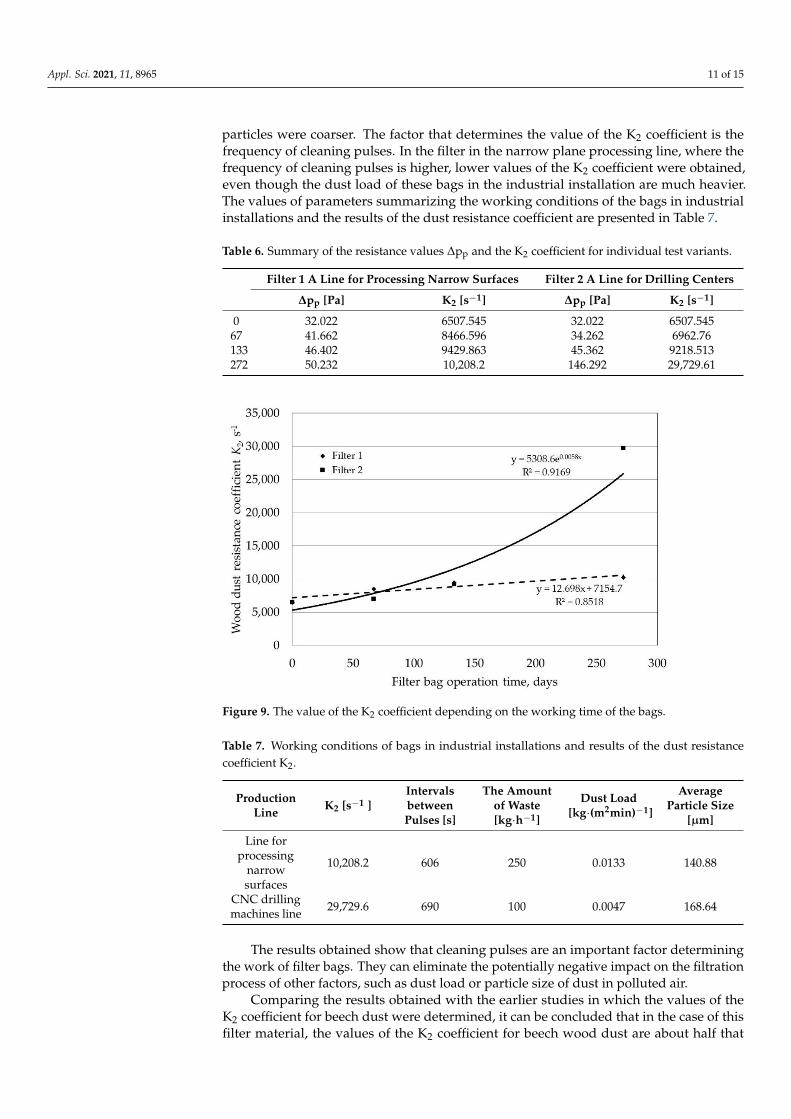
In the initial phase, the pressure drop increases quite quickly, but with the time of theexperiments, the increase in the pressure drop gets smaller. This proves the stabilization ofthe dust cake formed on the surface of the filter medium and thus the stabilization of theflow conditions in the entire system.
For bags from both lines it was observed that the longer the fabric was used in theindustrial installation, the higher the air flow resistance during laboratory tests. Comparingboth lines, it can be concluded that slightly higher resistances were observed for the bagsof the CNC drilling machine line. However, in the case of the longest operation life of272 days, this difference was significant.
Based on the regression equations for pressure drop obtained in individual test fil-tration processes, the values of the total pressure drop for the 50th filtration cycle werecalculated. The equations and values of ∆pc are presented in Table 5. The total pressuredrop difference of the bags from the filter 1 and from the filter 2 were statistically significantfor the 67th day and 272nd day. However, the absolute difference was much greater for the272nd day.
Table 5. Summary of regression equations and pressure drop values for the 50th filter cycle. a, b—thesame letters in the lines mean no significant differences at the level of significance 0.05.
Line for Processing Narrow Surfaces Line for Drilling Centers
Equation ∆pc [Pa] Equation ∆pc [Pa]
0 45.851T0.109 83.7 a 45.851T0.109 83.7 a
67 52.186T0.1053 93.34 b 53.218T0.0868 85.94 a
133 56.621T0.0995 98.08 a 73.1T0.0513 97.04 a
272 62.722T0.0879 101.91 a 160.77T0.0377 197.97 b
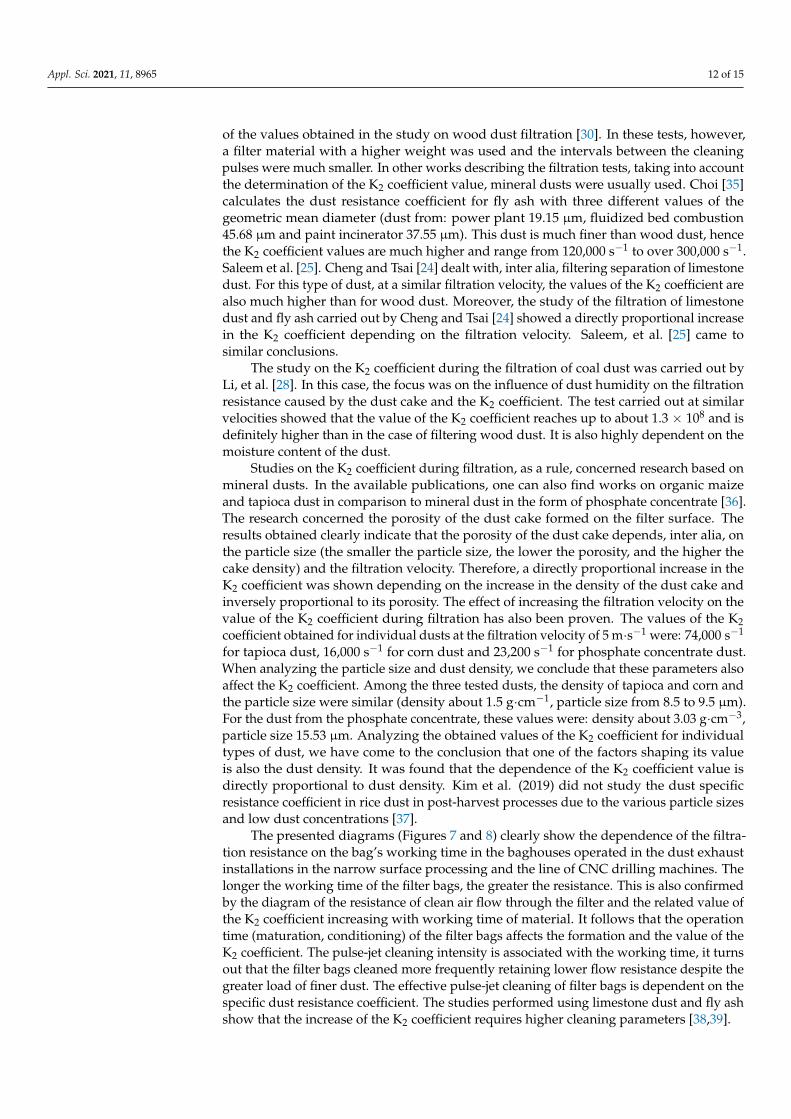
Using the ∆pc value from Table 5, the values of the K2 dust resistance coefficient werecalculated based on Formula (4) for all test processes. The results of these calculations arepresented in Table 6.
Figure 9 shows the dependence of the K2 coefficient on the operation time of the bagsin the installation in both lines.
Based on the results obtained, differences in the value of the K2 coefficient wereobserved. Extending the operation time of bags in industrial installations increases the K2coefficient from 6400 s−1 to over 10,100 s−1 in the case of narrow surface processing line(filter 1) to almost 30,000 s−1 in the case of CNC drilling machines line (filter 2). Highervalues of the K2 coefficient were obtained for the CNC drilling machine line, in whichthe bags operating in the industrial installation were less loaded with dust and the dust
Appl. Sci. 2021, 11, 8965 11 of 15
particles were coarser. The factor that determines the value of the K2 coefficient is thefrequency of cleaning pulses. In the filter in the narrow plane processing line, where thefrequency of cleaning pulses is higher, lower values of the K2 coefficient were obtained,even though the dust load of these bags in the industrial installation are much heavier.The values of parameters summarizing the working conditions of the bags in industrialinstallations and the results of the dust resistance coefficient are presented in Table 7.
Table 6. Summary of the resistance values ∆pp and the K2 coefficient for individual test variants.
Filter 1 A Line for Processing Narrow Surfaces Filter 2 A Line for Drilling Centers
∆pp [Pa] K2 [s−1] ∆pp [Pa] K2 [s−1]
0 32.022 6507.545 32.022 6507.54567 41.662 8466.596 34.262 6962.76133 46.402 9429.863 45.362 9218.513272 50.232 10,208.2 146.292 29,729.61
Appl. Sci. 2021, 11, x FOR PEER REVIEW 12 of 16
Figure 9. The value of the K2 coefficient depending on the working time of the bags.
Based on the results obtained, differences in the value of the K2 coefficient were ob-
served. Extending the operation time of bags in industrial installations increases the K2
coefficient from 6400 s−1 to over 10,100 s−1 in the case of narrow surface processing line
(filter 1) to almost 30,000 s−1 in the case of CNC drilling machines line (filter 2). Higher
values of the K2 coefficient were obtained for the CNC drilling machine line, in which the
bags operating in the industrial installation were less loaded with dust and the dust par-
ticles were coarser. The factor that determines the value of the K2 coefficient is the fre-
quency of cleaning pulses. In the filter in the narrow plane processing line, where the
frequency of cleaning pulses is higher, lower values of the K2 coefficient were obtained,
even though the dust load of these bags in the industrial installation are much heavier.
The values of parameters summarizing the working conditions of the bags in industrial
installations and the results of the dust resistance coefficient are presented in Table 7.
Table 7. Working conditions of bags in industrial installations and results of the dust resistance
coefficient K2.
Production
Line K2 [s−1 ]
Intervals
between
Pulses [s]
The Amount of
Waste [kg·h−1]
Dust Load
[kg·(m2min)−1]
Average Parti-
cle Size [µm]
Line for pro-
cessing narrow
surfaces
10,208.2 606 250 0.0133 140.88
CNC drilling
machines line 29,729.6 690 100 0.0047 168.64
The results obtained show that cleaning pulses are an important factor determining
the work of filter bags. They can eliminate the potentially negative impact on the filtra-
tion process of other factors, such as dust load or particle size of dust in polluted air.
Comparing the results obtained with the earlier studies in which the values of the K2
coefficient for beech dust were determined, it can be concluded that in the case of this
filter material, the values of the K2 coefficient for beech wood dust are about half that of
the values obtained in the study on wood dust filtration [30]. In these tests, however, a
filter material with a higher weight was used and the intervals between the cleaning
pulses were much smaller. In other works describing the filtration tests, taking into ac-
Figure 9. The value of the K2 coefficient depending on the working time of the bags.
Table 7. Working conditions of bags in industrial installations and results of the dust resistancecoefficient K2.
ProductionLine K2 [s−1 ]
IntervalsbetweenPulses [s]
The Amountof Waste[kg·h−1]
Dust Load[kg·(m2min)−1]
AverageParticle Size
[µm]
Line forprocessing
narrowsurfaces
10,208.2 606 250 0.0133 140.88
CNC drillingmachines line 29,729.6 690 100 0.0047 168.64
The results obtained show that cleaning pulses are an important factor determiningthe work of filter bags. They can eliminate the potentially negative impact on the filtrationprocess of other factors, such as dust load or particle size of dust in polluted air.
Comparing the results obtained with the earlier studies in which the values of theK2 coefficient for beech dust were determined, it can be concluded that in the case of thisfilter material, the values of the K2 coefficient for beech wood dust are about half that
Appl. Sci. 2021, 11, 8965 12 of 15
of the values obtained in the study on wood dust filtration [30]. In these tests, however,a filter material with a higher weight was used and the intervals between the cleaningpulses were much smaller. In other works describing the filtration tests, taking into accountthe determination of the K2 coefficient value, mineral dusts were usually used. Choi [35]calculates the dust resistance coefficient for fly ash with three different values of thegeometric mean diameter (dust from: power plant 19.15 µm, fluidized bed combustion45.68 µm and paint incinerator 37.55 µm). This dust is much finer than wood dust, hencethe K2 coefficient values are much higher and range from 120,000 s−1 to over 300,000 s−1.Saleem et al. [25]. Cheng and Tsai [24] dealt with, inter alia, filtering separation of limestonedust. For this type of dust, at a similar filtration velocity, the values of the K2 coefficient arealso much higher than for wood dust. Moreover, the study of the filtration of limestonedust and fly ash carried out by Cheng and Tsai [24] showed a directly proportional increasein the K2 coefficient depending on the filtration velocity. Saleem, et al. [25] came tosimilar conclusions.
The study on the K2 coefficient during the filtration of coal dust was carried out byLi, et al. [28]. In this case, the focus was on the influence of dust humidity on the filtrationresistance caused by the dust cake and the K2 coefficient. The test carried out at similarvelocities showed that the value of the K2 coefficient reaches up to about 1.3 × 10⁸ and isdefinitely higher than in the case of filtering wood dust. It is also highly dependent on themoisture content of the dust.
Studies on the K2 coefficient during filtration, as a rule, concerned research based onmineral dusts. In the available publications, one can also find works on organic maizeand tapioca dust in comparison to mineral dust in the form of phosphate concentrate [36].The research concerned the porosity of the dust cake formed on the filter surface. Theresults obtained clearly indicate that the porosity of the dust cake depends, inter alia, onthe particle size (the smaller the particle size, the lower the porosity, and the higher thecake density) and the filtration velocity. Therefore, a directly proportional increase in theK2 coefficient was shown depending on the increase in the density of the dust cake andinversely proportional to its porosity. The effect of increasing the filtration velocity on thevalue of the K2 coefficient during filtration has also been proven. The values of the K2coefficient obtained for individual dusts at the filtration velocity of 5 m·s−1 were: 74,000 s−1
for tapioca dust, 16,000 s−1 for corn dust and 23,200 s−1 for phosphate concentrate dust.When analyzing the particle size and dust density, we conclude that these parameters alsoaffect the K2 coefficient. Among the three tested dusts, the density of tapioca and corn andthe particle size were similar (density about 1.5 g·cm−1, particle size from 8.5 to 9.5 µm).For the dust from the phosphate concentrate, these values were: density about 3.03 g·cm−3,particle size 15.53 µm. Analyzing the obtained values of the K2 coefficient for individualtypes of dust, we have come to the conclusion that one of the factors shaping its valueis also the dust density. It was found that the dependence of the K2 coefficient value isdirectly proportional to dust density. Kim et al. (2019) did not study the dust specificresistance coefficient in rice dust in post-harvest processes due to the various particle sizesand low dust concentrations [37].
The presented diagrams (Figures 7 and 8) clearly show the dependence of the filtra-tion resistance on the bag’s working time in the baghouses operated in the dust exhaustinstallations in the narrow surface processing and the line of CNC drilling machines. Thelonger the working time of the filter bags, the greater the resistance. This is also confirmedby the diagram of the resistance of clean air flow through the filter and the related value ofthe K2 coefficient increasing with working time of material. It follows that the operationtime (maturation, conditioning) of the filter bags affects the formation and the value of theK2 coefficient. The pulse-jet cleaning intensity is associated with the working time, it turnsout that the filter bags cleaned more frequently retaining lower flow resistance despite thegreater load of finer dust. The effective pulse-jet cleaning of filter bags is dependent on thespecific dust resistance coefficient. The studies performed using limestone dust and fly ashshow that the increase of the K2 coefficient requires higher cleaning parameters [38,39].
Appl. Sci. 2021, 11, 8965 13 of 15
Long-term operation of the filter bags can be simulated under laboratory condi-tions. The methods of aging filter materials in laboratory conditions, used so far bySaleem, et al. [20] and Mukhopadhyay and Bawane, (2015) [21] corresponded to the num-ber of cleaning pulses for a period of approximately 100 days of bag work in a furniturefactory (maximum 10,000 cycles), while the operation life of such bags is often severalyears. As a result, such artificial aging of filter bags may turn out to be unreliable; therefore,to verify the actual operation of such bags, they must be tested taking into account theiruse in real conditions.
4. Conclusions
The research conducted has shown that the properties of filter non-woven fabricsused in industrial conditions change during their operation. It has been shown that theair flow resistance through the filter fabric increases with the longer filtration time. Onthe basis of the results obtained, it can be concluded that the operation properties of thefilter bags depend not only on their primary operating characteristics, but also on theirworking conditions. The conditions in which the filter bags work also include the highdust load and the low size of the dust particles. These factors negatively affect the filtrationresistance, but their influence can be compensated by the increased frequency of cleaningpulses. It has also been shown that the K2 coefficient is influenced not only by the filtrationvelocity, moisture content of dust, porosity and density of the dust layer, particle size anddensity of the material from which the dust was produced, but also by the length of thebag operation time.
The high parameters of pulse-jet cleaning pulse frequency and initial pressure shouldbe used to reduce the increase of the pressure drop in bag filters for wood dusts. The valueof the dust specific resistance coefficient can be an indicator of the need for this reduction.
Author Contributions: Conceptualization, C.D., S.D. and T.R.; methodology, C.D. and Z.P.; software,C.D.; validation, C.D., Z.P. and T.R.; formal analysis, C.D. and T.R.; investigation, C.D.; resources,C.D.; data curation, C.D. and Z.P.; writing—original draft preparation, C.D. and Z.P.; writing—review and editing, T.R. and R.K.; visualization, C.D. and Z.P.; supervision, S.D. and T.R.; projectadministration, T.R. and R.K.; funding acquisition, T.R. and R.K. All authors have read and agreed tothe published version of the manuscript.
Funding: This publication is the result of the following projects implementation: the research taskNo. 506.227.02.00 statutory R&D activities of Faculty of Forestry and Wood Technology, PoznanUniversity of Life Sciences and projects by Ministry of Education, Science, Research and Sport of theSlovak Republic VEGA 1/0324/21 and KEGA 026UMB-4/2021.
Institutional Review Board Statement: Not applicable.
Informed Consent Statement: Not applicable.
Data Availability Statement: Not applicable.
Conflicts of Interest: The authors declare no conflict of interest.
References1. Siew, S.S.; Martinsen, J.I.; Kjaerheim, K.; Sparén, P.; Tryggvadottir, L.; Weiderpass, E.; Pukkala, E. Occupational Exposure to Wood
Dust and Risk of Nasal and Nasopharyngeal Cancer: A Case-control Study among Men in Four Nordic Countries—With anEmphasis on Nasal Adenocarcinoma. Int. J. Cancer 2017, 141, 2430–2436. [CrossRef]
2. Matrat, M.; Radoï, L.; Févotte, J.; Guida, F.; Cénée, S.; Cyr, D.; Sanchez, M.; Menvielle, G.; Schmaus, A.; Marrer, E. OccupationalExposure to Wood Dust and Risk of Lung Cancer: The ICARE Study. Occup. Environ. Med. 2019, 76, 901–907. [CrossRef]
3. Jacobsen, G.; Schaumburg, I.; Sigsgaard, T.; Schlünssen, V. Non-Malignant Respiratory Diseases and Occupational Exposure toWood Dust. Part II. Dry Wood Industry. Ann. Agric. Environ. Med. 2010, 17, 29–44. [PubMed]
4. Burton, C.; Bradshaw, L.; Agius, R.; Burge, S.; Huggins, V.; Fishwick, D. Medium-Density Fibreboard and Occupational Asthma.A Case Series. Occup. Med. 2011, 61, 357–363. [CrossRef] [PubMed]
5. Bell, H.K.; King, C.M. Allergic Contact Dermatitis from Urea-Formaldehyde Resin in Medium-Density Fibreboard (MDF):CONTACT POINT. Contact Dermat. 2002, 46, 247. [CrossRef] [PubMed]
Appl. Sci. 2021, 11, 8965 14 of 15
6. International Agency for Research on Cancer. Arsenic, Metals, Fibres, and Dusts. IARC Monogr. Eval. Carcinog. Risks Hum. 2012,100, 11–465.
7. Directive (EU) 2017/2398 of the European Parliament and of the Council of 12 December 2017 Amending Directive 2004/37/ECon the Protection of Workers from the Risks Related to Exposure to Carcinogens or Mutagens at Work 2017. Available online:https://www.eumonitor.eu/9353000/1/j9vvik7m1c3gyxp/vklpgng5lezp (accessed on 24 September 2021).
8. Simon, X.; Bémer, D.; Chazelet, S.; Thomas, D. Downstream Particle Puffs Emitted during Pulse-Jet Cleaning of a Baghouse WoodDust Collector: Influence of Operating Conditions and Filter Surface Treatment. Powder Technol. 2014, 261, 61–70. [CrossRef]
9. Ockajová, A.; Kucerka, M.; Krišt’ák, L.; Igaz, R. Granulometric Analysis of Sanding Dust from Selected Wood Species. BioResources2018, 13, 7481–7495. [CrossRef]
10. Kminiak, R.; Orlowski, K.A.; Dzurenda, L.; Chuchala, D.; Banski, A. Effect of Thermal Treatment of Birch Wood by SaturatedWater Vapor on Granulometric Composition of Chips from Sawing and Milling Processes from the Point of View of Its Processingto Composites. Appl. Sci. 2020, 10, 7545. [CrossRef]
11. Kos, A.; Beljo-Lucic, R.; Šega, K.; Rapp, A.O. Influence of Woodworking Machine Cutting Parameters on the Surrounding AirDustiness. Holz Roh Werkst 2004, 62, 169–176. [CrossRef]
12. Beljo-Lucic, R.; Cavlovic, A.O.; Jug, M. Definitions and Relation of Airborne Wood Dust Fractions. In Proceedings of the 4thInternational Scientific Conference—Woodworking Techniques, Prague, Czech Republic, 7 September 2011; pp. 25–32.
13. Ockajová, A.; Kucerka, M.; Kminiak, R.; Krišt’ák, L’.; Igaz, R.; Réh, R. Occupational Exposure to Dust Produced When MillingThermally Modified Wood. Int. J. Environ. Res. Public Health 2020, 17, 1478. [CrossRef]
14. Kminiak, R.; Kucerka, M.; Kristak, L.; Reh, R.; Antov, P.; Ockajová, A.; Rogozinski, T.; Pedzik, M. Granulometric Characterizationof Wood Dust Emission from CNC Machining of Natural Wood and Medium Density Fiberboard. Forests 2021, 12, 1039. [CrossRef]
15. Pedzik, M.; Rogozinski, T.; Majka, J.; Stuper-Szablewska, K.; Antov, P.; Kristak, L.; Kminiak, R.; Kucerka, M. Fine Dust Creationduring Hardwood Machine Sanding. Appl. Sci. 2021, 11, 6602. [CrossRef]
16. Mukhopadhyay, A. Pulse-Jet Filtration: An Effective Way to Control Industrial Pollution Part II: Process Characterization andEvaluation of Filter Media. Text. Prog. 2010, 42, 1–97. [CrossRef]
17. Mukhopadhyay, A. Pulse-Jet Filtration: An Effective Way to Control Industrial Pollution Part I: Theory, Selection and Design ofPulse-Jet Filter. Text. Prog. 2009, 41, 195–315. [CrossRef]
18. Lu, H.-C.; Tsai, C.-J. A Pilot-Scale Study of the Design and Operation Parameters of a Pulse-Jet Baghouse. Aerosol Sci. Technol.1998, 29, 510–524. [CrossRef]
19. Potok, Z.; Rogozinski, T. Pilot-Scale Study on the Specific Resistance of Beech Wood Dust in a Pulse-Jet Filter. Sustainability 2020,12, 4816. [CrossRef]
20. Saleem, M.; Khan, R.U.; Tahir, M.S.; Krammer, G. Experimental Study of Cake Formation on Heat Treated and Membrane CoatedNeedle Felts in a Pilot Scale Pulse Jet Bag Filter Using Optical In-Situ Cake Height Measurement. Powder Technol. 2011, 214,388–399. [CrossRef]
21. Mukhopadhyay, A.; Bawane, H.S. Emission of Fine Particles and Ageing Behavior of PTFE Finished Filter Media during IndustrialPollution Control. Environ. Pollut. 2015, 4, 58. [CrossRef]
22. Callé, S. Changes in the Performances of Filter Media during Clogging and Cleaning Cycles. Ann. Occup. Hyg. 2001, 45, 115–121.[CrossRef]
23. Koehler, J.L.; David, L. Model Calibration for Pressure Drop in a Pulse-Jet Cleaned Fabric Filter. Atmos. Environ. 1983, 17,1909–1913. [CrossRef]
24. Cheng, Y.-H.; Tsai, C.-J. Factors Influencing Pressure Drop through a Dust Cake during Filtration. Aerosol Sci. Technol. 1998, 29,315–328. [CrossRef]
25. Saleem, M.; Krammer, G.; Tahir, M.S. The Effect of Operating Conditions on Resistance Parameters of Filter Media and LimestoneDust Cake for Uniformly Loaded Needle Felts in a Pilot Scale Test Facility at Ambient Conditions. Powder Technol. 2012, 228,100–107. [CrossRef]
26. Cirqueira, S.S.R.; Tanabe, E.H.; Aguiar, M.L. Evaluation of Operating Conditions during the Pulse Jet Cleaning Filtration UsingDifferent Surface Treated Fibrous Filters. Process Saf. Environ. Prot. 2017, 105, 69–78. [CrossRef]
27. Chen, Y.-S.; Hsiau, S.-S.; Lee, H.-Y.; Chyou, Y.-P. Filtration of Dust Particulates Using a New Filter System with Louvers andSublouvers. Fuel 2012, 99, 118–128. [CrossRef]
28. Li, J.; Li, S.; Zhou, F. Effect of Moisture Content in Coal Dust on Filtration and Cleaning Performance of Filters. Physicochem. Probl.Miner. Process. 2016, 52, 365–379. [CrossRef]
29. Lupion, M.; Rodriguez-Galan, M.; Alonso-Fariñas, B.; Gutierrez Ortiz, F.J. Investigation into the Parameters of Influence on DustCake Porosity in Hot Gas Filtration. Powder Technol. 2014, 264, 592–598. [CrossRef]
30. Rogozinski, T. Pilot-Scale Study on the Influence of Wood Dust Type on Pressure Drop during Filtration in a Pulse-Jet Baghouse.Process Saf. Environ. Prot. 2018, 119, 58–64. [CrossRef]
31. Dolny, S.; Rogozinski, T.; Dobak, S. Methodology of Pilot-Scale Studies on Pulse-Jet Filtration of Air Polluted with Wood Dust.Wood Res. 2019, 64, 325–334.
32. Mao, N.; Yao, Y.; Kanaoka, C. Comparison of Filtration Performances of Cleanable Fabric Filters Measured by VDI and JIS TestingRigs. Adv. Powder Technol. 2006, 17, 85–97. [CrossRef]

Appl. Sci. 2021, 11, 8965 15 of 15
33. Liu, J.X.; Chang, D.Q.; Xie, Y.; Mao, N.; Sun, X. Research on Fine Particles Capture of Baghouse Filter Media. Appl. Mech. Mater.2013, 300–301, 1293–1297. [CrossRef]
34. Hoeflinger, W. New Developments for Optimal Selection of Filter Media in Fine Dust Bag- House Filtration. Glob. J. Technol.Optim. 2011, 2, 111–116.
35. Choi, J.-H.; Ha, S.-J.; Park, Y.-O. The Effect of Particle Shape on the Pressure Drop across the Dust Cake. Korean J. Chem. Eng. 2002,19, 711–717. [CrossRef]
36. Ito, L.X.; Aguiar, M.L. A Study of the Porosity of Gas Filtration Cakes. Braz. J. Chem. Eng. 2009, 26, 307–315. [CrossRef]37. Kim, H.; Kim, O.W.; Lee, H.J.; Ahn, J.H. Dust Collection Performance of Bag Filters in Rice Processing Facilities. Trans. ASABE
2019, 62, 1467–1473. [CrossRef]38. Tsai, C.-J.; Tsai, M.-L.; Lu, H.-C. Effect of Filtration Velocity and Filtration Pressure Drop on the Bag-Cleaning Performance of a
Pulse-Jet Baghouse. Sep. Sci. Technol. 2000, 35, 211–226. [CrossRef]39. Lu, H.-C.; Tsai, C.-J. Influence of Design and Operation Parameters on Bag-Cleaning Performance of Pulse-Jet Baghouse. J.
Environ. Eng. 1999, 125, 583–591. [CrossRef]
Related Documents