Application of Odor Sensors to Ore Sorting and Mill Feed Control Final Report Reporting Period Start Date: September 30, 2003 Reporting Period End Date: December 31, 2004 Principal Author: Michael G. Nelson Date Report Issued: August 2005 DOE Award Number: DE-FG26-03NT41934 Submitting Organization: University of Utah Mining Engineering Department 135 South 1460 East, Room 313 Salt Lake City, Utah 84112

Welcome message from author
This document is posted to help you gain knowledge. Please leave a comment to let me know what you think about it! Share it to your friends and learn new things together.
Transcript
Application of Odor Sensors to Ore Sorting and Mill Feed Control
Final Report
Reporting Period Start Date: September 30, 2003Reporting Period End Date: December 31, 2004
Principal Author: Michael G. NelsonDate Report Issued: August 2005
DOE Award Number: DE-FG26-03NT41934Submitting Organization: University of Utah
Mining Engineering Department135 South 1460 East, Room 313Salt Lake City, Utah 84112

ii
DISCLAIMER
This report was prepared as an account of work sponsored by an agency of the United States Government.Neither the United States Government nor any agency thereof, nor any of their employees, makes anywarranty, express or implied, or assumes any legal liability or responsibility for the accuracy, completeness,or usefulness of any information, apparatus, product, or process disclosed, or represents that its use wouldnot infringe privately owned rights. Reference herein to any specific commercial product, process, orservice by trade name, trademark, manufacturer, or otherwise does not necessarily constitute or imply itsendorsement, recommendation, or favoring by the United States Government or any agency thereof. Theviews and opinions of authors expressed herein do not necessarily state or reflect those of the UniteStates Government or any agency thereof.
iii
ABSTRACT
Abstract – Control of the feed provided to mineral processing facilities is a continuing challenge. Mucheffort is currently being devoted to overcoming these problems. These projects are usually described underthe general headings of Mine-to-Mill Integration or Mine-Mill Optimization.
It should be possible to combine the knowledge of ore type, mineralogy, and other characteristics (locatedin the mine modelling system), with the advanced capabilities of state-of-the-art mill control systems, toachieve an improved level of control in mineral processing that will allow optimization of the millprocesses on an almost real-time basis. This is not happening because mill feed it is often treated as auniform material, when in reality it varies in composition and characteristics.
An investigation was conducted to assess the suitability of odor sensors for maintaining traceability in oreproduction and processing. Commercially available sensors are now used in food processing,environmental monitoring, and other applications and can detect the presence of very small amounts (0.1 -500 ppm) of some molecules. An assortment of such molecules could be used to “tag” blocks of ore asthey are mined, according to their respective characteristics. Then, as the ore came into the mill, an arrayof “electronic noses” could be used to assess its characteristics in real time.
It was found that the Cyranose 320, a commercially available odor sensor, can easily distinguish amongsamples of rock marked with almond, cinnamon, citronella, lemon, and orange oils. Further, the sensorcould detect mixtures of rocks marked with various combinations of these oils. Treatment of mixtures ofgalena and silica with odorant compounds showed no detrimental effects on flotation response inlaboratory tests.
Additional work is recommended to determine how this concept can be extended to the marking of largevolumes of materials.

iv
TABLE OF CONTENTS
ABSTRACT iiiTABLE OF CONTENTS ivLIST OF FIGURES vLIST OF TABLES vEXECUTIVE SUMMARY 1INTRODUCTION 2 1. TRACERS AND TAGS – CURRENT TECHNOLOGY 2 2. TAGS FOR LARGE VOLUMES OF ORE 3 3. ODOR SENSOR TECHNOLOGY 4 4. ODOR SENSORS FOR MINING APPLICATIONS 4PROJECT OBJECTIVES 8METHODS 8 1. SENSOR SELECTION 9 2. SENSOR PURCHASE 10 3. SELECTION OF MARKER COMPOUNDS 10 4. SENSOR OPERATION AND INTERPRETATION 10LABORATORY TESTS 13 1. MARKER COMPOUND LONGEVITY 13 2. METHOD DEVELOPMENT 15 3. INSTRUMENT RESPONSE TO MARKER COMPOUNDS 17 4. INSTRUMENT RESPONSE TO MARKED ROCK SAMPLES (SINGLE MARKER COMPOUNDS)
19
5. INSTRUMENT RESPONSE TO MIXTURES OF MARKED ROCK SAMPLES (VARIOUS MARKER COMPOUNDS)
20
6. EFFECT OF MARKER COMPOUNDS ON THE FLOTATION RESPONSE OF ROCK SAMPLES
21
CONCLUSIONS 24REFERENCES 25

v
LIST OF FIGURES AND TABLES
Figure 1. The Cyranose 320 8Figure 2. The MOSES II Odor Sensor 9Figure 3. Typical Cyranose 320 Smellprint 11Figure 4. Mean-Distance Diagram for Five Marker Compounds Applied to Rock Samples 11Figure 5. PCA Plot for Five Marker Compounds Applied to Rock Samples 12Figure 6. Canonical Distance Plot for Five Marker Compounds 12Figure 7. Dropper-top Sample Bottle 15Figure 8. Sample Aspiration Needles 15Figure 9. Equipment Configuration for Sampling 16Figure 10. Smellprint for Pine Oil 17Figure 11. Smellprint for Orange Oil 17Figure 12. PCA Plot for Pine and Orange Oil Training Sets and Almond Oil Sample 18Figure 13. Canonical Plot for Pine and Orange Oil Training Sets and Almond Oil Sample 18Figure 14. Smellprint for Rock Samples Marked with Citronella 19Figure 15. Mean Distance Plot for Mixtures of Marked Rocks 20Figure 16. Canonical Plot for Mixtures of Marked Rocks 21Figure 17. Results of Flotation Tests on Mineral Samples Marked with Odorants 23
LIST OF TABLES
Table 1. Summary of Commercially Available Odor Sensors 6Table 2. Applications of Odor Sensors 7Table 3. Important Characteristics of the Cyranose 320 Odor Sensor 9Table 4. Sample Makeup for Cinnamon/Citronella Marked Rock Test 20Table 5. Sample Lots Prepared for Flotation Testing 22Table 6. Results of Flotation Tests on Samples Marked with Odorants 22
1
EXECUTIVE SUMMARY
It should be possible to combine the knowledge of ore type, mineralogy, and other characteristics(located in the mine modelling system), with the advanced capabilities of state-of-the-art mill controlsystems, to achieve an improved level of control in mineral processing that will allow optimization ofthe mill processes on an almost real-time basis. This is not happening because mill feed it is oftentreated as a uniform material, when in reality it varies in composition and characteristics.
An investigation was conducted to assess the suitability of odor sensors for maintaining traceability inore production and processing. It was found that the Cyranose 320, a commercially available odorsensor, can easily distinguish among samples of rock marked with almond, cinnamon, citronella,lemon, and orange oils. Further, the sensor could differentiate among mixtures of rocks marked withvarious combinations of these oils.
In laboratory tests, it was found that treatment with odorant compounds had the following effects onflotation response in a simple quartz/galena mixture: no frother addition was required – the citronellaand cinnamon oils created a very strong froth; slightly higher lead recoveries were obtained onmixtures that had been treated with the oils; and lower rougher concentrate grades were obtained onmixtures that had been treated with the oils.
Additional work is recommended to determine how this concept can be extended to the marking oflarge volumes of materials. After suitable sensors and odorants are identified in lab tests, an exhaustivefield testing program will be required. Nonetheless, odor sensing systems show promise for use intagging various types of ore, to allow tracking of that ore through the mining and milling process. Thiscould improve the integration of mine and mill operations, allowing the knowledge held in the miningand geological computer models to be transferred to the mill control system. Ore response to manymineral processing operations could be improved by having a more detailed knowledge of the natureof the feed.
2
INTRODUCTION
A brief survey of publications since 2000, under the keywords Mine-to-Mill Integration or Mine-MillOptimization, found 15 articles. Seven of these articles discussed the control of fragmentation, andhow it can be optimized between blasting (in the mine) and comminution (in the mill) [Dare-Bryan, etal., 2001, Grundstrom, et al., 2001, Kanchibotla, 2003, Marton and Crookes, 2001, Morrell and Munro,2000, Scott, et al., 2000, and Wooller, 2001]. Two articles discussed how the mine design couldminimize dilution and waste production [Anon., 2001a, and Klein, et al., 2003]. Five articles discussedthe relationship between ore mineralogy and overall mill performance, and addressed, at least in part,how the integrated ‘mine-mill system’ might be optimized [Lotter, 2002, Paley and Kojovic, 2001,Pease, et al., 2001, Taylor and Altman, 2001, and Williams and Holtzhausen, 2001]. The final articlewas general in nature [Herbst, 2000].
This brief literature survey indicated that the primary effort to date in mine-to-mill integration has beenoptimizing the relationship between blast fragmentation and comminution. The concept is referencedin the literature as early as 1991 [Smith and Hautala], and is addressed in some detail beginning in 1995[McKee, et al.] In some locations, this part of the mine-to-mill integration effort has been successful.At the same time, there is the potential to accomplish much more.
The relationship between ore composition or mineralogy and downstream processing is well known inthe mining industry. In fact, the very definition of a mineral deposit as an orebody depends on itssusceptibility to processing in an economical manner. It should be possible to combine the knowledgeof ore type, mineralogy, and other characteristics (located in the mine modelling system), with theadvanced capabilities of state-of-the-art mill control systems, to achieve an improved level of control inmineral processing, allowing optimization of the mill processes on an almost real-time basis. Thisconcept was described as early as 1993 [Robertson and Sehic], and is often discussed by mine and milloperators. Unfortunately, it is difficult to accomplish, for two reasons: First, mining processes,including drilling, blasting, loading, and transport, may allow for segregation of mined ore bycomposition, mineralogy, or other characteristics important in subsequent processing; second, millfacilities may not allow segregated storage of ore, at least not to the extent that might be used in anoptimized operation.
Both these limitations could be overcome to some extent by a method of attaching tracers or tags toindividual blocks or volumes of ore. If those tracers could be detected or sensed, the informationabout each ore block, gained during exploration and mining, could be used as input data to the millcontrol system. This would allow the real-time optimization or ore processing.
1. TRACERS AND TAGS – CURRENT TECHNOLOGY
A brief discussion of tracer technology is useful at this point. Tracers or tags are widely used in themanufacture and distribution of discrete products. The most familiar example is the well-known barcode, which is found on virtually every consumer product [Footlik, 1994, and Scanlon, 2003]. Ofcourse, bar codes must be attached to individual objects, and those objects must be transported orpresented in such a way that the bar code is accessible to the sensing device, a scanner. Clearly, barcodes cannot be used for large volumes of ore, where particle size and shape vary widely, and particleposition changes at random as the ore is transported.
3
Radio frequency (RF) tags are small plastic chips, each with an embedded RF transmitter. These tagscan be sensed from a distance, and do not require direct, line-of-sight contact with the sensor [Pidgeon,2003, and Anon., 2001b]. In some cases, they can be sensed through a covering of solid or particulatematerial. Thus for tagging ore, they overcome some of the limitations noted for bar codes. However,there is no reasonable way that RF tags can be used with volumes of ore, when those volumescomprise large numbers of discrete particles, because tags would have to be attached to a large numberof the particles within each volume.
Radioactive tracers have been used to determine the behavior of particles in a natural or syntheticprocess [Cheong, 1993, and Walsh and Rao, 1986]. Typically, the radioactive tracers are selected tohave properties similar to those of the particles that must be followed through the process in question,and mixed with non-radioactive particles for feed to the process. After processing, the tracer particlesare located with radiation detector, allowing documentation of their individual responses to theprocess. For example, Walsh and Rao [1986] used irradiated gold particles of various sizes todetermine how particle size was related to recovery in gravity concentration devices. The sizedistribution of the irradiated particles was matched closely to that of the gold being processed. Notethat the tracers are used to determine the response of particles with certain characteristics to a givenprocess, and not to mark a given particle or group of particles. Again, the limitations of this techniquefor tagging large volumes of ore are clear.
Where a large number of particles must be tagged, surface coatings are used. An example is the studyof particle diffusion through membranes. Particles of a given size are tagged with an analyte that issensitive to a given method (usually a form of optical spectroscopy), and then coated with glass toprotect the analyte from the liquid in which the particles are transported [Mulvaney, et al., 2003]. Thismethod allows the simultaneous coating of large numbers of particles, but is designed for smallparticles of relatively uniform size. Furthermore, it requires optical line-of- sight for particle sensing.Thus it would be difficult and expensive in applications large volumes of ore.
2. TAGS FOR LARGE VOLUMES OF ORE
Reflection on the preceding discussion of tracer and tag technology allows compilation of a‘specification list’ for tagging large volumes of ore:
1. It must be possible to tag all or almost all the particles in a given volume of ore, regardless ofparticle size. This may be all the ore in the bucket of a loader or shovel, in a haul truck, or on aconveyor belt.
2. Tagging must be relatively inexpensive, and uncomplicated.3. Ore particles must remain tagged at least until they enter the milling process. For example, we
might want to scan the ore on the belt feeding a SAG mill or crusher, and calculate thedistribution of ore types in the mill feed.
4. Detection of the tags must be possible from a distance, and, ideally, through a covering of oreparticles.
5. Detectors must function in typical mine/mill environments, being resistant to vibration, dust,shock, temperature variation, etc.
6. Tagging must not cause problems in the mill operations; for example, tags must not alter thesurface chemistry of ore particles in a way that will interfere with froth flotation.
7. The tags must be inexpensive and environmentally benign.
4
A review of available sensor technology indicated that chemical odor sensors may be suitable for thisapplication.
3. ODOR SENSOR TECHNOLOGY
Odor sensors are modeled after the human olfactory system. Human smell is quite sensitive: allylmercaptans are typically detected at a concentration of 0.05 ppb [Maruniak, et al., 1983]. It is also verydiscriminatory: skilled perfume chemists can recognize and distinguish 8,000 to 10,000 substances onthe basis of odor quality [Axel, 1995].
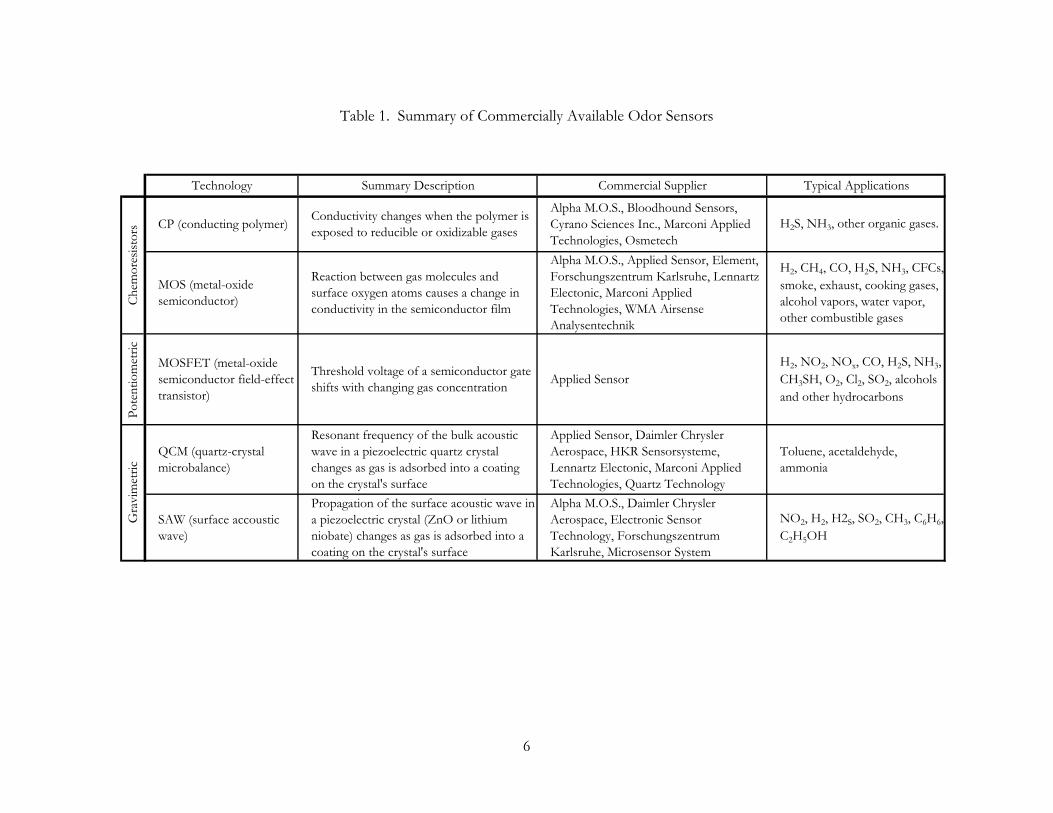
Odor sensors fall in the general category of chemosensors, which are devices that are capable ofconverting a chemical quantity into an electrical signal. In general, chemosensors function with achange in mass, or in the electrical, thermal, optical, or properties of a sensing material. Thedevelopment of chemical odor sensors began in the early 1980s [Vanneste and Geise, 2003], and hasprogressed rapidly. Commercially available sensors are described briefly in Table 1 [Nanto and Stetter,2003, and Vanneste and Geise, 2003]. Of the sensors listed in Table 1, the MOSFET type is the mostwidely used.
The sensors listed in Table 1 vary widely in size and price. Some are handheld units, with anapproximate cost of US$5,000 each. Others must be operated with a laptop or desktop computer, andmay cost as much as US$100,000. Much of the variation in cost is related to the pattern recognitionsoftware that is used by the sensor.
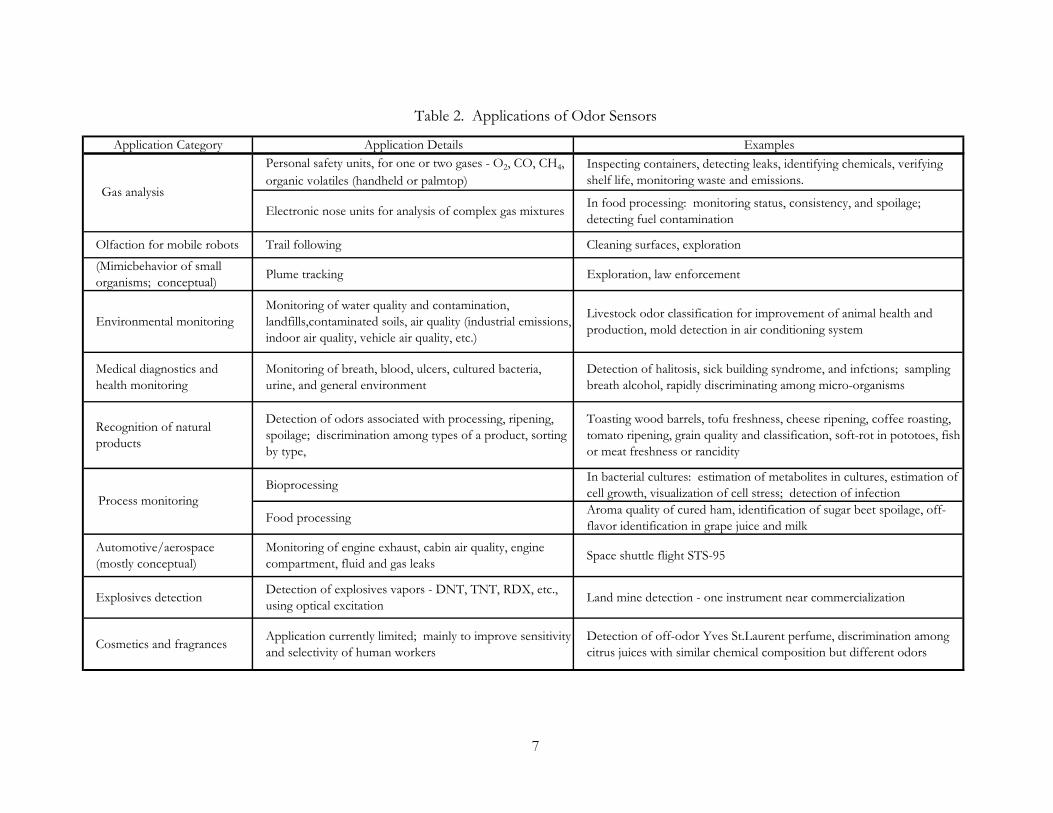
Odor sensors are used with several data-processing or pattern recognition techniques, including multi-layer perception, principal component analysis, fuzzy learning vector quantization, cluster analysis,Kohonen network, linear regression, feature weighting, least squares, discriminant function analysis,and fuzzy reasoning. Use of one or more of these techniques makes it possible for sensors to functionwith a kind of low-level intelligence, with which patterns and trends can be detected and indicated.These techniques are described in detail in the technical literature. Odor sensors are used in numerousapplications. Pearce, et al. [ibid.] identify the categories shown in Table 2.
In addition to the sensors listed in Table 1, several sensors based on changes in optical properties havebeen demonstrated in laboratory settings. There are also spectrographic (mass or infrared) systemsavailable commercially, for on-line or at-line analysis of gases. These systems are smaller and morerugged than comparable laboratory units. For detailed information on sensor technologies, the readeris referred to Pearce, et al. [2003].
4. ODOR SENSORS FOR MINING APPLICATIONS
To allow the tagging and tracking of ore types from mining through milling, several odorants would beselected. Each type of ore would be tagged with a different odorant at an appropriate and convenientplace in the mining process. Tagging would likely be done by spraying the ore with odorantcompounds. This could be done when the ore is being loaded from the blast pile, or as it is hauledpast a certain location. The spray tagging system could be interfaced with the mine modelling system,so tagging could be automated. The number of marker compounds used in a mine would depend onthe number of ore types present and the number of variables to be characterized.

5
During transport to the mill or stockpile, the ore would retain the odors of its markers. Mixtures ofore types will be detected as mixtures of odors. An array of “electronic noses” could be used to assessthe characteristics of that ore. The nose array would communicate with the mill control system,providing periodic updates on the nature of the ore coming into the mill. Nose arrays could beinstalled at more than one location in the mill, depending on need and application.
The marker compounds must have several key properties:
1. They must disperse widely over the ore when sprayed;2. They must be non-toxic to mine and mill personnel;3. They must be detectable above background odors in the mine and mill;4. They must remain on the ore for a certain period of time (determined by the flow of ore from
the mine through the mill);5. They must be detectable through a certain thickness of ore (perhaps the thickness on a
conveyor belt);6. Their presence must not interfere with downstream operations, like flotation and thickening;
and7. They must be inexpensive.
Further research and experience will certainly add to and modify the above list.
6
Table 1. Summary of Commercially Available Odor Sensors
Technology Summary Description Commercial Supplier Typical Applications
CP (conducting polymer) Conductivity changes when the polymer is exposed to reducible or oxidizable gases
Alpha M.O.S., Bloodhound Sensors, Cyrano Sciences Inc., Marconi Applied Technologies, Osmetech
H2S, NH3, other organic gases.
MOS (metal-oxide semiconductor)
Reaction between gas molecules and surface oxygen atoms causes a change in conductivity in the semiconductor film
Alpha M.O.S., Applied Sensor, Element, Forschungszentrum Karlsruhe, Lennartz Electonic, Marconi Applied Technologies, WMA Airsense Analysentechnik
H2, CH4, CO, H2S, NH3, CFCs, smoke, exhaust, cooking gases, alcohol vapors, water vapor, other combustible gases
Pote
ntio
met
ric
MOSFET (metal-oxide semiconductor field-effect transistor)
Threshold voltage of a semiconductor gate shifts with changing gas concentration Applied Sensor
H2, NO2, NOx, CO, H2S, NH3, CH3SH, O2, Cl2, SO2, alcohols and other hydrocarbons
QCM (quartz-crystal microbalance)
Resonant frequency of the bulk acoustic wave in a piezoelectric quartz crystal changes as gas is adsorbed into a coating on the crystal's surface
Applied Sensor, Daimler Chrysler Aerospace, HKR Sensorsysteme, Lennartz Electonic, Marconi Applied Technologies, Quartz Technology
Toluene, acetaldehyde, ammonia
SAW (surface accoustic wave)
Propagation of the surface acoustic wave in a piezoelectric crystal (ZnO or lithium niobate) changes as gas is adsorbed into a coating on the crystal's surface
Alpha M.O.S., Daimler Chrysler Aerospace, Electronic Sensor Technology, Forschungszentrum Karlsruhe, Microsensor System
NO2, H2, H2S, SO2, CH3, C6H6, C2H5OH
Chem
ores
istor
sG
ravi
met
ric
7
Table 2. Applications of Odor Sensors
Application Category Application Details ExamplesPersonal safety units, for one or two gases - O2, CO, CH4, organic volatiles (handheld or palmtop)
Inspecting containers, detecting leaks, identifying chemicals, verifying shelf life, monitoring waste and emissions.
Electronic nose units for analysis of complex gas mixtures In food processing: monitoring status, consistency, and spoilage; detecting fuel contamination
Olfaction for mobile robots Trail following Cleaning surfaces, exploration(Mimicbehavior of small organisms; conceptual) Plume tracking Exploration, law enforcement
Environmental monitoringMonitoring of water quality and contamination, landfills,contaminated soils, air quality (industrial emissions, indoor air quality, vehicle air quality, etc.)
Livestock odor classification for improvement of animal health and production, mold detection in air conditioning system
Medical diagnostics and health monitoring
Monitoring of breath, blood, ulcers, cultured bacteria, urine, and general environment
Detection of halitosis, sick building syndrome, and infctions; sampling breath alcohol, rapidly discriminating among micro-organisms
Recognition of natural products
Detection of odors associated with processing, ripening, spoilage; discrimination among types of a product, sorting by type,
Toasting wood barrels, tofu freshness, cheese ripening, coffee roasting, tomato ripening, grain quality and classification, soft-rot in pototoes, fish or meat freshness or rancidity
Bioprocessing In bacterial cultures: estimation of metabolites in cultures, estimation of cell growth, visualization of cell stress; detection of infection
Food processing Aroma quality of cured ham, identification of sugar beet spoilage, off-flavor identification in grape juice and milk
Automotive/aerospace (mostly conceptual)
Monitoring of engine exhaust, cabin air quality, engine compartment, fluid and gas leaks Space shuttle flight STS-95
Explosives detection Detection of explosives vapors - DNT, TNT, RDX, etc., using optical excitation Land mine detection - one instrument near commercialization
Cosmetics and fragrances Application currently limited; mainly to improve sensitivity and selectivity of human workers
Detection of off-odor Yves St.Laurent perfume, discrimination among citrus juices with similar chemical composition but different odors
Gas analysis
Process monitoring
8
PROJECT OBJECTIVES
The University of Utah has completed a project to investigate the properties of odor sensors andodorants, with the preceding application concept in mind. The objectives of the project were:
1. Locate commercially-available odor sensors and determine their characteristics;2. Locate detectable, sprayable compounds with properties that appear suitable for use in
marking ores;3. Purchase selected sensors and marker compounds;4. Perform lab tests on marker/sensor combinations, to determine sensitivity vs. time
functions;5. Perform lab tests on marked rock samples, to determine sensor response and ability to
discriminate odor combinations; and6. Perform bench-scale flotation tests on rock and ore pre-treated with selected marker
compounds.
METHODS
1. SENSOR SELECTION
A search of the technical literature and the internet indicated that several odor sensors arecommercially available, as shown above in Table 1. Two sensors from Table 1 were identifiedfor possible use in the project, the Cyranose 320, manufactured by Cyrano Sciences, Inc., andthe MOSES II, manufactured by Lennartz Electronic Gmbh.
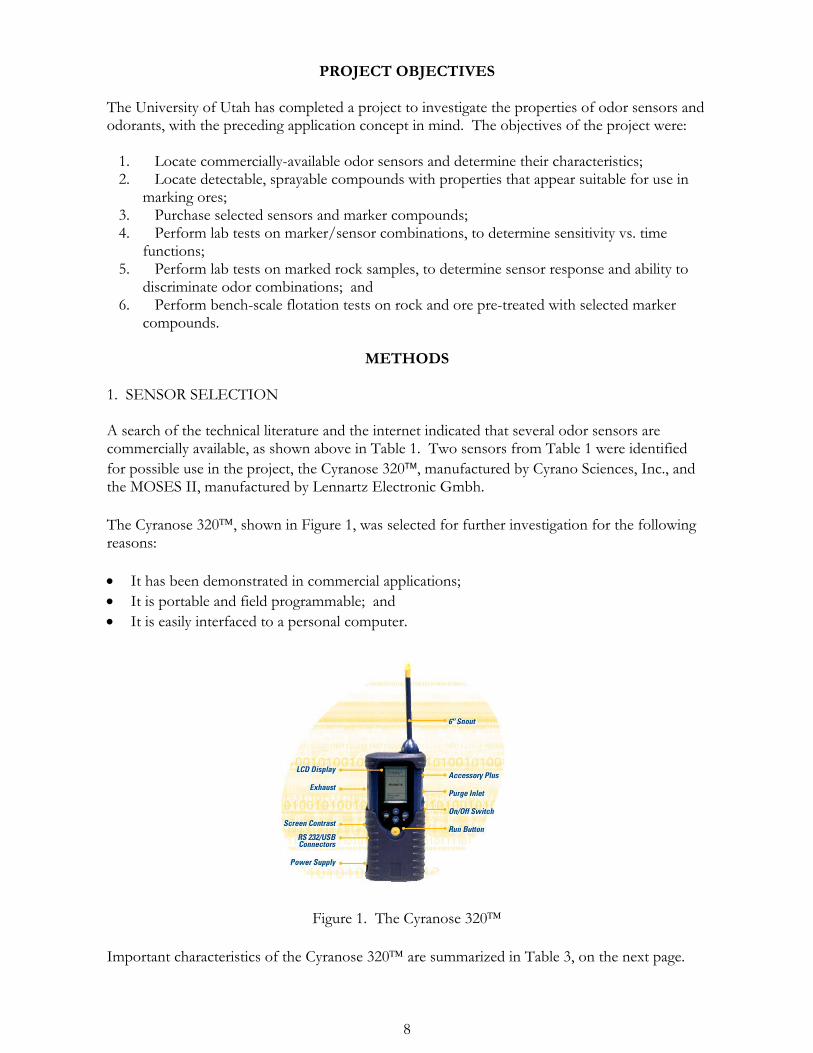
The Cyranose 320, shown in Figure 1, was selected for further investigation for the followingreasons:
• It has been demonstrated in commercial applications;• It is portable and field programmable; and• It is easily interfaced to a personal computer.
Figure 1. The Cyranose 320
Important characteristics of the Cyranose 320 are summarized in Table 3, on the next page.
9
Table 3. Important Characteristics of the Cyranose 320 Odor Sensor
Weight < 32 Ounces (0.91 kg)Sensors 32-channel polymer composite sensor arrayDisplay 320 × 200 graphic with LED backlightResponse Time 10 secondsField Calibration User selectableKeypads 5 buttons: Scroll Up, Scroll Down, Select, Cancel, RunCommunication RS-232 link, up to 57,600 bpsSampling Pump 50 – 180 cm3/minAlgorithms KNN, Kmeans, PCA, CDA
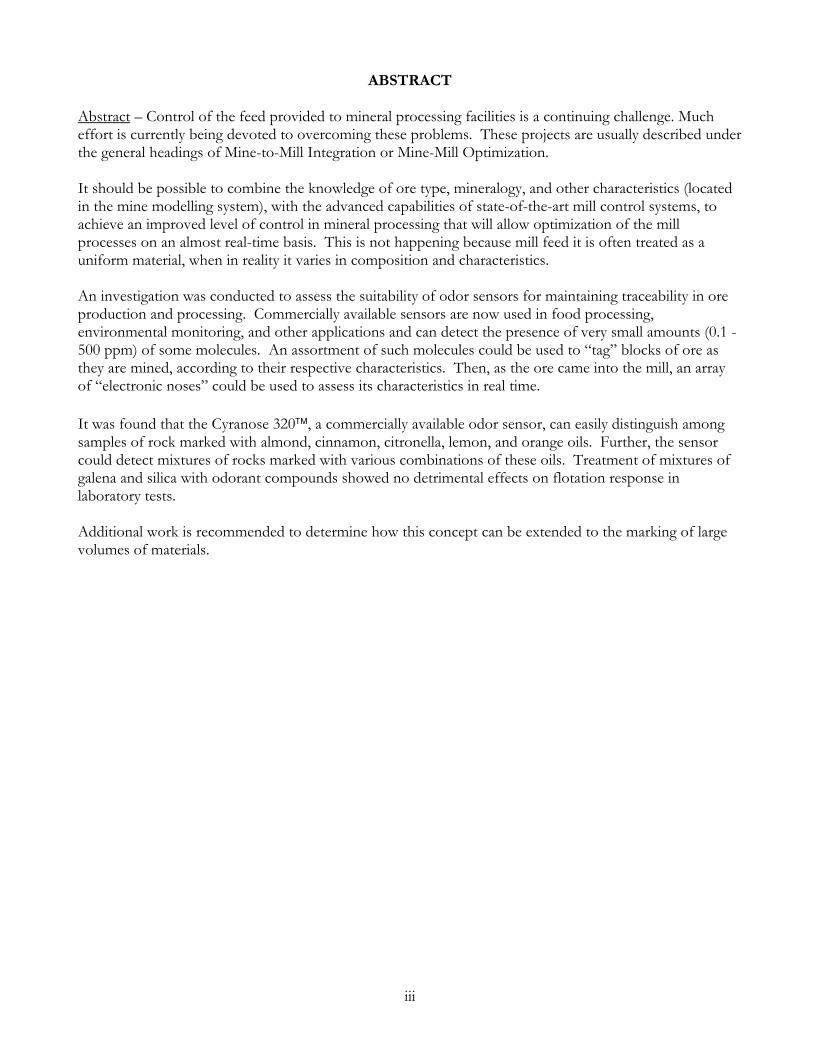
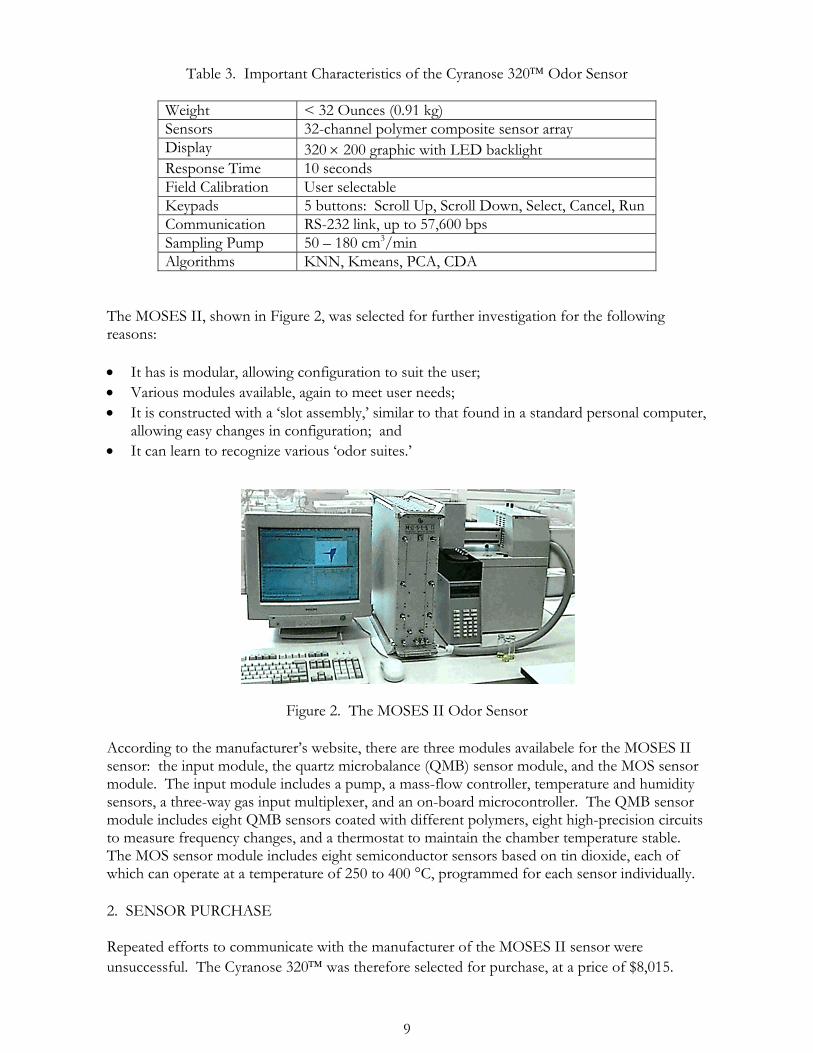
The MOSES II, shown in Figure 2, was selected for further investigation for the followingreasons:
• It has is modular, allowing configuration to suit the user;• Various modules available, again to meet user needs;• It is constructed with a ‘slot assembly,’ similar to that found in a standard personal computer,
allowing easy changes in configuration; and• It can learn to recognize various ‘odor suites.’
Figure 2. The MOSES II Odor Sensor
According to the manufacturer’s website, there are three modules availabele for the MOSES IIsensor: the input module, the quartz microbalance (QMB) sensor module, and the MOS sensormodule. The input module includes a pump, a mass-flow controller, temperature and humiditysensors, a three-way gas input multiplexer, and an on-board microcontroller. The QMB sensormodule includes eight QMB sensors coated with different polymers, eight high-precision circuitsto measure frequency changes, and a thermostat to maintain the chamber temperature stable.The MOS sensor module includes eight semiconductor sensors based on tin dioxide, each ofwhich can operate at a temperature of 250 to 400 °C, programmed for each sensor individually.
2. SENSOR PURCHASE
Repeated efforts to communicate with the manufacturer of the MOSES II sensor wereunsuccessful. The Cyranose 320 was therefore selected for purchase, at a price of $8,015.

10
3. SELECTION OF MARKER COMPOUNDS
The Cyranose 320 can detect and discriminate among many compounds, including volatilegases, vapors of aromatic oils. The Practical Guide to the Cyranose 320 (Anon., 2001c), is a user’sguide provided with the instrument. As examples, it describes the following applications of thesensor:
• Distinguishing between fresh and old basil;• Distinguishing among three liquid fragrances;• Distinguishing among phenyl ether, acetone, and phenol;• Detecting and distinguishing among contaminants in water: 1,000 ppm propionic acid and
1,000 ppm high molecular weight acid; and• Distinguishing among different types of pet food.
Thus it was clear that marker compounds could be selected from a wide range of chemicals. Forconvenience and safety in the planned laboratory tests, small amounts of aromatic oils werepurchased from a chemical supply house. Aromatic oils were chosen because they are relativelyinexpensive, they require no special storage and handling procedures, they clean up easily, andtheir odors are generally inoffensive to humans. The oils purchased included pine, orange,citronella, lemon, and almond. Later in the project, after it was determined that pine oil wasunsuitable for use with the Cyranose 320, cinnamon was purchased for use in subsequent tests.
4. SENSOR OPERATION AND INTERPRETATION
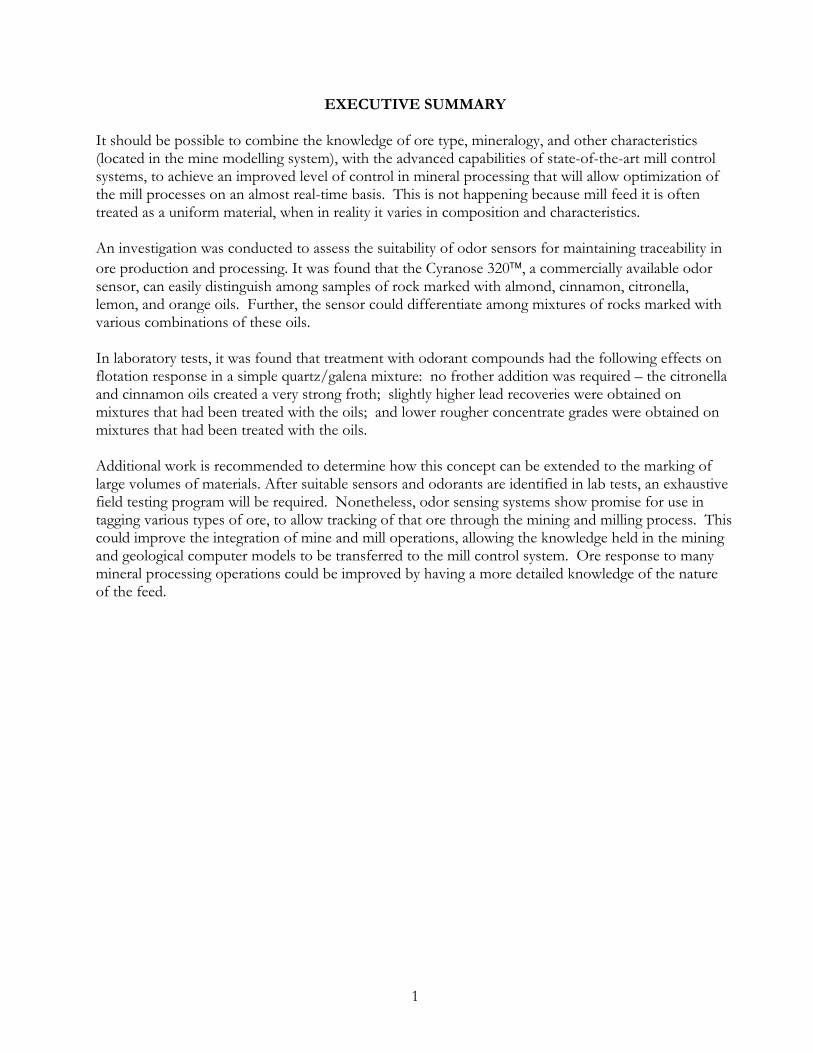
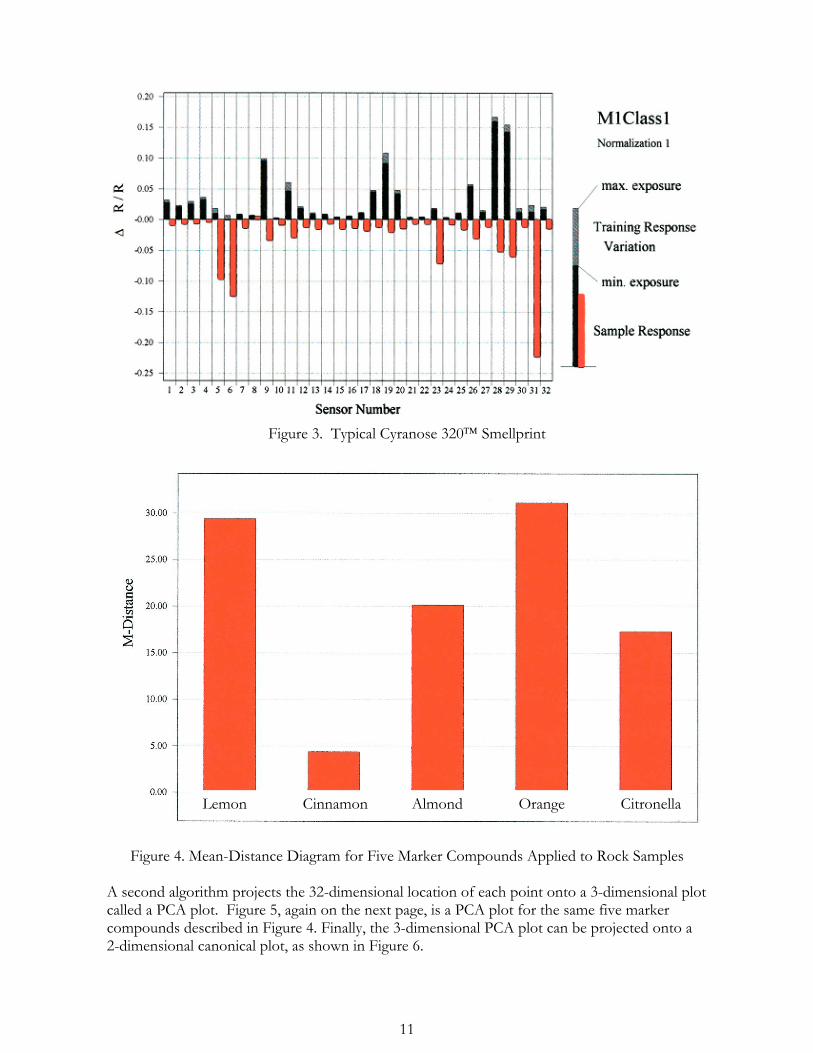
As noted above, the Cyranose 320 is based on a 32-channel array of composite polymersensors. Each sensor adsorbs a given odor to a greater or lesser degree, causing a change in itsresistance. The changes in resistance (∆R/R) of all 32 sensors comprise the ‘smellprint’ of agiven odor. The software provided with the Cyranose 320 uses four pattern-recognitionalgorithms to analyze these smellprints.
Smellprints are based on the instrument’s response to samples readings of the same odor. Thesesamples are called the training set. Before a sample is drawn, air is pumped through the samplechamber for purging. The sample is then drawn into the sample chamber, and the change inresistance of each sensor is recorded. The data are then transferred to a computer and analyzedusing the Cyranose 320 software. Each smellprint can be thought of as a point (with associatedvariance) in 32-dimensional space. A typical smellprint is shown in Figure 3. The black/graybars summarize a training set of 10 samples of citronella oil, and the red bars show the responseto a single sample of orange oil. The differences are clear.
The pattern-recognition software uses various algorithms to render this data into moreunderstandable forms. One algorithm calculates the Euclidean distances for the K-means foreach sample. A mean-distance diagram for five of the marker compounds is shown in Figure 4,on the next page. Note that this diagram could easily be used to distinguish cinnamon from theother compounds, but that the differences between orange and lemon, or almond and citronella,are less clear.
11
Figure 3. Typical Cyranose 320 Smellprint
Figure 4. Mean-Distance Diagram for Five Marker Compounds Applied to Rock Samples
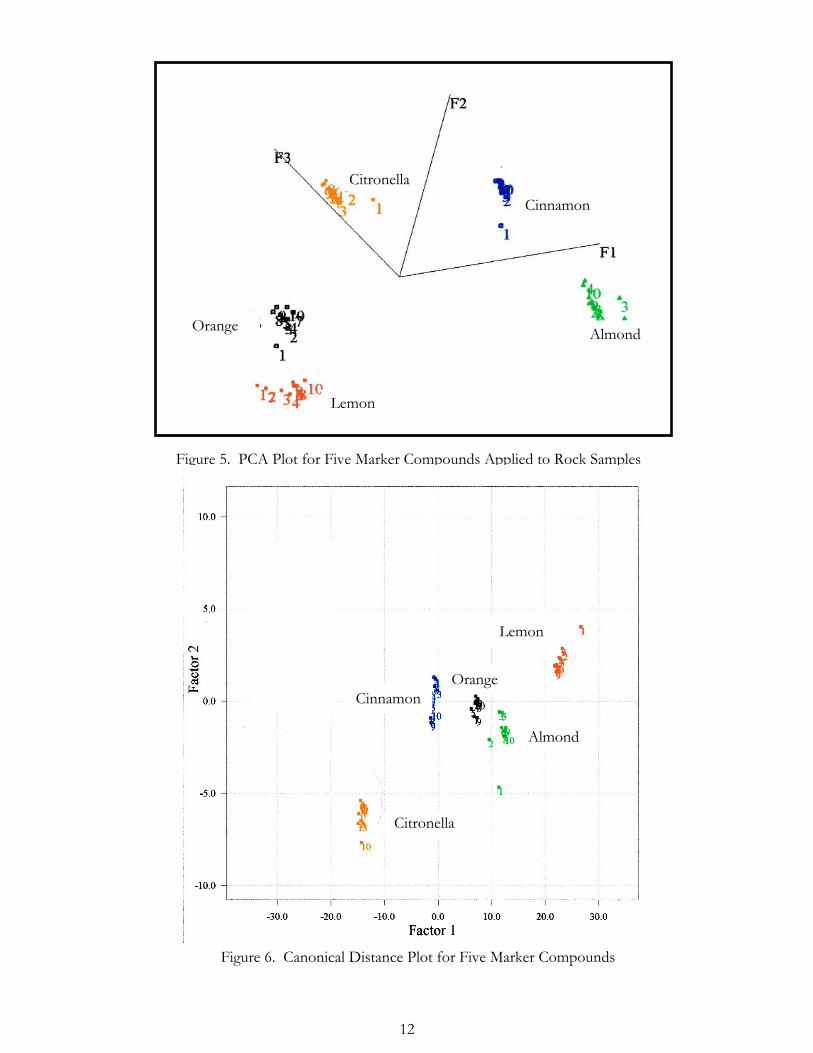
A second algorithm projects the 32-dimensional location of each point onto a 3-dimensional plotcalled a PCA plot. Figure 5, again on the next page, is a PCA plot for the same five markercompounds described in Figure 4. Finally, the 3-dimensional PCA plot can be projected onto a2-dimensional canonical plot, as shown in Figure 6.
Lemon Cinnamon Almond Orange Citronella
12
Figure 6. Canonical Plot for Five Marker Compounds
Orange
CinnamonCitronella
Orange
Lemon
Almond
Figure 5. PCA Plot for Five Marker Compounds Applied to Rock Samples
Lemon
Almond
Citronella
CinnamonOrange
Figure 6. Canonical Distance Plot for Five Marker Compounds
13
Note that the PCA and the canonical plot show all ten of the measurements in the training setfor each sample. Also note that in some of the samples, there are points that are not tightlygrouped in the cluster, for example, Point 1 in the magenta cluster. In some cases, theperformance of the instrument in discriminating among various odors can be improved bydeleting outlying measurements from the training set.
From Figures 3-6, it is clear that the various outputs of the Cyranose 320 can be used todiscriminate among aromatic oils. The instrument can store 5 groups of 10 training sets each.
There is also a function called ‘Identify’ in the sensor software. In the Identify function, a singlesample of an unknown is compared to the smellprints of all the training sets in a given group ormethod. If the smellprint of the unknown corresponds closely to that of one of the training sets,the instrument will display the name of that training set, along with a level of confidence for theidentification. The level of confidence is given by a number of stars, from one to five. Thequantitative meaning of these stars is not specified by the manufacturer
When the Cyranose 320 is connected to a computer, the accompanying software allowsmodification of almost all aspects of the instrument’s operation. Purging and sampling times canbe changed, parameters of the pattern recognition algorithms can be altered, etc.
LABORATORY TESTS
Laboratory tests were conducted to determine the following:
1. Longevity of marker compounds on rock samples;2. Experimental methods for assessing instrument response to various samples.3. Instrument response to marker compounds;4. Instrument response to marked rock samples (single marker compounds);5. Instrument response to mixtures of marked rock samples (various marker compounds); and6. Effect of marker compounds on the flotation response of rock samples.
None of the tests were exhaustive. Rather, they were designed as scoping tests, to determinewhether there were any significant difficulties in the concept of using odor sensor for orecontrol.
1. MARKER COMPOUND LONGEVITY
If odor sensors are to be used for ore control, it will be necessary for the marker compounds tobe detectable for a certain period of time, as determined by the mining and milling cycles at agiven site. However, compounds that can be detected by an odor sensor are by nature volatile,Thus each is expected to have a finite longevity when applied to ore or rock.
Further, it will be important to determine effective methods for applying marker compounds tolarge volumes of rock. Application by spraying is one method that might work will. To controlcosts, it may be desirable to dilute the marker compounds before they are applied.
This series of tests was designed to determine what longevities might be expected with differentcombinations of marker compound, diluted marker compound, and rock type, and whatmethods are suitable for applying marker compounds to rocks. The tests were designed forscoping, and were not intended to be exhaustive. Initially, it was intended to conduct these testsby applying marker compounds to rocks in different combinations, and then to record the
14
response of the Cyranose 320 to the marked rocks. However, there was an unexpected delayin the delivery of the Cyranose 320, and the test method was modified to maintain the projectschedule, with longevities of marker compounds on rocks being determined by weight.
Dilution of Marker Compounds: The marker compounds were all volatile oils. Two diluents weretested: a 5% solution of dishwashing liquid in water and full-strength rubbing alcohol. Mixturesof mixture of oil and diluent (1:1) were blended at at high speed for 5 minutes. The detergentsolution did not mix well with the oils, and large amounts of foam were generated in blending.Alcohol worked well as a diluent.
Future work will require a careful study of the costs of marker compounds, and how those costsmight be influenced by dilution. It will also be necessary to assess the effects of dilutioncompounds and methods on cost and subsequent process respsonse.
Longevity Tests: The following variables were tested:
1. Marker compound – almond, citronella, orange, and pine oil;2. Rock type – beryl, forsterite, serpentine, and wollastonite;3. Application methods – spray and dip; and4. Application strength – 50 and 100%.
The general test procedure was as follows:
1. Small rock samples were selected, and their weights were recorded. Rock samples were notwashed before testing, and some rock types had much more dust on their surfaces thanothers.
2. Marker compounds were applied to the rock samples, by dipping or spraying.2.1. Dipping procedure:
- Rock samples were held with tongs and dipped directly in marker compounds (fullstrength or diluted).
- Samples were held above the marker compound container until dripping of excessceased.
- Samples were placed in tared weighing boats.2.2. Spraying procedure:
- Selected marker compounds (full strength or diluted) were placed in standard plasticspray bottles.
- Rock samples were placed on paper towels, spaced to avoid overspray among samples.- Samples were sprayed.- Samples were placed in tared weighing boats.
3. Weights of the marked rock samples were recorded at times of 1, 3, 5, 10, 15, 20, 30, 60, 90,120, 150, 180, 240, 300, 360, and 420 minutes, or until there was no measurable change inweight.
These tests produced a large body of data, which is available on request. The followingconclusions were drawn:
1. Longevity of diluted marker compounds was less than that of full strength compounds.2. The amount of marker compound initially placed on a rock sample has a great influence on
the longevity of the marker compound on that sample.
15
3. Dipping places a much larger amount of marker compound on samples than spraying.Retention of diluted marker compounds decreased to about 50% after about 50 minutes, anddid not markedly decrease after 420 minutes; similarly, retention of full-strength markercompounds remained at or above 90% after 420 minutes.
4. The longevity of marker compounds applied by spraying is short – almost always less than 60minutes. Thus spraying is not a satisfactory method of applying marker compounds.
5. Larger amounts of marker compound were adsorbed on the surfaces of rock compoundsthat were coated with rock dust. This had a greater effect on the amount of marker adsorbedthan did the type of rock.
2. METHOD DEVELOPMENT
Accurate determination of instrument response to various samples required a consistent andcarefully-developed procedure. All the samples were liquids or solids coated with liquids. It wasthus necessary to contain the samples in a manner that allowed consistent sampling of a uniformheadspace above the sample. Similarly, it was necessary to use a consistent procedure to drawodor-bearing air from above the samples into the instrument. Finally, it was important to devisea procedure that minimized or eliminated cross-contamination in the sample aspiration path andthe sensor chamber.
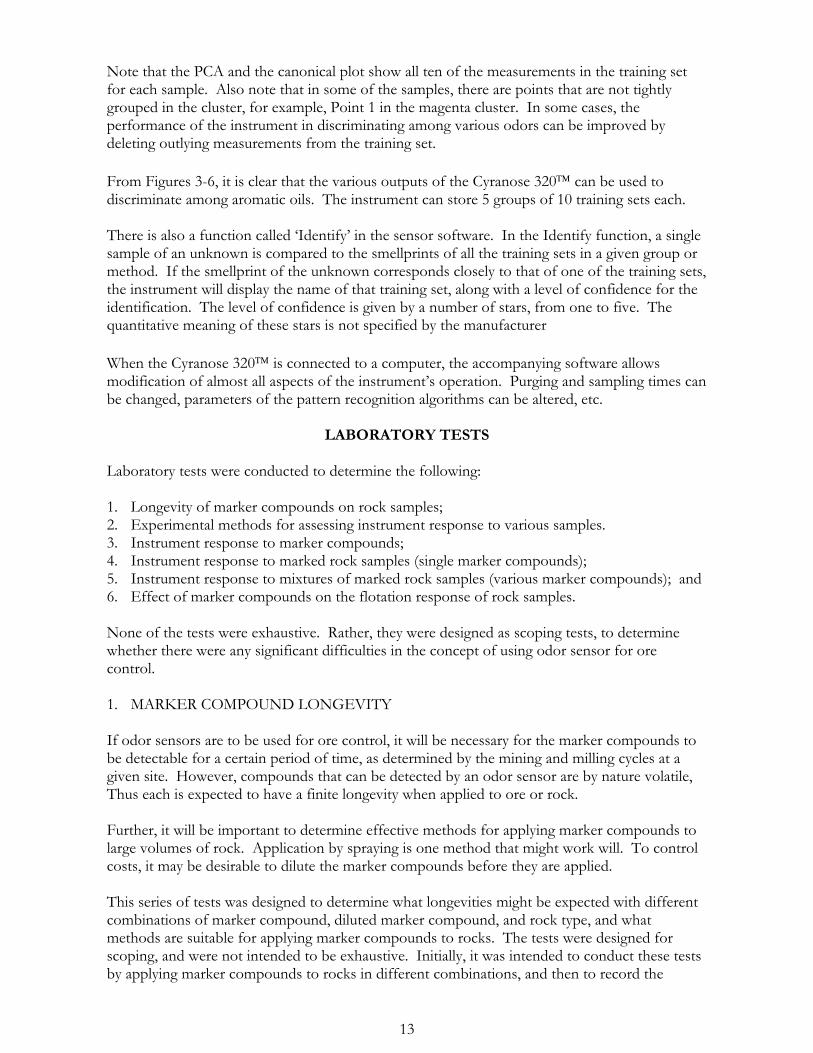
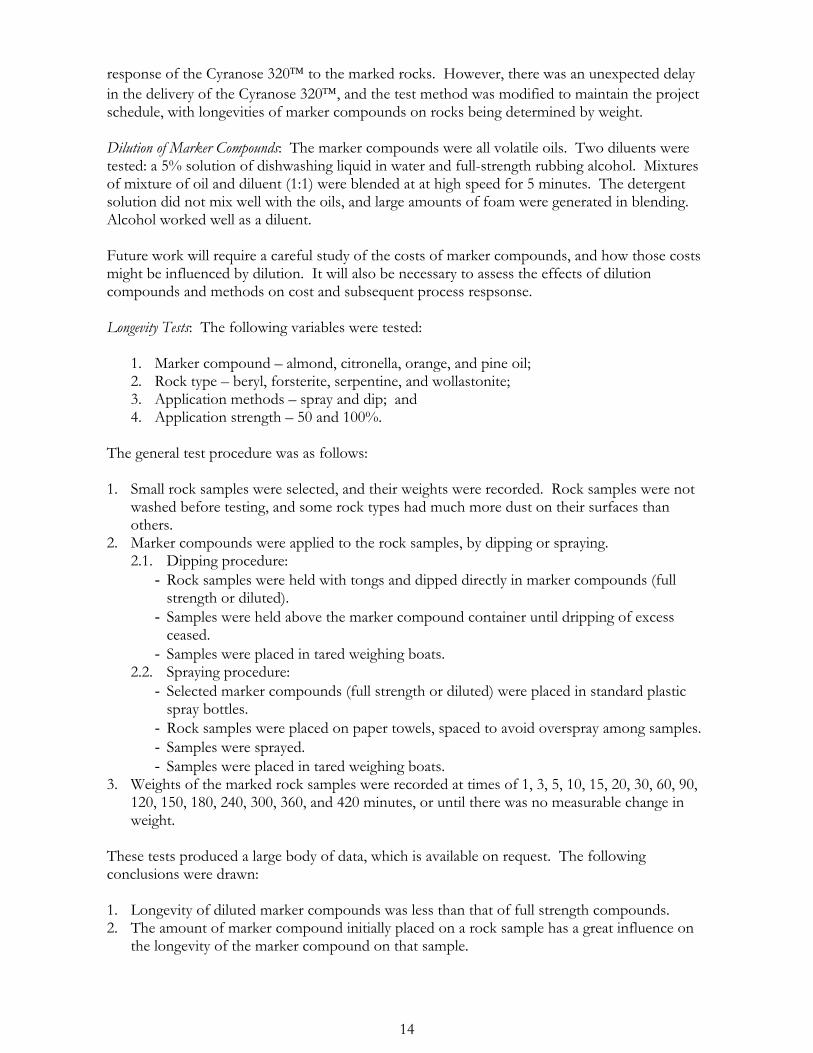
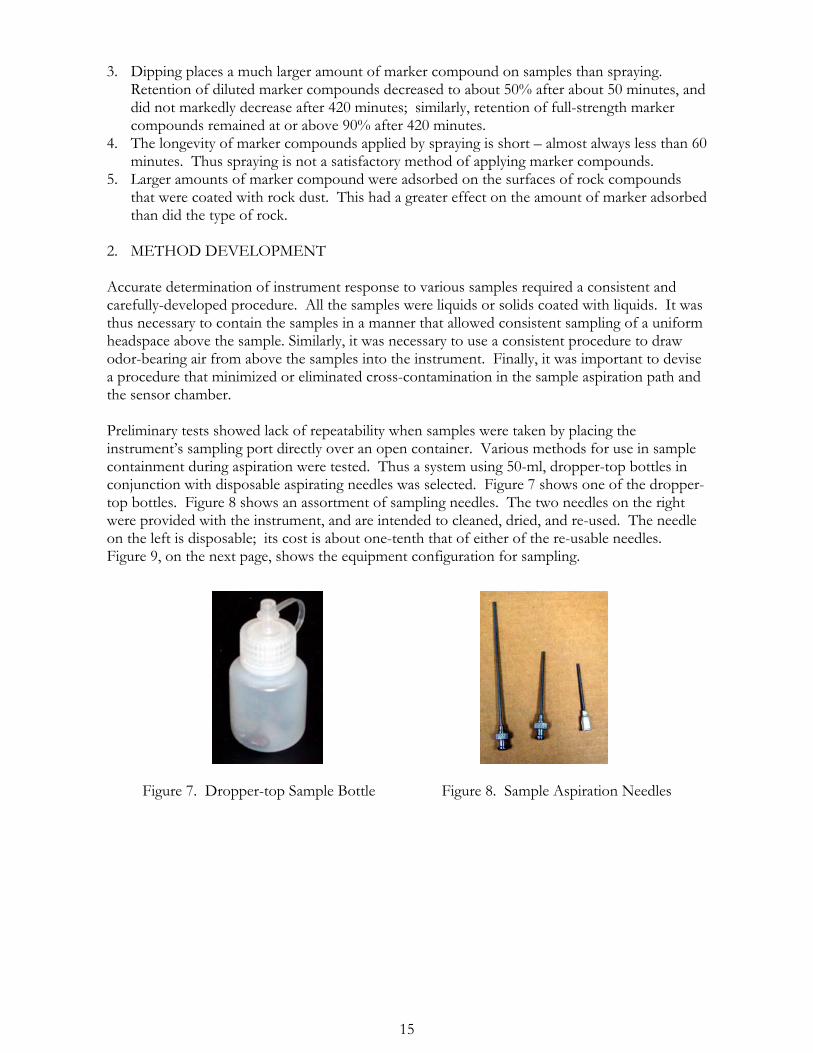
Preliminary tests showed lack of repeatability when samples were taken by placing theinstrument’s sampling port directly over an open container. Various methods for use in samplecontainment during aspiration were tested. Thus a system using 50-ml, dropper-top bottles inconjunction with disposable aspirating needles was selected. Figure 7 shows one of the dropper-top bottles. Figure 8 shows an assortment of sampling needles. The two needles on the rightwere provided with the instrument, and are intended to cleaned, dried, and re-used. The needleon the left is disposable; its cost is about one-tenth that of either of the re-usable needles.Figure 9, on the next page, shows the equipment configuration for sampling.
Figure 7. Dropper-top Sample Bottle Figure 8. Sample Aspiration Needles
16
Figure 9. Equipment Configuration for Sampling
Additional effort was required to arrive at correct settings for the sampling parameters. It wasfound that accurate sampling of the aromatic oils selected as marker compounds required purgetimes between samples that were longer than the default settings. It was also found that the odorof pine oil was so strong that it ‘overpowered’ the instrument, making discrimination amongother compounds impossible. Apparently the compounds associated with the odor of pine oil
17
had a long residence time on the sensor array, effectively deadening its response to weaker odors.Thus after the initial tests, pine oil was not used.
3. INSTRUMENT RESPONSE TO MARKER COMPOUNDS
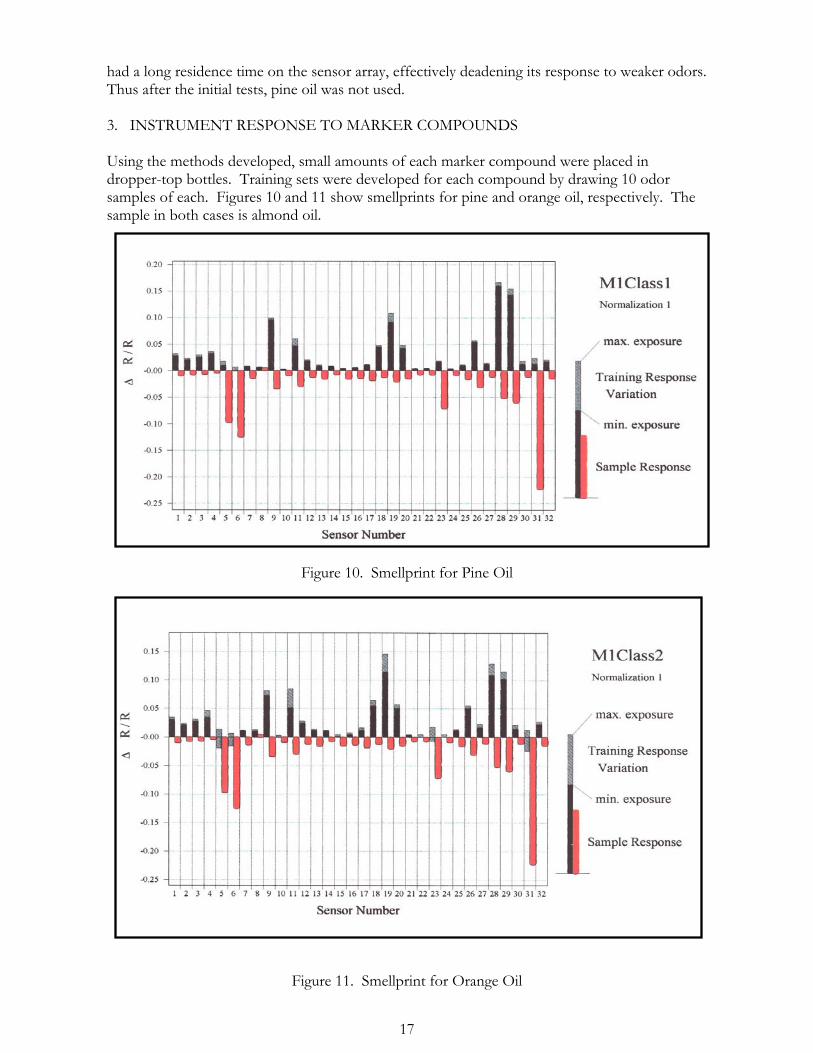
Using the methods developed, small amounts of each marker compound were placed indropper-top bottles. Training sets were developed for each compound by drawing 10 odorsamples of each. Figures 10 and 11 show smellprints for pine and orange oil, respectively. Thesample in both cases is almond oil.
Figure 10. Smellprint for Pine Oil
Figure 11. Smellprint for Orange Oil
18
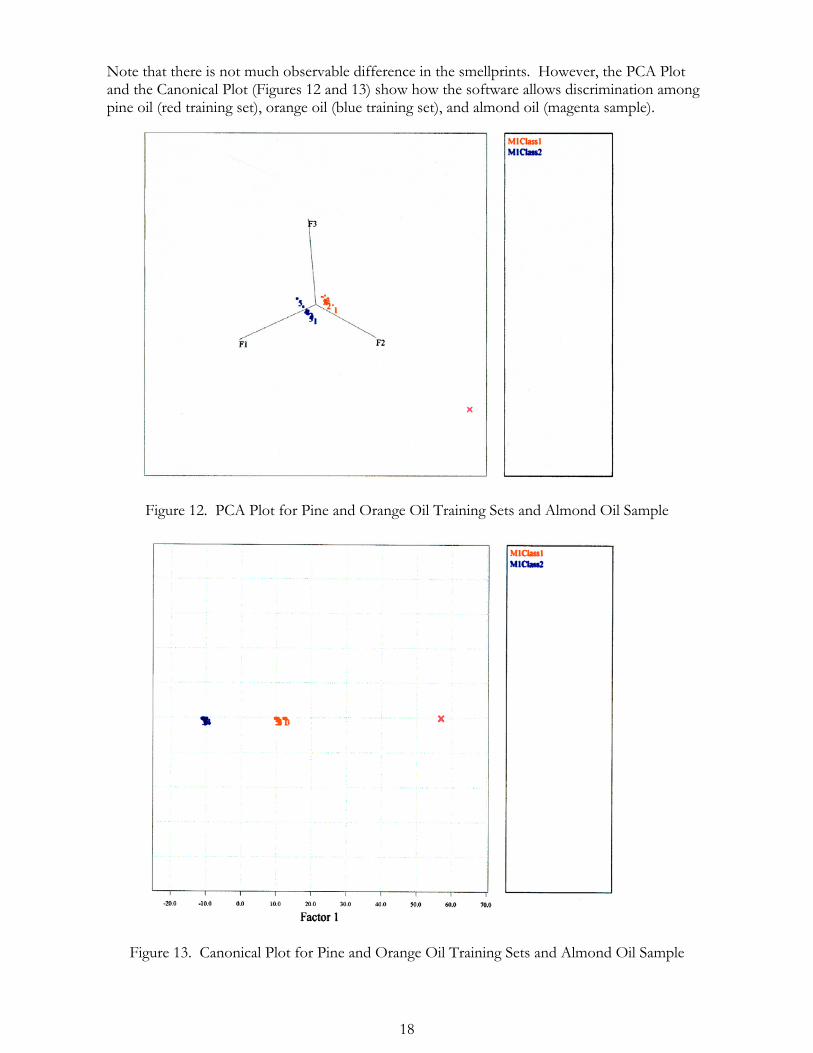
Note that there is not much observable difference in the smellprints. However, the PCA Plotand the Canonical Plot (Figures 12 and 13) show how the software allows discrimination amongpine oil (red training set), orange oil (blue training set), and almond oil (magenta sample).
Figure 12. PCA Plot for Pine and Orange Oil Training Sets and Almond Oil Sample
Figure 13. Canonical Plot for Pine and Orange Oil Training Sets and Almond Oil Sample
19
The PCA and Canonical plots show clear differences among all the marker compounds. Usingthe built-in ‘Identify’ algorithm, the instrument could readily distinguish among the five markercompounds, (almond, citronella, lemon, orange, and pine oils), tested in this portion of theproject. The performance of the ‘Identify’ algorithm consistently identified marker compoundswith a 5-star confidence.
It was thus concluded that the output of the Cyranose 320, when correctly analyzed, could beused to distinguish among the odors of almond, citronella, lemon, orange, and pine oils. The‘Identify’ algorithm reliably identified all of these compounds.
4. INSTRUMENT RESPONSE TO MARKED ROCK SAMPLES(SINGLE MARKER COMPOUNDS)
Sample rocks for these tests were selected from a bag of aquarium gravel, with particle size ofapproximately 1 centimeter. This gravel appeared to be mostly sandstone and limestone.Sample rocks for testing were chosen to be close to the same size. Using the methodsdeveloped, each rock was dipped in the selected marker compound. Six rocks were marked witheach compound, and placed in dropper-top bottles. Training sets were developed for eachcompound by drawing 10 odor samples of each. It was at this point that the use of pine oil wasdiscontinued, and cinnamon oil was used instead.
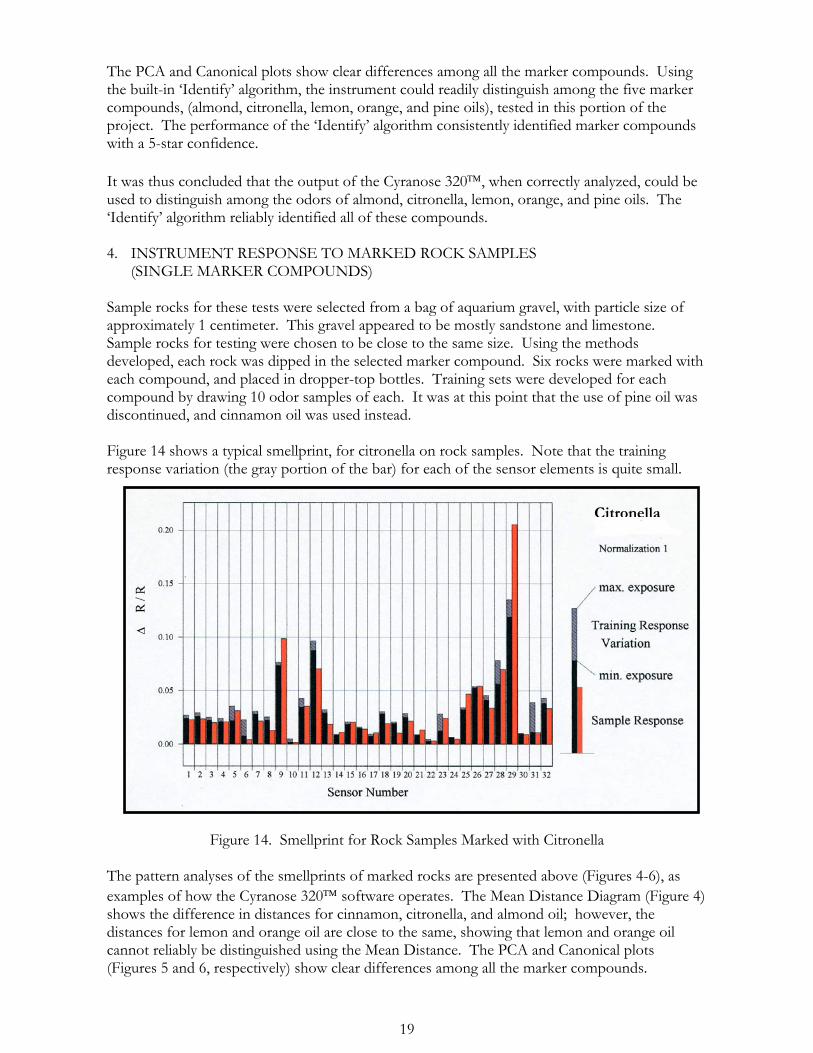
Figure 14 shows a typical smellprint, for citronella on rock samples. Note that the trainingresponse variation (the gray portion of the bar) for each of the sensor elements is quite small.
Figure 14. Smellprint for Rock Samples Marked with Citronella
The pattern analyses of the smellprints of marked rocks are presented above (Figures 4-6), asexamples of how the Cyranose 320 software operates. The Mean Distance Diagram (Figure 4)shows the difference in distances for cinnamon, citronella, and almond oil; however, thedistances for lemon and orange oil are close to the same, showing that lemon and orange oilcannot reliably be distinguished using the Mean Distance. The PCA and Canonical plots(Figures 5 and 6, respectively) show clear differences among all the marker compounds.
Citronella
20
It was thus concluded that the output of the Cyranose 320 could be used to distinguish amongthe odors of almond, cinnamon, citronella, lemon, and orange oils. Again in this series of tests,the ‘Identify’ algorithm worked reliably, identifying the marker compounds on the rock samples.
5. INSTRUMENT RESPONSE TO MIXTURES OF MARKED ROCK SAMPLES(VARIOUS MARKER COMPOUNDS)
The same gravel was used in this test series as in the previous set. Groups of eight rocks weredipped in one of the marker compounds and placed in a dipper-top bottle. Training sets weredeveloped for each compound by drawing 10 odor samples of each.
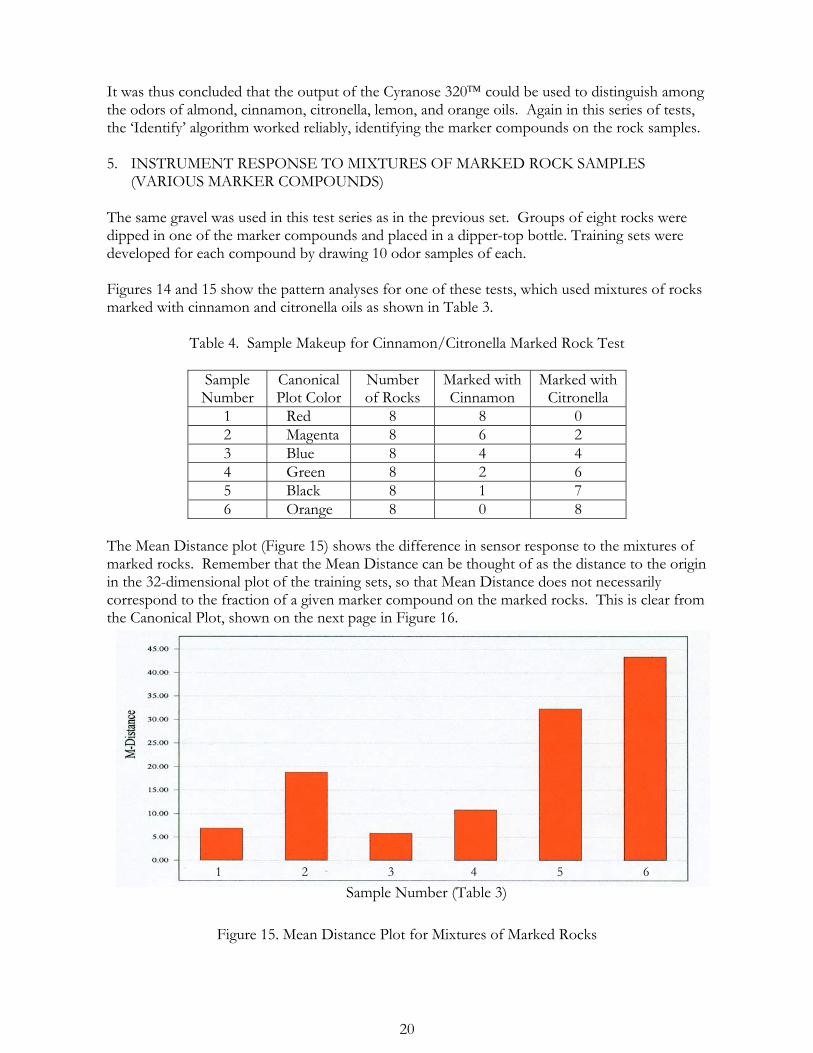
Figures 14 and 15 show the pattern analyses for one of these tests, which used mixtures of rocksmarked with cinnamon and citronella oils as shown in Table 3.
Table 4. Sample Makeup for Cinnamon/Citronella Marked Rock Test
SampleNumber
CanonicalPlot Color
Numberof Rocks
Marked withCinnamon
Marked withCitronella
1 Red 8 8 02 Magenta 8 6 23 Blue 8 4 44 Green 8 2 65 Black 8 1 76 Orange 8 0 8
The Mean Distance plot (Figure 15) shows the difference in sensor response to the mixtures ofmarked rocks. Remember that the Mean Distance can be thought of as the distance to the originin the 32-dimensional plot of the training sets, so that Mean Distance does not necessarilycorrespond to the fraction of a given marker compound on the marked rocks. This is clear fromthe Canonical Plot, shown on the next page in Figure 16.
Figure 15. Mean Distance Plot for Mixtures of Marked Rocks
1 2 3 4 5 6Sample Number (Table 3)
21
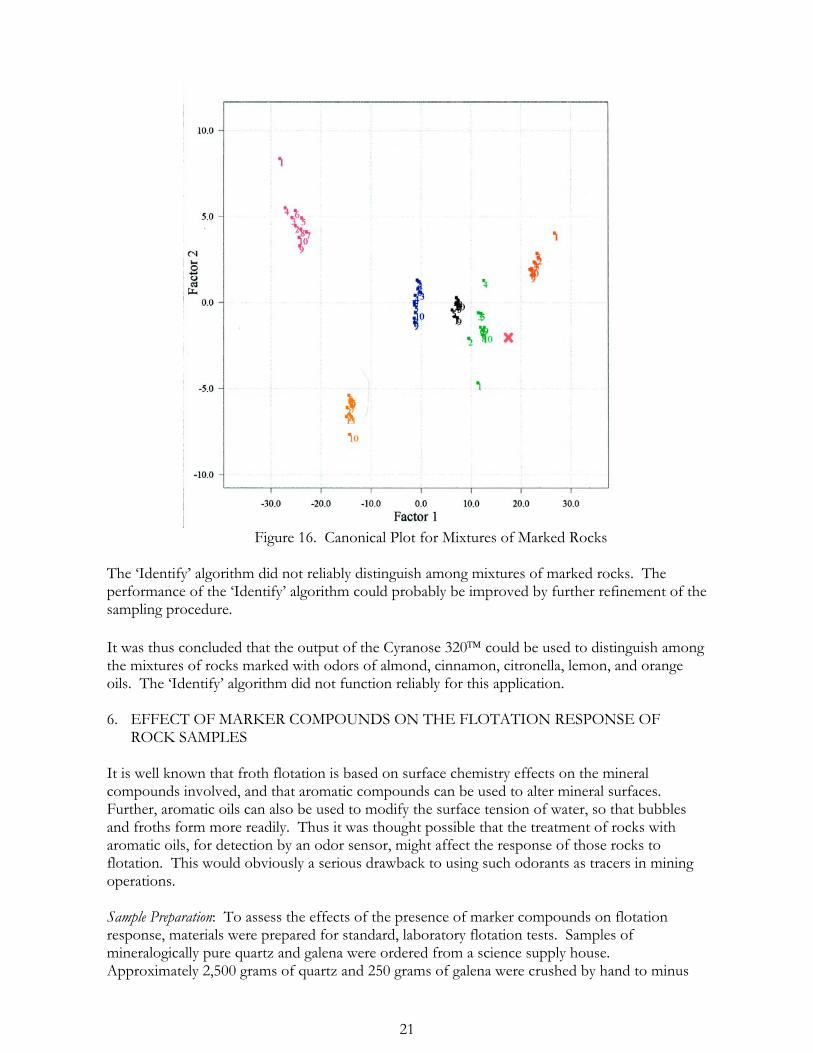
Figure 16. Canonical Plot for Mixtures of Marked Rocks
The ‘Identify’ algorithm did not reliably distinguish among mixtures of marked rocks. Theperformance of the ‘Identify’ algorithm could probably be improved by further refinement of thesampling procedure.
It was thus concluded that the output of the Cyranose 320 could be used to distinguish amongthe mixtures of rocks marked with odors of almond, cinnamon, citronella, lemon, and orangeoils. The ‘Identify’ algorithm did not function reliably for this application.
6. EFFECT OF MARKER COMPOUNDS ON THE FLOTATION RESPONSE OFROCK SAMPLES
It is well known that froth flotation is based on surface chemistry effects on the mineralcompounds involved, and that aromatic compounds can be used to alter mineral surfaces.Further, aromatic oils can also be used to modify the surface tension of water, so that bubblesand froths form more readily. Thus it was thought possible that the treatment of rocks witharomatic oils, for detection by an odor sensor, might affect the response of those rocks toflotation. This would obviously a serious drawback to using such odorants as tracers in miningoperations.
Sample Preparation: To assess the effects of the presence of marker compounds on flotationresponse, materials were prepared for standard, laboratory flotation tests. Samples ofmineralogically pure quartz and galena were ordered from a science supply house.Approximately 2,500 grams of quartz and 250 grams of galena were crushed by hand to minus
22
1.5 cm. The crushed minerals were separated into three lots each, and prepared as shown inTable 5 below.
Table 5. Sample Lots Prepared for Flotation Testing
Lot Weight, grams Treatment1-Galena 60 None2-Galena 60 Dipped in Citronella Oil3-Galena 60 Dipped in Cinnamon Oil1-Quartz 250 None2-Quartz 250 Dipped in Citronella Oil3-Quartz 250 Dipped in Cinnamon Oil
The samples were delivered to Dawson Metallurgical Laboratories in Salt Lake City for flotationtesting. Each sample was lightly pulverized to approximately minus 10 mesh in a ring-and-puckpulverizer with the ring removed. Pilot grinding tests on 200 grams of quartz were conducted inour rod mill to determine the time required to produce a 106-micron, P80 product size.
The back-calculated head assays for the laboratory flotation tests on mixtures containing 10% byweight galena varied from 7.58 to 8.50% Pb. The mean back-calculated head assay for the nine(9) tests was 8.03% Pb.
Flotation Tests: Twenty grams of galena were mixed with 200 grams of quartz and the mixturewas ground in a rod mill, at 42% solids, to approximately 80% passing 106 microns. The threemixtures described in Table 5 were used in triplicate tests for a total of nine tests.
The ground sample was placed in a 500-gram, Agitair, laboratory flotation machine and adjustedto approximately 18% solids. Cytec 3418A aerophine lead collector was added to the pulp at adosage of 5 grams per metric ton of solids and the pulp was conditioned for 5 minutes. The airwas subsequently introduced into the flotation machine and a rougher froth product wascollected for four 4 minutes. MIBC frother was added to the tests on the control sample thatcontained no oil.
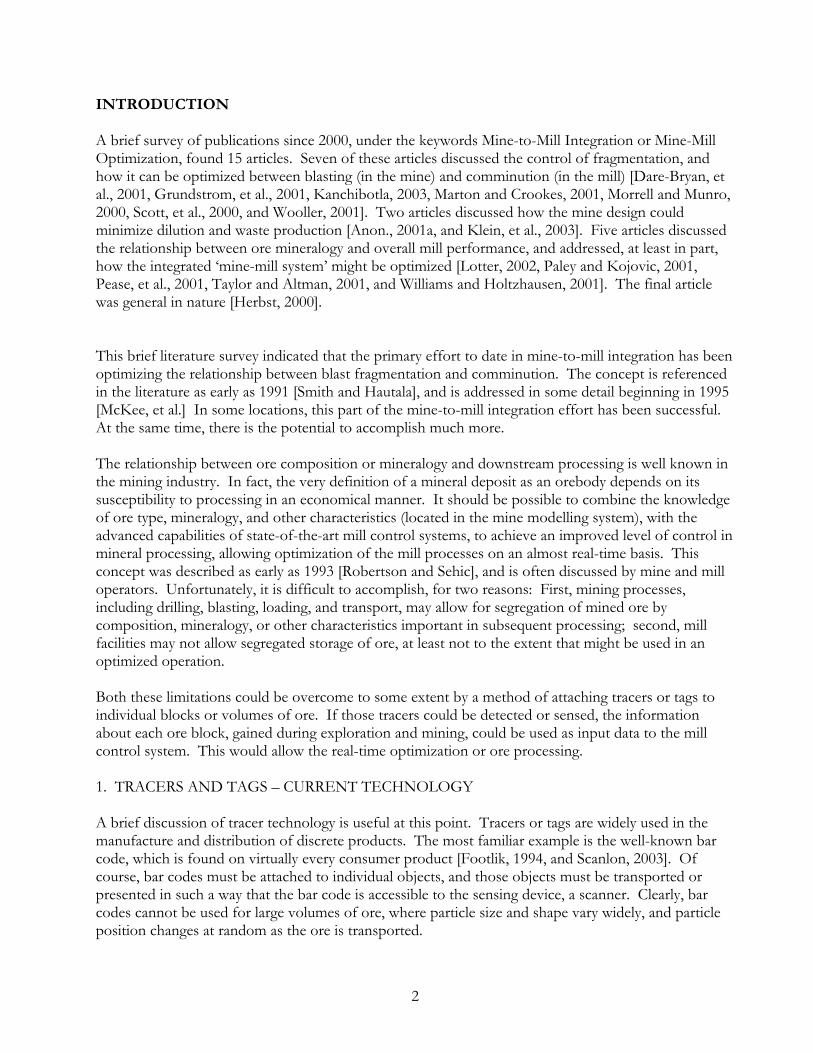
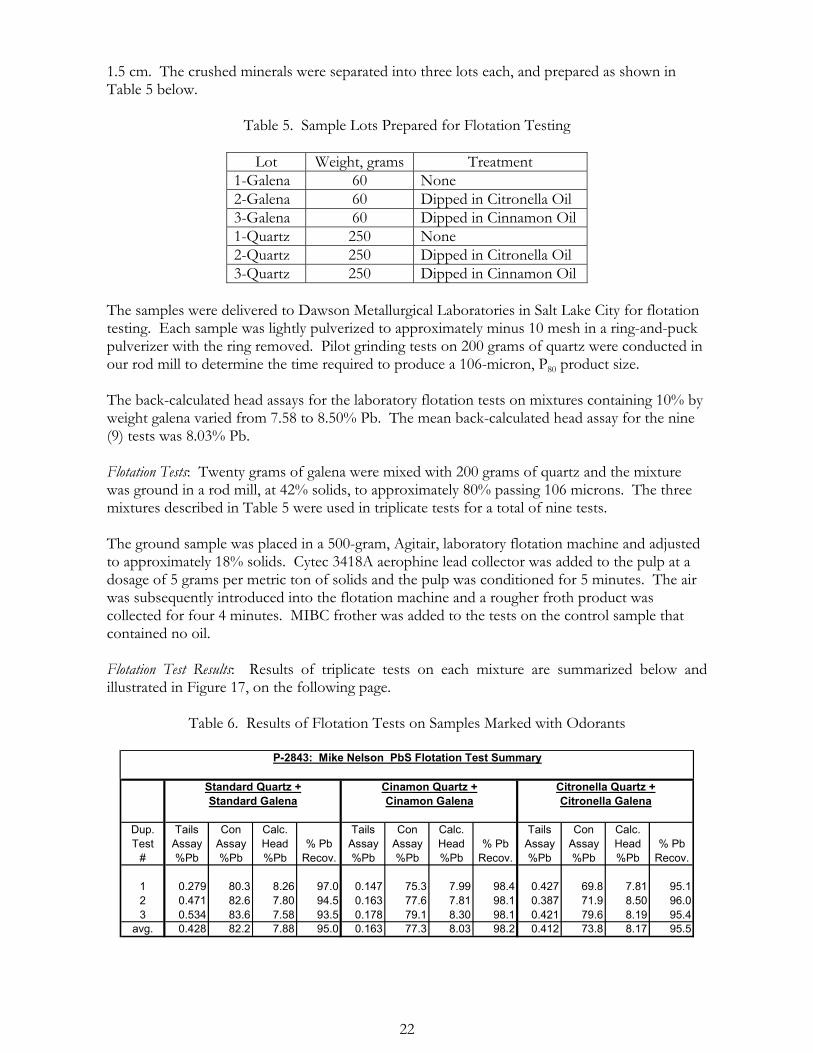
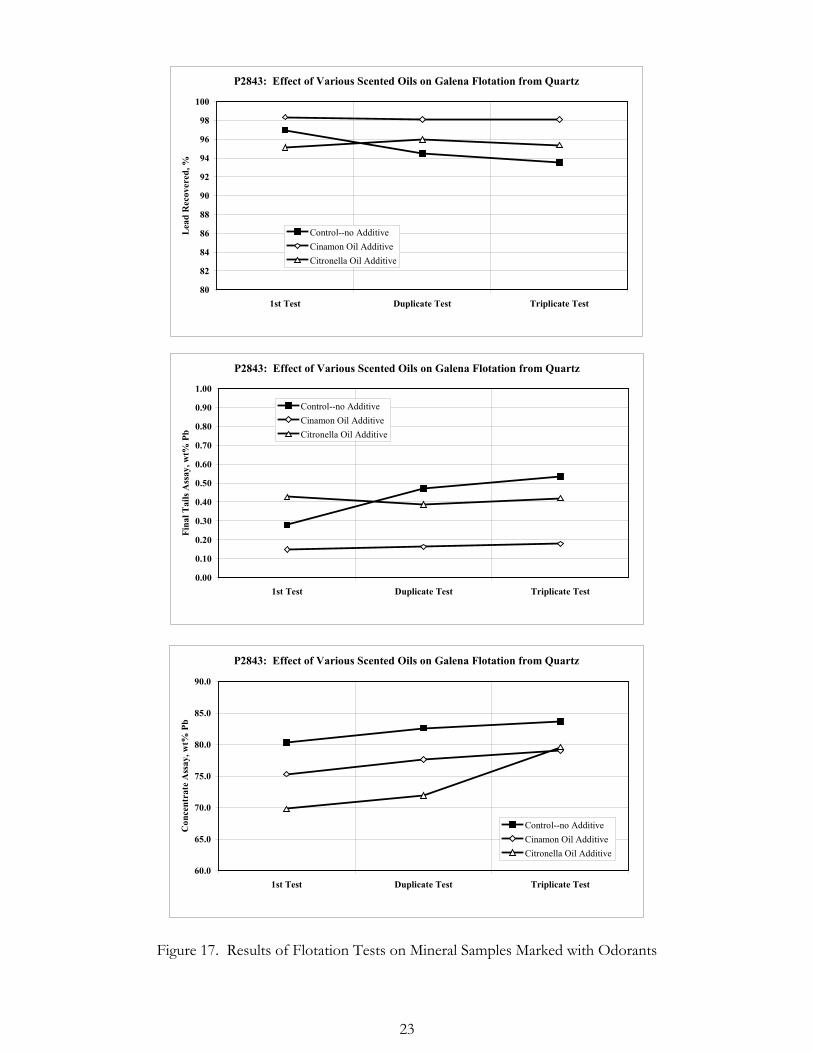
Flotation Test Results: Results of triplicate tests on each mixture are summarized below andillustrated in Figure 17, on the following page.
Table 6. Results of Flotation Tests on Samples Marked with Odorants
Dup. Tails Con Calc. Tails Con Calc. Tails Con Calc.Test Assay Assay Head % Pb Assay Assay Head % Pb Assay Assay Head % Pb
# %Pb %Pb %Pb Recov. %Pb %Pb %Pb Recov. %Pb %Pb %Pb Recov.
1 0.279 80.3 8.26 97.0 0.147 75.3 7.99 98.4 0.427 69.8 7.81 95.12 0.471 82.6 7.80 94.5 0.163 77.6 7.81 98.1 0.387 71.9 8.50 96.03 0.534 83.6 7.58 93.5 0.178 79.1 8.30 98.1 0.421 79.6 8.19 95.4
avg. 0.428 82.2 7.88 95.0 0.163 77.3 8.03 98.2 0.412 73.8 8.17 95.5
Citronella Quartz +Citronella Galena
P-2843: Mike Nelson PbS Flotation Test Summary
Standard Quartz +Standard Galena
Cinamon Quartz +Cinamon Galena
23
P2843: Effect of Various Scented Oils on Galena Flotation from Quartz
80
82
84
86
88
90
92
94
96
98
100
1st Test Duplicate Test Triplicate Test
Lea
d R
ecov
ered
, %
Control--no AdditiveCinamon Oil AdditiveCitronella Oil Additive
P2843: Effect of Various Scented Oils on Galena Flotation from Quartz
0.00
0.10
0.20
0.30
0.40
0.50
0.60
0.70
0.80
0.90
1.00
1st Test Duplicate Test Triplicate Test
Fina
l Tai
ls A
ssay
, wt%
Pb
Control--no AdditiveCinamon Oil AdditiveCitronella Oil Additive
P2843: Effect of Various Scented Oils on Galena Flotation from Quartz
60.0
65.0
70.0
75.0
80.0
85.0
90.0
1st Test Duplicate Test Triplicate Test
Con
cent
rate
Ass
ay, w
t% P
b
Control--no AdditiveCinamon Oil AdditiveCitronella Oil Additive
Figure 17. Results of Flotation Tests on Mineral Samples Marked with Odorants
24
Slightly higher lead recoveries and lower rougher concentrate grades were obtained on mixturesthat contained oil, compared with the tests on mixtures with no oil. This may be due to the factthat a more voluminous froth was observed during flotation of the mixtures that contained oilcompared to tests on mixtures with no oil. Frother was not required in tests on the oiledsamples.
It should be noted that these preliminary tests were performed as rougher tests. The increasedamounts of quartz that floated from the oiled samples may be rejected if the rougherconcentrates were subjected to cleaning. Additional testing would be required to evaluate this.
CONCLUSIONS
Investigation of odor sensing systems for mining and milling applications is just beginning, andmany questions remain to be answered. After suitable sensors and odorants are identified in labtests, an exhaustive field testing program will be required. Nonetheless, odor sensing systemsshow promise for use in tagging various types of ore, to allow tracking of that ore through themining and milling process. This could improve the integration of mine and mill operations,allowing the knowledge held in the mining and geological computer models to be transferred tothe mill control system. Ore response to many mineral processing operations could be improvedby having a more detailed knowledge of the nature of the feed.
The present study was a preliminary examination of the potential for the use of odor sensors indistinguishing among mixtures of rock marked with various odorant compounds. The followingspecific conclusions were reached:
1. The longevity of marker compounds on rock samples (volatile oils) depends on oil dilution,application method, and rock type.
2. In application, markers will have to be carefully tested for use.3. Application with an atomizing sprayer is not a good method for applying volatile oils to rock
samples.4. Dipping is a good method for applying volatile oils to rock samples. However, it will likely
be unsuitable for large-scale application.5. Further work is required to develop a good method for large-scale application.6. The Cyranose 320 can easily distinguish among pine, orange, almond, lemon, citronella,
and cinnamon oils. The different samples could be distinguished with a PCA Plot, aCanonical Plot, or using the instrument’s ‘Identify’ algrorithm.
7. Because of its strong odor, pine oil is difficult to use with the Cyranose 320, requiring longpurge times after sampling. It is not recommended for future work.
8. The Cyranose 320 has a good response to fresh cinnamon oil. However, cinnamon oilforms a crust when exposed to air, which decreases the response of the Cyranose 320.
9. The Cyranose 320 can also distinguish among rocks that have been marked with variousoils and then mixed in various proportions. This identification must be done by examinationof a PCA Plot or a Canonical Plot. In the ‘Identify’ mode, the Cyranose 320 cannotidentify the composition of mixed rock samples.
10. Further work is required to determine proper instrument configuration for identification ofmixed rock samples.
11. Treatment with odorant compounds (citronella and cinnamon oils) had the following effectson flotation response in a simple quartz/galena mixture:a. No frother addition was required – the citronella and cinnamon oils created a very strong
froth.
25
b. Slightly higher lead recoveries were obtained on mixtures that had been treated with theoils.
c. Lower rougher concentrate grades were obtained on mixtures that had been treated withthe oils.
12. The effects of odorant treatment on flotation response are unlikely to have a significantdetrimental effect on the processing of ores marked with odorant compounds.
REFERENCES
Anon., 2001a. Ore dilution versus mine to mill optimisation at KCGM. AusIMM Bulletin, no. 6,Nov./Dec., p. 31.
Anon., 2001b. RF tags pinpoint vehicle locations for Ford. Modern Materials Handling, v. 56, no.12, p. 70.
Anon., 2001c. The Practical Guide to the Cyranose 320, Part number 02-40152, Revision C, CyranoSciences, Inc., Pasadena, California, 72 pp.
Axel, R., 1995. The molecular logic of smell, Scientific American, v. 273, pp. 154-159.
Cheong, H.-F., 1993. Correlation statistics of sediment motion and its dispersion. Journal ofHydraulic Research, v. 31, no. 4, pp. 495-505.
Dare-Bryan, P., L. Wade, and M. Randall, 2001. Computer modelling of bench blasting forgrade control. Proceedings of the 27th Annual Conference on Explosives and Blasting Technique, Volume II,Jan. 28-31 2001, Orlando, Florida, International Society of Explosives Engineers, pp. 13-24.
Footlik, I.M., 1994. History of the materials handling industry by one of its founders. AmericanSociety of Mechanical Engineers, Material Handling Division, MHDThe Materials HandlingEngineering Division 75th Anniversary, Proceedings of the 1994 International Mechanical Engineering Congressand Exposition, Volume 2, Nov. 6-11 1994, Chicago, Illinois, ASME, pp. 145-146.
Grundstrom, C., S.S. Kanchibotla, A. Jankovich, and D. Thornton, 2001. Blast fragmentationfor maximizing the sag mill throughput at Porgera gold mine. Proceedings of the 27th AnnualConference on Explosives and Blasting Technique, Volume I, Jan. 28-31 2001, Orlando, Florida,International Society of Explosives Engineers, pp. 383-399.
Herbst, J.A., 2000. Mine-to-mill optimisation - Research and practice. AusIMM PublicationSeries, no. 5, pp. 3-9, Conference. International Congress on Mineral Processing and ExtractiveMetallurgy (Minprex 2000), Sep. 11-13 2000, Melbourne, Australia, AusIMM.
Kanchibotla, S.S., 2003. Optimum blasting? Is it minimum cost per broken rock on maximumvalue per broken rock? Fragblast, v. 7, no. 1, Mar., A.A. Balkema, pp. 35-48.
Klein, B., R. Hall, M. Scoble, and M. Morin, 2003. Total systems approach to design forunderground mine-mill integration. CIM Bulletin, v. 96, no. 1067, Jan., pp. 65-71.
Lotter, N.O., P.J. Whittaker, L. Kormos, J.S. Stickling, and G.J. Wilkie, 2002. The developmentof process mineralogy at Falconbridge Limited and application to the Raglan Mill. CIM Bulletin,v. 95, no. 1066, pp. 85-92.
26
Marton, A., and R. Crookes, 2001. A case study in optimising fragmentation. AusIMMProceedings, v. 306, no. 2, Dec., pp. 35-43.
Maruniak, J.A., W.L. Silver, and D.G. Moulton, 1983. Olfactory receptors respond to blood-borne odorants. Brain Research, v. 295, pp. 312-316.
McKee, D.J., G.P. Chitombo, and S. Morrell, 1995. Relationship between fragmentation inmining and comminution circuit throughput. Minerals Engineering, v. 8, no. 11, Nov., pp. 1265-1274.
Morrell, S., and P.D. Munro, 2000. Increased profits through mine-and-mill integration.AusIMM Publication Series, no. 2, After 2000 – the Future of Mining, the Impact of New Technology,and Changing Demands on the Mining Industry, Apr. 10-12 2000, Sydney, NSW, pp. 194-198.
Mulvaney, S.P., M.D. Musick, C.D. Keating, and M.J. Natan, 2003. Glass-coated, analyte-taggednanoparticles - A new tagging system based on detection with surface-enhanced Ramanscattering. Langmuir, v. 19, no. 11, May 27, pp. 4784-4790.
Nanto, H., and J.R. Stetter, 2003. Introduction to Chemosensors, in Pearce, T.C., S.S.Schiffman, H.T. Nagle, and J.W. Gardner, eds., Handbook of Machine Olfaction – Electronic NoseTechnology, Wiley VCH, Berlin, pp. 33-54.
Paley, N., and T. Kojovic, 2001. Adjusting blasting to increase SAG mill throughput at the RedDog Mine. Proceedings of the 27th Annual Conference on Explosives and Blasting Technique, Volume I, Jan.28-31 2001, Orlando, Florida, International Society of Explosives Engineers, pp. 65-81.
Pearce, T.C., S.S. Schiffman, H.T. Nagle, and J.W. Gardner, eds., Handbook of Machine Olfaction –Electronic Nose Technology, Wiley VCH, Berlin, pp. 33-54.
Pease, J.D., M.F. Young, A. Clark, and G. Tucker, 2001. Lessons from manufacturing -Selecting ore to optimise the mining and milling process. Monograph Series - AusIMM, v. 23,pp. 369-378.
Pevely, S., 2001. Ore Reserve, grade control and mine/mill reconciliation practices at McArthurRiver Mine, NT. Monograph Series - AusIMM, v. 23, pp. 567-578.
Pidgeon, R, 2003. RF tags will help to smooth supply chain. Packaging Magazine, v. 6, no. 14, Jul24, p. 5.
Robertson, I.G., and O.A. Sehic, 1993. Ore quality control for process optimisation.Conference Series - AusIMM, no. 5, 1993, pp. 227-234, Proceedings of the International Mining GeologyConference, Jul. 5-8 1993, Kalgoorlie-Boulder, Western Australia.
Scanlon, Lisa, 2003. Behind bars. Technology Review, v. 106, no. 3, Apr., MIT, p. 80.
Scott, A., J. Segui, and S.S. Kanchibotla, S., 2000. Ore characterization for Mine to Millfragmentation. AusIMM Publication Series, no. 3, pp. 247-253, Fourth International MiningGeology Conference, May 14-May 17 2000, Coolum, Queensland, Australia.
Smith, M., and R. Hautala, 1991. Coupled expert system approach to blast optimization andfragmentation modelling. Preprint 91-50, SME Annual Meeting, Feb 25-28, SME, Denver,
27
Colorado, 6 pp.
Taylor, D.L., and K.A. Altman, 2001. Geological data analysis for mineral processing. Draggingmetallurgy into the twenty-first century. Computer Applications in the Minerals Industries, pp. 491-493SME.
Vanneste, E., and H.J. Geise, 2003. Commercial Electronic Nose Instruments, in Pearce, T.C.,S.S. Schiffman, H.T. Nagle, and J.W. Gardner, J.W., eds., Handbook of Machine Olfaction – ElectronicNose Technology, Wiley VCH, Berlin, pp. 151-179.
Walsh, D.E., and P.D. Rao, 1986. Development of a radiotracer technique to evaluate goldrecovery by gravity concentrators. CIM Bulletin, v. 87, pp. 29-37.
Williams, N.R., and S. Holtzhausen, 2001. The impact of ore characterization and blending onmetallurgical plant performance. Journal of the South African Institute of Mining and Metallurgy, v. 101,no. 8, Nov./Dec., pp. 437-446.
Workman, L., and J. Eloranta, 2003. The effects of blasting on crushing and grinding efficiencyand energy consumption. Proceedings of Twenty-Ninth Conference on Explosives and Blasting Technique,Volume I, Feb. 2-5 2003, Nashville, Tennessee, International Society of Explosives Engineers,pp. 131-140.
Related Documents