Distribution Category: Materials (UC-25) ANL-82-80 ANL--82-80 DE83 008718 ARGONNE NATIONAL LABORATORY 9700 South Cass Avenue Argonne, Illinois 60439 ICANS-VI Proceedings of the Sixth Meeting of the INTERNATIONAL COLLABORATION ON ADVANCED NEUTRON SOURCES Argonne National Laboratory June 28 - July 2, 1982 DISCLAIMER Ti, port weas prepared as acm.t of work .po.eord by am ape.y of the Umbd Sat.m Gourme.L Neither the Umited State. overameat mar may apb.y theraof, or amy Of thair employee, make may warra ty, wspra. or implied, or aur s. amy ea b iab~ity or Nr pld- bUlity for the aumrmay, oompletemem, or uefumem of may laformitlin, apparels, pr1el, or princ - dibcteld, or repreaeats that its -e would lat iap privately maad rights Rder- o heruim to may wpedi meummecral predmcl, prooa or survive by trade eame, tdwmauh, mamufactuer, or otherwe dosot A y uaomeetle or Imply h aade .amea, a. meadatoas, or favorig by the Uited States Oovramewt or any @ay thaetr. The vie ad opluioin of authors eusmp ed herI-a do mot umarily date or iet dM of the UJited State overamat or amy aIcy there. January 1983 Ca~QciZ N.,1..I ~cA -E 9-3 NOTICE PORTIONS OF THIS REPORT ARE ILLEUIBII It hss beon reproduced from the best available copy to permit the brfest possible availabillty. MASTER Thimu a nis on~i as Lrn

Welcome message from author
This document is posted to help you gain knowledge. Please leave a comment to let me know what you think about it! Share it to your friends and learn new things together.
Transcript

Distribution Category:Materials (UC-25)
ANL-82-80ANL--82-80
DE83 008718
ARGONNE NATIONAL LABORATORY9700 South Cass Avenue
Argonne, Illinois 60439
ICANS-VI
Proceedings of the Sixth Meeting of theINTERNATIONAL COLLABORATION ON
ADVANCED NEUTRON SOURCES
Argonne National LaboratoryJune 28 - July 2, 1982
DISCLAIMER
Ti, port weas prepared as acm.t of work .po.eord by am ape.y of the Umbd Sat.mGourme.L Neither the Umited State. overameat mar may apb.y theraof, or amy Of thairemployee, make may warra ty, wspra. or implied, or aur s. amy ea b iab~ity or Nr pld-
bUlity for the aumrmay, oompletemem, or uefumem of may laformitlin, apparels, pr1el, orprinc - dibcteld, or repreaeats that its -e would lat iap privately maad rights Rder-
o heruim to may wpedi meummecral predmcl, prooa or survive by trade eame, tdwmauh,mamufactuer, or otherwe dosot A y uaomeetle or Imply h aade .amea, a.meadatoas, or favorig by the Uited States Oovramewt or any @ay thaetr. The viead opluioin of authors eusmp ed herI-a do mot umarily date or iet dM of theUJited State overamat or amy aIcy there.
January 1983
Ca~QciZ N.,1..I ~cA -E 9-3NOTICE
PORTIONS OF THIS REPORT ARE ILLEUIBIIIt hss beon reproduced from the bestavailable copy to permit the brfestpossible availabillty. MASTER
Thimu a nis on~i as Lrn

A major purpose of the Techni-cal Information Center is to providethe broadest dissemination possi-ble of information contained in.DOE's Research and DevelopmentReports to business, industry, theacademic community, and federal,state and local governments.
Although a small portion of thisreport is not reproducible, it isbeing made available to expeditethe availability of information on theresearch discussed herein.
Preface
Representatives of the Laboratories of the International Collaboration onAdvanced Neutron Sources gathered between 28 June and 2 July, 1982 at ArgonneNational Laboratory for their sixth meeting, ICANS-VI. The meeting was thefirst opportunity for participants to see Argonne's Intense Pulsed NeutronSource, which went into full operation in August, 1981, and in an importantsense celebrated the coming-on-line of this most recent entry into the world'scomplement of the new generation of neutron sources.
The main topics of the meeting were "Targets and Moderators" and "NeutronScattering Instrumentation", following what has become the customary rotationof subjects. An additional topic, "Nuclear Data and Codes" emerged this timeas a separate entity, closely related to the Targets and Moderators subjects.
As usual, we devoted the first sessions to Status Reports from the differentprojects. In addition, Gunter Bauer provided an informal report on progresson new neutron sources in the Soviet Union, based on his attendance of therlubna meeting in June.
On the second and third days, participants presented prepared papers in twoseparate sessions devoted to the two main topics of the meeting. We made adeliberate effort to provide as much time as possible for open discussionsin a "workshop" style. This attempt was a response to a call raised at theend of each of the recent meetings, to provide more such opportunity. Itseemed that we happily succeeded in this, but at a cost which we recognized,of making very tight schedules for formal presentations.
These Proceedings are organized roughly in the order and organization ofpresentations. In addition, we include a record of some of the discussionsfollowing each Status Report, and separate summaries of discussions onvarious subjects of the topical sessions. We have reproduced the manu-scripts essentially as received. The Editor expresses his deep gratitudeto all participants for their contributions, for the help of those who agreedto chair the sessions, and for the efforts of those who prepared discussionsummaries. All contributed to the success of the meeting.
We all express our thanks to Ms. Miriam Holden and her staff of Argonne'sConference Planning and Management group, for so smoothly attending toorganizational details and participants travel and communication needs. Itis all too easy to take this for granted, but we do not. Their excellentefforts and broad experience were fundamental to the success of the meeting.As conference organizer, I cannot express sufficient thanks to Dr. GerardLander, Director, IPNS Program, for his essential help and encouragementthroughout.
In broad summary, we can say that the activities and results reported, andthe productive discussions that took place, show that the spallation neutronsources are developing in a healthy way, and that the objectives of the ICANSare served well by our meetings.
Argonne, IllinoisNovember, 1982
J. M. Carpenter111


Contents page
Part A Status Reports from ICANS Laboratories and Projects & TopicalSummaries on Discussion Meetings
Al Progress on the Construction of the Spallation NeutronSource at the Rutherford Appleton Laboratory 1
D. A. Gray
A2 Status and Neutron Scattering Experiments at KENS 15
N. Watanabe, H. Sasaki, Y. Ishikawa, and Y. Endoh
A3 Status of the SNQ Project at KFA JUlich 41
G. S. Bauer
A4 Status of the WNR/PSR at Los Alamos 51
R. N. Silver
A5 Status Report on the SIN Neutron Source 69
W. E. Fischer
A6 Intense Pulsed Neutron Source (IPNS) at Argonne NationalLaboratory (ANL): A Status Report as of June, 1982 77
J. N. Carpenter, C. W. Potts, and G. H. Lander
Part B Contributed Papers
Section 1: Instrumentation
51-1 Electronically Focused Powder Diffractometers at IPNS-I 105
J. D. Jorgensen and J. Faber, Jr.
51-2 The IPNS Time-of-Flight Single Crystal Diffractometer 115
A. J. Schultz, R. G. ie ler and J. N. Williams
v

page
B1-3 Beryllium-Beryllium Oxide Filter Difference Spectrometer 125
J. A. Goldstone, J. Eckert, A. D. Taylor and E. J. Wood
81-4 A Resonance Filtered Beam Spectrometer 137
R. M. Brugger, A. 0. Taylor, C. E. Olsen, J. A. Goldstoneand A. K. Soper
B1-5 eV Neutron Spectroscopy Using Resonance Absorption EnergySelection on a Pulsed Source 157
W. G. Williams and J. Penfold
81-6 Polarized Epithermal Neutron Spectrometer at KENS 171
M. Kohgi
B1-7 Polarized Neutron Techniques and Applications 179
G. P. Felcher (abstract only)
81-8 Dynamic Range Aspects of Pulsed Source Instruments 181
F. Mezei
81-9 A Phased Chopper at WNR 191
V. Bolie, R. M. Brugger, and R. N. Silver
81-10 The IPNS-I Chopper Spectrometers 207
D. L. Price, J. M. Carpenter, C. A. Pelizzari, S. K. Sinha,I. Bresof and G. E. Ostrowski
81-11 A Rotating Crystal Pulse Shaper for Use on a Pulsed NeutronSource 217
J. M. Carpenter and C. J. Carlile
B1-12 A Linear Position Sensitive Neutron Detector Using FibreOptic Encoded Scintillators 237
P. L. Davidson and H. Wroe
vi

page
B1-13 The IPNS Data Acquisition System 247
T. G. Worlton, R. K. Crawford, J. R. Haumann andR. Daly
B1-14 Tests of a Resonance Detector Spectrometer fo' Electron-Volt Spectroscopy 265
J. M. Carpenter, N. Watanabe, S. Ikeda, Y. Masuda andS. Sato
81-15 Crystal Analyzer TOF Spectrometer (CAT) for High Energy 279Incoherent Neutron Scattering
N. Watanabe, S. Ikeda and K. Kai
81-16 The Inelastic Rotor Spectrometer at the Harwell Linac 291
B. C. Boland
Summary of Instrument Session
S1 Instrumentation - Summary of Contributed Paper andDiscussion Sessions 299
R. K. Crawford
S2 Summary of Discussions of Electron Volt Spectroscopy 309
A. D. Taylor, N. Watanabe and J. M. Carpenter
Section 2: Targets and Moderators Designs and Tests
B2-1 Progress on the SNS Target Station 315
A. Carne
82-2 Cryogenic Moderator Design 327
B. R. Diplock
vii

page
B2-3 Remote Handling Equipment for SNS 339
B. H. Poulten
B2-4 Thermofluid Dynamics of the Liquid Lead-Bismuth Target forthe Spallation Neutron Source at SIN 357
Y. Takeda
B2-5 Developing an Optimum Target Design for a High EnergySpallation Neutron Source with Respect to Mechanical andThermal Constraints 375
J. F. Stelzer
B2-6 Grooved Cold Moderator Tests 391
K. Inoue, Y. Kiyanagi, H. Iwasa, N. Watanabe, S. Ikeda,J. M. Carpenter and Y. Ishikawa
B2-7 Measurement of Neutron Spectra and Fluxes at the IPNSRadiation Effects Facility 407
R. C. Birtcher, M. A. Kirk, T. H. Blewitt and L. R.Greenwood
B2-8 Time-Structure of Thermal Neutron Leakage from Fast andSlow Moderators for Spallation Neutron Sources 43
G. S. Bauer, H. M. Conrad, K. Grunhagen, H. Spitzer,F. Gompf, W. Reichardt and W. E. Fischer
B2-9 Some Aspects of the Neutronics of the SIN Neutron Source 441
F. Atchison, W. E. Fischer, and B. Sigg
B2-10 Studies of a Lead Reflector for a Pulsed Neutron Source 461
A. D. Taylor, G. J. Russell, M. M. Meier and H. Robinson
82-11 Moderated Neutron Pulse Shapes 475
A. D. Taylor
viii

page
Summaries of Target and Moderators Session
S3 Summary of Discussions on Reflector Studies, Neutron Fluxand Energy Deposition Studies in the Session, Targets andModerators: Designs and Tests 485
R. G. Fluharty
S4 Summary of the Session Target and Moderators: Designand Test 489
W. E. Fischer
S5 Summary of Discussion Session on Beamline ShieldingConsiderations for Spallation Neutron Sources 493
G. J. Russell, M. M. Meier and T. A Broome
S6 Summary of a Discussion on the Gain in Thermal NeutronFlux by Using Grooved Hydrogenous Moderators 497
G. S. Bauer
Section 3: Nuclear Data and Codes
B3-1 Computational Methods for High-Energy Sources 503
T. W. Armstrong, P. Cloth, and D. Filges
83-2 High-Energy Fission Models Validation and Comparisonwith Experiments 529
T. W. Armstrong, P. Cloth, D. Filges and R. D. Neef
B3-3 Measurements of the Spallation and Fission Product Productionfor Depleted Uranium and Natural Lead Targets Bombarded by 1100MeV Protons 551
W. Amian, N. F. Peek and D. J. Shadoan
ix

page
83-4 Cascade Neutron Yields from Energetic Heavy IonInteractions 571
M. M. Barbier
B3-5 Measured and Calculated Neutron Yields for 100 MeV Protonson Thick Targets of Pb and Li 583
R. T. Jones, M. A. Lone, A. Okazaki, B. M. Townes, D. C.Santry, E. D. Earle, J. K. P. Lee, J. M. Robson, R. B.Moore and V. Raut
B3-6 Methods of Neutron and Proton Dosimetry at Spallation Sources 605
L. R. Greenwood and R. J. Popek
B3-7 How Much Thermal Neutron Flux is Gained Using DeuteronsInstead of Protons? 619
G. S. Bauer, H. M. Conrad, K. GrUnhagen, H. Spitzer andG. Milleret
83-8 Monte Carlo Study of the Energy Deposition of a Flux ofSpallation Neutrons in Various Samples 629
M. Pepin
B3-9 Possible Use of Copper Spallation Reactions to MeasureHigh Energy Particle Spectra in Shielding Experiments 639
W. Amian, V. DrUke, M. Kloda and W. Litzow
Summary of Nuclear Data and Codes Session
S7 Summary of Afternoon Session, Tuesday, June 29, 1982 651
A. Carne and T. Broome
X

1
ICANS-VI
INTERNATIONAL COLLABORATION ON ADVANCED NEUTRON SOURCES
June 27 - July 2, 1982
PROGRESS ON THE CONSTRUCTION OF THE SPALLATION NEUTRONSOURCE AT THE RUTHERFORD APPLETON LABORATORY
David A Gray
Rutherford Appleton Laboratory
ABSTRACT
This paper gives details of progress on the Spallation Neutron Source
which is due to produce first neutrons in 1984. It updates similar reports
given at ICANS-IV and ICANS-V.

2
PROGRESS ON THE CONSTRUCTION OF THE SPALLATION NEUTRONSOURCE AT THE RUTHERFORD APPLETON LABORATORY
David A GrayRutherford Appleton Laboratory
1. INTRODUCTION
This report is an update of reports given by G Manning at ICANS-IV
and by myself at ICANS-V. A recapitulation of the main parameters of the
SNS is given in Table 1 and the layout of the facility in Figure 1. A full
description of the project is given in Reference 1.
2. FINANCE
The financial approvals or capital are in the process of being
updated to 15.04M for the machine and target station and 2.31M for the
7 (out of 15) approved instruments. The update is purely for inflation.
This does not include costs for staff nor for design, research and
development costs. The allocation to cover all costs for the SNS in the
current financial year is 8.53M with similar figures foreseen in Forward
Look projections. The money is consistent with providing first neutrons in
mid-1984 with 5 instruments available at that time.
Approximately 9M worth of equipment has been ordered for the machine
and target station and O.3M for the instruments.
3. PROGRESS
3.1 Injection
The ion source (Figure 2) and pre-injector were successfully run to
produce H beam at 665 keV during February. During several runs since
then improvements have been made to power supplies for the ion source and
to reduce damage to electronic components caused when there is a spark-over
in the accelerating column. Computer control of the ion source is now
being implemented.

3
TABLE 1: MAIN PARAMETERS OF THE SNS
Proton design energy 800 MeV
Proton design intensity 200 pA
Nominal repetition frequency 50 Hz
Injection scheme
Injection interval
Injection energy (protons)
Injected protons/pulse
Emittance H ions
Mean radius of synchrotron
Number of superperiods
Dipole field at 70.44 MeV
Dipole field at 800 MeV
Betatron tune (Qh' %o)Beam emittance at 70.44 MeV H
V
Number of RF cavities
Frequency swing (harmonic No. - 2)
Vacuum chamber in magnet
Target material
Fast neutron production rate
Neutron current from surface ofmoderator
H charge exchange
376 is
70.44 MeV
5 x 10¹³
25w x 10 6 rad m
26.0 m
10
0.1764 T
0.6970 T
4.31, 3.83
540w x 10 6 rad m
430w x 10 6 rad m
6
1.34 to 3.09 MHz
Ceramic
Depleted Uranium
3 x 10¹⁶ n per sec
1015 - 10135 s ster 1 eV 1
(.01 eV - 1 eV)
4
During March 10 ieV beam was accelerated through the first of the 4
linac tanks. Further linac beam will not be run until the whole linac is
ready for 70 MeV tests which is programmed for October.
The linac has been aligned and the tanks flattened to produce the
required RF field law.
The October 70 MeV beam date is determined by the build and test and
the modulators for the RF valves driving the tanks. This work is going to
programme.
The 70 MeV beam transport line between the linac and the synchrotron
is being installed.
The injection septum magnet which steers the H ions on to the
stripping foil has been delivered. Its power supply has been installed
and it is about to be powered. Components have been delivered for the 4
beam bump magnets which change during injection the circulating proton
closed orbit to make it pass through the stripping foil. The first has been
assembled. The beam bump magnet power supply will be delivered shortly.
Development work on stripping foils is continuing with good results.
Circular foils, 50mm in diameter, of the required thickness, 0.25p, with a
conducting coating of alumina and supported all round are routinely made.
These foils have been tested with 70 MeV proton beam at SIN, Zurich, and
initial indications are that they last for the equivalent of 10 hours of
full SNS intensity as expected. Work is now proceeding on improving
techniques for making the required 120 x 30 mm foils with one unsupported
edge of which some have already beer. made.
A rectangular foil supported all round is shown in Figure 3.
3.2 Synchrotron ring magnets
There has been a delay in the delivery of the 10 dipole magnets.
The prototype was delivered 14 months late in January. The configuration
was determined using cor iter calculations. The central field and field
gradient was as computed within the measurement accuracy (AB/BN 10'4).

5
The end fields similarly tied up with calculations. Since the prototype was
ordered further refinement of the beam dynamics has changed the required
average gradient in the magnet. This will be accommodated by changing the
end shapes of the dipoles which have now been determined. Losses in the
core and coils have been as the predictions. The inductance is about 10%
higher than calculated.
The 10 main quadrupole doublets have been assembled in modules with a
trim quadrupole doublet and have been installed in the synchrotron room
(Figure 4).
The 10 singlet quadrupole magnets have been delivered, as have the
steering magnets for closed orbit correction.
The support frames for all the main magnets have been surveyed into
position. In the case of the dipoles, see foreground of Figure 4, this
was doi. using the dipole base with dummy targets.
3.3 Magnet power supplies
All components fox the main magnet power supply have been delivered.
Part of the capacitor bank has been used to power the dipole prototype.
All 30 of the programmable power supplies needed for the trim
quadrupole and correction magnets have been delivered and are being
positioned in the centre of the synchrotron room which has sufficient
shielding to protect electronic components.
3.4 Main ring vacuum
The ceramic chambers for the quadrupole modules have been installed
and the singlet chambers manufactured. The 10 5m long 360 chambers for
the dipoles (Figure 5) have been manufactured. Shorter ceramic chambers
for straight section modules containing steering magnets are being
manufactured.
Components for the roughing line are available and the ion pump
controls have been installed.

6
3.5 RF shields
The design of the RF shields which fit inside the ceramic chambers is
complete. The inside dimensions of the doublet ceramic chambers have been
measured. The supports for the wires in the shield are individually
machined to put the shield accurately around the beam. The first doublet
shield is being assembled. Components for the dipole shields are being
manufactured.
3.6 Main ring RF system
The prototype RF cavity has been tested successfully to full voltage
with the correct frequency swing and swing rate (Figure 6). Two production
cavities have been installed in the synchrotron room.
The prototype amplifier chain which powers the cavity has been shown
to provide sufficient power. There have been problems with parasitic
oscillations at high frequency emanating from either inside the valve or
associated with the mounting of the valve which are in the process of
resolution. Preliminary work has been done on the parallel chain which
compensates for the beam loading of the intense proton pulses. The
production amplifiers are being built up.
The DC bias supplies have been installed and the 6 anode power supplies
are nearly complete. A new bias regulator using larger transistors has
been designed and the prototype is under construction. The low power RF
system has been used in the cavity tests.
3.7 Diagnostics
2osition monitors, profile monitors, intensity monitors and the
Q-measuring system for the synchrotron are being manufactured. The high
quality co-axial cables have been installed. Electronics are being
manufactured and installed.
3.6 Extraction
The extraction team have been diverted during the year to help with
the injector. The extraction work is now continuing and components are

7
being ordered.
3.9 Extracted proton beam
The new components required have been ordered. Stands for the EPB
which has to go over and back acrL:ss the synchrotron will be of concrete
and have been designed.
3.10 Target station
A Carne will be dealing with this item in detail at this meeting.
Highlights of progress have been the successful production of two uranium
target plates encased in Zircaloy and the build-up of target station
shielding to include the installation on one side of the 'inserts' which
will allow individual collimators for each of the neutron lines. The
shutter system has been designed and the lower shielding wedges which go
radially between the shutters have been ordered.
The 3.2m diameter target void vessel which contains the target,
moderator, reflector assembly and which has been designed to ASME 3 Class A
standard, has been ordered. The target, moderator, reflector assembly
has been specified following neutronic measurements at Los Alamos.
Development work continues on the remote handling system.
3.11 Controls
One of the 3 satellite computers is being used progressively to control
components of the injector (Figure 7). The second satellite, for the
synchrotron, has been installed and is being used for development of the
diagnostics and other systems. Development of system hardware continues
and interface hardware modules are in various stages of manufacture.
3.12 Experimental facilities
Of the 7 approved instruments, the Liquids and Amorphous Materials
Diffractometer (LAD) has been installed on the Harvell linac and commissioned
successfully. The components for the High Throughput Inelastic
Spectrometer (HTIS) have been delivered. Installation on the Harell
8
linac is expected this month. The type of system for the HUB computer has
been chosen and the approval procedure is underway to buy the initial
components for this system so that software development can be done.
4. OTHER USES OF THE SNS
Other uses of the SNS are being considered. These include facilities
for research using the ISR technique, neutrinos, fast neutrons for
irradiation studies, pions for radiobiology and charged particles for
setting up detectors for particle physics research. These facilities are
described in more detail in Alan Carne's paper at this meeting.
References
1. Spallation Neutron Source: Description of Accelerator and Target.B Boardman (Ed). RL-82-006, March 1982.
2. ICANS-V. Proc. of 5th meeting, Jiilich 22-26 June 81, p.63.Jul-Conf-45, Oct 81.

9
Extracted proton beamS800 MeV -otons
y t / ITarget staff on and shieling
Synchrotron
800 MeV protons
Experimental hall
Linac 70 MeV Hions 25m
Ion source and prainsector 665 ka H-ons
Fig. 1. Layout of the SNS
Fig. 2. H ion source on EHT platform
Fig. 3. Experimental stripping foil
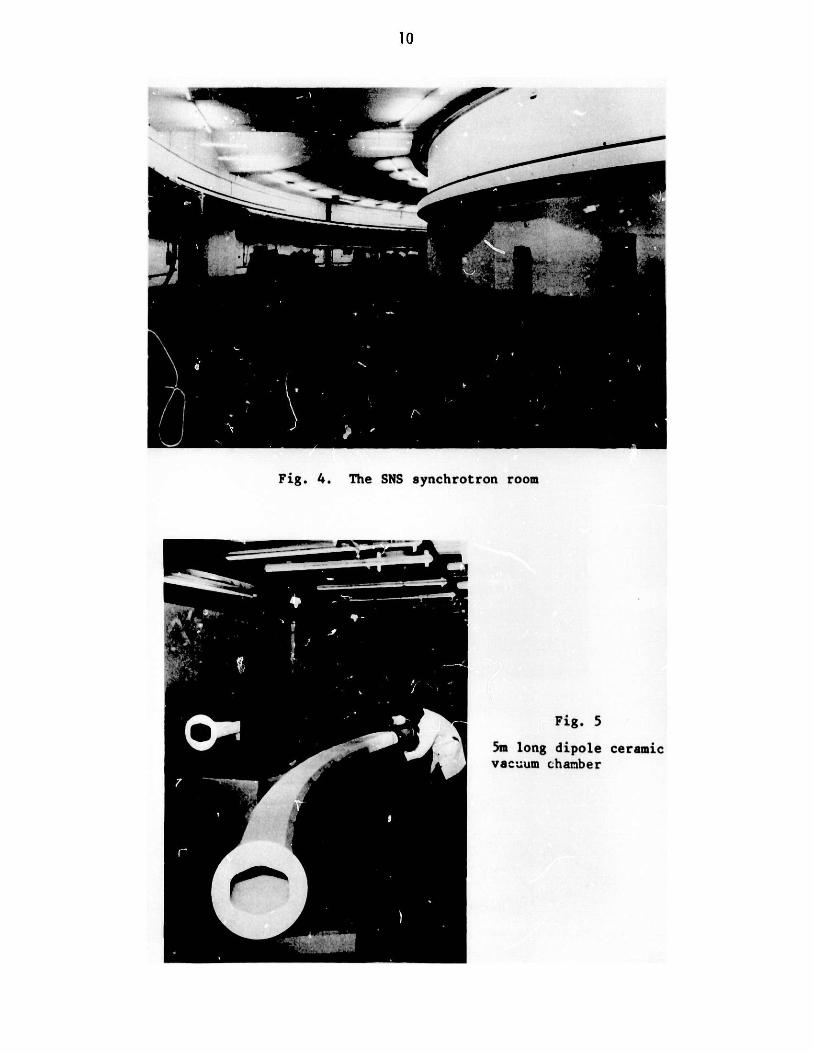
Fig. 4. The SN
Iwo
10
S synchrotron room
Fig. 5
5m long dipole ceramicA J vacuum chamber
- - - /'"

11
Fig. 6. One of the 6 RF cavities
Fig. 7. Injector Control Centre

12
SNS - D. A. Gray
J. Meese
D.
R.
A. Gray
Kustom
D. A. Gray
R. Kustom
D. A. Gray
A. D. Taylor
D. A. Gray
J. M. Carpenter
D.
R.
H.
A. Gray
Moon
Wroe
Q What is the maximum Q shift achievable with the trim
quads?
A 0.25
Comment - I'm concerned about the durability of the ceramic
vacuum vessel under proton bombardment. What tests had
been done on the material?
A Tests had been done using the Harwell cyclotron at beam
intensities corresponding to the maximum loss expected
in SNS.
Q Can you change the vacuum vessels and how long would it
take?
A Yes we can change them but the time to do so cannot yet
be assessed.
Q Can you extract a single beam bunch rather than 2, to
get shorter neutron pulses?
A We could kick out one pulse in principle and send it
to a second target station or a beam dump, but we
cannot trap and accelerate a single bunch to 800 MeV
with the present RF system.
Q What is the present position on glueing the dipole
magnet laminations together?
A The problem has now been solved by the manufacturers.
Q What are the first 5 instruments?
A A liquids and amorphous materials diffractometer
(LAD now operating initially on the Harwell linac);
a high throughput, inelastic spectrometer using
the Be filter techniques (HTIS) is being assembled
ready for initial operation on the linac; parts
are being ordered a high resolution powder diff-
ractometer (HRPD) on a 100 m guide tube; designs

13
are being finalized on a high energy transfer
spectrometer (HET) using a fast chopper to
monochromate the incident beam and finally
the incident flight path for a quasielastic
instrument will be built to serve a beryl-
lium-beryllium window spectrometer to be
supplied by the Bhaba Institute in Bombay.
A polarized neutron spectrometer using
filters is also being built as a development
project, initially for use on the Harwell
linac.
J. Meese Q What run time do you expect?
H. Wroe A Probably the best feel for that is given by some
figures Colin Windsor has produced comparing
estimated run times on the SNS with actual times
on the linac for the same measurement. The SNS
times are a few minutes in some cases. In
practice you would do harder experiments say
with small samples or at high resolution.

14

15
ICANS-VI
INTERNATIONAL COLLABORATION ON ADVANCED NEUTRON SOURCES
June 27 - July 2, 1982
STATUS AND NEUTRON SCATTERING EXPERIMENTS AT KENS
Noboru Watanabe and Hiroshi Sasaki
National Laboratory for High Energy PhysicsOho-machi, Tsukuba-gun, Ibaraki, 305, Japan
Yoshikazu Ishikawa and Yasuo Endoh
Physics Department, Tohoku University
Sendai, 982, Japan
Kazuhiko Inoue
Department of Nuclear Engineering, Hokkaido UniversitySapporo, 060, Japan
ABSTRACT
This paper reports present status of the KENS facility, progress in
neutron scattering experiments and instrumentaldevelopments, and status
of the KENS-I' program. A design study of a high intensity rapid-cycle
800 MeV proton synchrotron for proposed new pulsed neutron (KENS-II) and
meson source is also described.
16
STATUS AND NEUTRON SCATTERING EXPERIMENTS AT KENS
Noboru Watanabe and Hiroshi SasakiNational Laboratory for High Energy PhysicsOho-machi, Tsukuba-gun, Ibaraki, 305, Japan
Yoshikazu Ishikawa and Yasuo EndohPhysics Department, Tohoku University
Sendai, 982, Japan
Kazuhiko InoueDepartment of Nuclear Engineering, Hokkaido University
Sapporo, 060, Japan
1. PRESENT STATUS OF KENS
In FY 1981 (April 1, 1981 - March 31, 1982), the booster synchrotron
at KEK has been operated for 3280 hours, 88 per cent of which has been
delivered to the Booster Synchrotron Utilization Facility (BSF). The
spallation neutron source KENS has been operated successfully throughout
this period. Total operation time for KENS was about 1450 hours, because
we shared the machine time with Booster Meson Facility (Boom) of Meson
Science Laboratory, University of Tokyo.
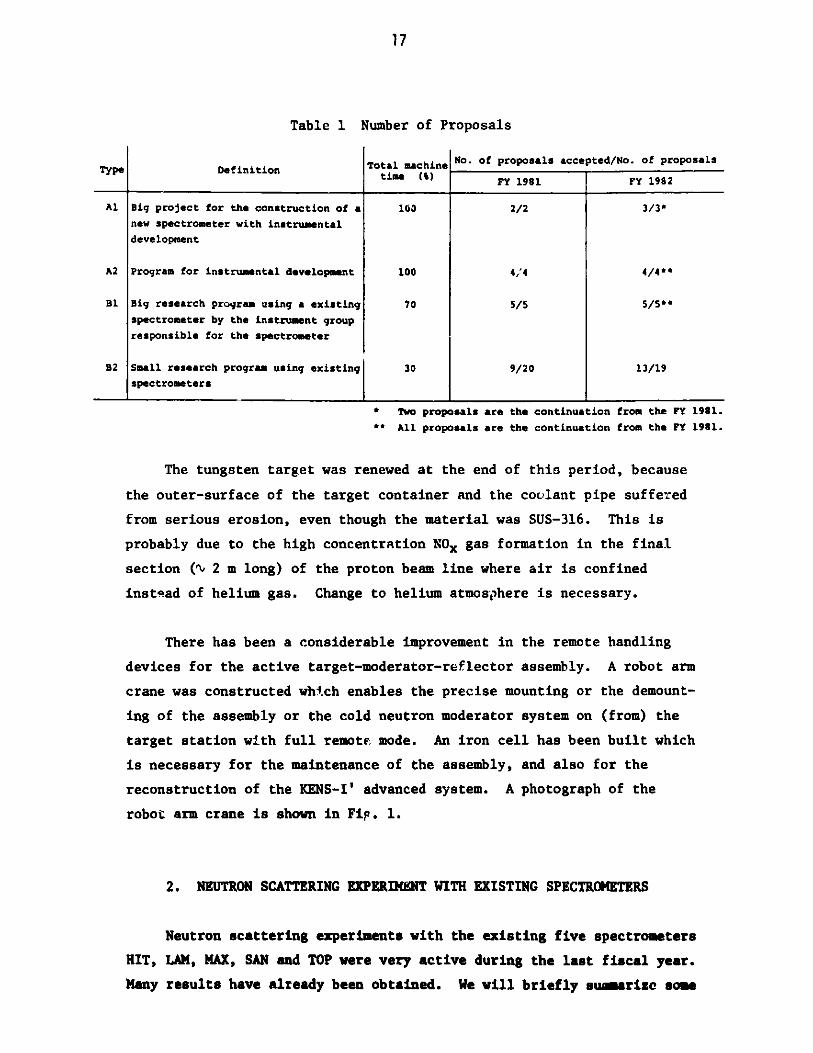
Many research programs were proposed for FY 1982. Number of proposals
are listed in Table 1. Among the existing spectrometers, the small angle
scattering spectrometer SAN is the busiest. In order to relieve machine
time congestion, the construction of a new small angle scattering machine
has been proposed, which will be authorized in the next fiscal year.
The machine will be equipped with a 2-dimensional PSD made of Li-6 glass
scintillators, and installed at a beam hole viewing the room temperature
moderator. Shortage in neutron machine time becomes more serious this
year, because the BSF has started to deliver proton beams to the new
facility, Particle Radiation Medical Science Center, University of
Tsukuba, which is located in the next door of KENS. Furthermore, the
proton accelerators at KEK will be shut down for about one year probably
in 1984, due to the TRISTAN tunnel construction under the existing
accelerators.
17
Table 1 Number of Proposals
Total machine No. of proposals accepted/No. of proposalsType Definition Fi18 Y92tie()FY 1981 FY 1982
Al Big project for the construction of a 160 2/2 3/3*new spectrometer with instrumental
development
A2 Program for instrumental development 100 4/4 4/4**
Bi Big research program using a existing 70 5/5 5/5**
spectrometer by the instrument group
responsible for the spectrometer
B2 Small research program using existing 30 9/20 13/19spectrometers
* Two proposals are the continuation from the FY 1981."* All proposals are the continuation from the FY 1981.
The tungsten target was renewed at the end of this period, because
the outer-surface of the target container and the coolant pipe suffered
from serious erosion, even though the material was SUS-316. This is
probably due to the high concentration NOx gas formation in the final
section (ti 2 m long) of the proton beam line where air is confined
instead of helium gas. Change to helium atmosphere is necessary.
There has been a considerable improvement in the remote handling
devices for the active target-moderator-reflector assembly. A robot arm
crane was constructed whl.ch enables the precise mounting or the demount-
ing of the assembly or the cold neutron moderator system on (from) the
target station with full remote; mode. An iron cell has been built which
is necessary for the maintenance of the assembly, and also for the
reconstruction of the KENS-I' advanced system. A photograph of the
robot arm crane is shown in Fip. 1.
2. NEUTRON SCATTERING EXPERIMENT WITH EXISTING SPECTROMETERS
Neutron scattering experiments with the existing five spectrometers
HIT, LAM, MAX, SAN and TOP were very active during the last fiscal year.
Many results have already been obtained. We will briefly suinarize some

18
of these research activities. (All of the experimental results which
have been achieved last year are being published as KENS Report-III, KEK
Internal (1982).)
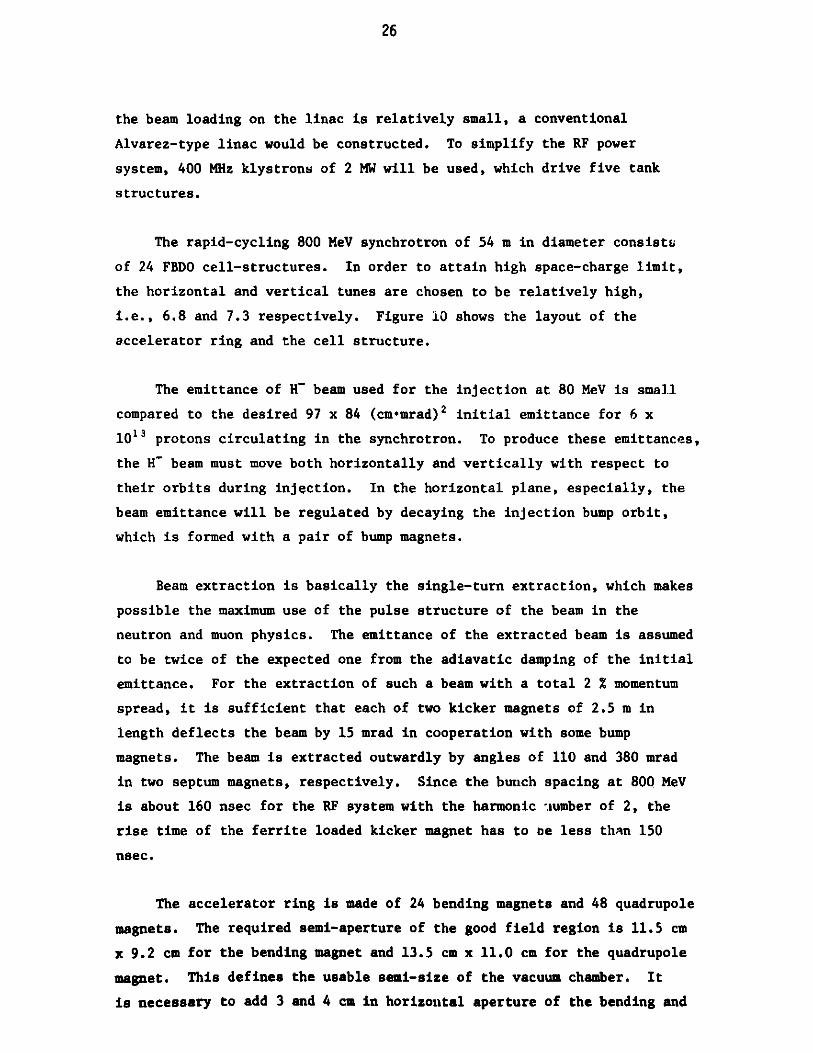
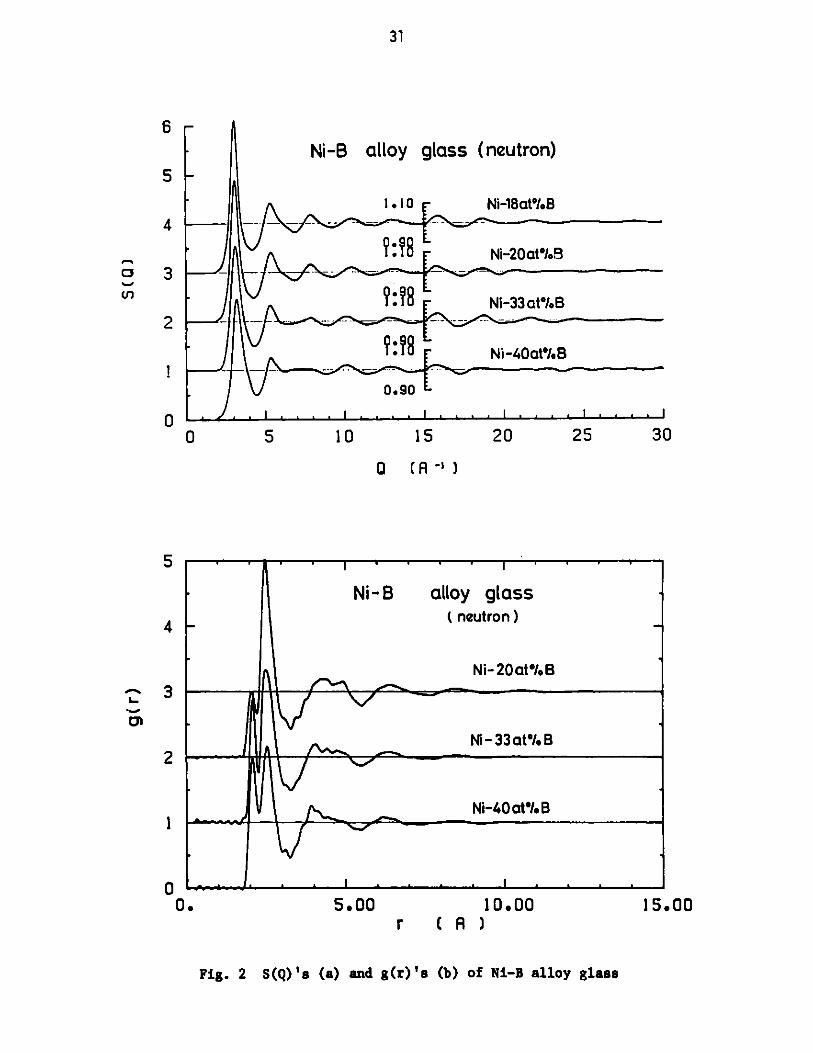
1. High Intensity Total Scattering Spectrometer (HIT)
More than hundred samples have been measured with HIT last year.
Short-range structures of metal-metal alloy glasses such as Ni-Ti and
Cu-Ti, and those of archetypical metal-metalloid alloy glass of Ni-B
have been determined, and it was concluded that (i) the atomic arrange-
ment of alloy glasses preserves the chemical shot-range order analogous
to that found in the corresponding crystalline compounds, (ii) glass
formation composition ranges are likely to be dominated by the nature of
the chemical short-range order inherent in these alloy glasses. As an
example of measured data, S(Q)'s and g(r)'s of Ni-B alloy glasses are
shown in Fig. 2. Atomic sites of deuteriums in deuterided metallic
glasses such as Pdo.3SZro.6 5Dx; structure changes of Pd-17at%Si alloy
glass by cold rolling; and structures of silicate glasses, binary amorphous
alloys and amorphous As-chalcogenids were also studied. Nuclear and
magnetic structure of Fe-B alloy glasses has been measured. Instrumental
improvement is also in progress; annulus detectors of Li-6 glass scinti-
llator at small angles are under construction.
2.2 Large Analyzer Mirror Spectrometer (LAM)
Several improvements were made on the LAM since last ICANS. One of
them, the increase of the number of analyzers from four to eight (see
Fig. 3), provided more information about the Q dependence of the quasi-
elastic spectral profile, and the evacuated housing of the whole spectro-
meter improved drastically the S/N ratio. Fig. 4-a gives some raw data
of the quasielastic spectrum of chloroprene. We can definitely dis-
tinguish the quasielastic and the elastic parts in the spectrum. Fig.
4-b shows the measured elastic incoherent structure factor (EISF) where
the solid line is a theoretical curve of EISF in a model describing

19
migration of kinks in the rubber polymer. Many other low energy fluc-
tuational motions involved in molecular and spin systems were studied.
In the case of the former, diffusion in liquids such as water, methanol
aqueous solutions, cycrohexane, benzene, etc; rotational diffusion in
plastic crystals; micro-Brawnian motion of polymer chains; and diffusion
of hydrogen in TiHx were studied. Similar studies concerning poly- and
oligo-ethers, a-lactalbumin solution and polyelectrolyte solutions were
also done. Concerning spin systems, experiments were performed to
measure the temperature and magnetic field dependence of crystal field
splitting in CeBi.
2,3 Multi-Analyzer Crystal Spectrometer (MAX)
One of the progress MAX made last year was the success of the
intensity mapping of the magnetic excitations over the whole Brillouin
zone. An example is shown in Fig. 5 where the magnetic excitations in a
YFeo. 7Mno. 3 alloy at various temperatures up to 1.5TN are displayed
as the contour maps of the scattering intensity. The data show clearly
that the low energy excitations are renormalized near Tc, while the
higher energy excitations remain almost unchanged even above TN.
2.4 Small Angle Scattering Spectrometer (SAN)
The SAN, small angle scattering machine has also been improved
further this year. The large external memory bank of 2 M bite was
attatched to it in order to make the measurement of the time dependent
phenomena possible. The measurements under various circumstances as at
different temperatures (10 < T < 1,000 K) or in a magnetic field (H < 5
kG) become also possible. The subjects studied by this spectrometer
included the magnetic systems, phase separation in alloys as well as
polymer and biological problems. A complete study of the magnetic
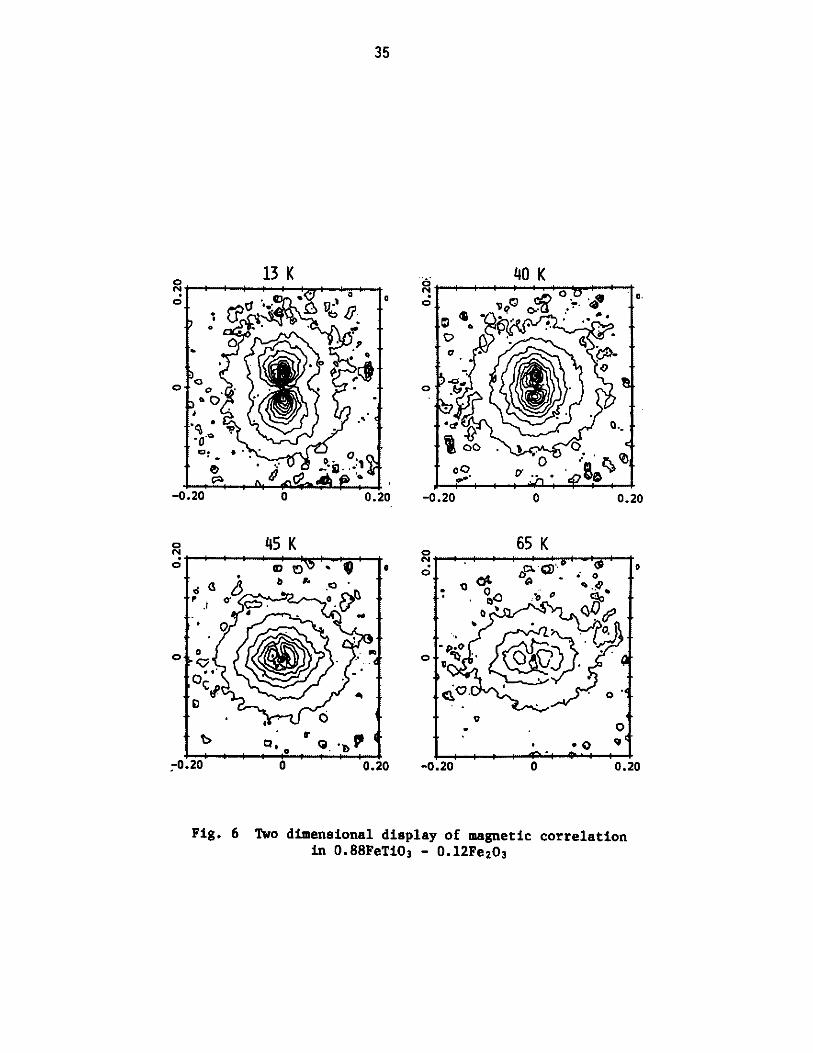
correlation was carried out on a single crystal of 0.88FeTiO 3-0.12Fe203
at different temperatures (10 < T < 300 K) in various magnetic fields.
Two dimensional displays of the scattering pr:files at low temperatures

20
are shown in Fig. 6. A significant change of the profiles occurs between
40 K and 45 K corresponding to the existence of the spin glass tempera-
ture at 38 K. The magnetic phase diagram of MnSi near TN has also been
established. The spinodal decomposition process of Fei-xCrx alloys was
studied for various compositions (x = 0.2, 0.3, 0.4 and 0.6) and the
important contributions of thermal fluctuations and nonlinear effects
are recognized. By the study of the semi-dilute polymer solutions
around the compensation temperature, the binary cluster integral of
polymer segments and the ternary cluster integral were separately obtained.
The structure of nucleosome core from chicken erythrocytes were studied
in a dilute solution with different Na+ and an interesting ionic strength
dependence of core sizes was found.
2.5 Time-of-Flight Spectrometer with optical Polarizer (TOP)
After completion of the performance test of TOP it has been operated
as the polarized neutron diffractometer with a polarization analyzer.
Though polarization is not completely satisfied, the flipping efficiency
and the reflectivity of the polarizer is 100 % and 90 % respectively,
which is excellent.
Numbers of experiments have been carried out during a year, namely
polarized neutron diffraction studies on the Fe-Pd, Fe-Sb and Fe-V
artificial superlattice films. We could find unusual magnetic form
factor due to the interfacial effects on the ferromagnetism of Fe layers.
We also measured similar effects of the magnetic form factor of Ni ultra
fine particles. Besides these studies, we have found novel feature of
the dynamical depolarization of the transmitted neutrons through ferro-
magnetic alloy&. We illustrate the typical examples in Fig. 7, where
the depolarization is dependent of the velocity of neutrons when they
pass through a quenched Feo. 85 Cro. 15 alloy, whereas polarization is
maintained completely in the case of the transmission through an anealed
Feo.8sCro.is alloy. It must be concluded that the comparable size of
micro magnetic domains as the Larmor period are distributed in the
quenched alloy which disappear by anealing.
21
3. NEW SPECTROMETERS AND INSTRUMENTAL DEVELOPMENTS
There have been a corniderable progress in the instrumental develop-
ment since last ICANS. Three spectrometers, FOX, CAT and DIX have been
constructed and operated, and other two named PEN and RAT are now under
construction. RAT and CAT are installed at the same beam hole H-7, and
the combination is called RAC. CAT and DIX are the tentative machine
for the instrumental development. A test machine for the PEN which is
called Pre-PEN was constructed and operated. A prototype machine of RAT
has also been constructed and the test experiments are in progress.
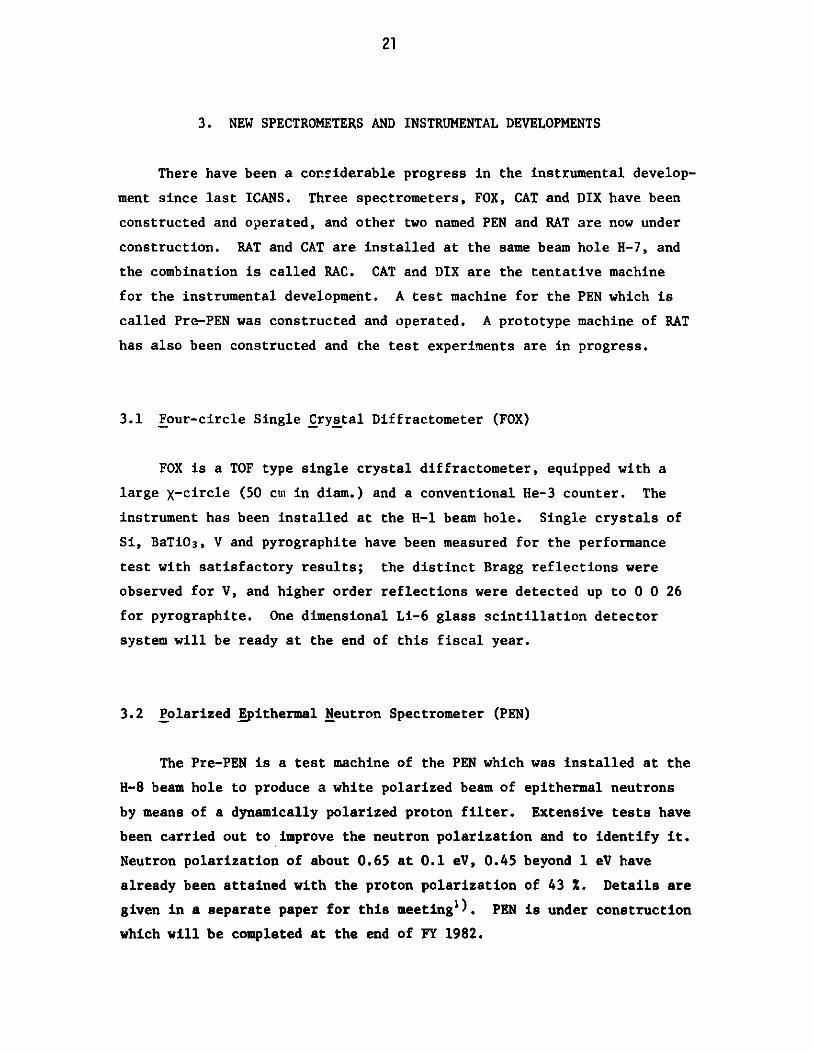
3.1 Four-circle Single Crystal Diffractometer (FOX)
FOX is a TOF type single crystal diffractometer, equipped with a
large X-circle (50 cm in diam.) and a conventional He-3 counter. The
instrument has been installed at the H-1 beam hole. Single crystals of
Si, BaTi03, V and pyrographite have been measured for the performance
test with satisfactory results; the distinct Bragg reflections were
observed for V, and higher order reflections were detected up to 0 0 26
for pyrographite. One dimensional Li-6 glass scintillation detector
system will be ready at the end of this fiscal year.
3.2 Polarized Epithermal Neutron Spectrometer (PEN)
The Pre-PEN is a test machine of the PEN which was installed at the
H-8 beam hole to produce a white polarized beam of epithermal neutrons
by means of a dynamically polarized proton filter. Extensive tests have
been carried out to improve the neutron polarization and to identify it.
Neutron polarization of about 0.65 at 0.1 eV, 0.45 beyond 1 eV have
already been attained with the proton polarization of 43 %. Details are
given in a separate paper for this meetings). PEN is under construction
which will be completed at the end of FY 1982.

22
3.3 Cystal Analyzer TOF Spectrometer (CAT)
CAT is a inverted geometry type machine designed to measure the
incoherent high energy excitation in the range 50 - 1,000 meV, with good
resolution (Ahw/hw = 0.02 ti 0.03), and with good efficiency. Since the
two-dimensional focussing geometry is adopted in the scattered neutron
path, larger planar sample can be used without sacrificing the resolu-
tion. In order to test the instrumental performance, local modes of
hydrogens in the various metallic hydrides have been measured. It was
found that the spectrometer can provide spectrum with extremely low
background and with excellent resolution. For instance, in case of
TiH2 , higher harmonics have been detected up to 5th order with respective
fine structures. Details are given in a separate paper for this meeting2).
3.4 Resonance Detector Analyzer TOF Spectrometer (RAT)
RAT is a resonance detector spectrometer. The instrument of this
type will make possible spectroscopy with scattered neutron energies in
the range 1 - 10 eV, with resolution in the neighborhood of 50 meV. The
system uses a resonantly-absorbing material,, which captures scattered
neutrons of fixed energy; a scintillation counter rr,;isteres the resulting
gamma ray cascade. Time of flight disperses the energy spectrum as a
function of incident neutron energy. We have constructed and operated a
prototype machine to understand the principle of the instrument and to
develop it, in collaboration with J. M. Carpenter from Argonne National
Lab.
By extensive tests to identify sources of background and find
corrective measures, we arrived at some general understandings which
guided our development, and some spesific principles
We have tested various scintillators for the gamma ray detection,
and found bismuth germinate (BGO) scintillator is the best for this
application. We have examined a fast and a slow electronics to handle
the detector signal and found that the fast system workes well. We have
23
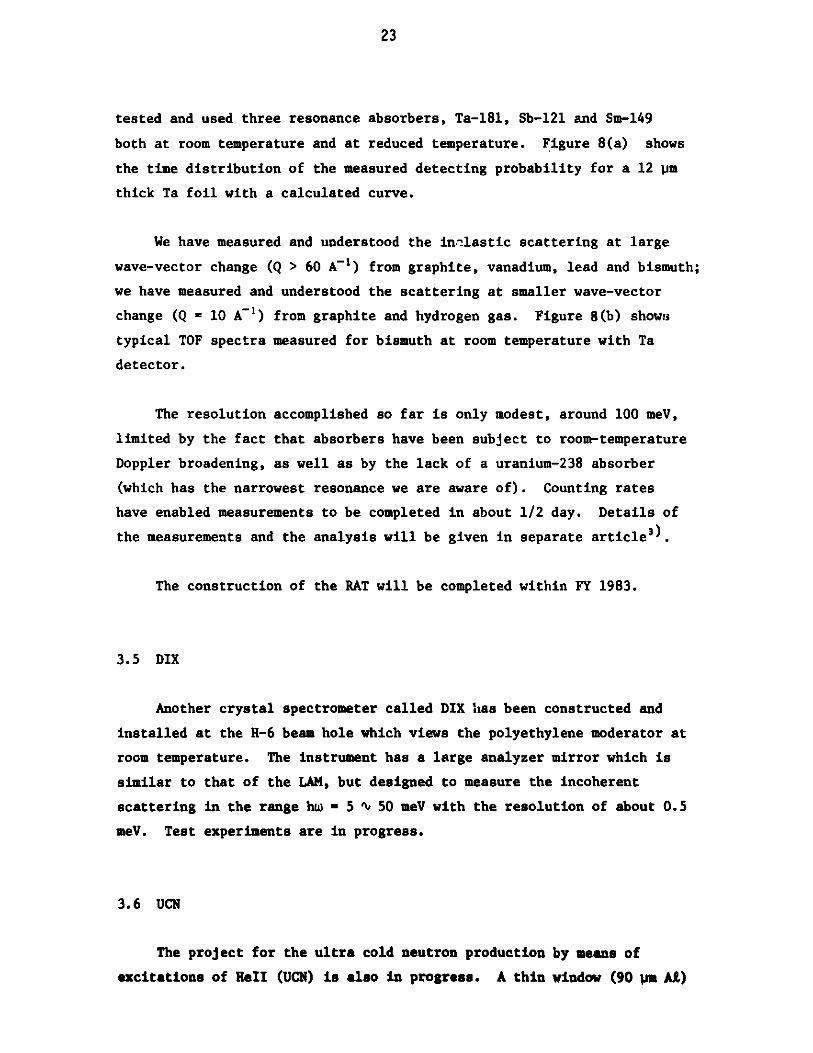
tested and used three resonance absorbers, Ta-181, Sb-121 and Sm-149
both at room temperature and at reduced temperature. Figure 8(a) shows
the time distribution of the measured detecting probability for a 12 pm
thick Ta foil with a calculated curve.
We have measured and understood the inelastic scattering at large
wave-vector change (Q > 60 A') from graphite, vanadium, lead and bismuth;
we have measured and understood the scattering at smaller wave-vector
change (Q = 10 A-') from graphite and hydrogen gas. Figure 8(b) show;
typical TOF spectra measured for bismuth at room temperature with Ta
detector.
The resolution accomplished so far is only modest, around 100 meV,
limited by the fact that absorbers have been subject to room-temperature
Doppler broadening, as well as by the lack of a uranium-238 absorber
(which has the narrowest resonance we are aware of). Counting rates
have enabled measurements to be completed in about 1/2 day. Details of
the measurements and the analysis will be given in separate articles).
The construction of the RAT will be completed within FY 1983.
3.5 DIX
Another crystal spectrometer called DIX has been constructed and
installed at the H-6 beam hole which views the polyethylene moderator at
room temperature. The instrument has a large analyzer mirror which is
similar to that of the LAM, but designed to measure the incoherent
scattering in the range hw - 5 ti 50 meV with the resolution of about 0.5
meV. Test experiments are in progress.
3.6 UCN
The project for the ultra cold neutron production by means of
excitations of HeII (UCN) is also in progress. A thin window (90 Um A)
24
He-3 counter was developed for detecting ultra cold neutrons. The He-3
cryostat producing UCN is being tested. First cooling will be started
in the fall of 1982.
3.7 PSD
The position sensitive detectors (PSD) employing the Li-6 glass
scintillator is also under development. The PSD (3 x 28 arrays) based
on a fibre optic encoding method was constructed, and the performance
was tested by using the Bragg reflections from a single crystal of KBr.
4. STATUS OF KENS-I' PROGRAM
KENS-I' program has been proposed ) which aimed to increase the
neutron beam intensity about one order of magnitude by the improvements
of the present accelerators and the target-moderator system.
A charge exchange injection system with H ion to increase the
proton beam current is now under construction and the operation test is
scheduled in next autumn. Energy up of the present 20 MeV proton linac
is also being discussed in the accelerator group at KEK, but no decision
has been made yet.
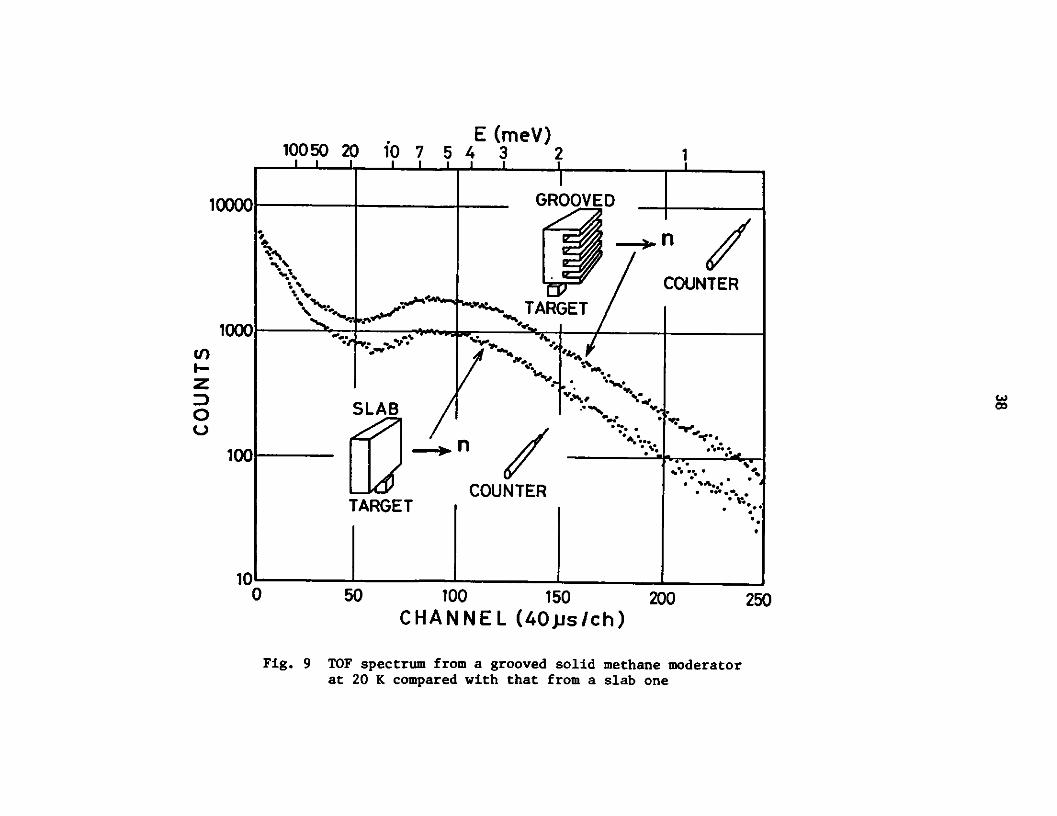
A grooved surface solid methane moderator has been proposed at KENS
in order to increase the cold neutron beam intensity. A prototype
cryogenic moderator chamber with a grooved surface has been constructed
and extensive test experiments are now in progress, using the pulsed
cold neutron facility at Hokkaido linac.
In Fig. 9 is demonstrated a measured spectrum obtained from the
grooved solid methane at 20 K, compared with that irom a flat one. A
gain factor of about two has already been recognized at the cold neutron
region. The results proves that the grooved surface is also very useful
for the cold moderator as for the thermal neutron. moderator. A first

25
installation of a grooved solid methane moderator to the KENS target
station will be completed at the end of this fiscal year. Details of
the prototype experiment is given in a separate paper for this meetings).
The convension of the present tungsten target to a depleted uranium
is one of the most important project in KENS-I' program. The rectangular
target is necessary to keep the good coupling efficiency. We are hopping
to realize this by the collaboration with Argonne National Lab. Some
calculations and mock up tests are now in progress.
5. KENS-II PROGRAM
KENS-II program is a future project to construct a intense pulsed
spallation neutron source at KEK. A tentative program has been presented
at the meeting on future program of BSF last March. This was first
formal presentation in KEK. Since the construction of a high intensity
proton synchrotron is the most important part of the program, a design
study has just started.
Design study of a proton synchrotron, which is the generator of the
meson-intense and neutron-intense beam, Gemini, is in progress. This
800 MeV synchrotron is aimed to deliver an intense proton beam, e.g.,
500 pA in time average. Such a beam intensity, for instance, will be
achieved by accelerating 6 x 10¹³ protons per pulse with the repetition
rate of 50 Hz. This machine also should play the role of the injector
to the present KEK 12 GeV proton synchrotron on behalf of the 500 MeV
booster synchrotron. The circumference of the machine, therefore, was
determined to be a half of that in the 12 GeV synchrotron. The machine
parameters are listed in Table 2. The accelerator will consist of an H
ion source, preaccelerator including RFQ, 80 MeV Alvarez-type linac, and
800 MeV rapid-cycling synchrotron.
The requirements on the ion source are that 30 mA of H- ion beau
is injected into the synchrotron with the pulse width of at least 350
psec to realize the beam intensity of 6 x 10¹³ protons per pulse. Since
26
the beam loading on the linac is relatively small, a conventional
Alvarez-type linac would be constructed. To simplify the RF power
system, 400 MHz klystrons of 2 MW will be used, which drive five tank
structures.
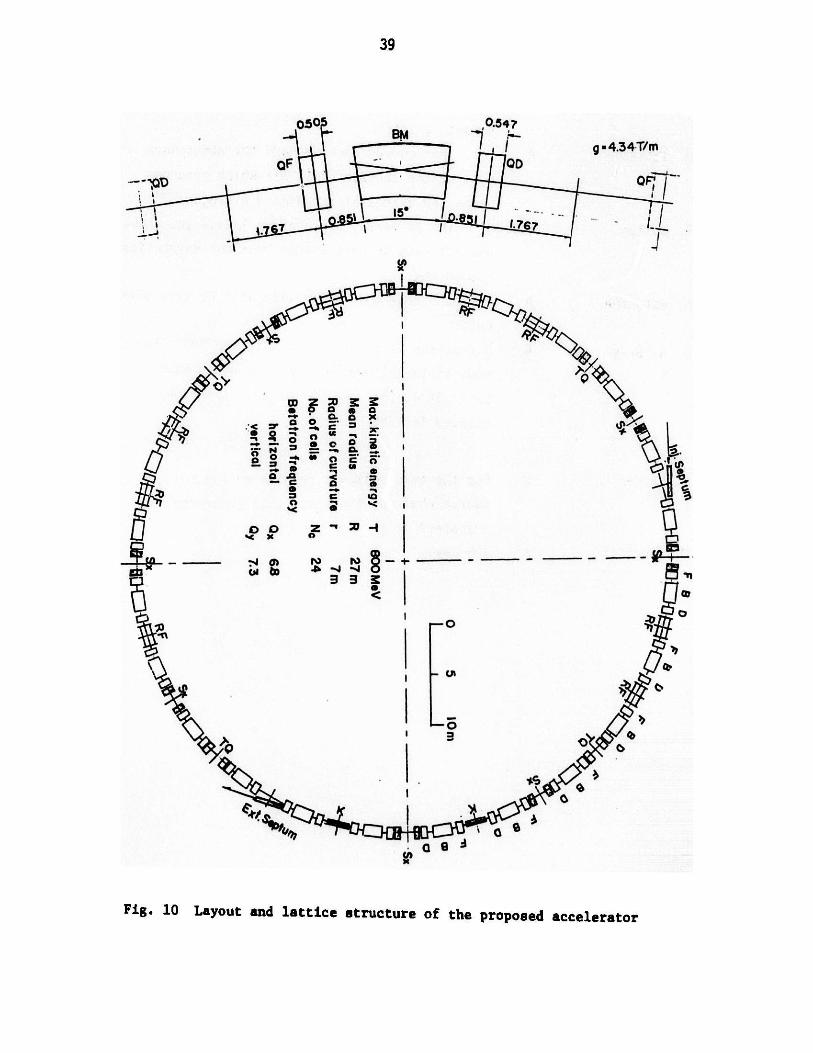
The rapid-cycling 800 MeV synchrotron of 54 m in diameter consists
of 24 FBDO cell-structures. In order to attain high space-charge limit,
the horizontal and vertical tunes are chosen to be relatively high,
i.e., 6.8 and 7.3 respectively. Figure 10 shows the layout of the
accelerator ring and the cell structure.
The emittance of H~ beam used for the injection at 80 MeV is small
compared to the desired 97 x 84 (cm-mrad)2 initial emittance for 6 x
1013 protons circulating in the synchrotron. To produce these emittances,
the H- beam must move both horizontally and vertically with respect to
their orbits during injection. In the horizontal plane, especially, the
beam emittance will be regulated by decaying the injection bump orbit,
which is formed with a pair of bump magnets.
Beam extraction is basically the single-turn extraction, which makes
possible the maximum use of the pulse structure of the beam in the
neutron and muon physics. The emittance of the extracted beam is assumed
to be twice of the expected one from the adiavatic damping of the initial
emittance. For the extraction of such a beam with a total 2 % momentum
spread, it is sufficient that each of two kicker magnets of 2.5 m in
length deflects the beam by 15 mrad in cooperation with some bump
magnets. The beam is extracted outwardly by angles of 110 and 380 mrad
in two septum magnets, respectively. Since the bunch spacing at 800 MeV
is about 160 nsec for the RF system with the harmonic lumberr of 2, the
rise time of the ferrite loaded kicker magnet has to oe less than 150
nsec.
The accelerator ring is made of 24 bending magnets and 48 quadrupole
magnets. The required semi-aperture of the good field region is 11.5 cm
x 9.2 cm for the bending magnet and 13.5 cm x 11.0 cm for the quadrupole
magnet. This defines the usable semi-size of the vacuum chamber. It
is necessary to add 3 and 4 cm in horizontal aperture of the bending and

27
quadrupole magnet respectively, to allow the room for the injection and
extraction of the beam. The synchrotron ring magnet is excited by 50
Hz, dc-biased sine-wave current. All of the bending and quadrupole
magnets are devided into eight or twelve groups. These ar-: connected in
series through resonant capacitors and forms a ring circuit. The dc
bypass for the capacitors is provided by installing chokes in parallel
to the capacitors and resonating the resultant tank circuits to 50 Hz.
In order to reduce the RF accelerating voltage, the magnet system would
be excited by a bi-resonant frequency system with the resonant frequencies
of 33 and 100 Hz as proposed by M. Foss and W. Praeg at ANL. Even in
this case, the max. voltage imposed on the exciting coil of the magnet
will be kept within 10 kV to the earth. This is achieved by using
hollow conductors of parallel current paths and by transposing those
paths each other at the connection points between coil pancakes. This
procedure will reduce eddy current loss as successfully applied at the
KEK booster synchrotron magnet.
It should be guaranteed that a single bunched beam is always supplied
to each of the neutron and meson experimental facility. This determines
uniquely the harmonic number of RF acceleration system !s 2. With the
80 MeV linac beam of 0.75 % full momentum spread, the emittance of such
an injected beam is 0.84 eV sec. If the RF bucket area has to be twice
of this emittance, the required maximum RF voltage is 200 kV for the 50
Hz operation and 150 kV for the 33 Hz operation of the guide field
magnet, respectively. Eight RF stations will provide with this accele-
rating voltage, each of which is installed in a 3 m long straight section.
The reduction of RF bucket area due to space charge will require higher
KF voltage. Therefore, the application of the bi-resonant frequency
system to the excitation of the guide magnet is significant.
The design study of this machine is only on the start point. In
addition to refining concept and hardware for each accelerator component,
the problem remains to be solved on the radiation protection and handling.
And also, some aspects of the designs may be changed in the process of
the design work.

28
Table 2 Parameters of the proposed accelerator
Maximum kinetic energyMaximum intensityRepetition rateAverage beam currentInjection energyInjection beamNumber of turns of injected beamBeam pulse width of injected beam
Magnet radiusAverage radiusNumber of periodLength of straight sectionStructureBetatron frequency
HorizontalVertical
Revolution frequency
Maximum beta-functionHorizontalVertical
Momentum compaction factorTransistion energy/rest energyBeam emittance
800 MeV80 MeV
Number of bending magnetsLength of bending magnetsLength of quadrupole magnets
Focussing magnetDefocussing magnet
Bending magnet field800 MeV80 MeV
Quadrupole magnet peak field gradient
Peak energy gain per turnHarmonic numberRF frequencyMax. RF voltageRF bucket areaNumber of RF stations
800 MeV6 x 10" p/p50 Hz (100/3 Hz & 100 Hz)500 VA80 MeV30 mA H->240>350 us
7.00 m27.00 m243.008 mFBDO
6.87.30.687 - 1.489 MHz
12.4 m12.9 m2.71 x 10-26.07
0.26 x 0.23 (mm rad) 2
0.97 x 0.84 (mm rad) 2
241.833 m
0.505 m0.547 m
0.697 T0.189 T4.34 T/m
94.9 keV (63.3 keV)21.374 - 2.978 MHz200 kV (150 kV)1.67 eV.sec
8
Incoherent space charge limit 7.7 x 10 1' p

29
REFERENCES
1) M. Kohgi, et al., presented paper to this meeting (1982).
2) N. Watanabe, S. Ikeda and K. Kai, presented paper to this meeting(1982).
3) J. M. Carpenter, N. Watanabe, S. Ikeda, Y. Masuda and S. Sato, tobe published.
4) N. Watanabe, H. Sasaki, Y. Ishikawa, Y. Endoh and K. Inoue, 1roc.ICANS-V (Jiilich, June 22 - 26, 1981) p. 21.
5) K. Inoue, et al., presented paper to this meeting (1982).
30
Fig. 1 Photograph of robot arm crane
31
6
5
4
3
2
1
0
5.00 10.00r (A)
Fig. 2 S(Q)'s (a) and g(r)'s (b) of Ni-B alloy glass
15.00
Ni-B alloy glass (neutron)
1.10 Ni-18at.
Ni-20atc/.3
4: Ni-33at%/B
-99 Ni-40at/.B
0.90
0 5 10 15 20 25 3C
o (A-)
Ni-B alloy glass(neutron)
Ni-20ato/.B
Ni- 33at/.B
Ni-40 at/. B
v
5
4
3
CD
2
0o.

0 05 (m) Neutron shield
Be filier
Evacuated spectrometer He countercontainer .
:.-Analyser mirror
Tur n t able :::..
to beam neutronstopper Beam monitor source
Low Q analyser Sample
Fig. 3 Configuration of the improved LAM
wA

33
150 200C
250 300HANNEL
350
(a)
EISF
n-=3
0
s=1.74
-
1 2I f Q(A-)3
(b)
Fig. 4 TOF spectrum (a) and calculated (solid curve)and measured (open circle) EISF (b) for chloroprene
at room temperature
4001
I.-
z
z
ch loropren
- 0=930
.
-S
-*
"
"*"i
1 I 1
1 II l
300
200
100
1.0
UI '
0
0.5}
I I

34
FE7OMN3O T-0.97TN
50
/
//. /
/"/
C..
t
-(meV)
/
I
/// f
*,f
-1.00 -0.50 o. 0.50 I.00
Q(a')
I - -. --;I IJ
FE7OIN3O T-0.72TN
1
I
I
r
FE7OflN3O . .T-l.23TN
5oT(meV )
40o
'30
, -,/"" r
-100 -0.0 0
/
/-
//
"
S .
0.50' 1.00
C (A-'.
Fig. 5 Intensity mapping of the magnetic excitations
in a yFeo, 7Mno.3 alloy at various temperature
FE7OfN3O T-1.06TN
(meV)I
40
30
|"
-1.00" - -. 3 0 - .CS0 1.00
- -)
W \ "
50meV)"/
-40.
-1.00 -0.50 0. 0.50 1.00
. Q(A')
v If
-.
35
13K .. 40 K" 0-
00 *0
* oQ***od
-0.20 0 0.20 -0.20 0 0.20
N45 K 0 65 K
0 0.20
P io"0 q :a 0
" o 0
-0.20 0 0.20 -0.20 0 0.20
Fig. 6 Two dimensional display of magnetic correlationin O.88FeTiO3 - O.12Fe2O3

FE-85 CR-15 T=1MM
H=900(Oe)7400
3000
200
I.A IA . A *.l ..* .*. .L - - -:3.13 3130 35.6 40.0 45.0 10.0
SQUARE OF WAVELENGTH (A 2 )(a)
CR-15 T=IMM
ANNEAL
H=92J (Oe)
I0o' too 1190 Ilea :9.4 nee 364 3. X6.0 40.0 10.6
SQUARE OF WAVELENGTH (A2 )(b)
Fig. 7 Polarization of neutron beams after transmissionthrough 1 um thick Feo.8 5Cro. 15 crystal,quenched from molten state (a), and after annealing (b)
36
101
SOT ANNEAL
0
H
H
I
I
6- -
FE-8510'
I
0H
4N
H
a4
10 - --
r. mw Iv.v I1.0 0.0

37
To - foil(300K)
(C H. Widths 0.25psec)
1140 1160 1180 1200
CHANNEL
(a)
.
-' . BI (room temp)with To detctor
c -
FN 0U)(
z
Fig. 8 Measured (solid circles) and calculated (solid curves)
time distributions of detecting probability
for 12 pm thick Ta foil at room Temp. (a), and
time spectra of scattered neutrons from Bi at room temp.
measured by Ta detector (b)
10050 20 10 7E (meV)
5 4 3 2 1
00 GROOVED
n
COUNTERes '
-j~> -- TARGET00 0
SLAB -'
00-.-We .
COUNTER ' ----TARGET .'.-
1050 100 150
CHANNEL (4Ops/ch)200 250
Fig. 9 TOF spectrum from a grooved solid methane moderatorat 20 K compared with that from a slab one
100
10
V)
0
11
39
0,0 ,0.547
I ~g-4.34-T/mOF OD
~OFO
. 7 i i1.767
JI p
-h * o 2
F . I yr
Fig 10 Laou and latc stutr f hrpsdceeao

KEK - N. Watanabe
Russell
N. Watanabe
R. Kustom
N. Watanabe
D. A. Gray
G. Lander
M. Kohgi
Q Was the corrosion you mentioned outside the
target canister?
A Yes. For convenience we made the atmosphere
outside the canister just air vhich produces
ozone and oxides of irradiated nitrogen.
Comment - The 24 period synchrotrc latice you showed
doesn't seem to have enough room for extraction
components.
A Yes it's true that extraction will be very diffi-
cult!
A Extraction is already hard with the SNS. For
KENS-II the allowable beam loss would have to
be < .3% on the same philosophy as the one
adopted for SNS.
Q For the quasi-elastic results on the cold
source what was the resolution in energy
transfer?
A 100 peV.
40

41
ICANS-VI
INTERNATIONAL COLLABORATION ON ADVANCED NEUTRON SOURCES
June 27 - July 2, 1982
STATUS OF THE SNQ PROJECT AT KFA JtLICH
G. S. Bauer
Institut far Festkorperforschung/Projekt Spallationsneutronenquelle
Kernforschungsanlage Jlich
D-5170 Jilich
ABSTRACT
The study for a high power spallation neutron source carried out jointly
by the Kernforschungszentrum Karlsruhe and the Kernforschungsanlage Jtlich has
been completed in May 1981. In Feb. 1982 the KFA Jtlich was selected as the
site for a future spallation neutron source in Germany. A final decision about
it construction does, however, require more planning work which will be car-
ried out by KFA until the end of 1983. A formal project SNQ has been estab-
lished at KFA, starting July 1, 1982. A staged concept for the realization of
the facility will be studied.

42
STATUS OF THE SNQ PROJECT AT KFA JULICH
G. S. BauerInstitut fdr FestkOrperforschung/Projekt Spallationsneutronenquelle
Kernforschungsanlage JdlichD-5170 Jlich
In March 1979, a special advisory panel to the German Ministry for Research
and Technology recommended to study the possibility of building a high power
spallation neutron source as a new central neutron research facility in the
Federal Republic of Germany. The chairman of this panel was G. zu Putlitz.
About two months later, in May 1979 the two major German laboratories for nu-
clear research, the Kernforschungszentrum Karlsruhe and the Kernforschungsan-
lage Jdlich established a collaboration to carry out such a study. The goal
was to finish the study work within two years. About half way through, in May
1980, an intermediate report was prepared for a panel (Pinkau-panel) appointed
to evaluate major proposed projects for foundamental research in Germany.
Based on this intermediate report, this panel concluded in February 1981 that
a new neutron source should be built in Germany and that, if feasible, this
should be a spallation neutron source. A further 3 to 4 year study period was
recommended to prove the technical feasibility of components which were con-
sidered as being critical to the success of the facility. The SNQ-study was
completed in June 1982, with the result that a spallation neutron source which
could be competitive with a high flux reactor in terms of time average neutron
flux and which would allow the users to benefit greatly from its time struc-
ture was feasible with present-day technology. This conclusion was based on
numerous experimental and theoretical investigations and had been essentially
confirmed by an international group of experts to whom the results had been
presented at Heidelberg. It was, however, clear that prototypes should be
built for certain components. The complete study report, which consists of
three parts in 16 volumes was handed over to the Ministry of Research and Tech-
nology in September 1981.
The general plan of the facility is shown in Fig. 1 and the main data of the
reference concept as worked out in the SNQ-study are summarized in Table 1.
The estimated cost of the facility was about 540 million DM for the accelera-
tor and proton experimental areas, 140 million DM for the target station and
130 million DM for the proton pulse compressor ring.

43
Accelerator type:
Type of particles:
Mean proton current:
Peak proton current:
Pulse repetition rate:
Injection an preacceleration:
Low energy accelerating
structure:
High energy acceleratingstucture:
Total length of accelerator:
Total power consumption:
Target type:
Target material:
Power dissipated in target:
Moderators:
Time average thermal neutronflux:
Peak thermal neutron flux:
Thermal neutron pulse width:
Number of thermal neutronbeam tubes:
Number of cold neutronbeam tubes:
Number of neutron guides:
Experimental areas:
Options:
Linac
Protons (H )
5 mA
100 mA
100 Hz
450 keV dc
Alvarez, 108 MHz, 450 keV-105 MeV
Disk and washer, 324 MHz, 105-1100 MeV
650 m
50 MW (whole facility)
Rotating target, H2 0 cooled
Pb, Al-clad
2,9 MW
H20, D20, Cold Source
7.1014 cm-2 s-1
1.3.1016 cm- 2 s-1
510 ps
12
2
12
350 MeV proton hall
1100 MeV proton hall
Target hall (thermal neutrons)
Neutron guide hall
Neutrino cavern
Target top hall (irradiation stations)
U-238 target (flux doubling)
10 mA proton beam (1 ms pulses)
Proton pulse compressor (0.5 ps pulses)
Target station with pulsed source
Table 1: Main parameters of the SNQ reference concept

44
Two possibilities were considered, to build the facility in a staged way such
as to be able to produce neutrons already well before the full sum has been
spent.
One possibility would be to build the target station as conceived and the
linac tunnel, but to equip the linac with accelerating structure only up to a
fraction of the final energy. It has been estimated that this energy could be
of the order of 350 MeV if about half of the total cost was to be spent on
stage 1. This would make it possible to serve the 350 MeV experimental area
and to produce neutrons in the target. The neutron flux levels achievable in
this way would be about 25% of those of the reference concept, but with the
early use of depleted uranium it could be brought up to t = 3e1014 cm-2 s-1
and 4 = 6.1015 cm-2s~1. The pulse length would be 510 ps. Further accelerating
structures could be added as funding becomes available, each time increasing
the neutron flux in the target. With growing operating experience with the
U-238 target, this might allow to achieve a time average thermal neutron flux
of 1.4.1015 cm-2 s~1 and a peak flux of 2.6e1016 cm-2 s-1 when the 1.1 GeV beam
is available and the target of depleted uranium is retained. As a last step
the proton pulse compressor would be built to provide a time structure suita-
ble for work with epithermal neutrons.
Another possibility for a staged realization would be to partly inverc the se-
quence of construction and to build the target station and the ring first. The
ring would than be laid out as a synchrotron initially, but its design would
take into account its later conversion into a proton pulse compressor. Desira-
ble specifications for such a synchrotron would be a proton energy of 1.1 GeV,
a repetition rate of 50 Hz and a time average proton current of 0.5 mA with
proton pulses of no more than 200 ns duration. This last requirement comes
from the desire to provide a good time structure for neutrino research and
certain applications of mesons right from the beginning. It would be tolerable
if two or three such pulses would be extracted from the ring at 10 Ns separa-
tion. For the thermal neutron pulse in the non-decoupled and unpoisonned mod-
erator this wculd hardly affect the pulse width, which is of the order of
150 ps. On the other hand, for work with neutrons in the epithermal regime
those subpulses should be joined together to give one pulse of less than 1 ps
duration. A synchrotron of these ratings may be close to the limits of feasi-
bility, but is still within reasonable extrapolation from existing concepts.

45
With a target of depleted uranium, a time average thermal neutron flux of
1.5.1014 cm-2 s-1 and a peak flux of 1.601016 cm-2 s-1 would be anticipated. The
high peak-to-average flux ratio results from (a) the reduction in pulse fre-
quency by a factor of two and (b) the shortening of the proton pulses which
gives a factor of about 3 in thermal neutron peak flux. While this peak flux
is higher than achieved in any neutron source so far, the time average flux of
this first stage would still be on the same level as that of the most powerful
research reactor presently operating in Germany (the FRJ-2, DILO, in Jilich).
It is a particularly attractive feature of this first stage that all the es-
sential design characteristics of the final concept are already realized, al-
though at only 10% of the intensity. Besides providing very good working con-
ditions for those disciplines which need short proton pulses, it would allow
to gain all the necessary experience e.g. in shielding requirements, target
operation and instrument design at the correct energy and time structure. The
linear accelerator needed for the injection into this synchrotron could be sim-
ilar in design to the high current linac to be built in stage II. It would,
however, operate at reduced load levels and thus allow to collect valuable ex-
perience. Also, its final energy would be likely to be of the order of 100-
120 MeV and it would thus make an ideal test bed for the high energy accelera-
ting structure of the linac which is yet to be examined under practical beam-
load conditions. Based on the experience from the injector, the high power
linac would be built in stage II. The goal should be to achieve a peak current
of 200 mA, while retaining the 5 mA time average value. Due to the shorter pro-
ton pulses and with a target of depleted uranium, the flux levels in the moder-
ators would then be I - 1.4.101s cm-2 s-1 and $ - 5.2-1016 cm-2 s-1. In stage
III the synchrotron would finally be converted into a proton pulse compressor
with similar pulse characteristics as before but with 10-fold higher intensity
(i.e. accommodating the full linac beam). Since the implementation of stage II
and III in this concept would not interfere with the operation of stage I re-
spectively II, transition from one stage to the other could be done with only
minor shut down periods. Also, since the operation of the linac with H -ions,
which is required for the injection into the synchrotron may be quite diff i-
cult to achieve, it would be conceivable that the synchrotron and the linac
could be working in alternating periods and thus ensure good time structure or
high flux values as dictated by the experimental program.

46
Table 2 gives a comparison of the two stages of the target station DIANE ac-
cording to this scheme (with synchrotron and with 200 mA linac) to other lead-
ing neutron sources in the world.
In February 1982 a decision was taken by the Federal Ministry of Research and
Technology in Germany that, if a spallation neutron source was to be built, it
would be located at KFA Jlich. KFA was asked to work out a detailed concept
for a staged realization of the facility and to establish a project plan.
Following this decision, the spallation neutron source was made one of the
prime research goals at KFA and the process of formal establishing the SNQ
project was initiated. On June 9 the supervisory board of the laboratory gave
its agreement to the foundation of the project. Fig. 2 gives a scheme of the
planned organization.
Following the Ministry's request, KFA will carry out studies for both of the
above staging concepts to a sufficient degree of detail that a decision, which
one to pursue further, can be made. Such a decision is envisaged for early
1983. For the concept selected, a more detailed plan and cost estimate togeth-
er with a general project plan will be worked out and submitted to the minis-
try to serve as a basis for the decision, whether or not the source should be
built.
__________HFR (ILL) ______IAN DIANE I DIANE U SNSPeak thermal flux m(crr2s1) 1015 2.1016 1.3.1016 1.7.1016 5.2.1016 4.5 .1015Average thermal flux 0(cm-2s 1) 1015 2.1013 7.104 1.5104 1.4.1015 7.1012Pulse repetition rate v (s-1) - 5 100 50 100 50
Pulse width_ _(_)s) - 150 510 150 270 30Fuel or target U-235(HEU Pu Pb U-238 U-238 U-238
periodicallyMode of operation critical per cri non-critical on-critical non-critical non-criticalCoolant D20 Na H2O H2O H20 D20Average tnermal power (MW) 57 4 2.9 1 10 0.25Moving parts - Reflector Target Target Target -
(5u.25Hz) (0.5Hz) (0.25Hz) (0.5 Hz)Options and extensions - Electron U-Target, multiplying Compressor
Induction Compressor target ringLinac ring (?)Source - Source -pulse 7ps pulse 0.7ps
e as studied in SNQ-report, Imox =100 mA, lo, =5mAPb TargetDIANE I: v = 0.5 mA, U -238 TargetDIANE II: by = 5r A, Imx =200mA,U-238 Target
Table 2: Comparison of modern neutron sources

IJU
- LJ _ L L I l I l+a w >N > w su
-1--- I -I~F15
Injector buildingAssembly hallRF-galeryDirt shieldingTest and assembly buildingOperations building350 MeV experimental hall
8910I1121314
Air stackSwitchyard20 kV power distribution
Cooling towersRF power suppliesHigh energy beam switchyardAssembly hall
15161718192021
1100 MeV experimental areaCooling towersAirstackTarget buildingNeutron guide hallProton pulse compressorSite entrance
Fig. 1: Site Planning of the SNQ reference concept
234567

48
Scientific AdvisoryPanel
Board of Directors
Chairman: W. H&fele
SectionProjects and Programs
P. Engelmann
KFA ScientificCouncil
Project Commission
Project ManagerProject Planning
Group --.. H. H. Stiller
G. S. Bauer
Project Staff
Sub-Project Sub-Project"Accelerator" "Target Station"
Sub-ProjectUtilization and
Sc Instrumentation
Sub-ProjectBuildings and
Utilities
Fig. 2: Preliminary Organizational Diagram of the Projectnenquelle at KFA J~lich
Spa llations-Neutro-
a 0

49
SIB - G. Bauer
R. Silver
G. Bauer
W. E. Fischer
G. Bauer
F. Mezei
B. Brown
G. Bauer
QA
What is the cost of stage 1 of SNQ?
400 M DM.
Q What is the neutron flux produced by stage 1?
A At 350OMeV with a U target = 3 x 10¹⁴ and
$ is 20 times higher.
Comment - It is not correct that all instruments
will use the mean flux. Spin echo would
have velocity selectors using ~ 20% of the
wavelength range so the relevant flux is
the peak.
Q What is the status of the radiation effects
facility?
A There is nothing very special in mind. We
are thinking of a low temperature facility
which could be put into the reflector tank
or target area when needed.

50

51
ICANS-VI
INTERNATIONAL COLLABORATION ON ADVANCED NEUTRON SOURCES
June 27 - July 2, 1982
STATUS OF THE WNR/PSR AT LOS ALAMOS
R. N. SilverPhysics Division
Los Alamos National LaboratoryLos Alamos, NM 87545
ABSTRACT
A proton storage ring is presently under. construction at Los
Alamos for initial operation in 1985 to provide the world's highest
peak neutron flux for neutron scattering experiments. The
operational WNR pulsed neutron source is in use for TOF instrument
development and condensed matter research. Experimental results
have been obtained in incoherent inelastic scattering, liquids and
powder diffraction, single crystal diffraction and eV spectroscopy
using nuclear resonances. Technical problems being addressed
include chopper phasing, sci nti 1 lator detector development,
shielding and collimation. A crystal analyzer spectrometer in the
"constant Q" configuration is being assembled. The long range plan
for the WNR/PSR facility is described.

52
The Los Alamos pulsed spallation neutron source, the WNR/PSR is
progressing toward its goal of a world class facility in 1985. This
will provide a peak thermal flux of 1016 n/2-s at 12Hz, with a
time average current of 100 pA of 800 MeV protons. Construction has
commenced on the Proton Storage Ring (PSR), which will compress the
750 u sec long macropulses from the LAMPF accelerator to a .27 psec
proton pulse width more suitable for time of flight neutron
scattering experiments. Construction is presently on schedule and
within cost, with the first proton beam expected in March 1985.
In this paper, the emphasis will be on the progress and plans
of the neutron scattering research program and instrumentation at
Los Alamos. The WNR is presently an operational spallation neutron
source, with a time average current of 4-5 uA of 800 MeV protons at
a proton pulse width of 5 psec and a repetition rate of 120Hz.
This makes it possible to test novel TOF instrument developments, to
explore the unique science made possible by these sources, and to
develop the expertise of the scientific staff by research
experience. The goal is to have mature instrumentation, research
programs, and staff by 1986 to maximize the scientific impact of the
much superior source characteristics of the PSR.
Neutron scattering instrumentation at Los Alamos has advanced
considerably since the last report at ICANS IV. Figure 1 shows the
current layout of instrumentation at the WNR. Three instruments,
which were in an assembly or testing stage two years ago, are
presently in a production mode for condensed matter research. These
are: 1) a general purpose diffractometer (GPD) for powder,

53
liquids, and amorphous materials diffraction; 2) a single crystal
diffractometer (SCD) based on the Laue-TOF technique; and 3) a
Be-BeO filter difference spectrometer (FDS) for incoherent inelastic
scattering. A prototype eV spectrometer using nuclear resonance
filters (EVS) is operational. Testing and assembly has commenced on
a constant Q spectrometer for the measurement of elementary
excitations in single crystals, particularly at high energies. In
addition, the vexing problem of phasing neutron choppers to the
power line used to trigger LAMPF has been solved. Systematic
studies have commenced of shielding and data acquisition
requirements for the much higher intensities of the PSR era.
The filter difference spectrometer, shown in Figure 2, uses the
differing Bragg cutoffs of Be and BeO to improve the resolution of
the filter detector. techniques (see the article by J. A. Goldstone,
et.al., in these proceedings). Figure 3a shows the raw Be filter
spectrum from KH Maleate, while Figure 3b shows the improvement in
resolution obtained by taking the difference of Be and BeO filter
spectra. A comparison of the performance of the FDS with the
crystal analyzer spectrometer (CAS) (Figure 4) is shown in Figure
5. These were obtained on approximately 30g samples with 100 pA-hrs
of beam. The FDS has comparable resolution to the CAS with greatly
improved count rate. In the final version, a further factor of 4
improvement will be obtained for the FDS by cooling the filters to
77 K and increasing the detector solid angle. An example of
research with the FDS is shown in Figure 6 and 7.
Ni-Dimethylgloxine is a molecule with an intramolecular hydrogen

54
bond. The vibrational frequency of the out of plane bending mode
y(OHO) of this hydrogen is obtained by observing the change in
spectrum upon deuteration (Figure 6). Measurements of this kind
were used in a systematic study of the variation of the vibrational
frequency with bond length. The question was whether the trend
observed with the longer bonds of the intermolecular cases would
continue for the shorter bonds of the intramolecular cases. The
results (Figure 7) show a clearly different trend. The FDS and CAS
have also been used for studies of hydrogen optic modes in metal
hydrides and for complementary measurements to IR and Raman in
chemical spectroscopy.
The general purpose diffractometer is shown in Figure 7. The
150' bank provides for medium resolution (ed/d ~ .45) powder
diffraction. The low angle banks at 40' and 10' are especially
important to minimizing inelasticity connections in liquids
diffraction. In this paper, the emphasis will be on recent work on
the structure of water with the GPD. The quantity sought in a
diffraction experiment is the static structure factor S(Q).
However, the quantity measured is a differential cross section
I(Q;. These are simply related to each other only in the case of
completely elastic scattering. In the case of light elements, the
recoil of the particle from which the neutron scatters leads to
large inelasticity corrections required to extract S(Q) from 1(Q).
Examination of the kinematics shows that the corrections can be
minimized by scattering at low angles with high energy neutrons to
achieve a given Q. This is demonstrated in a comparison of the

55
performance of the GPD with the 04 instrument at the ILL shown in
Figure 8. The structure factor S(Q) is expected to oscillate about
the static self scattering limit at high Q. However, the measured
cross section at the ILL droops far below the self scattering
limit. At a reactor, high Q is reached at a fixed wavelength by
scattering at large angles with a consequent large inelasticity
correction. In contrast, the result for the GPD at 40 is much
closer to the static limit because high energy neutrons (up to 1.7
eV at 20O1) are used to reach high Q. Thus, it is possible at
the WNR to analyze liquids diffraction data without introducing
questionable models for the inelastic scattering. Note also the
competitive count rate of the GPD and the larger Q range
obtainable. The water experiment involved taking a linear
combination of cross sections obtained on isotope substituted
samples (H20, D20, and an H20:D20 mixture), to extract the
HH distinct cross section. Because of the minimal inelasticity
effects, this can be compared directly with molecular dynamics
simulations of the structure of water as shown in Figure 9.
Remarkable overall agreement is obtained between theory and our
model independent experiment. The differences correspond to a
somewhat smaller coordination number and bond lengths in the
experiment compared to the simulations.
The single crystal diffractometer shown in Figure 10 uses a
25 x 25 cm He3 multiwire area detector to collect data in a time
resolved Laue technique. Figure 11a shows the intensity as a
function of x and y on the detector for the sum of all time channels
56
in a sapphire sample. Figure 11b shows a single time channel with a
single Bragg peak. We have worked closely with ANL in the
development of software to derive integrated intensities from the
data. Structural refinements on test crystals have produced R
factors, thermal parameters, and lattice positions comparable to
X-ray and single wavelength reactor experiments. One very
encouraging result is that data rates with this instrument at the
present WNR are comparable to a four circle diffractometer at BNL.
This shows the advantages of the combination of white beams with
multidetectors to obtain high data rates. However, backgrounds were
much higher than at BNL primarily due to the poor shielding
currently available. Upgrade of the instrument will include
improved shielding and collimation, a two-axis goniometer, and the
use of position sensitive scintillator detectors.
Two instruments are being tested in prototype form. We have
developed an eV spectrometer based on the use of nuclear resonances
for energy selection (see the article by Brugger, et.al., in these
proceedings). The technique is to take the difference between
spectra with resonance filters in the beam and removed. Figure 12
shows the scattering from liquid He using the U 238 resonance at
6.6 eV in a direct geometry. The peak at 3.5 eV energy transfer is
from the He while the peak at .69 eV is from the Al container.
Tests of resolution in direct, inverted, and sample geometries have
been carried out. We are currently examining possible detector
configurations. The initial experimental effort is on momentum
distributions in hydrogenic systems. We are also developing a

57
constant Q spectrometer similar to C. Windsor's design primarily for
the measurement of high energy elementary excitations in single
crystals such as magnons. Considerable attention is being paid to
the calibration and alignment of the spectrometer. Resolution
calculations suggest that the constant Q machine will have
complementary characteristics to triple axis spectrometers at
reactors. Preliminary experiments have suggested that competitive
data rates will be obtained with the PSR.
We are also addressing several of the technical problems of
pulsed sources. This includes chopper phasing (see the article by
Bolie, et. al., in these proceedings), beam line collimation and
shielding, and scintillator detector development. The approach to
collimation and shielding has included empirical tests, the
development of detectors to measure neutron energy spectra, and
Monte Carlo simulations. The detector effort has concentrated on
improving the speed and lowering the y sensitivity of Anger
scintillator cameras.
The long range plan for the WNR/PSR is to have a total of eight
neutron scattering instruments operational by 1986 when the PSR is
expected to come into reliable operation. These include upgraded
versions of the filter difference spectrometer (FDS) and single
crystal diffractometer (SCD) currently in operation. The present
general purpose diffractometer will be replaced by two instruments:
one a low resolution (1-20) machine with small angle capability
optimized for liquids, amorphous and special environment diffraction
(LIQ); and the other a high resolution ( .15%) powder

58
diffractometer (HRPD) on a 35 m flight path. We also expect to have
a high resolution chopper spectrometer (CS), an eV spectrometer
(eVS) and a constant Q machine (CQS) all optimized by research
experience on the present WNR. Figure 13 shows a possible layout of
condensed matter instruments at the WNR in 1986, where we have added
a quasielastic backscattering spectrometer (BSS). The figure also
shows the powder diffractometer in low resolution (lOm)
configuration (LRPD) prior to PSR operation. We show on f.p. 11
that it is possible to place more than one instrument on a beam line
if the flight paths are long.
This is a report of work by personnel and collaborators of the
neutron scattering group, P-8, at Los Alamos. This includes A.
Soper, J. Eckert, J. Goldstone, P. Seeger, P. Vergamini, A. Larson,
R. Alkire, R. Brugger (P4JRR), A. Taylor (Rutherford-Appleton
Laboratory) and R. Pynn (ILL).

59
WNR CONDENSED .AT TER INSTRUMENTSFP 8June '82
- FPS FP 10
FDSGP
.Fr 6 ' SCD /- -C per -
NP P
Fig. 1. Current layout of neutron scatteringinstrumentation at the WNR. NPstands for flight paths assigned tonuclear physics. GPD is the generalpurpose diffractometer, SCD thesingle crystal diffractometer, FDSthe filter difference spectrometer,CAS the crystal analyzer spectro-meter, and EVS the electron voltspectrometer.
Fig. 2FILTER DIFFERENCE SPECTROMETER
DETECTORBANKS
s
15 cm
L 0
Schemat ic layout of theFilter Difference Spec-trometer for incoherentinelastic scattering.The filter provides aBragg cutoff to thefinal energy bandpass.The difference betweenBe and BeO filter spectrais taken to improve theresolution of the filtertechnique. (3b)
TTe
13 m 0.28 m

60
K H MALEATE
.g . m U . . _ N. 1. . m m = -
Be
I.
I (
-
'S
Li
S.. .. .
II Be - BOO - - t
., -. . I
I .4~I
Fig. 3abb
Comparison of the spectraobtained on KH Maleateusing a Be filter (3a)and the Be-BeO filterdifference tecnique.
Fig. 4
Schematic layout of thecrystal analyzer spec-trometer. The analyzercrystals are pyrolyticgraphite.
TOSHIELDING BEAM DUMP
o3Hte DETECTORBANK
I I
COOLEDBERYLLIUM
SAMPLE
A,(NLYZER CRYSTALS
EEAM MONITOR
INCIDENT FLIGHT PATH
-
' I- r
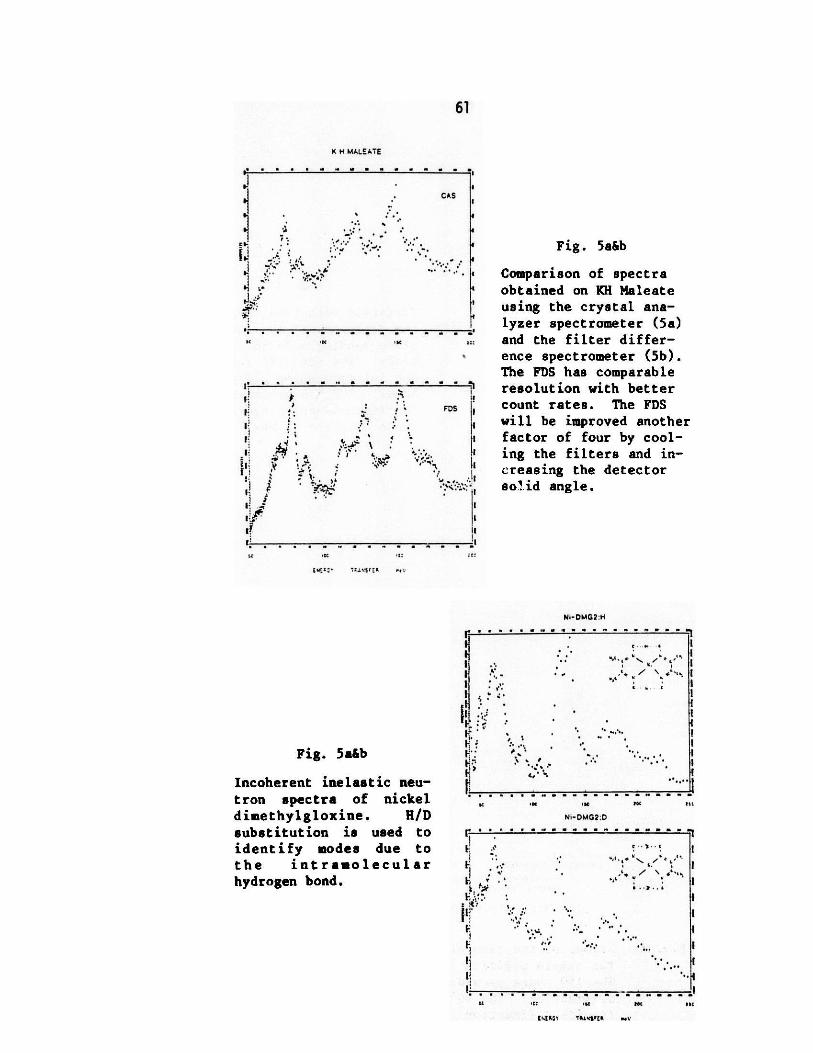
61
K H MALEATE
CASII- I
. -
. -.. .
I~~a- I
FDS f
* -1
- I1
E ii
- -
Fig. 5ab
Incoherent inelastic neu-tron spectra of nickeldimethylgloxine. H/Dsubstitution is used toidentify modes due tothe intramolecularhydrogen bond.
Fig. 5abb
Comparison of spectraobtained on KH Maleateusing the crystal ana-lyzer spectrometer (5a)and the filter differ-ence spectrometer (5b).The FDS has comparableresolution with bettercount rates. The FDSwill be improved anotherfactor of four by cool-ing the filters and in-creasing the detectorsolid angle.
N.-DMG2:H
" .' - ' .....-- -' --" --' *F
r . 1
(1 I I
Ii .-
f -
. .. . . ... . . . . . .
'f" " R f f. r r .f fr
ti .. I o It
FIt ' ....VF .r

62
'20
~(OH0)/Cm-rY'
2 55
250
00
KH
240 - Y KHMCINi-DMG2
IS
300
FUTURE DETECTOR DANK(SPECIAL ENVIRONMENT DIFFRACTION)
CANTED ARRAY OF 16 5% BORiON LOADED30cm x 13cm3He POLYETHYLENE SHIELD
DETECTORS
IIEAVY BORNLOADED I
SHIELD
BORON ^O GET LOST
LOADED PIPE-PARAFFI ; WAX--
-Li
16 15cm K 1-33 lieDETECTORS (mforo Iu
BEAM be added in Imlure)
COLLIMA OR
EVACUATE /ARGON TRANSMISSIONSAMPLE ENVIRONMENT MONITOR
INCIDENT BEAM TRANSLATION/ROTATION TIIIN TITANIUM ORMONITOR SAMPLE STAGE ALUMINUM WINDOWS
GENERAL PURPOSE DIFFRACTOMETER
Fig. 8. Layout of the general purpose diffractometer.The sample position is at 10m from the source.The 150* bank provides .45% resolution powderdiffraction. The 40' and 10' banks are forliquids diffraction. The evacuated/argonsample environment is under construction.
Fig. 7
Variation with bond length ofthe frequency of the out ofplane bending mode in hydrogenbonds. The dots are resultsfor intermolecular hydrogenbonds. The X's are resultsfor intramolecular hydrogenbonds obtained at WNR.
iGGG i10
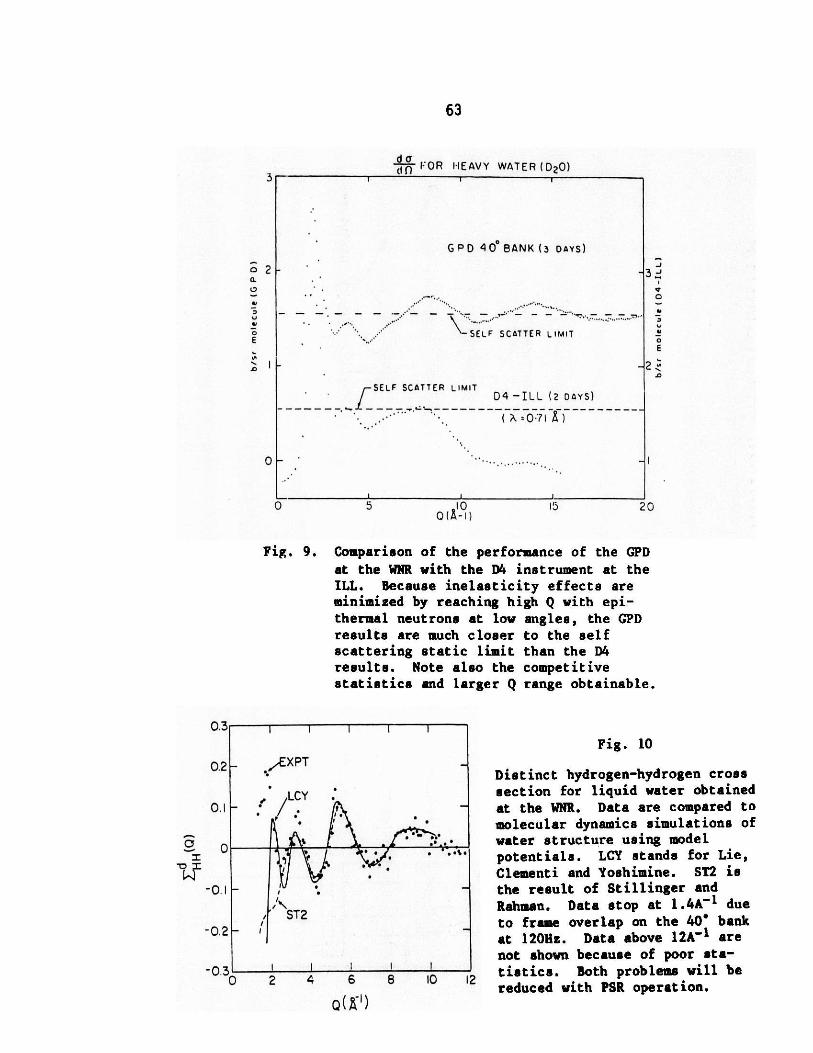
63
df)FOR HEAVY WATER (D 20)
0 5 101Q(A-I)
15
-J
30
0
E
.0
20
Fig. 9. Comparison of the performance of the GPDat the WNR with the D4 instrument at theILL. Because inelasticity effects areminimized by reaching high Q with epi-thermal neutrons at low angles, the GPDresults are much closer to the selfscattering static limit than the D4results. Note also the competitivestatistics and larger Q range obtainable.
0.
02
0.
-0.
-0.
5
2 ,EXPT
LCY .
2~ ' -
3 1
Fig. 10
Distinct hydrogen-hydrogen cross
section for liquid water obtained
at the WNR. Data are compared tomolecular dynamics simulations of
water structure using model
potentials. LCY stands for Lie,
Clementi and Yoshimine. ST2 is
the result of Stillinger andRahman. Data stop at 1.4A- 1 due
to frame overlap on the 40' bank
at 120Hz. Data above 12A- 1 are
not shown because of poor sta-
tistics. Both problems will bereduced with PSR operation.
3
0 20.0
0
E
.0
0
G PD 40 BANK (3 DAYS)
SELF SCATTER LIMIT
I-SELF SCATTER LIMIT- - D4 -ILL (2 DAYS)
-0 122 4 6 8 10

SINGLE CRYSTAL PULSED NEUTRON DIFFRACTOMETER
INCIDENT BEAM
ETrR -. 45"
- 9
:l; --
2 :ijgAREAEC OE ---
- - GET LOST PIPE
MERCURY RESERVOIR
.AREA DETECTOR
BEAM COLI.IMATOR
GONIOMETERMOUNT -
ROTARY TABLE[ . '
- GET LOST PIrEF
Fig. 11. Layout of the Laue-TOF single crystal diffractometer.The detector is a He3 multivire counter.
GONI'

1
Fig. 12a. Intensity vs position on the areadetector for a sapphire crystalwith all time channels compressed.
4 it p7t -
Fig. 12b. Intensity vs position on the areadetector for a sapphire crystaland a single time channel.
0u-
r
Spectrum He
10000
.69
01
N'.7. :b)
0.003'U-230 fIltor warm
fluns 106-114
3.5
/ I
Citannol (0.4ias)
U'l
1(XX)
Fig. 13. Inelastic neutron scattering data onliquid He obtained with the electronvolt spectrometer using a warm U 2 3 8
filter with a resonance at 6.6 eV.The peak at 3.5 eV transfer is dueto the He. The peak at .69 eV trans-fer is due to the Al container.

F r o'/FP 0
-K FP9
COS
FP6
LIQ
FP,1 FP
J FP 2NFP 2Fr 35mn
ss
evS y
I
WNR CONDENSED MATTER INSTRUMENTSMoy, 1986
Fig. 14. Possible layout of neutron scattering instruments at the WNRin 1986 after the PSR begins operation. Labels are as in test.

WNR - R. Silver
J. Meese
R. Woods
J. M. Carpenter
A. D. Taylor
S.
A.
K. Satija
D. Taylor
H. Wroe
R. Silver
67
Q What are the milestones for construction of PSR?
A All components should have been delivered in
1984 and construction complete in 1985.
Comment - You may have been unfair to your results in
comparing WNR diffraction data with that from
BNL because the BNL background is in 2 dimensions
whereas yours is in 3 as a TOF measurement.
Comment - Improving the shielding in a neighboring
instrument (the Be filter) reduced the back-
ground in the single crystal diffractometer
by an order of magnitude.
Q What is the background like on the GPD?
A In this case the background arises from air
scattering inside the GPD itself.
Q How long do you think you will take to work
PSR up to full intensity?
A About 1 to 2 years.

68
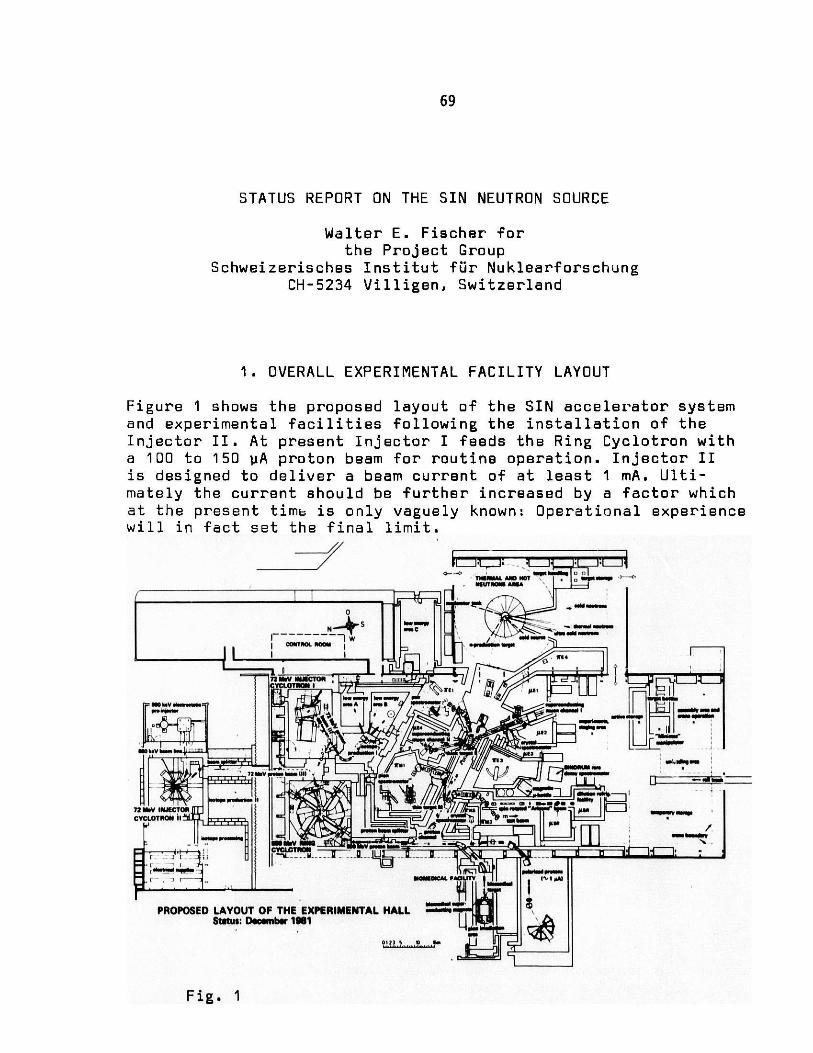
69
STATUS REPORT ON THE SIN NEUTRON SOURCE
Walter E. Fischer forthe Project Group
Schweizerisches Institut fur NuklearforschungCH-5234 Villigen, Switzerland
1. OVERALL EXPERIMENTAL FACILITY LAYOUT
Figure 1 shows the proposed layout of the SIN accelerator systemand experimental facilities following the installation of theInjector II. At present Injector I feeds the Ring Cyclotron witha 100 to 150 VA proton beam for routine operation. Injector IIis designed to deliver a beam current of at least 1 mA. Ulti-mately the current should be further increased by a factor whichat the present time is only vaguely known: Operational experiencewill in fact set the final limit.
L1121. yz~-- --q 1
72 M.V' .NrCTO Mw9 , n ~ ..d e
THIPU AD OT E E E AL*NUUTNO ARIA
0
j~~a m.RIIL rMm
I I
CYCLOTRN I1
LAYOU OF THE EXEIMNALHLStatus: Decmbe 1961WM
Fig. 1

70
The present status is as follows:
Injector II is under construction.
Improvement of the proton channel for high current
operation is in the design stage.
The spallation neutron source design is progressing.
2. TIME SCHEDULE
First beam from Injector II is expected towards the end of 1983.During 1984 and 1985 the intensity limits will be explored. Inorder to accelerate a 1 mA beam in the Ring Cyclotron to 590 MeV;the RF-power has to be increased. The proton channel, includingthe meson target stations, need considerable improvement toallow full exploitation of this higher current. This task willnow be accomplished during two long shutdown-periods, presumablythose in 1984/85 and 1986/87.
The spallation neutron source, recommended by the Federal ScienceCouncil, and now approved by the Federal Schools Council, isscheduled for funding as from 1985.
Fig. 2The 72 MeV Injector II under construction in May 1981.The prototype of the 50 MHz-resonators is installedbetween two sector magnets.
. i Rol ffm .

71
3. INJECTOR II
This is a 72 MeV Isochronous Cyclotron, and is, in its principles,very similar to the 590 MeV Ring Machine. Figure 2 gives an im-pression during the state of construction. It will be fed by a860 kV Cockcroft-Walton generator as a pre-accelerator.
Fig. 3View showing tle main components of the 860 keV pre-accelerator: the Cockcroft-Walton generator designedfor 900 kV (left) and the high voltage dome (right)which will house the ion source and the 60 keV beamline.
An artist's impression of the beam transport from the Cockcroft-Walton generator and the vertical injection system are shown inFig. 4.
4. NEUTRON SOURCE
Among the different versions discussed at the last ICANS-meetings,we now prefer the arrangement with a vertical liquid metal target(beam injected from below) using natural convection as coolingmechanism. A cross section, showing the principle of this sourcetype, is given in Fig. 5.
The design of a vertical Pb/Bi-target needs a rather careful inves-tigation of the thermo-fluid dynamics which is driven by the
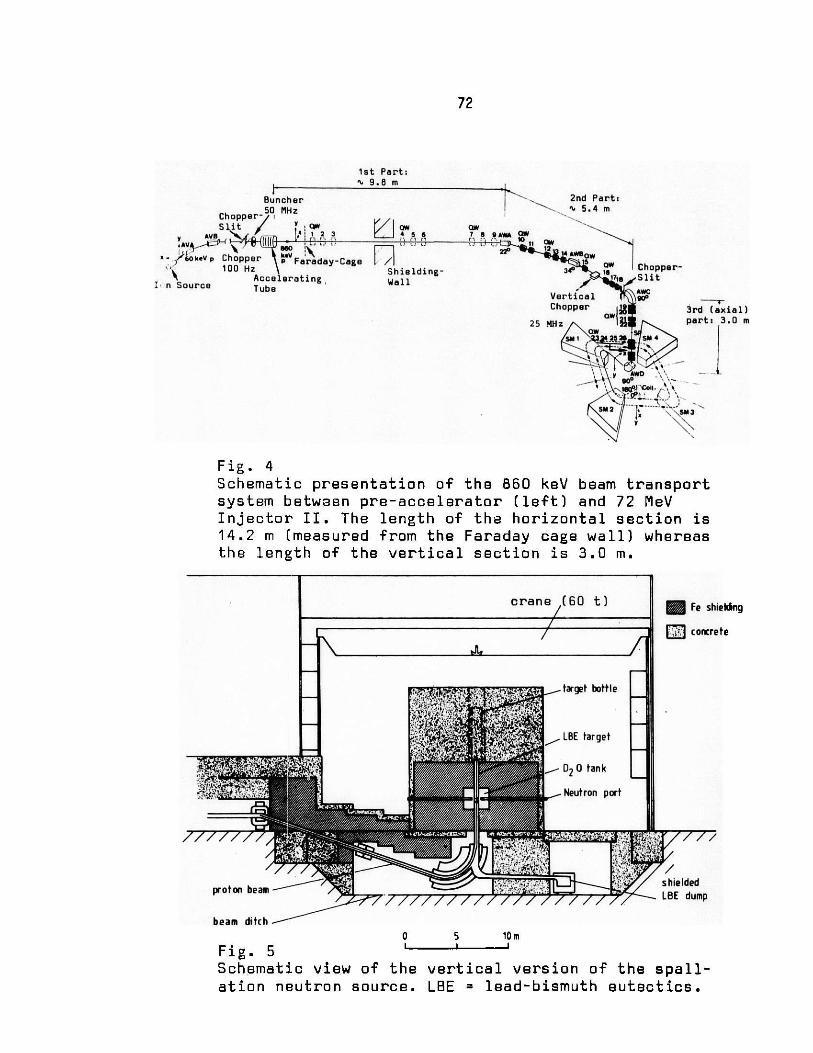
72
1st Part:t 9.8 m
Buncher50 MHz
Chopper- 5Slit f 3
- keVp Chopper 0 Faraday-Cage100 Hz
\ n uAccelerating,I" n Source Tube
Shielding-Wall
2nd Part:t5.4m
ow7 8 9 wA
- 10 it o2 12 1 w
340 ow Chopper-
Vertical 9'-Chopper 8 3rd (axial)
25 MHz ow 1 part: 3.0 m
1M 2526 SM 4
2 AW M
Ise!' Coll. /
\ SMx -S
Fig. 4Schematic presentation of the 860 keV beam transportsystem between pre-accelerator (left) and 72 MeVInjector II. The length of the horizontal section is14.2 m (measured from the Faraday cage wall) whereasthe length of the vertical section is 3.0 m.
crane (60 t)
/ /VA.
0 5 10 m
/ Fe shieking
" concrete
Fig. 5 I
Schematic view of the vertical version of the spall-ation neutron source. LBE = lead-bismuth eutectics.
proton beam --shieldedLBE dump
beam ditch

73
buoyancy force caused by the heating of the lower part of thetarget by the proton beam. A program of work to study the be-haviour of such systems theoretically and experimentally is underway. In Fig. 6 we show a typical set of flow-patterns and tem-perature distributions for some time sequence after switching ona beam. This subject will be treated in a special paper to thisConference [1]. Some effort is still needed to find the optimalconfiguration of the target for most effective cooling.
a b c d e f g h
Fig. 6Transient behaviour for 3 m target of 15 cm radius.Beam current is 100 pA. Contour-maps are for temperature(above) and stream function (below). For temperaturecontours, the lowest line is 3.1 0 C above melting point,and line interval is also 3.1 0 C. "a" is at 2.55 sec, andinterval between two figures is 5.10 sec.
On the neutronics side, further measurements of flux distributionsin moderators have been made by the JGlich-Karlsruhe-SIN collab-oration. One of the flux maps, relevant to the planned SIN-source,is shown together with its comparison with a Monte-Carlo simu-lation (Fig. 7). This setup had an annular void gap between targetand moderator. Other configurations and their comparisons arepresented in another paper to this Conference [2]. By means ofthese flux distributions for thermal neutrons in the D20 moder-

74
ator, we may find the optimal position of the cold source aswell as the position and size of the beam tubes.
70
60
~50
40
301U.
Z20
0
0
- " --- - EXPERIMENT REF. 4
goo
5x113
"xftmoo'dow - of-. "b x101
.
" -30 -20 -10 0 10 20 30 40 50 60 70
z, AXIAL DISTANCE FROM FRONT FACE OF TARGET [CM I
Fig. 7Comparison of calculation and experiment for thethermal neutron flux in a D20 moderator. 590 MeVprotons incident on a 15 cm diameter Pb/Bi-target.Intensities in units of neutrons cm- 2 sec-1mA- 1 .Measured® and calculated U peak flux = 8.6.1013
neutrons cm- 2 sec- 1 mA- 1 .
Further activity is concerned with the heat dissipation in thevicinity of the spallation target - a topic particularly import-ant for the design of the cold source. Model calculations for anexperimental setup at the TRIUMF-source have been done for sev-eral sample materials. The results are presented in a third paperto this Conference [3]. The experimental run is scheduled atTRIUMF for November 1982.
5. ACTIVITIES FOR THE NEAR FUTURE".
Below we give a list of experimental activities planned to berealized during the second part of 1982 and in 1983:
(i) Irradiation tests of window materials at LAMPF.
(ii) Heat dissipation measurements in the vicinityof a spallation target. This experiment will bedone at TRIUMF in collaboration with KFA-Jllich.

75
(iii) Model experiments for thermo-fluid dynamics ofthe liquid metal targeta) water modelb) Pb/Bi model
(iv) Mock-up experiment at the SIN proton beam fortests of several configurations of cold sources;in collaboration with KFA-Julich and TU-Munich.
6. INSTRUMENTATION
A list of spectrometers to be installed at the source has beengiven at ICANS-V. A recent reinvestigation among the presentusers in Switzerland of neutron scattering facilities has notchanged this situation.
Presently there are five neutron spectrometers at the reactor"Saphir" fully booked up. Furthermore, spectrometer time abroad- mainly in Grenoble and Rise - is used by Swiss groups. Accordingto the investigations there will be requirement for about twicethe present number of spectrometers in future. In this sense, theSIN spallation source may be exploited by experiments of our ownresearch groups.
International participation in the experimental program, es-pecially at the guides for cold neutrons, where some spare timeis likely to be available, is however strongly urged.
REFERENCES
[1] Y. Takeda, Thermofluid Dynamics of the Liquid Lead-BismuthTarget for the Spallation Neutron Source at SIN,These proceedings
[2] F. Atchison, W.E. Fischer and B. Sigg, Some Aspects of theNeutronics of the SIN Neutron Source,These proceedings
[3] Monte Carlo Study of the Energy Deposition of a Flux ofSpallation Neutrons in Various Samples,These proceedings

76
SIN - W. Fischer
D. A. Gray
W. Fischer
A. Carne
W. Fischer
H.
W.
Wroe
Fischer
Q Will you have space charge problems in the
860 kV beam in injector??
A Yes we probably will. That's why we've
allowed 1-2 years to work up. The 40 eV
beam from the source has been operated
at full intensity space charge neutralisation
occurs when argon at 10-5 Torr is the back-
ground gas.
Q Have you integrated the flux to get the neutron
yields?
A Yes and we also have other estimates at yields.
We think there will be 10n/proton at 590 MeV.
Q How many hours a year will you run?
A We haven't got an exact figure yet, but the
neutron source parasites on the main machine
which has only one long shutdown of 1 month
in a year.

77
ICANS-VI
INTERNATIONAL COLLABORATION ON ADVANCED NEUTRON SOURCES
June 27 - July 2, 1982
INTENSE PULSED NEUTRON SOURCE (IPNS) AT ARGONNE NATIONAL LABORATORY (ANL):
A STATUS REPORT AS OF JUNE, 1982
J. M. Carpenter, C. W. Potts and G. H. Lander
Argonne National Laboratory, Argonne, Illinois 60439 U.S.A.
ABSTRACT
In this status report a general overview is given of the IPNS program.
The facility has been operating since August 1981 and in a routine way for
outside users since November 1981. The accelerator performance has been
exceptional. Most instruments are now operational, or nearly so. For
details of the individual instruments and experimental program the reader
is referred to papers later in these Proceedings.
Paper to be published in an Argonne National Laboratory Internal Report aspart of the Proceedings of the International Collaboration on AdvancedNeutron Sources (ICANS-VI) held at ANL, June 27-July 2, 1982.

78
INTENSE PULSED NEUTRON SOURCE (IPNS) AT ARGONNE NATIONAL LABORATORY (ANL):
A STATUS REPORT AS OF JUNE 1982
J. M. Carpenter, C. W. Potts, and G. H. Lander
Argonne National Laboratory, Argonne, Illinois 60439
1. INTRODUCTION
The Intense Pulsed Neutron Source (IPNS) has been operating since Octo-
ber 1981. The performance of the accelerator has been exceptional. From
November 1 to May 5 it delivered protons for a total of 2175 hours at an
average current of 8 pA and an operating efficiency of 88%. In this period
of time some 80 experiments have been run at IPNS. Details of some of these
will be found in the individual instrument papers. Figure 1 shows the layout
of the experimental facilities. At this time three beams are unassigned,
although two of them are being temporarily used for radiation damage experi-
ments. As will be discussed in more detail, we now have 6 operational scat-
tering instruments, 2 instruments in the testing stage, and 3 special ex-
periments that are being set up on the neutron beams. Two cryogenic fast
neutron irradiation facilities are operating.
2. IPNS-I ACCELERATOR SYSTEM
At the time of the ICANS-V meeting, the Rapid Cycling Synchrotron (RCS)
was just in the process of turning back on after a lengthy shutdown for
apparatus improvement and for relocation of the extraction components to
deliver the proton beam to the IPNS-I targets. A report' at that conference
detailed many improvements and gave preliminary assessments of their value.
Reference to the 1982 operating records in Table I below indicates the over-
all success of the improvement program.

79
TABLE I
ACCELERATOR OPERATING SUMMARY
(Nov-June)
1980 1981-82
Operating Energy 300 MeV 400 MeV
Average Beam Current 4.72 pA 7.98 pA
Operating Efficiency 85.2% 88.0%
Scheduled Operating Time 2569.2 hours 2471.0 hours
Available Operating Time 2187.8 hours 2175.3 hours
Total Pulses on Target 1.98 x 10⁸ 2.17 x 10⁸
Total Protons on Target 2.25 x 10²⁰ 3.60 x 10²⁰
The accelerator turned on in April of 1981 and made some brief tests
with the proton beam to assure that no gross problems existed. RCS first
delivered protons to the Radiation Effects Facility on May 5, 1981. First
runs for neutron scattering instrument calibration began August 4. These
runs were at a proton energy of 500 MeV. While average currents of 5 pA were
achieved, reliability was poor and the continuity required for studies to
increase the beam current was impaired by all too frequent operating inter-
ruptions.
The reliability problems were primarily in the charge storage cabling
of the kicker magnet power supplies and in the rf system. The problems en-
countered were a type that took several million pulses to develop and the
limited prior running had not revealed them.
400 MeV Operation
A decision was made at that time to operate temporarily at a proton
energy of 400 MeV to allow the accelerator some time to sort out its
problems. This was consistent with the experimenters needs also since lower
electrical power costs allowed more running time for instrument development
and the powder diffractometers, the workhorses of the early IPNS-I program,
were quite effective with the neutrons available at 400 MeV.
The summer test running of the RCS had convinced the operators that
the intensity dependent high energy beam instabilities that had previously
plagued the RCS were not related to betatron tune and were not correctable

80
with the new programmable optupoles.2 Evidence indicated that the instability
depended on rf voltage amplitude and at that time it was felt that enough
additional protons could be accelerated at 400 MeV with better reliability
to more than make up for the decrease in neutrons per proton at 400 MeV.
The improvement in beam current and reliability shown in Figures 2 (a) &
(b) during 400 MeV operation dramatically indicate the correctness of this
assumption.
Reliable operation has allowed the accelerator crews the time to attack
specific problems of the operation with gratifying results. The kicker
cable problems were found to be the result of faulty cables and consultation
with the manufacturer helped straighten these out. Modifications were also
made in the terminating resistors to allow lower voltage operation. The rf
problems were quite varied in nature but are now under control. Very early
in the 400 MeV running period improvements were made in the beam phase feed-
back system which moved the beam intensity instability threshold from about
1.4 x 10¹² protons per pulse to over 2 x 10¹² protons per pulse (at 400 MeV).
Machine studies have been done at 450 MeV with the accelerator easily achiev-
ing an extracted beam current of 8 pA.
Plans are to increase the energy to 450 MeV in September, evaluate the
effectiveness of operation at this energy for 2-3 months, then begin opera-
tion at 500 MeV if no new problems develop at 450 MeV.
Chopper Controlled Operation
Almost all the RCS operation has been carried out with the entire accel-
erator timing system under control of a crystal oscillator. This oscillator
also provides timing reference to one or more neutron choppers. Some of the
accelerator modifications to permit this type of operation have previously
been described.3 Since all the accelerator power supplies have a voltage
ripple which is synchronized to the power line, chopper controlled operation
tends to be more unstable and lossy than power line synchronized operation.
Accelerator personnel have continuously worked to decrease this instability
so that chopper controlled operation is just as free of proton loss as line
synchronized operation.
One of the approaches phase locked the chopper motor to the power line
with a very slowly responding circuit. This provided significant improve-
ment in accelerator performance and is acceptable to the chopper user as
81
long as only one chopper is in use. This method is not acceptable for the
more general case of several choppers in operation each with different
moments of inertia, since only one can be in control of accelerator proton
extraction timing. As of this writing, the accelerator runs quite cleanly
under chopper control, but still requires a lot more operator attention
than line synchronized operation.
Present Status
The accelerator has now operated in a production mode for 22 weeks and
performance has exceeded expectations. A most vital ingredient required to
make this a production facility has been control of the proton losses in the
accelerator tunnel. This has been partially accomplished by added diagnos-
tics, some of which automatically shutdown faulty operation. While Table I
tells the success story of the IPNS-I accelerator, some other points are
worth noting. The accelerator has reached peak currents of 11.2 pA for short
periods under acceptable operating conditions and 24 hour averages of 10 pA.
Accelerator study periods have produced 2.4 x 10¹² protons per pulse at 5 Hz.
The limiting component of the system is now clearly the H ion source. The
synchrotron and linac can efficiently handle all the H current presently
available, at least at 400 MeV. It may be possible to edge the average
current up to 10 pA with the present source, but that will be about the limit.
Stripping foils have been something of a problem since they have to be
replaced about every 5 million pulses. A new foil must be conditioned for
about 4 hours at reduced current. This significantly reduces average cur-
rent so that we are considering better foil materials.
Future Plans
Machine studies have revealed no serious injection space charge problems
with 3 x 10¹² protons injected. The operating ion source provides such beams
at 5 Hz but at 30 Hz only about 2.2 x 10¹² can be delivered regularly to the
synchrotron. This source produces a current of 15 mA at an energy of 750 keV.
Linac personnel have adapted a 15 Hz Fermilab magnetron H source to run at
30 Hz. This new source reliably produces 40-50 mA H beams at 32 Hz on the
test stand. Plans are to install this source about March of 1983.
While we cannot fully evaluate the RCS capability with the present ion
source, we believe it should be possible with the new ion source in operation
82
to get the average current up to about 12 pA without any further significant
changes in equipment. Added rf voltage will probably be required to increase
the beam current above 12 pA. With some compromise in rf reliability, about
10% more voltage can be achieved with the present cavities. A third rf sys-
tem is actively being considered as a major future improvement.
3. TARGETS AND MODERATORS
The IPNS Zircaloy-2-clad uranium targets have been in use in both the
Neutron Scattering Facility (NSF) and the Radiation Effects Facility (REF)
since startup time. Completely-assembled tantalum targets are available
for both facilities, as are spare uranium target assemblies. We have not
yet used either. The targets and (independent, interchangeable) cooling
systems have operated completely trouble-free, and according to design
expectations.
The uranium targets consist of eight, 25-mm-thick, 100-mm-diameter
uranium-alloy disks, clad with 0.5-mm Zircaloy-2, (1.5 mm on circumference)
cooled by light water flowing in 1-mm channels between disks. Disks 1,3,5,
and 7 contain small, steel-sheathed thermocouples in Zircaloy wells at their
centers.
The entirely-conventional cooling systems have two loops; the primary
loop contains a helium-gas-covered surge tank with hydrogen recombiner, fil-
ters, ion-exchange column, the pump and heat exchanger. Radiation monitors
near the exchange column detect gross changes in radiation levels, which are
primarily due to positron-annihilation and nitrogen-16 gammas. Periodic
sampling and gamma-ray spectral analysis of primary water and cover gas gives
us the most sensitive, longer-term indication of trouble such as a breach of
cladding. Normal gas and water samples contain isotopes identified as spal-
lation and activation products of 300 series stainless steel., Zircaloy and
water. No excess hydrogen is evolved, gratifyingly contrary to ZING-P'
experience.
The target temperatures behave according to design, with disk 1 center-
line temperature rising approximately 14 degrees C above coolant temperature,
per microamp of 400 MeV protons on the NSF. The temperature in the REF is
somewhat higher, presumably due to sharper focussing of the proton beam.
We have measured the transient temperature response of the uranium

83
disks: they respond to proton beam intensity variations in a fashion des-
cribed by two time constants, 6.7 and 2.1 sec, in accordance with calcula-
tions. (Measured thermocouple response times are less than about .5 seconds.)
Thus even beam power fluctuations on the times scale of 10 seconds give
fully-reversed thermal stress cycles. (We identified cladding thermal stress
cycling fatigue as the mechanism of failure of our targets at the original
design current of 22 microamps, 500 MeV.) At 8 microamps proton current,
we are operating at stresses just below the level of infinite fatigue cycle
lifetime.
The shielding provides general background levels of .5 to 1. mrem/hr,
at 8 microamps of proton current. We find exceptions up 3. to 10. mrem/hr
in locations close to the neutron beam tubes at the shield face. At the
shield top, where a corner of the central iron shield has no concrete shield-
ing (an unoccupied area), we find several hundred mrem/hr, which we have
attributed to 25 keV "iron-window" neutrons. Near the LRMECS chopper,
shielded with only 30. cm of hydrogenous material, the dose rate is about
25 mrem/hr with 8 microamps of protons on the target. The beam stops are
quite simple; we use second-hand shipping casks and reactor beam stops about
which we admit we know little. Unmodified, these bring the dose rates down
to levels of about 1 mrem/hr, except in the case of LRMECS, where we added
30. cm of iron in the beam direction to accomplish this level.
We have not yet installed the cryogenic moderator system, which
originally was to consist of two liquid methane moderators at approximately
about 100 Kelvin, and two liquid hydrogen moderators at approximately 25
Kelvin. This was due to problems of time dependent and static differential
thermal contraction, material flaws, thermal shorts in the cryogenic heat
exchangers, and some central instabilities. We have now repaired the moder-
ator and reflector assembly, and will circulate liquid methane in all four
moderators. We expect to be operating with the cryogenic moderator system
beginning with the start-up this October.
Meanwhile, since startup of the NSF, we have used a system consisting
of three ambient-temperature polyethylene moderators, with inner graphite
and outer beryllium reflectors, and cadmium decoupling and void liners
throughout. (In this temporary assembly, we provide no vertical beam mod-
erator.) The assembly is uncooled. Figure 3 illustrates the temporary
assembly.)
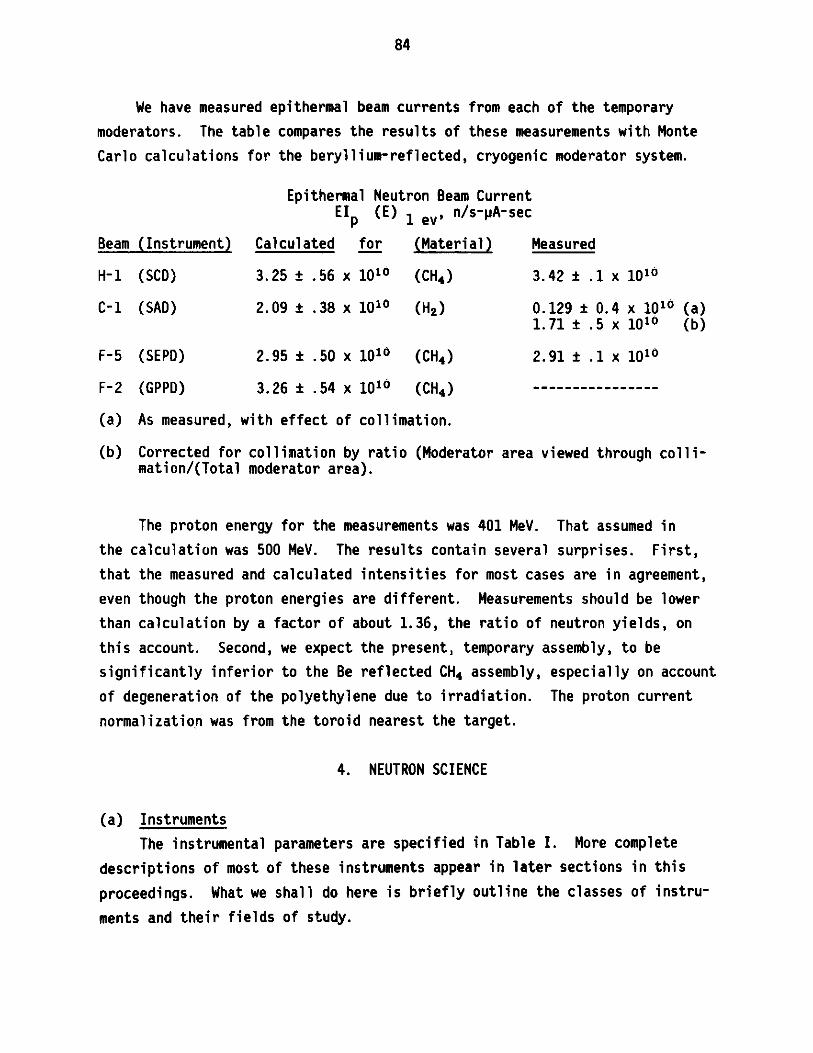
84
We have measured epithermal beam currents from each of the temporary
moderators. The table compares the results of these measurements with Monte
Carlo calculations for the beryllium-reflected, cryogenic moderator system.
Epithermal Neutron Beam CurrentEI (E) 1 ev' n/s-pA-sec
Beam (Instrument) Calculated for (Material) Measured
H-1 (SCD) 3.25 .56 x 1010 (CH4) 3.42 .1 x 1010
C-1 (SAD) 2.09 .38 x 1010 (H2) 0.129 0.4 x 10¹⁰ (a)1.71 .5 x 101 (b)
F-5 (SEPD) 2.95 .50 x 1010 (CH4) 2.91 .1 x 1010
F-2 (GPPD) 3.26 .54 x 1010 (CH4) ----------------
(a) As measured, with effect of collimation.
(b) Corrected for collimation by ratio (Moderator area viewed through colli-mation/(Total moderator area).
The proton energy for the measurements was 401 MeV. That assumed in
the calculation was 500 MeV. The results contain several surprises. First,
that the measured and calculated intensities for most cases are in agreement,
even though the proton energies are different. Measurements should be lower
than calculation by a factor of about 1.36, the ratio of neutron yields, on
this account. Second, we expect the present, temporary assembly, to be
significantly inferior to the Be reflected CH4 assembly, especially on account
of degeneration of the polyethylene due to irradiation. The proton current
normalization was from the toroid nearest the target.
4. NEUTRON SCIENCE
(a) Instruments
The instrumental parameters are specified in Table I. More complete
descriptions of most of these instruments appear in later sections in this
proceedings. What we shall do here is briefly outline the classes of instru-
ments and their fields of study.

85
Powder Diffractometers
From the first prototype spallation source up to the present day it has
been clear that these machines would open up new areas of research. There
are two powder diffractometers at IPNS, as the table indicates, and both are
fully operational. There are two primary reasons for this; first the abun-
dance of epithermal neutrons has allowed measurements out to much higher Q-1
values, possibly up to ~ 100 A , and secondly, the short pulse width,
together with long flight times has allowed new standards of resolution to
be attained. For example, both instruments have a resolution of AQ/Q
~ 0.003, which is independent of Q. At the present time three main areas
of study have been pursued: (i) Structural work. At present the heaviest
demand is for this area, and since a data set can be collected from a
reasonable (~5g) size sample in ~24 hrs the machines service a good number
of users. In fact about half our present users fit into this category,
although this may be misleading as not all our instruments are fully opera-
tional. What is of great importance is that the software package for hand-
ling this data is "on-line" at ANL. FORTRAN software for the display and
analysis of time-of-flight (TOF) neutron powder data from the powder diff-
ractometers is operational on our IPNS-dedicated VAX 11/780 computer. At
the heart of this software package are the routines TOFPRP and TOFLS
(written by R. B. von Dreele of Arizona State University and used exten-
sively at Argonne over the past 2- years) which perform full-matrix
least-squares refinement of crystal structure and peak shape parameters
(Rietveld analysis) based on powder data. Programs to determine Bragg
reflections for a given structure, to calculate Fourier syntheses, to
calculate distances, angles and associated standard deviations from refined
structures and to illustrate the atomic arrangement of a given structure
have been adapted for use in this package. A user's guide to the Rietveld
analysis of powder data at IPNS is in preparation. Users who have stayed
an extra day or two after data collection have been able to leave with
nearly complete Rietveld refinements. In addition, we are running a short
course on Powder Diffraction and Rietveld Analysis at ANL from July 13-16,
1982.
(ii) Glasses, liquids and amorphous systems. For these studies the high
Q capability is particularly important and this has already been exploited ina study of PxSei-x glasses by Misawa, Price, and Susman. Another interesting
86
application of the powder diffractometers was in determination of the mag-
netic scattering from an amorphous ferromagnet Fe0.82 Y 80.18 by Guttman,
et al. Here the experimenters used banks of detectors placed symmetrically
left and right of the incident beam, and applied a magnetic field i so thatfor one set of detectors 1i1, and for another U.Pf. Under these conditions
the magnetic scattering appears in the 0.LN detectors only and can be sep-
arated out. Note that with the time-of-flight method this condition is true
for all 4 .(iii) Measurements of residual grain interaction stresses in deformed
alloys. MacEwan et al have exploited the high resolution at all Q values toobserve the shifts of individual peaks after materials have been permanently
strained. They estimate that residual bulk strains of order 10-5 can be
detected using the high resolution configuration.
Single-Crystal Diffractometer
This instrument, based on the wavelength-resolved Laue method, uses a
30 x 30 cm position sensitive 6Li-glass scintillation detector developed by
M. G. Strauss and others in the Electronics Division at ANL. The smaller-
scale prototype built up at ZING-P' was the first of its kind. As this
technique is capable of viewing large portions of reciprocal space it has a
wide variety of potential applications. The first experiments have concen-
trated on crystallography and the crystal structure of Mn(CO)3 (C6H8 CH3) at
25K was solved by a joint group from ANL and the University of North
Carolina at Chapel Hill. The low-temperature structure was solved indepen-
dently by direct methods - to our knowledge, the first such case with
time-of-flight data.
Other types of experiments which are being performed with this instru-
ment include searches for diffuse scattering, satellite peaks, and super-
lattice reflections. The versatility of the instrument is certain to make
it particularly attractive for these latter studies. There are a few small
difficulties still to be worked on, for example, involving dead time and
minor aberrational effects and fast neutron background when the minimum0
wavelength is below ~0.6A. However, the instrument is clearly operational
and we expect these problems to be overcome and new uses to emerge.

87
Small-Angle Diffractometer
The SAD is another recently-developed instrument. As such, one expects
to encounter new challenges, and the most difficult one is to diminish the
background scattering from fast neutrons. The instrument has a 2-dimensional
gas-filled proportional counter that sits directly in the incident beam, but
the background is now a factor 106 lower than the direct beam flux. At
present the minimum usable Q is limited to ~ 0.02 A ; however, once the-3 0-1cold moderator is installed, the Q range will be 7 x 10 to 0.35 A
Experiments are being conducted on both metallurgical as well as biological
samples, and we expect to receive proposals for this instrument for the
first time in September.
Chopper Spectrometers
The inelastic scattering experiments at IPNS are of special interest
because they attempt to exploit in a direct way the high epithermal flux,
which is a unique capability of spallation sources. Both these machines
run in the so-called 'direct' geometry, i.e. the incident energy E0 is
defined. So far runs have been made with E0 = 160 and 500 mel.
The Medium-Energy Chopper Spectrometers at IPNS are designed for inelas-
tic scattering experiments over a wide range of energy transfer (0-500 meV)
and momentum transfer (0.1-20 A1 ). The high-intensity, low-resolution
instrument (LRMECS) has been operating for several months and experiments
approved by the Program Committee are underway. Measurements of the vibra-
tional densities of states of amorphous Si02 and amorphous P have been com-
pleted. The electronics for the phasing of chopper and accelerator have been
improved and the time in which the accelerator-chopper phase relationship
is acceptable (to-tc c, typically 2 psec) is now essentially 100%.
The second chopper machine (High resolution medium energy chopper spec-
trometer, HRMECS) is now installed and initial tests have been run. Of
particular importance is that we are able to run two choppers simultaneously,
which presents a complex phasing problem since only one chopper can be used
to trigger accelerator extraction. Tests have now shown that two (or more)
choppers controlled by a fixed-frequency oscillator can be maintained in
acceptable phase relationship with the accelerator.
As expected, the chopper spectrometers have been under great demand for
experiments. At the last program committee meeting only 43% of the proposals

88
on LRMECS could be accommodated. Although this situation may get better when
HRMECS comes on line, the low percentage reflects both the long time required
for these experiments and the high interest.
The readcr is referred to the specific article on chopper spectrometers
for further details of the experiments that have been performed and are
planned.
Crystal Analyzer Spectrometer
This machine uses the 'inverse' geometry technique in which the final
energy is defined by a cooled Be filter and focussed graphite crystals to be
3.6 meV. The time-of-flight technique is then used to determine the initial
energy and thus the energy transfer is known. The CAS is being constructed
primarily for studying vibrational modes at hydrogen in metals. The CAS can
be used effectively for other studies such as vibrational densities of states
and molecular spectroscopy.
(b) Radiation Effects Facility
The Radiation Effects Facility (REF) at IPNS has been in operation
since January 1982. Two fast-neutron irradiation positions operate indepen-
dently at controlled temperatures between 4.2K and about 500 C. Neutron
fluxes, energy spectra, and flux gradiants have been accurately determined
in these 2 temperature irradiation positions. Secondary proton and gamma
fluxes have also been measured and found to be within acceptable limits.
The fast-neutron flux is typically 1 x 10¹² n/cm2-sec lEn > 0.2 MeV) and
has an energy spectrum quite similar to a slightly degraded fission-neutron
spectrum. Computer controlled data acquisition systems for in-situ experi-
ments are in use for the 2 temperature controlled irradiation positions.
The REF is available for user's experiments approximately 1/4 of the total
IPNS running, or about 6 weeks through the year. More details can be found
in the specific article on the REF.
(c) Special experiments at IPNS
In addition to the experimental facilities described above that are
open to the entire user community on an experiment by experiment basis,
three proposals were accepted by the Program Committee in June 1981 for
long-term assignment of beams. These are described briefly below. In each

89
case they represent a considerable effort, often collaborative with other
institutions.
Nuclear magnetic ordering in 3He at very low temperature
This experiment is designed to observe antiferromagnetic Bragg reflec-
tions from single crystals of solid 3He below 0.001K. The facility is now
in the final stages of assembly.
A vibration-free support structure to hold the cryostat has been com-
pleted and the dilution refrigerator has been installed at IPNS. In previous
testing before this installation it cooled below 0.006K. The nuclear cooling
stage is now being installed. The sample cell with a single-crystal silicon
window is being leak tested.
Other necessary components such as filters, the chopper assembly, posi-
tion-sensitive detectors, and shielding are now almost completed. Studies
of solid 3He crystal growth will begin soon, and the actual experiments
later this summer.
Polarized Neutron Mirror at IPNS
An optical instrument is being installed for neutron reflection studies.
The object is to determine the magnetic induction A (z) close to the surface
of materials. In many instances A varies as a function of the distance zfrom the surface until it reaches a value A0 for the bulk. The goal is
attained by measuring the spin dependent reflectivity of the neutron beam by
the surface, since this quantity is related by optical laws to A (z). The
perturbation of the magnetic induction at the surface is detected if signi-0
ficantly different from the bulk over a region not smaller than 5 A, nor0
larger than 1000 A.
A filtered neutron beam is reflected by a magnetized cobalt mirror.This reflects only the neutrons whose spin is parallel to the magnetization
of the cobalt. The polarized beam is brought on the sample, which has awell-polished surface and is kept in a magnetic field paralled to that of
the cobalt mirror. The neutrons are partially reflected by the surface ofthe sample; the reflectivity as a function of the wavelength is measured bya time-of-flight detector. The insertion of a flipping coil in the spacebetween the mirror and the sample allows the reversal of the neutron spins
90
with respect to the laboratory magnetic fields; in this way the spin-
dependent reflectivity of the sample is exactly identified.
The instrument is scheduled to start operating in June 1982. With an
initial round of experimnts devoted to the detection of the penetration
length of an applied magnetic field in superconducting ErRh4B4, and the
determination of the magnetic critical exponents at the surface of ferro-
magnetic nickel. The special environments for the samples are presently
under construction.
Ultracold Neutron Eeriments
The ultimate aim of this experiment is to measure the electric dipole
moment (EDN) of the neutron as a test of time reversal invariance. A finite
EON would show failure of time reversal. We have demonstrated a practical
system for producing ultracold neutrons (UCN) at high density from a pulsed
neutron source using ZING-P'. We now need to show that we can hold these
neutrons in a bottle for 100 seconds or so.
To do this we have (1) built a window that separates the bad vacuum of
our source (a rapidly moving mica crystal which reflects 400 m/sec neutrons)
(2) polished the surface of our bottle and (3) built pneumatically operated
valves with minimum leakage to control the neutrons. We need a high flux of
400 m/sec neutrons to test the source and bottle and we hope to have this
from the refrigerated moderator in IPNS.
To be competitive with other measurements of the EDN we need a density
of about 10 UCN/cc stored in our bottle.
(d) Data Acquisition System
Ease of use, flexibility, and reliability were the primary goals in the
design of the IPNS Data Acquisition System (DAS) and these goals have been
met very well. Very little time has been lost through problems with the DAS
and users have been able to begin using the system with a minimum of in-
struction. This is the first neutron scattering data acquisition system
with the sophistication to do electronic time focussing on the fly, enablingthe use of large detector banks in simple arrangements. The IPNS DAS includes
a powerful and compatible host computer (a VAX 11/780) to permit rapidanalysis of acquired data. This allows us to run an efficient user programdespite the complex nature of the data. Outside users are usually able to
complete most of their analysis before leaving the Laboratory if they are

91
with respect to the laboratory magnetic fields; in tis way the spin-
dependent reflectivity of the sample is exactly identified.
The instrument is scheduled to start operating in June 1982. With an
initial round of experiments devoted to the detection of the penetration
length of an applied magnetic field in superconducting ErRh4B4, and the
determination of the magnetic critical exponents at the surface of ferro-
magnetic nickel. The special environments for the samples are presently
under construction.
Ultracold Neutron Experiments
The ultimate aim of this experiment is to measure the electric dipole
moment (EDM) of the neutron as a test of time reversal invariance. A finite
EDM would show failure of time reversal. We have demonstrated a practical
system for producing ultracold neutrons (UCN) at high density from a pulsed
neutron source using ZING-P'. We now need to show that we can hold these
neutrons in a bottle for 100 seconds or so.
To do this we have (1) built a window that separates the bad vacuum of
our source (a rapidly moving mica crystal which reflects 400 m/sec neutrons)
(2) polished the surface of our bottle and (3) built pneumatically operated
valves with minimum leakage to control the neutrons. We need a high flux of
400 m/sec neutrons to test the source and bottle and we hope to have this
from the refrigerated moderator in IPNS.
To be competitive with other measurements of the EDN we need a density
of about 10 UCN/cc stored in our bottle.
(d) Data Acquisition System
Ease of use, flexibility, and reliability were the primary goals in the
design of the IPNS Data Acquisition System (DAS) and these goals have beenmet very well. Very little time has been lost through problems with the DASanJ users have been able to begin using the system with a minimum of in-struction. This is the first neutron scattering data acquisition systemwith the sophistication to do electronic time focussing on the fly, enablingthe use of large detector banks in simple arrangements. The IPNS DAS includesa powerful and compatible host computer (a VAX 11/780) to permit rapid
analysis of acquired data. This allows us to run an efficient user programdespite the complex nature of the data. Outside users are usually able to
92
complete most of their analysis before leaving the Laboratory if they are
willing to stay a day or two after their experiments are completed.
The DAS currently serves seven instruments: The SEPD, GPPD, LRMECS, SCD,
CAS, HRMECS and the Solid He3 Experiment (and on a temporary basis, the
Polarized Neutron Experiment). The SAD instrument does not yet use the main
IPNS DAS but instead uses an upgraded form of the data acquisition system
which was used for this instrument at ZING-P'. All IPNS users analyze data
on the IPNS VAX 11/780.
Many unique capabilities and a great deal of flexibility are provided
by the IPNS DAS. The user can choose the range of tiles-of-flight over which
data is collected, channel widths, grouping and/or time-focussing of detec-
tors, and method of monitoring collection. Time-focussing corrections which
can be made before recording each event include scaling of the time to cor-
rect for different flight paths, and/or scattering angles and corrections
for time delays. This has permitted a simple symmetric design Jnr the
powder diffractometers with the detectors mounted on a circle surrounding
the sample. Three types of time delay corrections are possible so cor-
rections can be made for different types of instruments. Data from diff-
erent detectors may be collected over the same or different ranges and a
given event may be histogrammed more than once to allow collection with
and without corrections such as time-focussing. Each powder instrument
has, on occasion, collected data simultaneously into more than 220,000
channels. The Single Crystal Diffractometer can collect data into over
one million channels at a time.
5. USER PROGRAM
IPNS is a national user facility. What this means is that we encourage
and actively seek use of the various instruments by outside users. To achieve
this effectively we have developed the following policy:
o Program Committee (chaired by a non-Argonne scientist -- majority
of members from outside Argonne) will review experiment proposals
and allocate time to optimize the production of good science.

93
o Instrument Scientists will be allotted 25% of time on each instru-
ment for checking, upgrading, calibration and their own experiments,
remaining 75% will be allocated by Program Committee.
o Some beams will be left free for special experiments in which all
experimental equipment will be provided by the users.
o Users will generally provide any non-standard equipment required
(beyond conventional sample environment equipment).
o Users will provide their own travel support (Argonne Universities
Association may be able to help university users in special cases).
o Neutrons will be provided free of charge for scientific experiments
meeting criteria established by the Department of Energy.
o Proprietary experiments may be scheduled with appropriate cost
recovery according to the Department of Energy guidelines.
The question is how well has this worked. On the whole extremely well.
So far (Nov. 1981 - June 1982) we have run 80 experiments. About 60 outside
users have been involved with these experiments, and of these about 30 have
actually been at ANL to do their experiments. This is a promising start.
A summary of the research proposals submitted in February 1982 for the
experimental period April 1982 - October 1982 is given below. The decisions
on which proposals were accepted are those of the Program Committee which met
at Argonne on March 1, 1982. The next proposal deadline is September 15.
Proposal forms, experimental report forms, and a user handbook describing the
instruments in detail are available by writing to the Scientific Secretary,
IPNS-372, Argonne Natonal Laboratory, Argonne, Illinois 60439, telephone
(312) 972-5518.
94
Instrument Number Submitted No. Accepted(3)Outside OutsideUsers ANL Total Users Total
Special EnvironmentPowder Diff. 10 10 20 6 13
General PurposePowder Diff. 10 7 17 10 15
Low-Res. Medium-EnergyChopper Spectr. 6 5 11 2 4
Single Crystal Diff. 7(2) 1 8 6(1) 7(1)
Radiation Effects Fac. 7 8 15 7 13
Special Experiments 1 2 3 1 3
TOTAL NUMBER(2) 41 33 74 32 55
(1) Final experiments to be selected depending on results of screeningmeasurements. One of these proposals includes 44 individual proposalsfrom scientists representing 32 U.S. institutions.
(2) Counts proposals with multiple samples as one proposal.
(3) In most cases time allocated was less than requested.
Proposals were also received 1r the Small Angle Diffractometer.and High-Resolution Medium-Energy Chopper Spectrometer.These are not included here becLuse these instruments are still in a testingstage.
6. FUTURE PLANS
For many years Argonne has been in the lead with thinking and devel-
oping spallation sources for. neutron science. ZING-P in 1974 was the first
source based on a proton accelerator in the world. The IPNS concept was
developed and documented at ANL in 1978 (see ANL publication 78-88 compiled
by J. M. Carpenter, D. L. Price, and N. J. Swanson, 291 pages) and included
detailed specifications for both IPNS-I, which we now have operating, and
IPNS-II, a more intense machine designed for 800 MeV energy and 500 pA cur-
rent. Work on this latter machine is not at present continuing, since not
only is funding unavailable but better ideas have also emerged in the inter-
vening 4 years. The United States is looking to the WNR/PSR option at Los

95
Alamos as a high intensity source in the late 1980's. As a major center
for pulsed neutron research, the staff at ANL are actively involved in col-
laborations with Los Alamos personnel on designing instruments and planning
or continuing research programs at the WNR/PSR.
In addition some effort is being made at Argonne to think of new accel-
erator based systems. Since the research reactors in the U.S. were commis-
sioned in 1966, and the LAMPF accelerator in 1972, this is a necessary step
if we are to have a competitive source ten years from now. Dr. R. L. Kustom
is in charge of these efforts and further details may be obtained by writing
directly to him. Some of the ideas, particularly those involving the fixedfield alternating gradient (FFAG) synchrotron, appear very promising from
the viewpoint of neutron science.
7. CONCLUSION
IPNS-I is now working well. We are learning how to optimize the instru-
ments to do the best science with pulsed neutrons. The accelerator is working
well and we plan to increase the energy to 450 MeV in September. A new ion
source will be installed next March, which will result in a large increase in
current. Optimistically we hope a year from now that IPNS will have 2A
times the flux it now has. On the neutron science front we expect to have
13 instruments in operation and rerhaps one or two new spectrometers in the
early stages of design. Our efforts with pulsed neutrons has drawn world-
wide attention and we expect a large number of visitors, both from the U.S.
and outside, who are interested and wish to contribute to getting the best
science from these sources. We urge you to submit proposals!

96
REFERENCES
1. Potts, C. W., "Improvements in the Rapid Cycling Synchrotron", Proc.
ICANS-V, p. 53 (October 1981).
2. Potts, C., Faber, M., Gunderson, G., Knott, M., and Voss, D., "Tune
Control Improvements on the Rapid Cycling Synchrotron", IEEE Trans.
Nucl. Sci., Vol. NS-28, No. 3, p. 3020 (June 1981).
3. Praeg, W., McGhee, D., and Volk, G., "Phase Lock of Rapid Cycling
Synchrotron and Neutron Choppers", IEEE Trans. Nucl. Sci., Vol. NS-28,
No. 3, p. 2171 (June 1981).
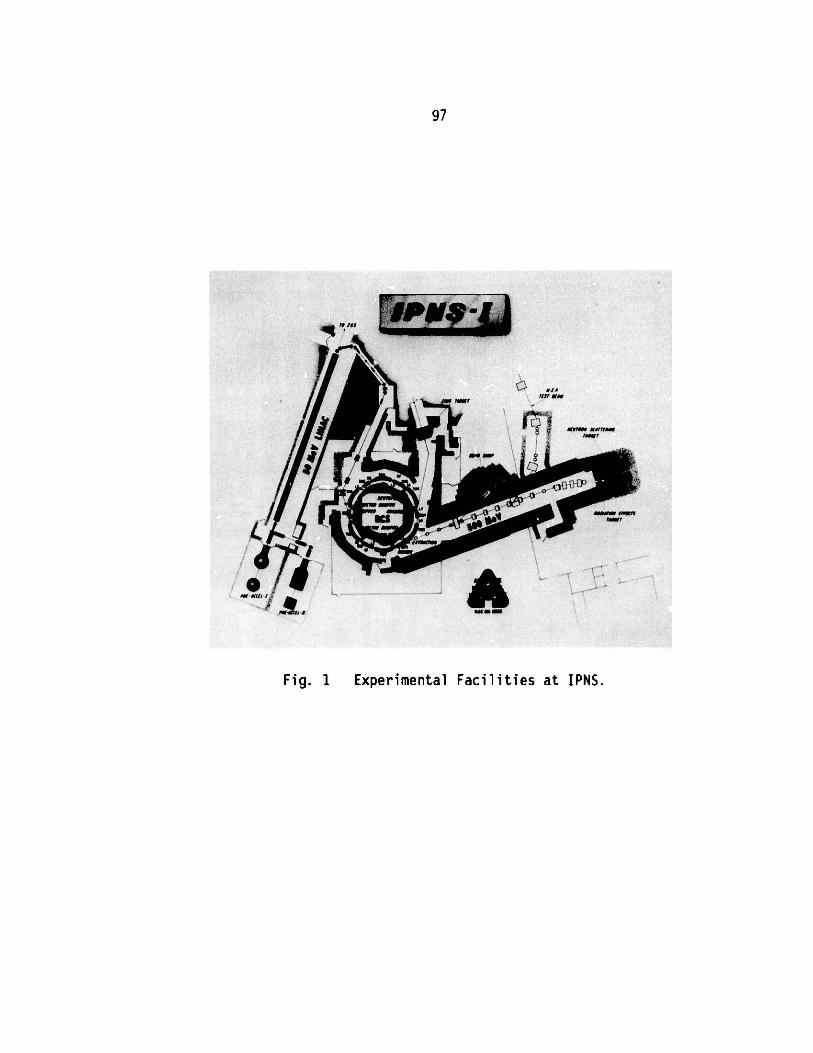
97
OJ' __ _ _
AN &A
w
nI rM
?Of r*rr M rna
Fig. 1 Experimental Facilities at IPNS.
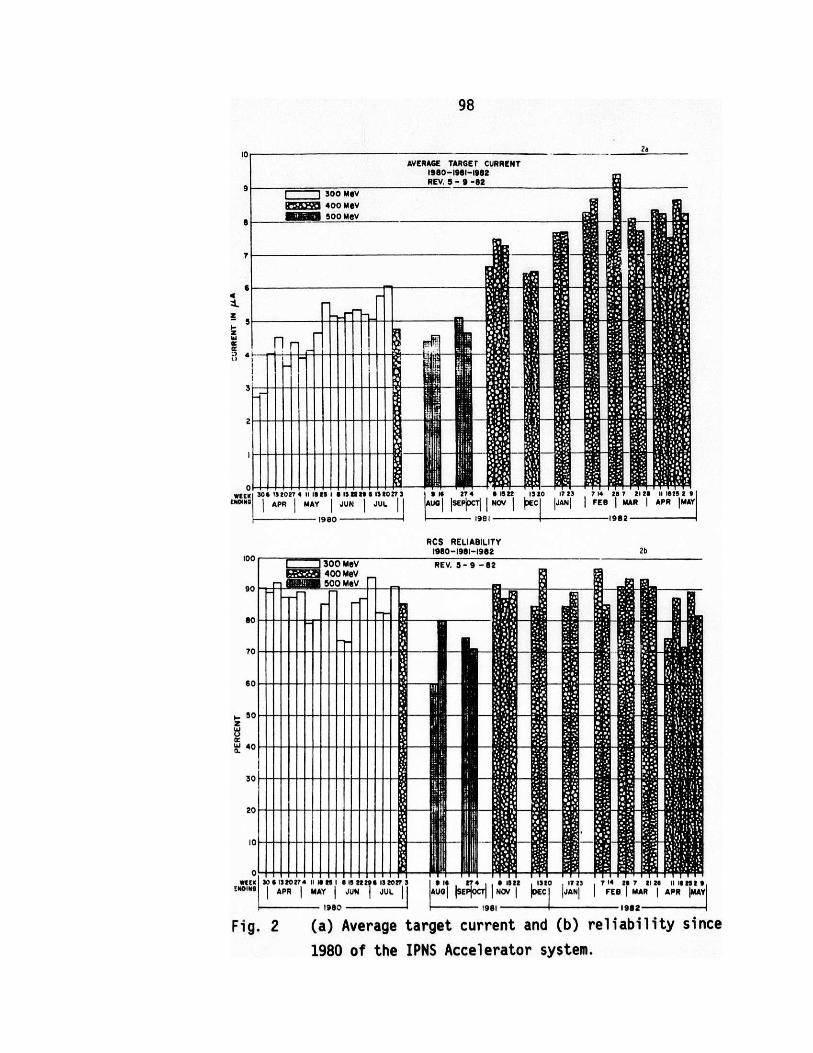
98
0 ---- - 2a _____
AVERAGE TARGET CURRENT1980-1981-1982
9 300 MOV400 MeV
8 -0 e -
7
6
5
2 -
0IIC 30-307'It iS1U3 307
ENDING IAPR IMAY I JUN IJUL
1980
; Is 274 6 1522 1320 7123 7 14 28 7 21 25 11 10252 9
1AUGI ISEPI I INOV I JEC IJANI IFEB MAR I APR IMAY
19811982
RCS RELIABILITY1980-1981-1982
ivU 300 MeV REV. 5- 9 -82
90 5 ---
80 -1 - -
70
60
50 - - - -- -- -
0 - --0-
30 --- 4-1- 2- --- - 320 ---
20 --- 2-0-2--2-1- -2-
10 -- - -- -- -- - - - - -
01N0 j APR I MAY j JUN IJUL
1960
2b
AUGI ISE iOCTI NOV DEC IJANI FEB MAR APR MAY
1981 1982
Fig. 2 (a) Average target current and (b) reliability since
1980 of the IPNS Accelerator system.
t
i
l1

99
4.
QC,
Z
U-J
E.
IIi
LU
W4
0-
44Q
I.C.
4
dl
D
U
M
CNJ
S -
Fig. 3 The temporary moderator-reflector assembly.
The three moderators are of polyethylene,
reflected by graphite decoupled and hetero-
geneously poisoned by .5mm thick cadmium.
4
2
E
L
111 13
~~***'***'*********'
~z1t~M
--H--d _------
I 2 *
-40=ab
i a
L: E
40M
C,,
a
U
m
-J0
y: . .. w :

100
TABLE I IPNS-I EXPERIMENTAL FACILITIES
NEUTRON SCATTERING
Facility Range Resolution(Instrument Scientist) Assignment tWave-vector Energy Wave-vector Energy
Special EnvironmentPowder Diffractometer(J. D. Jorgensen)
General PurposePowder Diffractometer(J. Faber, Jr.)
Single CrystalDiffractometer(A. J. Schultz)
Low-ResolutionMedium-EnergyChopper Spectrometer(J. M. Carpenter)
High-ResolutionMedium-EnergyChopper Spectrometer(D. L. Price)
Small-AngleScattering Diffractameter(J. E. Epperson (a),C. Borso (b) )
Crystal AnalyzerSpectrometer(T. 0. Brun)
F5
F2
H1
F4
H3
0.5-40 A"
0.5-100 A-1
2-20 A-1
0.1-30 A 1
0 -10.3-9 A
C1
Fl
0.001-0-1
0.3 A
3-16 A
*A 0.35%
0.25%
2%
*
*A
0-0.6 eV 0.02 K0
0-0.4 eV 0.01 K0
*A 0.004 A-1
0.02-0.5 eV
No energy analysisWave-vector, K = 4n sin e/XMaterials Science -- 3 Meter Flight PathBiology -- 8 Meter Flight Path
Beam Tube
F3C2C3F6H2Vi
Facility(Instrument Scientist)
Radiation Effects Facility(R. C. Birtcher)
NEUTRON BEAMS FOR :. LCurrent Use
VacantPolarized Neutron Exp.Solid He3 ProjectIrradiationsIrradiationsUltra-Cold NuLron Exp.
EXPERIMENTS
Flight Path Length (m)
6-706-407.5-256-206-202.7-6.7
RADIATION EFFECTSDescription
Two vertical (5 cm ID) tubes with flux 1 x 10¹²n/cm2 sec and one horizontal (3.8 cm ID) tube withflux 3 x 10¹¹ for energy greater than 0.1 MeV at8pA; capabilities for maintaining two samples atliquid helium t .perature (4*K) and above
A
*
*
0.05 E
0.02 E
*
2%
t(a)(b)
.r
101IPNS - G. H. Lander
H. Wroe
G. Lander
A. Carne
J. Carpenter
C. Potts
Comment - I noticed that in scheduling you allowed
25% of the beam time for in-house use. On SNS
we have allowed a commissioning period for a
new instrument but once it's scheduled in-house
scientists have to compete for time'through the
same procedure as the university user.
Response - In practice the 25% rule is not applied
across the board. The scientists often use the
instrument time to finish off collaborative
experiments. Even at the ILL quite a lot of
beam time is reserved for internal use, and most
people think this appropriate.
Q How much beam time does the HEP test beam get?
A It uses 1% of the beam which is scattered out
continuously.
Comment - We expect 500 MeV operation to be just as
reliable as 450 MeV.

102
103
J. M. Carpenter, D. L. Price, G. H. Lander
V. Stipp, A. W. Schulke, I. Rresof, F. J. Rotella

104
G. S. Bauer, K. L. Kliewer A. Carne, C. W. Potts
B. S. Brown, T. H. Blewitt
105
ELECTRONICALLY FOCUSED POWDER DIFFRACTOMETERS AT IPNS-I
J. D. Jorgensen and J. FaberArgonne National Laboratory, Argonne, Illinois 60439
ABSTRACT
Two powder diffractometers have been operated at IPNS-I since August
1981. The diffractometers achieve high resolutioin with large detector
solid angles for scattering angles from t 12 to 157' by electronically
focussing the events from individual detectors in an on-line microprocessor.
INTRODUCTION
During the operation of the ZING-P' prototype pulsed neutron source at
Argonne National Laboratory (December 1977 to August 1980) considerable data
were taken with a time-of-flight diffractometer known as the High Resolution
Powder Diffractometer (HRPD).' The HRPD clearly demonstrated the high and
nearly constant resolution which could be obtained by the time-of-flight
technique at a pulsed neutron source, but suffered from one important limi-
tation. The long incident and short scattered flight paths rendered mecha-
nical time-focusing techniques impractical except in back scattering. (90'
detectors were provided on the HRPD, but with a much smaller solid angle
than at 1600.) For this reason, the HRPD was ineffective for studying mag-
netic structures and indexing unknown structures where complete data are
required at large d-spacings.
The two powder diffractometers at IPNS-I, the General Purpose Powder
Diffractometer (GPPD) and the Special Environment Powder Diffractometer
(SEPD), achieve focusing, which allows events from separate detectors to be
summed, by processing signals from a large number of individual detectors in
a dedicated microprocessor before data histogrms are constructed. This
technique allows detector arrays of large solid angle to be constructed at
any desired scattering angle. Moreover, the focusing of the instrument can
be software controlled which allows the detector configuration to be opti-
mized for a particular experiment or the initial flight path to be changed
to achieve a different overall resolution.

106
DIFFRACTOMETER DESIGN
The GPPD and SEPD are of identical basic design but are positioned on
different initial flight paths and have different detector configurations.
A schematic of the instrument is shown in Fig. 1. The instrument consists
of a large octagonal shielded enclosure with the sample position at the
center and available detector positions from 12' to 157' at a constant
radius of 1.5 meters. Final collimation of the incident beam occurs just
prior to entering the sample chamber. The final collimators are cast from
boron carbide and epoxy resin and are supported in an iron "wheel" 61 cm. in
diameter and 8.9 cm. thick which can be rotated to select three incident
beam sizes up to a maximum of 2.5 x 7.6 cm. The nominal beam size which is
used for routine powder diffraction and upon which the design calculations
were made is 1.3 x 5.0 cm.
The sample chamber is an aluminum tank 61 cm. in diameter and 122 cm.
long. The beam enters through a thin (0.4 mm) aluminum window which is
located within the collimator shielding wedge where it is not viewed by any
PweDao Track Dtometer
Monitor oskector%%
- r
s S ckoo+
Fig. 1. Schematic layout of the General Purpose and Special Environment
Powder Diffractometer.

107
of the detectors. The exit window is located outside the instrument shield-
ing at the end of a 15 cm diameter pipe connected to the chamber. The
sample chamber is evacuated throguh this exit pipe. The wall of the chamber
has been thinned to 0.3 cm in the scattered neutron path leading to the
detectors. Samples are mounted on an arm extending from the center of the
top cover plate. Separate cover plates and adapters are available for
mounting furnaces, cryostats, displex refrigerators and pressure cells.
Each instrument presently contains approximately 140 10-atmosphere 3He
proportional counters 1.27 cm. diameter and 38.1 cm. long. The detectors
are grouped ito arrays centered around specific scattering angles as listed
in Table I. The detectors and their individual preamps are supported in
modules which clamp onto the constant radius detector mounting track. The
TABLE I
Performance parameters for the General Purpose and Special EnvironmentPowder Diffractometers at IPNS-I. (May 1982).
GPPD
Incident flight path:Useful thermal flux on
20 msample: 2 x 10⁵ n-cm- 2-sec- 1
Det. area (ster.)
152 0.2 2.9 0.0022 0.1090 0.3 3.9 0.0040 0.08660 0.4 5.5 0.0075 0.05230 0.9 11 0.025 0.034
SEPD
Incident flight path: 14mUseful thermal flux on sample: 4 x 10⁵ n-cm- 2-sec 4
1
26 dmin(A) dmax(A) d/d Det. area (ster.)
0.0860.0860.0520.034
2e dmax(A) Ad/d
145905722
0.20.30.41
4.05.48.019
0.00350.0060.010.035

108
entire detector chamber is dehuiddified to reduce electrical noise. Easy
access to the detectors is obtained through the hinged, shielded access
doors. Shielding is an integral part of the instrumnent structure and con-
sists of polyethylene, borax, and boron carbide.
DATA ACQUISITION SYSTEM
Signals from the individual detectors are discriminated, time-encoded,
and mapped into histograms in a data acquisition system built around a Z8000
microcomputer coupled to a PDP 11/34A minicomputer. (Fig. 2).2 The Z8000
'INHISIT' TO CINPUT INPUT DA
CLOCKPULSES MASTER
CLOCK
d *DISCRIMINATORDSECO AND FIFODETECTOR SUFFER
INPUTS
AMACTAWAY
CONTROLLER C
ASo-bitsPOLLINGMODULEI
or
CAMACINSTRUMENTCONTROLS
WL M10 MS LDISKS
RL
MULTI UJS
Z-303OMPUTER
FLT IUSNTERFACE
L aIN GVAIooPRINflNG GRAPHICS
TERMINAL TERMINAL
dat .0I)MULTIBUS-BOARD interrupt TO-PDPI
INTERFACE
serial. IA)
PDP 11/31TERMINAL
oT
900 BUDISERIAL
INTERFACE
Fig. 2. Block diagram of the data acquisition system.
PDP 11/3AINSTRUMENT
MINI COPUTER
S MEMORY

109
microcomputer is dedicated solely to data acquisition and histogram
construction, and directly accesses semiconductor random accesses memory in
which data histograms are stored. All other instrument functions, e.g.,
input, output and display of data, instrument control, etc., are handled by
the PDP 11/34A minicomputer which also supervises the Z8000 microcomputer
and has access to the histogram memory.
Discrimination and time-encoding occur in modules in a CAMAC system
with 8 detector inputs per module. All of the time-of-flight discriminator
modules are connected to a single 8'tfz master clock. Whenever one of the
inputs of a TOF discriminator module receives an analog pulse within the
discriminator window, a 20 bit time word (125 ns. resolution) is combined
with 3 bits of input identification and loaded into a first-in-first-out
(FIFO) buffer in the module. Each FIFO buffer can store sixteen 24-bit
words (the 24th bit is used to indicate FIFO overflow). A polling module
scans the FIFO buffers and identifies those which are over half full. The 8
bit addresses of FIFO buffers to be read are passed through a multibus
interface to the Z8000 microcomputer which then reads the data from the
buffer. Each event is then represented by a 32-bit word containing 20 bits
of time information, 11 bits of detector identification and one overflow
bit.
Before constructing histograms, the microcomputer performs the arith-
metic operations on the raw time-of-flight data required to achieve time-
focusing of detectors at different angles. The standard time-focusing
algorithn mimics mechanical time-focusing where path length, 1, and
scattering angle, 0, are constrained to achieve
I sin 8 constant ,
so that d-spacing becomes a linear function of time with a single contant,
A, for an extended array:
d- A * ht
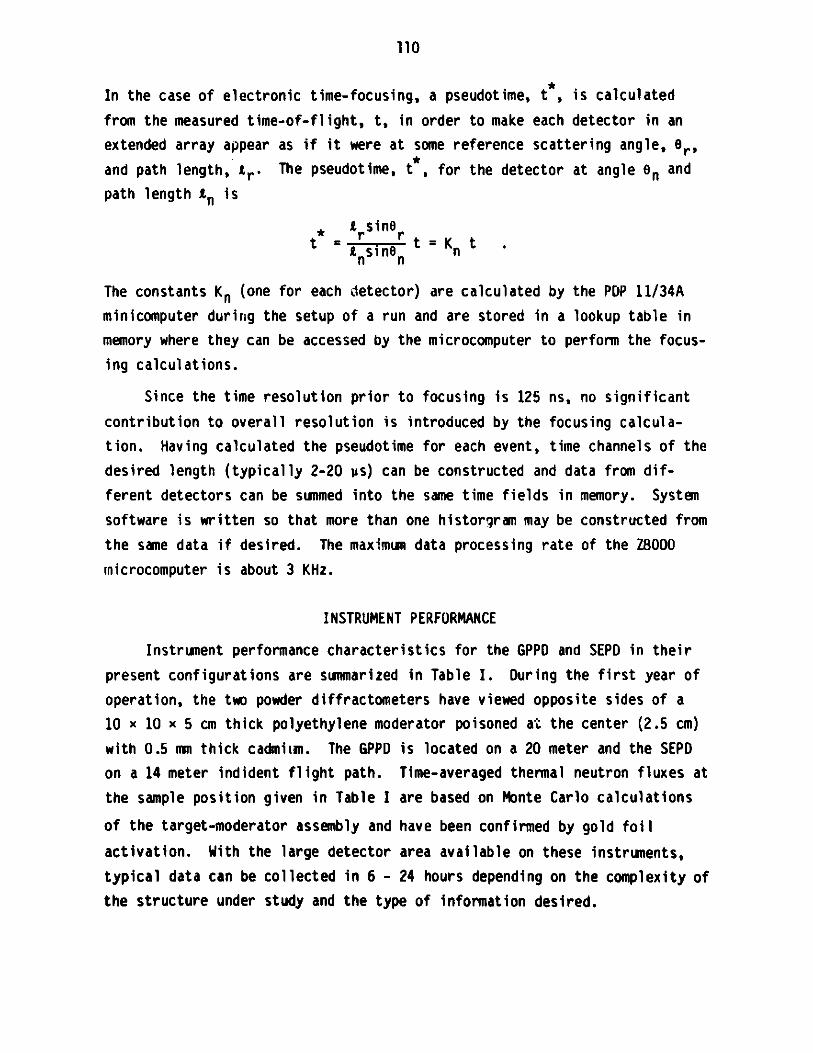
110
In the case of electronic time-focusing, a pseudotime, t, is calculated
from the measured time-of-flight, t, in order to make each detector in an
extended array appear as if it were at some reference scattering angle, 8r'and path length, tr. The pseudotime, t*, for the detector at angle en and
path length in is
Ansinet = rIn~ t = Kn t .
The constants Kn (one for each detector) are calculated by the PDP 11/34A
minicomputer during the setup of a run and are stored in a lookup table in
memory where they can be accessed by the microcomputer to perform the focus-
ing calculations.
Since the time resolution prior to focusing is 125 ns, no significant
contribution to overall resolution is introduced by the focusing calcula-
tion. Having calculated the pseudotime for each event, time channels of the
desired length (typically 2-20 us) can be constructed and data from dif-
ferent detectors can be sunmed into the same time fields in memory. System
software is written so that more than one historgram may be constructed from
the same data if desired. The maximum data processing rate of the Z8000
microcomputer is about 3 KHz.
INSTRUMENT PERFORMANCE
Instrument performance characteristics for the GPPD and SEPD in their
present configurations are summarized in Table I. During the first year of
operation, the two powder diffractometers have viewed opposite sides of a
10 x 10 x 5 cm thick polyethylene moderator poisoned at the center (2.5 cm)
with 0.5 mm thick cadmium. The GPPD is located on a 20 meter and the SEPD
on a 14 meter indident flight path. Time-averaged thermal neutron fluxes at
the sample position given in Table I are based on Monte Carlo calculations
of the target-moderator assembly and have been confirmed by gold foil
activation. With the large detector area available on these instruments,
typical data can be collected in 6 - 24 hours depending on the complexity of
the structure under study and the type of information desired.
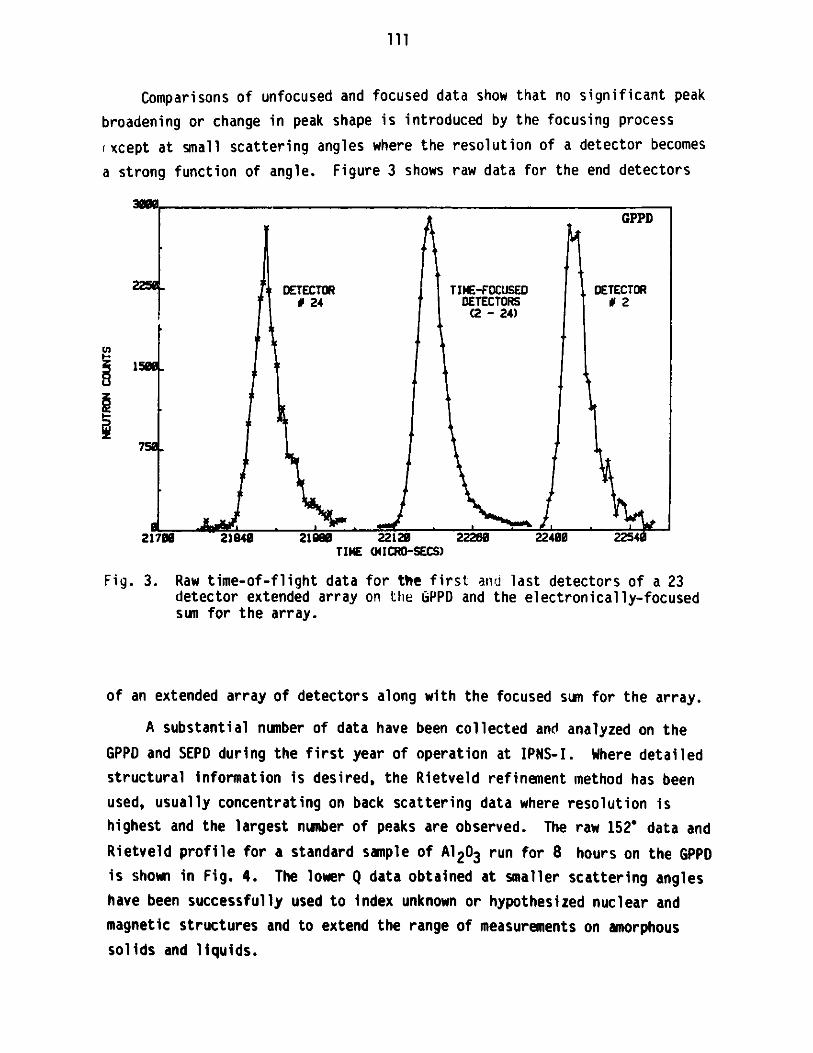
111
Comparisons of unfocused and focused data show that no significant peak
broadening or change in peak shape is introduced by the focusing process
xcept at small scattering angles where the resolution of a detector becomes
a strong function of angle. Figure 3 shows raw data for the end detectors
331
225w
1590
DETECTORM 24
TIME-FOCUSEDDETECTORS
(2 - 24)
GPPD
DETECTOR12
750.
0
2170 21848 21968 22120TIME (MIcRO-SECS)
22250 22420 22540
Fig. 3. Raw time-of-flight data for the first and last detectors of a 23detector extended array on the GPPD and the electronically-focusedsun for the array.
of an extended array of detectors along with the focused sum for the array.
A substantial number of data have been collected and analyzed on theGPPD and SEPD during the first year of operation at IPNS-I. Where detailed
structural information is desired, the Rietveld refinement method has beenused, usually concentrating on back scattering data where resolution is
highest and the largest number of peaks are observed. The raw 152' data andRietveld profile for a standard sample of A1 203 run for 8 hours on the GPPDis shown in Fig. 4. The lower Q data obtained at smaller scattering angleshave been successfully used to index unknown or hypothesized nuclear andmagnetic structures and to extend the range of measurements on amorphoussolids and liquids.
Io
-

112
>.483 0.528 0.573 0.618 0.63 0.708 0.753 0.738d-SPACING (A)
0.643 0.88 0.933 0.978
S4(b)0
8
0
0~
I II II I III I aI I I I I II
t.ooo LO45 1.000 1.35 1.10 1.225 1.270 1.30d-SPAING (A)
Fig. 4. Raw data (crosses) and calculated Rietveld profile (solid line) forAl 03 taken at 28 = 152' on the GPPD. Tick marks below the profilein icate positions of all allowed reflections. A difference plot(observed minus calculated) appears at the bottom. Background hasbeen subtracted before plotting.
o .
1 4(a)
.
I* IIlhIh I IIIIIII ItI n11111 II I 111111 III 1 1 IIll I | 111111 I ii II
1.023
I AA AA AA dt L, W& NA-W a- A- mbb f
f
-.aA.-A And i iI1 -. 1 -. A Y 1.AL".. - _ . -
I
- - - - - - - - - -
L.360 1.405 1.450 1.415T1sa

113
O'
0C
00
0
0
If
o
4(c)
I I I
. 1.562 1.607 1.652 1.697 1.742 1.77 1.632 M1.77 1.322 1.67 2.012 2.Cd-SPACING (A)
4(d)
57
0
a3-
2.04 .079 L4 .M ! .=K l. 204 2.34 2.364 2431 AM 2.2 2.574d-sAQNG (A)

114
SUMMARY
The GPPD and SEPD at IPNS-I clearly show that electronic focusing tech-
niques can be used to increase the Q range and flexibility of time-of-flight
diffractometers. The two IPNS-I diffractometers do this focusing during
data collection with a dedicated microcomputer. This allows high time reso-
lution before focusing and on-line display of the composite histograms.
REFERENCES
1. J. D. Jorgensen and F. J. Rotella, J. Appl. Cryst. 15, 27 (1982).
2. R. K. Crawford, R. T. Daly, J. R. Haunann, R. L. Hitterman, C. B.Morgan, G. E. Ostrowski and T. G. Worlton, IEEE Trans. Nucl. Sci. NS-28,3692 (1981).

115
ICANS-VI
INTERNATIONAL COLLABORATION ON ADVANCED NEUTRON SOURCES
June 27 - July 2, 1982
THE IPNS TIME-OF-FLIGHT SINGLE CRYSTAL DIFFRACTOMETER
A. J. Schultz, R. G. Teller and Jack M. Williams
Chemistry Division, Argonne National LaboratoryArgonne, Illinois 60435, U.S.A.
The single crystal diffractometer (SCD) at the Argonne Intense Pulsed
Neutron Source (IPNS) utilizes the time-of-flight (TOF) Laue technique to
provide a three-dimensional sampling of reciprocal space during each pulse.
The instrument contains a unique neutron position-sensitive 6Li-glass
scintillation detector with an active area of 30x30 cm. The three-
dimensional nature of the data is very useful for fast, efficient measure-
ment of Bragg intensities and for the studies of superlattice and diffuse
scattering. The instrument was designed to achieve a resolution of 2% or0
better (R = AQ/Q) with 29>60 and APO.7A.
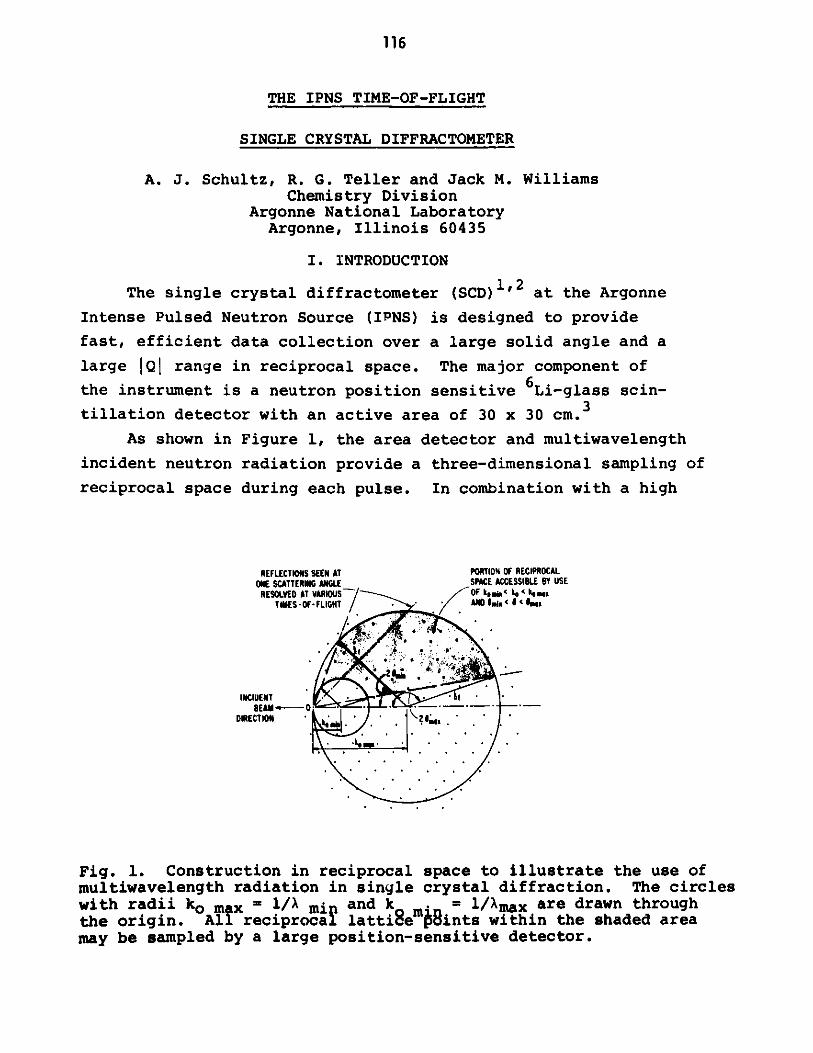
116
THE IPNS TIME-OF-FLIGHT
SINGLE CRYSTAL DIFFRACTOMETER
A. J. Schultz, R. G. Teller and Jack M. WilliamsChemistry Division
Argonne National LaboratoryArgonne, Illinois 60435
I. INTRODUCTION
The single crystal diffractometer (SCD) 1 , 2 at the Argonne
Intense Pulsed Neutron Source (IPNS) is designed to provide
fast, efficient data collection over a large solid angle and a
large lQ| range in reciprocal space. The major component of
the instrument is a neutron position sensitive 6Li-glass scin-
tillation detector with an active area of 30 x 30 cm.3
As shown in Figure 1, the area detector and multiwavelength
incident neutron radiation provide a three-dimensional sampling of
reciprocal space during each pulse. In combination with a high
REFLECTIONS SEEN AT PORTION OF RECIPROCALONE SCATTERING ANGLE -SPACE ACCESSIBLE BY USE
RESOLVED AT VARIOUS // OF ke0,Ia'ke (knTIMES-OF-FLIGHT /A im < 0 < es
INCIDENT -.- 1
BEAM--ODIRECTION
Fig. 1. Construction in reciprocal space to illustrate the use ofmultiwavelength radiation in single crystal diffraction. The circleswith radii ko max = l/a mi andkm = = 1/Xmax are drawn throughthe origin. All reciprocal latti8em$ints within the shaded areamay be sampled by a large position-sensitive detector.

117
intensity pulsed source this can lead to higher data rates or the
use of smaller crystals. The three-dimensional nature of the data
can also be extremely useful in studying superlattice and
scattering and diffuse scattering.
2. INSTRUMENT DESIGNl,2
The crystal and detector orienter incorporates all 4
circles which are normally found with conventional diffracto-
meters (see Fig. 2). The detector is mounted on a 0.5 m. detec-
tor arm which permits sample-to-detector distances of 20 to 45 cm.
and an accessible 26 range of 20-160*. A Displex closed cycle
helium refrigerator can be mounted on the diffractometer to permit
sample temperatures in the range of 10-300 K. The sample is 663 cm.
from the moderator surface, of which it "sees" a circular portion
8.8 cm in diameter. A low efficiency BF3 counter is 30 cm.
upstream from the sample and is used to monitor the incident
neutron flux.
Fig. 2. Photograph of the Single Crystal diffractometer. The areadetector is inside the shielded enclosure on the detector arm. ADisplex helium refrigerator mounted on the goniostat permitssample temperatures of 10-300 K.
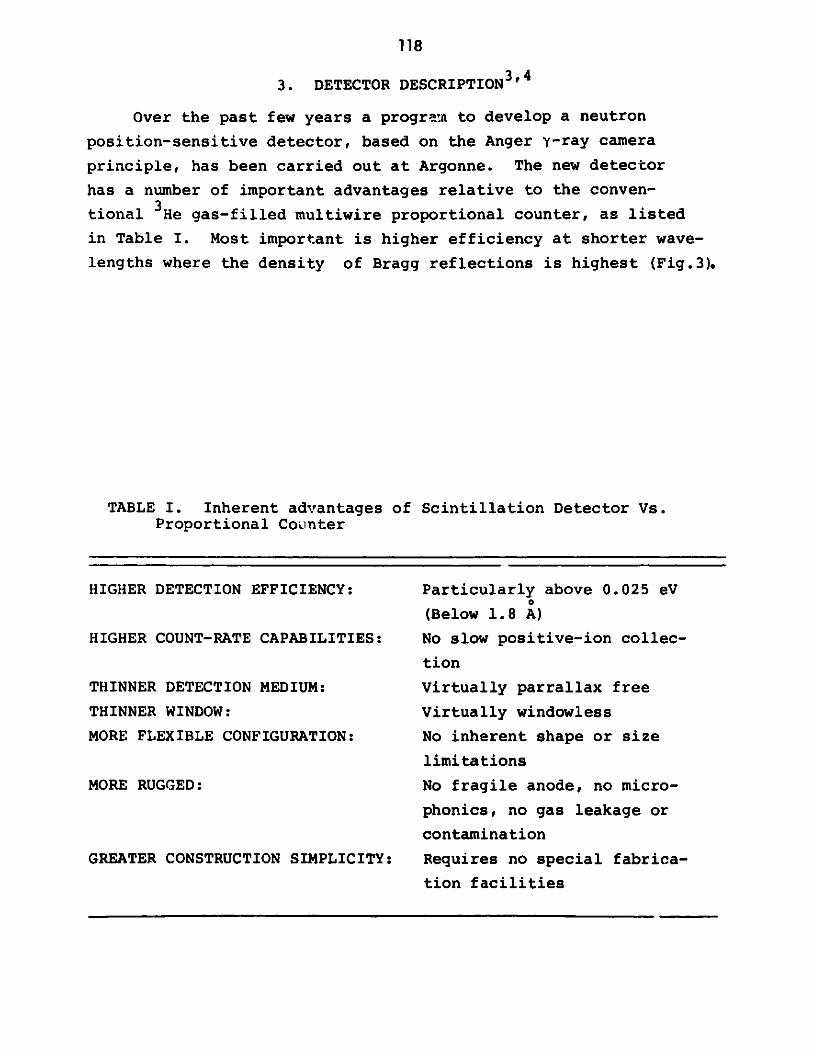
118
3. DETECTOR DESCRIPTION3 '
Over the past few years a program to develop a neutron
position-sensitive detector, based on the Anger y-ray camera
principle, has been carried out at Argonne. The new detector
has a number of important advantages relative to the conven-
tional 3He gas-filled multiwire proportional counter, as listed
in Table I. Most important is higher efficiency at shorter wave-
lengths where the density of Bragg reflections is highest (Fig.3).
TABLE I. Inherent advantages of Scintillation Detector Vs.Proportional Counter
HIGHER DETECTION EFFICIENCY:
HIGHER COUNT-RATE CAPABILITIES:
THINNER DETECTION MEDIUM:
THINNER WINDOW:
MORE FLEXIBLE CONFIGURATION:
MORE RUGGED:
GREATER CONSTRUCTION SIMPLICITY:
Particularly above 0.025 eV
(Below 1.8 A)
No slow positive-ion collec-
tion
Virtually parrallax free
Virtually windowless
No inherent shape or size
limitations
No fragile anode, no micro-
phonics, no gas leakage or
contamination
Requires no special fabrica-
tion facilities

119
A(A)
3 2 1.5 I 0.7 05 0.3
--
-4
0 0 C 0 0 0.OOS 0 01 0 025 0 05 0 1 0.25 0.9 1.0
E (eV)
Fig. 3 Plots of neutron detector efficiency vs. wavelength for3He gas and 6Li glass.
Fig. 4. Neutron-position scintillation detector consisting of a7x7 array of square photomultiplier tubes, each 51x51 mm2 and a30x30 cm 6 Li glass scintillator shown at the lower right removedfrom in front of the light disperser.
10
0.9
0.6
0.4
02
U
UWI-W
0
00

120
A photograph of the detector now in use on the SCD is shown
in Figure 4, and a schematic drawing is shown in Figure 5. The
detector contains a 2 mm. thick 6Li-loaded, Ce-activa-
ted, glass scintillator, a 38 mm. thick light disperser con-
sisting of Pyrex glass and plexiglass, and a 7x7 array of
2-inch square photomultiplier tubes (PMT's). A small air gap
(0.1 mm.) between the scintillator glass and the light disperser
provides a critical refraction angle of 400 which spreads the
light over at least two PMT's in the horizontal and vertical
directions. Incident light rays with angi.es greater than 400
are reflected and then scattered back by the layer of aluminum
oxide on the opposite side of the scintillator.
The signal from each PMT is resistively weighted according
to X and Y positions, respectively. The weighted sums for X
and Y are divided by the unweighted sum to provide the centroid
of the scintillation event. We estimate the intrinsic resolu-
tion of the detector is approximately 3.5 mm.
XHIGH VOLTAGE WEGHTING X DVI E D
SUPPLY AND RESISTORS VDE AC
DISTRIBUTION Y COMPUTER- WEIGHTING Y DIDE AC
RESISTORS VDE AC
49 PM ARRAY SUMMER E SCA|STROBE
DISPERSER DISPLAY
AIR GAP
6Li GLASS SCINTILLATORn
Fig. 5. Basic operation of neutron-position scintillation detector.The position of a neutron interaction in the Li glass is deter-mined by calculating the normalized centroids of scintillation X/Eand Y/E using a resistor weighting scheme.
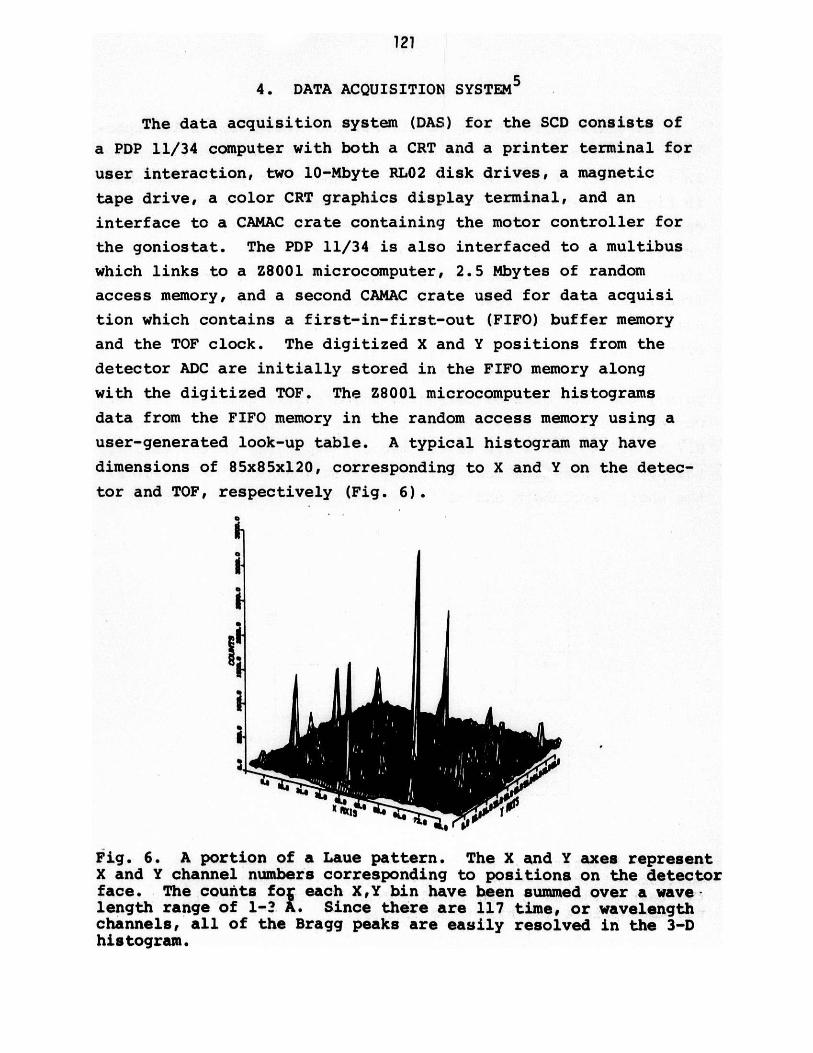
121
4. DATA ACQUISITION SYSTEM5
The data acquisition system (DAS) for the SCD consists of
a PDP 11/34 computer with both a CRT and a printer terminal for
user interaction, two 10-Mbyte RLO2 disk drives, a magnetic
tape drive, a color CRT graphics display terminal, and an
interface to a CAMAC crate containing the motor controller for
the goniostat. The PDP 11/34 is also interfaced to a multibus
which links to a Z8001 microcomputer, 2.5 Mbytes of random
access memory, and a second CAMAC crate used for data acquisi
tion which contains a first-in-first-out (FIFO) buffer memory
and the TOF clock. The digitized X and Y positions from the
detector ADC are initially stored in the FIFO memory along
with the digitized TOF. The Z8001 microcomputer histograms
data from the FIFO memory in the random access memory using a
user-generated look-up table. A typical histogram may have
dimensions of 85x85x120, corresponding to X and Y on the detec-
tor and TOF, respectively (Fig. 6).
.I
I.
Fig. 6. A portion of a Laue pattern. The X and Y axes representX and Y channel numbers corresponding to positions on the detectorface. The counts foV each X,Y bin have been summed over a wave-length range of 1-3 A. Since there are 117 time, or wavelengthchannels, all of the Bragg peaks are easily resolved in the 3-Dhistogram.
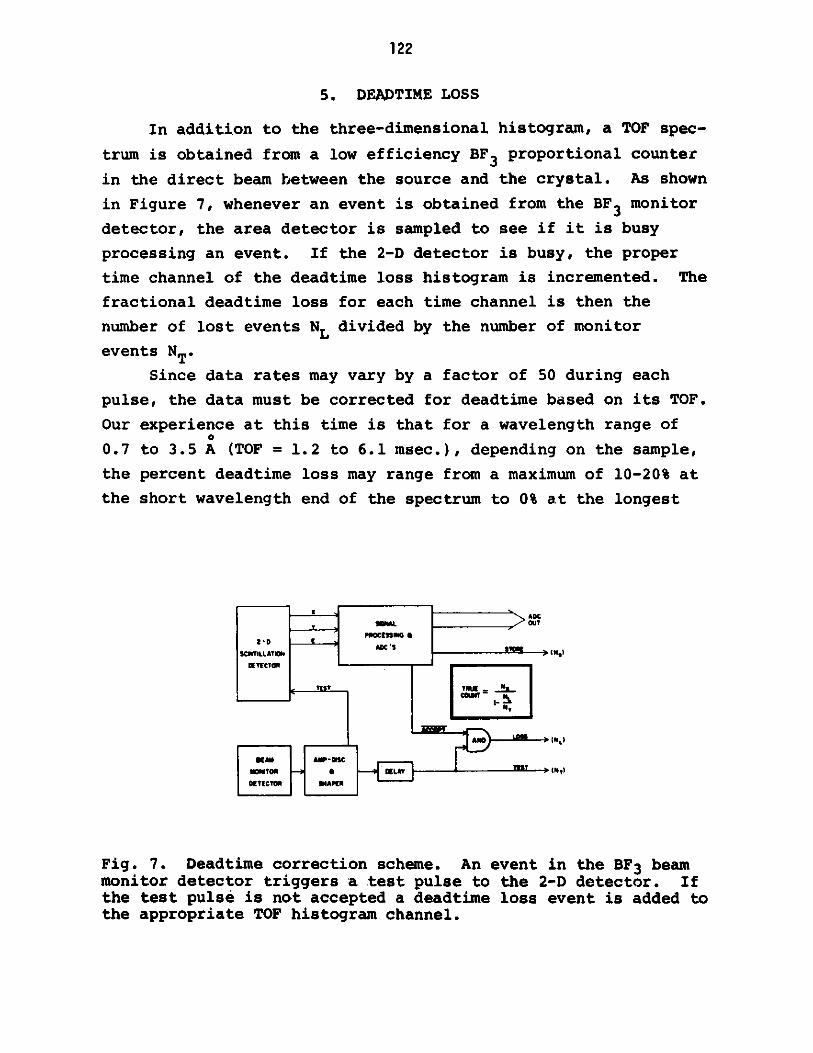
122
5. DEADTIME LOSS
In addition to the three-dimensional histogram, a TOF spec-
trum is obtained from a low efficiency BF3 proportional counter
in the direct beam between the source and the crystal. As shown
in Figure 7, whenever an event is obtained from the BF3 monitor
detector, the area detector is sampled to see if it is busy
processing an event. If the 2-D detector is busy, the proper
time channel of the deadtime loss histogram is incremented. The
fractional deadtime loss for each time channel is then the
number of lost events NL divided by the number of monitor
events NT.
Since data rates may vary by a factor of 50 during each
pulse, the data must be corrected for deadtime based on its TOF.
Our experience at this time is that. for a wavelength range of
0.7 to 3.5 A (TOF = 1.2 to 6.1 msec.), depending on the sample,
the percent deadtime loss may range from a maximum of 10-20% at
the short wavelength end of the spectrum to 0% at the longest
moio2dtcortigrsatstple tUhN2Ddeeto. I
SCarr LL ATist ADC ShannNeDETECTOR
0E T ECTCOUNT 1A
Fig. 7. Deadtime correction scheme. An event in the BF3 beam
monitor detector triggers a test pulse to the 2-D detector. If
the test pulse is no~t accepted a deadtime loss event is added to
the appropriate TOF histogram channel.

123
wavelength. From observed counting rates, we estimate this
represents an average deadtime of approximately 7 u sec. This
number includes the rejection of signals which do not fall
within the pulse-height discriminator window (e. g., gamma-rays)
or have been effected by pileup. Since the pulse risetime of
the 6Li glass is 0.5 usec. (90% of final amplitude), improve-
ments in shielding, background levels, signal shaping and
position encoding could lead to a smaller deadtime.
6. RESOLUTION
The resolution function of the instrument is
S2 2R = [R + RL + (cot0*AO)2 ]%
where S = 2sin= (2m/h) (L/t) sine and t is the time-of-flight,
L is the neutron flight distance, 0 is the Bragg angle, A is
the neutron wavelength, m.t.is the neutron mass, and h is Planck's
constant. Reasonable values for the variables in the resolution
function are Rt = 0.017, RL = 0.0015 and AO = 0.850. By
varying the time channel width such that At/t is constant, these
values are wavelength independent and RS is 20 dependent due to
the cote function. However, above 20 = 600 the contribution
to RS becomes small, and RS quickly approaches or falls below0 0
a value of 0.02. To resolve a 25 A axis at the d-spacing of 1 A
only requires 4% resolution, such that the SCD resolution is
sufficient for single crystal studies of mose molecular ,com-
pounds with upwards of 100 independent atoms in the unit cell.

124
REFERENCES
1S. W. Peterson, A. H. Reis, Jr., A. J. Schultz and- P. Day,Advances in Chemistry Series, No. 186, Solid State Chemistry:A Contemporary Overview, S. L. Holt, J. B. Milstern andM. Robbins, eds., American Chemical Society, 1970, pp. 75-91.
2A. J. Schultz, R. G. Teller, J. M. Williams, M. G. Strauss andR. Brenner, Trans, Am. Cryst. Assoc., Vol. 18, 1982, in press.
A. J. Schultz, R. G. Teller, S. W. Peterson and J. M. Williams,Transactions of the Symposium on Neutron Scattering, ArgonneNational Laboratory, August 12-14, 1981, American Institute ofPhysics, J. Faber, ed., in press.
M. G. Strauss, R. Brenner, F. J. Lynch and C. B. Morgan, IEEETrans. Nucl. Sci., NS-28, 800 (1981).
5R. K. Crawford, R. T. Daly, J. R. Baumann, C. B. Morgan, G. E.Ostrowski and T. G. Worlton, IEEE Trans. Nucl. Sci., NS-28,3692 (1981).

125
BERYLL IUM-BERYLL IUM OXIDE FILTER DIFFERENCE SPECTROMETER
by
J. A. Goldstone, J. Eckert, A. D. Taylor,and E. J. Wood
Los Alamos National LaboratoryLos Alamos, NM 87545

126
1. INTRODUCTION
Inelastic neutron scattering is the most important technique for the
study of elementary excitations in condensed matter over a wide range of
energy and momentum transfers. However, intensity limitations do, in some
instances, prevent the use of inelastic neutron scattering. Since some of
the new pulsed neutron sources promise to reach higher neutron fluxes than
currently available at reactor based sources, the development of optimal
inelastic time-of-flight (TOF) neutron spectrometers is of considerable
importance. Even at the present low to medium flux pulsed sources the
spectrum in the epithermal region is more intense than at high flux reactors,
particularly if a hot moderator is not used. Molecular vibrational
spectroscopy using inelastic incoherent neutron scattering is a natural
application for this energy range whose importance has increased greatly
since the Be filter inelastic spectrometer IN-lB at the hot source of the
reactor of the Institut Laue Langevin (ILL) became available. The instrument
described in this paper is an optimized TOF analog of the ILL spectrometer
for use at pulsed neutron sources.
For inelastic scattering by TOF techniques either the incident or final
flight time of the neutrons scattered by the sample must be determined
separately as only the total flight time is recorded. In the Be filter
spectrometer the final energy of the neutrons reaching the detector is less
than the polycrystalline cutoff (5.22 meV) which gives a wide bandpass of
final flight times. The resulting count rates are therefore much higher than
those of a crystal analyzer whose bandpass is defined by the crystal mosaic
and the range of Bragg angles available to the scattered neutrons.
Furthermore, since the final energy for a filter analyzer is small compared
to the incident neutron energy for measurements of large energy transfers,

127
the momentum transfer Q does not vary much with scattering angle. A large
solid angle can therefore be covered with adequate Q-resolution. This type
of spectrometer is however most useful for the study of essentially
dispersionless excitations, since it effectively allows only one cut through
(Q,E) space.
A large improvement for the filter spectrometer is possible by taking the
difference of spectra recorded with two different filter materials. The
instrument described in this paper utilizes as the bandpass of final energies
the difference between the cutoffs of Be and BeO of 1.5 meV. A schematic of
the spectrometer is shown in Fig. 1. The filter sections are arranged in an
alternating sequence of beryllium and beryllium oxide, five on each side
covering a range of 900 in scattering angle on each side. The physical
dimensions of a section are: inner radius 90m, outer radius 240mm, angular
spread 180 and height 100m. The sample position is 13m from the target
and the detectors are 0.28m from the sample. Each detector bank consists of
six 3He 10 atm detectors. The beam size is 25m x 100m at the sample
position. Each bank is separately recorded, like filter material spectra
summed, and the weighed difference taken.
We begin by giving a description of the data analysis for a simple filter
analyzer, followed by a discussion of the difference method. The filter
difference technique is then compared with the single material filter and the
current Weapons Neutron Research (WNR) crystal analyzer. A brief survey of
experiments conducted with the difference spectrometer is presented in
section 4. Finally, the expected types of use of this instruent in future
high intensity operation are discussed.
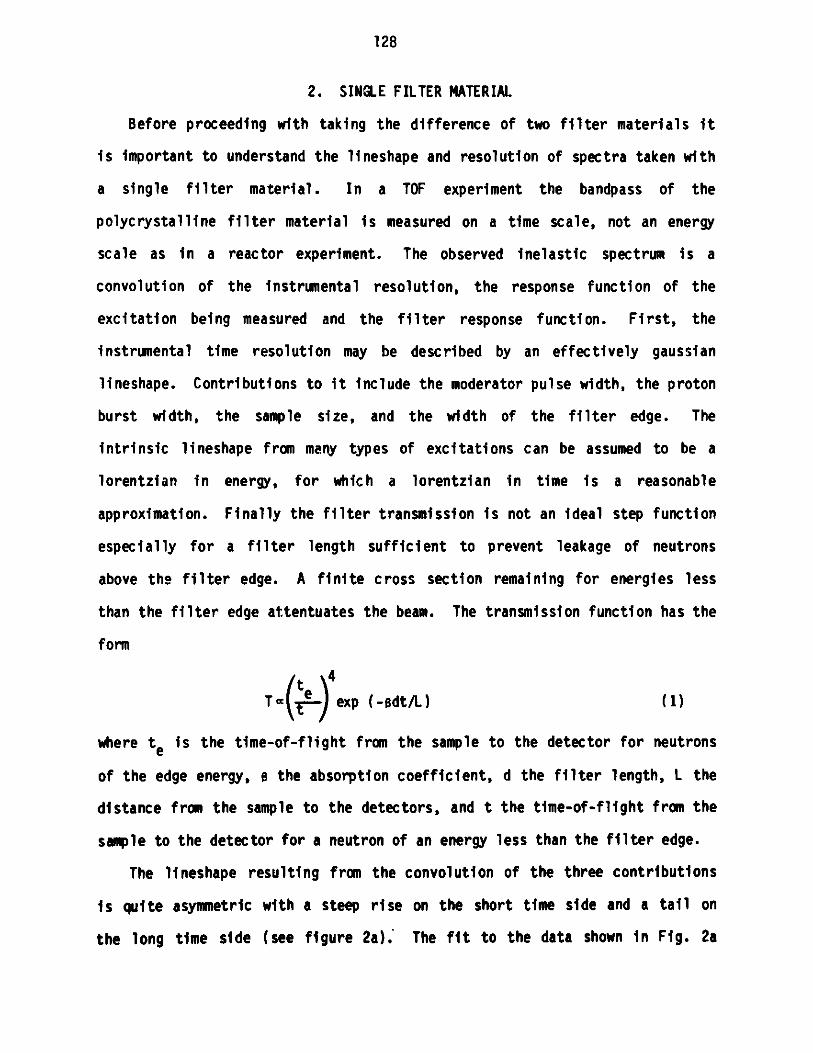
128
2. SINGLE FILTER MATERIAL
Before proceeding with taking the difference of two filter materials it
is important to understand the lineshape and resolution of spectra taken with
a single filter material. In a TOF experiment the bandpass of the
polycrystalline filter material is measured on a time scale, not an energy
scale as in a reactor experiment. The observed inelastic spectrum is a
convolution of the instrumental resolution, the response function of the
excitation being measured and the filter response function. First, the
instrumental time resolution may be described by an effectively gaussian
lineshape. Contributions to it include the moderator pulse width, the proton
burst width, the sample size, and the width of the filter edge. The
intrinsic lineshape from many types of excitations can be assumed to be a
lorentzian in energy, for which a lorentzian in time is a reasonable
approximation. Finally the filter transmission is not an ideal step function
especially for a filter length sufficient to prevent leakage of neutrons
above the filter edge. A finite cross section remaining for energies less
than the filter edge attentuates the beam. The transmission function has the
form
Tc ( exp (-Bdt/L) (1)
where te is the time-of-flight from the sample to the detector for neutrons
of the edge energy, B the absorption coefficient, d the filter length, L the
distance from the sample to the detectors, and t the time-of-flight from the
sample to the detector for a neutron of an energy less than the filter edge.
The lineshape resulting from the convolution of the three contributions
is quite asymmetric with a steep rise on the short time side and a tail on
the long time side (see figure 2a). The fit to the data shown in Fig. 2a

129
shows that this model for the filter lineshape yields reasonable parameters
at least for isolated peaks. Not shown is the fit to the BeO spectrum, which
is in excellent agreement with the fit to the Be spectrum. Thus we can
consider spectra taken with a single material filter to be well understood.
These spectra, however, have some disadvantages which limit the
usefulness of such a spectrometer. The relatively poor resolution makes
deconvolution of overlapping peaks difficult, particularly if a broadened
peak shows no obvious structure. A practical upper limit of three
lorentzians in a convolution reduces the information obtainable from a
complex spectrum such as that shown in figure 3a. The most disturbing aspect
of the model is that the shift of the peak position resulting from the
convolution is dependent on the intrinsic width of the mode being measured.
The time-to-energy transformation is therefore very complex.
3. DIFFERENCE METHOD
Some of the complications and restrictions of the single filter spectra
may be overcome by combining data using filters with two different cutoff
energies such as Be and BeO. The bandpass is then restricted to the energies
between the two cutoffs (3.76 to 5.22 meV). While this is important, the
main improvement results from the elimination of the long low energy tail
present with the single filter material.
The most important problem for the difference method is to subtract the
two spectra correctly. For physical considerations the filters were selected
to be the same length and the detectors all the same distance from the
sample. In order to perform the difference, the transmission fractions for
the two filters should be matched for energies below that of the BeO edge.
Using Eq. 1 of section 2, we require that

130
a T(Be) = a' T(BeO)
or
at exp (-Bdt/L) = a' exp (-s'd't/L')
where the primed values refer to the BeO. Since d and L are the same for
both materials, then
exp [-d(B-s')t/L]
giving a'/a = 0.58 at the Be edge. Although a'/a is still a function
of t, its dependence over a peak is weak and may be replaced by a weighted
mean a = 0.60. This is in excellent agreement with transmission
measurements made on two sections at WNR which yielded a mean ratio of 0.60.
While taking the difference leads to a loss in statistical accuracy, the
high throughput of the spectrometer nevertheless allows a few percent
statistics to be collected in a reasonable amount of time. The advantages
gained however are considerable. First, a symmetric lineshape (see Fig. 2b)
is recovered because the bandpass between the two filter edges is nearly a
square function. Second, the greatly improved resolution allows peaks which
are not obvious in the undifferenced spectra to be discerned. An example is
given in figures 3a and b where the Be filter spectrum and the difference
spectrum of potassium hydrogen maleate are shown. Finally, the time to
energy mapping is no longer dependent on the intrinsic width of the
vibrational excitation. Fitting can now be performed outside the
convolution, which is needed in the undifferenced case, and can be done on an
energy rather than a time-of-flight scale.

131
The resolution of the filter difference spectrometer is compared (Fig 4.)
with that of the crystal analyzer spectrometer currently in use at the WNR.
At energy transfers greater than about 100 meV the resolution is similar to
that of the crystal analyzer, but the count rate significantly is higher
because of the larger solid angle covered and the wider bandpass of final
energies.
4. EXPERIMENTAL PROGRAM
The present experimental program using the filter difference spectrometer
at the WNR consists of the following areas.
(1) A principal application has been the study of localized hydrogen
vibrations in metals, particularly the bcc hydrides such as Nb and Ta. In
this case the aim is to relate vibrational energy levels to anhannonicity of
the hydrogen potential. A program in cooperation with Sandia National
Laboratories has been initiated on rare earth metal hydrides. The
vibrational frequencies and relative occupation of tetrahedral and octahedral
site hydrogen atoms have been measured for concentrations near the dihydride
for lanthanum and yttrium (see Fig. 5). In addition, the hydrogen storage
material FeTi was studied.
(2) The vibrational frequencies of H in extremely short intruiolecular
hydrogen bonds were determined for a number of such compounds in a
collaboration with the University of Durham, U.K. (see, e.g. the spectrum of
KH maleate, Fig. 3b). The resulting correlation of the out-of-plane bending
mode y(OHO) with the 0-0 distance is completely different than that found in
many previous studies for the usually longer intermolecular hydrogen bonds.
(3) A series of experiments were conducted to study the coupling of
torsional modes of NH2 and NH 4 groups to other internal modes in

132
insensitive high explosives such as picrates, triaminotrinitrobenzene and
related compounds (Fig. 6). Torsional modes could readily be identified, and
pronounced frequency shifts were observed as a result of the intramolecular
mode coupling.
(4) Catalytic reactions can be studied on large surface area materials
owing to the penetrating power of neutrons in comparison to electrons or
light. Preliminary experiments on organometallic compounds such as
Mn(CO)5CH3 and HCCo3(CO) 9 to observe C-H modes have been performed.
Work is also in progress on ethylene on a supported platinum catalyst in
collaboration with Brookhaven National Laboratory.
5. CONCLUSIONS
A successful experimental program has been initiated on the filter
difference spectrometer. The instrument is most appropriate for energy
transfers from about 50 to 600 meV when moderate energy resolution is
sufficient and a high count rate of importance. The difference technique is
well enough understood so that peak positions, line widths and integrated
intensities can be determined from fairly complex spectra.
Several improvements to the instrument are in progress. An important
change will be cooling of the sections which is expected to give
approximately a factor of two increase in signal. The solid angle subtended
by the detector banks will also be increased by a factor of 1.7 without
significant degradation in resolution. With these improvements, much smaller
samples can be examined in cases where material is unavailable in larger
quantities, as well as samples with much small scattering cross sections.

133
The major improvement will come when the proton storage ring becomes
operational in 1985. A total increase of approximately 100 in neutrons
detected will allow much more difficult experiments to be performed on this
instrument with still a fast turnover rate.

134
DETECTOR
BANKS
~~ ~
SAMPLEa"0
890 0
Fig. 1
A schematic of the filterdifference spectrometer isshown. Filter sections are150mm long, 100mm high andspan 18 degrees. Eachdetector bank consists ofsix 3He 10atm detectors.
13.0 m -2 0.28m
6
5
4
3
^.2V I
I-
2LU
z
3
2
01
CrOOHI I I I IK PEAK
Be POSITION a151 m.VFWHMI3 meV _
- --
. t -
I I I I"
"
"U
C
I-(I)
WH-Z
K H MALEATE
28
-
Be 2*
. 1
2
4
01
16
12 1
8
4
2200 2400 2600 2600 3000 3200TIME (ps)
Fig. 2. (a) Chromous acid spectrumfrom the beryllium filter data andthe fit given by the solid line.(b) Chromous acid differencespectrum. Notice the missingtail on the long time side of the
peak.
2000 2500 3000 3500
TIME (ps)4000 4500
Fig. 3. (a) Beryllium filterspectrum of potassium hydrogenmaleate. (b) Difference spectrumof potassium hydrogen maleate.The peak at 2,500 us is y(OHO)mode.
.. * '- .eBo .*6 -
0.
owl@
1. 1 1 1 1m
0L
TARGET
I

135
10
w
v45
20 50 100 200 500
q (mV)
Fig. 4. Energy resolution (FWHM) of thefilter difference spectrometer (FDS) andthe lANR crystal analyzer spectrometer (CAS).
I
*I
-in- !M
nRpwgy Tranue wV)
Fig. 5. Yttrium dihydride spectrium takenon the filter difference spectromter.The peak near 80 mYe is due to octahedralsite hydrogen atoms chile the one at 120 meVis due to tetrahedral site atoms.
r
FOS - -o
- -/cas
YH ADS 80 K
_1 1 l 1 l l l l

136
N
C
I-
I-z
500 1000 1500
FREQUENCY (cm 1)
Fig. 7
Tricobalt-nonacarbonyl-methylidyne differencespectrum showing the H-Cbending mode at 105 meV,a C-Co stretch at 86 meVand their harmonics at172 and 210 meV. Themodes between 50 and70 meV are Co-C-0 andCo-Co modes.
0
C
0
C
TATB 15K
I I*I
500 1000 1500 2C(FREQUENCY (cm')
p-Nitroaniline 15 K NitH H .
H H
NO2
2000
"
HCCoCCOk
I.
. .I:J .
""
"
1 ".6-0'-
f... *G'o'-..i N
50 100 150 200 250
Fig. 6
1, 3, 5-triamino 2, 4, 6-trinitrobenzene(TATB) andpara-nitro-aniline areshown. The NH2 torsionalfrequency (arrows) issignificantly higher inTATB where strong couplingto the NO2 groups issuspected.
g
I I

137
ICANS-VI
INTERNATIONAL COLLABORATION ON ADVANCED NEUTRON SOURCES
June 27 - July 2, 1982
A RESONANCE FILTERED BEAM SPECTROMETER
R.M. Brugger*, A.D. Taylor+, C.E. Olsen, J.A. Goldstoneand A.K. Soper
Physics DivisionLos Alamos National Laboratory
Los Alamos,'NM 87545
ABSTRACT
A new inelastic neutron scattering spectrometer which operates in the
range 1 eV to 15 eV has been developed at the Los Alamos pulsed spalla-
tion source WNR. Based on a nuclear resonance filtering the beam, the
concept has been tested in 'direct', 'inverted' and 'sample' geometries.
A number of resonance filters have been tested to determine their effec-
tiveness. The spectrometer is described and examples of data are
presented.
*Permanent address: University of Missouri Research ReactorUniversity of MissouriColumbia, MO
+Permanent address: Rutherford Appleton LaboratoryChilton, DidcotOXON OX11 OQXUnited Kingdom

138
I. INTRODUCTION
The next generation of neutron sources, pulsed spallation sources, are
now producing neutrons and scientific results(1). These sources have a
rich flux of epithermal neutrons which should open up unique research in the
field of electron volt energy transfers. However, before this can be tested,
spectrometers must be developed to explore this region. One such
spectrometer, the resonance filtered beam spectrometer FBS is described in
this paper2,3.
II. PRINCIPLE OF OPERATION'
The FBS uses a foil or filter with a strong nuclear resonance at ER to
define the energy of the incident (or scattered) neutrons. The scattered (or
incident) energy is then found by time-of-flight TOF. The difference between
TOF spectra taken without and with a filter in the beam gives the spectrum of
scattered neutrons that would have had an incident (or final) energy
corresponding to ER. Thus the primary and secondary energies and momenta
can be determined, and the conditions for performing an inelastic neutron
scattering experiment are achieved. If the filter is in the incident beam,
the geometry is called 'direct' while with the filter in the scattered beam,
the geometry is called 'inverted.' A related arrangement, 'sample' geometry,
where the system under investigation has a component with a nuclear
scattering resonance has also beam tried, and is described.
III. RESOLUTION
The overall energy transfer resolution is a convolution of the
contributions from the energy width of the resonance, incident and scattered
flight path uncertainties and the moderated neutron pulse widths. These

139
contributions are, to a first approximation, for the direct geometry case,
respectively
(2). E 3/2
(3)=E3/2
(4) fAE = 2 - Ef3 t2
(AE)=2 (i)2
In these equations, L1 and Lf are the incident and scattered flight paths
and AL, and ALf their respective uncertainties. The energy width of the
resonance filter's transmission Is tiER. The moderated neutron pulse width,
tit, Is itself a convolution of contributions fran neutron moderation &tm'
and fran the Intrinsic width of the proton burst tt where
A2 t=2 E + At 2
or
2 .. 4000 2et t + at

140
Lengths are measured in meters, energies in meV and time in ws. For the
inverted geometry case, these expressions become
3/2'
AE(1) = + (E) aER
(2) AL1AE =2 -E
3/2
(3) = A E
f
3/2
(4) fl EAE = 2 "F r t
The above sets of equations indicate that the FBS in the direct geometry
and inverted geometry are similar in resolution when flight paths can be
optimized and energies are comparable. One practical consideration favoring
the inverted geometry is that with the existing target shield it is quite
difficult to make Li short for the direct geometry while it is quite easy
to make Lf short for the inverted geometry.
In addition to these explicit contributions to the energy transfer
resolution, a defocusing effect is produced as the dispersion relationship
for a given mass nucleus crossing the Q-E locus for a resonance at a
particular scattering angle. The effect may be seen in figure 1 (direct
geometry) and figure 2 (inverted geometry). In these figures both the
dispersion relation and the Q-E loci which are illustrated as lines are, in
reality, bands in Q-E space.
141
IV. RESONANCE FILTERS
A search was made for nuclei with suitable resonances. Table I is a
partial list of those which have been identified. It is important that the
appropriate resonance is well separated from other resonances, that the
resonant cross-section is high while the cross section beyond the resonance
be relatively small. Also it is important that the resonance have a narrow
natural width and a narrow Doppler width. Further criteria are that the
material can be easily obtained elementally or isotopically and that it is
easy to handle. The underlined cases in table I are those that have been, or
are planned to be used at WNR. What is of importance in the measurement is
not the cross-section but the transmission, so the resolution and intensity
of a given resonance may be tuned by adjusting the filter thickness. As an
example, ENDF/B-V cross-section data show the Doppler broadened widths of the
1.056 eV resonance of 240Pu to be 58 meV at 300K and 43 meV at 77K. Such
widths are only achievable in the limit of an infinitly thin absorber for
which there would be no significant signal. Considerations of signal and
resolution imply that at the resonance center an attenuation of about 0.75 is
appropriate. Note that the optimum thickness for a gi!ePn resonance is a
function of the filter temperature. Figure 3 gives the variation of AER as
a function of the filter thickness for 240Pu. Data for Rh, Au and 238U
filters are given in figure 4. The solid points on the curves show the
filter thicknesses at which the peak of the resonace gives 0.75 attentuation.
Table I shows that there are a number of available elements or isotopes
that have narrow and isolated resonances. The limit to the resolution which
can be achieved, set by the natural and Doppler widths of these resonances

142
is about 50 meV for 1 eV neutrons using a 240Pu foil and 75 meV FWHM at
6.67 eV using a 238U foil.
V. EXPERIMENTAL ARRANGEMENT
The three modes of this spectrometer have been developed and tested at
WNR. Figure 5 shows the WNR target station and experimental area with the
FBS set up in direct goemetry. On flight path 3 the incident flight path is
about 5.5 m and the scattered neutrons are detected at about 5.5 m from the
sample at an angle which may be varied between 0 and 120'. The unscattered
beam is removed via the get lost pipe, thus reducing background.
Figure 6 shows the specta with the filter in and with the filter out when
the sample was a thin slab of H20 and a 0.002" thick sheet of Rh metal was
the resonance filter. The scattering angle was 22 . At short times (less
than 300us) where the foil essentially attenuates no neutrons both spectra
superimpose exactly. The dip in the foil in the spectrum at 700 is
corresponds to neutrons being absorbed from the primary beam at 1.257 eV by
the Rh resonance. The difference between the two spectra, equivalent to
scattering from an incident beam of 1.257 eV neutrons, is shown in figure 7.
The resolution function of this version of the spectrometer calculated
for current WNR conditions using the equations of section III is given in
figure 8 for a variety of resonance filters. It should be noted that the WNR
proton pulse of about 4 ps (contribution eE(4)) dominates the 238U
resolution, is an equal contribution to the resolution when Au is the filter,
but does not effect the resolution functions when either Rh or 240Pu are
the filters.
Figure 9 shows the FBS set up in its inverted geometry mode on fly ht
path 11. In this configuration the incident flight path of about 30 m
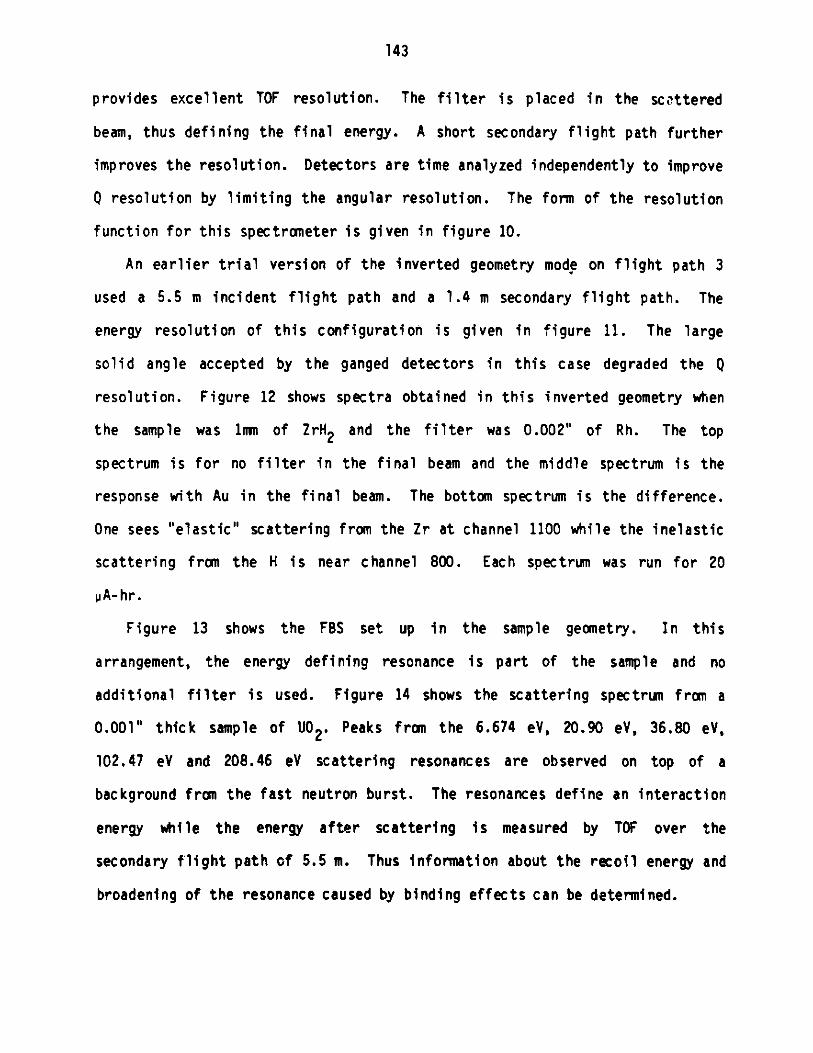
143
provides excellent TOF resolution. The filter is placed in the scttered
beam, thus defining the final energy. A short secondary flight path further
improves the resolution. Detectors are time analyzed independently to improve
Q resolution by limiting the angular resolution. The form of the resolution
function for this spectrometer is given in figure 10.
An earlier trial version of the inverted geometry mode on flight path 3
used a 5.5 m incident flight path and a 1.4 m secondary flight path. The
energy resolution of this configuration is given in figure 11. The large
solid angle accepted by the ganged detectors in this case degraded the Q
resolution. Figure 12 shows spectra obtained in this inverted geometry when
the sample was 1m of ZrH2 and the filter was 0.002" of Rh. The top
spectrum is for no filter in the final beam and the middle spectrum is the
response with Au in the final beam. The bottom spectrum is the difference.
One sees "elastic" scattering from the Zr at channel 1100 while the inelastic
scattering from the H is near channel 800. Each spectrum was run for 20
pA-hr.
Figure 13 shows the FBS set up in the sample geometry. In this
arrangement, the energy defining resonance is part of the sample and no
additional filter is used. Figure 14 shows the scattering spectrum from a
0.001" thick sample of U02 . Peaks from the 6.674 eV, 20.90 eV, 36.80 eV,
102.47 eV and 208.46 eV scattering resonances are observed on top of a
background from the fast neutron burst. The resonances define an interaction
energy while the energy after scattering is measured by TOF over the
secondary flight path of 5.5 in. Thus information about the recoil energy and
broadening of the resonance caused by binding effects can be determined.

144
The spe-tra presented in the proceeding paragraphs show the versatility
of FBS and that it can operate in all three geometries.
VI. SCATTERING EXPERIMENTS
The goals of developing eV spectrometers are to study high energy
excitations, excitations that show the ground state momentum distribution of
particles, transitions between magnetic states of crystals, and transitions
between electronic states of materials. Many of these experiments are
difficult and beyond the initial capabilities of FBS or any other eV
spectrometer. More accessable experiments were tried first to show the
capability of an FBS.
An easy class of experiment is found by scattering from atoms of mass 1
amu, where the widths of the inelastic scattering are correspondingly
greater. Scattering at high Q gives a direct observation of the ground state
momentum distribution of the H atom and hence leads to the shape of the
potential the proton experiences. Such measurements are clearly of
importance in understanding, for example, hydrogen bonded systems.
As a preliminary experiment, the ground state momentum distribution of
ZrH2 was investigated where the potential is well described by a simple
harmonic oscillator of frequency 140 meV. Figure 15 shows data for
scattering from ZrH2 at 90' using a 0.002" Rh foil. The sharp peak at
channel 45 corresponds to recoil scattering from Zr atoms and the broad
feature centered at channel 66 is due to scattering from H. The width of the
Zr peak corresponds to the calculated resolution function. The dashed line
corresponds to scattering from a simple harmonic oscillator of frequency 150
mev, evaluated along a constant scattering angle of 90 . The resolution

145
function for the Rh foil has been folded in. The actual position of the
maximum in scattering from H is an artifact of the cut taken thru Q-e space
and the shape of S(Q,E). This position is very sensitive to the width of the
scattering function. Figure 16 shows an inverted geometry measurement made
on the same system with a 0.002" Rh filter and the detectors at 60, (using
the short FP 3 configuration). These data have been transformed to an energy
transfer scale. Again the sharp peak at E= 0 eV is Zr scattering and its
width is in excellent agreement with the calculation shown in figure 11. The
broad H mode centered at E= 1.5 eV is again consistent with a simple
harmonic oscillator of frequency 150 meV. This time the peak does reflect a
maximum in S(Q,e). Detailed analysis of these data was not carried out due
to the large (+ 6) acceptance of the detector bank in the trial geometry.
Scattering at large Q requires large scattering angles, thus removing
detector from regions of high background. The physics processes in the
system of interest tend to broaden with Q and so energy and resolution
requirements become less severe. Figure 17 shows the high Q scattering from
a series of different mass nuclei. The FBS was in direct geometry with the
scattering angle 117.5' and the foil was 0.003" of 238U. In these data,
i2 02shifts in peak position due to recoil, ER = ,- are evident. The
effect being greatest for the mass 4 amu case. Although for these particular
run conditions the width of each peak was dominated by instrumental
resolution, the effect of resolution is again least for He. By fitting the
He data, a ground state momentum distribution of the struck particles (normal
He) was obtained. The He peak has a width corresponding to an effective
temperature of 13K, in agreement with previous measurements. The resolution,
figure 8, of this geometry was, however, too poor to attempt to separate the
condensate and noncondensate fractions for He below the lambda oint.

146
Two approaches are possible to improve the charactistics of the He
experiment. By using the inverted geometry, with a long primary flight path
and by using short proton burst ( 0.5 uas) all contributions to the resolution
can be made small relative to the intrinsic energy width of the resonance.
For a 30 m primary path and a 1 m secondary path, some 100 meV resolution may
be achieved at a final energy of 6.67 eV corresponding to the 238U
resonance. The second device which may be employed to improve the experiment
is, that by going to the inverted technique (E1 > Ef = ER), Q can be
increased since Ei is larger. This expands the characteristic widths of
both distributions, which are proportional to Q, relative to the intrinsic
resolution, which has a much weaker dependence on Q. Figure 18a, illustrates
the cut taken thru Q-E space and Figure 18b shows simulated data including a
statistical variance appropriate to the subtraction technique for a 10%
condensate fraction. A fit to these simulated data (solid and dashed lines)
allows the two components of this lineshape to be extracted, recovering,
within resonable errors, the simulated condensate fraction and the condensate
and noncondensate widths.
Figure 19 gives an example of a sample geometry experiment. The two
peaks correspond to scattering from the 6.674 eV resonance in U when the U
atoms are bound in U0 2 and UF4. Within the present resolution, the same
recoil energy and widths are measured for both materials.
The above examples of data show that a certain class of experiments using
eV neutrons on FBS are now possible. The results also provide encouragement
to attempt the more difficult experiments such as observing magnetic

147
transitions for which Q must be < 4 A-1 while E will be greater than 100
meV. Similar measurements to observe electronic excitations in molecules
will require Q <4 A-1.
VII. CONCLUSIONS
The results presented in the preceeding sections show that FBS works as
an inelastic neutron spectrometer with eV neutrons. its major disadvantages
are: 1) that the statistical accuracy of each point is limited because FBS
employs a difference to define an event and 2) the resolution is limited by
the energy width of the nuclear resonance used as a filter.
The general advantages of FBS are: 1) it is relatively easy to assemble
and use, 2) it can be used in all three geometries, 3) counting rates can
be large which helps to overcome the difference disadvantage, 4) the
subtraction technique removes fast neutron background, 5) a large number of
resonances are available, 6) the foils are relatively easy to handle and
cool, and 7) since only neutrons are detected, filters that are radioactive
can be used.
Both the direct and inverted geometry configurations have their merits.
In the direct geometry, the necessity of having a long secondary flight path
may be capitalized on for low Q scattering where a reasonable radial
separation between beam and detector may be achieved at small angle. A
further advantage of the filter being in the primary beam is that only a
small filter area is required and so smaller (and hence more esoteric)
filters may be used. Cooling the filters to suppress Doppler broadening is
also facilitated. The inverted geometry has the advantage that the long
initial flight path fits well with the biological shielding requirement. In
many cases, the direct and indirect geometries complement each other.

148
References
1. C. G. Windsor, Pulsed Neutron Scatttering, Taylor and Francis
Ltd, London (1981).
2. R. M. Brugger, A. D. Taylor, C. E. Olsen and J. A. Goldstone,
Bulletin of the APS, 27, #1, pp 13 (Jan 1982).
3. A. D. Taylor and R. M. Brugger, Bulletin of the APS, 27, #1,
pp 14 (Jan 1982).

149
Ac knowiledc'ments
The authors appreciate the encourgement and helpful discussions of
Richard Silver and the mechanical assistance of Rod Hardee.

150
TABLE I
5o2u Possible Resonances for FIS
Isotope NaturalAbundance
(%)
ER Nuclear Doppler-(tV) Width Broadened
(me) Width(eay)
Peak CrossSection (Teoperature)
(barns (K))
1495m 13.9 0.872 61 2790(300)240P. - I~ a 3.3 1 30
r 62.7 1.303 87.3 30 3001151n 95.7 1.457 75 29900(300)185Re 37.4 2.156 57.7 9300(300)242Pu - 2.67 27 35200(300)238Pu - 2.90 38 1020(300)169Th 100 3.90 108 30100(300)181Ta 100 4.28 57 14100(300)7 Au 1In 4.906 139 1803U - 5.19 2927 (300236
U - 5.45 27 15700(300)23811 04.1 6.974 27.5 104 7712(300)
ZAI- - S4 1247S (77)159
T b
163py186W238U
- 9.96 42100 11.14 9533.8 11.9 12724.9 16.23 12428.6 18.84 33700.1 2n _ 21
4200(300)7140(300)3120(300)2070(300)
29800(300)ArAI nn
100
80
- 60
40
20
27(omu)9(omu)
4(omu) N
-. 90*) 1 (omul
- -.U(60")
Au (60*)
Rh (60*),/Rh(90*) Au(22@)
A2 ,U (22)
_ -'' -
,'h (22*)
0 2 4 6
4 (ev)
Fig. 1. For direct geometry,the cut in Q-c spaceof inelastic scatter-ing for particularincident energies(Rh, Au, U) at par-ticular angles (22*,60', 90, 117) byparticular mass par-ticles (1, 4, 9,27 mu).
80
60.4
a
0E (eV)
Fig. 2. For indirect geometrysimilar cuts in Q-espace to Figure 1.
Au(120*)
U (90*)
Z!-Nol Au(90*)
9(emu) 4(aau)
Au(60*) ,--
, -' 1481s) -
-Rh (90*)
-'Rh (60*)
--
U(_ ). . Au(20*)
-Rh (20*)
40
20
2 4 6
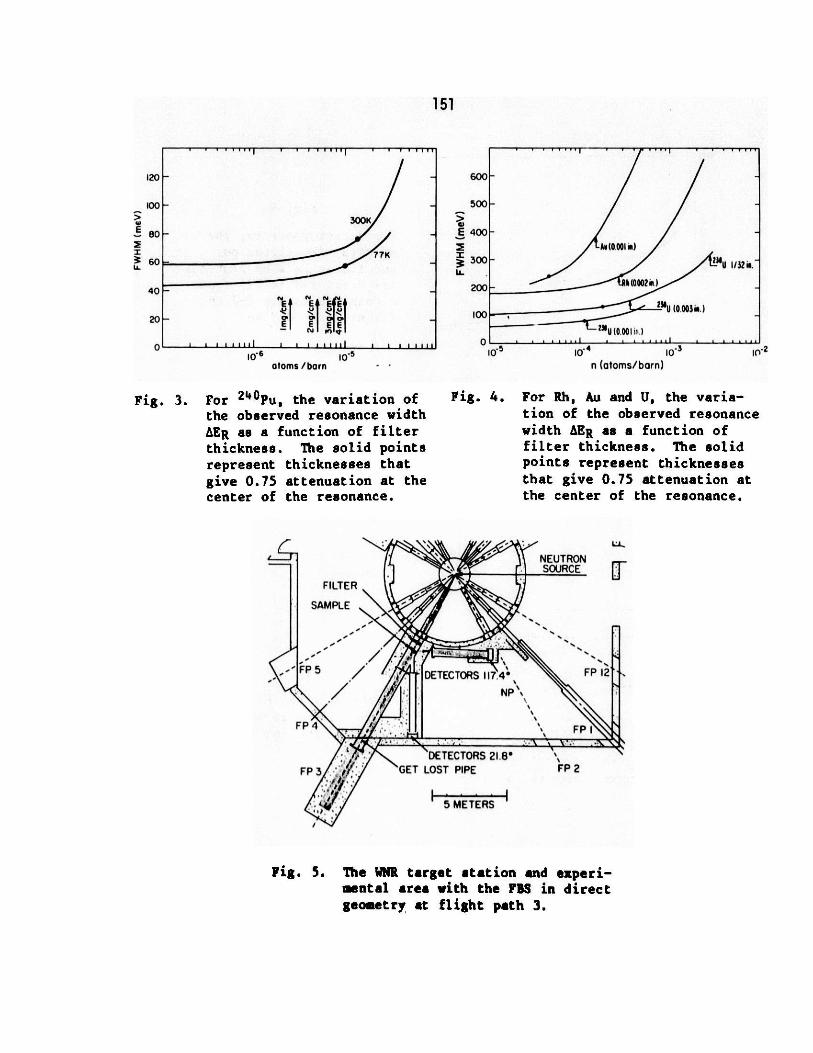
151
120
100
80
60
40
20~
U-10-6 -5
atoms /born -
Fig. 3. For 240Pu, the variation ofthe observed resonance width
AER as a function of filterthickness. The solid pointsrepresent thicknesses thatgive 0.75 attenuation at thecenter of the resonance.
6001
500
E 400
300
200
100
0
. .I ''''''''l 1 rr rT-I
F- -
K
E E EN ?
i-2n (atoms/barn)
Fig. 4. For Rh, Au and U, the varia-tion of the observed resonancewidth AER as a function offilter thickness. The solidpoints represent thicknessesthat give 0.75 attenuation atthe center of the resonance.
NEUTRONSOURCE
FILTER
SAMPLE
-FP 5 FP 12/ t DETECTORS 1174NP
FP 4
- DE TECTORS 21.8*
FP 3 GET LOST PIPE FP 2
5 METERS
Fig. 5. The WNR target station and experi-mental area with the FBS in directgeometry at flight path 3.
0-5
-~ ~ ~ ~ A A(0.001 in) U / i.
_ N0002 i? )
U (0.003il.)2
U (0.00 Iin )

152
200 400CHANNEL (3.2ps)
80k
-JW
U
z0U
600 800
32
Fig. 7
The difference of the twospectra of Figure 6.
JLI
0
U
-0 200 400CHANNEL (32 s)
600 800
Fig. 8
Calculated resolution of theFBS for direct geometry asstructured in Figure 5.
ENERGY TRANSFER,e (meV)
Fig. 9
The WNR target station andexperimental area with theFBS in inverted geometryat flight path 11.
rM /
/ r ~ /NOW M
nP SA' tI
SKII4
Fig. 6
For direct geometry, thespectra with filter out
and filter in when neutronsare scattered at 22' froma thin H20 sample and thefilter is 0.002" Rh.
0
1000
'0 600E
200
Au (0.001 in.)
-236U o . 3n
- h(00oo in)
-4 Po,(4,,,,,, 2)
102 103
r. i i i
k

153
500
Au (0.001 in.)400 -
300 Rh (0.002 in.)
102 103 H
ENERGY TRANSFER,e (meV)
Fig. 10
Calculated resolution ofFBS in inverted geometryas structured in Figure 9.
800
E600
400
2001
0
238U(0.003in) Au(0.001in.)
Rh (0.002 in.)
F- Pu (4mg cm-2 )
102 103 I
ENERGY TRANSFER,e (meV)
Fig. 11
Calculated resolution FBSin inverted geometry atflight path 3.
800 1200CH.4 EL (0.4u)
1600 2000
Fig. 12
For inverted geometry, thespectra taken at flightpath 3 for a 1 - thicksample of Zr! and with afilter of 0.0A2" fh. Thedetectors observed scatter-ing at 60.
NEUTRON~ ~~ SOURCE
SAMPLE
FP 5 DETECTORS 117.4 FP 12
/-. NP
FP 4 D FP I
- DETECTORS 21.8*FP 3 GET LOST PIPE FP 2
5 METERS
Fig. 13
The WNR target station andexperimental area with theFBS in sample geometry atflight path 3.
E)
200
too
0
- 238U (0.003 in.)
240Pu (4mg cm-2)
-JWzzxU.
0)
I-
400
1000
-
10K
5K
0
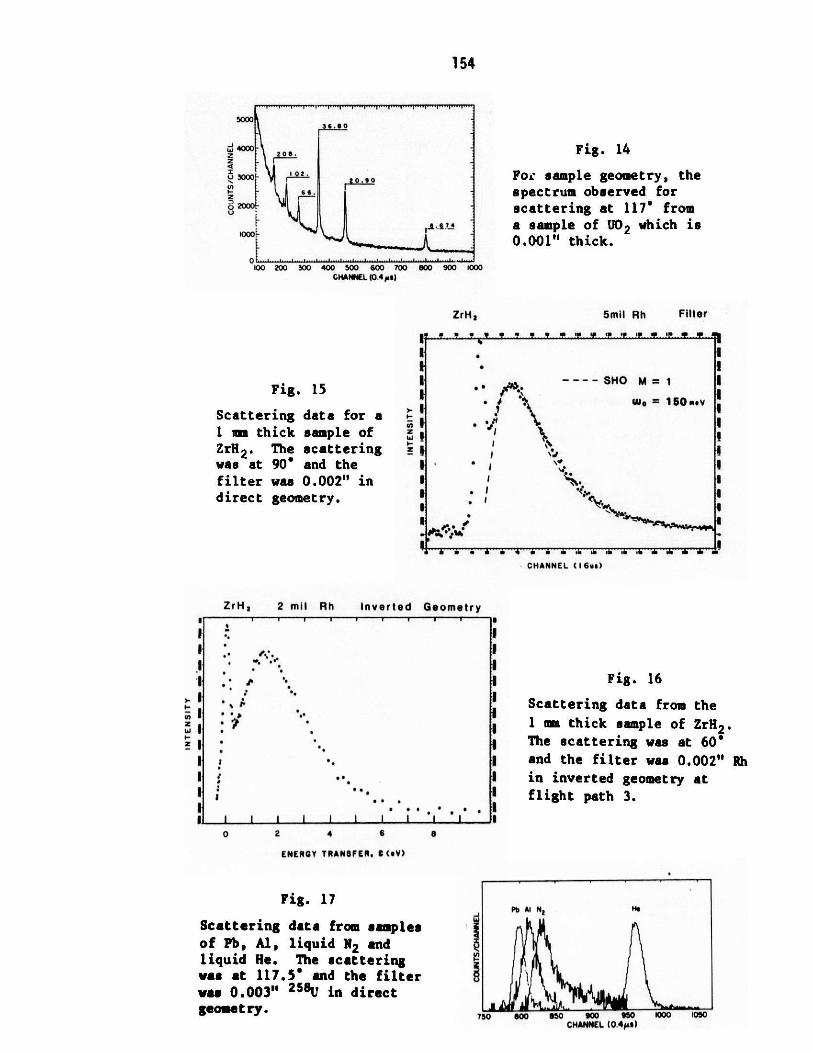
154
5000 ..56.80
--
W 4000zQU~ 3000Q 102.
166
Z
100 200 300 400 '500 600 700 80 900 1000CHANNEL (0.4 ps)
ZrH2
Fig. 14
For sample geometry, thespectrum observed forscattering at 117' froma sample of U02 which is0.001" thick.
5mil Rh Filter
Fig. 15
Scattering data for a1 -m thick sample ofZrH2 . The scatteringwas at 90* and thefilter was 0.002" indirect geometry.
r
zW5-
z
6 s " is . . S w SW N 3 Se SI S *S
-"
. .
)~
---- SHO M= 1
w. = 150m.v
'I
.1
r " V
CHANNEL (16us)
ZrH 2 2 mil Rh Inverted Geometry- I
1
-: -.....
-.I
I ." r
1 -. I
I ~. II . . .I
p i i i i I I I I I I
0 2 4 6 8
ENERGY TRANSFER. C (V)
Fig. 17
Scattering data from samplesof Pb, Al, liquid N2 andliquid He. The scatteringwas at 117.5* and the filterwas 0.003" 258Uw in directgeometry.
Fig. 16
Scattering data from the
1 mm thick sample of ZrH2 'The scattering was at 60*and the filter was 0.002" Rhin inverted geometry atflight path 3.
750 800 650 C 00 950CHANNEL (0.4 1a)
1000 1050
zW~
2
Pb Al N 2
"
s s
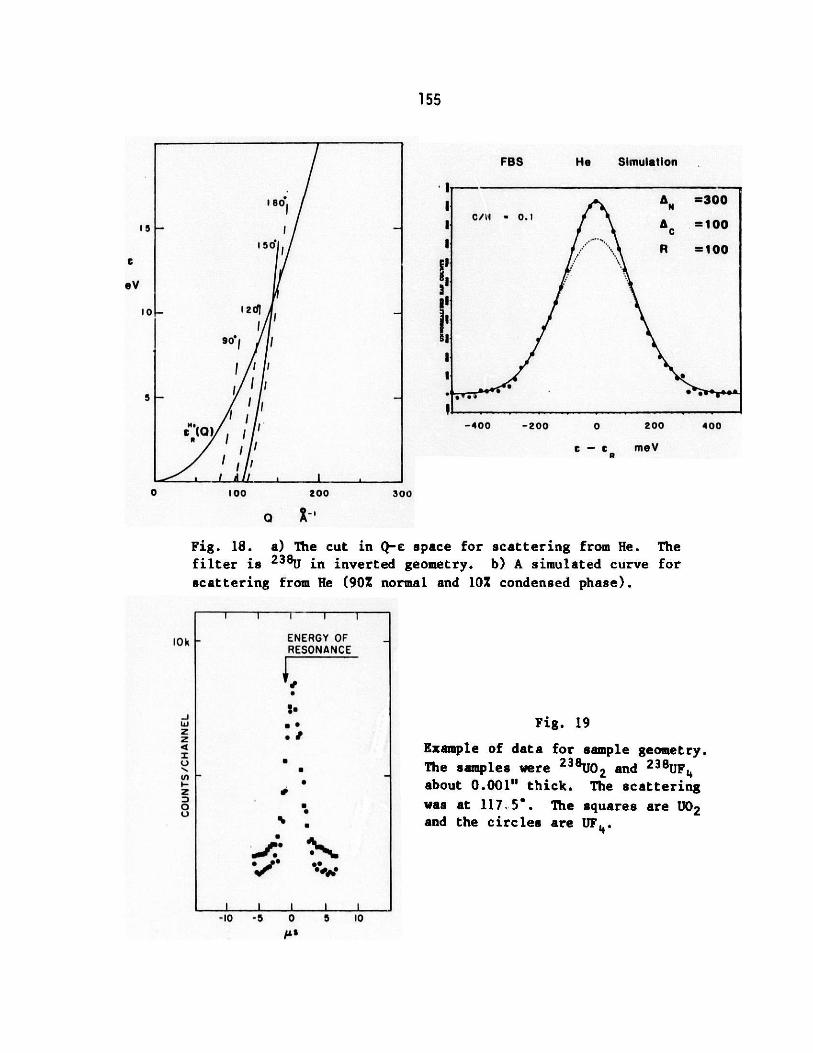
155
FBS
I 80
F- I-
- 1 2dj ..
90, I I'
- I
c I '
I I
He Simulation
AN 300C/i - 0.1 AC =100
R =100
-
e* *
-400 -200 0 200 400
c - c, meV
300
0 -
Fig. 18. a) The cut in Q-c space for scattering from He. Thefilter is 2 3 8U in inverted geometry. b) A simulated curve forscattering from He (90% normal and 10% condensed phase).
-10 -5 0 5 10
Fig. 19
Example of data for sample geometry.The samples were 2 3 8U02 and 238UF4about 0.001" thick. The scatteringwas at 117 5*. The squares are U02and the circles are UF4 .
15
C
eV
I1I
I1
I
1
10
5
0 too 200
10k I-
-JWzz4
UN-
z0U
ENERGY OF
RESONANCE
..
.,
U
"
-10 -5 0
s
s 10

156

157
ICANS-VI
INTERNATIONAL COLLABORATION ON ADVANCED NEUTRON SOURCES
June 27 - July 2, 1982
eV NEUTRON SPECTROSCOPY USING RESONANCE ABSORPTION ENERGY
SELECTION ON A PULSED SOURCE
W G Williams and J Penf oldNeutron Division, Rutherford Appleton Laboratory
ABSTRACT
A method is proposed for measuring excitation energies up to approx 1 eV by
using an absorption foil difference technique in the inverse geometry. The
discussion is restricted to using the149Sm resonance at an energy ER - 0.873
eV and utilises other fixed absorption filters to improve the sensitivity of
the method for inelastic measurements. Feasibility tests have been carried
out on the LAD total scattering spectrometer at the Harwell Linac. By extra-
polating from results obtained for ZrH2 it is predicted that with more
powerful sources such as the SNS it should be possible to observe high energy
magnetic excitations.

158
eV NEUTRON SPECTROSCOPY USING RESONANCE ABSORPTION ENERGY
SELECTION ON A PULSED SOURCE
W G Williams and J Penf old
Neutron Division, Rutherford Appleton Laboratory
1. INTRODUCTION
The new pulsed neutron sources provide much greater fluxes of epithermal
neutrons than steady state sources and the importance of this characteristic
to studies in condensed matter physics has been expounded by several authors
eg Sinha(C). In order to exploit this feature in dynamical studies we require
effective monochromators at neutron energies E 1eV and three methods of
energy selection viz (i) crystal monochromators , (ii) phased Fermi
choppers(3) and (iii) nuclear resonance absorption(4) may be considered. A
detailed discussion of methods (i) and (ii) has been given in reference 2;
they provide a means of performing high resolution measurements (energy
transfer resolutions ,vw/t ~- 2%).
Two variations of method (iii) have been examined. In the first, the
"resonance detector spectrometer"(4 ,5,6), an analysing foil placed after the
scatterer captures neutrons resonantly over a narrow energy region and the
emitted y-rays are detected. This is an example of an inverse geometry
instrument in which a large fraction of the incident white pulsed beam can be
utilised. The second variation is a direct geometry instrument, the "filtered
beam spectrometer"(7), where the absorbing foil is used to define the incident
neutron energy and the difference TOF spectra of data collected with and
without the foil gives the sample's response to the resonance energy incident
neutrons.

159
This paper discusses the possibilities of using a Samarium-149 resonance
absorber with a resonance energy ER - 0.873 eV for inelastic experiments
initially at the Harwell Linac and later on the SNS. The reason for confining
the discussion to this resonance is two-fold: (i) it is possible to polarise
the nucleus(8), so there is the potential eventually of extending the method
to look at spin-dependent scattering processes, and (ii) the resonance has a
conveniently small total width r - 60 meV(9 ). It was decided first to
examine the possibilities offered by the foil difference method, both in
direct and inverse instrument geometries. In the latter case, in contrast to
ref 7, the difference TOF spectra result from scattered neutrons at the
resonance energy.
2. FOIL DIFFERENCE METHOD IN DIRECT AND INVERSE GEOMETRIES
Since the difference counts are always combined with the total TOF on a pulsed
source spectrometer it is possible, at least in principle, to use the foil
difference technique in either the direct or inverse geometry. The advantages
and disadvantages of each method can only really be assessed by experiment,
however for foils with ER ~ 1 eV such as Sm, we favour using the inverse
geometry approach. The need to carry out many measurements at the lowest
possible momentum transfer tNQ means that the scattered neutron wavevector k2
(hence energy E2) should be as high as possible; this is easiest with E2 - ER
for neutron down-scattering ie with an analyser foil after the scatterer.
Another important reason for choosing the inverse geometry is that it should
in practice provide better energy resolution over much of the energy transfer
range of interest (0.2< t w(eV) < 1). These resolutions are dominated by the
term representing the energy width of the resonance peak and for direct (D)
and inverse (I) geometry spectrometers on a pulse source may be approximated
by:
rwi E R L2 E 1 1.5- R 1+ J, and (2.1)
At1 E [ L 1 E 2 1.5
+D R 11+ 2E2(2.2)

160
where L1 and L2 represent the incident and scattered beam flight paths, and E1
and E2 the incident and scattered neutron energies. We now calculate these
contributions to the energy resolutions for situations where the difference
count rates (per unit energy transfer) in the direct and inverse geometry foil
experiments are comparable. Matching of incident and scattered beam solid
angles gives:
A inAd nA Ad- -2(2.3)
1 "2 D L1L2 1
where Am and Ad are the moderator and total detector areas and if we assume
that these are equal (it should for example be possible to cover a large part
of the scattered beam solid angle by placing the absorbing foil close to the
sample in case I) we obtain equivalent count rate differences with:
(L1L2)D - (L1L2)I, or
(2.4)
L1DL2D - L1ID21
The resolution equations require L21 4(C L11 and L2D > LiD, and whereas the
first condition is relatively easily met, the second is not. For the SNS LID
must be greater than approx 6 m so that the sample extends beyond the
biological shielding. We have calculated the energy resolutions for the
following hypothetical (but practical) spectrometer case where equation (2.4)
is fulfilled:
LID - 6 m; L2D 3 m
L1I - 18m; L2 1 - 1 m
and ER 1 eV; 0ER 0.05 eV

161
The results are shown in Figure 1. It is concluded that the inverse geometry
arrangement gives appreciably better resolutions for resonance energy foils
with ER ~ 1 eV and it was decided to carry out detailed calculations of the
performance of a Sm analyser difference spectrometer on the Harwell Linac and
SNS sources.
The equating of luminosities, as discussed above, neglects the effect of the
incident and scattered beam divergencies on the Q resolution. This factor was
considered, at least initially, to be less important than the optimisation of
the intensity and energy transfer resolution. The beam divergence effect on
the Q resolution can, in principle, be improved by reducing the area of
detector elements while maintaining large total areas.
3. ENERGY SELECTION USING THE SAMARIUM RESONANCE AT ER - 0.873 eV
The optimum resolutions and difference counts in resonance absorption
difference spectrometers are obtained by optimising the thickness of the
absorption foil. If the foil is too thin the difference counts are less than
the optimum, whereas very thick foils cause a degradation in the energy
transfer resolutions. The optimisation method described in this section was
applied to the Sm resonance at ER - 0.873 eV. It has been shown(1 0) that the
absorption cross-section across this resonance peak can be described by the
Breit Wigner expression:
o(E) -(1+ 022E)(3.1)
1 + 4(E-ER)2/r2 \ E
where E is the neutron energy, r the total resonance width, and co is the
maximum cross-section at the resonance energy ER. The foil attenuation A(E)
across the absorption peak, which is proportional to the difference counts in
these experiments, is then given by:
-E NdEA(E) - 1 -*exp -- , (3.2)
11 + 4(Z-E ) 2/ r E

1 c2
where Nd is the atomic thickness of the absorbing nucleus in the foil. This
function was calculated for the Sm resonance using the recommended resonance
parameters given in reference (9). The curves for different Sm thicknesses Nd
are shown in Fig 2. The foil thickness optimisation uses a quality factor
A(ER)/AER2 , where A(ER) is the attenuation factor at E - ER and AER is the
FWHM of the attenuation peak. The variation of this quality factor with Sm
foil thickness is also shown in Fig 2. We conclude that the optimum Sm
thickness is Nd ~ 3.5 x 10²⁰ at cm-2 . In the calculations to be presented and
in the test experiments t be performed we shall use a Sm foil atomic
thickness Nd'3.0 x 10²⁰ at cm-2 which corresponds to a physical thickness
d ~ 0.1 mm; this gives a peak attenuation A(ER) - 0.61 and a resolution width
AER - 0.075 eV.
4. DESIGN OF RESONANCE FILTER DIFFERENCE SPECTROMETER IN THE INVERSE GEOMETRY
(a) Outline Description
Feasibility experiments on the resonance foil analyser method were carried out
on the SNS total scattering spectrometer LAD(11) which is currently in
operation at the Harwell Linac. This has convenient incident (L1 - 10.5 m)
and scattered (L2 - 1 m) neutron flight paths to give a near optimum
resolution in inverse geometry. Detectors at scattering angles 0 - 50, 100
and 200 were used and the detector apertures were opened up to approx 20 mm
(wide) x 250 mm (high); these are considerably larger than that normally used
in the high Q resolution mode. We were particularly interested in the
performance of the instrument at small scattering angles since its application
to magnetic scattering problems demands a low Q capability. Figure 3 shows a
schematic diagram of the test instrument. The functions of the incident and
scattered beam absorption filters are described in the following section.
(b) Incident and Scattered Beam Filters
The statistical errors in the filter difference method for measuring in-
elastic scattering processes can be considerably reduced by minimising the
general background in the spectrometer as well as the counts due to elastic
scattering. This is achieved in this spectrometer design by using two sets of
absorbing filters, one in the incident beam and one in the scattered beam;
these remain stationary in all measurements. The purpose of the incident beam
filter (Filter A) is to selectively attenuate neutrons of energies E 1 eV
and this contains Cd, Er and Sm absorbers. The Sm filter is the highest energy

163
absorber of these three and is made "thick" to ensure that no E - 0.873 eV
neutrons are incident at the scatterer. This means that any 0.873 eV neutrons
detected by the Sm foil analyser difference method must have been scattered
inelastically, in fact by down-scattering. The thermal neutron absorbers (Cd
and Sm) also serve to remove potential "frame overlap" slow neutrons from the
incident beam. For example elastically scattered neutrons at energies 12 - 13
meV arising from the previous machine pulse would also appear in the same time
channels as the main inelastic events of interest in the LAD test instrument.
The second set of filters (Filter B) contains Hf, In and Rh foils and is
placed in the scattered beam to reduce the counts detected due to elastic
scattering at neutron energies between approx 1.1 eV and 1.6 eV. The
compositions of filters A and B are given in Table 1 and their calculated
transmittances at neutron energies up to 1.8 eV are illustrated in Fig 4. It
is reiterated that their function is to reduce the number of counts that occur
in the time channels where a difference count due to inelastic scattering can
be expected ie they improve the sensitivity of the difference method but do
not contribute to the difference count.
Table 1 Incident and scattered beam filtersfoil analyser instrument tests.
used for Sm
Filters Atomic Thickness of Physical
Absorber (at cm-2) Thickness
Cd 9.3 x 10211 mm
Filter A Er203 Powder 1.0 x 10²² (Er) 15 mmSm203 Powder 9.2 x 10²¹ (Sm) 30 mm
In foil 1.9 x 10²¹ 0.5 mm
Filter B Rh foil 3.6 x 10²⁰ 0.05 m(Hf foil 1.1 x 10²¹ 0.25 mm

164
It is worthwhile expanding cn the discrimination between elastic and inelastic
events provided by the incident and scattered beam filters. The transmittance
product TA TB is shown as a function of total time-of-flight on the test
instrument for both elastic and inelastic scattering in Fig 5. The difference
counts are proportional to TA TB (inel) whereas TA TB (el) produces a constant
"background" count in the two parts of the measurement. The elastic-inelastic
discrimination is particularly good for energy transfers between 0.4 and 0.9
eV.
(c) Predicted Performance of Test Instrument
The expected performance of the test instrument was simulated using a computer
code written by R M Richardson for the Beryllium Filter inverse geometry
spectrometer on the SNS(1 2) which has been modified for resonance peak
analysers. The code predicts the energy transfer and momentum transfer
resolutions by including all the possible contributions due to uncertainties
in lengths and times as well as the spread in the energy selection. It also
gives the count rates where the scattering cross-section is well known or can
be modelled.
Fig 6 shows the energy transfer resolution Aiw/tw, which is effectively
determined by the absorption peak width AER - 0.075 eV, calculated for the
test instrument as a function of the energy transfer. Fig 7 shows the (Q,w)
scans available on the test instrument for the three fixed angle detectors at
0 - 50, 100 and 200. The Q difference offered by the three detector scans may
be useful in distinguishing between nuclear and magnetic inelastic scattering,
though this will probably require a smaller 50 detector height (approx 100 mm)
ie improved Q resolution. The figure also shows that it should be possible to
observe magnetic excitations up to energies tw ~ 0.35 eV with the 50 detector
(Q 4A-).
Figure 8 shows a simulation of the time of flight spectra with and without the
analysing foil for an isotropic Einstein oscillator with unit effective mass
(eg H in a metal) where the fundamental frequency is tiw - 0.16 eV. The
sample chosen was a 25% scatterer and the predicted count rates pertain only
to the 50 detector on the LAD test instrument where the inelastic cross-
section for the fundamental mode was estimated to be (d2a/dAdE) ~27 3 barns
sr~- eV-1. The difference count rates are also shown in the figure and the
integrated difference count rate over the fundamental peak is approx 10
cts/hr. The two most important features to notice are: (i) that the

165
difference count rates are always larger than a factor x 0.1 compared with the
individually measured count rates over the major part of the energy transfer
range of interest (hw 1 eV) and (ii) the difference counts at times of
f light ~ 970 psec correspond to elastically scattered neutrons at energies
~ 0.73 eV, where there is an increase in the transmittance of the incident
beam filters (see TA curve in Fig 4).
These count rate calculations were also substantiated using analytic
expressions similar to those given by Allen et al(4) for the resonance
detector spectrometer. The predicted count rates for the other two detectors
were approximately x2 those shown for the 50 detector.
(d) Measurements with a ZrH2 scatterer
The raw data T.O.F. difference spectra due to hydrogen vibrations in a
zirconium hydride 25% scattering sample on the LAD Test spectrometer are shown
in Figs 9(a-c). The fundamental mode at iw - 0.14 eV and the overtone modes
are clearly observed, though they remain unresolved due largely to the Doppler
broadening of the resonance absorption peak which was not included in the
computer simulation. The variation in the peak intensities at different
scattering angles has the expected Q-dependence. These preliminary results
clearly demonstrate the feasibility of the experimental method.
5. SUMMARY
A discussion has been presented of the application of a resonance absorber
difference method in an inverse geometry TOF spectrometer for measuring
excitations over the energy transfer range 0.1 < tmw (eV) < 1. The feasibility
of the technique was assessed using the LAD total scattering spectrometer at
the Harwell Linac as a test instrument. It should prove possible to use the
method to observe overtone modes in metal-hydrogen samples, and, particularly
with more powerful sources such as the SNS, high energy magnetic excitations.
Finally it should be pointed out that significant improvements in these count
rates are expected for any purpose-designed SNS instrument since:
(i) large improvements in the detector solid angle (x 10) should easily be
possible, and

166
(11) the SNS source strength at full intensity is approx x600 that used in
above calculations and experiment.
It is therefore reasonable to expect any SNS instrument to be capable of
measuring cross-sections at least three orders of magnitude lower than that
given in the above example, and this brings with it the prospect of observing
many magnetic excitations which have hitherto not been measureable.
ACKNOWLEDGEMENT
The authors acknowledge useful discussions with our colleagues Dr R Cywinski
and Dr A D Taylor.

167
REFERENCES
1. S K Sinha. J Appl Phys 50 (1979) 1952
2. C J Carlile and W G Williams. ' Inelastic Neutron Scattering using a
Crystal Spectrometer on a Pulsed Source'. Rutherford Appleton Laboratory
Report RL-81-028 (1981)
3. B C Boland 'High Energy Inelastic Spectrometer'. Proc ICANS-IV KENS
Report II (1981) 580
4. D R Allen, E W J Mitchell and R N Sinclair. J Phys E Sci Instrum 13
(1980) 639
5. R N Sinclair, M C Moxon and J M Carpenter. Bull Am Phys Soc 22 (1977)
101
6. L Cser, N Kroo, P Pacher, V G Simkin and E V Vasilyeva. Nucl Instrum
Meth 179 (1981) 515
7. R M Brugger, A D Taylor, C E Olsen and J A Goldstone. Bull Am Phys Soc
27 (1982) 14
8. F F Freeman and W G Williams. J Phys E Sci Instrum 11 459 (1978)
9. 'Neutron Cross Sections'. BNL 325 Second Edition Supplement No: 2.
August 1966 62-149-3
10. A W McReynolds and E Andersen Phys Rev 93 (1954) 195
11. W S Howells. 'A Diffractometer for Liquid and Amorphous Materials
Research'. Rutherford Appleton Laboratory Report RL-80-017 (1980)
12. R M Richardson. 'A High Throughput Inelastic Neutron Scattering
Spectrometer for the Harwell Linac and the Spallation Neutron Source'.
Rutherford Appleton Laboratory Report RL-82-035 (1982).
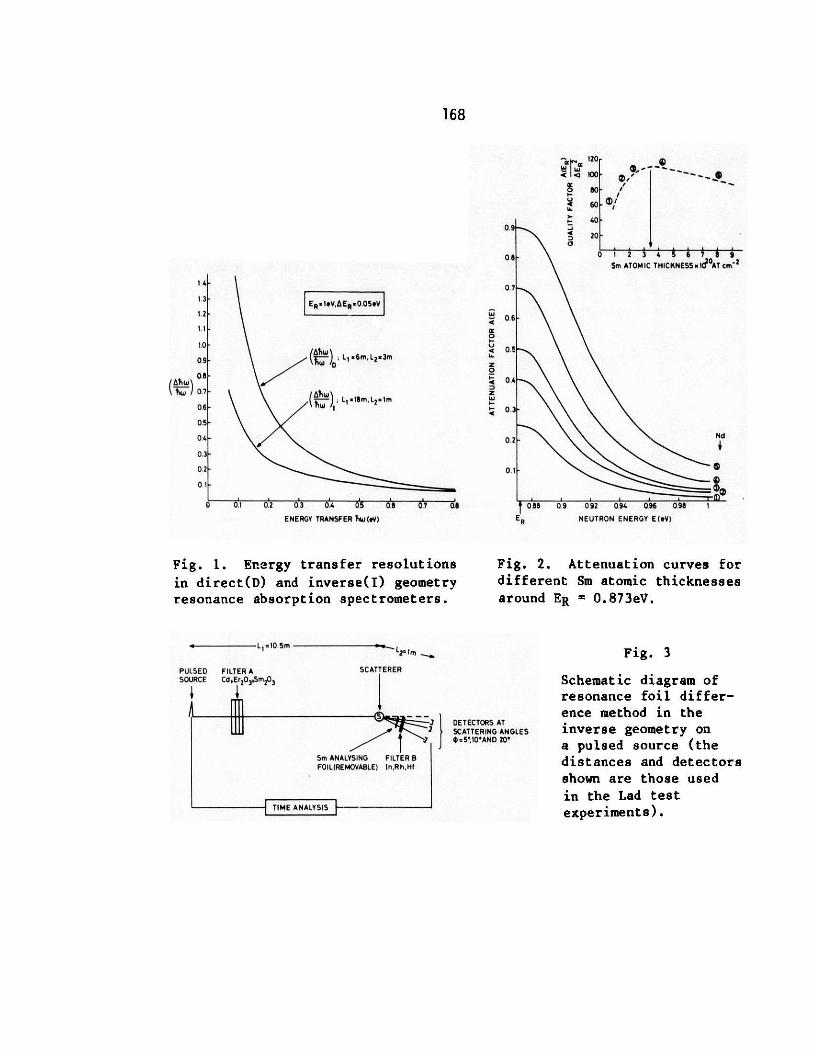
168
ER-I#V, E.0.05V
( , L 1.6mL 2=3m
/ , D t1mLxm
4_
0M4z0
z
zW
0.1 02 03 0.4 05 0.8 07 0.1
ENERGY TRANSFER hw (eV)
Fig. 1. Energy transfer resolutions
in direct(D) and inverse(I) geometryresonance absorption spectrometers.
L1 =10.5m ' Le2-'m -PULSED FILTER ASOURCE Cd,Er20 3,sm 2o3
SCATTERER
J DETECTORS ATSCATTERING ANGLES
SJ =5-10-AND 20-
Sm ANALYSING FILTER 8FOIL(REMOVABLE) In,RhHf
TIME ANALYSIS
0.9
0o
07
0.6
0.5
0.4
0.3
0.2
0.1
120
W a100
0 80
4 60
~' 40
m
.
-
D 20
. 1 2 3 4 6 7 9Sm ATOMIC THICKNESS x1 ATcm-2
Nd
4
0.88 09 092 0.94 096 098
NEUTRON ENERGY E(eV)
Fig. 2. Attenuation curves fordifferent Sm atomic thicknessesaround ER = 0.873eV.
Fig. 3
Schematic diagram ofresonance foil differ-ence method in theinverse geometry ona pulsed source (thedistances and detectorsshown are those used
in the Lad testexperiments).
14
13
12
1.0
09
0.8
( 07 -
0.6
0.5-
04-
0.3-
02-
01
0 1ER

169
0S 10
NEUTRON ENERGY E(IV)
Is
Fig. 4. Neutron energydependences of thetransmittances of the
incident and scatteredbeam filters.
SCATTERED lEAN FILTERS-.2 I
II
e 1
I I
/\ I1 I
1 I
Fig. 5. Elastic-inelastic
scattering discrimination
provided by incident and
scattered beam filters.
SCATERING
s0'
03
0.5
0.7
rof
of
Nos O
4r 0
e l
02
04
Il
12Q
I
0 0I 02 03 04 OS 06 07 OR
ENERGY TRANSFER Iw(w.)
Fig. 6. Energy transferresolution on Lad testinstrument.
do 0' 03 O' 0' ' ''
ENERGY TRANSFER SwIYW)
Fig. 7. (Q,w) Scans onLad test instrument forfixed angle detectors at
0 - 5*, 100 and 20*.
1 06 OR 04 0
T' T,(In.41AR
IG N IS I.I i I
TOA T16 IS 14 1 1 1
N 10'
.3IC
ID
"
i
t
aZ
K
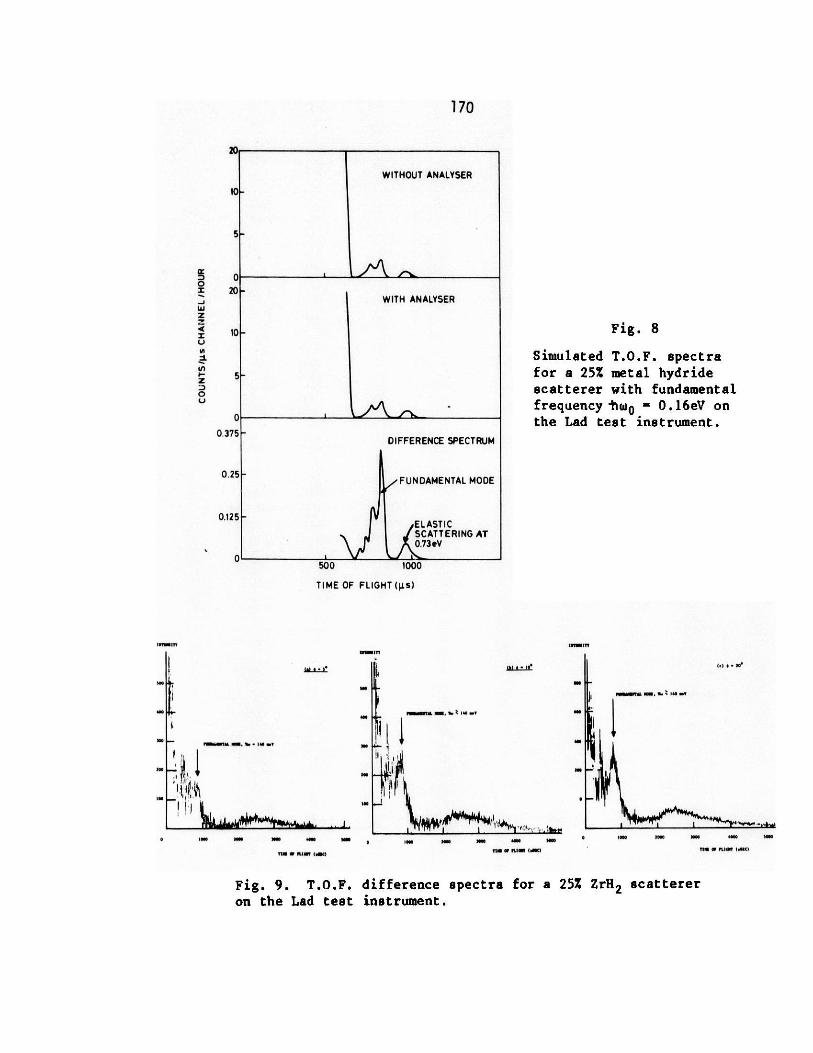
WITHOUT ANALYSER
10
5
020
WITH ANALYSER
10
5
n-
TIME OF FLIGHT (ps)
lawi
icO
owI r ,r210-
im ,m UN -TE. & luli (USC)
Fig. 9. T.O.F. difference spectra for a 25% ZrH2 scatterer
on the Lad test instrument.
170
0
IJ
z
U
z0U
Fig. 8
Simulated T.O.F. spectrafor a 25% metal hydridescatterer with fundamentalfrequency iw0 = 0.16eV onthe Lad test instrument.
DIFFERENCE SPECTRUM
FUNDAMENTAL MODE
ELASTICSCATTERING AT0.73eV
0.375-
0.25-
0.125 -
500 1000
nwi m IUTI . 1:14
In* 300 imc woo w00
II
msa ITV
W
w
w.
M
IM
w,.8 am no woo um.0

171
ICANS - VI
INTERNATIONAL COLLABORATION ON ADVANCED NEUTRON SOURCES
June 27 - July 2, 1982
POLARIZED EPITHERMAL NEUTRON SPECTROMETER AT KENS
M. Kohgi
Department of Physics, Tohoku University, Sendai 980, Japan
ABSTRACT
A spectrometer employing a white, epithermal, polarized
neutron beam is under construction at KENS. The neutron
polarization is achieved by passage through a dynamically
polarized proton filter ( D.P.P.F ). The results of the test
experiments show that the D.P.P.F method is promising in
obtaining polarized epithermal neutron beam. The basic design
of the spectrometer is described.

172
POLARIZED EPITHERMAL NEUTRON SPECTROMETER AT KENS
M. KohgiDepartment of Physics, Tohoku University, Sendai 980, Japan
L. INTRODUCTION
A spectrometer employing a white, epithermal, polarized
neutron beem is now under construction at KENS. The neutron
polarization is planned to be achieved by passage through a
dynamically polarized proton filter ( D.P.P.F )l). This Polar-
ized Epithermal Neutron Spectrometer ( PEN ) will be used for
the wide purposes ; for example, the study of the process of the
dynamical polarization of protons itself, the magnetic structure
determination of the amorphous magnets, the observation of high
energy magnetic excitations in the ferromagnets, as well as the
nuclear physics problems.
Prior to the installation of the PEN spectrometer, we per-
formed some test experiments ( Pre - PEN experiments ). The
results are briefly summarized below. The basic design of the
PEN spectrometer is shown in the last section.
2. PRE-PEN EXPERIMENTS
The aim of the Pre-PEN experiments was twofold. One was to
establish the technique for cooling a large area filter by liquid3He and another was to examine the geometrical dependence of the
neutron polarization cross section by polarizing longitudinally
the neutron beams and comparing the results with those obtained
by Hiramatsu et al. and Lushchikov et al. where the neutrons
were polarized in the transverse directions.
The Pre-PEN machine consists of a horizontally mounted
coaxial superconducting magnet with a 3He cryostat in it3), a
Drabkin type spin flipper, a goniometer to install the Fe8Co92
analyzer crystal and a detector rotating around the goniometer.
Because of the testing nature of the Pre-PEN experirie~its, the

173
machine was constructed by assembling the existing apparatuses3)
which were not necessarily optimized for the present purpose.
The neutron beam was tightly collimated to 15 x 15 mm2 so that
no neutrons bypassing the filter were monitored by the detector.
The polarizing filter was made with a polycrystalline sample of
ethylene glycol with stable Cr complexly. The filter was cooled
to ca. 0.5 K in a cryostat by pumping on liquid 3 He. Since 3He
has a large neutron absorption cross section and the cryostat was
mounted horizontally, a protection of neutron beam path from
liquid 3He constitutes the most difficult part of the experiment.
The protons of the filter were polarized by a dynamic method
at a frequency of 70 GHz in a magnetic field of 25 KG applied in
the direction of the neutron beams ( longitudinal polarization ).
The proton polarization was detected by analyzing the height of
NMR signal from the filter. The neutron polarization was deter-
mined by two methods ; either directly by Bragg reflection from a
saturated Fe8Co9 2 at discrete energies or indirectly by analyzing
the intensity of the transmitted beams.
The filter configuration which was used in the early stage
of the experiments iG shown in Fig. 1(a). Using this type of
filter ( case (a) ), the high enough polarization of neutrons was
observed at the low energy side ( for example, over 90% at 50 meV,
80% at 100 meV ). However, it was found that in this configura-
tion the leakage of unpolarized neutrons through the Cd shield
was unavoidable at the high energy side because of the lowering
of the liquid 3H level.
The finally adopted filter configuration which made the
bypass leakage of neutrons as small as possible is shown in
Fig. 1(b) ( case(b) ). In this case, the beam size was signif-
icantly reduced and we were obliged to decrease the filter thick-
ness to 10 mm in order to increase the counting statistics. The
neutron polarization is, therefore, reduced in case (b) compared
with the case (a), but the energy dependence of the polarization
could be determined with less ambiguity.
The results of polarization of the white neutron beams with
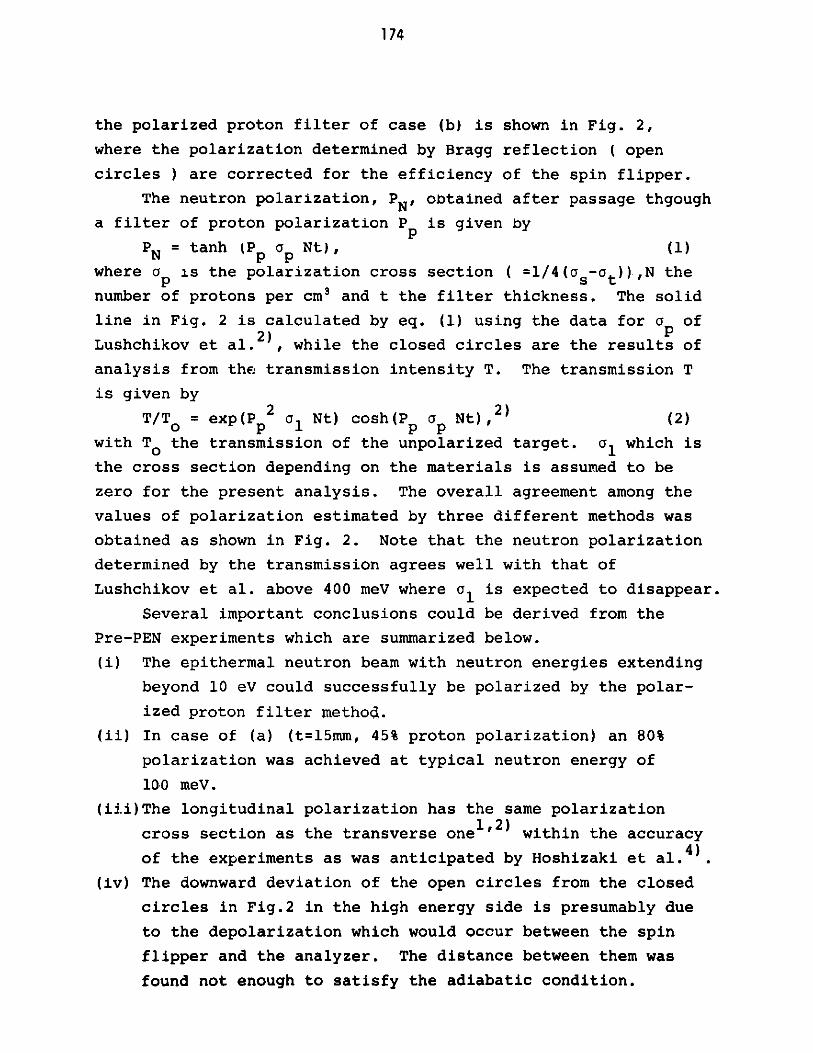
174
the polarized proton filter of case (b) is shown in Fig. 2,
where the polarization determined by Bragg reflection ( open
circles ) are corrected for the efficiency of the spin flipper.
The neutron polarization, PN, obtained after passage thgough
a filter of proton polarization Pp is given by
PN = tanh (Pp ap Nt), (1)
where ap is the polarization cross section ( =l/4(as-at)).,N the
number of protons per cm3 and t the filter thickness. The solid
line in Fig. 2 is calculated by eq. (1) using the data for a1 of
Lushchikov et al.2 , while the closed circles are the results of
analysis from the transmission intensity T. The transmission T
is given by
T/T0 = exp(P P2 a1 Nt) cosh(PPaQ Nt),2) (2)
with T0 the transmission of the unpolarized target. a1 which is
the cross section depending on the materials is assumed to be
zero for the present analysis. The overall agreement among the
values of polarization estimated by three different methods was
obtained as shown in Fig. 2. Note that the neutron polarization
determined by the transmission agrees well with that of
Lushchikov et al. above 400 meV where a1 is expected to disappear.
Several important conclusions could be derived from the
Pre-PEN experiments which are summarized below.
(i) The epithermal neutron beam with neutron energies extending
beyond 10 eV could successfully be polarized by the polar-
ized proton filter method.
(ii) In case of (a) (t=15mm, 45% proton polarization) an 80%
polarization was achieved at typical neutron energy of
100 meV.
(iii)The longitudinal polarization has the same polarization
cross section as the transverse onel,2) within the accuracy
of the experiments as was anticipated by Hoshizaki et al.4 .
(iv) The downward deviation of the open circles from the closed
circles in Fig.2 in the high energy side is presumably due
to the depolarization which would occur between the spin
flipper and the analyzer. The distance between them was
found not enough to satisfy the adiabatic condition.

175
(v) The upward deviation of the closed circles from the solid
line can be attributed to a1 in eq. (2).
Further experiments would, however, be necessary before we
conclude that ap in eq. (1) is completely the same for both LMN
(Lushchikov et al.) and ethylene glycol ( Pre-PEN ).
3. DESIGN OF PEN SPECTROMETER
In contrast to the Pre-PEN machine, we adopted the trans-
verse polarization scheme in PEN ; The He3 cryostat is verti-
cally inserted in the Helmholtz type superconducting magnet with
the magnetic field in the vertical direction. This configuration
was selected because of its advantage over the Pre-PEN machine
for the neutron scattering experiments ; the neutron scattering
experiments can be performed for the dynamically polarized
material, the distance between the filter and sample can be made
shorter, the level of liquid He can be kept stable, the con-
sumption of liquid He can be significantly reduced, etc. The
superconducting magnet was specially designed so as to produce
25 KG with a homogenuity of 5 x 10⁻⁵ over a dimension of 30 x
40 x 20 mm3 and with no zero field in the neutron beam path.
The magnet as well as the shield house to accomodate it have al-
ready been installed in H8 beam hole. The designing of the
proton filter configuration is now in progress taking account of
the results of the Pre-PEN experiments. The neutron detecting
system of the PEN spectrometer is scheduled to be divided into
three groups. The first is used for the observation of the
scattering from the dynamically polarized materials or others set
on the proton filter position. The scattered neutrons from the
center of the proton filter system are observed through
several small windows open on its shield. The 3He detectors with
their shield boxes are placed in front of the windows. The
second group is used for the magnetic total scattering. An
assembly of a sample table, 3He detectors and their shield is
placed just after the polarized neutron exit of the proton
filter system. The position of the assembly is variable
along the incident neutron path. A electric magnet can be

176
settled on the sample table. The third group is used for inelas-
tic scattering (mainly magnetic). It is composed of a small
detector bank and its shield. The detectors look the center of
the second scattering assembly. The flight path between the
sample table and the detector bank as well as the scattering
angle is variable. This configuration was selected taking ac-
count of its flexibility for controlling the resolution and
choosing the scattering condition.
The first part of the neutron detecting system described
above has already been constructed. The final designing of the
other parts is now in progress.
In conclusion,the D.P.P.F. method is promising in obtaining
polarized epithermal neutron beams. Since the various factors
will be optimized in designing PEN, including an effort to
increase the total neutron intensity, PEN will become a powerful
polarized epithermal neutron beam facility at KENS.
This paper isbased on the work done by PEN-group at KENS ;
Y. Ishikawa, M. Kohgi, T. Nakajima, M. Ishida, and J. M. Newsam
Tohoku University ; A. Masaike, S. Ishimoto, Y. Masuda,
S. Isagawa and K. Morimoto : KEK.
References
1) S. Hiramatsu, S. Isagawa, S. Ishimoto, A. Masaike,K. Morimoto, S. Funahashi, Y. Hamaguchi, N.Minakawa andY. Yamaguchi : J. Phys. Soc Jpn. 45 (1978) 949.
2) V. I. Lushchikov, Yu. V. Taran and F. L. Shapiro : SovietJ. Nucl. Phys. 10 (1970) 669.
3) S. Ishimoto : Proc. ICANS - IV (1981) 6304) N. Hoshizaki and A. Masaike : KEK Report 81-22 (1981).

177
(a)He-3 Wrat Wave guide
NMR cal
Carbonresistor -3
-. -Lq.He-3
24mm-*Filter material
(ethylene glycol-Cr)
Cvity
t~rt~n- (At)
Cadmium shield
Beam
(b)
By C wvindow 8y C powder
(brass)
Carbton n
(ethylene glycol-Civ)Beam
Fig.1 Proton filter configuration for Pre-PENexperiments
1.0
0.8
061
0.41
10-1Energy (eV)
1 10
Fig.2 Neutron polarization by D.P.P.F with theconfiguration shown in Fig.1(b)
.2.4-'
0
L.
0
c0a0
Ethylene glycol - CrVt =1,0cm PD= 4 3 */o
- * o FeCo(200)reflection -" " Transmission
- Lushchikov et al.
*O .gO S
.
0.2110-2

178

179
ICANS-VI
INTERNATIONAL COLLABORATION ON ADVANCED NEUTRON SOURCESJune 27 - July 2, 1982
POLARIZED NEUTRON TECHNIQUES AND APPLICATIONS*
G. P. FelcherArgonne National Laboratory, Argonne, IL 60439
ABSTRACT
Among the possible uses of a polarized, polychromatic neutron beam
emitted by a pulsed source is the study of medium and high energy excitations
in solids and liquids with high energy resolution. This can be achieved with
an instrument that combines the capabilities of the resonance detector
1spectrometer with those of the spin-precession analysis. As first step
toward the realization of such an insturment, a device has been constructed
that filters the spins of a polychromatic neutron beam. The device consists
in a polarized proton target, that selectively scatters away from the beam
neutrons of one spin state only. The target is made of an hydrogenated
crystal containing paramagnetic ytterbium; the polarization of the hydrogen
nuclei is obtained indirectly, via the polarization of ytterbium, by a method
2
called spin refrigeration. The first neutron tests of the device at the
Intense Pulsed Neutron Source at Argonne are quite promising.
*Work supported by the U.S. Department of Energy
1G. P. Felcher and J. M. Carpenter, Nuclear Insturments and Methods,192, 513 (1982).
2J. Button-Shafer, R. Lichti and W. H. Potter, Phys. Rev. Letters,39, 677 (1977).

180

181
ICANS-VI
INTERNATIONAL COLLABORATION ON ADVANCED NEUTRON SOURCES
June 27 - July 2, 1982
DYNAMIC RANGE ASPECTS OF PULSED SOURCE INSTRUMENTS
F. Mezei
Institut Laue-Langevin, 156X, 38042 Grenoble, France
ABSTRACT
In recent applications of neutron scattering the dynamic range is
found to be an important aspect of instrument performance along with neutron
flux and resolution. It is pointed out that due to the inherent use of a
broad wavelength band, certain instruments, like small angle scattering and
neutron spin echo spectrometers, provide better dynamic range capability on
a pulsed source than on a continuous source.

182
DYNAMIC RANGE ASPECTS OF PULSED SOURCE INSTRUMENTS
F. Mezei
Institut Laue-Langevin, 156X, 38042 Grenoble, France
1. INTRODUCTION
Neutron scattering instruments are most often considered from the
double point of view of resolution and neutron intensity only. The funda-
mental importance of a third parameter, dynamic range (DR), has only been
recently realized. This is probably due to the fact that classical neutron
scattering instruments have a rather small DR, typically between 1:20 and
1:50 (in what follows DR is characterized by the ratio of the smallest and
biggest value of a parameter which can be measured by a given instrument in
a single configuration). In recent small angle neutron scattering (SANS)
and inelastic (mostly magnetic) studies it has been found, that in order to
cover a range wide enough to produce a complete set of data, the same sample
had to be investigated in a sequence of similar experiments with different
resolutions. Practice has also shown that the wide DR, which was made
available for the first time by the rather recent neutron spin echo (NSE)
method (about 1:1000) is a most essential feature in some experiments.
In what follows I will discuss experimental examples in order to show
that large DR can be crucial in obtaining model independent information,
which is the major advantage of neutron scattering. It will also be pointed
out that the use of a broad wavelength band on pulsed source instruments is
instrumental for achieving an improved DR. This makes pulsed neutron sources
particularly well adapted to SANS and quasielastic NSE experiments.
2. EXPERIMENTAL CONSIDERATIONS
The main advantage of neutron scattering with respect to other micro-
scopic methods of probing atomic structure and dynamics is that neutrons can
provide model independent information. The neutron scattering cross section

183
is directly related to the correlation function S(q,w) and by neutrons we
can explore both space and time via the largely independent experimental
parameters q and w. In magnetic problems neutrons present a further unique
feature, viz. their direct coupling to the magnetization allows to single
out unambiguously the magnetic scattering effects (eventually by the use
of polarization analysis).
The a priori model independence of the neutron scattering data is
just due to the fact that both parameters q and w are kept track of. In
experiments like NMR, ESR, pSR, etc. certain points or integrals in the
(q,w) parameter space are only explored. This is why in most cases these
data can only be interpreted by fitting to specific models.
However, neutron scattering provides model independent information only
if the experimental conditions are good enough that the data reduction does
not imply deconvolution or heavy corrections (e.g. for inelasticity in
diffraction work). In practice this means sufficient resolution and dyna-
mic range. A parameter we wish to determine often varies substantially
e.g. as a function of temperature or over the (q,w) space. If we have to
use several instruments to follow this variation, we might face very
serious difficulties in patching together the bits of information. In
particular, the comparison of absolute scattering intensities from one
instrument to another is always a problem. Therefore it is preferable to
use instruments with a wide DR in a single setting. This of course implies
high resolution on the one end of the range. As a matter of fact, a
roughly constant relative resolution (6x/x=const. over the range of the
parameter x) is the best compatible with large DR.
To proceed let us consider a few typical experimental examples. In
Fig. 1 the distribution of neutron intensity scattered by Southern beam
mottle virus in H20 solution is shown [1]. These data could not be obtained
in a single scan using the Dli SANS instrument at the ILL, because too wide
ranges had to be covered both in intensity and momentum transfer. In fact
this figure has been assembled from results of several experiments made on
different samples, at different neutron wavelengths and using different
instrumental configurations. This procedure is tedious, takes longer time
than a single scan and it is less reliable, of course.

184
"S
1 0 I
S
S
"..'S**.
S"
x10 A )
Fig. 1 Neutron intensity distribution scattered by Southern bean
mottle virus in H2O solution as a function of the momentum
transfer [1].
The second example (Fig. 2) shows the q dependence of the inelastic
Lorentzian line width rq of the critical scattering of iron at the Curie
point [2]. It is seen that the results follow the predicted power law
rgaqz with z i 2.5 over an impressive range of four orders of magnitude
in w. This is in constrast to the interpretation given to anomalies
observed in hyperfine field experiments [3], according to which below
o.S.
q ti 0.05 A- a cross over should take place to the f aq2 behavior. Previous
qOS.1
neutron scattering results [4,5] only covered q values above 0.05 A , and
only recent high resolution time-of-flight (TOF) and NSE experiments [2]
(made respectively on the IN5 and IN11 instruments at the ILL) allowed to
rule out the hypothesis of a crossover, and to give another explanation for
the hyperfine field anomalies. The value of the exponent z, however, could
only be determined with a precision of t 0.05 in view of the uncertainties
of comparing data taken under different conditions and by different methods.
In order to check finer details of theoretical predictions we should determine
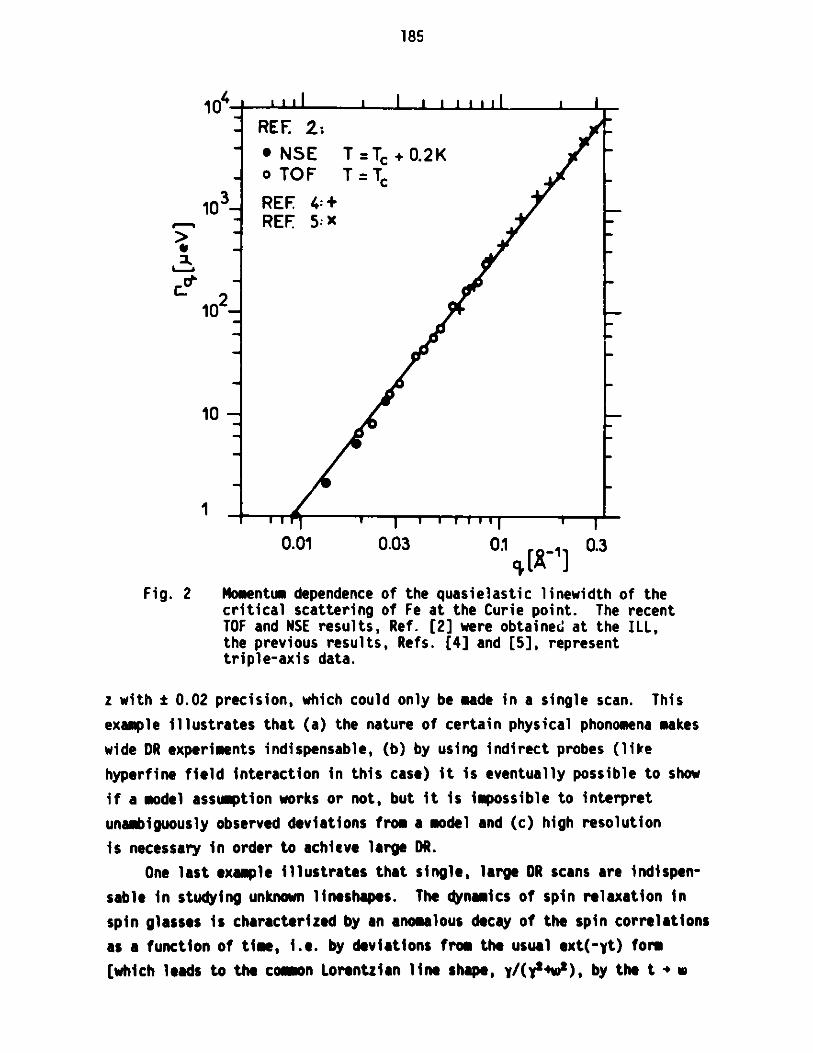
185
10
103_,-, -
210-
10
1
-moilImall I I . . . I i a I
-L L.1
0.01 0.03 01 [-1]
Fig. 2 Momentum dependence of the quasielastic linewidth of thecritical scattering of Fe at the Curie point. The recentTOF and NSE results, Ref. [2] were obtained at the ILL,the previous results, Refs. [4] and [5], representtriple-axis data.
z with 0.02 precision, which could only be made in a single scan. This
example illustrates that (a) the nature of certain physical phonomena makes
wide DR experiments indispensable, (b) by using indirect probes (like
hyperfine field interaction in this case) it is eventually possible to show
if a model assumption works or not, but it is impossible to interpret
unambiguously observed deviations from a model and (c) high resolution
is necessary in order to achieve large DR.
One last example illustrates that single, large DR scans are indispen-
sable in studying unknown lineshapes. The dynamics of spin relaxation in
spin glasses is characterized by an anomalous decay of the spin correlations
as a function of time, i.e. by deviations from the usual ext(-yt) form
[which leads to the coron Lorentilan line shape, y/(yl+w2), by the t 4w
REF. 2.;* NSE T=Tc+0.2KoTOF T=TcREF 4:+REF 5:X
_ 3
r
p
V.%

186
Fourier transformation]. This has been established in the pioneering work
of Amir Murani [6], who patched together data taken on the IN4, IN5 and
IN10 spectrometers at the ILL in order to cover the w range of 1 peV to
2 meV. However, this procedure did not allow to obtain quantitative results
on the actual lineshape. This was only made possible by using the NSE
method, which allowed to cover a 1:600 range in a single scan, incidentally,
directly in the time domain [7]. The results [8] in Fig. 3 show that at
some temperatures (viz. 30 and 36 K) the data are compatible with the
predicted const - n(t) shape (which would give straight lines in the
log-scale figure), but not at other temperatures. In this particular
case a.c. susceptibility data allowed to extend the results [10] over an
improbable range of 1:1012, which revealed that there can be interesting
details only apparent on such a large DR (e.g. the drop in the 26K curve
between 10- 8 and 10-5 sec). Note that the ESR and pSR experiments made
on the same system were invariably evaluated under the obviously wrong
assumption of exponential decay. This shows again the fundamental role
of neutron scattering as model independent probe.
C10
SS
*..V~g~ .5 e~d ~K.L36K K -
V 0K - KD10w - -t- -
Tie. (sMc)
Fig. 3 Decay of the spin-spin correlations vs. time in Cu-5% Mnspin glass alloy. Dots with error bars represent NSE and 1polarization analysis data (Ref. [8]) measured at q=0.1 AR.The open circles give values calculated from a.c. suscepti-bility data (Ref. [9])
187
3. DYNAMIC RANGE OF PULSED SOURCE INSTRUMENTS
There are basically two ways of making wide DR experiments:
a) use of very high resolution
b) use of several wavelengths
The only existing neutron scattering technique which provides large DR
at fixed wavelength by its high resolution capability is NSE with a DR of
about 1:1000. Further increase of the range in NSE, and achieving anything
like 1:200 - 500 with the other methods requires the application of several
wavelengths in a single experiment. This is exactly what pulsed source
instruments do, and in what follows I will consider this aspect for SANS
and NSE.
The resolution in SANS experiments is determined by the definition
of the scattering angle and of the neutron wavelength A. Since in cold
moderators the neutron pulse length is roughly proportional to the wave-
length, an approximately constant relative resolution 6X/A will be main-
tained in the most interesting part of the wavelength band between about
2 and 10 A. Note that this resolution happens to be around 1-2%, which
is considerably better than what is usually required and used in SANS
experiments (viz. about 10%). At any given scattering angle, the smallest0
q information will be given by the A110 A neutrons, while the shorter
wavelength, higher flux portion of the spectrum provides information at
higher q's, where the scattering cross section tends to be smaller (cf.
Fig. 1). This intensity compensation effect is a very important feature,
and it can make useful much of the data collected during the same time.
In usual, fixed wavelength SANS experiments long wavelength is used to
access the smallest q values, and thus the measuring time is determined
by the low cross section higher q data, taken at the same lower incoming
flux. Thus a SANS instrument not only covers a wider DR on a pulsed
source than on a continuous one (typically 1:200 compared with 1:40), but
also collects data more efficiently. At the final end the data rate at
a pulsed source should be comparable to that at a continuous source with
a flux about 20-50 times higher than the time averaged pulsed flux.
Many of the above considerations apply to the use of NSE on a pulsed
source (11]. The DR could be extended to 1:10000 by using a wavelength
band between 3 and 10 A, which can be handled by supermirror neutron

188
polarizers. In experiments like the study of diffusion at small scattering
angles, the above intensity compensation arguments also apply, and in
addition a similar situation holds for the resolution. Shorter wavelength
neutrons provide information at high q, where the quasielastic linewidth
tends to be bigger (cf. Fig. 2), i.e. less resolution is required. In
addition, shorter wavelength might even be necessary in order to keep the
scattering triangle close to a constant q configuration. (e.g. in Fig. 2
the TOF data could not be extended to higher q values because the inelasti-
city would have become comparable to the incoming neutron energy of 0.8 meV).
For the rate of data collection in NSE at a pulsed source the same figures
should apply than those given above for SANS.
4. CONCLUSION
Recent experience shows that in some neutron scattering studies the
dynamic range of the instrument used is as important as neutron intensity
or resolution. This implies, that the same way as e.g. high flux can not
make up for poor resolution, the use of several instruments with different
ranges can not always replace a large DR scan in a single setting of a
single instrument. Pulsed source instruments are bound to provide superior
DR with respect to continuous source machines, due to the inherent use of
a broad wavelength band. In particular this feature makes pulsed sources
well adapted for small angle scattering and quasielastic neutron spin echo
experiments. In these cases the data collection rate corresponds to that
on a continuous source with 20-50 times the time averaged flux of the
pulsed source, and no good time-of-flight resolution is required, i.e.
cold neutron pulses of several 100 psec length are perfectly acceptable.

189
REFERENCES
[1] See B. Jacrot Rep. Prog. Phys. 39, 911 (1976)
(2] F. Mezei, to be published.
(3] L. Chow, C. Hohenemser and R. M. Suter, Phys. Rev. Ltr. 45, 908 (1980)
[4] M. F. Collins et al., Phys. Rev. 179, 952 (1969)
[5] S. Boronkay and M. F. Collins, Int. J. Magn. 4, 205 (1973)
[6] See A. P. Murani, J. de Physique Suppl. Coll. 39, C6-1517 (1978)
[7] See Neutron Spin Echo, edited by F. Mezei, (Lecture Notes inPhysics, Vol. 128, Springer Verlag, Heidelberg, 1980)
[8] F. Mezei and A. P. Murani, J. Magn. Magn. Mat, 14, 211 (1979)
[9] J. L. Tholence, Solid State Comm. 35, 113 (1980)
[10] F. Mezei, in "Recent Developments in Condensed Matter Physics",Y. T. Devreese, editors (Plenum Press, New York, 1981) pp.679-694
[11] F. Mezei, Nucl. Inst. Meth., 164, 153 (1979)

190

191
A PHASED CHOPPER AT WNR**
by
V. Bolie*, R.M. Brugger+, R. N. SilverPhysics Division
Los Alamos National LaboratoryLos Alamos, NM 87545
ABSTRACT
At WNR, a proportional-integral-derivative PID control system has
been developed to hold a neutron chopper within the 128 isec widewindow allowed by LAMPF. After achieving this control, LAMPF is
triggered from the chopper to limit the phase jitter between theLAMPF produced burst of neutrons and the chopper opening. This PIDsystem has been tested for phase control, phase jitter and neutron
control using a chopper spinning at 14,400 RPM. The results to date,which are discussed, indicate that a chopper can be phased to the
neutron pulses produced by LAMPF to + 0.5 usec..
*Permanent address: Department of Electrical and Computer EngineeringUniversity of New MexicoAlbuquerque, NM
+Permnent address: University of Missouri Research ReactorUniversity of MissouriColumbia, M
* A paper presented at the VIth annual ICANS Meeting, ANL, June 28,1982.

192
I. Introduction
Since the beginning of slow neutron spec troscropy, phased
chopper-velocity selectors 1 ' 2 have been important instruments for
inelastic neutron scattering experiments. With the advent of the new
pulsed spallation neutron sources, a chopper phased to the pulsed
source 3,4,5,6 is again projected to be an important spectrometer.
At the WNR pulsed source, the LAMPF proton accelerator produces the
neutron bursts in phase with the 60 Hz wave form of the commercial
power-line voltage. Since the power line frequency is not exact, it
is a challenge to keep a chopper, with its required high moment of
inertia, sufficiently in phase (+ 1/2 usec) with the neutron bursts
to achieve precise time-of-flight TOF resolution. Unfortunately,
this problem will remain after completion of the Proton Storage Ring,
PSR. Despite the PSR's anticipated capability to store protons for
extraction, maximum current will be achieved by minimizing storage
time to minimize beam spill. This paper presents the recent success
in developing a control system for chopper phasing at the WNR. A
discussion of the effort to solve a similar problem at the SNS at the
Rutherford Laboratory was presented at the ICANS IV meeting.8
II. Statement of the Problem
Fig. 1 shows a schematic layout of the coupling of the LAMPF
accelerator to a chopper at the WNR. With the switch U in the down
position, LAMPF is triggered directly by the zero crossings of the
commercial power line. The accelerator delivers proton bursts to a
spallation target at the WNR to produce neutron bursts. To define
the incident energy of the neutron beam impinging on the sample, the
chopper must open at a fixed time delay after the neutron burst. To
maintain this delay, a control system is required. Because the
chopper mass, and hence moment of inertia, must be large in order for
the chopper to be neutronically effective, it is impractical to
control the phase of the chopper to the required accuracy of + 1/2
p sec alignment with the zero crossings of the power-line voltage.
Therefore, LAMPF allows a 128 p sec wide window around each zero
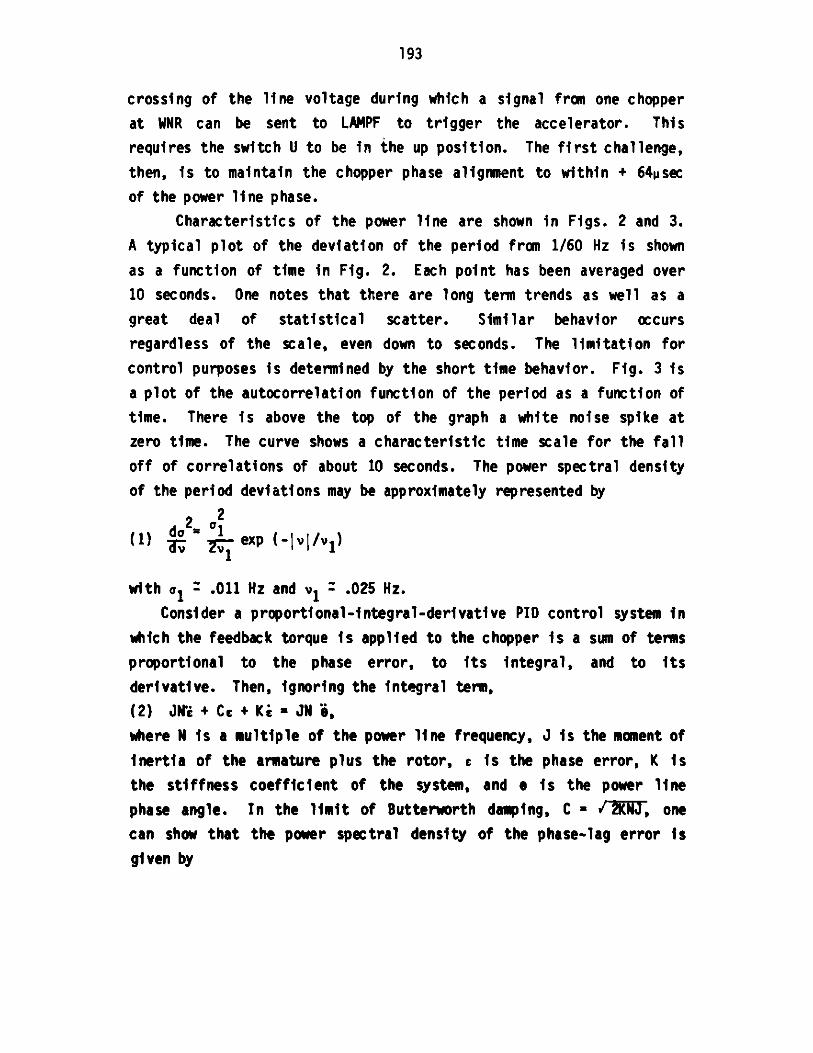
193
crossing of the line voltage during which a signal from one chopper
at WNR can be sent to LAMPF to trigger the accelerator. Thisrequires the switch U to be in the up position. The first challenge,
then, is to maintain the chopper phase alignment to within + 64psec
of the power line phase.Characteristics of the power line are shown in Figs. 2 and 3.
A typical plot of the deviation of the period from 1/60 Hz is shown
as a function of time in Fig. 2. Each point has been averaged over10 seconds. One notes that there are long term trends as well as a
great deal of statistical scatter. Similar behavior occurs
regardless of the scale, even down to seconds. The limitation for
control purposes is determined by the short time behavior. Fig. 3 is
a plot of the autocorrelation function of the period as a function of
time. There is above the top of the graph a white noise spike at
zero time. The curve shows a characteristic time scale for the fall
off of correlations of about 10 seconds. The power spectral density
of the period deviations may be approximately represented by
2)d 2= o
(1) y yexp (-Ivl/vl)
with Q1 = .011 Hz and vl = .025 Hz.
Consider a proportional-integral-derivative PID control system in
which the feedback torque is applied to the chopper is a sum of terms
proportional to the phase error, to its integral, and to its
derivative. Then, ignoring the integral term,(2) JNW+CC +KI=JNO,
where N is a multiple of the power line frequency, J is the moment of
inertia of the armature plus the rotor, c is the phase error, K is
the stiffness coefficient of the system, and * is the power linephase angle. In the limit of Butterworth damping, C = / 2KIJ, onecan show that the power spectral density of the phase-lag error isgiven by

194
(3) d ( T 2 (v/v )2 dc 2
dv \r o1+(v/v )
Here T is the period and v0 = (2 )-1 K/NJ. For v<<v 0 , one
can then show that the RMS phase-lag error is
(4) 7'RMS = 2,r /NJ olvl
0
and the RMS control power is(5) PRMS = 8w3 /N2F0 Jc,1v1The available power must be must greater than (5) to keep the control
system linear. If one estimates ten times (5), then, for a typical
rotor of J = 500 kgcm2 operating at 32,400 RPM, one obtains a
control power requirement of 230 W. Additional power is required to
overcome bearing drag.III. Control System for 14,400 RPM Test
A PID control system was tested using one of the choppers from
the MTR velocity selector2 . Fig. 4 shows the control system in
schematic form.The input signal EL is the train of 20 p sec pulses of 120 Hz
nominal repetition rate, corresponding to the successive zero
crossings of the powerline voltage wavefornu. The output is the
advancing phase angle e of the chopper shaft S, which rotates at the
nominal speed of 2 X 120 = 240 Hz. Each revolution of the shaft is
detected by a magnetic pickup Q which senses the passage of a slot inthe iron disk D attached coaxially to the shaft (or equivalently aniron stud attached to the chopper rotor). The signal conditioner P
squares up the rough pulse train from the pickup Q, and delivers (as
a feedback signal ER) a train of 20 asec pulses of 120 Hz normalrepetition rate.

195
The shaft S is driven by a 500 W, 2 phase, 4 pole induction
motor M, which receives its stator excitation from a 2 phase, 240 t48 Hz, variable-frequency drive unit. Each phase of the drive unit
is a 250 W solid state amplifier, connected to an 8-bit
digital-to-analog converter which has its data input furnished by a256-byte read-only-memory ROM. The phase one memory contains a
cosine wave, and the phase-two memory contains a sine wave. The twoROM's are addressed simultaneously by the parallel outputs of an
8-bit binary counter, which is toggled by a voltage-controlled
oscillator having a 61.4 + 1.3 kHz output frequency which is
linearly related to the input voltage V.
The function of the controller box B is to transform the line
signal EL and the rotor signal ER into a control voltage V which
will maintain phase lock within an acceptable phase tracking error.Early studies showed that the conventional rate generator in a
standard PID controller is far too insensitive to detect theminiscule, but crucial, speed changes. Instead, a digital
timing-and-computing scheme was devised to measure the relative phaselag and the duration of every revolution of the shaft S with an
accuracy of + 204 nsec, and to convert the resulting data streams
into a phase error signal and "vernier speed error" signal needed to
stabilize the associated phase loop.In obtaining the experimental data reported here, the speed
error gain setting was such that full scale correction(-10 < V < + 10 volts) corresponded to a 0.375 Hz speed error. The
phase error gain was manually set to the highest value achievable
without inducing overshoot oscillations. With the motor and chopper
running in a one Torr vacuum, the four supporting bearings consumedan average drag power of .150 W.
IV. Phasing ExperienceAs a test of the PID control system, one of the surplused
choppers from the MTR velocity selector2 was reactivated. Thischopper has a mcient of inertia of about 200 Kgcm2 . The 500 W

196
motor was used to drive the chopper at speeds up to 14,400 RPM. A
magnetic pickup was used to sense an iron stud on the chopper torecord the chopper's relative angular position. Figure 5, which
demonstrates the phase control, shows the spectrum of magnetic pickup
events when the chopper is controlled to the line and the scan is
triggered by the time of the zero crossing signal from LAMPF. The
full width half maximum FWHM of this curve is 15 sec, while the full
width at the base FWB is 45 u sec. These times are both well within
the window of 128 Psec in which LAMPF will allow for a trigger from
the chopper to be sent back to trigger LAMPF.Figure 6, which is a first demonstration of the jitter, shows
the spectrum of magnetic pickup events when the chopper is controlled
to the line and LAMPF is triggered by the chopper. The FWHM is 2.0
Psec while the FWB is 5.0 pgsec, both approaching the conditions that
will be satisfactory for a phased chopper.
Since the MTR chopper with its Ni shell and Ni + Cd shades in
the foil package will not be satisfactory for chopping neutrons above
0.3 eV, a new chopper was made. This new chopper, which is shown inFigure 7, has a shell of Al and shades in the foil package of three
pieces of Borsical9 '"0 , a composite of B fiber covered with Al.The radius of curvature of these slots is 1.30" to pass 0.5 eV
neutrons when the chopper is spinning at 14,400 RPM. The moment of
inertia of this chopper is 100 Kgcm2.Figure 8 shows an example of the phase control for the Al shell
chopper while Figure 9 shows the jitter. The chopper was spinning at
14,400 RPM. Figure 8 shows that the control or phase lock of the
chopper to the line that drives LAMPF was 50 p sec FWB, well within
the 128 P sec window allowed ty LAMPF. Figure 9 has a FWHM of 1.8
sec and a FWB of 6 p sec, close but not as narrow as desired.Analysis of parts of the control system indicate that the adjustable
delay #1 of Figure 1 has a jitter of 1 sec while the adjustable
delay #2 has a jitter of t 0.5 sec. These could account for much
of the t 1 usec jitter of Figure 9. Inspection using an oscilloscopeof the change in speed of the chopper as sensed by the magnetic

197
pickup signal indicates a short time jitter of only a few tenths of a
isec. This should represent the jitter that is achievable with the
PID control system when the coarseness of the delay units is reduced.
A longer time hunting is observed in the speed of the chopper.
This may cause some jitter and a longer time-integral control may
need to be used in the control system.
IV. Neutron Experience
For neutron tests, the Al shelled chopper was placed at flight
path 8 of WNR. A fluted beam was used which viewed the 10cm X 10cm
source at the target through a 2cm X 0.13cm slot at the chopper.Neutron detectors were placed just before the chopper, and just after
the chopper.
Figure 10 shows spectra of the flux of neutrons that were
measured by the two detectors. The upper curve of Figure 10 is the
typical WNR spectrum for a beam filtered only by Cd. The increase
near channel 600 is the start of the thermal Maxwellian
distribution. The dip near channel 900 indicates the Cd cut off.
The lower curve o'r Figure 10 shows the bursts as sensed by the
detector just after the chopper, for several different phase
settings. Since the detector was near the chopper and in a high
field of scattered neutrons, the backgrounds of the lower curve are
not indicative of the true effectiveness of the chopper when closed.
The envelope of the bursts of the lower curve show the coarse
transmission of the chopper.The burSts are sharp, even the first burst at channel 60 which
is about 20 eV. The 4th burst is at about 0.4 eV, a little below the
design target for maximum transmission for this chopper. The lastburst at channel 950 is for about 80 meV neutrons which are so slowthat they are mostly swept out by the nearly straight slots.
Figure 11 shows an expanded view of the 4th burst, the one for0.4 eV neutrons. Its FWFM which is 10 psec, is a composite of the5.2 psec FWHM of the chopper opening and closing, the 11.2 psec FWBof the sweep of the chopper across the source and the 2 p sec FWM of

198
the jitter of the chopper. The boron shades made of three
thicknesses of Borsical seem to be effective for chopping neutrons
even up to 20 eV. The background of Figure 11 is not significant
because of the way these tests were run.
199
V. Conclusions
The control tests and neutronic tests presented in this paper
demonstrate that the PID control system effectively holds a chopper
within the time window allowed by LAMPF. The jitter measurements
show that a chopper can trigger LAMPF to within < + 0.5 psec once the
electronic coarseness is refined. The neutronics measurements show
that the boron fiber shades are effective neutron choppers.
200
Acknowledgements
The authors recognize and thank Harold Bowen for his many
contributions and assistance in the construction and checkout of thePID control system. Rod Hardee was a great help in reassembling the
MTR chopper. The authors also thank Joyce Goldstone, Phil Seeger and
Don Crocker for valuable assistance during the course of this
development.

201
References
1. R. A. Egelstaff, "Proceedings of the First InternationalConference on the Peaceful Uses of Atomic Energy", Geneve, VolIV, p. 119, United Nations, New York, (1955).
2. R.M. Brugger and J.E. Evans, Nuclear Inst. and Meth., 12, 75,(1961).
3. W. 0. Whittemore and H. R. Danner, "Neutron InelasticScattering," Vol 1, P. 273, IAEA, Vienna, (1963).
4. G. J. Kirouac, W. E. Moore, L. J. Esch, K. W. Seeman and M. L.Yeater. Theralizatlon of Reactor Spectra Vol 1, p. 389, IAEA,Vienna, (1968).
5. B. C. Boland, D. F. R. Mildner, G. C. Sterling, L. J. Bunce, R.N. Sinclair and C. G. Windsor, Nucl. Inst. and Meth. 154 349,(1978).
6. R. Kleb, C. A. Pelizzari and J. M. Carpenter, "Fermi Choppersfor Epithermal Neutrons", (in preparation).
7. C. G. Windsor, Pulsed Neutron Scattering, pp. 296, Taylor andFrancis LTD, London, (1951).
8. T. J. L. Jones and J. G. Parker, Proceedings of the IVth ICANSMeeting, KEK, TSUKUBA, Oct 20-24, (1980), KENS Report II, pp499, (March 1981).
9. Composite Technology, Inc., 6 Mill Street, Broadbrook, Conn.06016.
10. T. J. L. Jones, J. Penfold and W. G. Williams, RutherfordLaboratory Report RL-79-020, (March 1979).

202
- - - - - - SWITCH
1 U 120 HEARELAMPF --
InE ^
ADJUST EL P[O 6 HPEH, DELAY CHOPECHOPPER
L ADJUST Eft YSE
120 Ht DELn2 -- n
LINE FLAGSAMPLE
Fig. 1
Schematic layout of the
coupling of a chopper atWNR to the LAMPF accelerator.
LA
32r
Fig. 2
Period deviation from60 Hz versus time ofthe LAMPF commercial
power line.
-30-
28
O 26
a 24-.JWC 220
20I-
S18
16IA.
0 5 10 15 2C0 25 30TIME (s)
35 40 45 50
1..i..l..........1..1......1....1.... 1.... ... ;
" -f
.. 5.
-- - - .
-
I
.' ,. . .. . .~ a
-; ,.. .Q -, -4 .,
-- . . ... ---. .
- w- s.
X24 25 26 27 28 2TIME (hours)
* '4
- - "
Fig. 3
Autocorrelation of theperiod deviations ofFigure 2.
9 30 31 32
.1 ... 1 ...1 ...1 ...1 ..........1 ...1 .-
. 111-
A"-
1-
8
6
- 4
z 2
1 0
0 -20
i -6
-6
-,
- - .. I
-v
l
34
-
"
, J

203
Fig. 4
The neutron choppercontrol system.
Fig. 5
The measured phase errordistribution between theLAMPF power-line cross-over and the chopperangular position usingthe PID control system.The chopper had a nickelshell, a moment of inertiaof 200 Kgcm 2 and wasrunning at 14,400 RPM.
-JW~zza
U
F.-z0U-
2.o ss
5.CNs
CHANNEL
I I I I I I I I I I I I I I I I I
CHANNEL (3.2 ps)
Fig. 6
The chopper jitter distributionwhen the chopper is phased toLAMPF as in Figure 5 and LAMPFis fired within the 128 usecwindow. In this case, thechopper was spinning at7,200 RPM.
-JWzz4
U
z0
DEL6
M Q
P

204
-7- -d 19~~
-7
-u
K(1
Fig. 7. A drawing of the Al shell chopperwith the Al shell in the center, a foilpackage to the left and an exploded view ofthe foil package to the right.
12500 F
700 I I
600
500
400
300
200-
00
1n --S
UJC- 00
'16400 16500 18600 16700 16600
CHANNEL (0.2 s)
Fig. 8. The control or phaseerror distribution for the Alshell chopper with 100 Kgcm 2
spinning at 14,400 RPM.
J 0000WzzQIU- 7500-
Inf-z
0 5000
r2500 F
00 16729 16739 16749 19759
CHANNEL (0.2 s)
Fig. 9. The chopper jitterdistribution with the Al shellchopper phased to LAMPF as inFigure 8 and LAMPF being firedby the chopper. The chopperwas spinning at 14,400 RPM.
JW~zZ4I
(nI-z0U
r J ,
I a
6e
e 0
irk! J
r

205
NEUTRON2010 2.0 1.0 0.1 0.5 0A
ENERGY (eV)0.3 0.2 0.1
00 800 900 1000o 100 200 300 400 500 600 7CHANNELS (1.6 1s)
Fig. 10. Spectra of the flux of neutronsmeasured in flight path 8 by detectors justbefore and just after the chopper.
I I
I0.0
"
BACKGROUNDI I
- M~oo 3600
CHANNEL (0.21is)
Fig. 11
An expanded view of the 4th burstfrom the left of Figure 10.
- I I I I I I I I
-JWzz4U
z0U.
300
250 F
J 2 0 0
WzzIz0U 100
50
I

206

207
ICANS-VI
INTERNATIONAL COLLABORATION ON ADVANCED NEUTRON SOURCES
June 27 - July 2, 1982
THE IPNS-I CHOPPER SPECTROMETERS
D. L. Price, J. M. Carpenter, C. A. Pelizzari,
S. K. Sinha, I. Bresof and G. E. Ostrowski
Argonne National Laboratory, Argonne, Illinois 60439 U.S.A.
ABSTRACT
We briefly describe the layout and operation of the two chopper experi-
ments at IPNS-I. The recent measurement on solid 4He by Hilleke et al. pro-
vides examples of time-of-flight data from the Low Resolution Chopper
Spectrometer.

208
THE IPNS-I CHOPPER SPECTROMETERS
D. L. Price, J. M. Carpenter, C. A. Pelizzari
S. K. Sinha, I. Bresof and G. E. Ostrowski
Argonne National Laboratory, Argonne, Illinois 60439 U.S.A.
The chopper spectrometers at IPNS-I enable measurements of inelastic
scattering with energy transfers in the range 40-800 meV. Detectors placed
at many different angles determine the scattering as a function of wave vector
Q as well as energy transfer E. As an example, Fig. 1 shows the region of
(Q,E) space opened up by the use of 500 meV neutrons compared with the region
accessible to 100 meV neutrons, which are towards the upper end of the range
available at reactors. The aim of the chopper spectrometers at IPNS-I is to
explore the new scientific opportunities in this new (Q,E) region.
0.41
0.3
3
0.I
0 5 I0 15
Fig. 1 Region of (Q, E) space opened up by 500 meVneutrons compared with 100 teV (E w -w).
ACCESSIBLEL ETO 0.5 eV
EUTRONS
- A
F ACCESSIBLE
T0 0.1 eV
EUTRONS
.7
o.21
nIo.0

209
Fig. 2 shows a schematic of the layout for the two spectrometers now
existing at IPNS-I. By increasing the distances dl and d3 the resolution is
improved but at the expense of intensity. The two machines, Low-Resolution
Medium-Energy Spectrometer (LRMECS) and High-Resolution Medium-Energy Chopper
Spectrometer (HRMECS) represent different compromise positions with respect
to this trade-off. The dimensions for the two machines are given iii the
figure.IPNS-I CHOPPER SPECTROMETERS
DETECTORS
PULSEDSOURCE
dl d2 (
CHOPPERSAMPLE01
d1
LRMECS 6.2 m
HRMECS 12.8 m
d2
0.6 m
1.1m
d3
2.5 m
4.0 m
tiE 0~
6-8%
3-4%
Fig. 2
Schematic of the layoutand dimensions of thetwo chopper spectrom-eters at IPNS-I.
-10 to +120
-20* to +20*
The chopper has a body of beryllium with aluminum end-caps; boron fiber/
aluminum composite defines the slits; details are given elsewhere.
The system shown in Figure 3 maintains the choppers for these and otherBLOCK DIAGRAM OF IPNS-I CHOPPER PHASING SYSTEM
60 Hz RCS ProtonDeam __ IPNSclock target
CCC r.----------
System Priority EX IBLANK Datamaster Chopper ,I acquisition l
clock selector M/S t controller to system 11 Fig. 3MEXg 5A It
IIreed set .SP Zero Summary of the scheme30Hz I 30Hz crofor chopper phasingdelay at IPNS-I.
1 I delayed Mag pickup II30 Hz
3.932 MIS II Frequencysynthesizer Chopper
Srepots for each chopperrpasIChopper ye Poer Iregulator amplIfIers
L-.-----------------

210
machines in a fixed phase relation to the accelerator2. A key element is the
system master clock, based on a crystal oscillator and sending synchronized
driving pulses to the Rapid Cycling Synchrotron (RCS) and the choppers. Each
chopper circuit (in the dashed-line box in Fig. 3) generates a signal de-
manding extraction from the accelerator, based on the to signal from the
target, the chopper period and a preset delay time. The priority level
selector sends the highest priority (relative to a preassigned hierarchy)
valid extraction signal to the RCS. The logic of the phasing mechanism is
shown in detail in Fig. 4. The system performs excellently with the two
choppers running simultaneously.
TIMING SEQUENCE OF IPNS-I CHOPPER PHASING
Protons on target (t0)10O
Extraction window (EW I
Chopper i: tw - &Tw/2i tw t +IATI21
Extraction Im Di . *-command (EXi -Ti - Tji -
c c1
xChopper synch Tcpulses (SP FF T
At 1 - /21 10 + o T i I
Conditions
1. For each chopper i I t2 + D is valid extractioncommand (EXi it
- t- I AT .
2. Master is highest priority chopper giving valid EX;master extraction command IMEX triggers RCS traction.
3. For master, it t i TAT, change delay so that t - t.
4. If t II + T - T i 2ATc. blank off data acquisitionsystem for chopper I and, for slaves, change delays so that
1 -t + T - T 6/2
Fig. 4. Timing sequence and logic ofthe chopper phasing system.

211
Approximately 100 3He proportional counters in each instrument detect
scattered neutrons. The signals run to the IPNS-I Data Acquisition System3;
the software enables signals from individual detectors to be binned singly or
together as a larger group. The data are analyzed on the VAX 11-780 using
general purpose programs which have been developed. Fig. 5 gives a summaryof the scheme involved.
ANALYSIS OF CHOPPY R SPECTROMETER DATA
Vanadium CHOPV m vim, il Sv10, Elrun
FUDGEComparewith theory
Detector FoAE(4 Resolutionefficiency factors FQi(el parameters
Sample run Ile, ti CHOPBackground run Ole, t) Sin, El
INTERP
Compare with theory
Fig. 5
Summary of the scheme forchopper data analysis.
Since HRMECS has only just become operational, we now limit our discus-
sion to LRMECS. Table I lists the experiments recommended by the Program
Committee for the first year of full operation. At the present time all
experiments recommended for the first half-year have been run and are in
various stages of data analysis. In some cases additional data are needed.
As an example, we show raw time-of-flight data for the solid 4He experi-
ment5 . The data were taken with E = 500 meV. The object was to determine
the ground state momentum distribution in hcp solid 4He.
Figure 6 shows the scans through (Q,E) space corresponding to a fixed
detector as a function of angle. Peaks are expected at the points where the
curve for the recoil energy
2 2
ER =
crosses the (Q,E) scans (M = mass of scattering atom).

212
REGION OF (O,E) SPACE ACCESSIBLE
TO CHOPPER SPECTROMETER
0.2 0.4 0.6 0.8 1.0 1.2 1.4 1.6 1.8
/
- 2 x 110"
00 100 * 30' 400 50 600 70 80 90 100 120
- 1 I I I I II lA I. \__AA0 0.2 0.4 0.6 0.8 1.0 1.2 1.4 1.6 1.8
Fig. 6
(Q, E) conditions forthe 4He experiment.The solid curves arethe loci through (Q, E)space scanned by de-tectors at the anglesindicated. The dashedcurve is the recoilenergy for 4He. Thecrosses indicate thepeak positions in themeasurement of Hillekeet al. (Ref. 5). Eo-505 meV, ko - 15.6 A-1.
Q/ko
The remaining figures show the count rate as a function of time for three
angles. The circles represent the scattering with the container full and the
lines the empty container scattering normalized by monitor counts to the full
container run. Fig. 7 shows the helium peak at a small angle, $ = 7.5*, where
the recoil energy is very small and the helium peak is superimposed on the
scattering from the container.
RUN 0106 50i3 HE
0,
Fig. 7
Curve of scattering from4He (open circles) com-pared with that from theempty container (normal-ized to the sample run)at room temperature,
0 - 7.5' (Hilleke et al.,Ref. 5).
160.00 800. :. 840.00 B60.00 920.00 960.00 100.00 1040.T
10
09
0.8
0.7
06
0.5
0.4
0.3
0.2
0.I
0
0Wi
1>
SG 8 PHi-7.5
o_0
C'A
00te
;aa.
O
.
0.
N
O
0
0 *O
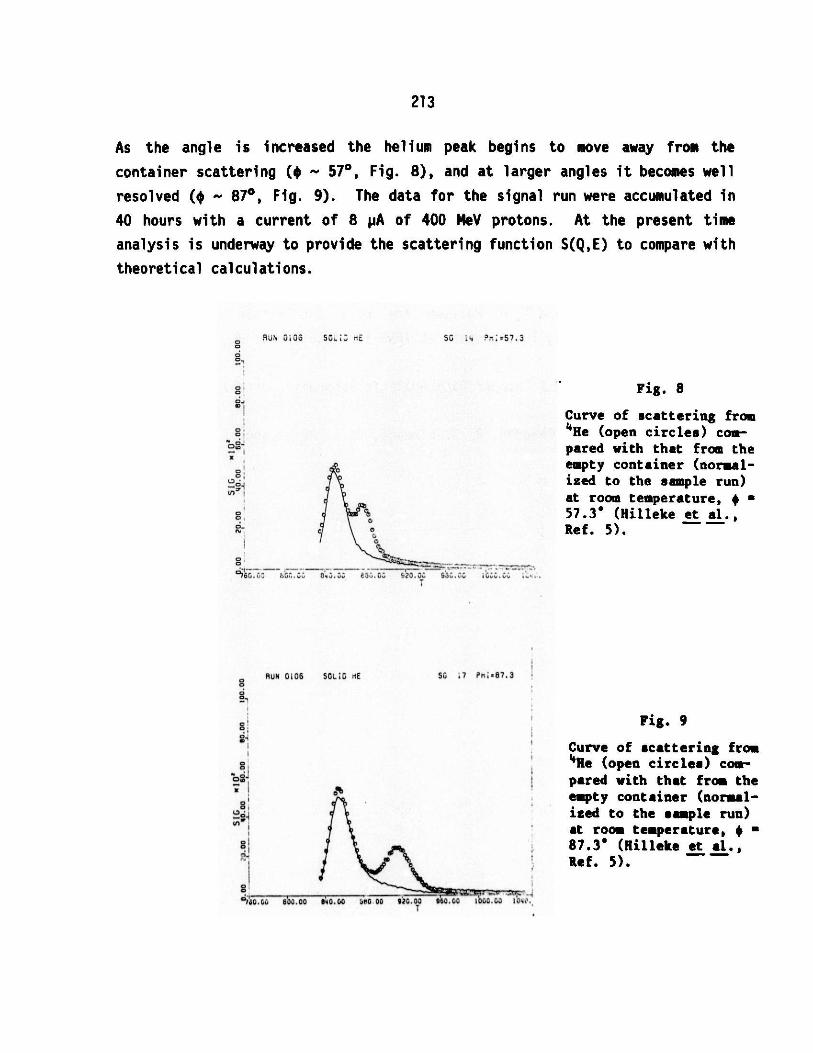
213
As the angle is increased the helium peak begins to move away from the
container scattering (* ~ 570, Fig. 8), and at larger angles it becomes well
resolved ($ - 87 , Fig. 9). The data for the signal run were accumulated in
40 hours with a current of 8 pA of 400 MeV protons. At the present time
analysis is underway to provide the scattering function S(Q,E) to compare with
theoretical calculations.
RUN OiOG S.; ME;
o.,
Fig. 8
0C
OC,
00
H OO
RUN 0106 SOLiG HE
Curve of scattering from4He (open circles) com-pared with that from theempty container (normal-ized to the sample run)at room temperature, * -57.3* (Hilleke et al.,Ref. 5).
SG 47 Pni.87.3
0
I ~ e
0,
01o 010.Gu6 00.00 0. .00 '500 00 92G.00 960.GG 1060. U 1040.
Fig. 9
Curve of scattering from4 He (open circles) com-pared with that from theempty container (normal-ized to the sample run)at room temperature, * -87.3* (Hilleke et al.,Ref. 5).
I
5G :4 n:=57.3

214
References
1. R. Kieb, C. A. Pelizzari and J. M. Carpenter "Fermi Choppers for Epither-
mal Neutron Beams", to be published.
2. W. Praeg, D. McGhee and G. Volk "Phase Lock of Rapidly Cycling Synchrotron
and Neutron Choppers", IEEE Trans. Nucl. Sci. NS-28, 2171 (1981).
3. R. K. Crawford, R. T. Daly, J. R. Haumann, R. L. Hitterman, C. B. Morgan,
G. E. Ostrowski and T. G. Worlton "The Data Acquisition System for the
Nuclear Scattering Instruments at IPNS-I", IEEE Trans. Nucl. Sci. NS-28,
3692 (1981).
4. D. L. Price, "IPNS-I Chopper Data Analysis Programs", June 1, 1982 (unpub-
lished).
5. R. 0. Hilleke, P. Chaddah, R. 0. Simmons, D. L. Price and S. K. Sinha (to
be published).

215
TABLE 1. LIST OF EXPERIMENTS RECOMMENDED BY THE PROGRAM COMMITTEEFOR THE FIRST YEAR OF LRMECS
LOW-RESOLUTION MEDIUM-ENERGY CHOPPER SPECTROMETER
Accepted Proposals November 1981 - April 1982
6 S. A. WernerG. Shirane
71 R.R.P.
0. Hilleke0. SinmonsChaddah
S. K. Sinha
43 J.C.D.
M.A.F.
CarpenterPelizzariR. Mildner
57 S. M. ShapiroS. K. Sinha
58 J.L.R.S.
65 R.
S.B.S.
S. LanninPilioneMaganaK. Sinha
D. Parks
ShapiroGrierK. Sinha
U. of MissouriBrookhaven
U. of IllinoisU. of IllinoisBhabha At. En. Res.Cntr.Argonne
ArgonneArgonneU. of Missouri
BrookhavenArgonne
Penn State U.Penn State U.Penn State U.Argonne
Polytechnic Inst.of New YorkBrookhavenBrookhavenArgonne
High Energy Magnetic Excita-tions in Pure Chromium
Momentum Density of HCP 4He
Mapping the Scattering Lawfor Vitreous S102
Measurement of Spin Dynamicsin the Mixed Valence AlloyCe1 xThx
Time of Flight Study of thePhonon Density of AmorphousPhosphorus
Quasielastic Neutron Scat-tering Study of Ce0 .9-xLaxTh 0 .1
Accepted Proposals May - October 1982
9 S-H. ChenD. L. Price
66 S.H.B.
72 S.A.D.R.
K. SinhaA. MookGoodman
K. SinhaJ. ArkoL. PriceM. Nicklow
104 J. R. D. CopleyW. S. Howells
127 M. Loewenhaupt
MITArgonne
ArgonneOak RidgeU. of Cincinnati
ArgonneArgonneArgonneOak Ridge
McMaster Univ.Rutherford Lab.
Julich
Proton Dynamics in SupercooledWater
Measurement of the CondensateFraction of 4He in Superfluid4He and 3He-4He Solutions
Dynamical Response in theExchange Enhanced ParamagnetU A12
Atomic Motion in Liquid Lithiumand Selected Lithium Alloys
Magnetic Excitations in Ceriumand Uranium Compounds
Spin Waves in Ordered Ni3Mn
2nd Backup
10 days
10 x 1/2 dayswith 1127
10 days
10 x 1/2 dayswith #72
136 P. Blanckenhagen Karlsruhe
7 days
10 days
7 days
7 days(with 165)
7 days(Backup)
7 days(with 157)
1st Backup

216

217
ICANS-VI
INTERNATIONAL COLEABATI4 N ADVANCED NEUTIC SOURCES
June 27 - July 2, 1982
A 1~YATING CRYSTAL PULSE SHAPER FOR LEE C N A
PULSED NEYTIO4 SORCE
J M Carpenter
Argonne, National Laboratory
Argonne, Illinois 60439
USA
C J Carlile
Rutherford Appleton Laboratory
Chilton, Oxfordshire OX11 OQK
England
ABSTRACT
A pulse shortening device is described for use on pulsed thermal
neutron sources. The device employs rotating single crystals and has
applications in the design of high resolution cold neutron
spectrwmeters.
218
A WI!ATDIG CRYSTAL PULE SHAPER FOR USE 0 A
PULSED NEUT 1 SURCE
J M Carpenter
Argonne National Laboratory
C J Carlile
Rutherford Appleton Laboratory
1. Introduction
It is much more favourable to use white beam time of flight
techniques on pulsed neutron sources than on continuous reactor-
based neutron sources for reasons of neutron economy. However,
from the moment of formation of the neutron burst in the moderator
the white beam is correlated in wavelength and time unlike a beam
on a continuous source and therefore neutrons of different
wavelengths disperse as they travel from the moderator. This
correlation provides the basis of the design of many pulsed source
neutron spectrometers. In certain cases however it can be the
cause of design constraints.
This is the case for the time of flight high resolution
quasielastic spectrometer IRIS [1] to be built on the spallation
neutron source SNS [2] at the Rutherford Appleton Laboratory. For
this spectrometer a pulse of cold neutrons narrow in time but as
wide as possible in wavelength is required. It is necessary
therefore to reduce the moderator pulse width by chopping the beam
as close to the moderator as possible in order to maintain an
adequately wide incident neutron wavelength window. The distance
of closest approach, and thus the wavelength window, is limited

219
however by the intense radiation field in which the chopper must
operate. A rotating crystal nonochromator can produce a wider
wavelength window than a mechanical chopper at the same position by
matching the time of arrival of neutrons of different wavelengths
in the incident beam to the time dependent Bragg condition of the
rotating crystal. This paper explores the feasibility of such a
device.
2. The A-t representation of the neutron pulse
In X-t space, where t is the time of arrival of a particular
neutron of wavelength A at a given distance L from the moderator,
the neutron pulse can be represented by a straight line passing
through the origin as shown in figure 1. Wavelength and time of
arrival are related through the de Broglie relationship
h= g.t W Ct
Thus at a position close to the moderator this locus has a higher
gradient, and far from the moderator a lower gradient reflecting
the dispersion of the pulse with distance. For a given
monochromatic neutron wavelength the time distribution of such
neutrons is shown schematically in figure 2. A measure of the time
width of the neutron pulse is given by the MR dtM of this curve
although this conceals the asymmetric shape of the pulse
particularly the tail at long times. Nevertheless on the A -t
diagram the pulse width can be represented by separate traces for
the leading and trailing edges of the pulse at the PWIK positions
as indicated in figure 1. Note that the time distribution is
independent of distance from the moderator and that 8 t M is
determined for the neutron pulse at the moment of its emission from
the moderator surface and remains constant for each wavelength at
all distances from the moderator. Consequently the principle

220
parameter with which to vary the resolution of a spectrometer is
its distance from the moderator and, for high resolution
instruments, the required distance can become untenable. In these
circumstances d t M can be reduced in order to achieve the desiredresolution. 6 tM is proportional to wavelength in the slowing downregion of the spectrum (a6 tM ' 7X where A is expressed in Angstromsand t M in microseconds). In the thermalised Maxwell-Boltzmann
region of the spectrum the pulse broadens and the constant of
proportionality rises to between 12 and 25 [2,4].
The pulse narrowing necessary to attain high resolution can be
achieved by two methods:
- The moderator itself can be designed such as to provide the
pulse structure required by a particular spectrometer.
However, since a number of spectrometers, in general, view the
same moderator there i a limited, but nevertheless important,
scope for this option.
- The pulse itself can be tailored after formation by some
mechanism. This can be achieved by the use of a mechanical
chopper but, as its alternative name of velocity selector
implies, this greatly reduces the wavelength distribution in
the beam transmitted by the chopper. This can be seen in
figure 3 where we restrict our attention to a relatively
narrow range of wavelengths. In this case the neutron pulse
at a fixed distance from the moderator can be represented by
two approximately parallel lines in A-t space.The action of
the chopper, of burst time 6 t c, restricts the wavelength
component in the transmitted beam to a relatively narrow range
taX, particularly when 6t c< dtM .Thus one advantage of the
pulsed source - its white beam - can be severely limited in
the design of high resolution instruments.
221
An idealised pulsed shortening device would reduce the pulse in
time whilst maintaining its full wavelength range. This ideal case
is indicated by the dashed lines in figure 3. A rotating crystal
assembly, as described in the following section, more nearly
approaches this ideal than does a chopper.
3. The rotating crystal pulse shaper
3.1 The basic principle
Suppose we arrange a single crystal, rotating with a constant
angular frequency w , at a distance L from the moderator as
shown in figure 4. Then as initially fast and later slow
neutrons illuinate the crystal, the rotational motion adjusts
the Bragg angle 0B to reflect a continuous broad band of
wavelengths whilst only remaining in the reflecting position
for any particular wavelength for a time short compared to the
intrinsic neutron pulse width 6tM from the moderator.
3.2 Phasing
Correct phasing of the crystal with respect to the time origin
of the neutron pulse will enable the resulting sinusoidal locus
of the beam reflected from the rotating crystal in A -t space to
form a tangent to the moderator neutron pulse locus as shown in
figure 5. The crystal locus is given from Bragg's law as
A(t) - 2d sin e (t) (1)where
eB(t) - - t*)

222
and t* o is a time origin for the crystal (equivalent to thetime when the crystal planes are parallel to the incident
bean).
Its gradient is given by
da(t) deB(t)- = 2d cos OB(t)dt dt
By setting this gradient at a particular wavelength equal to
the gradient c of the pulse from the moderator we obtain an
expression for the crystal frequency w required to reflect a
neutron wavelength a* at time t*(= X*/c).
Hence
doB(t) hS= --- _=(2)
dt mL [(2d) 2 _ 1*2](
3.3 The wavelength and time windows
Figure 6 illustrates the general case of the interaction of the
rotating crystal pulse shaper with the moderator pulse in which
the traces in A -t space intersect. The half-height contours
of the pulse are represented by the lines
hX=c(t tM/2) wherec= g

223
The rotating crystal, phased to be in reflecting orientation at
time t* = A I*/c, reflects neutrons of wavelength A at time t
given to first order by
A = A* + c' (t-t*)
= c' (t - t *)0
where c' is the gradient of the sine wave trace from the
crystal and is given by
c' w [(2d) 2 _a2
= 2wd co sOB(t)
AAc is the wavelength band reflected at a particular Bragg
angle and is given by AX = 2d cosGBAe 0 , where Ae0 is the
range of Bragg angles contributing to the reflection process
and is a measure of the divergence of the reflected beam.
A A M (= c A tM ) is the wavelength band transmitted by the
chopper whereas the overall wavelength band of neutrons
selected by a rotating crystal can be seen from figure 6 to be
c'
AX'M = AXM
c'/(c' - c) is the wavelength band gain factor of the crystal
over the chopper and for c' = c the selected band becomes very
large but not arbitrarily so inaamich as the argnents here are
based on a linearized treatment. A nmerical solution of the
problem is presented in section 4 where a realistic value of
the wavelength band reflected can be estimated for the case
when the two curves are tangential.
224
3.4 The burst time of the rotating crystal
The burst time of the rotating crystal determines the
resolution of the system and is equivalent to the chopper burst
time in determining the overall resolution of a chopper
spectrometer. The time width of the reflected neutron pulse
for a particular wavelength, caused by the inherent divergences
of the beam, is given by
AXAtc = = c
This is dependent on the incident and exit collimations a and a2
and on the mosaic spread $8of the crystal and is equal to A/w.
This factor can be identified with the scan time contribution
to the resolution of a reactor based rotating crystal
spectrometer which is given in [51 as:
AO 1 8a2 2 + 1 2 a22 + a2 28
c =w a +a 22 + 402
The approach is only valid provided that the scan time is
shorter than the moderator burst width, ie the pulsed source
appears to be a continuous source for the duration of the
reflection of a particular wavelength. In this case where coldneutrons are employed and collimations are t 10 then crystal
rotational frequencies above 25 Hz ensure its validity.
The pulse formed by the rotating crystal pulse shaper does not
appear to diverge from either the crystal or the moderator.
Rather the pulse appears to have been formed at a distance
L - m (c - ) downstream from the moderator, and at a time
t-*M'A * (c - c,) after the moderator pulse itself.

225
3.5 The Doppler Effect
Since the monochramator crystal is moving with respect to the
incident neutron beam the presence of the Doppler effect on the
reflection process must be assessed.
The Doppler effect serves, for a particular point in the
rotating crystal, to vary (i) the Bragg angles of incidence and
reflection in the laboratory frame (ii) the selected and
reflected wavelengths and (iii) the point in time of the
reflection, each with respect to the equivalent parameters for
the case of a stationary monochromator [6]. Considering the
whole volume of the crystal this causes a broadening of the
wave ength band selected, the time of reflection and the
divergence of the reflected neutron beam. However, in the
plane denoted AA in figure 7 (a) which is perpendicular to the
Bragg reflection planes and passes through the axis of
rotation, the Doppler effect does not manifest itself. In this
plane the direction of motion is perpendicular to the momentum
transfer vector in the reflection process and therefore the
Doppler effect becomes negligible. This can be achieved in
practice by using plate crystals in Laue transmission geometry
(figure 7 (b)).
The Doppler effect has been used to advantage in focussing
rotating crystal spectraneters on continuous neutron sources
[5,7] but it appears impossible to fulfill all these conditions
on a pulsed source where the incident beam is already
correlated in energy and time. In particular the focussing
conditions eployed in rotating crystal spectrometers require
that the crystal be rotated in the opposite sense to that
required for this application.
226
3.6 Practical Considerations
Because of geometrical and shielding constraints the tailored
neutron beam should emerge from the neutron source radially.
This can be achieved with the set-up shown in figure 8 (a)
where a second identical crystal is phased with the first to
reflect the neutron beam into the primary drift path of the
spectrometer. In practice there also requires to be a
translation of one crystal with respect to the other in order
to satisfy the Bragg conditions for all wavelengths.
A second method is for the two crystals to be mounted on a
single rotating table either with the first crystal located
centrally and the second eccentrically (figure 8 (b)) or with
both crystals positioned synetrically with respect to the axis
of rotation of the rotating table (figure 8 (c)).
In all cases the nation of the two crystals approximates well
the rotational and translational notions required to satisfy
the conditions described previously without significant
degradation by the Doppler effect.
4. A Numerical Solution
In order to assertain the possible gain of a rotating crystal over
a chopper we will ociupare the performance of the two systems
constrained to the design specifications of the IRIS quasielastic
spectrcmeter to be installed on the S4S [1].

227
4.1 The IRIS spectrometer
IRIS is a high resolution (1 u eV) quasielastic spectrometer.
It operates by defining a neutron pulse at 4.4 metres from the
moderator, allowing this pulse to disperse 40 metres to the
sample position, and analysing the scattered beam by back-
scattering from an array of silicon analyser crystals. In the
design of the IRIS spectrometer the beam definition is by a
12 usec burst time chopper and the analysing wavelength of the
silicon (111) reflections in backscattering is 6.28R.
The wavelength window transmitted by the chopper, taking the
half height positions as limits and a pulse width of 25 A , is
0.14R, corresponding to an equivalent energy band of 93 u eV.
For comparison the backacattering spectrometer IN10 at the ILL,
Grenoble has an energy band of 15 ueV ( 0.023) and a
resolution of ' 1 ueV.
The rotating crystal device with which to replace the chopper
must use monochromators with a Bragg cut off greater than
6.288. The obvious choice is graphite with a Bragg cut-off of
6.69R and a reflectivity for cold neutrons approaching 100%.
4.2 The application of graphite crystals
The maximum useful wavelength window ea is reflected when the
crystal locus and the pulse are tangential at 6.28. From
equation 2 there is a reciprocal relation between crystal
frequency and the distance of the crystal from the moderator.In order that periodic phasing occurs the crystal frequency
must bear an integral relationship to the pulsed source
frequency. For the SIS this frequency is 50Hz. Therefore one
can define a series of distances each corresponding to a

228
particular crystal frequency. The times of arrival t* of
6.28 neutrons (A *) at these distances can thus be determined
and, fran equation 1, the values of to*, the time origin ofthe crystal rotation. Therefore one has a limited choice of
distances at which to locate the crystal if one choses to
reflect the maximun wavelength band. These distances are
given in Table 1.
CrystalFrequency
(Hz)
Moderator-crystal distance(metres)
25 10.92
50 5.46
75 3.64
100 2.73
Table 1 The
arx
relationship between
frequency
crystal position
The intersection of a sine wave and a straight line has,
surprisingly, no analytical solution and so the equations have
been solved nunerically using the data in Table 1.
A graphical solution for 50 Hz is shown in figure 9. Therequired scan time of the crystal is a factor of ten less than
the imoderator pulse width and therefore for convenience in the
calculations of wavelength windows this width is asswed to be
negligible. On an expanded scale in figure 10 it can be seen
that one can increase the wavelength window substantially by

229
phasing the crystal to the leading edge of the pulse [figure
10 (b)] rather than its peak [figure 10 (a)]. The resulting
wavelength windows are given in Table 2 together with the
wavelength window which wold be obtained from a chopper in
the same position.
Wavelength Window (R)
Crystal
Frequency Crystal Chopper
(Hz)
Peak Centre Leading Edge
25 0.44 0.62 0.06
50 0.63 0.86 0.115
75 0.75 1.05 0.17
100 0.87 1.21 0.24
Table 2 The rsvelength windows trananitted by a chopper
and a rotating crystal assembly for the
conditions given in table 1.
These values, converted to uits of energy are shown in table
3 and plotted in figure 11 as a fwbction of frequency and
distance. For operation of the crystal at 50 Hz at a distance
of 5.46 ietres the energy window is estimated to be 567 u eV

230
when phased to the leading edge of the pulse. This can be
carpared with the value of 76 yeV for the choier at the same
distance and the window of 15 iaeV presently available on the
backscattering spectrcmeter at Grenoble.
Energy Window (p eV)Crystal
Frequency Crystal Jhopper(Hz)
Peak Centre Leading Edge
25 290 409 40
50 415 567 76
75 494 692 112
100 574 798 158
Table 3 The energy windows transmitted by a choper
and a rotating crystal assembly for the
conditions given in table 1.
This energy window does not exceed the overlap value for 40
metres which is ti 1 meV at 6.28R.
4.3 The scan time
For a frequency of 50 Hz a burst time of 12 sec can be
achieved by the ctice of appropriate values of the
collimation and mosaic qptead. As an exziple by setting
a - a2 - 8a69aequation 3 reduces to

231
At = =
and the value of the collimation and the crystal mosaic spread
required for a burst time of 12 isec is 18.3 minutes of arc
which is acceptable.
5. Conclusions
our assessment indicates that the selected wavelength band can be
substantially increased and the source pulse significantly
shortened by the use of a rotating crystal pulse shaper instead of
a mechanical chopper. This method has applications in the design
of high resolution cold neutron spectrcxeters and diffractcmeters
on accelerator based pulsed neutron sources. It could also have
applications for pulse shortening on pulsed reactors [8] and quasi-
pulsed accelerator based neutron sources [9] where the
intrinsically long pulse widths limit the resolution capabilities
of the source. The concept is presently being tested
experimentally [10] at the KDMS pulsed neutron source in Japan.
The ultimate pulse shortening device would be represented by a
crystal with a time varying angular velocity such that its trace in
A -t space would be a saw-tooth. This seems to be a practical
possibility in view of the modest frequency requirements for a
uniformly rotating crystal.

232
References
[1] Carlile C J. Rutherford Laboratory report (1982) RL-82-009
[2] Manning G. Contemporary Physics (1978) 19 505
[3] Windsor C G. Pulsed Neutron Scattering (1981)
Taylor & Francis Ltd (London)
[4] Carpenter J M. Nucl Insts & Meths (1977) 145 91
[5] Carlile C J and Ross D K. J Appl Cryst (1975) 8 292
[6] Buras B and Giebultowicz T. Acta Cryst (1972) A28 151
[7] Meister H and Weckermann B. Inelastic Scattering of
Neutrons in Solids & Liquids (1972) 713 IAEA (Vienna)
[8] Anan'ev V D et al. Instr & Exptl Techns (1977) 20 1245
[9] Bauer G S, Sebening H, Vetter J E and Willax H (1981)
Joint Julich/Karlsruhe report Jul Spec 113/KfK 3175
[10] Carpenter J M and Watanabe N. Private camminication
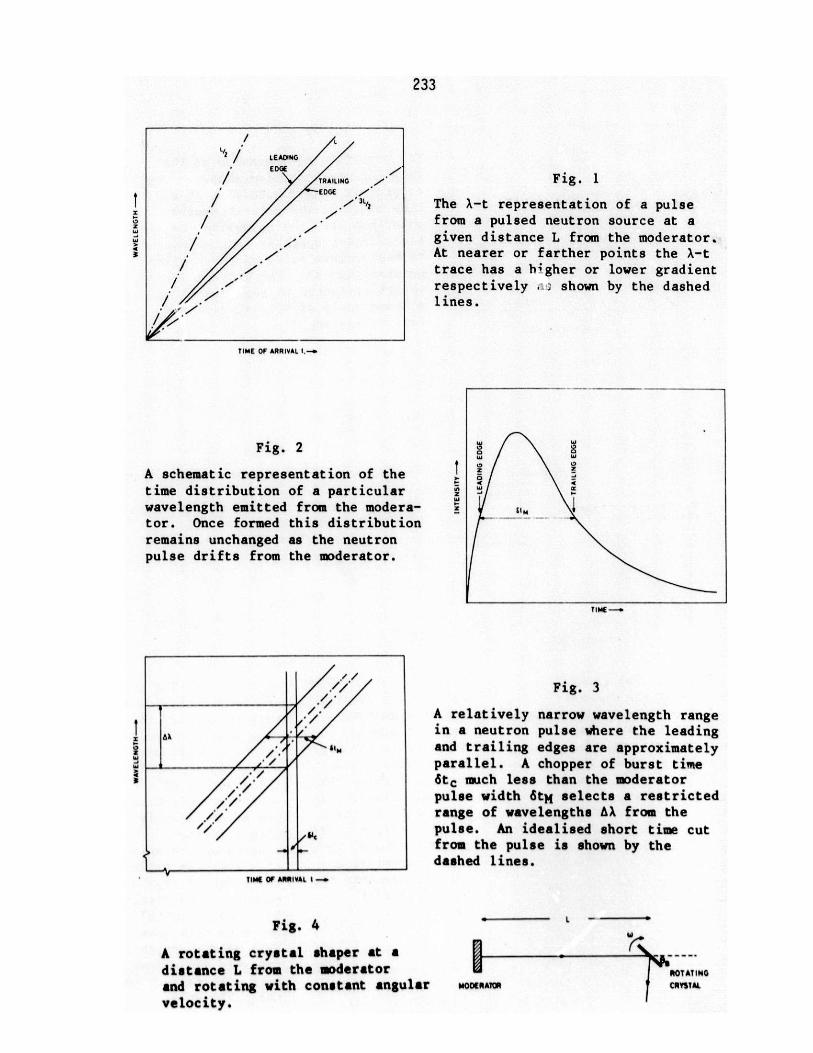
233
/ L
LEADING-EDGE
/ TRAILING f
EDGE 7
TIME OF ARRIVAL t.-3
Fig. 2
A schematic representation of thetime distribution of a particularwavelength emitted from the modera-tor. Once formed this distributionremains unchanged as the neutronpulse drifts from the moderator.
1
0Z
S7
7
K AiM
e: 'C
TIME Of ARRIVAL 1-
Fig. 4
A rotating crystal shaper at a
distance L from the moderatorand rotating with constant angular
velocity.
Fig. 3
A relatively narrow wavelength rangein a neutron pulse where the leadingand trailing edges are approximatelyparallel. A chopper of burst time6tc much less than the moderatorpulse width 6 tM selects a restrictedrange of wavelengths AA from thepulse. An idealised short time cutfrom the pulse is shown by thedashed lines.
ThROT ATINGCRYSTALMOORATOR
Fig. 1
The a-t representation of a pulsefrom a pulsed neutron source at agiven distance L from the moderator.At nearer or farther points the a-ttrace has a higher or lower gradientrespectively shown by the dashedlines.
W
oE-W Wf 0
4 :U. J
T IME-+
12
W
W
4
L

234
0 to
TIME OF ARRIVAL 1 --.
Fig. 5
The principle of operation of therotating crystal pulse shaper. Thecrystal is phased such that at atime t* after the poly-chromaticpulse has left the moderator itstrace in a-t space is tangentialto the neutron pulse at the desiredwavelength. X*. The maximum wave-length reflected by the crystal ata Bragg angle of 90' is twice thelattice spacing 2d.
A
LEADING EDGE AND
TRAILING EDGE OFTHE MODERATORPULSE
LOCUS OF ROTATINGCRTSTAL REFLECTIONS
" -- ,
TIME OF ARRIVAL I-
Fig. 6. The generalcase of the interac-tion of the rotatingcrystal pulse shaperwith the moderatorpulse in which thetraces in A-t spaceintersect.
A
('I
A /
([)
Fig. 7. (a) A cylin-drical crystal rotat-ing in a neutronbeam. Plane AA,parallel to the scat-tering vector andpassing through theaxis of rotation, isunaffected by theDoppler effect. (b)A plate crystal inLaue transmissiongeometry renders theDoppler effectnegligible.
(,)
(b)
(C
Fig. 8. (a) The use
of two rotating crys-tals to deflect thetime-shortened pulseinto the drift path
of the spectrometer.(b) A method ofachieving this by theuse of an assemblywith a crystalmounted on the axisof a rotating table
and a second crystalmounted eccentrical-ly. (c) As in (b)but with both crys-tals mounted eccen-trically and syme-
tric with respect tothe table axis.
I
=A
/_ -' '-
1z
iWJ
W
0 1,
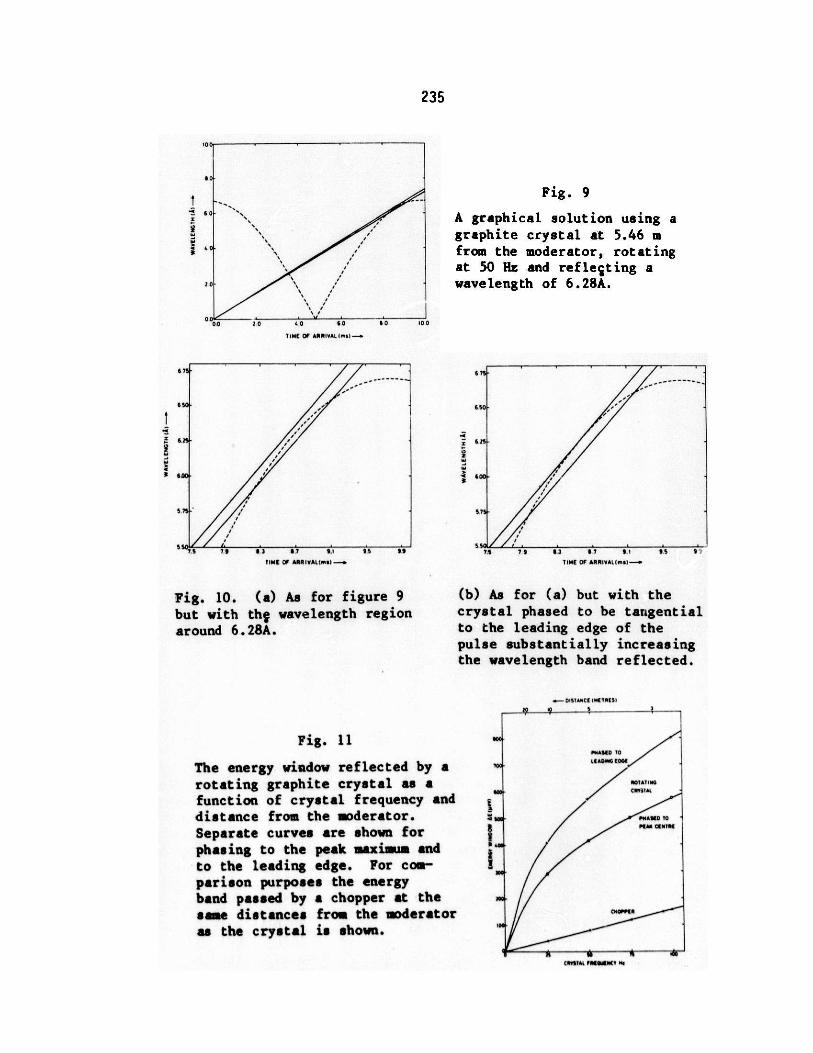
235
Fig. 9
A graphical solution using agraphite crystal at 5.46 mfrom the moderator, rotatingat 50 Hz and reflecting awavelength of 6.28A.
0--
*
* i
00 20 40 60 90 101
TIME OF ARRIVAL .1--.
67
6 5 --
6 50 -,
5 75 76 I3 B? 6., 65 66
TIME OF ARAIVALIP'S -.
Fig. 10. (a) As for figure 9but with tht wavelength regionaround 6.28A.
Fig. 11
The energy window re flec ted by arotat ing graphite crystal as afunction of crystal frequency anddistance from the uoderator.Separate curves are shown forphasing to the peak maximumm andto the leading edge. For com-parison purposes the energyband passed by a chopper at thesame distances from the woderatoras the crystal is shown.
4 600
76 79 3 67 9.1TIME OF ARRIVALIm4s-
95 9.
(b) As for (a) but with thecrystal phased to be tangentialto the leading edge of thepulse substantially increasingthe wavelength band reflected.
-DISTANCE IMERE51
boc
Faa
I
1
001110 ToLE&s0 100
ROTATNG
P4*6EV ToP601 CI 6131
C"Oppap
CRYSIA. P0901 WT
a
0
6
1
Z
W
W
3
0
//
ii
/
/
/
i
6 7
6 SD

236

237
ICANS-VI
INTERNATIONAL COLLABORATION ON ADVANCED NEUTRON SOURCE
June 27 - July 2, 1982
A LINEAR POSITION SENSITIVE NEUTRON DETECTOR USING
FIBRE OPTIC ENCODED SCINTILLATORS
P L Davidson and H WroeNeutron Division, Rutherford Appleton Laboratory
ABSTRACT
A linear position sensitive slow neutron detector with 3 mm resolution is
described. It uses the fibre optic coding principle in which the resolution
elements are separate pieces of lithium loaded glass scintillator each coupled
by means of flexible polymer optical fibres to a unique combination of 3 photo
multipliers (PM's) out of a bank of 12. A decoder circuit responds to a triple
coincidence between PM outputs and generates a 12 bit word which identifies the
scintillator element which stopped the incident neutron. Some details of the
construction and decoding electronics are given together with test results
obtained using a laboratory isotope neutron source and a monochomated, collimated
neutron beam from a reactor. The count rate in the absence of neutron sources-1
is 2-3 c min per element; the element to element variation in response to a
uniform flux is a few percent for 95% of the elements; the resolution as
measured by a 1 mm wide prode neutron beam is 3 un; the relative long term
stability is about 0.1% over 3 days and the detection efficiency measured by
comparison with an end windowed, high pressure gas counter is about 65% at a
neutron wavelength of 0.9A .
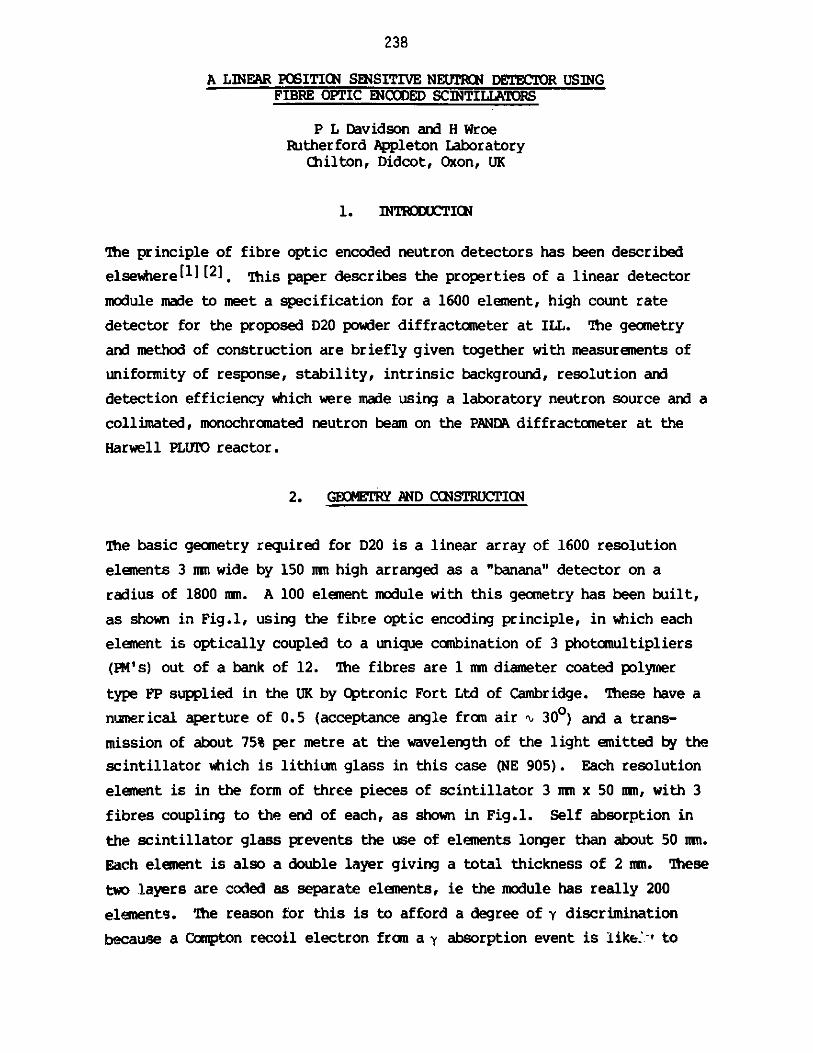
238
A LINEAR POSITION SENSITIVE NEUTIN DETECTOR USINGFIBRE OPTIC ENCODED SCINTILLATORS
P L Davidson and H WroeRutherford Appleton Laboratory
Chilton, Didcot, Oxon, UK
1. INTRODUCTION
The principle of fibre optic encoded neutron detectors has been described
elsewhere 11 [2], This paper describes the properties of a linear detector
module made to meet a specification for a 1600 element, high count rate
detector for the proposed D20 powder diffractometer at ILL. The geometry
and method of construction are briefly given together with measurements of
uniformity of response, stability, intrinsic background, resolution and
detection efficiency which were made using a laboratory neutron source and a
collimated, monochromated neutron beam on the PANDA diffractometer at the
Harwell PLUTO reactor.
2. GEOMETRY AND CCNSTRUCTIOM
The basic geometry required for D20 is a linear array of 1600 resolution
elements 3 m wide by 150 m high arranged as a "banana" detector on a
radius of 1800 m. A 100 element module with this geometry has been built,
as shown in Fig.l, using the fibre optic encoding principle, in which each
element is optically coupled to a unique combination of 3 photomultipliers
(PM's) out of a bank of 12. The fibres are 1 m diameter coated polymer
type FP supplied in the UK by Optronic Fort Ltd of Cambridge. These have a
numerical aperture of 0.5 (acceptance angle from air t 300) and a trans-
mission of about 75% per metre at the wavelength of the light emitted by the
scintillator which is lithium glass in this case (NE 905). Each resolution
element is in the form of three pieces of scintillator 3 m x 50 mm, with 3
fibres coupling to the end of each, as shown in Fig.l. Self absorption in
the scintillator glass prevents the use of elements longer than about 50 nm.
Each element is also a double layer giving a total thickness of 2 m. These
two layers are coded as separate elements, ie the module has really 200
elements. The reason for this is to afford a degree of y discrimination
because a Compton recoil electron from a y absorption event is like:.v to

239
penetrate more than one element and the electronic decoder rejects simul-
taneous counts from 2 elements. The dead space between elements is 0.1 un.
In this arrangement a neutron event is identified by a triple coincidence in
a bank of 12 PM's. These are EMI type 9843A, a low cost, 38 nu diameter
end-windowed tube with a good single photoelectron pulse height distribution
but moderate gain, and a typical operating voltage of 900 v. The PM's are
optically coupled to the bundles of fibres at an angle of 250 to minimise
the possibility of light being reflected from the PM back up the fibres, an
effect which is believed to cause an undesirable form of cross-talk between
elements. The number of elements coupled to each PM and to each combination
of 3 PM's are 55 and 136 respectively.
The whole assembly is contained in an aluminim alloy light-tight box with
the dimensions shown in Fig.1 which illustrates the compact nature of the
design, allowing shielding to be placed close to the scintillator.
3. ELECTNkICS
The principle of the decoder is illustrated in Fig.21 3 1 . The number of the
elements, A, can have a value between 1 and 200. X, Y and Z are the numbers
of the particular PM's in the triple coincidence which codes for A. With
the code used, for every pair of values of X and Y there is a number D such
that D = A-Z as shown in Fig.2 for the first few values of A. This property
is used in the circuit shown schematically in Fig.3. Each PM output is
passed to a Le Croy MVL100 amplifier/discriminator chip where pulse height
discrimination takes place at a level of about 1 MW. Logic pulses from
these chips are passed to a circuit which produces an output, the validity
signal, if 3 or more inputs are present within a time window of 200 ns.
This output starts the sequence controller. For a "good" event 3 and only 3
input lines will have signals. These are presented simultaneously, by a
special circuit, to a 16 bit pattern register. The sequence is stopped if
the number of bits latched is more than 3. Next a priority encoder reads,
in turn, the positions of the 3 set bits (X, Y and Z) and encodes them as 4
bit numbers in 3 registers, as shown. X and Y address a Read Only Memory
which contains the values of D. This process is performed in parallel with

240
the transfer of the third bit into the Z register. Finally, D is added to Z
to produce a 12 bit position descriptor. The decoder is capable of handling
16 PM's (ie 560 elements) but only 12 are used for the D20 module. The time
to decode is at present 400 ns but this time is being reduced to ti 100 ns
using faster circuits.
4. PERFORMANCE MEASUREMENTS
4.1 Uniformity of Response
The detector was exposed to a 5 curie Pu/Be laboratory neutron source
with a polyethylene moderator. The neutron flux at the detector
position is roughly 5 n cm- 2 s1. Fig.4 shows the result of a 6 h
count. The general shape of the plot is due to the distribution of
flux from the source which is not quite uniform. This is shown by the
fact that if the detector is moved the same shape appears on a dif-
ferent set of elements. The element to element variation is a few per
cent with one or two exceptions. The low count on the first element
is because this one has only 5 pieces of scintillator rather than 6.
4.2 Intrinsic Background
The detector was placed about 10 m from the laboratory source and
completely shielded by 30 an of B4C loaded plastic blocks. On an
overnight run the average count recorded was 0.5 c min-1 an2 . The
count per element varied between 2 and 3 c min- 1 . This compares to
about 10 c h 1 per element for an equivalent high pressure gascounter.
4.3 Stability
The relative long term stability from element to element was measured
using the laboratory source over a period of 3 days 6 h. A million
counts were accumulated in one particular element and the counts in
all other elements recorded at that time. The average counts in 10
elements near the centre of the detector was found and used to

241
normalise all subsequent counts which were taken every 2 hours. This
procedure does not reveal identical systematic changes in all the
elements. The results are shown in Fig.5 and are about what would be
expected from statistical variations. SubsequEnt absolute measure-
ments (simply recording the counts in a given time) show small
systematic changes in all elements which may be temperature effects.
The roam in which these measurements are made has large temperature
variations. It may be that a simple temperature stabilising system is
needed for the very best stability to be achieved.
4.4 Resolution
Measurements of the spatial resolution were carried out on the PANDA
powder diffractometer at the Harwell PLUIO reactor using the normal
specimen arm to move the D20 module behind a fixed vertical slit which
defined the test neutron beam. The "slit" was made up from boron
loaded resin shielding blocks, 30 an high separated by thin spacers.
To obtain a reasonable beam intensity, the full height of the PANDA
beam was used, viz about 40 mn, though the vertical intensity distri-
bution was highly non-uniform being sharply peaked. For scanning this
slit beam across the elements the detector module was mounted in the
normal orientation and to scan along the 150 m dimension it was
turned through 900.
Fig.6 shows the results of a scan across a few elements in the centre
of the detector. The full width at half height is 3 m as expected.
The level of the wings on either side of the response curves for each
element was reduced in later mesurements by reducing the intensity in
the beam with an extra lead collimator. (These measurements were all
done in the direct bean from the PANDA monochramator where the radia-
tion level measured by a 0-y monitor was 2r h).
Fig.7 shows the results of a scan along the 150 m dimension of an
element. The mall gaps between the three sections can be seen. The
detection efficiency falls slightly near the end of the scintillator
remote from the fibres due to attentuation of the light intensity in

242
the scintillator itself. It also falls at the fibre end because for a
small fraction of the neutron absorption events which occur very close
to one fibre light cannot enter the other two fibres directly since
the line of sight is outside the acceptance angle. These events may
not be counted. The latter effect could be eliminated by interposing
a short length of non-scintillating "stand-off" light guide between
the fibres and the scintillator, at the cost of increased complexity
during assembly.
4.5 Detection Efficiency
The detection efficiency was measured by comparing the response of the
detector to a 10 mn diameter beam with that of an end-windowed 3He
detector to the same beam. The 3He detector was an [MT type 434H10/-
SAX, 10 an long with a 4 mn thick alumina window. Sunning the counts
on these elements exposed to the beam, the total was 67% of the count
on the 3He detector with neutrons of wavelength 0.9 A. The stopping
power of 10 an of 3He at 5 atmospheres is 97%. Losses in the ceramic
window are approximately the same as those in the aluminium window of
the PSD plus the losses due to dead space between the elements. An
estimate of the absolute efficiency of the scintillator itself is thus
67 x .97 = 65%. The theoretical stopping power of 2 m of NE905 scin-
tillator for neutrons of wavelength 0.9 R is 78%, so there may be some
electronic losses. The efficiency scaled to a neutron wavelength of 1
is 69%.
5. OCNCWSIC4S
The edge coupled fibre optic coded PSD using lithium glass sintillator has
been demonstrated. It has good detection efficiency, stability and
resolution. The module has proved reliable and has been moved many times to
different neutron sources with no problems. The maximum countrate capabi-
lity has not yet been measured due to lack of an intense neutron beam but is
expected to meet the specificaion for the proposed D20 instrument at ILL,
viz: maximum countrte for one element - 105 c s1 with 10% dead time losses
and 5 x 10⁶ c S-1 for the whole 1600 element detector.
243
The cowftrate in the absence of neutrons is 2-3 c min~1 per element, con-
siderably higher than the equivalent gas counter but adequately low for high
countrate applications or for use on pulsed sources such as the &4S.
The constructional techniques are straightforward though tedious, the time
consuming element being the fixing of the scintillator tiles not making the
fibre optic encoder. The compact design allows large area detectors to be
made by stacking modules without the contaiment problems associated with
high pressure gas detectors.
ACNr ETS
The authors would like to thank Mr C Moreton-Smith, Mr E M Mott and Mr J C
Sutherland for their work on various aspects of the fibre optic coded
detector development.
REFERENCES
1. Rutherford Laboratory Annual Report 1977, p.53.
2. Position Sensitive Slow Neutron Detectors Using Fibre Optic Encoding,P L Davidson and H Wroe, Proc ICANS IV, Oct 1980. (KENS Report II,March 1981, pp.642-649).
3. 9S Time-of-Flight Electronics, P Wilde and R 5 Milborrow, InternalRAL Memorandun, June 1978.
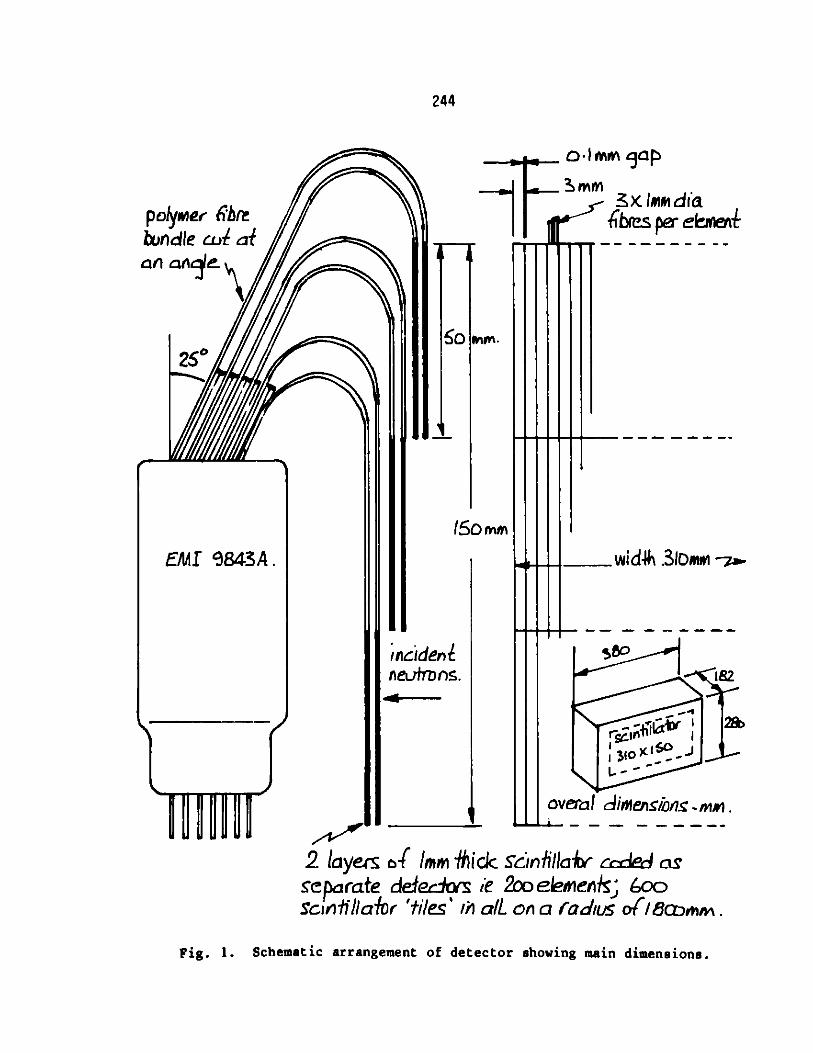
244
polyMer 6bre
bundle Lv afan n elj
25
15o mm
,ricidenneulrvAnS.
-1w
o.IMWIga
xlmmdiaIX I perspeane
Mr.
60 mm.
____ wid4 .SIOmwi -
ovetI dineln ion mu .
2 Layers o- In,,i lick so6nIjIayr c cded asseparate deedc te 2coeseneiik 600
ScgritIllaor 'tiles' ii alL on a (adis o(/8tmv.
Fig. 1. Schematic arrangement of detector showing main dimensions.
EMf 843A.
. Li

245
Phombahpier No. X Y Z D:No.A-A 1 2 3i4I5 7 QI roll 113- Si A-Z
2 xx x 1 2 3 -22 xx x 2 4 -2
3 > x .x . _2 5 -24 x -w f i _ -- i 2 (, -2$ x x , ix (__ _ 2 -7 -
6 F 2 8 -2
4 x x x --- o -
I I
'7 III)I ________4,__
Fig. 2
Illustrating the codeand parameters usedin decoding
i I I I I
Fig. 3
Schematic of decoder
1 2 3 lb- - -PMs (oly 2usedWrD23)-
- - - aAplr fif discnminaors - - - -
c'icbdenct i &rcvi p
16hepcftern neg ; sitr
-T
i2 bg adry
12 bit pFddim desornptar
I

246
I1- ,
c '
0 0 70 30 40 so 6OE0 20tioo
Fig. 4
Response to LaboratoryNeutron Source.
Fig. 5
Relative stability onlaboratory source;April 30-May 3 1982.
n* .<f-eie ino 4o using PM's o, 5, it; "ta "
ekMen o 52 Lrinq Pkf o1,10-,,10Ibrtzona Imes tre ent o"t7o charge
0 12 24 3 46 -o
5e 57 56 55 -- E&aWn No.wCAMin beam t Wrd x 40am A4r
- -11 ~I
5 .5BeiM p dItIon /.
Fig. 6
Horizontal scan acrosscentre of elements.
2
Fig. 7
Vertical scan alongan element.
1-4 so wdr. bam X r o 9 A
sonfIakr sane ns (acd bkyer a1i: Adar+)
I L II 1I11110 l
5
4
2
12
it
1.0
CanLMts
t( lD
0.s
0
~1~~--
axnts
x 104
i
5 A0 isBMW asii ia v%a

247
ICANS-VI
INTERNATIONAL COLLABORATION ON ADVANCED NEUTRON SOURCES
June 27 - July 2, 1982
THE IPNS DATA ACQUISITION SYSTEM
T. G. Worlton, R. K. Crawford,
J.R. Haumann, and R. Daly
Argonne National Laboratory
ABSTRACT
The IPNS Data Acquisition System (DAS) was designed to bereliable, flexible, and easy to use. It provides unique methodsof acquiring Time-of-Flight neutron scattering data and allowscollection, storage, display, and analysis of very large dataarrays with a minimum of user input. Data can be collected fromnormal detectors, linear position-sensitive detectors, and/orarea detectors. The data can be corrected for time-delays andcan be time-focussed before being binned. Corrections to be madeto the data and selection of inputs to be summed are entirelysoftware controlled, as are the time ranges and resolutions foreach detector element. Each system can be configured to collectdata into millions of channels. Maximum continuous data ratesare greater than 2000 counts/sec with full corrections, or 16000counts/sec for the simpler binning scheme used with areadetectors. Live displays of the data may be made as a functionof time, wavevector, wavelength, lattice spacing, or energy. Inmost cases the complete data analysis can be done on the DAS hostcomputer. The IPNS DAS became operational for four neutronscattering instruments in 1981 and has since been expanded toseven instruments.

248
1.0O INTROQUCT JQN
Scientific requirements for the Data Acquisition System forIPNS neutron scattering instruments were extensively analyzed in1978-79 before the DAS was designed. The first section belowsummarizes our assessment of the requirements at that time. Thisis followed by a section outlining the DAS design selected anddetailing specific hardware and software implementations. Thethird section summarizes our experience with the DAS sinceSummer, 1981 when it became operational. In this latter sectionwe discuss current performance levels and the extent to which theinitial requirements have been met, and comment on the extent towhich our initial assessment of requirements is still valid.
2.0 DESIGN REQUIREMENTS
2.1 atg Acgyistion Rgguipements
Although physically the time-of-flight instruments varyconsiderably, they all involve qualitatively similar dataacquisition and control requirements. Each of the instrumentsappears to the data acquisition system as a collection ofdetectors or detector elements, from which data are receivedconcurrently. Each event detected must be identified with aspace and time descriptor. The spatial descriptor corresponds tothe physical location of the detector, or detector element in thecase of position sensitive detectors, in the instrument. Thetime descriptor corresponds to the time of arrival of the eventat the detector with respect to the time of arrival of theprotons at the heavy metal target. The energy range and flightlength needed for some instruments mandate a time descriptor witha magnitude up to 0.1 seconds, while the precision desired forcalculational purposes for some instruments requires the timedescriptor to resolve 1/8 microsecond time increments. Table Ilists the expected data rates, histogram sizes, etc., estimatedin 1978 for the various instruments then being planned forinitial construction. Since not all of the instruments were thendefined, the hardware and software for the DAS had to be designedwith sufficient flexibility so that future expansion to includeadditional instruments would not require a major redesign effort.Future expansion of the number of detector elements or of thedata rates in existing instruments should also be easilyincorporated into the DAS. Also since only limited manpower wasavailable to implement the DAS within the allotted time and tomaintain it when it became operational, the system had to bedesigned with the intent of purchasing as much of the equipmentas possible from commercial vendors.
249
2.1.1 grouping And/or "Electronic-TimgFocussing' - The numbersderived for n, the histogram size, in Table I represent animmense amount of data for the user to handle for a singleexperiment. In many cases this degree of spatial resolution isnot required and the user would prefer to have a considerablycondensed data set with which to work. In particular, in manycases the outputs from a number of detectors could be combinedafter suitable manipulation, so that a single set of timechannels would represent that entire group of detectors. Thus itwas required that the DAS be capable of providing such suitablemanipulations "on-the-fly" on the raw data to allow such"grouping" of detectors. This concept has sometimes beenreferred to as "electronic time-focussing'. Since the groupingdesired differs from instrument to instrument (see below), andmay differ from experiment to experiment on a given instrument,the selected grouping scheme must be very flexible. Changing ofthe grouping must also be a relatively simple task. Any suchgrouping should not cause a degradation of the resolution as foras the variable of interest is concerned.
In the case of the powder diffractometers the desiredgrouping would combine detectors in such a way that eventscorresponding to the same d-spacing between crystalline planes inthe sample would be binned in the same channel. This diffractionby the sample is governed by Bragg's law W = 2d sin THETA, whereW is the neutron wavelength and THETA is one half the scatteringangle, and for the time-of-flight case this reduces to
d = (h/2m) (i/L sin THETA) (t - t0)
Here L is the-total source-sample-detector path length, t is thetime of detection of the neutron, and tO is the average time ofemission of the neutron from the source. This grouping tocombine events with the same values of d is best done beforehistogramming the data, as this calculation should be carried outwith a high degree of precision in t if the overall resolution ofthe instrument is not to be degraded by the grouping process.
In the case of the chopper spectrometers, the desiredgrouping would combine events corresponding to the same scatteredneutron energy Es. This is given by
Es a m Ls**2/21t - tl)**2
where Ls is the sample-detector distance, t is the time ofdetection of the neutron, and ti is the time the neutron was atthe sample. Iti is determined by the chopper open time and isthe same for all detectors.) For some IPNS instruments, detectorsare located at several values of Ls, so events with the some It -tI)/Ls must be combined.
250
2.2 Qhg Bp Rguirements
IPNS is a "user-oriented" facility with major emphasisplaced on satisfying the needs of an outside user community, manyof whom are only occasionally involved in neutron scattering.Thus the DAS must be designed to.interface with such "non-expert"users, and to minimize the amount of user input required to carryout routine operations. In order to support the fairly rigidscheduling inherent in a "user-oriented" facility, the DAS mustbe highly reliable, and must be reasonably immune to user errors.In particular, a user error or other failure on one instrumentshould not affect the operation of another instrument.
Display of live data is essential for each instrument if theusers are to interact effectively with their experiments.Effective displays of both area-detector and non-area-detectordata are also important if "non-expert" users are to be able tointerpret the unfamiliar time-of-flight data. Hard-copy plottingcapabilities should be readily accessible to each instrument.
It should be possible for the outside user to complete atleast a preliminary data reduction, and preferrably a final datareduction, while at the IPNS facility. This is particularlyimportant because the immense quantities of raw histogram dataand the form in which the data appear in the histogram often makeit difficult to ascertain the quality of the data or theappropriate course for further measurements until after the datareduction has been completed. An estimate of the computing powerrequired to provide this analysis capability was made by scalingfrom previous experience with time-of-flight instruments. Thisestimate indicated that the analysis of data from a fullcomplement of 12 instruments would require the equivalent of 2-3hours of computing time on the IBM 370/195 system at the ArgonneCentral Computer Facility, per day of operation of the IPNSfacility. Sufficient on-line disk storage must be available tohandle all the data sets currently involved in analysis for eachinstrument. The histogram size and time/data-set data in Table Iwere used in estimating storage requirements. With the exceptionof the SCD, these requirements amount to a few Mbytes perinstrument.
Requirements for control and monitoring which can beforeseen include monitoring and/or control of chopper-sourcephasing, driving of stepping motors to change sample or detectororientations, and monitoring and/or control of experimentalenvironment parameters leg - temperature, pressure, magneticfield, etc.).

251
3.0 JP DAS DESIGN AND IMPLEMENTATION
To fulfill the DAS requirements it was decided to provideeach instrument with a number of processors dedicated to specifictasks. The tasks were divided into five main categories:
1. Data acquisition and histogramming2. User interface and instrument control3. Video display of data4. Data analysis and bulk storage5. Communication between the various processors
Figure 1 contains a block diagram of the distributed processorconfiguration used for the data acquisition system at IPNS. Theseparate subsystems are discussed in turn below.
3.1 Qgg guisition
3.1.1 QCMAC Hardware - CAMAC was chosen to provide a flexible,modular, standardized system in which to implement thespecial-purpose modules required to encode the data. The CAMACsystem developed for the IPNS instruments is shown in block formin Figure 2. The time-of-flight discriminator modules used inthe system have the common feature of interfacing to the CAMACdataway through a First-In First-Out (FIFO) buffer memory. Thefunction of these FIFO's is to acquire data at high instantaneousrates and to allow faster transfer of the data from the CAMACsystem to the Multibus system by the use of Direct Memory Access(DMA) block transfers of the data.
In addition to the crate controller and time-of-flightdiscriminator moduless, two specialized modules are required ineach system. These are the Polling module and the Clock module.This leaves 20 slots free for discriminator modules in eachcrate.
The Polling module scans the L lines from the discriminatormodules within a given CAMAC crate to determine which modulescontain data in their FIFO buffers. When a module is found whichcontains date. the polling module passes an 8-bit byte to aparallel I/O port on the Multibus. This port in turn interruptsthe Z8001 microcomputer and supplies it with the 8-bit byte,three bits identifying the crite and five bits indicating themodule number within the crate. For some of the instruments itis necessary to have more than one CAMAC crate filled withdiscriminator modules. For this reason the polling module isdesigned to fill the role of either master or slave. As a slaveunit the module will scan only its crate, while in the mastermode it also scans the slave units in other crates.
252
Only one master clock module is used for each instrumentcomputer system. This module generates an 8 MHz clock, whichwill result in a clock start time uncertainty of 125 ns, and willproduce digitized times in 125 ns increments. Upon receipt of at0 pulse (pulse indicating neutron production at the source) themodule produces a 'SYNC' pulse which is used by the discriminatormodules as a time digitizer reset pulse. The number of t0 pulsesreceived while data acquisition is active are counted by a 24 bitcounter. Upon command from the CAMAC controller, or fromexternal hardware command, the clock module issues an 'INHIBIT'signal, synchronized to the t0 pulse. Upon receipt of the'INHIBIT' signal all discriminator modules stop data acquisition.The clock module also has provisions for allowing dataacquisition only within a programmable time window after each t0pulse.
The CAMAC Time-of-Flight Discriminator Modules which areused for standard and linear position sensitive detectors produceoutput formats which are the same for both types of detectors,although the detector signal is digitized differently for eachdetector type. For the standard detectors, each discriminatormodule can handle inputs from 8 independent detectors. Eachinput has its own programmable lower discriminator level, and all8 have a common, programmable upper discriminator level. When ananalog pulse on one of the inputs falls within the discriminatorlevels, a 20-bit time word is combined with 3 bits of inputidentification, and the resulting 23 bits is loaded into a FIFObuffer in the module. The buffer can store sixteen 24-bit words.When this FIFO contains 8 data words, the module sets a CAMAC LAMindicating that the module requires service. The 24th bit inthese words i. used to indicate FIFO overflow. Data acquisitioncan be gated on or off at all modules by an 'INHIBIT' signalgenerated in the clock module.
The discriminator modules for linear-position-sensitivedetectors produce a 20-bit time word, and I bit to indicate FIFOoverflow. The 3-bit input identification now contains detectorposition information. This module also has a programmable windowdiscriminator. In addition, it has position encoding circuitrywhich enables it to digitize the position information for one ortwo linear-position-sensitive detectors depending upon theresolution desired. The resolution is selectable to either 1part in 4 or 1 part in 8. With the lower resolution, twodetectors can be serviced, with the upper bit of the 3-bitposition code indicating from which detector the data originated.
For area-position-sensitive detectors (initially presentonly on the SCD instrument) the role of the discriminator moduleis filled in part by an x-y position digitizer at the detector,in part by a time digitizer module, and in part by one or more256 word x 16 bit commercial CAMAC FIFO modules (see Figure 2).The x-y position digitizer provides 8 bits of x and 8 bits of yposition in digital form. The time digitizer module latches thex-y position data, produces a 16-bit time word, and multiplexes
253
and strobes these into the FIFO module. The FIFO module(s) alsoset a CAMAC LAM when they are filled to a selected level.
3.1.2 Multibus Hardware - The MULTIBUS (Trademark of IntelCorp.) was chosen as the system bus for the data acquisitioncomputer because of the large array of support products availablefor this bus structure. The data acquisition Multibus system ismade up of a Multibus crate containing four boards plus memory.The four boards are:
1. A Z8001-based single board computer2. An interface to the CAMAC controller3. An interface to the communications processor4. An I/O board containing both serial and parallel I/O
ports
The communications interface board is discussed below as part ofthe PDP-11 to Multibus link. The two interface boards, alongwith the CAMAC modules noted above, are the only custom designedhardware in the system. Memory boards with capacities cf 128Kbytes and 512 Kbytes are used, with the amount of memorycontained in each system being dependent on the instrument. EachMultibus system has at least 128 Kbytes of this RAM memory, whichis used for both program and data storage.
The data acquisition computer uses a 16-bit Z8001microprocessor. This microprocessor was chosen mainly for itsability to directly access the large amounts of memory needed forbuilding the space-time histograms which can contain severalmillion elements. The data acquisition computer is a Multibuscompatible product built by Central Data Corporation. Thiscomputer board provides 24 memory address lines to allowaddressing of up to 16 Mbytes of memory, which is sufficient forall instruments currently envisioned. It also contains a 2K wordPROM monitor which on power-up is written into and executed fromRAM. This monitor provides on-line debug capabilities for thedata acquisition programs.
3.1.3 9ftwgr . An &9 Foy - The data acquisition programs forthe Z8001 are written and assembled using the PDP-11 userinterface computer as a program development system. Thehistogramming programs are basically table-driven routines toallow flexibility in the formatting of the histograms. Thesetables are generated by routines on the PDP-11 when the user setsup the run, and are then down loaded to the Z8001 at run time.
During a data acquisition run, the Z8001 works onhistogramming the data except when the CAMAC Polling modulecauses an interrupt. Upon receipt of this interrupt, the Z8001programs the CAMAC controller for a DMA transfer of the data from

254
the FIFO in the Dibcriminator module requesting service to a 2Kbyte software-controlled circular buffer in the processor datamemory. This block of data is then given a header containing thenumber of bytes in the block and the crate and slot number of themodule from which the data was read. After this the Z8001 goesback to building histograms from this data-
Most of the instruments utilize only standard and/orlinear-position-sensitive detectors. The algorithm developed forhistogramming in this case emphasizes flexibility, sincedata-rate considerations indicate that speed is not of overridingimportance. In this algorithm the fields are organized as 'timefields', each of which contains the histogram locations to holdthe data from one group of detectors for one histogram. Thehistogram structure is controlled by four binning tables (DMAP,TTYPE, TSHIFT, TSCALE) which contain the information required bythe Z8001 algorithm in order for it to properly histogram thedata.
In this case the raw data stored in a block in the raw datacircular buffer is organized as 24 bit words which contain 3 bitsof input ID along with the time information. These 3 bits arecombined with the crate and module number stored in the blockheader to make up the detector element identification number ID.A detector mapping table DMAP is used to determine whichhistograms an event with a given ID should be binned in, and foreach such histogram DMAP will map ID to a memory address TSTRTfor the start of the corresponding time field in histogrammemory. Mapping more than one detector to the same time fieldresults in 'grouping' of detectors.
The fundamental time coordinate is the elapsed time T in0.125 microsecond clock cycles, which is encoded as a 20-bitnumber within the 24-bit raw data word. When"electronic-time-focussing" is desired, a pseudotime T* iscalculated from T using the algorithm
T* = (T - CD - ED) + KSC*(T - CD - ED)/2**15
and this T* is then used in determining the mapping within thistime field. The parameter CD is a constant time shift parameter,while ED is a time shift parameter which is a function of T only.The parameter KSC is found in the TSCALE table (addressed usingID) while the parameter ED is found in the TSHIFT table(addressed using a scaled T). This format for T* permitsaccommodation to the grouping equations simply by changing thecontents of the TSCALE and TSHIFT tables.
The DMAP table also links each ID to an index ITYPE whichpoints to a location in the TTYPE table. This table contains thedescriptors which determine how each time field is organized (eg- range of pseudotime values included, parameters to determinechannel widths, etc.). If ITYPE = 0 input from that detector IDwill not be binned, so any given detector can be easily 'turned

255
off" by software.
In this way a completed histogram is a two-dimensional arrayof the form I(p,t), where "p" is the position of the detector and"t" is the time of arrival of the event at that position. Thissoftware also has the unique capability of storing a given eventmore than once. This is equivalent to having paralleltime-of-flight analyzers. This multiple histogramming allows thedata to be collected with and without scaling or shiftingcorrections. It also permits collection of high-resolution dataover special time regions. This histogramming software isdesigned so that various options in time scaling ane limitchecking can be eliminated to allow acquisition of data at higheraverage rates.
A second algorithm was developed to histogram data fromarea-position-sensitive detectors (initially used only for theSCD). In this case the CAMAC modules encode each event as 16time-bits and 16 position-bits. The algorithm developed for thiscase emphasizes histogramming speed rather than flexibility,since data rates are high and the expected uses of the data donot require wide variations in histogram mapping. This algorithmis also table-driven, but the tables used in this case are muchlarger and provide a direct mapping of the 16-bit raw-time wordand the 16-bit raw-position word. The histogram is organized in'position fields' rather than time fields, as this format isbetter matched to the data display and analysis'requirements.
The 16-bit time word is used in addressing a look-up table(192 Kbytes long) which maps to the 24-bit address PSTRT for thestart of the corresponding position field. The 16-bit positionword is used in addressing a word look-up table (128 Kbytes long)to find the 16-bit offset from PSTRT to the channel for thisevent. In the initial implementation the position and timelook-up tables are independent and each event can be binned inonly one histogram. Also, at least initially, position mappingis taken to be uniform over the face of the detector, althoughthis is not a fundamental requirement.
The software is designed so that both types of detectors canbe handled (using both algorithms and both types of parametertables) concurrently by the Z8001. This permits, for example,the operation of standard beam monitor detectors concurrentlywith an area-position-sensitive detector.
3.2 V!g; I cj;f4S!
The user interface computer is a DEC PDP 11/34 containing256 Kbytes of memory, two RL-02 10 Mbyte disk drives, a VT-100raster scan video terminal, and an LA-120 hard copy terminal.This computer runs under DEC's RSX 11/M multi-tasking operatingsystem. It also contains an a direct Unibus interface to a
256
second CAMAC controller which is used to control various devicesassociated with the instrument, such as stepping motors, samplechangers, or shutters.
The instrument computer system configuration chosen, withthe Z8001 microcomputer dedicated to data acquisition, provides asystem capable of executing a variety of data-histogrammingalgorithms while leaving the PDP 11/34 minicomputer free to serveas a powerful and flexible interface to the user. Allcommunication between the user and the data acquisition systemtakes place through the PDP-11 computer via the VT-100 terminal.The commands are executed under control of the RSX MonitorConsole Routine (MCRJ or a special command interpreter (PNS).
All data collection is organized around the concept of arun. All parameters defining a particular run, including thehistograr.ming tables discussed above, are set up by the PDP-11 ina run file header, and the histogrammed data is later appended tothis header to make a complete run file which contains theinformation necessary for subsequent data analysis. Usercommands have been implemented on the PDP-11 to set uphistogramming tables tailored to a specific experiment; toschedule, start, and stop data acquisition for a run or a seriesof runs; and to print or display data or other run informationin various formats on the graphics display terminal. Additionalcommands are available for diagnostic and maintenance purposes.
Set up of the run file headers has been kept as simple aspossible consistent with the wide flexibility offered. As muchof this information as possible is obtained automatically. Ifthe method of data collection is the same as in a previous run,the previous run may be used as a "Default Run" which furnishesall information except the title and user name. Even if no"Default Run" is used to set up histogramming, default values ofall input except the input numbers of the detectors to be binnedare supplied. However the user has the option of selectingminimum and maximum times of interest and the resolution desired,as well as time-focussing parameters for each detector. Ifdesired, the channel width may be doubled after a given number ofchannels to allow compression of the lower energy portion of thespectrum where there are not many peaks.
When a run is started, the histogramming algorithm isdownloaded to the Multibus system and the tables from theselected run file are then downloaded to that system as well.The PDP-11 then issues a 'start' command to the Z8001 to initiateindependent data acquisition. The layout of Multibus Memoryafter loading the data acquisition program and the histogrammingtables is illustrated for instruments without area detectors inFig. 3. An area of Multibus Memory has been set aside for theraw data table, and other areas have been reserved for FIFOoverflows and for channel count overflows. When the count in achannel exceeds the maximum for a 16 bit word (655351 theacquisition program automatically stores the address of the

257
overflowing channel in the overflow buffer and these channelcounts are corrected in the analysis phase.
In addition to the setup of histogramming tables, the PDP-11is also used extensively for graphics displays (see Displaysection below), for backing up the data to disk, for userinitiated data printouts, for monitoring the progress of the dataacquisition process, etc.
3.3 PDP-ll To Multibus Link
The PDP-11 to Multibus link is implemented with two boards,a Unibus Micro Controller (UMC) board from Associated ComputerConsultants on the PDP-11 Unibus, and a custom Multibus interfaceboard on each Multibus. The UMC board can control seven Multibusinterfaces, thus allowing each PDP-11 computer to link with up toseven independent Multibus systems.
The UMC provides a Z80 micro-computer with compatible Z80peripheral chips together with Unibus DMA circuitry, 32single-byte registers accessible from the Z80 and PDP-11, and aprogrammable PDP-11 interrupt vector. The local Z80 bus from theUMC is extended via a flat cable to interface boards in eachlinked Multibus. Each Multibus interface provides abidirectional 64 word FIFO thru which data flows asynchronouslybetween the local Z80 bus and the Multibu:3, DMA control logic andaddressing registers for Multibus to FIFO transfers, 2single-byte registers accessible as I/O ports from the Z80 andMultibus, and controls to reset the Multibus and generate a lowpriority interrupt on the Multibus.
Each new 24-bit Multibus address is generated by hardwareaddition of a 24-bit increment register and a 24-bit addressregister. This addressing scheme allows the DMA transfer ofnon-contiguous data and is used, for instance, to transfer timeslices through space-time descriptor organized histograms. Thedata path for large block transfers between Multibus and UNIBUSis, MULTIBUS to FIFO to Z80-DMA to UNIBUS, and is handledentirely in hardware. The Z80 CPU is used mainly to accept I/Oparameters from the PDP-11 in order to set up MULTIBUS and UNIBUSaddress registers and to program the Z80-DMA. The Z80 CPU alsouses shared registers and interrupts as mechanisms to handle DMAinitiations and completion sequences.
Besides transferring large data blocks directly between theUnibus and Multibus the communication processor system alsopasses short command blocks to the Z8001 from PDP-11 tasks. Thecommand and the parameters needed to complete the command arelocated in the Subfunction byte and 6 Parameter words which areincluded in every PDP-11 RSX I/O request fi.e. - the 010executive directive). The Z80 passes these command blocks tofixed Multibus locations and interrupts the Z8001 at a low

258
priority. The PDP-11 I/O completion then awaits theinterpretation and implementation of this command block by theZ8001. The communication processor can handle up to 32 separatePDP-11 I/O channels. Since the PDP-11 needs only one channel perMultibus for sending a command block, all Multibus systemsattached to the PDP-11 may be executing commands simultaneously.
3.4 Disply
The display processor is a VS11 bit slice processor producedby the Computer Special systems group of DEC, which provides forraster graphics display with a resolution of 512 x 512 pixelswith up to 16 colors or intensities.
Instructions and graphic data are placed in a "display file"in the PDP-11 memory, where they are accessed in a DMA operationby the VS11 image processor. Programming of graphic displaysconsists of setting up the appropriate display file which can beupdated concurrently with its access by the VS11 image processor.The VS11 operation is synchronized to the PDP-11 software, wherenecessary, by the appropriate use of "start" and "stop" commandsto the VS11. Otherwise the VS11 and PDP-11 operations areasynchronous.
The existence of the "point" and "vector" graphic modesmakes it relatively simple to interface the VS11 to standard"pen-plotting" graphics software packages. We have interfacedthe VS11 instruction set to such a pen-plotting software graphicspackage, and this package is used for display of histogram filesstored on disk. However 'live" data updating is programmeddirectly with the VS11 instruction set to achieve greaterplotting speed. The "bitmap" graphic plotting mode is used for"density plot" representations of two-dimensional slices throughhistograms.
The display of "live" histogram data being accumulated inthe Multibus memory involves the concurrent and asynchronousoperation of the four front end processors. The PDP-11determines, on the basis of user input, which portion of thehistogram is to be displayed. The communication processorsupervises the transferring of the histogram data to a staticcommon region in the PDP-11 memory several times per second.Continuous-loop applicat! ns software operates on the data inthis static common, performing scaling, change of units, etc.,and then places this data in proper format in a display file.The display processor in the VS11 cycles through the display fileand converts the data to pixel information and stores it in itsimage memory. This software produces. rapid display updates whichprovide a good sense of the "live" nature of the data, as it isbeing histogrammed by the Z8001.

259
3.5 Data Analysis
A DEC VAX 11/780 is used for complex data analysis andshared I/O with all instrument systems. This data analysiscomputer includes 2 Mbytes of RAM memory, a Floating PointAccelerator, a 516 Mbyte disk IRP07), a 67 Mbyte disk (RM03), two10 Mbyte (RL02) disks, a 800/1600 bpi magnetic tape drive, aVersatec printer-plotter, a 300 1pm Printronix line printer,modems, a number of VT-100 display terminals, and a VS11 graphicsdisplay processor with a color monitor.
This data analysis computer is meant to receive data fromthe various instrument computers via the communication interfaceor by transferring RL02 disk packs from the front-end computers.The data is then either stored or analyzed by routines providedby the user. After reduction the data can be plotted and/orprinted by the various output devices connected to the VAX or itcan be shipped back to the instrument system for display orfurther manipulation.
3.6 PDP 11/34-VAX Link
A serial high speed synchronous link is being developedbetween the PDP-11 front end computers and the VAX. Its mainfunction will be to move large data files between the twoprocessors. Its operation is not essential to data acquisitionbut will be useful in transferring data to the VAX for analysis.This transport is currently accomplished by moving the RL02 datadisk from the front-end computer to the VAX. A low-speed seriallink allows users to call up the VAX and log on to theirfront-end computer to check on the status of their experiment.The hardware for the high-speed serial link is in place and thesoftware is now under development.
4.0 NORFOMAN- LNMA Y
The IPNS DAS became operational for four of the first fiveinstruments in Summer, 1981. Construction of the fifth of theproposed initial instruments was completed in 1982, and it andtwo other instruments have been added to the DAS since it firstbecame operational. Our experience with some of the variousaspects of the system is outlined in the separate sections below.
260
4.1 xagonI9
During 1981-82, the software on the PDP-11 computers and inthe PDP-11 to Multibus interface computer 1Z80) was modified toallow each PDP-11 computer to serve more than one instrument. Inthis implementation, each instrument still has its ownindependent CAMAC-Multibus Data Acquisition system, but sharesthe user interface, disk backup, graphics display, and link tohost, with one or more additinal instruments. In this mannerthe original five PDP-11 computer systems and VS11 graphicssystems now support seven instruments, with an eighth soon to beadded. The ease with which this expansion was performedindicates that the goals of flexibility and expandability havebeen well met. However, although this sharing of PDP-11computers has resulted in significant cost savings, it hassomewhat compromized the initial goal of complete independence ofinstruments. It is thus not as satisfactory a means of expansionas would be a simple expansion by including more of theindependent complete instrument computer systems.
4.2 Dgt Rates
The initially established goals for instantaneous data rateshave been achieved. The pulse-pair resolution for pulses in thesame discriminator module is approximately 2 microseconds, whilethere is no interference whatsoever between pulses in differentdiscriminator modules. This seems to be quite adequate for alldata acquisition situations seen to date. However, for the areadetectors where position encoding is done as part of the detectorrather than as part of the DAS, pulse-pair resolution is of theorder of 7 microseconds, and this does cause a dead-time problem.
The initially established goals for time-averaged data rateshave been exceeded. The DAS can handle rates as high as 3000events per second for non-area-detector instruments, and rates ofup to 16,000 events per second for areo-detector instruments.This time-averaged rate has so far proved adequate forarea-detectors. However, in the case of non-area-detectorinstruments the users immediately found it to be "essential" tomake full use of the very large time-of-flight range permitted bythe system. This has caused the data rates from theseinstruments (particularly powder diffractometers) to be muchhigher than was anticipated on the basis of previous experiencewith similar earlier instruments (which were typically restrictedto under 10,000 channels total for data). Data rates for theseinstruments are thus pressing against the limits imposed by theDAS. To alleviate this problem, a faster single-board-computerbased on the Z8001 microprocessor is being designed. The use ofmultiple Z8001 processors on each Multibus is another possibilitywhich was included in the original system architecture, and thisis contemplated as a possible longer-term sol) tion. With boththese improvements a factor of ten increase i.. time-averaged data

261
rate should be achievable while still using the same flexiblehistogramming algorithm.
4.3 Histogram Sizes
The non-area-detector instruments currently haveapproximately 150 detectors each. In the initial calbration andtesting of these instruments extensive use was made of theability to concurrently collect and histogram data from eachdetector separately. The multiple-histogram option was also usedextensively in this calibration/testing phase, and has been usedto a lesser extent in more recent applications. Histograms formultiple histograms) in excess of 200,000 channels have beencollected on some of the non-area-detector instruments.(Multibus memory boards have on occasion been shifted betweeninstruments to allow larger-than-originally-anticipatedhistograms. This is a simple process requiring only a fewminutes.) In routine operation these instruments typically use20,000 to 100,000 channels per run. The Single CrystalDiffractometer, which uses an area-detector, routinely collectshistograms of about 800,000 channels.
4.4 Electronic Time-Focussing
This concept has worked extremely well. The flexibilityinherent in the use of the table-driven focussing algorithm wasmost vividly demonstrated when the chopper was removed from oneof the chopper spectrometers and a time-focussed powderdiffraction spectrum was collected in that instrument from thesame sample that was used in the inelastic scatteringmeasurements. This required only the setup of a new run with theproper focussing parameters. In other tests on the powderdiffractometers, detector banks at various angles (includingangles down to about 15 degrees) have been focussed with nodifficulty.
4.5 Qisljgy
The VS11 display has worked very well for our purposes.Especially important has been the speed of this ,display, whichmakes possible "live' updates of 4000 point histograms. Equally,if not more, important has been the density plotting capabilitywhich has been extremely useful for representing area-detectordata.

262
4.6 Qg t Analysis
The presence and availability of the VAX host computer aspart of the DAS has been extremely important, especially insofaras the experiments for outside users are concerned. Extensivedata analysis software for the various instruments has veendeveloped for the VAX by the Instrument Scientists, and this hasenabled outside users to begin data analysis immediately afterthey have completed data acquisition, and to leave Argonne withdata that have already been at least partially analyzed. Thiscomputer is quite heavily used, although the CPU is not yetsaturated. It appears that our initial estimate that thiscomputer would be nearly saturated when a full complement ofapproximately 12 instruments was operational at IPNS is stillvalid.

263
Table 1
instrument GPPD SEPD SCD LRMECS HRMECS
Detectorsb
SD 160 -120 2 -150 '200LPSD(Res) "20(8) -100((4) -200(4)APSD (Res) 1(256x256)
n" -320 -120 -65000 "550 -1000
nt c 8000 8000 256 500 1000
n - nd*l n2.6K 1M 16M 0.3 Iin
[tot (cts/sec)c 1500 -1000 -20000 -3000 "1000t ime-avg
I tantaneous(cts/sec)c '10 5 .o1 .-o .i1 6 105
Typical timed 1 day 1 day 4 hrs. 5 days 1 daysto obtain one histogram
a GPPD - General Purpose Powder Diffractometer; SEPD Special Environment Powder Diffractometer;SCD - Single Crystal Diffractometer; LRHECS - Low Resolution Medium Energy Chopper Spectrometer;HRMECS - High Resolution Medium Energy Chopper Spectrometer.
b SD - Standard 3He-filled gas proportional counters; SPSD - 3He filled linear position-sensitive gasproportional counters; APSD - area position-sensitive detector (3He proportional counter orscintillation counter); Res - number of detector elements per detector.
C Worst case estimate.
d Estimated from experience - Includes experiment setup time.
TO OTHERMULTI"S
- SYSTES-----------------------------------
IGeH sEE HIGH SPEED
. D SERIALL UNKSj7N.. ,TO OTHER- -UKC80 INSTRUMENS
Z-4=1 (COWUNICA110N)MULMBUB POP U/3
D1(USER INTERFACE)(DATA ACOIAS M) EXPNESEALUNE EXPANDER
COMMUNICATIONS)
SERI~..VAX 1V780WARE VT-oo (ANALYSIS)
Fig. 1. A block diagram showing one instru-ment computer system (within dotted
lines) and its link to the analysis
computer.
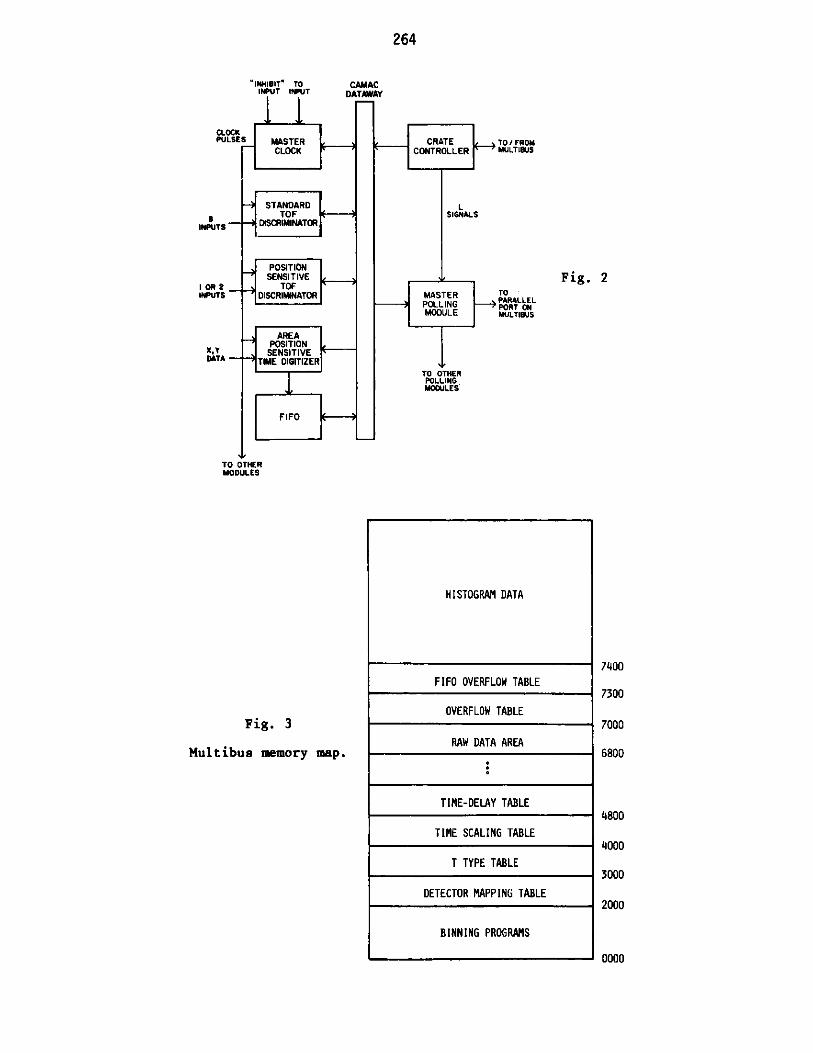
264
IN
"INHIBIT a TO
CLOCKPULSES MASTER
CLOCK
STANDARDTOF
UTS DISCRIMINATOR
I OR 2 _
INPUTS
xyDATA -
'4,TO OTHERMODULES
Fig. 3
Multibus memory map.
CAMACDATAWAY
CRATE TO / FROMCONTROLLER -4 MULTISUS
-4 SIGNALS
MA STER TOPOLLING PARALLELPOLLING PORT ONMODULE MULTIBUS
MODULES
Fig. 2
7400
7300
7000
6800
4800
4000
3000
2000
0000
HISTOGRAM DATA
FIFO OVERFLOW TABLE
OVERFLOW TABLE
RAW DATA AREA
TIME-DELAY TABLE
TIME SCALING TABLE
T TYPE TABLE
DETECTOR MAPPING TABLE
BINNING PROGRAMS
POSITION
SENSITIVE
TOF
DISCRIMINATOR
AREA
POSITIONSENSITIVE
TIME DIGITIZER
FIFO

265
ICANS-VI
INTERNATIONAL COLLABORATION ON ADVANCED NEUTRON SOURCES
June 27 - July 2, 1982
TESTS OF A RESONANCE DETECTOR SPECTROMETER
FOR ELECTRON-VOLT SPECTROSCOPY
J. M. Carpenter*
N. Watanabe
S. Ikeda
Y. Masuda
S. Sato
Japanese Laboratory for High Energy Physics (KEK),
Oho-Machi, Tsukuba-Gun, Ibaraki-Ken, 305 Japan
ABSTRACT
We have tested a resonance detector spectometer at the KENS neutron
source, using 181Ta, 121Sb and 149Sm absorbers and bismuth germanate (BGO),
Nal and plastic scintillators. In the process we uncovered and solved
numerous background problems, and discovered a time-focussing principle.
We measured the scattering from a number of materials and so far have analyzed
and present results for bismuth and graphite. Tests of cooled absorbers have
indicated that resolution of 70 meV is possible with '81Ta.
* Permanent address: Argonne National Laboratory, Argonne, Illinois,60439, U.S.A.

266
TESTS OF A RESONANCE DETECTOR SPECTROMETER
FOR ELECTRON-VOLT SPECTROSCOPY
J. M. Carpenter
N. Watanabe
S. Ikeda
Y. Masuda
S. Sato
Japanese Laboratory for High Energy Physics (KEK),
Oho-Machi, Tsukuba-Gun, Ibaraki-Ken, 305 Japan
1. INTRODUCTION
Spectroscopy using neutrons in the range 1-10 eV opens the prospect for
several new kinds of measurements exploiting the short pulses and high inten-
sity of epithermal neutrons produced by pulsed sources. Allen, Mitchell and
Sinclair(1) have recently reviewed the principles and applications of these
spectrometers, examples of which are in measurements of struck-particle momen-
tum distributions, high frequency, low-wavevector excitations and molecular
spectroscopy.
Heavy elements exhibit narrow nuclear resonances in the range of a few
electron volts. These make possible spectrometers based on filter-difference
methods or on detection of secondary capture products. We chose to develop a
resonance detector spectrometer (RDS) based on detecting prompt capture gamma
rays. This class of spectrometer gives the prospect of statistically cleaner
results, as opposed to filter-difference spectrometers, particularly where the
scattering function is small compared to its average value. Figure 1 schema-
tically shows the resonance detector spectrometer. Scattered neutrons cap-
tured resonantly (at known energy Ef) by the absorber produce a cascade of
gamma rays which register as pulses in the scintillation detector. The
time-of-flight spectrum gives the incident energy dependence of the scattering
probability.
(1) D. A. Allen, E. W. J. Mitchell and R. N. Sinclair, J. Phys. E: Sci.Instrum. 13 (1980) 639

267
RESONANCEABSORBER SECONDARY
PARTICLEDETECTOR
Lf* (E.G. SCINTILLATOR
60 AND PHOTOMULTIPLIER)
Li.U
PULSED SAMPLESOURCE(MODERATOR)
Fig. 1 Schematic diagram of a resonance detector spectrometer
The table shows some of the most-attractive resonances.
Table I Some Attractive Capture Resonances
Isotope
238U
181Ta
121Sb
149Sm
Ef, eV
6.67
4.28
6.24
.87
r, meV
22.
57.
88.
60.
We chose the 4.28 eV 181Ta resonance for most of our tests because it has
reasonably good resolution, lies in the range of energies of interest, and the
material is readily available in appropriate thickness. Figure 2 shows the
time-of-flight distribution of the capture gamma ray intensity from a 300 K,
12 pm foil of 181Ta placed at the sample position of the spectrometer. The
interval between 4.28 eV and the next-highest resonance at 10.34 eV is avail-
able for spectroscopy.
0- mm-mmwm

268
In)O
384NO. (0.5 s/CH.)
To -181on sample position
N
512 640
Fig. 2 Capture gamma ray intensity vs. neutron time-of-flight,for 12 pm Ta foil at the sample position (8.21 m, 0.5ps/ch)
Figure 3 shows the 4.28 eV resonance in detail; the points are measure-
ments, the solid line a first-principles calculation of the spectrometer
response. The distance from moderator to absorber was 8.21 m for this test.
The calculation includes the effect of geometry as well as self-shielding,
Doppler broadening, and the intrinsic resonance width. We have performed a
similar measurement and analysis of the 6.24 eV 121Sb resonance and obtained
similar agreement with a first principles calculation.
5r
4
3
2
v
W
zz
V)HZ0
(7N
M MI
Q1N
N
N~
128
m
NONN
01M)
256CHANNEL
V 1 ' Arm "Tql 7AA r pP r. rYrr'
V V^Aoh.O vm.[;. LMA.-"j ft- - - -LI )I
1

269
To- foil(300K)
(CH. WIdthm0.25sec)
1140 1160 1180 1200CHANNEL
Fig. 3 The 4.28 eV 181Ta resonance. Points, data of Fig. 2.Line, first-principles calculation, see text.
2. SHIELDING AND BACKGROUND
After extensive tests to identify sources of background and find
corrective measures, we arrived at some general principles and some specific
understandings which guided our development. Both neutron and gamma ray
shielding emits capture gamma rays which can be detected by the scintillator.
Both act as neutron traps, storing neutrons for several hundred microseconds.
There is the possibility that some more-or-less short-lived (10-1,000
microseconds) isomers are produced in shielding and other components due to
high energy neutron interactions, which decay during measuring time to produce
detectable gamma rays. About 10 cm of lead is needed around the entire
spectrometer to attenuate gamma rays from the surrounding concrete and steel.
Beyond this, about 10 cm of hydrogenous material is needed to stop neutrons
from outside. Polyethylene is inappropriate because of the 150 ps decay time
of thermal neutrons in this medium; the thermal neutrons emit capture gamma
rays (2.2 MeV) upon capture in hydrogen, and a 7 MeV cascade when they are
captured in the adjacent lead. Boron loaded resin material works well.

270
B4C shielding inside the spectrometer seems like a good idea. We tried
configurations both with and without it, and at our levels of background, did
not observe significant differences in the background. High energy neutrons
accompany slow neutrons from the source, appearing in a difficult-to-stop halo
around the beam. We finally found that very tight, massive collimation (lead,
about 1 meter long, 40 cm dia.) around the indicent beam is required to deal
with these neutrons. With this collimation, including B4C and hydrogenous
material, we were able to operate the detector within 10 cm of the center of
the 4 cm wide beam.
We have tested various scintillators for gamma ray detection. Scintil-
lator materials capture neutrons both resonantly and continuously; the result-
ing capture and decay gammas are detected with high efficiency. The tradi-
tional NaI detector is especially bad this way. We adopted bismuth germanate
(BGO) (Bi 4Ge3012) scintillators, which seem quite good in this application.
Plastic scintillators have rather too low efficiency for the energetic gamma
rays we must detect.
We measured the response of the BGO detector without a resonance
absorber, and with a Pb scatterer. Most of the resonances are those of
germanium. The spectrum is smooth, and the counting rate small for times
longer than the arrival time of 40. eV neutrons.
Neutrons captured in the samples produce a sample-dependent capture gamma
ray background in some cases. The vanadium 1/v cross section is large enough
to be troublesome, giving a large constant background in the TOF spectrum.
The vanadium sample contained a small amount of tantalum impurity, even though
it is some of the highest-purity, zone-refined material. Since we were using
the 4.28 eV resonance of tantalum as our monochromator, this interfered with
measurement of the scattering. We made an antimony absorber, with which we
satisfactorily measured the scattering from vanadium. The problem of 1/v
capture in the important case of hydrogen is not so severe, since the ratio
of scattering to capture is higher than in vanadium.
Some photomultiplier components contain materials having resonances in
the neighborhood of those we want to use as monochromators. Gamma ray cas-
cades from captures there are detected with high efficiency by the nearby
scintillator, and may interfere with measurements as a structured background.

271
A persistent feature in the measured scattered neutron spectra was due to121Sb capture (6.24 eV). Since this moved (in time) according to detector
position, we suspected it to be due to capture in some component of the
detector assembly. We measured the capture gamma ray spectra of black
dielectric tape, mu-metal and the photomultiplier dynode and photocathode
regions, respectively used as light tight assembly material, magnetic shield
and scintillation counter, irradiated in the sample position. Figure 4 shows
the results.
300 -
200-
100-
0
40
300
200
100
A
t.1
i
- -I
-
- Black tape
f- metal
ViU
- -
- -L .1
- ---
Photo cathode of PM
128 256 384 512 640 768 896
Fi._4 Capture gamma ray intensity vs. time, for photomultipliercomponents irradiated at the sample position.
600
500-
400-
300-
20C
OC
L 1 1 l 1 1 I
1 11i

272
Even though the photocathode is so thin as to to be transparent, the trouble-
some 6.24 eV 121Sb capture peak was evident only in the spectrum of the photo-
cathode. Subsequently, we prepared a 1. mm thick shield of 10B bound in
epoxy resin; placed between the resonance absorber and the scintillator and
photocathode, this reduced the spurious peak, and also reduced the background
due to neutron capture in the scintillator.
Important in all this is that capture gammas appear after only about 10%
of the captures in boron, moreover, their energy is low enough that we can
electronically discriminate against them. Thus we have been able to freely
use boron in the shielding.
3. RESOLUTION AND DEAD TIMES
The resolution accomplished so far is only modest, around 100 meV,
limited by the fact that absorbers have been subject to room-temperature
Doppler broadening, as well as by the lack of a uranium-238 absorber (which
has the narrowest resonance we are aware of). Counting rates have enabled
measurements to be completed in between a few hours and about day.
We discovered a geometric focussing effect on the resolution, which
comes about due to the joint effects of varying flight paths and scattering
angles according to emission and interaction positions at the source, sample
and detector. The recoil shift of the incident energy varies according to
scattering angle, and times-of-flight vary according to incident energy and
flight path length. The result is the subject of a separate paper.
We have examined a fast and a slow electronics for this application and
found that the fast system worked well, having a dead time of about 100 nsec,
while the slow one gave serious dead time problems in the TOF
spectra.
4. SCATTERING MEASUREMENTS
We made test measurements on samples of Bi metal, V metal, graphite and
H2 gas. Figure 5 shows the results for 900 scattering from Bi, along with a
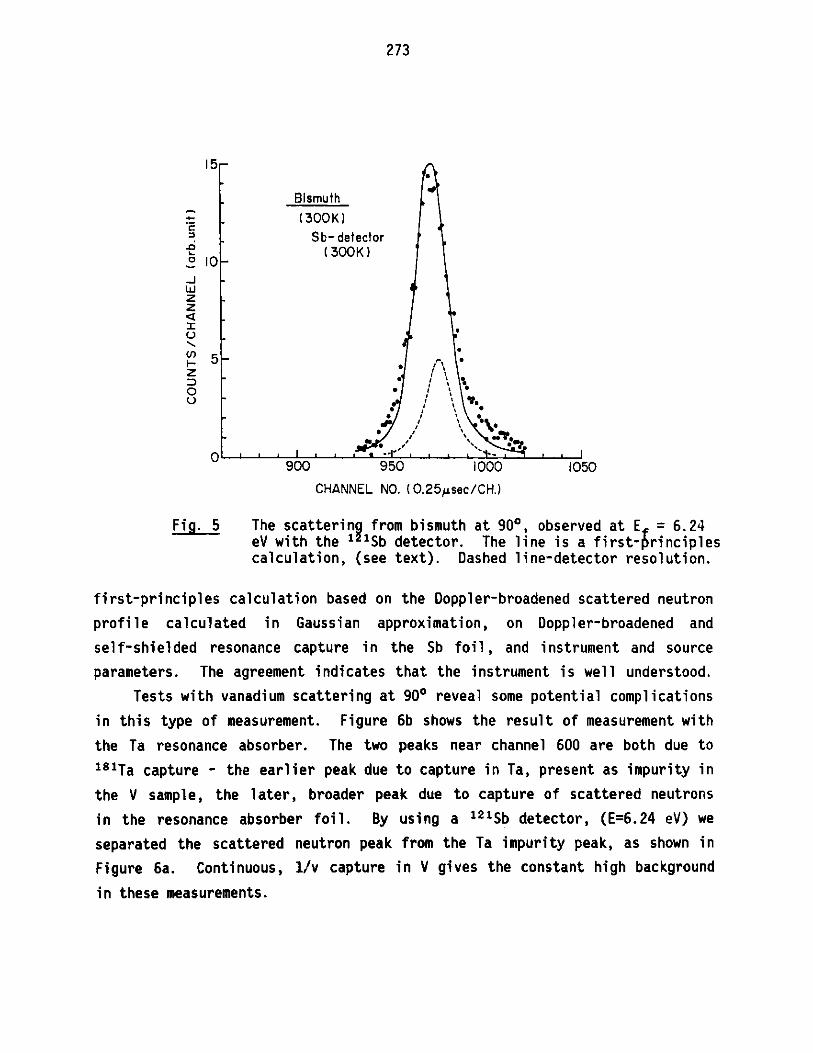
273
15
Bismuth
(300K)Sb- detector(300K)
J
zz2
VI) "I-. 5 "0z* I
o -
O "aU *7"
900 950 1000 1050
CHANNEL NO. (0.25sec/CH.)
Fig. 5 The scattering from bismuth at 900, observed at E = 6.24eV with the 1 1Sb detector. The line is a first-principlescalculation, (see text). Dashed line-detector resolution.
first-principles calculation based on the Doppler-broadened scattered neutron
profile calculated in Gaussian approximation, on Doppler-broadened and
self-shielded resonance capture in the Sb foil, and instrument and source
parameters. The agreement indicates that the instrument is well understood.
Tests with vanadium scattering at 900 reveal some potential complications
in this type of measurement. Figure 6b shows the result of measurement with
the Ta resonance absorber. The two peaks near channel 600 are both due to
181Ta capture - the earlier peak due to capture in Ta, present as impurity in
the V sample, the later, broader peak due to capture of scattered neutrons
in the resonance absorber foil. By using a 121Sb detector, (E=6.24 eV) we
separated the scattered neutron peak from the Ta impurity peak, as shown in
Figure 6a. Continuous, 1/v capture in V gives the constant high background
in these measurements.

274
-Vanadiumby sb detector6= 90*
- ch.widtn=0.5 s /ch.
-w
01 , ________
by Ta detector
01 1 I_ _ _ _
128 256 384 512 648
Figs. 6a&b The scattering from vanadium at 900 observed (a) atE = 6.24 eV with 121Sb and (b) at Ef = 4.28 eV with1 iTa absorbers.
We measured the scattering from graphite at 900 scattering angle. The
data suffered from a substantial background, including the 1 21Sb peak, pre-
sumably because our 10B scintillator and photocathode shield had slipped out
of place. The spectrum obtained by removing the Ta absorber proved to be a
good measure of the background. Figure 7 shows the net scattering after
subtraction of this background, with a first-principles calculation of the
scattering to 4.28 eV.
500
400
300
200
100
"Woo
300-
200-
00-o
"
II"iI '
" "i:

275
Graphite (300K) Detector ResolutionS10 (Ta, 300K)
--. , ,4.28eVW
00
0
10 0 0 10 50 110 0 1150 120 0
CHANNEL NO. (0.25 s/CH. )
Fig. 7 The scattering from graphite at 90*, observed at
E = 4.28 eV with 181Ta absorber. The line is a
ffrst-princi ples calculation, modeling the graphitescattering with a gaussian scattering law with an
effective temperature of 1097 K.
Satisfactory agreement could only be obtained by calculation using the mean
kinetic energy of the struck carbon atoms, near 1100 K, substantially higher
than that derived from any of the densities of states that we consulted. The
table gives two energy moments of several densities of states which have been
presented b different authors. yo is the coefficient of the Debye-Waller
factor e200 . T~g is the effective temperature in the Gaussian scatteringmodel S(Q,E) a exp[-(c-K2Q2/2M)2 / (4 $2Q2/2M) k BT eff)]. Spectra of graphite
cannot be successfully predicted using the handbook Debye temperature
0 D=420 K, for which T eff = 325 K. Measurements at 22* scattering angle show a
recoilless component, and a low component due to one-phonon scattering. The
results have not yet been analyzed.

276
Table 2 Energy Moments of the Densities of States of Graphite
Density of states y0eV-1 E = 3/2kBTeffeV
eff, K
Young and Koppela) 28.02 0.0920712
Carvalhob) 24.70 0.0925
Page and Haywoodc) 16.04 0.103
Wilsond) 29.65 0.0977
Ni cklow 008Wakabayashi, and 33.950
Smi the)
a) J. A. Young and J. U. Koppel, J. Chem. Phys. 42, 357 (1965)
b) F. Carvalho, Nucl. Sci. and Eng. 34, 224 (1968)
c) D. I. Page and B. C. Haywood, Atomic Energy Research Establishment(Harwell) Report AERE-R-5778 (1968)
d) J. V. Wilson, Oak Ridge National Laboratory Report ORNL-P-585 (1964)
e) R. Nicklow, N. Wakabayashi and H. G. Smith, Phys. Rev. B 5, 4951 (1972)
We measured the scattering from 300K H2 gas at 220 scattering angle.
Results have not yet been analyzed.
We tested 149Sm and 181Ta absorbers cooled to low temperature, by
observing the capture gamma rays produced by the absorber in the sample
position. Figure 8 shows the expected narrowing. Both absorbers suffer
significant broadening due to self-shielding, and we compute that a 7pm-
thick 181Ta foil would provide 70 meV resolution at 50K.

277
Sm-149 '(300K)
I.
.,
FWHM =72 ch.
1.
024 1152 1280 1408XT.
(36K)
FWHM=60ch.
ti "
1152 1280 1408
12 pm thick -.To-181 -(300K) -
FWHM = 17.5 ch.
i i S2B0
(-50K)
" FWHM =I3 ch.
.mm1 t
1024 1152 1280
Fig. 8 Measurements with room temperature and cold 149Sm and181Ta absorbers. On the left are the results for the.87 eV 149Sm resonance (.5 ps/ch), on the right, thosefor the 4.28 eV '81Ta resonance (.25 ps/ch).
5. CONCLUSIONS
We have solved many of the shielding problems related to resonance
detector spectrometers, and measured spectra which are in agreement with cal-
culated expectations. Resolution was in the neighborhood of 100 meV. By use
of cooled absorbers of appropriate thickness, resolution can be reduced to
about 70 meV, with 181Ta. Further improvements in resolution are possible by
use of 238U (E=6.67 eV, r=22 meV). Use of a method in which spectra for thick
and thin absorbers are subtracted, to eliminate the wings of the resolution
function, may provide further improvement.
i 1O4
1 024

278

279
ICANS-VI
INTERNATIONAL COLLABORATION ON ADVANCED NEUTRON SOURCES
June 27 - July 2, 1982
CRYSTAL ANALYZER TOF SPECTROMETER (CAT)FOR HIGH ENERGY INCOHERENT NEUTRON SCATTERING
Noboru Watanabe and Susumu Ikeda
National Laboratory for High Energy PhysicsOho-machi, Tsukuba-gun, Ibaraki-ken, 305, Japan
Kenzo Kai
The Research Institute for Iron, Steel and Other MetalsTohoku University, Sendai, 980, Japan
ABSTRACT
This paper reports the design and performances of a high resolution
crystal analyzer spectrometer which has been built and operated at KENS.
Energy resolution of the instrument is 1E/c = 0.02 % 0.03 in the range
of energy transfer E = 0.05 "' 1 eV. With this spectrometer, local mode
of hydrogens in various metallic hydrides have been measured. In case
of TiH2 or ZrHx, higher harmonics of the optical peaks have been detected
up to 5th orders with their fine structures. Higher order peaks of
TaH0 .5 have also been detected. Optical mode in hydrogenated metallic
glass of NiTiH0*5 has been measured and compared with that in crystalline
sample.

280
CRYSTAL ANALYZER TOF SPECTROMETER (CAT)FOR HIGH ENERGY INCOHERENT NEUTRON SCATTERING
Noboru Watanabe and Susumu IkedaNational Laboratory for High Energy Physics
Oho-machi, Tsukuba-gun, Ibaraki-ken, 305, Japan
Kenzo KaiThe Research Institute for Iron, Steel and Other Metals
Tohoku University, Sendai, 980, Japan
1. INSTRUMENT
A high resolution crystal spectrometer has been built and operated
at KENS. The instrument makes possible the measurement of incoherent
neutron scattering with large energy transfer in the range e = 0.05 "' 1 eV,
with resolution of about te/e = 0.02 ti 0.03 in the entire range of
energy transfers). The instrument is an inverted geometry type; the
scattered neutrons are detected at a fixed energy by a large analyzer
crystal, while the incident neutron energy is determined from the measured
total time of flight, t, using the following relation,
t = L + ,(1)
where Li, Lf, Vi, and Vf are incident (i) and scattered (f) flight paths
lengths and neutron velocities, respectively.
In this type of spectrometer, generally speaking, uncertainty in
the second term becomes large due to the finite extent of sample, analyzer,
and detector. This reflects on the first term through the relation in
equation (1) and results in the poor definition of the incident energy.
?f we put the sample and the detector on a plane, and set the analyzer
parallel to this plane as shown in Fig. 1(a), then two dimensional
focussing is realized in time of flight between sample and detector.
This focussing geometry make it possible to improve the energy resolution
without sacrificing the geometric counting efficiency. A prototype
spectrometer of this type was developed and operated at Tohoku linac2-4 .
In the new machine at ENS, signal to background ratio has been largely
increased with an improved energy resolution . Momentum transfer, Q,

281
is rapidly increased with energy transfer, E, due to the low final
energy, but the spectrometer will be useful for the measurements of the
local mode of hydrogens in metalic hydrides, for the molecular spectro-
scopy, etc., where the value of Q is not crucial and the Q-dependence is
not so important. Similar instruments were operated also at the pulsed
neutron facilities of Harwell linac5), ZING-P' at Argonne6), and WNR, at
Los Alamos7 .
Figure 1(b) shows the spectrometer configuration. The instrument
has been installed at H-7 beam hole which views the surface of a moderator
(polyethylene slab at room temp.) perpendicularly. Maximum beam size at
sample position is 7 cmW x 7 cmH. In order to minimize the ambiguity of
the incident flight path length, a plane sample is set perpendicularly
tc, the beam at L1 = 5.299 m. The analyzer crystal is a 10 cm x 10 cm
pyrographite (mosaic spread 1.2*). Bragg angle of 9B ' 430 is used, and
002 reflection corresponds to Ef = 4 meV. Eight He-3 proportional
counters, 1/2 inches in diam. and 12 inches in active length filled to
20 atoms pressure, are set in horizontal direction to form a detector
plane. In the present configuration, center line distance between
sample and analyzer, and that between analyzer and detector are 36 cm
respecively which correspond to inter plane distance a = 24.2 cm. A
beryllium filter (9.5 cmH x 12 cuW x 15 cmL) cooled to liquid nitrogen
temperature is used between analyzer and detector with a post cross
collimator made of cadmium, in order to eliminate neutrons due to higher
order reflections. Sample-analyzer-detector system is buried in a
shield box of 2 cm thick B.C and 25 cm thick borated resin wall.
2. ENERGY RESOLUTION
Extensive studies of the energy resolution were performed by a
Monte Carlo computer simulation for sample-analyzer-filter detector
system. Figure 2(a) shows the effect of the mosaic spread, 0, in the
analyzer crystal on the time distribution of the scattered neutrons.
This indicates that mismatch in tim focussing due to the finite value
in 0 is not significant in this spectrometer. The most probable value

282
of tf is determined to be tf = 821 isec from this result.
Figure 2(b) shows the calculated energy spectrum of the scattered
neutrons. The width is fairly wide which is consistent with measurement,
and from this distribution, mean value of Ef is determined to be Ef =
3.9 meV.
The effect of the finite size and circular cross section of the
detector was also studied. Even with 1/2" diam. counter, the effect
seems significant, and if necessary we can improve the resolution by
placing a proper cadmium mask, with a sacrifice in counting efficiency
by about 30 %. Calculated values of the total and partial resolution
are shown in Fig. 3 as a function of energy transfer.
3. PERFORMANCE
In order to test the performance of the spectrometer, local vibra-
tion mode of hydrogens in various metalic hydride samples has been
measuredl y'8). In Fig. 4(a) is shown a typical raw data of TOF spectrum
obtained from TiH2 at room temperature which demonstrates the extremely
low background level compared to the results obtained at other labora-
tories. Even at the time corresponding to e = c, background is low
enough to observe a small step increase in the spectrum. Figure 4(b)
shows the energy spectrum which demonstrates the higher resolution of
the instrument. Higher harmonics are clearly observed up to 5th order
with their fine structures.
ZrHi.ai and ZrH1 .9 3 have been measured and the results are shown in
Fig. 5. The locations of the peaks are listed in Table 1 with those
obtained for TiH2 and TaHN0 s. It is obvious that the frequencies for
higher harmonics are shifted by appreciable amounts from the respective
harmonic positions, and from these frequency shifts we can determine the
anharmonicity parameters of the hydrogen potential. The striking feature
of the fine structures in the higher harmonics is that the separation or
the split of the subpeaks in the respective orders becomes more pronounced

283
at higher harmonics. In the fundamental peak of ZrH1 .,9, there are two
sub-peaks at about 138 meV and 145 meV with a shoulder at about 154 meV.
The results is consistent with the reported values by Couch, et al.9)
There exists a distinct difference between the fine structures of ZrH1 .41
(cubic) and those of ZrH1 .93 (tetragonal), especially in the 2nd harmonics.
Table 1 Peak Positions of Localized Modes
1st (meV) 2nd (meV) 3rd (meV) 4th (meV) 5th (meV)
138 257 389 500 644[ZrH1*, 145 274 415 531 677(300 K) 154 293
137 260 394 493 644
ZrH1 1' . 141 274 433 531 666(300 K) 146 297 565
139 263 394 523 678
TiHM 148 280 405 565 740
(300 K) 154 304 433
171
122 233
TH,, 130 236
(300 K) 162 277
167 318
124 225TsH,' 130 239(30 K) 161 277
Figure 6 shows the results of TaHO0 *. In TaH0 . 5 at room temperature,
the lower fundamental peak (ti 120 meV) has a shoulder at about 130 meV,
and the higher fundamental (ti 160 meV) splits into two peaks. Heapelmann,
et al.1'0 have measured TaHo.o. and fitted the higher fundamental peak
by two Gaussians. The present results are qualitatively consistent with
theirs. They have found the second harmonics of the lower fundamental
at about 227 meV which may correspond to our peak at 223 may. In the
present spectrum, many extra peaks are observed above this energy. Some
of the may be attributed to the multi-phonon contribution of the funda-
mentals. Assignment of the peaks are now in progress. The results at
low temperature are also shown in the figure.

284
Hydrogenated metallic glass of NiTi2H0 .5 has also been investi-
gated1 1), in which hydrogen atoms reside in the central hole of poly-
hedral unit structures of metallic atoms. The results are shown in Fig.
7 where the measured spectra of TiH2, NiTi2H0 g and NiTi2H0,5 crystals
are also displayed for comparison. The striking new result is the
observation of well defined higher harmonics of the local mode in glassy
metallic hydride. Higher harmonics in the glassy sample are clearly
observed up to 4th or 5th order at low temperature as in crystalline
sample, while a rapidly damping occurs beyond 3rd harmonics at room
temperature.
Table 2 Locations and Line Widthsof 1st, 2nd and 3rd Harmonics
1st level 2nd level 3rd level
lu FWHN fie FWHM he FWU
a-(NiTi :)H,.. , 143 2 74 5 275 3 106 10
c-(NiTi =)H,.. , 150 2 36 5 286 3 67 10 410 8 90 20
c-(NiTi )H4., 1 47 5 286 3 90 10 412 8 140 20
TiH3 31 1 285 3 55 5 4288 96 10
unit: meV
The location and width of the optic peaks are sunarised in Table
2. Note that the low-energy shoulder appearing at h S. 100 meV in the
crystalline NiTi2Ho .5 is also found in the glassy state. This shoulder
seems to be contributed from hydrogen atoms in the possible octahedral
site as in crystalline state! Details will be given in separate a
rticles.
References
1) S. Ikeda, N. Watanabe, K. Kai and S. Yamaguchi, KENS Report III,KEK Internal (1982).
2) N. Watanabe, N. Furusaka and 14. isawa, Research Rep't. Lab. Nucl.Sci. , Tohoku Univ. 12 (1979) 72 (in Japanese).

285
3) N. Furusaka, N. Watanabe and H. Asano, ibid. 12 (1979) 83 (inJapanese).
4) N. Watanabe and M. Furusaka, KENS Report I, KEK Internal 80-1 (19'30)181.
5) D. H. Day and R. N. Sinclair, J. Chem. Phys. 55 (1971) 2870.
6) K. Skold, K. Crawford and H. Chen, Nucl. Instrum. Methods 145
(1977) 117.
7) J. Eckert, R. N. Silver, A. Soper, P. J. Vergamini, J. Goldstone,A. Larson, P. A. Seeger and J. Yarnell, Proc. ICANS-IV (1981) 434.
8) S. Ikeda, N. Watanabe and K. Kai, Kens Report III, KEK Internal(1982).
9) J. G. Couch, 0. K. Harling and L. C. Clune, Phys. Rev. B 4 (1981)159.
10) R. Hempelmann and D. Richter, Z. Phys. B - Condensed Matter 44
(1981) 159.
11) K. Kai, S. Ikeda, N. Watanabe and K. Suzuki, KENS Report III,KEK Internal (1982).
12) H. Buchner, N. A. Gutijar, K-D. Beccu and H. Sufferer, Z. Metalkd.63 (1972) 497.

286
I Neutron Source
Incident Neutron (Ei. vi. )Li
Detector
Sample
Scattered Neutronn ̂ (E .v .A )
Analyzer
[i]l Moderator
.I-
* .
- *6
1 - .
-'* -
* . . - .6 '
0
Incident Collimator
Iron
Polyethylene
" . " -- - ' He-3. Counter
(70 x70" '.Al Window .- - .- "Sample .. .-
" Cd Grid
"* - - ' Collimator
-. Cryostat:. Vacuum Chamber
"".-" - - P-G -- "-' Be Filter (12?0'9Sa150'- - 008.0. B4C Resin
o '
Borated Resin
Fig. 1 Principle (a) and configuration (b). of. the spectrometer
*1I

287
tf - Distribution
0.10
-- Pu 0.8*
----- s 1.2
--- Ps 3.00CLi
-
0.05F
0.0821 822 tf (pSEC)
(a)
1
E - Distribution
-- Pu a
Be FilterCut Of f
Ef
3.
3.0 4.0 5.0 (meV)(b)
Fig. 2. Time distribution of detected neutrons due to finitemosaic spread of analyzer crystal (a) and energy distributionof detected neutrons.
4.01
ol
200
- Total (without mask. CH. W.z 4 psec)
Total (with mask. CH. W. =2psec )
600 800400 1000
E (meV)
Fig. 3. Total and partial energy resolution.
0.
3.0
2.0
vI
Qa
1.0
.IV
I
-. .. ..
I
^1 I I
Tota I
% Total .
", . d---o Detector (no ma
CH. W. ( 4 sec)
. Ei /Pulse W.
Analywar W..
Sample W.

288
(3001)
z
o
N Ch. Width h.Wdh .u - c 4+"[e .-
0014 -
0 200 400 600 800 1000Channel -.) Fig. 4
Ti 2 -Raw TOF spectrum (a) and double differ-(300K) ential cross section (b) of TiH2 .
.b . -"- 2nd -
.j - - 100 200 3001 msV )
.3rd
- 200 400 600 '001000E (meV)
(b)
Zr H.4 .(300K)-
20 000 200 3001..)
Fig. 5 200 400 600 800 000E (me)
Double differential cross section <)
of ZrHi"41 (a) and ZrH1.93 (b)
ZrH1. 41
(300K)
v
0 400 980 !W 1000E (,MV)
(b
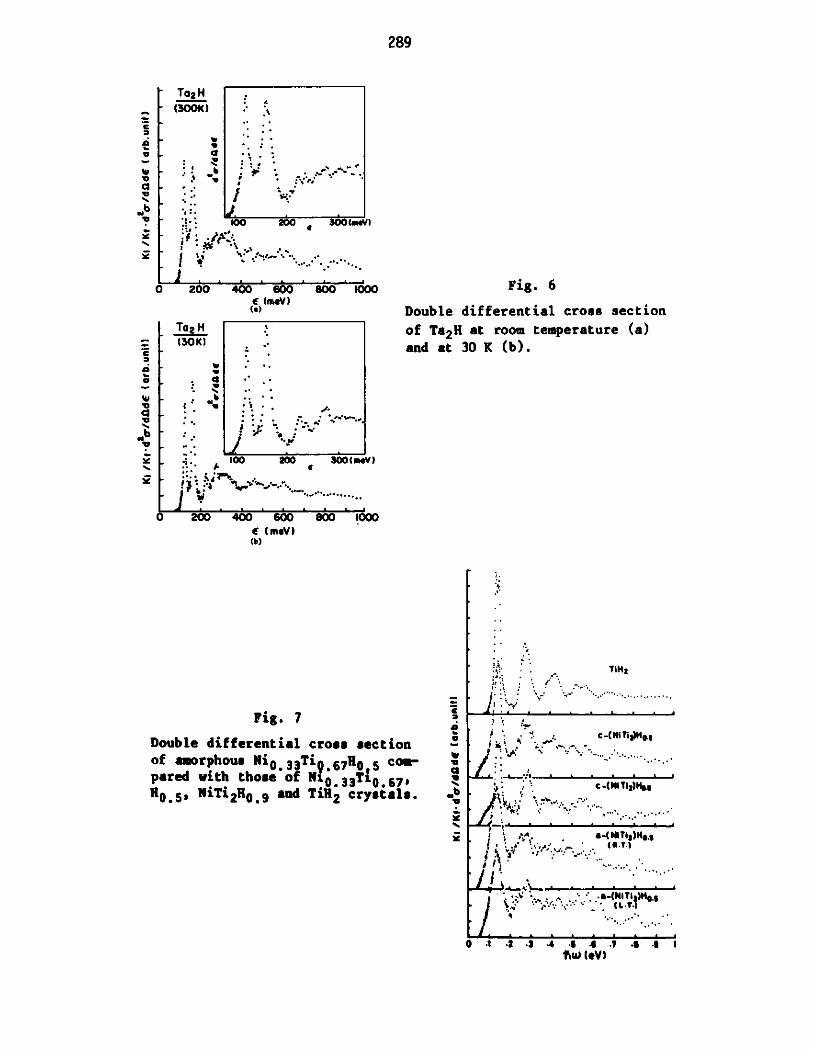
Toa H(300k)
v"
100 200 300..
_ . 0,.. g oo I
VI
P 200 400 600 800 1000w (mv )(a)
T H. 1(-0')
qu
..
. . 800 200 300(..
Fig. 6
Double differential cross section
of Ta2H at room temperature (a)and at 30 K (b).
v)
200 400 600E (meV)(b)
Fig. 7
Double differential cross sectionof amorphous Ni0 . 3 3Ti. 6 78 0 5 com-pared with those of N10 33Ti0 67 ,
H0 .5, NiTi 2H0 .9 and TiN 2 crystals.
C
.3
O.3
«b
it"4
IVrTIH1
- ."c -(NI i $$ .
c -(NIT.)!
-t---T." ; ,"-"---( ----
0 .1 .2 .2 .4 .5 .6 .7 .6 .t 1, w (V
289
.
C2
O
Wi
C2
a
a«b
800 1000A
--"

290

291
THE INELASTIC YIVR SPECTI ETER AT THE HBAULL LDAC
B C BolandNeutron Division
Rutherford Appleton Laboratory
i. INSTRUMENT DESCRIPTION
te Harwell Linac has been operating routinely for approximately 6 months at
25 Kw power and 75 Hz into a tantalum target. During this period a nuber
of test experiments has been carried out and a period set aside for
university user experiments
The instrument viewed a water moderator in slab geometry at 250 to the
normal. The moderator was 4.4 as thick with gadolinium poisoning 13 mm,
below the surface. No decoupler was present. The measured coupling
efficiency is 5 x 10⁻⁴ n(1 eV)/nf/ster.
The spectrometer is designed to measure energy transfers from 50 meV to 400
meV covering a range of Q values from 1-15 rl. Particular emphasis has
been placed on the low Q counter banks where measurements at low Q reduce
multiphonon contributions in vibrational spectra, diffusional broadening in
liquids and allow measurements to be made on magnetic excitations(l). The
spectrometer consists of a Nimonic rotor, rotating at 600 Hz, accurately
phased to the linac with a jitter of less than + js, placed at 6.4 metres
from the moderator. Incident energy (E0 ) selection is made by varying the
phase of the rotor with respect to the linac. E0 can be varied froml150 meV
to 500 meV. The selected neutrons are allowed to fall on the sample placed
1 metre downstream in an evacuated chamber. Sample temperature can be
controlled from 20K to room temperature. Ilw angle counter banks are placed
between 40-110 either side of the main beam at 2.5 metres. In addition,
counter banks are placed every 100 betmen 240-940 at 1.62 metres. The
counters are 1' diameter He 3 10 atmosrhere and 4 atmosphere respectively.
The region of (Q,w) space covered for two values of E0 is shown in Figure 1
together with that covered by a beryllim filter spectrometer operating at
these energy transfers. The energy resolution is estimated to be 7 mV at
an energy transfer of 150 mV (4.70). Te intensity at the sample was
measured using vanadium scattering to be 1100 n/s over 2" x 1' bea at 450
meV E0 .

292
2. EXPERIMENTAL RESULTS
Figure 2 shows the measured spectra for a sample of sodium bifluoride NaHF2 'The sample was " 13% scatterer 3 nu thick inclined at 450 to the beam and
kept at 90K. NaHF2 in the pure salt form has been investigated before withneutrons but only at high Q values and relatively poor energy resolution
using the beryllium filter technique (2). The bifluoride ion has a sharp
bending mode v 2 at 156 meV and an antisyimetric stretch v 3 at '& 177 meV.The two modes are separated in the pure salt by IR measurement (3) but are
both broad due to interactions with near ions. In a dilute sample of HF2ions in KC1 the modes are seen as extremely narrow peaks in the IR spectrum.
The modes have not been separated before in a neutron scattering experiment
from the pure salt. In Figure 2 the two modes as seen by the low Q counter
bank of the IRS are seen to be clearly separated (the ordinate, S, is
proportional to S (Qw)); the insert shows the comparable spectrum measured
on the beryllium filter spectrometer IN1 at ILL. In addition, in collabora-
tion with Durham Univer-sity( 4 ), the sodium bifluoride was run at a higher
incident energy E0 = 450 meV in order to collect data on the second harmonic
at ' 300 meV. In a run of length 78 hours, data were collected over a wide
Q range. Figures 3 and 4 show the raw data from the low angle (70) counter
and the 240 counter. Under these conditions the resolution is not good
enough to separate the bend and stretch modes.
In a collaboration with the Universities of Muinster and Birmingham (5) data
were taken on samples of vanadium, and vanadium titanium, hydride. With
little multiphonon broadening of the optical mode, data frcom the high angle
counter banks can be sunned with little or no loss of resolution. Figures 5
and 6 show reduced data (S(Q,w) against bw) for the twosamples with the
optical mode clearly split.
3. CONCLUSION
All indications are that the energy resolution is as predicted and is
certainly twice as good as that of any other spectrometer presently
available to the UK users at these energy transfers. Backgrounds on the
high angle banks 240-940 are excellent but at the low angles are too high at
present for anything but hydrogenous samples. Tests have shown that much of
this background cores from the main bean in the area of the collimation
between the chopper and the sample, and steps are being taken to iqptove
this area.

293
References
(1) Boland B C, Mildner D F R, Stirling G C, Bunce L J, Sinclair R N,Windsor C G, Nuclear Instriments and Methods 154 (1978) 349.
(2) Waddington T C, Howard J, Brierley K P and Tonkinson J, J Chem Phys 64(1982) 193.
(3) Salthouse J A and Waddington T C, J Chen Phys 48 (1968) 5274.
(4) Howard J, Tomkinson J, Boland B C, to be published.
(5) Severin H, Wilson S K P, Wicke E, Ross D K, Carlile C J, to bepublished.
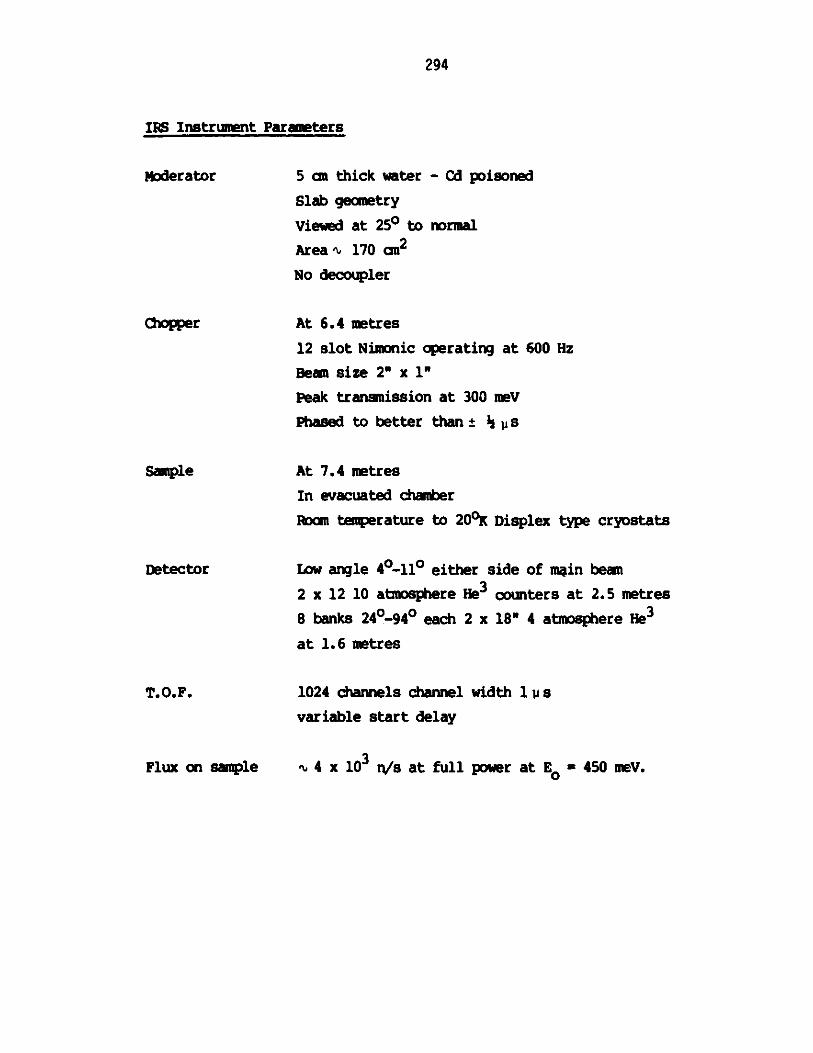
294
IRS Instrument Paramiters
Moderator 5 an thick water - Cd poisoned
Slab geometry
Viewed at 250 to normal
Area t170 an2
No decoupler
Chopper At 6.4 metres
12 slot Nimonic operating at 600 Hz
Bean size 2" x 1"
Peak transmission at 300 neV
Phased to better than u s
Sample At 7.4 metres
In evacuated chamber
Roam temperature to 200 K Displex type cryostats
Detector Low angle 4 -110 either side of main beau
2 x 12 10 atmosphere He3 counters at 2.5 metres
8 banks 24 -94 each 2 x 18" 4 atmosphere He3
at 1.6 metres
T.O.F. 1024 channels channel width 1hu s
variable start delay
Flux on sample .4 x 103 n/s at full power at Eo-=450=meV.
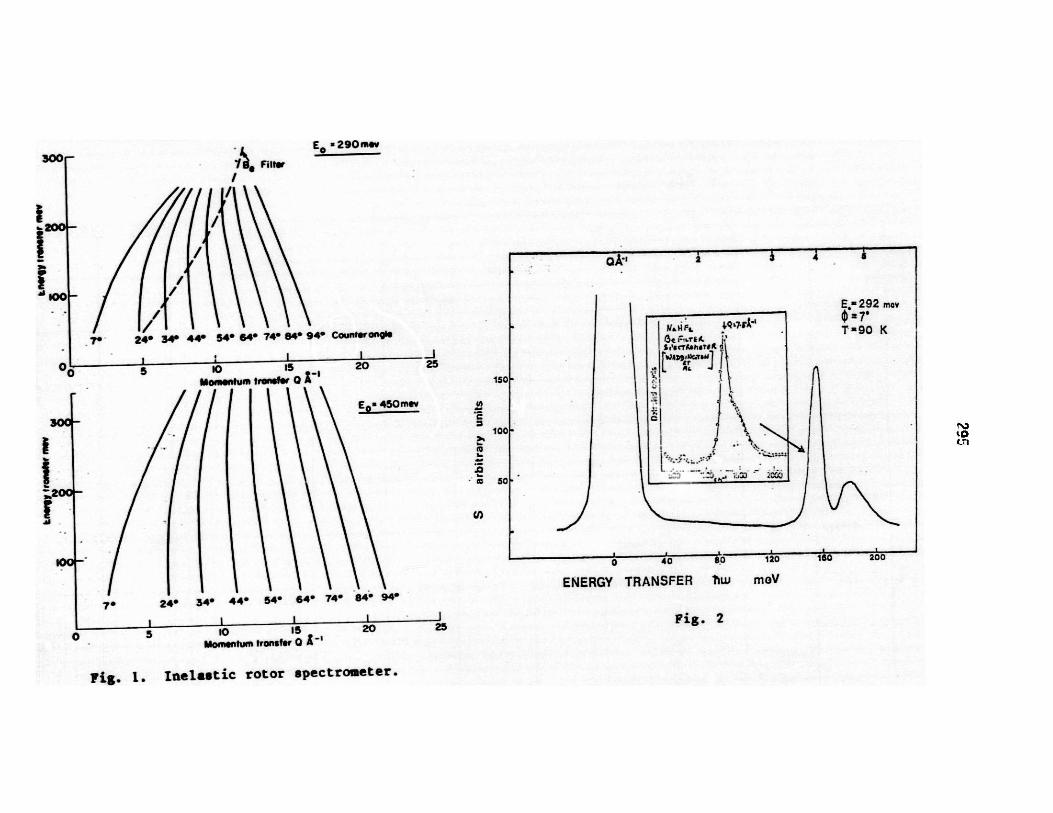
E 290 mev300 Filter
t6
r /
To 24' 340 440 54* 640 74* 64* 94* Counter on"le
00 S 05S - 20 25
Mome Muum travefer 0 A
Ea= 4S0tnev
300 -
y* 24* 34. 44. 54- 64- 74- 84- '
s 10 15 20 2s
Momentwn transfer 0 -
1501-
100
;
-o s0*t 5
Nl
Ee- 292 mov
d F. 47rk' T-90 K
S t's CT Ahoh K
7 /4
- 200
C-
0 40 80 120
ENERGY TRANSFER hw meV
Fig. 2
Fig. 1. Inelastic rotor spectrometer.
- I- I -ok' a 1 4 0
0LT11
1SO 200
6Oki 2

- 11._
0~ - --
C! ^..,.. c t e '2 4 .Ie
- - - F FWg) aMJ F T F .0
0
0~~~~~-- --__ - -- hitfL lEo ~1 T
0'a
0
o I Ikd
o J ,1 I5
_____ __ '~.'~ ~ , ,tlT __10
I-_______________ ______________ ______________ F__________ ____________
RiT !BL _LE IEE
>vf"'L fL.
C..b.12.-s sO.
ilIE.-
~..fees.u*120 p.'
I
rI I __
Ii IAM1"d HF b+« M
tf a
!N -
. :. C .l .I -: ,I :., I ' ----
'I(
Fig. 3
3I
N0
-
1
-
D
_ I
Fig. 4
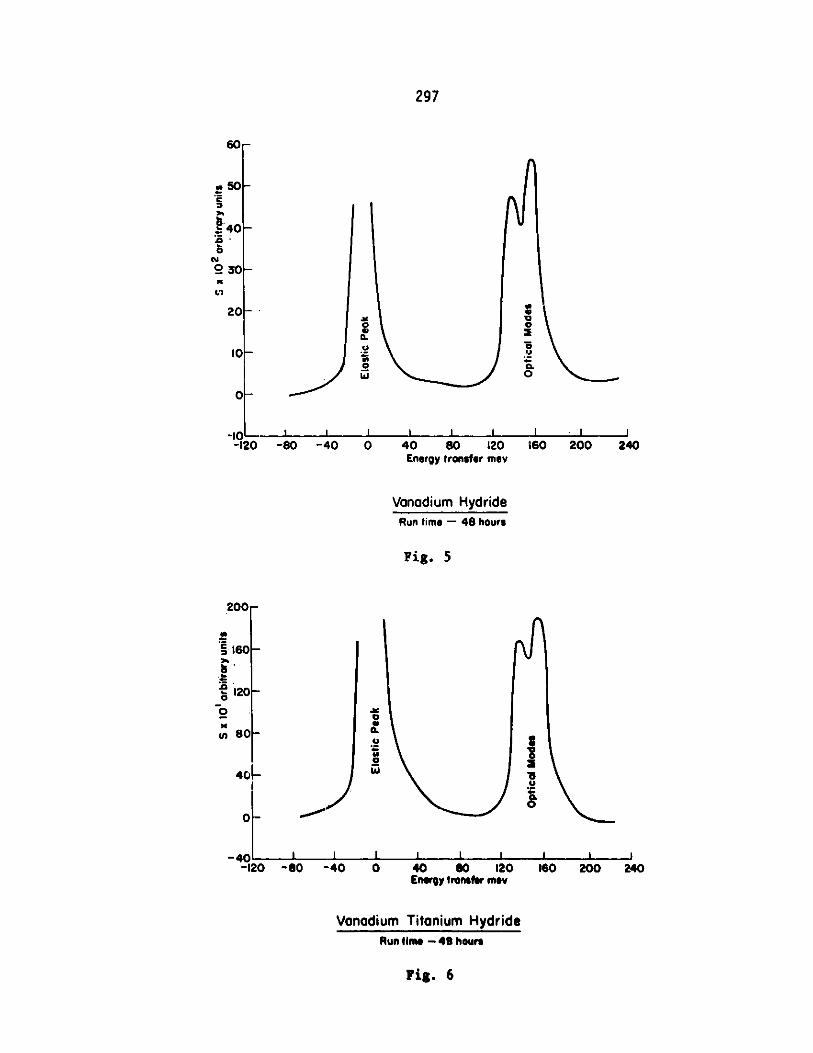
297
60
«50
140
20-
20
10
20o00
-10-10 -80 -40 0 40 80 120 160 200 240
Energy transfer mev
Vanadium HydrideRun time - 48 hours
Fig. 5
200-
160
120-
0 0
-40 F0
-120 -80 -40 0 40 80 120 160 200 240Energy transfer mev
Vonodium Titonium HydrideRun time - 48 hours
Fig. 6

__ LI . R fiIYL FLIE JLL 1IHAR ELL LINAc.
I RS DA A FAD E ardKIf RFAA? .. a~ AAM
E = 497 we-
-=C35 AI
_ _ ___ _ _._ _k _ _
. -
C) I_
O ~5JQY
N~-2
x I 0120. ,0 140.00 161
IC)
GF.GJF5 CF 10.0099:1 FRO F:UGDR-n ;-E 9 .CL.UT
HAkUGLL I.Oi#ACIR~S AF~cEr,tDA A '. ICE 9'Kf
sAN)AEAc I .. h 0&.4 .. D
SA' ,7
X7 s=3
Iu
u
o I
h-*
cci
CSI
RVERRGE El80.00 160.00 2,40.00 320.00
NEI r'( 7+ Pr IS-eR ak * *J
Fig. 7
20.1
ko
40.00 60.00 80.00 J00.00ck 'AD.
40 .C
r:
I+II
.
ri p
G
?i
t
1
G
G
0
G0
-160.00
J
t
-80.00 0-o 0
Fig. 8

299
Instrumentation - Summary of Contributed Paper '
and Discussion Sessions
R. K. Crawford
The contributed paper session included papers on the following major
topics: Powder Diffractometers, Single Crystal Diffractometers, Small Angle
Diffractometers, Inverted Geometry Spectrometers, Spectrometers for the
Electron-Volt Energy Range, Choppers and Chopper Spectrometers, Polarized
Neutron Instrumentation, Detectors, and Data Acquisition. There was also a
general paper on the importance of the large dynamic range provided by most
time-of-flight instruments. In the discussion sessions, additional material
was presented on Inverted Geometry Spectrometers, Spectrometers for the
Electron-Volt Energy Range, Choppers and Chopper Spectrometers, and Polarized
Neutron Instrumentation. The summaries below combine material from the con-
tributed paper session and discussion sessions under these major topic
headings.
I. Diffractometers
Jim Jorgensen reported on the ANL powder diffractometers. His basic
message was that these two instruments work extremely well. These in-
struments both use on-the-fly software time-focussing of the detectors,
and this technique has been very successful. The high resolution pro-
vided by these instruments is being utilized by a number of powder dif-
fraction users. These instruments have also proved to be quite good for
obtaining high Q data from amorphous samples.
Art Schultz reported on the single-crystal diffractometer at ANL.
This instrument uses an area-detector of the Anger type. The instrument,
and its associated data analysis software, are now in routine use for
crystal structure problems. Initial experiments also indicate the power
of the area-detector-based time-of-flight Laue technique for finding
low-intensity features such as diffuse scattering or satellite peaks
between the Bragg peaks.
Ernest Epperson reported on the small angle diffractometer at ANL,
and Masahumi Kohgi reported on the KENS small angle diffractometer. The
KENS instrument is on a cold neutron guide and uses only the long-
wavelength portion of the spectrum. It uses an area-detector made up of
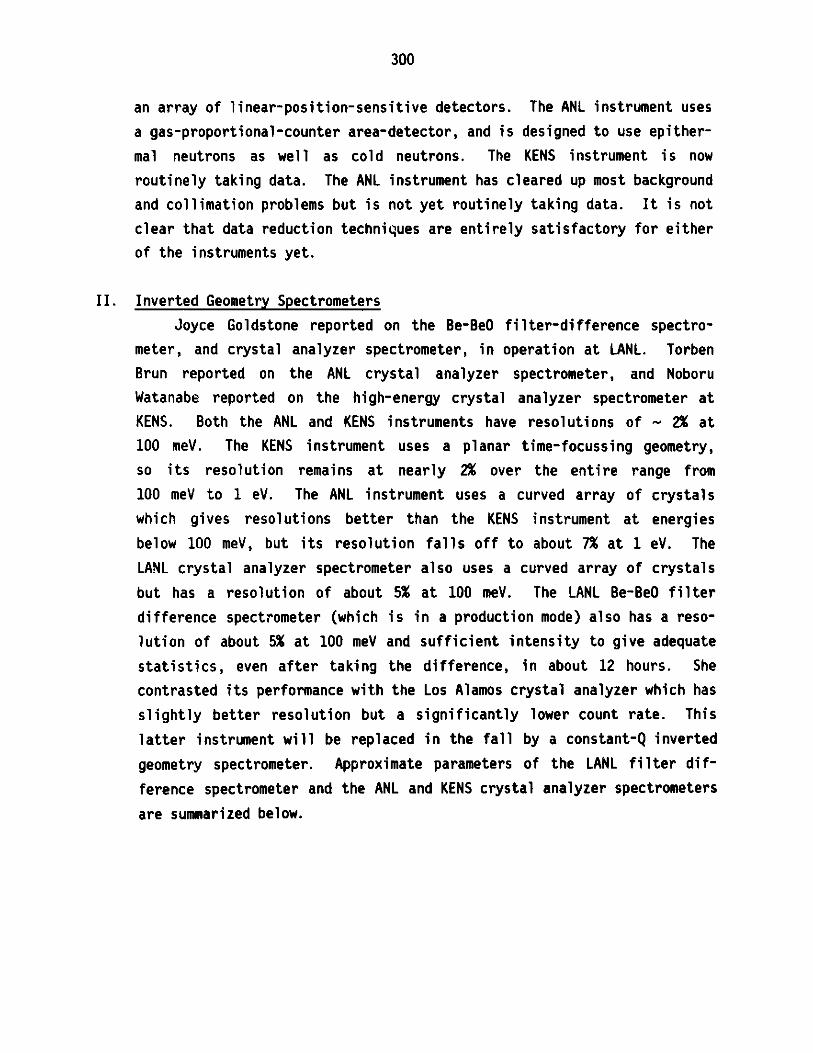
300
an array of linear-position-sensitive detectors. The ANL instrument uses
a gas-proportional-counter area-detector, and is designed to use epither-
mal neutrons as well as cold neutrons. The KENS instrument is now
routinely taking data. The ANL instrument has cleared up most background
and collimation problems but is not yet routinely taking data. It is not
clear that data reduction techniques are entirely satisfactory for either
of the instruments yet.
II. Inverted Geometry Spectrometers
Joyce Goldstone reported on the Be-BeO filter-difference spectro-
meter, and crystal analyzer spectrometer, in operation at LANL. Torben
Brun reported on the ANL crystal analyzer spectrometer, and Noboru
Watanabe reported on the high-energy crystal analyzer spectrometer at
KENS. Both the ANL and KENS instruments have resolutions of ~ 2% at
100 meV. The KENS instrument uses a planar time-focussing geometry,
so its resolution remains at nearly 2% over the entire range from
100 meV to 1 eV. The ANL instrument uses a curved array of crystals
which gives resolutions better than the KENS instrument at energies
below 100 meV, but its resolution falls off to about 7% at 1 eV. The
LANL crystal analyzer spectrometer also uses a curved array of crystals
but has a resolution of about 5% at 100 meV. The LANL Be-BeO filter
difference spectrometer (which is in a production mode) also has a reso-
lution of about 5% at 100 meV and sufficient intensity to give adequate
statistics, even after taking the difference, in about 12 hours. She
contrasted its performance with the Los Alamos crystal analyzer which has
slightly better resolution but a significantly lower count rate. This
latter instrument will be replaced in the fall by a constant-Q inverted
geometry spectrometer. Approximate parameters of the LANL filter dif-
ference spectrometer and the ANL and KENS crystal analyzer spectrometers
are summarized below.
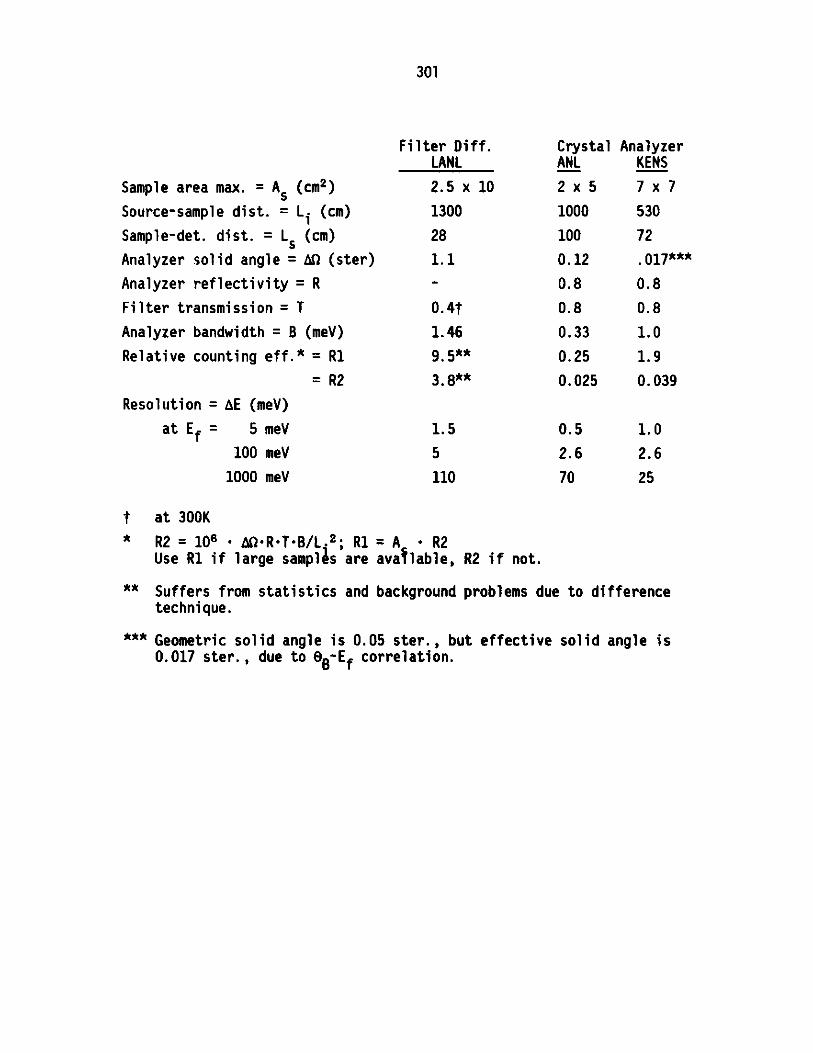
301
Sample area max. = As (cm2 )
Source-sample dist. = L. (cm)
Sample-det. dist. = Ls (cm)
Analyzer solid angle = fl (ster)
Analyzer reflectivity = R
Filter transmission = T
Analyzer bandwidth = B (meV)
Relative counting eff.* = R1
= R2
Resolution = AE (meV)
at E f= 5 meV
100 meV
1000 meV
t*
Filter Diff.LANL
2.5 x 10
1300
28
1.1
0. 4t
1.46
9.5**
3.8**
1.5
5
110
at 300K
R2 = 106 -AQ-R-T-B/L 2; R1 = A - R2Use R1 if large samples are available, R2 if not.
Suffers from statistics and background problems due to differencetechnique.
*** Geometric solid angle is 0.05 ster., but effective solid angle is0.017 ster., due to OB-Ef correlation.
CrystalANL
2x5
1000
100
0.12
0.8
0.8
0.33
0.25
0.025
AnalyzerKENS
7 x 7
530
72
.017***
0.8
0.8
1.0
1.9
0.039
1.0
2.6
25
0.5
2.6
70

302
III. Electron-Volt Spectrometers
Bob Brugger and Andrew Taylor reported on the direct and inverted
geometry resonance filter difference spectrometer prototype measurements
at LANL, Gavin Williams reported on the inverted geometry resonance
filter difference spectrometer prototype measurements underway by RAL
at the Harwell Linac, and Jack Carpenter reported on the extensive
development (in which he participated) of a resonance detector spectro-
meter at KENS. A general conclusion of the discussion was that the
inverted geometry instruments were greatly superior to any practical
direct geometry resonance filter difference instruments.
The filter difference techniques have the large advantage that
the instrumentation is quite simple, involving only a resonance absorbing
foil and standard neutron detectors. The difference method also means
that background does not appear in the final results. However the
difference method involves the subtraction of two large numbers and so
has inherently large statistical errors. Thus it does not seem useful
for measuring weak inelastic scattering. (However, Gavin Wlliams dis-
cussed the use of additional broadband filters in the incident and
scattered beams as a technique to cut out most of the unwanted neutrons
and hence greatly reduce this statistical problem. This technique will
be tested on the Harwell Linac. This technique also suffers from the
relative inefficiency of neutron detectors at these energies.
The resonance detector spectrometer also uses a resonant neutron
foil, but in this case it is used as an energy-sel3ctive detector rather
than as a filter. The capture gamma rays from the resonance of interest
are detected by standard gamma techniques. This has the advantage of
being a direct neutron detector technique, and so does not suffer from
the bad statistics due to subtraction of large numbers inherent in the
filter-difference techniques. However, shielding is much more compli-
cated because the detector must be shielded from both gammas and un-
wanted neutrons.
Resolutions of about 70 meV (in a final resonance energy of
several eV) are currently achievable.
IV. Choppers and Chopper Spectrometers
David Price reported on the chopper phasing techniques developed at
ANL and on the results with the two chopper spectrometers there, Richard

303
Silver and Bob Brugger reported on current LANL attempts to phase a
chopper to the LAMPF accelerator, and Spencer Howells reported on recent
results on the chopper spectrometer operated by Brian Boland at the
Harwell linac. ANL has solved its chopper phasing problems by running
both the choppers and the accelerator from a fixed frequency crystal
oscillator. A further refinement allows one "master" chopper to control
extraction from the accelerator, thus effectively eliminating any
effects of hunting oscillations for this chopper. Additional choppers
can also operate as "slaves", in which case they cannot control extrac-
tion and so must follow the extraction frequency as best they can. At
present the master can stay in phase within 1-2 microseconds while the
single slave chopper currently operating is in phase within about 7
microseconds over 95% of the time.
LANL can control the LAMPF pulse within a 64 microsecond window
which follows the line frequency. They are attempting to do this by
using a relatively large permanent-magnet motor to provide sufficient
torque to drive the chopper to follow the required rapidly-varying
smoothed live frequency. Preliminary tests indicate the chopper can
follow this frequency fairly well, although details about hunting oscil-
lations, chopper heating and long-term ability to remain in phase were
still sketchy.
The Harwell linac is phased to a crystal oscillator, so there is
no major phasing problem for the RAL chopper spectrometer there.
Results on the ANL and RAL chopper spectrometers have mostly been
aimed at the epithermal part of the spectrum. Both have used incident
beams of about 500 meV. Background problems at these energies, although
difficult, have been tractable in both cases. Progress is being made in
understanding the resolution functions of these instruments.
Jack Carpenter discussed the use of Bragg reflection from a
rotating crystal as an alternative to choppers for providing pulse-
shaping in some cases for pulsed source instruments. In particular,
this can provide a narrow time pulse with a wide energy band, which
is difficult to do with choppers outside the biological shield. No
plans are currently underway to build or test such a device, however.

304
V. Polarized Neutron Instrumentation
Masahumi Kohgi reported on the cold polarized neutron spectrometer
and on tests performed on a polarized proton polarizer at KENS, Gian
Felcher reported on progress on the spin refrigerator polarizer at ANL,
on a proposed neutron spin precession technique for enhancing resolution
in eV spectrometers, and on the current ANL efforts with cold
polarized neutrons, and Gavin Williams reported on the RAL efforts
using resonance absorption polarizers, including the prototype instru-
ment being tested at the Harwell linac. The main efTort continues to
be directed toward developing efficient broad-band polarizers for thermal
and epithermal neutrons. This work is technically very demanding and
although some progress has been made the optimum solution has not yet
been achieved.
The polarizing filter method based on the spin-dependent scattering
of neutrons by polarized protons in a dynamically polarized ethylene
glycol target is being pursued at KENS. A proton polarization of 43%
has been achieved in a 1 cm thick target. Workers at KENS are now build-
ing an instrument based on a filter of this type. The spin refrigerator
principle, which is an alternative method for polarizing protons, is
currently being tested at ANL. It uses a crystal of Yttrium Ethyl
Sulphate doped with Yb3+, which is rotated in a magnetic field of 1.3 T.
The apparatus is much simpler and more compact, and has much simpler
cryogenic and field-homogeniety requirements, than the dynamic polariza-
tion method. A proton polarization of 30% has so far been achieved in
preliminary measurements. Considerably higher proton polarization will
be needed in both types of filter. These polarized proton filter tech-
niques are extremely important to the future of polarized beam research
at pulsed neutron sources, since this is the only known technique which
provides white beam neutron polarization over a broad energy range up to
KeV energies.
RAL is investigating the filter method using selective absorption
by polarized nuclear resonances. Several statically polarizable nuclei
have been identified as potentially useful neutron polarizing filters
in the epithermal and lower eV energy range. 151Eu is particularly
interesting since it has a broad-band polarizing capability extending
up to 0.6 eV. A new application using neutron resonances for combined
energy and spin analysis (eg. for inelastic polarization measurements)

305
was also described. These techniques will be extensively tested at
the Harwell linac.
Cold neutron polarizers based on mirror reflections are easy to
make, and many experiments have been performed on the TOP spectrometer
at KENS. A novel application of the critical reflection of polarized
cold neutrons from magnetized surfaces, is being used at ANL to probe
the penetration of a magnetic field into the surface of a superconductor.
Time-of-flight polarized beam measurements are particularly appropriate
in this case, since a wide range of wavelengths can be covered with the
sample set at a fixed reflection angle.
Gian Felcher discussed his proposed use of polarized neutrons in a
spin precession technique which could yield energy resolutions of about
30 meV in the lower eV energy range. However, any tests of this tech-
nique await the development of a satisfactory white-beam neutron
polarizer.
VI. Detector Development
There has been significant progress since the last ICANS in the use
of scintillator detectors at pulse sources. The 30 cm square, 49 tube
Anger Camera using square photomultipliers has been brought into service
at the single crystal diffractometer at IPNS. The effects of the intrin-
sic backgrounds in the Li glass scintillator and its sensitivity to y
radiation have not so far proved troublesome though care is taken to
minimize the amount of y producing shielding material such as Cd or B.
Work is proceeding on the difficult problems of reduction of data from
PSD's used in diffraction studies. Powerful FEM computers with large
memory are needed. Detailed studies of the properties of the detector
such as long term stability and uniformity of detection efficiency over
the scintillator area have not yet been made.
A coded scintillator detector using solid glass light guides rather
than optical fibers was tried on the constant Q spectrometer at the
Harwell linac but proved to have too high a background for that low count
rate instrument. An alternative arrangement of individual scintillator
elements and coupled to " photomultipliers was much more successful
yielding background levels in use which were slightly lower than an 8
atmosphere 9mm diameter 3He counter, with the advantage of higher
efficiency and lower cost. The best results were obtained with 2 layers

306
of scintillator 1mm thick separated by a layer of lead (3mm thick) to
absorb the secondary electrons from y capture events. Significant reduc-
tions in intrinsic background can be made by using a separate plastic
scintillator to veto cosmic ray events in the glass scintillator.
In discussion of the origins of the intrinsic background in 6Li-
loaded glass scintillators, Tom Holden referring to CRNL work by Aslam
Lone, pointed out that this may be due to reactions induced by the triton
recoiling from the 6Li(n,a) T reaction; triton decay itself is not a
problem. The most likely candidate reaction is
T + 160 + 19F + 18F + n
18F 1i9. min. 180 + p+ (.633 MeV)
The Coulomb barrier is 2.4 MeV, while the triton energy is 2.7 MeV.
Other possibilities are
T + 2 9Si4 32P + y and T + 3oSi - 3 2p + n,
32p 14.3 d 32S + p (1.71 MeV)
The Coulomb barrier is 3.8 MeY. The key to diagnosing the background
problem is probably to me. :re the decay time of the background,
following neutron irradiation. Neutron activation of other isotopes
in the scintillator may also account for the "cooling off" effect seen
when a detector is removed from a neutron field.
Good lithium-loaded scintillating glass is now being produced in
Japan by Nikon. There is enough difference in the pulse shape for
neutron and y interactions to enable pulse shape discrimination to be
used. There was no evidence of a activity in the pulse height spectrum.
Work is also going on in Japan on fibre optic coupling.
VII. Data Acquisition
There have been iho significant conceptual developments in data
acquisition systems for neutron scattering instruments since the last
ICANS meeting. However, since then the IPNS data acquisition has been
brought on line. Tom Worlton reported on the performance of this system
which is quite satisfactory. RAL has just placed the initial order for
VAX computers for the SNS neutron scattering data acquisition system.

307
VIII. Importance of Dynamic Range
Ferei Mezei discussed the importance of providing instrumentation
which covers a wide dynamic range, noting that many experiments at
ILL must be done on several different instruments in order to cover a
sufficient dynamic range. He also cited several examples of experiments
which led to the wrong conclusions because the experiments did not span a
sufficient dynamic range. He noted that this makes pulsed source instru-
ments potentially very attractive, since the wide dynamic range is an
inherent feature of most time-of-flight instruments.
IX. Standard Samples
There was a general discussion of the adoption of a standard sample
material for the intercomparison of inelastic spectrometers. It was
decided to adopt as a standard the material sodium bifluoride (NaHF2).
Sodium bifluoride has a sharp peak (~- 11 meV wide) at 159 meV, and has a
much broader peak at 179 meV. Some peaks at higher energies have also
been observed.
Measurements are to be made at low temperatures (20-30K) using
sample geometries optimized for the instrument on which the measurements
are made. Results of these measurements are to be distributed informally
among the ICANS laboratories by the experimentalists involved.

308

309
Summary of Discussions of Electron Volt Spectroscopy
A. D. Taylor, LANL
N. Watanabe, KEK
J. M. Carpenter, ANL
For purposes of discussion, we define these spectrometers to be those
which use sharp nuclear resonances to define the neutron energy before or
after scattering. We heard descriptions of tests of two types of these spec-
trometers, the Resonance Filter Beam Spectrometer (RFBS) (Brugger & Taylor,
these proceedings) and the Resonance Detector Spectrometer (RDS) (Carpenter
and Watanabe, these proceedings).
The diagram shows the general plan of these spectrometers; letters
designate the position of the resonance device.
DETECTORC
B
SOURCE A
Fig. 1 Schematic diagram of Electron Volt Spectrometers.

310
The table summarizes the distinctions between the two methods, and introduces
a third, prospect, that of the Resonance Filter Detector Spectrometer (RFDS),
which has been prototyped (Brugger and Taylor; Williams and Penfold, these
proceedings).
Methods of Electron-Volt Spectroscopy
ParticleDetected
Neutron Secondary(y)
StatisticalMethod
Difference RFBS (A) and RFDS (B)
Direct RDS (C)
In the RFBS resonance interactions remove neutrons of definite energy
from the incident beam and the distribution of scattered neutron energies is
determined by time of flight. The difference between spectra measured with
and without the filter gives the net scattered intensity distribution for
fixed initial energy. In the RFDS, resonance interactions remove neutrons of
definite energy from the scattered beam, and the distribution of incident
neutron energies is determined by time of flight. The difference between
spectra with and without the filter gives the net scattering for fixed final
energy. In the RDS, resonant interactions in an absorber are detected
through the prompt secondary particles produced, and the incident neutron
energy distribution is determined by time of flight. The measured spectrum
is directly proportional to the desired intensity distribution.
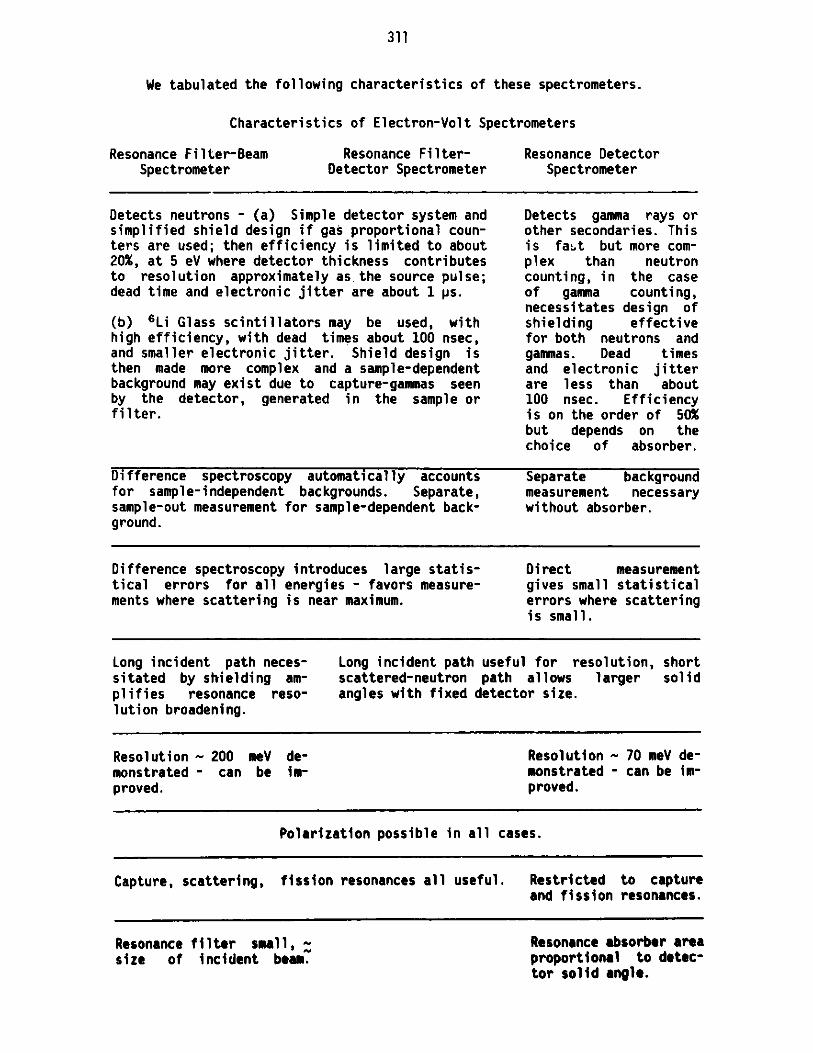
311
We tabulated the following characteristics of these spectrometers.
Characteristics of Electron-Volt Spectrometers
Resonance Filter-BeamSpectrometer
Resonance Filter-Detector Spectrometer
Resonance DetectorSpectrometer
Detects neutrons - (a) Simple detector system andsimplified shield design if gas proportional coun-ters are used; then efficiency is limited to about20%, at 5 eV where detector thickness contributesto resolution approximately as.the source pulse;dead time and electronic jitter are about 1 ps.
(b) 6Li Glass scintillators may be used, withhigh efficiency, with dead times about 100 nsec,and smaller electronic jitter. Shield design isthen made more complex and a sample-dependentbackground may exist due to capture-gammas seenby the detector, generated in the sample orfilter.
Detects gamma rays orother secondaries. Thisis fast but more com-plex than neutroncounting, in the caseof gamma counting,necessitates design ofshielding effectivefor both neutrons andgammas. Dead timesand electronic jitterare less than about100 nsec. Efficiencyis on the order of 50%but depends on thechoice of absorber.
Difference spectroscopy automatically accounts Separate backgroundfor sample-independent backgrounds. Separate, measurement necessarysample-out measurement for sample-dependent back- without absorber.ground.
Difference spectroscopy introduces large statis- Direct measurementtical errors for all energies - favors measure- gives small statisticalments where scattering is near maximum. errors where scattering
is small.
Long incident path neces- Long incident path useful for resolution, shortsitated by shielding am- scattered-neutron path allows larger solidplifies resonance reso- angles with fixed detector size.lution broadening.
Resolution 200 meV de- Resolution 70 meV de-monstrated - can be im- monstrated - can be im-proved. proved.
Polarization possible in all cases.
Capture, scattering, fission resonances all useful. Restricted to captureand fission resonances.
Resonance filter small, ~size of incident beam.
Resonance absorber areaproportional to detec-tor solid angle.

312
Resonance Filter-Beam Resonance Filter- Resonance DetectorSpectrometer Detector Spectrometer Spectrometer
Detector far from sample, Detector close to Sample - detector dis-so small detector solid sample, so large detec- tance 10cm accomplished.angle. tor solid angle.
Filter independent of detector simplifies cooling to Cooling of absorber pro-reduce Doppler broadening contribution to resolu- bably requires coolingtion. of secondary-particle
detector.
Pulse shape rejection of gamma ray background pos- Backgrounds can be re-sible with use of 6Li scintillators. duced by coincidence
counting or spectro-scopy of secondaries atsacrifice of efficiency.
We find the RFBS, and the less-tested RFDS to be apparently simple devices,
notably useful for testing methods. The RDS requires more complex detector
technology, but for statistical reasons will probably be best especially for
problems in which the scattering of interest is small compared to the average
scattering from the sample, the most-common case.
So far tests have been mostly in measurements characterizable as those of
struck-particle momentum distributions. Richard Silver showed that these can
include some interestingly-structured, but easily-resolvable features. Much
more exploration of magnetic, molecular and electronic excitations is needed,
as well as tests of the RFDS, which can be done in more-or-less simple adapta-
tions of TOF diffractometers.
The technique using the difference spectra obtained using resonance
devices of two different thicknesses of absorber should be tested. Here,
the absorption (1 - -na(E)) is proportional to na(E) in the wings of the
resonance, but due to self-shielding in the thick case, is less sharp near
the peak than in the thin case. The difference spectrum can be made sharper
than that in the thin-absorber case. The technique would be applicable to
any of the spectrometers discussed here.
Gavin Williams described the potential advantages, particularly for low
Q scattering, of using thick composite filters which have strong resonance
absorbtion regions on either side of the energy range of interest. When
placed in the direct beam, these filters suppress background and greatly
enhance signal to noise.

313
D. A. Gray, C. W. Potts
N
H. Conrad, B. Diplock, M. Meier, C. Tschalar
A. W. Armstrong, D. Filges

314
J. Goldstone, W. S. Howells, H. Wroe, M. H. Mueller
G. J. Russell, T. A. Broome, J. Goldstone
315
ICANS-VI ANL
INTERNATIONAL COLLABORATION ON ADVANCED NEUTRON SOURCES
June 27 - July 2, 1982
PROGRESS ON THE SNS TARGET STATION
A Carne
Rutherford Appleton Laboratory
Chilton, Didcot, Oxon, UK.
Introduction
This progress report is a continuation of reports given in the previous
ICANS meetings. In particular, the report given at ICANS IV (1) was a
definitive statement of the overall Target Station, containing the
expected performance parameters. This review gives progress and
modifications covering the last eighteen months, under the five broad
areas of Target, Target Assembly, Control System, Bulk Shield and Remote
Handling. Finally a discussion of additional facilities to the SNS is
presented.
2 Target
(i) The general description of the target was given at the ICANS IV
meeting. Since that time a full description of the theoretical study on
the whole target assembly, based on a modified HETC code package, has
been produced (2).
A study of the cooling tests on target plate models has shown that the
cooling is mainly forced convective and that the expected uranium
centreline temperatures would be as low as 2900C. Accordingly new
uranium thickness been obtained based on a centreline temperature
of 3800C and assuming a reduction of up to 101 in thermal conductivity
due to uranium burn-up. The choice of temperature allows a greater

316
mechanical strength and a margin of error in reduction of beam size (~
10%) or in beam intensity (~ 20%) whilst keeping below the cavitational
swelling regime of radiation damage. The new target will have 23 plates
in 4 batches of uranium thickness 7.7mm (8), 9.7mm (8), 16.8mm (4) and
26.2mm (3), as shown in the schematic diagram, figure 1.
(ii) Fabrication of the zircaloy-2 clad uranium plates has been under
development with the Fulmer Research Institute in the UK. The HIP
bonding technique is used in which the assembly of uranium disk and
zircaloy cover plates are subjected to an isostatic pressure of 2000
bars in an argon atmosphere furnace at 8000C for 3 hours. Two
successful test plates have been obtained with complete bonding;
however, $-quenching to refine grain size resulted in some small areas
of de-bond at the corners. This problem is being investigated, along
with mounting of thermocouple wells.
3 Target Assembly
(i) The four moderators discussed in reference (1) have been
confirmed and their basic geometries fixed, as shown in Table 1. Of the
two lower, cryogenic, moderators one will be liquid methane at 95 - 97K
and the second will be para-hydrogen at 25K. The moderators will be
single phase to give uniform density and flow, requiring operating
pressures of 4 atmospheres (ie. subcooled with TB~ 131K) for methane and
15 atmosphere (ie. supercritical) for hydrogen. New estimates of the
total energy deposition in the moderators indicate values of about 665W
for the methane and 520W hydrogen moderators for an assumed 200 A on
target. These new figures have been based on references (3) and (4) and
are about two times the previous estimates. Further details of the
moderators are given elsewhere is this meeting (5).
(ii) The moderators will be surrounded on all but the exit faces by
decoupler using a boron loaded laminate containing 35% of natural B4 C,
to give an effective decoupling energy of about 3eV. No decoupler is
proposed for the hydrogen moderator, high intensity of the long
wavelength neutrons being required rather than pulse shape. The beam
ports through the reflector will also contain decoupler of the same
type. The total energy desposition is expected to be about 4KW, to be
removed through thermal contact with the reflector vessels.
3174 Control System
The target station control system has three tasks: to set up and
monitor the operation of the plant, to provide an interlock system to
ensure safe operation and to provide an emergency shutdown system whilst
maintaining cooling of the target at all times. The system itself is
composed of 4 parts; (i) a Minicomputer Control System (MINICS) using a
GEC 4070 minicomputer to provide the overall control function and to
carry out routine monitoring, (ii) a Microcomputer Control System (MCS),
using. an Intel iSBC microprocessor, to monitor the vital parameters
related to the condition and safety of the target station components
(eg. target temperatures, coolant pressures and flow) and to provide
the facility for a software-generated beam trip under monitored faults,
(iii) a Target Beam Trip (TBT) to provide a hard-wired interlock
operating independently of the computers, (iv) Coolant Control Logic
(CCL) to ensure adequate cooling to the target in the event of plant or
computer failure. Each of the first three parts is capable of turning
off the proton beam in the event of a fault thus providing a three-fold
heirarchy of safety monitoring and operation: the last part ensures
continued target safety under all circumstances, eg. against decay
heating which has a maximum value of about 9KW. The CCL is implemented'
using programmed logic controllers (PLCs) in a triple redundant
configuration such that a single failure within a PLC will not cause CCL
malfunction.
Sensors (eg. temperature, pressure, position) are standard radiation-
hard commercial devices connected to standard panel meters which
interface directly to the data acquisition system. Modular design is
maintained to allow rapid servicing and simple alignment and
calibration. This basically simple system is designed to make
commissioning and trouble shooting as straight forward as possible and
to enhance reliability.
The system is designed so that the target station, once set-up, can be
left unattended during normal operation with monitoring and control
exercised remotely via the main SNS control system.
5 Bulk Shield
Major components of the bulk shield have been designed and have been
delivered or are under construction.

318
The shielding inserts provide local supports into which the collimated
neutron beams and their shielding are placed. The arrangement makes the
mounting of the neutron beams independent of the bulk shield and so
allows flexibility in any future instrument layouts. The inserts, in 6
modules, have been delivered and figure 2 shows the mounting of a set of
three in the bulk shield. The second set will be mounted in July/August
of this year. The datum base plates and the central pillar, acting as
the target station central datum and the eventual emergency drain pipe,
can also be seen in this figure.
The shutter "vessels" contain triangular shielding wedges and the
neutron beam shutters. The shielding wedges are in production, with
completion expected by the end of November 1982. The shutters
themselves are designed and the order for manufacture will be placed in
September 1982. The centre section of the shutter incorporates a cast-
lead collimator with its own helium atmosphere.
The target void vessel provides a contained atmosphere of helium, at
4.5mbar below ambient, around the target assembly. The helium gas
performs several functions: at 95 concentration it guarantees there is
no risk of burning or detonation with complete leakage of either or both
cryogenic moderators; when circulated it provides cooling for the 5KW
energy deposition in the vessel walls; it serves as a low attenuation
transport medium for thermal neutrons. The void vessel is some 3.2m
diameter and 3.2m high. Its walls contain eighteen neutron beam double
windows each of size 190 x 190mm2 of 2 x 0.5mm thick aluminium.
Pressure cycling tests of a single 0.5mm sheet from ambient to vacuum to
ambient, with 207mbar on the other side, have shown a distortion of less
than 10mm over a 1000 cycles without failure. The number of cycles is
an order of magnitude greater than -ever likely in operation. The vessel
has been designed, is being constructed under the ASME III category 'A'
regulations and is due' for delivery in April 1983.
Figure 3 shows the void vessel. In this figure can also be seen the
tubes for the proposed Fusion Materials Irradiation Test Facility, which
will sample the backward flux of fast and high energy neutrons escaping
from the target assembly. At the location shown, fluxes of11 - 2 -1 10 -2 -14 x 10 ncn sec f or En a 1 IhV and 4 :a 10 ncm sec f or En a 10MeV
are expected for a 200 VA input proton beam.

3196 Remote Handling
The dimensions of the remote handling cell have been fixed at 3.3m (L)
by 4m (W) by 5.5m (H). The walls and roof are respectively 1.6m and lm
thick. The wall thickness will reduce the radiation dose rate at the
outside of the shielding to less than lO uSv/hr and so allow prolonged
use of the manipulators. Detail design is underway for installation,
together with the rail and drainage systems, in the second half of this
year. The overall ventilation system has been specified according to
the appropriate UK codes of practice.
A full scale mock-up remote handling cell has been built to start the
testing and development of the tools and techniques for handling all the
components of the Target Assembly. The major task is removal and
replacement of the target. The alignment and lifting frames and the
mechanism for rotating the target from horizontal to vertical prior to
pi.acing it in the storage wells have been built. The overall operation
of removing a (dummy) target, rotating it and placing it ready for
storage takes about 1+ hours. Various fasteners for the target flange
have been examined, with captive swing bolts appearing to be the best.
Coolant seals for this flange (and others) have also been studied, with
silver-plated stainless steel ("Corruseals") giving the best seals with
minimum corrosion.
Figure 4 shows part of the target removal operation showing the lifting
frames around the dummy target. More details of remote handling are
given elsewhere in this meeting (6).
7 Other Facilities
The use of an irradiation test facility in the target station has
already been mentioned: there are further major facilities additional
to the SNS based on an intermediate transmission target located in the
extracted proton beam some 20m upstream of the main SNS target. These
facilities consist of a negative pion beam for medical applications and
a surface u+ beam for studies in solid state and chemistry using the uSR
technique. The pion beam will rely on the high intensity of the proton
beam and will complement the existing facilities at SIN, LANL and
TRIUMF. The surface mon beam will be unique in that it will be pulsed,
give useful u stopping rates up to 100 tides greater than existing
facilities and give wide flexibility in available operating modes.
Figure 5 shows a general layout of the Experimental Hall with the
.intermediate target' station, pion and mion beams.

320
(i) The target itself will have a variety of geometries with graphite
thicknesses up to 50mm in the proton beam direction, resulting in a
reduction of thermal neutron flux from the main SNS target of up to
about 16%. Various tunes of the proton beam are available to produce
different waist sizes (horizontal and vertical) at the target as
required by the pion and moon beams whilst still satisfying the main
optics requirement of transmitting good beam onto the neutron production
target. Local steel shielding will be installed around the target to
reduce the external radiation dose rate to the same value as elsewhere
for the EPB shielding, ie. less than 7iSv/hr. Further shielding may be
added as necessary to ensure low time-independent backgrounds for the-
neutron instruments.
(ii) The biomedical pion beam will be a conventional low momentum (up
to 210 MeV/c) negative pion beam of large acceptance (285 mar %Ap/p),
which combined with the 200 zA incident proton beam will generate dose
rates in the pion stopping region (volume 120 x 80 x 70mm3, 0.67 litres,
depth 285 - 375mm in tissue) of 0.11 Gy/min (10.9 Rads/min). The
primary task of this beam will be radiological experiments and
eventually radiotherapy on human patients. A comprehensive programme of
research with this beam has been proposed by groups from UK universities
and medical institutions.
(iii) The 28MeV/c pulsed surface muon beam facility will be one of the
only two plsed it sources in existence, the other being the low current
(Ip - 24A) source at KEK. The advantages of a pulsed u source will be
combined with those of a surface muon beam to achieve increases of up to
a factor 100 of the useful p+ stopping rates for USR studies. The beam
will incorporate two fast kicker magnets, the first separates the
individual moon bursts generated by the intrinsic pulse structure of the
SNS proton beam (2 x 100ns bursts separated by 230ns, repeated at 50Hz)
and the second to shorten each r"?lse down to. ~0ns FWHM when required.
The use of Soller-type collimators before the second kicker might allow
a decrease of the final pulse width down to 1 - 2ns. Beam intensities
of 10701+/s total, ie. 105 u+/burst will be available with the full time
width of each burst. This intensity decreases linearly with pulse width
down to the 1 - 2ns available. The beam will include a crossed-field
electrostatic velocity selector which, at 10% rating, will eliminate
electron contamination, and at full rating (E - 5MV/m, B - 6.5 x 10⁻²T,
L - 2.3m) will rotate the moon polarisation from 100% longitudinal to
100% transverwe.

321
The beam can also be operated with the pulse separation facility for
cloud muons of both charge signs of momentum up to 50MeV/c and as a
conventional high momentum pion beam (w ) up to 200MeV/c.
The principal use of this beam will be for SR, channeling experiments
in solid state and a wide spectrum of pure research with pions and
muons.
The status of this work is that funds have been provided to allow the
modification of the EPB for the future implementation of these
proposals. The proton beam line has been redesigned and includes the
use of large aperture quadrupoles (which already exist); the mechanical
support systems for the quadrupoles and a rail system have been designed
to overcome the restricted access due to the presence of the
intermediate target; the EPB shielding has been modified to allow the
installation of either or both beams; detail work is starting on the
intermediate target itself. No further committment has yet been made on
the biomedical beam; but for the SR beam work is going ahead to prepare
a full proposal for presentation at the end of this year with the
possibility of installation ready for SNS "Day One" in 1984.
8 Acknowledgements
This report gratefully acknowledges the work of the members of the SNS
Target and Utilisation Group, in particular Tim Broome, Dave Clarke,
Brian Diplock, Gordon Eaton, John foaston, Mike Holding, Bernard
Poulten, Ken Moye, Ken Roberts and Eddie Fitzharris and Colin Thomas,
also the collaboration with members of Neutron Division.
9 References
(1) A Carne, "Review of SNS Target Station". Proceedings of ICANS
IV, KEK Tsukuba, Japan, October 1980.
(2) F Atchison, "A Theoretical Study of a Target Reflector and
Moderator Assembly for SNS". Report RL-81-006, April 1981.
(3) N Watanabe and K Boning, "Summary of Energy Deposition and
Cryogenic Equipment". Proceedings of ICANS V, Juich, West
Germany, June 1981.

322
(4) E Karle, K Hain, W Leiling, "Technisches Konzept einer Kalten
Neutronen-Quelle fur die SNQ". SNQ Study Teil III Kf A
Julich/Karlsruhe, June 1981.
(5) B R Diplock, "Cryogenic Moderator Design". This Conference.
(6) B H Poulten, "Remote handling Equipment For SNS". This
Conference.

323
TABLE 1
SNS Moderators
A
H20
316 K t 1 K
High Intensity
at expense of
resolution
-I - --
B
CH4
95 - 97 K 1 K
High Resolution
slowing down
spectrum
C
p-H2
25 K 1 K
Long wavelength
D
"20
316 K t 1 K
(as required)
dimensions of moderator material, =m
w
h
d
120
120
15
30
45
Poison: 0.05mm
Gd. Clad
Decoupler: 6mm
boron loaded
laminate, 35%
natural B4C
Void Liner: As
for decoupler
(shared with
'D')
120
115
45 (at centre)
Poison:
provision for
future incor-
poration
Decoupler: 6m
boron loaded
laminate, 35Z
natural 14C
Void Liner: As
decoupler pref-
erred (shared
with 'C')
110
120
80 (at centre)
Poison: None
Decoupler: None
Void Liner: 1am
Cd preferred
(shared with
'3')
120
120
2205
22.5
45
Poison: 0.05 sm
Gd. Clad
Decoupler: As
'A'
Void Liner: As
for decoupler
(shared with
'A')
ai

IITAL OF RATECONSTRUCTION
Td ihx) = 380'
W max - 300 Wci
T (Zr) -120*CII
nM -- m rn-Io
SJK OUTLET TEMPERATURE 509C
- OUTLET PRESSURE 3-4 BARS
N C
2-66th
2-66 LA
1-77 Lt -
WA
HEN POSITED IN TARGET KW
dln"''J intuding d.mr 20
a in Zhdoy-2 dadiNg 6
'""n I" V"" x 'i'ng Windw 7
diin Hey Wher Cwbr* S
TOm ____
MET PRESSURE 4-76 BARSHEAVY WATER COOLANT
AT 13'C
COOLANT GAPSz17SmIUVELOCITY N GAPS.55.Is
FIG :1 TARGET C00LNG PARAMETERS AND TEMPERATRE DSTRBUIM (RUL INTENSITY PROTON BEAM)
-I,a
I
- - -I
1
ILISOJEL 71E8PRESSURE VESSEL

325
Fig. 2. Installation of first set of shielding inserts.
UPPER WEWHIN PLUG
,AM ENEr
N
QoL AM
urv
Fig. 3
Target station void ves-sel (vertical section)
sI
-nr-/
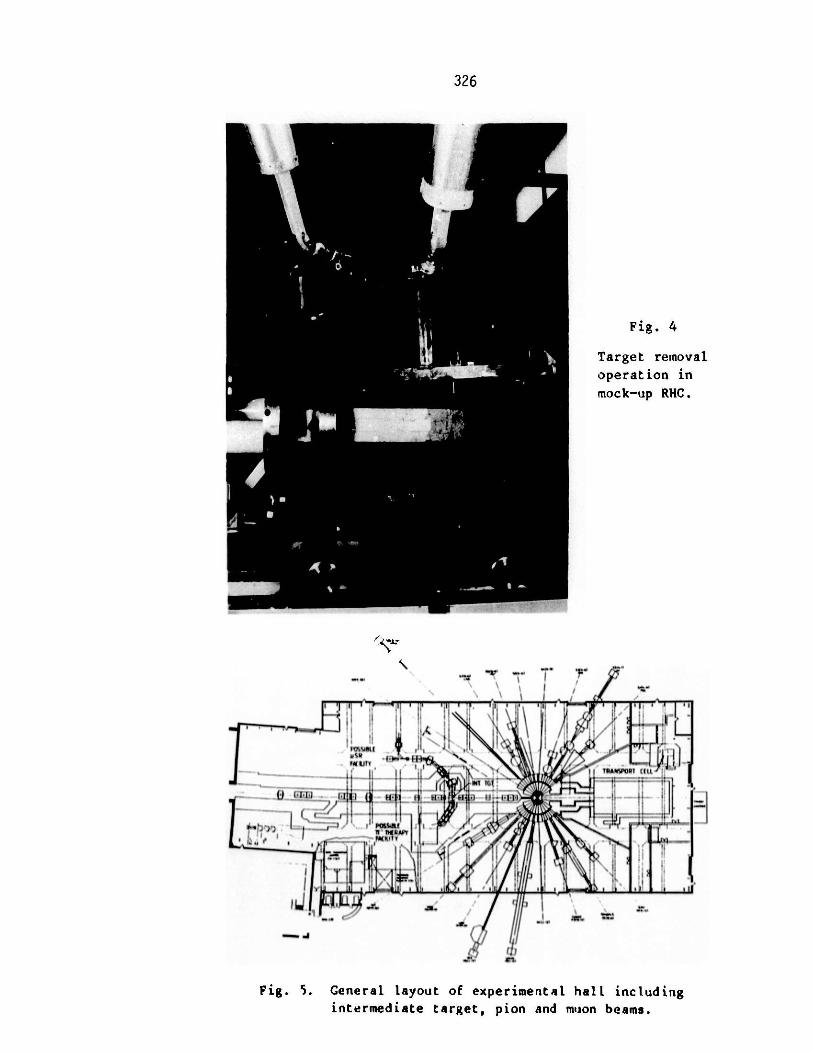
326
Fig. 4
Target removal
operation inmock-up RHC.
I.,.
L.1 M " il,-,I ' ...-
Ie -
Fig. S. General layout of experimental hail includingintermediate target, pion and muon beams.

327
ICANS-VI
INTERNATIONAL COLLABORATION ON ADVANCED NEUTRON SOURCES
June 27 - July 2, 1982
CRYOGENIC MODERATOR DESIGN
B R DiplockRutherford Appleton Laboratory
Chilton, Didcot, Oxon, United Kingdom
ABSTRACT
This paper describes the present design of the two cold moderators to be built
for the Spallation Neutron Source. It discusses the reasons behind a number
of the design features and highlights several problem areas requiring
solutions before a final design can be constructed.

328
ICANS-VI
INTERNATIONAL COLLABORATION ON ADVANCED NEUTRON SOURCES
June 27 - July 2, 1982
CRYOGENIC MODERATOR DESIGN
B R DiplockRutherford Appleton Laboratory
Chilton, Didcot, Oxon, United Kingdom
1. INTRODUCTION
This paper is intended to be a report on the current position of the two cold
moderators being designed for the SNS. It is not meant to indicate how cold
moderators should be designed, but rather to indicate the authors present
thinking in the hope that it will stimulate discussion.
2. TARGET/MODERATOR ASSEMBLY
The position of the four moderators with respect to the target is shown in
Fig 1, two ambient temperature moderators above the target, and two cryogenic
moderators below. The physics requirements for the four moderators is shown
in Table 1.
The forward lower moderator contains liquid methane (CHO) at a temperature in
the range 95-97K controlled to 1K, and the rearword lower moderator contains
supercritical hydrogen (H2) at a temperature of 25 1K.
The methane is at a pressure of 4 atmospheres so that the boiling point
(131.4K) is well away from the operating temperature to minimise the formation
of bubbles which would give unacceptable density variations.
The hydrogen is at a pressure of 15 atmospheres, ie. above the critical
pressure, to again avoid the risk of large variations in density.

329
3. MODERATOR VESSEL DESIGN (FIGS 2 AND 3)
Since the moderating fluids are at elevated pressure:, both vessels need to be
design". as pressure vessels, and a compromise needs to be reached between
wall flatness and thickness. Ideally, for maximum coupling to the target, the
walls should be completely flat and for minimum wall interactions, should have
zero thickness.
To a first approximation, the ratio of wall radius of curvature to thickness
is constant for a given stress level. It is possible, therefore, to vary one
of the parameters, provided the other is varied simultaneously. Thus a flat
wall requires to be thick, or alternatively, a thin wall needs a small radius
of curvature.
A spherical radius of 250 mm has been chosen for both vessels coupled with a
wall thickness of 3 m for the CH4 vessel, and 5 mm for the H2 vessel. The
material for both vessels is a 3.5% Mg aluminium alloy, since it has good
mechanical properties at cryogenic temperatures and is easily welded.
The hydrogen moderator design has triple containment, the space between the
outer wall and the vacuum vessel being filled with pure helium gas at a slight
pressure above the outside volume. This latter volume is the target void
vessel containing a minimum of 95% helium, the remainder being air. If no
triple containment were provided, any leak through the vacuum vessel would
allow the 5% air to cryopump on to the cold moderator vessel. Under
irradiation ozone and various oxides of nitrogen would be formed which could
explode spontaneously possibly causing a major failure of the moderator and
target assembly. The pure helium blanket around the vacuum vessel provides a
guarantee that air can never reach and cryopump on to the cId vessel.
4. HEAT LOAD
The heat load on the moderators arises from several sources. The vastmajority of the energy input is due to nuclear heating within the moderatingfluid itself, and this is very large compared with the heat input due to

330
thermal radiation. As a result, there is little penalty in deleting the
thermal radiation shield on the hydrogen moderator that is customary for
cryogenic vessels that operate at temperatures below 80 K. Deletion of this
shield reduces both the complication and also the material in the neutron
beam.
A summary of the estimated heat loads from the various sources is shown in
Tables 2 and 3 together with the moderator flow rates require' to keep the
temperature rise to the values stated.
The magnitude of the energy deposition in the moderator due to nuclear heating
causes great concern, since the accuracy of the estimate appears to be poor.
Under-estimation results in too little refrigeration capacity being available
with the result that the operating temperature will not be attained, and
over-estimation means that large amounts of money are needlessly used to
provide over-size refrigeration.
The estimates that have been made for SNS have been based on information given
at ICANS V1) and from SNQ2). This information has been extrapolated
in the best possible way to the proton been power of SNS.
It is very necessary for further experimental and theoretical work to be done
to corroborate these estimates.
5. HEAT REMOVAL
Early calculations indicated that it was not possible to remove the heat from
a static volume of moderator without unacceptable temperature variations due
to the limitations of natural convection and conduction.
It was decided therefore that there remained two alternatives:-
a) Design a local circulation system for the moderator and transfer the heat
via a heat exchanger to cold helium gas flowing through a long transfer line
from the refrigerator.

331
b) Circulate the moderator through the long transfer line to the
refrigerator.
Option a) reduces to a minimum the areas where hazardous gases are present,
but requires a circulation fan to be placed in a high radiation environment,
and the extra heat exchanger requires an operating temperature drop that
reduces the operating temperature of the refrigerator.
Option b) is a simpler system but has a considerably larger region containing
hazardous fluids.
After careful consideration, it was decided to opt for the second alternative,
largely to avoid the problem of breakdown of the circulating fan in the high
radiation area and its subsequent replacement using remote handling
techniques.
6. LAYOUT OF CRYOGENIC SYSTEM
The general layout of the cold moderator system is shown in Fig 4. The
target, moderator, transfer lines, refrigerators and shielding plugs are all
mounted on a number of trollies making up a train. The whole assembly is
designed to move horizontally on rails a distance of about 8 m to place the
target assembly in the remote handling cell for maintenance work, target
change, etc.
As can be seen, the transfer lines pass through the primary and secondary
shielding plugs and have an overall length of about 16 m. As a result, it is
very difficult, if not impossible, to design a removable transfer line without
dis-assembling the shielding plugs. It is proposed therefore to design the
transfer lines that are installed in the shielding plugs to be permanent and
of maximum possible reliability. This means that they will have a minimum
number of joints which will be fully welded and of high integrity.
To allow changes in moderator design to be accommodated, a demountable joint
will be incorporated between the primary shielding plug and the moderator.

332
Due to the extremely intense radiation in this region, this joint will be
designed for breaking and re-making using remote handling techniques, thus
posing a major design problem.
As the refrigerators are mounted on a trolley in a restricted area, emphasis
will be placed on using a design which is as compact and integrated as
possible. It is hoped that an inert working fluid can be used, and that fans
for circulating the moderating fluids will be incorporated in the
refrigerators. The basic requirements for the refrigerators are shown in
Table 4.
7. IRRADIATION EFFECTS ON METHANE
It is expected that a partial breakdown of the methane moderator will occur
under irradiation and the products will be hydrogen gas and higher
hydrocarbons, such as ethane, propane, etc.
The hydrogen gas can be removed fairly easily by a gas eliminater, but the
higher hydrocarbons pose more of a problem. Some of the radiation products
may have a freezing point above the operating temperature of 95 K so there is
a finite risk of partial or complete blockage of the circuit, particularly in
the refrigerator area.
To avoid this it is proposed to continuously remove a small percentage of the
fluid, replacing it with fresh methane. It is anticipated that this will
maintain the levels of the higher hydrocarbons at a sufficiently low level to
avoid the risk of blockage. The amount of fluid to be removed has not yet
been established, but it is hoped that it will be considerably less than 1% of
the total flow.
A schematic layout of the methane circuit, Fig 5, shows this outgoing methane
bleed cooling the make up gas in a regenerative heat exchanger.

333
8. OUTSTANDING PROBLEMS
As was said in the introduction, this paper is a report on the author's
thinking on cold moderator design and it is clear that a number of problems
still exist which should be resolved before the two moderators are built and
commissioned. These can be summarised as follows:-
a. Temperature Variations in Moderator
The present design has a simple "in and out" flow system. .Will this be good
enough to maintain the temperature variation within 1 K, or must a more
sophisticated design of flow channels be incorporated?
b. Temperature Excursions Due to Variations of Proton Beam Intensity
(including On/Off transients)
What magnitude of excursions will occur and what time interval is there before
temperatures settle down to within the acceptable limits?
c. Design of Remote Handled Transfer Line JointHow simple, or difficult, will it be to design a reliable leak tight joint
using remote handling techniques?
d. Risk of Methane Freezing in the Refrigerator
Is it reasonable to operate the moderator at 95 K (4.5 K above the freezing
point) without the risk of local freezing in the refrigerator heat exchanger?
e. Triple Containment for H2 Moderator
Is the risk of air cryopumping on the hydrogen moderator vessel sufficientlyreal to warrant incorporating a pure helium atmosphere in a triple
containment?
f. Radiation Breakdown of Methane
What is the magnitude of the build-up of higher freezing point radiation
products and how can they best be eliminated?
Answers to the above questions are not easy to obtain, but are necessary in
order to design and build cold moderators having a high degree of reliability

334
and safety.
9. ACKNOWLEDGEMENTS
The author gratefully acknowledges the help of various members of the SNSTarget and Utilisation Group in discussions on cold moderators, and toRob Hambleton, Graham Toplis and Elaine Wright for producing theillustrations.
10. REFERENCES
1. N WATANABE and K BONING.Equipment". Proceedings
"Summary of Energy Deposition and Cryogenicof ICANS V. Julich, West Germany, June 1981.
2. E KARLS,.K HAIN, W LEILING. "Technisches Konzept einer Kalten NeutronenQuelle fur die SNQ". SNS Study Teil III, Julich/Karlsruhe, June 1981.

335
TABLE 1
SNS Moderators
-
A
H20
316 K 1 K
High Intensity
at expense of
resolution
B
CH4
95 -97 K 1 K
High Resolution
slowing down
spectrum
C
p-H2
25 K 1 K
Long wavelength
D
H20
316 K 1 K
(as required)
dimensions of moderator material, mm
w
h
d
120
120
15
30
45
Poison: 0.05mm
Gd. Clad
Decoupler: 6mm
boron loaded
laminate, 352
natural B4 C
Void Liner: As
for decoupler
(shared with
'D')
120
115
45 (at centre)
Poison:
provision for
.future incor-
poration
Decoupler: 6mm
boron loaded
laminate, 352
natural B C
Void Liner: As
decoupler pref-
erred ('hared
with 'C')
110
120
80 (at centre)
Poison: None
Decoupler: None
Void Liner: la
Cd preferred
(shared with
'B')
120
120
22.5
22.5
45
Poison: 0.05 mm
Gd. Clad
Decoupler: As
'A'
Void Liner: As
for decoupler
(shared with
'A')
__ __ _ __ __ -

336
TABLE 2
25K MODERATOR (PARA-HYDR06EN)
MAx. DIMENSIONS: 12 cm H, 11 cm W, S8cm D,VOLUME: " 1 LITRE
HEAT INPUT: NUCLEAR IN H.NUCLEAR IN ALUMINIUMTHERMAL INTO MODERATOR
TRANSFER LINE (80K+25K)CIRCULATING FAN
TOTAL REFRIGERATION
TEMPERATURE RISE ACROSS MODERATOR ' 1.300H. FLOW RATE: % 33G/SEC. (500 CM'/SEC)
H, PRESSURE: 15 ATM ADS. (SUPERCRITICAL)
454 w*30 wt35 w
519 w
6w60 w
585 w
* BASED ON J.. Iaf/CN' -hiA FOR 500) EVAM (REF I CASV)t BASED ON J.I /6 FOR ALURINIU AND 53BEAM (REF SNIQDTA)
TABLE 3
95K MODERATOR (ETHANE)
MAx. DIMENSIONS:VOLUME:
1.c5 cM H, 12 cmM , 4.5 CM D." 0.6 LITRES
NEAT INPUT : NUCLEAR IN CH.NUCLEAR IN ALUMINIUMTHERMAL INTO MODERATOR
TRANSFER LINE
CIRCULATING FAN
TOTAL REFRIGERATION
TEreuaaimi RisE AcRoss MODERATOa 2 CCM, FLOW RATE: % 986/sEC (220 CN'/SEC)CH. PREKSt: 4 ATM AssSOILINS POINT: 131.4K
* Aweo 2. i a/Cm'- MA FOR S0 REY (REF IC VLS BASE iW i.u/ FO ALMiNi$ AN D D EAM (REF -'ITA)
TALE 4
EFRI6ERATONS
SAT 25K* 150 M AT I0 FOR RADIATION SHIELD.MokIRs FLUID: HIGH PRESSURE HELIUM M As.
TRANSEA FLUID: SUPERCRITICAL HYDOGEN.FLOI RATE: 50 CM'IsEC. (336/sEC)
PIPE boos: 15 M.CIRCUIT RESISTANCE: 40 M.FAR POWER: 60 w INTO TRANSFER FLUID.
FETHS300w AT 95KMORKINS FLUID: HIGH PRESSURE HELIUM GAS.
TRANSFER FLUID: LIbJIDH TNANE.
FLOW RATE: 220 cM'/sEC. (96 6/GEC).PIPE boRE: 15 M.CIRCUIT RESISTANCE: 30 M.FAN Pon: 60 w INTO TRAsNPER FLUID.
625 w"13 wt26 w
664 w60 w60 w
784 w

Moderated Neutrons
Moderated Neutran Target V."." Wa
AMBIENT- -- -TEMPERATUR
MODERATORES
-- - -
TAWET MWAFE
- EtTIM Tx CUM -DWER M0ERATMS
,,,al~- fl-f
-- - - - -- --
Fig. 1. Target/uoderator/reflector assembly
Vapour PN.tur
MOdreed Nwutrons
High Energy NewoiU
1 ii4 44 1444
Fig. 2.
Targ~ eS -aMigi Energy Neutrom.
Fig. 3. Methane Moderator (95K)
pper .- -..... ... . -
f 'f f e r / o a o 4 oL0 2030
S5
Hydrogen Moderator (25'K)
*n
ll
aloes
nl
IU
mw

338
Gos
mole Hn Cell
- - IdirbPI g
Cold Moderators(2 off)
/ / / //ff///// /7-'
H2 Transfer Line AC H4 Transfer Line 0 1000 2000
1 Scae rn/rn
Fig. 4. General layout of cryogenic system
CH4 Gas
H.P.C linders
Moderator H2 Go.HeatExchangers
Buffer VolumeGas
Electrical Heating Eliminatorfor
Temperature Control PrimaryShieldCirculatingPlug Fan
RemoteHandledJoint
15 metres
Fig. 5. Schematic layout of methane circuit
'1
TargetAssembl
iR
aeom imary hield'
Trolley
Storage
Ref rgCUnits
.BaseT.. rollia reuey
irrrrrr irr irrrr !!
/ / // / /

339
ICANS-VI
INTERNATIONAL COLLABORATION ON ADVANCED NEUTRON SOURCES
June 27 - July 2, 1982
REMOTE HANDLING EQUIPMENT FOR SNS
B H PoultenRutherford Appleton Laboratory
Chilton, Didcot, Oxon, United Kingdom
1. INTRODUCTION
This report gives information on the areas of the SNS facility which become
highly radioactive preventing "hands-on" maintenance. Levels of activity are
sufficiently high in the Target Station Area of the SNS, especially under
fault conditions, to warrant reactor technology to be used in the design of
the water, drainage and ventilation systems. These problems, together with
the type of remote handling equipment required in the SNS are discussed.
2. DESIGN OF THE SNS FACILITY
The SNS facility is being built in the old "Nimrod" accelerator buildings,
some existing "Nimrod" equipment is being utilised wherever possible in order
to save costs. This fact restricts the design parameters when consideration
has to be given to remote handling as neither the buildings nor the Nimrod
equipment was designed with remote handling in mind.
This has not deterred the designers from considering the problems of remote
handling. All equipment has been designed to cater for quick release of the
water, electrical and vacuum connections. The majority of acceleratorcomponents are in modular form; a module, once disconnected, can be slid orlifted out of its position and a new modular unit fitted. The old unit is
then taken to an active handling area in Hall 1 where maintenance can beundertaken. "Nimrod" magnets have also been set in modular units down the EPBline.

340
When designing an SNS type accelerator the ventilation, water and drainage
systems have to be considered for active and remote handling. Systems have to
be designed to cope with a target failure however low the probability of this
type of incident occurring. If such a failure should occur, the ventilation
and filters in the water circuit should be capable of being renewed by remote
handling techniques. Radioactive material spilt on the floor must be able to
be washed down to a recovery tank in the drainage area.
There have been very few problems in designing these basic requirements into
the systems as standard Atomic Energy Codes of practice, proven over the
years, have been used. The main codes of practice used, especially in the
Target Station.area, are listed in Table 1.
3. REMOTE HANDLING AREAS
Fig 1 shows the SNS facility with the Ion Source, pre-injector and linac in
the foreground. It is envisaged that these items should be able to be
maintained with normal "hands-on" maintenance. Special handling equipment has
been devised to handle the steering magnets and chopper vessel installed after
the linac(Ref 1). This equipment (modified fork lift trucks) will aid in
keeping time spent by the maintenance crews in a high radiation area down to a
minimum.
All other areas shown in figure 1 require some form of remote handling
equipment to undertake maintenance tasks around the facility. They are:-
Area 1 Synchrotron Hall.
Area 2 The Extracted Proton Beam Line running from the Synchrotron Hall to
the Target Station.
Area 3 The Target Station in Building R55.
Area 4 Transfer Tunnel and Cell.

341
4. REMOTE HANDLING EQUIPMENT
4.1 Area 1 Synchrotron Hall
As yet no firm decision has been made as to the type of equipment to purchase
for work in the area. It is thought that radiation will not reach a level
that will prevent "hands-on" maintenance until two years after the start-up
date.
To keep radiation levels as low as possible in this area, it is proposed to
encase the accelerator in a shielding wall. All electrical and water
connections to the synchrotron will be outside the wall to enable "hands-on"
maintenance methods to be applied, vacuum vee band clamps are to be
disconnected by long rods or by over-the-wall type manipulators.
Some special components, eg. scrapers, will be handled by some form of remote
handling from very early on. The main purpose of the shield wall is to
minimise activation of the building itself and to contain the activity of
"hot" items so allowing freer access elsewhere. The shield will be added
gradually as and when needed. We must be careful that the extra time needed
for access to the enclosed units does not result in greater doses to the
people involved.
Long term plans are to install a mobile remote manipulator aided by remote
manipulators mounted from one of the cranes. This type of equipment has been
proven at LAMPF, Fermi and CERN labs. Consideration is also being given to
purchase a Marauder type vehicle(Ref 2).
Cranes will be radio-controlled in this area; special techniques are being
devised to determine the position of a crane to aid remote handling. So that
"hands-on" maintenance can be undertaken on the cranes, they will be parked in
special shielded areas when the accelerator is operating.
Viewing will be via television cameras. TV cameras are to be mounted on
cranes and specially designed track vehicles(Ref 2). Lighting intensity
will be as that proposed for the HEF mock-up at Los Alamos(Ref 3).

342
4.2 Area 2 The Extracted Proton Beam Line
This is the most difficult area of the accelerator to maintain, for not only
are the radiation levels high but the area available for remote handling work
is extremely restricted. Also the major part of the equipment is ex-Nimrod
stock. Vacuum, electrical and water connections are to be disconnected by a
mobile manipulator. The modular units are mounted on rails, once released
from their supplies they are then motored down the tunnel to an area where
they can be removed.
Viewing equipment will be the same as that used for Area 1 in the Synchrotron
Hall.
4.3 Area 3 Target Station
The target which contains 33 kg of Uranium 238 becomes highly radioactive
under irradiation by the 800 MeV 200 pA proton beam. Because of this high
level of radioactivity, a specially designed remote handling cell is being
installed where the target can be removed safely (see figs 2, 3 and 4). The
cell has been designed using four commercial through the wall type
manipulators, two either side of the target, and two standard zinc bromide
windows for viewing purposes. A one tonne remotely operated crane is used for
lifting purposes, entry into the cell is via the transfer tunnel and then
through the floor of the cell. See fig 5.
To ensure accurate fitting of the target to the water cooling flanges and to
prevent the mating flanges from being damaged, a special lifting frame for the
target has been produced. The target in the lifting frame is first swung into
position on the rail system with the mating flanges 150 mm apart, the target
is then pushed forward on a small trolley. Alignment, if required, is
achieved by using the alignment screws on the lifting frame.
The target is supplied to the cell in a vertical mode and is stored Rfter
irradiation in storage wells in the same position.

343
In order to turn the target into the horizontal position (and back to
vertical) a special turning frame has been designed.
The flanges are tightened by a pneumatic nut runner which is supported by a
balancer mounted on a swinging jib.
There Are three storage wells in the cell, each target is stored in a well for
approximately one year before its removal. The storage wells are fitted with
a separate cooling circuit to remove the decay heating in the targets. Before
a target is removed from its working position, the storage well cooling
circuit is coupled to a secondary cooling circuit of the target. Whilst the
target is being moved and stored, the target is cooled at all times.
The reflector and cold moderators have yet to be finalised in design(Ref 4)
but it is envisaged that special handling equipment will be made to help
maintain the moderators in service. To give adequate viewing of these
components, TV cameras are being placed in the cell.
4.4 Area 4 Transfer Tunnel and Transport Cell
The Transport Cell is similar to the Remote Handling Cell but contains onlytwo sets of through-the-wall manipulators. Facilities for installing zinc
bromide windows will be made but they will only be installed if it is proven
that TV viewing is not adequate. The main function of the Transport Cell is
to handle the target into its Transport Flask but it will also be used as a
general remote handling workshop.
Radioactive material it received from the remote handling cell via the
transfer tunnel and through the cell floor. The material is then placed in
suitable radioactive containers and dispatched through a large shielded door
at floor level.
To transport the radioactive material between the remote handling cell and the
transport cell, a remotely operated transport trolley has been designed. The
transport trolley has a cask with 100 mm lead walls to carry the active

344
material. This thickness of lead gives sufficient protection for a person to
work hands on for a few minutes on the transport trolley in the event of a
breakdown. Viewing of the transport trolley in the tunnel will be undertaken
with TV cameras.
5. TARGET FLANGE DESIGN
Several flange designs have been tried in the mock-up remote handling cell.
See figs 6, 7, 8 and 9. The Vee Clamp performed well but it cannot be
incorporated into the design as it fouled the cold moderator system. At least
10 clamps would be required to obtain the correct closing force on the seal.
The lever clamp assembly and the standard nut and bolt were not as easily
fitted with remote manipulators as the other two systems.
The swing or eyebolt gave some problems in the cell but worked well once the
spring loaded ball was fitted. This enabled the bolt to be placed in the
required position whilst the runner was fitted. A firm decision has been
taken to use this bolting arrangement.
6. DRAINAGE AND VENTILATION SYSTEMS
If a target failure occurs all the activity is contained within the target
station area. To ensure complete encapsulation, the drainage and ventilation
systems are being designed to the latest AECP standards.
The drainage system, see fig 10 has been designed to be double sealed
throughout the complex. Where pipework goes outside the complex, the pipework
is double contained. All inner pipework is stainless steel but to reduce
costs the outer pipes may be painted or zinc coated mild steel if they are in
a rust free area.
The Synchrotron Room had a drainage and ventilation system installed for
Nimrod. The low level active drainage network has been modified and checked.
Extra filters are being added to the ventilation plant to ensure that the

345
system is suitable for the SNS.
For the Target Station area a complete new ventilation system is being
designed, see fig 11. Several important factors have had to be taken into
consideration. They are:
a. The activated air in the target shutter vessels.
b. The helium in the target void vessel.
c. The air in the remote handling cell, the services area, the transfer
tunnel and transport cell.
d. The hydrogen and methane plants in the services area.
The major activity in the shutter void vessel is 41Ar (half life 1.8 hr),
1i%, (half life 20.5 min) and 13N (half life 10 min), see Ref 5. Air
from the shutter void vessel is routed via the EPB line and then the
Synchrotron Room, the air takes two hours to pass this route thus ensuring at
least one half life decay period has occurred. The air from the shutter void
vessel is also used for removing 13 kW of heat from the shielding and target
void vessel, this heat is removed before it is sent down the EPB line.
To keep a safe atmosphere in the Target Void Vessel, because of the presence
of hydrogen and methane, the target void vessel is run at a higher pressure
than the surrounding ventilation systems, ie. the target shutter vessels and
the remote handling cell. However, to ensure no activity ever escapes from
the target void vessel to the surrounding atmosphere, the target void vessel
is run at a negative atmospheric pressure. In operation, the target shutter
vessel and the remote handling cell will be at -55 mm WG and the target void
vessel at -45 mm WG.
The filters in the Target Void Vessel will be the new Harwell circular type,
see Ref 6.
The air systems in the remote handling cell and the services area all have
HEPA filters (99.95% Eff) to remove particles. Charcoal filters are fitted to
remove 1311.

346
The hydrogen and methane plant ventilation systems have sufficient capacity to
remove the total air volume in the plant area in one minute.
7. CONCLUSION
When designing a complex such as the SNS, certain areas of the plant are
closer to reactor technology than accelerator technology and have to be
designed accordingly. Although this increases the design load, no new
technology is required as drainage, ventilation and remote handling techniques
for highly radioactive components are well known in the nuclear industry.
8. ACKNOWLEDGEMENTS
The author gratefully acknowledges John Hogston who has carried out design
work both on the remote handling cell and the drainage system, Graham Toplis
for producing the illustrations and Claire Cheesmore for typing the report.

347
REFERENCES
Ref 1 70 MeV Injector Component Handling in the HEDS Tunnel. P Gregory.
Internal SNS Report No. SNS/AMM/P8/81.
Ref 2 'Manufactured by Morfax Ltd, Mitcham, England.
Ref 3 HEF Mock-up at Los Alamos. Paper No. LA-UK-82-1393.
Ref 4 Cryogenic Moderator Design. B R Diplock. This conference.
Ref 5 Activation of Air in Shutter Vessels. T Broome. Internal SNS Report
No. SNS/FNV/M6/80 Amend 1.
Ref 6 Development of Filters and Housing for Active Plant. S Hackney and
R Platt. AERE UKAEA. 17 DOE Nuclear Air Cleaning Conference.
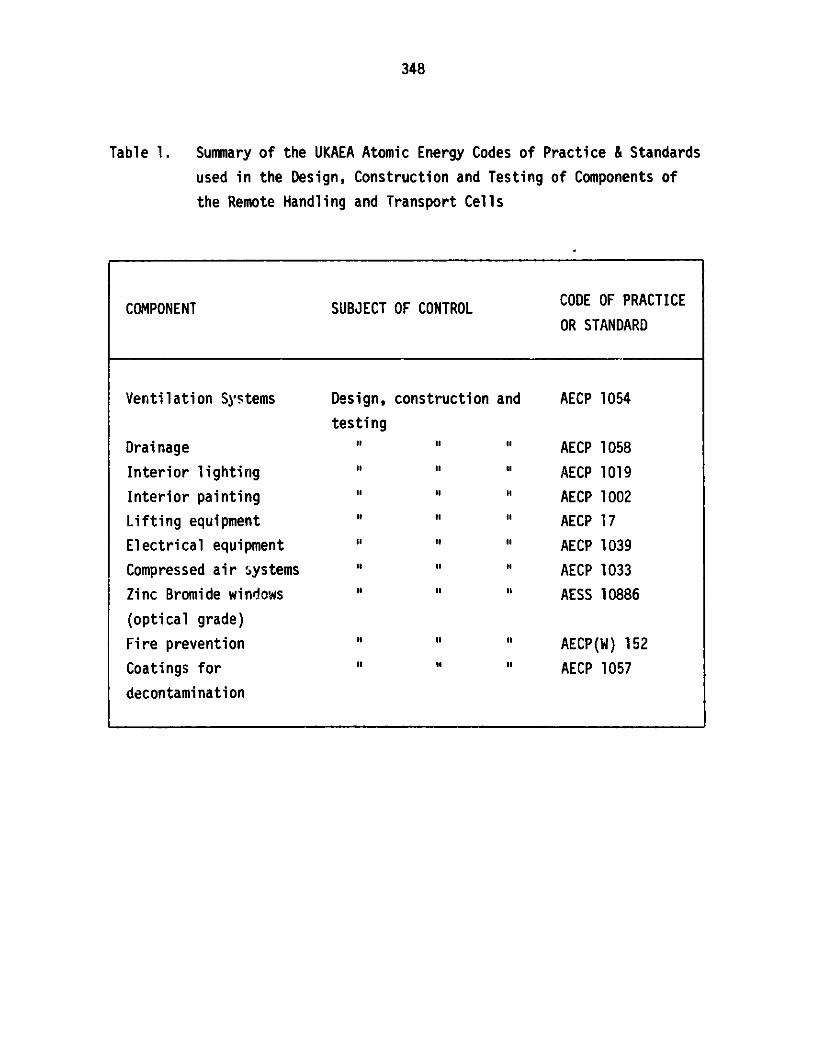
348
Table 1. Summary of the UKAEA Atomic Energy Codes of Practice & Standards
used in the Design, Construction and Testing of Components of
the Remote Handling and Transport Cells
COMPONENT SUBJECT OF CONTROL CODE OF PRACTICE
OR STANDARD
Ventilation Systems Design, construction and AECP 1054
testing
Drainage AECP 1058
Interior lighting AECP 1019
Interior painting "' " AECP 1002
Lifting equipment " " " AECP 17
Electrical equipment " " AECP 1039
Compressed air systems " AECP 1033
Zinc Bromide windows " "' AESS 10886
(optical grade)
Fire prevention " " " AECP(W) 152
Coatings for " " " AECP 1057
decontamination
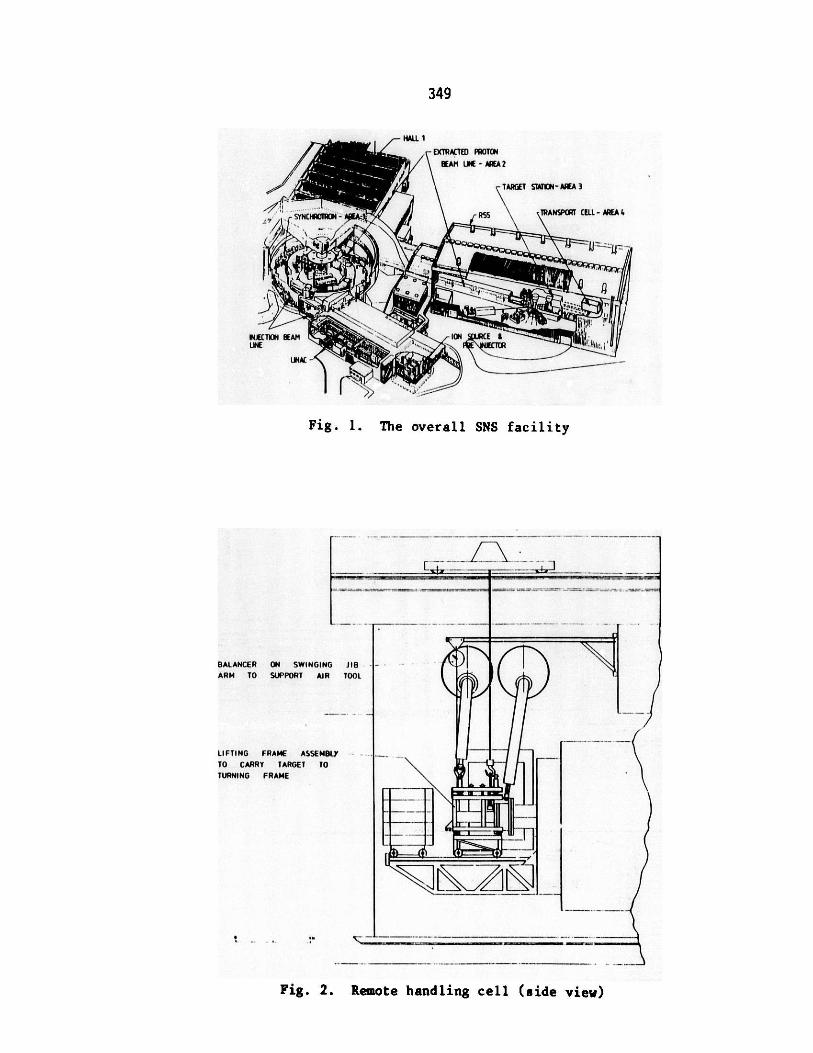
349
HALL 1
EXTRACTED PROTON
BEAM LIN -- AREA 2
RS 1RANSPOT CELL -AREA 4
INJECTION BEAM /ION E t
UIN- - -
Fig. 1. The overall SNS facility
BALANCER ON SWINGING JIBARM TO SUPPORT AIR TOOL
LIFTING FRAME ASSEMBLYTO CARRY TARGET TOTURNING FRAME
77zZJF -~
1-40
Fig. 2. Remote handling cell (side view)

LXTLNM0I IILACIIMAINPUI AT OR12 EACHI Sit*
ZNC ROIDE
WIN OOW
TRANSFER TUNNEL
S W L I T ONNE
AMIENT TEMPERATUREE MODERATOR SERVICES
UNDERGROUND TRANSPORT ZI1
TROLLEY IN RAISEDPOSITION SHOWING DOUBLE L CRYOGENIC TEMPERATURESEAL /MODERATOR SERVICES
LIFTI
RAILS * DOUBLE CONTAINMENTDRAINAGE SYSTEM
C BRMOE
WINDOW
NO TABLE
Fig. 3. SNS remote handling cell (end view)
U'
i

/
STORAGE WELLS FORSPENT TARGET
_ E1ZINC BROMIDEL WINDOW-
7-
(j~N.
KIi \<
4-
AMBIENT MODERATOR / REFLECTOR-
ASSY ROLLED FORWARD TOSHOW TARGET
ZINC BROMIDE
WINDOW-
TURNING FRAME
Fig. 4. SNS remote handling cell (plan view)
w,
FL
i-iII~
119
V
- -- -

352
REMOTE
EPB LINE
E HANDLING CELL
MAIN SHIELDING
TRANSFER TUNNEL
TURNTABLE
)RT CEL L
TRANSPORT TROLLEYRAIL SYSTEM
10- - - Metres
Fig. 5. Remote handling cell, transfertunnel, and transport cell.
THREAD MACHINED DAMN TOCORE DIA
q-jj=L
Fig. 7
Swing or eyebolt
\\
ZI Fig. 6
Standard nut and bolt
Ii
L-Ff
- SPRING LOADED BALL
LOCATES BOLT IN 2
POSITIONS
ii H i F 1 -
1 - I a m R i
TRANSPO
I I

--
353
Fig. 9
Vee clamp
NI=
I I
-
Fig. 8
Lever clamp assembly
9 1

M00 2 I1 MODS REFLECTORSECONDARY SEC(ONARYI
TARGETEtERIEEY El
H0N
TKs
TARGETRGENCY
020
SHED DOOR
I- - - - - - - ~- -
V
1 PIPEWORK L 2 CRYfOGENS 3
*f'q - s--Pil - -
1
I- I
t .3 t
rt at- -- - - --. - - - f r
VOID VESSELTANK
D 1 O 1 HJ3
DRAIN ' DRPTANK I TANK SECONDARY
DRAINAGE -N4.
TANK 1 Dq - TANK 2110RHC+SERVICES RHC SERVES+DRAIN TRANSPORT DRAINS
MODERAIOR 110SECONDMY TARET
COOLING DRAIN
DRAIN TANK
- - BASINSTAPE 3 TANK 4 TANG 5
ITAl T WETOR H=0
010 00
D P-DUMP TANK
Fig. 10. Drainage system for SNS target station
EHETARE HA
HEADER MOD 1 11TARGET
Ot0 IVOID
VESSEL
REFLECTR
0=0
HEAR
REMITEHANIlNGCELL
/tI r "[ "
xIWE
Z
(A)U,
5 .. J n L_ .. I
i I f--.
w r-
Y L i ;/\
I
I
w w w
A-

S-SPAR. ARRESTORCF-COARSE FILTER
HF-EPA FILTER
C - COLER
D-DAMPER
F -FAN
CH'-CHARCOAL FILTER
4- STOP VALVE
ASL -ACTIVE SAMPLING LINE
OAV-ONE WAY AIR VALVE
EEROENEYU
NITROGEN UP
CF
HFCH
CFD
01
F
CCHHFCF
S
SL AS
ASL
DE4
F FD Dt
CH C :j CHHF HF
CF CF
TARGET H FSHUTTEVESSEL
TARGET REMOTEVOID HANDLING
CELL
OAV's
HF - -
WAT R RAI AGESYSTEM
EPB. LINE
D
F
ASL
HF
TRANSPORTCELL
HF_ f
TUNNEL
ASN
C
SYNCHROTRON ROOM
MANIPULATORAREA
STACK
(.n
Fig. 11. Ventilation system for target station
SERVICES Ii")AREA v
01-
\\NX'N XXNX\N\N\
_- - -
t
1
S c

356

357
ICANS-VI
INTERNATIONAL COLLABORATION ON ADVANCED NEUTRON SOURCES
June 27 - July 2, 1982
THERMOFLUID DYNAMICS OF THE l
FOR THE SPALLATION NE.
LEAD-BISMUTH! TARGET
URCE AT SIN
Y. TakedaSchweizerisches Institut fur Nuklearforschung
CH-5234 Villigen, Switzerland
ABSTRACT
Natural convection of liquid Lead-Bismuth Eutectics (LBE) hasbeen numerically simulated and thermal-fluid behaviours of atarget were studied. The calculation was based on the Boussinesqapproximation and made for a simple geometry of a vertical cyl-indrical container with a distributed internal heat generation.Studies have been made of the effects of the target height, beampower and adiabatic side wall. They showed that the naturalconvection is effective for transporting heat and the verticalcylindrical target is practicable.
358
THERMOFLUID DYNAMICS OF THE LIQUID LEAD-BISMUTH TARGETFOR THE SPALLATION NEUTRON SOURCE AT SIN
Y. TakedaSchweizerisches Institut fur Nuklearforschung
CH-5234 Villigen, Switzerland
1. INTRODUCTION
The spallation neutron source at SIN is planning to use Lead-Bismuth Eutectics (LBE) in a liquid state as a target material[1]. Since the proton beam power is quite high (MW level), thechoice of a liquid target seems attractive from the standpoint ofheat removal. Furthermore it is planned to have a vertical targetwith beam entry from the bottom. The principle of this idea is toutilize the natural convection of LBE to transport the heatdeposited by the beam in the lower part of the target, to a heatexchanger at the top. In spite of the attractions of a liquidtarget for high current beams from accelerators, hydrodynamicinvestigations are not plentiful. In the German project [2],pumped liquid metal was an alternative candidate for the target,and experimental and theoretical investigations were carried out.At TRIUMF, the lead target is in a partially molten state duringoperation. Calculations including natural convection were done[3] for this horizontal cylindrical target, and this seems to bethe only thermofluid dynamical analysis of natural convection ina liquid target.
The principal difficulties of the problem are as follows:
(i) natural convection is in a completely confined spacewhich allows no use of boundary layer theory,
(ii) the very low Prandtl number of liquid metal,(iii) a difficulty in defining the Grashof number because
of the distributed internal heat generation,(iv) a fairly large aspect ratio (height/radius) which
may lead to hydrodynamic instability,(v) high power deposition.
A further result of the difficulties is that they can lead theflow regime into the turbulent region. For turbulent flow, it isvery difficult to obtain an analytical prediction for an optimaldesign of the target. There exist a very limited number of reportsof experimental work for turbulent natural convection of liquidmetal.

359
In the present work, the numerical simulation was performed fornatural convection of LBE in a vertical cylindrical container offinite length, in order to examine the general thermofluidbehaviours.
2. CALCULATIONAL METHOD
2.1 Assumptions
In formulating the problem, the following assumptions wereadopted:
(i) All the physical phenomena are axis-symmetric, andthe beam profile does not change during irradiation,so that the problem is treated in a two-dimensionalsystem.
(ii) The flow is laminar.(iii) The Boussinesq approximation is valid, that is, all
the physical properties are constant except for thoseaffecting the buoyancy force.
(iv) The LBE is always molten so as to avoid the movingboundary problem.
The coordinate system used is shown in Fig. 1. Only the half planeof the vertical cross section is shown.
Z
H Fig. 1Gravity Schematic of target and
coordinate system.
Ha
rirProton Beam
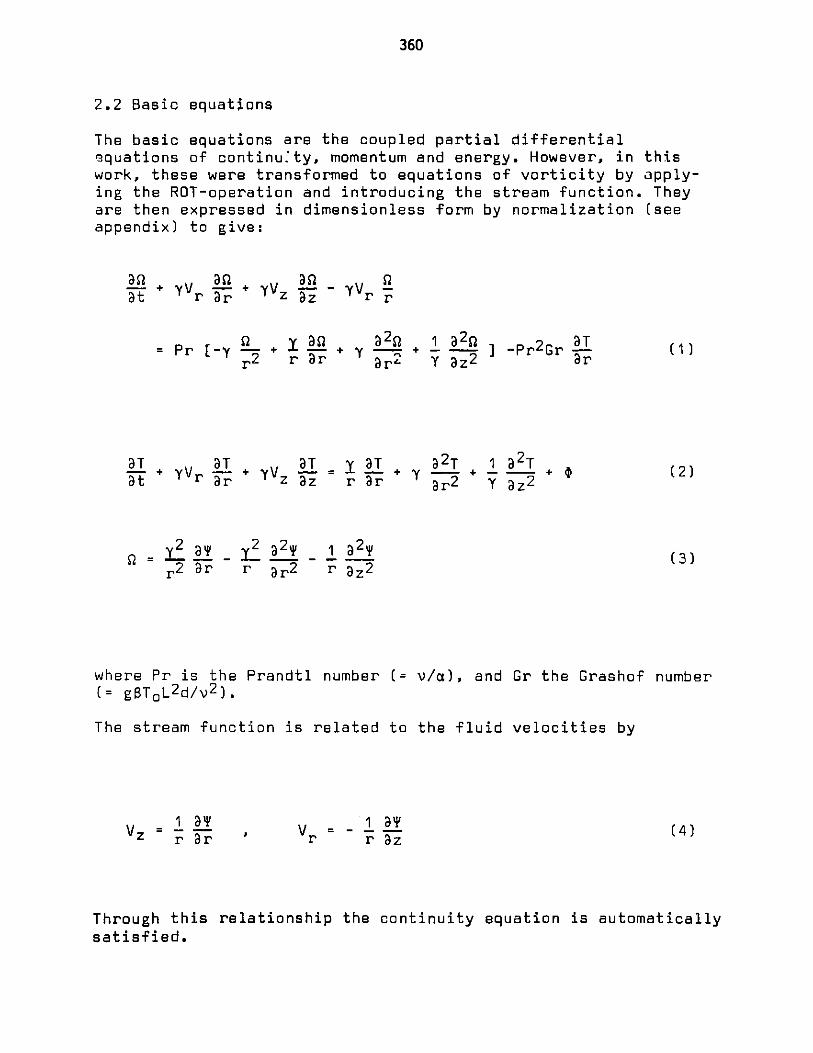
360
2.2 Basic equations
The basic equations are the coupled partial differentialequations of continuity, momentum and energy. However, in thiswork, these were transformed to equations of vorticity by apply-ing the ROT-operation and introducing the stream function. Theyare then expressed in dimensionless form by normalization (seeappendix) to give:
- + YVr - + V -- YVrat r ar Y z az Y r r
si asp 2 1 92g DT= Pr [-y - + - + -- + iPrG -r2 rar yar Y22-PrG 3r
DT aT aT aT + 2 T 1 a 2 T-t + aV -z+a - r= 1 - -- +. +at' r ' Z z r ar ar2 Y az2
r2 ar r ar2 r
(1)
(2)
(3)a 21yz22
where Pr is the Prandtl number (= v/cs), and Gr the Grashof number(= gaToL2d/v 2 ).
The stream function is related to the fluid velocities by
1 a
Z r 3r
r 1 aVr r * 3z (4)
Through this relationship the continuity equation is automaticallysatisfied.

361
2.3 Boundary and initial cgnditi ons
Boundary conditions for the stream function are taken as
; z = 0&1
; r = 0&1
; r = 0
0 < r< 1
0 < z < I
0 < z < 1
0 < z < Ha
and the thermal boundary conditions are
; r = 1
; Z = 0&1
Ha< z < 1
0 < r < 1
where Ha is the length of the adiabatic surface as defined inFig. 1.
Since vorticity boundary conditions cannot be given, they areapproximated with the values at the next inside grid points andcorrected by iteration.
Initial conditions were determined from the assumption of havinga quiescent liquid with a uniform temperature (the melting tem-perature of LBE)
Vr Uz 'I' 0u T 0 at t * 0 (10)
Most of the calculations were carried out with a boundary con-dition of the full length of the side wall at a constant tem-perature (conducting wall, Ha = 0),
2,4 Profile of heat generation
As the driving force for the fluid motion of the target liquid isonly the buoyancy force-due to the internal heat generation, andno external temperature difference is applied to the system, the
DT - = 0az
T = =0
aT-r=
(5)
(6)
T = 0
-T = 0
3 Z
(7)
(8)
(9)
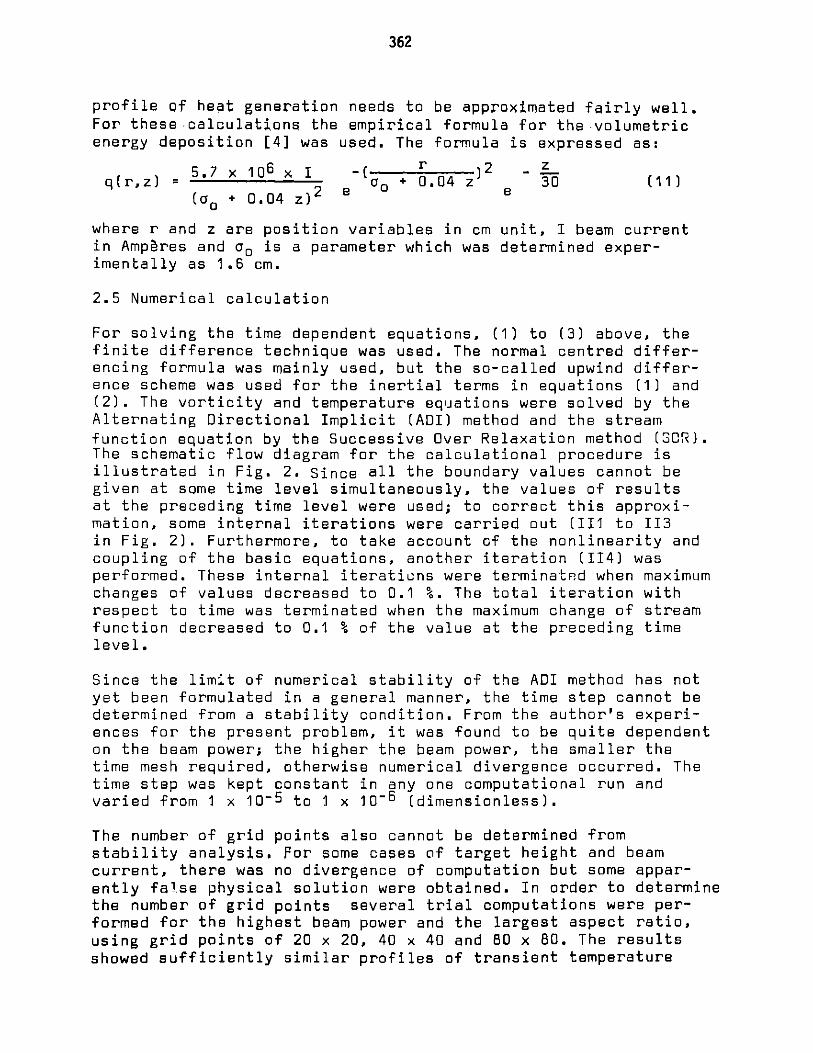
362
profile of heat generation needs to be approximated fairly well.For these.calculations the empirical formula for the volumetricenergy deposition [4] was used. The formula is expressed as:
6 x r 2 _ zq(r,z) = 5.7<x106 I e' Q + 0.04 z 30 (11)
(Q + 0.04 z)2 e 0 e
where r and z are position variables in cm unit, I beam currentin Amperes and co is a parameter which was determined exper-imentally as 1.6 cm.
2.5 Numerical calculation
For solving the time dependent equations, (1) to (3) above, thefinite difference technique was used. The normal centred differ-encing formula was mainly used, but the so-called upwind differ-ence scheme was used for the inertial terms in equations (1) and(2). The vorticity and temperature equations were solved by theAlternating Directional Implicit (ADI) method and the streamfunction equation by the Successive Over Relaxation method (3OR).The schematic flow diagram for the calculational procedure isillustrated in Fig. 2. Since all the boundary values cannot begiven at some time level simultaneously, the values of resultsat the preceding time level were used; to correct this approxi-mation, some internal iterations were carried out (III to 113in Fig. 2). Furthermore, to take account of the nonlinearity andcoupling of the basic equations, another iteration (114) wasperformed. These internal iterations were terminated when maximumchanges of values decreased to 0.1 %. The total iteration withrespect to time was terminated when the maximum change of streamfunction decreased to 0.1 % of the value at the preceding timelevel.
Since the limit of numerical stability of the ADI method has notyet been formulated in a general manner, the time step cannot bedetermined from a stability condition. From the author's experi-ences for the present problem, it was found to be quite dependenton the beam power; the higher the beam power, the smaller thetime mesh required, otherwise numerical divergence occurred. Thetime step was kept constant in any one computational run andvaried from I x 10- 5 to I x 10-6 (dimensionless).
The number of grid points also cannot be determined fromstability analysis. For some cases of target height and beamcurrent, there was no divergence of computation but some appar-ently false physical solution were obtained. In order to determinethe number of grid points several trial computations were per-formed for the highest beam power and the largest aspect ratio,using grid points of 20 x 20, 40 x 40 and 80 x 80. The resultsshowed sufficiently similar profiles of transient temperature

363
Input Dataand
Initialization
Solve
Temperature E q. 111
SolveVorticity Eq.
Solv e
Stream function Eq. 12 113
Calculate
Velocity field
Printout
Stop
Fig. 2Flow diagram of numerical calculation
field and stream lines for 40 x 40 and 80 x 80, that 40 x 40was used in the series of computations.
All the computations were carried out on the SIN VAX-11 computer.

364
3. RESULTS AND DISCUSSIONS
For most of the computations, the following values are common:a target radius of 15 cm and a beam current of 0.1 mA. The ma-jority of the results are presented as contour maps of streamfunction and temperature. The contour lines of stream functionrepresent the path of flow of an elemental fluid particle. Theoutermost contour for both temperature and stream function,correspond to the lowest values (= dT and dT), and these valuesare also used as the interval between the lines. Explicit valuesof dT and dT are given in the figure captions.
3.1 Transient behaviours
3.1.1 Streamline field and temperature profile
Figure 3 shows the transient temperature distributions and stream-line fields for a 150 cm high target with side wall cooling.
(a) (b) (c) (d) (o) (f) (g) (h)
Fig. 3Transient behaviour for a 150 cm high target. Beam current is0.1 mA. Contour lines are for dT = 0.05 (6.3 OC) for tempera-ture in (a) to (m), 0.025 (3.1 C) in (n) to (p), and with
d T = 10 for streamline. (a) is at 1.2 x 10⁻⁴ (3.8 sec) and
the time interval is 8 x 10⁻⁵ (2.5 sec).
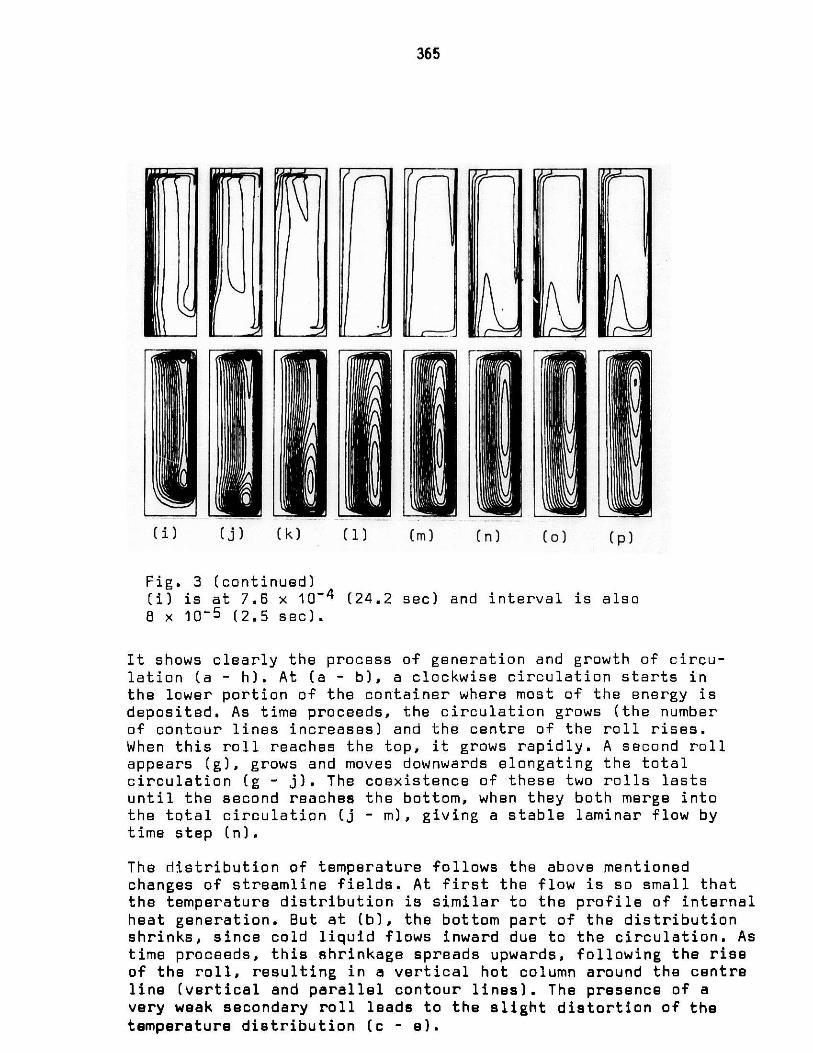
365
(i) (j) (k) (1) (m) (n) (o) (p)
Fig. 3 (continued)(i) is at 7.6 x 10⁻⁴ (24.2 sec) and interval is also8 x 10- 5 (2.5 sec).
It shows clearly the process of generation and growth of circu-lation (a - h). At (a - b), a clockwise circulation starts inthe lower portion of the container where most of the energy isdeposited. As time proceeds, the circulation grows (the numberof contour lines increases) and the centre of the roll rises.When this roll reaches the top, it grows rapidly. A second rollappears (g), grows and moves downwards elongating the totalcirculation (g - j). The coexistence of these two rolls lastsuntil the second reaches the bottom, when they both merge intothe total circulation (j - m), giving a stable laminar flow bytime step (n).
The distribution of temperature follows the above mentionedchanges of streamline fields. At first the flow is so small thatthe temperature distribution is similar to the profile of internalheat generation. But at (b), the bottom part of the distributionshrinks, since cold liquid flows inward due to the circulation. Astime proceeds, this shrinkage spreads upwards, following the riseof the roll, resulting in a vertical hot column around the centreline (vertical and parallel contour lines). The presence of avery weak secondary roll leads to the slight distortion of thetemperature distribution (c - e).

366
A stronger effect can be seen from the first roll in figures (f)(h), At the.top of the container the strong local circulation
makes the isothermal lines horizontal transporting heat from thecentral region to the periphery. Following the downward motion ofthe second roll, the hot liquid column (which is partially cooledat the surface) flows down, leaving the intermediate region(core) between the central hot column and surface at low tempera-ture (g - i). When the second roll reaches the bottom (j), thiscore becomes an island of lower temperature. During the time whenthe two rolls are merging and the total circulation is growing,the central hot column is washed away and the position of thetemperature maximum moves from the bottom centre to the topcentre (j - 1), and a relatively uniform temperature distributionis formed (1 - m). However, once the total circulation is estab-lished, the heat is accumulated around the centre line and formsthe central hot column again (n - p). The maximum temperature isalso at the bottom centre. The high temperature gradient due tothe side-wall cooling can also be seen.
This general aspect of temperature profile and streamline fieldagrees well with the experimental and numerical investigation byTorrance et al. [5]. Their work was done for natural convectionof air in a cylindrical container of unit aspect ratio (but withlocal heating at the bottom surface) and, in particular, showedthe "vortex shedding" during the transient phase for a highGrashof number system.
3.1.2 Time change of temperature
Figure 4 shows the change of temperature with time for a 150 cmhigh target. Tmax is the maximum temperature in the system whilethe others are at fixed points. The total length of time is1.68 x 10-3. The maximum temperature increases very quickly toabout 75 0C above the melting temperature. It then drops, reachinga stable value of 26 C after some weak oscillations. The pos-ition of the maximum temperature is mainly located at the bottomcentre of the target, but during the drop, it moves up the centreline.
Temperatures at the fixed points show a similar behaviour to thatof the maximum; an increase followed by a decrease with a some-what flat "plateau" inbetween. The starting time of the tempera-ture increase is earlier and its "plateau" value is larger, thecloser the point is to the bottom centre. This behaviour of thetemperature can be understood as follows: At first, the hot fluidheated by the beam flows up and increases the temperature atthese points, and then, as the flow is being established coldfluid is carried in from the peripheral regions to decrease thetemperature. For the lower portion of the target, the small over-shoot at the start of the "plateau" might be caused by the devel-
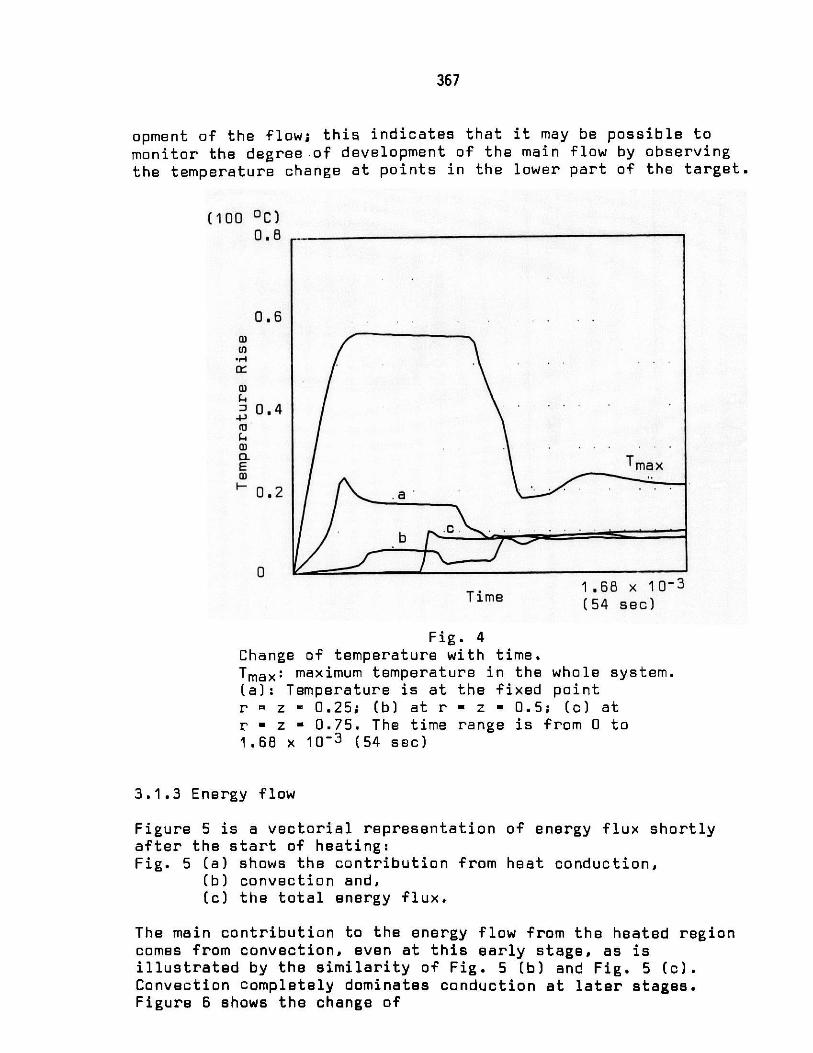
367
opment of the flow; this indicates that it may be possible tomonitor the degree of development of the main flow by observingthe temperature change at points in the lower part of the target.
(100 0 C)0.8
0.6
OJ
o:
a)
0.4(a03CLE
~ 0.2
0
Time1.68 x 10-3(54 sec)
Fig. 4Change of temperature with time.
Tmax: maximum temperature in the whole system.(a): Temperature is at the fixed pointr = z - 0.25; (b) at r - z - 0.5; (c) atr - z - 0.75. The time range is from 0 to1.68 x 10-3 (54 sec)
3.1.3 Energy flow
Figure 5 is a vectorial representation of energy flux shortlyafter the start of heating:Fig. 5 (a) shows the contribution from heat conduction,
(b) convection and,(c) the total energy flux.
The main contribution to the energy flow from the heated regioncomes from convection, even at this early stage, as isillustrated by the similarity of Fig. 5 (b) and Fig. 5 (c).Convection completely dominates conduction at later stages.Figure 6 shows the change of
Tmax
.a
b . .
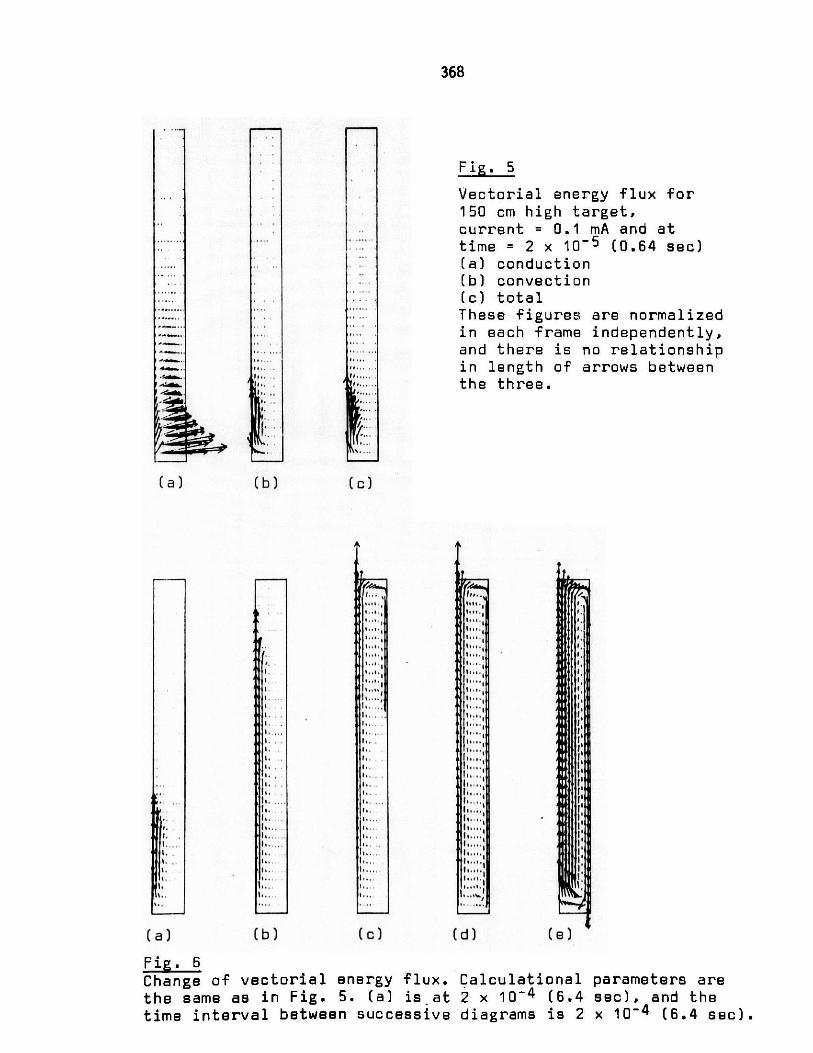
Fig. 5
Vectorial energy flux for150 cm high target,current = 0.1 mA and attime = 2 x 10⁻⁵ (0.64 sec)(a) conduction(b) convection(c) totalThese figures are normalizedin each frame independently,and there is no relationshipin length of arrows betweenthe three.
Its.
11,x,.
11..::
11....,
1 1 ..,
(d)
,I
9.
I,
I,
I,
I,11I,I,I1I1
I,II
I,II
Ce)
Fig. 6Change of vectorial energy flux. Calculationalthe same as in Fig. 5. (a) is at 2 x 10⁻⁴ (6.4time interval between successive diagrams is 2
parameters aresec), and thex 10-4 (6.4 sec).
368
11..
Fr.
(b)(a) (c)
I:1.
1.1.
I.
1.
1.1.
11.
rI.
11.
1..
1.
11...
(b)
I..,.1
Il..,.'
I.
I..
(c)
1,.1.1.
1.1..
(a)

369
the total energy flux with time, The change of the energy flow isfairly large, and follows the development of the liquid flow.When the flow is established, the energy flows towards the centreline in the bottom regions of the target and towards the peripheryat the top. In the middle region of the target, the energy flowsvertically upward in a central column transporting the depositedenergy to the top. This heat is then transferred to the cooledwall during the downwards flow in the outer region of the target.
3.2 The effects of physical conditions
3.2.1 Target height
Figure 7 gives a comparison of the profiles of temperature dis-tribution and streamline fields for various target heights atone fixed dimensionless time (1.6 x 10⁻³). By this time, the totalcirculation is well established for all three cases. The value ofstream function is largest for the shortest target. The generalfeatures of the temperature distribution are the vertical iso-therms in the central and peripheral regions, horizontal iso-therms in the top region, and a fairly uniform temperature dis-tribution in the intermediate core. Inversion layers are generatedby the total circulation at the top centre and the bottom periph-ery, indicating some possibility of the appearance of the stag-nation at the bottom corner. From this general behaviour, (butbearing in mind the fundamental limitations in the calculation),we could expect that in the main part of the container a stablelaminar flow develops, which is part of a total circulation
throughout the target and iseffective for energy transport.
Fig. 7Change of temperature (top)and flow (bottom) profileswith target height;radius = 15 cm
O current = 0.1 mA(a) 75 cm at 26.1 sec(b) 150 cm at 52.2 sec(c) 300 :m at 104.5 sec(1.64 x 10⁻³ for all)Contour lines are withdT*= 0.025 (3.1 OC) anddT = 10
(a) (b) (c)

370
3,2,2 Beam power
Calculations were performed with various beam currents for atarget height of 150 cm. Beam currents of 0.1, 0.5 and 1 mA wereused. Profiles for temperature and streamlines are very similaralthough the absolute values of these are different. The signifi-cant difference is that the speed of rising of the roll is some-what larger for higher beam currents. This is caused by thelarger buoyancy forces due to the higher temperature difference.,The highest temperatures in the container were found at the bottomcentre for all three cases, and the values are plotted as a func-tion of beam current in Fig. 8. A power law relationship betweenmaximum temperature rise and beam current was found, and anestimate of the exponent is 0.68, which is in very good agree-ment with the value of 2/3 given by a simple one-dimensionalanalysis [6]. This relationship is helpful in estimating themaximum temperature for other beam currents.
200
100
0)
En
a), 50
4)
o)
a.E0)
20
100 yA Beam Current 1 mA
Fig. aMaximum temperature rise versus beam current
3.2.3 Adiabatic side wall
Calculations were done with the lower half of the side wall adia-batic, for two target heights (150 and 300 cm), in order to seeif a simpler arrangement for the target is feasible. All other
I I I I I I I I

371
conditjonS and parameter values are the same as fpr the case witha conducting side wall. The temperature distribution and stream-line field are shown in Fig. 9. The general structure of the flow
Fig. 9Temperature (top) and flow(bottom) profile for adiabaticside wall condition;(a) Ha = 75 cm(b) = 150 cmPhysical parameters are all thesame as in Fig. 7.Contour lines are withdT = 0.025 (3.1 0 C) anddT = 10
0
(a) (b)
patterns are very similar to the cooled side wall cases (seeFig. 7), with the absolute values of stream function larger in theupper region implying a stronger circulation. The temperaturedistributions show more significant differences. The temperaturegradients are smaller beside the adiabatic surface, which isobviously from the difference of boundary condition, and alsoleads to the simpler temperature profile in the lower peripheraland core regions. Because the area of heat transfer out of thetarget is reduced, the temperature in the central column is higher.At the end of the calculations the maximum temperature rises abovethe melting point were 35.9 0 C for 150 cm target and 32.8 0 C for300 cm, whereas they are 26.00 C and 25.20 C respectively, for con-ducting walls.
4. CONCLUSIONS
Numerical investigations have been made for the natural con-vection in a liquid lead-bismuth target based on the conventionalBoussinesq approximation. Geometrical configurations were restric-ted to vertical cylinders of various lengths. A distributedinternal heat generation was taken into account and is the onlydriving force for liquid motion. The following conclusions are made:

372
1) In the transient phase, the flow bifurcated but did not leadto a hydrodynamic.instability,
2) Following the initial transient phase, a stable total circu-lation is established in all the cases examined.
3) The temperature profile shows that there is a hot column ofliquid about the centre line and a steep gradient at the sur-face. In the intermediate core region, the temperature vari-ation is small.
4) The position of the maximum temperature in a target is at thebottom centre, i.e. at the middle of the beam entry window,except for a short period in the transient.
5) This maximum temperature rise in the transient is several timeshigher, depending on the systems, than that of the stationaryvalue.
6) The maximum temperature rise in the system is directly pro-portional to (beam power)0.6.
7) Calculations with an adiabatic side wall of half the length ofthe target show the accumulation of small amounts of heat in theinsulated region of the system, resulting in a higher maximumtemperature at the bottom center.
ACKNOWLEDGEMENT
The author is grateful to Or. W.E. Fischer, F. Atchison andDr. Ch. Tschalar for their helpful discussions and encouragements.
REFERENCES
[1] W.E. Fischer, Status Report on the SIN Neutron Source,These proceedings
[2] H. Hoffmann, Proceedings ICANS-V, Julich[3] Y. Takeda, to be published[4] L. Buth and H. Werle, INR-996, Kernforschungszentrum
Karlsruhe (1980)[5] K.E. Torrance and J.A. Rocket, J.Fluid Mech., Vol. 36 (1969)
p. 21 and 33[6] Ch. Tschalar, Proceedings ICANS-V, Julich

373
NQENCLATURE
Target height
Height of adiabatic wall
Target radius
Radial coordinate
Time
Temperature
Radial velocity
Axial velocity
z
Y
$V
Gr
Pr
s
Axial coordinate
Aspect ratio (= H/R)
Vorticity
Stream function
Internal heat generation
Grashof number
Prandtl number
Thermal volume expansioncoefficient
APPENDIX
The pF sical variables (shown with *) were normalized in thefollowing way:
t = at*/HR
'P = T*/Ha
Vr = RVr*/a
r = r*/R
0 = HR Q*/a
Vz = R2 Vz*/Ha
z = z*/H
T = (T*-To)/To
0 = HRq/(aTo pCp)
where a is the thermal diffusivity and To the melting temperature,
p the density, Cp the specific heat of LBE and q the power density.
H
Ha
R
r
t
T
Vr
Vz
;
:
:
:
:
:
:
:
:
:
:
:
:
:
:
:

374

375
ICANS-VI
INTERNATIONAL COLLABORATION ON ADVANCED NEUTRON SOURCES
June 27 - July 2, 1982
DEVELOPING AN OPTIMUM TARGET DESIGN FOR A HIGH ENERGY SPALLATION
NEUTRON SOURCE WITH RESPECTTOeMECHANICAL AND THERMAL CONSTRAINTSJ .F.Stelzer
KFA Julich
ABSTRACT
On the search for a suited target design different variants have been syste-
matically been studied with respect to their temperature and rigidity be-
haviour. The calculations dealt with the temperatures and stresses in the
maximally loaded parts and were carried out using the finite element method.
The final solution is a rotating, internally water-cooled wheel of 2.5 m
outer diameter, carrying about 9000 rods filled with lead. There are three
highly loaded areas: the outer housing, the beam window and the lead-filled
target rods. The construction of the mathematical models is shown. The re-
sults are introduced and discussed. The design satisfies the mechanical de-
mands.

376
DEVELOPING AN OPTIMUM TARGET DESIGN FOR A HIGH ENERGY SPALLATION
NEUTRON SOURCE WITH RESPECT TO MECHANICAL AND THERMAL CONSTRAINTS
J.F.StelzerKFA Julich
1. THE SEARCH FOR A.SUITED TARGET DESIGN
When our work on the target station started there existed two competing ideashow the problems arising with the extremly high heat deposition could be sol-ved: 1) using a liquid metal circuit, and 2) using a rotating target wheelsimilarly like a rotating anode.
One of the most severe reasons speaking against the liquid metal circuit wasthe impossibility to find a acceptable window located between the pressurizedliquid metal and the vacuum of the proton accelerating region. There is a cer-tain thickness of the window necessary to withstand the fluid pressure, butthe thicker the window the longer are the heat flux paths to the cooled sur-face and, consquently, the higher the temperatures and the thermal stresses.The appropriate relationships for a window consisting of graphite are exhibi-ted in figure 1. Also windows of Molybdenum were examined as-is reported inref./1/ and /2/.
A concentration followed on Bauer's concept of a rotating target. The firstproposal consisted in a compact lead target which was only cooled from itssurfaces/3/. However, our finite element calculations of the temperatureand stress distribution showed that the temperatures in the hottest regionrose approximately to the melting temperature of lead, and the thermal stres-ses attained values beyond the tensile strength.
From this experience we learned that 1) the length of the heat flux pats fromthe region of the heat scurces to the water-cooled surfaces need to be short,and 2) the lead volume should not be large and compact but distributed inseveral smaller sections to decrease the thermal stresses.
Consequently, a rotating target was proposed with evolvent-shaped lead sec-tions with cooling water in the intermediate gaps, see re ./. schematicpicture of this design shows figure 2, and, addidionally, a scheme of themarching heat sources as considered in the calculations. However, an evalu-ation of the results showed that the maximal temperatures at the hot spotswere still rather high, unless the evolvent width was small (<2 cm), and thethermal stresses could not yet be tolerated. The experience we gained fromthis was that the changing over from a compact 3-d-structure to a strip shape,a 2-d-structure, did not bring sufficient relief. The consequence was nowto turn to a 1-d-configuration, where the target material is distributed insome thousand single rods which is the present concept. But before this de-sign was studied for a certain time a compact target (also rotating) was ex-amined where a partly melting of the lead was allowed.
Figure 3 gives an impression of the melting target concept. The beam enterswith a flat angle and hits the inner surface. mis esmgn, however, cannotbe realized because of the too high stresses in the housing. As materialfor the housing we proposed molybdenum or niobium since the intermediate tem-peratures in the hottest spot arise up to 1100 0C, but the thermal stressesincreased to intolerable high values.

377
The described history of the Juelich target station shows the advantages re-sulting from a cowork between physicists who create always new proposals andideas and engineers, in this case especially finite element analysts, whocheck in rather quick and not very expensive mathematical models the realisa-tion possibilities. In this way by a chain of varied and stepwise improveddesigns an optimum can be found, or at least a compromise to live with.
As already mentioned, a provisionally final design exists. In this designsome thousand single rods are fixed in a housing, as figure 4 displays. Inthe following the behaviour of this target wheel under thermal and mechani-cal loads is reported.
2. THE ANTICIPATED TARGET WHEEL DESIGN
A target wheel was chosen consisting of a slowly rotating, internally water-cooled wheel. With this concept it is possible to control the extremelyhigh heat deposition (120 kW/cm3 in a proton pulse peak) in such a way thatneither the local temperatures nor the stresses exceed conventional limits,as will be shown. The calculations, throughout executed using the finiteelement analysis method, are concerned with those parts of the target whichare subjected to the highest loads. These are
1) the rather weak housing which comprises the water-cooled, cylindrically-shaped target elements and which is mainly stressed by the water pressure,
2) that part of the housing which serves as the proton window and is exposedto intensive and intermittently acting thermal loads,
3) the target elements themselves which are stressed for a short time by avery intensive heat deposition resulting from the interaction betweenprotons and matter. Some of these lead-filled cylinders have an additio-nal task, working as tie-rods between the housing lid and the bottom andare thus additionally stressed.
The calculations were carried out using the FEABL2 programme. This program-me was developed by A.Sievers, J.F.Stelzer and R.Welzel at the KFA Juelich,based on a. software package developed by Orringer / 6/.An advantage of thisprogram is to calculate simultaneously temperature fields, structural de-formations and stresses. Some routines had been adjusted to the special re-quirements of the task, as e.g. allowance for the pulsing character of theheat deposition by an accordingly fine incrementation of the time axis. Theaccompanying thermal stresses result for each time step from the momentarytemperature distribution. Dynamic stress wave effects depending on a veryrapid heating of the material as reported by P.Sievers /7/ were neglectedin the calculations because this influence is very small under our operatingconditions with pulse widths of 0.5 milliseconds.
Physical rameters. The heat sources in the exposed matter last for 0.5 mil-liseconds followed by a break of 10 milliseconds without heat deposition.The proton beam penetrates with a circular cross section. The correspondingheat sources form a Gaussian distribution across this area. The intensitydecreases exponentially as it progresses through the target material. Therelationships are shown schematically in Figure 5. Some data of the targetwheel are given in table 1.
Table 1: Some target wheel data
outside diameter 250 cmheight of the target material (lead) 10 cm
378
depth of the area filled with target material inbeam direction 70 cmperipheral speed 4 m/s -1speed of rotation 30.56 min_angular velocity 3.2 s
Our remarks concerning the three hard loaded design parts now begin with anexamination of the stress behaviour of the target housing.
Rigidity analysis of the tar et housin . The outer casing of the water-cooledzone is made of A g. con ains e lead filled, Al-clad target rods ofapproximately 24 mm outside diameter and 100 mm length, see figure 6. Thecasing houses about 9000 such rods. The casing bottom is thus stressed by thecorresponding gravitational load. The main load, however, results from thecoolant pressure. There are still other, but smaller loads resulting e.g.from the centrifugal forces acting in the water and the stagnation pressureat the outside wall. Because of its material and geometry the housing isnot very rigid and its deformations become intolerable if all the rods arefixed according to figure 6.The mathematical model. Figure 7 shows the calculation model. It is represen-ted by 324 finite elements with 672 nodal points. Figure 8 gives some dimen-sions and the pressure distribution. In the actual structure the rods are lo-cated on 37 radii designated R1 to R37, from the largest radius to the smal-ler ones in the proton flight direction. The model has fewer opposite pairsof nodal points than rods. Therefore, with the connecting rods calculationa certain number of them is presumed to be combined at these locations.Calculation result. Figure 9 shows the housing deformation if no specialmeasures are undertaken. The maximum displacements of lid and bottom haveapproximately opposite positions and open a clearance of 2.13 mm. If targetrods in this region are firmly connected to the opposite sheets, a consider-able stiffening of the casing results. Figure 10 displays the deformationpattern with every second rod being fastened on the radii R16 and R18. Inthis way 272 rods act as traverses. The next two figures, 11 an'1 12, illust-rate the reference stress distributions in the lid for both cases. The stres-ses remain tolerably low. The problem of the number and location of the tra-verses was the subjc-t of an optimization procedure, see reference /8/.The connecting rods altogether carry a total load of approximately 70 tons.The tensile stress in the rods will be superimposed by the thermal stress ina process described below. The same is true of the beam window which is al-so under tensile stress from the water pressure.
Rigidity analysis of the beam window. In addition to the mechanical load de-scribed, the beam window is also subjected to thermal stress by the protonbeam. The protons arrive intermittently since the beam is pulsed. When thenext proton flash enters the wheel has rotated further over a distance ofone beam radius, see figure 13. This relationship establishs the context be-tween the target wheel geometry and its rotating speed.
The mathematical model. This reproduces a part of the peripheral verticalsheet, see figure 14. The curvature is not taken into consideration with re-gard to the rather large radius. The following data are used, table 2.
Table 2 Data of the beam window
Material Al Mg3sheet thickness 5 mm

379
proton beam radius 40 mmmaximum heat deposition 47 kW/cm3 2water cooling from the rear with 1 W/(cm2K)water temperature 30 C.
Cooling is only effected from the rear since the front is surrounded by va-cuum. For the calculation it is assumed that an appropriate angular rangeof the window stays in the beam for 0.5 milliseconds. After 10 millisecondsthe next spot is hit, the centre of which is one radius distant from the for-mer one. The same cross section is once again immersed in the heat depositi-on area after 2 seconds. Cooling is continuously maintained. For reasonsof symmetry only the hatched half of the window needs to be taken into con-sideration. The transient temperature field calculation takes the movingheat sources into consideration in the manner mentioned. The initial tempe-rature is 30 0C.The results from the casing calculation must also be intro-duced. This is performed by including the found radial and axial displace-ments as constraints in the window calculation, as is shown diagrammaticallyin figure 15.
Results. The calculation reveals that the quasi steady-state relationshipsare attained after 6 target wheel revolutions. The temperature distributionoccuring immediately before heat deposition is illustrated in figure 15. Theproton shot then causes the temperatures which are given in figure 16. Themaximum temperature rise amounts to about 11 K. The stresses (here: the re-ference stresses) in the element centres can be seen in figure 18. An evalu-ation of the stresses is made at the end of the paper.
Temperatures and stresses in the target elements. A-target rod has a cylin-dricaTshape,is-fT ied with lead and clad with AlMg3. Similarly to the beamwindow, every rod stays for a short time in the proton beam before it is car-ried away by the rotating wheel. Thus, from shot to shot hitting the samespot a rather long cooling period occurs.
The calculations deal with target rods in different positions. The highestthermal load is induced in the rods on the largest radius (R1). The calcu-lations also take the rods on the radii R16 and R18 into consideration. The-re is only a reduced thermal stress here since the incoming proton energy isalready weakened by the 30 cm path through an energy absorbing zone. On theother hand, these rods must bear the tensile load due to their function asthrough-bolts discussed above. Some variants with different cladding thick-nesses were calculated since the cladding must take over the main part ofthe tensile load because of the weakness of the lead.
The mathematical odel. This is shown in figure 19. For reasons of symetryonly one quarter needs to be simulated. The subdivision into finite elementsis accomplished in three storeys. The limiting planes between them where thenodal points are situated are designated ZO to Z3. Each storey is subdivi-ded into 126 finite elements as can be seen in figure 20 On the outer sur-face of the model a heat transfer coefficient of 1 W/(cm2K) is assumed. Atthe beginning of the transient temperature field calculation the whole rodis at the temperature of the cooling water. During the calculation a con-stant ambient fluid temperature is assumed.
Heat deposition. The pulsing heat deposition is again observed with 5 ms hea-ting followed by 2 s cooling time. The Gaussian distribution of the heat de-position over the beam radius and the exponential axial decrease are takeninto account. However, the heat source decrease across one rod does not

380
amount to more than 10 %.
Pre-stressing. The case was also considered in which the lead kernel is un-dercooled before being inserted into the AlMg3 cladding to prevent a gap e-tween the kernel and the cover. The tangential initial stress of 50 N/mm isappropriate. But there is little danger that such a gap and an associatedtemperature rise will occ-ur since the lead shows a larger thermal expansion(about 20 %) than the AlMg3. An axial pre-stress appears in the rods actingas traverses. This load is induced by constrained displacements resultingfrom the casing analysis.
Results. Temperatures. Let us first consider a rod on the largest radius.The time dependent temperature development is exhibited in figure 21 for thehottest point of a rod. After about 10 s or 5 wheel revolutions a stablestate is reached. The rise between the temperature extremes amounts to 42 K.A survey of all nodal point temperatures is given in figure 22. The tempe-rature exceeding that of the cooling water in the centre of the rod middleplane (Z3) varies between 21 and 63 K. The outer AlMg3 jacket is 15 K aboyethe coolant temperature. The leaving heat flux density amounts to 15 W/cm .This means a very large interval between subcooled boiling (which is not dan-gerous at all), not to speak of the dangerous film boiling which would notappear before 300 W/cm2. Despite the rather low melting point of lead (327OC) no melting will take place. With a coolant temperature of for example60 oC the highest lead temperature will be at 123 OC.
Stresses are calculated in the geometrical centres of the finite elemeits.In the non-prestressed rods the stresses are only a consequence of the tem-perature gradients and the impeded thermal expansion of the lead restrainedby the influence of the AlMg3. Tangential and axial stress components pre-dominate. Figure 23 illustrates the reference stress distribution in the lay-er with the highest load which is located between the planes Z2 and Z3. Thmaximum reference stress appears in the AlMg3 jacket and amounts to 75 N/mm .In the case of pre-stressing by shrinking, the maximum stress rises to 109N/m 2 .
A hypothetical operating disturbance. Some problems could perhaps arise ifthe coolant flow were partly blocked e.g. by distorted or disconnected tar-get rods. It may be assumed that then the heat transfer along half of thetarget rod surface decreases to one tenth, to 0.1 W/(cm2K). In the centralplane of the rod temperatures then occur as shown in figure 24. The highestovertemperatures above the coolant now vary between 72 and 112 K. It can beseen that even such a severe deterioration of local cooling does not provokea dangerous temperature increase.
Temperatures and stresses in the through-bolt rods. These rods are locatedin the radii Ri6 and Ri8. The proton beam only deposits about one quarterof the heat sources here compared to the radius R1. The maximum temperaturevariations range between 5 and 15 K above the coolant temperature. Thestresses were calculated for jacket thicknesses of 0.5 and 1 mm and thermaland tensile load. The tangential pre-stress caused by a shrunken jacket wasalso taken into account. The results are listed in the following table 3.
Table 3: Maximum stresses in the cladding of a rod on R18, layer between theplanes Z2 and Z3, in N/mm2
Cladding thickness tangential tensile ar a aef(um) pre-stress load0.5 no no 0.04 12.4 12.8 12.7

381
0.5 yes no -0.9 57 15.2 51.80.5 yes yes -0.9 57.3 21.6 50.91 no no 111 yes no 471 yes yes 47
It can be seen that the stress reduction by a doubling of the cladding thick-ness is insignificant. A tangential pre-stress is responsible for a highstress increase. The maximum reference stress in the lead is 5.9 N/mm .
3. FINAL EVALUATION OF THE RESULTS
As has been shown, in the design the temperatures remain at low and non-cri-tical values at all locations. In order to evaluate the stresses we mustrefer to the appropriate tolerable stresses. Because of continuous cyclicloading the fatigue stress should preferably be taken into consideration.AlMg3 in a soft, annealed state is in this respect superior to hard, cold-formed material. The following values are given in ref. /9/, table 4.
Table 4: Fatigue strength of AlMg3 in N/nm2 under cyclic loading with alter-nating tensile and compressive stress
state lower limit upper limitsoft 72 126semihard 58 115hard 52 78 .
At two locations on the target the lower limit of the soft material isslightly exceeded: in the centre of the beam window (stress equals 75 N/mm2 )and in the rod jacket of a rod on the outer radius (also 75 N/mm 2 ). We seethat it is not advisable to shrink the jackets on the rods since then thestress will increase to the intolerable value of 109 N/mm2 .
It can thus be seen from the results that an arbitrarily long lifetime ofth3 target assembly cannot be expected. This would undoubtedly be the caseif the maximum stress were to remain everywhere below the lower fatiguestrength limit. However, from the engineer's point of view it can be statedthat the thermal and mechanical loads occuring in the target wheel do notexceed tolerable and comonly accepted limits.
382
References
/1/ SNQ Realisationsstudie zur Spallations-Neutronenquelle, ed.G.S.Bauer, H.Sebening, J.Vetter, H.Willax, JUl-Spez-113, JUlich,1981, 3 volumes
/2/ Seitz, L., A.Sievers, J.F.Stelzer: Strahlfenster unter thermischerund mechanischer Belastung, chapter 42 in vol.3 of /1/
/3/ Stelzer, J.F.: Heat dissipation and thermal stress in solid tar-gets, paper at the Meeting on Targets for Neutron Beam Spallati-on sources, Juelich, 11-12 June 1979
/4/ Enerich, R., L.Seitz, J.F.Stelzer: Temperatures and thermalstresses in a spallation target from lead, evolvent target, chap-ter 41 in vol.3 of /1/
/5/ Seitz, L., A.Sievers, J.F.Stelzer: A rotating target from leadwith phase change solid-liquid, chapter 40 in vol.3 of /1/
/6/ Orringer, 0., S.E.French: FEABL finite element analysis basislibrary, AFOSR TR, ASRLTR 16242, MIT, Cambridge, Mass., 1972
/7/ Sievers, P.: Elastic stress waves in matter due to rapid heatingby an intense high-energy particle beam, European Organization.for Nuclear Research, paper LAB II/BT/74-2, Geneva, 1974
/8/ Stelzer, J.F.: Two applications of optimum structural design inthe field of nuclear technique, Proc. Int.Symp. on Optimum Struc-tural Design, ed. R.H.Gallagher, E.Atrek, A.J.Morris e.a., Uni-versity of Arizona, Tucson, 1981, pp.1-23 to 1-29
/9/ Sass,F. and Ch.Bouchb, editors: Dubbels Taschenbuch fUr den Ma-schinenbau, 11th ed., Springer, Berlin, 1958, pp.540-542

383
MAXIMAL TEMPERATURES AND STRESSES
IN A GRAPHITE BEAM WINDOW
*6
ep
4% :43
46/, ss - tempstature
A
- thermal stress
54 \
'maximally tolerable
/\ 7 operating temperature
L.0
S L.
) 4)
a, v
b/A
maximally tolerable reference stress
q maximally tolerable reference stress
window thickness in m
5 7
18 0 d hydrostatic pressure
Protons: 0.6 GeV100 mA, tact ratio 0..1
Fig. 1. Maximum temperatures and stresses vs. window thicknessin a berm window of graphite. Beat deposition accord-ing to the anticipated Juelich spallation source.
0)00t
00'0M
.
L
I
L.0
CCCC'
r6
I
-
I

n = 66.8 mini
I ,
Photons
,
'?"S
4
y
1
I1
- 645
I"s ---- M5I
Fig. 2. Schm of the evolvent-shaped targetwsheel (above) and of the marchingheat sources (belov)
liquid
Fig. 3. Melting target with the finite element sub-division (above). Calculated areas ofmolten and solid lead after 80 target wheelrevolutions, quasi-steady-state (below).
solid

385
distribution of fast neutrons
target rods f
proton bese
coolant outletbearing and drive
coolant inlet
Fig. 4. Survey of the target wheel which Fig. 5. Distribution of the inducedsuits all thermal and mechanical heat deposition in a soliddemands body by proton bombardment
coolant passage
lid of the housing
/
/ Al-cladding
/ lead
/
/,
bottom of the housing
- -- coolant passage
Fig. 6. A single target rod. It issituated in the wheel hous-ing with plugs at both ends.It can expand independentlyof the ambient rods.
bottom/
Fig. 7. Projected view of thecalculation model
R 1250775
in ~3 br 8 ,.
315
Fig. S. A mdel cross section
M~r)
r
protons
lid

386
II
Fig. 9. Deformation of the housingif no traverses are present.Deformation enhancement bya factor of 200.
FF
25.90
15.54
13.36
5.19
I. U
1-1
- -
Fig. 11. Distribution of thereference stresses inthe lid of the hous-ing if no traversesare present
/ I
- - -- - ---
- - - - - - - - - u' 1 1
Fig. 10. Deformation of the housingwith traverses at the ra-dii R16 and R18. Defor-mation enhancement by afactor of 200.
I"-- - t - -r -- 1 1 1 1 1 w
1 1 1 1
Fig. 12. Reference stress distri-bution in the lid of thehousing with traverses inthe radii R16 and R18
Fig. 13The chronological order of en-ergy deposition in the outerwheel wall, the window
I
h 1 14 1H

387
to*1 1n* II.3 ts to
II I I S____ I '---I ~ '-~ I ~ d I ~ I ~ -~ -
aI
e I
ii J ii jmo
Fig. 14
Mathematical model
of the beam window
Fig. 15
Displacement constraints
of a window cross section
30.7 30.6 30.6 30.6 30.6 30.6
3.6 30.6 .6 3.6 3.6 .6
30.6 31 .6 1 36.6 1
31.31.5
.6 .0 .a
Fig. 16. Temperature distribution inthe window after 2 a cool-ing shortly before heatdeposition, quasi-steady-state, in centigrade
30.5 30. .5 .S 30.5 .5
31.5 1.5 31.5
.4 .t 4 0 ..
Fig. 17. Temperature distributionin centigrade in the win-dow immediately afterheat deposition
200
I t
t tI It I1
t
, \ /1

388
SITS 5434 5429 5426 5621 5416 5462 5608 5403 5400
SS40 S536 5630 S62S SS19 5514 SSOS S502 '1%6 5491
5666 S@66 SS62 SS6o SSS7 SSSS S6 S2 P 7115 84 516146 6143 6141 6196137 76636692 K695 6694 66 K697 6701 67o 6703 67o2
7164 7187 7159 7191 7195 72o2 7206 721 7214 7212
7456 7459 7462 7469 7474 7422 7487 7494 7497 751
Fig. 18. Reference stresses n the beam window in N/cm2
.
A1IMq3
-'F- Z30- Z2
~ ~ z20
0
- z
-Z3
Z2
Szo
Fig. 19
Mathematical model of the tar-get rod. It consists of threefinite element storeys. Theintermediate planes are desig-nated ZO, Z1, Z2 and Z3.
in
d In
* In
r
c1 'n
I
--- -- ----
.1 ,
0 2
Fig. 20
Plane with nodal point
Fig. 21
Time-dependent developmentof the temperature at thehottest spot of a targetrod on the largest radius
4 6 e 10 12 14 16 18 29
time In seconds
00I i 4 3 2,c
3.6 6.
8.9.61.t '.
0-- da --
1
1
1
1
1
1
1
1
1
1
-i
1 ,1 1
1 ,
1 ,
1 ,
1 1
1 1
1 ,
1 ,
1 1
J
I
I

389
111n
I '
U,
:1I I
Fig 23
u
Distribution of the referencestresses in the target rod inthe region of the highest load
Fig. 22
Temperatures in the four planes of thetarget rod. Left column: immediatelyafter energy deposition, right column:after an intermediate cooling time of 2 s.
niN
Fig. 24
Temperatures in a target rod,plane with the maximum temper-atures in the context of acoolant flow disturbance.Left: after the shot, right:after 2 s cooling.
3
lu.MI
mss'-'

390

391
GROOVED COLD MODERATOR TESTS
K. Inoue, Y. Kiyanagi, H. IwasaDepartment of Nuclear Engineering, Hokkaido University
N. Watanabe, S. IkedaNational Laboratory for High Energy Physics
J. M. CarpenterArgonne National Laboratory
and Y. IshikawaPhysics Department, Tohoku University
ABSTRACT
We performed some grooved cold moderator experiments for methane at 20 K
by using the Hokkaido University linac to obtain information to be used in the
planning of the KENS-I' project. Cold neutron gains, spatial distribution of
emitted beams and time distribution of the neutrons in the grooved cold
moderator were measured. Furthermore, we assessed the effects of the grooved
cold moderator on the performances of the spectrometers presently installed at
the KENS-I cold source. We concluded that the grooved cold moderator
benefited appreciably the performances of the spectrometers.
392
GROOVED COLD MODERATOR TESTS
K. Inoue, Y. Kiyanagi, H. IwasaDepartment of Nuclear Engineering, Hokkaido University
N. Watanabe, S. IkedaNational Laboratory for High Energy Physics
J. M. CarpenterArgonne National Laboratory
and Y. IshikawaPhysics Department, Tohoku University
1. INTRODUCTION
From the results of our experiments and laboratory experiences using the
Hokkaido University cold source and the KENS source over a period of several
years, we have concluded that the accelerator-based cold neutron source using
a 20 K methane moderator is a safe, reliable and highly efficient device which
can be applied as both a photo neutron source and a spallation neutron
source1~4). Current operations of the KENS cold source have proved to be
satisfactory, and it has been useful in many studies embracing various fields
since fiscal year 1980.
The KENS-I' project is designed to increase the intensity of the present
KENS-I source. This endeavor will require several sophisticated techniques")
among which is the optimum design and use of a grooved cold moderator chamber
which will be feasible and economical. several authors investigated the
grooved moderator for thermal neutrons, but no work on the grooved cold
moderator has been done as yet5,6). Current plans call for the installation
of the new chamber in the presently in use fast neutron reflector under its
limited space and restricted design conditions. In order to decide the
appropriate dimensions and to get quantitative data of the pulse shape which
will be needed to assess its influence on the performance of the spectrometers,

393
we performed semde preliminary experiments on the 20 K methane grooved moderator
by using the ccld source facility at Hokkaido University. Snme of the results
of the experiments and an assessment of the grooved cold moderators are
reported in this presentation.
2. EXPERIMENTAL METHOD
The techniques used in the present experiments took advantage of the
ordinary neutron time-of-flight technique and cryogenic facilities for the
cold moderator. The experimental arrangement, shown in Fig. 1, has already
been described in some detail in connection with the Hokkaido University cold
source2).
The grooved moderator chamber and a new flat one of the same dimensions as
the KENS cold source replaced the commonly used cold moderator chamber. We
purchased both a grooved chamber and a flat one made of aluminum, the
dimensions of which are shown in Fig. 2, and attached them to the bottom of
the heat exchanger of the cold source facility instead of to the actual
moderator chamber. Because of the occurence of clogging of the methane at
the entrance of the gas inlet tube, we had to replace the inlet tube with a
wider one.
For the measurements of spatial dependence of the neutrons emitted from
the grooved surface of the chamber, we utilized a movable, remotely controlled
slit plate which was made of cadmium. The size of the slit was 4 m in
height and 100 m- in width, and the slit was placed parallel to the grooves and
at the outside of the Dewar chamber as shown in Fig. 1. The measurements of
the time dependence of the neutron pulse emitted from the chamber were
performed by using the time-of-flight technique and a mica ionochrometer.

394
3. EXPERIMENTAL RESULTS
A. Time-of-flight spectra
Emitting neutrons from a methane moderator at 20 K., the grooved and flat
moderators had unique time-of-flight spectra as shown in Fig. 3. Both
spectra were normalized for the fast neutron intensities emitted from the
target. Relative fast neutron intensities were determined by measuring the
8-activity induced by the (n,p) reaction of aluminum. A large enhancement of
the time-of-flight spectra took place in the cold neutrons, resulting in an
approximately doubled neutron gain.
B. Spatial dependence of emitted beams
Considerably irregular spatial distribution of the emitted neutron beam
from the grooved surface was expected. We measured the dependence of the
beam along the vertical direction of the grooved chamber by using the movable
cadmium slit described above. Figs. 4 and 5 show the measured data for
neutrons of energies 2, 5 and 50 meV respectively.
Although the overall spatial dependence in the grooved moderator was
similar to the one in the flat moderator, the ratio of the intensities of the
beams emitted from the bottom and the top of the grooves was cosiderably high.
As seen from the figures, the ratio became larger as the neutron energy
decreased.
C. Time dependence of pulses
We next measured the time dependence of the pulses by using a mica mono-
chrometer with Bragg angle of 85'. Figs. 6 and 7(a) show the pulse spectra
of 5.26 meV neutrons emitted from the tops and the bottoms of the grooves and
from the whole grooved surface, which were all normalized to the peak height.

395
Fig. 7(b) shows a comparison of the three pulse spectra from the grooved
moderator and a spectrum from the flat moderator. As is clearly recognized,
the shapes of the pulses from the top and the bottom of the grooves are very
similar but the starting time of the sharp rise in the latter one has a time
delay of about 40 is compared to the former one. This time delay approxi-
mately corresponds to the time-of-flight of the groove height for 5 meV
neutrons. Thus the shape of the pulse spectra from the whole surface of the
grooved moderator is apparently distorted as compared to the one from the flat
moderator; moreover, the effective width is appreciably longer than that of
the flat moderator.
4. EFFECTS OF PULSE SHAPE DISTORTION ON PERFORMANCE OF SPECTROMETERS
We report in this section our assessment of the effects of pulse shape
distortion on the performance of the spectrometers. There are three
spectrometers installed at the KENS' cold neutron source: SAN: a small angle
scattering spectrometer, TOP: a polarized neutron spectrometer and LAM: a
quasielastic spectrometer.
The former to spectrometers are equipped with 20 m long neutron guide
tubes which provide sufficient time-of-flight length of incident neutrons.
Thus pulse shape distortion is not a problem in the case of the former two.
Furthermore, the increase of total intensity benefits primarily their
performances.
In the case of the LAN, which is a conventional energy resolution
quasielastic spectrometer, the pulse shape distortion affects the resolution
to some extent. To assess this effect we calculated the elastically
scattered neutron spectra from both the grooved and the flat moderators. The
measured intensity distribution, y(t), on the time analyser is related to the
neutron cross section O(1I+12) and various instrumental comditios7 ) ,

396
y(t) - const.ffn(E1 )Z(t - 1m - 12_)a(Ei+E2)R(E2)dEidE2/2E/m 2E2/m
where n(E1) is the energy spectrum of neutrons emitted from the moderator, Z(r)
is the time distribution of the pulse, T is the emission time, R(E2) is the
resolution function of the analyser for the scattered neutrons and 11 and 12
are the first and second flight path lengths respectively.
Fig. 8 shows the calculated results of y(t) in the cases of the grooved and
the flat moderators in which the cross section was assumed to be elastic and
synthesized time distributions were used as shown in Fig. 9. As seen from
Fig. 8, the effective pulse width in the case of the grooved moderator is about
15 percent longer than that obtained from the flat moderator. However, there
is no appreciable difference in the pulse shape on the rising side. In the
case of the LAM, intrinsic resolution is determined by the pulse shape on the
rising side. Therefore, it was proved that the grooved cold moderator
operates efficiently without diminishing resolution performance.
References
1) K. Inoue, et al.: J. Nucl. Sci. Tech., 13(1976)389.2) K. Inoue, et al.: Nucl. Instr. Meth., 192(1982)129.3) Y. Ishikawa, et al.: Proc. 4th Int. Collaboration on Advanced Neutron
Source(ICANS), Tsukuba, Japan(Oct.1980).4) N. Watanabe, et al.: Proc. 6th Int. Collaboration on Advanced Neutron
Source(ICANS), Argonne, USA(June 1982).5) J. M. Carpenter: Proc. 4th Int. Collaboration on Advanced Neutron
Source(ICANS), Tsukuba, Japan(Oct.1980).6) G. S. Bauer: ibid.7) K. Inoue, et al.: Nucl.Instr.Meth., 178(1980)459.
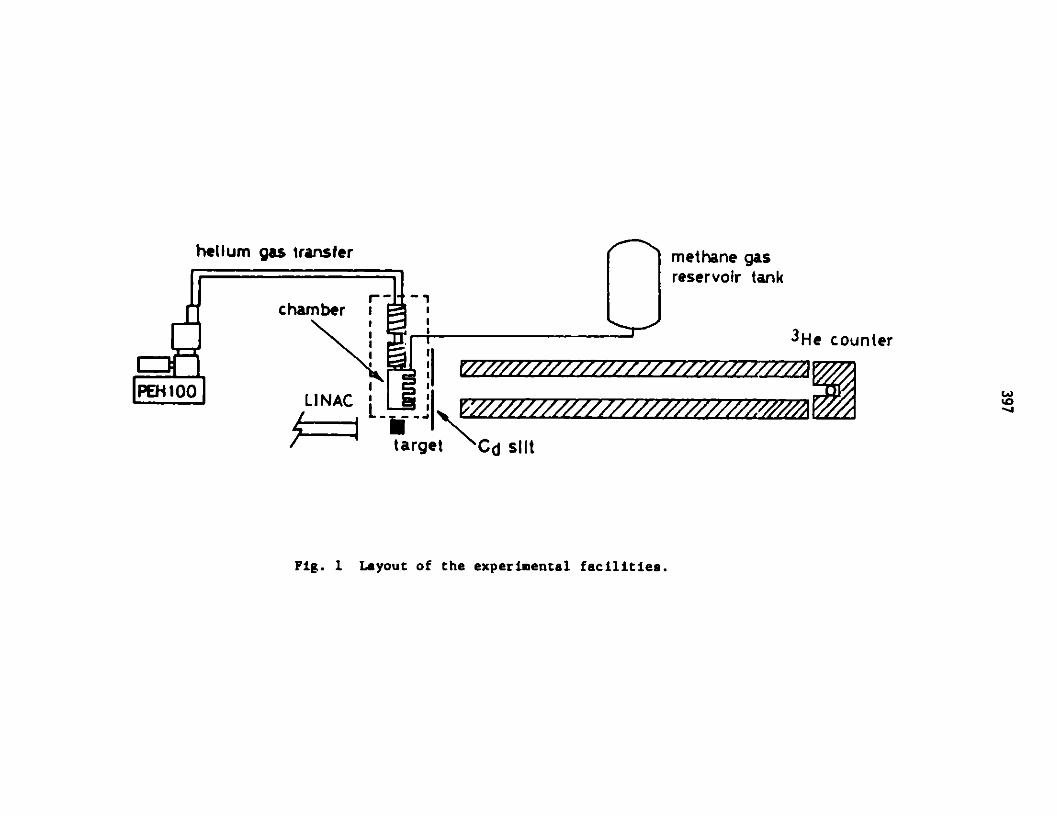
helium gas transfer
reservoir tank
cham ber
I
H co I A4F O 11111 1111011
3 He cou
LINAC
taret Cd slit
Fig. 1 Layout of the experimental facilities.
PEH100
nter
Methane gas

groovedgas inlet
k5cmK 15cm
15cm
flatgas inlet
K 15cm5cm
Fig. 2 Grooved and flat methane chambers.
15cm

399
E (meV)10050 20 10 7 5 4 3 2 1
GROOVED
-", COUNTER
-- %. TARGET--- -
*.%,
- - --
"-h
COUNTER
1 I
100
0
FLAT
TARGET
50 100 150 200
CHANNEL (40pslch)
.. %
Fig. 3 Time-of-flight neutron spectra from grooved and flat modrators.
100U0
looc
I-z
~3O
10250
I l
. . .

400
TARGET
II
AX
Cd SLIT
NEUTRON BEAM
3.7m
COUNTER
4r
3-
21
1-
n10 '
En=5rneV
0
Fig. 4 Spatial dependence of emitted neutron beam with energy 5 meV.
zwz
~0
0 5 10 15X (cm), OUSTANCE FROM BOTTOM OF CHAMBER

401
2
I-
z En=2meVw
z1 (b)
-1-
00 5 10 15
X (cm), DISTANCE FROM BOTTOM OF CHAMBER
3
En= 50meV
2-
z(a)z
2
co -
.
00 10 15
X (cm), DISTANCE FROM BOTTOM OF CHAMBER
Fig. 5 Spatial dependences of emitted neutron beams with energies50 meV:(a) and 2 meV:(b).

402
5r-
0 .
En =5.26meV(a)
- n
ROM TOPS OF GROOVES
1350 14.50NUMBER OF 4 ys CHANNELS
En=5.26meV
1550
(b)
]T F
FROM BOTOMS OF GROOVES
-",
1350 1450NUMBER OF 4ys CHANNELS
Fig. 6 (a) Time distributiontops of the grooves.neutrons initted from
of the pulse of neutrons emitted from the(b) Time distribution of the pulse of
the bottoms of the grooves.
-
2L
z
<3
I-
zwz
"F
<..
t '"
1250
S
<3
c..
zwT
-
"
t
0QtI25
--.rteI I
=o

403
5-
(a)En=5.26meV
z
r
f- +
ac
f-
5- r-GROOVED MOCERA TOR ( TO TAL )
___FLA T MOOER ATOR
iEn
3 -i(b)z
If(BOT TOM OF GROOVES )C -
0
1250 1350 1650 1550
NUMBER OF 4s CHANNELS
Fig. 7 (a) Time distribution of the pusle of neutrons emitted from thewhole surface of the grooved chamber. (b) Comparison of thethree pulses emitted from the tops and the bottoms of the groovesand the whole surface, and the pul.se emitted from the flat chamber.

404
flat grooved
3
a:
a.Vn
z2
0W
F-
00 230 240 250
CHANNELS (32 ps/ch)
rig. 8 Calculated scattered spectra for the grooved and the flat moderatorsusing an elastic scatterer. These data exhibited effectiveresolutions.

405
5-
flat
wJ
a-
03 -grooved
z0
I -
~ -
00 100 200 300
EMISSION TIME 'C(Ns)
Fig. 9 Synthesized tine distributions of the pulses used in the spectralcalculation.

406

407
MEASUREMENT OF NEUTRON SPECTRA AND FLUXES
AT THE IPNS RADIATION EFFECTS FACILITY
R. C. Birtcher, M. A. Kirk, T. H. Blewitt and L. R. Greenwood
Argonne National Laboratory
Argonne, Illinois 60439
ABSTRACT
We have measured the neutron spectra, fluxes, and flux distributions
produced by nuclear spallation resulting from 478-MeV proton bombardment of
tantalum and depleted uranium targets Surrounded by a thick lead neutron
reflector. The configuration was chosen to simulate a radiation effects
facility at a spallation-neutron source. The method of multiple foil
activation with spectrum unfolding by the STAYSL computer code was used to
measure the neutron spectra. The experimental results are compared in detail
with the results of computer calculations on the same configuration of targets
and reflector. The neutron production and transport codes HETC and VIM were
employed in these calculations.
Based on these measurements, the Radiation Effects Facility (REF) was
designed and constructed at the IPNS. Using simular activation techniques the
neutron spectra, fluxes and flux distributions have been determined for the
REF.
1. INTRODUCTION
The Development of nuclear reactors as energy sources has required and
will continue to require the study of the effects of neutron irradiations upon
materials. This has lead to the need for a Radiation Effects Facility (REF)
at the IPNS [1J.The study of radiation effects requires well-controlled
intense fluxes of high-energy neutrons without contamination by secondary
particles. Further, access to these neutrons must be direct and allow precise
environment and temperature control. Many basic studies also require

408
irradiation at liquid helium temperatures to arrest defect migration. These
requirements have placed several restrictions upon the design of the REF. The
proton target should generate the largest number of neutrons per proton with
the minimum of neutron-energy moderation and minimum y flux. This led to the
minimization of the target cooling water and target diameter consistent with
acceptable target temperatures. Both Ta and 238U were considered as target
materials. To further minimize the neutron energy loss and increase the
neutron flux, the target should be surrounded by a high density reflector
material consisting of atoms with a high atomic number. These considerations
lead to the testing of several target/reflector systems by computer modeling
and finally by a full scale experimental mock-up [2].
2. Experimental Details2.1 Mock-up.
A simplified schematic of the experimental arrangement for the REF mock-
up is shown in Fig. 1. The targets were solid cylinders of Ta, 8.2 cm in
diameter and 13.2 cm long, and of Zircaloy-clad 2 3 8 U, 8.3 cm in diameter and
14.6 cm long. Each target was irradiated separately while centrally located
in a cylindrical Ph cask. The Pb cask surrounded the target with 25 cm of
reflector material, and held the neutron-dosimetry assemblies. The
perpendicular neutron dosimetry assembly was located in a hole that passed
within 1 cm of the ID surface of the cask. The target was located so that
this hole was at the calculated peak neutron flux position along the target
axis. The principal neutron dosimetry package was also located within the
hole, and adjacent to the target. The parallel neutron dosimetry assembly was
located in an Al tube suspended between the Ph cask and the target. An
additional 46 cm of Pb was placed above and on one side of the Pb cask for
radiation shielding of the environment. The entire target and cask were
electrically isolated to provide a Faraday-cup measurement of incident-proton
current. This and another Faraday-cup beam stop were used to monitor beam
alignment on target during the irradiation, but proved to be substantially in
error for an absolute measurement of integrated proton current over the entire
irradiation period. Instead, the integrated proton flux was measured with Al
monitor foils, as described in the next subsection.
Both targets were water cooled with a flow of -0.6 1/sec. Temperatures
were monitored by thermocouples during irradiations by 478-MeV protons at

409
typical time-averaged currents of -1 A. The temperature increased by -2C
fFigt 1. Schemnatic of target, reflector, and dosimetry positions. (a) Taor U target; (b) hole for perpendicular neutron dosimetry assembly; (c)principal neutron dosimetry site; (d) tube for parallel neutron dosimetryassembly; (e) proton dosimetry foils; and (f) Pd reflector.
above the coolant temperature (35 C) on the surface of the Ta target at the
calculated axial position of maximum energy deposition (5 cm from the front
face of the target). There was a X35 C rise in the centerline temperature at
a similar axial position in the 238U target.
The 478-MeV proton beam was supplied to the mock-up experiment by the ANL
Rapid Cycling Synchrotron (RCS, formerly called Booster II [31 when associated
with the ZGS accelerator). The protons were obtained by stripping the
electrons from a 50-MeV H- beam supplied by a linear accelerator (Linac),
which also served to inject the ZGS during these experiments. As a result of
the sharing of the Linac system with the ZGS, the RCS was operated in a "burst
mode", consisting of approximately 2.7 seconds of beau extraction at 15-Hz
repetition, followed by 1.3 seconds without beam. This mode of operation had
no effect on the operation of the experiment or the results. The number of
protons per pulse on target averaged -7 x 10¹¹ with an effective frequency of
"10 Hz as a result of the burst-mode operation, yielding an average beam
current on target of about 1 aA during normal operation of the accelerator.
"Abnormal" accelerator operation consisted of complete shutdowns due to
equipment failures. Details of the accelerator operation were recorded for
each irradiation, and used to correct the corresponding neutron dosimetry
data.
Integral dosimetry of the 478-HeV proton beam was accomplished by
monitoring the 27A1 (p,x) 22Na reaction in aluminum foils placed at the
entrance to the Pb reflector (Fig. 1). A cross section of 17.8 ub (15) us

410
used for the 2 7 A1 (p,x) 2 2 Na reaction at the proton energy of 478 MsV. This
cross section is the value recommended by the CEA (France) in their 1971
compilation of nuclear monitor reactions [4]. The error represents the spread
of the various experimental data at this energy. The uncertainty in the value
of this cross action is the predominant source of possible error in the
absolute number of protons on target. To compensate for the loss of energetic
spallation products at the surfaces of the Al foil, a high-purity Al foil
0.025 mm thick was sandwiched between two ordinary Al foils 0.012 m thick.
These foil thicknesses proved adequate to compensate for loss of the 2 2Na
product, but inadequate for the lighter 7 Be product. For this reason, and
because the cross section for its production is not as well established, the
Be activity was not used for dosimetry purposes. The proton spallation
reaction yielding 2 4Na was not used for proton dosimetry because 24Na is
produced by neutron absorption in Al and because of the short 2 4Na half-life
(15 hr).
The Al dosimetry foils were also used to obtain autoradiographs of the
integrated intensity distribution of the proton beam for each target
irradiation. Microphotodensitometry data were obtained from the
autoradiographs to generate the experimental beam profiles (linearity with
fluence was assumed), which were then averaged about the cylindrical axes of
the targets. These averaged radial beam profiles were used as input
parameters to the computer programs that calculated the spallation-neutron
production with which the experimental results will be compared. The proton
beam for irradiation of the 2 3 3 U target was intentionally broadened somewhat
to lower the target centerline temperature.
2.2 Computer Model Calculations.
Spallation-neutron production and neutron transport were calculated by
two Monte Carlo-based three-dimensional computer codes, HETC [5] and VIM
[61. The High Energy Transport Code (HFTC) employs nuclear models to
calculate high-energy-cascade and evaporation particles caused by the incident
protons. Spallation neutrons with energies from 500 Hey down to 15 MeV were
transported by this code to the volumes in which the experimental measurements
were made. Neutrons with En < 15 MeV were subsequently transported by the VIM
code. Neutron-produced fission in the 238U target was included in the VIM
411
calculations, but not in the NETC calculations.
The detailed geometry and material composition of the target, cooling
system, and reflector were taken into account in the calculations of the mock-
up experiment. Neutron spectra, integrated flux, and spatial flux
distributions were obtained for each target by averaging three independent
calculations, each involving 2000 incident 500 MeV protons distributed on the
target face according to the experimental beam profile. The results of these
calculations will be displayed and compared with the experimental dosimetry
results in section.
2.3 Radiation Effects Facility
The PEF, shown in Fig. 2, consists of the 238U target, two vertical
irradiation thimbles, and a horizontal irradiation thimble, all surrounded by
a Pb neutron reflector. Based on the results of the mock-up experiment, the
target material was chosen to maximize the conversion of protons to
neutrons. There is some gamma production associated with the fission process
in 238 U, although much less than in a reactor-based facility where all
neutrons are produced by fission. Should the gami flux pose an experimental
problem, it is possible to change to a Ta target, from which there would be a
greatly reduced gamma flux. Lead was chosen as the reflector material based
on the results of the mock-up experiment. The Pb reflector alongside the
target is in the form of removable sections 10 cm on a side and 45 cm long in
cladding. For specialized needs, reflector sections can be removed to
increase the irradiation volume or to allow replacement with a different
reflector material. Such a change in reflector or target material could
change the energy distribution of the neutrons within the irradiation
facilities.
The two vertical irradiation thimbles, located on either side of the
target at the positions of maximum flux, contain liquid helium cryostats (5 cm
inner diameter) that can operate at temperatures between 4 and 1000 K. The
liquid helium is supplied by a single 400-W refrigerator (CTI model 2800 R).
The two cryostats have separate vacuum systems, which allow the temperature to
be controlled independently in each cryostat. The horizontal irradiation
thimble (2 cm inner diameter) is located on an axis parallel to and directly
below the target. The majority of the 238% target-cooling water is between

412
I P N S -I RADIATION EFFECTS EXPERIMENTAL ASSEmaLY
CRYOSTATS
PROTON BEAM
HIGH DENSITY ' TARGET CAVITY LINERREFLECTOR REGION
TARGET INSERTIONa REMOVAL TUBE
RADIATION EFFECTS
TARGET ASSEMBLY -
FAST FLUX IRRADIATION TUBE
TARGET COOLING LINES
TARGET CAVITY DRAIN
Figure 2. IPNS-I radiation effects assembly.
the target and this thimble. The horizontal thimble operates at ambient
temperature and is designed to permit short irradiations with sample removal
while neutrons are being produced. The REF differs from the mock-up
experiment in the large voids near the target.
2.4 Neutron Scattering Facility
The 238UT target in the NSF is surrounded by C and Be reflectors which are
penetrated by 12 neutron beam lines. Moderators for producing the thermal-
neutron beams are located directly above and below the target. Two unused
horizontal beam lines have been modified to contain irradiation thimbles (-1
cm diameter). These two thimbles radially approach within 4 cm of the target
axis at the position of maximum neutron flux along this. The majority of
target-cooling water is between the target and these thimbles. Both NSF
irradiation thimbles operate a ambient temperature.
Protons for the IPNS were supplied by the RCS at 500 MeV [7]. The
protons were -100 ns long pulses at a repetition rate of 30 Hz. The proton
flux incident upon the 2 3 8U targets was determined from the current induced in

413
a toroid located 3.5 m upstream from the target. This measurement is
uncertain by 5 percent. The protons had an energy of 500 MeV.
2.5 Neutron Dosimetry.
A multiple-foil-activation method was used to determine the neutron
fluxes and energy spectra for the Ta and 238 U irrdiations at the principal
dosimetry site in the mock-up experiment (Fig. 1) and at the primary
irradiation positions in the irradiation facilities. The STAYSL computer code
[8] was used to find the most probable neutron spectra from the foil
acitivies, using a least-squares technique. The input spectra were taken from
the computer-model calculations of neutron production and transport to the
principal dosimetry site for each target and reflector system.
The Dosimetry Group and the Analytical Chemistry Laboratory at ANL
measured foil activities with Ge(Li) detectors over several y-decay half-lives
for each of the 28 reactions listed in Table 1. Peak integrations and
Compton-background subtractions were done by means of computer program in
routine use by the Dosimetry Group [9]. Prior to spectrum unfolding,
activation corrections for neutron and gamma self-shielding, cover foils, and
decay during and after irradiation were made for foil geometries in an
isotropic flux. The STAYSL program compared the calculated activities with
the measured activities. It then adjusted the differential neutron spectrum
(100 energy groups), using a least-squares procedure. The energy-dependent
cross sections were taken from ENDF/B-IV [10]. For those reactions sensitive
to neutron energies > 30 MeV, the energy-dependent cross sections have been
extrapolated [111 to 44 MeV and integrally tested in a well-defined Be (d,n)
neutron spectra [12].
The output of the STAYSL code includes a complete covariance-error matrix
for the neutron-flux spectra. Errors and covariances in the measured
acitivities, cross sections, and input spectra were estimated from the
available nuclear data. The integral activities typically had errors of *22,
whereas cross-section and flux errors varied from 5 to 50% depending on the
estimated reliability of nuclear data. Flux and cross-section self-
covariances were specified by a Gaussian function assuming that nearby groups
are highly correlated and widely separated groups uncorrelated. This
procedure also guarantees a smooth output spectra, avoiding sharp peaks and
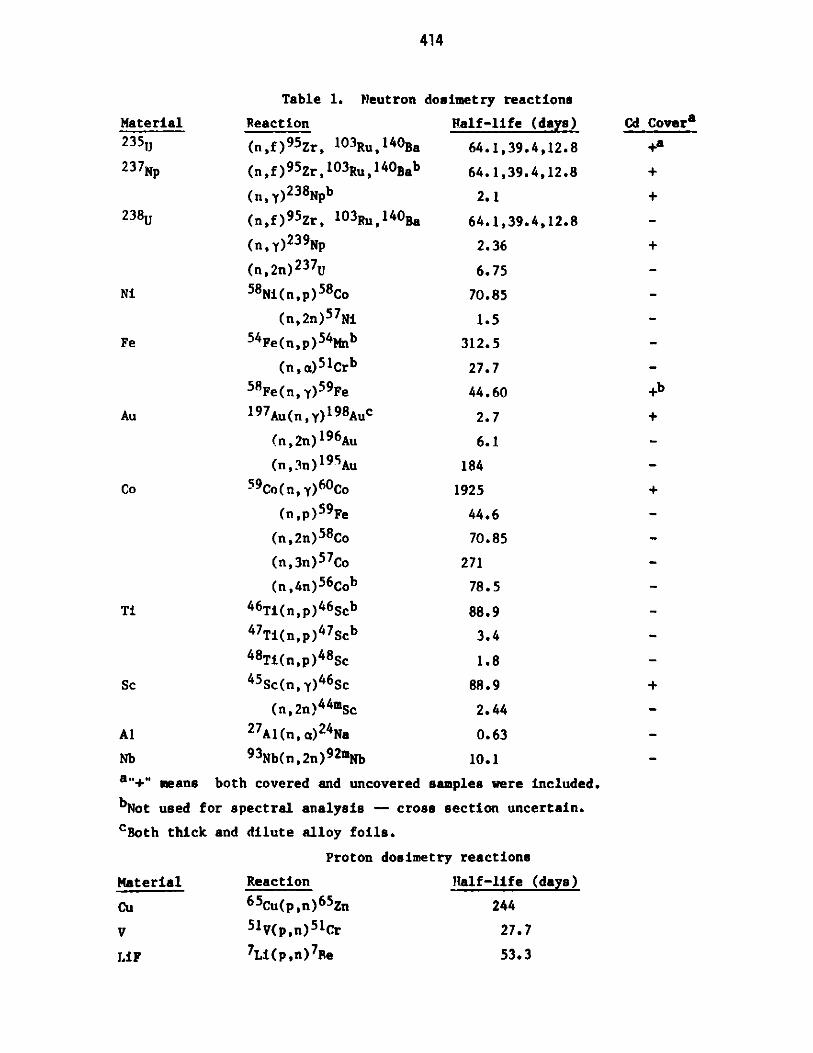
414
Table 1. Neutron dosimetry reactions
Material Reaction Half-life (days)
235UH (n ,f)95Zr, 1 0 3 Ru, 1 40 Ba 64.1,39.4,12.8
237Np (n,f)95Zr,10 3Ru,14OBab 64.1,39.4,12.8
(n,y)2 3 8Npb 2.1
238U (n,f)95Zr, 10 3Ru,1 40Ba 64.1,39.4,12.8
(n,y)239Np 2.36
(n,2n)237U 6.75
Ni 58Ni(n,p)58Co 70.85
(n,2n)5 7Ni 1.5
Fe 54Fe(n,p)54Mnb 312.5
(n, a)51Crb 27.758Fe(n,y)59Fe 44.60
Au 197Au(n,y)1 9 8 Auc 2.7
(n,2n)1 9 6Au 6.1
(n,3n)1 9 5Au 184
Co 59Co(n,y)60Co 1925
(n,p)5 9Fe 44.6
(n,2n)58Co 70.85
(n,3n)5 7Co 271
(n,4n)56Cob 78.5
Ti 46Ti(n,p)46Scb 88.94 7Ti(n,p)47Scb 3.4
48Ti(n,p)48Sc 1.8
Sc 4 5Sc(n,y)4 6Sc 88.9
(n,2n)44mSc 2.44
Al 27A1(n,a)24Na 0.63
Nb 93Nb(n,2n)92mNb 10.1
a"+" means both covered and uncovered samples were included.
bNot used for spectral analysis - cross section uncertain.
cBoth thick and dilute alloy foils.
Proton dosimetry reactions
Material Reaction Half-life (days)
Cu 65Cu(p,n)65Zn 244
V 5 1 V(p,n) 5 1 Cr 27.7
LiF 7Li(p,n)7 Be 53.3
Cd Covera
+8
+
+
+b
+
+

415
dips at known neutron resonances. The output covariance-error matrix was used
to compute broad group flux errors (Table 2) and can be used for errors in
derived quantities such as nuclear displacements or gas production in
irradiated materials.
In addition, the spatial flux distribution was determined for the two
other neutron-dosimetry locations of the mock-up shown in Fig. 1 and in the
vertical thimble of the REF, using 50-cm-long dosimetry wires of Fe, Ni, Ti,
and Co. After irradiation, the wires were cut into 2.5-cm segments. The
neutron spectrum in each segment was calculated by means of STAYSL to fit the
activities produced by eight reactions in the wires; the spectrum measured at
the corresponding principal disometry site was used as an input spectrum,
Integral fluxes (E > 1.0 MeV) of the resultant spectra were determined along
the length of these two dosimetry locations, but with less accuracy than at
the principal site, since fewer neutron reactions were available.
Secondary-proton dosimetry was also performed -in a position near the
principal neutron dosimetry site. The proton reactions listed in Table 1 for
Cu, V, and LiF were used to obtain an approximate estimate of secondary-
protron flux and crude energy distribution.
3. Neutron Spectra and Fluxes
3.1 Mock-up
The neutron spectra obtained at the principal dosimetry site of the mock-
up experiment are shown in Figs. 3 and 4 for the Ta and 2 3 8 U targets,
respectively. In these two figures, the solid lines are the theoretical
calculations (HETC and VIM) and the dotted lines are the results of fitting
the experimental foil activities of Table 1 with the STAYSL code, using the
calculated spectra as input. In Figs. 3 and 4, the experimental
determinations extend to 44 MeV, and the calculated spectra are not displayed
above this energy.
For both targets, the agreement between calculated and experimental
neutron spectra, is seen to be reasonably good. However, the experimental
data tend to yield more neutrons in the energy range between about 10-2 and
10-1 MeV, and fewer neutrons below 10-3 MeV, than one finds in the calculated
spectra for the two targets. The remaining differences above 10-1 NV are
close to, or within, the experimental error. The experimental error is least
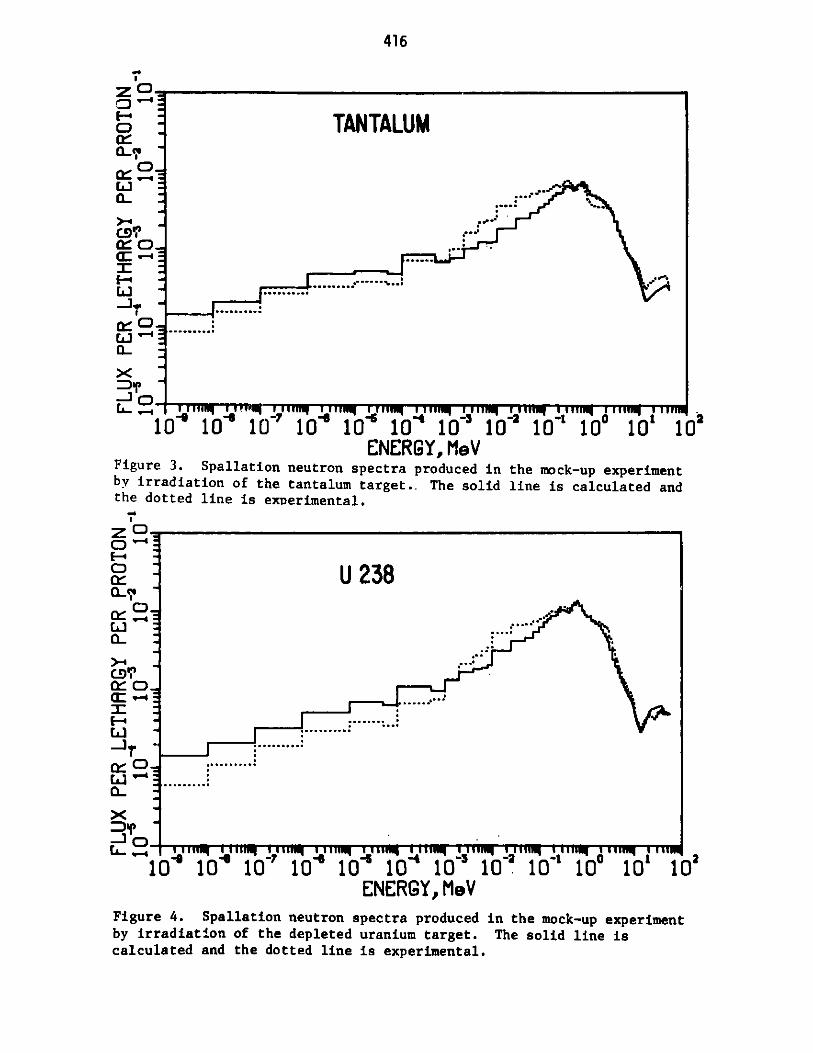
416
ZO-O -
o TANTALUM0-
^'.. ""T~li""T
a-
nip-
-g Y - -7 -6 -6 -4 -3 -2 -i 0 1 210 10 10 10 10 10 10 10 10 10 10 10ENERGY, MeV
Figure 3. Spallation neutron spectra produced in the mock-up experimentby irradiation of the tantalum target.. The solid line is calculated andthe dotted line is experimental.
w i U238
ao -j
'1i io40 10~ 10-6 10'* 10~ 1 1- 2 1ff 100 101 102aENERGY, MeV
Figure 4. Spallation neutron spectra produced in the mock-up experimentby irradiation of the depleted uranium target. The solid line iscalculated and the dotted line is experimental.

417
where the number of nuclear reactions and the magnitude of the cross sections
used in this study are greatest, namely, for neutron energies less than 10-3
MeV and between 2 and 10 MeV. However, owing to the strong covariance effects
between different neutron-energy groups, reducing the error in energy regions
that are well covered by reactions helps to establish the neutron spectrum in
the difficult region between 10-2 and 2 MeV, and integral errors in fluxes or
derived quantities are less than might be expected.
Above 10 MeV, an unexpected bump appears in both calculated and
experimental spectra for both target materials. The sharpness of these bumps
is due to the method of plotting the flux per unit lethargy (d/dlnE, or
equivalently, E d$/dE), which tends to accentuate high-energy features. In a
linear differential plot, d/dE, this feature becomes a marked change in slope
and is also revealed in the calculations of Fullwood et al. [13] In the
calculated spectra, this change of slope in the differential plot is the
beginning of the high-energy tail of spallation neutrons with energies up to
the incident proton energy, or 478 MeV in the present experiment.
The calculated neutron flux falls rapidly above 30 HeV. The neutron flux
in the 44-500 MeV energy region was ignored in the spectral measurements,
since adequate activation cross sections are not available. However, this
omission does not have any significant effect on the output flux solutions,
since the flux is falling rapidly with energy and the flux above 44 MeV is
less than 1% of the total. In particular, the rise in the lethargy spectra
above 14 MeV is not caused by omitting neutrons above 44 MeV, since the
reactions which have large cross sections between 10 and 30 MeV have
negligible cross sections above 44 MeV. Only the 59Co(n,3n) reaction would be
significantly affected, probably lowering the flux in the last few energy
groups (> 40 MeV) where the uncertainty is already very large.
Only the spectrum for neutron energies > 0.1 MeV is of importance to most
radiation-damage phenomena; however, the entire spectrum and neutron yield is
of concern for slow neutron scattering studies. Some values of integral flux
determined at the principal dosimetry site are displayed in Table 2 for both
target systems. The integral flux values for neutrons in several energy
ranges are shown, along with the one-standard-deviation error, and are
compared with the calculated results for neutron energies > 0.1 MeV and > 1.0
MeV. As a best estimate and for completeness, the calculated flux for neutron

Table 2. Integral neutron fluxes per incident 500 MeV proton
Neutrons (n/m2 per proton)
Mock-up Ta Target
Exp. Calc.
383(*15%)
8.31(*16%)
209(*21%)
60.1(*11%)
REF
Mock-up 2 3 8U Target Vertical thimble
Exp. Calc. (Center)
579(*13%)
4.51(*16%)
200 362(*17%)
63 114(*13%)
311
2.4
310 199
93 66
REF NSF
horizontal horizontal
thimble thimble
203
1.7
122
36
194
44
55
13
Secondary
Proton
Energy
(MeV)
20-40 00.2 ~0.2
Neutron
Energy
(MeV)
Total
Thermal
> 0.1
> 1.0 -a
Secondary Protons (P/rn2 per proton)
^o. 7X0.3

419
energies > 44 MeV has been added to the experimental determinations of
integral fluxes for all lower energy limits. The consequences of this
assumption, or any other reasonable assumption for the flux above 44 MeV, are
Quite small for the total, thermal En > 0.1 MeV, and En > 1 MeV integral
fluxes. The standard-deviation errors for the integral fluxes reflect the
uncertainties in the neutron-spectrum determinations. They do not, however,
include an overall 15% uncertainty due to possible error in the 2 7A1 (p,x)
2 2Na cross section (17.8 mb) used to 2 3 8U targets, but not to the realtive
error between the Ta and 238U results.
It should be noted that the agreement between experimental and calculated
values of integrated flux for neutrons with energies > 0.1 MeV is somewhat
fortuitous for Ta. With reference to Fig. 3, it can be seen that the
integrals of the calculated and experimental curves are equal only if the
lower-energy limit is about 0.1 MeV. Other lower-energy limits of integration
will result in significant differences between calculated and experimental
integrated fluxes.
Also displayed in Table 2 are the results of an attempt to measure the
secondary-proton flux present at the principal neutron dosimetry site. The
spallation reaction 2 7 A1 (p,x) 2 2 Na is of only limited use, owing to probably
interference by a similar neutron spallation reaction, 27A1 (n,x) 22Na, o
unknown cross section. This interference will only take place at the neutron -
dosimetry sites that are near the target. The primary-proton dosimetry foil;
at the front of the Pb reflector (Fig. 1) will not be exposed to a comparable
flux of very high-energy neutrons (4<« 4p). The results of the reactions
listed in Table 2 indicate a secondary-proton flux of roughly 0.3 p/m 2 per
incident 478-MeV proton, with energy values in the range of 20-40 MeV. The
22Na production can be accounted for by assuming the calculated neutron flux
for En > 40 MeV and a high-energy neutron cross section for 22Na production
equal to the cross section for high-energy protons. The estimate of the
secondary-proton flux could be improved considerably through knowledge of the
spallation cross section for high-energy neutrons in aluminum. The secondary-
proton flux is assumed to be predominantly above 20 MeV, since the cross
sections for the proton reactions with Cu, V, and Li all rise steeply below 20
MeV. We would thus expect to observe much greater activation if there were a
significant proton flux below 20 MeV. Furthermore, all three activation rates

420
can be simultaneously fit, assuming most protons are in the 20-40 MeV energy
region. In any case, this weak secondary-proton flux does not appear to be
significant in terms of either radiation damage in materials or interference
with the neutron dosimetry [e.g., the (p,d) reaction is indistinguishable from
(n,2n), etc.J.
3.2 Radiation Effects Facility
The energy distribution of the neutrons at the position of maximum flux
along the center of the REF vertical thimble is shown in Fig. 5 along with the
energy distribution for fission neutrons. The neutron flux measurements were
made with 1 atm of He gas in the irradiation thimble, and only minor changes
are expected if the cryostats contain liquid helium. The REF neutron spectrum
can be characterized as a degraded fission spectrum with a high-energy
component. The flux of neutrons with E > 0.1 MeV is 199 (n/m2)/p, and the
ratio of thermal to "fast" (E > 0.1 MeV) neutrons is 0.012 for 500-MeV protons
incident upon the 2 3 8 U target. The secondary proton flux is estimated to be
0.7 * 0.5 (p/m2)/p or 0.4% of the flux of neutrons with E > 0.1 MeV.
Radiation of LiF thermal luminescence dosimeters has placed an upper limit on
the y flux of 15% of the total dose in Rads.
The neutron energy distribution for the REF horizontal thimble is also
shown in Fig. 5. This spectrum is very similar to the spectrum for the
vertical thimble, and the minor differences are likely due to the increased
target-cooling water near the horizontal thimble. In the horizontal thimble
the flux of neutrons with F > 0.1 MeV is 122 (n/m 2 )p, and the ratio of thermal
to "fast" (E > 0.1 MeV) neutrons is 0.014 for 400-MeV protons incident upon
the 2 3 8 U target. The lower number of neutrons per proton for the horizontal
thimble is due in part to the differences in the distance from the target axis
to the horizontal thimble and the vertical irradiation thimbles. The proton
flux in the horizontal thimble is estimated to be 0.20 * 0.15 (p/m2)/p or 0.2%
of the flux of neutrons with E > 0.1 MeV. The neutron and proton fluxes at
the principle dosimetry sites in the REF are listed in Table 2.

421
-2
IPNS-REF * -M""._- ' .VERTICAL
;"10 - - HORIZONTAL'' S.-
s 0 -- 0%'-
-FISSION
-3-2- 50 1031c 2 0 ' 10 010 110 2
NEUTRON ENERGY (MeV)
Figure 5. Neutron spectra produced in the vertic 1 and horizontal thimbles of
the REF by 500-MeV protons incident upon the U81 target; a pure fission
neutron spectrum is shown for comparison.
3.3 Neutron Scattering Facility
Figure 6 shows the neutron energy spectrum for one of the horizontal
thimbles in the NSF, the REF vertical thimble, and a pure fission spectrum.
The neutron energy distribution for the NSF and REF are quite different,
particularly at low neutron energies. The additional low-energy neutrons are
produced by (n,2n) reactions and down-scattering in the C and Be. The flux of
neutrons with E > 0.1 MeV is 55 (n/s2)/p, and the ratio of thermal to "fast"
(E > 0.1 MeV) neutrons is 0.80 for 500-MeV protons incident upon the 238U
target. The neutron fluxes available in the NSF are listed in Table 2.

422
T0~
IPNS0
0=
Q0-
REF
x 4 ... - t -5 - -
~3 FISSION -
10 10 10 10 10 10 10 10 10 10 1102NEUTRON ENERGY, MeV
Figure 6. Neutron spectra produced in the REF vertica thimble and NSFhorizontal thimble by 590-MeV protons incident upon the U targets; a pure
fission spectrum is shown for comparison.
4. Spatial Distribution of Neutron Flux
4.1 Mock-up.
All of the above results have been obtained from the complete set of
reactions listed in Table 1, determined at the principal dosimetry sites;
however, additional data were obtained at the other neutron dosimetry
locations shown in Fig. 1, using only eight reactions. Integrated-spatial
flux distributions were obtained in directions perpendicular and parallel to
the target cylinder axis, though not to the same degree of accuracy as was
possible at the principal dosimetry site. Figure 7 shows the experimental and
calculated integrated flux for neutron energies greater than 1.0 MeV, for both
Ta and 238U irradiations in the direction perpendicular to the target axis
(see Fig 1.). The perpendicular dosimetry hole was located -4 cm from the
front face of the target, a position chosen to coincide with the maximum flux
along the target axis as calculated prior to these experiments. The
calculated position of the flux peak is confirmed in Fig. 8, which shows the
experimental and calculated flux distributions (En > 1.0 MeV) along the
parallel dosimetry direction.
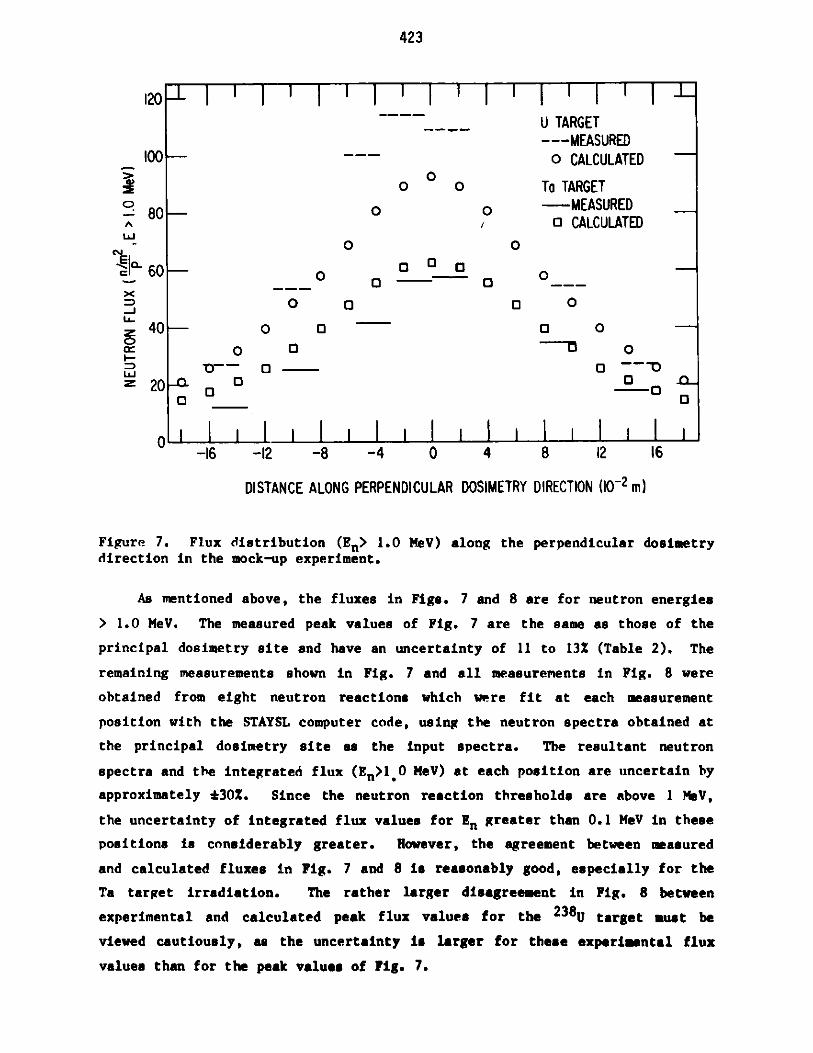
423
120U TARGET--- MEASURED
100 ---- 0 CALCULATED
o 0 To TARGET
80 -0--MEASUREDA 0 CALCULATED
N-0 0
00
0 O 0 0 0
0 o 0 o
z 20- 0 0000 _
C -16 -12 -8 -4 0 4 8 12 16
DISTANCE ALONG PERPENDICULAR DOSIMETRY DIRECTION (10-2 m)
Figure 7. Flux distribution (En> 1.0 MeV) along the perpendicular dosimetrydirection in the mock-up experiment.
As mentioned above, the fluxes in Figs. 7 and 8 are for neutron energies
> 1.0 MeV. The measured peak values of Fig. 7 are the same as those of the
principal dosimetry site and have an uncertainty of 11 to 13% (Table 2). The
remaining measurements shown in Fig. 7 and all measurements in Fig. 8 were
obtained from eight neutron reactions which were fit at each measurement
position with the STAYSL computer code, using the neutron spectra obtained at
the principal dosimetry site as the input spectra. The resultant neutron
spectra and the integrated flux (En>l.0 MeV) at each position are uncertain by
approximately *30%. Since the neutron reaction thresholds are above 1 MeV,
the uncertainty of integrated flux values for En greater than 0.1 MeV in these
positions is considerably greater. However, the agreement between measured
and calculated fluxes in Fig. 7 and 8 is reasonably good, especially for the
Ta target irradiation. The rather larger disagreement in Fig. 8 between
experimental and calculated peak flux values for the 238U target gust be
viewed cautiously, as the uncertainty is larger for these experimental flux
values than for the peak values of Fig. 7.
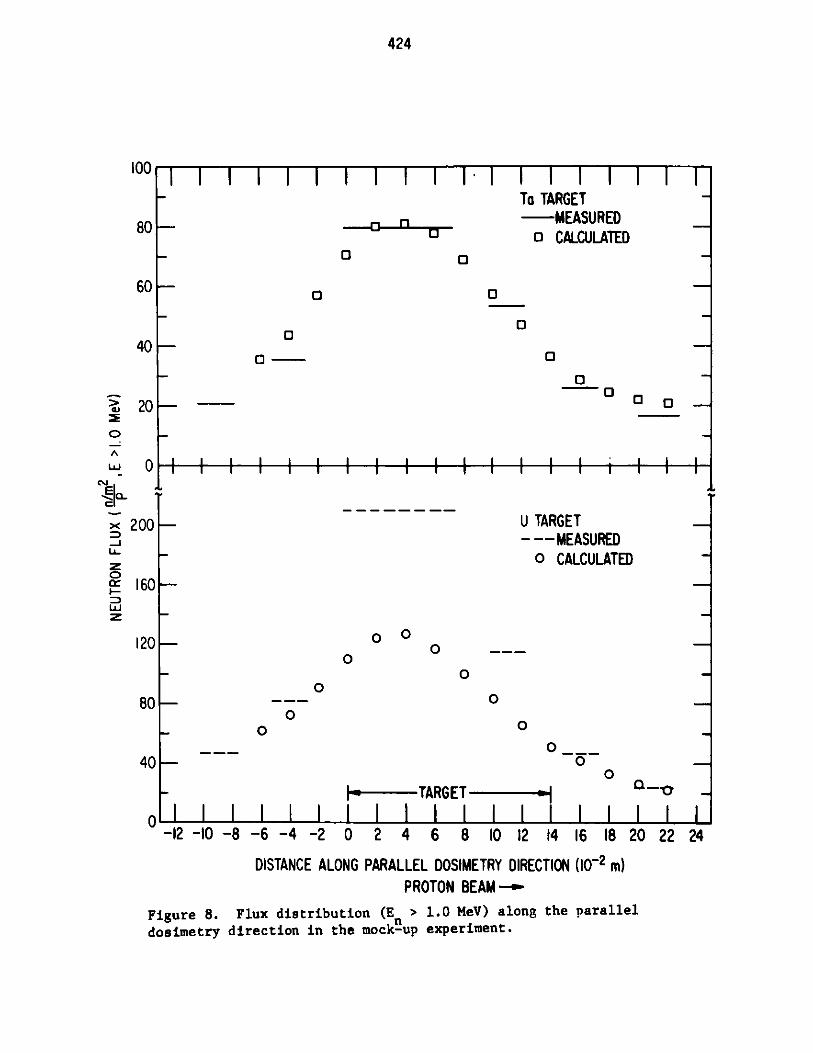
424
I I I I I
0
0
- I
- _ I
To TAF
00
0
0
100
80
60
40
2010
A
x 2002-JL
z
L I I I I I I I I I
RGETMEASUREDCALCULATED
00 - -
U TARGET- -- MEASURED
0 CALCULATED
0
0
0
0
SI I I
0
0
0
0
0_
-TARGET - mI I I I I I I I I
0a-
S l I
-12 -10 -8 -6 -4 -2 0 2 4 6 8 10 12 14 16 18 20 22 24
DISTANCE ALONG PARALLEL DOSIMETRY DIRECTION (10-2 M)PROTON BEAM-'
Figure 8. Flux distribution (E > 1.0 MeV) along the parallel
dosimetry direction in the mock-up experiment.
0
0 -
I I
0
120
80
40
0
0 i i i 0 4 i i I - - 0 i i i i i i i i 4--
.
I I 1 1 1
l

425
The accuracy of the spectra above 1.0 MeV is sufficient to make some
qualitative statements concerning the variation of these spectra along the two
directions. In the perpendicular direction, which is nearly radial, the
neutron spectrum above 1.0 MeV softens slightly with increasing distance from
either target; the ratio of neutrons above 10 MeV to those above 1.0 MeV is
^30% lower at a location 20 cm out from t1' primary dosimetry site. In this
direction the thermal-neutron flux decreases less sharply than the flux for En
> 1.0 MeV.
The spectral changes above 1.0 MeV are slight along the direction
parallel to the target axis and between the target and reflector. Above 1.0
MeV, the spectrum hardens somewhat with increasing distance behind the front
face of the target; the ratio of neutrons above 10 MeV to those above 1.0 MeV
is --20% higher 20 cm from the peak flux position. However, the thermal-
neutron flux, measured in front of and behind the target, falls less sharply
than the flux for E > 1.0 MeV. This is probably due to the target-cooling
systems, since slightly larger volumes of water are located immediately in
front of and behind the targets than along their sides.
4.2 REF.
The spatial variation of neutrons with E > 0.1 MeV within the REF
thimbles has been determined from the activation of Ni dosimeter wires [5 8Ni
(n,p)58CoJ. The fluxes were determined by comparing the measured activities
with those measured at the positions of the full spectral dosimetry
packages. Any changes in the neutron energy spectrum have been ingnored.
Figure 9 shows the variagion of the neutron flux (E > 0.1 MeV) within the
REF vertical thimble. The surfaces of constant neutron flux within the
thimble can be approximated by cylinders centered on the 2 38U target axis.
The maximum flux is 311 (n/ m2)/p at the position nearest the target. The
flux decrease within the crystal in a direction perpendicular to the target
axis is nearly linear. The 502 decrease across the vertical thimble is larger
than the -302 decrease expected in a solid Pb reflector but the same as the
decrease expected in a solid Ta reflector. The difference between these two
reflector materials is due to the additional neutron generation in Pb by
multiple neutron reactions.

426
ISOFLUX LINES IN THE REF CRYOSTAT
TOPVIEW OFCENTRALPLANE
A
0.90.8
B
7 0.6
0.20
0.18
0.16
0.14
.12REF TARGET
. A
0.06
0.04
DISTANCE FROM 0.CRYOSTAT BOTTOM(m)
02
7 -
.6
0.5
1
B OA B
NEUTRON FLUXACROSS CRYOSTATCENTER
0.02 0.04
Figure 9. Spatial variation of the neutron flux
within the REF vertical thimble.(En > 0.1 MeV)
I

427
Figure 10 shows the variation of the neutron flux (E > 0.1 MeV) along the
length of the REF horizontal thimble located below the 23 8U target. The
neutron flux is a maximum at a position 4-5 cm behind the front face of the
238U target, in agreement with previous calculations. This measurement was
made along the bottom of the horizontal thimble. At the top of the horizontal
thimble (1.5 cm closer to the target), the flux is 30% higher.
cnIPNS-REFHORIZONTAL FACILITY
>- 1.0
0.75
S 0.50-
0
J0.25-
U-
M 500-MeV
PROTONS M3U TARGET
00.050 0.40 0.30 0.20 0.10 0
DISTANCE FROM BACKSTOP (m)
Figure 10. Spatial variation of the neutron flux (En > 0.1 MeV) within the
REF horizontal thimble.
In the case of the NSF horizontal thimbles, which are nearly radial to
the target axis, the neutron flux decreases rapidly with increasing distance
from the target. The rate of flux decrease is the same as in the midplane of
the REF vertical thimble (Fig. 9).

428
7. Summary
The neutron spectra, flux and flux spatial distribution for a spallation
neturon source have been determined for a simplified system who's geometry
allowed computer modeling of the neutron generation. Based on these results,
a new neutron source, the IPNS, has recently been constructed at Argonne
National Laboratory. This source is a national facility for radiation effects
and condensed matter research. The Radiation Effects Facility (REF) has two
cryogenic irradiation thimbles and one ambient-temperature irradiation
thimble, and the Neutron Scattering Facility has two ambient-temperature
irradiation thimbles. The neutron spectra, flux and flux spatial distribution
has been determined for each of these thimbles. The large, well-controlled
and -instrumented irradiation volume, the well-characterized neutron spectrum
and flux, and the dedication to radiation effects studies make the REF ideally
suited for both basic and applied research.
Acknowledgments
The authors would like to thank the operators and other personnel
associated with the RCS accelerator for their assistance with the
irradiations.
429
References
1.) R. C. Britcher, T. H. Blewitt, M. A. Kirk, T. L. Scott, B. S. Brown and
L. R. Greenwood, J. Nucl. Mater. To be published.
2.) M. A. Kirk, R. C. Birtcher, T. H. Blewitt, L. R. Greenwood, R. J. Popek
and R. R. Neinrich, J. Nucl. Matte. 96 (1981) 37.
3.) E. A. Crosbie, M. H. Foss, T. K. Khoc and J. D. Simpson, IEEE Trans.
Nucl. Sci. NS-22(3) 1975, 1056.
4.) J. Tobailem, C. H. Lassus-St. Genies and L. Leveque, Commissariat a
l'Energie Atomique (France) Report No. CEA-N-1446 (1971).
5.) K. C. Chandler and T. W. Armstrong, Oak Ridge National Laboratory Report
ORNL-4744 (1972).
6.) F. M. Gelbard and R. E. Prael, Argonne National Laboratory Report ANL-
75-2 (1974).
7.) C. W. Potts, IFEF Trans. Nucl. Sci., NS-28 (1981) 2104.
8.) F. G. Perey, Oak Ridge National Laboratory Report ORNL/TM-6062 (1977) as
modified by L. R. Greenwood.
9.) R. Malewicki, R. R. Heinrich and R. J. Popek, Proc. 23rd Conf. on
Analy al Chemistry in Energy Technology, Radioelement Analysis-
Progress and Problems, Gatlinburg, Tnn., Oct. 9-11, (1979) 155.
10.) FNDF/B-IV Dosimetry File, Brookhaven National Laboratory Report BLN-NCS-
50446 (1975).
11.) L. R. Greenwood, Argonne National Laboratory Report ANL-FPP/TM-115
(1978).
12.) L. R. Greenwood, R. R. Heinrich, M. J. Saltmarsh and C. B. Fulmer, Nucl.
Sci. Eng. 72 (1979) 175.
13.) R. R. Fullwood, J. D. Cramer, R. A. Haarman, R. F. Forrest, Jr., and R.
G. Schrandt, Los Alamos Scientific Laboratory Report LA-4789 (1972).

430

431
ICANS-VI
INTERNATIONAL COLLABORATION ON ADVANCED NEUTRON SOURCES
June 27 - July 2, 1982
TIME-STRUCTURE OF THERMAL NEUTRON LEAKAGE FROM
FAST AND SLOW MODERATORS FOR SPALLATION NEUTRON SOURCES
G.S. Bauer, H.M. Conrad, K. Grunhagen and H. SpitzerInstitut fur Festkorperforschung der KFA JUlich GmbH
W.Germany
F. Gompf and W. ReichardtKernforschungszentrum Karlsruhe
Institut fur Angewandte KernphysikW.Germany
W.E. FischerSchweizerisches Institut fur Nuklearforschung
Villigen, Switzerland
ABSTRACT
The dwell-times of neutrons slowed down either in small polyethy-
lene moderators or a large D20 volume have been measured. The
fast neutrons have been produced by bombarding lead, lead-bismuth,
depleted uranium and tungsten targets of slab or cylindrical
shape with short pulses of 590 MeV protons. Lead and beryllium
reflectors have been employed for the rectangular shaped grooved
polyethylene moderators. The geometry-adapted (jagged) polyethy-
lene moderators used with the cylindrical target have been measu-
red only in "D20-reflected" configuration. The essential result
of the numerical analysis of about 40 target-moderator-reflector
configurations tested is that for the "fast" (light hydrogen)
moderators the most intense flux component decays in 100 ps or
less.

432
TIME-STRUCTURE OF THERMAL NEUTRON LEAKAGE FROM
FAST AND SLOW MODERATORS FOR SPALLATION NEUTRON SOURCES
G.S. Bauer, H.M. Conrad, K. Grunhagen and H. SpitzerInstitut fur Festkorperforschung der KFA JUlich GmbH
W.Germany
F. Gompf and W. ReichardtKernforschungszentrum Karlsruhe
Institut fur Angewandte KernphysikW.Germany
W.E. FischerSchweizerisches Institut fUr Nuklearforschung
Villigen, Switzerland
1. INTRODUCTION
The main advantage of the latest type of high intensity neutron
source is the nearly unrestricted time structure which can be
imposed on the primary fast neutron flux. The width of the ther-
mal neutron peak flux is, however, governed both by the proton
pulse width and the dwell time of the thermalized neutrons in
the moderator. In other words, even an infinitely short proton
pulse would result in a thermal neutron peak decaying with a
finite half-width determined by geometry and material of the
moderator. Besides short neutron pulses necessary for time-of-
flight spectroscopy the designer of a spallation source is in-
terested in obtaining as high peak and average fluxes as pos-
sible. In order to optimize pulse width, peak flux and average
flux the precise dwell times of thermalized neutrons in different
moderators have to be measured. The experimental analysis of
moderator characteristics is quite difficult, if the proton
pulse on the target is inadequately broad. Therefore we repeated
and extended our previous investigations /Bauer et al. 1981a/ at
the Swiss proton cyclotron (SIN) with a considerably improved
proton chopper.
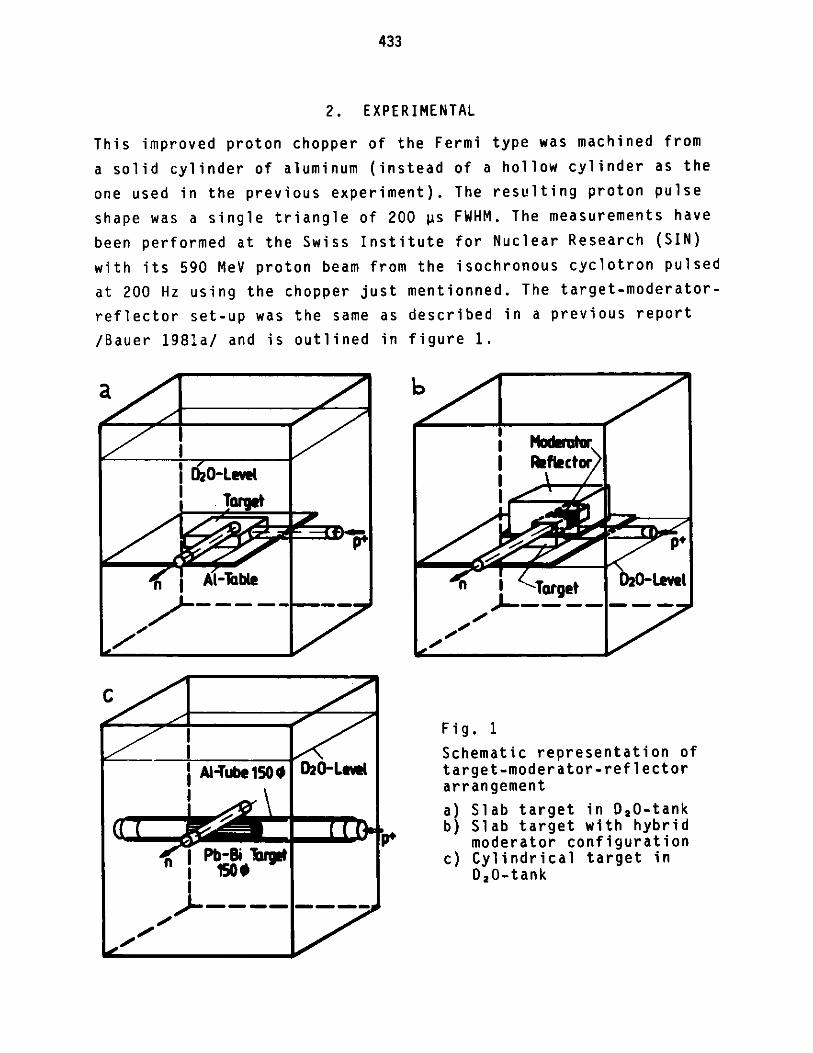
433
2. EXPERIMENTAL
This improved proton chopper of the Fermi type was machined from
a solid cylinder of aluminum (instead of a hollow cylinder as the
one used in the previous experiment). The resulting proton pulse
shape was a single triangle of 200 ps FWHM. The measurements have
been performed at the Swiss Institute for Nuclear Research (SIN)
with its 590 MeV proton beam from the isochronous cyclotron pulsed
at 200 Hz using the chopper just mentionned. The target-moderator-
reflector set-up was the same as described in a previous report
/Bauer 1981a/ and is outlined in figure 1.
aI
>1, -pp I
Al-ube150
Pb-i T tI04
D20-Lew
=-10
- mm
Fig. 1
Schematic representation oftarget-moderator-reflectorarrangement
a) Slab target in D20-tankb) Slab target with hybrid
P moderator configurationc) Cylindrical target in
D20-tank
i .T
n AI-Table
Reflector
n Target
6:0e /-Awl
Alp-
wo
000000
P*
0 !ML
C
PO5 l

434
Two types of arrangements have been investigated: the slab target
geometry representing the lay-out of the proposed German spalla-
tion source SNQ and a cylindrical target configuration simulating
the liquid metal target proposed for the Swiss project.
In the case of the cylindrical target jagged polyethylene modera-
tors of sixfold rotational symmetry, both with and without grooves,
have been employed. This new moderator is shown in figure 2.
thermal neutron beam tube
solid part - groove
Pb-Bi target Al-foil not drawn
target supporting tube 210
(0.5 cm aluminum)
Fig. 2
The jagged moderator for cylindrical targets
In order to more realistically simulate the flux depression by
beam holes, additional aluminum tubes not shown in figure 1
viewing the moderators have been mounted.
The time structure of the thermal neutron field in the polyethy-
lene moderator and in the D20 tank have been measured inserting
a small, low-efficiency BF 3 counter (0.6 cm diameter, 3 cm long)
into holes in the polyethylene moderators. The neutron intensities
measured as a function of time as well as the primary proton

435
distribution were stored in a small computer with time-of-flight
interface. The time channel width was 25 ps. The primary proton
time distribution (triangle!) was measured with a scintillator
telescope viewing a carbon scatterer in the direct beam.
3. DATA EVALUATION AND RESULTS
In order to extract the neutron dwell times from the measured
intensity distributions we assumed a mathematical expression for
the neutron field decay of the form
f(t) = f - exp(-t/T1 ) + f2 - exp(-t/' 2)*
since we found that two time constants T1 and T2 were sufficient
for a proper description of our data. This above expression was
convoluted numerically with the measured triangular-shaped primary
proton distribution and the resulting convolution fitted to the
experimental data varying the four parameters fl, f2, T 1 and T2.
In a series of cases (mainly with the fast moderator and lead
reflector) it was found that only two parameters (f1 and T1) were
necessary for a perfect fit. In figure 3 is given an example of
the experimental data and the resulting fitted curve.
3.1 Results for slab targets
Three different target materials have been used in slab geometry
simulating the target wheel of the German spallation project:
a lead target of 10x75x60 cm3 (height x depth x width), a tung-
sten target of 10x30x21 cm3 and a target of depleted uranium of
10x50x45 cm3 . The grooved polyethylene moderator was placed at
the maximum of the fast neutron flux emerging from the targets.
Table 1 shows selected results from the numerical fitting calcu-
lations mentioned above. Besides the proper fitting parameters
derived quantities like the integrated intensity and the stan-
dard deviation of the distribution ire listed.
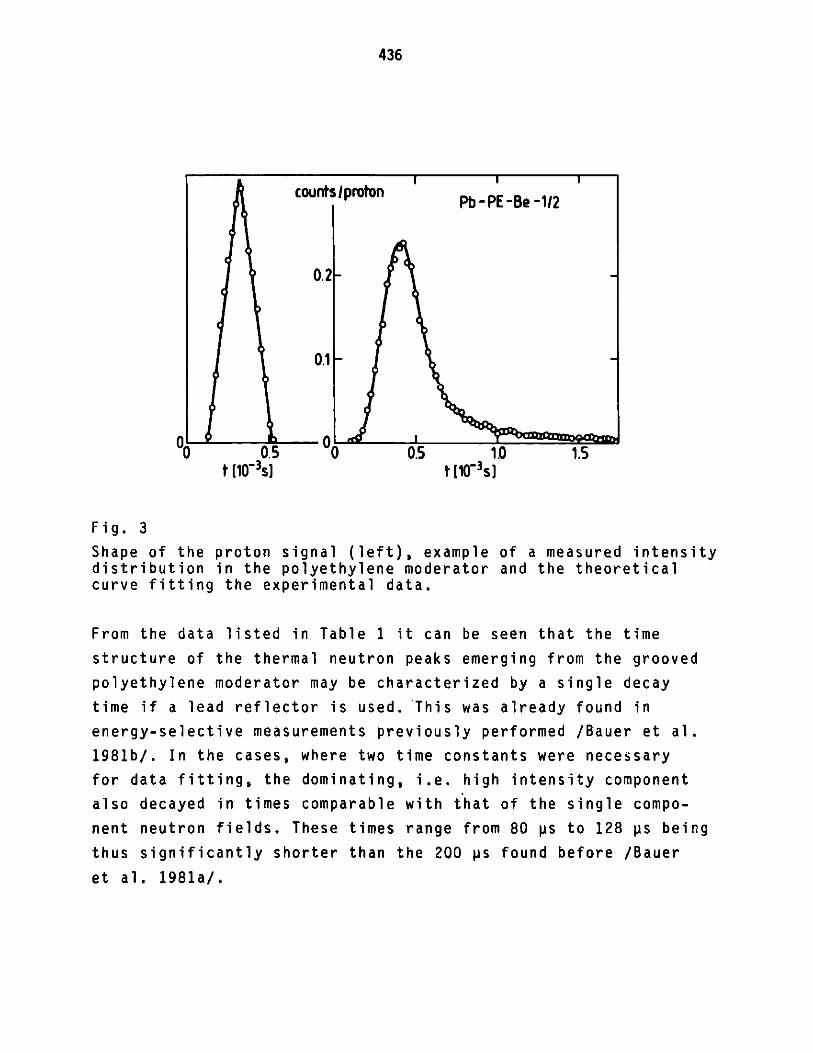
436
could
C
0o 0.5t [10 3sJ
nts Iproton
I. 2
.
0.5 1.0t (10 3s]
1.5
Fig. 3
Shape of the proton signal (left), example of a measured intensitydistribution in the polyethylene moderator and the theoreticalcurve fitting the experimental data.
From the data listed in Table 1 it can be seen that the time
structure of the thermal neutron peaks emerging from the grooved
polyethylene moderator may be characterized by a single decay
time if a lead reflector is used. This was already found in
energy-selective measurements previously performed /Bauer et al.
1981b/. In the cases, where two time constants were necessary
for data fitting, the dominating, i.e. high intensity component
also decayed in times comparable with that of the single compo-
nent neutron fields. These times range from 80 ps to 128 ps being
thus significantly shorter than the 200 ps found before /Bauer
et al. 1981a/.
Pb-PE -Be -112
F -
F -
9 1'1
11 :
V
I I
D.1F
0
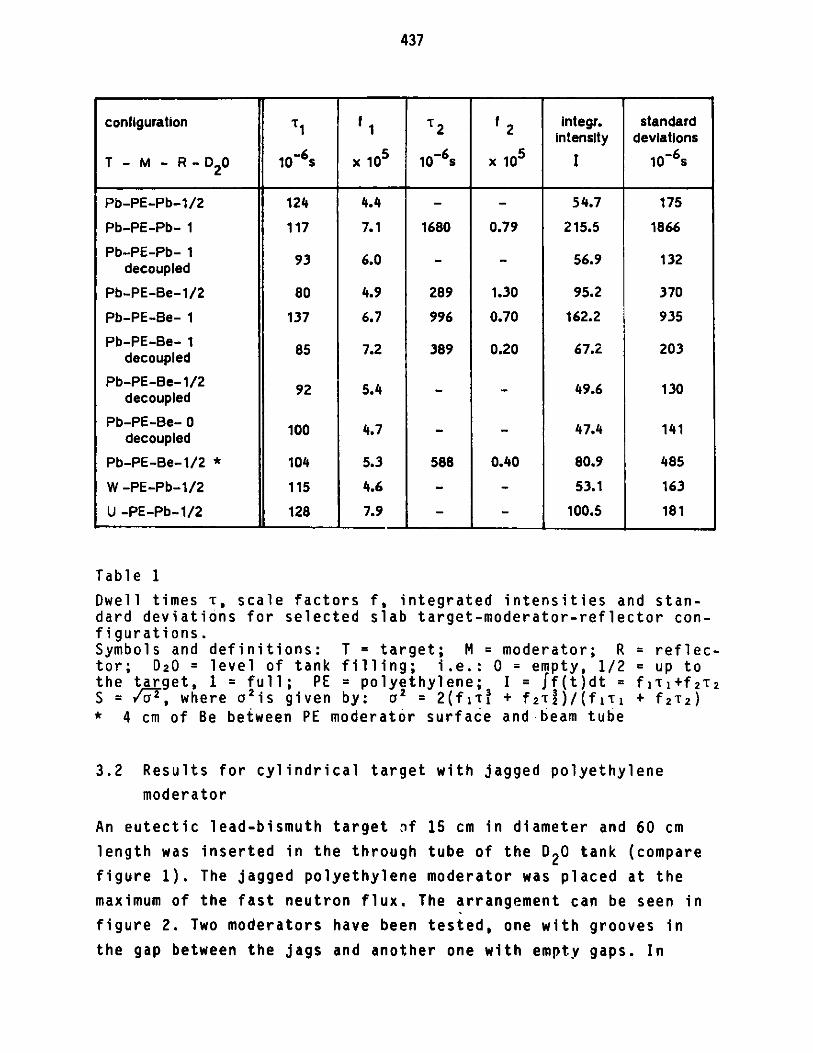
437
configuration T f 1 T 2 f2 integr. standardintensity deviations
T - M - R - D 2 0 i0-6 s x 105 10-6 s x 105 I 10-6 s
Pb-PE-Pb-1/2 124 4.4 - - 54.7 175
Pb-PE-Pb- 1 117 7.1 1680 0.79 215.5 1866
Pb-PE-Pb- 1 93 6.0 - - 56.9 132decoupled
Pb-PE-Be-1/2 80 4.9 289 1.30 95.2 370
Pb-PE-Be- 1 137 6.7 996 0.70 162.2 935
Pb-PE-Be- 1 85 7.2 389 0.20 67.2 203decoupled
Pb-PE-Be-1/2 92 5.4 - - 49.6 130decoupled
Pb-PE-Be- 0 100 4.7 - - 47.4 141decoupled
Pb-PE-Be-1/2 * 104 5.3 588 0.40 80.9 485
W -PE-Pb-1/2 115 4.6 - - 53.1 163
U -PE-Pb-1/2 128 7.9 - - 100.5 181
Table 1
Dwell times T, scale factors f, integrated intensities and stan-dard deviations for selected slab target-moderator-reflector con-figurations.Symbols and definitions: T = target; M = moderator; R = reflec-tor; D20 = level of tank filling; i.e.: 0 = empty, 1/2 = up tothe target, 1 = full; PE = polyethylene; I = ff(t)dt = f1T1+f2T2S = /T, where a2is given by: a2 = 2(frT? + f 2 T1)/(f 1 T1 + f2T2)* 4 cm of Be between PE moderator surface and -beam tube
3.2 Results for cylindrical target with jagged polyethylene
moderator
An eutectic lead-bismuth target of 15 cm in diameter and 60 cm
length was inserted in the through tube of the D20 tank (compare
figure 1). The jagged polyethylene moderator was placed at the
maximum of the fast neutron flux. The arrangement can be seen in
figure 2. Two moderators have been tested, one with grooves in
the gap between the jags and another one with empty gaps. In
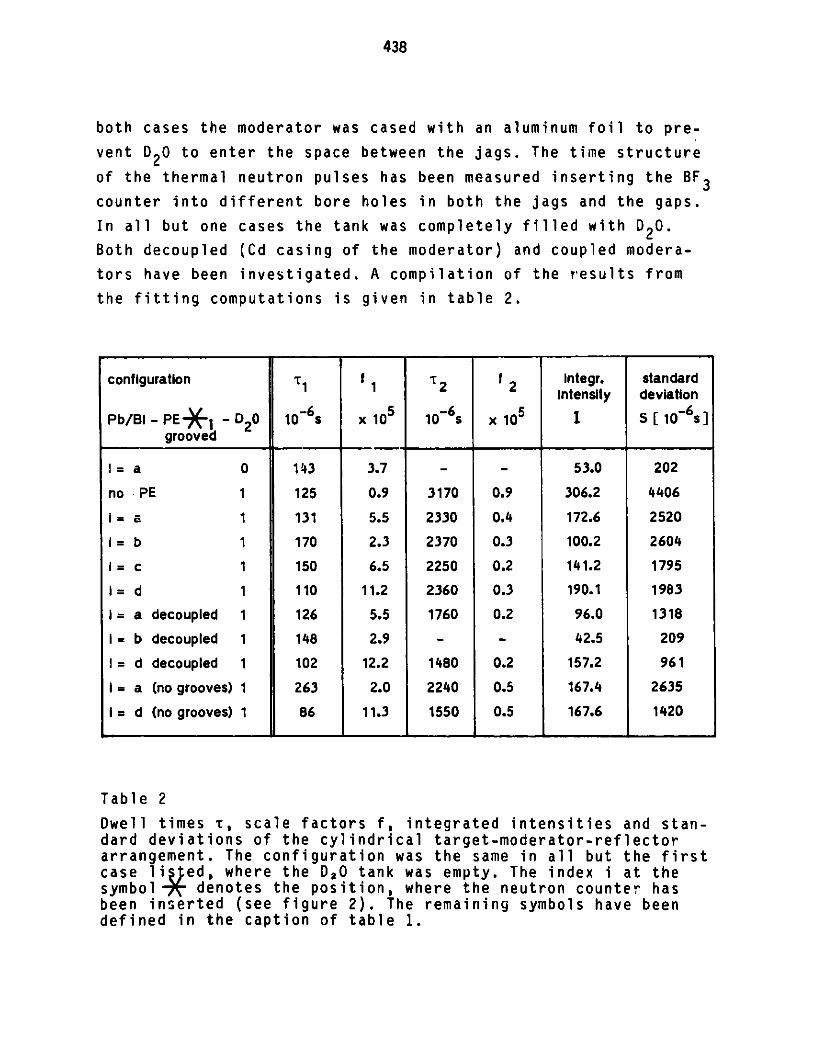
438
both cases the moderator was cased with an aluminum foil to pre-
vent D20 to enter the space between the jags. The time structure
of the thermal neutron pulses has been measured inserting the BF 3
counter into different bore holes in both the jags and the gaps.
In all but one cases the tank was completely filled with D20.
Both decoupled (Cd casing of the moderator) and coupled modera-
tors have been investigated. A compilation of the results from
the fitting computations is given in table 2.
Table 2
Dwell times T, scale factors f, integrated intensities and stan-dard deviations of the cylindrical target-moderator-reflectorarrangement. The configuration was the same in all but the firstcase li ed, where the D20 tank was empty. The index i at thesymbol denotes the position, where the neutron counter hasbeen inserted (see figure 2). The remaining symbols have beendefined in the caption of table 1.
configuration T f fT22 integr. standardintensity deviation
Pb/BI - PE - 20 10-6s x 105 1-6s x 105 I S [1-s]grooved
I= a 0 143 3.7 - - 53.0 202
no . PE 1 125 0.9 3170 0.9 306.2 4406
= a 1 131 5.5 2330 0.4 172.6 2520
= b 1 170 2.3 2370 0.3 100.2 2604
i = c 1 150 6.5 2250 0.2 141.2 1795
I = d 1 110 11.2 2360 0.3 190.1 1983
1 = a decoupled 1 126 5.5 1760 0.2 96.0 1318
= b decoupled 1 148 2.9 - - 42.5 209
I = d decoupled 1 102 12.2 1480 0.2 157.2 961
= a (no grooves) 1 263 2.0 2240 0.5 167.4 2635
1 = d (no grooves) 1 86 11.3 1550 0.5 167.6 1420

439
4. CONCLUSIONS
In the case of the grooved fast moderator for slab targets the
neutron peaks were found to be shorter than deduced from previous
measurements. A dwell time of 80...120 .as is considerably shorter
than the proton pulses of 500 ps of the SNQ linac. Thus the maxi-
mum possible peak flux will not be reached. As compared to previ-
ous estimates based on decay times of 200 ps the peak flux would
only increase by 8 % due to the reduction of the dwell time to
100 ps. Shortening, for instance, the proton pulse to 250 ps
would yield a gain of 100 % with a dwell time of 100 ps, whereas
a gain of 55 % only would result, if the dwell time was 200 ps.
Thus there is a big incentive to try to increase the pulse proton
current to 200 mA and shorten the pulse to 250 ps.
For the cylindrical target (in liquid state), which shall be
employed for the Swiss spallation source, the above considera-
tions may be of no importance, as it was proposed to operate that
source continuously. Besides that, the D20 moderator would domi-
nate the time structure. Thereby the proton pulse length is no
important parameter.
REFERENCES
G.S. Bauer, W.E. Fischer, F. Gompf, M. Kuchle, W. Reichardt, andH. Spitzer (1981 a)"Thermal Neutron Leakage and Time Structure Measured for VariousTarget-Moderator-Reflector Configurations for a Spallation Neu-tron Source"paper D2-4 in "ICANS V" pp. 445-474, G.S. Bauer and D. Filges,eds., report JUl-Conf-45, Kernforschungsanlage Jillich
G.S. Bauer, H.M. Conrad, H. Spitzer, K. Friedrich, and G.Milleret (1981 b)"Measurement of Time Structure and Thermal Neutron Spectra forVarious Target-Moderator-Reflector Configurations of an Intensi-ty-Modulated Spallation Neutron Source"paper D2-5 in "ICANS V" pp. 475-488, G.S. Bauer and D. Filges,eds., report Jul-Conf-45, Kernforschungsanlage Julich

440

441
ICANS-VI
INTERNATIONAL COLLABORATION ON ADVANCED NEUTRON SOURCES
June 27 - July 2, 1982
SOME ASPECTS OF THE NEUTRONICS OF THE SIN NEUTRON SOURCE
F. Atchison and W.E. FischerSchweizerisches Institut fur Nuklearforschung
CH-5234 Villigen, Switzerland
and
B. SiggInstitut fur Reaktortechnik, ETHZCH-5303 Wurenlingen, Switzerland
ABSTRACT
Some results from both experiment and calculation, obtained as
part of the optimisation study for the SIN neutron source are
presented.

442
SOME ASPECTS OF THE NEUTRONICS OF THE SIN NEUTRON SOURCE
F. Atchison and W.E. FischerSchweizerisches Institut fur Nuklearforschung
CH-5234 Villigen, Switzerland
and
B. SiggInstitut fur Reaktortechnik, ETHZCH-5303 Wurenlingen, Switzerland
1. INTRODUCTION
The current state of the SIN neutron source project is describedelsewhere in these proceedings [1]. In this report we presentsome results, from both experiment and calculation, obtained aspart of our detailed design study.
The overall source optimization is a several-year program and has,as its (usual) goal, the production of the best neutron sourcewith the available resources. The major areas of study are:
(i) The neutronic optimization of the source:reconciliation of conflicting neutronic require-ments of beam guides and thermal tubes, pro-duction of adequately low backgrounds, etc.
(ii) The thermofluid dynamics of the target.
(iii) The practical aspects of producing an operablesource: radiological safety, choice of satis-factory materials, etc.
Calculations using both computer codes and "hand built" physicsare presented; a brief resume of the principal computer codespresently available to our project is given in Table I.
2. THE PRODUCTION TARGET
Tne target material is an eutectic mixture, 55 % Bi, 45 % Pb, ofaensity 10 g/cc. A vertical cylinder of diameter between 10 and
' rr and of length in excess of 1 m is envisaged, with natural-.aiection in the liquid metal to provide the primary heat trans-an mechanism. A major part of our study will be the reconcili-
Sf neutronic and thermofluid-dynamic requirements, to obtainy s lmr set of dimensions. The thermofluid dynamics of the

Table I
The principle computer codes available
CODE COMPUTER BRIEF DESCIPTION AREAS OF APPLICATION
HET [1] VAX-11 Analogue Monte- arlo nucleon-meson - Primary production for fast neutrons in targettransport code. - Energy deposition by the high-energy cascade
- Nuclide production by HE spallation reactions- High energy backgrounds for the source
05RSIN VAX-11 Monte-carlo neutron transport code - Sub-15 eiev neutron effects in the target
An extensively modified version of - Neutronics of the moderator including
05R [ 2 ] thermalisation.
EGS [3] VAX-11 Monte-carlo electromagnetic cascade - Gamma transport throughout the neutron sourcecode.
DO?-3 [4] CYBER 170 Discrete ordinates neutron transport - Shield designSERIES code
RSYST [5] CYBER 170 One-dimensional transport (Sn) and - Moderator optimization studies
SERIES two-dimensional diffusion code.
ORIHET VAX-11 Isotope production and decay. - Accivation studies throughout the neutron
A modified version of ORIGEN [6] source.
References for Table 1
I V.A. COLEMAN & T.W. ARMSTRONG ORNL-4606 (1970)2 R.R. COVEYOU et. al. ORNL-3622 (1965)3 R.L. FORD & V.R. NELSON SLAC-210 (1978)
4 .A. RHOADES & F.R. MYNATT ORNL-TM-4280 (1973)
5 R. RUEHLE IKE-Ber.' 4-12 (+973)6 M.J. BELL ORNL-4628 (1973)
HET & 05R are part of the RSIC computer code collection number CCC-178 and ORIGEN is CCC-217.
wA

444
target are discussed in a separate report in these proceedings(Takeda [2]).
2.1 Neutronic performance
The general neutronic performance, as the target radius is varied,has been calculated using HET. The results are summarized inFig. 1. The calculation was made using a 530 MeV proton beam in a2 cm variance Gaussian truncated to 10 cm diameter. As should beexpected, fast neutron production increases only slowly once thetarget radius exceeds that of the beam; similarly for the com-ponent of the power dissipation from the high energy cascade.
ME NEUTRONS AVERAGEENERGY
HE NEUTRONS/1OMPROTONS
HE NEUTRON POWER kWt1.mA
FAST NEUTRONS /PROTON
TARGET POWER MW15mA
10 20 30 40
Fig. 1Variation, with targetradius, of target power,fast neutron productionand HE neutron productionrate, average power andescape power. Calculationfor a Pb/Bi target usingHET.
TARGET RADIUS [CM]
A major consideration in the design of the source is the back-
ground in thermal beam tubes. The shielding effect of the Pb/Biis shown by the decrease of both the flux and average energy forthe high energy neutron escapes.
100
10 -
1

445
2.2 Power dissipation
This is estimated to be approximately 73 % of the incident protonbeam power from all sources, with the main contribution comingfrom ionization loss. The cooling system will have to remove some-what under 1 MW. A further 17 % of the beam power is used to lib-erate the neutrons from the target nuclei. The remaining 10 % isdeposited in the rest of the source (mainly in the moderator).
2.3 Target activation
The contribution from the residual nuclei of spallation reactionshas been calculated using ORIHET. The build-up of activity as afraction of continuous irradiation time at 1.5 mA, and the decayof activation after a 1 year irradiation are shown in Fig. 2. Thetarget activation should be somewhat less than 1 MCi during nor-mal operation. The power dissipation from these decays is 3 kW,including a 2.6 kW contribution from decay gammas.
.f
- I
I'
Vt
Fig. 2Build-up and decayof activation for aPb/Bi target at 1.5 mAand 530 MeV protons.(i) Buildup of totalactivity (++++);
(ii) Buildup of a-activity (-x- -- );(iii) Decay of totalactivity (+-.--);
(iv) Decay of a-activity (-o- - .Decay curves are fortime periods following1 year irradiation.
106
10
10'
t
103
102 I . .A I p
10 102 10 3 10 4 10 106 i 10TIME [sec I
_o. . -u
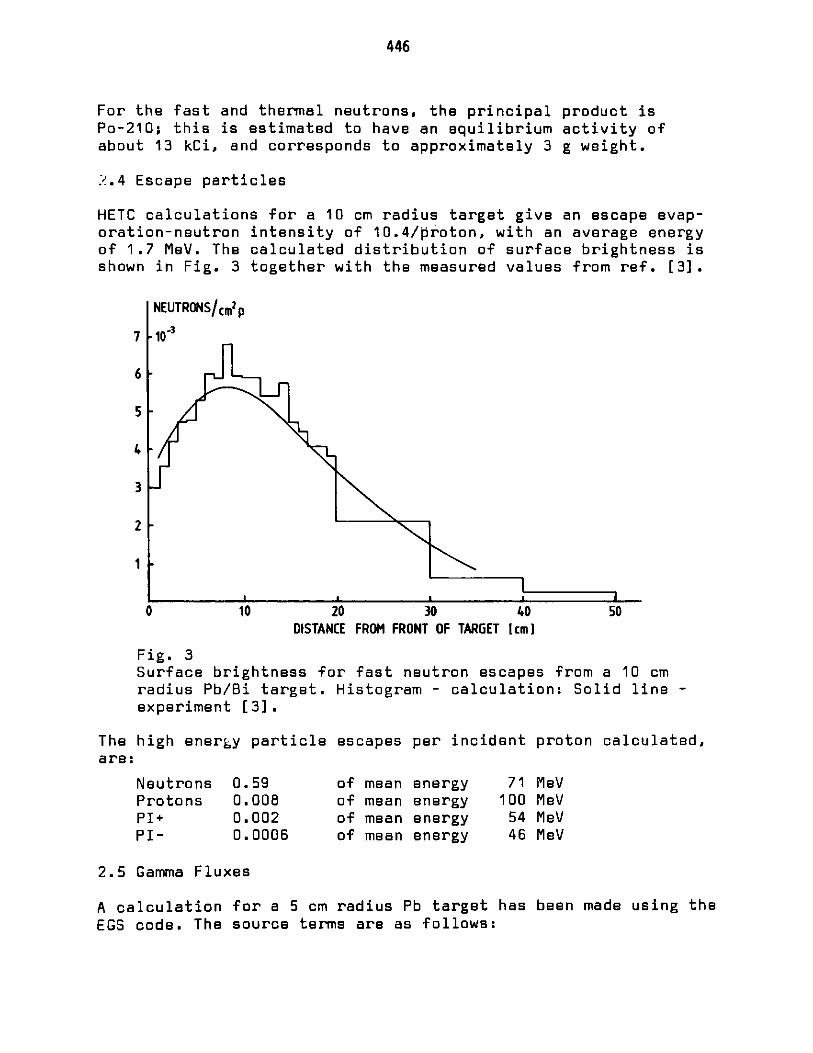
446
For the fast and thermal neutrons, the principal product isPo-210; this is estimated to have an equilibrium activity ofabout 13 kCi, and corresponds to approximately 3 g weight.
?.4 Escape particles
HETC calculations for a 10 cm radius target give an escape evap-oration-neutron intensity of 10.4/proton, with an average energyof 1.7 MeV. The calculated distribution of surface brightness isshown in Fig. 3 together with the measured values from ref. [3].
NEUTRONS/cm2p
7 -10~3
6
5
4
3
2
1
10 20 30 40 50DISTANCE FROM FRONT OF TARGET 1cm)
Fig. 3Surface brightness for fast neutron escapes from a 10 cmradius Pb/Bi target. Histogram - calculation: Solid line -experiment [3].
The high energy particle escapes per incident proton calculated,are:
Neutrons 0.59 of mean energy 71 MeVProtons 0.008 of mean energy 100 MeVPI+ 0.002 of mean energy 54 MeVPI- 0.0006 of mean energy 46 MeV
2.5 Gamma Fluxes
A calculation for a 5 cm radius Pb target has been made using theEGS code. The source terms are as follows:

447
1. Prompt nuclear gammas: 1.2 per incident proton on the basisof the residual excitation being dissipated by emission of asingle gamma. The source energy distribution is shown inFig. 4. The source strength at 1.5 mA proton current is1.2.1016 photons/sec and 8 kW.
1016
15
V1 0
1-0a
-1OzLwp.
SOURCE
SPECTRUM
ESCAPE SPECTRUM
Fig. 4Integrated source andsurface-escape spectrafor prompt nucleargammas
IV 2 4 6 8 10ENERGYf[MeV 1
2. 7rr decay: 0.024 are produced in the target per incident pro-ton with an energy spectrum approximated by:
P(Eo)OdEno = 0.0025 EgoEXP[-(0.05 Ego)]dEgo
Isotropic decay in the CMS system at the production point isused to generate the source gammas. The gamma spectrum isshown in Fig. 5. The source strength at 1.5 mA is 4.5.1014photons/sec and 6.3 kW.
3. Decay gamma's: The Darmstadt gamma ray atlas [4]has beenbuilt into the ORIHET code. The spectrum after a 1 year ir-radiation at 1.5 mA is use and is shown in Fig. 6. Thesource strength is 2.9.1010 photons/sec and 3.2 kW. Thesource is assumed uniformly distributed in a 1 m long target.
The source strength distributed throughout the target is 4.1016photons/sec and 17.5 kW. The calculated escape spectra after-transport through the target are shown in Figs. 4, 5 and 6, with

448
SOURCE SPECTRUM
Z1
10
~10"10
a
z
10101
10
1016
a,
v 105z0
V-
z
z 10
101,1.0 2.0
ENERGY IMeV 13.0
ESCAPE SPECTRUM
100 200 300ENERGY [MeV)
SOURCE SPECTRUM
ESCAPE SPECTRUMiL, I I I I I I I i i I I i 1
I
Fig. 5Integrated source andsur-'ace-escape spectrafor gammas from nodecay
Fig. 6Integrated source andsurface-escape spectrafor decay gammas
i

449
their source spectra. The overall escapes correspond to8.5.1015/sec and 3.9 kW, which is approximately 20 % of thesource strength.
There are also 9.4-101 3 /sec of electrons and positrons with meanenergy 23 MeV (0.34 kW) escaping the target.
The distributions of escape-gamma intensity and power along thetarget are shown in Fig. 7. The localized no and nuclear gammaray production leads to the asymmetric distribution.
1.5-
KW PHOTONS/set
3 1102.
--- PHOTONS/sec__ 0.5-
I I I I I I I I I
0 10 20 30 40 50 60 70 80 90DISTANCE FROM FRONT OF TARGET 1 cm ]
Fig. 7Calculated distribution of surface-escape gammaflux and power for a 5 cm radius Pb/Bi target
3. THE MODERATOR
The outline design incorporates a 1 to 1.5 m radius 020 tank ofheight 2 to 2.5 m. A cold source viewed by beam guides is to beincorporated. Tangential thermal neutron tubes and thermal neu-tron guides are also planned. The design study has as main aims,to find an optimum moderator volume and the best positions for:
(a) the thermal beam tubes, subject to obtaining an adequatelylow backgrounds

450
(b) the cold source, taking into consideration a realistic ther-mal load on the refrigerator system.
3.1 Thermal Fluxes
Measurements of thermal neutron fluxes in a realistic model ofour neutron source have been carried out as part of the SIN/KFA-Julich collaboration. Some of these measurements have already
been reported [5].
The following configurations are of particular interest, bothfrom the point of view of thermal neutron flux maximization andalso for consideration of the target/moderator interface design.A general layout of the measured system is shown in Fig. 8; fur-ther details of the experiment may be found in reference [5].
.dwqf
jAl-Tube I Al-Tube 1500 D20-Level2000
Pb-Bi Target1500
7
Fig. 8General arrangementfor thermal neutronflux measurements
p+
The results from four configurations are considered:
Pb/Bi targetPb/Bi targetPb/Bi targetDep.U target
+ D20 moderator+ 3 cm air gap (void) + D20 moderator+ 5 cm Be + 020 moderator+ 5 cm Be + D20 moderator
For the purpose of discussion, A) is taken as a reference system.The thermal flux as a function of radius for two axial distancesalong the target is shown in Fig. 9.for systems A), B) and C): Forfurther comparison, the flux-maps for cases A) and C) are shown inFig. 10.
-
A)B)
C)
D)
-4000F"

451
1.0
0. ---
0.5- ~
Z =45cm\
0.2
Pb/Bi
020orBe
02 0
1 * i ,~~ R
Al 10 20 30 40 50 60 70 [ cm]
Fig. 9Measured variation ofthermal neutron fluxin a D20 moderator asa function of radialdistance from thetarget axis. Z ismeasured from thefront surface of thetarget.C ) case A)(------ case B)(------9case C)
The 3 cm void of case B) leads to a peak thermal flux depressionof 15 %, with an outward shift of approximately 5 cm. At largerradii, the flux penalty is of the order of 8 %. The effect of thevoid is to create an additional leakage path fcr neutrons.
Case C) has produced the most surprising result; although thepeak thermal neutron flux is reduced by approximately 2 %, atlarge radii the fluxes are identical. There seems to be no over-all neutron gain with a Be sleeve. In the axial direction theflux decrease with the Be sleeve is somewhat faster, as may beseen in Fig. 10. The gain factor, as estimated from the measuredspectra of Cierjacks et al. [6] and published Be(n,2n) cross-section values [7], was approximately 14 %. The measurementsindicate the increased absorption by the Be should reduce this
1014n
cot
sic
%
\
v.

452
50 [
40 [
30
20
10 FTARGET
-20 -10 0 10 20 30 40 50 Z Icml 60
Fig. 10Measured thermal-neutron flux map in a D20 moderator. Thecurves are marked with intensity as a fraction of peakflux.( ) case A)(------) case B)
gain factor to about 9 %. This is a significant over-estimate; ofthe several possibilities, we believe.the most probable cause tobe, that the neutron spectrum used in the calculation is too hard.Further examination of this question is in progress.
These experimental measurements give us valuable results for codeverification. Both diffusion theory and Monte-Carlo [8] givereasonable agreement with experiment. The discrepancy noted inreference [8]may arise from an overestimate for the absorption inthe target; this is currently under investigation.
Further indications from these results are:
(i) Any void (for example a vacuum jacket) around thetarget should be kept to the smallest practicablewidth.
(ii) Beryllium could be a candidate for a target con-tainer material.
R [cm)
0.36
0.44
0.53
,D ? 0.62
~0.710.8\
Weft 0..
1114 .01011Ii /\

453
Case D) has been included to give an evaluation of depleteduranium as a target material. The thermal neutron flux at thepeak was increased by 70 %, which should be compared to thesource strength gain of 2.8 compared to Pb/Bi as measured byBauer et al. [5]. The flux depression of 40 % is caused by theabsorption of neutrons in the uranium. The peak flux position isshifted outwards by approximately 4 cm, a definite advantage forinstallation of beam tubes.
The model target, being solid, was highly unrealistic, lackingfor instance any cooling medium and cladding. The considerableuranium density decrease in a technologically feasible targetwill lead to a further reduction of flux, which has been esti-mated to be at least 20 %.
The flux increase using depleted uranium would not seem to justi-fy overcoming the prodigious technological problems its use wouldrequire.
3.2 Moderator Optimisation. I - D20 Shield Interface
The moderator flux in the D20 is affected by (among other things)the choice of material outside the tank. In contrast to the sim-plest system where the shielding iron starts immediately afterthe D20 tank, a layer of material of one of the following twoclasses could be included:
(i) Combining good reflection and shieldingproperties, e.g. Pb, Bi.
(ii) Thin layer reflectors, e.g. H20, Be.
In both cases a reduction of both the radius of the 020 tank andthe outer shield are possible. An analytic method is used.
Case 1: A Pb reflector
To calculate the optimum thickness for the layer, the overallshielding effect of Pb plus iron is maximized subject to a con-stant thermal neutron flux in the moderator. Referring to Fig. 11,the thermal flux will be unchanged if ? (=[RD 20 + R], RD20 theD20 tank radius) is kept constant. The extrapolation length J.
Pb Fe Fig. 1120 dpb dFe IExplanation of the symbols
for calculation, of optimumth W ) . Pb reflector thickness.
RD 20 RR R

454
is a function of the thickness of the Pb layer, dpb, and will belonger for Pb than Fe. The marginally inferior shielding abil-ity of Pb will be offset by it, in part, replacing some of theouter layer of D20.
The dose from the high energy neutrons at some radius RD withinthe Fe shield may be considered in terms of a shielding functionf, given by:
f = EXP -[EPbdPb + EFedFe]
where EPb (= 0.058/cm) and EFe (= 0.062/cm) are the macroscopicshielding cross-sections. Using the dimensional relationshipsshown in Fig. 11 the function f may be rewritten as:
f = EXP -[EFe(Ro-R)] EXP -[EPbdPb~EFe(dPb-)]
- EXP -[EFe(Ro-R)].f*
As (R0-R) is a constant, the minimum high energy flux may befound from the condition,
df*d(dpb)
The relationship between 2 and dpb may be represented by theAlbedo formula for thermal neutrons in the diffusion approxi-mation:
0020k = DPbXPb TANH [Xpb(dpb+kpb)] (1)
where 0020 (= 0.818 cm) andDPb (= 0.907 cm) are the diffusioncoefficients, Xpb =Eabs/DPb Eabs (= 0.00483 cm) is the
macroscopic absorption cross-section for Pb and ZPb (a 3.58 cm)is the diffusion theory extrapolation length for a Pb/Fe inter-face.
AlFe Fig. 12
D20 H2O Explanation of thedR symbols for
*th calculation, ofoptimum H20 reflectorlayer thickness.
RFe
R

455
The optimum Pb layer thickness is 23.45 cm and the correspondingextrapolation length 11.88 cm. The diffusion theory extrapolationlength for a D20/Fe interface is 3.22 cm, hence for R constantand constant flux in the moderator, 8.66 cm of the Pb layer re-places D20. The other 14.79 cm of Pb replaces Fe, but as the Pblayer is equivalent to (EPb/EFe)* 23.45 = 21.88 cm of Fe, thenthe effective thickness of the shield is increased by 7.09 cm ofFe, which may be removed. (We note that the distance factor inthe shielding allows us to take only a large fraction of these7.09 cm.)
Case 2: A H2 0 layer
In this case there is no strong shielding effect to consider, andthe problem is to find the H2 0 width, dR, which minimised theiron shield radius RFe (see Fig. 12) that is:
d(L-dR) = 0d(dR)
The extrapolation length I is related by equation (1) on theprevious page, with the appropriate changes due to the differentmaterials and leads to optimum dR and 2 given by:
1 0020DR H2 0 ACOSH H2 0 -
R XH2O DH2O R
SDD20 020 -1)
XH 2O 0H2 0 \H20
Taking 9R for the H2 0/Fe interface = 0.6 cm, DH2 0 = 0.1532 cmand Eabs for H20 as 0.0188 cm,then dR = 3.62 cm and 2 = 13.72.
The D20 tank radius may be reduced by 10.5 cm and the outer shieldradius is reduced by 6.88 cm.
The reduction of shielding and 020 material quantities in the caseof H2 0 and Pb reflectors are comparable. For the D20, a 10 cm re-duction of tank radius is significant, whilst the shielding thick-ness change in the case of Pb is small compared to the error in-volved in estimating the required thickness. It is likely that theinnermost layers of shielding will require cooling; a light watercooling channel of about 3.6 cm width would be a neutronic opti-mum.

456
3.3 Moderator optimization. II - Physical dimensions
The size of the D20 moderator affects the thermal neutron flux.Two different criteria apply:
(i) for beam tubes the maximum neutron current atthe monochromator;
(ii) for guides and the cold source, the maximum fluxof the moderator.
In this section, the optimisation for beam tubes is considered.The neutron current, I, at a monochromator is determined by theflux at the beam tube tip, $, and the length from tip to mono-chromator L. The length L is determined principally by the radiusof D20 tank and the thickness of the bulk shield; reduction of Lcan only come from reduction of the D20 tank radius for a properlyshielded source.
Taking as a reference system, a 145 cm long by 15 cm diametertarget in a 130 cm radius by 260 cm high D20 tank (see Fig. 13),the thermal neutron flux distributions in the moderator, withthree thicknesses of the whole peripheral layer of D20 replacedby Pb, have been calculated using the DIFF-2D code of RSYST.Calculated axial and radial flux distributions are shown in Figs.14 and 15.
-t260 cm
Pb 020 Pb Fig. 13- Arrangement of target/
Zr 1moderator/reflector assembly15t -f13 for calculation of optimum
.D20 tank radius in section30- 3.3.70cm
Void
0
130cm7.5cm
The figure of merit n for examining the performance is:
- = . (LRef 2
'Ref *Ref \L/

457
th'
100 15050
Fig. 14Variation of neutronflux at radial dis-tances of 16.25 cm
and 36.25 cm(------3, from thetarget axis in thetarget axial direc-tion. Calculation bydiffusion theory for0, 30, 50 and 70 cmof D20 replaced byPb.
200 z [cIml
Fig. 15Radial distributionof neutron flux inplane of the fluxmaximum from diffusiontheory calculation.Curves are for 0, 30,50 and 70 cm of D20replaced by Pb.
101-2 -1
-Cm s
PblBi Zr0
Pb 70
10 20 30 40 50 60 70 r[cml
In Table II are shown values of n and * for the reference systemand three other 'effective' D20 tank radii, at three differentradii, r, in the D20. Taking r = 31.25 as a representative case,an effective D20 tank radius of approximately 100 cm seems opti-mal. Using the extrapolation length for the H20 layer of theprevious section, this corresponds to a physical radius of appro-ximately 90 cm.
1014cm" s'
.00)
d~b[cm)
30
70
1.01
nth
1.0
0.51
0.51

458
Table II
Fluxes and figure of merit n for various 020 tank effective radii
r = 16.25 cm r = 31.25 cm r = 42.5 cmR(cm) L(cm) 0 114
cm- n 0 n 0 n
sec-1I
131.6 600.0 1.027 1.0 0.826 1.0 0.606 1.0
112.0 580.4 1.002 1.043 0.798 1.032 0.575 1.014
92.3 560.6 0.959 1.070 0.748 1.036 0.520 0.984
72.3 540.7 0.881 1.057 0.655 0.977 0.419 0.851
3.4 Energy Deposition
The energy deposition by the fast neutrons during thermalisationhas been calculated, but at present only an upper bound estimatefor the other contributions is available. The following contri-butions to the total energy have been calculated for a 1 mA current:
1. High energy neutrons 42.0 kW (UL)2. High energy protons 0.8 kW (UL)3. Charged pions 0.14 kW (UL)4. During thermalisation 18.2 kW (C )5. Gammas (from target) 2.6 kW (UL)6. Electrons (from target) 0.23 kW (UL)7. Gammas (from D[ny]T) 2.7 kW (C )
where the qualifiers UL stand for Upper Limit and C for Calcu-lated.
This gives an upper limit of approximately 67 kW/mA.
The distribution of energy deposition by the neutrons duringthermalisation indicates that 50 % of their power contribution is
deposited in approximately the first 6 cm of the D20 and 90 % inthe first 22 cm. The peak energy density for this contribution is1.0 W/cc at I mA.
3.5 Moderator Activation
The tritium build-up has been estimated from the thermal fluxdistribution in the D20, using a macroscopic capture cross-section
of 0.000034/cm. Averaging over the flux, the capture rate is esti-
mated at 2.7'10 15/sec/mA. This corresponds to an equilibrium

459
activation of approximately 70 kCi. For a total D20 volume of4850 litres, this is an equilibrium specific activity, withmixing, of 14.4 Ci/ t.
The values during the build-up are 0.8 Ci/ t at 1 year, 1.5 Ci/tat 2 years and 2.3 Ci/ at 3 years.
REFERENCES
[1] W.E. Fischer, Status Report on the SIN Neutron Source,These proceedings
[2] Y. Takeda, Thermofluid Dynamics of the Liquid Lead-BismuthTarget for the Spallation Neutron Source at SIN,These proceedings
[3] W. Litzow et al., Paper 4, SNQ-Report, part III, A2 (1981)[4] U. Reus, W. Westmeier, I. Warneche, GSI-Report 79-2 (1979)[5] G. Bauer et al., Contribution ICANS V (Jlich) p. 445 (1981)[6] S. Cierjacks et al., Contribution ICANS IV (Tsukuba (1980)[7] MHoro rpyririoBle McTOMU paC'eTa 3W4HTI1 OT HeHTPOHOB
B.P. BeprenbcOH, A.11. CyBopoB, B.3.TopnHH (1970)[8] F. Atchison et al., SIN Newsletter 14, p.NL5 (1982)

460
461
ICAN S-VIINTERNATIONAL COLLABORATION ON ADVANCED NEUTRON SOURCES
June 27 - July 2, 1982
STUDIES OF A LEAD REFLECTOR FOR A PULSED NEUTRON SOURCE
by
A. D. Taylor, G. J. Russell, M. M. Meier and H. RobinsonPhysics Division
Los Alamos National LaboratoryLos Alamos, NM 87545
1. INTRODUCTION
Many of the new generation of accelerator based neutron sources have
adopted a target-moderator geometry in which the neutron beam is
tangential to the target (wing geometry). Such an arrangement
significantly reduces the high energy (up to several hundred MeV) neutron
background compared with the radial configuration (slab geometry). This
improvement in background is accompanied by a severe reduction in solid
angle between target and moderator, thus reducing the neutronic
coupling. Some compensation may be achieved by using a fast neutron
reflector [1]. These reflectors fall into two classes: moderating
reflectors such as water, polyethylene, heavy water, graphite and
beryllium; and non-moderating reflectors such as iron, copper, nickel and
lead. Both experiment and Monte Carlo simulation show beryllium to be
the superior moderating reflector. In this paper, we examine the
consequences of adopting a non-moderating reflector and compare its
performance to that of beryllium.
462
Reflector studies on a time modulated source [2] have shown lead to
be an excellent reflector, maintaining the structure of the long time
pulse ( 500 ps) marginally better than beryllium and with a slightly
superior yield. Engineering, fabrication and cost factors as well as
improved gamma and fast neutron shielding properties further favour lead
as a reflector for these sources. Even for truly pulsed sources which
rely primarily on time of flight for energy selection, Monte Carlo
studies have shown that a lead reflector maintains an excellent time
structure in hydrogenous moderators in the slowing down region [3]. In
this paper, we describe the experimental comparison of lead and beryllium
reflectors for the case of a pulsed spallation source. The
target-moderator-reflector configuration used was a mock-up of the
Rutherford Appleton Laboratory's SNS geometry. The experiments were
performed in the low current target area of the Los Alamos National
Laboratory's spallation source, the WNR. This work was complemented by
Monte Carlo calculations using the TIMOC code[4].
2. EXPERIMENTAL MEASUREMENTS AT THE WNR
The capabilities of the low current target area of the WNR for time
structure and spectral measurements on the neutron beams produced by
pulsed spallation target-moderator-reflector assemblies have been
described previously [5]. In this study, the normal WNR reflected 'T'
configuration, figure la, was modified to simulate the geometry of the
SNS assembly [6], figure 1b. Only one moderator was used and it was open
on both faces. The decoupler and void liner (which was removable) were

463
cadmium; and a neutronic approximation to SNS' s heavy water cooling wings
was incorporated. The reflector, which could be either lead or
beryllium, formed a 40 cm cube around the system. Both 238U and Pb
targets were used to study the effect of the harder spectrum from the
small Pb target.
Using the pyrolytic graphite crystal analyser arm, the time structure
of moderated neutron pulses from a lead reflected and a beryllium
reflected moderator were compared. The 100 ns long proton pulses used
make a negligible contribution to these data and the 0.4% resolution of
the spectrometer is small in comparison with the observed widths.
Semi-logarithmic plots of these data (unnormalized) are shown in figures
2a and 2b. In both cases, there was a cadmium decoupler between
moderator and reflector and a cadmium void liner in the neutron beam port
through the reflector. The FWHM of the time pulses were found, within
experimental error, to be identical. Further, it was possible to
superimpose the time pulses from both reflectors over two orders of
magnitude showing that the shape was the same.
The overall efficiency of the two reflectors was compared by
measuring the spectral distribution by time of flight over a 5.58 m
flight path. Each data set was normalized, corrected for detector
efficiency and attenuation factors and converted to an energy
distribution (see [5] for details). The overall spectrum is then
described by a maxwellian region:
Amax (E) = m exp(-E/T)T2

464
and an epithermal region
$ (E) =epi E
joined together by a switch function
(W -1A (E) = [1 + exp I1 - W
thus
$(E) = max (E) + A(E) epi (E)
In these equations, 4m is the integrated maxwellian intensity, T is the
effective neutron temperature, $e is the differential intensity at
1 eV, y is a measure of the leakage of the system and W1 and W2
parameterize the switch from slowing down. to themalization behavior.
Using $m, T, $i,, y, W1 and W2 as parameters, a fit is made to the
data*. A typical fit is shown in figure 3. The results of this analysis
are summarized in Table I for studies with a Pb target and in Table II
for studies with the 238U target. The latter table contains data from
coupled as well as decoupled systems. The yield parameters $m and $,
indicate that although a lead reflector performs well, it is not as
efficient as a beryllium reflector. At this point the question of
reflector dimensions must be raised: although both reflectors were
physically identical in size, their neutronic dimensions were not the
same. A 40 cm beryllium reflector is close to its optimum size [3]; the
Monte Carlo technique was employed to establish the optimum size of a
lead reflector.
*NOTE: The values of y > 1.0 indicate that a high energy background has
not been accounted for. This background is less then 7% at
1.257 eV (the rhodium resonance) and may be large at high
energies. In the thermal region, it is negligible.

465
3. MONTE CARLO OPTIMIZATION
Variation of the reflector cube dimensions experimentally would have
been costly in time and effort, difficult to achieve because of the
experimental set up and hazardous to personnel involved because of the
radiation levels around the target. A very good estimate of the
functional dependence of performance on cube size is readily achieved by
Monte Carlo simulation. Such an optimization has already been described
for the case of a beryllium reflector. We now report results for a lead
and a heavy water reflector. The geometry used to optimize the reflector
dimensions is shown in figure 4. A 10 x 10 x 5 cm3 moderator is
located centrally in a cube of reflector of side 2L and decoupled by a
variable density B 10 layer. An isotropic point source is located below
the moderator. The coupling efficiency, as measured by neutrons leakingdown the beam tube, is determined for a variety of dimensions, 2L. These
data are given in figure 5 for beryllium,. lead and heavy water
reflectors. We observe that a 40 cm beryllium reflector (L = 20 cm) is
within a factor 1.08 of the saturation value whereas the performance of a
40 cm lead reflector may be enhanced by up to a factor 1.3.
We note that the absolute performance of beryllium in this simple
geometry (figure 4) is significantly better than that of lead or heavy
water. Calculations on realistic geometries (with a target source rather
than a point source) do not support this result. It would appear to be
an artifact of the extremely tight source to moderator coupling
employed. The saturation of the coupling with increasing moderator size
is, however, quantitatively supported by realistic calculations and by
experiment [5).Using the information of figure 5 to scale the experimental data on a
40 cm cube reflector to a reflector of optimal size gives 11.4 and 3.9
for the thermal and epithermal coupling parameters when lead is the
reflector (Pb target) and 11.5 and 3.8 for a beryllium reflector (Pb
target). With the softer spectrum from a U 238 target the thermal, and
epithermal parameters become 24.1 and 8.46 with a lead reflector and 25.3
and 8.45 with a beryllium reflector.

466
We may conclude that for pulsed neutron moderators a lead reflector
is as efficient as a beryllium reflector. On the question of decoupler,
some differences appear. As expected a coupled beryllium system has an
effective neutron temperature of 25 meV, indicating the highly moderated
nature of the spectrum, in comparison with some 34 meV when decoupled.
It is known from .other work that this increase in moderation is
accompanied by a degradation in time structure. In the case of the lead
reflector, some lowering in the neutron temperature did occur for the
coupled case. No time measurement was made on the coupled lead reflector
but it is reasonable to infer that some pulse degradation has occured and
that even a non-moderating reflector such as lead may need to be
decoupled for use in a truly pulsed source.Two secondary aspects of the reflector's performance should be
discussed, namely the fast neutron shielding effect and the distribution
of energy within the moderator-reflector system.
4. FAST NEUTRON SHIELDING
For a tightly coupled target-moderator system in wing geometry, the
collimation is usually set such that no neutron may leak out of the
target directly into the experimental area. Table III summarizes the
high energy attenuation lengths for some common shielding materials. For
very high energy neutrons some rays exist with only a few mean free paths
of attenuation [7], see figure 5. Such a problem may be eased (at the
expense of flux) by increasing the target-moderator distance, by
minimizing the collimator void or by adding additional shielding external
to the bulk shield or internal to the target crypt. The reflector is the
first material that such neutrons encounter and it is highly desirable to
maximize their attenuation within the bulk shield. We see from Table III
that lead is far superior in this aspect to beryllium.
467
5. NEUTRONIC HEATING
A disturbing feature of non-moderating reflectors is the
redistribution of neutronic heating in the target-moderator-reflector
assembly. As neutrons moderate in the reflector, they deposit energy
which might otherwise be added to the moderator's heat load. In a
non-moderating reflector neutrons entering the moderator after several
collisions in the reflector still carry a large fraction of their initial
energy. Figure 6 shows the Monte Carlo results for the fraction of the
total energy available in the test geometry that was deposited in the
moderator and reeflector as a function of the size of reflector, for all
three reflector materials. Both heavy water and beryllium reflectors
absorb substantial fractions of this energy (~80%) whereas even the
largest size of lead reflector takes up less than 40%. The result is a
factor 2 increase in heat deposited in the moderator. This calculation
is idealized and the presence of a target is expected to reduce the
effect. Although such a factor may not be significant for ambient or
90 K moderators, a substantial financial penalty would be incurred in the
case of a liquid hydrogen moderator operating at 20 K. In such a case, a
composite reflector' with a beryllium blanket (or other moderating
reflector) surrounding the cryogenic moderator would be desirable.
6. CONCLUSION
This study illustrates the complementarity of experiment and Monte
Carlo simulation. Neither technique on its own would have been able to
answer the questions raised; for example, thermal pulse shapes from a
reflected configuration are extremely difficult to compute and heat loads
in the reflector and moderators impossible to measure at currents which
are low enough to keep induced radiation at a level which would allow the
experiment to be performed. There are many practical advantages to using
a lead reflector. We find no degradation in the quality or intensity of
moderated neutron pulses. The shielding advantage may be somewhat offset
by the higher moderator heat loads, especially if cryogenic moderators
are used.

468
References
[1] J. M. Carpenter, "Pulsed Spallation Neutron Sources for Slow Neutron
Scattering," Nucl. Instr. and Meth. 145 (1977) 91-113.
[2] G. S. Bauer, H. M. Conrad, H. Spitzer, K. Friedrich and G. Milleret,
"Measurement of Time Structure and Thermal Neutron Spectra for
Various Target-Moderator-Reflector Configurations of an
Intensity-Moderated Spallation Source," Proceedings of the 5th
Meeting of the International Collaboration on Advanced Neutron
Sources, Ji'l-Conf-45, ISSN 0344-5789 Jiillich (1981) 475-488.
[3] A. D. Taylor, "Monte Carlo Reflector Studies for a Pulsed Neutron
Source," Proceedings of the 5th Meeting of the International
Collaboration on Advanced Neutron Sources, JUl-Conf-45, ISSN
-344-5789 Julich (1981) 377-388.
[4] H. Kschwendt and H. Reif, "TIMOC--A General Purpose Monte Carlo Code
for Stationary and Time Dependent Neutron Transport," Euration
Report EUR 4915e (1970).
[5] G. J. Russell, M. M. Meier, H. Robinson and A. D. Taylor,
"Preliminary Neutronics of a Reflected 'T' - Shape
Premoderator/Moderator. for the Weapons Neutron Research Facility,"
Proceedings of the 5th Meeting of the International Collaboration of
Advanced Neutron Sources, JUl-Conf-45, ISSN 0344-5789 Julich (1981)
389-416.
[6] A. D. Taylor, "Neutron Transport from Targets to Moderators,"
Rutherford and Appleton Laboratory Report, RL-81-057.

469
[7] J. M. Carpenter, private communication.
[8] M. Barbier, "Shielding and Activation Study for the Intense Pulsed
Neutron Source of Argonne National Laboratory". Mitre Technical
Report MTR-6998 (1975).
[9] G. J. Russell, these proceedings.

470
Table I
Pb TARGET
Reflector
Be
Pb
U TARGET
Reflector
Be
Pb
Be
Pb
Material
MFP(cm)
Decoupler
Cd -
Cd
Decoupler
Cd
Cd
High
Be
50.0
Energy
H20
90.3
3.54
3.01
m
10.7
8.8
T
33.6
33.8
Y
1.05
0.99
Table II
7.82
6.51
8.08
6.88
m
23.4
18.5
35.4
24.7
T
34.0
33.9
25.0
28.6
Y
1.05
1.00
1.07
1.02
Table III
Neutron Nuclear Mean Free Paths (MFP) [8].
Concrete Fe Cu W Pb
46.1 17.3 15.8 10.1 17.8
Wi
90
97
W2
8.5
9.3
W1
91
93
132
118
W2
8.5
8.9
14.6
12.4
U
11.1

471
REFLECTOR
=- . rTAEGET^
DECOUPLER PREMOD RATOR
D LINER
MODERATOR -.
Fig. la
Section through the standardreflected 'T' shape moderator/premoderator configurationused at the WNR.
REFLECTOR
DECOUPLER
-- VOID LINER
MODERATOR
Fig. lb
Section through the modified con-figuration simulating a singlemoderator SNS wing geometry.
Pb Reflector Be Reflector
Time
Fig. 2a
Semi-logarithmic plot the moderatedpulse shapes of a lead reflected sys-tem. The moderator was cadmium de-coupled polyethylene, poisoned at adepth of 1.27 cm by 0.025 am of gado-linium. The peak at 5500 us is the004 reflection from pyrolitic graph-ite. The spurious peak at 2400 is isthe 002 reflection, viewed in frameoverlap.
Time
Fig. 2b
The corresponding data to figure 2awith beryllium as reflector. Thesedata were taken at 60 Hz, thus elimi-nating the frame overlap problem.
s,
r
w
c
"
e
foe sin sin Sim
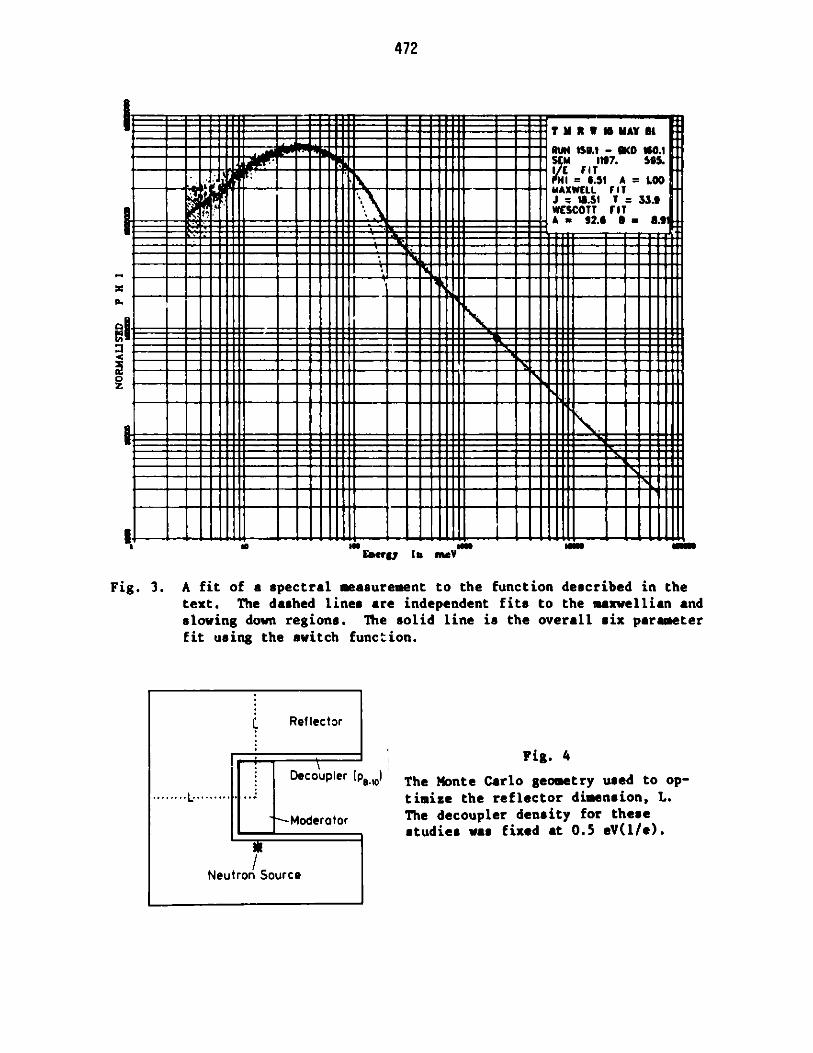
472
_ jE ~f}1E'ii
h6-1
T M S I S MAY 81RUN 159.1 - KD 160.1SCM 1197. 565.HI=45 A = 3.00
MAXWELL FI TJI 18.51 T = 33.9WESCOTTY .TA " 92.6 S - 6.921
K\.NII~~~~~~ VaIh 1 WIBVA~f
* 44::::
Energy I oMeV
Fig. 3. A fit of a spectral measurement to the function described in thetext. The dashed lines are independent fits to the maxwellian andslowing down regions. The solid line is the overall six parameterfit using the switch function.
Ref lector
Decoupler (pe-o10
Moderator
Neutron Source
Fig. 4
The Monte Carlo geometry used to op-
timize the reflector dimension, L.The decoupler density for thesestudies was fixed at 0.5 eV(1/e).
I1
I
t.
0
i i i i ---- -- ice
f I
N-- L
I -T --I
ptIn
71
14 on
fi
Is
1

473
REFLECTOR DIMENSION
r i i
1.0"
* Pb
. ," O
- -II
t
0
to 40 60
L cm
0 Z 3 4 s 4 t
Fig. 6
The ray diagram for fast neutron col-limation for a typical beam. Thenumbers opposite each ray correspondto the number of mean free paths seenby a 100 MeV neutron. Calculations[81 indicate that some 14 mean freepaths are required to shield a 5 bA,800 !eV source.
0.S
0..
0.4
0.3
0.0
ENERGY DEPOSITION
I I I I I
...D.0(.) ------ -- - SOmN )
. ...... ) -
--.se.(mr> -
..... ......... .0.0C.)
--- .- 7.3
- --- - ----- --.. lt .--.- .----M-G- - - -- - -
75F-5%*Mf
Fig. 7
The fraction of initial neutronenergy deposited in the reflectorand moderator of Figure 4 forberyllium, lead and heavy waterreflectors.
0 3o 4fL em
Fig. 5
The two steradian average of thesurface flux from the moderator as afunction of reflector dimension forberyllium, lead and heavy water re-flectors. The numbers shown are thescaling factors required to convert a40 cm cube of reflector to theasymptotic performance.
0
4
-s.2
J
U
I

474
475
ICANS-VI
INTERNATIONAL COLLABORATION OF ADVANJCED NEUTRON SOURCES
June 28 - July 2, 1982
MODERATED NEUTRON PULSE SHAPES
A. D. TaylorPhysics Division
Los Alamos National LaboratoryLos Alamos, NM 87545
I. INTRODUCTION
The time dependence of the neutron pulse from hydrogeneous moderators
is well known in the slowing down region. The full width at half
maximum, et50, behaves as 2/Tr when time is measured in s and energy
in eV. The shape of the pulse throughout the slowing down region is a
universal function of vt, $ (v,t) = (E svt)2 exp (- Esvt). In this
equation, v is the neutron velocity, Es the macroscopic cross section
of the moderating material and t is time. This infinite medium result is
found to hold well even for small hydrogeneous moderators [1] and
departures from this behaviour for reflected moderations are understood.
Measurements of the time dependence have been made in the thermal region
but no specific parameterization has been given. An empirical
description is used in powder profile refinement [2] but this has no
physical basis. The time behaviour depends strongly on the material and
size of the moderator, the reflector and decoupler. Figure 1 shows the
wavelength dependence of at50 in the thermal range for a series of
possible moderator configurations, measured at the WNR [3). Monte Carlo
calculations have given some information on pulse shape [4), but are
dependent on details of the scattering kernels used and are difficult to

476
perform for other than simple moderators. As condensed matter
experiments on pulsed neutron sources become more sophisticated,
information will be needed on the shape of the thermal pulse in addition
to at50 . In this paper, we attempt to find some guidelines to the time
behaviour of moderated neutron spectra in the thermal region.
2.' TIME DEPENDENT DIFFUSION THEORY [5]
The long time dependence of the moderated neutron pulse shape is, in
time dependent diffusion theory, given by
$(t) = exp - t/T
where
T- = ao + DB2 - CB4 + . . .
In these equations, a0 is the absorption probability, 0 the diffusion
coefficient, C the diffusion cooling constant and B2 the geometric
buckling. For a rectangular moderator of dimension, L1 X L2 X L3
3
B2 = ,2 L-2
We must correct the physical dimension of the moderator by the
extrapolation length, d = 0.71Xtr, where atr is the transport mean
free path. Thus
3
B2 2 ( 11 + 2d)-2
Table I gives the paruieters cg, D, C and atr for four common
moderating materials. With these parameters, we can anticipate the long
time decay of neutron pulses from large moderators. Although not

477
strictly applicable, we will proceed to use this theory as a guide to the
behaviour of quite small moderator (B2 ~ 1 cm-2).
3. EXPERIMENTAL PROCEDURE
In this paper, we re-analyze two sets of data: time dependent
measurements from a pyrolitic graphite crystal anayzer on a mock up
spallation source at the CERN PS booster [6] and uwipublished data takenwith a similar analyzing system at the low current target area of the WNR
[3]. An exponential is fitted to the long time decay portion of eachreflection. At long wavelengths, this decay is found to be independent
of reflection, although the intensity associated with the mode increases
as energy decreases. In some cases, for example at small buckling, this
mode totally dominates the peak shape. The fitted T values and a
description of the configuration are given in Table I.
4. COUPLED AND DECOUPLED SYSTEMSAll the data presented in Table II were taken on reflected systems.
Only two of the runs had direct neutronic coupling between the moderator
and the reflector. In Figure 2, we plot the z vs B2 prediction for
beryllium, heavy water, light water and polyethylene using the diffusion
parameters of Table I. The coupled run (CERN N) had a 10 X 20 X 7 cm3
polyethylene moderator coupled with the beryllium reflector. The T value
of 500 u s from this moderator is totally consistent with the mode
expected from beryllium with a volume equal to that of the reflector
used, and not with the decay expected from the polyethylene moderator.
When the same reflector was decoupled (CERN B4C and CERN Cd), the decay
is well described by the moderator mode. An intermediate case is the
partially coupled dataset, WNR 184. In this run two strongly separatedmodes from the moderator were observed, a fast mode corresponding to the
moderator decay and a slow mode of 300 p s (containing twice theintensity) resulting from the reflector decay. The system was decoupled,
but no void liner was. used. The WNR reflector, Figure 3, has a complex
shape making the buckling difficult to calculate. However, reversing theanalysis, for the 300 p s mode to result from beryllium would require
B 2 = 0.025 cm-2, corresponding to a cube of side 36 cm. This is ingood agreement with the physical size of the WNR reflector.

478
For the case of polyethylene moderators we now extend the comparison
of diffusion theory to our data to very large values of buckling. InFigure 4 the solid line is the result obtained using the diffusion
parameters of Table I. The open triangles and circle are results for
decoupled, hcmogenecus moderators. The closed symbols are decoupled
heterogeneously poisoned moderators. In these cases, the moderator
dimension is taken to be that on the beam side of the 0.025 mn gadolinium
poison which neutronically isolates the moderator from the premoderator
for energies less than 150 meV. Both these sets of data are seen to be
in excellent agreement with the diffusion result even at values of B2
as large as 3.36 cm-2.
The open square of Figure 3 (WNR 265) is, however, anomalously high.
This configuration had a void liner but no decoupler between the
moderator and the beryllium reflector. The 100 ps decay time is
dramatically lower than the 300 ps expected from the reflector. This
obvious effect of omitting the decoupler must be contrasted with our
study of the effect of decoupler and void liner on the full width at half
maximum of the pulse, Figure 5. These data show only a 3 us degradation
in at50 compared with the 30 us increase in decay time. The slow mode
does not appear to dominate the peak in these coupled and weakly
decoupled systems but does significantly change the shape at levels lower
than the half height. Often considerable intensity is to be found in
these tails. Simple spectral measurements which indicate a gain in
intensity at a particular energy may, therefore, be an erroneous guide to
the most effective moderator.
6. CRYOGENIC MODERATORS
An extension of this approach to cryogenic moderators may be of some
value, particularly since one application of these moderators is the
production of pulses of long wavelength neutrons, where the exponential
decay may be expected to dominate. Cryogenic materials of interest are
liquid and solid methane and liquid hydrogen. The behaviour of methane
should be similar to that of polyethylene with good agreement expected,
with the appropriate diffusion parameters, even for small systems.

479
The equilibrium form of hydrogen at 20'K is para-hydrogen. A
substantial decrease in its cross-section occurs for neutrons unable to
excite the lowest level rotational transition (14 meV). Below 14 meV
para-hydrogen is virtually transparent to neutrons, It is for this
reason that para-hydrogen moderators should not show the gain reported
for reentrant grooved methane and polyethylene moderators [7,8].
The diffusion parameters for various ortho-para mixtures have been
measured at Los Alamos by G. Hansen [9], Figure 6. Unlike previous
measurements [10], these data give consistent values of the absorbtion
probability between the two spin states of hydrogen. Hansen found that
the extrapolation length for 99.8 % para-hydrogen was approximately
12.5 cm, i.e., larger than the physical dimension of a liquid hydrogen
moderator for a pulsed source. The conclusion is that for such tiny
moderators, no fundamental mode will exist.
7. CONCLUSION
Simple diffusion theory may be used to describe some aspects of the
behaviour of small hydrogeneous moderators in the thermal region. The
measurement of diffusion parameters for methane, both liquid and solid,
wou d be valuable. Unfortunately, such a general description does not
seem applicable to parahydrogen.
480
References
[1] A. D. Taylor, "Neutron Transport from Targets to Moderators",Rutherford and Appleton Laboratory Report, RL-81-057 (1981).
[2] R. von Dreele, to be published.
[3] G. J. Russell, M. M. Meier, H Robinson and A. D. Taylor"Preliminary Neutronics of a Reflected 'T'-ShapePremoderator/Moderator for the Weapons Neutron Research Facility",Proceedings of .the 5th Meeting of the International Collaborationof Advanced Neutron Sources, Jul-Conf-45, Julich (1981) 389-416.
[4] D. J. Picton, Ph. D. Thesis, University of Brimingham (1981).
[5] K. H. Beckurts and K. Wirtz, Neutron Physics, Springer-Verlag(1964).
[6] G. S. Bauer, J. P. Delahaye, H. Spiter, A. D. Taylor and K. Werner,"Relative Intensities and Time Structure of Thernal Neutron Leakagefrom Various Moderator-Decoupler Systems for a Spall-ation NeutronSource", Proceedings of the 5th Meeting of the InternationalCollaboration on Advanced Neutron Sources. Jul-Conf-45. Julich(1981) 417-444.
[7] K. Inoue, Y. Kiyanagi, H. Iwasa, N. Watanbe, S, Ikeda, J. M.Carpenter and Y. Ishikawa, "Grooved Cold Moderator Tests", theseproceedings.
[8] G. S. Bauer, "Summary on a Discussion on Moderators with GroovedSurfaces", Proceedings of the 4th Meeting of the InternationalCollaboration on Advanced Neutron Sources, KENS Report II, Tsukuba(1981).
[9] G. Hansen, private communication.
[10] T. A. Bryan and A. W. Waltner, "Diffusion Parameters of LiquidHydrogen", Phys. Lett. 17(1965), pp 129-130.

481
Table I
Diffusion Parameters [5]
Moderator ao D C qtr
(S-1 ) (m 2s- 1 (cm4S1 ) (cm)
CH2 5,900 26,600 2,600 0.35
H20 4,800 36,900 5,100 0.43
D20 19 2.0 105 5.3 105 2.43
Be 285 1.2 105 2.8 105 1.48
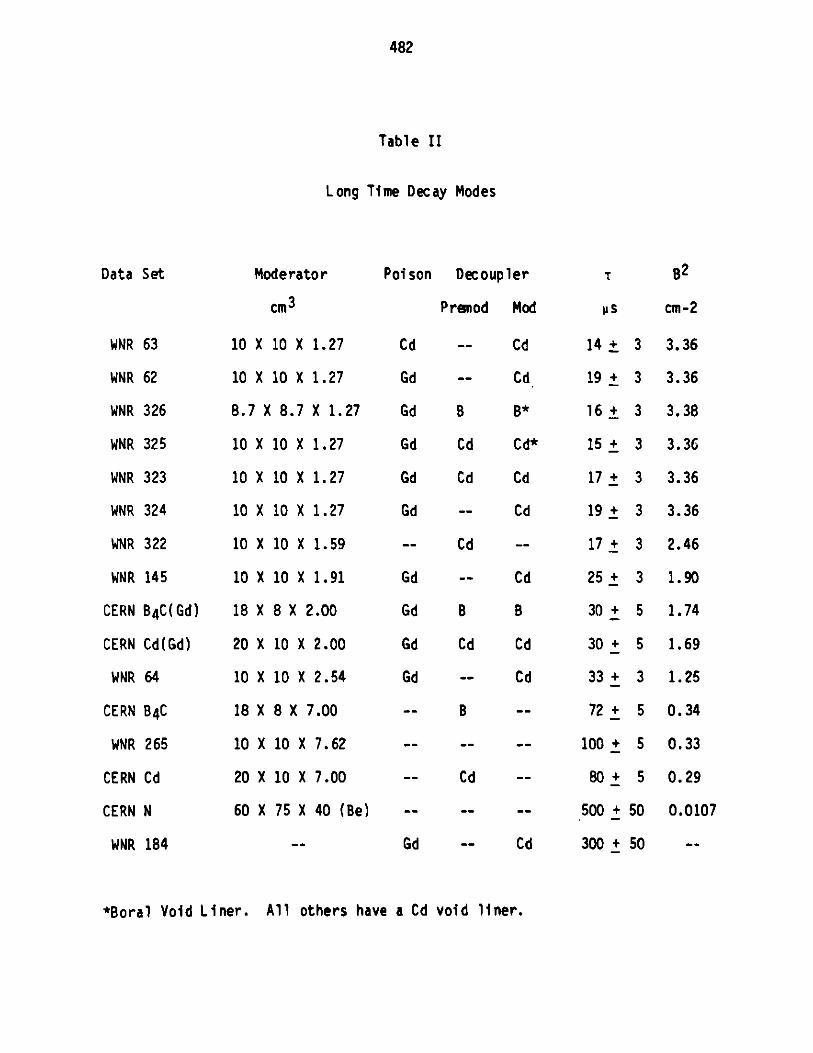
482
Table II
Long Time Decay Modes
Moderator Poison Decoupler
Prenod Mod
10 X 10 X 1.27
10 X 10 X 1.27
8.7 X 8.7 X 1.27
10 X 10 X 1.27
10 X 10 X 1.27
10 X 10 X 1.27
10 X 10 X 1.59
10 X 10 X 1.91
18 X 8 X 2.00
20 X 10 X 2.00
10 X 10 X 2.54
18 X 8 X 7.00
10 X 10 X 7.62
20 X 10 X 7.00
60 X 75 X 40 (Be)
Cd
Gd
Gd
Gd
Gd
Gd
Gd
Gd
Gd
Gd
B
Cd
Cd
Cd
B
Cd
WNR
WNR
WNR
WNR
WNR
WNR
WNR
WNR
CERN
CERN
WNR
CERN
WNR
CE RN
CERN
WNR
63
62
326
325
323
324
322
145
B4C(Gd)
Cd(Gd)
64
B 4C
265
Cd
N
184
Cd 14
Cd 19
B* 16
Cd* 15
Cd 17
Cd 19
-- 17
Cd 25
B 30
Cd 30
Cd 33
-- 72
- - 100
80
-- 500
Cd 300
*Boral Void Liner. All others have a Cd void liner.
Data Set
cm 3
T B2
us cm-2
-- B
-- Cd
Gd
+
+
+
+
+
+
+
+
+
+
+
+
+
+
+
3.36
3.36
3.38
3.36
3.36
3.36
2.46
1.90
1.74
1.69
1.25
0.34
0.33
0.29
0.0107
3
3
3
3
3
3
3
3
5
5
3
5
5
5
50
50
--
--
--

483
FWHM of TIME STRUCTURE
Fig. 1
The energy dependence of thefull width at half maximum(FWHM) of the time structurefrom moderators poisoned at adepth of 1.27 cm, 1.91 cm and2.54 cm by 0.025 ® of gado-linium. The no poison case,where the premoderator isviewed directly, is also shown.
4
LONG TIME DECAY
Fig. 2
The long time decay mode constant asa function of B2 for Be, D20, H20and CH; moderators. The open tri-angle is the mode from CERN N andthe open circle the mode fromWNR 184. The solid triangles referto decoupled CH2 moderators.
II [34L
\ -
o-- K I .,,..
0.001 0.01 0.1
Fig. 3
A cross-section throughthe reflected 'T'-shaped
moderator used at the WkI.
60 -
At,,40 -
20
no poison
0
So- -2.54o
_-1.27
-A
0 2
WAVELENGTH
3
A
IC
REFECTOR
- LN ER
MODERATOR -
I i I 1 i 1 1 E 1 1 1

484
LONG TIME DECAY MODE
a
U '
I.0
Q1
Fig. 4
The long time decay mode constant asa function of B2 for a CH 2 moderator.The open symbols are homogeneous mod-erators and the closed symbols areheterogeneously poisoned moderators.
1o
Fig. 5
The energy dependence of the
FWHM of the time structure ofa 1.27 cm moderator for vari-o'is combinations of decouplerand void liner. The solidline is from a high statisticsrun on the 1.27 cm case.
At5n.
30 -
20
10
00
8
0
+
oa
A ae of a
0
n+
2
WAVELENGTH A
b.c V..,
6 -
Ca 4
CA C
- 4
3 4
LONG TIME DECAY
H20
0.2% 0-N2
74.5% 0-H2
-7
I I I I I I I
0.0 0.02 0.04
B' cm'
0.06
Fig.. 6The reciprocal of the long timedecay mode plotted against 32for several values of the orthofraction in liquid hydrogen [9].
0.08
1 00
So
O-
7000
3000
3000

485
Summary of Discussions on Reflector Studies,
Neutron Flux and Energy Deposition Studies
in the Session, Targets and Moderators:
Designs and Tests
R. G. Fluharty
The discussion session on targer-reflector-moderator design included
three sessions on moderator optimization and one each on target activation
measurements and energy deposition. The Monte Carlo studies of G. Russell
were on reflected systems and involved variations in the many parameters in
an optimization approach. Generally this involves "tweaking" to make 5-20%
gains in the neutron beam yields where the following points merit
highlighting:
A. In his studies he found that the removal of the pre-moderator did not
decrease the neutron yields. This rather clearly shows that the
"reflector" enhancement is due to neutrons coming from the Be rather
than being from reflections. This conclusion is based upon the
available solid angles for reflection and return for the thin moderators
without premoderator and the timing required for neutrons to pass from
the moderator to Be and to return. The assumption here being that the
incoming neutrons are epithermal >> 30 ev to be compatible with the
narrow moderator pulse widths but are not fast neutrons. They are not
fast neutrons because they would rapidly leak out of such small system
before reaching thermal.
B. Studies of the size of Be reflector show that much smaller sizes are
permissable allowing the addition of high Z shielding materials as com-
posite reflectors. These are desirable to shield against fast neutrons
from the source and moderator. In addition the reduced mass of the
moderator without premoderator would reduce the number of fast particles
scattered down the beam tube.
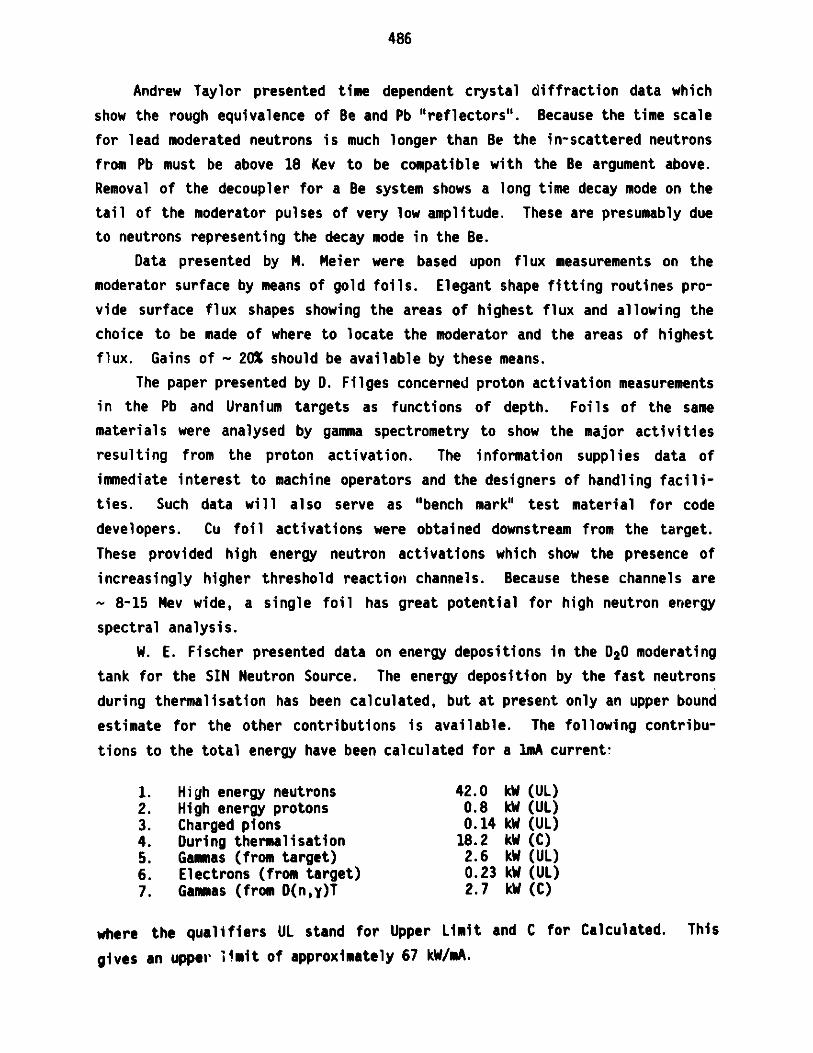
486
Andrew Taylor presented time dependent crystal diffraction data which
show the rough equivalence of Be and Pb "reflectors". Because the time scale
for lead moderated neutrons is much longer than Be the in-scattered neutrons
from Pb must be above 18 Kev to be compatible with the Be argument above.
Removal of the decoupler for a Be system shows a long time decay mode on the
tail of the moderator pulses of very low amplitude. These are presumably due
to neutrons representing the decay mode in the Be.
Data presented by M. Meier were based upon flux measurements on the
moderator surface by means of gold foils. Elegant shape fitting routines pro-
vide surface flux shapes showing the areas of highest flux and allowing the
choice to be made of where to locate the moderator and the areas of highest
flux. Gains of ~ 20% should be available by these means.
The paper presented by D. Filges concerned proton activation measurements
in the Pb and Uranium targets as functions of depth. Foils of the same
materials were analysed by gamma spectrometry to show the major activities
resulting from the proton activation. The information supplies data of
immediate interest to machine operators and the designers of handling facili-
ties. Such data will also serve as "bench mark" test material for code
developers. Cu foil activations were obtained downstream from the target.
These provided high energy neutron activations which show the presence of
increasingly higher threshold reaction channels. Because these channels are
8-15 Mev wide, a single foil has great potential for high neutron energy
spectral analysis.
W. E. Fischer presented data on energy depositions in the D20 moderating
tank for the SIN Neutron Source. The energy deposition by the fast neutrons
during thermalisation has been calculated, but at present only an upper bound
estimate for the other contributions is available. The following contribu-
tions to the total energy have been calculated for a imA current:
1. High energy neutrons 42.0 kW (UL)2. High energy protons 0.8 kW (UL)3. Charged pions 0.14 kW (UL)4. During thermalisation 18.2 kW (C)5. Gammas (from target) 2.6 kW (UL)6. Electrons (from target) 0.23 kW (UL)7. Gammas (from D(n,y)T 2.7 kW (C)
where the qualifiers UL stand for Upper Limit and C for Calculated. This
gives an upper limit of approximately 67 kW/mA.

487
The distribution of energy deposition by the neutrons during thermalisa-
tion indicates that 50% of their power contributions is deposited in approxi-
mately the first 6cm of the D20 and 90% in the first 22cm. The peak energy
density for this contribution is 1.0 W/cc at l.A.

488

489
Summary of the SessionTarget and Moderators: Design and Test
byWalter E. Fischer
Schweizerisches Institut fGr NuklearforschungCH-5234 Villigen, Switzerland
In this session, the presentations were from three rather
clearly distinguishable classes of neutron source:
i) The More or Less Established Sources IPNS, KENS and WNR:
They are running at an average beam power in the region of
10 kW. Their contributions to this session and also their
status reports gave evidence of a trend to make contri-
butions mainly on instrumentation.
ii) The Source(s) under Construction SNS:
It is designed for higher average beam power (above 100 kW).
Very special technical problems have to be solved at this
stage; they are down to the basic level of "nuts and bolts".
iii) The Sources in the Design Stage SIN, SNQ:
They have the ambition to deal with a high average beam
power (beyond 1 MW). These projects are at the level of
Mock-up experiments and technical design.
A particularly interesting result was reported by K. Inoue.
Grooved cold moderators have given a 2.0 to 2.5 times higher
neutron current in the 1 to 10 meV energy region than a corre-
sponding flat moderator. Similar effects for thermal neutrons
have been presented at previous meetings. Time-dependent measure-
ments showed that the higher flux is mainly due to an increase of
pulse width rather than to increased pulse height. These results
have revived the discussions on Grooved moderators.

490
This example shows how the design of high power sources may
still be influenced by basic data provided by the established
sources. Decisions on large D2 -sources for the "modulated" SNQ
and the "continuous" SIN-facilities should possibly be recon-
sidered in view of these results.
Evidence of the impressive progress of SNS has been pre-
sented by A. Carne and his colleagues. The engineering and build-
up of the shielding, as well as the peripheral equipment such
as control system, remote handling, drainage- and ventilating-
systems, and described by B. Poulten, cover at this stage a con-
siderable part of their activity. What could we learn from their
presentations? My own (obviously biased) conclusions are the
following:
1) At a rather late stage in the project, new technical insight
may be obtained, demanding a high flexibility, even during the
realisation phase. The SNS uranium target is an example: The
cooling mechanism turned out to be more efficient than expected.
Hence, thicker target plates may be used which leads to a higher
target efficiency.
2) Components have to be built in spite of incertainties about
some basic physical parameters. This became evident in the pre-
sentation on "Cold Moderator Design" by B. Diplock. Lack of pre-
cise knowledge of e.g. energy deposition by neutrons and gamma
rays can become quite embarrassing: this even more so since the
walls of cold moderators are "neither flat nor massless"
There were several reports from the project groups of fu-
ture high power sources. It seems that at the power level of
several megawatts a stationary target is no longer practical. At
SIN, a liquid metal target, using natural convection as cooling
mechanism, has been chosen. In the paper by Y. Takeda (presented

491
by Ch. Tschalar), results of calculations in thermo-fluid dynam-
ics gave evidence of the feasibility of the concept. Further in-
vestigations are still necessary to establish the reconciliation
of neutronic and thermo-fluid dynamic requirements. With this
target concept, investigations concerning the (stationary) beam
window need special care. Therefore, irradiation tests of window
material at a realistic beam power density are prepared at LAMPF.
The target concept of SNQ for a beam power of 5 MW is a rotating
wheel. Further details about the design was presented by
J. Stelzer. Water cooled Pb-rods encased in AlMg3 lead to a
solution with mechanical stresses well below conventional limits.
An advantage of this concept is the "moving window"; for a 5 MW
beam power probably a necessity. On the neutronic side, flux
distributions for thermal neutrons in a 020 tank have been
measured by the KFA/SIN-collaboration for a Pb-target, with and
without a Be-sleeve. The results indicate that there is practi-
cally no gain in source strength from the (n,2n) reactions in the
beryllium. This is in contradiction to theoretical calculations
using the experimental neutron spectrum from a bare target.
From the contents of this session, we may draw the following
conclusions:
i) The running sources do not suffer too much from the absence
of basic physical data - they run: They could, however, still
provide this kind of data for the projects in the design
stage.
ii) SNS has to go ahead with construction, in spite of uncer-
tainties - an embarrassing situation, which presumably
cannot be escaped by any project in the realisation phase.
iii) The high power sources may still adjust their final design
to new data.
From these conclusions we send a message to the running
sources: Please continue to deliver basic technical and physical
data in order to support the design of the future sources.

492

493
ICANS-VI
INTERNATIONAL COLLABORATION ON ADVANCED NEUTRON SOURCES
June 28 - July 2, 1982
SUMARY OF DISCUSSION SESSION ON BEA.INE SHIELDING CONSIDERATIONSFOR SPALLATION NEUTRON SOURCES
G. J. Russell and M. M. MeierLos Alamos National Laboratory
Los Alamos, New Mexico 87545 USA
T. A. BroomeRutherford and Appleton LaboratoriesChilton, Didcot, OXON OXII OQX, UK
This was the first ICANS meeting where we specifically discussed problems
associated with shielding beamlines at spallation neutron sources. Theseproblems are difficult to tackle both computationally and experimentally.
What makes the problem unique to spallation neutron sources is the possibility
of high-energy (up to several hundred MeV) neutrons and charged particles
contaminating the thermal neutron beams extracted from these sources. Thehigh-energy neutrons and charged particles can themselves cause biological orinstrument background problems or produce neutron and y-ray progeny (by
interacting with collimation systems, instrument components, and beam stops)which must be shielded against.
A typical beamline shield is illustrated in Fig. 1; questions relating to
beamline shielding should be considered as a unit. Items needing attentionare:
Interior to Bulk Shield- energy of the proton beam- target and moderator neutronic coupling- angle (relative to the proton beam) at which neutron beams are
extracted
- moderator field-of-view- collimator design
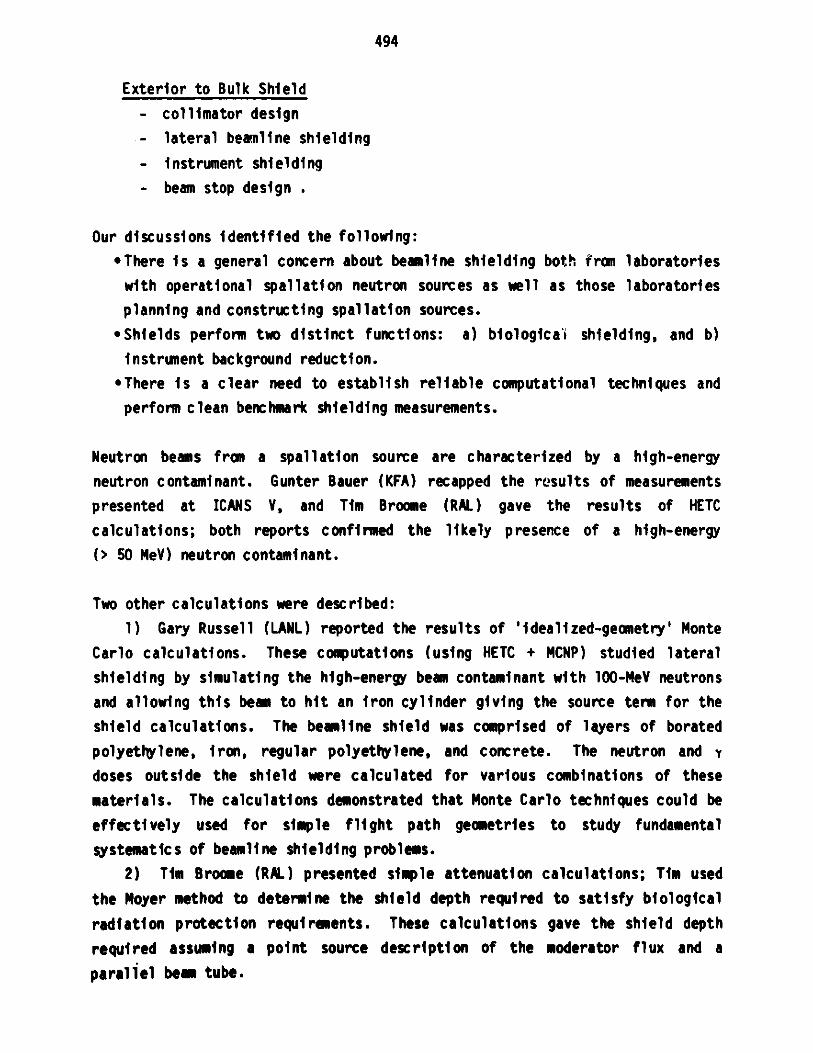
494
Exterior to Bulk Shield
- collimator design
- lateral bea'iline shielding
- instrument shielding
beam stop design .
Our discussions identified the following:
*There is a general concern about beamline shielding both from laboratories
with operational spallation neutron sources as well as those laboratories
planning and constructing spallation sources.
eShields perform two distinct functions: a) biological shielding, and b)
instrument background reduction.
' There is a clear need to establish reliable computational techniques and
perform clean benchmark shielding measurements.
Neutron beams fran a spallation source are characterized by a high-energy
neutron contaminant. Gunter Bauer (KFA) recapped the results of measurements
presented at ICANS V, and Tim Broome (RAL) gave the results of HETC
calculations; both reports confirmed the likely presence of a high-energy
(> 50 MeV) neutron contaminant.
Two other calculations were described:
1) Gary Russell (LANL) reported the results of 'idealized-geometry' Monte
Carlo calculations. These computations (using HETC + MCNP) studied lateral
shielding by simulating the high-energy beam contaminant with 100-MeY neutrons
and allowing this beam to hit an iron cylinder giving the source term for the
shield calculations. The beamline shield was comprised of layers of borated
polyethylene, iron, regular polyethylene, and concrete. The neutron and y
doses outside the shield were calculated for various combinations of these
materials. The calculations demonstrated that Monte Carlo techniques could be
effectively used for simple flight path geometries to study fundamentalsystematics of beamline shielding problems.
2) Tim Broome (RAL) presented simple attenuation calculations; Tim used
the Moyer method to determine the shield depth required to satisfy biologicalradiation protection requirements. These calculations gave the shield depthrequired assuming a point source description of the moderator flux and a
parallel bear tube.

495
Other calculational techniques were discussed and a concensus emerged that the
combination most likely to succeed would be two dimensional discrete ordinates
codes with source terms calculated by Monte Carlo. The hope was expressed
that calculations of simple geometries might be possible in the near future
which could lead to the development of techniques to perform full collimator
design calculations. One major limitation with the present codes is the
inadequency of existing high-energy (> 20 MeV) neutron cross sectionlibraries. At KFA, some theoretical effort will be expended to create an
improved high-energy library. At the WNR, new (p,n) cross-section experiments
will be performed in the near future. The physics models in the high-energy
codes need improving, but the effort available for this is limited. As a
preliminary to establishing a closer contact between ICANS members on the
subject of codes, a simple HETC benchmark calculation will be circulated for
interlaboratory code comparison.
Operating experience (at WNR, IPNS and KENS) with beamline shielding has shown
that systems have evolved which perform satisfactorily at relatively lowproton currents of 2-8 pA and at proton energies of 500-800 MeV. However, the
shielding arrangements at these facilities are essentially ad hoc or empiricalin nature. More' work on beamline shielding needs to be done before beamlines
can be adequately shielded at higher proton currents. Jack Carpenter (AL)
reported on background problems encountered at KENS during experimental
studies of resonance detector systems. These problems stemmed mainly from a
halo around the beam which was only eliminated with a substantial amount of
lead shielding; the results suggested that the backgrounds were probably dueto high- (rather than low-) energy neutrons.
A limited (but important) experimental program at the WNR was described which,
together with the knowledge gained from existing flight path shielding, should
help better understand beamline shielding problems. At the WNR, lateral
beamline shielding questions will be investigated both experimentally and
calculationally. A clear need for good benchmark experiments for code
validation was identified, but the definition and execution of suchexperiments will require a great deal more thought. In particular, the
measurement of the neutron beam spectrum requires a calibrated high-energy
neutron detection system.
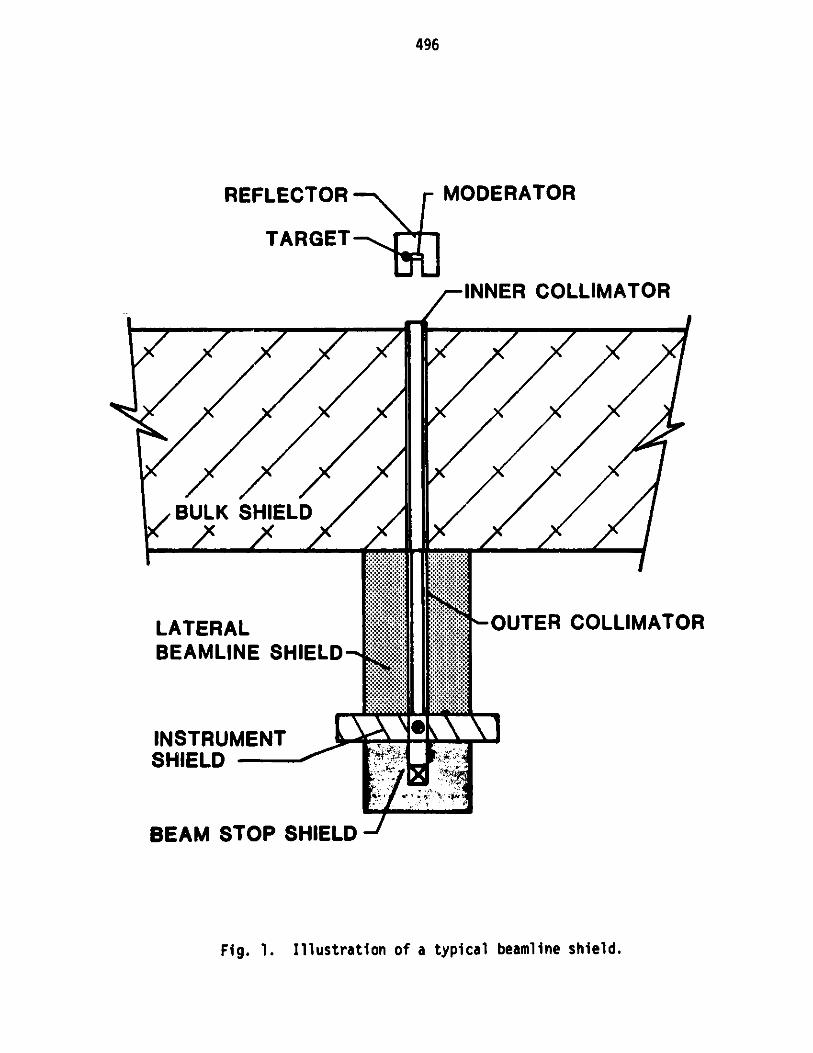
496
REFLECTORrMODERATOR
TARGET
/ INNERt
COLLIMATORI
BULK SHIE LD
LATERALBEAMLINE SHIELD
OUTER COLLIMATOR
INSTRUMENT
SHIELD
BEAM STOP SHIELD
Fig. 1. Illustration of a typical beamline shield.
/
1FI
-
ox.-
li
L
op
titi"
":
":
:":
sk N VI
SOY
"O
:ti"
titi"
::

491
Summary of a Discussion on the Gain in Thermal Neutron Flux
by using Grooved Hydrogenous Moderators
G. S. Bauer
Grooved moderators as investigated experimentally in various laboratories
have a potential to yield a higher thermal neutron leakage from their surface
than moderators with a flat surface. Gains reported are between a factor of
about 1.3 and little more than two. During the discussion which was organized
to try to get a better insight into how and under what conditions these gains
come about, several sets of data were presented, most of which had already
been given earlier. New results were shown at this meeting by the Japanese
group (K. Inoue, et al, these proceedings) and by the Los Alamos group, pre-
sented by G. Russell.
In the Japanese experiments which referred to a cold moderator, the fin
material forming the grooves was simply added to the surface of the flat mod-
erator used for comparison. A gain by a factor 2 or more was found in the
integrated yield but not in the peak flux which was reported to stay virtually
unchanged. The thickness of the fins and their mutual separation was 1.6 cm
which may be somewhat high relative to the mean transport length of about 0.5
cm or even less in a cold CH4-moderator. The experimenters showed that most
of the flux came from the bottom of the grooves between the fins.
Measurements by the Los Alamos group showed that the actual shape of the
fins (rectangular, triangular or trapese-shaped cross section) is not of major
importance. This is in accordance with the findings during the experiments
done for the SNQ-project. It was of interest to see that there was no signi-
ficant difference in gain whether the fins were arranged parallel or perpendi-
cular to the target surface in a tangential geometry (wing-type geometry).
This offset some of the earlier speculations that the improved coupling to the
target brought about by the more extended moderator was the prime reason for
the gain.
During the discussion it was felt that the magnitude of the gain does
depend quite significantly on whether or not a reflected arrangement is used.
This view was supported by the data presented by the SNQ-group at the ICANS-IV
meeting (G. S. Bauer, proceedings of ICANS-IV). It does seem, however, that

498
it is also of importance whether or not a moderating reflector is used (e.g.
Be as compared to Pb). In the data obtained during the SNQ-mockup experiments
for the special arrangement chosen for the DIANE moderator-reflector system
with a large target and a Pb reflector, a significant gain was found for the
integrated flux as well as for the peak flux (fig. 1, after data presented at
ICANS-V, Bauer et al). A summary of the integrated flux (the quantity of
prime interest in an intensity modulated source) obtained at the CERN-Booster
for various arrangements (Bauer et al, ICANS-V) is shown in Fig. 2. Here 1.0
is the reference value of the DIANE moderator-reflector design for all
energies.
It was concluded, that the answer to the qt!cstion, whether or not grooved
moderators are of advantage in any given design, depends very much on the way
in which the source will be used and what its time average power is. The
slight pulse-broadening that may be introduced may offset the intensity gain
in certain cases on a well reflected and decoupled moderator. If, however,
the pulse is long anyway, e.g. because of a long source pulse or because
excessive heating precludes the use of a decoupler, the gain from using a
grooved moderator is certainly worth the effort.
Grooved moderators of hydrogenous materials essentially work like
reentrant beam holes in a moderator of large transport length. In this
sense it should be anticipated that there is also a gain in peak flux,
which so far does not seem to have been confirmed unanimously.
5-240
So MTg R Alect. odertor
;20 / roA EnMNg 200 NeiW Enbry P bft rt" Pb B. gra " Pb . grooved
% o0 P Pb gr 16 0 Pb P grooved15U b gNoI'/ \ Pb groovedg 9% -120/
IS_77 4~0 1'r10 0 60 90 0 30 60 90
Neutron Energy 1 mW) Neutron Energy 1 meV )
Fig. 1 Relative intensities measured for grooved and flat (polyethylene)moderators with Pb and Be-reflector using targets of Pb and depletedU. Data have not been corrected for crystal reflectivity as af'inction of energy (higher order reflections used).

499
1 I IU
.~...-----
4.-W01 -- -* --
- r face Decoupler Poison'O flot - -> :groved Cd -
.CS grooed GA ffat Cd Gd
aCx flat &kC -
" f lt C id001
20 40 60 80 100Energy (meV)
Fig. 2 Energy dependency of the integrated intensity of the reflections ofa graphite analyser for various moderator configurations with andwithout decopling and poisonning relative to the intensity obtainedfrom a moderator as proposed for DIANE.

500
R. C. Birtcher, J. M. Meese
R. Jacobson, A. J. Schultz
I

501
T. G. Worlton, R. E. Prael
M. Loevenhaupt, J. E. Epperson

502

503
I CANS -VI
INTERNATIONAL COLLABORATION ON ADVANCED NEUTRON SOURCES
June 27 - July 2, 1982
COMPUTATIONAL METHODS FOR HIGH-ENERGY
SOURCE SHIELDING
T.W. Armstrong*, P. Cloth, D. Filges
Institut ftr Reaktorentwicklung
Kernforschungsanlage J lich GmbH
Postf!ach 1913
D-5170 Jtlich 1, Germany
'KFA Consultant, P.O. Box 2807
La Jolla, California 92038, USA
ABSTRACT
The computational methods for high-energy radiation trans-
port related to shielding of the SNQ-spallation source are out-
lined. The basic approach is to couple radiation-transport compu-
ter codes which use Monte Carlo methods and discrete ordinates
methods. A code system is suggested that incorporates state-of-
the-art radiation-transport techniques. The stepwise verification
of that system is briefly summarized. The complexity of the re-
sulting code system suggests a more straight forward code speci-
ally tailored for thick shield calculations. A short guide line
to future development of such a Monte Carlo code is given.
504
COMPUTATIONAL METHODS FOR HIGH-ENERGY
SOURCE SHIELDING
T.W. Armstrong*, P. Cloth, D. Filges
Institut ftr Reaktorentwicklung
Kernforschungsanlage JQlich GmbH
Postfach 1913
D-5170 Jdlich 1, Germany
*KFA Consultant, P.O. Box 2807
La Jolla, California 92038, USA
INTRODUCTION
The SNQ shielding problem has special features and impor-
tance compared to usual accelerator shielding considerations. It
presents difficult computational requirements because of the com-
bination of a relatively high-energy source, large shielding di-
mensions, and geometric complexities. There does not presently
exist a computer code system with an appropriate data base which
is directly applicable to the SNQ shielding problems of concern.
In the following discussion, the step-wise development of
such a shielding code system is suggested. The basic approach is
to couple radiation computer codes which use both Monte Carlo me-
thods (suitable for complex geometries) and discrete ordinates
methods (suitable for deep-penetration) with a cross section data
base extended to accomodate the SNQ beam energy of 1100 Kev. Fur-
ther plannings to improve the system aiming at an all-Monte-Carlo
procedure capable of deep penetration problems are outlined.
505
The main factors governing the bulk shield thickness requi-
red are the attenuation of high-energy particles (mainly neu-
trons) and the material density. This is because the flux (or
dose) attenuation depends approximately exponentially on these
factors, and only linearly with source strength (and dose rate
criterion). That is, the flux spectrum at large distances (seve-
ral mean free paths) from the source is roughly represented by
*(E,x) { S f(E).exp(-xp/)att)/x 2(1)
This can be seen e.g. in Fig. 1 from measurements and calcula-
tions. For the depht-dependence of high-energy particles see
also Refs. 1 and 2.
In detailed code calculations the quasi material constant
katt is not valid. In lieu of it the corresponding differencial
cross section data are used. Providing of cross-sections will be
discussed.
One might expect that since katt is so fundamental to shield
design for high-energy radiations, accurate values for common
shielding materials would be available from previous experiments
and accelerator facility designs. This is not the case. For ex-
ample, previous measurements of attenuation lengths for iron ran-
ge from about 120 to 180 g/cm2 . (An HETC code calculation for a
500 1eV proton source and iron shield is reported by Broome to
give Xatt - 179 g/cm2 /3/.) There is also a wide range of mea-
sured Xatt values reported for concrete (= 110 to Vs 172 g/cm2).(A summary of all but the most recent measured values for katt'
and descriptions of most of the experiments, is given in /4/.)

506
There are several reasons for these large variations in the
measured values for katt' Some unaccounted for invalid assump-
tions have to be made in the measurements. Also katt has some
spectral dependence, e.g., Xatt measured along the beam axis can
be different from off-axis measurements because of differences
in particle spectra.
SUGGESTED METHOD FOR SHIELDING CALCULATIONS
There are, of course, some alternatives as to the most ap-
propriate calculational approach to take. However, only one pro-
cedure is outlined here, which is believed to be feasible and
reasonably accurate, but which can probably be improved with fur-
ther thought.
The basic approach here for the near future is to use a com-
bination of Monte Carlo and discrete ordinates methods. While in
principle it is feasible, even for the very thick shields envisi-
oned, to use Monte Carlo methods alone, this would require some
substantial modifications of existing codes, or eventually wri-
ting of new codes. This will be discussed later as an further im-
provement. The method outlined here can be applied nearer term.
The main advantage of the code system is that it incorpora-
tes state-of-the-art radiation transport developments and is, we
believe, representative of the most accurate methods allowed by
present day cross section data and computer capabilities.
The radiation transport codes suggested for use in the
shielding code system are: 1. HETC /5/, for the Monte Carlo cal-
culation of high-energy nucleons and pions, 2. MORSE /6/, for the

507
Monte Carlo transport of low-energy and 7-rays, 3. the discrete
ordinates code ANISN /7/, for one-dimensional neutron and 7-ray
transport, and 4. the discrete ordinates code DOT /8/, for two-
dimensional neutron and 7-ray transport. It should be noted that,
except for HETC, other comparable transport codes exist. In par-
ticular, there is the Los Alamos group of transport codes: the
MCNP (continuous energy) and MCMG (multigroup) Monte Carlo codes
/9/, which have capabilities similar to MORSE; and the discrete
ordinates codes for 2-D and 1-D transport, TWOTRAN and ONETRAN
/10/. The reasons for selecting MORSE, ANISN and DOT for the
shielding code system are, in addition to representing state-of-
the-art capabilities, they are compatible with the present IBM
computer facilities at KFA and with the needed high-energy cross
section data base.
COMPUTER CODES"
Monte Carlo Codes
The high-energy transport code HETC and the low energy neu-
tron/7-ray transport code MORSE, which have been applied exten-
sively during the SNQ reference design study /11/, would be used
in the shielding calculations in their present form. It would
however, probably be better to couple these two codes at a higher
neutron energy (say 60 MeV) than that usually used (15 MeV).
This could be done by extending the MORSE cross section to higher
energies using the HILO library discussed below. This change is
expected to have a negligible effect on bulk shielding estimates.
However, it may be important in obtaining the high-energy portion
of the neutron spectrum from the SNQ-neutron moderator. High-
energ;' neutrons in the moderator which elastically scatter with
oxygen would be more accurately treated by making this change.

508
Discrete Ordinates Codes
The discrete ordinates, or Sn, method is a means of numeri-
cally solving the Boltzmann transport equation in which the phase
space is divided into a number of discrete points. A set of fini-
te differences equations can then be formulated which can be sol-
ved by an iterative technique. (The detailed equations are given,
for example, in Ref. /12/).
The radiation transport codes ANISN and DOT employ the dis-
crete ordinates methods coupled with a multigroup deterministic
solutions of the Boltzmann transport equation for neutrons and
gamma rays. ANISN solves the one-dimensional form of the Boltz-
mann transport equation in slab, cylindrical or spherical geome-
tries, whereas DOT solves the two-dimensional form in slab and
R-Z or R-9 cylindrical geometries.
While ANISN is only l-D, the computation and set-up times
are much less than for DOT. Thus, ANISN will be very helpful in
evaluating cross section sets, doing sensitivity studies, inves-
tigating parameter variations, etc. which would be too time con-
suming if only DOT were used.
Code Coupling Considerations
The ANISN and DOT codes transport only neutrons and (for
appropriate cross section input) the secondary gamma-ray produced
by neutrons. Therefore, a basic premise of the Monte Carlo/dis-
crete ordinates coupling procedure suggested here is that the
discrete ordinates codes are used only for transport in those
spatial regions of the shield where neutrons are the dominate
particles. One method of coupling is to consider an internal
boundary in the shield at some depth sufficiently large that neu-
509
trons dominate. The Monte Carlo calculated neutron current across
this boundary then constitutes the discrete ordinates code input.
Both ANISN and DOT allow a boundary angular neutron source as an
input option, so no code modifications are required.
"Coupling codes" will have to be written to put the Monte
Carlo results in the quadrature set format needed to provide the
neutron source for ANISN and DOT. HETC has previously been coup-
led with ANISN /13/, but for a volumetric ANISN neutron source
and not for deep-penetration applications. A code called DOMINO
/14/ for the opposite type of coupling, i.e., DOT output to Monte
Carlo, is available. However, we are not aware of any previously
documented experience in coupling Monte Carlo transport followed
by discrete ordinates transport for the very deep penetration
shielding applications of interest here.
All neutrons from the Monte Carlo calculations crossing the
coupling plane in the "positive" (larger depth) directions for
the first time then constitute a surface source for the ANISN or
DOT calculations. This is illustrated in Fig. 2.
The coupling plane for defining the source for the discrete
ordinates calculations should be located sufficiently deep into
the shield that the neutrons are the dominate high-energy partic-
les rather than protons, but yet no deeper than necessary to sa-
tisfy this criterion so that the statistics from the Monte Carlo
calculations are as good as possible. Fig. 3 gives a good picture
of the neutrons becoming the dominate high-energy cascade partic-
le. It is also advantageous to have the coupling plane as shallow
as possible so that there will be a "region of overlap" where re-
sults from the two calculations can be compared.
510
DATA BASES
The shielding code system suggested requires high-energy
multigroup cross section data for the discrete ordinates trans-
port calculations. Much of the needed cross section data are
available, but the present data base is not completely compatible
with SNQ application requirements because the maximum neutron
energy considered is 400 MeV. Also, there are other approxima-
tions in the present data base whose accuracy is questionable for
the very thick shields of interest for the SNQ.
The approach suggested here is to make ad hoc modifications
to the present data to allow "Phase I" calculations to be made,
which would include transport calculations to test the importance
of present approximations.
Status of Present High-Energy Transport Cross Section
Data Base
A multi-energy group cross section library (called HILO) for
coupled neutron/v-ray transport has recently been developed at
ORNL in a format compatible with ANISN and DOT input requirements
/15/. Features of this library are summarized in Table II. These
data have been obtained by using experimental data at low ener-
gies (( 14.9 MeV) and theoretical models at high energies (14.9-
400 MeV).
Some work has also been done at Los Alamos /16/ to obtain
two high-energy cross section sets: 1. a 60 group library from
thermal to 60 MeV, and 2. a 41 group library up to 800 MeV. The
41 group library contains the following element: H, C, 0, Al,
Si, Fe, Mo, W, and Pb. A P3 angular expansion is used for all
elements except Fe, which is extended to P8. These cross sections

511
were obtained in a manner similar to that of the HILO library,
i.e., ENDF data at low energies ((=20 MeV) and optical model and
intranuclear-cascade-evaporation model calculations for higher
energies.
It should be noted that the Los Alamos cross section library
does not include elastic scattering for nuclides other than H at
high energies. Based on a test case for an iron shield (a rather
"thin" one-dimensional spherical shield having diameter of 1.4
meters with a central isotropic neutron source from 50 MeV deu-
terons on Be), it was concluded that high-energy elastic scatte-
ring had a negligible effect on the dose equivalent at the edge
of the shield /16/. However, calculations for a heavy concrete
shield reported in Ref. /17/ (using the HILO library, for a sphe-
rical shell shield 3.7 m thick, point isotropic neutron source,
<-*60 MeV, from deuterons Li) show that the dose equivalent outsi-
de the shield is over estimated by more than three orders of mag-
nitude if elastic scattering by heavy (other than H) elements at
high energies (>u14.9 MeV) is neglected. (This may also have im-
plications for the SNQ bulk shielding calculations in comparing
iron vs. cast-iron since cast-iron contains nominally 20 atom
per cent C and Si).
It is suggested here that the HILO high-energie cross sec-
tion library be used (with modifications to allow higher-ener-
gies) for the initial discrete ordinates calculations related to
SNQ shielding. The main consideration is that this data set in-
cludes elastic scattering (for all but the heaviest nuclei - W
and Pb) whereas the Los Alamos library does not. Also, the HILO
library includes 7-ray production and transport cross sections
for v-rays produced in low-energy (< 14.9 MeV) neutron collisi-
ons, which are neglected in the Los Alamos library. Furthermore,
the HILO library has a higher order angular expansion at high

512
energies (p5 vs P3 ), except for Fe, and a finer energy group
structure.
While the HILO library is recommended, it should be noted,
however, that some of the considerations and assessments mentio-
ned in Ref. /16/ in connection with the development of the Los
Alamos library are very relevant to our interests. As an example,
for the high-energy nonelastic cross sections of the HILO libra-
ry, the results of intranuclear-cascade-evaporation model calcu-
lations are used directly abovez60 MeV. In the Los Alamos libra-
ry, such model cross sections are adjusted in some cases (e.g.,
upward by about 15 % for Fe) where some experimental data points
are available.
SNQ-SHIELDING CALCULATIONS
Several "baseline" configurations are suggested here for
setting up the initial shielding -code system. There are a number
of questions to be investigated using these simple shield arran-
gements, as outlined and discussed below.
Both 1-D and 2-D arrangements are suggested. The reasons for
starting with a 1-D setup are: (a) To gain experience in Monte
Carlo/discrete ordinates coupling with the simpler 1-D case.
(There are no data presently available to check either the 1-D
or 2-D cases, but the laterally integrated 2-D results can be
compared with the 1-D calculations as a partial check.) (b) The
2-D calculations will require considerable computer time for deep
penetrations, and many of the preliminary calculations (investi-
gating quadrature sets, parameter variations, etc.) can be made
with the 1-D set-ups. (c) For some of the eventual applications
(e.g., accelerator shielding requirements due to proton beam los-
ses) 1-D approximations are adequate.

513
Baseline Arrangements
A source/shield arrangement in cylindrical geometry for the
1-D case is shown in Figure 4. This set-up serves for baseline
test calculations. Fig. 5 shows (upper case) a similar set-up for
DOT calculations.
The lower arrangement in fig. 5 is to allow early estimates
of bulk shielding dimensions using the initial code system and
data base. The couplig surface is the target surface in this ca-
se.
Note also that the l-D arrangement preserves the anisotropy
of the neutron source at the coupling plane, so, for example, in-
vestigations of appropriate quadrature sets from the 1-D ANISN
calculations should be relevant to the 2-D DOT calculations.
A target diameter of 10 cm is chosen to be consistent with
the thickness of the reference design target wheel. We have indi-
cated a target length L as approximately the range R of the pri-
mary proton range so that primary protons have a chance to pro-
duce neutrons within the target material. The angular and radial
dependence of the neutrons at the coupling plane will depend upon
L (the magnitude depending on L and the depth of the coupling
plane). For example, for the reference design target wheel, where
the wheel diameter was >"2 range thicknesses, relatively few neu-
trons escape the target in the forward (00) direction, and the
neutron angular distribution is peaked at about 300. Therefore,
calculations for several target lengths (e.g., L-0, L R, and
L 2R) would be of interest.

514
Arrangement with Beam Holes
Prediction of the doubly differential neutron and gamma-ray
spectra emerging from a beam hole, taking into account interac-
tion effects in the shield material around the hole, is a very
demanding calculation. It will require the full extent of the
transport codes as well as computer capabilities.
The first part would be to calculate the angular and spa-
tially dependent neutron, proton, and charged pion energy spec-
trum leakage from the target surfaces adjacent to the moderators.
The moderators should be included in these calculations to ac-
count for any second order effects; that is, particles which are
"reflected" from the moderator back into the target region may
produce additional particles which then can enter the moderator.
A MORSE calculation will also be required to account for the neu-
trons which are produced in HETC below the cutoff energy. These
spectra obtained become the source for part two of the HETC-MORSE
calculation.
The second part of the calculation need only include the mo-
derator since all back-scattered particles have been accounted
for. The source calculation for the second HETC calculation will
be the protons, charged pions and neutron leakage spectra obtai-
ned in the first part of the calculation. MORSE will be used
twice during this step of the calculation: once to transport the
low-energy neutrons leaking from the target, and once to trans-
port the neutrons produced in the second HETC calculation. By
using some of the biasing techniques already incorporated into
the MORSE code, an improvement in the statistical accuracy of the
low energy emerging neutrons can be obtained. It may also be
necessary to incorporate some biasing techniques into HETC - for
example, particle splitting in important regions and directions.

515
The DOT calculation will probably, require a biased (asymme-
tric) angular quadrature, with most of the angles pointing down
the collimator hole. In addiation, it will be necessary to define
fine radial intervals (sayo'0.1 cm) for a short distance (~l - 2
cm) into the shield material to properly account for "skin" ef-
fects. Since neutrons and gamma rays which are located more than
several mean-free-paths into the shield material have little ef-
fect on the emerging particles at the end of the collimator, it
is only necessary to make the thickness shield material surroun-
ding the beam hole a few mean-free-paths thick. There is not, of
course, experience to guide any of the above assumptions and test
calculations will be necessary to refine the procedure. The ar-
rangement is (shown in Fig. 6.
It is not clear whether a single DOT calculation can simula-
te the entire length of the collimator. This is because the
length-to-diameter ratio is very large (L/D'. 60) and a fine spa-
tial grid is needed radially near the collimator surface. There-
fore, array sizes may exceed computer storage capacities, and/or
computation times may be prohibitive. If this should be the case,
the problem can be divided into several parts, "overlapping" se-
veral DOT calculations for sequential segments of the collimator
length (see Fig. 6). (This procedure is suggested by "overlap"
discrete ordinates calculations which have been made for deep pe-
netrations in air from neutron sources /18/.
516
FUTURE CODE SYSTEMS AND DATA BASE
The complexity of the presented code system ,the computer
time and man power consuming running procedure for each problem
case suggest a more straight forward computer code specially tai-
lored for thick shielding calculation. If we realize the con-
straints of the above system, e.g., the strongly limited geome-
tric capabilities, or the restriction to only neutral particle
treatment (usually neutrons and gammas), we find, that Monte-
Carlo techniques is the adequate means that should be tried for
our purpose.
Thick Shield Monte Carlo Codes
The following is somewhat qualitative and serves only as a
guide line in developing a special thick-shield Monte Carlo code.
In thick shields as they occur in the SNQ case particles have to
travel a large number of mean free paths to go through, whereas
the average number of collisions that particles undergo during
their lifetime (until energy has fallen below a certain level)
is considerably smaller. Neutral particles, however, can travel
any distance between collisions with, of course, low probability
for larger path-lengths. Thus, a few particles can penetrate the
thick shield, and the calculation of this small fraction is the
deep penetration problem.
For simplicity reasons let us asume that the shield consists
of only one single material and forget about the fact that the
considered particle may change its identity from collision to
collision and temporily may be a charged particle. This will only
complicate the computational procedure but not affect the prin-
ciple. The collision points of the particle tracks will be, ac-
cording to what was discussed above, concentrated close to the

517
source, with more or less none of them in the far away shield re-
gions near the surface. What is needed, however, is for bulk
shielding calculations collision points near the surface, and for
the case with beam tubes a more flat distribution.
The idea now is to calculate first a collision history of
a particle without considering beforehand the free paths between
collisions. This is justified as in our simpel model collision
physics is space independent. After that, we sample a set of free
tracks that has importance for our purpose. We do this in a way
that the total migration length, that is the sum of all free
paths of a track is in a certain range of high importance. Al-
though there is some similarity to so called path-length stret-
ching, which produces a wide variety of migration lengths, our
procedure - and this is the advantage - gives control over the
important parts of this variety.
Let us express the migration length in terms of the mean
free path and denote it V, then the conditional probability of
a collision history for agiven relative migration length i is a
measure for the importance of this history to penetration of a
shield of the thickness in the order of V. According to our dis-
cussion above V the number of mean free paths through the shield
is (on average) larger than n the number of collisions.
While the bulk of histories has n values (collision numbers)
near the average and well below V, there might be a small frac-
tion of histories with n close to 'p having thus an extremely high
importance yet being completely underrepresented in the n distri-
bution provided e.g. by the intra-nuclear cascade calculation,
as compared to their relevance for the shielding calculation
(Fig. 7). It is not known hcw strong this effect could be, but
it can be overcome by using biasing techniques already in the in-

518
tra-nuclear cascade model, which is a Monte-Carlo program itself.
Obviously it is the extremely forward directed component of the
cascade variety of extreme low energy loss, that can have excep-
tional high collision numbers. If this small history group plays
a certain role, for which we have some indication, it has also
to be considered in preparing cross-sections with HETC for use
with the near term Monte-Carlo discrete ordinate system. So one
of our next steps in code development is introduction of suitable
biasing techniques in the intranuclear cascade part of HETC.
REFERENCES
1 S.P. Shen
Passage of High-Energy Particles in Matter:
Nuclear Cascades Induced in Dense Media by 1-and 3-GeV
Protons
BNL-8721,Brookhaven National Laboratory (1965).
2 T.W. Armstrong and R.G. Alsmiller
Monte Carlo Calculations of the Nucleon-Meson Cascade in
Iron Initiated by 1- and 3-GeV Protons and Comparisons
with Experiment
Nucl. Sci. Engr. 33, 291 (1972)
3 T.A. Broome
Shielding for the Spallation Neutron Source at the
Rutherford Laboratory
Paper in "Meeting on Targets for Neutron Beam Spallation
Sources"
G.S. Bauer (Ed.), Jtl-conf-34, Januar 1980

519
4 W. Wade Patterson and Ralph H. Thomas
Accelerator Health Physics
Academic Press, New York, New York, 1973
5 T.W. Armstrong and K.C. Chandler
HETC - A High-Energy Transport Code
Nucl. Sci. Engr. 43 353 (1971)
6 E.A. Straker
The MORSE Code - A Multigroup Neutron and
Gamma-Ray Monte Carlo Transport Code
ORNL-4585, September 1970
7 W.W. Engle, Jr.,
ANISN, A One-Dimensional Discrete Ordinates
Transport Code with Anisotropic Scattering,
K-1693, March 1967
(also updated features described in ANISN
Code Package as distributed by the Radiation
Shielding Information Center, Oak Ridge, TN)
8 W.A. Rhoades, et.al.
The DOT-IV Two-Dimensional, Discrete-Ordinates
Transport Code with Space-Dependent Mesh and
Quadrature
ORNL-TM-6529, August 1978
(also, related documentation contained in DOT-IV
Code Package distributed by the Radiation Shielding
Information Center, Oak Ridge, TN)
9 W.L. Thompson and E.D. Cashwell
The Status of Monte Carlo at Los Alamos
LA-8353-MS, May 1980

520
10 T.R. Hill
ONETRAN, A Discrete Ordinates Finite Element Code
for the Solution of the One-Dimensional Multigroup
Transport Equation
LA-5990-MS, June 1975
11 T.W. Armstrong, P. Cloth, D. Filges, R.D. Neef
Theoretical Target Physics Studies for the SNQ
Spallation Neutron Source
Jul-Spez-120, July 1981
12 F.R. Mynatt, F.J. Muckenthaler, and P.N. Stevens
Development of Two-Dimensional Discrete Ordinates
Transport Theory for Radiation Shielding
CTC-INF-952, August 1969
13 T.W. Armstrong
Calculation of the Lunar Photon Albedo from
Galatic and Solar Proton Bombardment
J. Geophys. Res. 77, 524 (1972)
14 M.B. Emmett, C.E. Burgart, and T.J. Hoffman
DOMINO, A General Purpose Code for Coupling Discrete
Ordinates and Monte Carlo Radiation Transport Calculations
ORNL-4853, July 1973
15 HILO, 66 Neutron, 21-Gamma-Ray Group Cross Sections for
Radiation Transport for Neutron Energies up to 400 MeV
ORNL Radiation Shielding Information Center Data Package
DIC-87 (1981)

521
16 W.B. Wilson
Nuclear Data Development and Shield Design for Neutrons
Below 60 MeV
LA-7159-T, February 1978
17 R.G. Alsmiller, Jr., and J. Barish
Neutron -Photon Multigroup Cross Sections for Neutron
Energies < 60 MeV
Nucl. Sci Engr. 69, 378 (1979)
18 J.V. Pace, III, F.R. Mynatt,and L.S. Abbott,
"A Study of the Overlap Conditions Required in Sequential
Discrete Ordinates Transport Calculations for a 14-MeV
Neutron Source in a 5000-m Radius Cylinder of Air",
ORNL-TM-3269, June 1971

522
0,
0*No
C
40040
.0
E
U.4
40
-2600 700 800
Fig. 1Depth-dependence of high-energy particles inan iron shield bombarded by 1 and 3 GeV pro-ton beams. (F-18 production in Al foils)The experimental values are taken from Ref.1,the calculated values from Ref. 2.
40
0 400 200 300 400 500Z (g/cm 2
o _ _*
0~
* *
- 3GeV
- -4GeV --
~~~ o EXPERIMENTAL- -- CALCULATED, STRAIGHTAHEAD --- f CALCULATED, MONTE CARLO -

523
Fig. 2Schematic of the contribution of a particleto the surface source at its first cross-over point on the surface.
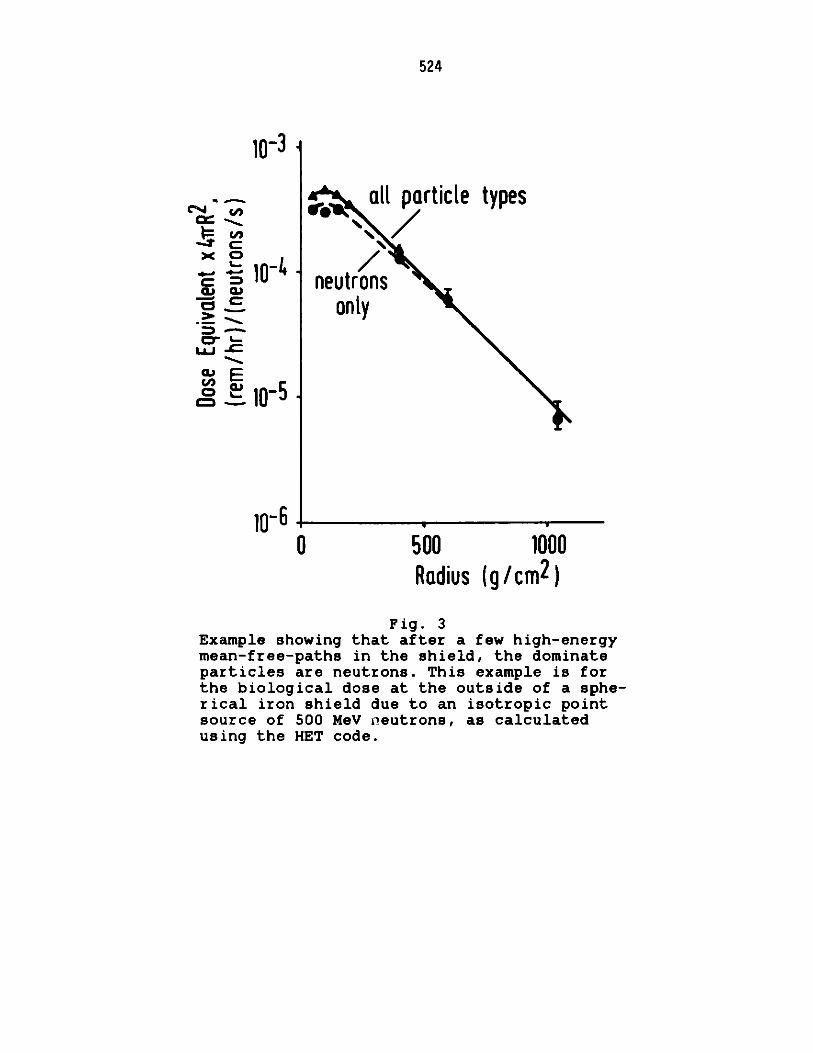
524
*C
GJOa)
-' C
10-6
all particle types
neutronsonly
0 500 1000
Radius (g/cm 2 )
Fig. 3Example showing that after a few high-energymean-free-paths in the shield, the dominateparticles are neutrons. This example is forthe biological dose at the outside of a sphe-rical iron shield due to an isotropic pointsource of 500 MeV neutrons, as calculatedusing the HET code.
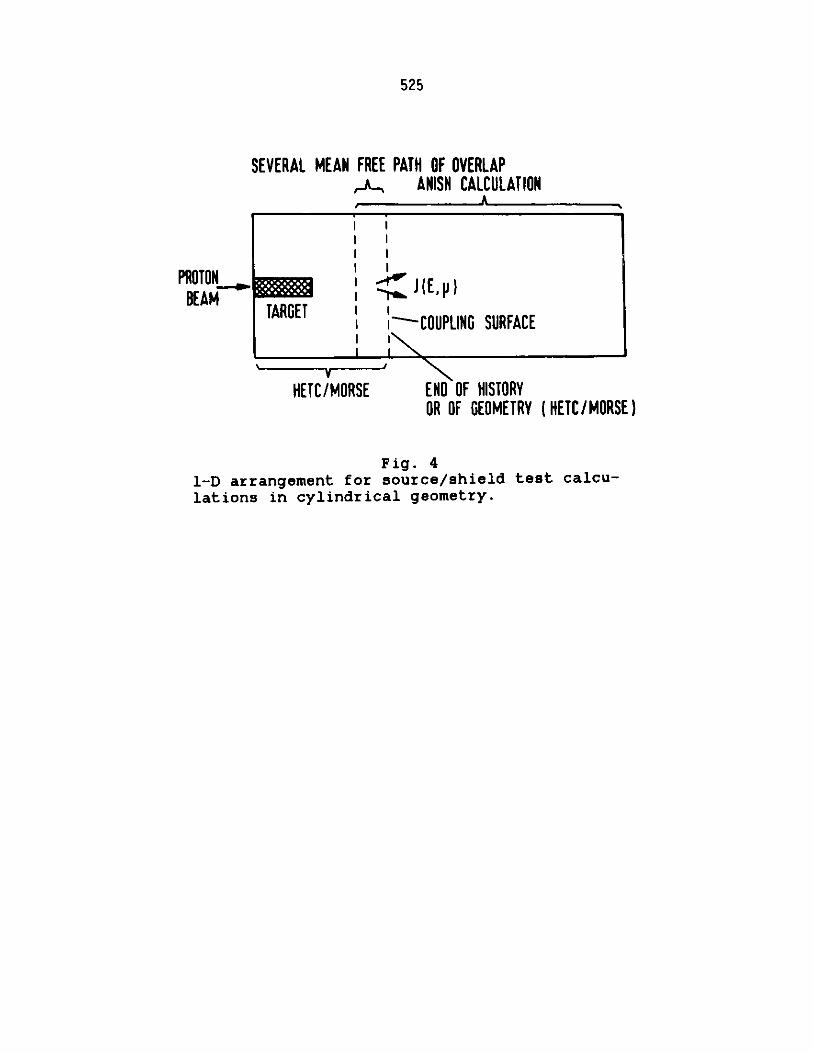
525
SEVERAL MEAN FREE PATH OF OVERLAP, ANISH CALCULATION
I II II I
PROTONSBEAM TARGET --PILATARGETCOUPLING SURFACE
HETC/MORSE ENO OF HISTORYOR OF GEOMETRY (HETC/MORSE)
Fig. 4l-D arrangement for source/shield test calcu-lations in cylindrical geometry.

526
PROTONBEAM
PROTON -BEAM
SEVERAL MEAN FREE PATH OF OVERLAPOOT-CALCULATION
1AI V
, II I
(E, r9$
TARGET '- COUPLING SURFACEI I
HETC / MORSE
IRON CONCRETE
J(E, rz,9,$)
Fig. 52-D arrangement for test and early bulk shiel-ding calculations using DOT in cylindricalgeometry.
R

527
SHIELD MATERIAL
TARGET WHEEL3 4
S2 S3 BEAM HOLE
Fig. 6Arrangement for 2-D SNQ-beam hole calculations
with code coupling surfaces S1, 52 and 53.
I I
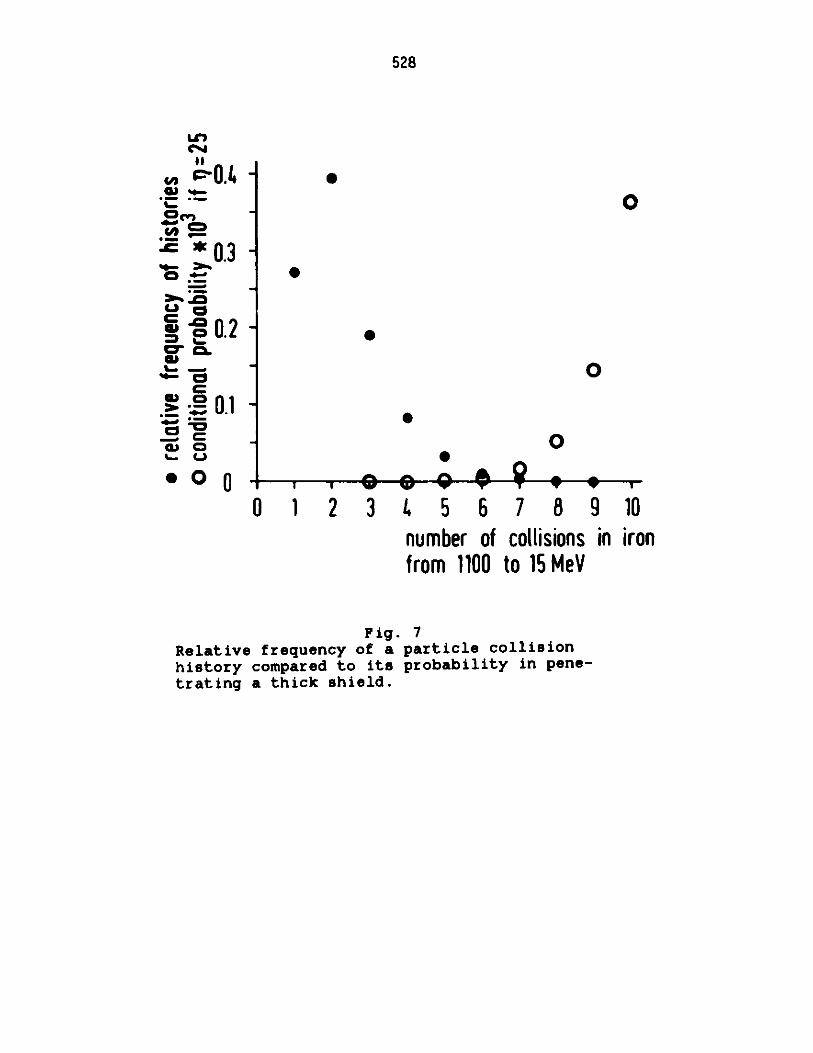
528
(40.vOcyn
~0.2
C
00.
0
0
0
w I I wafi
0 1 2 3_ 0 o AelaQ
W W, V, TI 1w
4 5 6 7 8 9 10number of collisions in ironfrom 1100 to 15 MeV
Fig. 7Relative frequency of a particle collisionhistory compared to its probability in pene-trating a thick shield.
529
I CANS-V I
INTERNATIONAL COLLABORATION ON ADVANCED NEUTRON SOURCES
June 27 - July 2, 1982
HIGH-ENERGY FISSION MODELS VALIDATION
AND COMPARISON WITH EXPERIMENTS
T.W. Armstrong , P. Cloth, D. Filges, R.D. Neef
Institut fir Reaktorentwicklung
Kernforschungsanlage Jlich GmbH
Postfach 1913
D-5170 Jtlich 1, Germany
KFA Consultant, P.O. Box 2807
La Jolla, California 92038, USA
ABSTRACT
Calculations including the high energy fission models were per-
formed. Comparisons on BNL-Cosmotron arrangements of thermal neu-
tron peak fluxes in the H2 0-moderator for lead and depleted ura-
nium targets are given for different proton beam energies (540,
960, 1470 MeV) and two B0-parameters (8 and 14 MeV) of the level
density formula. Preliminary results of neutron spectra measure-
ments for thin uranium targets are compared with HETC calcula-
tions at 590 MeV incident proton beam energy. The residual mass
distributions are determined in thin uranium targets for proton
beam energies of 0.3, 1.0, and 2.9 GeV. The calculations are done
using the Rutherford and Appleton Laboratory high energy fission
model (RAL) and are compared with respective calculations of the
ORNL-model by Alsmiller et.al..

530
HIGH-ENERGY FISSION MODELS VALIDATION
AND COMPARISON WITH EXPERIMENTS
T.W. Armstrong*, P. Cloth, D. Filges, R.D. Neef
Institut fir Reaktorentwicklung
Kernforschungsanlage Jlich GmbH
Postfach 1913
D-5170 Julich 1, Germany
KFA Consultant, P.O. Box 2807
La Jolla, California 92038, USA
1. INTRODUCTION
From previous papers Ref. /1/ and /2/ at ICANS-V of the compari-
son of high energy fission (HEF) models for the High-Energy-
Transport-Code (HETC) it was stated: Spectrum hardening with high
energy fission models incorporated in the HET code is evident.
The neutron captures in water surrounding finite depleted uranium
targets are found to be 5-10 % higher with HEF. Significant dif-
ferences of Rutherford and Appleton Laboratory (RAL) /3/ and the
Oak Ridge National Laboratory (ORNL) /4/ high energy fission
(HEF) models are found at incident proton beam energies above 1
GeV. The RAL model gives lower values than the ORNL model. The
B0 value seems to be model and energy dependend.
These investigations were continued studying the spatial depen-
dence and thermal neutron peak fluxes in BNL-Cosmotron experi-
ments (Refs. 5, 6). Preliminary comparisons for thin target mea-
surements on uranium /Ref. 7/ with HETC calculations and predic-
tions for residual mass distributions were also performed.

531
2. SPATIAL DEPENDENCE AND THERMAL NEUTRON PEAK FLUXES IN
BNL-COSMOTRON EXPERIMENTS
The calculations were done for BNL-Cosmotron setups /5, 6/ at
three proton beam energies (540, 960, and 1470 MeV) using HETC-,
MORSE-CG-, and SIMPEL-spallation computer code system at KFA-IRE
as described in Ref. 8. In Table 1 comparisons of the thermal
peak fluxes in the H2 0-moderator for lead and uranium targets for
different beam energies and several B0 -parameters of the level
density formula are shown. In Table 2 the ratios of thermal peak
fluxes for uranium and lead with different B0 -parameters are cal-
culated.
In Fig. 1 the thermal peak fluxes for neutrons (n cm- 2 s-1) per
proton are plotted as a function of proton beam energy for lead
and uranium target with B0 -14. The uranium target system gives
twice the thermal neutron peak flux of the lead system. The peak
fluxes depend linearly on the incident proton beam energy upto
1 GeV. For higher energies there is only a weak increase of the
neutron flux because of the spatial spreading out of the casca-
des.
In Fig. 2 and 3 the three-dimensional thermal flux distributions
for the lead and uranium system at incident proton beam energy
of 960 MeV are plotted meshwise. It is obvious that in the urani-
um case the flux distribution is more concentrated.

532
Target EvaporationModel
Thermal PeakFluxn cm-2 s-1per proton
Thermal PeakFluxn cm-2s-1per 1 mA
B 0 -8,no RAL*
B 0 -14, RAL
B 0 -14, RAL
B0 -8,no RAL
B0 -14, RAL
BO-8, RAL
B0 -14, RAL
B0 -8,no RAL
B0 -14, RAL
B0 -14, RAL
* RAL - High Energy Fission ModelAppleton Laboratories
/3/ of Rutherford and
Table 1: Calculated thermal neutron peak fluxes for lead anduranium targets for two BO values at different incidentproton beam energies
B0
14
8
14
14
Peak flux ratioUdep/Pb
1.93
1.9
2.2
2.15
Table 2: Energy dependent ratios of thermal neutronpeak fluxes for uranium and lead targets
EnergyMeV
540
960
1470
Pb
Pb
Udep
Pb
Pb
UdepUdep
Pb
Pb
Udep
2.4 x
2.15 x
4.15 x
4.7 x
3.55 x
8.9 x
7.8 x
6.25 x
5.1 x
1.1 x
10- 2
10-2
10-2
10-2
10-2
10-2
10-2
10-2
10-2
10-1
1.5
1.34
2.59
2.9
2.2
5.5
4.8
3.9
3.2
6.9
x 1014
x 1014
x 1014
x 101 4
x 1014
x 1014
x 101 4
x 1014
x 1014
x 1014
Energy
540
960
960
1470

533
3. NEUTRON SPECTRA COMPARISONS
The calculations are made using the intranuclear-cascade- evapo-
ration model contained in the HETC code in combination with the
standard Rutherford and Appleton Laboratory high energy fission
model (RAL) with B0 - 14 /3/. The cases considered are 590-MeV
protons on U-238 target nuclei. The measured neutron spectra
which are compared with here were kindly provided by S. Cierja:ks
of KfK, and are unpublished data from experiments performed at
SIN. (The experimental method was summarized by Cierjacks, et.al.
at ICANS-V /9/.) Cierjacks has indicated /7/ that the normaliza-
tion of the measured data is to be checked in further experiments
at SIN, so the comparisons here should be regarded as preliminary
at present. Analyzed data for U targets at three angles (30, 90,
and 150 degrees) are compared.
Figures 4-6 show comparisons of the present calculations and the
KfK measurements for neutron spectra at 300, 900, and 1500 from
thin uranium targets bombarded by 590-MeV protons.
To show better the low-energy neutron comparisons in the evapora-
tion region, Fig. 7 gives the low-energy (( 10 MeV) neutron part
of spectra with a linear scale. The calculated spectra here are
averaged over all emission angles.
The basic conclusions from these comparisons are: (a) For urani-
um, there is rather good agreement in the evaporation region of
the spectrum ( few MeV and nelow). The magnitudes of the evapo-
ration peaks agree within 25 %. The evaporation neutron maximum
is lower in the calculations ( 1 MeV calculated vs. 2 MeV mea-
sured). In the "region of overlap" of the high-energy part of the
evaporation spectru and where the cascade production begins to
dominate (i.e., in the energy range 10 - 25 MeV), the calculated

534
results are higher, by as much as a factor of 3 at 10 MeV. The
high-energy part of the spectrum () 50 MeV) is underestimated by
the calculations, by a factor of 3 for small (e.g., 300) angles,
with much worse agreement at the higher angles.
4. RESIDUAL MASS DISTRIBUTIONS IN THIN URANIUM TARGETS
The calculations made here are for proton beams having kinetic
energies of 0.3, 1.0, and 2.9 GeV incident on thin U-238 targets.
These were made using the Rutherford and Appleton Laboratory
(RAL) high energy fission model and the results computed here are
compared with available results for the same cases computed by
the Oak Ridge National Laboratory (ORNL) model developed by
Alsmiller, et.al. /4/.
A summary of the mass distribution results for the three beam
energies as calculated using the RAL model is shown in Figure 8.
The points shown are averages over AA - 5 intervals, and are
plotted at the midpoint of the intervals. Representative error
bars (one standard deviation) are indicated. The normalization
is per nonelastic proton-uranium collision, which can be conver-
ted from yields to production cross sections by multiplying by
the computed total nonelastic cross section (Table 3). Note from
Fig. 8 that the model predicts a "bump" in production in the mass
region between that of the fission products (A < 180) and the
mass region of the residual spallation product mass in which fis-
sion did not occur (A > 220); this is discussed in more detail
later.
In Figures 9 and 10 results from the RAL model are compared with
ORNL mo"el predictions and measured data. The ORNL calculations
are also averaged over AA - 5 intervals. The normalization of the
535
measured data of Stevenson, et.al. /10/ at 300 MeV is taken from
the ORNL paper /6/, in which the area under the experimental
points in the mass region from 60 to 160 was normalized to be the
same as the area under the ORNL calculated histogram in this mass
region. (The 2.9 GeV experimental values are the absolute produc-
tion cross sections given by Friedlander, et.al. /11/, converted
to yields using the calculated nonelastic cross section.)
From Figures 9 and 10, the model predictions and measured data
are all in good agreement in the vicinity of the peaks of the
fission fragment mass distributions, although the RAL model seems
to predict a somewhat wider fission fragment distribution.
As noted earlier, the RAL model predicts three peaks in the mass
distribution: the fission fragment peak near A-ll0, the spalla-
tion peak near A-238, and an intermediate peak near A-200. This
intermediate peak apparently results from spallation products
which "survive" de-excitation through the mass region of high-
fission probability into a lower mass region where further de-ex-
citation by neutron emission is much more likely than fission.
For illustration the mass distributions are calculated with and
without fission competition for the 1-GeV beam case (Fig. 11).
To get the fission probability versus mass number, subroutines
of the RAL model are used to compute the fission probability for
various arbitrarily selected isotopes covering the mass range
from 175 to 250. Thus, while spallation products are produced
down to A-160 (for l-GeV, Fig. 11), and the model allows fission
for these low masses, the fission probability determined for
these masses is very small for A < 200, accounting for the peak
in this region. This intermediate peak in the mass distribution
is probably most evident at "medium" beam energies - i.e. at low
beam energies (say, 100 MeV) there is not sufficient excitation
energy to produce many nuclei in the lower mass region of low-
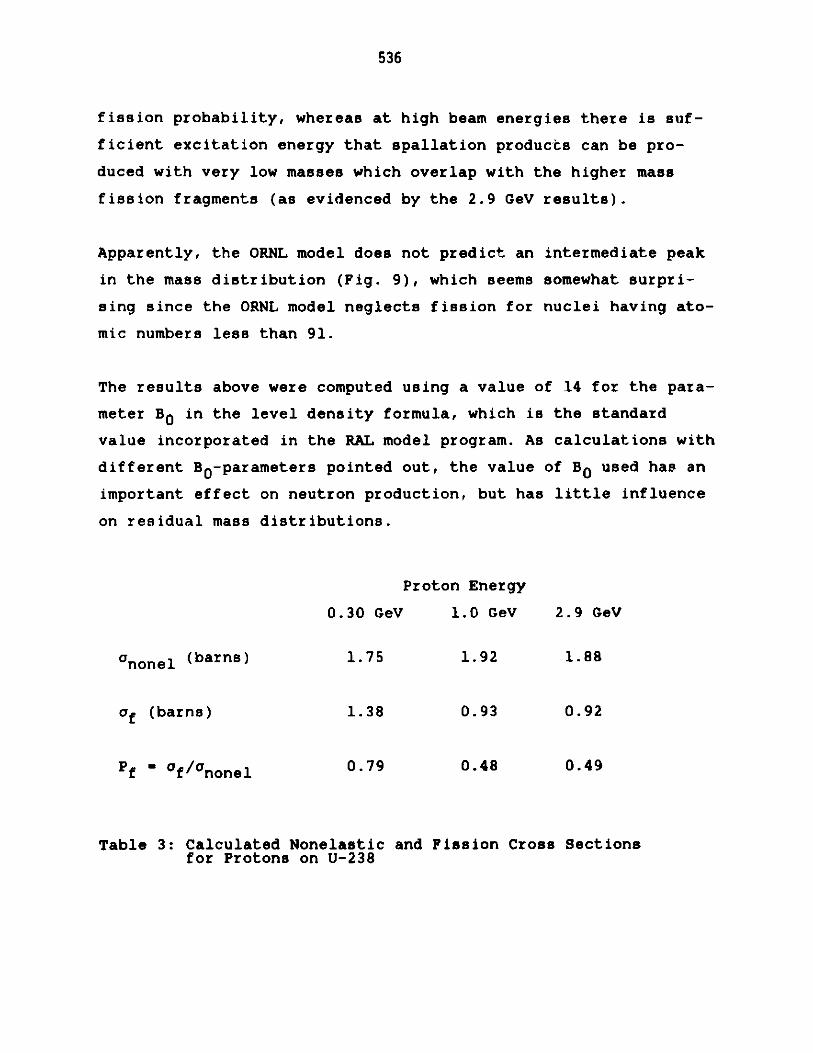
536
fission probability, whereas at high beam energies there is suf-
ficient excitation energy that spallation products can be pro-
duced with very low masses which overlap with the higher mass
fission fragments (as evidenced by the 2.9 GeV results).
Apparently, the ORNL model does not predict an intermediate peak
in the mass distribution (Fig. 9), which seems somewhat surpri-
sing since the ORNL model neglects fission for nuclei having ato-
mic numbers less than 91.
The results above were computed using a value of 14 for the para-
meter B0 in the level density formula, which is the standard
value incorporated in the RAL model program. As calculations with
different B0 -parameters pointed out, the value of B0 used has an
important effect on neutron production, but has little influence
on residual mass distributions.
Proton Energy
0.30 GeV 1.0 GeV 2.9 GeV
anonel (barns) 1.75 1.92 1.88
of (barns) 1.38 0.93 0.92
Pf - of/Ononel 0.79 0.48 0.49
Table 3: Calculated Nonelastic and Fission Cross Sectionsfor Protons on U-238

537
5. CONCLUSIONS
For the thick target-moderator systems (large H2 0 moderator)
using lead and uranium as target material a factor of about 2
between uranium (0.2 % wt 23 5U) and lead in thermal neutron peak
fluxes is reachable. The B0 -dependence in lead target systems is
larger than in uranium system, therefore in the new KFA version
of HETC (HETC/KFA-l) mass dependent level density parameters in
the evaporation model were introduced.
From the comparisons of neutron spectra calculations with measu-
rements on this uranium targets the major deficiency of the pre-
sent model is considered to be the underestimate of the high-
energy neutrons. The comparisons here are with preliminary expe-
rimental data, and with only a small part of the KfK data which
have been taken, so the magnitude of the experimental/theoretical
differences may change if further comparisons are made. However,
there is enough evidence from these, and other comparisons which
have been made, to believe that the difference, at least at large
angles, is real, even though the magnitude may be considered
still questionable.
The RAL model predicts a somewhat wider fission fragment distri-
bution than the experiment. Between the fission fragment peak and
the spallation peak the RAL model predicts an intermediate peak
near A-200. This peak results from spallation products which
"survive" de-excitation through the mass region of high-fission
probability into a lower mass region where further de-excitation
by neutron emission is much more likely than fission. The ORNL
model does not predict an intermediate peak in the mass distribu-
tion which seems somewhat surprising since the ORNL model ne-
glects fission for nuclei having atomic numbers less than 91.

538
6. REFERENCES
/1/ T.W. Armstrong, P. Cloth, D. Filges, R.D. Neef,
"A Comparison of High-Energy Fission Models for
the HETC Transport Code, Part II: Thick Targets",
Proceedings of the 5th Meeting of the International
Collaboration on Advanced Neutron Sources",
G.S. Bauer and D. Filges (Eds.), 22-26 June 1981,
JiUlich, Jul-Conf-45 (October 1981)
/2/ T.W. Armstrong, D. Filges, "A Comparison of High-
Energy Fission Models for the HETC Transport Code,
Part I: Thin Targets", Proceedings of the 5th Meeting
of the International Collaboration on Advanced Neutron
Sources", G.S. Bauer and D. Filges (Eds.), 22-26 June
1981, Jt lich, Jtl-Conf-45 (October 1981)
/3/ F. Atchison, "The Inclusion of Fission in the High-Energy
Particle Transport Code, HETC", Bulletin of the American
Physical Society 24, 874 (1979)
/4/ F.S. Alsmiller, R.G. Alsmiller Jr., T.A. Gabriel,
R.A. Lillie, J. Barish, "A Phenomenological Model for
Particle Production from the Collisions of Nucleons and Pions
with Fissile Elements at Medium Energies", ORNL/TM-7528 (1981)
/5/ J.S. Fraser, et.al., "Neutron Production in Thick Targets
Bombarded by High-Energy Protons", Phys. in Canada 21, 17
(1965)

539
/6/ R.G. Alsmiller Jr., T.A. Gabriel, J. Barish, F.S. Alsmiller
"Neutron Production by Medium Energy ( 1.5 GeV) Protons
in Thick Uranium Targets"
ORNL/TM-7527 (1981)
/7/ S. Cierjacks,
KfK unpublished, private communication 1981
/8/ T.W. Armstrong, P. Cloth, D. Filges, R.D. Neef,
"Theoretical Target Physics Studies for the SNQ
Spallation Neutron Source", Jul-Spez-120 (July 1981)
/9/ S. Cierjacks, et.al., "High-Energy Particle Spectra
Spallation Targets", Proceedings of the 5th Meeting
of the International Collaboration on Advanced
Neutron Sources, G.S. Bauer and D. Filges (Eds.)
22-26 June 1981 Jfilich, Jl-Conf-45 (October 1981)
/10/ P.C. Stevenson, et.al., "Further Radiochemical
Studies of the High-Energy Fission Products",
Phys. Rev. 111, 886 (1958)
/11/ G. Friedlander, "Fission of Heavy Elements by High-
Energy Protons, in Physics and Chemistry of Fission",
1965, International Atomic Energy Agency, Vienna, 1965

540
URANIUMa,
LEA
10-1E
500 0001
PRTa LEADNRY M
C
-2
500 1000 1500PROTON BEAM ENERGY (MeV)
Fig. 1
Thermal neutron peak fluxes per proton as a function of
proton beam energy (540, 960, 1470 MeV) for lead and
uranium target with B0 - 14 MeV

541
$th(r,z)
4%
Fig. 2
Thermal neutron flux distribution for the lead systemin R-Z plane (incident proton beam energy 960 MeV)

542
nth r,z)
Fig. 3
Thermal neutron flux distriution for the uraniumsystem in R-Z plane (incident proton beam energy960 MeV)

543
10 1 10 10' 10
1d' LEGENO 1d'o - MEASURED
- CALCULATED
10 10
10 1 0
10 m, 104
- 590 MEV PROTONS-- URANIUM TARGET-
30 DEGREES 110103
103 10
10 -' 1010 if10 1 o 10
NEUTRON ENERGY
Fig. 4
Comparison of calculated and KfK measured neutronspectra at 300 from uranium target bombarded by590-MeV protons
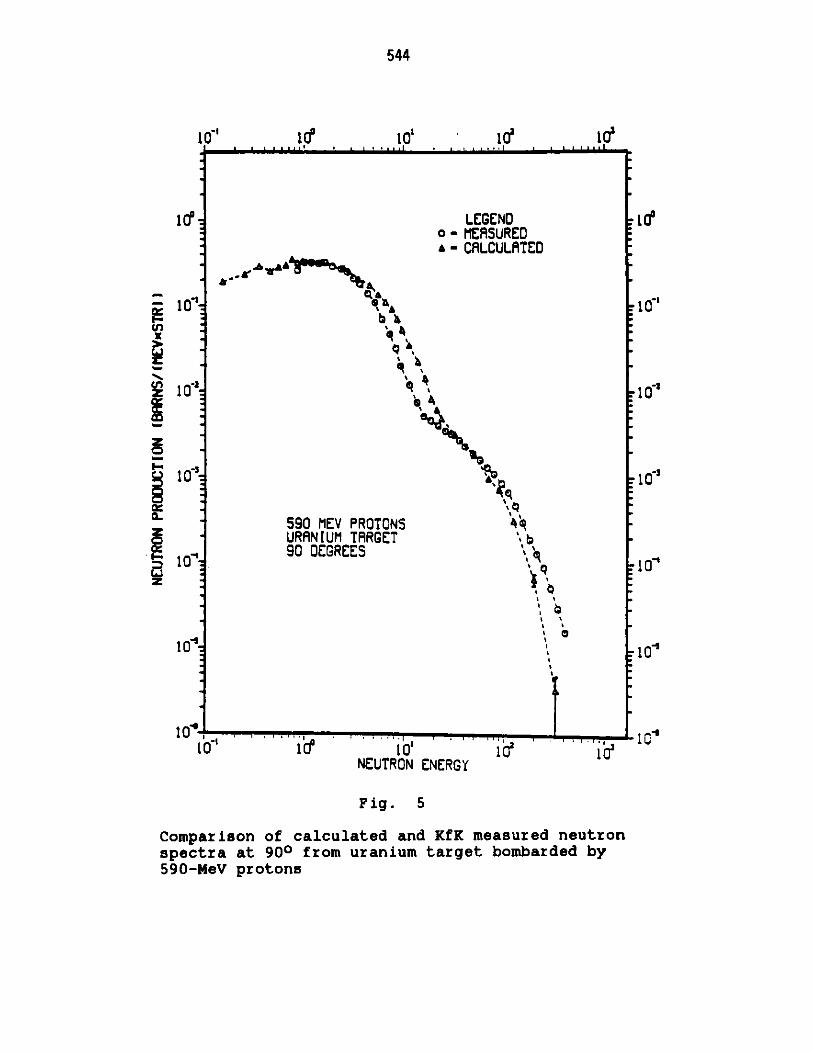
544
1 10 10210li sa
9 a ,aable * .. . I l t i
1 D- LEGEND0 - MEASUREDs - CALCULATED
law10~ 1010 104
CAL.A
590 MEV PROTONS-URANIUM TARGET ,,a
10-90 DEGREES \, q
- - 0i
10 ,1C~
10 ..
NEUTRON ENERGY
Fig. 5
Comparison of calculated and KfK measured neutronspectra at 900 from uranium target bombarded by590-MeV protons

545
10 ' 1 1010 10'
1 T LEGEND 1o-MEASUREDs - CALCULATED
-- 10 10~
U.. I..
10 10
590 MEV PROTONSURANIUM TARGET ' 4150 DEGREES I,
10~ 410
oi To, 10 ,
10"
10 - . 101i, . .- 0
10 U1T10 10a 10NEUTRON ENERGY
Fig. 6
Comparison of calculated and KfK measured neutronspectra at 1500 from uranium target bombarded by590-MeV protons
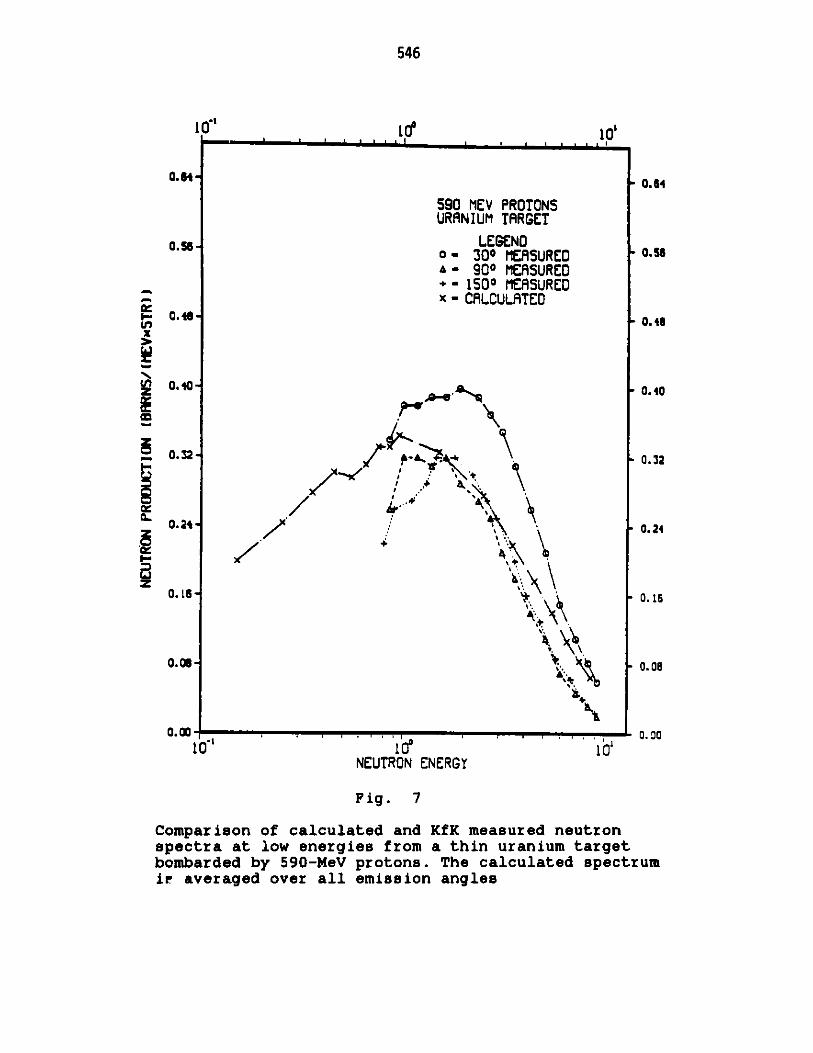
546
10' 10 10'
0.64 0.64
590 MEV PROTONSURANIUM TARGET
0.o6 LEGENDo - 300 MEASURED 0.56& - 900 MEASURED+ - 1500 MEASUREDx - CALCULATED
0.400.4x
0.32 - 0.32
;A':ll
0.24 02C0.2
0.16 0.16
0.0 00.08
0.00 b I0.00
! 0'NEUTRON ENERGY
Fig. 7
Comparison of calculated and KfK measured neutronspectra at low energies from a thin uranium targetbombarded by 590-MeV protons. The calculated spectrumie averaged over all emission angles

200.0 240.0
U,
-J
-J
1-0
I
C,,
10 -
-
10'-
10-
10--10 - I II I
o.n 40.n An. 0 MASS n iFn.UnBnn.EnMASS NUMBER
Fig. 8
Mass distributions predicted by RAL high-energyfission model for 300, 1000, and 2900 MeV protonson thin U-238 target
547
0.0 4 0.0 80.0
0- r CV0- 110 CVA- IC Pe
Y9
eT"
o
A .
10
0-2
10
10
r..r
da*a
24n. n
L I I I I 1

548
40.0 80.0 120.0 160.0 200.0 240.0
oRAL MODELJ0W41 MODEL"MEASURED
-)
U,Cr)
r
LJ
Li
Q
*, wo
,
10
-210 -
1040.0 80.0 120.f1
MASS NUMBER160.0 200.0 240. n
Fig. 9
Comparison of mass distributions computed usingRAL model, from ORNL model calculations /6/, andfrom measurements of Stevenson, et.al. /10/ for300 MeV protons on thin U-2?' target
0.0
"
1
1~
I I
-10'
--104
10'
UaI
0
0.0
1 1 l 1 1
1
4
1
1
1
1
1
1

549
40.0 W0.0 120.0 160.0 200.0 240.0
o RALM tDEL.. omL MDEL* MEASURED
NA
v.
t-
0
Ir
10
10
10440.0 80.0 Sgyn.o 6ISo.0 200.0 244.n
MRSS NUMBER
10~
10'
10~
Fig. 10
Comparison of mass distributions computed usingRAL model, from ORNL model calculations /6/, andfrom measurements of Friedlander, et.al. /11/ for2900 MeV protons on thin U-238 target
0.0
1
S-I
1
I U S
t? S
1,
o0
0 .c.n
L.

550
1 li
C. ". WITH FISSIONW WITHOUT FISSION
S10*- 1 0~LI
r
r -a 10 *
0
10, - -10
0~c- -'z
F-.
10o ,10-
-l
-J
c 1 0-+t0 ,0.0 4.1 8.0 121. o 1 F .200. r 240.n
MASS NUMBER
Fig. 11
Comparison of mass distributions with and withouthigh-energy fission taken into account for 1-GeVprotons on U-238
551
ICANS-VI
INTERNATIONAL COLLABORATION ON ADVANCED NEUTRON SOURCES
June 27 - July 2, 1982
MEASUREMENTS OF THE SPALLATION AND FISSION PRODUCT
PRODUCTION FOR DEPLETED URANIUM AND NATURAL LEAD
TARGETS BOMBARDED BY 1100 EV PROTONS
W. Amian, N.F. Peek*, D.J. Shadoan*
Institut fur Reaktorentwicklung
Kernforschungsanlage Julich GmbH
Postfach 1913
D-5170 Julich 1, Germany
*Physics Department, University of California,
Davis, California 95616
ABST)RtACT
In order to simulate the spallation source target, 3 cm diame-
ter by 1 mm thick disks of natural lead and depleted uranium
were irradiated at 1100 MeV proton energy. The targets were
inbedded between 5 cm thick bricks of the respective material.
Gamma-ray spectrometric methods of gamma-peak and half life
analysis were developed to deduce mass yield distributions of
the radionuclides produced. Both for lead and uranium fission
products have been observed. The mass yield distributions and
axial distributions of some isotopes are given. For lead the
total production rates of some isotopes within an 100 x 50 x
450 mm target block are given.

552
MEASUREMENTS OF THE SPALLAT I ON AND FISSION PRODUCTPRODUCTION FOR DEPLETED URANIUM AND NATURAL LEAD
TARGETS BOMBARDED BY 1100 MEV PROTONS
W. Amian, N.F. Peek*, D.J. Shadoan*
Institut far ReaktorentwicklungKernforschungsanlage Ji lich GmbH
Postfach 1913D-5170 Julich 1, Germany
*Physics Department, University of California,Davis, California 95616
INTRODUCTION
Development of a high flux neutron source utilizing the spal-
lation reaction necessarily involves extensive study of resi-
dual activity produced in the target material. To accomodate
this task, gamma-ray spectrometric methods have been developed
to deduce mass yield distributions for proton-induced spalla-
tion and fission reactions.
Measurements have been performed for thick targets of depleted
uranium and natural lead bombarded by 1100 MeV protons. The
axial distributions of the spallation and fission products ob-
served within an 1.5 cm radial interval around the beam axis
have been measured. Some of these results are given in this
paper. For the uranium target especially the depth dependent
production of Pu 239 by its precurson Np 239, the production
of U 237 and of the fission product Ru 103 are given.
Preliminary mass yield distributions have been evaluated for
1 mm thick target foils exposed to the proton beam at the sur-
face of the thick targets. Both for lead and uranium targets,
fission products have been observed.

553
EXPERIMENTAL PROCEDURE
The experimental procedures involved irradiation of relatively
thin, 1.0 mm thick, target foils embedded at equally spaced
intervals in a larger target whose physical dimensions were
similar to those of the proposed "infinitely thick" spallation
target wheel. Two target materials were chosen for investiga-
tion, natural Pb and depleted U. An 1100 MeV proton beam at
Saturne National Laboratory within the Centre d'Etudes
Nucleaires de Saclay with an average intensity of up to 80 nA
was used for irradiations. Once irradiated the target foils
were removed and counted using high resolution gamma-ray spec-
troscopy. The resulting data were recorded on magnetic tape
for subsequent computer analysis and isotope identification
/l/. Figure 1 shows the configuration of the Pb target in de-
tail. The first target foil shown was an aluminium foil (3.0
cm diameter by 1.0 mm thick) positioned 5.0 cm in front of the
main target assembly. In this position it was utilized to mon-
itor the incoming proton intensity. The next target foil (the
first Pb foil) was positioned directly in front of the main
assembly to receive full beam energy. Immediately behind the
first Pb foil followed a 1.0 mm thick aluminium plate used to
monitor the beam distribution.
The three target elements described above, Al foil, Pb foil,
and Al plate, constituted a repetitive unit and appeared a to-
tal of 10 times; each unit separated by a 5.0 cm thick Pb
brick. Individual target foils consisted of 3.0 cm diameter
by 1.0 mm thick natural Pb disks. These dimensions were chosen
as a compromise between adequate counting intensity and cor-
rections due to self-absorption and non point-source geometry.
Due to space limitations in the target area the total length,
554
45 cm, of the complete Pb target assembly was short of the
"infinite thickness", 65 cm, required to completely absorb
1100 MeV protons. Stopping-power calculations indicated an
energy loss of 700 MeV in 45 cm of Pb.
The uranium target foil assembly was identical except for two
instances. First, the entire target assembly was infinitely
thick at an overall length of only 35 cm and therefore the
number of uranium target foils irradiated was eight in one run
and nine in the next. Secondly, the uranium foils were vacuum
encapsulated in aluminum cases to prevent the escaping of ra-
dioactive gases.
The data collection system included high resolution gamma-ray
analysis electronics in conjunction with a 80 cm3 Ge(Li) de-
tector and an automatic sample changer mounted on rails to
vary the distance to the detector easily. The detector was in-
closed in lead shielding, 10 cm thick. The background due to
photons with energies less than 100 keV, such as lead x-rays
were excluded from the spectra by a lower level discriminator.
The detector was calibrated against IAEA and PTB standard re-
ference sources with + 2 % accuracy. The cross sections used
to determine the number of protons striking the target for the
respective proton reactions on aluminium are given in table
1. These have been taken from a review paper of Cummings /2/.
DATA REDUCTION
The gamma-ray spectra are analyzed by the computer code
AGAMEMNON /3/. All spectra are corrected especially for energy
calibration drift. The half life analysis and nuclide identifi-
cation code YELLOW /4/ is then applied to the peakfit results.

555
YELLOW sorts the outputs of AGAMEMNON by energy and time,
plots the calculated activity for each peak-energy group as
a function of time and identifies the reaction products based
on their half lifes and known gamma-ray transitions. Besides
the activity-time plot the system prints a list of all candi-
dates which fit the experimental points best. The resulting
decay curves of the best candidates are drawn in the graph
(Fig. 2). If the decay is of parent-daughter nature, this is
taken into considuation. Any number of overlapping nuclides
may be taken into account, experience, however, revealed that
a maximum of three is sufficient (for parent daughter decay,
six).
Finally the program outputs the complete list of candidate nu-
clides ordered by atomic number and mass number (Fig. 3). The
number of nuclei produced as calculated by the half life analy-
sis is given for each of the isotope's gamma-ray transition
lines. To accept a condidate nuclide the dominant gamma-ray
transition lines have to fit the decay curves at the respec-
tienergy most probably and these results have to agree
within the experimental errors stated for the number of nu-
clei. These errors include besides the statistical errors of
counting the fitting errors of the peakfit and the error of
the half life analysis. For dominant lines this is typically
no more than 5 %. The list of candidate isotopes is derived
from the compilation of Erdtmann and Soyka /5/, however the
list of perent nuclei had to be enlarged for our purposes. For
letargets the library is scanned from atomic number Z - 4(Be)
up to Z - 84(Po), for uranium up to Z - 94(Pu).
All results give~ pave been corrected for decay during irradi-
ation and for gamma-ray attenuation in the sample.

556
EXPERIMENTAL RESULTS
Figures 4 and 5 show the axial distributions of Pt-191, Os-185,
Y-88, Pb-203 and Hg-203 within 1,5 cm radial interval around
beam axis.
The total number of reactions per proton within the target can
be estimated by these data and by the measurements of the beam
profile performed by looking at the Na-24 distribution on the
aluminium plates inserted into the target. Table 2 gives the
mean and FWHM of the vertical Gaussian beam profile, the Na-24
intensity and the fraction of the beam hitting the 3 cm-diame-
ter target. The value of 15 % at a depth of 45 cm is near to
a homogeneous activation of 14.1 % (target area/total area).
The results of these calculations are given in table 3.
Figure 6 shows the number of reactions per proton and per
(g/cm2) for a lead foil at the front target face for various
mass numbers. A distinction has been made between de-excita-
tions from proton rich (,8+,e) and neutron rich (B) states,
respectively. Starting from the mass of the heaviest lead iso-
tope (208) the production of radioactive proton rich isobars
increases sharply to a mass number at 200 (stable isotopes may
be produced in addition) and drops off about two orders of
magnitude to a mass number of 140. At masses < 110 neutron
rich fission products seem to be produced in competition with
proton rich isobars.
The axial distribution of the fission product Rh-103, the
Pu-239 precursor Np-239 and of the spallation product U-237
for the lead target bombarded at 1100 MeV proton energy are
shown in figure 7. The distribution of Rh-103 is representa-

557
tive of the number of fissions and therefore for the energy
deposition.
Figure 8 shows the number of reactions per proton and per
(g/cm2) for a uranium foil at the front target face for vari-
ous mass numbers. Again a distinction has been made between
neutron rich and proton rich isobars. The neutron rich isobars
at masses between 85 and 155 are the normal fission products.
Their distribution has the expected shape. Proton rich isobars
are produced in that region, too, but at a one order of magni-
tude lower rate. In the gap between mass numbers 160 and 190
no nuclides could be identified with certainty. The gap be-
tween mass number 210 and 230 is not accessible to 7-spectro-
metry, because the nuclides are short lived a-emitters.*
It can be assumed, that the fissions observed are mainly due
to neutrons. This is shown in figure 9 where the axial distri-
butions of the fission products Ba-140 and Nd-147 and of the
proton rich product Xe-127 are compared to the results for a
foil exposed to the proton beam 20 cm upstream from the tar-
get. While the production rates for the fission products drop
off sharply, the one of Xe-127 remains nearly unchanged. This
result however, should be taken qualitatively only, because
the neutron flux in the upstream position is not known from
experiment.
*By integration of the distribution for neutron rich fissionproducts using Simpson's Formula and relating it to 200 %yield an absolute yield of (5 + 2) % for mass 103 was estima-ted. Multiplying the numbers for Ru 103 in figure 9 by 20gives the axial distribution of fission in the uranium targetblock in an 1.5 cm radial interval around beam axis.

558
CONCLUSION
The experiments described in this study allow to measure the
axial distributions within natural lead and depleted uranium
targets for those spallation and fission products, which show
dominant v-ray lines. Because no chemical separations are done
the gamma-ray spectra contain numerous overlapping peaks. The
presence of a nuclide like Lu 170, having 596 known gamma-ray
lines, in the spectra of the lead targets illustrates this
fact. This is why the analysis of the spectra necessarily
calls for extensive studies of the half lifes identifiable.
For both target materials preliminary mass yield distributions
have been evaluated for 1 mm thick target foils exposed to the
proton beam at the surface of the thick target blocks. Fission
products have been observed in each case.
For uranium the shape of the fission product disterbution for
neutron rich isobars seems to imply the fission by low energy
neutrons in competition to high energy particle processes.
This is more substantiated by the fact, that a target foil ir-
radiated 20 cm apart from the thick target shows a relatively
higher decreas in the formation of neutron rich fission pro-
ducts as compared to proton rich fission products.
It is planned to compare our experimental data with calculated
predictions using the Monte Carlo code HETC.

559
REFERENCES
/1/ N.F. Peek, D.J. Shadoan, W. Amian
Gamma-ray measurements of isotopes produced
by 1.1 GeV protons on lead and uranium targets
ICANS-V, Julich 1981
/2/ J.B. Cumming
Annual Review of Nuclear Science 13 (1963) 261
/3/ W. Amian
AGAMEMNON - a computer code to analyze complex
gamma-ray spectra
(in preparation)
/4/ W. Amian, N.F. Peek, D.J. Shadoan
Gamma-ray spectrometric product identification
and half life analysis from proton induced
spallation and fission reactions of lead and
uranium
ICANS-V, Jilich 1981
/5/ G. Erdtmann, W. Soyka
The gamma-rays of the radionuclides
Verlag Chemie, Weinheim and New York 1979

Fig. 1: Target configuration showing the small target disk followed by an aluminum disk and an
aluminum plate along with the 5 cm thick Pb brick.
U,
0

561
ENERGY. 1098.94224/1
U
3-
13
0
PT 188 --- > 77 IR 188
P0 206 -- >-- > 83 81 206
2 4
TIME SINCE E08 / HRS.10.30 0 A0. 9.49E.03.- 3.37E.00
-- > 1.73 0 AU. I.52E.01- 1.61E.04 CHI. 1.50E.028.83 0 AO. 1.47E+04.- 8.53E.01--30 6.24 0 AO. 1.95E-02"- 7.10E+04 CHI. 1.15E02
' *m03
ENERGY ERROR CORR1098.94 0.62 I.051E+00
10 S-EO LIVETIME 2 RESIDUE CPS ERPOR CTS/S ENERGY FHM EFFICIENCY OTCORR72UI 7530 1.593E+02 5.820E+02 4.834E.00 5.020E+02 3.991E+03 1098.37 2.723E+00 5.865E-04 1.080E.0072U1 7558 2.334E+02 1.506E+03 2.596E+00 3.510E+02 4.981E+03 1098.58 2.598E.00 5.865E-04 1.050E.0072UI 7589 4.289E+02 4.622E+03 2.469E.00 2.482E+02 4.637E+03 1098.76 2.668E+00 5.865E-04 1.022E+0072UI 7636 6.954E+02 8.364E+03 1.797E+00 2.445E+02 3.260E+03 1098.62 3.130E+00 5.865E-04 1.011E.0072U1 7640 7.083E+02 8.551E+03 1.831E.00 2.715E.02 3.244E.03 1098.66 3.111E.00 5.865E-04 1.011E.0072U1 7698 1.383E+03 1.928E+04 2.595E+00 6.219E+01 1.149E.03 1099.30 2.604E.00 5.865E-04 1.004E+0072U1 7702 1.415E.03 1.984E.04 2.571E.00 6.150E.01 1.158E.03 1099.24 2.621E+00 5.865E-04 1.004E.0072U1 7767 2.806E+03 3.351E+04 1.786E+00 2.203E+01 4.200E+02 1099.19 2.682E.00 5.865E-04 1.002E.0072UI 7819 4.868E+03 6.398E.04 1.046E+01 6.765E+00 9.430E.01 1099.36 2.709E+00 5.865E-04 1.000E.0072U1 7855 6.798E+03 8.640E.04 4.165E.00 3.385E+00 2.726E+01 1099.34 2.378E.00 5.865E-04 1.000E+00MLF 8.30E+02 HRS AU " 4.95E+03 I/SEC LOGlO3AO.SEC3 " 3.69E.00 CH12 * 2.00E.00Y0-LONG- * 3.12E+03 1/SEC AO-SHORT- 2.72E+03 I/SEC HLF-LONG- - 9.75E+02 HRS MLF-SHORT- . 8.37E+02 HRSCHISQR-L- 5.15E-01 CHISOR-S- * 1.61E.01AO-LONO- .1 2.21E+03 *- 2.36E+031 1/SEC HLF-LONG- .3 1.08E+03 +- 3.69E+021 HA0-SHORT- .I 5.63E.03 +- 2.92E+031 I/SEC HLF-SHORT- .3 3.54E+02 +- 2.80E.021 H CHISOR S.SOE+00
1098.94 224 HALFLIFE HLF/H AO (E-E01/N DECAYEIII 26 FE 59 4.51E+01 0 I.08E.03 3.56E.03 I.11E.00 1.29E-02CHISOR. 3.79E.01" - 2.28E.02
E423 38 SR 83 1.35E"00 U 3.24E"01 6.36E+18 O9.0E-01 6.91E-64CHISOR. 2.63E"05 - 4.08E+17
DAUGHTERS: R8 83 KR 83H
E322 77 IR 168 1.73E.00 0 2.47E"02 9.49E.03CHISOR. I.50E+02 +- 3.37E"00
7.56E-0I 5.27E-09
E221 83 81 206 6.24E00 0 2.12E+02 1.47E.04 9.39E-01 2.21E-10CHISOR. 1.15E"02 +- 8.53E"01
1/10 PEAK NR LINE
I.00E.00 1098.94 224 1099.221291.47 249 1291.56190.59 23 192.34140.66 11 142.65336.24 63 334.80
6.58E-01 511.61 99 511.000.00 0 762.50
381.51 71 381.50778.14 154 778.40423.99 82 423.50388.57 73 389.20
1098.94 224 1098.00
6.88E-01 154.44 14 155.03631.67 123 633.10477.82 94 478.10
0.00 0 2214.601209.73 241 1210.00633.67 123 635.00
1098.94 224 1097.00
9.94E-01 803.39 162 803.05881.33 181 881.00515.62 100 516.10
1719.21 290 1718.65537.56 105 537.43341.97 64 343.50182.81 20 184.00497.25 98 497.20894.99 184 895.00
1098.94 224 1098.20
o PO 206 6- 8.83 0 AG. 6.86E+03"- 1.14C.02--P 83 81 206 --j 6.21 0 A0. 3.91E-03"- 5.51E02ANO 26 FE 59 I.0E+03 H AU. 2.36C.03"- 6.64E01 CHI. 1.71C.00
PT I6 --> 10.30 0 0U. 5.65E03"- 2.54E+02--b 77 IR 188 --3 1.73 0 AU. 1.17E-02+- 4.31E+02ANO 26 Ft 59 1.06E+03 H 40. 2.46E03.- 8.91E0I CHI. 7.386E00
38SR 83 3.24E01 H A0. 6.86E.04"- I.18E+04AND 26 FE 59 1.08E.03 H A0. 2.89E.03+- 1.78E.02 CHI. 2.92E.01
Fig. 2: Decay plot and typical output information of YELLOW
INTENS5.65E.03A4.32E+OIA3.1 E+OUAI.03E.OOA2.60E-OIA
5.40E.01A3.OUE.01A2.20E.01A1.80E+00A3.60E+OOA1.60E.UOA2.00E-OIA
3.34E01A2.16E01AI.60E.OIAI.30E.DIA6.75E.UOA5.80E.OOAI.35E+0OA
I.00E.02A6.76E.OIA4.OOE.OIA3.40E+DIA2.90E+0IY2.40E.OIAI.92E+01AI.55EOIAI.53EOIAI.33E+01A

562
40 ZR 95 6.440E+01 0 5.564E+06 SEC 1.546E+03 HDAUGHTERS' NB 95MNB 95GENESE' NFl 6.500 NTH ZR 94 NFA MO 98PARENTi O.000E+0OPARENT2' 0.000E+004 LINES
ENERGY NUCLEI SIGMA PARENT SIGMA CHISOR PAGE PARENT724.18 44.2000A ElsZOaOOs-'EI'- 724.31 7.61E+11 3.85E+10 0.OOE+00 0.OOE+00 6.07E-01 143 0756.72 54.8000A ElaZOs:O-E1'- 756.85 7.56E+11 3.67E+10 0.OOE+00 0.OOE+00 1.44E+00 150 0
1 LINES MISSING UITH TOTAL INTENSITY OF 0.0200
44 RU 103 3.935E+01 0 3.400E+06 SEC 9.444E+02 HDAUGHTERS, RHIO3MGENESE. NTH RUI02 NFl 3.090 NFA RHI03PARENT1' 0.000E+00PRRENT2' 0.000E+00
23 LINESENERGY NUCLEI SIGMA PARENT SIGMA CHISOR PAGE PARENT
294.98 0.2420A E8aZIsOOs-'Z1<- 294.36 1.01E+12 2.23E+11 0.00E+00 0.00E+00 1.57E+00 51 0317.72 -1.000OA443.80 0.3110A E5 Zmo0s-'Zm'- 444.70 1.88E+12 1.74E+11 0.00E+00 0.00E+00 8.63E+00 87 0497.08 86.4000A EIaZOs00m-'E1- 497.25 1.03E+12 5.37E+10 0.00E+00 0.00E+00 8.35E-01 98 0557.04 0.7600A EaZ4s400s-'Z4'- 557.65 1.11E+12 7.84E+10 0.00E+00 0.OOE+00 1.72E+00 110 0610.33 5.3000A EIsZOa00-'E1'- 610.55 9.98E+11 5.66E+10 0.00E+00 0.00E+00 1.36E+00 119 013 LINES MISSING WITH TOTAL INTENSITY OF 0.1790
57 LA 140 4.027E+01 H 1.105E+06 SEC 3.070E+02 HDAUGHTERS,GENESE' NFl 6.300 NTH LR139 NFA CE140PARENTI BR 140 1.279E+01 0PARENT2' 0.000E+0041 LINES
ENERGY NULLEI SIGMA PARENT SIGMA CHISOR PAGE PARENT131.12 0.5300A EaZOsOOs->Eu<- 129.67 1.83E+15 3.19E+14 0.00E+00 O.OOE+00 8.41E+02 7 0241.96 0.421OA E2sZOs00:->E2'- 242.22 4.99E+11 1.54E+11 0.00E+00 0.00E+00 2.05E-01 38 0266.55 0.5200A E4sZmsOO->Zm'- 267.64 2.28E+06 7.38E+08 1.68E+07 2.74E+09 5.62E+00 45 1328.75 18.5000A E1sZOsDOs-'EI'- 329.02 6.68E+07 1.26E+11 5.28E+11 3.28E+09 5.13E+00 61 143?.55 2.9800A E1sZIsDO ->Z1- 432.80 5.48E+04 2.23E+07 5.09E+11 1.04E+08 1.01E+00 84 1487.03 43.0000A E1ls Z Oa->Z1<- 487.45 2.35E+08 3.47E+09 5.12E+11 7.17E+09 1.13E+00 96 1510.95 0.3500A E6sZ' sO0->ZE<- 511.61 4.95E+13 2.35E+12 2.99E+13 1.52E+12 3.86E+00 99 1574.20 -1.0000751.79 4.1900A E1ZOsOOs-'E1- 751.81 1.54E+07 1.27E+11 5.25E+11 3.51E+09 6.36E+00 149 1815.80 22.3200A E1lZ1s00->Z1- 816.21 2.96E+06 3.08E+08 5.23E+11 8.22E+08 8.29E+00 167 1867.86 5.3600A E1aZIsOOs-'Z1- 868.02 7.62E+04 1.34E+08 4.99E+11 6.02E+08 1.65E-01 178 1919.60 2.6100A E1aZ1sDOs->Z1'- 919.57 2.82E+05 3.57E+06 4.97E+11 1.67E+07 2.52E+00 192 1925.25 6.9200A EluZ3sO:s-'Z3'- 925.52 3.16E+08 1.40E+09 4.96E+11 2.98E+09 2.66E+00 194 1951.02 0.4900A E3sZ6sOO-'Z6- 951.95 1.65E+06 3.20E+09 4.10E+09 1.50E+10 6.25E+00 199 11085.20 -1.00001596.20 95.4700A E21:aZDOs-'Z1- 1596.61 1.37E+04 1.58E+09 5.15E+11 7.42E+09 2.64E-01 282 1
16 LINES MISSING WITH TOTAL INTENSITY OF 0.4300
-- - - - - - - - - - - - - - - - - - - - - - - - - -- - - - - - - - - - - - - - - - - - - - - - - - -
Fig. 3: List of candidate nuclides

Pt 191
Os 185
Y 88
U U
30 40 50
DISTANCE FROM TARGET FRONT FACE (cm)
Fig. 4: Axial distributions of Pt191, Os185 and Y88
within an 1.5 cm radial interval around beam axis
563
E
C,
0 10 20
10-4-
10-6 -
10~7-

564
E
10~
0 - .
10-6 .
10-7 -
Pb 203(PLATE)
Pb 203 (CYLINDER)
Hg 203 (PLATE)
Hg 203 (CYLINDER)
10DISTANCE
20FROM
30TARGET
40
FRONT50
FACE (cm)
Fig. 5: Axial distributions of Pb203 and Hg203 within an
15 mm diameter cylinder around beam axis and within
an 100 x 50 x 1 mm plate
0
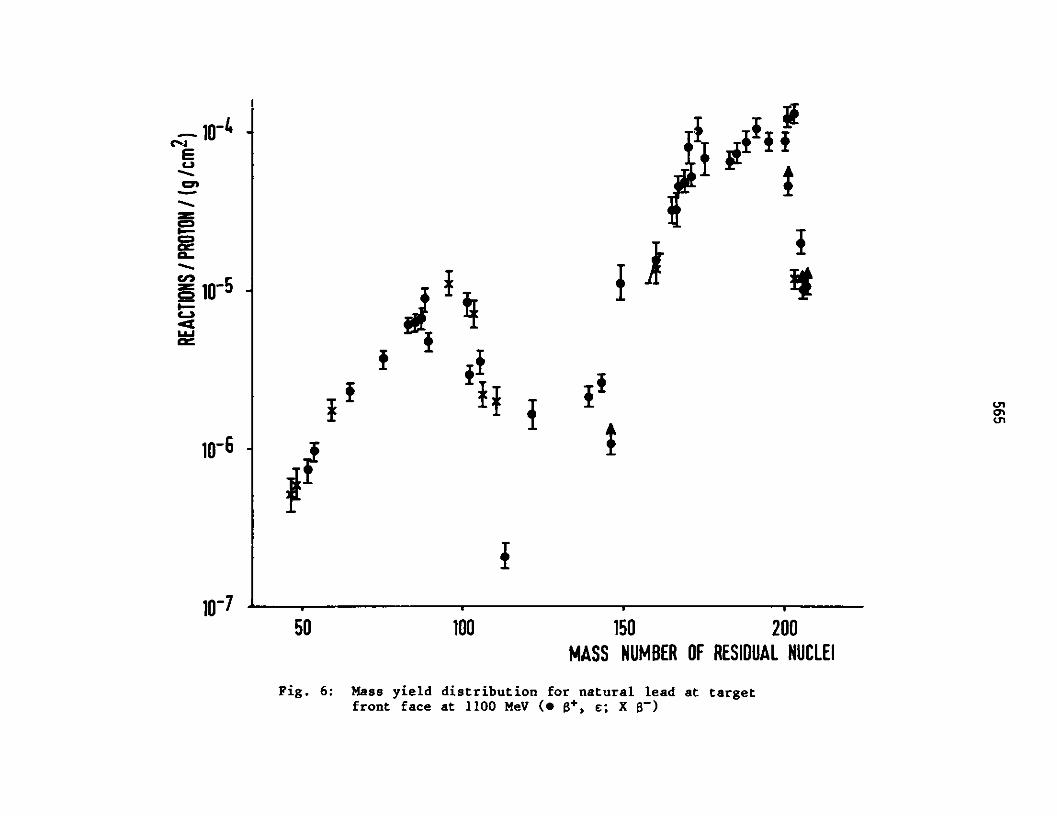
- 10-4
E
0 - .
10-6.
50 100 150MASS NUMBER
Fig. 6: Mass yield distribution for natural leadfront face at 1100 MeV (" 8+, E; X g')
200OF RESIDUAL NUCLEI
at target
f
ii
-
fM,U,
10-7

566
E-
LIJ
Np 239
U 237
Ru 103 fp
0 10 20 30 40
DISTANCE FROM TARGET FRONT FACE (cm)
Fig. 7: Axial distributions of Np239, U237 and Rul03 within
an 1.5 cm radial interval around beam axis. The
distribution of fissions is ti 20 times that of Rul03
(uranium, 1100 MeV)
10-6

I
t '
I*
E
C,,
NZ-
I I;I
*
I
iJ.
50 100 200150
MASS NUMBER OF RESIDUAL NUCLEI
Fig. 8: Mass yield distribution for depleted uranium at targetfront face at 1100 MeV (" 8~; X g+, e)
I 4CA7
238
111

568
E
1-5
1O-6
10-7
Xe 127BX1.0-'Loa140 fp
Ndl47fp low yield
-20 0 10 20 30 1.0
DISTANCE FROM TARGET FRONT FACE (cm)
Fig. 9: Axial distributions of Ba140, Nd147, Xe127 compared to
thin foil results 20 cm in front of the target
(uranium, 1100 MeV)
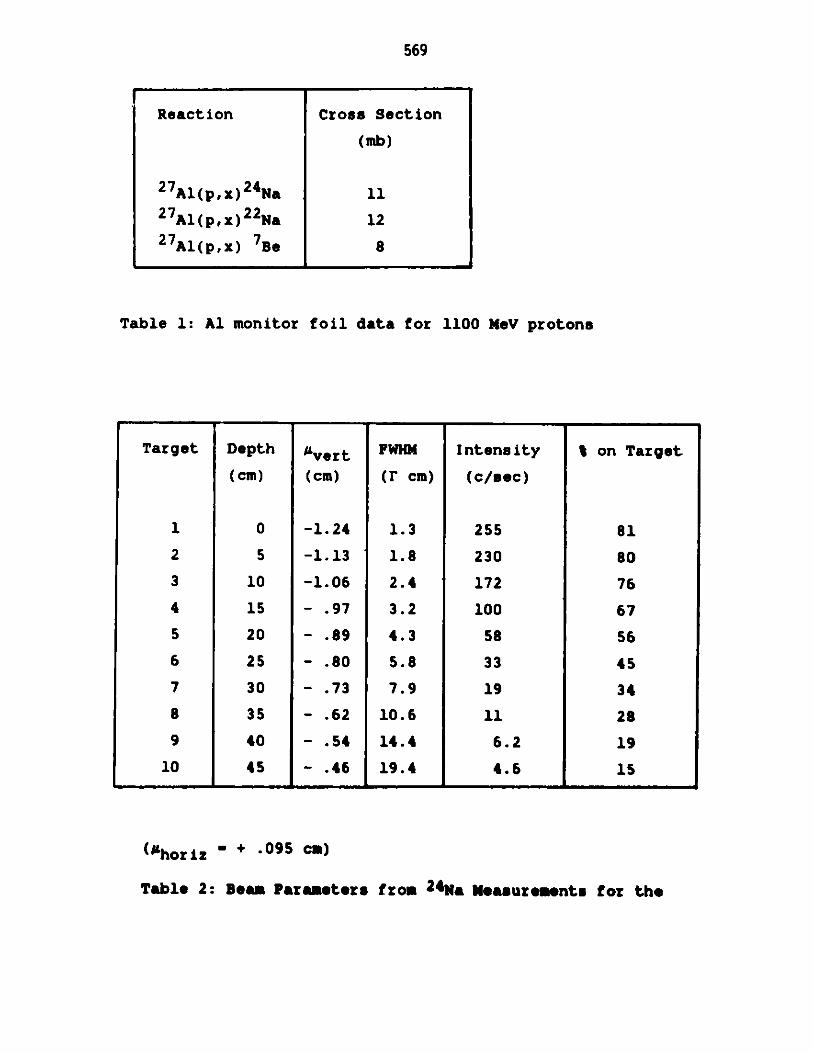
569
Table 1: Al monitor foil data for 1100 MeV protons
Y V U U
Depth
(cm)
0
5
10
15
20
25
30
35
40
45
Avert
(cm)
-1.24
-1.13
-1.06
- .97
- .89
- .80
- .73
- .62
- .54
- .46
FWHM
(T cm)
1.3
1.8
2.4
3.2
4.3
5.8
7.9
10.6
14.4
19.4h 1I
Intensity
(c/sec)
255
230
172
100
58
33
19
11
6.2
4.6
% on Target
81
80
76
67
56
45
34
28
19
15
(horiz - + .095 cm)
Table 2: Beam Parameters from 2 4 Na Measurements for the
Reaction Cross Section
(mb)
27Al(p,x)24Na 112 7Al(px)2 2Na 1227 A1(px) 7Be 8
Target
1
2
3
4
5
6
7
8
9
10

570
*numbers estimated to be correct within a factor of two
Estimated activities at saturation for some dominant
a-emitters
Half life
6.1 1011a
2.0 101 5a
2.0 10 1 5 aI L
Activity
at Saturation
(KBq/nA)
180
140
130
Table 3: Activity at saturation per nA proton current of1100 KeV within a 45 cm long, 10 cm * 5 cm arealead target
Nuclide Half life Activity
at Saturation*
(MBq/nA)
Hg 203 46.6 d 20
Pb 203 52.1 h 380
Tl 201 73.5 h 220
Pt 191 2.8 d 190
Os 185 94.0 d 110
Re 183 71.0 d 120
Zr 95 64.0 d 20
Y 88 108.0 d 11
Nuclide
Pt 190
Os 186
Hf 174

571
ICANS - VI
INTERNATIONAL COLLABORATION ON ADVANCED NEUTRON SOURCES
June 27 - July 2, 1982
CASCADE NEUTRON YIELDS FROM ENERGETIC
HEAVY ION INTERACTIONS
Marcel M. Barbier
Marcel M. Barbier, Inc.
ABSTRACT
Experimental data on heavy ion production of cascade neutrons (neutron
energy above 20 MeV) is collected and reviewed. Cascade neutron production
figures per unit solid angle are given as a function of emission angle for
projectiles up to Ar 40 and incident energies up to 2100 MeV/AMU. Total
cascade neutron yields per event are derived and found not to increase when
going to heavier projectiles.

572
CASCADE NEUTRON YIELDS FROM ENERGETIC
HEAVY ION INTERACTIONS.
Marcel M. Barbier
Marcel M. Barbier, Inc.
1. NEUTRON DIFFERENTIAL PRODUCTION CROSS-SECTIONS.
There has been numerous measurements of neutron production by protons,
light, and heavy ions, which are in part reported in the bibliography. In
order to compare them, we have plotted the cascade neutron single differential
cross-sections00
---- f -------- barn/sterad
d~z dCSSas a function of neutron emission angle 6 in fig. 1. In the forward direction
(0= 0) there is generally a peak, whereas between 150 and 1500 the data
can in most cases be approximated by an exponential with angle of the form
exp (-k 8), where k (rad-1 ) can be found from the figure.
Fig. 2 groups recent data collected by measurement at the Berkeley
Bevalac. Some of these curves are proton production measurements, upgraded
by the neutron proton ratio in the target nucleus. One sees that as the
energy and the masses of the projectile and target increase, there tends to
be more cascade neutrons produced, and more neutrons are produced at
larger emission angles.
2. NUCLEAR REACTION CROSS-SECTIONS.
Is is useful to have a value for the nuclear interaction cross-section,
which is approximately the inelastic one ;Iinel, as this serves to calculate the
yield at each angle, which is the neutron differential cross-section d6/df
divided bydlnel. We have used the values published by Barshay, Dover and Vary
and drawn by extrapolation the graph given in fig. 3 which gives approximative
values of6el as a function of projectile and target masses Ap and AT.

573
---.-
0- - - -.
'17 .~.rt tz . ....
S. tIi... .... - - . -.
.- -- - - - - -- --
tr.
ri
.. a.,., a ., s --. .. .
'4r-
i
'rrl-mot'
22=23 US

574
barnVS
E>a oto.
I.
aJ
r:. i :3
d ~ - -F--.-. ___________________________________________________I--I----. I -
* 1~-1z-*---'---'--::::~2:z2:2::1 ::~ - -4---
-- - - I h~ 4-
.. .. - - --- - -
p: o
wo~~ .e .1
- -
1~11 .. .J
- *
- -I - - ;
\ra'

575
4
A
c
1;ME
4
a a % a slqik A

576
The (nel values given are smaller than the geometric cross-sections. It is a
recognized fact that grazing incidence (tangential nuclei) is not enough for
inelastic interactions to take place: there must be a volume common to both
nuclei.
3. CASCADE NEUTRON YIELD.
The cascade neutron yield at a given angle, as mentioned previously, is
given by:
. neutron/sterad
The division of the d'/dSvalues by finel has the advantage of grouping the
numerical values together. Excepting the forward direction, where neutron
emission is always enhanced, the yield then takes the form:
=e)O/s*a
wherero is a mathematical quantity describing the practically exponential
decay with 9 between 150 and 1500. Practically, it is the intersection of
the straight line on linear-log paper with the ordinate axis at 9 = 0.
4. TOTAL NUMBER OF CASCADE NEUTRONS PER INTERACTION.
To compare cascade neutron production from various projectiles, targets
and energies, it is convenient to take in a simplistic fashion the total neutron
production as a figure of merit. This is obtained by integrating the yieldmultiplied by the proper solid angle differential at each angle over all angles:
N =Y=) 2WX fe& sing0dO
= 2ir (-le )/(4*e ) '=2mYo, (1 + k 2)

577
The values obtained are plotted in fig. 4 as a function of projectile
incident energy for various projectiles and targets.
5. ENERGY DEPENDENCE.
A pattern seems to emerge from fig. 4. which suggests an energy
dependence following the expression E 0-3 in most cases.
6. PROJECTILE, TARGET DEPENDENCE.
The total neutron production N extrapolated or intrapolated fromfig. 4 at a common energy of 1,000 MEV/AMU is shown for all targets as a
function of projectile mass up to Ar 40 in fig. 5. Neutron production, which
begins to increase with projectile mass up to carbon 12, shows a systematicdecrease for all targets when going to projectile mass 20 (Neon). This could
be explained by the fact that channels involving creation of charged fragments
carrying neutrons with them (such as deuterons, alphas and other light atoms)tend to be favored when the projectile mass increases.
As of now there are no known production measurements with projectiles
above Ar 40. It would be useful to do such measurements, with heavier
atoms in the future.
Pending such measurements, theoretical calculations such as the fire
streak and fireball calculations can be applied. Dr. Walt Schimmerling at
Berkeley has told me that he is working with Professor Meadey of Kent
University on deriving theoretically a formula which will give the inclusive
neutron production as a function of projectile and target masses. Inclusive
refers in this case to the total number of reaction channels which produce at
least one neutron (and in some cases more).
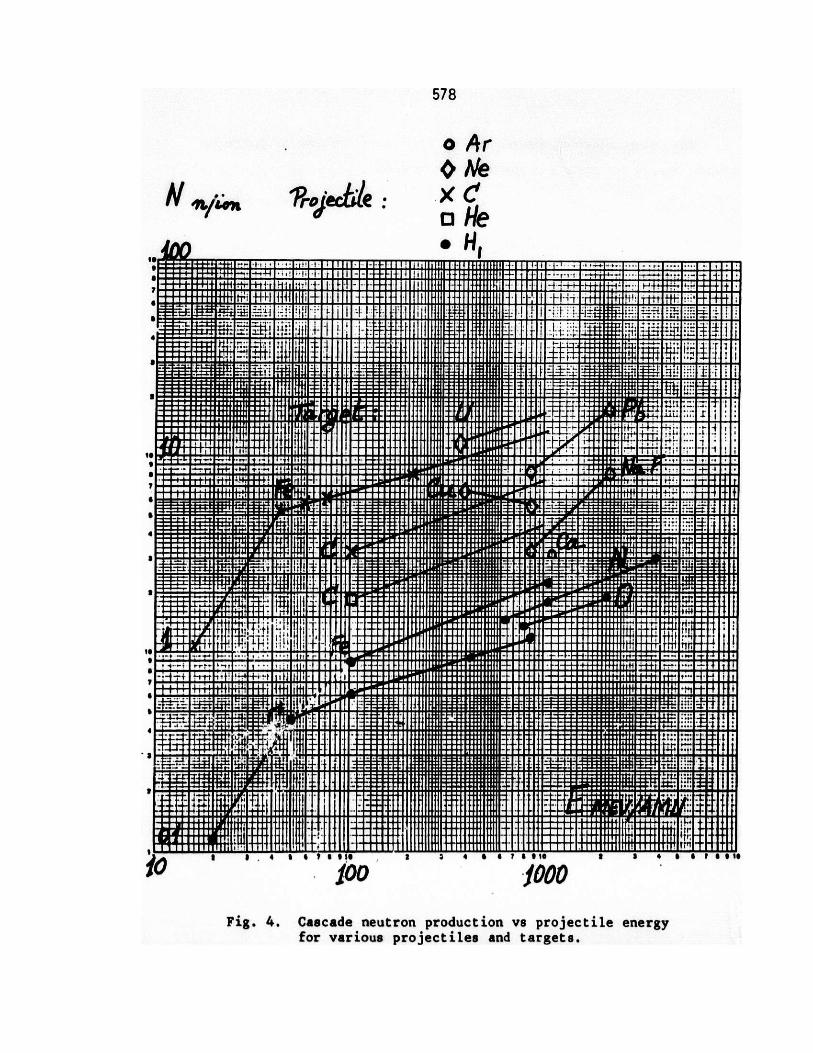
578
'rojefibe
i~ -- -+- ;4
tet
1~~ '
-! * Pt t - -
-" - ,-- - - - ;-
a -r 1 I .H - n -
-LLI
100
o ArA Ne
xaoHe
H,
2 3 4 " 67 6 210
1000
Fig. 4. Cascade neutron production vs projectile energyfor various projectiles and targets.
4wo
" a " t t n t g ig
N n/a
io

579
'1I
6- -. r - - - - - - -
IF -.7 -F- .-- .-
4 . J
- +.- - -t -- T . -
- r - - -1 - - -- . - -- : :
a
- -
... i. -- -- - - .
. .... . 7.
14
4. 7 - . ... . .. .-. ......T
. .I .--I- --
- Figure Cascade Neutron Production at 1000 BV/AMU v. Projectile Masfor Various Targets.
L ..- ;
F- .. -U - oe- t- +e ---.. - --,;IE E ----e b
flTirtlT'f II I *111 **~ I
- senseenseenmaseaseEssammessusammasse
- I :: ;1 1--p . s.-- g : -Till

580
BIBLIOGRAPHY.
R. G. Alsmiller Jr., R. T. Santoro, J. Barish, Shielding Calculations fora 200 MeV Proton Accelerator and Comparison with ExperimentalData, Particle Accelerators 1975, Vol. 7, pp. 1-7.
T. M. Amos, Jr., Neutron Yields from Proton Bombardment of Thick Targets,Thesis, Department of Physics, Michigan State University, EastLansing,1972.
S. Barshay, C. B. Dover, J. P. Vary, Nucleus-Nucleus Cross-Sections and theValidity of the Factorizatior. Hypothesis at Intermediate and HighEnergies, Phys. Rev. C, Vol 11, No 2, Feb. 1975, pp. 360-369.
H. W. Bertini, Secondary Particle Spectra from the Interaction of 30-340MeV Protons on Complex Nuclei ORNL-TM-1652, Feb. 27, 1967, OakRidge, TN.
H. W. Bertini, Preliminary Data from Intranuclear-Cascade Calculations of0.75-, 1-, and 2-GeV Protons on Oxygen, Aluminium and Lead, and 1-GeV Neutrons on the same Elements, ORNL-TM-1996, Oak RidgeNational Laboratory, December 1967.
H. W. Bertini et al., HIC-1: a First Approach to the Calculation of HeavyIon Reactions at Energies above 50 MeV/Nucleon, ORNL-TM-4134,Jan. 1974.
H. W. Bertini, T. A. Gabriel, R. T. Santoro, Predicted Proton Spectrum atForward Angles for 29.4 GeV Nitrogen on Carbon, Phys. Rev. C,Vol. 9, No. 2, Feb. 1974.
H. W. Bertini, R. T. Santoro, O. W. Hermann, Calculated Nucleon Spectra atSeveral Angles from 192-, 500-, 700-, and 900- MeV 12 C on 5 6 Fe,Phys. Rev. C, Vol. 14, No. 2, Aug. 1976.
H. Blosser, private communication 1980, Michigan State University, EastLansing.
R. Deltenre, European Organization for Nuclear Research, Geneva, Switzerland,private communication, 1971.
W. Everette, Differential Neutron Production Cross-sections vs. Angle forNeon, C, NaF, Cu, Pb, U, unpublished, private communication, LawrenceBerkeley Laboratory, 1982.
D. Graham Foster, Los Alamos Scientific Laboratory, private communication,1979.
T. A. Gabriel et al, Calculated Secondary Particle Spectra from Alpha-Particle- and Carbon-Induced Nuclear Reactions, ORNL-TM 4334, Oct.1973, Oak Ridge, TN.
J. Gosset, J. I. Kapusta, G. D. Westfall, Phys. Rev. C 18, 844, 1978.

581
M. C. Lemaire, S. Nagamiya, 0. Chamberlain, G. Shapiro, S. Schnetzer, H. Steiner,I. Tanihata, Table of Light Fragments Inclusive Cross-sections in RelativisticHeavy Ion Collisions, Part I, LBL-8463 UC-34c, Berkeley, Nov. 1978.
Ph. Tardy-Joubert, Etude du Rayonnement Autour d'un Acceldrateur deHaute Energie, CEA-R2975, CEN Saclay, France.
A. Sandoval et al., Spectra of p, d, and t from Relativistic Nuclear Collisions,LBL-8771, Berkeley.
R. T. Santoro, private communication, Engineering Physics, Oak RidgeNational Laboratory, May 1981.
W. Schimmerling et al., Measurement of the Inclusive Neutron Production byRelativistic Neon Ions on Uranium, Phys. Rev. Letters, Vol 43, No. 27,Dec 31, 1979.
J. W. Wachter, W. R. Burrus, W. A. Gibson, Neutron and Proton, Spectrafrom Targets Bombarded by 160 MeV Protons, Phys. Rev, Vol. 161,No. 4, Sept. 20, 1967.

582
583
ICANS-VI
INTERNATIONAL COLLABORATION ON ADVANCED NEUTRON SOURCES
June 27 - July 2, 1982
MEASURED AND CALCULATED NEUTRON YIELDS FOR 100 MeV PROTONSON THICK TARGETS OF Pb AND Li
by
R.T. Jones, M.A. Lone, A. Okazaki, B.M. Townes,D.C. Santry and E.D. Earle
Atomic Energy of Canada LimitedChalk River Nuclear Laboratories
Chalk River, Ontario KOJ IJO
J.K.P. Lee, J.M. Robson, R.B. Moore and V. RautMcGill UniversityMontreal, Quebec
ABSTRACT
The neutron yield per proton from thick targets of lead and lithiumirradiated with 100 MeV protons has been measured and calculated. Thewater bath method was used to measure the neutron production, and aFaraday cup for the the beam current determination. Measured yields are0.343 + 0.021 for lead and 0.123 + 0.007 for lithium. Corresponding yieldscalculated with the nucleon-meson transport code NMTC are 0.363 + 0.002 and0.160 + 0.001. Measured and calculated thermal neutron distributions inthe water bath are also compared.
June 1982

584
MEASURED AND CALCULATED NEUTRON YIELDS FOR 100 MeV PROTONSON THICK TARGETS OF Pb and Li
R.T. Jones, M.A. Lone, A. Okazaki, B.M. TownesD.C. Santry and E.D. Earle
Atomic Energy of Canada LimitedChalk River Nuclear Laboratories
Chalk River, Ontario KOJ 1JO
J.K.P. Lee, J.M. Robson, R.B. Moore and V. RautMcGill UniversityMontreal, Quebec
1. INTRODUCTION
AECL has a research and development program aimed at constructing an
accelerator and neutron producing target for economic breeding of fissile
material, the so-called Breeder Accelerator (BA)(1,2). The planned
stages of the program are:
(1) ZEBRA (Zero Energy BReeder Accelerator)
Beam: 300 mA protons at 10 MeV
Purpose: To gain understanding of acceleratoroperation at high current and lowenergy.
(2) EMTF (Electronuclear Materials Test Facility)
Beam: 70 mA protons at 200 MeV
Purpose: Further accelerator development andmaterials testing using neutrons from aPb-Bi target.Thermal neutron source for fundamentalresearch. (Flux available~1015 n.cm2.s-1 )
(3) PILOT BA
Beam: 70 mA protons at 1000 MeV
Purpose: Accelerator development and targetblanket development at moderate powerlevels.
585
(4) DEMO BA
Beam: 300 mA protons at 1000 MeV
Purpose: Full scale demonstration of electro-nuclear breeding.
The work described here is to help with the design and performance
assessment of the target for the EMTF. There are very few measurements of
neutron yields from thick targets for protons with energies in the range
50 to 400 MeV. We have measured such yields from targets of lead and
lithium for 100 MeV protons. These measurements will provide a benchmark
for the computer codes used to design the EMTF target-moderator assembly.
We also present results calculated using the codes NMTC and MORSE for the
experimental geometry.
2. EXPERIMENTS
2.1 General Description
The 100 MeV proton beam of the McGill Cyclotron was used to irradiate
thick targets of Pb (1.6 cm thick by 6.2 cm diameter) and Li enriched to
99.995 wt.% Li-7 (17.4 cm long by 5.7 cm diameter). A large tank of light
water surrounding the targets thermalized and captured the neutrons
produced and also served as part of the Faraday cup for proton current
measurement. The neutron source strength was derived from measurements of
the thermal neutron flux distribution in the water.
2.2 Beam Current Measurement
The beam line and target arrangement are shown in Figure 1. The
remotely controlled quartz scintillator was used to initially align the

586
beam and to periodically monitor its alignment and profile during an
irradiation. Continuous monitoring of the current on the 2.5 cm ID brass
collimator also safeguarded against abrupt changes in beam profile or
position and ensured that only the target was irradiated. Post-irradiation
autoradiography of a lead target confirmed that the beam spot although not
quite circular was only '1 cm in diameter.
To measure the integrated charge on the target, the target tube and
the water tank were electrically connected and insulated from ground to
form a large Faraday cup. This was connected to a low impedance, low
noise current integrator. Extensive tests were performed to check the
accuracy of the current integration.
The current integrator was calibrated with a precision current.source
which verified its accuracy to +0.1% on the 10-8 and 10-9 A ranges. A
portable current source was used to measure the effect of the shunt
impedance of the Faraday cup with no beam. This made less than 0.4%
difference to measurements of currents of about 50 nA.
With the beam on, other systematic errors in the current measurement
are possible. Ionization current in the residual gas in the target tube
was calculated to "be negligible due to the low pressure of the gas and the
large length (75 cm) and small diameter (6.3 cm) of the tube. The geometry
of the tube also helped to suppress the loss of secondary electrons from
the Faraday cup as did permanent magnets placed near its outer end.
Leakage of charge from the Faraday cup due to ionization in the target room
was measured by stopping the beam upstream in a thick copper block. The
beam was adjusted such that the measured radiation level in the target
room was similar to that experienced in an actual irradiation. This test
indicated a systematic error of less than 0.8%.
Radio frequency pick-up on the Faraday cup was negligible from the
cyclotron but considerable from a nearby television transmitter. A w
filter in the lead to the integrator reduced this effect by several orders

587
of magnitude. Residual current due to RF pick-up was of the order of
0.1 nA and was monitored during the irradiation by occasionally switching
off the beam. The integrated charge was corrected for this effect which
introduced an uncertainty of less than 0.2%. The filter circuit also
provided protection against pulse saturation of the integrator due to the
pulsed nature of the synchrocyclotron beam.
Typical average beam currents were about 50 nA with an estimated
overall uncertainty of less than 1.5%.
2.3 Neutron Yield Measurement
The basis of the method is that the fate of the great majority of
neutrons produced in the target is moderation followed by capture in the
water bath. A measurement of the volume integrated thermal flux combined
with the absorption cross section of water can therefore be equated with
the neutron yield, provided the small corrections for leakage, fast neutron
absorption, and thermal neutron absorption in other than water can be
made.
To minimize leakage a large tank in the form of a vertical cylinder
(1.7 m high by 1.5 m diameter) was used (Fig. 2). The back face of the
targets was located about 60 cm from the front surface of the tank at its
mid-height.
The method chosen to measure the neutron flux was activation of gold
foils attached to a lucite frame in the vertical plane above the target
tube. About 70 foils of thickness either 0.254 mm or 0.051 mm and diameter
11.3 mm were used, distributed as indicated in Fig. 2. This gives the
spatial flux distribution which must be integrated. To minimize the number
of foils used most measurements were made in the plane above the target
tube. The frame was, however, equipped with arms below and to either side
at the position immediately downstream from the target. These enabled
azimuthal asymmetries in the flux distribution, due to non uniformities in
the beam profile or radial displacement of the beam from the target centre,

588
to be measured. A correction for azimuthal variation was made to the
measured fluxes before integration.
The gamma activity of the foils was counted on an automatic system
with two NaI(T1) detectors connected to counting channels biased at 50 keV.
Preliminary data analysis corrected for counter dead time, room background
and radioactive decay during and since the irradiation. The efficiency of
the counter system for Au-198 activity had been previously established
using standardized gold foils of the same diameter as those used here but
of different thickness (0.025 mm). A correction for the different
gamma-ray absorption in the present foils allowed their Au-198 activity
content to be calculated.
To obtain the neutron flux from the activity the effective macroscopic
absorption cross section for gold, E , is required. We use the Westcott
convention) to define this
E -E 0(GBg + Grrs)
where Eo is the macroscopic cross section for 2200 m~s-1 neutrons
(5.835 cm-1), g and s are the Westcott cross section parameters
[defined in (3)], and r is the Westcott epithermal flux index. G and B are
factors accounting for thermal neutron flux depression in the foil and in
the moderator around the foil, respectively. Gr is a similar quantity to
G but for neutrons at the Au-197 resonance energy (4.9 eV).
The epithermal flux index, as a function of distance from the target,
was obtained from an irradiation in which some of the foils were covered
with cadmium. Gr was calculated from (4) and s taken from (5), the
resulting correction for epi-cadmium activation was ~ 3.6% for 0.254 mm
foils and ~ 6.4% for 0.051 mm foils. Values for the product GB were
obtained from subsidiary experiments: GB - 0.715 for 0.254 - foils and
0.923 for 0.051 mm foils.

589
3. RESULTS
The measured thermal flux distributions, normalized to a 1 mA proton
current, are shown in Figs. 3 and 4. That for the lithium target is much
less steeply sloped. This may be ascribed to a higher average neutron
energy in the source spectrum and a spatially more distributed source.
These fluxes have been corrected for azimuthal variation of the flux
measured in the previously described manner. The largest of these
corrections was about 10%. This occurred before alignment of the beam was
finalized. With better beam alignment the corrections fell in the range 1%
to 4%.
To integrate the flux over the measurement volume cubic splines were
fitted to the logarithm of the flux. This was done first for the axial (z)
distributions at each radius (r) where measurements had been made, then
radially. The lines in Figs. 3 and 4 are the fitted splines. Because of
the discontinuity in the measurement array caused by the target tube the
integration was done for positive and negative z separately. The zero of
the z co-ordinate is shown in Figs. 2 and 3.
Various checks were made on the accuracy of the integration method.
These included reversing the order of integration (r then z), including
measurements at extra radial positions for one irradiation and integrating
over all z at once. The results showed systematic differences in the range
+1%.
For the lithium target results it was necessary to extrapolate the
fluxes beyond the measurement volume. An exponential extrapolation was
used and increased the integral by ~ 5%.
To obtain the neutron absorption rate in the water, the integrated
flux is multiplied by the appropriate macroscopic absorption cross section
(0.0220 cm-1 was used). This can be equated to the neutron source strength

590
if allowance is made for the small numbers of neutrons lost in other ways.
These include thermal neutron absorptions in the target and target tube
(<1% for both targets), absorption of non-thermal neutrons (~-1.4% for Pb
target, ~1.9% for Li), and leakage of neutrons of all energies (0.3% for
Pb target, 0.5% for Li). The first of these corrections was based on the
measured thermal fluxes and known cross sections, the other two were
derived from the calculations described in the next section.
The measured neutron yields for three irradiations with Pb targets and
one with a Li-7 target are shown in Table 1. The uncertainty in the
measurement, derived from the three results for lead, is +3%. A separate
error analysis in which errors were assigned to each of the separate
factors needed to derive the measured yield indicated an overall error of
+6%. These estimates are in reasonable agreement since the first cannot
detect some systematic effects which were included in the second.
4. CALCULATION OF NEUTRON YIELDS AND FLUXES AND
COMPARISON WITH MEASURED VALUES
4.1 Method of Calculation
The calculations for these experiments were performed using a
combination of computer codes and nuclear data which were originally set up
for accelerator breeder target studies at CRNL.
The (p,n) production and neutron transport down to neutron energies
below a 14.9 MeV cut-off energy were computed using NMTC(6), a
nucleon-meson transport code. This code employs Monte Carlo techniques to
provide a detailed description of the transport process using the
intranuclear-cascade-evaporation model of nuclear interactions. The
intranuclear-cascade calculation is based on Bertini's mediumenergy

591
intranuclear-cascade code(7), and the evaporation calculation is
carried out using a version of Guthrie's evaporation code(8). Slowing
down of charged particles due to excitation and ionization of atomic
electrons is treated using the continuous slowing down approximation, and
elastic collisions with all nuclei other than hydrogen are neglected. When
the neutron energy falls below the 14.9 MeV cut-off its location, energy
and direction are stored, and a random sample of these neutrons is used as
an input source distribution for the MORSE(9,1 0) code, which tracks
each neutron until it is absorbed or escapes.
A 23-group neutron cross section library for use with the MORSE code
was produced using SUPERTOG(1 1) to derive a 100 group (GAM-11 99 groups + 1
thermal group) cross-section set from ENDF/B-IV data files for each
material of interest. Data for each material were combined into an ANISN
format P-3 library using DLC-2, and this set was further condensed to 23
groups. The group condensations were done assuming a fission spectrum
joined by a 1/E distribution to a 300*K Maxwellian.
4.2 The Experimental Simulation
The CRNL version of the NMTC code can only accommodate cylindrical
geometry, and, although the detailed geometry of the beam tube, target
tube, target can, and target was represented exactly, the water bath had to
be approximated in the NMTC calculation by a concentric cylinder of length
152.4 cm and radius 85.73 cm.
In MORSE calculations the same horizontal beam tube, target tube,
target can, and target were represented but the experimental vertical water
bath orientation was treated explicitly as a cylinder of 152.4 cm diameter
and 171.45 cm height. In both calculations the aluminum tank was ignored.

592
In order to determine a calculated flux distribution the water bath
was split into zones for the MORSE calculations, the mesh chosen being a
compromise between providing large enough regions for acceptable
statistical accuracy and yet small enough to enable the flux variation to
be reasonably defined.
4.3 Results and Comparisons
The calculated neutron yields are shown in Table 1. Agreement with
the measured value is good for the lead target but not for the lithium.
This is perhaps not surprising since NMTC was designed for targets of heavy
nuclei and for proton beams of energy >100 MeV.
To compare the measured fluxes with those from MORSE it was necessary
to integrate the measured distribution over the large zones used in the
calculation. The same integration method as for the yield calculation was
used. For the lead target axial distributions are compared in Fig. 5 and
radial in Fig. 6. Normalization is to the same proton current and
agreement is generally good. The error bars represent the statistical
errors of the Monte Carlo calculation. Similar results for the lithium
target are shown in Figs. 7 and 8. Here the agreement is not good; even if
the difference in neutron yield is removed by renormalization, the
calculated fluxes clearly fall off more rapidly than the measured.
5. CONCLUSIONS AND FUTURE PLANS
We have measured the neutron yield from thick targets of Pb and Li-7
irradiated with 100 MeV protons with a precision of about +6%. The
computer code NMTC calculates a neutron yield from the high mass number
target which is in satisfactory agreement with the measured value. This is
not true of the Li-7 target where the calculated value is some 33% higher
than that measured. The combination of codes NMTC and MORSE provide a
satisfactory description of the thermal neutron distribution in light water
moderator surrounding the Pb target. For the Li-7 target they predict a

593
more rapid fall off of the flux than is observed. This is consistent with
the calculated neutron source spectrum being too soft.
We plan future measurements on both light (Be,D20) and heavy (U,Th)
target materials. It is also expected that we will measure yields from
accelerator structural materials such as the medium-weight elements Cu and
Fe.
6. REFERENCES
1. G.A. Bartholomew, Research Opportunities with Prototype Accelerators
for an Accelerator Breeder, Proc. ICANS-V, Julich, June 1981.
2. J.S. Fraser et al., A Review of Prospects for an Accelerator Breeder,
Atomic Energy of Canada Limited, Report AECL-7260, 1981.
3. C.H. Westcott et al., Effective Cross Sections and Cadmium Ratios for
the Neutron Spectra of Thermal Reactors, Atomic Energy of Canada
Limited, Report AECL-612, 1958.
4. G.M. Roe, The Absorption of Neutrons in Doppler Resonances, KAPL-1241,
(1954).
5. C.B. bigham et al., Experimental Effective Fission Cross Sections and
Neutron Spectra on a Uranium Fuel Rod, Part II, Atomic Energy of Canada
Limited, Report AECL-1350, 1961.
6. W.A. Coleman and T.W. Armstrong, The Nucleon-Meson Transport Code NMTC,
ORNL-4606, 1970.
7. H.W. Bertini, Intranuclear-Cascade Calculation of the Secondary Nuclear
Spectra from Nuclear-Nucleus Interactions in the Energy Range 340 to
2900 MeV and Comparison with Experiment, Phys. Rev. 188, 1711, 1969.
594
8. M.P. Guthrie, EVAP-4: Another Modification of a Code to Calculate
Particle Evaporation from Excited Compound Nuclei, ORNL-TM-3119, 1970.
9. E.A. Straker, P.N. Stevens, D.C. Irving and V.R. Cain, The MORSE Code
- A Multigroup Neutron and Gamma-Ray Monte Carlo Transport Code,
ORNL-4585, 1970.
10. E.A. Straker, W.H. Scott Jr. and N.R. Byrn, The MORSE Code with
Combinatorial Geometry, DNA-2860 T, 1972.
11. R.Q. Wright, N.M. Greene, J.L. Lucius and C.W. Craven Jr. SUPERTOG:
A program to Generate Fine Croup Constants and Pn Scattering Matrices
from ENDF/B, ORNL-TM-2679, Rev. 1973.

595
TABLE 1
Measured and Calculated Neutron Yields
Target Au Foil Thickness Measured Calculated
Material Used Yield Yield
(mm) (n/p) (n/p)
Pb 0.254 0.330 0.363 + 0.002
0.254 0.346
" 0.051 0.353
Li-7 0.254 0.123 0.160 + 0.001

596
INSULATED
JOINTS
-ar
BRASSCOL LIMATOR
VACUUMPUMP
MOTOR DRIVENQUARTZ BEAM VIEWER
N
WATER
INSULATEDJOINTS
TARGET
TV CAMERA
LOWIMPEDANCEINTEGRATOR
Fig. 1: Beam Line and Target Arrangement
-VGATEVALVE
Is

597
DIAMETER 1.5 m
n I j~-~..JIE - I - I -
LEVELINGscREw v
TARGET
I'll IF
Ia
LUCITE FRAME
FOILS
WATER TANK
Fig. 2: Water Tank and Foil Array
IIULATOR
t
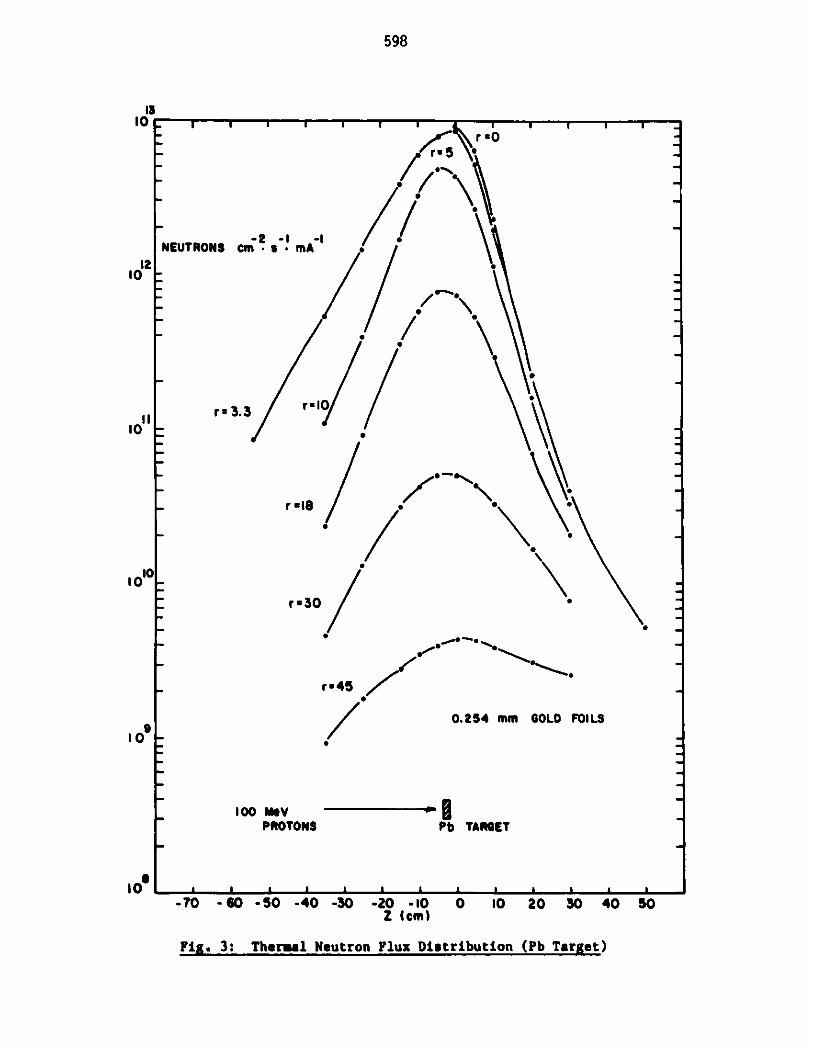
598
13I0
I210
I,10
t0
I0'
0F
r*45 ~ 0~/ 0.254 mm GOLD FOI LS
100 MvPROTONS Pb TARGET
-70 - 60 -50 -40 -30 -20 -10
Fig. 3: Thermal Neutron Flux Distribution (Pb Target)
NEU
r00
0/o
ru5
IRONS cm s - mA .
*"
rx 3.3 r O10
r " 18" ."*"
x"30 *
0 10 20 30 40 50

599
m wI I I I I 1 1 I I1 I1 I I a
NEUTRON S cm ? s mA . r
r x3.3 0
r a 10
r "18 /
12
I0
1090
109 100 MaV .-
PT0N S TAR T
A I I 1 1 I I I 1 2 A 1
-70 . 0 405o,40 40 (0 )Z (cm)
0 10 20 30 40 50
!!&. 4: Thermal Neutron Flux Distribution (Li-7 Target)
r"30 /r45* 0.051 mm GOLD FOILS
ff
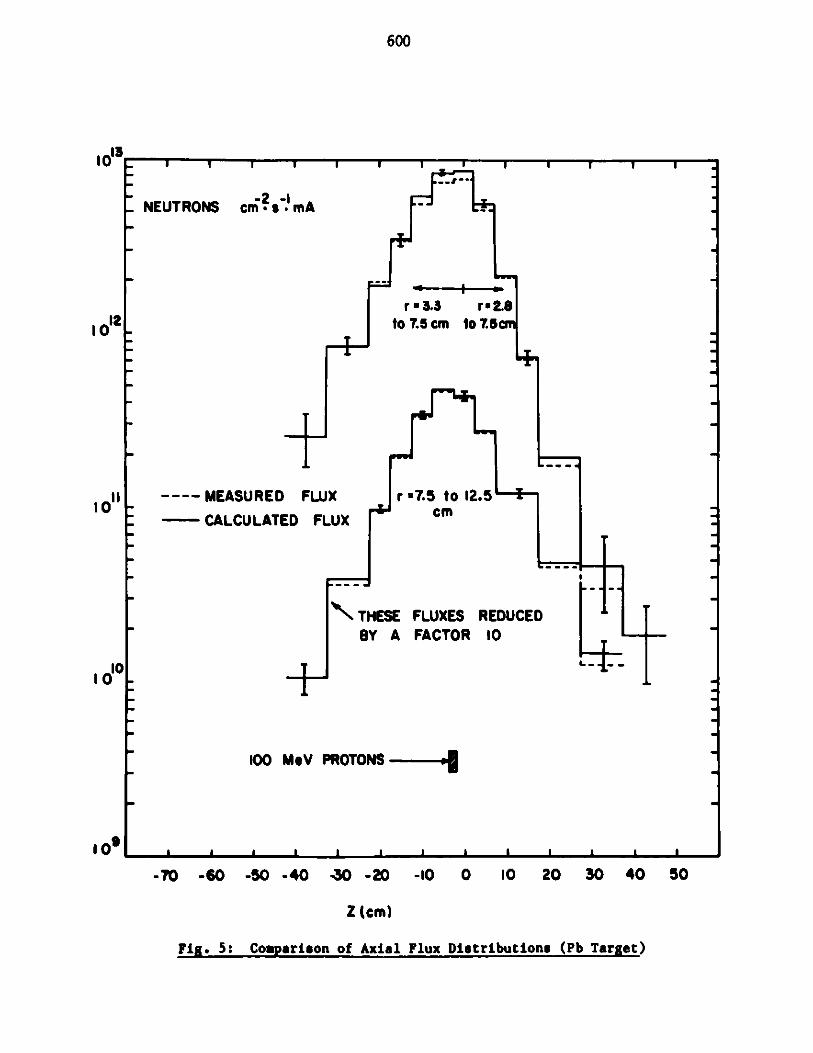
600
NEI UTRONS cnns.mA
r3.3 r"2.8tol7.5cm to .5
---- MEASURED
CALCULATE
FLUX r u7.5 to 12.5
ED FLUX cm
THESE FLUXES REDUCEDBY A FACTOR 10
100 MOV PROTONS
1 I 1 1 L 1A 1
-70 -60 -50 -40 30 -20 -10 0 10 20 30 40 50
Z (cm)
Fig. 5: Comparison of Axial Flux Distributions (Pb Target)
"v
11 3-
10
1010o1
o9*
m,u I Ti
_I

601
- I
- NEUTRONS
I
-2 -Icm,, s - mA
Z INTEGRATION
Pb TARGET
Ko
p013
12I10
I'
I0
I0
20 30
FROM -2.5TO +2.5 cm
MEASURED FLUX
,7 CALCULATED FLUX
40 50 60 70
r (cm)
vi.6:CmaronoRdilFuDititon (PTrg)
L1 .
01 1 ,
I I I I
I ,I
of Radial Flux Distributions (Pb Target)Fig. 6: Comprison

602
NE
r-3.3to7.5 r*2.Sto7.5
UTRONS cm- -mA 9
THESE FLUXESREDUCED BY
FACTOR 10
/
+
MEASURED- "", FLUX
~=.1
r = 7.5 to 12.51
CALCULATED FLUX
..
cm~
PROTON BEAM .TGL i TARGET
-70 -60 -50 -40 -30 -20 -10 0 10 20 30 40 50
Z(cm)
Fig. 7: Comparison of Axial Flux Distributions (Li-7 Target)
012
10
10 o
1oL
i 1 1 i i

603
103
NEUTRONS cm? s - mA
- - -
Li
0
TARGET
10 20
Z INTEGRATION FROM -12.5 TO -7.5 cm
30
1d2
I0"
10
O9
40 50
FLUX
FLUX
60 70
r (cm)
Fig. 8: Comparison of Radial Flux Distributions (Li-7 Target)
-- - - - - -MEASURED
CALCULATED
_I II 1 -L

604

605
ICANS -VI
INTERNATIONAL COLLABORATION ON ADVANCED NEUTRON SOURCES
June 27 - July 2, 1982
METHODS OF NEUTRON AND PROTON DOSIMETRY AT SPALLATION SOURCES
L. R. Greenwood and R. J. Popek
Argonne National Laboratory
ABSTRACT
A variety of techniques are being developed to measure the neutron
and proton fluxes and energy spectra at spallation neutron sources. Multiple-
activation dosimetry is being used to adjust the neutron energy spectrum by a
least-squares procedure. Primary beam protons are measured by the 2 7 A1(p,*)
2 2Na reaction and secondary protons by (p,n) reactions on 7Li, 51 V, and 6 5Cu.
Lithium fluoride thermoluminescent dosimeters are used to measure the neutron
dose rate, although we have been unable to determine the much weaker gamma
dose rate. Neutron fluxes, displacement damage, gas production and trans-
mutation, and dose rates are now routinely determined for materials irradia-
tions with uncertainties of 10-15x.
606
METHODS OF NEUTRON AND PROTON DOSIMETRY AT SPALLATION SOURCES
L. R. Greenwood and R. J. Popek
Argonne National Laboratory
1. INTRODUCTION
In order to understand radiation damage measurements at spallation
neutron sources, we need to fully characterize these facilities in terms of
neutron flux and energy spectra and the resultant displacement damage, trans-
mutation, and dose rate. A companion paper at this conference1 describes the
results of such measurements2 at the Radiation Effects Facility (REF) of the
Intense Pulsed Neutron Source (IPNS) at Argonne National Laboratory. The
present paper discusses the techniques used in these measurements.
Neutron flux and spectral measurements were made using the multiple-
activation technique.3 This method has been developed for fusion material
irradiations and has been successfully applied in a wide variety of neutron
sources including fission reactors, 14 MeV T(d,n) sources, and Be(d,n)
sources.4 This method measures activation products induced simultaneously
in a number of materials. These integral activities are chosen to span all
neutron energy regions of interest. Each integral is equal to the neutron
flux-spectrum times the activation cross section. The flux-spectrum is then
adjusted to obtain the best fit to the integral measurements. The final
neutron spectrum is then used to calculate damage parameters. This can be
done routinely with integral uncertainties of 10 - 15%.
2. NEUTRON FLUX AND SPECTRAL MEASUREMENTS
In order to obtain the best analysis of the IPNS neutron spectrum,
more than 30 different activation products were measured using Ge(Li) gamma
spectrometry. Twenty-eight reactions were used to adjust the neutron flux
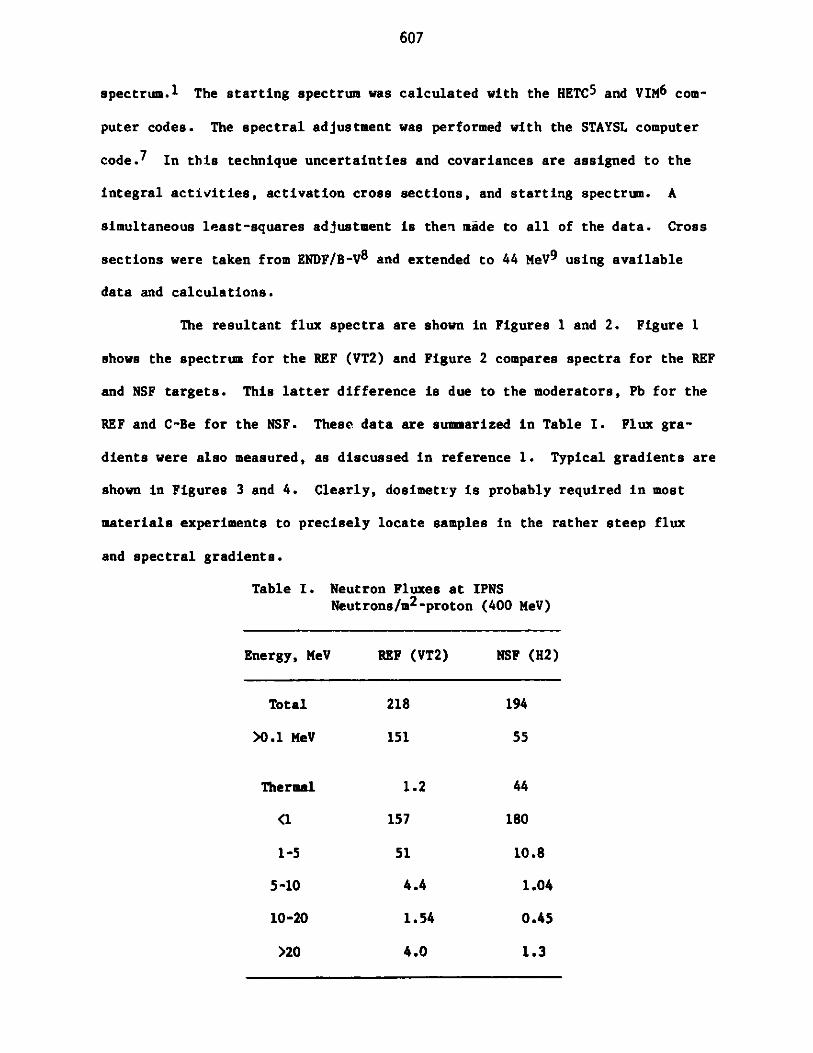
607
spectrum.1 The starting spectrum was calculated with the HETC5 and VIM6 com-
puter codes. The spectral adjustment was performed with the STAYSL computer
code.7 In this technique uncertainties and covariances are assigned to the
integral activities, activation cross sections, and starting spectrum. A
simultaneous least-squares adjustment is then made to all of the data. Cross
sections were taken from ENDF/B-V 8 and extended to 44 MeV9 using available
data and calculations.
The resultant flux spectra are shown in Figures 1 and 2. Figure 1
shows the spectrum for the REF (VT2) and Figure 2 compares spectra for the REF
and NSF targets. This latter difference is due to the moderators, Pb for the
REF and C-Be for the NSF. These data are summarized in Table I. Flux gra-
dients were also measured, as discussed in reference 1. Typical gradients are
shown in Figures 3 and 4. Clearly, dosimetry is probably required in most
materials experiments to precisely locate samples in the rather steep flux
and spectral gradients.
Table I. Neutron Fluxes at IPNSNeutrons/m2 -proton (400 MeV)
Energy, MeV REF (VT2) NSF (H2)
Total 218 194
>0.1 MeV 151 55
Thermal 1.2 44
<1 157 180
1-5 51 10.8
5-10 4.4 1.04
10-20 1.54 0.45
>20 4.0 1.3

608
Several problems were considered which might interfere with this
technique. First of all, if protons are present as well as neutrons, then
confusion is possible as to the source of reaction products. For example, a
(p,d) reaction is indistinguishable from a (n,2n) reaction. Fortunately, the
proton flux is quite low, as discussed in section 4. Hence, proton interfer-
ence is generally less than 1%. Secondly, our present activation cross
sections do not extend above 44 MeV. This high energy flux can be neglected
for all of the reactions we have used since both the cross sections and fluxes
are very weak above 44 MeV. The only exception to this rule is that we appar-
ently see interference with (n, a) reactions from high-energy spallation
products. Activation rates from 5 4Fe, 63Cu, and 6 0Co were all much higher
than expected (40-80%). The most likely explanation is that the activation
products can also be produced by spallation from the neglected high-energy
neutrons. As proof of this we note that the worst cases appear to be those
elements which have the least abundant isotopes (i.e., 5 4Fe (n,a) may be
overshadowed by 5 6Fe spallation).
On the other hand, spallation cross sections could be extremely
valuable in defining the neutron spectrum above 30 MeV. J. Routti and
J. Sandberg have recently demonstrated this technique using spallation pro-
ducts from copper.1 0 We have observed these spallation products in many of
our materials and plan to develop this technique, although the cross sections
are not very well known. In general, neutron cross sections are very poorly
known above 20 MeV, a fact which hampers neutronic and shielding calculations
as well as dosimetry.

609
3. PROTON BEAM DOSIMETRY
The 27Al(p,*)2 2Na reaction has been used to monitor the direct
proton beam. Originally this was done to measure beam profiles and currents.
However, with improvements in the beam monitoring system we are now able to
study the cross section. The measurements were performed by placing a stack
of three Al foils (5 miles thick, 4" by 4" square) directly in the proton beam.
The center foil was then gamma counted, the others being used to correct for
recoil losses. We have focused on 2 2 Na since we want a long-lived monitor for
irradiations lasting a week or more. Thus, 2 4 Na is too short-lived. We also
measure 7Be; however, the data has not been repeatable, possibly due to the
longer recoil ranges of 7 Be ions compared to those for 2 2 Na.
The results of several measurements are listed in Table II. As can
be seen the 22Na results are quite consistently lower than measurements with
the toroids and faraday cup. The 2 2Na yield was taken from a French evalua-
tion."1 Our results indicate that the most likely cross section at 400 MeV is
13.4 mb ( 10%), considerably lower than the recommended value of 17.8 mb.
Table II. 2 7Al(p,*)2 2Na Cross Section Measurements
Proton Energy - 400 MeVPrevious Cross Section - 17.8 mb
Date Protons, x 1017 Ratio
22Na Toroid (22Na/Toroid)
11-1641 1.20 1.63 0.74
11-20-81 1.32 1.72 0.77
02-08-82 16.4 21.9 0.75
Average - 0.75
Adjusted cross section - 13.4 ub (t1OZ)

610
4. SECONDARY PROTON DOSIMETRY
As mentioned previously, some concern was raised over the possibility
of protons interferring with neutron dosimetry measurements. Another more
serious concern is that low energy protons may deposit very high energy losses
in insulators under study for radiation damage. The following measurements
show that neither of these effects are significant.
In order to measure secondary proton fluxes, several materials were
irradiated to look for (p,n) reactions. The 6 5 Cu(p,n) 6 5 Zn and 51V(p,n)51Cr
reactions gave the best results, mainly since neither target has any strong
neutron-activation products, except from spallation. The 5 6 Fe(n,p) 5 6 Co
reaction is overwhelmed by neutron activities. Lithium fluoride was also
tried; however, 7 Be from the 7 Li(p,n) reaction appears to be weaker than
the 7 Be produced by spallation in fluorine. The Cu and V results are listed
in Table III.
Table III. Secondary Proton DosimetryREF-VT2-400 MeVPb Absorption Result < E > X100 MeV
Reaction Rate/NC a, mb Flux/cm 2 -iC
(x 10"18) (x 108)
51V(p,n) 5 lCr 2.41 10-20 4.66 5Cu(p,n) 6 5 Zn 2.50 10-20 X1.7
58 Ni(n,p) 58 Co 5493. 40.8 1346.
Secondary protons/neutrons 4/800
Flux at 10 NA: neutrons: 1.3 x 10¹² n/cm2-sprotons: X1.6 x 109 p/cm2 -s
611
Since these two reactions have very similar thresholds and cross
section values, little can be deduced about proton fluxes or energies.
Another experiment was thus performed where the Cu and V samples were embedded
at 16 locations in a lead cylinder measuring 1-7/8" in diameter by 3" long.
Although these samples are still being analyzed, preliminary results indicate
a rather even distribution of 65Zn. This implies that the protons must have
rather high energies, certainly above 100 MeV and more likely 150-200 MeV.
The even distribution is then explained since the decrease in proton flux
across the cylinder is balanced by the increase in cross section as the pro-
tons lose energy. Each of these effects is roughly a factor of two for our
experimental geometry.
Since we know that the protons must have an average energy above
100 MeV, then the (p,n) activation cross sections must be in the 10-20 mb
range (although neither reaction is well-known at 100-200 MeV). The proton
flux must thus be about 1.6 x 10⁸ protons/cm2 -C or about 1.6 x 10⁹ protons/
cm2 -s.at 10 NA beam current. This secondary proton flux is only about 1/800
of the neutron flux, as shown in Table III. These measurements are still in
progress and we hope to refine our knowledge of the secondary proton flux.
In any case, the present results indicate that these protons are of little
concern to radiation damage and dosimetry measurements. The most likely
explanation for these particles is that we are seeing protons elastically or
inelastically scattered from the target and that these nearly 400 MeV protons
lose about 200 MeV in the uranium target and lead moderator before we detect
them.

612
5. DOSE MEASUREMENTS
Insulator irradiations now being done for the fusion materials
program require knowledge of the total dose deposited in the samples. This
dose is primarily due to neutrons, but may be weakly influenced by gammas,
protons, or other charged particles. Thermoluminiscent dosimeters (LiF-
TLD700) were irradiated in an attempt to more accurately determine dose rates.
These dosimeters were calibrated at known 2 2 6Ra and 6 0Co sources prior to
their use at IPNS. The samples were irradiated in polyethelene tubing.
Nickel wires were also irradiated to determine the neutron flux
using the 58Ni(n,p)5 8Co reaction. In order not to saturate the dosimeters it
was necessary to reduce the IPNS beam-cycling rate to 1 hertz (normally 30 hz)
and to expose the samples for only 1-15 minutes.
The TLD results are listed in Table IV along with background gamma
Table IV. Dose Measurements at IPNSLiF - TLD 700Ep - 400 MeV; 1 Hz; 4 x 10¹³ P
Dose (Rads/ C)
Location (REF) Exp. ( 10%) Calc. (neutron) ( 15%)
VT2 18.7 19.1
VT1 17.0 18.1
Background Gamma Dose
Gaina Dose, R/hr ( 10%)Run Time (a) Pre-Run Post-Run
1 77 92
15 82 150

613
doses before and after short irradiations at reduced (1/30) beam power. The
calculated doses (neutron only) were determined by averaging 7Li and F Kerma
factors1 2 over our measured neutron spectra, normalized to the 58Ni(n,p)
activation rate. As can be seen, the calculations overpredict the measured
rates, although values agree within the estimated errors. One possible source
of this overprediction is that the kerma factors include the full beta-par-
ticle energies even though our samples (1 mm OD by 6 m long) will not stop
all of the betas. We estimate that this effect might reduce our calculated
values by as much as 10%, although more exact calculations have not been per-
formed. In any case, it would appear that most of the dose seen in the TLD's
is due to neutrons. Estimates of the gamma flux13 suggest that the gamma dose
should be no more than 10-20% of the neutron dose and we have already shown
that secondary protons are negligable. Nevertheless, it would appear that TLD
measurements and calculations are not sufficiently accurate at present to
really measure the weaker gamma dose and other techniques may be needed.
6. CONCLUSIONS
Techniques have been developed to characterize neutron and proton
fluxes and energy spectra at spallation neutron sources. Routine neutron
measurements are now being performed to provide materials experimenters with
exposure data including calculated displacement, transmutation, and dose
rates. These integral parameters can generally be determined to 10-15%
accuracy, although some problems remain. In particular, nuclear cross
sections need further development above 20 MeV. Spallation cross sections
(e.g., for Cu) would be especially useful and might allow us to extend the
spectral adjustment technique up to the proton beam energy. Further work is
also needed to measure the gama flux at spallation sources. The use of TLD's
614
is questionable for this purpose due to uncertainties in the measurements and
calculations. Proton dosimetry also could be improved with more nuclear
reactions and better dosimetry. Work is continuing in all of these areas,
although we feel that the IPNS is now sufficiently well-characterized for
routine materials experiments.
REFERENCES
1. R. C. Birtcher, M. A. Kirk, T. H. Blewitt, and L. R. Greenwood, Measure-
-nent of Neutron Spectra and Fluxes at the IPNS Radiation Effects Facility,
proceedings of this conference.
2. M. A. Kirk, R. C. Birtcher, T. H. Blewitt, L. R. Greenwood, R. J. Popek,
and R. R. Heinrich, J. Nucl. Mater. 96, (1981) 37.
3. L. R. Greenwood, Review of Source Characterization for Fusion Materials
Irradiations, BNL-NCS-51245, (1980) 75.
4. L. R. Greenwood, R. R. Heinrich, M. J. Saltmarch, and C. B. Fulmer, Nucl.
Sci. Eng. 72, (1979) 175.
5. K. C. Chandler and T. W. Armstrong, Oak Ridge National Laboratory Report,
ORNL-4744 (1972).
6. F. M. Gelbard and R. E. Prael, Argonne National Laboratory Report, ANL-
75-2 (1974).
7. F. G. Perey, Least-Squares Dosimetry Unfolding: The Program STAYSL,
ORNL-TM-6062 (1977); modified by L. R. Greenwood (1979).
8. Evaluated Nuclear Data File, Part B, Version V, National Neutron Cross-
Section Center, Brookhaven National Laboratory (1979).
9. L. R. Greenwood, "Extrapolated Neutron Activation Cross-Sections for
Dosimetry to 44 MeV", ANL-FPP-TM-115 (1979).

615
10. J. T. Routti and J. V. Sandberg, Computer Physics Communications 21,
(1980) 119.
11. J. Tobailem, C. H. Lassus-St. Genies, and L. Leveque, CEA Report-N-1446
(1971).
12. M. A. Abdou, Y. Gohar, and R. Q. Wright, MACK-IV; A Program to Calculate
Nuclear Response Functions from Data in ENDF/B Format, Argonne National
Laboratory Report, ANL-FPP-77-5 (1978).
13. M. Kimura, J. M. Carpenter, and D. F. R. Mildner, Calculations of the
Heat Deposition and the Expected Rate of Temperature Rise in Moderator,
Reflector, and Decoupler Materials at IPNS-I, Argonne National Laboratory
Report, ANL-81-22 (1981).
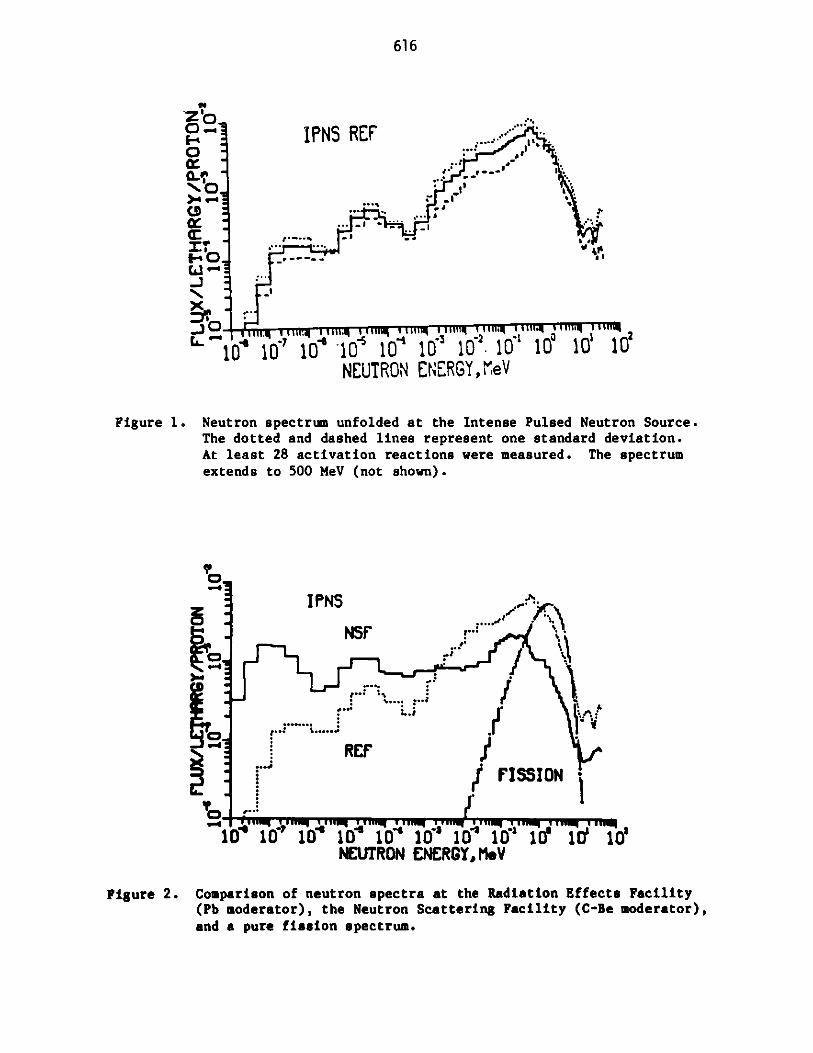
616
o -I I1PNS REF .-
SO.I
10 10 10 10 10 10 102. 1O 100 10 10NEUTRON ENERGY, wheV
Figure 1. Neutron spectrum unfolded at the Intense Pulsed Neutron Source.The dotted and dashed lines represent one standard deviation.
At least 28 activation reactions were measured. The spectrum
extends to 500 MeV (not shown).
40
IPNS,
. t a.
REFFISSION"
' l'
1W010' 10" 10 10 10' 10"' 1 10'10'NEUTRON ENERGY, MeV
Figure 2. Comparison of neutron spectra at the Radiation Effects Facility(Pb moderator), the Neutron Scattering Facility (C-Be moderator),
and a pure fission spectrum.

617
N
z IPNS - VT2-.
3 ~CENTER -.z ~INSIDE' -.
o OUTSIDE
0.0 6.0 12.0 18.0 24.0VERTICAL HEIGHT,cm
Figure 3. Vertical flux gradients in the vertical thimble 2 of IPNS-REF.The solid line was at the center of the tube; the dotted linewas on the inside radius, 2 cm closer to the target; the dashedline was on the outside radius, 2 cm farther from the target.
IPNS - RABBITE
c*
'"U TARGET
0C
-60.0 -5.0 -30.0 -15.0 0.0DISTANCE FROM END,cm
Figure 4. Horizontal flux gradients asasured in the center of the IPNS-REFrabbit tube, parallel to the 2 38U target. Distances are relativeto the end of the rabbit hole. The target location is shown.The beau is incident from the left.

618
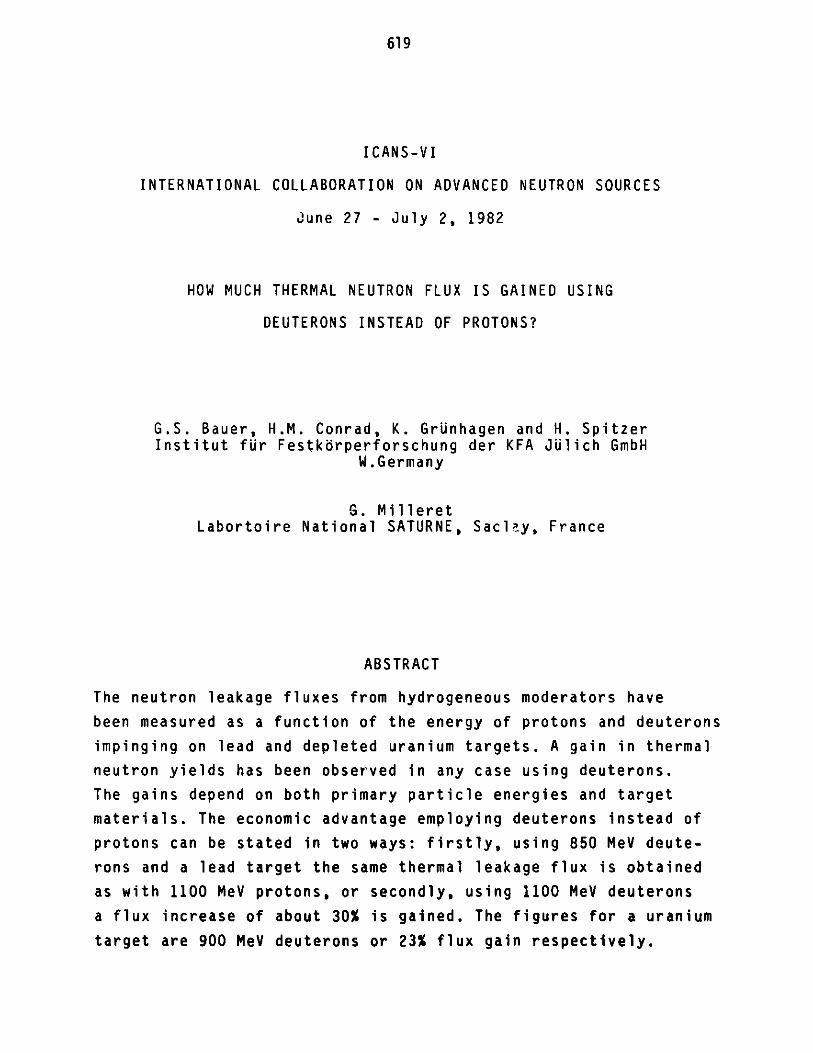
619
ICANS-VI
INTERNATIONAL COLLABORATION ON ADVANCED NEUTRON SOURCES
June 27 - July 2, 1982
HOW MUCH THERMAL NEUTRON FLUX IS GAINED USING
DEUTERONS INSTEAD OF PROTONS?
G.S. Bauer, H.M. Conrad, K. GrUnhagen and H. SpitzerInstitut fur Festkorperforschung der KFA JUlich GmbH
W.Germany
G. MilleretLabortoire National SATURNE, Saclay, France
ABSTRACT
The neutron leakage fluxes from hydrogeneous moderators have
been measured as a function of the energy of protons and deuterons
impinging on lead and depleted uranium targets. A gain in thermal
neutron yields has been observed in any case using deuterons.
The gains depend on both primary particle energies and target
materials. The economic advantage employing deuterons instead of
protons can be stated in two ways: firstly, using 850 MeV deute-
rons and a lead target the same thermal leakage flux is obtained
as with 1100 MeV protons, or secondly, using 1100 MeV deuterons
a flux increase of about 30% is gained. The figures for a uranium
target are 900 MeV deuterons or 23% flux gain respectively.
620
HOW MUCH THERMAL NEUTRON FLUX IS GAINED USING
DEUTERONS INSTEAD OF PROTONS?
G.S. Bauer, H.M. Conrad, K. GrUnhagen and H. SpitzerInstitut fur Festkorperforschung der KFA JUlich GmbH
W.Germany
G. MilleretLabortoire National SATURNE, Saclay, France
1. INTRODUCTION
Loss of kinetic energy of charged particles due to ionization of
matter penetrated by high energy ions are the reason for the very
low neutron yields at particle energies below 100 MeV /Bartholo-
mew, 1966/. Clearly, neutral particles cannot be produced with,
or accelerated to, the high kinetic energies necessary for effi-
cient spallation reactions. On the other hand, heavier nuclii con-
taining neutrons can be used as vehicles for neutral projectiles.
Although ionization losses may become very severe for multiply
charged ions, numerical calculations by Barashenkov (1974) indi-
cated that an appreciable gain in neutron yield may be obtained
by using deuterons instead of protons (deuterons are stripped on
impinging on matter giving two particles with half the kinetic
energy each; binding energy of -2.2 MeV neglected).
As neutron production by spallation is a power consumptive, i.e.
a costly procedure, each possibility fcr increasing its efficiency
should be checked. For the German spallation project (SNQ project)
this might mean a reduction in investment expenses and particu-
larly in running costs if a lower-energy linac for deuterons
could be envisaged. In order to improve the basis for this dis-

621
cussion we performed measurements of the thermal neutron leakage
fluxes from hydrogeneous moderators in a target-moderator-reflec-
tor geometry as proposed for the SNQ project. We decided to
measure the gains in thermal fluxes in realistic arrangements in-
stead of determining the fast neutron yields from targets in order
to be independent of any subsequent corrections and conversions.
2. EXPERIMENTAL
The experiments have been performed at the synchrotron of the
Laboratoire National SATURNE. The set-up is the same as used in
our former investigations and details are described elsewhere
/Bauer et al., 1981c/. With the present measurements we used for
the first time the actual H20-moderator planned for use in the
SNQ, its size and shape (grooved surfaces!) being the result of
our former studies /Bauer; 1981a, 1981b/. This moderator is
shown in figure 1.
beam hole axesgrooved moderator
water inflow
water outflow
reflector (stacked lead slabs)
aluminIum separator for coolant flow
Fig. 1
Grooved-surface H 2 0-moderator with lead reflector
622
The SNQ mock-up used for our measurements can be briefly charac-
terized as follows: lead target with dimensions 10x50x75 cm3
(height x width x depth), the H 0-moderator with lead reflector,
a graphite block of 40x60x60 cm (simulating the D20-moderator)
below the target and an overall lead shielding of about 50 cm
thickness. The uranium target had the dimensions 10x45x50 cm3 .
The proton energies used were 400 MeV, 600 MeV, 750 MeV and 1100
MeV. With deuterons we utilized only the lower three values, 750
MeV being the highest energy which could be diverted into our
experimental area. The absolute numbers of protons and deuterons
impinging on our targets were determined by carbon activation in
separate short calibration irradiations in which the counts si-
multaneously recorded with secondary emission chambers (SEC) and
ionizations chambers (IC) were related to the activation results.
In the actual experiments the SEC and IC counts were used as a
measure of the number of the primary particles.
3. RESULTS AND DISCUSSION
Although we measured the gain of thermal neutrons emerging from
hydrogeneous moderators in various configurations using deuterons
instead of protons, the main emphasis in this paper will be on
the SNQ target-moderator-reflector arrangement employing the pro-
posed grooved-surface H20-moderator mentionned above. The results
for reflected and unreflected polyethylene moderators both measured
with lead and uranium targets are quoted only briefly.
Figure 2 shows the thermal neutron leakage fluxes from the H20-
moderator with lead reflector, resulting from bombarding lead or
depleted uranium targets with both protons and deuterons of
various energies.
As mentionned in the caption of figure 2, the lines drawn through
the experimental data points are guides to the eye only. The
reader should keep in mind that the data of figure 2 do not axhi-

623
H20 Moderator with groovesI I I IN~14
312
a 10
amoc26
z 4
E2a
I n '"
400 600 800
Kin. Energy of Particle (MeV)200 1000 1200
Fig. 2
Relative thermal neutron leakage measured from an H20-moderatorfor slab targets (10 cm high) of Pb and depleted U as a functionof kinetic energy for protons and deuterons. The geometry wasthe same for all energies and for protons and deuterons. Curvesare a guide to the eye only.
bit the total fast neutron yield as a function of energy as, forinstance, given in the paper of Barashenkov /1974/. The plotted
thermal neutron leakages represent the expected fluxes of a rea-
listic target-moderator-reflector configuration. The data there-
fore contain physical parameters like target-moderator geometry,
penetration depth of the primary protons or deuterons and coup-
ling efficiency for fast neutrons from target into moderator. The
increasing penetration depth of the primary particles with in-
creasing kinetic energy in conjunction with the finite size of
the moderator may explain the downward bending of the leakage cur-
ves for protons at higher energies. In fact the bending is less
pronounced for the uranium target. This is consistent with the
smaller penetration depth of protons in that material.
- and P b- reflector d 4+ .
U -Target(depleted)
d p+
Pb-Target
IVO
1 1 1
-I
i
624
Despite the difficulties in expressing our experimental data in
mathematical relations, as discussed so far, we may answer the
following question without stressing our results too much. What
is the kinetic energy of deuterons yielding the same thermal
neutron flux per primary particle as do protons of 1100 MeV?
Inspection of figure 2 shows that only a slight (linear) extrapo-
lation of the deuteron lines is necessary to see that 850 MeV
deuterons on a lead target will yield the same thermal flux like
1100 MeV protons. For the uranium target we find that 900 MeV
deuteron are sufficient to yield the same flux as 1100 MeV pro-
tons.
If we linearly extrapolate the deuteron lines to 1100 MeV, we
can estimate the flux gain we would obtain in employing deuterons
instead of protons. (This extended extrapolation appears to be
justified because the deuterons are likely to have a shorter
effective range in the target relative to protons.) Under this
assumption the flux gain with 1100 MeV deuterons is found to be
about 30% for a lead target and about 23% for a depleted uranium
target.
Table 1 shows a comparison of the gains according to our experi-
mental data for the lead target and the results of Barashenkov's
/1974/ numerical calculations. Although Barashenkov calculated
total fast neutron yields the comparison with our data is certain-
ly justified for the lower energies, where minor coupling and
penetration effects influence the proportionality of fast neutron
yields and thermal leakages. A comparison with Barashenkov's
uranium data is omitted because these results refer to natural
uranium whereas we employed depleted uranium.
For the sake of completeness we have added table 2, in which the
results for the other target-moderator-reflector configurations
are listed. Most of these data may be of academic interest only.

625
Theory [ Barashenkov] This experiment This experiment
E [ MeV] (lead target) (depleted uranium)
Nd+ / N + 4d+ / P+ (d+ / p+
400 1.11 1.10 1.13
600 1.18 1.22 1.24
750 1.16 1.23 1.16
1100 (1.13) (1.30) (1.23)
extrapolated values
Table 1: Comparison of numerical calculations /Barashenkov,1974/ of fast neutron gain Nd+/ND+ with experimentaldata for the thermal neutron leakage gain *d+/c(b+on changing from protons (p+) to deuterons (d+). Thecomparison is for a lead target. The column on theright are experimental values for a depleted uraniumtarget.
d+ / P+
grooved polyethylene moderator
E [MeV] lead target depleted uranium target
lead shielding no lead shielding no
no reflector reflector + shielding no reflector reflector + shielding
400 1.11 1.07 - -
600 1.18 1.26 - -
750 1.20 1.24 - 1.19
Table 2: Thermal neutron leakage gain factors for a groovedpolyethylene moderator in several configurations. Di-mensions of the moderator are 13.5x10x20 cm3 with 1 cmwide and 6 cm deep grooves pointing toward the neutronbeam tube.

626
4. CONCLUSION
It is obvious that a thorough discussion of the advantages and
disadvantages of employing deuterons, even on the basis of our
experimental results, is beyond the scope of this report since
this would involve accelerator technology quite heavily. More-
over, not every aspect can be formulated as a quantitative argu-
ment, so the final decision will have to balance quantitative
economic aspects and qualitative reasons. We shall only give a
brief summary of the pros and cons. There are mainly two pros:
Firstly, an 850 MeV deuteron linac has less than 70 % of the
length of an 1100 MeV proton linac if we utilize the same rf-
frequency. This reduces investment costs at about the same ratio.
Secondly lowering the primary particle energy reduces the power
consumption of the linac and thereby the running costs of the
spallation source, which are the dominating part (> 50%) thereof.
The two essential cons are: Firstly, under the assumption of
a fixed pre-accelarator (dc-accelerator) energy, deuterons would
leave that injector part with lower velocity, whence shorter
drift- tubes or lower rf-frequency for the Alvarez-linac were
necessary. Both is unfavourable because of weaker beam focussing
and worse economics respectively. This drawback may be circum-
vented utilizing an RFQ-structure instead of the electrostatic
pre-accelerator, because these structures are expected to reach
about 2 MeV. Secondly, deuterons produce activation due to d-d
reactions already in the low-energy injector structures, a fact
which might impede the operation. This latter disadvantage is
certainly not easily transferrable into quantitative economic
terms.

627
REFERENCES
V.S. Barashenkov, V.D. Toneev, and S.E. Chigrinov;Atomnaya Energiya, 37, 480 (1974) (engl. translation: Sov. J.Atomic Energy 37, 1216 (1975) )
G.S. Bauer, J.P. Delahaye, H. Spitzer, A.D. Taylor, and K. Werner(1981 a)"Relative Intensities and Time Structure of Thermal NeutronLeakage from Various Moderator-Decoupler Systems for a Spalla-tion Neutron Source"paper D2-3 in "ICANS V" pp. 417-444, G.S. Bauer and F. Filges,eds., report Jul-Conf-45, Kernforschungsanlage Julich
G.S. Bauer, W.E. Fischer, F. Gompf, M. KUchle, W. Reichardt, andH. Spitzer (1981 b)"Thermal Neutron Leakage and Time Structure Measured for VariousTarget-Moderator-Reflector Configurations for a Spallation Neu-tron Source"paper D2-4 in "ICANS V" pp. 445-474, G.S. Bauer and D. Filges,eds., report Jul-Conf-45, Kernforschungsanlage Julich
G.S. Bauer, H.M. Conrad, H. Spitzer, K. Friedrich, andG. Milleret (1981 c)"Measurement of Time Structure and Thermal Neutron Spectra forVarious Target-Moderator-Reflector Configurations of an Intensi-ty-Modulated Spallation Neutron Source"paper D2-5 in "ICANS V" pp. 475-488, G.S. Bauer and D. Filges,eds., report Jul-Conf-45, Kernforschungsanlage Julich

628

629
ICANS-VI
INTERNATIONAL COLLABORATION ON ADVANCED NEUTRON SOURCES
June 27 - July 2, 1982
MONTE CARLO STUDY OF THE ENERGY DEPOSITION OF A FLUX OF
SPALLATION NEUTRONS IN VARIOUS SAMPLES
M. PepinSchweizerisches Institut fur Nuklearforschung
CH-5234 Villigen, Switzerland
ABSTRACT
The flux of spallation neutrons produced on a sample by a 10 jAbeam of 520 MeV protons incident on a 25 cm long cylindrical leadtarget of 7.7 cm radius was estimated with the Monte Carlo codesHET and 05R. In order to save computing time, the simulation wasdone in two steps, and the number of high-energy neutrons in theregion of interest could be enhanced at the end of the first step.The calculated flux was compared with the values measured byS. Cierjacks, M.T. Rainbow, M.T. Swinhoe, and L. Buth at 590 MeV.The energy deposed in the sample by nuclear reactions above 15 MeVand by elastic recoils was estimated for the materials Be, C, Al,Fe, Cu, W, Pb, Bi and D20. For a 10 yA incoming beam, the totalenergy deposition varies between 1.02 x 10⁻⁴ cal/cm 3 sec for Bi and3.30 x 10-4 cal/cm3 sec for 020. The fraction of this energy whichis deposed through elastic revoils varies from 6 % for Bi to 88 %for D20.

630
MONTE CARLO STUDY OF THE ENERGY DEPOSITION OF A FLUX OFSPALLATION NEUTRONS IN VARIOUS SAMPLES
M. PepinSchweizerisches Institut fur Nuklearforschung
CH-5234 Villigen, Switzerland
1. INTRODUCTION
The design of high-intensity spallation neutron sources requiresa better knowledge of the heating effects of the neutron flux onthe components of the source than is now available. In order tolearn more about these effects, an experiment to measure theheat-up of samples of the nine materials Be, C, Al, Fe, Cu, W,Pb, Bi and 020 in the flux of the TRIUMF neutron source is beingplanned as a collaboration between KFA Jtlich and SIN, and willbe carried out at the end of this year.
In preparation for this experiment we have used the Monte Carlocodes HET [1] and 05R [2] to estimate
(i) the neutron flux expected at the sample positionin conditions approximating the planned experiment,and
(ii) the expected values of heat deposition throughhigh-energy nuclear interactions and throughelastic recoils for all nine sample materials.
2. GEOMETRY OF THE SOURCE
The geometry assumed for the computation is a simplified versionof the TRIUMF neutron source (see Fig. 1). In particular, thewalls containing the moderator baths are omitted and only acentral volume of 75 x 100 x 100 cm3 is considered.
The production target is a lead cylinder, 25 cm in length and of7.7 cm radius. It is surrounded by a H2 0/D2 0 moderator assemblywhich includes an iron shielding block above the target and twovertical irradiation shafts. In the planned experiment, the sam-ples will be placed in the rectangular shaft to the side of thetarget. To obtain sufficient statistics, a 5 x 5 x 2 cm3 samplewas chosen for the Monte Carlo run, although the experiment willuse samples approximately one order of magnitude smaller in vol-ume. The relative positions of target and sample are shown inFig. 2.

631
Cylindrical Shaft, 6cm 122cm
Rectangular Shaft j I on l ock6.35m 13.65 CM2
Lead Target I gIl I N15.4 cmn 0
25 cmlog I I Im
E I I I t
y U I ,
i~A PlateI
i "C,
Fig. 1Simplified geometry ofthe central region ofthe TRIUMF neutronsource, as used in theMonte Carlo study.
Q
bum":"31' m is 56cmm
, 3S c. se S'"p
Fig. 2Sketch showing the position of the sample with respectto the lead target, and the definition of the kine-matic parameters used to describe the escaping neutrons.

632
3. ORGANISATION OF THE RUN
The calculation was done in five steps, as follows:
(i) HET run for the Pb target,(ii) fit to the escape spectrum,
(iii) high-energy neutron flux (E > 15 MeV),(iv) low-energy neutron contribution (10 eV < E < 15 MeV),(v) energy deposition.
4. HET RUN FOR THE LEAD TARGET
The beam used in the calculation is a 15 mm radius, 300 i x 250 irmm mrad beam of 520 MeV protons. One hundred thousand cascades weregenerated and followed to the point where the particles escapefrom the lead. The yield of high-energy escapes was 0.627 0.003neutrons and 0.006 - 0.0002 protons per incoming proton. Therewere also (9 t 1)x 10-4 positive pion and (5 1)x 104 negativepion escapes per incoming proton.
The energy deposition in the target was 360 MeV per incoming pro-ton, corresponding to 860 cal/sec for a 10 jA beam.
5. FIT TO THE ESCAPE SPECTRUM
It is clear that a straightforward one-pass Monte Carlo simu-lation of the whole target-moderator-sample system requires aprohibitively large number of incoming protons in order to obtaina meaningful spectrum of neutrons at the sample. We thereforefitted the spectrum of escaping neutrons and regenerated a largenumber of escapes in the region where the neutron has some chanceto make a contribution to the flux on the sample. Propagation ofneutrons escaping outside this region could be dropped.
The kinematic parameters used in this fit are defined in Fig. 2.The lead target was divided lengthwise into five sections of 5 cmeach. For each section, cuts were defined in the polar angle t9between the neutron momentum pn and the z-direction; the cuts wereused to reject events too strongly forward or backward peaked(see Fig. 3). The retained events (about 30 % of the total numberof escapes) were used to plot the following distributions:
(i) z-coordinate of the escape point Q(ii) polar angle 0 for the five intervals of z
(iii) kinetic energy E and angle a for 12 subregions in thez-0 space.
These distributions were used to generate escaping neutrons. For theazimuthal angle v of the escape point, an isotropic distribution
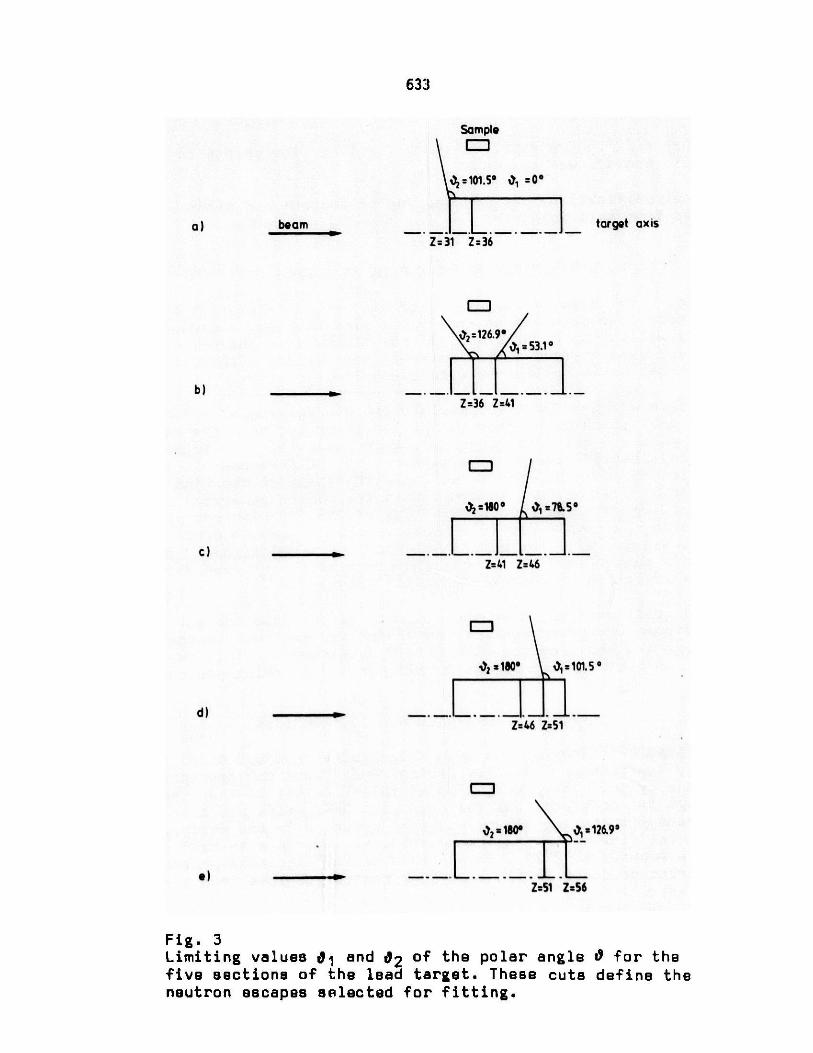
633
Sample
J=101.5* J1 =0*
a) beam target axisZ=31 Z=36
02=126.9*53.10
b) - - .Z=36 Z=41
J2=180* /,=785*
Z=41 Z=46
J2=180* J =101.5 *
Z=46 Z=51
J2 =180 J =126.9:
e) - .Z=51 Z=56
Fig. 3Limiting values 01 and 02 of the polar angle 0 for thefive sections of the lead target. These cuts define theneutron escapes selected for fitting.

634
within a 36-degree sector whose bissecting line points to thesample center, was assumed.
For simplification, the propagation of protons and pions was aban-doned from this point on.
6. HIGH-ENERGY NEUTRON FLUX AT SAMPLE POSITION
In order to allow the treatment of D20, which is present both inthe moderator bath and as one of the nine samples, a Glauber typemodel written by F. Atchison [31 was linked into the HET code,and was used instead of the intranuclear cascade evaporation modelfor non-elastic collisions with deuterium.
The code was then used to simulate the propagation of 105 neutronsfrom the escape point through the moderator and onto the sample.As a check, 5 x 10⁴ neutrons were also generated from each of thetwo adjacent 36-degree sectors. About 12'800 neutrons hit thesample and could be used to estimate the shape of the high-energyspectrum. Scaling back to compensate for the re-generated par-ticles, we obtained an absolute flux of 256 5 high-energy neu-trons on the sample per 105 incoming protons (quoted error isstatistical only). The contribution of the two "adjacent" sectorsto this number is 7 %, so that the contribution of even moredistant sectors can certainly be neglected.
As an additional check on the validity of our fits and cuts, asmall number of cascades were generated and followed in one passthrough the whole system. The result obtained from this run was300 55 neutron hits on the sample per 10 incoming protons.
7. LOW-ENERGY NEUTRON CONTRIBUTION
The first HET pass for the lead target also produced 9.37 low-energy neutrons per incoming proton, which were not transportedfurther by HET. The propagation of this flux out of the lead andthrough the moderator was followed with 05R, which was also usedto transport the low-energy neutrons produced in the moderator.The total flux of low-energy neutrons (10 eV < E < 15 MeV) on thesample amounts to 6121 180 neutrons per 105 incoming protons(neutrons produced in the moderator contribute less than 1 % tothis value).
The neutron spectrum obtained at sample position (low- and high-energy ranges combined) is given in Table I; the Table also showsthe flux of neutrons at target surface and at approximately 900(-0.2 < cos e9 < 0.2).
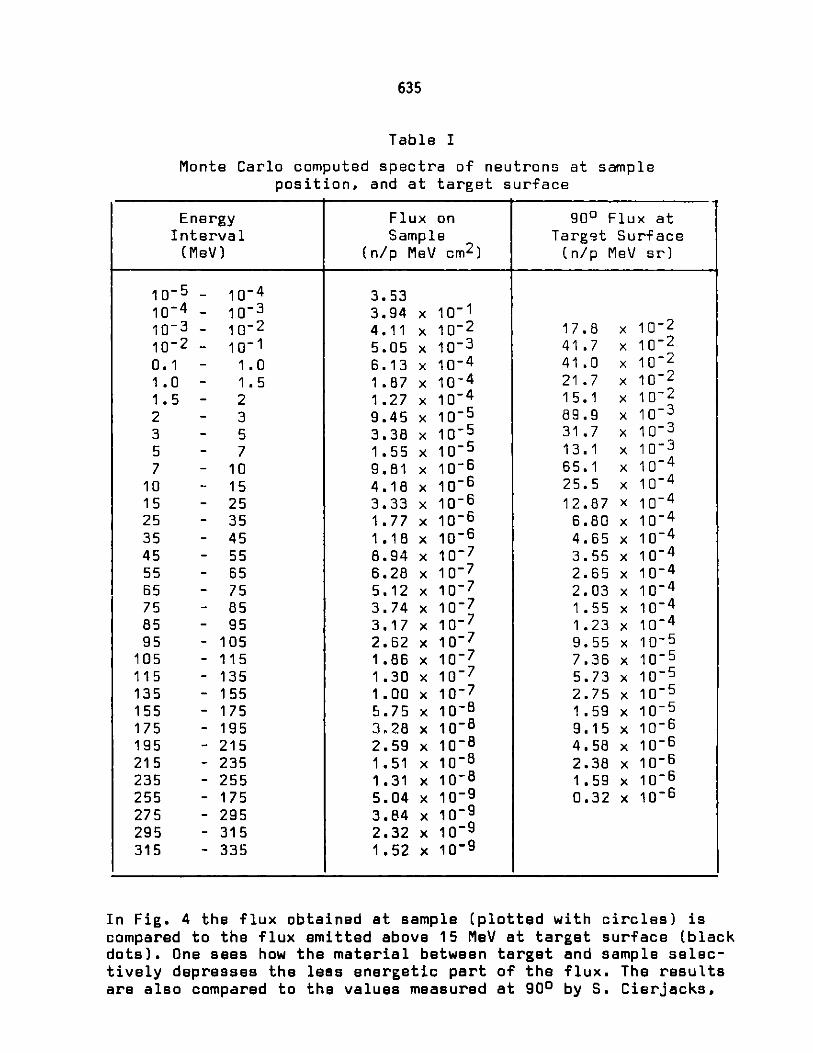
635
Table I
Monte Carlo computed spectra of neutrons at sample
position, and at target surface
Energy Flux on 900 Flux atInterval Sample Targ't Surface(MeV) (n/p MeV cm2 ) (n/p MeV sr)
10-5 - 10~4 3.5310-4 - 10-3 3.94 x 10-110- 3 - 10-2 4.11 x 10⁻² 17.8 x 10-210-2 - 10-1 5.05 x 10⁻³ 41.7 x 10-20.1 - 1.0 6.13 x 10⁻⁴ 41.0 x 10-21.0 - 1.5 1.87 x 10~4 21.7 x 10-21.5 - 2 1.27 x 10⁻⁴ 15.1 x 10⁻²² - 3 9.45 x 10⁻⁵ 89.9 x 10⁻³ - 5 3.38 x 10⁵ 31.7 x 10⁻³
5 - 7 1.55 x 10- 5 13.1 x 10-37 - 10 9.81 x 10- 6 65.1 x 10_4
10 - 15 4.18 x 10⁻⁶ 25.5 x 10415 - 25 3.33 x 10⁻⁶ 12.87 x 10-425 - 35 1.77 x 10⁻⁶ 6.80 x 10-435 - 45 1.18 x 10⁻⁶ 4.65 x 10-445 - 55 8.94 x 10⁻⁷ 3.55 x 10-455 - 65 6.28 x 10⁻⁷ 2.65 x 10-465 - 75 5.12 x 10⁻⁷ 2.03 x 10-475 - 85 3.74 x 10⁻⁷ 1.55 x 10-485 - 95 3.17 x 10⁻⁷ 1.23 x 10-495 - 105 2.62 x 10⁻⁷ 9.55 x 10⁻⁵
105 - 115 1.86 x 10⁻⁷ 7.36 x 10-5115 - 135 1.30 x 10- 7 5.73 x 10-5135 - 155 1.00 x 10- 7 2.75 x 10-5155 - 175 5.75 x 10- 8 1.59 x 10-5175 - 195 3.28 x 10⁻⁸ 9.15 x 10-6195 - 215 2.59 x 10⁻⁸ 4.58 x 10-6215 - 235 1.51 x 10⁻⁸ 2.38 x 10-6235 - 255 1.31 x 10⁻⁸ 1.59 x 10-6255 - 175 5.04 x 10⁻⁹ 0.32 x 10-6275 - 295 3.84 x 10-9295 - 315 2.32 x 10-9315 - 335 1.52 x 10⁻⁹
In Fig. 4 the flux obtained at sample (plotted with circles) iscompared to the flux emitted above 15 MeV at target surface (blackdots). One sees how the material between target and sample selec-tively depresses the less energetic part of the flux. The resultsare also compared to the values measured at 900 by S. Cierjacks,
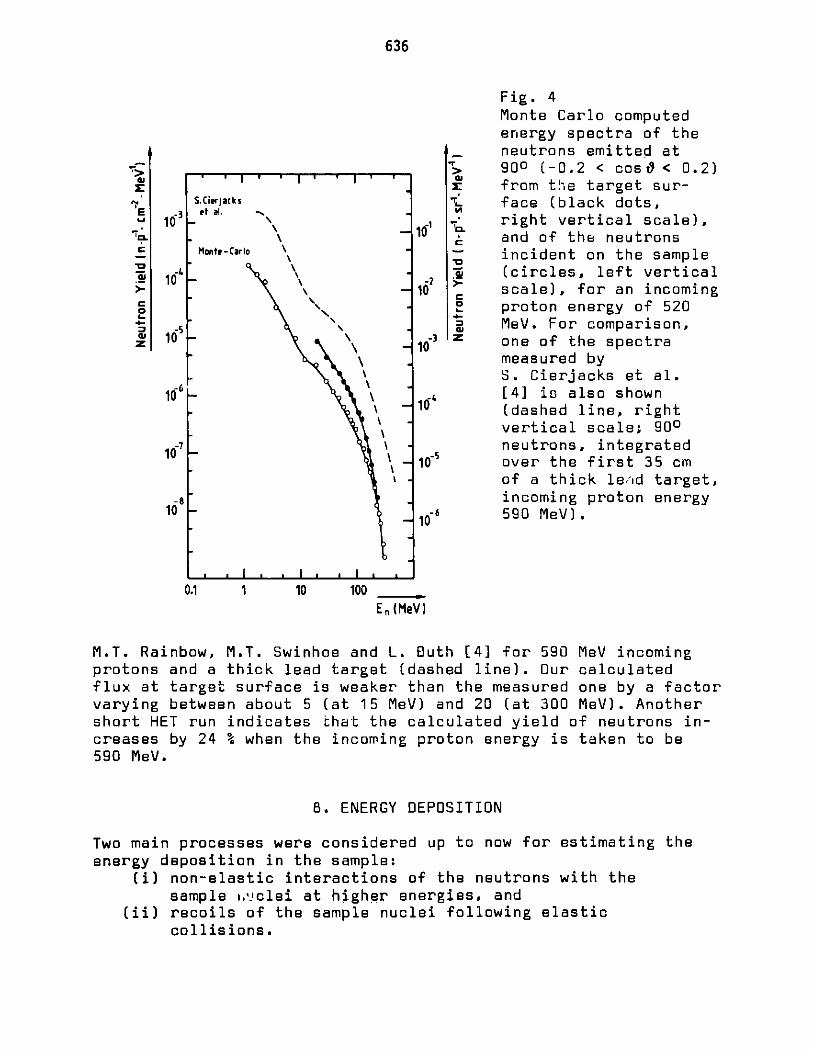
636
Fig. 4Monte Carlo computedenergy spectra of theneutrons emitted at900 (-0.2 < cos t9< 0.2)
E from the target sur-
S.Cirjaks face (black dots,103 -ta right vertical scale),
- 10 and of the neutronsMnt-*ro incident on the sample
2 r (circles, left vertical1-10 scale), for an incoming
- L proton energy of 520
s, MeV. For comparison,z10 -- 0-3 Z one of the spectra
measured byS. Cierjacks et al.
1066-\ ' [4] is also shown10 i(dashed line, right
vertical scale; 900-7\- neutrons, integrated
10 -10 over the first 35 cmof a thick leid target,
.- incoming proton energy10 -106 590 MeV).
0.1 1 10 100En (MeV)
M.T. Rainbow, M.T. Swinhoe and L. Buth [4] for 590 MeV incomingprotons and a thick lead target (dashed line). Our calculatedflux at target surface is weaker than the measured one by a factorvarying between about 5 (at 15 MeV) and 20 (at 300 MeV). Anothershort HET run indicates Chat the calculated yield of neutrons in-creases by 24 % when the incoming proton energy is taken to be590 MeV.
8. ENERGY DEPOSITION
Two main processes were considered up to now for estimating theenergy deposition in the sample:
(i) non-elastic interactions of the neutrons with thesample iclei at higher energies, and
(ii) recoils of the sample nuclei following elasticcollisions.

637
The energy deposition of non-elastic interactions was estimatedby making, for each sample material, a HET run with incidentneutrons generated according to the high-energy part (E > 15 MeV)of our spectrum. The history tapes were then examined with theheat depositon analysis programme ENDEN5 [5].
The number of recoils from elastic collisions was obtained fromour neutron spectrum and from the compilation of neutron cross-sections by D.I. Garber and R.R. Kinsey [6]. The total energydeposition through this mechanism depends on the angular dis-tribution of the recoils. In this estimation we assumed, as asimple model, a linear distribution of the cosine p of the center-of-mass scattering angle,
P(p) = I (1 + 3.f1.p)
with f1 values taken from the ENDF/B data. For lack of betterdata, it was also assumed that the f1 values at 20 MeV were validat all higher energies. The results are shown in Table II.
Table II
Heat deposition from nuclear reactions above 15 MeV Erand from elastic recoils Eel for a 10 iA incoming protonbeam, and corresponding initial rate of sample heat-upfor nine materials.
Energy deposition dT(cal/10 A - sec -"cm3) dt
Er Eel Er + Eel ( C/sec)
Be 1.08 x 10⁻⁴ 1.78 x 10⁻⁴ 2.86 x 10⁻⁴ 3.5 x 10⁻⁴
C 0.99 x 10⁻⁴ 1.03 x 10⁻⁴ 2.02 x 10⁻⁴ 7.6 x 10⁻⁴
Al 0.99 x 10⁻⁴ 0.42 x 10⁻⁴ 1.41 x 10⁻⁴ 2.4 x 10⁻⁴
Fe 2.32 x 10⁻⁴ 0.28 x 10⁻⁴ 2.60 x 10⁻⁴ 3.1 x 10⁻⁴
Cu 2.27 x 10~ 4 0.32 x 10~4 2.59 x 10⁻⁴ 3.1 x 10⁻⁴
W 2.20 x 10⁻⁴ 0.12 x 10⁻⁴ 2.32 x 10⁻⁴ 3.8 x 10⁻⁴
Pb 1.06 x 10⁻⁴ 0.08 x 10~4 1.14 x 10~4 3.3 x 10⁻⁴
Bi 0.96 x 10⁻⁴ 0.06 x 10~4 1.02 x 10~4 3.5 x 10⁻⁴
020 0.41 x 10~4 2.89 x 10~4 3.30 x 10⁻⁴ 3.0 x 10⁻⁴
A noteworthy feature of these results ision through elastic recoils is the major
that the energy deposit-contribution for light
nuclei, and remains a sizeable effect for medium-heavy ones(e.g. 12 % for copper).
638
ACKNOWLEDGEMENTS
I owe a great deal to F. Atchison, who suggested the "guided"Monte Carlo method in order to make this study feasible on aVAX-11/780 computer, and who supplied the Glauber model and heatanalysis programmes [3,5]. His advice and help during the runwere most valuable, and he suggested many improvements to thewriting of this paper.
REFERENCES
[1] HETC, ORNL 4744.[2] 05R, ORNL Report CCC-161/NMTC and CCC-17.[3] F. Atchison, private communication.[4] S. Cierjacks, M.T. Rainbow, M.T. Swinhoe, and L. Buth,
Primarbericht KfK 3097 B, Fig. 6.[5] F. Atchison, ENDEN5, private communication.[6] 0.1. Garber and R.R. Kinsey, Neutron Cross Sections, BNL 325.

639
ICANS-VI
INTERNATIONAL COLLABORATION ON ADVANCED NEUTRON SOURCES
June 27 - July 2, 1982
POSSIBLE USE OF COPPER SPALLATION REACTIONS TO MEASURE
HIGH ENERGY PARTICLE SPECTRA IN SHIELDING EXPERIMENTS
W. Amian, V. Druke, M. Kloda, W. Litzow
Institut fur Reaktorentwicklung
Kernforschungsanlage Julich GmbH
Postfach 1913
D-5170 Julich 1, Germany
ABSTRACT
The formation of spallation products in copper foils has been
used to derive the high energy part of the neutron energy spec-
tra from spallation reactions. Spectra for lead and uranium spal-
lation targets have been measured. The method allows to derive the
neutron energy spectra by unfolding of the measured residual nu-
clei in the energy region of 100 MeV up 650 MeV with reason-
able precision, which is illustrated by the confidence limits
of the neutron spectra derived.
640
POSSIBLE USE OF COPPER SPALLATION REACTIONS TO MEASUREHIGH ENERGY PARTICLE SPECTRA IN SHIELDING EXPERIMENTS
W. Amian, V. Druke, M. Kloda, W. Litzow
Institut fir ReaktorentwicklungKernforschungsanlage Julich GmbH
Postfach 1913D-5170 Julich 1, Germany
INTRODUCTION
Experiments have been performed to measure the formation of
spallation products in copper foils by high energy neutrons
emerging from thick cylindrical spallation targets of lead and
uranium, respectively, bombarded by 1100 MeV protons. In addi-
tion "normal" threshold reaction foils have been used. While
these reactions cover the energy region between about 1 MeV and
20 MeV, the copper spallation reactions have thresholds upto
about 100 MeV. The cross sections for the "normal" threshold
reactions have been taken from /1/, those for the copper spalla-
tion reactions are known only from calculations /2/. The unfol-
ding of the measured activities has been performed with the code
LOUHI78 /3/ to derive the neutron energy spectrum.
EXPERIMENTAL
The copper foils and "normal" threshold reaction foils were
about 10 cm downstream from the beam entrance to the target
(rectangular parallelepiped of 15 x 15 x 90 cm3) immediately on
the target surface. The protonbeam of 1100 MeV energy had 11.2
nA intensity for the uranium target, 22.5 nA for the lead tar-
641
get, respectively. The formation of Fe59, Co58, Co57, Co56, Mn52,
V48, Sc46 and Sc44 in the copper foils and of the respective
isotopes in the "normal" threshold foils has been measured by
gamma-ray spectrometry using Ge(Li)-detectors. Table I gives the
saturation activities in units of decays per second per detector
nucleus per proton.
The copper foils have been measured about three hours after the
end of bombardment and afterwards about three months later. This
explains why Cr48 and Na24 which have relatively long half lifes
and low production cross sections have not been observed. Later
experiments should reveal their existence by counting at inter-
mediate cooling times. Strong overlapping activities at short
times (hours) stem from Cu61, Mn56, Ni65, Cu64.
RESULTS AND DISCUSSION
The spallation yield cross sections of different products for
copper as calculated according to the Rudstam formulas /2/ are
presented in figure 1. In the case of the "normal" threshold
reactions, the cross sections have been set to zero above the
highest energy known from the literature /1/.
The unfolding of the neutron energy spectra measured with the
copper spallation reactions and the "normal" threshold reactions
has been performed with the code LOUHI78. The comparison of the
measured activities and the ones calculated for the spectrum de-
rived are given in tables II and III, respectively.
642
The agreement of measured and calculated saturation activities
is fairly well. However, since the product yield cross sections
for the copper spallation reactions are not very well known this
reasonable agreement has to be expected. Figure 2 gives the un-
folded spectrum in units of neutrons per cm2 per second per MeV
and per proton for the uranium target, figure 3 for the lead
target.
The confidence bands reveal that only the regions between 3 MeV
and 15 MeV and between 100 MeV and 650 MeV can be unfolded
with sufficient precision. This uniquely corresponds to the re-
gions, where the cross sections dominantly contribute to the re-
actions observed. Further reactions with lower and higher thre-
sholds are needed to get detailed information outside these re-
gions.
643
REFERENCES
/1/ D.I. Garber, R.R. Kinsey
Neutron Cross Sections, Volume II, Curves
BNL 325, Brookhaven National Laboratory (1976)
/2/ G. Rudstam
Z. Naturforschung 21 a (1966) 1027
/3/ J.T. Routti, J.V. Sandberg
Computer Physics Communications 21(198) 119

644
10Fcurve
102 1 59Fe 20 2 58Co
S3 Co61056- -
. 10 5 52Mn 7
6 548V57 46 60
1 -'-8 8ra9 44Sg
11 10 24No
10
-3 210 --
3 5
-4 9 s 1
10100 1 02 103 104
- energy [MeVI
Fig. 1: Calculated spallation cross sections for copper

645
U, 1100MeV
0
0
c.100 >
--
C
10
10
1 10 100 1000neutron energy (MeVI
Fig. 2: Unfolded neutron energy spectrum at the surface,
10 cm from beam entry, for a rectangular uranium
target (15 x 15 x 90 cm3 ) at 1100 MeV

646
Pb, 1100 MeV
C
,n o10
C 0
E
10
10 100 1000neutron energy [MeVI
Fig. 3: Unfolded neutron energy spectrum at the surface,
10 cm from beam entry, for a rectangular lead
target (15 x 15 x 90 cm3) at 1100 MeV

647
Nuclide Half life
45.1 d
70.78 d
270.00 d
77.30 d
5.70 d
16.10 d
83.85 d
3.93 h
23.00 h
15.03 h
Gamma-Energy(keV
1099.22;1291.56
811.75
122.07; 136.43
846.75;1238.28
1434.30; 935.60
983.50;1311.60
1120.52; 889.26
1156..95;
306.00; 116.00
1368.55;2754.10
Saturation Activity(sec-1 /proton/nucleus)Uranium Lead
3.9
5.1
2.7
3.6
2.0
7.7
4.4
2.2
10- 3 0
10-29
10-29
10-30
10-30
10-'s1
10-31
10-31
3.3
4.9
2.9
4.2
9.4
6.6
2.8
10- 3 0
10-29
10-29
10-30
10- 3 1
10- 3 1
10- 3 1
Table I: Saturation activities for the copper spallat ion productsproduced from neutrons emerging from lead and uraniumspallation targets, respectively
Fe59
Co58
Co57
Co56
Mn52
V48
Sc46
Sc44
Cr48
Na24

648
Saturation Activity(sec 1 /proton/nucleus)
Reaction Measured Calculated % Difference
Cu(nsp)Fe59 3.9 10-30 5.1 i0- 3 0 32.2
Cu(nsp)Co58 5.1 10-29 5.1 10-2 9 1.2
Cu(n,sp)Co57 2.7 10-29 1.5 l0-29 44.2
Cu(nsp)Co56 3.6 10-30 3.1 10-30 14.6
Cu(n,sp)Mn52 2.0 10-30 1.1 10-30 43.8
Cu(n,sp)V48 7.7 10-31 5.5 10- 3 1 28.7
Cu(n,sp)Sc46 4.4 10-30 3.2 10- 3 0 26.4
Cu(n,sp)Sc44 2.2 10-30 3.0 10- 3 0 40.8
Fe54(n,p)Mn54 5.8 10-27 2.7 10- 2 7 53.7
Inll5(n,n')Inll5m 4.7 10-27 4.8 10- 2 7 1.5
Ni58(n,p)Co58 2.9 10-2 7 3.5 10- 2 7 18.8
Co59(n,a)Mn56 5.4 10-29 4.1 10- 2 9 25.4
Nb93(n,2n)Nb29m 3.5 10-2 8 3.9 10- 2 8 14.6
Zr90(n,2n)Zr89 1.1 10- 2 7 1.1 10- 2 7 3.3
Table II: Saturation activities of the reactions observedin comparison to the calculated saturation acti-vities for the uranium target at 1100 MeV protonenergy

649
Saturation Activity(sec-1 /proton/nucleus)
Reaction Measured Calculated % Difference
Cu(n,sp)Fe59 3.3 10-30 3.9 10-30 17.3
Cu(n,sp)Co58 4.9 10-29 3.9 10-29 20.9
Cu(n,sp)Co57 2.9 10-29 1.1 10- 2 9 60.5
Cu(n,sp)Co56 4.2 10-30 2.4 10- 3 0 43.2
Cu(n,sp)V48 9.4 10-31 6.2 10-31 34.3
Cu(n,sp)Sc46 6.6 10-31 4.0 10-31 39.5
Cu(n,sp)Sc44 2.8 10-31 4.2 10-31 48.9
Fe54(n,p)Mn54 4.5 10-27 1.7 10- 2 7 62.3
1n115(n,n')Inll5m 2.9 10-27 2.7 10- 2 7 7.3
Ni58(n,p)Co58 1.8 10-27 2.2 10-27 21.7
Co59(n,a)Mn56 4.2 10-29 3.4 10-29 18.8
Nb93(n,2n)Nb29m 2.8 10-28 3.4 10-28 21.8
Zr90(n,2n)Zr89 1.0 10-27 1.1 10- 2 7 10.0
Table III: Saturation activities of the reactions observedin comparison to the calculated saturation acti-vities for the lead target at 1100 MeV protonenergy

650
651
Summary of Afternoon Session, Tuesday, June 29, 1982
A. Carne & T. Broome
Though the session was nominally on Nuclear Data and Codes it did also
contain some papers from the morning session. I believe our early change to
have the Tuesday sessions in series rather than in parallel turned out to be
the right one because of the overall interest that the Target Station
designers have in the whole range of topics.
The Session was a broad ranging one so that it is difficult to make a
general summary, and it may be easier to quickly run through the papers and
try to pick out salient features.
The first report we heard was on the IPNS Radiation Effects Facility
given by Bob Birtcher. The requirement of a good REF was of course high
flux (> 1012 n/cm2/sec En > 0.1 MeV), pure n beams with no charged particles
or y's (particularly because of their effect on the cryogenics), easy access,
large volumes and control of flux achieved by control of the accelerator.
Some of the features were described with the conclusion that a uranium target
was better than tantalum giving about 50% more neutrons in total and 73% more
with energies above 0.1 MeV. Flux distributions were as expected and the
neutron spectrum was rather similar to that of the irradiation facility at
CP-5 except for the much higher component of neutrons above 1 MeV. Overall
the performance met reasonably well with the predictions of HETC/VIM. We of
the RAL were encouraged by this report where we hope to achieve similar per-
formance, but where we will be parasiting on the main target assembly.
The paper by Harold Conrad discussed the time structure of pulses from
H20 and D20 moderators. Experiments were carried out at SIN at 590 MeV using
the proton chopper. Several combinations of moderator, target and reflector
were examined including slab targets of Pb, 238U and W. Also examined was a
heavily grooved "starlight" moderator to simulate 6 beam tube faces, which
however appeared to act as a flux trap. The data displayed could be
characterized by two neutron dwell times. The conclusion from the talk was to
propose halving the SNQ pulse length to 250ps and doubling the peak intensity
to maintain the same average proton current. The resulting shortened dwell
time would increase 9th by 100%.
The third paper was a first ever report on y calculations for spallation
targets. The target was Pb, rather than Pb-Bi, 5 cm dia., 530 MeV at 1.5 NA

652
(a = 2 cm, truncated at 10 cm). The various sources of y production and
transport were examined with some surprising results of spectrum softening and
strong absorption in the target. The overall photon emission in the target
was about 17.5 kW of which about 20%, i.e. 3.9 kW, escaped from the target to
which must be added a further 0.34 kW from e , pair production etc. In
broad terms the y escape was about 1/10 of the neutron escape.
The next two papers were presented by Detlef Filges. The first was a
very comprehensive review on "Computational Methods in Beam Tube Shielding".
It is clear that standard attenuation methods are inadequate to deal with
complex geometries. Further the material attenuation length is a vital
parameter but is poorly known. As an example the SNQ requires 17 decades of
shielding, ie a material attenuation of e30 or 6 m of iron; however a 10%
error in Xatt. is equivalent to about 1 m of iron or 1 - 2 orders of magnitude
in radiation dose. For SNQ the code system of HETC plus MORSE + ANISN or DOT
is being used and the calculations to be done on beam holes were described.
Note that ANISN and DOT deal only with neutrons and gammas so there is a need
for validations to ensure that they are dominating. There is a need for high
energy multigroup cross-section data particularly for the high energies of
SNQ. Finally the use of importance sampling in HETC and for charged particles
was proposed.
The second paper discussed high energy fission models. The Cosmotron
experiments were mocked up for 540, 960, 1470 MeV, Pb and 238U . At 960 MeV
(the energy closest to SNQ) the thermal neutron flux ratio for U to Pb was 2.
The recoil products add greatly to energy deposition when high energy fission
is included. Thin target experiments of Cierjacks with 590 MeV protons on2 38U for several angles were compared with the RAL model (with B = 14). In
angular distribution agreement appeared to be within about 25% and good agree-
ment in spectra apart from < few MeV in the evaporation part. Compared with
the limited experimental data the model appeared to underestimate high energy
neutron and proton production. On residual mass the RAL and Alsmiller codes
were compared at 1 GeV. In the vicinity of the fission peak there was good
agreement, but the RAL code predicted a wider fission product mass range.
There was a second (spallation) peak and a third, intermediate peak predicted
by the RAL code but not produced at all by the Alsmiller code.
Marcel Barbier discussed in a short paper neutron production in heavy ion
interactions. The interest is strong for heavy ion fusion and could be also
for some future neutron source. From some, as yet, rather limited data some

653
estimates of neutron production were presented.
The next paper by Rick Jones of CRNL was on Neutron Yields for 100 MeV
protons on Pb and Li. The basis was from the original specification at the
EMTF* proposal (70 mA at 200 MeV on Pb-Bi) which was one of four projects
among the Canadian plans towards electronuclear breeding, the last of which
was the 300 mA 1 GeV accelerator. The experiment itself used the now familiar
water bath technique, but where very careful examination of experimental
errors in systematics was done. From a Pb target 1 cm long a yield of neu-
trons of 0.34 n/p was obtained in good agreement with the codes, but less good
for Li. There was good agreement with the calculations using NMTC/MORSE.
Larry Greenwood discussed the methods of neutron and proton dosimetry
at spallation sources, particularly using activation methods to characterize
particle spectra both in IPNS NST & REF. He used 27A foils in the beam using
the 27A2(p,x)22Na reaction to get long lifetime because of foil access prob-
lems. There appeared to be a discrepancy between beam toroid and the foils
which gave a lower apparent beam. The LANL people reported that they had used2 7A foils to give 7Be, 22Na and 24Na and obtained agreement with toroid
readings of better than 10%.
The last paper of the day was that of Harold Conrad, comparing deuterium
with protons for the primary beam for a neutron source. He examined d, p on
Pb and U over several energies and concludes that d would give a gain in neu-
tron production over p at 1.1 GeV of about 30%, and 10-15% at 400 MeV. The
30% gain was equivalent to saying that an 850 MeV d linac was equivalent to a
1.1 GeV proton one, ie an accelerator of about 2/3 the length. This remark
was questioned by some members of the audience but it was felt that it would
be a good challenge to offer to the other 1/3 of the ICANS collaboration - the
accelerator experts. Such papers (with that of M. Barbier) are good ones to
end a session for they remind us that not only must we help each other on
todays sources but we must also look forwared to the bigger and better ones of
the future.
*ElectroMagnetic Test Facility

6th Meeting of the InternationalCollaboration on Advanced Neutron Sources
June 28 - July 2, 1982Argonne National Laboratory
Argonne, Illinois U.S.A.

655
3 6 38 404243 (4 )®
0OiigrP12c13 tu0(15)
(11)
Pictured Missing from Picture
Bohringer, D.
Filges, D.
Goldstone, J.
Taylor, A.
Woods, R.
Carpenter, J.
Carne, A.Silver, R.Crawford, R. K.Bauer, G. S.Watanabe, N.Loewenhaupt, M.Armstrong, A. W.Fluharty, R. G.Inoue, K.
Diplock, B. R.Dorem, J. H.Howells, W. S.Stelzer, J. F.
Schulke, A. W.Holden, T.
Prael, R. E.
Brun, T. 0.
24.25.26.
27.28.29.30.31.32.
33.34.35.36.37.38.39.40.41.42.43.44.45.46.
Hecker, R.Felcher, G. P.Brugger, R. M.Russell, G. J.Mildner, D. F. R.Lander, G. H.
Williams, W. G.
Roach, P.Barbier, M. M.
Robinson, H.
Broome, T. A.
Worlton, T. G.Jones, R. T.Tschalr, C.
Poulten, B.
Conrad, H. M.
Epperson, J. E.Mizuki, J.Wroe, H.
Mueller, M. H.
Kohgi, M.Fischer, W. E.Jorgensen, J. D.
Amian, W.Birtcher, R. C.
Borso, C.
Brown, B. S.
Carlile, C. J.Chidley, B. G.Cloth, P.
Copley, J. R. D.Eckert, J.Faber, J., Jr.Gray, D. A.Greenwood, L.
Kazadi, S. M.Kliewer, K. L.Meese, J.
Meier, M. M.Mezei, F.Moon, R. M.Ottinetti, L.Popek, R.Price, D. L.Rotella, F. J.Satija, S. K.Schultz, A. J.Sinha, S. K.Smither, R.
1.2.
3.4.5.6.7.8.9.
10.11.12.
13.14.15.16.17.18.19.20.21.22.23.

656
List of Attendees6th Meeting of the International
Collaboration on Advanced Neutron SourcesJune 27 - July 2, 1982
Argonne National LaboratoryBuilding 362 Auditorium
Affiliation
1.
2.
3.
4.
5.
6.
7.
8.
9.
10.
11.
12.
13.
14.
15.
16.
17.
18.
19.
20.
21.
22.
23.
24.
25.
26.
27.
28.
29.
30.
Amian, W.
Armstrong, Tony
Barbier, Marcel
Bauer, Gunter S.
Birtcher, R. C.
Bohringer, D. E.
Borso, C.
Broome, Timothy
Brown, Bruce S.
Brugger, Robert M.
Brun, T. 0.
Carlile, C. J.
Carne, Alan
Carpenter, J. M.
Chidley, Bruce G.
Cloth, P.
Conrad, Harald Manfred
Copley, John R. D.
Crawford, R. Kent
Diplock, Brian
Eckert, J.
Epperson, J. E.
Faber, J., Jr.
Felcher, G.
Filges, Detlef
Fischer, Walter
Fluharty, Rex G.
Goldstone, Joyce A.
Gray, David A.
Greenwood, Lawrence R.
Name
KFA Julich GmbH
KFA Consultant
Marcel M. Barbier, Inc.
Kernforschungsanlage JUlich
Argonne National Laboratory
Argonne National Laboratory
Argonne National Laboratory
Rutherford Appleton Laboratory
Argonne National Laboratory
Los Alamos National Laboratory
Argonne National Laboratory
Rutherford Appleton Laboratory
Rutherford Appleton Laboratory
Argonne National Laboratory
Atomic Energy of Canada Ltd.
KFA Julich GmbH
KFA Julich GmbH
McMaster University
Argonne National Laboratory
Rutherford Appleton Laboratory
Los Alamos National Laboratory
Argonne National Laboratory
Argonne National Laboratory
Argonne National Laboratory
KFA JUlich GmbH
Swiss Institute for Nuclear Research
Universe Radiations Inc.
Los Alamos National Laboratory
Rutherford Appleton Laboratory
Argonne National Laboratory

Affiliation
31.
32.
33.
34.
35.
36.
37.
38.
39.
40.
41.
42.
43.
44.
45.
46.
47.
48.
49.
50.
51.
52.
53.
54.
55.
56.
57.
58.
59.
60.
61.
62.
63.
Hecker, Rudolf
Holden, Thomas M.
Howells, William Spencer
Inoue, Kazuhiko
Jones, Richard Thomas
Jorgensen, James D.
Kazadi, S. M.
Kliewer, K. L.
Kohgi, Masahumi
Lander, Gerard H.
Loewenhaupt, M.
Meese, J.
Meier, Michael M.
Mezei, Ferenc
Mildner, D. F. R.
Mizuki, Junichiro
Moon, Ralph M.
Mueller, M. H.
Norem, J. H.
Ottinetti, Luca
Popek, R.Poulten, Bernard H.
Prael, Richard E.
Price, David L.
Roach, Pat
Robinson, Harold
Rotella, Frank J.
Russell, G. J.
Satija, S. K.
Schulke, A. W.
Schultz, A. J.
Silver, Richard
Sinha, S. K.
657
Name
KFA Julich GmbH
Atomic Energy of Canada Ltd.
Rutherford Appleton Laboratory
Hokkaido University
Chalk River Nuclear Laboratories
Argonne National Laboratory
Argonne National Laboratory
Argonne National Laboratory
Tohoku University
Argonne National Laboratory
Institut fur Festkorperforschung
University of Missouri
Los Alamos National Laboratory
Institut Laue-Langevin
University of Missouri-Columbia
McMaster University
Oak Ridge National Laboratory
Argonne National Laboratory
Argonne National Laboratory
Argonne National Laboratory
Argonne National Laboratory
Rutherford Appleton Laboratory
Los Alamos National Laboratory
Argonne National Laboratory
Argonne National Laboratory
Los Alamos National Laboratory
Argonne National Laboratory
Los Alamos National Laboratory
Brookhaven National Laboratory
Argonne National Laboratory
Argonne National Laboratory
Los Alamos National Laboratory
Argonne National Laboratory

Affiliation
Smither, R.
Stelzer, Johann F.
Taylor, Andrew D.
Tschalar, Christoph
Watanabe, Noboru
Williams, W. Gavin
Woods, R.
Worlton, T. G.
Wroe, Harold
Argonne National Laboratory
KFA JUlich GmbH
Los Alamos National Laboratory
Swiss Institute for Nuclear Research
KEK-Nat. Lab. for High Energy Physics
Rutherford Appleton Laboratory
Los Alamos National Laboratory
Argonne National Laboratory
Rutherford Appleton Laboratory
Name
658
64.
65.66.
67.
68.
69.
70.
71.
72.

659
List of Authors
Page
Amian, W. - B3-3, B3-9Armstrong, T. W. - B3-1, B3-2Atchison, F. - B2-9Barbier, M. M. - B3-4Bauer, G. S. - A3, B2-8, S6, B3-7Birtcher, R. C. - B2-7Blewitt, T. H. - B2-7Boland, B. C. - B1-16Bolie, V. - B1-9Bresof, I. - B1-10Broome, T. A. - S5, S7Brugger, R. M. - B1-4, B1-9Carlile, C. J. - B1-11Carne, A. - B2-1, S7Carpenter, J. M. - A6, B1-10, B1-11,
B1-14, S2, B2-6Cloth, P. - B3-1, B3-2Conrad, H. M. - B2-8, B3-7Crawford, R. K. - B1-13, S1Daly, R. - B1-13Davidson, P. L. - B1-12Diplock, B. R. - B2-2Druke, V. - B3-9Earle, E. D. - B3-5Eckert, J. - B1-3Endoh, Y. - A2Faber, J. Jr. - B1-1Felcher, G. P. - B1-7Filges, D. - B3-1, B3-2Fischer, W. E. - A5, B2-8, B2-9, S4Fluharty, R. G. - S3Goldstone, J. A. - B1-3, B1-4Gompf, F. - B2-8Gray, D. A. - AlGreenwood, L. R. - B2-7, B3-6Grunhagen, K. - B2-8, B3-7Haumann, J. R. - B1-13Ikeda, S. - B1-14, B1-15, B2-6Inoue, K. - B2-6Ishikawa, Y. - A2, B2-6Iwasa, H. - B2-6Jones, R. T. - B3-5Jorgensen, J. D. - B1-1Kai, K. - B1-15Kirk, M. A. - B2-7Kiyanagi, Y. - B2-6Kloda, M. - 83-9Kohgi, M. - B1-6
551,639503,529
441571
41,431,497,619407407291191207
493,651137,191
217315,651
77,207,217265,309,391
503,529431,619247,299
24723732763958312515
105179
503,52969,431,441,489
485125,137
4311
407,605431,619
247265,279,391
39115,391
391583105279407391639171
660
List of Authors (continued)
Lander, G. H. - A6Lee, J. K. P. - 83-5Litzow, W. - B3-9Lone, M. A. - B3-5Masuda, Y. - B1-14Meier, M. M. - B2-10, S5Mezei, F. - B1-8Milleret, G. - B3-7Moore, R. B. - B3-5Neef, R. D. - B3-2Okazaki, A. - 83-5Olsen, C. E. - B1-4Ostrowski, G. E. - B1-10Peek, N. F. - B3-3Penfold, J. - B1-5Pelizzari, C. A. - B1-10Pepin, M. - B3-8Popek, R. J. - 83-6Potts, C. W. - A6Poulten, B. H. - B2-3Price, D. L. - B1-10Raut, V. - B3-5Reichardt, W. - B2-8Robinson, H. - B2-10Robson, J. M. - 83-5Russell, G. J. - B2-10, SSSantry, D. C. - B3-5Sasaki, H. - A2Sato, S. - B1-14Schultz, A. J. - B1-2Shadoan, D. J. - B3-3Sigg, B. - B2-9Silver, R. N. - A4, B1-9Sinha, S. K. - 81-10Soper, A. K. - B1-4Spitzer, H. - 82-8, B3-7Stelzer, J. F. - B2-5Takeda, Y. - 82-4Taylor, A. D. - B1-3, B1-4, S2, B2-10, 82-11Teller, R. G. - B1-2Townes, B. M. - 83-5Watanabe, N. - A2, B1-14, 81-15, S2, 82-6Williams, J. M. - 81-2Williams, W. G. - 81-5Wood, E. J. - B1-3Worlton, T. G. - 81-13Wroe, H. - 81-12
Page
77583639583265
461,49318161958352958313720755115720762960577
339207583431461583
461,49358315
265115551441
51,191207137
431,619375357
125,137,309,461,475115583
15,265,279,309,391115157125247237

661
Distribution for ANL-82-80
Internal:
E. S. Beckjord L. R. Greenwood D. L. PriceR. C. Birtcher J. D. Jorgensen P. RoachD. E. Bohringer S. M. Kazadi F. J. RotellaC. Borso T. Khoe A. W. SchulkeB. S. Brown M. Kirk A. J. SchultzT. 0. Brun K. L. Kliewer (2) D. ShaftmanJ. M. Carpenter (42) R. L. Kustom S. K. SinhaR. K. Crawford G. H. Lander R. SmitherE. Crosbie W. E. Massey T. G. WorltonJ. E. Epperson M. H. Mueller ANL Contract FileJ. Faber J. H. Norem ANL Patent Dept.G. Felcher L. Ottinetti ANL Libraries (3)B. R. T. Frost R. Popek TIS Files (6)
External:
DOE-TIC (27)Manager, Chicago Operations Office, DOEW. Amian, KFA Julich Gmbh, Julich, GermanyT. Armstrong, LaJolla, Calif.J. D. Axe, Brookhaven National Lab.M. Barbier, Marcel M. Barbier, Inc., Herndon, Va.G. S. Bauer, Kernforschungsanlage, Julich, Germany (3)M. Blume, Brookhaven National Lab.T. Broome, Rutherford Appleton Lab., Abingdon, EnglandW. L. Brown, Bell Labs., Murray Hill, N. J.J. Browne, Los Alamos National Lab.R. M. Brugger, Los Alamos National Lab.C. J. Carlile, Rutherford Appleton Lab., Abingdon, EnglandA. Carne, Rutherford Appleton Lab., Abingdon, EnglandB. G. Chidley, Atomic Energy of Canada Ltd., Chalk River (3)P. Cloth, KFA Jilich Gmbh, JUlich, GermanyJ. B. Cohen, Northwestern U.H. M. Conrad, KFA JUlich GmbH, Julich, GermanyJ. R. D. Copley, McMaster Univ., Hamilton,.Ont., CanadaB. Diplock, Rutherford Appleton Lab., Abingdon, EnglandJ. Eckert, Los Alamos National Lab.P. A. Egelstaff, Univ. of Guelph, Guelph, CanadaD. M. Engelman, Yale Univ.B. E. Fender, Institut Laue-Langevin, Grenoble, FranceD. Filges, KFA Julich GmbH, Julich, GermanyW. E. Fischer, Swiss Institute for Nuclear Research, Villigen, Switzerland (3)R. G. Fluharty, Universe Radiations Inc., Los AlamosJ. A. Goldstone, Los Alamos National Lab.D. A. Gray, Rutherford Appleton Lab., Abingdon, EnglandR. L. Harlow, E. I. duPont de Nemours & Co., Inc., Wilmington, Del.R. Hecker, KFA Julich GmbH, JUlich, GermanyT. M. Holden, Atomic Energy of Canada Ltd., Chalk RiverW. S. Howells, Rutherford Appleton Lab., Abingdon, EnglandK. Inoue, Hokkaido Univ., Sapporo, JapanY. Ishikawa, Tohoku Univ., Sendai, Japan (3)

662
G. A. Jeffrey, Univ. of PittsburghR. T. Jones, Chalk River Nuclear Laboratories, CanadaM. Kohgi, Tohoku Univ., Sendai, JapanB. Larson, Oak Ridge National Lab.M. Loewenhaupt, Institut fur Festkorperforschung, JUlich, GermanyJ. P. McTague, Brookhaven National Lab.J. Meese, Univ. of MissouriM. M. Meier, Los Alamos National Lab.F. Mezei, Institut Laue-Langevin, Grenoble, FranceD. F. R. Mildner, Univ. of Missouri-ColumbiaJ. Mizuki, McMaster Univ., Hamilton, CanadaR. M. Moon, Oak Ridge National Lab.R. Peele, Oak Ridge National Lab.B. H. Poulten, Rutherford Appleton Lab., Abingdon, EnglandR. E. Prael, Los Alamos National Lab.H. Robinson, Los Alamos National Lab.J. M. Rowe, National Bureau of StandardsG. J. Russell, Los Alamos National Lab.. (3)H. Sasaki, KEK-National Lab. for High Energy Physics, Ibaraki-ken, Japan (3)S. K. Satija, Brookhaven National Lab.R. Silver, Los Alamos National Lab.J. F. Stelzer, KFA JUlich GmbH, Jul lich, GermanyG. C. Stirling, Rutherford Appleton Lab., Abingdon, England (3)A. D. Taylor, Los Alamos National Lab.I. M. Thorson, Simon Fraser Univ., Burnaby, Canada (3)C. Tschal r, Swiss Inst. for Nuclear Research, Villigen, SwitzerlandP. J. Vergamini, Los Alamos National Lab.J. E. Vetter, KFK-Karlsruhe GmbH, Germany (3)N. Watanabe, KEK-National Lab. for High Energy Physics, Ibaraki-ken, JapanM. Wilkinson, Oak Ridge National Lab.W. G. Williams, Rutherford Appleton Lab., Abingdon, EnglandR. Woods, Los Alamos National Lab.H. Wroe, Rutherford Appleton Lab., Abingdon, England
Related Documents