Redondo Beach Residential Real Estate Market Conditions October 2016

Welcome message from author
This document is posted to help you gain knowledge. Please leave a comment to let me know what you think about it! Share it to your friends and learn new things together.
Transcript


Table of
Contents
Key Statistics for October
Sales 2016 Residential Sales Stats Year-to-Year Total Sales by Map Area Median 2016 Median Sales Stats Year-to-Year Median Sales by Map Area Listings 2016 Active Listings by Map Area 2016 Total Active Listings vs. Total Sales Year-to-Year Active Listings by Map Area Inventory 2016 Months of Inventory by Map Area Year-to-Year Months of Inventory
Summary
About Hady Chahine Contact Information

Key Statistics for October
Back to Table of Contents
= trending positive = trending positive
= trending negative = trending negative
Month-to-Month Comparison Sep 2015 Oct 2015 Delta (qty) Delta (%) Increase Decrease
Total Sales 63 66 3 4.8%
Median Sales Price 899,000 891,000 (8,000) -0.9%
Median Days to Sell 24 21 -3 -12.5%
Listings 186 169 -17 -9.1%
Sales/Listing Ratio 33.9% 39.1% 5.2% 15.3%
Months of Inventory 3.0 3.0 0.0 0.0%
Monthly Comparison Year-to-Year Oct 2015 Oct 2016 Delta Delta Increase Decrease
Total Sales 83 66 -17 -20.5%
Median Sales Price 850,000 891,000 41,000 4.8%
Median Days to Sell 33 21 -12 -36.4%
Listings 157 169 12 7.6%
Months of Inventory 2.0 3.0 1 50.0%
Back to Table of Contents
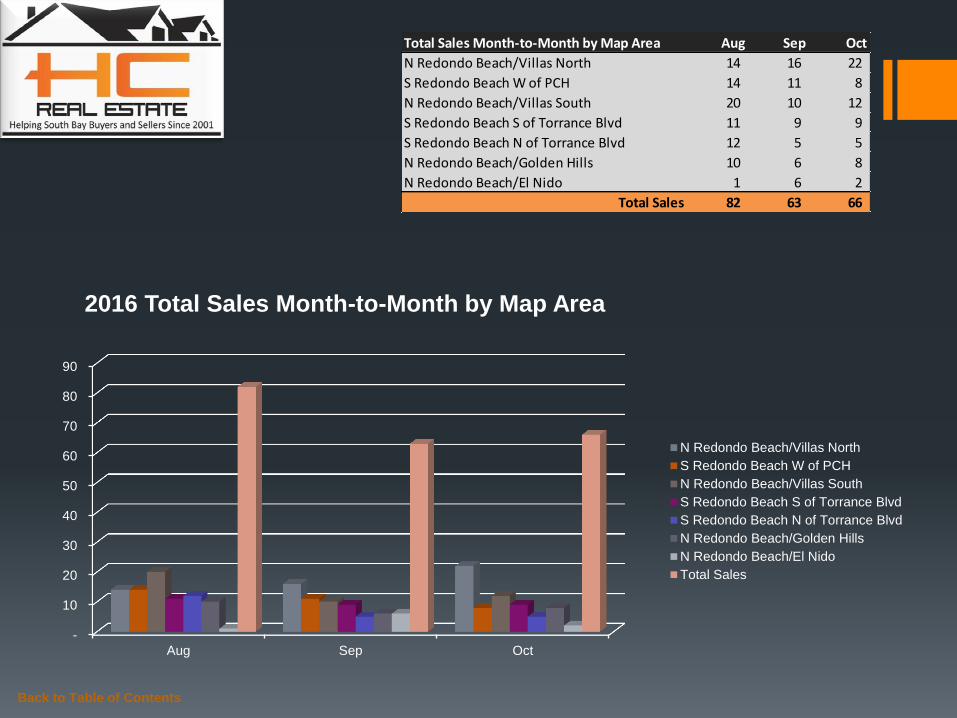
Total Sales Month-to-Month by Map Area Aug Sep Oct
N Redondo Beach/Villas North 14 16 22
S Redondo Beach W of PCH 14 11 8
N Redondo Beach/Villas South 20 10 12
S Redondo Beach S of Torrance Blvd 11 9 9
S Redondo Beach N of Torrance Blvd 12 5 5
N Redondo Beach/Golden Hills 10 6 8
N Redondo Beach/El Nido 1 6 2
Total Sales 82 63 66
-
10
20
30
40
50
60
70
80
90
Aug Sep Oct
2016 Total Sales Month-to-Month by Map Area
N Redondo Beach/Villas North
S Redondo Beach W of PCH
N Redondo Beach/Villas South
S Redondo Beach S of Torrance Blvd
S Redondo Beach N of Torrance Blvd
N Redondo Beach/Golden Hills
N Redondo Beach/El Nido
Total Sales

Back to Table of Contents
Total Sales Year-to-Year by Map Area 2014 2015 2016
N Redondo Beach/Villas North 21 17 22
S Redondo Beach W of PCH 7 10 8
N Redondo Beach/Villas South 15 19 12
S Redondo Beach S of Torrance Blvd 16 14 9
S Redondo Beach N of Torrance Blvd 9 12 5
N Redondo Beach/Golden Hills 5 9 8
N Redondo Beach/El Nido 6 2 2
Total Sales 79 83 66
-
10
20
30
40
50
60
70
80
90
2014 2015 2016
Total Sales Year-to-Year by Map Area: October
N Redondo Beach/Villas North
S Redondo Beach W of PCH
N Redondo Beach/Villas South
S Redondo Beach S of Torrance Blvd
S Redondo Beach N of Torrance Blvd
N Redondo Beach/Golden Hills
N Redondo Beach/El Nido
Total Sales

Back to Table of Contents
Median Sales Price Month-to-Month by Map Area Aug Sep Oct
N Redondo Beach/Villas North 942,000 807,500 857,000
S Redondo Beach W of PCH 882,033 671,000 872,500
N Redondo Beach/Villas South 858,000 792,500 875,950
S Redondo Beach S of Torrance Blvd 1,105,000 1,080,000 1,085,000
S Redondo Beach N of Torrance Blvd 1,072,500 1,040,000 860,000
N Redondo Beach/Golden Hills 1,037,500 993,500 898,500
N Redondo Beach/El Nido 816,000 871,000 1,180,000
Market Median Sales Price 963,000 899,000 891,000
-
200,000
400,000
600,000
800,000
1,000,000
1,200,000
Aug Sep Oct
2016 Median Sales Price Month-to-Month by Map Area
N Redondo Beach/Villas North
S Redondo Beach W of PCH
N Redondo Beach/Villas South
S Redondo Beach S of Torrance Blvd
S Redondo Beach N of Torrance Blvd
N Redondo Beach/Golden Hills
N Redondo Beach/El Nido
Market Median Sales Price

Back to Table of Contents
Median Sales Price Year-to-Year by Map Area 2014 2015 2016
N Redondo Beach/Villas North 705,000 730,000 857,000
S Redondo Beach W of PCH 1,060,000 778,000 872,500
N Redondo Beach/Villas South 808,000 855,000 875,950
S Redondo Beach S of Torrance Blvd 925,000 938,000 1,085,000
S Redondo Beach N of Torrance Blvd 1,167,007 896,000 860,000
N Redondo Beach/Golden Hills 849,000 940,000 898,500
N Redondo Beach/El Nido 726,500 707,500 1,180,000
Market Median Sales Price 808,000 850,000 891,000
-
200,000
400,000
600,000
800,000
1,000,000
1,200,000
2014 2015 2016
Median Sales Price Year-to-Year by Map Area: October
N Redondo Beach/Villas North
S Redondo Beach W of PCH
N Redondo Beach/Villas South
S Redondo Beach S of Torrance Blvd
S Redondo Beach N of Torrance Blvd
N Redondo Beach/Golden Hills
N Redondo Beach/El Nido
Market Median Sales Price

Back to Table of Contents
Active Listings vs. Total Sales by Map Area Jan Feb Mar Apr May Jun Jul Aug Sep Oct Nov Dec
N Redondo Beach/Villas North 9 18 18 14 21 29 26 47 39 39
S Redondo Beach W of PCH 25 31 22 28 30 40 38 30 28 24
N Redondo Beach/Villas South 20 23 28 25 21 40 29 34 41 38
S Redondo Beach S of Torrance Blvd 16 17 24 26 25 25 24 18 21 19
S Redondo Beach N of Torrance Blvd 16 12 13 13 19 23 20 25 29 27
N Redondo Beach/Golden Hills 10 15 14 12 12 11 15 12 19 13
N Redondo Beach/El Nido 2 - 4 4 7 6 6 7 9 9
Total Active Listings 98 116 123 122 135 174 158 173 186 169
-
5
10
15
20
25
30
35
40
45
50
Jan Feb Mar Apr May Jun Jul Aug Sep Oct Nov Dec
2016 Active Listings by Map Area
N Redondo Beach/Villas North
S Redondo Beach W of PCH
N Redondo Beach/Villas South
S Redondo Beach S of Torrance Blvd
S Redondo Beach N of Torrance Blvd
N Redondo Beach/Golden Hills
N Redondo Beach/El Nido

Back to Table of Contents
Active Listings vs. Total Sales by Map Area Jan Feb Mar Apr May Jun Jul Aug Sep Oct Nov Dec
N Redondo Beach/Villas North 9 18 18 14 21 29 26 47 39 39
S Redondo Beach W of PCH 25 31 22 28 30 40 38 30 28 24
N Redondo Beach/Villas South 20 23 28 25 21 40 29 34 41 38
S Redondo Beach S of Torrance Blvd 16 17 24 26 25 25 24 18 21 19
S Redondo Beach N of Torrance Blvd 16 12 13 13 19 23 20 25 29 27
N Redondo Beach/Golden Hills 10 15 14 12 12 11 15 12 19 13
N Redondo Beach/El Nido 2 - 4 4 7 6 6 7 9 9
Total Active Listings 98 116 123 122 135 174 158 173 186 169
Total Sales 54 34 73 87 83 89 83 82 63 66
Sales/Listings Ratio 55.1% 29.3% 59.3% 71.3% 61.5% 51.1% 52.5% 47.4% 33.9% 39.1%
-
20
40
60
80
100
120
140
160
180
200
Jan Feb Mar Apr May Jun Jul Aug Sep Oct Nov Dec
2016 Total Active Listings vs. Total Sales
Total Active Listings Total Sales

Back to Table of Contents
Active Listings Year-to-Year by Map Area 2014 2015 2016
N Redondo Beach/Villas North 32 27 39
S Redondo Beach W of PCH 28 35 24
N Redondo Beach/Villas South 31 23 38
S Redondo Beach S of Torrance Blvd 29 18 19
S Redondo Beach N of Torrance Blvd 36 26 27
N Redondo Beach/Golden Hills 12 15 13
N Redondo Beach/El Nido 9 13 9
Total Active Listings 177 157 169
-
20
40
60
80
100
120
140
160
180
2014 2015 2016
Active Listings Year-to-Year by Map Area: October
N Redondo Beach/Villas North
S Redondo Beach W of PCH
N Redondo Beach/Villas South
S Redondo Beach S of Torrance Blvd
S Redondo Beach N of Torrance Blvd
N Redondo Beach/Golden Hills
N Redondo Beach/El Nido
Total Active Listings
Back to Table of Contents
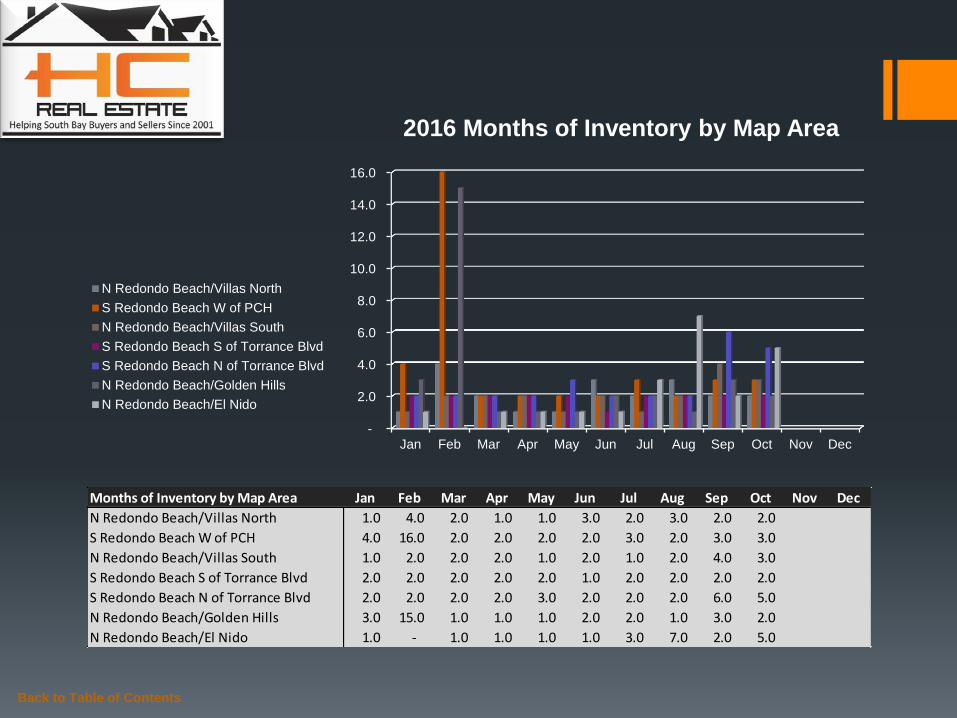
Months of Inventory by Map Area Jan Feb Mar Apr May Jun Jul Aug Sep Oct Nov Dec
N Redondo Beach/Villas North 1.0 4.0 2.0 1.0 1.0 3.0 2.0 3.0 2.0 2.0
S Redondo Beach W of PCH 4.0 16.0 2.0 2.0 2.0 2.0 3.0 2.0 3.0 3.0
N Redondo Beach/Villas South 1.0 2.0 2.0 2.0 1.0 2.0 1.0 2.0 4.0 3.0
S Redondo Beach S of Torrance Blvd 2.0 2.0 2.0 2.0 2.0 1.0 2.0 2.0 2.0 2.0
S Redondo Beach N of Torrance Blvd 2.0 2.0 2.0 2.0 3.0 2.0 2.0 2.0 6.0 5.0
N Redondo Beach/Golden Hills 3.0 15.0 1.0 1.0 1.0 2.0 2.0 1.0 3.0 2.0
N Redondo Beach/El Nido 1.0 - 1.0 1.0 1.0 1.0 3.0 7.0 2.0 5.0
-
2.0
4.0
6.0
8.0
10.0
12.0
14.0
16.0
Jan Feb Mar Apr May Jun Jul Aug Sep Oct Nov Dec
2016 Months of Inventory by Map Area
N Redondo Beach/Villas North
S Redondo Beach W of PCH
N Redondo Beach/Villas South
S Redondo Beach S of Torrance Blvd
S Redondo Beach N of Torrance Blvd
N Redondo Beach/Golden Hills
N Redondo Beach/El Nido
Back to Table of Contents
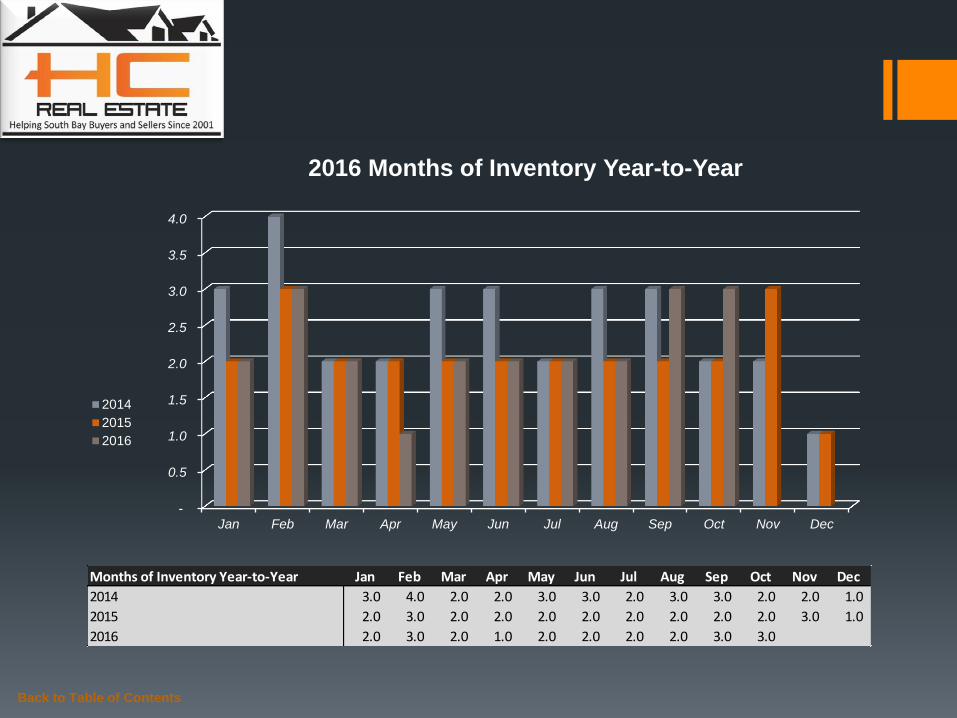
Months of Inventory Year-to-Year Jan Feb Mar Apr May Jun Jul Aug Sep Oct Nov Dec
2014 3.0 4.0 2.0 2.0 3.0 3.0 2.0 3.0 3.0 2.0 2.0 1.0
2015 2.0 3.0 2.0 2.0 2.0 2.0 2.0 2.0 2.0 2.0 3.0 1.0
2016 2.0 3.0 2.0 1.0 2.0 2.0 2.0 2.0 3.0 3.0
-
0.5
1.0
1.5
2.0
2.5
3.0
3.5
4.0
Jan Feb Mar Apr May Jun Jul Aug Sep Oct Nov Dec
2016 Months of Inventory Year-to-Year
2014
2015
2016

Summary Real estate activity in Redondo Beach during October produced mix results as metrics improved for total sales (+4.8%), median days to sell (-12.5%), and the sales-listing ratio (+15.3%). Moving in the opposite direction were the median sales price and net listings, which dropped 0.9% and 9.1% respectively. Year-over-year months of inventory data point increased 50% from 2015 to 2016.
In the news… According to C.A.R., ““thirty-one percent of California households could afford to purchase the $515,940 median-priced home in the third quarter, unchanged from second-quarter 2016 and up from 29 percent in third-quarter 2015.” http://www.car.org/newsstand/newsreleases/2016releases/3qtrhousingaffordability
For listing or buying questions or representation, or further information on market trending behavior, please feel free to contact me anytime. I look forward to hearing from you!
Back to Table of Contents
Monthly Comparison Year-to-Year Oct 2015 Oct 2016 Delta Delta Increase Decrease
Total Sales 83 66 -17 -20.5%
Median Sales Price 850,000 891,000 41,000 4.8%
Median Days to Sell 33 21 -12 -36.4%
Listings 157 169 12 7.6%
Months of Inventory 2.0 3.0 1 50.0%
Month-to-Month Comparison Sep 2015 Oct 2015 Delta (qty) Delta (%) Increase Decrease
Total Sales 63 66 3 4.8%
Median Sales Price 899,000 891,000 (8,000) -0.9%
Median Days to Sell 24 21 -3 -12.5%
Listings 186 169 -17 -9.1%
Sales/Listing Ratio 33.9% 39.1% 5.2% 15.3%
Months of Inventory 3.0 3.0 0.0 0.0%

Serving South Bay Home Buyers and Sellers Since 2001
RE/MAX Top 4 Team in California – 2012
RE/MAX 100% Club - 2011
Shorewood Realtors Top 5% in Overall Sales 2001-2006, 2008-2010
Back to Table of Contents
About
Hady Chahine…

The information being provided by CARETS (CLAW, CRISNet MLS, DAMLS, CRMLS, i-Tech MLS, and/or VCRDS) is for the visitor’s personal, non-commercial use and may not be used for
any purpose other than to identify prospective properties visitor may be interested in purchasing. Any information relating to a property referenced on this web site comes from the Internet
Data Exchange (IDX) program of CARETS. This web site may reference real estate listing(s) held by a brokerage firm other than the broker and/or agent who owns this web site. The accuracy
of all information, regardless of source, including but not limited to square footages and lot sizes, is deemed reliable but not guaranteed and should be personally verified through personal
inspection by and/or with the appropriate professionals.
Back to Table of Contents
Listings MLS BLOG Website
Hady Chahine
• 310-404-5361
Related Documents