foods Article Non-Destructive Quality Assessment of Tomato Paste by Using Portable Mid-Infrared Spectroscopy and Multivariate Analysis Didem Peren Aykas 1,2 , Karla Rodrigues Borba 3 and Luis E. Rodriguez-Saona 1, * 1 Department of Food Science and Technology, The Ohio State University, 100 Parker Food Science and Technology Building, 2015 Fyffe Road, Columbus, OH 43210, USA; [email protected] 2 Department of Food Engineering, Faculty of Engineering, Adnan Menderes University, Aydin 09100, Turkey 3 Department of Food and Nutrition, São Paulo State University, Araraquara 01049-10, Brazil; [email protected] * Correspondence: [email protected]; Tel.: +1-614-292-3339 Received: 11 August 2020; Accepted: 10 September 2020; Published: 15 September 2020 Abstract: This research aims to provide simultaneous predictions of tomato paste’s multiple quality traits without any sample preparation by using a field-deployable portable infrared spectrometer. A total of 1843 tomato paste samples were supplied by four different leading tomato processors in California, USA, over the tomato seasons of 2015, 2016, 2017, and 2019. The reference levels of quality traits including, natural tomato soluble solids (NTSS), pH, Bostwick consistency, titratable acidity (TA), serum viscosity, lycopene, glucose, fructose, ascorbic acid, and citric acid were determined by official methods. A portable FT-IR spectrometer with a triple-reflection diamond ATR sampling system was used to directly collect mid-infrared spectra. The calibration and external validation models were developed by using partial least square regression (PLSR). The evaluation of models was conducted on a randomly selected external validation set. A high correlation (R CV = 0.85–0.99) between the reference values and FT-IR predicted values was observed from PLSR models. The standard errors of prediction were low (SEP = 0.04–35.11), and good predictive performances (RPD = 1.8–7.3) were achieved. Proposed FT-IR technology can be ideal for routine in-plant assessment of the tomato paste quality that would provide the tomato processors with accurate results in shorter time and lower cost. Keywords: tomato paste; quality traits; natural tomato soluble solids; Bostwick consistency serum viscosity; lycopene; FT-IR; PLSR 1. Introduction California produces 96% of the total USA processed tomato products (11–15 million tons annually), and that number represents 30% of the world’s total production [1]. Processed tomatoes are used to make tomato products such as juice, ketchup, sauces, but they are mainly (75%) concentrated into a paste [2,3]. The concentrated paste is generally stored up to 2 years and sold as it is or diluted into value-added products, including sauces, salsas, or ketchup [3–5]. Tomato paste is the main constituent in tomato products, and thus, monitoring and retaining the quality traits during the production process is very important [5,6]. Routine quality control practices involve hourly testing of freshly manufactured tomato paste samples from each production line. These tests include soluble solids, viscosity, consistency, pH, acidity, and color [5,7]. Bostwick consistency or gross viscosity and serum viscosity are the pre-eminent quality parameters of tomato paste in determining consumer’s acceptability and are an essential part of the quality grade standards [8]. Besides having a crucial part in the end-product quality and acceptability, consistency and viscosity also have crucial Foods 2020, 9, 1300; doi:10.3390/foods9091300 www.mdpi.com/journal/foods

Welcome message from author
This document is posted to help you gain knowledge. Please leave a comment to let me know what you think about it! Share it to your friends and learn new things together.
Transcript

foods
Article
Non-Destructive Quality Assessment of Tomato Pasteby Using Portable Mid-Infrared Spectroscopy andMultivariate Analysis
Didem Peren Aykas 1,2, Karla Rodrigues Borba 3 and Luis E. Rodriguez-Saona 1,*1 Department of Food Science and Technology, The Ohio State University,
100 Parker Food Science and Technology Building, 2015 Fyffe Road, Columbus, OH 43210, USA;[email protected]
2 Department of Food Engineering, Faculty of Engineering, Adnan Menderes University, Aydin 09100, Turkey3 Department of Food and Nutrition, São Paulo State University, Araraquara 01049-10, Brazil;
[email protected]* Correspondence: [email protected]; Tel.: +1-614-292-3339
Received: 11 August 2020; Accepted: 10 September 2020; Published: 15 September 2020�����������������
Abstract: This research aims to provide simultaneous predictions of tomato paste’s multiple qualitytraits without any sample preparation by using a field-deployable portable infrared spectrometer.A total of 1843 tomato paste samples were supplied by four different leading tomato processors inCalifornia, USA, over the tomato seasons of 2015, 2016, 2017, and 2019. The reference levels of qualitytraits including, natural tomato soluble solids (NTSS), pH, Bostwick consistency, titratable acidity (TA),serum viscosity, lycopene, glucose, fructose, ascorbic acid, and citric acid were determined by officialmethods. A portable FT-IR spectrometer with a triple-reflection diamond ATR sampling system wasused to directly collect mid-infrared spectra. The calibration and external validation models weredeveloped by using partial least square regression (PLSR). The evaluation of models was conductedon a randomly selected external validation set. A high correlation (RCV = 0.85–0.99) between thereference values and FT-IR predicted values was observed from PLSR models. The standard errorsof prediction were low (SEP = 0.04–35.11), and good predictive performances (RPD = 1.8–7.3) wereachieved. Proposed FT-IR technology can be ideal for routine in-plant assessment of the tomato pastequality that would provide the tomato processors with accurate results in shorter time and lower cost.
Keywords: tomato paste; quality traits; natural tomato soluble solids; Bostwick consistency serumviscosity; lycopene; FT-IR; PLSR
1. Introduction
California produces 96% of the total USA processed tomato products (11–15 million tons annually),and that number represents 30% of the world’s total production [1]. Processed tomatoes are used tomake tomato products such as juice, ketchup, sauces, but they are mainly (75%) concentrated into apaste [2,3]. The concentrated paste is generally stored up to 2 years and sold as it is or diluted intovalue-added products, including sauces, salsas, or ketchup [3–5].
Tomato paste is the main constituent in tomato products, and thus, monitoring and retaining thequality traits during the production process is very important [5,6]. Routine quality control practicesinvolve hourly testing of freshly manufactured tomato paste samples from each production line. These testsinclude soluble solids, viscosity, consistency, pH, acidity, and color [5,7]. Bostwick consistency or grossviscosity and serum viscosity are the pre-eminent quality parameters of tomato paste in determiningconsumer’s acceptability and are an essential part of the quality grade standards [8]. Besides havinga crucial part in the end-product quality and acceptability, consistency and viscosity also have crucial
Foods 2020, 9, 1300; doi:10.3390/foods9091300 www.mdpi.com/journal/foods

Foods 2020, 9, 1300 2 of 14
economic implications for the tomato industry because processed tomatoes with higher consistency andviscosity lower the production costs by decreasing the amount of tomato needed to produce a certainlevel of quality product [8].
The natural tomato soluble solids (NTSS) in fresh tomatoes is mainly contributed by the reducingsugars, which significantly affects the overall quality of the final product, as well as its yield andconsistency [8,9]. The solid content in tomato paste is mainly affected by the degree of concentration,and to some extent, by the cultivar [10]. Similar to the Bostwick consistency and serum viscosity,fresh tomatoes with a higher NTSS content require less tomato fruit and less water removal to reachthe desired end-product quality [8,11]. Sugars and organic acids in tomatoes and their interactionswith the volatile compounds are responsible for the typical sweet-sour flavor of tomatoes or tomatoproducts [12,13]. Glucose and fructose are the main sugars presented in tomato paste with a smallamount of raffinose, arabinose, xylose, and galactose [8]. Two other important quality parameters intomato paste are pH and titratable acidity (TA), which play a key role in food safety and the tomatoflavor. Tomato paste’s pH and the acidity are affected by the cultivar, the ripening stage at the timeof harvesting, the tomato processing conditions (hot vs. cold break processing), growing location,and seasonal variations [2,8,9,14]. Tomatoes are low acidic foods (pH < 4.6), and they do not requireextreme thermal treatment to ensure microbiological food safety; furthermore, the low pH helps toinhibit the spore-forming bacteria Bacillus coagulans, making it less likely that the “flat sour” spoilage isformed [2,10]. A pH of 4.4 is considered the highest desirable value for food safety and to preventthermophilic spoilage [15–17]. The industrial tomato processors in California targets a pH 4.2–4.3range to ensure a margin of safety [2]. Citric acid is the main acid in tomatoes and contributes tothe pH and the titratable acidity [11]. Fresh tomatoes are good sources of vitamin C, but are highlysusceptible towards thermal degradation, therefore during the paste production process, tomatoes loseabout half of their vitamin C content because of the heat applications and processing [18,19].
In consideration of the role played by solids, viscosity, pH, sugars, and acids in tomato quality,several analytical methods have been developed and are currently used in the tomato industry.However, these traditional techniques are time-consuming, require laborious sample preparation,use of hazardous solvents, and high skilled testing personnel, also their applications are limited to thelaboratory environments, and they are not well adapted to routine in-line quality analysis [11]. Each testprovides only one quality trait information at a time, and currently there are still no truly standardizedprotocols for the routine determination of quality parameters in the tomato industry, and there is aneed for standardized protocols. Thus, the development of rapid, cost-effective, and robust techniquesis required for the quality control of tomato products.
Infrared spectroscopy is a promising technique for accurately assessing chemical profiling of rawmaterials and final products in the agro-food sector with simplicity, time- and cost-efficiency [11].The mid-infrared (4000–400 cm−1) region provides powerful vibrational information regarding thefunctional groups in different components and resulted in determining chemical compounds of interest inthe food matrix. Advancements in miniaturization techniques, adaptable sampling accessories includingattenuated total reflectance (ATR), or transmission cell (dial-path) with the corporation of chemometrictechniques offer a valuable tool to tomato processors and breeders for the rapid assessment of tomatoquality traits with real-time screening and field-based assessments. Near-Infrared (NIR) spectroscopyhas been applied for the quantitative determination of soluble solids, pH, sugars, TA, organic acids,firmness, lycopene, and β-carotene in fresh tomatoes [20–26] and in dehydrated tomatoes [27]. Similarly,FT-IR analysis has been successfully implemented to estimate the compositional parameters in freshtomatoes [9,11,13,28–30]. However, none of the previous studies evaluated the application of portableFT-IR spectroscopy on quality parameters of tomato paste, which could be invaluable for tomato pasteprocessors. It is essential to include a vast array of samples rich in compositional variation through thecollection from different processors and years to build a robust calibration model [31].
This study aimed to evaluate the use of the field-deployable portable infrared sensor to thesimultaneous prediction of multiple quality traits of tomato paste (natural tomato soluble solids,
Foods 2020, 9, 1300 3 of 14
pH, Bostwick consistency, titratable acidity, serum viscosity, lycopene, glucose, fructose, ascorbic,and citric acid) without any sample preparation.
2. Materials and Methods
2.1. Tomato Paste Samples
A total of 1843 tomato paste samples were provided by four different major tomato processorsin California, USA, for 2015, 2016, 2017, and 2019. Tomato paste samples were thermally processed,and there was no addition of any food additive.
2.2. Reference Analyses
The reference values for natural tomato soluble solids (NTSS), pH, Bostwick consistency, titratableacidity (TA), and serum viscosity were provided by the quality assurance department of each tomatoprocessor company. In contrast, the quantification of lycopene, individual sugars (glucose and fructose),and acids (ascorbic and citric) was done at the Food Science and Technology department laboratoriesat The Ohio State University (Columbus, OH, USA). Freshly produced tomato paste samples were sentby overnight carrier in insulated boxes with dry ice to sustain the refrigerated temperatures. The NTSS,pH, Bostwick consistency, TA, and serum viscosity tests were performed within the next hour ofthe paste production. On the other hand, overnight shipped samples were stored in refrigeratedconditions (4 ◦C) until analyzed for lycopene, sugars, and acid, that were done within a week ofreceiving the shipments.
The NTSS measurements were carried out by filling ( 34 full) microcentrifuge tubes with non-diluted
tomato paste samples. The microcentrifuge tubes were rotated using a Sorvall-Discovery M150 SEmicrocentrifuge (Thermo Fisher Scientific, Waltham, MA, USA) at 140,000 rpm for 10 min. Once therun is over, the serum portion (upper part) of the sample from each tube was slowly pipetted ontothe prism of the temperature-controlled refractometer (RX 5000i ATAGO, Bellevue, WA, USA) andthe measurement at 25 ◦C were recorded. The pH of tomato paste samples was determined using aMetrohm 827 pH meter (Herisau, Switzerland) at 25 ◦C. Samples were diluted with deionized wateruntil reaching 12 ◦Brix in a glass beaker. Bostwick consistency or gross viscosity of tomato pastesamples were determined using a Bostwick consistometer. Paste samples were diluted with deionizedwater until reaching 12 ◦Brix and approximately getting 200 g of final solution weight. The mixturewas placed into a stomacher blender (Seward™ Stomacher™Model 400, West Sussex, UK) to obtain acompletely homogenous blend. The mixture was cooled or heated to 20 ◦C (68 ◦F), and the chamberof the Bostwick consistometer was filled with the mixture. The diluted paste placed in the chamberwas leveled by removing the excessive sample with a spatula. The gate of the consistometer wasreleased, and the sample flow after 30 s was recorded to the closest 0.1 cm sign. Titratable acidity(TA) were determined with an Easy pH automatic titrator (Mettler Toledo, Columbus, OH, USA) bymixing 10 g of tomato paste with 100 mL deionized water and titrating with 0.1 N NaOH. TA resultswere reported as g citric acid/100 g sample or in %. The samples’ serum viscosity was determined bybringing the paste samples to 6 ◦Brix and centrifuging them at 2000 rpm for 15 min Thermo FisherScientific, Waltham, MA, USA). The supernatant portion of the sample was filtered through a Whatmanno.1 filter paper (Whatman PLC, Maidstone, UK), and the filtrate carefully poured into the large orificeof the Cannon-Fenske viscometer until the line marked in the reservoir. The viscometer was placedinto the 30 ◦C ± 1 ◦C water bath for 5 min for temperature equilibration. The time in seconds it takesfor the meniscus to move from the graduated mark above the lower bulb to the graduated mark belowthe lower bulb was recorded, while both orifices open to the air. The serum viscosity was reported ascentistokes (cSt) and calculated using distilled water’s absolute viscosity under the same conditions.All analyses were conducted in duplicate.
Lycopene concentrations in tomato paste samples were determined following the proceduredescribed by Anthon and Barrett (2007) with some changes [32]. A total of 0.3 g of tomato paste sample
Foods 2020, 9, 1300 4 of 14
was diluted with 1 mL of deionized water and vortexed for 1 min. A total of 0.1 g of diluted tomatopaste was transferred to another centrifuge tube and 8 mL of hexane/ethanol/acetone (HEA) 2:1:1 (v/v/v)solvent mixture was added and vortexed for 45 s. The mixture was kept for 20 min in the dark toavoid lycopene degradation through light irradiation [33]. One mL of deionized water was addedand vortexed for 15 s and stored for 10 min in the dark for phase separation and let the air bubblesdisappear. Absorbance readings were performed using Cary 50 UV-Vis spectrophotometer (AgilentTechnologies Inc., Santa Clara, CA, USA). The equipment was set to 503 nm, which is the maximumabsorption wavelength for lycopene. The equipment was set to zero using a blank prepared withwater (instead of tomato paste) and HEA solvent mixture. Lycopene analysis for the extracted sampleswas conducted in duplicate. The concentration of the lycopene was calculated using the extinctioncoefficient (172 mM−1) and absorbance readings.
Individual sugars, including glucose and fructose concentrations, were simultaneously determinedusing high-performance liquid chromatography (HPLC) (Shimadzu, Columbia, MD, USA) equippedwith a CBM-20A controller, an LC-6AD pump, a SIL-20AHT autosampler, a CTO-20A oven, and aRID-10A refractive index detector. Paste samples (0.2 g) were weighed into a micro-centrifuge tubeand diluted with HPLC grade water (1.6 mL). The mixture was vortexed for 30 s and centrifuged at13,200 rpm for 15 min at 25 ◦C. The supernatant part was filtered through a 0.45 µm pore size filter(Phenomenex®, Torrance, CA, USA) into a glass amber HPLC vial. Extracted sugars were separatedthrough a Rezex RCM-Monosaccharide Ca+ 300 × 7.8 mm column (Phenomenex®, Torrance, CA, USA).The elution of the sugars was carried out isocratically using HPLC grade water as a mobile phase at aflow rate of 1 mL/min for 20 min at 80 ◦C. Chromatograms were automatically integrated using LCSolutions software (Version 3.0, Shimadzu, Columbia, MD, USA). A standard curve was generated tocalculate the individual sugars, with a concentration range from 1.56 to 50 mg/mL (>99% purity, FisherScientific, Fair Lawn, NJ, USA). Sugar analysis was performed in duplicate.
Organic acids, including ascorbic and citric acid concentrations, were determined by an HPLC(1100 Series, Agilent Technologies, Santa Clara, CA, USA) composed of a G1311A quaternary pump,a G1322A degasser, a G1313 ALS autosampler, a G1316A column compartment, and a G1315B diodearray detector. Samples were prepared to mix tomato paste (0.3 g) with 4.5% metaphosphoric acid(1.5 mL) (Fisher Scientific, Fair Lawn, NJ, USA) into a 2 mL microcentrifuge tube and vortexed for30 s. A total of 100 µL of 100 Mm tris (2-carboxyethyl) phosphine (TCEP) (Sigma Aldrich, St. Louis,MO, USA) was added into the centrifuge tube in order to reduce dehydroascorbic acid to ascorbic acidand expand the stability of ascorbic acid [34], samples were incubated at 4 ◦C for 8 h and centrifugedat 10,000 rpm for 15 min at 4 ◦C. Similar to the sugar analysis, supernatant filtered through a 0.45 µmpore size filter (Phenomenex®, Torrance, CA, USA) into a glass amber HPLC vial. The elution of theacids was succeeded through a Prevail™ 5 µ, 150 × 4.6 mm column (Hichrom, Berkshire, UK). A totalof 10 µL sample was injected through the column; pH 2.2 adjusted HPLC grade water was used as amobile phase with a consistent flow rate of 0.8 mL/min. Chromatograms were automatically integratedfor citric acid at 210 nm and ascorbic acid at 245 nm using ChemStation software (Agilent Technologies,Santa Clara, CA, USA). A standard curve was generated to calculate individual organic acids (SigmaAldrich, St. Louis, MO, USA). The acid analysis was performed in duplicate.
2.3. Mid-Infrared Analysis
The spectral collection was carried out in California at each tomato processor’s quality assurancelaboratory, right after the paste production, to minimize any change in the reference values.The mid-infrared analysis was carried out using a portable FT-IR sensor (Agilent Technologies,Santa Clara, CA, USA) coupled with triple-reflection diamond Attenuated Total Reflectance (ATR)crystal. The ATR has a 2 mm diameter sampling surface with a 200 µm active area, which offers~6 µm effective depth of penetration for IR energy at 1700 cm−1. The FT-IR unit is also equippedwith a Zinc Selenide (ZnSe) beam splitter and a thermo-electrically cooled deuterated triglycinesulfate (DTGS) detector. Spectra were collected from 4000 to 650 cm−1 with a resolution of 4
Foods 2020, 9, 1300 5 of 14
cm−1. To increase the signal-to-noise ratio, 64 spectra were co-added in each sample collection,and between every measurement, a spectral background was taken to eliminate the environmentalchanges. Approximately 0.5 gr of tomato paste sample was directly applied to the active area of thesampling surface, ensuring full coverage of the sample is achieved. The spectral collection was done induplication for each sample, and collected spectral data were recorded by using Agilent MicroLab PCsoftware (Agilent Technologies, Danbury, CT, USA).
2.4. Partial Least Squares Regression (PLSR) Analysis
The spectral data were imported as GRAMS (.spc) files from the FT-IR instrument and evaluatedusing Pirouette® comprehensive chemometrics modeling software (version 4.5, Infometrix Inc., Bothell,WA, USA). Partial least squares regression (PLSR) with full cross-validation (leave-one-out approach)was employed to generate multivariate quantitative models to quantify the concentrations of qualitytraits in tomato paste using a portable FT-IR unit. The spectral data were transformed by the mean-center,smoothing (35-points), and Savitsky–Golay second derivative (35-points). PLSR establishes linearcorrelations between the spectral data and the reference values, which maximizes their covariance [35].PLSR sifts the most useful information from a large number of spectral data points into the firstseveral partial least square (PLS) factors (or latent variables—LVs), where the background effects canbe present in the less important factors [36]. The latent variables are the orthogonal factors, whichprovide the highest correlation with the dependent variable. The performance of the regression modelswas evaluated by the number of LVs, scores, loadings, standard error of cross-validation (SECV),the coefficient of determination (R-value), standard error of prediction (SEP), and outlier diagnostics.In contrast, outliers were determined using residual and Mahalanobis distances. The accuracy ofthe calibration models increases with the increasing number of the LVs or factors in the model atfirst, but then decreases as a result of overfitting the data by adding noise, which makes the modelsineffective [37]. On the other hand, selecting too few LVs yields an under-fitted model that integratesinsufficient information of the data. Therefore, the optimal number of LVs-factors should be chosenthrough the cross-validation approach by plotting the SECV against the PLSR factors.
3. Results and Discussion
3.1. Reference Values in Tomato Paste Samples
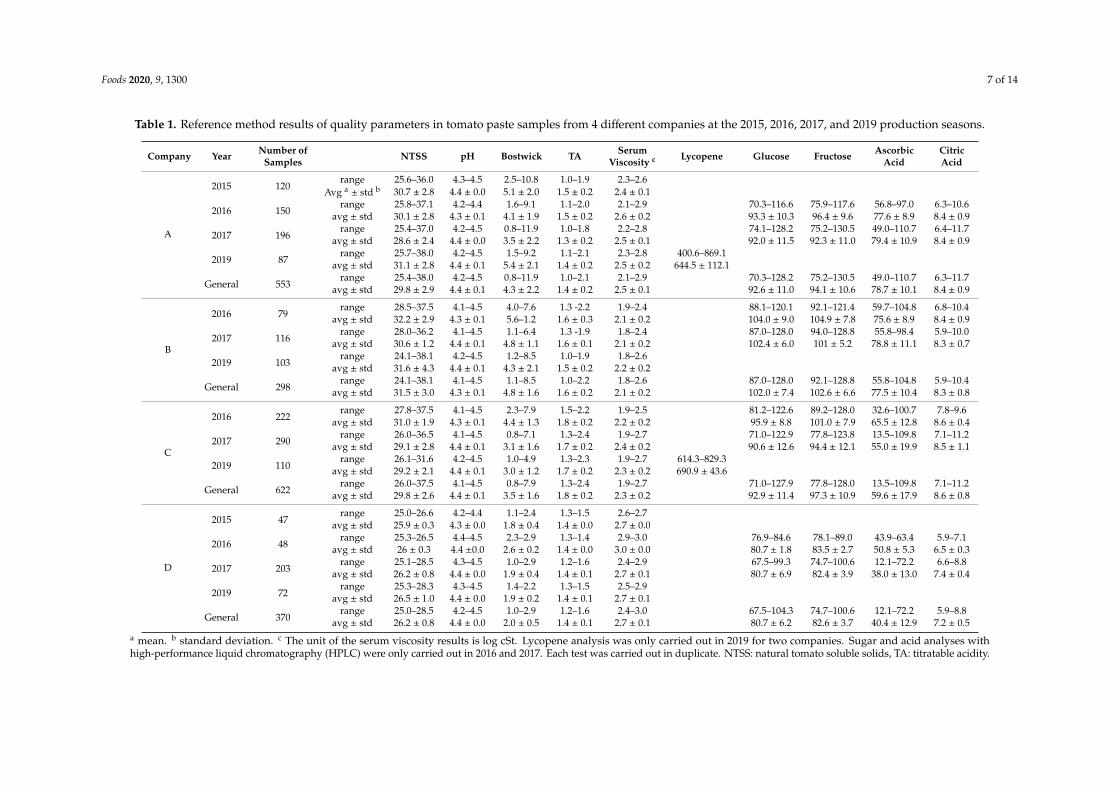
The reference compositional values for ten main quality traits of tomato paste are summarized inTable 1. The inclusion of a large number of paste samples from different years and different processingplants gave a wide range of reference values (Table 1). We should also point out that measurements ofthe quality parameters were performed at different laboratories using different equipment operatedby various individuals, which may introduce variation in the reported results. In general, the valuesthat were obtained in this study were similar to those reported in the literature. Overall the valuesranged from 24.1–38.1 (29.4 ± 3.0) ◦Brix (natural tomato soluble solids—NTSS), 4.14–4.49 (4.37 ± 0.07)for pH, 0.8–11.9 (3.6 ± 1.9) cm for Bostwick consistency, 1.0–2.4 (1.6 ± 0.2) % citric acid for titratableacidity—TA, 64.6–977.2 (317.3 ± 192.8) cSt for serum viscosity, 400.6–869.1 (662.2 ± 94.7) mg/kg forlycopene, 67.5–128.2 (92.0 ± 11.9) g/L for glucose, 74.7–130.5 (94.4 ± 11.2) g/L for fructose, 12.1–110.7(63.6 ± 20.0) mg/100 g for ascorbic acid, and 5.9–11.7 (8.2 ± 0.9) g/100 g for citric acid. Similar levels fortomato paste were also reported by other researchers [5,18,19,38–42]. According to the U.S. Departmentof Agriculture (USDA), the NTSS of the tomato paste should not be less than 24.0 ◦Brix (the maximumamount was not stated), and all the tested tomato paste samples were above that limit. Even though theminimum NTSS limit is 24.0 ◦Brix, the tomato paste producers in California adjust their productionsper customer requirements. All producers except one (Company D) had NTSS at around 30 ◦Brix for all4 years, but company D had an average NTSS of 26 ◦Brix. The pH of the tomato paste was low enough(pH < 4.6) to prevent any problem with pathogenic microorganisms. The pH of good quality pastesnormally lies within the range of 4.0–4.4 to prevent problems with thermophilic microorganisms [8].
Foods 2020, 9, 1300 6 of 14
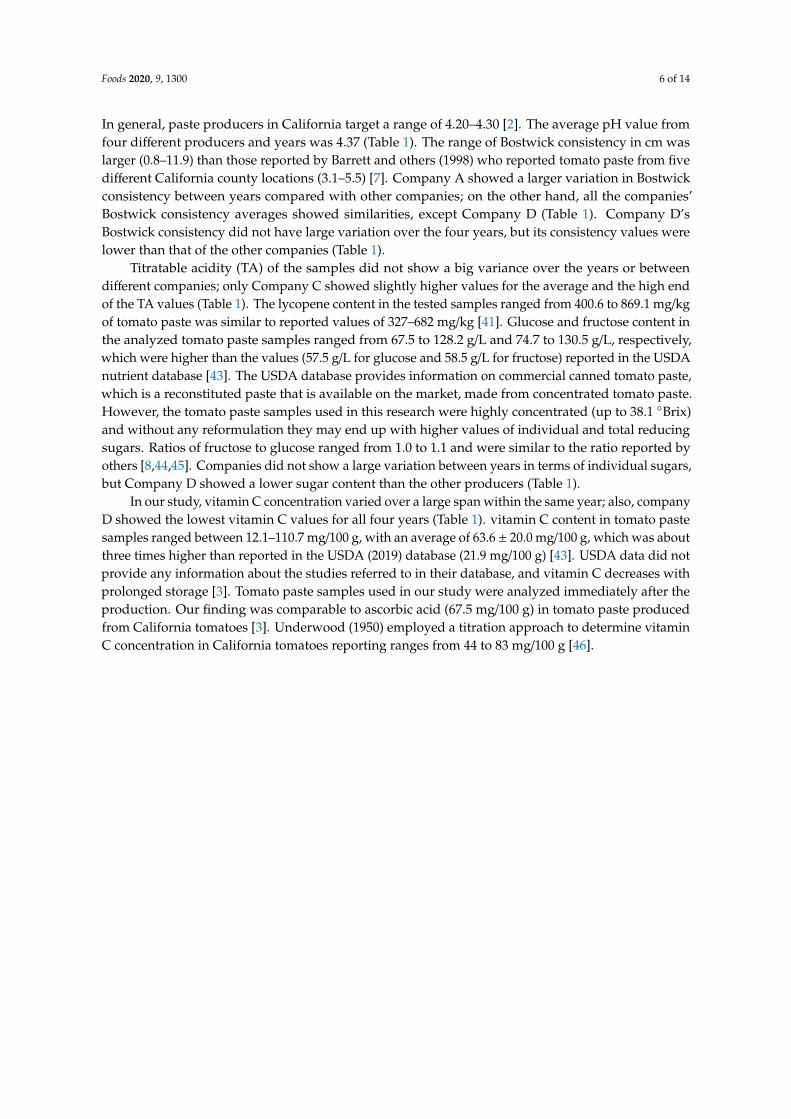
In general, paste producers in California target a range of 4.20–4.30 [2]. The average pH value fromfour different producers and years was 4.37 (Table 1). The range of Bostwick consistency in cm waslarger (0.8–11.9) than those reported by Barrett and others (1998) who reported tomato paste from fivedifferent California county locations (3.1–5.5) [7]. Company A showed a larger variation in Bostwickconsistency between years compared with other companies; on the other hand, all the companies’Bostwick consistency averages showed similarities, except Company D (Table 1). Company D’sBostwick consistency did not have large variation over the four years, but its consistency values werelower than that of the other companies (Table 1).
Titratable acidity (TA) of the samples did not show a big variance over the years or betweendifferent companies; only Company C showed slightly higher values for the average and the high endof the TA values (Table 1). The lycopene content in the tested samples ranged from 400.6 to 869.1 mg/kgof tomato paste was similar to reported values of 327–682 mg/kg [41]. Glucose and fructose content inthe analyzed tomato paste samples ranged from 67.5 to 128.2 g/L and 74.7 to 130.5 g/L, respectively,which were higher than the values (57.5 g/L for glucose and 58.5 g/L for fructose) reported in the USDAnutrient database [43]. The USDA database provides information on commercial canned tomato paste,which is a reconstituted paste that is available on the market, made from concentrated tomato paste.However, the tomato paste samples used in this research were highly concentrated (up to 38.1 ◦Brix)and without any reformulation they may end up with higher values of individual and total reducingsugars. Ratios of fructose to glucose ranged from 1.0 to 1.1 and were similar to the ratio reported byothers [8,44,45]. Companies did not show a large variation between years in terms of individual sugars,but Company D showed a lower sugar content than the other producers (Table 1).
In our study, vitamin C concentration varied over a large span within the same year; also, companyD showed the lowest vitamin C values for all four years (Table 1). vitamin C content in tomato pastesamples ranged between 12.1–110.7 mg/100 g, with an average of 63.6 ± 20.0 mg/100 g, which was aboutthree times higher than reported in the USDA (2019) database (21.9 mg/100 g) [43]. USDA data did notprovide any information about the studies referred to in their database, and vitamin C decreases withprolonged storage [3]. Tomato paste samples used in our study were analyzed immediately after theproduction. Our finding was comparable to ascorbic acid (67.5 mg/100 g) in tomato paste producedfrom California tomatoes [3]. Underwood (1950) employed a titration approach to determine vitaminC concentration in California tomatoes reporting ranges from 44 to 83 mg/100 g [46].
Foods 2020, 9, 1300 7 of 14
Table 1. Reference method results of quality parameters in tomato paste samples from 4 different companies at the 2015, 2016, 2017, and 2019 production seasons.
Company Year Number ofSamples NTSS pH Bostwick TA Serum
Viscosity c Lycopene Glucose Fructose AscorbicAcid
CitricAcid
A
2015 120range 25.6–36.0 4.3–4.5 2.5–10.8 1.0–1.9 2.3–2.6
Avg a± std b 30.7 ± 2.8 4.4 ± 0.0 5.1 ± 2.0 1.5 ± 0.2 2.4 ± 0.1
2016 150range 25.8–37.1 4.2–4.4 1.6–9.1 1.1–2.0 2.1–2.9 70.3–116.6 75.9–117.6 56.8–97.0 6.3–10.6
avg ± std 30.1 ± 2.8 4.3 ± 0.1 4.1 ± 1.9 1.5 ± 0.2 2.6 ± 0.2 93.3 ± 10.3 96.4 ± 9.6 77.6 ± 8.9 8.4 ± 0.9
2017 196range 25.4–37.0 4.2–4.5 0.8–11.9 1.0–1.8 2.2–2.8 74.1–128.2 75.2–130.5 49.0–110.7 6.4–11.7
avg ± std 28.6 ± 2.4 4.4 ± 0.0 3.5 ± 2.2 1.3 ± 0.2 2.5 ± 0.1 92.0 ± 11.5 92.3 ± 11.0 79.4 ± 10.9 8.4 ± 0.9
2019 87range 25.7–38.0 4.2–4.5 1.5–9.2 1.1–2.1 2.3–2.8 400.6–869.1
avg ± std 31.1 ± 2.8 4.4 ± 0.1 5.4 ± 2.1 1.4 ± 0.2 2.5 ± 0.2 644.5 ± 112.1
General 553range 25.4–38.0 4.2–4.5 0.8–11.9 1.0–2.1 2.1–2.9 70.3–128.2 75.2–130.5 49.0–110.7 6.3–11.7
avg ± std 29.8 ± 2.9 4.4 ± 0.1 4.3 ± 2.2 1.4 ± 0.2 2.5 ± 0.1 92.6 ± 11.0 94.1 ± 10.6 78.7 ± 10.1 8.4 ± 0.9
B
2016 79range 28.5–37.5 4.1–4.5 4.0–7.6 1.3 -2.2 1.9–2.4 88.1–120.1 92.1–121.4 59.7–104.8 6.8–10.4
avg ± std 32.2 ± 2.9 4.3 ± 0.1 5.6–1.2 1.6 ± 0.3 2.1 ± 0.2 104.0 ± 9.0 104.9 ± 7.8 75.6 ± 8.9 8.4 ± 0.9
2017 116range 28.0–36.2 4.1–4.5 1.1–6.4 1.3 -1.9 1.8–2.4 87.0–128.0 94.0–128.8 55.8–98.4 5.9–10.0
avg ± std 30.6 ± 1.2 4.4 ± 0.1 4.8 ± 1.1 1.6 ± 0.1 2.1 ± 0.2 102.4 ± 6.0 101 ± 5.2 78.8 ± 11.1 8.3 ± 0.7
2019 103range 24.1–38.1 4.2–4.5 1.2–8.5 1.0–1.9 1.8–2.6
avg ± std 31.6 ± 4.3 4.4 ± 0.1 4.3 ± 2.1 1.5 ± 0.2 2.2 ± 0.2
General 298range 24.1–38.1 4.1–4.5 1.1–8.5 1.0–2.2 1.8–2.6 87.0–128.0 92.1–128.8 55.8–104.8 5.9–10.4
avg ± std 31.5 ± 3.0 4.3 ± 0.1 4.8 ± 1.6 1.6 ± 0.2 2.1 ± 0.2 102.0 ± 7.4 102.6 ± 6.6 77.5 ± 10.4 8.3 ± 0.8
C
2016 222range 27.8–37.5 4.1–4.5 2.3–7.9 1.5–2.2 1.9–2.5 81.2–122.6 89.2–128.0 32.6–100.7 7.8–9.6
avg ± std 31.0 ± 1.9 4.3 ± 0.1 4.4 ± 1.3 1.8 ± 0.2 2.2 ± 0.2 95.9 ± 8.8 101.0 ± 7.9 65.5 ± 12.8 8.6 ± 0.4
2017 290range 26.0–36.5 4.1–4.5 0.8–7.1 1.3–2.4 1.9–2.7 71.0–122.9 77.8–123.8 13.5–109.8 7.1–11.2
avg ± std 29.1 ± 2.8 4.4 ± 0.1 3.1 ± 1.6 1.7 ± 0.2 2.4 ± 0.2 90.6 ± 12.6 94.4 ± 12.1 55.0 ± 19.9 8.5 ± 1.1
2019 110range 26.1–31.6 4.2–4.5 1.0–4.9 1.3–2.3 1.9–2.7 614.3–829.3
avg ± std 29.2 ± 2.1 4.4 ± 0.1 3.0 ± 1.2 1.7 ± 0.2 2.3 ± 0.2 690.9 ± 43.6
General 622range 26.0–37.5 4.1–4.5 0.8–7.9 1.3–2.4 1.9–2.7 71.0–127.9 77.8–128.0 13.5–109.8 7.1–11.2
avg ± std 29.8 ± 2.6 4.4 ± 0.1 3.5 ± 1.6 1.8 ± 0.2 2.3 ± 0.2 92.9 ± 11.4 97.3 ± 10.9 59.6 ± 17.9 8.6 ± 0.8
D
2015 47range 25.0–26.6 4.2–4.4 1.1–2.4 1.3–1.5 2.6–2.7
avg ± std 25.9 ± 0.3 4.3 ± 0.0 1.8 ± 0.4 1.4 ± 0.0 2.7 ± 0.0
2016 48range 25.3–26.5 4.4–4.5 2.3–2.9 1.3–1.4 2.9–3.0 76.9–84.6 78.1–89.0 43.9–63.4 5.9–7.1
avg ± std 26 ± 0.3 4.4 ±0.0 2.6 ± 0.2 1.4 ± 0.0 3.0 ± 0.0 80.7 ± 1.8 83.5 ± 2.7 50.8 ± 5.3 6.5 ± 0.3
2017 203range 25.1–28.5 4.3–4.5 1.0–2.9 1.2–1.6 2.4–2.9 67.5–99.3 74.7–100.6 12.1–72.2 6.6–8.8
avg ± std 26.2 ± 0.8 4.4 ± 0.0 1.9 ± 0.4 1.4 ± 0.1 2.7 ± 0.1 80.7 ± 6.9 82.4 ± 3.9 38.0 ± 13.0 7.4 ± 0.4
2019 72range 25.3–28.3 4.3–4.5 1.4–2.2 1.3–1.5 2.5–2.9
avg ± std 26.5 ± 1.0 4.4 ± 0.0 1.9 ± 0.2 1.4 ± 0.1 2.7 ± 0.1
General 370range 25.0–28.5 4.2–4.5 1.0–2.9 1.2–1.6 2.4–3.0 67.5–104.3 74.7–100.6 12.1–72.2 5.9–8.8
avg ± std 26.2 ± 0.8 4.4 ± 0.0 2.0 ± 0.5 1.4 ± 0.1 2.7 ± 0.1 80.7 ± 6.2 82.6 ± 3.7 40.4 ± 12.9 7.2 ± 0.5a mean. b standard deviation. c The unit of the serum viscosity results is log cSt. Lycopene analysis was only carried out in 2019 for two companies. Sugar and acid analyses withhigh-performance liquid chromatography (HPLC) were only carried out in 2016 and 2017. Each test was carried out in duplicate. NTSS: natural tomato soluble solids, TA: titratable acidity.
Foods 2020, 9, 1300 8 of 14
3.2. Spectral Information of Tomato Paste Samples.
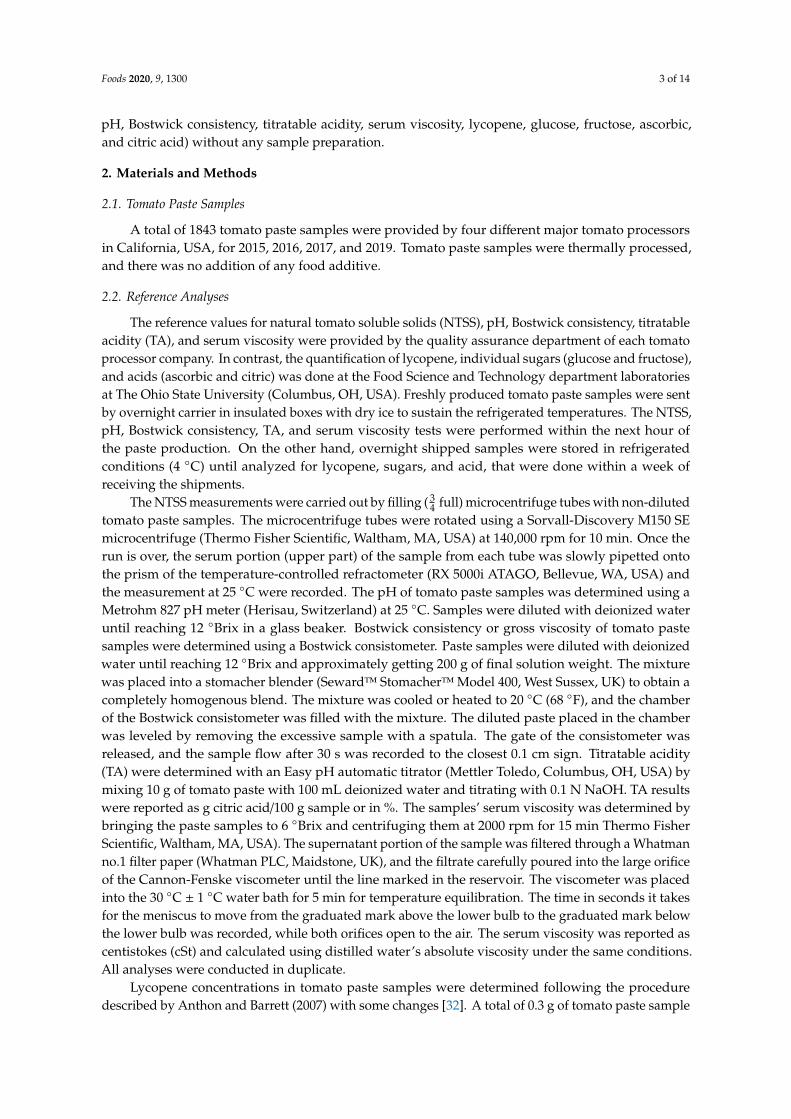
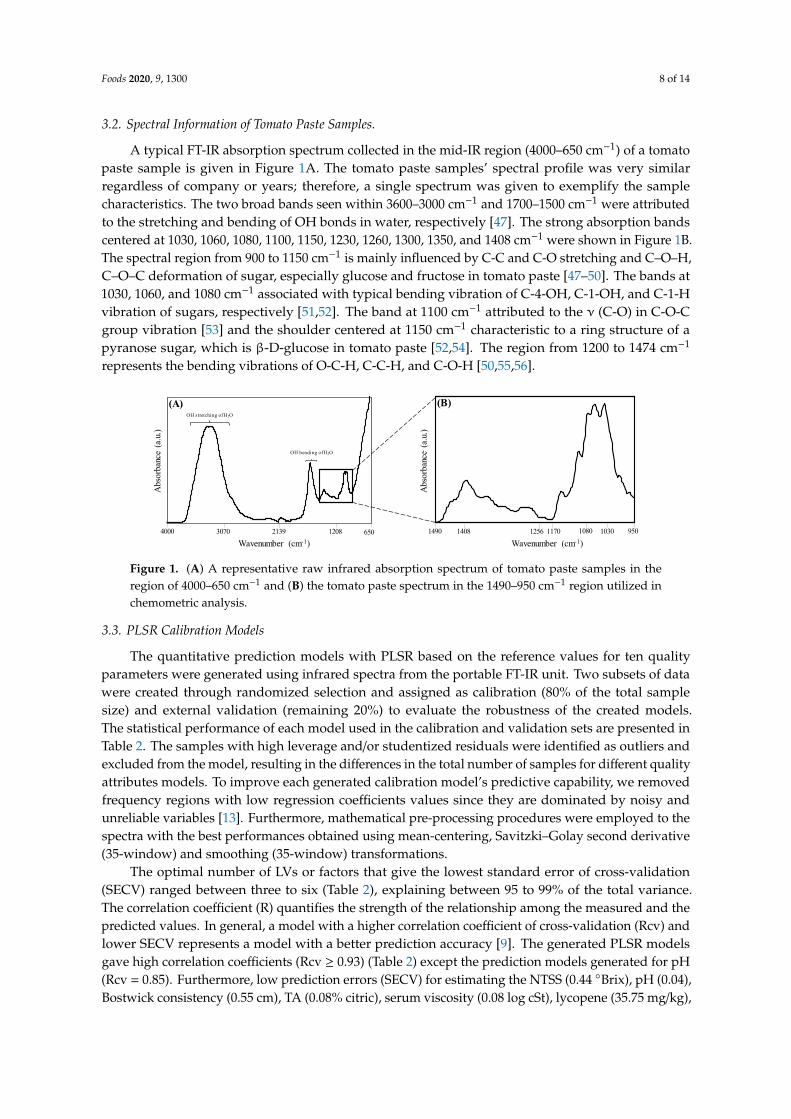
A typical FT-IR absorption spectrum collected in the mid-IR region (4000–650 cm−1) of a tomatopaste sample is given in Figure 1A. The tomato paste samples’ spectral profile was very similarregardless of company or years; therefore, a single spectrum was given to exemplify the samplecharacteristics. The two broad bands seen within 3600–3000 cm−1 and 1700–1500 cm−1 were attributedto the stretching and bending of OH bonds in water, respectively [47]. The strong absorption bandscentered at 1030, 1060, 1080, 1100, 1150, 1230, 1260, 1300, 1350, and 1408 cm−1 were shown in Figure 1B.The spectral region from 900 to 1150 cm−1 is mainly influenced by C-C and C-O stretching and C–O–H,C–O–C deformation of sugar, especially glucose and fructose in tomato paste [47–50]. The bands at1030, 1060, and 1080 cm−1 associated with typical bending vibration of C-4-OH, C-1-OH, and C-1-Hvibration of sugars, respectively [51,52]. The band at 1100 cm−1 attributed to the ν (C-O) in C-O-Cgroup vibration [53] and the shoulder centered at 1150 cm−1 characteristic to a ring structure of apyranose sugar, which is β-D-glucose in tomato paste [52,54]. The region from 1200 to 1474 cm−1
represents the bending vibrations of O-C-H, C-C-H, and C-O-H [50,55,56].
Foods 2020, 9, x FOR PEER REVIEW 8 of 14
3.2. Spectral Information of Tomato Paste Samples.
A typical FT-IR absorption spectrum collected in the mid-IR region (4000–650 cm−1) of a tomato paste sample is given in Figure 1A. The tomato paste samples’ spectral profile was very similar regardless of company or years; therefore, a single spectrum was given to exemplify the sample characteristics. The two broad bands seen within 3600–3000 cm−1 and 1700–1500 cm−1 were attributed to the stretching and bending of OH bonds in water, respectively [47]. The strong absorption bands centered at 1030, 1060, 1080, 1100, 1150, 1230, 1260, 1300, 1350, and 1408 cm−1 were shown in Figure 1B. The spectral region from 900 to 1150 cm−1 is mainly influenced by C-C and C-O stretching and C–O–H, C–O–C deformation of sugar, especially glucose and fructose in tomato paste [47–50]. The bands at 1030, 1060, and 1080 cm−1 associated with typical bending vibration of C-4-OH, C-1-OH, and C-1-H vibration of sugars, respectively [51,52]. The band at 1100 cm−1 attributed to the ν (C-O) in C-O-C group vibration [53] and the shoulder centered at 1150 cm−1 characteristic to a ring structure of a pyranose sugar, which is β-D-glucose in tomato paste [52,54]. The region from 1200 to 1474 cm−1 represents the bending vibrations of O-C-H, C-C-H, and C-O-H [50,55,56].
Figure 1. (A) A representative raw infrared absorption spectrum of tomato paste samples in the region of 4000–650 cm−1 and (B) the tomato paste spectrum in the 1490–950 cm−1 region utilized in chemometric analysis.
3.3. PLSR Calibration Models
The quantitative prediction models with PLSR based on the reference values for ten quality parameters were generated using infrared spectra from the portable FT-IR unit. Two subsets of data were created through randomized selection and assigned as calibration (80% of the total sample size) and external validation (remaining 20%) to evaluate the robustness of the created models. The statistical performance of each model used in the calibration and validation sets are presented in Table 2. The samples with high leverage and/or studentized residuals were identified as outliers and excluded from the model, resulting in the differences in the total number of samples for different quality attributes models. To improve each generated calibration model’s predictive capability, we removed frequency regions with low regression coefficients values since they are dominated by noisy and unreliable variables [13]. Furthermore, mathematical pre-processing procedures were employed to the spectra with the best performances obtained using mean-centering, Savitzki–Golay second derivative (35-window) and smoothing (35-window) transformations.
Table 2. Statistical performances of the partial least square regression (PLSR) models developed.
Parameter Calibration Model External Validation Model
Range N a Factor SECV b Rcv c Range N d SEP e RPre f RPD g NTSS (°Brix) 24.1–38.1 1436 3 0.44 0.99 25.7–37.5 359 0.40 0.99 7.3
pH 4.14–4.49 1419 6 0.04 0.85 4.19–4.49 355 0.04 0.83 1.8 Bostwick Consistency (cm) 0.8–7.9 1382 5 0.55 0.94 1.0–7.7 345 0.58 0.96 2.9 Titratable Acidity (% Citric) 0.99–2.40 1406 6 0.08 0.94 1.12–2.27 352 0.09 0.93 2.8
Serum Viscosity (log cSt) 1.81–2.99 1304 6 0.08 0.96 1.85–2.99 326 0.08 0.96 3.5 Lycopene (mg/kg) 400.6–869.1 138 6 35.75 0.93 483.4–851.1 35 35.11 0.93 2.7
Glucose (g/L) 67.5–128.2 1043 5 3.16 0.96 68.9–122.6 261 3.39 0.97 3.5 Fructose (g/L) 74.7–128.8 1032 4 3.11 0.96 75.4–128.0 258 3.88 0.96 2.9
Ascorbic Acid (mg/100 g) 12.1–110.7 1040 6 6.99 0.94 16.7–105.6 260 7.32 0.93 2.7
3070 2139 1208
Wavenumber (cm-1)
Abs
orba
nce
(a.u
.)
4000 650
OH stretching of H2O
OH bending of H2O
Abs
orba
nce
(a.u
.)
Wavenumber (cm-1)1490 1408 1256 1080 1030 9501170
(A) (B)
Figure 1. (A) A representative raw infrared absorption spectrum of tomato paste samples in theregion of 4000–650 cm−1 and (B) the tomato paste spectrum in the 1490–950 cm−1 region utilized inchemometric analysis.
3.3. PLSR Calibration Models
The quantitative prediction models with PLSR based on the reference values for ten qualityparameters were generated using infrared spectra from the portable FT-IR unit. Two subsets of datawere created through randomized selection and assigned as calibration (80% of the total samplesize) and external validation (remaining 20%) to evaluate the robustness of the created models.The statistical performance of each model used in the calibration and validation sets are presented inTable 2. The samples with high leverage and/or studentized residuals were identified as outliers andexcluded from the model, resulting in the differences in the total number of samples for different qualityattributes models. To improve each generated calibration model’s predictive capability, we removedfrequency regions with low regression coefficients values since they are dominated by noisy andunreliable variables [13]. Furthermore, mathematical pre-processing procedures were employed to thespectra with the best performances obtained using mean-centering, Savitzki–Golay second derivative(35-window) and smoothing (35-window) transformations.
The optimal number of LVs or factors that give the lowest standard error of cross-validation(SECV) ranged between three to six (Table 2), explaining between 95 to 99% of the total variance.The correlation coefficient (R) quantifies the strength of the relationship among the measured and thepredicted values. In general, a model with a higher correlation coefficient of cross-validation (Rcv) andlower SECV represents a model with a better prediction accuracy [9]. The generated PLSR modelsgave high correlation coefficients (Rcv ≥ 0.93) (Table 2) except the prediction models generated for pH(Rcv = 0.85). Furthermore, low prediction errors (SECV) for estimating the NTSS (0.44 ◦Brix), pH (0.04),Bostwick consistency (0.55 cm), TA (0.08% citric), serum viscosity (0.08 log cSt), lycopene (35.75 mg/kg),
Foods 2020, 9, 1300 9 of 14
glucose (3.16 g/L), fructose (3.11 g/L), ascorbic acid (6.99 mg/100 g), citric acid (0.27 g/100 g) (Table 2),were obtained.
Table 2. Statistical performances of the partial least square regression (PLSR) models developed.
ParameterCalibration Model External Validation Model
Range N a Factor SECV b Rcv c Range N d SEP e RPref RPD g
NTSS (◦Brix) 24.1–38.1 1436 3 0.44 0.99 25.7–37.5 359 0.40 0.99 7.3pH 4.14–4.49 1419 6 0.04 0.85 4.19–4.49 355 0.04 0.83 1.8
Bostwick Consistency (cm) 0.8–7.9 1382 5 0.55 0.94 1.0–7.7 345 0.58 0.96 2.9Titratable Acidity (% Citric) 0.99–2.40 1406 6 0.08 0.94 1.12–2.27 352 0.09 0.93 2.8
Serum Viscosity (log cSt) 1.81–2.99 1304 6 0.08 0.96 1.85–2.99 326 0.08 0.96 3.5Lycopene (mg/kg) 400.6–869.1 138 6 35.75 0.93 483.4–851.1 35 35.11 0.93 2.7
Glucose (g/L) 67.5–128.2 1043 5 3.16 0.96 68.9–122.6 261 3.39 0.97 3.5Fructose (g/L) 74.7–128.8 1032 4 3.11 0.96 75.4–128.0 258 3.88 0.96 2.9
Ascorbic Acid (mg/100 g) 12.1–110.7 1040 6 6.99 0.94 16.7–105.6 260 7.32 0.93 2.7Citric Acid (g/100 g) 5.9–11.2 1031 5 0.27 0.96 6.3–10.5 258 0.27 0.96 3.4a Number of samples used in calibration models. b Standard error of cross-validation. c Correlation coefficient ofcross-validation. d Number of samples used in external validation models. e Standard error of prediction. f Correlationcoefficient of prediction for validation. g Residual predictive deviation. Standard error of cross-validation (SECV) andstandard error of prediction (SEP) are in units of the predicted parameters.
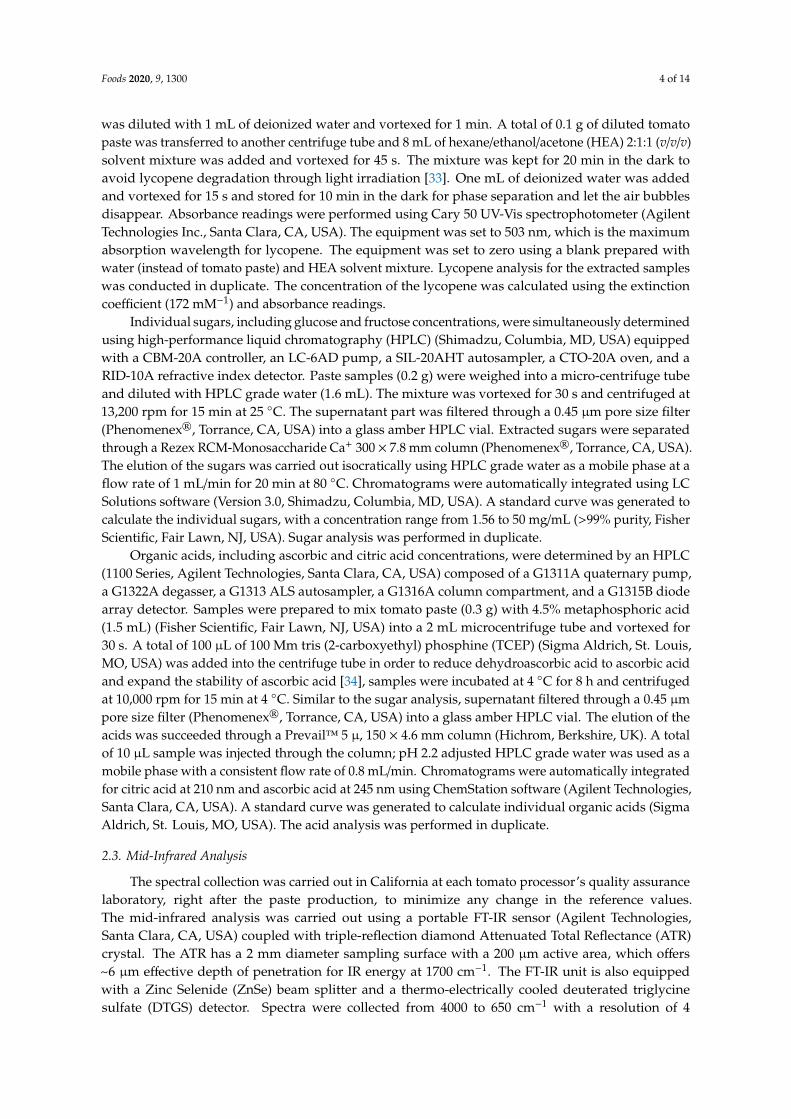
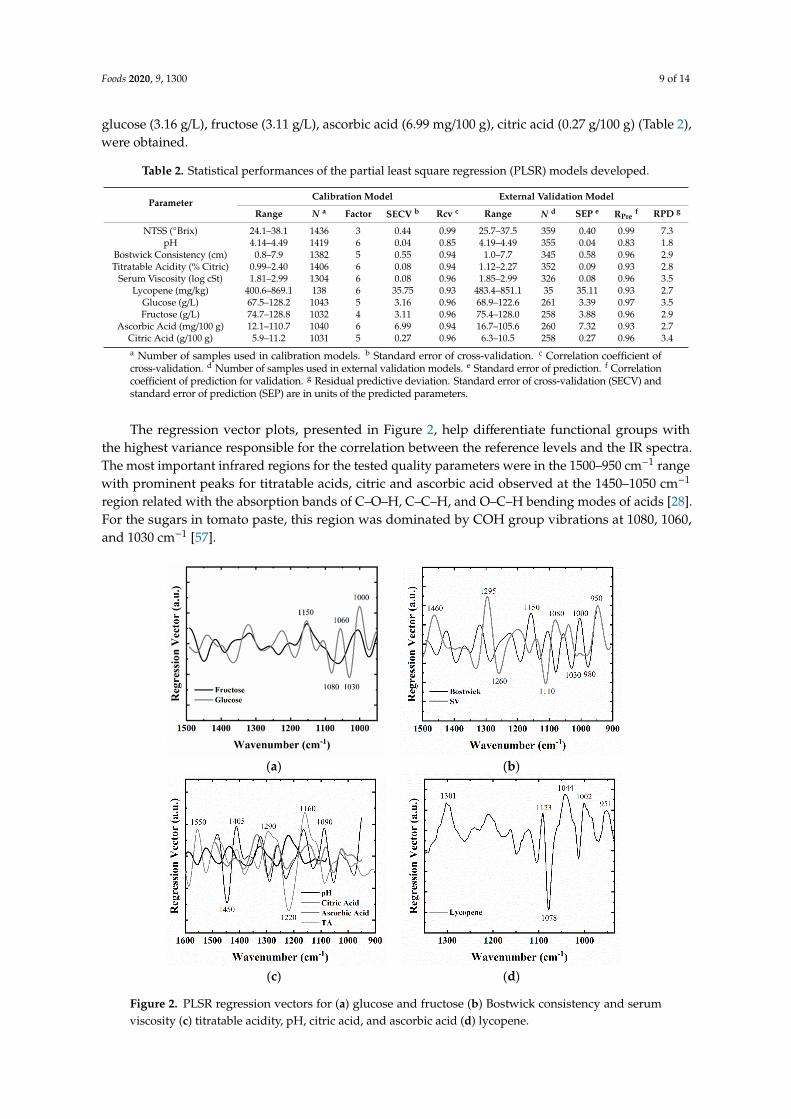
The regression vector plots, presented in Figure 2, help differentiate functional groups withthe highest variance responsible for the correlation between the reference levels and the IR spectra.The most important infrared regions for the tested quality parameters were in the 1500–950 cm−1 rangewith prominent peaks for titratable acids, citric and ascorbic acid observed at the 1450–1050 cm−1
region related with the absorption bands of C–O–H, C–C–H, and O–C–H bending modes of acids [28].For the sugars in tomato paste, this region was dominated by COH group vibrations at 1080, 1060,and 1030 cm−1 [57].
Foods 2020, 9, x FOR PEER REVIEW 9 of 14
Citric Acid (g/100 g) 5.9–11.2 1031 5 0.27 0.96 6.3–10.5 258 0.27 0.96 3.4 a Number of samples used in calibration models. b Standard error of cross-validation. c Correlation coefficient of cross-validation. d Number of samples used in external validation models. e Standard error of prediction. f Correlation coefficient of prediction for validation. g Residual predictive deviation. Standard error of cross-validation (SECV) and standard error of prediction (SEP) are in units of the predicted parameters.
The optimal number of LVs or factors that give the lowest standard error of cross-validation (SECV) ranged between three to six (Table 2), explaining between 95 to 99% of the total variance. The correlation coefficient (R) quantifies the strength of the relationship among the measured and the predicted values. In general, a model with a higher correlation coefficient of cross-validation (Rcv) and lower SECV represents a model with a better prediction accuracy [9]. The generated PLSR models gave high correlation coefficients (Rcv ≥ 0.93) (Table 2) except the prediction models generated for pH (Rcv = 0.85). Furthermore, low prediction errors (SECV) for estimating the NTSS (0.44 °Brix), pH (0.04), Bostwick consistency (0.55 cm), TA (0.08% citric), serum viscosity (0.08 log cSt), lycopene (35.75 mg/kg), glucose (3.16 g/L), fructose (3.11 g/L), ascorbic acid (6.99 mg/100 g), citric acid (0.27 g/100 g) (Table 2), were obtained.
The regression vector plots, presented in Figure 2, help differentiate functional groups with the highest variance responsible for the correlation between the reference levels and the IR spectra. The most important infrared regions for the tested quality parameters were in the 1500–950 cm−1 range with prominent peaks for titratable acids, citric and ascorbic acid observed at the 1450–1050 cm−1 region related with the absorption bands of C–O–H, C–C–H, and O–C–H bending modes of acids [28]. For the sugars in tomato paste, this region was dominated by COH group vibrations at 1080, 1060, and 1030 cm−1 [57].
(a) (b)
(c) (d)
Figure 2. PLSR regression vectors for (a) glucose and fructose (b) Bostwick consistency and serum viscosity (c) titratable acidity, pH, citric acid, and ascorbic acid (d) lycopene. Figure 2. PLSR regression vectors for (a) glucose and fructose (b) Bostwick consistency and serumviscosity (c) titratable acidity, pH, citric acid, and ascorbic acid (d) lycopene.
Foods 2020, 9, 1300 10 of 14
Overall, our calibration models showed similar or superior performances with the studies in theliterature that used FT-IR spectroscopy (portable dial-path or benchtop units) to predict soluble solids,pH, Bostwick consistency, TA, serum viscosity, lycopene, sugars, and acids in tomato juice [9,11,13,28,58]with fewer LVs.
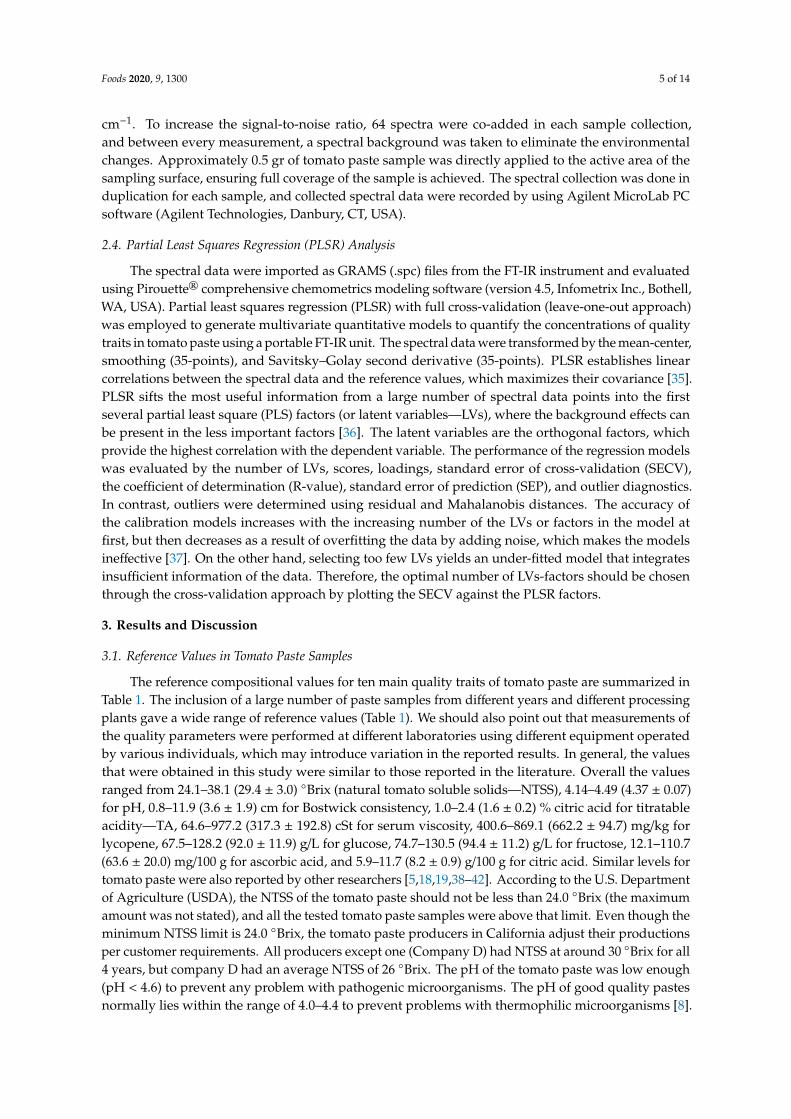
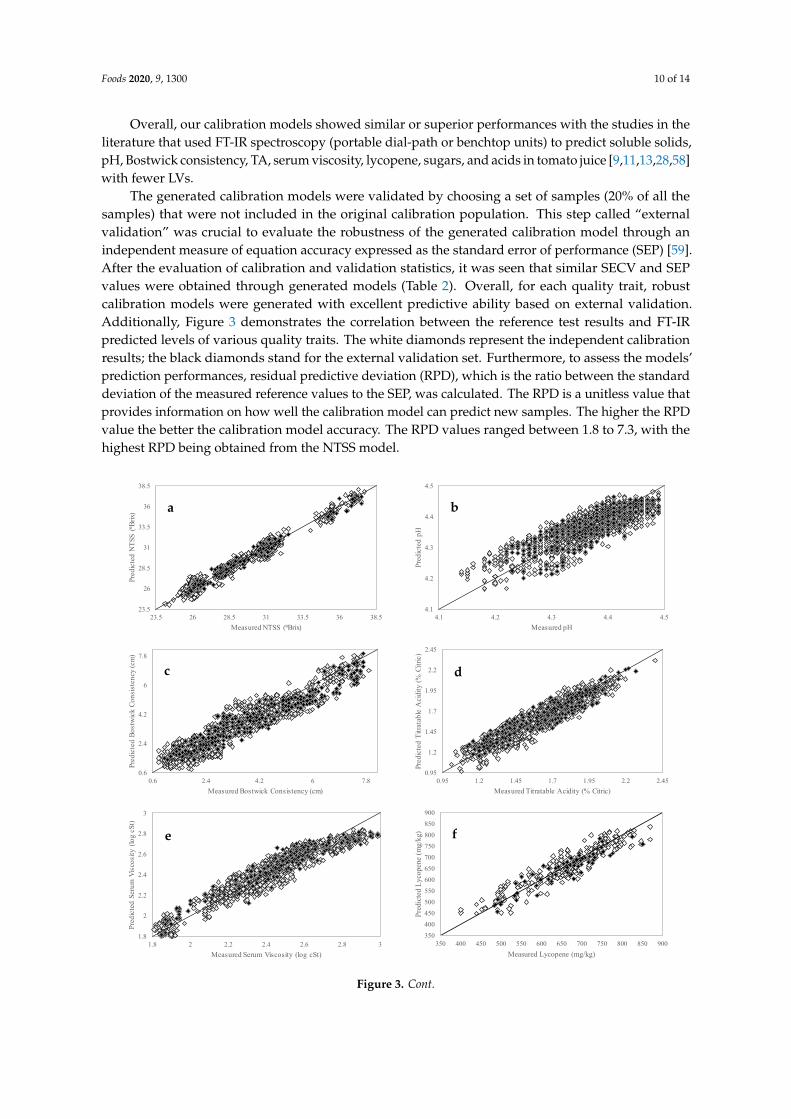
The generated calibration models were validated by choosing a set of samples (20% of all thesamples) that were not included in the original calibration population. This step called “externalvalidation” was crucial to evaluate the robustness of the generated calibration model through anindependent measure of equation accuracy expressed as the standard error of performance (SEP) [59].After the evaluation of calibration and validation statistics, it was seen that similar SECV and SEPvalues were obtained through generated models (Table 2). Overall, for each quality trait, robustcalibration models were generated with excellent predictive ability based on external validation.Additionally, Figure 3 demonstrates the correlation between the reference test results and FT-IRpredicted levels of various quality traits. The white diamonds represent the independent calibrationresults; the black diamonds stand for the external validation set. Furthermore, to assess the models’prediction performances, residual predictive deviation (RPD), which is the ratio between the standarddeviation of the measured reference values to the SEP, was calculated. The RPD is a unitless value thatprovides information on how well the calibration model can predict new samples. The higher the RPDvalue the better the calibration model accuracy. The RPD values ranged between 1.8 to 7.3, with thehighest RPD being obtained from the NTSS model.
Foods 2020, 9, x FOR PEER REVIEW 10 of 14
Overall, our calibration models showed similar or superior performances with the studies in the literature that used FT-IR spectroscopy (portable dial-path or benchtop units) to predict soluble solids, pH, Bostwick consistency, TA, serum viscosity, lycopene, sugars, and acids in tomato juice [9,11,13,28,58] with fewer LVs.
The generated calibration models were validated by choosing a set of samples (20% of all the samples) that were not included in the original calibration population. This step called “external validation” was crucial to evaluate the robustness of the generated calibration model through an independent measure of equation accuracy expressed as the standard error of performance (SEP) [59]. After the evaluation of calibration and validation statistics, it was seen that similar SECV and SEP values were obtained through generated models (Table 2). Overall, for each quality trait, robust calibration models were generated with excellent predictive ability based on external validation. Additionally, Figure 3 demonstrates the correlation between the reference test results and FT-IR predicted levels of various quality traits. The white diamonds represent the independent calibration results; the black diamonds stand for the external validation set. Furthermore, to assess the models’ prediction performances, residual predictive deviation (RPD), which is the ratio between the standard deviation of the measured reference values to the SEP, was calculated. The RPD is a unitless value that provides information on how well the calibration model can predict new samples. The higher the RPD value the better the calibration model accuracy. The RPD values ranged between 1.8 to 7.3, with the highest RPD being obtained from the NTSS model.
23.5
26
28.5
31
33.5
36
38.5
23.5 26 28.5 31 33.5 36 38.5
Pred
icte
d N
TSS
(⁰Brix
)
Measured NTSS (⁰Brix)
4.1
4.2
4.3
4.4
4.5
4.1 4.2 4.3 4.4 4.5
Pred
icte
d pH
Measured pH
0.6
2.4
4.2
6
7.8
0.6 2.4 4.2 6 7.8
Pred
icte
d Bo
stw
ick
Cons
iste
ncy
(cm
)
Measured Bostwick Consistency (cm)
0.95
1.2
1.45
1.7
1.95
2.2
2.45
0.95 1.2 1.45 1.7 1.95 2.2 2.45
Pred
icte
d Ti
trata
ble
Aci
dity
(% C
itric
)
Measured Titratable Acidity (% Citric)
1.8
2
2.2
2.4
2.6
2.8
3
1.8 2 2.2 2.4 2.6 2.8 3
Pred
icte
d Se
rum
Vis
cosi
ty (l
og c
St)
Measured Serum Viscosity (log cSt)
350400450500550600650700750800850900
350 400 450 500 550 600 650 700 750 800 850 900
Pred
icte
d Ly
cope
ne (m
g/kg
)
Measured Lycopene (mg/kg)
a b
c d
e f
Figure 3. Cont.
Foods 2020, 9, 1300 11 of 14Foods 2020, 9, x FOR PEER REVIEW 11 of 14
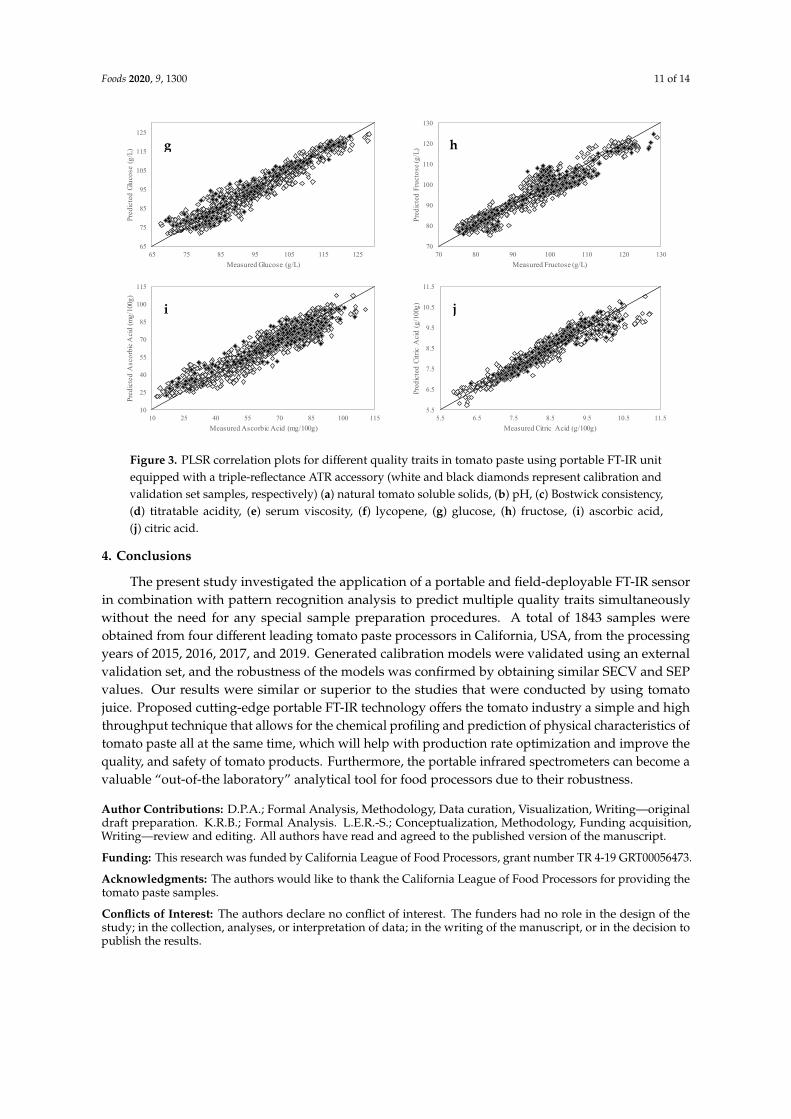
Figure 3. PLSR correlation plots for different quality traits in tomato paste using portable FT-IR unit equipped with a triple-reflectance ATR accessory (white and black diamonds represent calibration and validation set samples, respectively) (a) natural tomato soluble solids, (b) pH, (c) Bostwick consistency, (d) titratable acidity, (e) serum viscosity, (f) lycopene, (g) glucose, (h) fructose, (i) ascorbic acid, (j) citric acid.
4. Conclusions
The present study investigated the application of a portable and field-deployable FT-IR sensor in combination with pattern recognition analysis to predict multiple quality traits simultaneously without the need for any special sample preparation procedures. A total of 1843 samples were obtained from four different leading tomato paste processors in California, USA, from the processing years of 2015, 2016, 2017, and 2019. Generated calibration models were validated using an external validation set, and the robustness of the models was confirmed by obtaining similar SECV and SEP values. Our results were similar or superior to the studies that were conducted by using tomato juice. Proposed cutting-edge portable FT-IR technology offers the tomato industry a simple and high throughput technique that allows for the chemical profiling and prediction of physical characteristics of tomato paste all at the same time, which will help with production rate optimization and improve the quality, and safety of tomato products. Furthermore, the portable infrared spectrometers can become a valuable “out-of-the laboratory” analytical tool for food processors due to their robustness.
Author Contributions: D.P.A.; Formal Analysis, Methodology, Data curation, Visualization, Writing—original draft preparation. K.R.B.; Formal Analysis. L.E.R.-S.; Conceptualization, Methodology, Funding acquisition, Writing—review and editing. All authors have read and agreed to the published version of the manuscript.
Funding: This research was funded by California League of Food Processors, grant number TR 4-19 GRT00056473.
Acknowledgments: The authors would like to thank the California League of Food Processors for providing the tomato paste samples.
Conflicts of Interest: The authors declare no conflict of interest. The funders had no role in the design of the study; in the collection, analyses, or interpretation of data; in the writing of the manuscript, or in the decision to publish the results.
References
1. Winans, K.; Brodt, S.; Kendall, A. Life cycle assessment of California processing tomato: An evaluation of
65
75
85
95
105
115
125
65 75 85 95 105 115 125
Pred
icte
d Gl
ucos
e (g
/L)
Measured Glucose (g/L)
70
80
90
100
110
120
130
70 80 90 100 110 120 130
Pred
icte
d Fr
ucto
se (g
/L)
Measured Fructose (g/L)
10
25
40
55
70
85
100
115
10 25 40 55 70 85 100 115
Pred
icte
d A
scor
bic A
cid
(mg/
100g
)
Measured Ascorbic Acid (mg/100g)
5.5
6.5
7.5
8.5
9.5
10.5
11.5
5.5 6.5 7.5 8.5 9.5 10.5 11.5Pr
edic
ted
Citri
c A
cid
(g/1
00g)
Measured Citric Acid (g/100g)
g h
i j
Figure 3. PLSR correlation plots for different quality traits in tomato paste using portable FT-IR unitequipped with a triple-reflectance ATR accessory (white and black diamonds represent calibration andvalidation set samples, respectively) (a) natural tomato soluble solids, (b) pH, (c) Bostwick consistency,(d) titratable acidity, (e) serum viscosity, (f) lycopene, (g) glucose, (h) fructose, (i) ascorbic acid,(j) citric acid.
4. Conclusions
The present study investigated the application of a portable and field-deployable FT-IR sensorin combination with pattern recognition analysis to predict multiple quality traits simultaneouslywithout the need for any special sample preparation procedures. A total of 1843 samples wereobtained from four different leading tomato paste processors in California, USA, from the processingyears of 2015, 2016, 2017, and 2019. Generated calibration models were validated using an externalvalidation set, and the robustness of the models was confirmed by obtaining similar SECV and SEPvalues. Our results were similar or superior to the studies that were conducted by using tomatojuice. Proposed cutting-edge portable FT-IR technology offers the tomato industry a simple and highthroughput technique that allows for the chemical profiling and prediction of physical characteristics oftomato paste all at the same time, which will help with production rate optimization and improve thequality, and safety of tomato products. Furthermore, the portable infrared spectrometers can become avaluable “out-of-the laboratory” analytical tool for food processors due to their robustness.
Author Contributions: D.P.A.; Formal Analysis, Methodology, Data curation, Visualization, Writing—originaldraft preparation. K.R.B.; Formal Analysis. L.E.R.-S.; Conceptualization, Methodology, Funding acquisition,Writing—review and editing. All authors have read and agreed to the published version of the manuscript.
Funding: This research was funded by California League of Food Processors, grant number TR 4-19 GRT00056473.
Acknowledgments: The authors would like to thank the California League of Food Processors for providing thetomato paste samples.
Conflicts of Interest: The authors declare no conflict of interest. The funders had no role in the design of thestudy; in the collection, analyses, or interpretation of data; in the writing of the manuscript, or in the decision topublish the results.
Foods 2020, 9, 1300 12 of 14
References
1. Winans, K.; Brodt, S.; Kendall, A. Life cycle assessment of California processing tomato: An evaluation of theeffects of evolving practices and technologies over a 10-year (2005–2015) timeframe. Int. J. Life Cycle Assess.2019, 25, 538–547. [CrossRef]
2. Anthon, G.E.; Barrett, D.M. Pectin methylesterase activity and other factors affecting pH and titratable acidityin processing tomatoes. Food Chem. 2012, 132, 915–920. [CrossRef]
3. Koh, E.; Charoenprasert, S.; Mitchell, A.E. Effects of industrial tomato paste processing on ascorbic acid,flavonoids and carotenoids and their stability over one-year storage. J. Sci. Food Agric. 2012, 92, 23–28.[CrossRef] [PubMed]
4. Anthon, G.E.; Barrett, D.M. Changes in tomato paste during storage and the effects of heating on consistencyof reconstituted tomato paste. J. Texture Stud. 2010, 41, 262–278. [CrossRef]
5. Zhang, L.; Schultz, M.A.; Cash, R.; Barrett, D.M.; Mccarthy, M.J. Determination of quality parameters oftomato paste using guided microwave spectroscopy. Food Control 2014, 40, 214–223. [CrossRef]
6. Shobo, B.A.; Bodunde, J.G.; Makinde, E.A.; Olowe, V.I.O.; Ogunleye, M.T. Paste Quality of Tomato(Lycopersicon esculentum Mill) as Influenced by Variety and Organic Fertilizer. J. Org. Agric. Environ. 2018, 6,10–16.
7. Barrett, D.M.; Garcia, E.; Wayne, J.E. Textural modification of processing tomatoes. Crit. Rev. Food Sci. Nutr.1998, 38, 173–258. [CrossRef]
8. Thakur, B.R.; Singh, R.K.; Nelson, P.E. Quality attributes of processed tomato products: A review. Food Rev. Int.1996, 12, 375–401. [CrossRef]
9. Ayvaz, H.; Sierra-Cadavid, A.; Aykas, D.P.; Mulqueeney, B.; Sullivan, S.; Rodriguez-Saona, L.E.Monitoring multicomponent quality traits in tomato juice using portable mid-infrared (MIR) spectroscopyand multivariate analysis. Food Control 2016, 66, 79–86. [CrossRef]
10. Barringer, S. Canned Tomatoes: Production and Storage. In Handbook of Vegetable Preservation and Processing;Hui, Y.H., Chazala, S., Graham, D.M., Murrell, K.D., Nip, W.-K., Eds.; Marcel Dekker, Inc.: New York, NY,USA, 2004; pp. 123–134.
11. Wilkerson, E.D.; Anthon, G.E.; Barrett, D.M.; Sayajon, G.F.G.; Santos, A.M.; Rodriguez-Saona, L.E.Rapid assessment of quality parameters in processing tomatoes using hand-held and benchtop infraredspectrometers and multivariate analysis. J. Agric. Food Chem. 2013, 61, 2088–2095. [CrossRef]
12. Baldwin, E.A.; Goodner, K.; Plotto, A. Interaction of volatiles, sugars, and acids on perception of tomatoaroma and flavor descriptors. J. Food Sci. 2008, 73, S294–S307. [CrossRef] [PubMed]
13. Scibisz, I.; Reich, M.; Bureau, S.; Gouble, B.; Causse, M.; Bertrand, D.; Renard, C.M.G.C. Mid-infrared spectroscopyas a tool for rapid determination of internal quality parameters in tomato. Food Chem. 2011, 125, 1390–1397.[CrossRef]
14. Gould, W.A. Tomato Production, Processing and Technology; CTI Publications Inc.: Maryland, USA, 1992;ISBN 0930027183.
15. Anthon, G.E.; Lestrange, M.; Barrett, D.M. Changes in pH, acids, sugars and other quality parameters duringextended vine holding of ripe processing tomatoes. J. Sci. Food Agric. 2011, 91, 1175–1181. [CrossRef][PubMed]
16. Garcia, E.; Barrett, D.M. Evaluation of processing tomatoes from two consecutive growing seasons: Qualityattributes, peelability and yield. J. Food Process. Preserv. 2006, 30, 20–36. [CrossRef]
17. Monti, L.M. The Breeding of Tomatoes for Peeling. Acta Hortic. 1980, 100, 341–354. [CrossRef]18. Abushita, A.A.; Daood, H.G.; Biacs, P.A. Change in carotenoids and antioxidant vitamins in tomato as a
function of varietal and technological factors. J. Agric. Food Chem. 2000, 48, 2075–2081. [CrossRef]19. Capanoglu, E.; Beekwilder, J.; Boyacioglu, D.; Hall, R.; De Vos, R. Changes in antioxidant and metabolite
profiles during production of tomato paste. J. Agric. Food Chem. 2008, 56, 964–973. [CrossRef]20. Baranska, M.; Schütze, W.; Schulz, H. Determination of lycopene and β-carotene content in tomato fruits and
related products: Comparison of FT-raman, ATR-IR, and NIR spectroscopy. Anal. Chem. 2006, 78, 8456–8461.[CrossRef]
21. De Oliveira, G.A.; Bureau, S.; Renard, C.M.G.C.; Pereira-Netto, A.B.; De Castilhos, F. Comparison of NIRSapproach for prediction of internal quality traits in three fruit species. Food Chem. 2014, 143, 223–230.[CrossRef]
Foods 2020, 9, 1300 13 of 14
22. Torres, I.; Pérez-Marín, D.; De la Haba, M.J.; Sánchez, M.T. Fast and accurate quality assessment of Raftomatoes using NIRS technology. Postharvest Biol. Technol. 2015, 107, 9–15. [CrossRef]
23. Ibáñez, G.; Cebolla-Cornejo, J.; Martí, R.; Roselló, S.; Valcárcel, M. Non-destructive determination oftaste-related compounds in tomato using NIR spectra. J. Food Eng. 2019, 263, 237–242. [CrossRef]
24. Feng, L.; Zhang, M.; Adhikari, B.; Guo, Z. Nondestructive Detection of Postharvest Quality of CherryTomatoes Using a Portable NIR Spectrometer and Chemometric Algorithms. Food Anal. Methods 2019, 12,914–925. [CrossRef]
25. Camps, C.; Gilli, C. Prediction of local and global tomato texture and quality by FT-NIR spectroscopy andchemometric. Eur. J. Hortic. Sci. 2017, 82, 126–133. [CrossRef]
26. Sheng, R.; Cheng, W.; Li, H.; Ali, S.; Akomeah Agyekum, A.; Chen, Q. Model development for solublesolids and lycopene contents of cherry tomato at different temperatures using near-infrared spectroscopy.Postharvest Biol. Technol. 2019, 156, 110952. [CrossRef]
27. Ding, X.; Guo, Y.; Ni, Y.; Kokot, S. A novel NIR spectroscopic method for rapid analyses of lycopene, totalacid, sugar, phenols and antioxidant activity in dehydrated tomato samples. Vib. Spectrosc. 2016, 82, 1–9.[CrossRef]
28. Akpolat, H.; Barineau, M.; Jackson, K.A.; Aykas, D.P.; Rodriguez-Saona, L.E. Portable infrared sensingtechnology for phenotyping chemical traits in fresh market tomatoes. Lwt 2020, 124, 109164. [CrossRef]
29. Bureau, S.; Reling, P.; Bogé, M.; Garcia, C.; Renard, C.M.G.C.; Giovinazzo, R.; Page, D. Rapid characterizationof industry-type tomato using mid-infrared spectroscopy. Acta Hortic. 2017, 1159, 183–188. [CrossRef]
30. Beullens, K.; Kirsanov, D.; Irudayaraj, J.; Rudnitskaya, A.; Legin, A.; Nicolaï, B.M.; Lammertyn, J. The electronictongue and ATR-FTIR for rapid detection of sugars and acids in tomatoes. Sens. Actuators B Chem. 2006, 116,107–115. [CrossRef]
31. Nicolai, B.M.; Beullens, K.; Bobelyn, E.; Peirs, A.; Saeys, W.; Theron, K.I.; Lammertyn, J.Nondestructive measurement of fruit and vegetable quality by means of NIR spectroscopy: A review.Postharvest Biol. Technol. 2007, 46, 99–118. [CrossRef]
32. Anthon, G.; Barrett, D.M. Standardization of a rapid spectrophotometric method for lycopene analysis.Acta Hortic. 2007, 758, 111–128. [CrossRef]
33. Shi, J.; Le Maguer, M.; Bryan, M.; Kakuda, Y. Kinetics of lycopene degradation in tomato puree by heat andlight irradiation. J. Food Process Eng. 2003, 25, 485–498. [CrossRef]
34. Wechtersbach, L.; Cigic, B. Reduction of dehydroascorbic acid at low pH. J. Biochem. Biophys. Methods 2007,70, 767–772. [CrossRef] [PubMed]
35. Melado-Herreros, A.; Fernandez-Valle, M.E.; Barreiro, P. Application of NMR to Resolve FoodStructure, Composition and Quality. In Applications of NMR Spectroscopy, Applications in Food Sciences;Atta-ur-Rahman, Chaudhary, M.I., Eds.; Bentham Science Publishers: Sharjah, UAE, 2016; Volume 4, p. 44,ISBN 978-1-68108-143-4.
36. Kawamura, K.; Tsujimoto, Y.; Rabenarivo, M.; Asai, H.; Andriamananjara, A.; Rakotoson, T. Vis-NIR spectroscopyand PLS regression with waveband selection for estimating the total C and N of paddy soils in Madagascar.Remote Sens. 2017, 9, 1081. [CrossRef]
37. Abdi, H. Partial least squares regression and projection on latent structure regression (PLS Regression).Wiley Interdiscip. Rev. Comput. Stat. 2010, 2, 97–106. [CrossRef]
38. Carmen Sánchez, M.; Valencia, C.; Gallegos, C.; Ciruelos, A.; Latorre, A. Influence of processing on therheological properties of tomato paste. J. Sci. Food Agric. 2002, 82, 990–997. [CrossRef]
39. Deda, M.S.; Bloukas, J.G.; Fista, G.A. Effect of tomato paste and nitrite level on processing and qualitycharacteristics of frankfurters. Meat Sci. 2007, 76, 501–508. [CrossRef] [PubMed]
40. Kadakal, Ç.; Artik, N. Degradation kinetics of ergosterol in tomato paste serum. Eur. Food Res. Technol. 2008,227, 683–688. [CrossRef]
41. Khachik, F.; Beecher, G.R.; Holden, J.; Tenorio, M.D.; Barrera, M.R.; Goli, M.B.; Lusby, W.R. Effect of FoodPreparation on Qualitative and Quantitative Distribution of Major Carotenoid Constituents of Tomatoes andSeveral Green Vegetables. J. Agric. Food Chem. 1992, 40, 390–398. [CrossRef]
42. Shatta, A.A.B. Impact of Processing Steps on Physicochemical and Rheological Properties of Tomato Paste(Cold-Break). MOJ Food Process. Technol. 2017, 5, 263–271. [CrossRef]
43. USDA Tomato Products, Canned, Paste, without Salt Added. Available online: https://fdc.nal.usda.gov/fdc-app.html#/food-details/170459/nutrients (accessed on 10 July 2020).
Foods 2020, 9, 1300 14 of 14
44. Porretta, S.; Sandei, L.; Crucitti, P.M.; Poli, G.; Attolini, M.G. Comparison of the main analytical methodsused in quality control of tomato paste. Int. J. Food Sci. Technol. 1992, 27, 145–152. [CrossRef]
45. Kelebek, H.; Selli, S.; Kadiroglu, P.; Kola, O.; Kesen, S.; Uçar, B.; Çetiner, B. Bioactive compounds andantioxidant potential in tomato pastes as affected by hot and cold break process. Food Chem. 2017, 220, 31–41.[CrossRef] [PubMed]
46. Underwood, J.C. Factors Influencing Quality of Tomato Paste. I. Chemical Composition of CaliforniaCommercial Tomato Paste. J. Food Sci. 1950, 15, 366–372. [CrossRef] [PubMed]
47. Sinelli, N.; Spinardi, A.; Di Egidio, V.; Mignani, I.; Casiraghi, E. Evaluation of quality and nutraceutical contentof blueberries (Vaccinium corymbosum L.) by near and mid-infrared spectroscopy. Postharvest Biol. Technol. 2008,50, 31–36. [CrossRef]
48. Duarte, I.F.; Barros, A.; Delgadillo, I.; Almeida, C.; Gil, A.M. Application of FTIR spectroscopy for thequantification of sugars in mango juice as a function of ripening. J. Agric. Food Chem. 2002, 50, 3104–3111.[CrossRef]
49. Grube, M.; Bekers, M.; Upite, D.; Kaminska, E. Infrared spectra of some fructans. Spectrosc. Int. J. 2002, 16,289–296. [CrossRef]
50. Sivakesava, S.; Irudayaraj, J. Determination of sugars in aqueous mixtures using mid-infrared spectroscopy.Appl. Eng. Agric. 2000, 16, 543–550. [CrossRef]
51. Kacuráková, M.; Mathlouthi, M. FTIR and laser-Raman spectra of oligosaccharides in water: Characterizationof the glycosidic bond. Carbohydr. Res. 1996, 284, 145–157. [CrossRef]
52. Kanou, M.; Kameoka, T.; Suehara, K.I.; Hashimoto, A. Mid-infrared spectroscopic analysis of saccharides inaqueous solutions with sodium chloride. Biosci. Biotechnol. Biochem. 2017, 81, 735–742. [CrossRef]
53. Kedzierska-Matysek, M.; Matwijczuk, A.; Florek, M.; Barłowska, J.; Wolanciuk, A.; Matwijczuk, A.;Chrusciel, E.; Walkowiak, R.; Karcz, D.; Gładyszewska, B. Application of FTIR spectroscopy for analysis ofthe quality of honey. BIO Web Conf. 2018, 10, 02008. [CrossRef]
54. Cael, J.J.; Koening, J.L.; Blackwell, J. Infrared and raman spectroscopy of carbohydrates part 4. Identification ofconfiguration- and conformation-sensitive modes for d-glucose by normal coordinate analysis. Carbohydr. Res.1974, 32, 79–91. [CrossRef]
55. Hineno, M. Infrared spectra and normal vibration of β-d-glucopyranose. Carbohydr. Res. 1977, 56, 219–227.[CrossRef]
56. Irudayaraj, J.; Tewari, J. Simultaneous monitoring of organic acids and sugars in fresh and processed applejuice by Fourier transform infrared-attenuated total reflection spectroscopy. Appl. Spectrosc. 2003, 57,1599–1604. [CrossRef] [PubMed]
57. Birarda, G.; Holman, E.A.; Fu, S.; Weikel, K.; Hu, P.; Blankenberg, F.G.; Holman, H.Y.; Taylor, A.Synchrotron infrared imaging of advanced glycation endproducts (AGEs) in cardiac tissue from micefed high glycemic diets. Biomed. Spectrosc. Imaging 2013, 2, 301–315. [CrossRef] [PubMed]
58. Halim, Y.; Schwartz, S.; Francis, D.; Baldauf, N.A.; Rodriguez-Saona, L.E. Direct Determination of LycopeneContent in Tomatoes (Lycopersicon esculentum) by Attenuated Total Reflectance Infrared Spectroscopy andMultivariate Analysis. J. AOAC 2006, 89, 1257–1262. [CrossRef]
59. Windham, W.R.; Mertens, D.R.; Barton, F.E., II. Protocol for NIRS Calibration: Sample Selection and EquationDevelopment and Validation. In Agriculture Handbook No. 643 Near Infrared Reflectance Spectroscopy (NIRS):Analysis of Forage Quality; Marten, G.C., Shenk, J.S., Barton, F.E., II, Eds.; United States Departmentt ofAgriculture: Washington, DC, USA, 1989; Volume 643, pp. 96–103.
© 2020 by the authors. Licensee MDPI, Basel, Switzerland. This article is an open accessarticle distributed under the terms and conditions of the Creative Commons Attribution(CC BY) license (http://creativecommons.org/licenses/by/4.0/).
Related Documents