MASS SPECTROMETRY IN GRAPE AND WINE CHEMISTRY. PART II: THE CONSUMER PROTECTION Riccardo Flamini* and Annarita Panighel CRA, Istituto Sperimentale per la Viticoltura, Viale XXVIII Aprile 26, I-31015 Conegliano (TV), Italy Received 25 July 2005; received (revised) 28 November 2005; accepted 28 November 2005 Published online 22 March 2006 in Wiley InterScience (www.interscience.wiley.com) DOI 10.1002/mas.20087 Controls in food industry are fundamental to protect the con- sumer health. For products of high quality, warranty of origin and identity is required and analytical control is very important to prevent frauds. In this article, the ‘‘state of art’’ of mass spectrometry in enological chemistry as a consumer safety contribute is reported. Gas chromatography-mass spectrometry (GC/MS) and liquid-chromatography-mass spectrometry (LC/ MS) methods have been developed to determine pesticides, ethyl carbamate, and compounds from the yeast and bacterial metabolism in wine. The presence of pesticides in wine is mainly linked to the use of dicarboxyimide fungicides on vineyard shortly before the harvest to prevent the Botrytis cinerea attack of grape. Pesticide residues are regulated at maximum residue limits in grape of low ppm levels, but significantly lower levels in wine have to be detected, and mass spectrometry offers effective and sensitive methods. Moreover, mass spectrometry represent an advantageous alternative to the radioactive-source-containing electron capture detector com- monly used in GC analysis of pesticides. Analysis of ochratoxin A (OTA) in wine by LC/MS and multiple mass spectrometry (MS/MS) permits to confirm the toxin presence without the use of expensive immunoaffinity columns, or time and solvent consuming sample derivatization procedures. Inductively coupled plasma-mass spectrometry (ICP/MS) is used to control heavy metals contamination in wine, and to verify the wine origin and authenticity. Isotopic ratio-mass spectrometry (IRMS) is applied to reveal wine watering and sugar additions, and to determine the product origin and traceability. # 2006 Wiley Periodicals, Inc., Mass Spec Rev 25:741–774, 2006 Keywords: wine pesticides; wine defects; ethyl carbamate; ochratoxin A; mass spectrometry; lead in wine; illegal additions to the wine I. INTRODUCTION The first applications of mass spectrometry in the study of grape and wine chemistry were performed in the early eighties by electron impact gas chromatography-mass spectrometry (GC/MS-EI). Many wine volatile compounds formed with alcoholic fermentation were identified, so as aroma compounds from the grape (Rapp & Knipser, 1979; Rapp, Knipser, & Engel, 1980; Williams, Strauss, & Wilson, 1980, 1981; Williams et al., 1982; Rapp, Mandery, & Ullemeyer, 1983, 1984; Rapp, Mandery, & Niebergall, 1986; Strauss et al., 1986, 1987; Strauss, Wilson, & Williams, 1987; Shoseyov et al., 1990; Winterhalter, Sefton, & Williams, 1990; Humpf, Winterhalter, & Schreier, 1991; Versini et al., 1991; Winterhalter, 1991). It was revealed that grape varieties with evident floral aroma classified as ‘‘aromatic varieties’’ (e.g. Muscats, Malvasie, Riesling, Mu ¨ller- Thurgau, Gewu ¨rztraminer) are characterized from a high monoterpenol content, which increases during the latest stages of ripening (Di Stefano, 1996). A number of monoterpenols has been identified, the principal are reported in Figure 1. Chemical transformations involving monoterpenols during fermentation and wine aging with formation of new monoterpenols in wine, were also studied (Williams, Strauss, & Wilson, 1980; Di Stefano, 1989; Di Stefano, Maggiorotto, & Gianotti, 1992). By GC/MS, was revealed also that norisoprenoid com- pounds contribute to the forming of grape and wine aroma (Strauss et al., 1986, 1987; Strauss, Wilson, & Williams, 1987; Winterhalter, Sefton, & Williams, 1990; Humpf, Winterhalter, & Schreier, 1991; Winterhalter, 1991). Among them, vitispiranes, riesling acetal (2,2,6,8-tetramethyl-7,11-dioxatricyclo[6.2.1.0 1,6 ] undec-4-ene), b-damascenone, b-damascone, a- and b-ionol, a- and b-ionone, 1,1,6-trimethyl-1,2-dihydronaphtalene (TDN), actinidols, confer particular spice and floral fragrances (struc- tures reported in Fig. 2). In the nineties, GC/MS studies of the Sauvignon grapes and wines revealed sulphur compounds and methoxypyrazines (grassy note) as the typical aroma compounds of these varieties (principal structures are reported in Fig. 3) (Harris et al., 1987; Lacey et al., 1991; Allen, Lacey, & Boyd, 1994, 1995; Tominaga, Darriet, & Dubourdieu, 1996; Bouchilloux, Darriet, & Dubourdieu, 1998). Recently, mass spectrometry has been applied to study grape polyphenols, compounds related to the benefits of a moderate wine consumption. Liquid chromatography-mass spectrometry (LC/MS) permitted to improve the polyphenols characterization (anthocyanins, flavonols, tannins and proanthocyanidins, hydro- xycinnamic and hydroxycinnamoyltartaric acids), and to under- stand several mechanisms involved in the color stability of wine (Flamini, 2003). In the recent years, viticulture and enology play an important role for economy of many countries, and considerable efforts are devoted to improve the product quality and to match the widest approval of market. Many important industrial processes are finali- zed to improve organoleptic characteristics of wine: alcoholic Mass Spectrometry Reviews, 2006, 25, 741– 774 # 2006 by Wiley Periodicals, Inc. ———— *Correspondence to: Riccardo Flamini, CRA, Istituto Sperimentale per la Viticoltura, Viale XXVIII Aprile 26, I-31015 Conegliano (TV), Italy. E-mail: riccardo.fl[email protected]

Welcome message from author
This document is posted to help you gain knowledge. Please leave a comment to let me know what you think about it! Share it to your friends and learn new things together.
Transcript

MASS SPECTROMETRY IN GRAPE AND WINE CHEMISTRY.PART II: THE CONSUMER PROTECTION
Riccardo Flamini* and Annarita PanighelCRA, Istituto Sperimentale per la Viticoltura, Viale XXVIII Aprile 26,I-31015 Conegliano (TV), Italy
Received 25 July 2005; received (revised) 28 November 2005; accepted 28 November 2005
Published online 22 March 2006 in Wiley InterScience (www.interscience.wiley.com) DOI 10.1002/mas.20087
Controls in food industry are fundamental to protect the con-sumer health. For products of high quality, warranty of originand identity is required and analytical control is very importantto prevent frauds. In this article, the ‘‘state of art’’ of massspectrometry in enological chemistry as a consumer safetycontribute is reported. Gas chromatography-mass spectrometry(GC/MS) and liquid-chromatography-mass spectrometry (LC/MS) methods have been developed to determine pesticides,ethyl carbamate, and compounds from the yeast and bacterialmetabolism in wine. The presence of pesticides in wine ismainly linked to the use of dicarboxyimide fungicides onvineyard shortly before the harvest to prevent the Botrytiscinerea attack of grape. Pesticide residues are regulated atmaximum residue limits in grape of low ppm levels, butsignificantly lower levels in wine have to be detected, and massspectrometry offers effective and sensitive methods. Moreover,mass spectrometry represent an advantageous alternative to theradioactive-source-containing electron capture detector com-monly used in GC analysis of pesticides. Analysis of ochratoxinA (OTA) in wine by LC/MS and multiple mass spectrometry(MS/MS) permits to confirm the toxin presence without the useof expensive immunoaffinity columns, or time and solventconsuming sample derivatization procedures. Inductivelycoupled plasma-mass spectrometry (ICP/MS) is used to controlheavy metals contamination in wine, and to verify the wineorigin and authenticity. Isotopic ratio-mass spectrometry(IRMS) is applied to reveal wine watering and sugar additions,and to determine the product origin and traceability. # 2006Wiley Periodicals, Inc., Mass Spec Rev 25:741–774, 2006Keywords: wine pesticides; wine defects; ethyl carbamate;ochratoxin A; mass spectrometry; lead in wine; illegaladditions to the wine
I. INTRODUCTION
The first applications of mass spectrometry in the study of grapeand wine chemistry were performed in the early eightiesby electron impact gas chromatography-mass spectrometry(GC/MS-EI). Many wine volatile compounds formed withalcoholic fermentation were identified, so as aroma compoundsfrom the grape (Rapp & Knipser, 1979; Rapp, Knipser, & Engel,
1980; Williams, Strauss, & Wilson, 1980, 1981; Williams et al.,1982; Rapp, Mandery, & Ullemeyer, 1983, 1984; Rapp,Mandery, & Niebergall, 1986; Strauss et al., 1986, 1987; Strauss,Wilson, & Williams, 1987; Shoseyov et al., 1990; Winterhalter,Sefton, & Williams, 1990; Humpf, Winterhalter, & Schreier,1991; Versini et al., 1991; Winterhalter, 1991). It was revealedthat grape varieties with evident floral aroma classified as‘‘aromatic varieties’’ (e.g. Muscats, Malvasie, Riesling, Muller-Thurgau, Gewurztraminer) are characterized from a highmonoterpenol content, which increases during the latest stagesof ripening (Di Stefano, 1996). A number of monoterpenols hasbeen identified, the principal are reported in Figure 1. Chemicaltransformations involving monoterpenols during fermentationand wine aging with formation of new monoterpenols in wine,were also studied (Williams, Strauss, & Wilson, 1980; DiStefano, 1989; Di Stefano, Maggiorotto, & Gianotti, 1992).
By GC/MS, was revealed also that norisoprenoid com-pounds contribute to the forming of grape and wine aroma(Strauss et al., 1986, 1987; Strauss, Wilson, & Williams, 1987;Winterhalter, Sefton, & Williams, 1990; Humpf, Winterhalter, &Schreier, 1991; Winterhalter, 1991). Among them, vitispiranes,riesling acetal (2,2,6,8-tetramethyl-7,11-dioxatricyclo[6.2.1.01,6]undec-4-ene), b-damascenone, b-damascone, a- and b-ionol,a- and b-ionone, 1,1,6-trimethyl-1,2-dihydronaphtalene (TDN),actinidols, confer particular spice and floral fragrances (struc-tures reported in Fig. 2).
In the nineties, GC/MS studies of the Sauvignon grapes andwines revealed sulphur compounds and methoxypyrazines(grassy note) as the typical aroma compounds of thesevarieties (principal structures are reported in Fig. 3) (Harriset al., 1987; Lacey et al., 1991; Allen, Lacey, & Boyd, 1994,1995; Tominaga, Darriet, & Dubourdieu, 1996; Bouchilloux,Darriet, & Dubourdieu, 1998).
Recently, mass spectrometry has been applied to study grapepolyphenols, compounds related to the benefits of a moderatewine consumption. Liquid chromatography-mass spectrometry(LC/MS) permitted to improve the polyphenols characterization(anthocyanins, flavonols, tannins and proanthocyanidins, hydro-xycinnamic and hydroxycinnamoyltartaric acids), and to under-stand several mechanisms involved in the color stability of wine(Flamini, 2003).
In the recent years, viticulture and enology play an importantrole for economy of many countries, and considerable efforts aredevoted to improve the product quality and to match the widestapproval of market. Many important industrial processes are finali-zed to improve organoleptic characteristics of wine: alcoholic
Mass Spectrometry Reviews, 2006, 25, 741– 774# 2006 by Wiley Periodicals, Inc.
————*Correspondence to: Riccardo Flamini, CRA, Istituto Sperimentale
per la Viticoltura, Viale XXVIII Aprile 26, I-31015 Conegliano (TV),
Italy. E-mail: [email protected]

fermentation is promoted by inoculum of selected yeast, extractionof grape components is enhanced by maceration of grape skinsin controlled conditions and by addition of selected enzymes,malolactic fermentation and barrel- and bottle-aging are performedto achieve biological stability and to improve flavor and fragranceof product (Flamini, 2003). To guarantee the quality of product, allthese steps have to be monitored and verified.
Community laws, as well as the single Country ones, aredevoted to protect the consumer health, other than the internalmarket from introduction of low quality products, by accuratecontrols of foods. As a consequence, for exporting of wine andderivate products, quality certificates are often required, inparticular with regard to the presence of pesticides, heavy metals,ethyl carbamate and toxins, for which legal limits are oftendefined. To prevent frauds and to confirm the product identity,accordance between the real product characteristics and theproducer declarations (e.g., variety, geographic origin, quality,vintage) has to be verified. Some maximum limits of grape andwine contaminants are fixed by national and communityregulations, and are reported in Table 1.
Activity of researchers and organisms of control is devotedto develop new methods to verify the product origin (Ogrinc et al.,2001), to detect illegal additions and adulteration such as sugar-beet, cane sugar or ethanol addition and watering (Guillou et al.,2001), to protect consumer health through determination of foodcontaminants (Szpunar et al., 1998; MacDonald et al., 1999;Wong & Halverson, 1999).
On the other hand, to expand the worldwide market,considerable efforts of the main wine producer countries aredevoted to improve image of product, as a consequence theproduct characteristics and origin have to be well defined. Theresearch in viticulture and enology tries to enhance the typicalcharacteristics of grape varieties by selection of best clones, andto identify the more suitable parameters for the productcharacterization (Di Stefano, 1996; Flamini, Dalla Vedova, &Calo, 2001). For the variety characterization, several parametersof plant and grape, such as DNA, amphelography, isoenzymes,chemical compounds of grape (e.g., polyphenols, terpenes andnorisoprenoids, benzenoids, methoxypyrazines), are studied(Costacurta et al., 2001).
FIGURE 1. The principal monoterpenols that characterize with floral aroma the aromatic grape varieties
such as Muscats, Malvasie, Riesling, Muller-Thurgau, and Gewurztraminer. 1 furan linalool oxide (trans
and cis); 2 linalool; 3 neral (Z) and geranial (E); 4 a-terpineol; 5 trans-ocimenol; 6 pyran linalool oxide
(trans and cis); 7 citronellol; 8 nerol (Z) and geraniol (E); 9 diendiol I; 10 endiol; 11 diendiol II; 12 hydroxy
citronellol; 13 8-hydroxy dihydrolinalool; 14 7-hydroxy nerol (Z) and 7-hydroxy geraniol (E); 15 8-hydroxy
linalool (trans and cis); 16 7-hydroxy-a-terpineol; 17 geranic acid.
& FLAMINI AND PANIGHEL
742 Mass Spectrometry Reviews DOI 10.1002/mas

GC/MS and LC/MS have also been applied to developmethods for the legal parameters control finalized to theconsumer health protection and to prevent frauds, such asdetermination of pesticides in wine, detection of compoundsformed during alcoholic fermentation by yeast and bacteria,determination of illegal additions to the wine. Also methods fordetermination of toxins in the wine have been proposed (Zollneret al., 2000). Isotopic ratio-mass spectrometry (IRMS) is appliedto determine the product origin and traceability (Guillou et al.,2001); inductively coupled plasma-mass spectrometry (ICP/MS)is nowadays a large-used technique to determine heavy metals inwine.
For these aims the knowledge of the chemical compositionof grape and wine is essential. In the present review, the important
role of mass spectrometry in this frame is discussed, a techniquethat in the last years has permitted a rapid increase of enologicalchemistry knowledge, also promoted by introduction of newtechnologies such as LC/MS and ICP/MS. The ‘‘state of art’’ ofmass spectrometry in enological chemistry as a consumer safetycontribute is presented.
II. MASS SPECTROMETRY AS THE PRINCIPALTOOL FOR THE WINE PESTICIDES AND OTHERCONTAMINANTS DETECTION
There is a large interest regarding health and safety issuesassociated with the fungicides, insecticides and herbicide use,
FIGURE 2. Norisoprenoid compounds that characterize the grape and wine aroma with spice and floral
fragrances. 18 vitispiranes; 19 riesling acetal; 20 b-damascenone; 21 b-damascone; 22 a-ionol; 23 b-ionol;
24 a-ionone; 25 b-ionone; 26 TDN (1,1,6-trimethyl-1,2-dihydronaphtalene); 27 actinidols.
FIGURE 3. Sulphur compounds and methoxypyrazines identified as the typical aroma compounds
of Sauvignon grapes and wines. 28 3-isobutyl-2-methoxypyrazine; 29 3-sec-butyl-2-methoxypyrazine;
30 3-isopropyl-2-methoxypyrazine; 31 3-ethyl-2-methoxypyrazine; 32 3-mercaptohexyl acetate; 333-mercaptohexan-1-ol; 34 4-mercapto-4-methylpentan-2-one; 35 4-mercapto-4-methylpentan-2-ol; 363-mercapto-3-methylbutan-1-ol.
GRAPE AND WINE CHEMISTRY &
Mass Spectrometry Reviews DOI 10.1002/mas 743
and the possible presence of their residues in processed foods anddrinks. The high concern about health risks connected withpesticides, led to the development of several European Commu-nity (EC) Directives (also adopted by the Italian Legislation)stating maximum residue limits (MRLs) tolerated for each foodcommodity (Official Gazette of the Italian Republic, 1994,1995). Wine and grape are included among these commodities,in particular in wine the procymidone MRL has been definedto 0.5 mg/L, such as for cyprodinil and fludioxomil, 0.1 mg/Lfor myclobutanil, and 2 mg/L for iprodione; MRLs in grape havebeen fixed to 10 mg/kg for folpet, 5 mg/kg for vinclozolin, and3 mg/kg for carbaryl (Official Gazette of the Italian Republic,2004).
Fungicides, insecticides, and herbicide are commonly usedin viticulture. Structures of principal pesticides are reported inFigure 4, carbaryl is reported in Figure 12. Dicarboxyimidefungicides have been widely used against Botrytis cinerea invineyards. Vineyards are treated in the final stage of vegetation toprevent grape’s attack, which may occurs shortly before theharvest. Among them, vinclozolin and iprodione are currentlyemployed in Italy (Cabras et al., 1983; Matisova et al., 1996).These fungicides show reduced toxicity, but 3,5-dichloroaniline,the probable common final product of their degradation or
metabolic pathway, seems to be as hazardous as other aromaticamines.
Although maximum residue limits for most pesticides inwine have not been fixed, several countries have establishedguidelines in the authorized use of pesticides and MRLs for thetreatment of vines and grapes used in wine production. Pesticideresidues are regulated at MRLs in grapes at low ppm levels.Because the vinification process lowers the level of pesticides,their contents in wines are significantly lower than in grapes. As aconsequence, methods to detect pesticide residues must be veryeffective and sensitive (Wong & Halverson, 1999).
One of the first MS methods for determination of pesticidesin wine reported in literature was GC/MS-EI by performinganalysis with a diphenil-dimethyl polysiloxane capillary columnand the use of aldrin as internal standard (IS) (Wynn et al., 1993).Analysis of procymidone was performed by liquid extraction ofsample with hexane, and SIM mode analysis recording signals atm/z 96 and 283 for procymidone, and m/z 263 and 265 for the IS.By using both electronic capture detector (ECD) and MSdetector, the same limit of quantification (LOQ) of 2 mg/L wasreported.
In 1996, analysis of vinclozolin and iprodione in wine bysolid phase extraction (SPE) sample preparation with a porous
TABLE 1. Maximum limits of some grape and wine contaminants fixed by regulations of single countries, European Union
(EU), United Nations (UN)
contaminant grape wine grape juice Country source(mg/kg) (ppm) (ppm)
Carbaryl 3 Italy DM 14.12.20045 UN Codex Alimentarius
Diuron 0,05 Italy DM 14.12.2004Fenoxycarb 0,2 Italy DM 14.12.2004Folpet 10 Italy DM 14.12.2004
2 UN Codex AlimentariusIprodione 10 2* UN / Italy Codex Alimentarius / DM 14.12.2004Myclobutanil 1 0,1* UN / Italy Codex Alimentarius / DM 14.12.2004Penconazole 0,2 UN / Italy Codex Alimentarius / DM 14.12.2004Pirimicarb 0,2 Italy DM 14.12.2004Procymidone 5 0,5* Italy Codex Alimentarius / DM 14.12.2004Propiconazole 0,5 Italy DM 14.12.2004Triadimefon 2 Italy DM 14.12.2004Vinclozolin 5 UN / Italy Codex Alimentarius / DM 14.12.2004Ochratoxin A 0,002 0,002 0,002 EU CE Regulation n° 123/2005Pb 0,2 0,2 0,05 EU CE Regulation n° 466/2001Histamine 2 Germany recommended (Souza et al., 2005)
5 Belgium recommended (Souza et al., 2005)8 France recommended (Souza et al., 2005)10 Switzerland recommended (Souza et al., 2005)
*Only for Italy.
& FLAMINI AND PANIGHEL
744 Mass Spectrometry Reviews DOI 10.1002/mas

carbon stationary phase was performed (Matisova et al., 1996).Analytes were recovered with toluene and analyses performed byGC/MS. Thermal stability, chemical resistance, and stability overa wide pH range of carbon sorbents were evaluated. Recoveries oftwo fungicides in both standard solutions and spiked winesamples ranging between 80% and 97% were reported. MSanalyses were carried out by ion trap detector (ITD) in bothmultiple ion detection (MID) and SCAN mode. By selecting thecharacteristic ions of each compounds, LOQs of 50 ng/L forvinclozolin (by recording signals at m/z 178, 180, 198, 200, 212,215, 285, 287) and of 50 mg/L for iprodione (by recording signalsat m/z 187, 189, 244, 247, 314, 316), were recorded with a signalto noise ratio of 3 (S/N¼ 3). By performing analysis of avinclozolin 0.01 mg/L standard solution in MID mode,unambiguous compound identification was obtained, by ITDsensitivity of method for iprodione resulted significantly lowerthan for vinclozolin.
In the same year, a GC/MS method for analysis of fungicidemetalaxyl in wine by SPE sample preparation using a carbonsorbent, was performed (Kakalıkova, Matisova, & Lesko, 1996).Recoveries greater than 92% were reported for metalaxylstandard solutions at concentration 3–100 mg/mL, whereasrecoveries in spiked wines ranged from 80% to 99% dependingon the concentration and the sample matrix. LOQ by GC/MS-ITwas 0.50 mg/L. Metalaxyl residue concentration in wine closelyrelated to the interval between the last treatment of the vines andthe harvest of the grapes was observed.
Cabras et al. performed two different GC/MS methods bymicroextraction with acetone/hexane to determine the fungicides
cyprodinil, fludioxonil, pyrimethanil, tebuconazole, azoxystro-bin, fluazinam, kresoxim-methyl, mepanipyrim, and tetracona-zole in grapes, must, and wine. The methods limits of detection(LODs) resulted 0.05 mg/L for cyprodinil, pyrimethanil andkresoxim-methyl, and of 0.10 mg/L for the other analytes (Cabraset al., 1997a, 1998).
To perform the routine monitoring of pesticides, in 1997Kaufmann developed a fully automated reverse-phase SPE andGC/MS method for the simultaneous determination of 21different pesticides in wine (Kaufmann, 1997). By performingSIM mode analysis and monitoring the m/z species reported inTable 2, the method showed LODs between 5 and 10 mg/L, andlinearity regression coefficients greater than 0.99 (except for 4,4-dichloro-benzphenone and dicofol). Recoveries of 17 pesticidesin spiked wine samples ranged from 80% to 115%.
In 1998, Vitali et al. proposed a solid-phase microextraction(SPME) and GC/MS SIM mode method to determine sevendifferent insecticides (lindane, parathion, carbaryl, malathion,endosulfan, methoxychlor, and methidathion), 4 fungicides(procymidone, vinclozoline, folpet, and captan) and 3 herbicides(terbuthylazine, trifluralin and phosalone) in wine (Vitali et al.,1998). Authors highlight advantages of SPME as solvent-freeand easy and fast method that requires a very small samplevolume. SPME coupled with GC/MS has been also successfullyapplied in several studies on kinetics of fermentation and aromaprofiling of wines (Favretto et al., 1998; Vas et al., 1998; Francioliet al., 1999; Rocha et al., 2001; Vianna & Ebeler, 2001;Mallouchos et al., 2002; Bonino et al., 2003; Alves, Nascimento,& Nogueira, 2005; Flamini et al., 2005). SPME was performed by
FIGURE 4. The principal pesticides used in viticulture: procymidone 37; cyprodinil 38; fludioxonil 39;
myclobutanil 40; iprodione 41; folpet 42; vinclozolin 43.
GRAPE AND WINE CHEMISTRY &
Mass Spectrometry Reviews DOI 10.1002/mas 745

a silica fiber coated with polydimethylsiloxane (PDMS), per-forming extraction under stirring for 30 min and immerging thefiber in the wine sample saturated with MgSO4. Compounds werethermically desorbed in the GC injection chamber at 2508C. Forthe 14 pesticides investigated, LODs ranging between 0.1 and6 mg/L were recorded. Pesticide residues contamination wasrevealed at detectable levels in 12 of the 21 wines analyzed: 7pesticides were found at 0.8–5 mg/L levels, procymidone wasfound in 83% of the positive samples.
In 1999, Wong and Halverson performed a SPE and GC/MS-SIM method to quantify simultaneously 48 different pesticidesin wine (Wong & Halverson, 1999). Sample preparation wasperformed by a reverse phase C18 cartridges with elution ofanalytes using ethyl acetate. The Authors observed that additionof NaCl to the samples prior to extraction increased the extractionefficiency of 38 compounds, except for allethrin and demetonS-methyl.
In 2002, Natangelo et al. compared performances of aquadrupole mass filter (Q) MS and an ion trap (IT) MS systemsfor the pesticides analysis (Natangelo, Tavazzi, & Benfenati,2002). Sample preparation was performed by SPME, and themethods for analysis of propanil (anilide post-emergent herbi-cide), acetochlor (chloroacetanilide pre-emergent herbicide),myclobutanil (azole fungicide), and fenoxycarb (carbamateinsecticide) in grape juice and wine, were evaluated. Structuresof propanil and acetochlor are reported in Figure 5 (structure of
myclobutanil is reported in Fig. 4, fenoxycarb in Fig. 12). Toperform the GC/MS-Q analysis, the signals of ions at m/z 161and 163 (propanil), 146 and 162 (acetochlor), 150 and 179(myclobutanil), 88 and 116 (fenoxycarb) were recorded in SIMmode. For the GC/MS-IT analysis, collisionally produced ionsformed by multiple mass spectrometry (MS/MS) at m/z161! 126; 134 (propanil), m/z 223! 146 (acetochlor), m/z179! 125; 152 (myclobutanil), m/z 116! 88 (fenoxycarb),were monitored. SPME was performed with a poly(ethyleneglycol)/divinylbenzene (PEG/DVB) fiber (65 mm thickness) bydirect immersion of the fiber in the sample under stirring and afterNaCl addition. Analytes were desorbed by exposing the fiber inthe GC injector port 15 min at 2508C. Evaluation of the GC/MS-MS method LODs was carried out by selecting the most abundantdaughter ion generated by collisionally induced dissociation(CID) experiment; LODs calculated with S/N¼ 3 and precisioncalculated on three replicate analyses, are reported in Table 3.The two methods showed a comparable sensitivity, suitable tosatisfy the Italian legal limits of myclobulanil and fenoxycarb ingrapes (0.2 mg/kg). Both methods showed good linearity forsamples spiked at concentration below 200 mg/L. The precisionwas generally comparable, except in the analysis of myclobutanilin grape juice where IT showed lower precision.
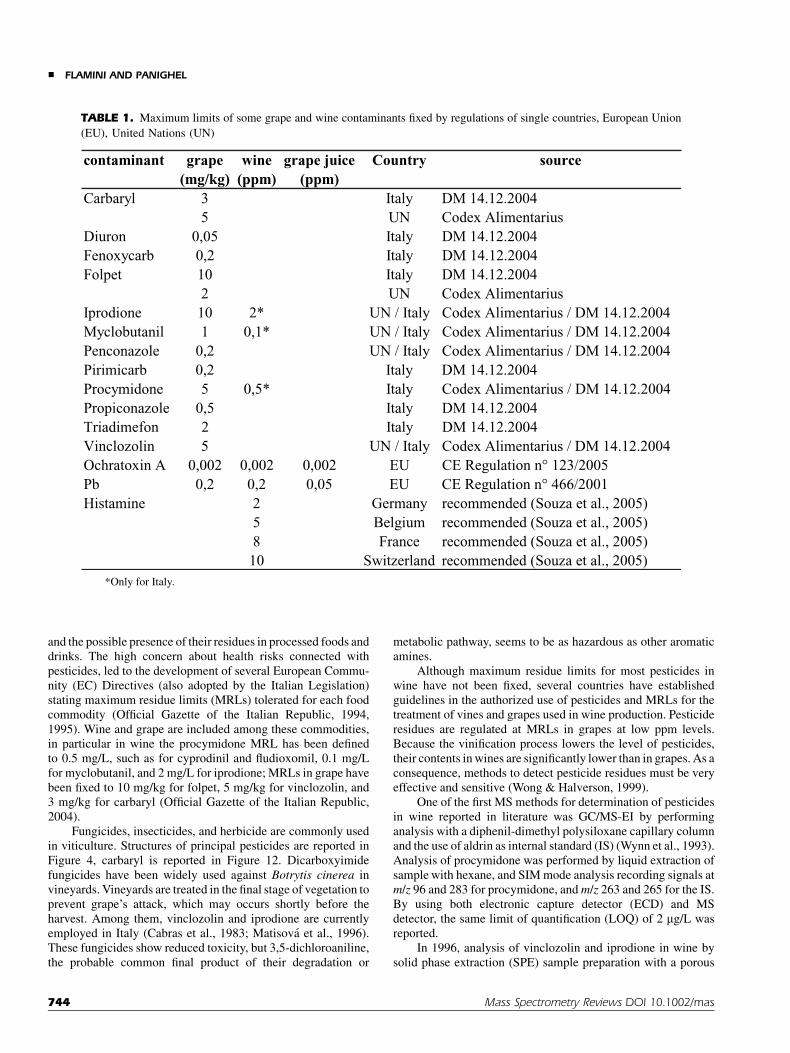
In 2003, Wong et al. developed an accurate SPE and GC/MS-SIM method for the multiresidue pesticides detection inwine by using a 5% diphenyl-95% dimethyl polysiloxanecapillary GC column (Wong et al., 2003). Pesticides wereextracted by a polymeric cartridge, and compounds co-elutedwith analytes were removed by passage through an aminopropyl-MgSO4 cartridge. Scheme of sample preparation is reported inFigure 6. Organohalogen, organonitrogen, organophosphate, andorganosulfur pesticides and residues (in total 153 compounds)were analyzed performing three different analyses by threedifferent SIM programs. Recoveries from samples spiked at10 mg/L resulted greater than 70% for 116 and 124 analytes in redand white wines, respectively. Identification of compound wasconfirmed by retention time of target ion and on three qualifier-to-target ion ratios. LOD for most of the pesticides was less than5 mg/L. The compounds analyzed are reported in Table 4 togetherwith the corresponding target and qualifier ions and LODs.
Stir-bar-sorptive-extraction (SBSE) uses a stir bar (typically10-mm length) incorporated in a glass tube and coated withPDMS. Upon stirring analytes are partitioned between the liquidmatrix of sample and the PDMS phase on the stir bar. Recoveriesincrease in according to the volume PDMS to the sample volumematrix ratio. Subsequently, the stir bar is transferred to a compactthermal desorption unit mounted on a programmable temperature
TABLE 2. Wine pesticides and corre-
sponding m/z species monitored in SIM
mode by automated reverse-phase solid-
phase-extraction and GC/MS
Pesticide m/zEthyl hydrocinnamate (I.S.) 104;1784,4-Dichloro-benzphenone 111;139Azinphos-methyl 93;160Bromopropylate 183;341Captafol 79;151Captan 79;149Chlorpyrifos 314;316Dichlofluanid 123/224Dicofol 139;251Dimethoate 87;125Endosulfan 241;339Etrimfos 181;292Fenamiphos 154;303Fenamirol 251;330Folpet (42) 260;295Iprodione (41) 187;314Malathion 125;173Methidathion 125;145Parathion-methyl 109;263Procymidone (37) 283;285Triadimefon (51) 181;208Vinclozolin (43) 212;285
Numbers corresponding to structures
in Figures 4 and 10 are reported.
FIGURE 5. Structures of some herbicides used in viticulture: acetochlor
(44) and propanil (45).
& FLAMINI AND PANIGHEL
746 Mass Spectrometry Reviews DOI 10.1002/mas

vaporization (PTV) injector and analytes are thermally desorbedinto the GC column. The stir bars allow a 500-fold increase inenrichment, and thus sensitivity, compared to SPME with 100-mm PDMS fibers.
A method to determine the dicarboximide fungicidesvinclozolin, iprodione, and procymidone (structures 43, 41, 37in Fig. 4, respectively) by SBSE and thermal desorption GC/MSanalysis (SBSE-TD-GC/MS), was proposed (Sandra et al.,2001). Iprodione was detected as its degradation product (3,5-dichlorophenyl)hydantoin; the method accuracy was verified bySBSE and liquid desorption Atmospheric-Pressure-Chemical-Ionization negative mode (SBSE-LD-LC/APCI-MS) analysis.By liquid–liquid extraction and MS detection, LOD is in theorder of 1 mg/L for vinclozolin. By capillary GC-Ion Trap massspectrometry (GC-IT) determinations in the ng/L range forvinclozolin and mg/L for iprodione, are achieved. By SBSE andGC/MS analysis in SCAN mode, limits of quantification were 0.5mg/L for vinclozolin and procymidone, and 5 mg/L for iprodione.LODs were 0.2 mg/L for vinclozolin and procymidone, and 2 mg/L for iprodione. By operating in SIM mode, LODs in the order of2 ng/L for vinclozolin and procymidone, and of 50 ng/L foriprodione, were achieved. Fragmentation spectra of three com-pounds are reported in Figure 7. Vinclozolin and procymidoneare easily identified, whereas iprodione showed low abundance.As a matter of fact, decomposition of iprodione occurs in the GCcolumn at temperatures above 2008C, the compound is degradedfor 90% to the more stable (3,5-dichlorophenyl)hydantoin.Decomposition also occurs during thermal desorption of the stirbar at 3008C and the analyte transfer in the hot transfer line.Because of the peak area ratio of iprodione and its degradationproduct is constant, quantification was performed on (3,5-dichlorophenyl)hydantoin. White wines and sparkling winesfrom different origin (France, Italy, South Africa) were analyzed,vinclozolin was found in concentration 2.6 mg/L in a sparklingwine; procymidone and iprodione resulted more abundant withconcentration between 5 and 65 mg/L.
The accuracy of the SBSE-TD-GC/MS method for theiprodione detection via degradation product was verified by
SBSE-LD-LC/MS analysis of a sparkling wine. After SBSEsampling, the stir bar was desorbed in acetonitrile and the LC/APCI-MS analysis of extract was performed. Analyses werecarried out by a C18 column using water and 10% tetrahydrofuranin methanol as mobile phase and gradient elution. APCI wasperformed in the negative mode in the mass range at mlz200–350, with a fragmentor voltage 70 V and capillary voltage4,000 V. Analyses were performed in SIM mode by recordingsignals at mlz 242.9, 245.0, and 246.8 for iprodione. Authorsreported this as the first application of SBSE with liquiddesorption; results obtained by SBSE-TD-GC/MS and SBSE-LD-LC/MS were comparable.
The (MþCH3OH-H)� ion formed for vinclozolin (MW286) and procymidone (MW 284) was observed; for iprodione(MW 330) formation of [M-CONHCH(CH3)2]� ion was due tothe thermolabile character of compound under the chemicalionization conditions used (spectra are reported in Fig. 8).Authors reported the negative chemical ionization (NICI) as abetter ionization and robustness method than positive chemicalionization (PICI), and than both positive and negative electro-spray ionization (ESI).
In a recent study, SBSE has been applied for the MSpesticides wine analysis (Hayasaka et al., 2003). On the basis offragmentation spectra, 18 different agrochemicals were identi-fied in wine. Recording signals at m/z 96, 283, and 285 (SIMmode) procymidone exhibited one of the strongest ion response,for this compound was estimated a LOD down to low ng/L levels.
Butyltin compounds, monobutyltin (MBT), dibutyltin(DBT), and tributyltin (TBT) (structures reported in Fig. 9) areused for the production of biocides and polymer stabilizers(Hoch, 2001). In particular, MBT and DBT are used as heat andlight stabilizers for poly(vinyl chloride) (PVC) materials, DBT isalso used as a binder in water-based varnishes (Summary ofReport 6/00, 2000). The main application of TBT is as a biocidein marine antifouling paints. In vitro studies revealed thatbutyltins disrupt the immune response in human, with effect onthe natural killer cells involved in the immune defense againstinfections and cancer (De Santiago & Aguilar-Santelises, 1999;
TABLE 3. Comparative data of precision (RSD for three replicate analyses)
and limits of detection of pesticides
grape juice white wine grape juice white wineGC/MS
Propanil (45) 5.9 5.3 0.1 1Acetochlor (44) 9,1 7,3 0,2 5Myclobutanil (40) 11,3 5,1 1,0 8Fenoxycarb (58) 14,4 4,1 0,3 4
GC/MS-MSPropanil 9,6 7,2 2 3Acetochlor 13,0 3,1 5 15Myclobutanil 17,7 2,2 10 2Fenoxycarb 11,2 9,1 8 5
LOD (µµg/L)precision (RDS, n=3)
mg/L based on a signal-to-noise ratio 3:1; obtained by GC/MS-Q SIM-mode
and GC/MS-MS analysis coupled with SPME (PEG/DVB 65 mm thickness fiber).
Numbers corresponding to structures in Figures 4, 5, and 12 are reported.
GRAPE AND WINE CHEMISTRY &
Mass Spectrometry Reviews DOI 10.1002/mas 747

FIGURE 6.
& FLAMINI AND PANIGHEL
748 Mass Spectrometry Reviews DOI 10.1002/mas

Whalen, Loganathan, & Kannan, 1999). Butyltin compounds arewidespread contaminants also found in some wines.
Azenha and Vasconcelos studied the presence of thesecompounds in Portuguese wines by SPME/GC/MS-IT (Azenha& Vasconcelos, 2002). Ethyl-derivatized butyltin compounds,produced by reaction with NaBEt4, were extracted and analyzed.For SPME a PDMS fiber was used, by performing headspaceextraction at 408C for 20–30 min. To perform GC analysis,compounds were thermally desorbed from the fiber into the linerin 1.5 min. LODs recorded ranged between 0.05 and 0.2 mg/L asSn for MBT, 0.02 and 0.1 mg/L as Sn for DBT, and 0.01 and0.05 mg/L as Sn for TBT, and showed to be strongly influencedby the matrix. In 14% of the 43 table and 14 Port wines analyz-ed, DBT was found at concentrations ranging between 0.05 and0.15 mg/L, the presence of MBTwas instead revealed in only onesample. In order to search the possible sources of DBT residues inthe wines, a study of some plastic and oak wood materials used inthe process of wine-making and directly in contact with mustsand wines, was performed. The results suggest that high-densitypolyethylene containers used to transfer the wine in the vinifi-cation process may be the main sources of these contaminants.
Folpet [N-(trichloromethylthio)phthalimide] is a fungicideused in vineyards (structure 42 reported in Fig. 4) in particularagainst downy mildew (Plasmopara viticola), powdery mildew(Uncinula necator), and gray mold (Botrytis cinerea) (Tomlin,1994). In the last eighties, laboratory studies indicated aneoplasm induction in the duodenum of rats. In general, thepresence of fungicides residues in must may inhibit the alcoholicfermentation. Studies were conducted to assess the naturalhydrolysis of folpet residues in grape musts. Results showed thatfolpet residues are fully decomposed by sunlight in grape must,and that during wine-making the compound is degraded com-pletely. At the end of fermentation, phthalimide, a hydrolysisproduct that did not show to inhibit the alcoholic fermentation, ispresent in wine (Hatzidimitriou et al., 1997; Cabras et al., 1997b).The fungicide may be also added to the wine as illegalpreservative. As a consequence, there is a relevant interest inthe development of methods to determine the folpet residues inwine.
In 1997, Unterweger et al. described a GC/MS method fordetection of folpet residues in grape juices, fermenting grapemusts and wines (Unterweger, Wacha, & Bandion, 1997). Thesample preparation was performed by liquid–liquid extractionwith n-hexane, and analysis by a phenylmethylsiloxane capillarycolumn using captan as internal standard. The method showedquantitative recoveries, and LOD of 100 mg/L.
Allyl isothiocyanate is used to protect the wine from theCandida mycoderma yeast attack and to sterilize the air in winestorage containers. Illegal additions of methyl isothiocyanate towines are made to prevent spontaneous fermentations, and asa soil fumigant for nematodes, fungi, and other diseases invegetables, fruits etc. (Saito et al., 1994; Gandini & Riguzzi,1997).
Uchiyama et al. performed a method for determination ofmethyl isothiocyanate in wine by extraction with ethyl acetateand GC/MS analysis (Uchiyama et al., 1992). Recoveries fromspiked samples ranged between 83% and 90% in white wine, and75% and 82% in red wine, and 0.05 mg/L LOD was obtained. Inthe same year, were published others GC/MS methods to detectmethyl isothiocyanate in wine (Fostel & Podek, 1992; Zimmer,Otteneder, & Bierl, 1992). Fostel and Podek proposed a direct-injection analysis using 1,4-dioxan as internal standard; Zimmeret al. performed liquid extraction of sample with 1,1,2-trichlorotrifluoroethane. In 1995, a GC/MS method for detectionof both methylisothiocyanate and allylisothiocyanate in wine wasdeveloped, with LODs lower than 1 ng/L (Przyborski, Wacha, &Bandion, 1995).
Also triazoles are fungicides widely employed in viticultureto control powdery mildews, rusts, and other fungal pests.Triazoles are classified as acutely toxic because of may affect theliver functionality, to decrease kidney weights, altered urinarybladder structure, to have acute effects on the central nervoussystem (Briggs, 1992). Due to their persistence, they can easilycontaminate fruit juices and wines, the Italian law fixed the LODsof these compounds in wine between 100 and 500 mg/kg.
In 2002, a SPME/GC/MS-EI method for rapid screening ofseveral triazole residues in wine was developed (Zambonin,Cilenti, & Palmisano, 2002). The analysis conditions wereoptimized for determination of triadimefon, propiconazole,myclobutanil, and penconazole (structures showed in Fig. 10,myclobutanil structure 40 reported in Fig. 4).
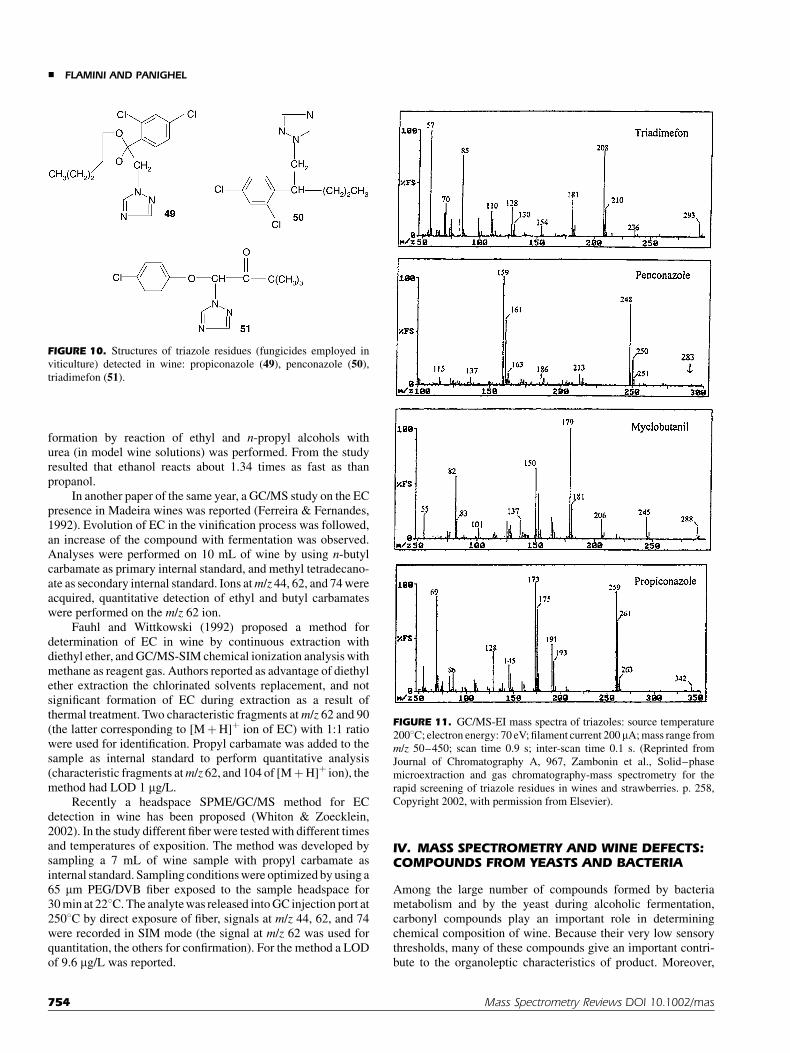
To perform quantitative detection, fragment ions at m/z 128,210, 293, for triadimefon, m/z 145, 173, 259 for propiconazole,m/z 179, 206, 288 for myclobutanil, and m/z 159, 161, 248 forpenconazole, were recorded in SIM mode. Mass spectra oftriazoles are showed in Figure 11. SPME was performed by asilica fiber coated with 85 mm thick polyacrylate, operating at508C under stirring for 45 min; the GC injection port thermaldesorption was performed in 5 min at 2508C. The method LODswere estimated ranging between 30 ng/Kg for propiconazole, and100 ng/Kg for triadimefon, lower the maximum residue levelsrecommended by the European Legislation in wine and grapes(e.g., European Directive 90/642/EEC, 1990). Two commercialwines were analyzed, and 1.0 mg/kg and 1.7 mg/kg ofpropiconazole, and 1.1 mg/kg of penconazole, were found insamples.
HPLC is the most suitable technique to determine polar, lowvolatile, and thermally labile pesticides, such as phenylureas andcarbamates. In spite of the high sensitivity of fluorescencedetection with post-column derivatization, or the robustness ofUV detection, mass detection has advantages of high sensitivityand selectivity. Recently, LC/MS methods to perform thepesticides analysis have been proposed. Fenandez et al. describeda method for analysis of carbamate residues in grape by matrixsolid-phase dispersion (MSPD) extraction and LC/MS analysis(Fernandez, Pico, & Manes, 2000). The method, with the use of
FIGURE 6. Flow chart of the sample preparation method proposed by Wong et al. (2003) for the SPE/GC/
MS-SIM multiresidue pesticides analysis in wine. (Reprinted from Journal of Agricultural and Food
Chemistry 51, Wong et al., Multiresidue pesticide analysis in wines by solid-phase extraction and capillary
gas chromatography-mass spectrometric detection with selective ion monitoring. p. 1150, Copyright 2003,
with permission from American Chemical Society).
GRAPE AND WINE CHEMISTRY &
Mass Spectrometry Reviews DOI 10.1002/mas 749
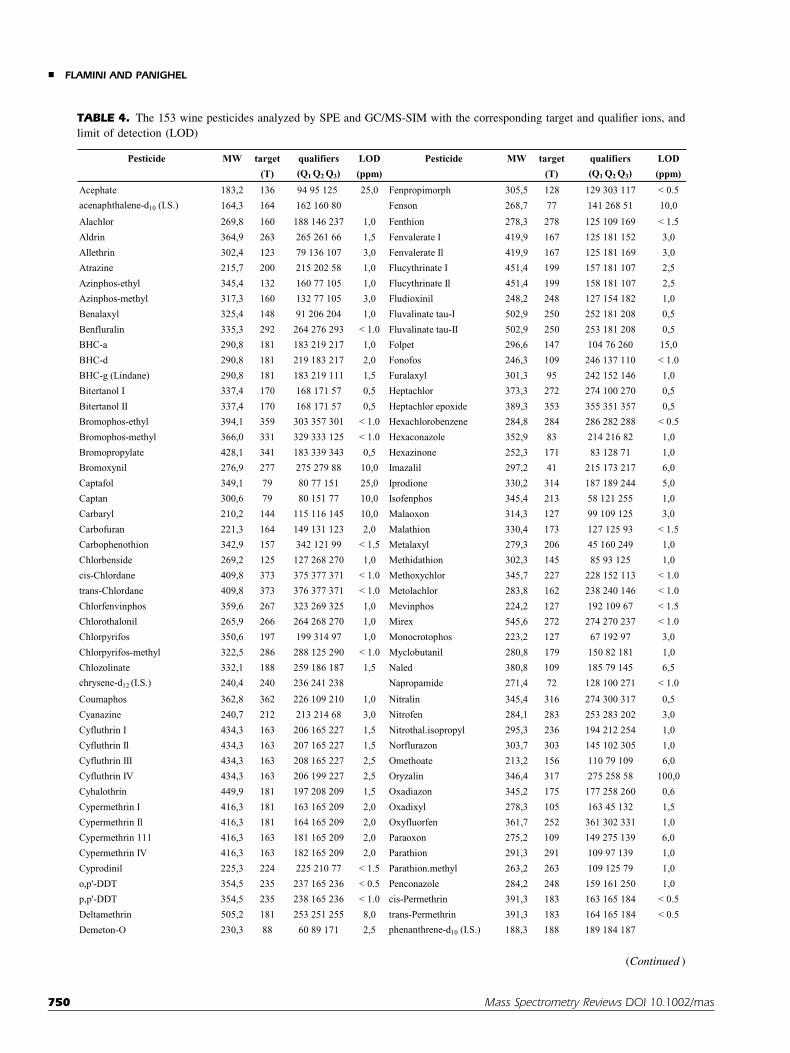
TABLE 4. The 153 wine pesticides analyzed by SPE and GC/MS-SIM with the corresponding target and qualifier ions, and
limit of detection (LOD)
Pesticide MW target qualifiers LOD Pesticide MW target qualifiers LOD
(T) (Q1 Q2 Q3) (ppm) (T) (Q1 Q2 Q3) (ppm)
Acephate 183,2 136 94 95 125 25,0 Fenpropimorph 305,5 128 129 303 117 < 0.5
acenaphthalene-d10 (I.S.) 164,3 164 162 160 80 Fenson 268,7 77 141 268 51 10,0
Alachlor 269,8 160 188 146 237 1,0 Fenthion 278,3 278 125 109 169 < 1.5
Aldrin 364,9 263 265 261 66 1,5 Fenvalerate I 419,9 167 125 181 152 3,0
Allethrin 302,4 123 79 136 107 3,0 Fenvalerate Il 419,9 167 125 181 169 3,0
Atrazine 215,7 200 215 202 58 1,0 Flucythrinate I 451,4 199 157 181 107 2,5
Azinphos-ethyl 345,4 132 160 77 105 1,0 Flucythrinate Il 451,4 199 158 181 107 2,5
Azinphos-methyl 317,3 160 132 77 105 3,0 Fludioxinil 248,2 248 127 154 182 1,0
Benalaxyl 325,4 148 91 206 204 1,0 Fluvalinate tau-I 502,9 250 252 181 208 0,5
Benfluralin 335,3 292 264 276 293 < 1.0 Fluvalinate tau-II 502,9 250 253 181 208 0,5
BHC-a 290,8 181 183 219 217 1,0 Folpet 296,6 147 104 76 260 15,0
BHC-d 290,8 181 219 183 217 2,0 Fonofos 246,3 109 246 137 110 < 1.0
BHC-g (Lindane) 290,8 181 183 219 111 1,5 Furalaxyl 301,3 95 242 152 146 1,0
Bitertanol I 337,4 170 168 171 57 0,5 Heptachlor 373,3 272 274 100 270 0,5
Bitertanol II 337,4 170 168 171 57 0,5 Heptachlor epoxide 389,3 353 355 351 357 0,5
Bromophos-ethyl 394,1 359 303 357 301 < 1.0 Hexachlorobenzene 284,8 284 286 282 288 < 0.5
Bromophos-methyl 366,0 331 329 333 125 < 1.0 Hexaconazole 352,9 83 214 216 82 1,0
Bromopropylate 428,1 341 183 339 343 0,5 Hexazinone 252,3 171 83 128 71 1,0
Bromoxynil 276,9 277 275 279 88 10,0 Imazalil 297,2 41 215 173 217 6,0
Captafol 349,1 79 80 77 151 25,0 Iprodione 330,2 314 187 189 244 5,0
Captan 300,6 79 80 151 77 10,0 Isofenphos 345,4 213 58 121 255 1,0
Carbaryl 210,2 144 115 116 145 10,0 Malaoxon 314,3 127 99 109 125 3,0
Carbofuran 221,3 164 149 131 123 2,0 Malathion 330,4 173 127 125 93 < 1.5
Carbophenothion 342,9 157 342 121 99 < 1.5 Metalaxyl 279,3 206 45 160 249 1,0
Chlorbenside 269,2 125 127 268 270 1,0 Methidathion 302,3 145 85 93 125 1,0
cis-Chlordane 409,8 373 375 377 371 < 1.0 Methoxychlor 345,7 227 228 152 113 < 1.0
trans-Chlordane 409,8 373 376 377 371 < 1.0 Metolachlor 283,8 162 238 240 146 < 1.0
Chlorfenvinphos 359,6 267 323 269 325 1,0 Mevinphos 224,2 127 192 109 67 < 1.5
Chlorothalonil 265,9 266 264 268 270 1,0 Mirex 545,6 272 274 270 237 < 1.0
Chlorpyrifos 350,6 197 199 314 97 1,0 Monocrotophos 223,2 127 67 192 97 3,0
Chlorpyrifos-methyl 322,5 286 288 125 290 < 1.0 Myclobutanil 280,8 179 150 82 181 1,0
Chlozolinate 332,1 188 259 186 187 1,5 Naled 380,8 109 185 79 145 6,5
chrysene-d12 (I.S.) 240,4 240 236 241 238 Napropamide 271,4 72 128 100 271 < 1.0
Coumaphos 362,8 362 226 109 210 1,0 Nitralin 345,4 316 274 300 317 0,5
Cyanazine 240,7 212 213 214 68 3,0 Nitrofen 284,1 283 253 283 202 3,0
Cyfluthrin I 434,3 163 206 165 227 1,5 Nitrothal.isopropyl 295,3 236 194 212 254 1,0
Cyfluthrin Il 434,3 163 207 165 227 1,5 Norflurazon 303,7 303 145 102 305 1,0
Cyfluthrin III 434,3 163 208 165 227 2,5 Omethoate 213,2 156 110 79 109 6,0
Cyfluthrin IV 434,3 163 206 199 227 2,5 Oryzalin 346,4 317 275 258 58 100,0
Cyhalothrin 449,9 181 197 208 209 1,5 Oxadiazon 345,2 175 177 258 260 0,6
Cypermethrin I 416,3 181 163 165 209 2,0 Oxadixyl 278,3 105 163 45 132 1,5
Cypermethrin Il 416,3 181 164 165 209 2,0 Oxyfluorfen 361,7 252 361 302 331 1,0
Cypermethrin 111 416,3 163 181 165 209 2,0 Paraoxon 275,2 109 149 275 139 6,0
Cypermethrin IV 416,3 163 182 165 209 2,0 Parathion 291,3 291 109 97 139 1,0
Cyprodinil 225,3 224 225 210 77 < 1.5 Parathion.methyl 263,2 263 109 125 79 1,0
o,p'-DDT 354,5 235 237 165 236 < 0.5 Penconazole 284,2 248 159 161 250 1,0
p,p'-DDT 354,5 235 238 165 236 < 1.0 cis-Permethrin 391,3 183 163 165 184 < 0.5
Deltamethrin 505,2 181 253 251 255 8,0 trans-Permethrin 391,3 183 164 165 184 < 0.5
Demeton-O 230,3 88 60 89 171 2,5 phenanthrene-d10 (I.S.) 188,3 188 189 184 187
(Continued )
& FLAMINI AND PANIGHEL
750 Mass Spectrometry Reviews DOI 10.1002/mas

APCI or Electrospray (ES) sources in positive mode, showed tobe suitable for detection of carbamate pesticide residues infruit and vegetables at the regulatory relevance levels, allowingthe simultaneous determination of 13 different carbamates:carbaryl, carbofuran, diethofencarb, ethiofencarb, fenobucarb,fenoxycarb, isoprocarb, methiocarb, metholcarb, oxamyl, pir-imicarb, propoxur, and thiobencarb. Structures are reported inFigure 12.
The 13 carbamates were separated by a C8 column using amethanol-water gradient. Authors reported the HPLC chromato-graphic peaks resolution improve by replacing methanol withacetonitrile, but a rapid contamination of the corona dischargeneedle was observed in APCI, probably due to the fact thatacetonitrile is a low-ionizable solvent compared with methanol.In positive mode, by performing increasing of cone voltage from10 to 120 V, the signals of three main ions [MþNa]þ, [MþH]þ,and [MþH – CH3NCO]þ were observed at 20 V. For both APCIand ES sources a cone voltage of 20 V provided the molecularmass information, through the protonated ions [MþH]þ showedlittle fragmentation, and the sensitivity was the highest for all the
compounds. N-methylcarbamate insecticides are labile com-pounds, and some of them undergo collisionally induceddecomposition even at low cone voltage (e.g. at 20 V the basepeak of the oxamyl APCI-positive spectrum was the ion at m/z163 formed by the loss of methylisocyanate residue). In positivemode, ES produces both [MþH]þ and [MþNa]þ adducts,whereas the APCI positive mode only produces the [MþH]þ
ion. By performing APCI in negative mode [M–CONHCH3]�
ions are formed for most compounds, and the [M–H]� ion ofdiethofencarb and fenoxycarb was observed. Better sensitivitywas achieved operating in positive mode. Authors observed thatthe softer ionization of ES with respect to APCI induces lowerfragmentation of oxamyl, and negative fragment ions ofcarbamates were obtained by APCI but not by ES. The LC/APCI-MS negative ion mode approach is proposed as a tool forconfirmation of carbamate with higher levels. The principalspecies and fragment ions formed from each carbamate recordedby performing APCI analysis in both positive- and negative-mode, and by ESI analysis in positive mode, are reported inTable 5.
TABLE 4. (Continued )
Demeton-5 230,3 88 60 170 89 2,5 Phorate 260,4 75 121 260 97 < 1.0
Desmetryn 213,3 213 198 171 58 < 1.5 Phosalone 367,8 182 367 121 184 < 1.0
Dialifos 393,9 208 173 210 76 1,0 Phosmet 317,3 160 161 77 93 < 1.5
Diallate I 270,2 86 234 236 128 < 0.5 Prochloraz 376,7 180 70 307 310 6,0
Diallate Il 270,2 86 235 236 128 < 0.5 Procymidone 284,1 96 283 285 67 1,0
Diazinon 304,3 179 137 199 152 < 1.0 Profenophos 373,6 208 339 139 206 3,0
Dichlobenil 172,0 171 173 136 100 < 1.5 Prometryn 241,4 241 184 226 105 < 1.5
Dichlofluanid 333,2 123 224 167 226 < 1.5 Propargite 350,5 135 150 231 34 0,5
4,4' -Dichlorobenzophenone 251,1 139 111 141 250 0,5 Propazine 229,7 214 229 172 58 < 1.0
Dichlorvos 221,0 109 185 79 187 < 1.0 Propetamphos 281,3 138 194 236 222 < 1.0
Dicloran 207,0 206 176 178 208 4,0 Propyzamide 256,1 173 175 145 255 1,5
Dicrotophos 237,2 127 67 193 72 3,0 Pyrimethanil 199,3 198 199 77 200 < 1.0
Dieldrin 380,9 79 263 277 279 2,0 Ouinalphos 298,3 146 157 118 156 50,0
Dimethoate 229,3 87 93 125 143 2,5 Ouintozene 295,3 237 249 295 214 < 2.0
Dinoseb 240,2 211 163 147 240 150,0 5imazine 201,7 201 186 173 68 3,0
Dioxathion 456,0 97 125 271 153 5,0 Tebuconazole 307,8 125 250 70 83 1,5
Disulfoton 274,4 88 89 97 142 1,0 Tecnazene 260,9 203 261 215 201 1,0
Endosulfan-a 406,9 241 195 239 237 1,5 Terbufos 288,4 231 57 103 153 < 1.0
Endosulfan-b 406,9 195 237 241 207 3,0 Terbuthylazine 229,7 214 173 216 229 < 1.5
Endrin 380,9 317 263 315 319 3,5 Terbutryn 241,4 226 185 241 170 < 1.0
Endrin aldehyde 380,9 67 345 250 347 2,0 Tetrachlorovinphos 366,0 329 331 109 333 < 1.0
Endrin ketone 380,9 317 67 315 319 < 1.0 Tetradifon 356,1 159 111 229 227 1,0
EPN 323,3 157 169 141 185 < 1.0 Thiometon 246,3 88 125 89 93 1,5
Eptam 189,3 128 43 86 132 1,0 Tolyfluanid 347,3 137 238 106 83 2,6
Ethalfluralin 333,3 276 316 292 333 1,0 Triadimefon 293,8 57 208 85 210 1,0
Ethion 384,5 231 153 97 125 1,0 Triadimenol 295,8 112 168 128 70 4,0
Fenamiphos 303,4 303 154 288 217 < 1.0 Tri-allate 304,7 86 268 270 128 < 1.0
Fenarimol 331,2 139 219 251 107 0,6 Trifluralin 335,3 306 264 290 307 < 1.0
Fenitrothion 277,2 277 125 109 260 1,0 Vinclozolin 286,1 212 198 187 285 1,0
Fenpropathrin 349,4 97 181 125 265 0,6
Pesticide MW target qualifiers LOD Pesticide MW target qualifiers LOD
(T) (Q1 Q2 Q3) (ppm) (T) (Q1 Q2 Q3) (ppm)
Reprinted from Journal of Agricultural and Food Chemistry 51, Wong et al., Multiresidue pesticide analysis in wines by solid-phase
extraction and capillary gas chromatography-mass spectrometric detection with selective ion monitoring. p. 1151–1153, Copyright 2003,
with permission from American Chemical Society.
GRAPE AND WINE CHEMISTRY &
Mass Spectrometry Reviews DOI 10.1002/mas 751

Carbofuran was found in a grape sample in concentration0.3–0.5 mg/kg. By performing analysis of 0.5 g sample, theauthors highlighted that the method is appropriate to detectcarbamate residues at lower levels of MRLs admitted by theEuropean Union in fruit and vegetables.
Wu et al. proposed a method for analysis of polar pesticidesin wine by automated in-tube SPME coupled with LC-electrospray ionization (C18-LC/ESI-MS) (Wu et al., 2002). Sixphenylurea pesticides diuron, fluometuron, linuron, monuron,neburon, siduron, and six carbamates barban, carbaryl, chlor-propham, methiocarb, promecarb, propham, were analyzed.Structures of compounds are reported in Figure 13, carbaryl andmethiocarb in Figure 12 (structures 52 and 55, respectively). In-tube SPME is a microextraction and pre-concentration techniquethat can be coupled online with HPLC, suitable for the analysis ofless volatile and/or thermally labile compounds (Wu et al., 2002).The technique uses a coated open tubular capillary as the SPMEdevice, and the extraction process can be automated. Due to thehigh extraction efficiency of the polypyrrole-capillary coatingtoward polar compounds, benzene compounds and anionicspecies, and to the high sensitive mass detection, LODs rangingbetween 0.01 and 1.2 ng/mL were calculated. Recoveries ofanalytes were observed to be affected by the sample ethanolcontent. For ESI-MS a capillary voltage of 4,500 V in positivemode was applied, with a cone voltage depending on the ionsselected (see Table 6). By operating in SIM mode the methodresulted suitable for analysis of carbamate and phenylureapesticides in the same run.
III. MASS SPECTROMETRY IN THE ETHYLCARBAMATE ANALYSIS
The toxicological testing conducted in laboratory on severalanimal species indicated that ethyl carbamate (EC) is a potentialhuman mutagen and carcinogen (IARC Working Group on theEvaluation of Carcinogenic Risks to Human, 1988). A Canadianstudy carried out in 1985, revealed the presence of high levels ofEC (up to several hundred mg/L) in some alcoholic beverages,especially dessert wines and spirits (Conacher et al., 1987).During fermentation, with the rapid yeast growth, arginine ismetabolized to form urea, which is by reaction with ethanol, theEC precursor (Ough, Crowell, & Mooney, 1988; Monteiro,Trousdale, & Bisson, 1989; Ough et al., 1990). Moreover, thearginine metabolism of the wine lactic bacteria inducesformation of the EC precursor citrulline (Tegmo-Larsson,Spittler, & Rodriguez, 1989; Liu & Pilone, 1998). Considerableefforts have been devoted to develop accurate methods for thequantification of EC and to clarify the origin of compound(Ferreira & Fernandes, 1992). The U.S. wine industry establisheda voluntary target for EC (15 mg/L or less in table wines; 60 mg/Lor less in fortified wines) the U.S. Food and Drug Administrationpublished recommendations to minimize EC in wine (Butzke &Bisson, 1997). For detection of EC, a SPE method with elution bymethylene chloride and GC/MS-SIM mode analysis has beenadopted by the AOAC International (Association of OfficialAnalytical Chemists) for alcoholic beverages (AOAC, 1995).Another GC/MS method for the wine EC analysis by the use of
FIGURE 7. Fragmentation spectra (EI) by stir-bar-sorptive-extraction
and thermal-desorption-GC/MS analysis (SBSE-TD-GC/MS) of dicar-
boximide fungicides vinclozolin, iprodione, and procymidone (struc-
tures 43, 41, 37 in Fig. 4, respectively) and of the iprodione degradation
product (3,5-dichlorophenyl)hydantoin. (Reprinted from Journal of
Chromatography A, 928, Sandra et al., Stir bar sorptive extraction
applied to the determination of dicarboximide fungicides in wine. p. 121,
Copyright 2001, with permission from Elsevier).
& FLAMINI AND PANIGHEL
752 Mass Spectrometry Reviews DOI 10.1002/mas

SPE styrene/DVB sorbent, was proposed (Jagerdeo et al., 2002).Recovery of analyte from the cartridge was performed by ethylacetate, LOD 0.1 mg/L was reported using 13C15N-labeled EC asinternal standard.
Conacher et al. (1987) developed a GC/MS method suitablefor determination of EC in several different alcoholic beverages.
The ethanol content was adjusted at 10%, then samples weresaturated with NaCl before to perform methylene chlorideliquid–liquid extraction. Before analysis extracts were concen-trated and dissolved in ethyl acetate. The LOD of method was0.5 mg/kg.
In the earlier 90s, the presence of EC, n-propyl carbamate,and urea, was investigated in a number of fortified wines (Daudtet al., 1992). After the sample preparation by liquid extractionwith dichloromethane, GC/MS analyses were performed usingcyclopentyl carbamate as internal standard and by recording inSIM mode the signal of fragment at m/z 62 for ethyl carbamate, n-propyl carbamate, and cyclopentyl carbamate. An effect of theyeast strain and of arginine level on the urea concentration in thewine was observed. A slight effect on initiating skin cancer inmice of n-propryl carbamate with respect to EC was demon-strated (Pound, 1967), and a study on relative rates of carbamates
FIGURE 8. Mass spectra by stir-bar-sorptive-extraction and liquid-desorption-LC/MS negative mode
analysis (SBSE-LD-LC/APCI-MS) of procymidone (1), iprodione (2), and vinclozolin (3) (structures 37,
41, 43 in Fig. 4, respectively). (Reprinted from Journal of Chromatography A, 928, Sandra et al., Stir-bar-
sorptive-extraction applied to the determination of dicarboximide fungicides in wine. p. 125, Copyright
2001, with permission from Elsevier).
FIGURE 9. Contaminants used for production of biocides and as
polymer stabilizers found in some wines: monobutyltin (46), dibutyltin
(47), and tributyltin (48). X¼Cl; OH; EHMA (2-ethylhexylmercapto-
acetate); 2-MET (2-mercaptoethyltallate).
GRAPE AND WINE CHEMISTRY &
Mass Spectrometry Reviews DOI 10.1002/mas 753
formation by reaction of ethyl and n-propyl alcohols withurea (in model wine solutions) was performed. From the studyresulted that ethanol reacts about 1.34 times as fast as thanpropanol.
In another paper of the same year, a GC/MS study on the ECpresence in Madeira wines was reported (Ferreira & Fernandes,1992). Evolution of EC in the vinification process was followed,an increase of the compound with fermentation was observed.Analyses were performed on 10 mL of wine by using n-butylcarbamate as primary internal standard, and methyl tetradecano-ate as secondary internal standard. Ions at m/z 44, 62, and 74 wereacquired, quantitative detection of ethyl and butyl carbamateswere performed on the m/z 62 ion.
Fauhl and Wittkowski (1992) proposed a method fordetermination of EC in wine by continuous extraction withdiethyl ether, and GC/MS-SIM chemical ionization analysis withmethane as reagent gas. Authors reported as advantage of diethylether extraction the chlorinated solvents replacement, and notsignificant formation of EC during extraction as a result ofthermal treatment. Two characteristic fragments at m/z 62 and 90(the latter corresponding to [MþH]þ ion of EC) with 1:1 ratiowere used for identification. Propyl carbamate was added to thesample as internal standard to perform quantitative analysis(characteristic fragments at m/z 62, and 104 of [MþH]þ ion), themethod had LOD 1 mg/L.
Recently a headspace SPME/GC/MS method for ECdetection in wine has been proposed (Whiton & Zoecklein,2002). In the study different fiber were tested with different timesand temperatures of exposition. The method was developed bysampling a 7 mL of wine sample with propyl carbamate asinternal standard. Sampling conditions were optimized by using a65 mm PEG/DVB fiber exposed to the sample headspace for30 min at 228C. The analyte was released into GC injection port at2508C by direct exposure of fiber, signals at m/z 44, 62, and 74were recorded in SIM mode (the signal at m/z 62 was used forquantitation, the others for confirmation). For the method a LODof 9.6 mg/L was reported.
IV. MASS SPECTROMETRY AND WINE DEFECTS:COMPOUNDS FROM YEASTS AND BACTERIA
Among the large number of compounds formed by bacteriametabolism and by the yeast during alcoholic fermentation,carbonyl compounds play an important role in determiningchemical composition of wine. Because their very low sensorythresholds, many of these compounds give an important contri-bute to the organoleptic characteristics of product. Moreover,
FIGURE 10. Structures of triazole residues (fungicides employed in
viticulture) detected in wine: propiconazole (49), penconazole (50),
triadimefon (51).
FIGURE 11. GC/MS-EI mass spectra of triazoles: source temperature
2008C; electron energy: 70 eV; filament current 200mA; mass range from
m/z 50–450; scan time 0.9 s; inter-scan time 0.1 s. (Reprinted from
Journal of Chromatography A, 967, Zambonin et al., Solid–phase
microextraction and gas chromatography-mass spectrometry for the
rapid screening of triazole residues in wines and strawberries. p. 258,
Copyright 2002, with permission from Elsevier).
& FLAMINI AND PANIGHEL
754 Mass Spectrometry Reviews DOI 10.1002/mas

aldehydes such as formaldehyde, acetaldehyde, acrolein, andbenzaldehyde are reputed to be carcinogens (Nascimento et al.,1997).
To determine carbonyl compounds at the low level that arenormally present in the wine, GC/MS methods are usuallyemployed. Among them, the more selective and sensitive methodis by analysis of their O-pentafluorobenzyl oximes (O-PFB-oximes) formed by derivatization with pentafluorobenzylhy-droxylamine (PFBOA) (scheme reported in Fig. 14).
By this approach, glyoxal and methylglyoxal (pyruvicaldehyde) in wine were studied (de Revel & Bertrand, 1993).Methylglyoxal is produced by the metabolism of variousmicroorganisms, such as yeasts Saccharomyces cerevisiae(Murata et al., 1985), and a bacterium lactobacillus strain(Baskaran, Prasanna Rajan, & Balasubramanian, 1989). Thiscompound is reputed to be cytotoxic and to interfere with celldivision in procaryotes and eucaryotes (Murata et al., 1986); as aconsequence the methylglyoxal reduction would be advanta-geous to the organisms because of the less toxic activity ofproducts (Inoue et al., 1988). Analysis of O-PFB-oximes was
performed by recording the signal at m/z 181 (the base peak inmass spectra of PFB-derivatives), in SIM mode. Differentiationbetween the saturated and the unsaturated aldehyde derivativeswas achieved by recording signals at m/z 239 and at m/z 250,respectively. Authors observed that succession of microorgan-isms, such as Leuconostoc œnos in malolactic fermentation, mayincrease concentration of glyoxal and methylglyoxal in wine (deRevel & Bertrand, 1993).
The same year, Vidal et al. identified several methylketonesin Cognac by GC/MS analysis of their O-PFB-oximes (Vidal,Estreguil, & Cantagrel, 1993). Usually, derivatization withPFBOA is performed directly in the aqueous samples, but inthese conditions the ketones derivatization requires longer times.To overcome the problem, a preliminary pentane/ethyl etherextraction of analytes was performed, derivatization of extractswas carried out at 658C for 30 min. Because the two geometricalsyn and anti oximes for each aldehyde form, to simplify thechromatogram the selective reduction of C=N oxime doublebond by pyridine:borane mixture was performed. MS analysis(SIM mode) showed a better selectivity with respect to GC/
FIGURE 12. Carbamates determined at regulatory relevance by LC atmospheric-pressure-chemical-
ionization (APCI) or electrospray (ES) positive-ion mode (methods proposed by Fernandez, Pico, & Manes,
2000). 52, carbaryl; 53, carbofuran; 54, ethiofencarb; 55, methiocarb; 56, fenobucarb; 57, isoprocarb; 58,
fenoxycarb; 59, diethofencarb; 60, metholcarb; 61, propoxur; 62, pirimicarb; 63, oxamyl; 64, thiobencarb.
GRAPE AND WINE CHEMISTRY &
Mass Spectrometry Reviews DOI 10.1002/mas 755

ECD and close sensitivity. The lowering of electron energy to35 eV increased sensitivity by lowering LODs of a factor 2.Methylketones determined in Cognac were 2-heptanone,2-nonanone, 2-undecanone, 2-tridecanone (formed by oxidationof volatile fatty acids), with levels sufficient to contribute in theformation of typical flavor of aged Cognac. Authors observedthat concentration of methylketones depended on the spirit ageand on aging conditions (peroxydase concentration, volume ofbarrels).
The presence in wine of others a-dicarbonyl compoundssuch as 3-hydroxy-2-oxopropanal (a reductone also namedhydroxypropanedial), 2,3-butanedione (diacetyl), and 2,3-pen-tanedione, was reported. ‘‘Sauternes’’ wines—sweet white tablewines produced from grapes infected by desirable Botrytis (noblerot)—was revealed to be rich in hydroxypropanedial. If Botrytis
cinerea attack is severe concentration of this compound in winemay reach to 1 g/L, and it can be used as a marker for estimationof the grape sanitary condition. Moreover, hydroxypropanedialand other carbonyl compounds present at high levels inbotrytized wines are important because they play an importantrole in the sulfur dioxide combination in winemaking (de Revel& Bertrand, 1994). It was also reported that reductones in winepreserve organoleptic qualities, fix aromas, and inhibit bacterialdevelopment (Shimohara et al., 1981; Yamanaka & Tsunoda,1994, 1995). By reaction with amino acids they form browningcompounds such as glyoxal, methylglyoxal, and diacetyl(Yamagushi, 1969; Shimohara et al., 1974; Velisek & Davidek,1978).
Guillou et al. (1997) studied the presence of hydroxypro-panedial in musts and wines. By GC/MS analysis a-dicarbonyl
TABLE 5. The principal species and fragment ions and their relative abundances (R%), recorded by performing positive- and negative-
APCI analysis, and by positive ESI analysis
Compound MW
Positive mode Negative mode Positive modem/z and tentative ions R% m/z and tentative ions R% m/z and tentative ions R%
Carbaryl 201 202 [M+H] + 100 143 [M-H-CH3NCO] - 100 202 [M+H] + 95
234 [M+H+CH3OH] + 13 145 [M+H-CH3NCO] + 100
224 [M+Na] + 75
Carbofuran 221 222 [M+H] + 100 163 [M-H-CH3NCO] - 100 222 [M+H] + 100
244 [M+Na] + 20
Diethofencarb 267 268 [M+H] + 100 266 [M-H] - 100 268 [M+H] + 100
182 [M+H-(CH3)2CH2NCO] + 22 290 [M+Na] + 20
Ethiofencarb 225 226 [M+H] + 100 167 [M-H-CH3NCO] - 100 226 [M+H] + 100
248 [M+Na] + 62
107 [M-CH3CH2S-CH3NCO] + 50
164 [M-CH3CH2S] + 50
Fenobucarb 207 208 [M+H] + 100 149 [M-H-CH3NCO] - 100 208 [M+H] + 100
226 [M+NH4]+ 25
Fenoxycarb 301 302 [M+H] + 100 185 [M-H-(CH2)3CH3NCO2]- 100 302 [M+H] + 100
230 [M+H-(CH3)2NCO] + 28 324 [M+Na] + 41
Isoprocarb 193 194 [M+H] + 100 135 [M-H-CH3NCO] - 100 194 [M+H] + 100
216 [M+Na] + 15
Methiocarb 225 226 [M+H] + 100 167 [M-H-CH3NCO] - 100 226 [M+H] + 100
152 [M-H-CH3NCO-CH3]- 60 248 [M+Na] + 22
Metholcarb 165 166 [M+H] + 100 107 [M-H-CH3NCO] - 100 166 [M+H] + 100
188 [M+Na] + 19
Oxamyl 219 163 [M+H-CH3NCO] + 100 161 [M-H-CH3NCO] - 100 242 [M+Na] + 100
147 [M-(CH3)NCO] - 40 258 [M+K] + 40
237 [M+NH4]+ 27
251 [M+CH3OH] + 17
Pirimicarb 238 239 [M+H] + 100 239 [M+H] + 100
261 [M+Na] + 29
Propoxur 209 210 [M+H] + 100 151 [M-H-CH3NCO] - 100 210 [M+H] + 100
168 [M+H-CH3CH=CH2]+ 33
153 [M+H-CH3NCO] + 20
Thiobencarb 257 258 [M+H] + 100 132 [M-CH2C6H4Cl] - 100 258 [M+H] + 100
APCI ES
Fragmentor voltages 20 V positive mode, 40 V negative mode. (Reprinted from Journal of Chromatography A, 871, Fernandez et al.,
Determination of carbamate residues in fruits and vegetables by matrix solid-phase dispersion and liquid chromatography-mass spectrometry. p. 47,
Copyright 2000, with permission from Elsevier).
& FLAMINI AND PANIGHEL
756 Mass Spectrometry Reviews DOI 10.1002/mas
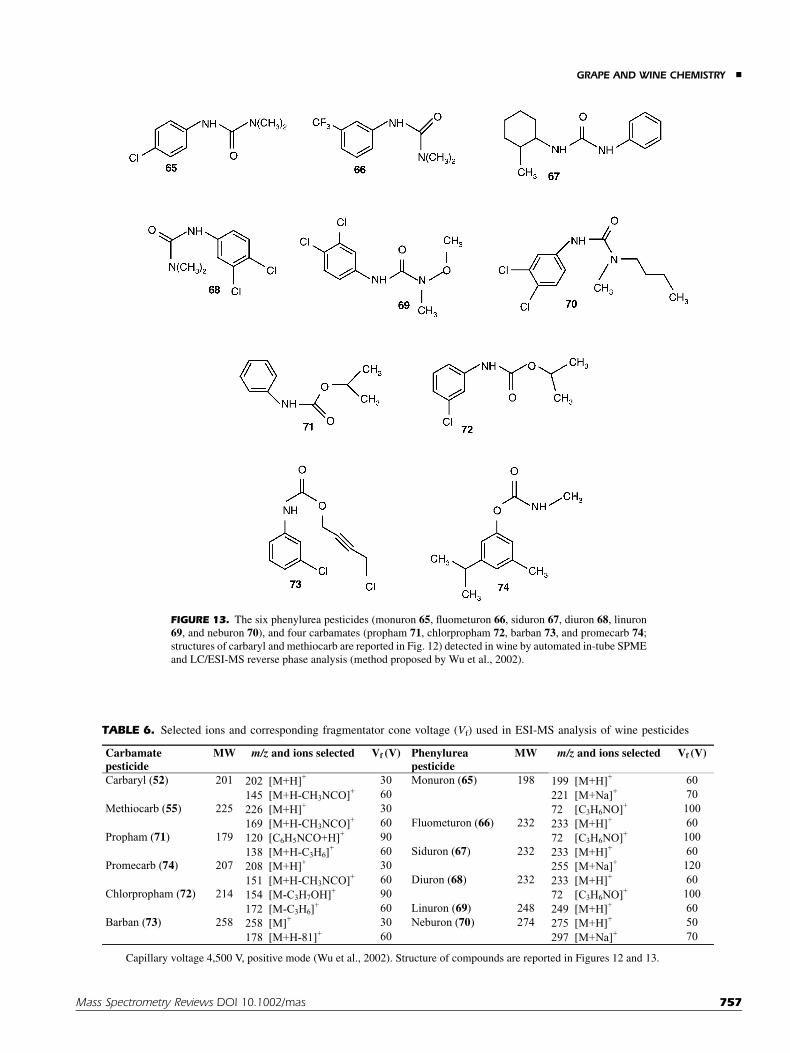
FIGURE 13. The six phenylurea pesticides (monuron 65, fluometuron 66, siduron 67, diuron 68, linuron
69, and neburon 70), and four carbamates (propham 71, chlorpropham 72, barban 73, and promecarb 74;
structures of carbaryl and methiocarb are reported in Fig. 12) detected in wine by automated in-tube SPME
and LC/ESI-MS reverse phase analysis (method proposed by Wu et al., 2002).
TABLE 6. Selected ions and corresponding fragmentator cone voltage (Vf) used in ESI-MS analysis of wine pesticides
Carbamatepesticide
MW m/z and ions selected Vf (V) Phenylurea pesticide
MW m/z and ions selected Vf (V)
Carbaryl (52) 201 202 [M+H]+ 30 Monuron (65) 198 199 [M+H]+ 60145 [M+H-CH3NCO]+ 60 221 [M+Na]+ 70
Methiocarb (55) 225 226 [M+H]+ 30 72 [C3H6NO]+ 100 169 [M+H-CH3NCO]+ 60 Fluometuron (66) 232 233 [M+H]+ 60
Propham (71) 179 120 [C6H5NCO+H]+ 90 72 [C3H6NO]+ 100 138 [M+H-C3H6]+ 60 Siduron (67) 232 233 [M+H]+ 60
Promecarb (74) 207 208 [M+H]+ 30 255 [M+Na]+ 120 151 [M+H-CH3NCO]+ 60 Diuron (68) 232 233 [M+H]+ 60
Chlorpropham (72) 214 154 [M-C3H7OH]+ 90 72 [C3H6NO]+ 100 172 [M-C3H6]+ 60 Linuron (69) 248 249 [M+H]+ 60
Barban (73) 258 258 [M]+ 30 Neburon (70) 274 275 [M+H]+ 50178 [M+H-81]+ 60 297 [M+Na]+ 70
Capillary voltage 4,500 V, positive mode (Wu et al., 2002). Structure of compounds are reported in Figures 12 and 13.
GRAPE AND WINE CHEMISTRY &
Mass Spectrometry Reviews DOI 10.1002/mas 757

compounds were detected as quinoxaline derivatives formed byreaction with 1,2-diaminobenzene (mass spectrum of 3-hydroxy-2-oxopropanal quinoxaline is reported in Fig. 15).
By analysis of O-PFB-oximes, changes of carbonylcompounds occurring with malolactic fermentation (MLF) ofwines were studied (Flamini, De Luca, & Di Stefano, 2002). GC/MS analysis was performed by poly(ethylene glycol) (PEG)column recording the signals at m/z 181, m/z 239, and m/z 250,using o-chlorobenzaldehyde as internal standard. Chromato-grams corresponding to the three signals are reported inFigure 16. Compounds corresponding to peak number arereported in Table 7.
Before derivatization, pyruvic acid in the wine was removedby passage through an ion exchange column. It was necessarybecause the large amount of the compound in wine reacts withPFBOA and forms derivatives, which leave from the column as abroad peak, covering a large range of chromatogram. The studyevidenced marked changes in carbonyl compounds occurringwith MLF, in particular with regard to diacetyl, acetoin andaliphatic saturated aldehydes, and glyoxal and methylglyoxalincreases were observed. A relevant presence of unsaturatedaldehydes in wine was also found. The dramatic increase of apeak observed on chromatograms revealed a relevant presence ofglycolaldehyde in wine. Because the higher were the glyoxalcontents, the higher those of glycolaldehyde, a reduction system
involving the two compounds was supposed. To study correlationbetween two compounds, and to verify the presence ofglycolaldehyde as promoted by malolactic bacteria, a study onsterilized synthetic solutions added of glyoxal and inoculatedwith a Oenococcus oeni lactic bacterium was performed (Flamini& Dalla Vedova, 2003). PBF-oximes of two compounds weredetected by GC/MS analysis in SIM mode recording signals atm/z 181, m/z 225 (Mþ species of glycolaldehyde), m/z 300 (Mþ
species of o-chlorobenzaldehyde), and m/z 448 (Mþ species ofglyoxal). Concentration of glycolaldehyde turned out to beassociated with the amounts of glyoxal present, and glyoxal wasobserved to decrease as glycolaldehyde increased. The reductionof glyoxal to glycolaldehyde was promoted by the bacterialactivity. A high glycolaldehyde ability to induce browning of(þ)-catechin in a model wine system was revealed (about10 times higher than that of ascorbic acid) inferring a possiblerole of the compound in the color stability of white wines.
Acetaldehyde is the most abundant carbonyl compound inwine and distillates. At high concentrations, the compoundconfers a strong, pungent note to the beverage (Di Stefano &Ciolfi, 1982). In the presence of alcohols, acetaldehyde reactswith the amino groups in nucleosides to yield compoundssuspected to increase the risk of breast cancer in women(Nascimento et al., 1997). Quantification of acetaldehyde is alsoimportant for monitoring alcoholic fermentation and to define the
FIGURE 14. Synthesis of pentafluorobenzyl derivatives (O-PFB-oximes) by reaction of carbonyl
compounds with pentafluorobenzylhydroxylamine (PFBOA).
FIGURE 15. Mass spectrum of quinoxaline derivative of 3-hydroxy-2-oxopropanal in wine formed by
reaction with 1,2-diaminobenzene (R1=H; R2=CH2OH). (Reprinted from Journal of Agricultural and Food
Chemistry 45, Guillou et al., Occurrence of hydroxypropanedial in certain musts and wines. p. 3383, 3385,
Copyright 1997, with permission from American Chemical Society).
& FLAMINI AND PANIGHEL
758 Mass Spectrometry Reviews DOI 10.1002/mas

enological treatments to the product. Addition of SO2 to the wine,made to preserve the product from oxidation and bacterialattacks, is affected by the level of acetaldehyde. Carbonylcompounds, by combining with SO2 and forming bisulfiteadducts, subtract the antioxidant to the wine (Di Stefano & Ciolfi,1982). Moreover, acetaldehyde present in excess may undergoesoxidation with consequent acetic acid and ethyl acetate levelsincreasing, and acetic sourness of wine.
GC determination of acetaldehyde is usually performed bydirect injection of sample by using packed column, or by analysisof 2-methylthiazolidin formed by reaction with cysteamine.These methods usually employ nitrogen phosphorus (NPD) orflame ionization detectors (FID) (EC Regulation no. 2870/2000,2000; Miyake & Shibamato, 1993). Recently, a specific GC/MS-EI method to determine acetaldehyde in wine and hydro-alcoholmatrixes by synthesis of O-PFB-derivatives has been proposed(Flamini, Tonus, & Dalla Vedova, 2002). Advantage of method isthat GC analysis is performed by using common PEG column;the compound is quantified on the basis of the sum of twoacetaldehyde O-PFB-oximes signals using 1-octanol as internalstandard. The method showed satisfying linearity and fairly goodreproducibility, with limited costs and times for samplepreparation. Absence of relevant interferences of wine matrixin the derivatization was verified by comparing results extra-polated from the calibration curve calculated by addition ofstandard acetaldehyde to the sample, with those obtained fromthe calibration curve calculated with standard solutions.
Diacetyl is regarded as adding complexity to wine flavor, butif present in quite high concentration (higher than 5 mg/L) it canbe overpowering and to confer a distinct butter-like undesirablenote to the wine. Levels of acetoin and diacetyl, produced byyeasts with alcoholic fermentation, are generally furtherincreased after MLF (Davis et al., 1985). Reduction of diacetylto acetoin (and 2,3-butanediol) is reported to be an advantageousprocess for the yeasts because it forms less toxic products.Moreover, this process increases the levels of the coenzymesNADþ and NADPþ (de Revel & Bertrand, 1994).
Hayasaka & Bartowsky (1999) developed a SPME/GC/MSmethod to determine diacetyl in wine, by using deuterateddiacetyl-d6 as internal standard. Diacetyl was quantified as sumof the both free and sulfur dioxide bounded forms. After NaCladdition to the wine the SPME fiber (coated with 65 mm PEG/DVB) was exposed to the 3 mL sample headspace at 408C.Molecular ions of diacetyl (m/z 86) and of diacetyl-d6 (m/z 92)were scanned in SIM mode, and diacetyl was quantified on theratio of the ion response of analyte relative to that of the internalstandard. The use of a deuterated form of diacetyl as internalstandard ensured the robustness of the method in that thequantitative result would not be affected by changes in theparameters of the headspace SPME conditions. The methodshowed excellent precision and accuracy, to be suitable foranalysis of both white and red wines, linearity concentrationrange 0.01–10.0 mg/mL, and LOD of 0.01 mg/mL. Authorssuggested that the sensitivity could be significantly improved byperforming chemical ionization.
Benzothiazoles form part of molecular structure of a largenumber of natural products, such as biocides, drugs, flavors.These molecules are used in several industrial products andprocesses: 2-mercaptobenzothiazole is a rubber additive chemi-
cal (e.g., vulcanization accelerators), used as corrosion inhibitor,as fungicide and herbicide (Santodonato et al., 1976).
Furthermore, benzothiazole has been found in the volatilefraction of oak wood used for aging wines (Perez-Coello, Sanz, &Cabezudo, 1998). In high level the compound may confer a‘‘rubber’’ or ‘‘burned’’ negative odor to the wine. A SPME/GC/MS method has been developed to determine benzothiazole inwine using a PEG/DVB fiber (Bellavia et al., 2000). SPME wasperformed by exposing the fiber on the headspace of the NaClsample added at 508C for 15 min. Analytes were desorbed fromthe fiber at 2508C for 10 min, analysis performed by a 5% phenyl-methyl-siloxane column. The mass spectrum of benzothiazoleshows the molecular ion at m/z 135 as main peak, and a lessabundant signal at m/z 108 derived by the loss of HCN. SIM modeanalysis was focused on the signal at m/z 135 as target ion, and onthe signal at m/z 108 as qualifier ion. Quantitative analysis wasperformed by addition of different amounts of standardbenzothiazole to the wine. The method revealed LOD of 45 ng/L (S/N¼ 3), and a wide linearity range, with short analysis timeand low cost. Twelve commercial wines were analyzed by thismethod, and the presence of benzothiazole was revealed in allsamples in concentration between 0.24 and 1.09 mg/L. Authorsdiscarded hypothesis that benzothiazole could derive from oakwood in that the wines studied were not aged, and formation ofcompound during the fermentation was supposed.
Many biogenic amines are reported to be psychoactive andvasoactive. Some Authors suggested a relationship between thetwo diamines putrescine and cadaverine, and histamine respon-sible of numerous cases of food intoxication (Lovenberg, 1974;Taylor, 1986; Stratton, Hutkins, & Taylor, 1991). Besides, withcooking putrescine and cadaverine may be converted intopyrrolidine and piperidine, respectively (Yamamoto et al.,1982). These secondary amines, as well as spermidine andspermine, may undergo nitrosation forming the extremelycarcinogenic nitrosamine. The aromatic amines b-phenylethy-lamine, tyramine, isopentylamine, and 3-(2-aminoethyl)indole(tryptamine), are responsible for dietary disturbs, inclusivehypertension (Stratton, Hutkins, & Taylor, 1991; Andersonet al., 1993). In wine these compounds are present as odorlesssalts, but at the pH value of mouth they may develop repulsivesmells. Moreover, amines may be related to the unsanitary stateof wine. Structures of these amines are reported in Figure 17.
Analysis of biogenic amines is generally performed by LCwith a pre- or post-column derivatization (commonly with o-phthalaldehyde in presence of mercaptoethanol), and fluori-metric detection of derivatives.
Fernandes and Ferreira by performing derivatization withheptafluorobutyric anhydride (HFBA) and GC/MS analysisdeveloped a method for simultaneous determination of theprincipal diamines, polyamines, and aromatic amines in wine andgrape juices (Fernandes & Ferreira, 2000). The compoundsdetermined were 1,3-diaminopropane, putrescine, cadaverine,spermidine, spermine, b-phenylethylamine, and tyramine.Before derivatization, a sample clean-up was performed byanionic exchange SPE; GC/MS analysis was performed in SIMmode by recording one target ion signal, and at least twoqualifying ions, for each HFBA-derivative. Compounds deriva-tives were quantified on the m/z signal at 104 for b-phenylethylamine, 480 (putrescine), 494 (cadaverine), 316
GRAPE AND WINE CHEMISTRY &
Mass Spectrometry Reviews DOI 10.1002/mas 759

FIGURE 16.
& FLAMINI AND PANIGHEL
760 Mass Spectrometry Reviews DOI 10.1002/mas

(tyramine), 254 (spermine and spermidine). Amphetamine, d8-putrescine, 1,7-diaminoheptane, norspermidine, and norsper-mine were used as internal standards. The method showed highreproducibility with LOD less than 10 mg/L.
In the same year, Ngim et al. put to point a method fordetermination of biogenic primary alkylamines in wine byderivatization with pentafluorobenzaldeide (PFB) and GC/MS-SIM analysis (Ngim et al., 2000). To perform derivatization theoptimal experimental conditions were: pH 12, reaction time30 min at 248C, concentration of PFB 10 mg/mL. More than30 biogenic amines, produced by enzymatic degradation ordecarboxylation of aminoacids during fermentation, have beenidentified. Analyses were performed by recording signals at m/z
208 and 211, corresponding to a-cleavage products of undeut-erated PFB-imines and methyl-d3-PFB-imine, respectively, andm/z 213, the molecular ion of pentafluoronitrobenzene. Com-pared with conventional LC analyses, the method showed moreselectivity, and a greater sensibility and resolution. The study wasperformed on 12 California wines, alkylamines from methyla-mine to n-eptylamine with concentration ranging from 0.048 to91 mg/L were detected, and also 2-phenylethylamine, 1,4-diaminobutane, and 1,5-diaminopentane were identified in wine.
b-carboline (norharman) and 1-methyl-b-carboline (harman)are compounds with monoamine oxidase inhibition and benzo-diazepine receptor binding activities (McIsaac & Estevez, 1966;Rommelspacher et al., 1981). They have also co-mutagenic
TABLE 7. The compounds corresponding to peak numbers of GC/MS
chromatograms in Figure 16
On the right, identification mode and retention times of syn and anti wine carbonyl
compounds PFB-derivatives recorded by polyethylene glycol capillary column. RT,
retention time; m/z 181, 239, 250: chromatograms registered in SIM mode; MS/EI, mass
fragmentation spectra; lit., data reported in literature. (Reprinted from Vitis 41, Flamini
et al., Changes in carbonyl compounds in Chardonnay and Cabernet Sauvignon wines as
a consequence of malolactic fermentation. p. 109, Copyright 2002, with permission
from Vitis).
FIGURE 16. GC/MS chromatograms obtained by recording the signals at m/z 181, 239, and 250 in SIM
mode in the analysis of carbonyl compounds PFB-derivatives of Cabernet Sauvignon wine. The signal at m/z
181 is the base peak in the mass spectra of derivatives; differentiation between the saturated and the
unsaturated aldehyde is achieved on the signals at m/z 239 and m/z 250, respectively. Compounds
corresponding to peak number are reported in Table 7. (Reprinted from Vitis 41, Flamini et al., Changes in
carbonyl compounds in Chardonnay and Cabernet Sauvignon wines as a consequence of malolactic
fermentation. p. 110, Copyright 2002, with permission from Vitis).
GRAPE AND WINE CHEMISTRY &
Mass Spectrometry Reviews DOI 10.1002/mas 761

activity in that aniline and o-toluidine are mutagenic compoundswhen the two b-carbolines are present. Pancreatic or liver tumorsin habitual drinkers, may be caused from small quantity ofsubstances having activity mutagenic or carcinogenic. Inaddition, production of acetaldehyde as ethanol metabolite couldplay a role in forming b-carbolines endogenously in alcoholicpatients, promoting the cancer. Adachi et al. studied b-carbolinesin wine and alcoholic drinks by LC-fluorescence reverse phasechromatography, and used LC/MS for identification of com-pounds (Adachi et al., 1991). By performing thermospray (TSP)LC/MS in positive ion mode, [MþH]þ species were observed asthe base peak of mass spectra (see Fig. 18). Mean contents 0.5mg/L of norharman and 8.5 mg/L of harman were found in the winesstudied.
There are countries (e.g., Italy) where commercialization ofhybrid grapes and wines is prohibited. Several studies wereperformed on volatile compounds considered typical odors ofhybrid grape varieties. Rapp, Versini, & Ullemeyer (1993) byGC/MS identified o-aminoacetophenone as the cause of theuntypical aging note also called ‘naphthalene note’ or ‘hybridnote’ of V. vinifera wines Muller-Thurgau, Riesling, and Silvaner.In the article, the presence in V. vinifera cvs of the compoundknown as ‘foxy’ smelling component of Labruscana grapes wasreported for the first time.
Ciolfi, Garofolo, & Di Stefano (1995) by GC/MS analysis offermented synthetic media, observed that o-aminoacetophenoneis a secondary metabolite of Saccharomyces cerevisiae yeasts.The presence of o-aminopropiophenone and of 3-(o-aminophe-nyl)-prop-1-en-3-one in fermented synthetic media (the identi-fications were based on the EI-fragmentation mass spectra) wasalso revealed.
Ayear after, a study on the presence of methylanthranilate inwine by GC/MS was published (Rapp & Versini, 1996). Thiscompound contributes to the typical hybrid/foxy taint of winesfrom American hybrids and wild vines, but the study revealed it
was present also in white wines from V. vinifera withconcentrations higher than 0.3 mg/L.
Heavier containing sulphur compounds have a detrimentaleffect on the wine aroma. Odors attributed to them are garlic(associated with trans-2-methylthiophan-3-ol and 4-methylthio-butan-l-ol), onion (2-methyltetrahydrothiophenone), burnt, cab-bage (methionol), and cauliflower (2(methylthio)-ethanol).Other sulphur compounds with low boiling point (less than908C), often have strong off-flavors and very low organolepticthresholds (Rapp, Guntert, & Almy, 1985) (structures reported inFig. 19). It was observed that addition of 2,20-dithiobis-ethanolincreases the H2S concentration in wine, a substance with verystrong odor of rotten eggs and sensory threshold 1 mg/L. Thecompound is a precursor of the very unpleasant poultry-likearoma 2-mercaptoethanol. In a study of 1995, the presence ofbis(2-hydroxyethyl) disulfide in wine was reported. Thecompound was extracted by ethyl acetate and identified by GC/MS on the basis of the column retention time and EI massspectrum (Anocibar Beloqui, Guedes de Pinho, & Bertrand,1995). The EI mass spectrum of 2,20-dithiobis-ethanol is reportedin Figure 20. Analysis of several hundred wines revealed amaximum 2,20-dithiobis-ethanol content of 3.5 mg/L, withhigher abundances in wines from Vitis labrusca or hybridvarieties.
V. MASS SPECTROMETRY AND WINE DEFECTS:COMPOUNDS RELEASED FROM OAK WOODSAND CORKS
Oak woods are commonly used for making barrels used for wineaging. It may occur that some compounds released from the woodconfer defects to the wine. By GC/MS analysis of PFBOAderivatives, Chatonnet & Dubourdieu (1998) identified several
FIGURE 17. Structures of amines involved in the food intoxication: putrescine (75), cadaverine (76),
histamine (77), isopentylamine (78), spermidine (79), spermine (80), b-phenylethylamine (81), tyramine
(82), triptamine (83).
& FLAMINI AND PANIGHEL
762 Mass Spectrometry Reviews DOI 10.1002/mas

aldehydes as substances responsible of sawdust smell sometimesoccurring in the wine aged in new barriques (225 L oak woodbarrels). Among them (E)-2-nonenal, (E)-2-octenal, 3-octen-1-one, and 1-decanal, were identified. (E)-2-nonenal is reputed tobe the main responsible of smell sawdust in wine. Authorsobserved that (E)-2-nonenal, 3-octen-l-one, (E)-2-octenal, and l-decanal were correlated to the subtle rancid and the weedy odorof ‘sawdust’ detected by smelling the gas effluent from GC.
The toasting process of the wood used to make barrels forbrandy and wine aging, is responsible of production of a greatnumber of volatile and odoriferous compounds. Some of thesehave ‘‘toasty caramel’’ aroma. Cutzach et al. identified a series ofcompounds related to the toasted aroma by performing GC/MSanalysis of wood extracts (Cutzach et al., 1997). In addition to
already knew substances released from tosted wood (2-hydroxy-3-methyl-2-cyclopenten-1-one or cyclotene, 3-hydroxy-2-methyl-4H-pyran-4-one or maltol), 2,3-dihydro-3,5-dihydroxy-6-methyl-4H-pyran-4-one (DDMP), 4-hydroxy-2,5-dimethyl-3(2H)furan-3-one (furaneol), 3,5-dihydroxy-2-methyl-4H-pyran-4-one, and2,3-dihydro-5-hydroxy-6-methyl-4H-pyran-4-one (dihydromal-tol) were identified on the EI fragmentation spectra (structuresare reported in Fig. 21). These molecules formed by heating inthe presence of proline, inferring that Maillard reactions areresponsible of their presence in the heated oak wood. Also furanand pyran compounds, such as furfural, 5-(acetoxymethyl)fur-fural, and 2,5-dimethyl-4-hydroxyfuran-3(H)-one have beenfound to be released by wood in the wine.
For the physical properties of cork as an excellent seal forliquids, cork stoppers are the principal closure for bottled wines,but tainted corks may cause off-flavor or ‘‘corkiness’’ in wine(Vasserot, Pitois, & Jeandet, 2001). The compound 2,4,6-trichloroanisole (TCA), with a ppt odor threshold, has beenidentified as the major cause of corkiness in wine. Corks may becontaminated by chloroanisoles during transport from packagingand shipping containers (Lee & Simpson, 1993), by micro-biological methylation of chlorophenols during the corksbleaching with hypochlorite (Burttshel et al., 1951), chloroani-soles may be present as residues of pesticides and insecticidesused in the cork forest (Lee & Simpson, 1993). TCA can be alsoformed during microbial contamination of raisins (Aung et al.,1996). Relationships between trichlorophenol and TCA areillustrated in Figure 22. A global dollar loss range up to US$10 billion was estimated for bottled Champagne wines affectedby cork taint (Fuller, 1995).
GC/MS studies on 2,4-dicloroanisole, TCA, 2,3,4,6-tetra-chloroanisole, pentachloroanisole, 2,4,6-trichlorophenol, 2,3,4,6-tetrachlorophenol, pentachlorophenol (PCP) and guaiacol inwines and cork stoppers, revealed a significant correlationbetween TCA in wines and its presence in cork stoppers, as wellas between the TCA level in wine and intensity of cork taint(Pena-Neira et al., 2000). Irradiation of TCA causes theformation of 2-chloroanisole, 4-chloroanisole, 2,4-dichloroani-sole, and 2,6-dichloroanisole (Careri et al., 2001). The GC/MS-EI fragmentation spectrum of TCA is reported in Figure 23.
Aung et al. (1996) studied the origin of chloroanisolescausing musty off-flavor of raisins. The chloroanisoles of raisinsamples were steam-solvent extracted using a mixture of pentaneand diethyl ether, extracts were concentrated and analyzed byGC/MS. Authors observed that TCA forms from raisins sterilizedwith propylene oxide or with hydrogen peroxide.
Ayear after, an SPME-GC/MS method to determine TCA inwine was developed (Evans, Butzke, & Ebeler, 1997). Byperforming headspace SPME with a PDMS 100 mm SPME fiber,quantitative recovery of analyte was obtained. Deuterated d5-TCA was used as internal standard. By performing SIM modeanalysis a method LOD 5 ng/L was achieved, with accuracy�8%, and precision (RSD) between 5% and 13%. TCA anddeuterated TCA were recognized by characteristic double peaksin the TIC (Fig. 24). Inspection of the extracted ions (Fig. 24,right) reveals two distinct peaks: the signal at m/z 195 relative tothe TCA [M-15]þ fragment ion (which does not occur in thedeuterated compound); the signal at m/z 215 relative to thedeuterated TCA Mþ species (not observed for TCA). Authors
FIGURE 18. Thermospray LC/MS positive ion mode mass spectra of
b-carboline (norharman, A) and 1-methyl-b-carboline (harman, B).
(Reprinted from Journal of Chromatography, 538, Adachi et al.,
Determination of b-carbolines in foodstuffs by high-performance liquid
chromatography and high-performance liquid chromatography-mass
spectrometry. p. 335, Copyright 1991, with permission from Elsevier).
FIGURE 19. Volatile sulphur compounds with strong off-flavors and
very low organoleptic thresholds that may effect the wine aroma: trans-
2-methylthiophan-3-ol (84), 4-(methylthio)-1-butanol (85), 2-methylte-
trahydrothiophen-3-one (86), 3-(methylthio)-1-propanol (methionol)
(87), 2-(methylthio)ethanol (88).
GRAPE AND WINE CHEMISTRY &
Mass Spectrometry Reviews DOI 10.1002/mas 763
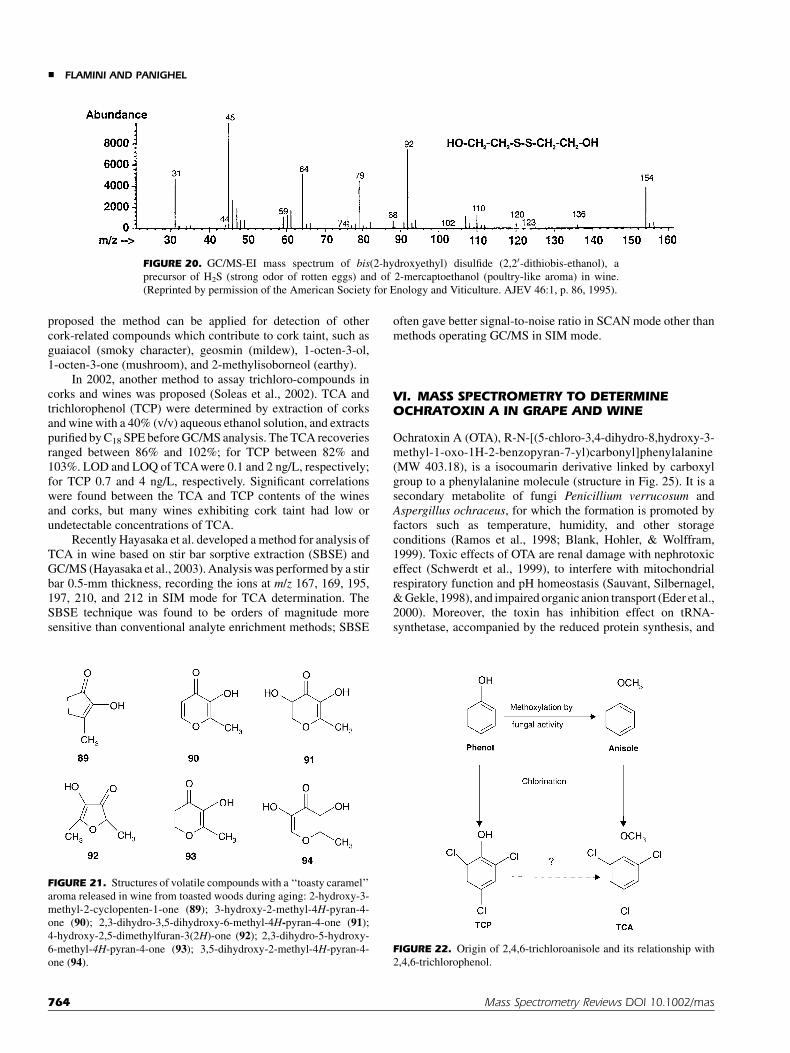
proposed the method can be applied for detection of othercork-related compounds which contribute to cork taint, such asguaiacol (smoky character), geosmin (mildew), 1-octen-3-ol,1-octen-3-one (mushroom), and 2-methylisoborneol (earthy).
In 2002, another method to assay trichloro-compounds incorks and wines was proposed (Soleas et al., 2002). TCA andtrichlorophenol (TCP) were determined by extraction of corksand wine with a 40% (v/v) aqueous ethanol solution, and extractspurified by C18 SPE before GC/MS analysis. The TCA recoveriesranged between 86% and 102%; for TCP between 82% and103%. LOD and LOQ of TCAwere 0.1 and 2 ng/L, respectively;for TCP 0.7 and 4 ng/L, respectively. Significant correlationswere found between the TCA and TCP contents of the winesand corks, but many wines exhibiting cork taint had low orundetectable concentrations of TCA.
Recently Hayasaka et al. developed a method for analysis ofTCA in wine based on stir bar sorptive extraction (SBSE) andGC/MS (Hayasaka et al., 2003). Analysis was performed by a stirbar 0.5-mm thickness, recording the ions at m/z 167, 169, 195,197, 210, and 212 in SIM mode for TCA determination. TheSBSE technique was found to be orders of magnitude moresensitive than conventional analyte enrichment methods; SBSE
often gave better signal-to-noise ratio in SCAN mode other thanmethods operating GC/MS in SIM mode.
VI. MASS SPECTROMETRY TO DETERMINEOCHRATOXIN A IN GRAPE AND WINE
Ochratoxin A (OTA), R-N-[(5-chloro-3,4-dihydro-8,hydroxy-3-methyl-1-oxo-1H-2-benzopyran-7-yl)carbonyl]phenylalanine(MW 403.18), is a isocoumarin derivative linked by carboxylgroup to a phenylalanine molecule (structure in Fig. 25). It is asecondary metabolite of fungi Penicillium verrucosum andAspergillus ochraceus, for which the formation is promoted byfactors such as temperature, humidity, and other storageconditions (Ramos et al., 1998; Blank, Hohler, & Wolffram,1999). Toxic effects of OTA are renal damage with nephrotoxiceffect (Schwerdt et al., 1999), to interfere with mitochondrialrespiratory function and pH homeostasis (Sauvant, Silbernagel,& Gekle, 1998), and impaired organic anion transport (Eder et al.,2000). Moreover, the toxin has inhibition effect on tRNA-synthetase, accompanied by the reduced protein synthesis, and
FIGURE 20. GC/MS-EI mass spectrum of bis(2-hydroxyethyl) disulfide (2,20-dithiobis-ethanol), a
precursor of H2S (strong odor of rotten eggs) and of 2-mercaptoethanol (poultry-like aroma) in wine.
(Reprinted by permission of the American Society for Enology and Viticulture. AJEV 46:1, p. 86, 1995).
FIGURE 21. Structures of volatile compounds with a ‘‘toasty caramel’’
aroma released in wine from toasted woods during aging: 2-hydroxy-3-
methyl-2-cyclopenten-1-one (89); 3-hydroxy-2-methyl-4H-pyran-4-
one (90); 2,3-dihydro-3,5-dihydroxy-6-methyl-4H-pyran-4-one (91);
4-hydroxy-2,5-dimethylfuran-3(2H)-one (92); 2,3-dihydro-5-hydroxy-
6-methyl-4H-pyran-4-one (93); 3,5-dihydroxy-2-methyl-4H-pyran-4-
one (94).
FIGURE 22. Origin of 2,4,6-trichloroanisole and its relationship with
2,4,6-trichlorophenol.
& FLAMINI AND PANIGHEL
764 Mass Spectrometry Reviews DOI 10.1002/mas

enhanced lipid peroxidation via the generation of free radicals(Hohler, 1998). OTA can also induce the formation of renaltumors with cytochrome P450-related reactions and DNA adductgeneration as potential contributing mechanisms (Castegnaroet al., 1998; Pfohl-Leszkowicz et al., 1998). The fungi develop ongrape, in particular in the harvest, in advantageous conditions ofhigh humidity and temperature; the toxin is then transferred to thewine in winemaking. OTA is commonly detected in wine by LC,performing SPE sample preparation by using immunoaffinitycolumn (IAC) (Burdaspal & Legarda, 1999; Visconti, Pascale, &Centonze, 1999; Castellari et al., 2000). As alternative methods,capillary electrophoresis with laser induced fluorescence detec-tion and electrospray tandem mass spectrometry methods havebeen developed. Also a stable isotope dilution assay (SIDA) andLC/APCI-MS positive mode method was developed forquantification of OTA in foods by using d5-OTA as internalstandard (Lindenmeier, Schieberle, & Rychlik, 2004).
In 1999, a method to determine OTA in dried vine fruit(currants, raisins, and sultanas) and confirmation by LC/MS wasproposed (MacDonald et al., 1999). Analyses were performed byacidic methanolic extraction of samples and clean-up of extractsby IAC. The quantitative detection of toxin was achieved byperforming reverse-phase LC-fluorescence analysis. A LOD ofmethod of 0.2 mg/kg was reported, with recoveries rangingbetween 63% and 77%. But fluorescence detection is not absolutefor OTA identification, and toxin presence is usually confirmedby synthesis of methyl ester, or by OTA enzymatic cleavage toyield ochratoxin a (7-carboxy-5-chloro-3,4-dihydro-8-hydroxy-3-methylisocoumarin) (Filali et al., 2001). In this study, toachieve the LC/MS confirmation an electrospray instrumentoperating in positive ionization nebulizer mode, with capillaryvoltage 2.6 kV and cone voltage 10 V, was used. Speciesmonitored were the 35Cl-containing [MþH]þ ion at m/z 404, andthe 37Cl-containing analog at m/z 406 (dwell time 0.1 s). As OTA
FIGURE 23. GC/MS-EI fragmentation spectra of 2,4,6-trichloroani-
sole. (Reprinted from Journal of Agricultural and Food Chemistry 50,
Soleas et al., Method for the gas chromatographic assay with mass
selective detection of trichloro compounds in corks and wines applied to
elucidate the potential cause of cork taint. p. 1034, Copyright 2002, with
permission from American Chemical Society).
FIGURE 24. GC/MS TIC of 2,4,6-trichloroanisole (TCA) and deuterated d5-TCA used as internal standard
(left). On the right, the GC/MS SIM traces of extracted ions at m/z 195 of TCA fragment ion, and at m/z 215
of I.S. molecular ion, used for quantification. (Reprinted from Journal of Chromatography A, 786, Evans
et al., Analysis of 2,4,6-trichloroanisole in wines using solid-phase microextraction coupled to gas
chromatography-mass spectrometry. p. 295, Copyright 1997, with permission from Elsevier).
GRAPE AND WINE CHEMISTRY &
Mass Spectrometry Reviews DOI 10.1002/mas 765

contains a chlorine atom, additional confirmation was obtainedby monitoring the two isotopic forms, and by comparing the m/z404/406 peak area ratios of OTA in samples with standardsolutions. Analysis of IAC extracts showed large amounts ofco-extractives compounds probably responsible of the ionsuppression observed and not occurring in the standard analysis.By performing analyses of 60 different samples of retail driedvine fruits, OTA level higher than 0.2 mg/kg was found in 19 of20 currant, 17 of 20 sultana, and 17 of 20 raisin samples, withmaximum content of 53.6 mg/kg.
Zollner et al. (2000) performed a LC/ESI method todetermine OTA in wine using MS-MS in multiple reactionmonitoring (MRM) with nitrogen as collision gas. Zearalanone(ZAN) was used as internal standard. The MRM ions selectedwere m/z 404! 239 (relative to [MþH-Phe]þ species), m/z404! 257, and m/z 406! 241 for OTA, and m/z 321! 123/189for ZAN. Collisional energy 32.5 eV was applied to have thehighest sensitivity. The method LOD achieved was 0.5 ppb.
In 2001, Soleas et al. published a GC/MS method to assayOTA in wine and beer (Soleas, Yan, & Goldberg, 2001). Afterperforming liquid extraction with dichloromethane and deriva-tization with bis [trimethylsilyl]trifluoroacetamide (BSTFA),detection was performed by monitoring in SIM mode the eightspecific ions at m/z 528, 529, 530, 531, 532, 604, 606, and 619.Recoveries ranging between 69% and 75% were reported. LODand LOQ were estimated at 0.1 and 2 mg/L, respectively. Themethod performances are lower than limits achieved byperforming C18 SPE and reverse-phase LC (gradient) analysiswith photodiode array detection at 333 nm: LOD and LOQ of0.05 and 0.10 mg/L, respectively. As a consequence, the GC/MSmethod is not suitable for routine quantitation, but it is potentiallyuseful as a confirmatory tool for samples containing OTA inlevels higher 0.1 mg/L.
Leitner et al. (2002) compared different analytical methodsto determine OTA in wine. ZAN was used as internal standard;the sample clean-up was performed by either IAC or C18
cartridges. LC analysis was combined with either ESI/MS-MS orfluorescence detection. An optimized sensitivity was obtained bysplitting the LC eluent in a ratio of 1:50, a 10 mL/min flow wasintroduced into the ion source. Detection at electrospray voltageof þ5,600V in MRM mode (collision gas nitrogen) wasperformed, the precursor/product ion combinations used were:m/z 404! 239, m/z 404! 257, and m/z 406! 241 for OTA; m/z321! 123 and 321! 189 for ZAN (dwell time 400 ms). Thehighest sensitivity was obtained using collisional energy 32.5 eV(as proposed by Zollner et al., 2000), with LOD 0.05 mg/L.Authors evidenced as advantage of mass spectrometry analysisthe use of the cheaper C18 SPE cartridge for the samplepreparation, on the contrary the specific IAC sample clean-up
to eliminate the matrix interferences is required for FL detection.By comparing the selective imunoaffinity clean-up coupled withFL detection, and C18 SPE coupled with MS-MS detection,comparable quantitative results were achieved; by coupling IACswith MS detection no advantages in terms of sensitivity andaccuracy were observed. Finally, LC/MS resulted in generaladvantageous as sample preparation, easy automatization, andunambiguous analyte identification.
In 2003, a study on the occurrence of OTA in 24 winescommercialized in South Africa and Italy was investigated byLC-fluorescence detection, performing confirmation by LC/MS-ESI in positive ion mode, was published (Shephard et al., 2003).The OTA confirmation was performed by CID experiments on theanalyte protonated molecular ion [MþH]þ at m/z 404 andselected reaction monitoring (SRM) of the resultant product ions[MþH – H2O – CO]þ at m/z 358 and [MþH – H2O]þ at m/z 386.
VII. ICP/MS AND ANALYSIS OFPB AND AS IN WINE
Sodium arsenite is employed in viticulture as fungicide againstthe esca plant disease (Eutypa lata). Arsenic is a suspectedcarcinogen and little is known about its chronic sub-lethal effects.The concentration of As in wines mainly depends on factors suchas soil composition, grape variety, climatic conditions, use ofpesticides, process of vinification, and storage conditions. TheOfficer Internationale de la Vigne et du Vin (O.I.V.) has set themaximum limit of As in wines at 200 pg/mL, but in general it isaccepted the presence of only a few pg/mL of As in un-contaminated wines (Baluja-Santos & Gonzalez-Portal, 1992;Bruno, Campos, & Curtius, 1994; Pedersen, Mortesen, & Larsen,1994; Kildahl & Lund, 1996). Traditionally the determining ofAs in wine is based on the generation of volatile amines followedby reaction with silver diethyldithiocarbamate, and measurementof molecular absorption of the As-containing complex formed(Handson, 1984). But the method LOD, estimated at 10 pg/mL,is not sufficient for the wine analysis. Alternatively, hydridegeneration atomic absorption spectrometry has been used for thequantification of several hydride-forming elements in wine,including As (Baluja-Santos & Gonzalez-Portal, 1992). Thetechnique normally requires sample decomposition, a timeconsuming procedure, which may result in sample contaminationor analyte loss. Unfortunately, both spectral and non-spectralinterferences of As are present, in particular intensity of Assignals are affected by non-spectral interference of carbon-containing substances. By ICP/MS signals of As may beenhanced from carbon-containing compounds.
Wangkarn & Pergantis (1999) proposed a method for thedetermination of As in wines using microscale flow injection(mFI) ICP/MS. The use of a microscale flow injection system witha microconcentric nebulizer (MCN) permitted an efficientsample introduction into the ICP/MS system, and reduced thematrix effects by a factor of 2–3 compared with conventionalFI-ICP/MS systems. Sample volumes between 0.2 and 1.0 mLwere injected into the system with a carrier flow rates rangingfrom 50 to 200 mL/min. The LOD of method resulted rangingfrom 25 to 59 fg As, and in wine resulted of 0.5 pg/mL. The
FIGURE 25. Structure of ochratoxin A (OTA).
& FLAMINI AND PANIGHEL
766 Mass Spectrometry Reviews DOI 10.1002/mas

method was developed on deionised water diluted wine samplesusing In as internal standard. By performing external calibrationor standard addition identical results were achieved. Analyseswere performed by quadrupole mass filter in SIM mode recordingthe signal at m/z 75 of Asþ species. By monitoring the signal atm/z 77 not evidence of 40Ar37Clþ (the species that can interferewith the signal at m/z 75 of 40Ar35Clþ) was observed. Since winescontain chloride at about 100 mg/mL it is essential to check forany chloride interferences. Concentration of As in the samplesstudied ranged between 7 and 13 pg/mL.
The presence of lead in wine may be as the consequence ofthe airborne particulate matter of atmosphere on grapes, and/or ofthe intake by the grapevine from ground water and soil. The metalmay also be released from bronze tanks, taps, pumps and tubing,containers used in winemaking. Since lead may be a real healthhazard because it affects the hemoglobin biosynthesis and thenervous system, the maximum permissible lead level in wine isregulated (International Methods of Wine Analysis, 1990 Paris;EC Regulation no. 466/2001, 2001). Detection of lead in wine isusually focused on the determination of the total lead Pb2þ. Inwine, the structurally complex pectic polysaccharide rhamnoga-lacturonan II (RG-II), an anionic biomolecule released from thegrape berry cell walls during vinification, is present. RG-II ismainly released as a dimer (dRG-II), which can form coordina-tion complexes with specific divalent cations as lead.
Szpunar et al. (1998) published a size-exclusion LC-ICP/MS (SEC-ICP/MS) method for analysis of lead biomolecularcomplexes in wine. By this approach, the lead distribution amongbiomolecular compounds was determined within 30 min; leadbound to biomolecules was quantified by comparing thechromatographic peak area with that of a signal obtained withflow-injection ICP/MS analysis. The bound lead fraction wascalculated as the ratio of the peak area of the lead signal obtainedby injection of the diluted wine sample on the size-exclusioncolumn (isocratic elution with a Tris-HCl buffer pH 7.2), to thepeak area of a signal of the same sample obtained by flow-injection ICP/MS using the chromatographic mobile phase as thecarrier stream (the eluate from the column was introduceddirectly into the ICP/MS). Three major lead isotopes 206Pb,207Pb, and 208Pb (abundance 24.1, 22.1, and 2.4%, respectively)were monitored. Lead was found to be combined with one majorbiomolecular species in wine of ca. 10 kDa and one to three minorcompounds. Between 40% and 95% of lead was found to form thecomplex with the dimer of RG-II, whose average concentrationranged between 20 and 100 mg/L in red and white wine,respectively.
In nineties, several applications of ICP/MS for the multi-element detection in wine were proposed: more than 60 elementsin wine were detected in a single run within 5 min (Williams,Jarvis, & Willis, 1992); another paper reported analysis of themajor wine elements Mg, Na, K, Ca, and Fe, the minor elementsAl, Cr, Mn, Cu, Zn, Se, Sr, Br, Rh, and trace elements Li, Ti, Ni,As, I, Ba, Pb, Sc, V, Co, Y, Zr, Mo, Sn, Cs, Ga, Nb, Pd, Cd, Sb, Hf,W, Hg, Tl, Th, and U (Perez-Jordan et al., 1998).
In 1999, by application of the double-focusing sector fieldICP/MS (ICP/SMS) the inorganic elements in alcoholicbeverages were detected with fg/mL LODs for high m/z valueelements (e.g., actinide) (Rodushkin, Odman, & Appelblad,1999). Measures of the Pb isotopic ratio showed better precision
than that obtained by quadrupole ICP/(Q)MS, in good accor-dance with as obtained by thermal ionization mass spectrometry(TIMS).
A year after, the Pb isotopic ratios were determined in 20different wines from all around the world by using the axialinductively coupled plasma-time of flight mass spectrometry(ICP/TOF-MS) (Tian et al., 2000). Data were compared withresults obtained by multicollector ICP/(MC)MS and quadrupoleICP/(Q)MS instruments. Pb levels between 5 and 150 mg/L werefound in samples, and the ratios 206Pb/207Pb, 208Pb/206Pb, and206Pb/204Pb were calculated. Ratios 206Pb/207Pb and 208Pb/206Pbby ICP/TOF-MS and ICP/(MC)MS analysis were similar,whereas not accordance of the 206Pb/204Pb ratio was observedbetween two techniques. The data obtained by ICP/(Q)MS werenot in accordance with those obtained by the two othertechniques.
Almeida and Vasconcelos applied ICP/MS to study the Pbcontamination in Port wine in samples since vintage 1935 untilvintage 1984 (Almeida & Vasconcelos, 1999). By performingthe study on 24 different Port wines Pb contents between 47 and80 mg/L were found, and a significant correlation between thetotal lead content and the 208Pb/206Pb ratio (with a sensibledecrease in the older wines) was observed.
VIII. MASS SPECTROMETRY FOR DETERMININGORIGIN OF WINE AND ILLEGAL ADDITIONS
Nowadays the increasing interest about the foodstuffs prove-nance is due to the request of consumer of additional warrantiesof quality, authenticity, and typicality. The Controlled OriginDenomination (Appelation d’Origine Controlee, A.O.C.) ofwines represents the unambiguous reference to the geographicalorigin and is an important indicator of quality. Some analyticalparameters in wine are detected to evaluate the authenticity ofproduct.
The 87Sr/86Sr isotope ratio is related to the geographicalorigin since it is characteristic of the soil where the vine is grown.This ratio was demonstrated not to change during the uptake of anelement from soil by a plant, and in plants it reflects the bedrock,soil, and soil water of growth. In 2002 was proposed a ICP sectorfield multicollector MS (ICP/SF-MC-MS) method for thedetermination of the Sr isotope ratios in wine, by using a sectorfield mass analyzer with a multicollector having the precisionrequired for the discrimination of different wines (<0.005%)(Barbaste et al., 2002). Because of the 87Sr measurement by MS issubject to interference from 87Rb, a preliminary chromatographicseparation was needed. As a matter of fact, the proximity of themasses of the two isotopes (86.908882 and 86.909186 for 87Srand 87Rb, respectively) needs a resolution (m/Dm) of ca. 3� 105
to discriminate one to another, not achievable by ICP/SF-MS.Experimental conditions of ICP/SF-MC-MS system wereradio frequency power (Rf) 1,250 W and plasma gas flow rate0.7 L/min. Precision 100 times better than by ICP/(Q)MS, and10 times better than by ICP/SF-MS without multicollector wasreported. The study was performed on 11 wines from differentorigin and revealed difference in the 87Sr/86Sr ratio betweenwines produced on basaltic, mixed, and granitic soils.
GRAPE AND WINE CHEMISTRY &
Mass Spectrometry Reviews DOI 10.1002/mas 767

The same year, another ICP/MS study on the trace andultratrace elements contents of 153 wines from the CanaryIslands was published (Perez-Trujillo, Barbaste, & Medina,2002). Concentration of 20 elements was measured, and thelevels of Te, Pt, Co, Zn, Re, Ti, Sb, Au, Rb were observed to belinked to the vintage, types of wines, and region of origin.
By ICP/MS, Taylor et al. studied differences in the elementcomposition of Canadian wines from different region byperforming a simultaneous determination of 34 trace elementsin wine (Li, Be, Mg, Al, P, Cl, Ca, Ti, V, Mn, Fe, Co, Ni, Cu, Zn,As, Se, Br, Rb, Sr, Mo, Ag, Cd, Sb, I, Cs, Ba, La, Ce, Tl, Pb, Bi,Th, and U) (Taylor, Longerich, & Greenough, 2003). TheAuthors identified several elements useful to distinguish productsfrom different regions of provenance. Among them, 10 elementsallowed to discriminate two different regions with accuracy of100%. In particular Sr was confirmed to be a good indicator ofprovenance. Because of the presence of ethanol, analysis wasperformed using a high Rf (1,500 W) necessary to maintain astable plasma (plasma gas flow rate of 14 L/min).
Isotopic techniques in the wine analysis were introducednearly 20 years ago from the French Government for detectingthe sucrose enrichment of wines. The site-specific natural iso-topic fractionation-nuclear magnetic resonance (SNIF-NMR)was adopted by the O.I.V. as an international method for the wineanalysis (O.I.V., 1990). The European Community RegulationNo. 2676/90 (EC Regulation no. 2676/90, 1990) adopted thismethod and also referred to the desirability of isotopic ratio massspectrometry (IRMS) of the 13C/12C ratio of ethanol in wine asadditional determination. The European Community proposedthe institution of a data-bank of reference values for wines of theEuropean wine producing regions (EC Regulation no. 2048/89,1989).
The 13C/12C isotope ratio of ethanol and the 18O/16O ratio ofwater reveal adulterations such as the cane sugar addition and thewatering of wine (Guillou et al., 2001). During the waterevaporation from the oceans, and with evapo-transpiration ofwater from plants, a depletion in heavy isotopes in the vaporoccurs compared with the liquid state. As a consequence, higherisotope ratios are observed in water from plants with respect tothe ground water. Most of the plants, such as grape and sugar-beet, fix the atmospheric CO2 by a carboxylation of ribulosel,5-diphosphate forming two phosphoglycerate molecules. Thisprocess is accompanied by an important depletion in 13C content.A second category of plants such as cane and maize, fix CO2 bycarboxylation of phosphoenolpyruvate leading to the oxalaceticacid, almost without isotope fractionation with respect to the 13Ccontent of atmospheric CO2. As a consequence, products fromthe latter plants have higher 13C contents than analogous productsfrom grape. The 13C/12C IRMS measurements are carried out onthe CO2 gas formed by combustion of the sample, the 18O/16Oratio is determined on a CO2 gas on the isotopic equilibrationwith the water to be analyzed. Intensity of the CO2 isotopomersion currents at m/z 44, 45, and 46 are measured for both thesample and reference. The isotopic ratio is calculated withrespect to the reference international standard as deviation permil (d%):
dX% ¼ ½ðRsample � RreferenceÞ=Rreference� � 1000
where X¼ 2H/1H, 13C/12C, 18O/16O; R¼ isotopic ratios ofsample and the reference international standard.
Martin et al. (1999) reported that by determining the naturalabundance isotopic ratios of H, O, and C, from water and ethanolextracted from the wine of the Bordeaux region in France, it ispossible to distinguish between sub-regions. Authors observedthat SNIF-NMR and IRMS parameters may be subjected toclimatic influences and are more efficient for characterizing theyear of production of a given appellation than for distinguishingdifferent appellations.
Ogrinc et al. (2001) investigated the authenticity andgeographical origin of Slovenian wines by combination of IRMSand SNIF-NMR. A total of 102 grape samples were collected indifferent wine-growing regions in 1996, 1997, and 1998. Theisotopic ratios determined to discriminate between coastal andcontinental regions were 2H/1H of methylene group of ethanol,d13C, and d18O values. Authors evidenced that the d18O valueswere modified by the meteorological events during graperipening and harvest.
The year after, authenticity of tequila samples was studiedby performing the headspace SPME sampling with a PDMS/DVB 65 mm fiber and on-line capillary GC/IRMS analysis(Aguilar-Cisneros et al., 2002). The d13C standard values weresimilar for 100% agave and mixed tequila samples, whereas thed18O data differed slightly within these categories.
In recent years, D(þ) malic acid has been found by Germanauthorities in some imported Italian wines. As a result, thenaturalness of products was suspected. While the presence oflarge amounts of D(þ) malic acid (some hundreds mg/L) leavesno doubts about the illegal addition of racemic malic acid, theoccurrence of some tens mg/L of this acid cannot be always takenas evidence of illegal acidification. Also if the presence of D(þ)malic acid has been revealed in musts and wines, as well as insynthetic media fermented by yeasts, and the formation of D(þ)malic acid is believed to be the result of side reactions during thealcoholic fermentation, the assumption that only the L(�) isomeroccurs in grapes and natural musts and wines has been worldwideaccepted.
In 1995, the occurrence of D(þ) malic acid in 70 Italianwines was investigated by performing a SPE sample preparation,derivatization of malic acid into methyl ester and GC/MSanalysis (Gaetano et al., 1995). Analyses were carried out by ag-cyclodextrin-trifluoracetyl chiral column using glutaric acid asinternal standard. For quantitative analysis, SIM of signals atm/z 100 and 103 (the base peak of mass spectra), relative to theinternal standard and dimethyl malate, respectively, wereregistered. An occurrence of D(þ) malic acid in 60% of thesamples inspected was revealed in amounts between 4 and100 mg/L. The study demonstrated the presence of low amountsof D(þ) malic acid in wines is not an evidence of illegalacidification of watered down products.
IX. CONCLUSIONS
Controls in food industry are fundamental to protect theconsumer health. For high quality products, warranty of originand identity is required and analytical control is very important to
& FLAMINI AND PANIGHEL
768 Mass Spectrometry Reviews DOI 10.1002/mas

prevent frauds. Common quality control of wine is performed byspectrophotometric methods, with determination of anthocyanicand polyphenolic indexes, organic acids, acetaldehyde, afterperforming colorimetric or enzymatic reactions; alkaline ele-ments and heavy metals are determined by atomic spectroscopy;sugars, glycerine, ethanol, organic acids by LC with UV-Vis andRI detection; pesticides and volatile compounds by GC usingECD or FID detector.
In the recent years, a very important contribute of massspectrometry has been observed: liquid- and gas-phase methodsfor determination of parameters related to illegal additions to thewine, heavy metals, pesticide residues, compounds released frommicrobiological and technological processes, have been pro-posed. The LC-MS/MS analysis of OTA in wine allows toconfirm the toxin presence without performing time and solventconsuming sample derivatization procedures, or the use ofexpensive IACs columns. The ICP/MS multielement analysis ofwine is a useful tool for the product characterization aimed toguarantee authenticity, in particular for Appelation d’OrigineControlee wines. IRMS, coupled with NMR, reveals the winewatering and sugar addition, and is used to determine the productorigin and traceability. Moreover, the high sensitivity of massspectrometry make this technique as an advantageous GCdetector with respect to the traditional radioactive-source-containing ECD used for pesticides analysis. This is an advantagealso due to the severe regulations and laborious controlprocedures required for radioactive sources in laboratory.
In the last 25 years, mass spectrometry provided importantcontribution to the grape and wine chemistry knowledge. By thehigh versatility and sensitivity of LC/MS and MS/MS techniques,nowadays present in many laboratories of enological chemistry,new approaches to the research are being developed, and the massspectrometry role is bounded to increase when new mass spectradatabases will be available.
REFERENCES
Adachi J, Mizoi Y, Naito T, Yamamoto K, Fujiwara S, Ninomiya I. 1991.
Determination ofb-carbolines in foodstuffs by high-performance liquid
chromatography and high-performance liquid chromatography-mass
spectrometry. J Chromatogr 538:331–339.
Aguilar-Cisneros BO, Lopez MG, Richling E, Heckel F, Schreier P. 2002.
Tequila authenticity assessment by headspace SPME-HRGC-IRMS
analysis of 13C/12C and 18O/16O ratios of ethanol. J Agric Food Chem
50:7520–7523.
Allen MS, Lacey MJ, Boyd SJ. 1994. Determination of methoxypyrazines in
red wines by stable isotope diluition gas chromatography-mass
spectrometry. J Agric Food Chem 42(8):1734–1738.
Allen MS, Lacey MJ, Boyd SJ. 1995. Methoxypyrazines in red wines:
Occurrence of 2-methoxy-3-(1-methylethyl) pyrazine. J Agric Food
Chem 43(3):769–772.
Almeida CMR, Vasconcelos MTSD. 1999. Determination of lead isotope
ratios in port wine by inductively coupled plasma mass spectrometry
after pre-treatment by UV-irradiation. Anal Chim Acta 396(1):45–53.
Alves RF, Nascimento AMD, Nogueira JMF. 2005. Characterization of the
aroma profile of Madeira wine by sorptive extraction techniques. Anal
Chim Acta 546:11–12.
Anderson M, Hasan F, McCroden J, Tipton K. 1993. Monoamine oxidase
inhibitors and the cheese effect. Neurochem Res 18(11):1145–1149.
Anocibar Beloqui A, Guedes de Pinho P, Bertrand A. 1995. Bis(2-
hydroxyethyl)disulfide, a new sulphur compound found in wine. Its
influence in wine aroma. Am J Enol Vitic 46(1):84–87.
AOAC. 1995. Official methods of analysis of AOAC International, 16th
edition. Vol. II. Ch. 28. Method 994.07. Gaithersburg, MD: AOAC.
Aung LH, Smilanick JL, Vail PV, Hartsell PL, Gomez E. 1996. Investigations
into the origin of chloroanisoles causing musty off-flavor of raisins.
J Agric Food Chem 44(10):3294–3296.
Azenha M, Vasconcelos MT. 2002. Butyltin compounds in Portuguese wines.
J Agric Food Chem 50:2713–2716.
Baluja-Santos C, Gonzalez-Portal A. 1992. Application of hydride generation
to atomic-absorption spectrometric analysis of wines and beverages:
A review. Talanta 39(4):329–339.
Barbaste M, Robinson K, Guilfoyle S, Medina B, Lobinski R. 2002. Precise
determination of the strontium isotope ratios in wine by inductively
coupled plasma sector field multicollector mass spectrometry (ICP-SF-
MC-MS). J Anal At Spectrom 17:135–137.
Baskaran S, Prasanna Rajan D, Balasubramanian KA. 1989. Formation of
methylglyoxal by bacteria isolated from human faeces. J Med Microbiol
28:211–215.
Bellavia V, Natangelo M, Fanelli R, Rotilio D. 2000. Analysis of
benzothiazole in Italian wines using headspace solid-phase microex-
traction and gas chromatography-mass spectrometry. J Agric Food
Chem 48:1239–1242.
Blank R, Hohler D, Wolffram S. 1999. Ochratoxin in the food chain-
occurrence, toxicity, and decontamination. Uebers Tierernaehr 27:
123–163.
Bonino M, Schellino R, Rizzi C, Aigotti R, Delfini C, Baiocchi C. 2003.
Aroma compounds of an Italian wine (Ruche) by HS-SPME analysis
coupled with GC-ITMS. Food Chem 80:125–133.
Bouchilloux P, Darriet P, Dubourdieu D. 1998. Identification of a very
odoriferous thiol, 2 methyl-3-furanthiol, in wines. Vitis 37(4):177–180.
Briggs S. 1992. A basic guide to pesticides: Their characteristics and hazards.
Washington, DC: Hemisphere Publishing Corporation.
Bruno SNF, Campos RC, Curtius AJ. 1994. Determination of lead and arsenic
in wines by electrothermal atomic absorption spectrometry. J Anal At
Spectrom, Cambridge 9:341–344.
Burdaspal PA, Legarda TM. 1999. Ochratoxin A in wine and grape musts and
juices produced in Spain and other European countries. Aliment
(Madrid) 299:107–113.
Burttshel RH, Rosen AA, Middleton FM, Ettinger MB. 1951. Chlorine
derivatives of phenol causing taste and odor. J Am Water Works Assoc
51:205–214.
Butzke CE, Bisson LF. 1997. Ethyl carbamate preventative action manual.
U.S. Food and Drug Administration, Center for Food Safety and
Applied Nutrition. http://vm.cfsan.fda.gov/�frf/ecaction.html
Cabras P, Diana P, Meloni M, Pirisi FM, Pirisi R. 1983. Reversed-phase high-
performance liquid chromatography of pesticides. Analysis of Vinclo-
zolin, Iprodione, Procymidone, Dichlozolinate and their degradation
product 3,5-dichloroaniline on white must and wine extracts.
J Chromatogr 256:176–181.
Cabras P, Angioni A, Garau VL, Minelli EV. 1997a. Gas chromatographic
determination of cyprodinil, fludioxonil, pyrimethanil, and tebucona-
zole in grapes, must, and wine. J AOAC Int 80(4):867–870.
Cabras P, Angioni A, Garau VL, Melis M, Pirisi FM, Farris GA, Sotgiu C,
Minelli EV. 1997b. Persistence and metabolism of folpet in grapes and
wine. J Agric Food Chem 45(2):476–479.
Cabras P, Angioni A, Garau VL, Pirisi FM, Brandolini V. 1998. Gas
chromatographic determination of azoxystrobin, fluazinam, kresoxim-
methyl, mepanipyrim and tetraconazole in grapes, must and wine.
J AOAC Int 81(6):1185–1189.
Careri M, Mazzoleni V, Musci M, Molteni R. 2001. Study of electron beam
irradiation effects on 2,4,6-trichloroanisole as a contaminant of cork by
GRAPE AND WINE CHEMISTRY &
Mass Spectrometry Reviews DOI 10.1002/mas 769

gas chromatography-mass spectrometry. Chromatographia 53(9/10):
553–557.
Castegnaro M, Mohr U, Pfohl-Leszkowicz A, Esteve J, Steinmann J,
Tillmann T, Michelon J, Bartsch H. 1998. Sex-and strain-specific
induction of renal tumors by ochratoxin A in rats correlates with DNA
adduction. Int J Cancer 77:70–75.
Castellari M, Fabbri S, Fabiani A, Amati A, Galassi S. 2000. Comparison of
different immunoaffinity clean-up procedures for high-performance
liquid chromatographic analysis of ochratoxin A in wines. J
Chromatogr A 888:129–136.
Chatonnet P, Dubourdieu D. 1998. Identification of substances responsible for
the ‘‘sawdust’’ aroma in oak wood. J Sci Food Agric 76:179–188.
Ciolfi G, Garofolo A, Di Stefano R. 1995. Identification of some
o-aminophenones as secondary metabolites of Saccharomyces cerevi-
siae. Vitis 34(3):195–196.
Codex Alimentarius Commision. 1990–1998. Codex maximum residue
limits for pesticides. http://apps.fao.org/servlet/org.fao.waicent.
Codex. FAO.
Conacher HBS, Page BD, Lau BPY, Lawrence JF, Bailey R, Calway P,
Hanchay JP, Mori B. 1987. Capillary column gas chromatographic
determination of ethyl carbamate in alcoholic beverages with
confirmation by gas chromatography/mass spectrometry. J Assoc Off
Anal Chem 70:749–751.
Costacurta A, Calo A, Crespan M, Milani M, Carraro R, Aggio L, Flamini R,
Ajmone-Marsan P. 2001. Morphological, aromatic and molecular
characteristics of Moscato vine varieties and research on phylogenetic
relations. Bull de l’O.I.V. 841-842:133–150.
Cutzach I, Chatonnet P, Henry R, Dubourdieu D. 1997. Identification of
volatile compounds with a ‘‘toasty’’ aroma in heated oak used in
barrelmaking. J Agric Food Chem 45(6):2217–2224.
Daudt CE, Ough CS, Stevens D, Herraiz T. 1992. Investigations into ethyl
carbamate, n-propyl carbamate, and urea in fortified wines. Am J Enol
Vitic 43(4):318–322.
Davis CR, Wibowo D, Eschenbruch R, Lee TH, Fleet GH. 1985. Pratical
implications of malolactic fermentation: A rewiew. Am J Enol Vitic
36(4):290–301.
de Revel G, Bertrand A. 1993. A method for the detection of carbonyl
compounds in wine: Glyoxal and methylglyoxal. J Sci Food Agric
61:267–272.
de Revel G, Bertrand A. 1994. Dicarbonyl compounds and their reduction
products in wine. Identification of wine aldehydes. In: Maarse H, van
der Heij DG, editors. Trends in flavour research. Zeist, The Netherlands:
Elsevier Science B.V. pp 353–361.
De Santiago A, Aguilar-Santelises M. 1999. Organotin compounds decrease
in vitro survival, proliferation and differentiation of normal human B
lymphocytes. Hum Exp Toxicol 18:619–624.
Di Stefano R. 1989. Evoluzione dei composti terpenici liberi e glucosidici e
degli actinidioli durante la conservazione dei mosti e dei vini in
funzione del pH. Riv Vitic Enol 2:11–23.
Di Stefano R. 1996. Metodi chimici nella caratterizzazione varietale. Riv
Vitic Enol 1:51–56.
Di Stefano R, Maggiorotto G, Gianotti S. 1992. Trasformazioni di nerolo e
geraniolo indotte dai lieviti. Riv Vitic Enol 1:43–49.
Di Stefano R, Ciolfi G. 1982. Produzione di acetaldeide da parte di stipiti di
lieviti di specie diverse. Riv Vitic Enol 35:474–480.
DM 14.12.2004. 2004. Italian Official Gazette, G.U. 292 14/12/04, All. 2,
S.O. 179.
EC Regulation no. 2048/89. 1989. Official Journal of the European
Communities 1989, L 202, 32–40.
EC Regulation no. 2676/90. 1990. Official Journal of the European
Communities 1990, L 272, 64–73.
EC Regulation no. 2870/2000. 2000. Official Journal of the European
Communities 2000, L 333, 20–46.
EC Regulation no. 466/2001. 2001. Official Journal of the European Union
2001, L077, 3–5.
EC Regulation no. 123/2005. 2005. Official Journal of the European Union,
2005, L025, 1–12.
Eder S, Benesic A, Freudinger R, Engert J, Schwerdt G, Drumm K, Gekle M.
2000. Nephritogenic ochratoxin A interferes with mitochondrial
function and pH homeostasis in immortalized human kidney ephitelial
cells. Pfluegers Arch 440:521–529.
European Directive 90/642/EEC. 1990. Official Journal of the European
Communities 1990, L 350, 71.
Evans TJ, Butzke CE, Ebeler SE. 1997. Analysis of 2,4,6-trichloroanisole in
wines using solid-phase microextraction coupled to gas chromatogra-
phy-mass spectrometry. J Chromatogr A 786:293–298.
Fauhl C, Wittkowski R. 1992. Determination of ethyl carbamate in wine by
GC-SIM-MS after continous extraction with diethyl ether. J High Res
Chromotogr 15:203–205.
Favretto D, Grandis G, Allegri G, Traldi P. 1998. An investigation on the
aroma fraction of some Italian wines by solid phase micro extraction gas
chromatography/mass spectrometry and membrane inlet mass spectro-
metry. Rapid Commun Mass Spectrom 12:1595–1600.
Fernandes JO, Ferreira MA. 2000. Combined ion-pair extraction and gas
chromatography-mass spectrometry for the simultaneous determina-
tion of diamines, polyamines and aromatic amines in Port wine and
grape juice. J Chromatogr A 886:183–195.
Fernandez M, Pico Y, Manes J. 2000. Determination of carbamate
residues in fruits and vegetables by matrix solid-phase dispersion and
liquid chromatography-mass spectrometry. J Chromatogr A 871:
43–46.
Ferreira MA, Fernandes JO. 1992. The application of an improved GC-MS
procedure to investigate ethyl carbamate behaviour during the
production of Madeira wines. Am J Enol Vitic 43(4):339–343.
Filali A, Ouammi L, Betbeder AM, Baudrimont I, Soulaymani R, Benayada
A, Creppy EE. 2001. Ochratoxin A in beverages from Morocco: A
preliminary survey. Food Addit Contam 18(6):565–568.
Flamini R. 2003. Mass spectrometry in grape and wine chemistry. Part I:
Polyphenols. Mass Spec Rev 22:218–250.
Flamini R, Dalla Vedova A, Calo A. 2001. Study on the monoterpene contents
of 23 accessions of Muscat grape: Correlation between aroma profile
and variety. Riv Vitic Enol 2(3):35–49.
Flamini R, De Luca G, Di Stefano R. 2002. Changes in carbonyl compounds
in chardonnay and cabernet sauvignon wines as a consequence of
malolactic fermentation. Vitis 41(2):1017–1112.
Flamini R, Tonus T, Dalla Vedova A. 2002. A GC-MS method for determining
acetaldehyde in wines. Riv Vitic Enol 2(3):15–20.
Flamini R, Dalla Vedova A. 2003. Glyoxal/glycolaldehyde: A redox system
involved in malolactic fermentation of wine. J Agric Food Chem
51(8):2300–2303.
Flamini R, Dalla Vedova A, Panighel A, Perchiazzi N, Ongarato S. 2005.
Monitoring of the principal carbonyl compounds involved in malolactic
fermentation of wine by solid-phase microextraction and positive ion
chemical ionization GC/MS analysis. J Mass Spectrom 40(12):1558–
1564.
Fostel H, Podek F. 1992. Detection of methyl isothiocyanate (methyl mustard
oil) in wine. Ernaehrung 16(3):157–158.
Francioli S, Guerra M, Lopez-Tamames E, Guadayoi JM, Caixach J. 1999.
Aroma of sparkling wines by headspace/solid phase microextraction
and gas chromatography/mass spectrometry. Am J Enol Vitic 50(42):
404–408.
Fuller P. 1995. Cork Taint. Closing in on an Industry Problem. Austr New
Zealand Wine Indust J 10(1):58–60.
Gaetano G, Delfini C, Piangerelli MG, Fedi C. 1995. Identification and
evaluation of D(þ) malic acid in wines by means of gas chromato-
graphy/mass spectrometry. Bull de l’O.I.V. 777-778:921–930.
& FLAMINI AND PANIGHEL
770 Mass Spectrometry Reviews DOI 10.1002/mas

Gandini N, Riguzzi R. 1997. Headspace solid-phase microextraction analysis
of methyl isothiocyanate in wine. J Agric Food Chem 45:3092–3094.
Guillou I, Bertrand A, de Revel G, Barbe JC. 1997. Occurrence of
hydroxypropanedial in certain musts and wines. J Agric Food Chem
45:3382–3386.
Guillou C, Jamin E, Martin GJ, Reniero F, Wittkowski R, Wood R. 2001.
Isotopic analyses of wine and of products derived from grape. Bull de
l’O.I.V. 839-840:27–36.
Handson PD. 1984. Lead and arsenic levels in wines produced from vineyards
where lead arsenate sprays are used for caterpillar control. J Sci Food
Agric 35(2):215–218.
Harris RLN, Lacey MJ, Brown WV, Allen MS. 1987. Determination of
2-methoxy-3-alkylpyrazines in wine by gas chromatography/mass
spectrometry. Vitis 26:201–207.
Hatzidimitriou E, Darriet P, Bertrand A, Dubourdieu D. 1997. Folpet
hydrolysis—Incidence on the initiation of the alcoholic fermentation.
J Int des Sci de la Vigne et du Vin 31(1):51–55.
Hayasaka Y, Bartowsky EJ. 1999. Analysis of diacetyl in wine using solid-
phase microextraction combined with gas chromatography-mass
spectrometry. J Agric Food Chem 47:612–617.
Hayasaka Y, MacNamara K, Baldock GA, Taylor RL, Pollnitz AP. 2003.
Application of stir bar sorptive extraction for wine analysis. Anal
Bioanal Chem 375:948–955.
Hoch M. 2001. Organotin compounds in the environment-an overview. Appl
Geochem 16:719–743.
Hohler D. 1998. Ochratoxin A in food and feed: Occurence, legislation and
mode of action. Z Ernaehrungswiss 37:2–12.
Humpf HU, Winterhalter P, Schreier P. 1991. 3,4-Dihydroxy-7,8-dihydro-b-
ionone b-D-glucopyranoside: natural precursor of 2,2,6,8-tetramethyl-
7,11-dioxatricyclo[6.2.1.01,6]undec-4-ene (Riesling acetal) and 1,1,6-
trimethyl-1,2-dihydronaphthalene in Red currant (Ribes Rubrum L)
leaves. J Agric Food Chem 39:1833–1835.
IARC Working Group on the Evaluation of Carcinogenic Risks to Human.
1988. IARC monographs on the evaluation of carcinogenic risks to
humans. Alcohol drinkin. Vol. 44. World Health Organization.
Inoue Y, Rhee H, Watanabe K, Murata K, Kimura A. 1988. Metabolism of
2-oxoaldehyde in mold. Eur J Biochem 171:213–218.
International Methods of Wine Analysis. 1990. Annexe C (Maximum Levels
of Different Elements in Wine). Paris-France.
Jagerdeo E, Dugar S, Foster GD, Schenck H. 2002. Analysis of ethyl
carbamate in wines using solid-phase extraction and multidimensional
gas chromatography/mass spectrometry. J Agric Food Chem 50(21):
5797–5802.
Kakalıkova L, Matisova E, Lesko J. 1996. Analysis of metalaxyl residues in
wines by SPE in combination with HRCGC and GC/MS. Zeitschrift
fuer Lebensmittel Untersuchung und Forschung 203(1):56–60.
Kaufmann A. 1997. Fully automated determination of pesticides in wine.
J AOAC Int 80(6):1302–1307.
Kildahl BT, Lund W. 1996. Determination of arsenic and antimony in wine by
electrothermal atomic absorption spectrometry. Fresenius J Anal Chem
354:93–96.
Lacey MJ, Allen MS, Harris RLN, Brown WV. 1991. Methoxypyrazines in
Sauvignon blanc grapes and wines. Am J Enol Vitic 42(2):103–108.
Lee TH, Simpson RF. 1993. Microbiology and chemistry of cork taints in
wine. In: Fleet GN, editor. Wine microbiology and biotechnology. Chur,
Switzerland: Harwood Academic Publishers. pp 353–372.
Leitner A, Zollner P, Paolillo A, Stroka J, Papadopoulou-Bouraoui A, Jaborek
S, Anklam E, Lindner W. 2002. Comparison of methods for the
determination of ochratoxin A in wine. Anal Chim Acta 453:33–41.
Lindenmeier M, Schieberle P, Rychlik M. 2004. Quantification of ochratoxin
A in foods by a stable isotope dilution assay using high-performance
liquid chromatography-tandem mass spectrometry. J Chromatogr A
1023:57–66.
Liu SQ, Pilone GJ. 1998. A review: Arginine metabolism in wine lactic acid
bacteria and its pratical significance. J Appl Microbiology 84:315–327.
Lovenberg W. 1974. Psycho and vasoactive compounds in food substances.
J Agric Food Chem 22(1):23–26.
MacDonald S, Wilson P, Barnes K, Damant A, Massey R, Mortby E, Shepherd
MJ. 1999. Ochratoxin A in dried vine fruit: Method development and
survey. Food Addit Contam 16(6):253–260.
Mallouchos A, Komaitis M, Koutinas A, Kanellaki M. 2002. Investigation of
volatiles evolution during the alcoholic fermentation of grape must
using free and immobilized cells with the help of solid phase
microextraction (SPME) headspace sampling. J Agric Food Chem
50(13):3840–3848.
Martin GJ, Mazure M, Jouitteau C, Martin YL, Aguile L, Allain P. 1999.
Characterization of the geographic origin of Bordeaux wines by a
combined use of isotopic and trace element measurements. Am J Enol
Vitic 50(4):409–417.
Matisova E, Kakalıkova L, Lesko J, de Zeeuw J. 1996. Application of porous
carbon for solid-phase extraction of dicarboxyimide fungicide residues
from wines in combination with high-resolution capillary gas
chromatography and gas chromatography-mass spectrometry. J Chro-
matogr A 754:445–454.
McIsaac WM, Estevez V. 1966. Structure-action relationship of beta-
carbolines as monoamine oxidase inhibitors. Biochem Pharmacol
15(10):1625–1627.
Miyake T, Shibamato T. 1993. Quantitative analysis of acetaldehyde in foods
and beverages. J Agric Food Chem 41(11):1968–1970.
Monteiro FF, Trousdale EK, Bisson LF. 1989. Ethyl carbamate formation in
wine: Use of radioactively labeled precursors to demonstrate the
involvement of urea. Am J Enol Vitic 40:1–8.
Murata K, Fukuda Y, Watanabe K, Saikusa T, Shimosaka M, Kimura A. 1985.
Characterization of methylglyoxal synthase in Saccharomyces cerevi-
siae. Biochem Biophys Res Comm 131:190–198.
Murata K, Inoue Y, Saikusa T, Watanabe K, Fukuda Y, Kimura A. 1986.
Metabolism of alpha-ketoaldehydes in yeasts: Inducible formation of
methylglyoxal reductase and its relation to growth arrest of Sacchar-
omyces cerevisiae. J Ferment Technol 64:1–4.
Nascimento RF, Marques JC, Lima Neto BS, De Keukeleire D, Franco DW.
1997. Qualitative and quantitative high-performance liquid chromato-
graphic analysis of aldehydes in Brazilian sugar cane spirits and other
distilled alcoholic beverages. J Chromatogr A 782:13–23.
Natangelo M, Tavazzi S, Benfenati E. 2002. Evaluation of solid phase
microextraction-gas chromatography in the analysis of some pesticides
with different mass spectrometric techniques: Application to environ-
mental waters and food samples. Anal Lett 35(2):327–338.
Ngim KK, Ebeler SE, Lew ME, Crosby DG, Wong JW. 2000. Optimized
procedures for analyzing primary alkylamines in wines by pentafluor-
obenzaldehyde derivatization and GC-MS. J Agric Food Chem 48:
3311–3316.
Official Gazette of the Italian Republic. 1994. Ordinanza del Ministero della
Sanita 3 Maggio 1994: Quantita massime di residui di sostanze attive
dei presidi sanitari tollerati in prodotti alimentari di origine vegetale
(recepimento della direttiva n. 93/58/CEE).
Official Gazette of the Italian Republic. 1995. Ordinanza del Ministero della
Sanita 9 Agosto 1995: Limiti massimi di residui di sostanze attive dei
prodotti fitosanitari tollerati in prodotti di origine vegetale (recepimento
direttiva n. 94/30/CE) e in cereali e prodotti di origine animale
(recepimento direttiva n. 94/29/CE).
Official Gazette of the Italian Republic. 2004. Decreto Ministeriale 27 Agosto
2004. Prodotti fitosanitari: limiti massimi di residui delle sostanze attive
nei prodotti destinati all’alimentazione.
Ogrinc N, Kosir IJ, Kocjancic M, Kidric J. 2001. Determination of authenticy,
regional origin, and vintage of Slovenian wines using a combination
of IRMS and SNIF-NMR analyses. J Agric Food Chem 49(3):1432–
1440.
GRAPE AND WINE CHEMISTRY &
Mass Spectrometry Reviews DOI 10.1002/mas 771
Ough CS, Crowell EA, Mooney LA. 1988. Formation of ethyl carbamate
precursors during grape juice (Chardonnay) fermentation. I. Addition of
amino acids, urea, and ammonia: Effects of fortification on intracellular
and extracellular precursors. Am J Enol Vitic 39(3):243–249.
Ough CS, Stevens D, Sendovski T, Huang Z, An D. 1990. Factors contributing
to urea formation in commercially fermented wines. Am J Enol Vitic
41:68–73.
Pedersen GA, Mortesen GK, Larsen EH. 1994. Beverages as a source of toxic
trace element intake. Food Addit Contam 11(3):351–363.
Pena-Neira A, de Simon BF, Garcıa-Vallejo MC, Hernandez T, Cadahıa,
Suarez JA. 2000. Presence of cork-taint responsible compounds in
wines and their cork stoppers. Eur Food Res Technol 211:257–261.
Perez-Coello MS, Sanz J, Cabezudo MD. 1998. Gas chromatographic-mass
spectrometric analysis of volatile compounds in oak wood used for
aging of wines and spirits. Chromatogr 47:427–432.
Perez-Jordan MY, Soldevila J, Salvador A, Pastor A, de la Guardia M. 1998.
Inductively coupled plasma mass spectrometry analysis of wines. JAnal
At Spectrom 13:33–39.
Perez-Trujillo JP, Barbaste M, Medina B. 2002. Contents of trace and
ultratrace elements in wines from the Canary Islands(Spain) as
determined by ICP-MS. J Wine Res 13(3):243–256.
Pfohl-Leszkowicz A, Pinelli E, Bartsch H, Mohr U, Castegnaro M. 1998. Sex-
and strain-specific expression of cytochrome P450s in ochratoxin A-
induced genotoxicity and carcinogenicity in rats. Mol Carginog 23:76–
85.
Pound AW. 1967. The initiation of skin tumours in mice by homologue and N-
substituted derivatives of ethyl carbamate. Austral J Exptl Biol Med Sci
45:507–516.
Przyborski H, Wacha C, Bandion F. 1995. Detection and evaluation of
methylisothiocyanate and allylisothiocyanate in wine. Mitteilungen
Klosterneuburg Rebe und Wein Obstbau und Fruechteverwertung
45(4):123–126.
Ramos AJ, Labernia N, Marin S, Sanchis V, Magan N. 1998. Effect of water
activity and temperature on growth and ochratoxin production by three
strains of Aspergillus ochraceus on a barley extract medium and on
barley grains. Int J Food Microbiol 44:133–140.
Rapp A, Guntert M, Almy J. 1985. Identification and significance of several
sulfur-containing compounds in wine. Am J Enol Vitic 36(3):219–221.
Rapp A, Knipser W, Engel L. 1980. Identification of 3,7-dimethyl-octa-1,7-
dien-3,6-diol in grape and wine aroma of Muscat varieties. Vitis 19:
226–229.
Rapp A, Mandery H, Niebergall H. 1986. New monoterpenediols in grape
must and wine and in cultures of Botrytis cinerea. Vitis 25:79–84.
Rapp A, Mandery H, Ullemeyer H. 1983. 3,7-Dimethyl-1,7-octandiol—A
new terpene compound of the grape and wine volatiles. Vitis 22:225–
230.
Rapp A, Mandery H, Ullemeyer H. 1984. New monoterpenoic alcohols in
grape must and wine and their significance for the biogenesis of some
cyclic monoterpene ethers. Vitis 23:84–92.
Rapp A, Versini G, Ullemeyer H. 1993. 2-Aminoacetophenone: Causal
component of ‘‘untypical aging flavour’’(‘‘naphthalene note’’, ‘‘hybrid
note’’) of wine. Vitis 32:61–62.
Rapp A, Knipser W. 1979. 3,7-Dimethyl-octa-1,5-dien-3,7-diol—A new
terpenoid component of grape and wine aroma. Vitis 18:229–233.
Rapp A, Versini G. 1996. Methylanthranilate (‘‘foxy taint’’) concentrations of
hybrid and Vitis vinifera wines. Vitis 35(4):215–216.
Rocha S, Ramalheira V, Barros A, Delgadillo I, Coimbra MA. 2001.
Headspace solid phase microextraction (SPME) analysis of flavor
compounds in wines. Effect of the matrix volatile composition in the
relative response factors in a wine model. J Agric Food Chem
49(11):5142–5151.
Rodushkin I, Odman F, Appelblad PK. 1999. Multielement determination and
lead isotope ratio measurement in alcoholic beverages by high-
resolution inductively coupled plasma mass spectrometry. J Food
Comp Anal 12(4):243–247.
Rommelspacher H, Nanz C, Borbe HO, Fehske KJ, Muller WE, Wollert U.
1981. Benzodiazepine antagonism by harmane and other beta-
carbolines in vitro and in vivo. Eur J Pharmacol 70(3):409–416.
Saito I, Yamada S, Oshima H, Ikai Y, Oka H, Hayakawa J. 1994. Analysis of
Methyl isothiocyanate in wine by gas chromatography with dual
detection. J AOAC Int 77(5):1296–1299.
Sandra P, Tienpont B, Vercammen J, Tredoux A, Sandra T, David F. 2001. Stir
bar sorptive extraction applied to the determination of dicarboximide
fungicides in wine. J Chromatogr A 928:117–126.
Santodonato J, Davis LN, Howard PH, Saxena J. 1976. Investigation of
selected potential environmental contaminants: Mercaptobenzothia-
zoles. Final report contract No 68-01-3128, project No L1255-06,
prepared for EPA Office of Toxic Substances.
Sauvant C, Silbernagel S, Gekle M. 1998. Exposure to ochratoxin A impairs
organic anion transport in proximal-tubule-derived opossum kidney
cells. J Pharmacol Exp Ther 287:13–20.
Schwerdt G, Freudinger R, Mildenberger S, Silbernagl S, Gekle M. 1999. The
nephrotoxin ochratoxin A induces apoptosis in cultured human
proximal tubule cells. Cell Biol Toxicol 15:405–415.
Shephard GS, Fabiani A, Stockenstrom S, Mshicileli N, Sewram V. 2003.
Quantitation of Ochratoxin A in South African Wines. J Agric Food
Chem 51(4):1102–1106.
Shimohara K, Tseng YK, Sato H, Omura H. 1974. Browning by the reaction
of triose-reductone and amino-acids. S Bull Fac Agric Kyushu Univ
28(3):139–144.
Shimohara K, Maeda H, Nonaki M, Murakami H, Omura H. 1981. Effect of
ascorbic acid and triose-reductone on the grown of Escherichia coli and
Bacillus subtilis. Eiyo to Shohur 34(1):76–79.
Shoseyov O, Bravdo BA, Siegel D, Goldman A, Cohen S, Ikan R. 1990. Iso-
geraniol (3,7-dimethyl-3,6-octadien-1-ol): A novel monoterpene in
Vitis vinifera L. cv. Muscat Roy. Vitis 29:159–163.
Soleas GJ, Yan J, Goldberg DM. 2001. Assay of Ochratoxin A in wine and
beer by high-pressure liquid chromatography photodiode array and gas
chromatography mass selective detection. J Agric Food Chem
49(6):2733–2740.
Soleas GJ, Yan J, Seaver T, Goldberg DM. 2002. Method for the gas
chromatographic assay with mass selective detection of trichloro
compounds in corks and wines applied to elucidate the potential cause
of cork taint. J Agric Food Chem 50(5):1032–1039.
Souza SC, Theodoro KH, Souza ER, da Motta S, Abreu Gloria MB. 2005.
Bioactive amines in Brazilian wines: Types, levels and correlation with
physico-chemical parameters. Brazil Arch Biol Technol 48(1):53–62.
Stratton J, Hutkins R, Taylor S. 1991. Biogenic amines in cheese and other
fermented foods. J Food Protect 54:460–470.
Strauss CR, Wilson B, Williams PJ. 1987. 3-oxo-a-ionol, vomifoliol and
roseoside in Vitis vinifera fruit. Phytochemistry 26(7):1995–1997.
Strauss CR, Dimitriadis E, Wilson B, Williams PJ. 1986. Studies on the
hydrolysis of two megastigma-3,6,9-triols rationalizing the origins of
some volatile C13 norisoprenoids of Vitis vinifera grapes. J Agric Food
Chem 34:145–149.
Strauss CR, Gooley PR, Wilson B, Williams PJ. 1987. Application of droplet
countercurrent chromatography to the analysis of conjugated forms of
terpenoids, phenols, and other constituents of grape juice. J Agric Food
Chem 35:519–524.
Summary of Report 6/00. 2000. Organotin stabilizers in PVC-Assessment of
risks and proposals for risk reduction measures. National Inspectorate,
Solna, Sweden.
Szpunar J, Pellerin P, Makarov A, Doco T, Williams P, Medina B, Łobinski R.
1998. Speciation analysis for biomolecular complexes of lead in wine
by size-exclusion high-performance liquid chromatography-induc-
tively coupled plasma mass spectrometry. J Anal At Spectrom 13:
749–754.
& FLAMINI AND PANIGHEL
772 Mass Spectrometry Reviews DOI 10.1002/mas

Taylor S. 1986. Histamine food poisoning: toxicology and clinical aspects.
CRC Crit Rev Toxicol 17:91–128.
Taylor VF, Longerich HP, Greenough JD. 2003. Multielement analysis of
Canadian wines by inductively coupled plasma mass spectrometry
(ICP-MS) and multivariate statistics. J Agric Food Chem 51:856–
860.
Tegmo-Larsson IM, Spittler TD, Rodriguez SB. 1989. Effect of malolactic
fermentation on ethyl carbamate formation in Chardonnay wine. Am J
Enol Vitic 40(2):106–108.
Tian X, Emteborg H, Barbaste M, Adams FC. 2000. Accuracy and precision
of lead isotope ratios in wines measured by axial inductively coupled
plasma time of flight mass spectrometry. J Anal At Spectrom 15(7):
829–835.
Tominaga T, Darriet P, Dubourdieu D. 1996. Identification of 3-mercapto-
hexyl acetate in Sauvignon wine, a powerful aromatic compound
exhibiting box-tree odor. Vitis 35(4):207–210.
Tomlin C. 1994. The pesticide manual, 10th edition. Faenham, England:
British Crop Protection Council.
Uchiyama S, Takeda H, Kobayashi A, Ito S, Sakurai H, Tada Y, Aoki G,
Hosgai T, Yamanaka T, Maekawa Y, Yoshikawa R, Ito K, Saito Y. 1992.
Determination of methyl isothiocyanate in wine by GC and GC/MS.
J Food Hygien Soc Jap 33(6):603–608.
Unterweger H, Wacha C, Bandion F. 1997. On detection and evaluation of
folpet in grape juice, grape must in fermentation (‘‘Sturm’’) and grape
wine. Mitteilungen Klosterneuburg Rebe und Wein Obstbau und
Fruechteverwertung 47(4):109–116.
Vas Gy, Koteleky K, Farkas M, Dobo A, Vekey K. 1998. Fast screening
method for wine headspace compounds using solid-phase microextrac-
tion (SPME) and capillary GC Technique. Am J Enol Vitic 49(1):100–
104. Research Note.
Vasserot Y, Pitois C, Jeandet P. 2001. Protective effect of a composite cork
stopper on Champagne wine pollution with 2,4,6-trichloroanisole. Am J
Enol Vitic 52(3):280–281.
Velisek J, Davidek J. 1978. Reactions of glyoxal with amino-acids. Formation
of the brown pigments. Sb Vys Sk Chem Technol Praze E: Potraviny
E46:35–50.
Versini G, Rapp A, Reniero F, Mandery H. 1991. Structural identification
and presence of some p-menth-1-enediols in grape products. Vitis 30:
143–149.
Vianna E, Ebeler SE. 2001. Monitoring ester formation in grape juice
fermentations using solid phase microextraction coupled with gas
chromatography—Mass Spectrometry. J Agric Food Chem 49(2):
589–595.
Vidal JP, Estreguil S, Cantagrel R. 1993. Quantitative analysis of cognac
carbonyl compounds at the ppb level by GC-MS of their O-
(pentafluorobenzyl amine) derivatives. Chromatographia 36:183–
186.
Visconti A, Pascale M, Centonze G. 1999. Determination of ochratoxin
A in wine by means of immunoaffinity column clean-up and
high-performance liquid chromatography. J Chromatogr A 864:89–
101.
Vitali M, Guidotti M, Giovinazzo R, Cedrone O. 1998. Determination of
pesticide residues in wine by SPME and GC/MS for consumer risk
assessment. Food Addit Contam 15(3):280–287.
Wangkarn S, Pergantis SP. 1999. Determination of arsenic in organic solvents
and wines using microscale flow injection inductively coupled plasma
mass spectrometry. J Anal At Spectrom 14:657–662.
Whalen M, Loganathan B, Kannan K. 1999. Immunotoxicity of environmen-
tally relevant concentrations of butyltins on human natural killer cells
in vitro. Environ Res 81(2):108–116.
Whiton RS, Zoecklein BW. 2002. Determination of ethyl carbamate in wine
by solid-phase microextraction and gas chromatography/mass spectro-
metry. Am J Enol Vitic 53(1):60–63.
Williams JG, Jarvis KE, Willis JD. 1992. Inductively coupled plasma mass
spectrometry: Application to the analysis of wines. J Wine Res 3:
59–62.
Williams PJ, Strauss CR, Wilson B. 1980. Hydroxylated linalool derivatives
as precursors of volatile monoterpenes of Muscat grapes. J Agric Food
Chem 28:766–771.
Williams PJ, Strauss CR, Wilson B. 1981. Classification of the monoter-
penoid composition of Muscat grapes. Am J Enol Vitic 32(3):230–235.
Williams PJ, Strauss CR, Wilson B, Massy-Westropp RA. 1982. Use of C18
reversed-phase liquid chromatography for the isolation of monoterpene
glycosides and nor-isoprenoid precursors from grape juice and wines.
J Chromatogr 235:471–480.
Winterhalter P. 1991. 1,1,6-Trimethyl-1,2-dihydronaphthalene (TDN) for-
mation in wine.1. Studies on the hydrolysis of 2,6,10,10-tetramethyl-1-
oxaspiro[4.5]dec-6-ene-2,8-diol rationalizing the origin of TDN and
related C13 norisoprenoids in Riesling wine. J Agric Food Chem 39:
1825–1829.
Winterhalter P, Sefton MA, Williams PJ. 1990. Two-dimensional GC-DCCC
analysis of the glycoconjugates of monoterpenes, norisoprenoids, and
shikimate-derived metabolites from Riesling wine. J Agric Food Chem
38:1041–1048.
Wong JW, Halverson CA. 1999. Multiresidue analysis of pesticides in wines
using C-18 solid-phase extraction and gas chromatography-mass
spectrometry. Am J Enol Vitic 50(4):435–442.
Wong JW, Webster MG, Halverson CA, Hengel MJ, Ngim KK, Ebeler SE.
2003. Multiresidue pesticide analysis in wines by solid-phase extraction
and capillary gas chromatography-mass spectrometric detection with
selective ion monitoring. J Agric Food Chem 51:1148–1161.
Wu J, Tragas C, Lord H, Pawliszyn J. 2002. Analysis of polar pesticides in
water and wine samples by automated in-tube solid-phase microextrac-
tion coupled with high-performance liquid chromatography-mass
spectrometry. J Chromatogr A 976:357–367.
Wynn NR, Cooper JF, Zheng SQ, Cabanis JC. 1993. Procymidone residues
determination in wine: Immuno-assays and mass detection-gas
chromatography. Bull de l’O.I.V. 749-750:551–557.
Yamagushi N. 1969. Studies on products of the browning reaction between
reducing sugars and amino-acids. Antioxidant activities of browning
reaction products and various reductones. J Food Sci Technol 16(4):
140–144.
Yamamoto S, Itano H, Kataoka H, Makita M. 1982. Gas-liquid chromato-
graphic method for analysis of Di- and polyamines in foods. J Agric
Food Chem 30(3):435–439.
Yamanaka T, Tsunoda K. 1994. Manufacture of flavour/taste improves for
foods and beverages. Kokai Tokkyo Koho, Patent JP 06, 293, 694.
Yamanaka T, Tsunoda K. 1995. Food/flavour improvement with aldehydes.
Kokai Tokkyo Koho, Patent JP 05, 316, 960.
Zambonin CG, Cilenti A, Palmisano F. 2002. Solid-phase microextraction
and gas chromatography-mass spectrometry for the rapid screening
of triazole residues in wines and strawberries. J Chromatogr A 967:
255–260.
Zimmer M, Otteneder H, Bierl I. 1992. Determination of methyl
isothiocyanate in wine. Weinwirtschaft Technik 3:10–11.
Zollner P, Leitner A, Luboki D, Cabrera K, Lindner W. 2000. Application of
a Chromolith SpeedROD RP-18e HPLC column: Determination of
ochratoxin A in different wines by high-performance liquid chromato-
graphy-tandem mass spectrometry. Chromatographia 52(11/12):818–
820.
GRAPE AND WINE CHEMISTRY &
Mass Spectrometry Reviews DOI 10.1002/mas 773
Riccardo Flamini graduated in Organic Chemistry at Padua University in 1994. After
earning his degree, he specialized in Chemical Synthesis at the Politecnico of Milan. Since
1996 he is a Research Scientist in Organic Chemistry at CRA, Viticulture Research Institute
as Chief of Chemistry Laboratory Staff. Since 2001 he is a Professor by contract of Quality
Control of Wine at the Agricultural Faculty of Padua University.
Annarita Panighel graduated in Chemistry at Padua University. She works as a Research
Scientist at the Chemistry Laboratory of CRA, Viticulture Research Institute.
& FLAMINI AND PANIGHEL
774 Mass Spectrometry Reviews DOI 10.1002/mas
Related Documents