MARSHALL PUBLIC SCHOOLS 2011-2012 MCA RESULTS

Marshall Public SchoolS 2011-2012 MCA Results
Feb 22, 2016
Marshall Public SchoolS 2011-2012 MCA Results. Demographics. AYP Information 2012 not available until August 30 th. MCA 2012 Reading Achievement Levels by Percent. Green = Strength (+2) White = Average Red = Concern (-2). MPS MCAII Reading Results Grades 3-8, 10. - PowerPoint PPT Presentation
Welcome message from author
This document is posted to help you gain knowledge. Please leave a comment to let me know what you think about it! Share it to your friends and learn new things together.
Transcript

MARSHALL PUBLIC SCHOOLS2011-2012 MCA RESULTS
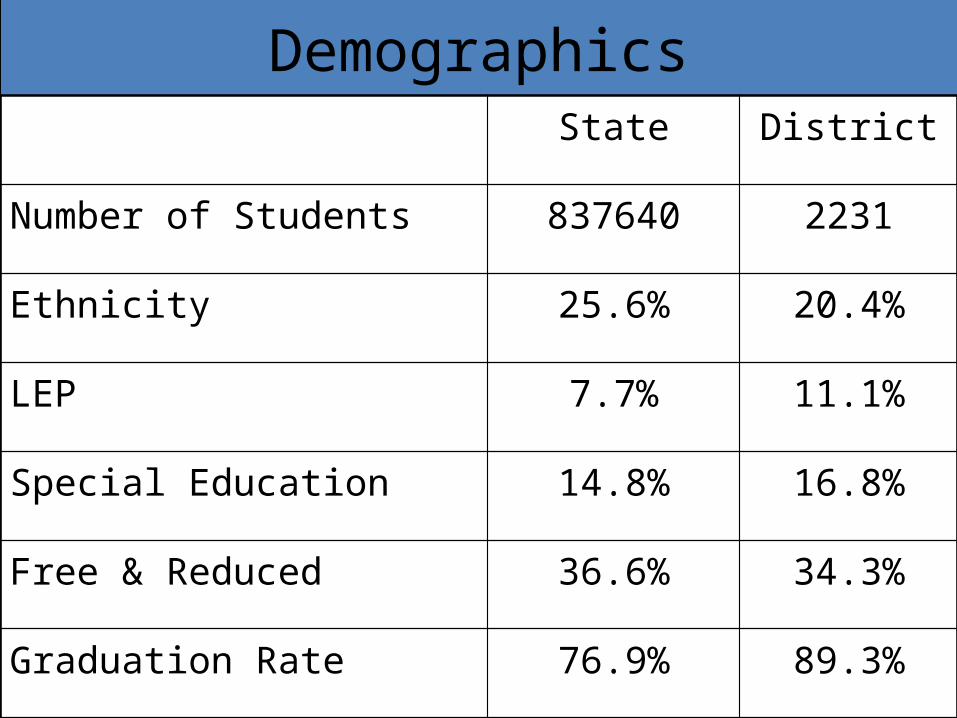
DemographicsState District
Number of Students 837640 2231
Ethnicity 25.6% 20.4%
LEP 7.7% 11.1%
Special Education 14.8% 16.8%
Free & Reduced 36.6% 34.3%
Graduation Rate 76.9% 89.3%

AYPInformation 2012not available until
August 30th

MCA 2012 ReadingAchievement Levels by Percent
Does Not MeetState / District
Partially Meets State / District
Meets State / District
Exceeds State / District
3rd 10.5 / 10 9.1/ 9.2 25.8 / 26.9 54.6/ 53.8
4th 10.3 / 11.9 14.4 / 14.4 31.2 / 29.4 44.1 / 44.4
5th 6.7 / 4.8 14 / 13.8 40 / 35.9 39.3 / 45.5
6th 7.8 / 6.8 15.9 / 18.8 33.9 /33.1 42.3 / 41.4
7th 10.7 / 6.3 17.8 /22 31.1 / 28.3 40.3 / 43.3
8th 10.7 /9.1 16.8/9.8 31.1 /32.2 41.3 /49
10th 7.1 /7.9 16.1 /12.9 42.4 /45.5 34.5 / 33.7
Green = Strength (+2) White = Average Red = Concern (-2)

MPS MCAIIReading Results
Grades 3-8, 10
MPS State 0
102030405060708090
100
76.7 76
2012 MPS MCA-II Reading Results

3RD GRADE READING Trend Data (2008-2012)
Sub-strands
2007-08 2008-09 2009-10 2010-11 2011-120
102030405060708090
100
3rd Gr. Reading-Sub Strands
VocabularyComprehensionLiterature
2007-08 2008-09 2009-10 2010-11 2011-12Vocabulary 79.2 83.38 87.81 77 85.7Comprehension 71.17 75.08 78.36 76.89 74.5Literature 72.19 79.46 79 75.07 74.6

3RD GRADE READING
Trend Data (2008-2012) Special Education
2007-08 2008-09 2009-10 2010-11 2011-120
102030405060708090
100
5055.55
40 40 40
85.47 82.9290
84 88.2
3rd Gr.-SPED
SPEDNon-SPED

3RD GRADE READING
Trend Data (2008-2012) Free & Reduced
2007-08 2008-09 2009-10 2010-11 2011-120
102030405060708090
100
68.9663.46
69.3863.76
75
88.6 88.76 90.09 88.23 85.7
Gr. 3 Reading-FRP
FRPNon-FRP
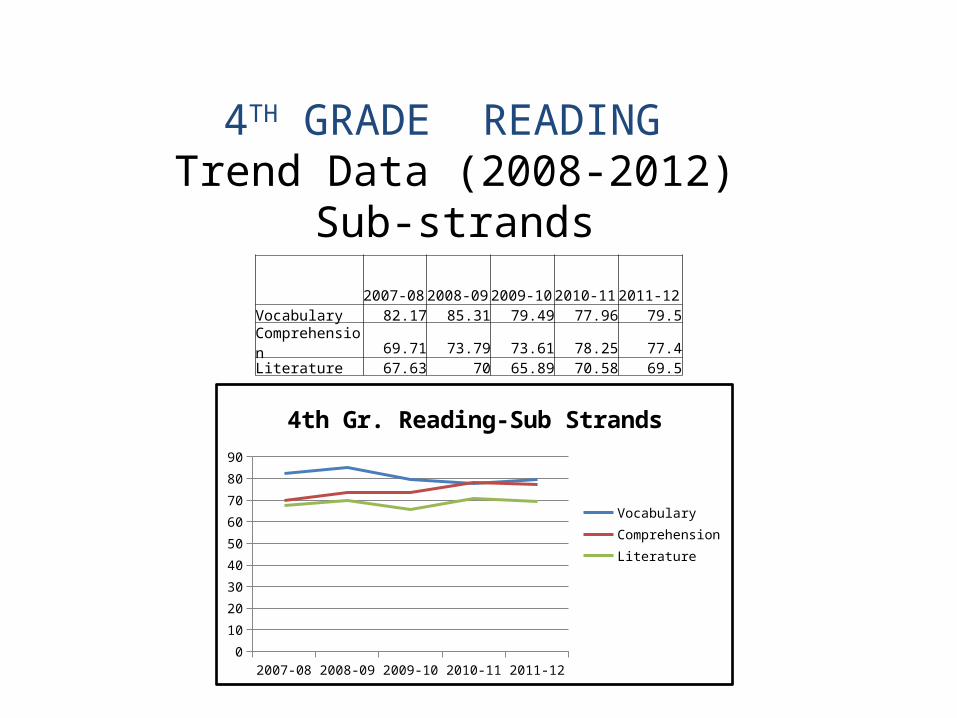
4TH GRADE READING Trend Data (2008-2012)
Sub-strands
2007-08 2008-09 2009-10 2010-11 2011-120
10
20
30
40
50
60
70
80
90
4th Gr. Reading-Sub Strands
VocabularyComprehensionLiterature
2007-08 2008-09 2009-10 2010-11 2011-12Vocabulary 82.17 85.31 79.49 77.96 79.5Comprehension 69.71 73.79 73.61 78.25 77.4Literature 67.63 70 65.89 70.58 69.5

4TH GRADE READING
Trend Data (2008-2012)Special Education
2007-08 2008-09 2009-10 2010-11 2011-120
10
2030
4050
60
7080
90
30.43
80
62.5
44.4 46.7
81.66 78.26
65.51
80.6 80
4th Gr.-SPED
SPEDNon-SPED

4TH GRADE READING
Trend Data (2008-2012)Free & Reduced
2007-08 2008-09 2009-10 2010-11 2011-120
102030405060708090
100
56.2566
50.98 51.0655.6
82.1 85.88
73.03
87.61 88.6
Gr. 4 Reading-FRP
FRPNon-FRP
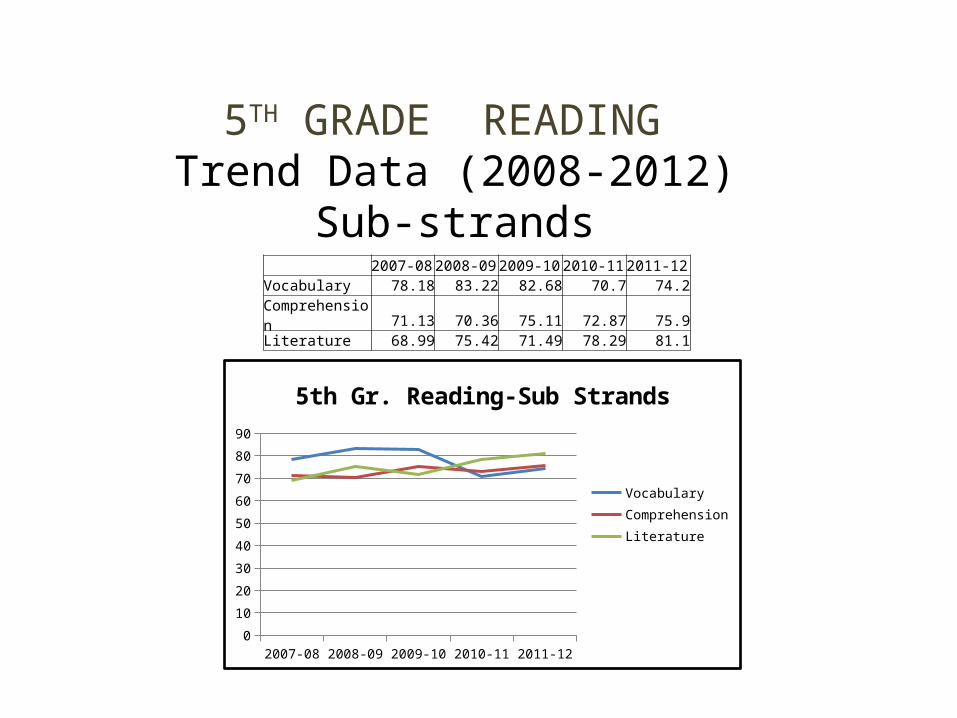
5TH GRADE READING Trend Data (2008-2012)
Sub-strands
2007-08 2008-09 2009-10 2010-11 2011-120
10
20
30
40
50
60
70
80
90
5th Gr. Reading-Sub Strands
VocabularyComprehensionLiterature
2007-08 2008-09 2009-10 2010-11 2011-12Vocabulary 78.18 83.22 82.68 70.7 74.2Comprehension 71.13 70.36 75.11 72.87 75.9Literature 68.99 75.42 71.49 78.29 81.1

5TH GRADE READING
Trend Data (2008-2012)Special Education
2007-08 2008-09 2009-10 2010-11 2011-120
10
2030
4050
60
7080
90
13.33
35
47.8254.1
66.6
81.45 85.2480.76 84.1 83
5th Gr.-SPED
SPEDNon-SPED

5TH GRADE READING
Trend Data (2007-2012)Free & Reduced
2007-08 2008-09 2009-10 2010-11 2011-120
102030405060708090
100
56 58.96 5864.8 66.7
84.2 85.4 85.8 87.2 88
Gr. 5 Reading-FRP
FRPNon-FRP

6TH GRADE READING Trend Data (2008-2012)
Sub-strands
2007-08 2008-09 2009-10 2010-11 2011-120
10
20
30
40
50
60
70
80
90
6th Gr. Reading-Sub Strands
VocabularyComprehensionLiterature
2007-08 2008-09 2009-10 2010-11 2011-12Vocabulary 81.09 81.13 77.11 77.18 78.9Comprehension 70.3 78.6 69.14 76.52 77.5Literature 61.31 76.13 79.95 69.9 83.4

6TH GRADE READING
Trend Data (2008-2012)Special Education
2007-08 2008-09 2009-10 2010-11 2011-120
102030405060708090
100
37.527.27 27.77
40 43.8
70
90.7580 81.9 78.6
6th Gr.-SPED
SPEDNon-SPED
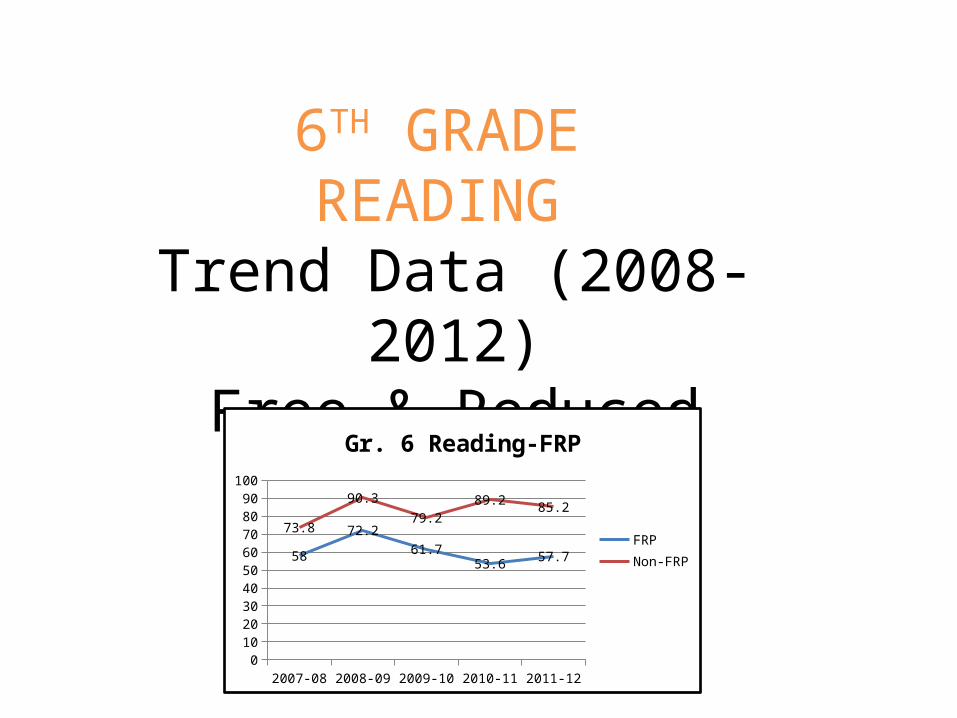
6TH GRADE READING
Trend Data (2008-2012)Free & Reduced
2007-08 2008-09 2009-10 2010-11 2011-120
102030405060708090
100
58
72.261.7
53.6 57.7
73.8
90.379.2
89.2 85.2
Gr. 6 Reading-FRP
FRPNon-FRP
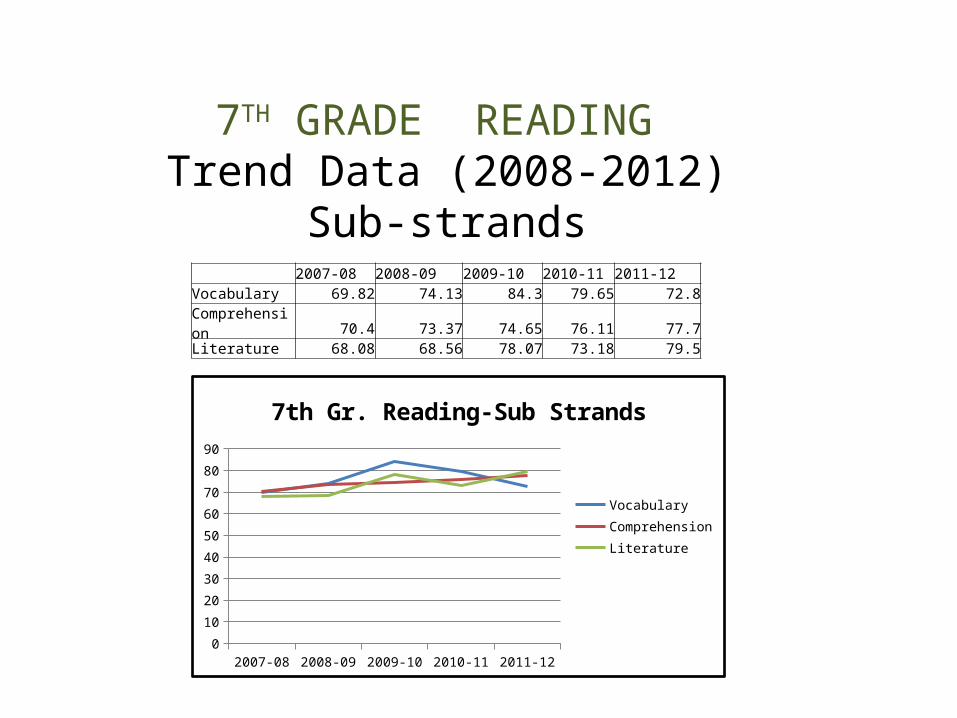
7TH GRADE READING Trend Data (2008-2012)
Sub-strands
2007-08 2008-09 2009-10 2010-11 2011-120
10
20
30
40
50
60
70
80
90
7th Gr. Reading-Sub Strands
VocabularyComprehensionLiterature
2007-08 2008-09 2009-10 2010-11 2011-12Vocabulary 69.82 74.13 84.3 79.65 72.8Comprehension 70.4 73.37 74.65 76.11 77.7Literature 68.08 68.56 78.07 73.18 79.5

7TH GRADE READING
Trend Data (2008-2012)Special Education
2007-08 2008-09 2009-10 2010-11 2011-120
10
2030
4050
60
7080
90
19.04
33.33 35.7127.8
46.6
65.3573.01
80.3485.2
75
7th Gr.-SPED
SPEDNon-SPED

7TH GRADE READING
Trend Data (2008-2012)Free & Reduced
2007-08 2008-09 2009-10 2010-11 2011-120
102030405060708090
100
47.1 48 47.554.6
50
64.9
80.2 83.688.4
81.8
Gr. 7 Reading-FRP
FRPNon-FRP
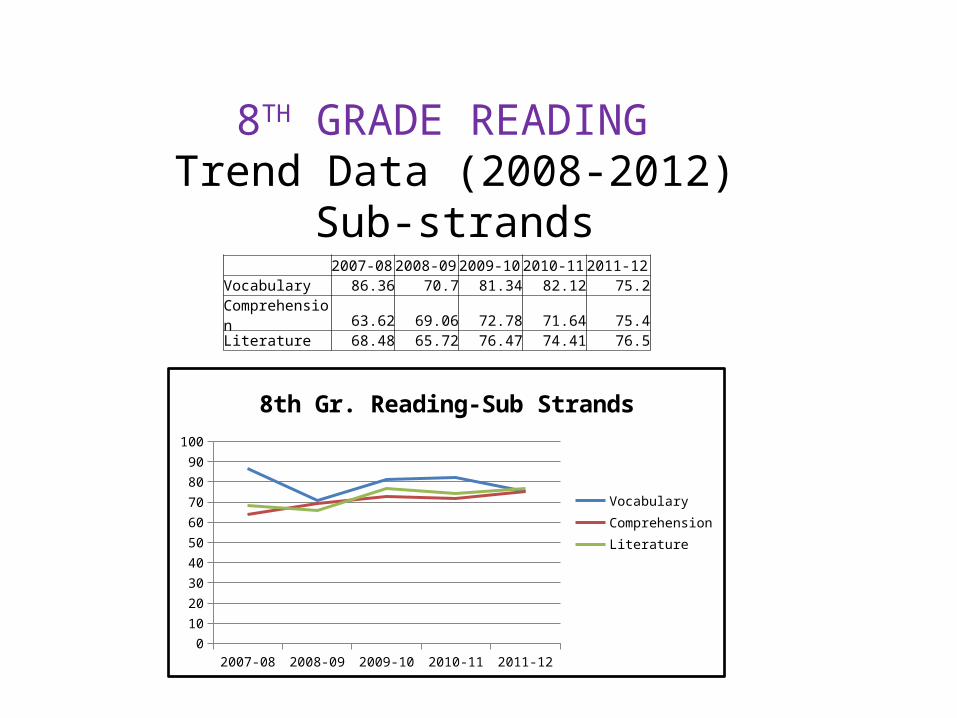
8TH GRADE READING Trend Data (2008-2012)
Sub-strands
2007-08 2008-09 2009-10 2010-11 2011-120
10
20
30
40
50
60
70
80
90
100
8th Gr. Reading-Sub Strands
VocabularyComprehensionLiterature
2007-08 2008-09 2009-10 2010-11 2011-12Vocabulary 86.36 70.7 81.34 82.12 75.2Comprehension 63.62 69.06 72.78 71.64 75.4Literature 68.48 65.72 76.47 74.41 76.5
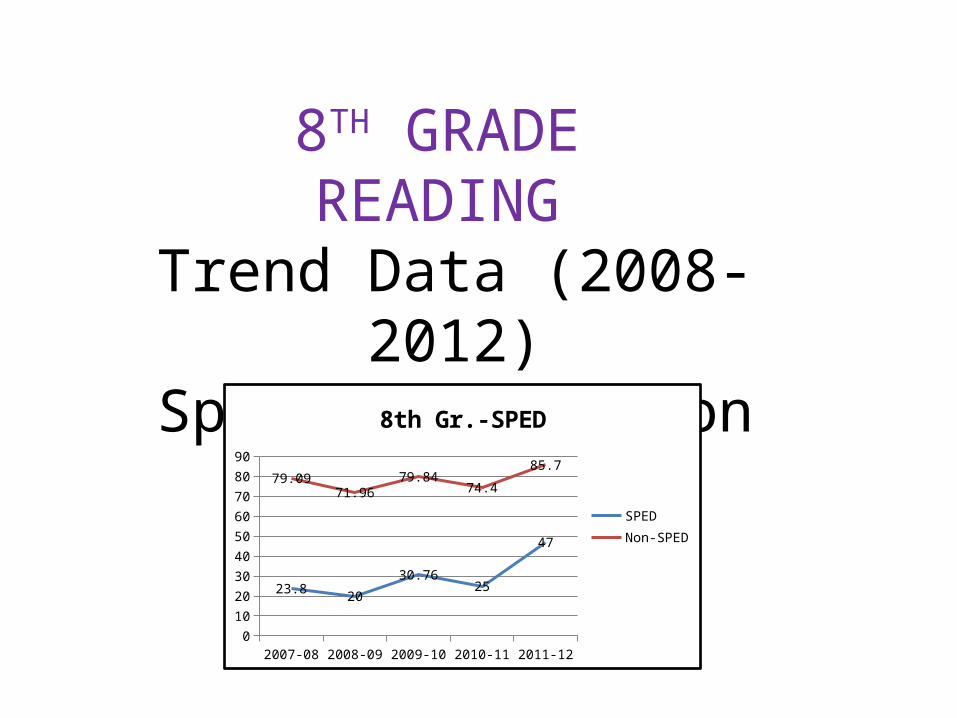
8TH GRADE READING
Trend Data (2008-2012)Special Education
2007-08 2008-09 2009-10 2010-11 2011-120
1020
30
4050
60
7080
90
23.8 20
30.7625
47
79.0971.96
79.8474.4
85.7
8th Gr.-SPED
SPEDNon-SPED

8TH GRADE READING
Trend Data (2008-2012)Free & Reduced
2007-08 2008-09 2009-10 2010-11 2011-120
102030405060708090
100
51 48.1
64.3
50
62.873.8 74
82.6 8089
Gr. 8 Reading-FRP
FRPNon-FRP
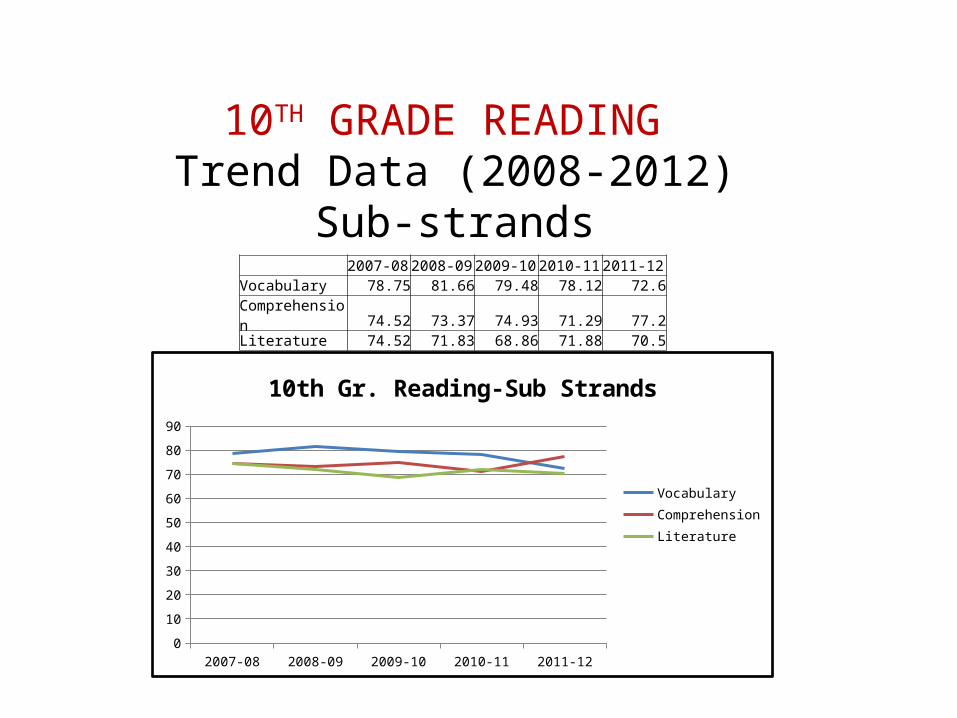
10TH GRADE READING Trend Data (2008-2012)
Sub-strands
2007-08 2008-09 2009-10 2010-11 2011-120
10
20
30
40
50
60
70
80
90
10th Gr. Reading-Sub Strands
VocabularyComprehensionLiterature
2007-08 2008-09 2009-10 2010-11 2011-12Vocabulary 78.75 81.66 79.48 78.12 72.6Comprehension 74.52 73.37 74.93 71.29 77.2Literature 74.52 71.83 68.86 71.88 70.5
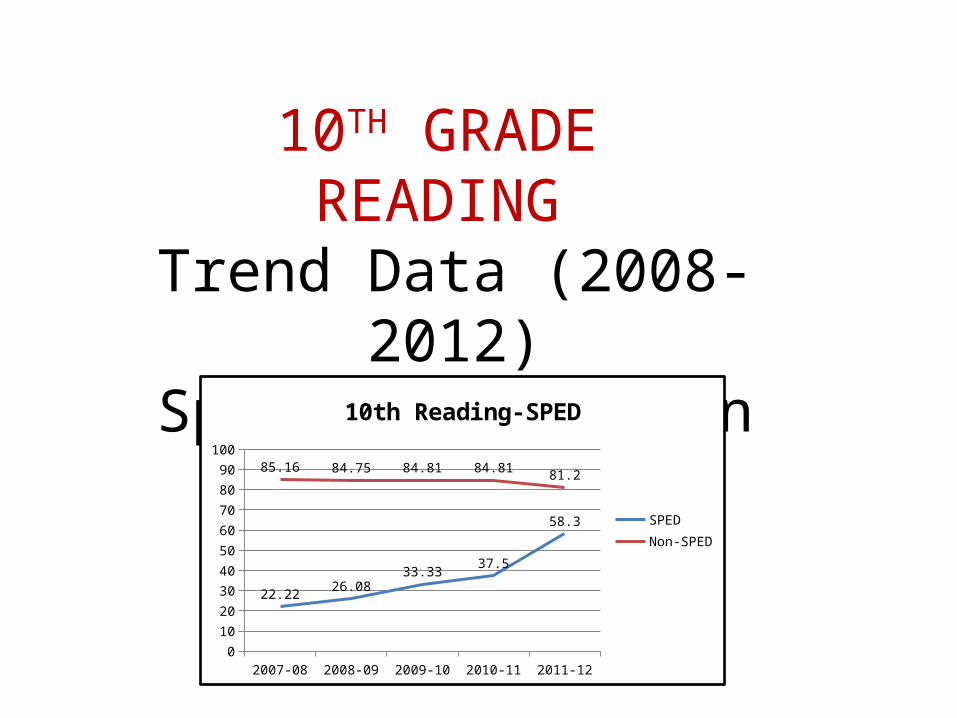
10TH GRADE READING
Trend Data (2008-2012)Special Education
2007-08 2008-09 2009-10 2010-11 2011-120
10
20
30
40
50
60
70
80
90
100
22.22 26.0833.33
37.5
58.3
85.16 84.75 84.81 84.81 81.2
10th Reading-SPED
SPEDNon-SPED

10TH GRADE READING
Trend Data (2008-2012)Free & Reduced
2007-08 2008-09 2009-10 2010-11 2011-120
102030405060708090
100
57.6948.83
63.4658.49
64.8
87.16 86.11 86.29 83 86.2
10th Reading-FRP
FRPNon-FRP

2005-06 2006-07 2007-08 2008-09 2009-10 2010-11 2011-120
10
20
30
40
50
60
70
80
90
100
71.7269.85
72.0475.33 75 74.69
76.6
61.18
48.88
56.81 56.4859.6
55.29
60.6658.82
43.22 42.37 43.22
48.5
40.94
50.03
77.77
73.33
84.78
78.37
67.7
74.41
57.89
64
37.5
46.42
57.89
52.1
47.29 47.56
72.8375.81
77.781.11 79.8
82.6684.32
26.49
18.18
27.77
39.5341.9
38.62
47.69
District Wide Reading Proficiency-MCA-IIPercent Proficient
AllEconomically DisadvantagedHispanicAsianBlackWhiteSPED

9TH GRADE WRITING Trend Data (2010-2012)
MPS Compared to the State 2010 2011 2012MPS 94.3 92.8 90.9State 90.6 89 91.9
2010 2011 20120
10
20
30
40
50
60
70
80
90
100
MPS Writing Test
MPSState

2012 MCA III MathAchievement Levels
Does Not MeetState / District
Partially Meets State / District
Meets State / District
Exceeds State / District
3rd 11.2 / 10.5 13.2 / 22.6 45.6 / 44.4 29.9 / 22.6
4th 13.1 / 18.2 13.6 / 15.1 41.9 / 45.9 31.4 / 20.8
5th 15.2 / 12.2 22.5/ 20.4 43.7 / 42.9 18.6 / 24.5
6th 17.2 / 12.4 22.9 / 29.2 39.3 / 39.4 20.5 / 19
7th 14.6 /11 26.8 /22.8 38.3 /36.2 20.3 /29.9
8th 15.3 / 4.9 22.7 / 7.7 37.6 /32.9 24.4/54.5
11th
(MCA II) 34.5 /41 23 /22.1 24.1 /21.7 18.4 /15.2
Green = Strength White = Average Red = Concern

MPS MCAII (Grade 11) &
MCAIII (Grades
3-8)Math
ResultsMPS State
0102030405060708090
100
68.9 65.4
2012 MPS MCA III Math Results
MPS State0
102030405060708090
100
36.9 42.5
2012 MPS MCA II Math Results

3RD GRADE MATH
MCA III - Sub-strandsTrend Data (2011-2012)
Algebra Data Analysis Geometry & Measurement
Number & Operations
0
1
2
3
4
5
6
4.71
5.57
4.544.92
4.2
5.14 5.024.47
Math Average Strand Scale Score-Gr.3
20112012
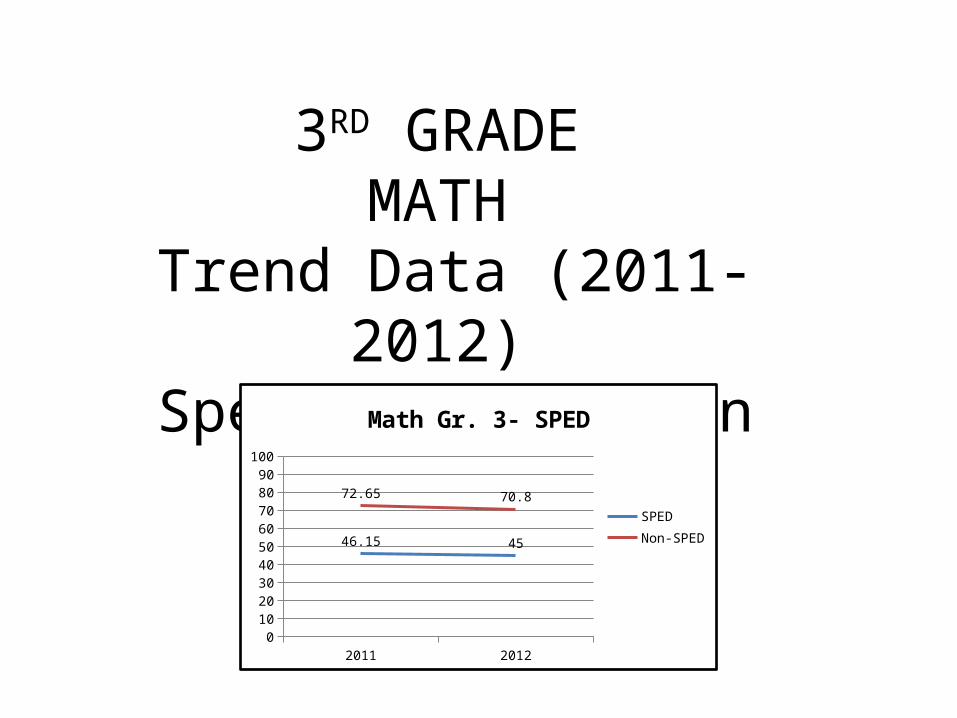
3RD GRADE MATH
Trend Data (2011-2012) Special Education
2011 20120
102030405060708090
100
46.15 45
72.65 70.8
Math Gr. 3- SPED
SPEDNon-SPED

3RD GRADE MATH
Trend Data (2011-2012)Free & Reduced
2011 20120
102030405060708090
100
49.3 50.8
83.5 81.4
Math Gr. 3- FRP
FRPNon-FRP
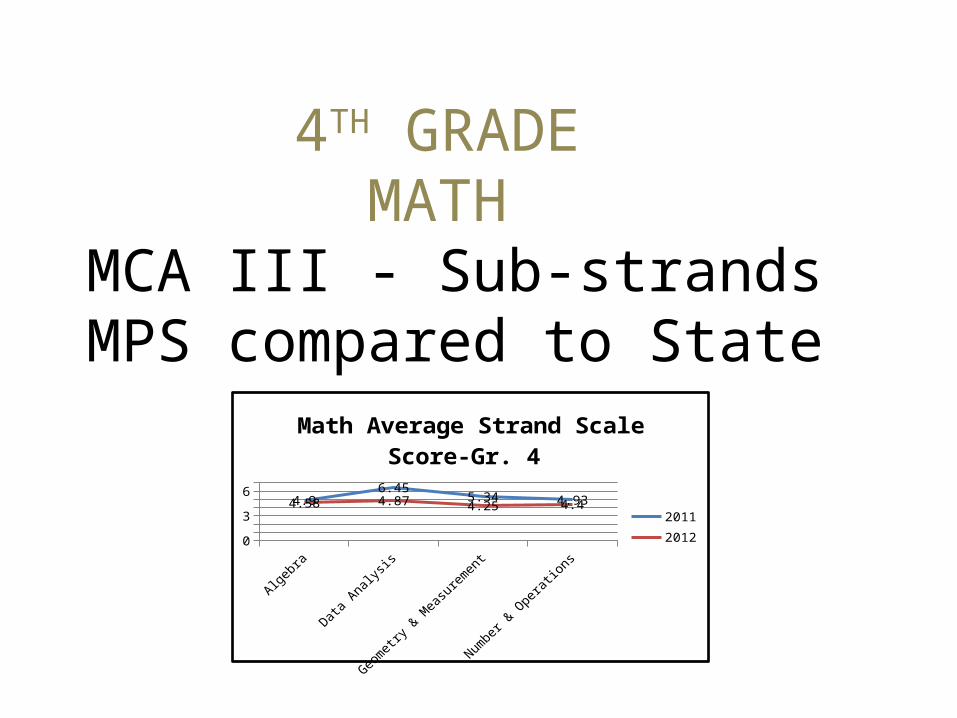
4TH GRADE MATH
MCA III - Sub-strandsMPS compared to State
Algebra Data Analysis Geometry & Measurement
Number & Operations
0
1
2
3
4
5
6
7
4.9
6.45
5.344.934.58 4.87
4.25 4.4
Math Average Strand Scale Score-Gr. 4
20112012

4TH GRADE MATH
Trend Data (2011-2012) Special Education
2011 20120
102030405060708090
100
47.36
35.5
74.43 74.2
Math Gr. 4- SPED
SPEDNon-SPED

4TH GRADE MATH
Trend Data (2011-2012) Free & Reduced
2011 20120
102030405060708090
100
48.93 52.8
80.95 78.2
Math Gr. 4- FRP
FRPNon-FRP

5TH GRADE MATH
MCA III - Sub-strandsTrend Data (2011-2012)
Algebra Data Analysis Geometry & Measurement
Number & Operations
0
1
2
3
4
5
64.76 4.56 4.85
4.34
5.32 5.36 5.29 5.46
Math Average Strand Scale Score-Gr. 5
20112012

5TH GRADE MATH
Trend Data (2011-2012)Special Education
2011 20120
102030405060708090
100
37.5
68.8
44.64
67.2
Math Gr. 5- SPED
SPEDNon-SPED

5TH GRADE MATH
Trend Data (2011-2012)Free & Reduced
2011 20120
102030405060708090
100
22
46.855.81
77
Math Gr. 5- FRP
FRPNon-FRP

6TH GRADE MATH
MCA III - Sub-strandsTrend Data (2011-2012)
Algebra Data Analysis Geometry & Measurement
Number & Operations
0
1
2
3
4
5
6
5.14 5.464.92 4.98
5.42 5.34 5.46 5.15
Math Average Strand ScaleScore-Gr. 6
20112012

6TH GRADE MATH
Trend Data (2011-2012)Special Education
2011 20120
102030405060708090
100
28
47.458.09 60.2
Math Gr. 6- SPED
SPEDNon-SPED

6TH GRADE MATH
Trend Data (2011-2012)Free & Reduced
2011 20120
102030405060708090
100
21.42
37.7
75.67 71.4
Math Gr. 6- FRP
FRPNon-FRP
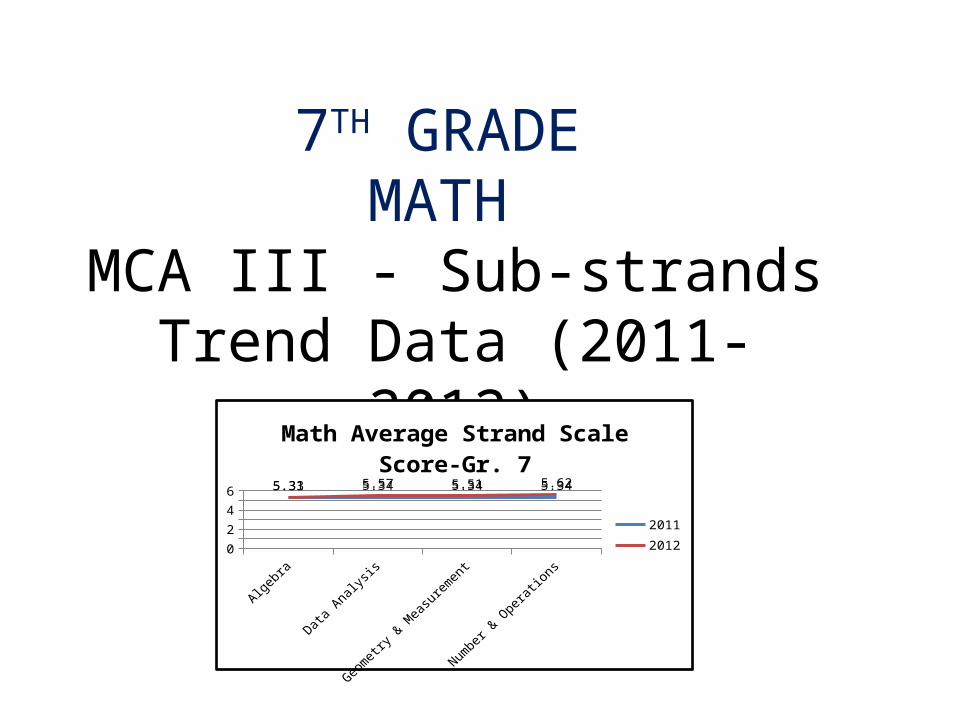
7TH GRADE MATH
MCA III - Sub-strandsTrend Data (2011-2012)
Algebra Data Analysis Geometry & Measurement
Number & Operations
0
1
2
3
4
5
6 5.33 5.34 5.34 5.345.31 5.57 5.51 5.62
Math Average Strand ScaleScore-Gr. 7
20112012

7TH GRADE MATH
Trend Data (2011-2012)Special Education
2011 20120
102030405060708090
100
16.66
42.9
71.31 69
Math Gr. 7- SPED
SPEDNon-SPED
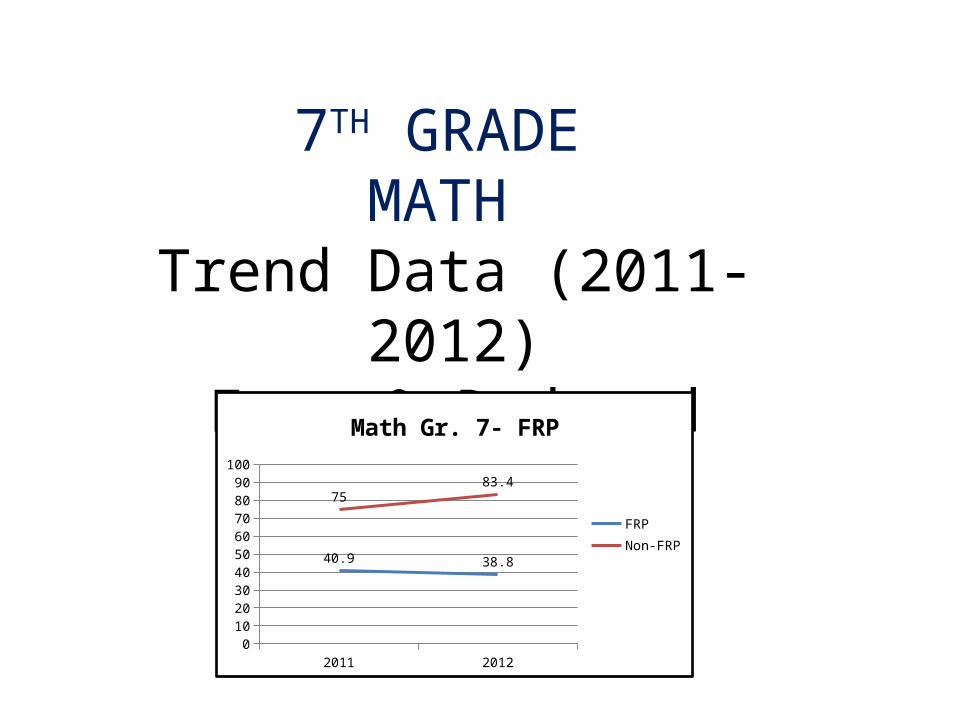
7TH GRADE MATH
Trend Data (2011-2012)Free & Reduced
2011 20120
102030405060708090
100
40.9 38.8
7583.4
Math Gr. 7- FRP
FRPNon-FRP

8TH GRADE MATH
MCA III - Sub-strandsTrend Data (2011-2012)
Algebra Data Analysis Geometry & Measurement
Number & Operations
0
1
2
3
4
5
6
7
5.33 5.34 5.34 5.34
6.55.72
6.736.21
Math Average Strand ScaleScore- Gr. 8
20112012

8TH GRADE MATH
Trend Data (2011-2012)Special Education
2011 20120
102030405060708090
100
31.25 27.8
82.2
96
Math Gr. 8- SPED
SPEDNon-SPED
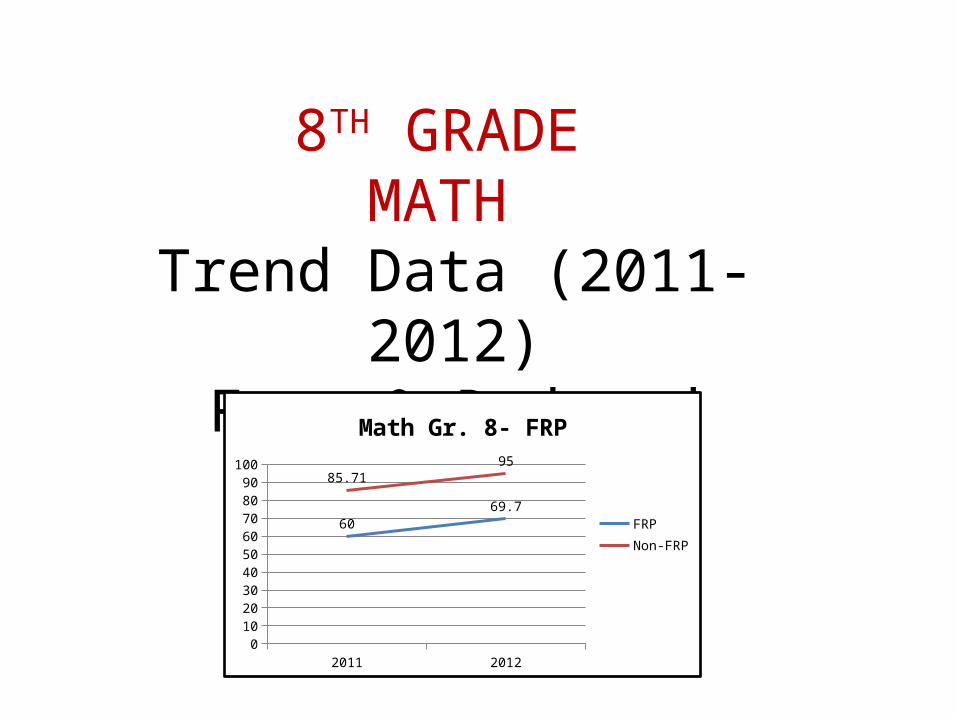
8TH GRADE MATH
Trend Data (2011-2012)Free & Reduced
2011 20120
102030405060708090
100
6069.7
85.7195
Math Gr. 8- FRP
FRPNon-FRP

11TH GRADE MATH
Trend Data (2008-2012)Sub-strands
2007-08 2008-09 2009-10 2010-11 2011-120
102030405060708090
100
Average Percent of Points Earned
Patterns, Functions and Al-gebra StrandData, Statistics & Probability StrandSpatial Sense, Geometry & Measurement Strand
2007-08 2008-09 2009-10 2010-11 2011-12Patterns, Functions and Algebra Strand 56.2 58.7 60 57.2 70.1Data, Statistics & Probability Strand 48 63.3 57.5 55.94 54.6Spatial Sense, Geometry & Measurement Strand 50.8 52.1 54.5 54.68 58.5

11TH GRADE MATH
Trend Data (2008-2012)Special Education
2007 2008 2009 2010 20120
10
20
30
40
50
60
70
80
90
100
0 05
11.115.6
40.4249.7 49.7 50.3
39.7
11th Math-SPED
SPEDNon-SPED

11TH GRADE MATH
Trend Data (2008-2012)Free & Reduced
2007 2008 2009 2010 20120
10
20
30
40
50
60
70
80
90
100
21.4
37.8
28.1 25.53
13.4
40.548 48.2
54.1645.9
11th Math-FRP
FRPNon-FRP

MPS MCAII (Grade 11) & MCAIII (Grades 3-8)
Math Trend Data
2011 20120
10
20
30
40
50
60
70
80
90
100
42.7836.9
62.8968.9
MCA II and MCA III Math Trend Data
MCA IIMCA III

Science Results will
be released in September

Questions?
Related Documents