pubs.acs.org/JAFC Published on Web 12/16/2010 © 2010 American Chemical Society J. Agric. Food Chem. 2011, 59, 747–754 747 DOI:10.1021/jf1038426 Lipid Fatty Acid Profile Analyses in Liver and Serum in Rats with Nonalcoholic Steatohepatitis Using Improved Gas Chromatography-Mass Spectrometry Methodology XIANLI WU,* ,†,‡ YUDONG TONG, †,‡ KARTIK SHANKAR, †,§ JANUARY N. BAUMGARDNER, †, ) JIE KANG, †,‡ JAMIE BADEAUX, † THOMAS M. BADGER, †,‡,§ AND MARTIN J. J. RONIS †,§, ) † Arkansas Children’s Nutrition Center, ‡ Department of Physiology and Biophysics, § Department of Pediatrics, and ) Department of Pharmacology and Toxicology, University of Arkansas for Medical Sciences, 15 Children’s Way, Little Rock, Arkansas 72202, United States Fatty acids (FAs) are essential components of lipids and exhibit important biological functions. The analyses of FAs are routinely carried out by gas chromatography-mass spectrometry after multistep sample preparation. In this study, several key experimental factors were carefully examined, validated, and optimized to analyze free fatty acid (FFA) and FA profiles of triglycerides and phospholipids in serum or tissue samples. These factors included (1) methylation/transesterification reagents, (2) validation of internal standards, and (3) final step concentration of FA methyl esters. This new method was utilized to analyze FFAs and the FA profiles of triglycerides and phospholipids in the serum and liver from a recently established rat model of nonalcoholic steatohepatitis (NASH). In this model, rats were fed a 220 kcal kg -3/4 day -1 diet containing either 5 or 70% corn oil for 21 days using total enteral nutrition. FA compositions of the serum and liver were found to shift from a pattern dominated by saturated and monounsaturated FAs (C16:0/18:1) to one dominated by polyunsaturated C18:2 derived from dietary linoleic acid. Alteration of FA composition in liver after overfeeding of high polyunsaturated fat diets may contribute to the progression of pathological changes from steatosis to inflammation, necrosis, and fibrosis observed in NASH. KEYWORDS: GC/MS; fatty acid; NASH; triglyceride; phospholipid; liver INTRODUCTION Fatty acids (FAs) are essential components of lipids and exhibit important biological functions in various tissues. As principle components in membranes, the chain length, degree of saturation, and other structural features of fatty acids are determinants of the physicochemical properties of biological membranes. In recent years, FAs have been suggested to play important roles in intracellular signaling. Free fatty acids (FFAs), their acyl Co-A esters, and metabolites have been implicated as intracellular signaling molecules involved in turning on nuclear receptors such as the peroxisome proliferator activator receptors (PPARs), which regulate lipid and carbohydrate metabolism, transport, and cellular proliferation ( 1 -3 ). Lipid peroxidation product protein adducts may disrupt normal protein function and contribute to cellular injury, which have been shown to be associated with triglyceride (TG) lipid droplets in liver cells ( 4 , 5 ). Different FA compositions of TGs may change the size of the droplet and the nature of associated proteins or adducts and thus change signaling pathways ( 6 ). Phospholipids (PLs) constitute ∼60% of the lipid mass of an eukaryotic cell membrane ( 7 ). FA analysis of PLs, especially in mitochondrial membranes, may also provide clues to mechanisms of cellular injury. In one report, the more unsaturated the FAs in the lipids are, the more likely reactive oxygen species species will perpetuate in membranes and cause mitochondrial permeability leading to apoptosis/necrosis ( 8 ). In light of these new findings, the analysis of FA profiles in tissues has become increasingly important as end points in under- standing the roles of FAs in physiological or pathological processes. The conventional method for such analysis typically consists of lipid extraction, lipid class segregation, esterification of FAs, chromatographic separation, sequential mass spectro- metric identification, and quantitation of the FA esters. For this laborious multistep procedure, each step must be optimized and carefully conducted to achieve optimal results ( 9 ). There are only a few papers published that analyzed FFAs and FA profiles in TGs and PLs in animal tissues ( 10-12 ). None of them carefully validated their methods. We had observed sig- nificant variation among samples and replicates using unvali- dated methods, in which some very important factors were either neglected or not validated. For instance, the recovery tests were rarely conducted to evaluate the completeness or loss during sample preparation. Moreover, analyzing whole FA profiles, ranging from short to long chain, saturated to polyunsaturated, is very different from analyzing one or several targeted FAs. Short-chain FA methyl esters (FAMEs) are more volatile than *To whom correspondence should be addressed. Tel: 501-364-2813. Fax: 501-364-3161. E-mail: [email protected].

Welcome message from author
This document is posted to help you gain knowledge. Please leave a comment to let me know what you think about it! Share it to your friends and learn new things together.
Transcript
pubs.acs.org/JAFCPublished on Web 12/16/2010© 2010 American Chemical Society
J. Agric. Food Chem. 2011, 59, 747–754 747
DOI:10.1021/jf1038426
Lipid Fatty Acid Profile Analyses in Liver and Serum in Ratswith Nonalcoholic Steatohepatitis Using Improved GasChromatography-Mass Spectrometry Methodology
XIANLI WU,*,†,‡ YUDONG TONG,†,‡ KARTIK SHANKAR,†,§
JANUARY N. BAUMGARDNER,†, ) JIE KANG,†,‡ JAMIE BADEAUX,†
THOMAS M. BADGER,†,‡,§ AND MARTIN J. J. RONIS†,§, )
†Arkansas Children’s Nutrition Center, ‡Department of Physiology and Biophysics,§Department of Pediatrics, and )Department of Pharmacology and Toxicology, University of Arkansas
for Medical Sciences, 15 Children’s Way, Little Rock, Arkansas 72202, United States
Fatty acids (FAs) are essential components of lipids and exhibit important biological functions. The
analyses of FAs are routinely carried out by gas chromatography-mass spectrometry after multistep
sample preparation. In this study, several key experimental factors were carefully examined, validated,
and optimized to analyze free fatty acid (FFA) and FA profiles of triglycerides and phospholipids in
serum or tissue samples. These factors included (1) methylation/transesterification reagents, (2)
validation of internal standards, and (3) final step concentration of FA methyl esters. This new
method was utilized to analyze FFAs and the FA profiles of triglycerides and phospholipids in the
serum and liver from a recently established rat model of nonalcoholic steatohepatitis (NASH). In this
model, rats were fed a 220 kcal kg -3/4 day -1 diet containing either 5 or 70% corn oil for 21 days
using total enteral nutrition. FA compositions of the serum and liver were found to shift from a
pattern dominated by saturated and monounsaturated FAs (C16:0/18:1) to one dominated by
polyunsaturated C18:2 derived from dietary linoleic acid. Alteration of FA composition in liver after
overfeeding of high polyunsaturated fat diets may contribute to the progression of pathological
changes from steatosis to inflammation, necrosis, and fibrosis observed in NASH.
KEYWORDS: GC/MS; fatty acid; NASH; triglyceride; phospholipid; liver
INTRODUCTION
Fatty acids (FAs) are essential components of lipids andexhibit important biological functions in various tissues. Asprinciple components in membranes, the chain length, degree ofsaturation, and other structural features of fatty acids aredeterminants of the physicochemical properties of biologicalmembranes. In recent years, FAs have been suggested to playimportant roles in intracellular signaling. Free fatty acids (FFAs),their acyl Co-A esters, and metabolites have been implicated asintracellular signaling molecules involved in turning on nuclearreceptors such as the peroxisome proliferator activator receptors(PPARs), which regulate lipid and carbohydrate metabolism,transport, and cellular proliferation (1-3). Lipid peroxidationproduct protein adductsmaydisrupt normal protein functionandcontribute to cellular injury, which have been shown to beassociated with triglyceride (TG) lipid droplets in liver cells (4,5).Different FA compositions of TGs may change the size of thedroplet and the nature of associated proteins or adducts and thuschange signaling pathways (6). Phospholipids (PLs) constitute∼60% of the lipid mass of an eukaryotic cell membrane (7). FAanalysis of PLs, especially inmitochondrial membranes,may also
provide clues to mechanisms of cellular injury. In one report, themore unsaturated the FAs in the lipids are, the more likelyreactive oxygen species species will perpetuate in membranes andcause mitochondrial permeability leading to apoptosis/necrosis (8).
In light of these new findings, the analysis of FA profiles intissues has become increasingly important as end points in under-standing the roles of FAs in physiological or pathologicalprocesses. The conventional method for such analysis typicallyconsists of lipid extraction, lipid class segregation, esterificationof FAs, chromatographic separation, sequential mass spectro-metric identification, and quantitation of the FA esters. For thislaborious multistep procedure, each step must be optimized andcarefully conducted to achieve optimal results (9).
There are only a few papers published that analyzed FFAs andFA profiles in TGs and PLs in animal tissues (10-12). None ofthem carefully validated their methods. We had observed sig-nificant variation among samples and replicates using unvali-dated methods, in which some very important factors were eitherneglected or not validated. For instance, the recovery tests wererarely conducted to evaluate the completeness or loss duringsample preparation. Moreover, analyzing whole FA profiles,ranging from short to long chain, saturated to polyunsaturated,is very different from analyzing one or several targeted FAs.Short-chain FA methyl esters (FAMEs) are more volatile than
*To whom correspondence should be addressed. Tel: 501-364-2813.Fax: 501-364-3161. E-mail: [email protected].
748 J. Agric. Food Chem., Vol. 59, No. 2, 2011 Wu et al.
long-chain FA methyl esters. Without a proper sample handlingstrategy, the majority of short-chain FAMEs may be lost duringesterification and following drying-out steps (13).
The first objective of the present study was to optimize severalkey factors in analyzing FFA and FA profiles of lipids in tissuesamples, primarily in liver. Because the theory and generalprocedures of FA analysis have been well established (7 , 9 ,14-16), we focused on several practical aspects including: (1)methylationor transesterification reagents, (2) validationof internalstandards (ISs), and (3) last step solvent evaporation of FAMEs.
Using the validated method, FFA and FA profiles of TG andPL in serum and liver from a recently established rat model ofnonalcoholic steatohepatitis (NASH)were analyzed (17).Althoughvarious pathological, biochemical, and molecular parameters ofthis NASHmodel have been published (17), the FA profiles haveawaited improvement of analytical techniques. The current studywas designed to fill this gap and provide insights into the role ofdietary polyunsaturated FAs (PUFAs) in the progression of thepathological changes in this model.
MATERIALS AND METHODS
Chemicals and Reagents. Thirty-seven FAME standards, glyceryltriheptadecanoate (C17:0 TG), tricosanoic acid (C23:0), heptadecenoicacid (C17:1), nonanoic acid (C9:0), pentadecanoic acid (C15:0), hepade-canoic acid (C17:0), nonadecanoic acid (C19:0), tricosanoic acid (C23:0),cis-10-hepadecanoic acid (C17:1), and FAMEs of C9:0, C15:0, C17:0,C19:0, C23:0, and C17:1 were purchased from Sigma-Aldrich (St. Louis,MO). Nonadecatrienoic acid (C19:3), tricosapentaenoic acid (C23:5), andtheirmethyl esters were purchased fromLaredanFineChemicals (Malmo,Sweden). 1,2-Dinonadecanoyl-sn-clycero-3-phospholine (C19:0 PC) waspurchased from Avanti Polar Lipids (Alabaster, AL). Sulfuric acid(99.999%), heptane, sodium hydroxide, anhydrous methanol (MeOH),and boron trifluoride methanol solution (14%) were also purchased fromSigma-Aldrich. All other reagents were high-performance liquid chroma-tography (HPLC) grade. Chloroform, ethanol, hexane, acetic acid,ethanolic phosphomolybdic acid, and ethyl ether were purchased fromFisher Scientific (Pittsburgh, PA). The IS solutions were made in CHCl3with a concentration of 1 μg/μL and an aliquot in a HPLC vial and storedat -20 �C. Thin-layer chromatography (TLC) plates (Partisil LK6DFSilica Gel 60 A, 20 cm � 20 cm, 200 μm) were obtained from Whatman(Maidstone, England). Ethanolic phosphomolybdic acid (20%; v/v) waspurchased fromSigma-Aldrich.A 2%ethanolic sulfuric acid solution (2%H2SO4 3MeOH) was made by adding 2 mL of sulfuric acid (99.999%) into98 mL of anhydrous MeOH.
Gas Chromatography-Electron Ionization Mass Spectrometry
(GC/EI-MS). The gas chromatography/mass spectrometry system (GC/MS) consisted of a GC-2010 with a GC/MS-QP 2010 Mass Spectrometer
(Shimadzu, Kyoto, Japan). A Supelco SP-2340 fused silica capillarycolumn (30 m � 0.25 mm � 0.2 μm, Bellefonte, PA) was used, withtemperature gradients from 50 to 100 �C at 14 �C/min, then to 145 at 9 �C/min, then to 170 at 7 �C/min, and held for 3min, then to 185 at 4.75 �C/minand held for 1 min, then to 225 at 15 �C/min and held for 3.5 min. Thecarrier gas (helium) flow was 7.0 mL/min. Injector, ion source, andinterface temperatures were 250 �C. GC settings were as follows: injectionmode split; flow control mode linear velocity; pressure, 53.5 kPa; totalflow, 7.0 mL/min; linear velocity, 18.2 cm/s; purge flow, 1.0 mL/min; andsplit ratio, 5.0. Themass spectrumwas acquired from40 to 400m/zwith aninterval of 0.4 s, threshold of 100, and scan speed of 1000.
Compound Identification and Quantitation. FA peaks were identi-fied based on comparing retention times with external standards orsimilarity search. Quantitation was conducted by using the peak area ofthe most intensive ion of each peak. For recovery tests, quantitation wasmadeusing external standards.One set ofC9:0/C15:0/C17:0/C19:0/C23:0/C17:1/C19:3/C23:5mixed FAME standards was used to create a standardcurve for the recovery test.
For quantitation of FFAs and FA profiles in tissue samples, an ISmethod was used. Briefly, one set of FAME standards (37 FAME) wasused for peak identification and to generate a relative response factor(RRF) (14) for IS quantitation.
Tricosanoic acid (C23:0), glyceryl triheptadecanoate (C17:0 TG), and1,2-dinonadecanoyl-sn-clycero-3-phospholine (C19:0 PC) were used as ISsfor quantitation of FFAs and FA profiles in TG and PL, respectively,using the following equation:
MX ¼ MIðAX�=AI
�Þ 3 ðSAI 3CXÞ=ðSAX 3CIÞ
whereMI is themass of ISFA,MX is themass of target FA,AI* is the peakareaof ISFA (sample),AX* is the peakareaof unknownFA(sample), SAI
is the peak area of IS FA (standard), CX is the concentration of target FA(standard), SAX is the peak area of target FA (standard), and CI is theconcentration of IS FA (standard).
In this equation, (SAI 3CX)/(SAX 3CI) was also referred to as RRF,which reflects the different detector response to IS and the analyte. RRFswere determined by running known amounts of 37 FAME standards thatcontained IS FA.
Methylation/Transesterification. Two methods were used for com-parison.
Method 1.Twomilliliters of 2%H2SO4 3MeOHwas added to screw capglass tubes, containing FA standards or scraped silica gel. The tubes werepurged with N2, sealed with vortex, and transferred to a heating block for70 min at 80 �C. The reaction was terminated followed by the addition of500 μL of 1 N sodium hydroxide.
Method 2. Two milliliters of borontrifluoride (BF3) in MeOH (14%)(BF3 3MeOH) was added to screw cap glass tubes, containing FAstandards or scraped silica gel. The tube was purged with N2, sealed,vortexed, and transferred to a heating block for 60 min at 90 �C, and thereaction was terminated by placing the tubes on ice.
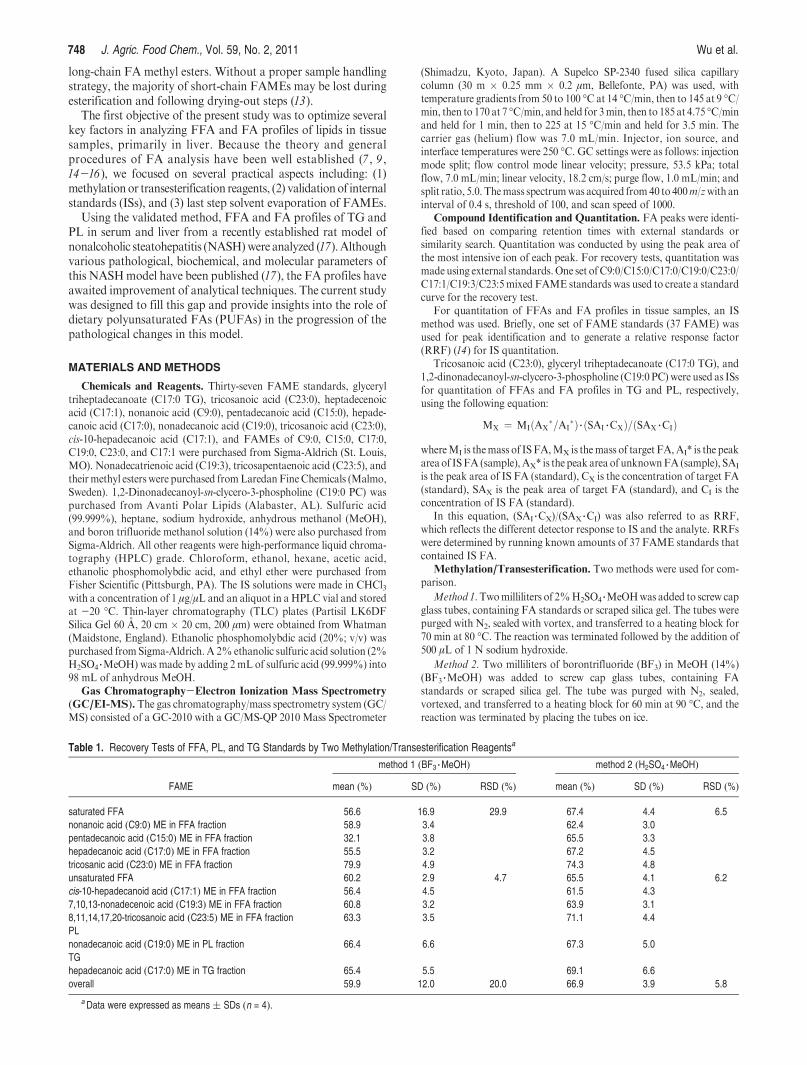
Table 1. Recovery Tests of FFA, PL, and TG Standards by Two Methylation/Transesterification Reagentsa
method 1 (BF3 3MeOH) method 2 (H2SO4 3MeOH)
FAME mean (%) SD (%) RSD (%) mean (%) SD (%) RSD (%)
saturated FFA 56.6 16.9 29.9 67.4 4.4 6.5
nonanoic acid (C9:0) ME in FFA fraction 58.9 3.4 62.4 3.0
pentadecanoic acid (C15:0) ME in FFA fraction 32.1 3.8 65.5 3.3
hepadecanoic acid (C17:0) ME in FFA fraction 55.5 3.2 67.2 4.5
tricosanic acid (C23:0) ME in FFA fraction 79.9 4.9 74.3 4.8
unsaturated FFA 60.2 2.9 4.7 65.5 4.1 6.2
cis-10-hepadecanoid acid (C17:1) ME in FFA fraction 56.4 4.5 61.5 4.3
7,10,13-nonadecenoic acid (C19:3) ME in FFA fraction 60.8 3.2 63.9 3.1
8,11,14,17,20-tricosanoic acid (C23:5) ME in FFA fraction 63.3 3.5 71.1 4.4
PL
nonadecanoic acid (C19:0) ME in PL fraction 66.4 6.6 67.3 5.0
TG
hepadecanoic acid (C17:0) ME in TG fraction 65.4 5.5 69.1 6.6
overall 59.9 12.0 20.0 66.9 3.9 5.8
aData were expressed as means ( SDs (n = 4).
Article J. Agric. Food Chem., Vol. 59, No. 2, 2011 749
Total FAMEs were extracted by heptane (1 mL � 3). The heptanelayers were combined, and the total volume was brought up to 3 mL withheptane for GC/MS.
Animals and Diets. Animals and Diets.Male Sprague-Dawley rats(175 g) were purchased fromHarlan Sprague-Dawley (Indianapolis, IN).Animals were housed in an Association for Assessment and Accreditationof LaboratoryAnimal Care (AAALAC) approved animal facility. Animalmaintenance and experimental treatments were conducted in accordancewith ethical guidelines for animal research and were approved by theInstitutional Animal Care and Use Committee at the University ofArkansas for Medical Sciences.
Rats were randomly assigned to two experimental groups before anintragastric cannula was surgically inserted and infused ig with water for7 days until presurgical weight returned. Thereafter, the rats were fed bytotal enteral nutrition (TEN) using previously published liquid dietcompositions (17). TEN rats were fed isocaloric 220 kcal kg -3/4 day -1
diets, which is 17% in excess of caloric intake recommended by theNational Research Council (17) . One group received a low-fat TEN dietcontaining 5% total calories as corn oil (CO), 79% carbohydrate calories(dextrose/maltodextrin), and 16% calories as protein (hydrolyzed whey),
while the second group received a high-fat TEN diet containing 70% totalcalories asCO, 14%carbohydrate calories, and 16%protein calories. Ratswere euthanized after 21 days of diet infusion, and serum and livers werecollected and stored at -70 �C until use.
Pathological Evaluation. Liver pathology was assessed by Oil RedO staining of liver sections according to the method describedpreviously (17 ).
Sample Preparation. Extraction of Total Lipids from Serum.Before extraction, 50 μL of C17:0 TG and 50 μL of C23:0 FFA (1 μg/μLfor both standards) were added as ISs. Total lipids were extracted withethyl ether (2 mL � 2) and dried under N2.
Extraction of Total Lipids from Liver. Liver homogenates wereextracted with chloroform-MeOH (2:1; v/v). Glyceryl triheptadecanoate(150 μg), C23 tricosanoic acid (100 μg), and 1,2-dinonadecanoyl-sn-clycero-3-phospholine (150 μg) were added into homogenates as ISs.The chloroform phase was collected and dried under N2.
Separation of Lipid Classes by TLC and Transesterification. Sampleswere reconstituted with chloroform and loaded onto TLC plates. Glyceryltriheptadecanoate, tricosanoic acid, and 1,2-dinonadecanoyl-sn-clycero-3-phospholine were also loaded as reference compounds. TLC plates weredeveloped with hexane:ether:acetic acid (60: 13: 0.65). A 20% ethanolicphosphomolybdic acid was sprayed onto the lane where the standard wasspotted, and the plate was heated for visualization. FFA,TG, and PLwerelocated based on theRf of the three reference compounds. Total FFA,TG,and PL spots were scraped and directly esterfied by sulfuric acid inMeOHor with boron-trifluoride-MeOH reagent (BF3-MeOH).
Last step Solvent EvaporationExperiment 1. C9:0 and C23:0 were dissolved in anhydrous MeOH and
directly esterified by sulfuric acid. After direct methylation, half of thesamples were extracted with heptane and directly analyzed by GC/MS.The other half was extracted with hexane followed by solvent evaporationunder N2. The residue was reconstituted with same volume of heptane forGC/MS analysis.
Experiment 2.C9:0, C23:0, C17:0 TG, andC19:0 PLwere spiked in liversamples, and FAMEs of C9:0, C23:0, C17:0, and C19:0 were prepared bythe above-mentioned method with sulfuric acid. Their recoveries werecalculated with and without last step solvent evaporation described inExperiment 1.
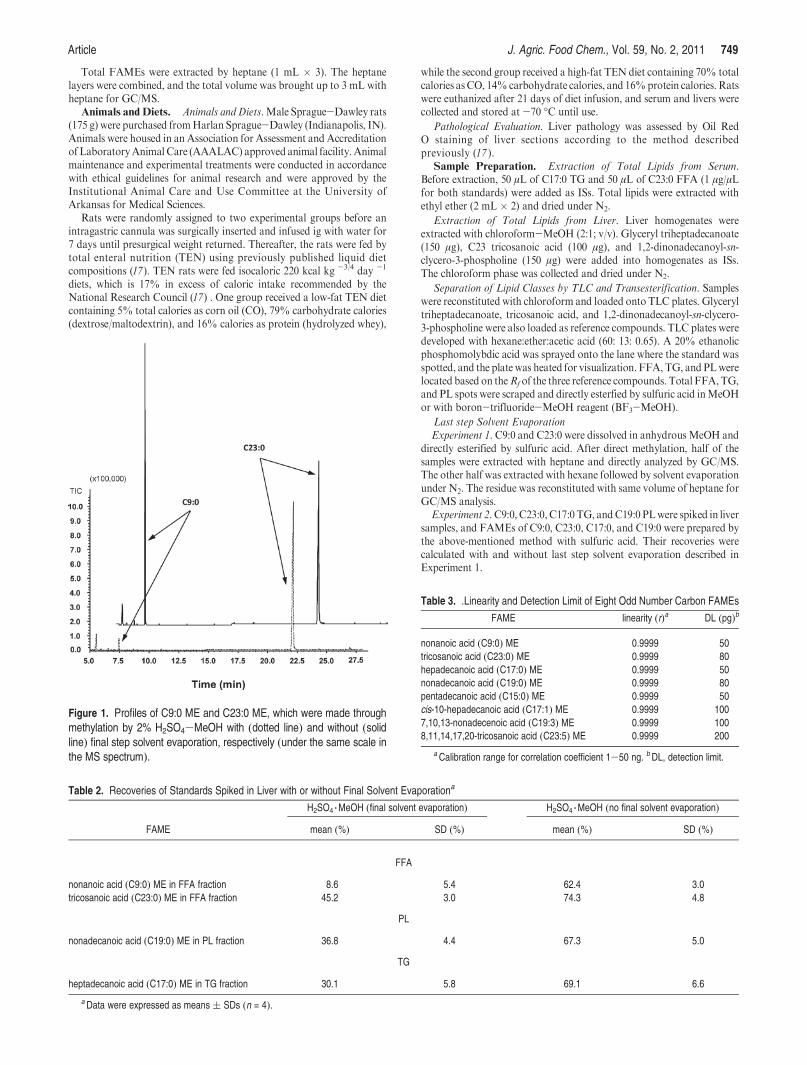
Figure 1. Profiles of C9:0 ME and C23:0 ME, which were made throughmethylation by 2% H2SO4-MeOH with (dotted line) and without (solidline) final step solvent evaporation, respectively (under the same scale inthe MS spectrum).
Table 3. .Linearity and Detection Limit of Eight Odd Number Carbon FAMEs
FAME linearity (r)a DL (pg)b
nonanoic acid (C9:0) ME 0.9999 50
tricosanoic acid (C23:0) ME 0.9999 80
hepadecanoic acid (C17:0) ME 0.9999 50
nonadecanoic acid (C19:0) ME 0.9999 80
pentadecanoic acid (C15:0) ME 0.9999 50
cis-10-hepadecanoic acid (C17:1) ME 0.9999 100
7,10,13-nonadecenoic acid (C19:3) ME 0.9999 100
8,11,14,17,20-tricosanoic acid (C23:5) ME 0.9999 200
aCalibration range for correlation coefficient 1-50 ng. bDL, detection limit.
Table 2. Recoveries of Standards Spiked in Liver with or without Final Solvent Evaporationa
H2SO4 3MeOH (final solvent evaporation) H2SO4 3MeOH (no final solvent evaporation)
FAME mean (%) SD (%) mean (%) SD (%)
FFA
nonanoic acid (C9:0) ME in FFA fraction 8.6 5.4 62.4 3.0
tricosanoic acid (C23:0) ME in FFA fraction 45.2 3.0 74.3 4.8
PL
nonadecanoic acid (C19:0) ME in PL fraction 36.8 4.4 67.3 5.0
TG
heptadecanoic acid (C17:0) ME in TG fraction 30.1 5.8 69.1 6.6
aData were expressed as means ( SDs (n = 4).
750 J. Agric. Food Chem., Vol. 59, No. 2, 2011 Wu et al.
Statistical Analysis. Data are expressed as means ( standard errorsof the mean (SEM). Student’s t test was used to analyze differencesbetween two groups. A value ofP<0.05was considered significant unlessotherwise mentioned. SigmaStat software package version 3.0 (SPSS,Chicago, IL) was used to perform all statistical tests.
RESULTS AND DISCUSSION
Validation of New GC/MS Method for Analysis of Lipid FA
Profiles. To be analyzed by GC, FAs must be converted intovolatile FA esters, in most cases, FAMEs. For lipids such as TGand PL, traditionally, this process includes two steps. First, theFAs are split off by saponification with sodium hydroxide orpotassium hydroxide and then methylated (12, 14). However,direct esterification of lipids (“alcoholysis”) proceeds far morerapidly than saponification, with hydrolysis and esterificationtaking place in one step (transesterification), which uses only onereagent. The methylation/transesterification reagent must becarefully selected to make sure that the majority of FFAs orFA chains of PL/TG are converted into FAME (14). Derivatiza-tion methods in preparing FAMEs have been well documented(12-14, 18). Two reagents, boron-trifluoride-MeOH reagent(BF3-MeOH) or acid-catalyzed reagents [in particularly, sulfuricacid-MeOH reagent (H2SO4-MeOH)], are the most widelyused (19). Both of them have been successfully used in methyla-tion of FFA, and BF3-MeOH has been used in transesterifica-tion of TGand PL (11,20). However, to our knowledge, there are
no studies employingH2SO4-MeOH in transesterification ofTGand PLof biological samples, and there are no studies to comparethe effectiveness of the two reagents in the methylation ofdifferent FFAs and transesterification of TG and PL. In thisstudy, these twomost widely usedmethylation/transesterificationreagents were compared for their effectiveness in making FAMEs.
Despite its popularity, BF3-MeOH has disadvantages. Thisreagent is highly hazardous, expensive, and has a limited shelf lifeeven when kept refrigerated, and deterioration can lead toartifacts. In our experiments, we found the formation of borontrimethoxide, and it can also add MeOH to double bonds(personal communication with Dr. W. W. Christie).
In our study, we compared BF3-MeOH and H2SO4-MeOHin methylation and transesterification of FFA, TG, and PL. Oddnumber carbon FAs, which differ in chain length and degrees ofsaturation as well as TG or PL containing odd number carbonFA chains, were spiked in rat liver, and their recoveries weremeasured (Table 1). The overall average recovery of these FFAs,TG, and PLwas 66.9% for 2%H2SO4-MeOHmethod vs 59.9%for BF3-MeOH method, indicating that 2% H2SO4-MeOHprovided better recoveries. The 2% H2SO4-MeOH not onlyprovided better recovery but also generated less variation. Re-lative standard deviations (RSDs) calculated for saturated FFA,unsaturated FFA, and overall were 6.5, 6.2, and 5.8% for 2%H2SO4-MeOHmethod, whereas these values with BF3-MeOHmethodwere 29.9, 4.7, and 20.0%.This is critical for quantification
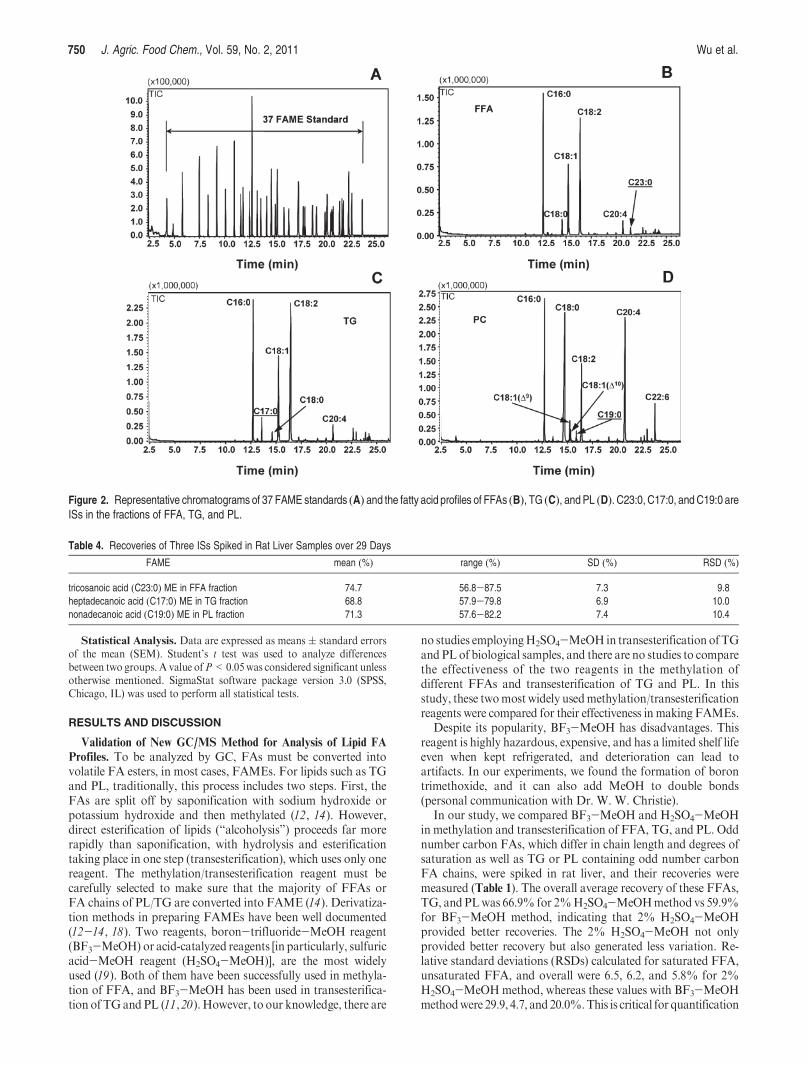
Figure 2. Representative chromatograms of 37 FAME standards (A) and the fatty acid profiles of FFAs (B), TG (C), and PL (D). C23:0, C17:0, andC19:0 areISs in the fractions of FFA, TG, and PL.
Table 4. Recoveries of Three ISs Spiked in Rat Liver Samples over 29 Days
FAME mean (%) range (%) SD (%) RSD (%)
tricosanoic acid (C23:0) ME in FFA fraction 74.7 56.8-87.5 7.3 9.8
heptadecanoic acid (C17:0) ME in TG fraction 68.8 57.9-79.8 6.9 10.0
nonadecanoic acid (C19:0) ME in PL fraction 71.3 57.6-82.2 7.4 10.4
Article J. Agric. Food Chem., Vol. 59, No. 2, 2011 751
with ISs. We also obtained better baseline in MS spectrum byusing 2%H2SO4-MeOH,which improves quantitation ofminorcompounds by increasing the signal-to-noise ratio to promotedetection at lower concentrations. In conclusion, we found 2%H2SO4-MeOH to be superior to BF3-MeOH inmaking FAMEfrom FFAs, TG, and PL.
The use of the IS for quantitation helps to balance out any losesof sample inherent to the sample preparation method or toinconsistent sample injection. However, for this to be true, theIS must be closely similar to the unknown analytes. In analyzingFAs with wide ranges of chain length and degrees of saturation,ISs must be validated and carefully selected. In some cases, ifnecessary, more than one IS may have to be used. Unfortunately,the validation of IS(s) has rarely been done. In this study, wevalidated tricosanoic acid (C23:0) as IS for FFA, glyceryl trihep-tadecanoate (containing three C17:0 chains, C17:0 TG) as ISfor TG, and 1,2-dinonadecanoyl-sn-clycero-3-phospholine(containing two C19:0 chains, C19:0 PC) as IS for PL.
For validation of ISs, recovery tests were conducted afterspiking C9:0, C15:0, C17:0, C23:0, C17:1, C19:3, C23:5, C17:0TG, and C19:0 PC in liver samples as described early. Oddnumber carbon FFAs do not exist in liver and represent FFAsof short or long chains and with different saturation degrees.Because of availability, only one standard from TG (C17:0 TG)and one fromPC (C19:0 PC) were adopted for recovery tests. The2%H2SO4-MeOHwas used as amethylation/transesterificationreagent. The results (Table 1) showed that the recoveries of moststandards were within the range 60-70%, except C23:0, whichwas slightly higher (74.3%). For quantification of FFAs, C23:0was found to be acceptable but not perfect as IS. However,considering that the majority of FAs in liver are in the C16-C20range, choosing C23:0 can reduce the interference with analytes.For PC and TG, C17:0 TG and C19:0 PC also displayed therecoveries of C17:0 and C19:0 in the 65-70% range. Thus, wethink that C17:0 TG and C19:0 PC are valid ISs for TG and PC,respectively.
In the conventional procedure, after derivatization, FAMEsare extractedwith organic solvents (e.g., hexane). Organic solventis then evaporated and reconstituted in a smaller volume oforganic solvent for GC or GC/MS analyses (21-24). The mainpurpose of this step is to concentrate the sample solution.However, this step may account for major loss of FAME,especiallyforshort-chainFAMEsduetohighervolatility(11,13,14).Nevertheless, except for one paper in which a simple comparisonwas mentioned (11), no other studies have addressed this issuecarefully. In the current study, two experiments were conductedto evaluate the loss of FAME in this single step. In the firstexperiment, a quick test was done using C9:0 and C23:0. Aftermethylation by 2% H2SO4-MeOH, their GC/MS chromato-grams with and without final step solvent evaporation wereshown in Figure 1. Comparing to direct heptane extraction, finalstep solvent evaporation accounted for major loss of short chainFA C9:0. For C23:0, the loss was minor because of much lowervolatility of C23:0 methyl ester. In the second experiment, therecoveries of four standards spiked into liver samples, C9:0,C23:0, C17:0 TG, and C19:0 PC, were conducted by exactly thesame procedures with and without final step solvent evaporation(Table 2). With last step solvent evaporation, recoveries of thesefour standards were all lower than those from procedure withoutlast step solvent evaporation. Not only were recoveries lower, butthe variations among samples were also greater (8.6-45.2% vs62.4-74.3%) (Table 2). These clearly showed that this solventevaporation step must be avoided. The main purpose of this stepis to increase sample concentration, which is crucial for analyzingminor FAMEs. We increased sample concentration by (1) usingmore sample and (2) using less organic solvent for the final stepextraction. There are other alternatives to increase sensitivity,such as analyzing pentafluorobenzyl (PFB) esters by negativechemical ionization (NCI) (25), but for other esters, standardsare usually not commercially available, which limits usage inquantitation.
Because the current method was developed to analyze FAs inanimal tissue samples, which in many cases are in tiny amounts,the linearity within the range of very low concentration (1-50 ng)and detection limit were assessed using eight odd number carbonFAME standards (Table 3). All standards displayed very goodcorrelation coefficients (r) > 0.9999. The detection limits of theeight FAME standards were estimated in the range of 50-200 pgby serial dilution. Therefore, this method is ideal for analyzingtrace amounts of FAs in animal tissue samples.
The representative chromatograms of 37 FAME standardsand the fatty acid profiles of the three fractions FFA, TG, and PLare presented in Figure 2. Reproducibility and robustness of this
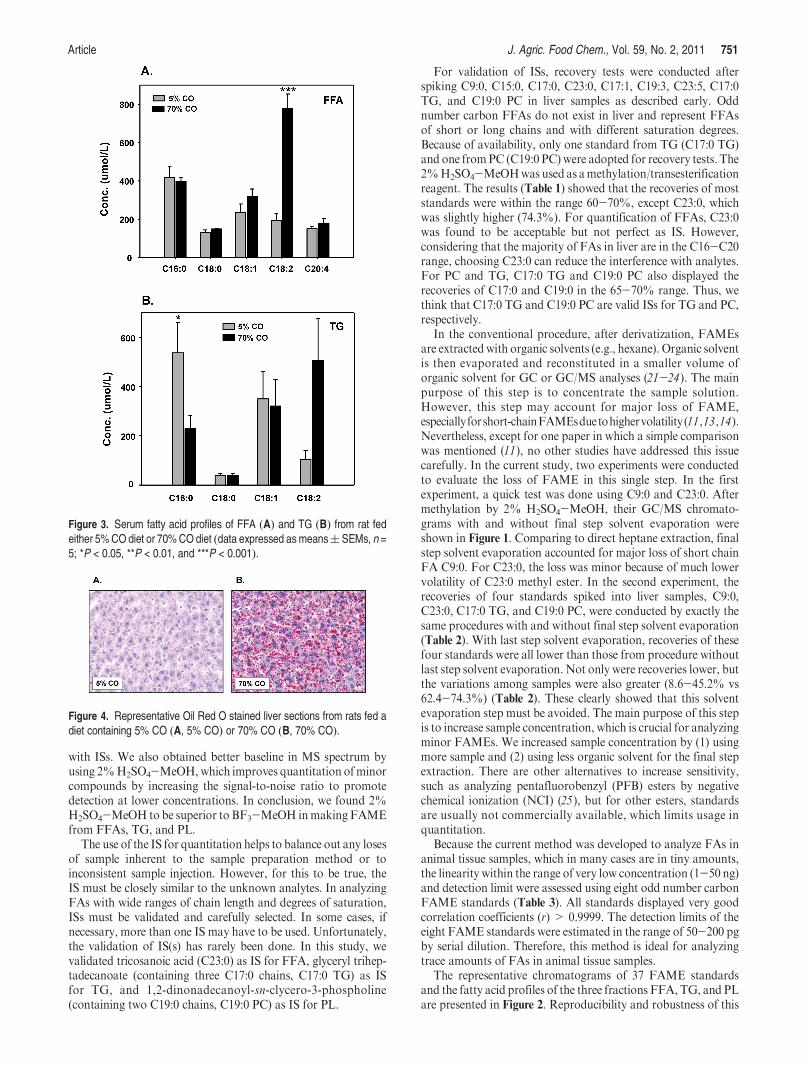
Figure 3. Serum fatty acid profiles of FFA (A) and TG (B) from rat fedeither 5%CO diet or 70%CO diet (data expressed asmeans( SEMs, n =5; *P < 0.05, **P < 0.01, and ***P < 0.001).
Figure 4. Representative Oil Red O stained liver sections from rats fed adiet containing 5% CO (A, 5% CO) or 70% CO (B, 70% CO).
752 J. Agric. Food Chem., Vol. 59, No. 2, 2011 Wu et al.
FA analysis method were evaluated by monitoring the recoveriesof three ISs day to day for 29 days (Table 4). Most recoveries fellin the 60-80% range, and their RSDs were around 10%.
FFAs and FA Profiles in Rat Serum and Liver. Dietary lipidsdirectly influenceFA composition in animal tissues, which in turncan alter their physiological or pathological consequences. In anewly established NASH model, rats fed a high polyunsaturatedfat diet were found to develop steatoheptatitis similar to clinicalNASH (17). By using the above validatedGC/MSmethod, FFAsandFAprofile of TGswere analyzed in serum from rats fed a dietcontaining 70% (total calories) or 5% CO (5, 17). CO contains55% PUFAs, 30% monounsaturated FAs, and 15% saturatedFAs. Of the saturated FAs, 80% are palmitic acid (lipid numberof C16:0), 14% stearic acid (C18:0), and 3% arachidic acid(C20:0). Over 99% of the monounsaturated FAs are oleic acid(C18:1). Ninety-eight percent of the PUFAs are the linoleic acid(C18:2). We have previously demonstrated that in this modeloverfeeding of either diet for 21 days resulted in obesity withidentical gain in body weight and adiposity (17). However, in the70% CO diet, total serum TGs were elevated from 5.8 ( 0.8 to10.3( 0.6 mg/mL (P< 0.05), and serum NEFA concentrationswere elevated from 0.6( 0.08 to 1.3( 0.3 mM (P<0.05) (17 ).In serum from rats fed 5% CO, palmitic acid (C16:0) was themajor FA in NEFA and TG (Figure 3). In 5% CO diet, 76%total calories are derived from carbohydrates (17 ). Palmiticacid is the major FA synthesized from carbohydrates. Inserum from rats fed 70% CO, the composition and ratio ofFFAs in NEFA and the FA profile of TG generally reflectedthat found in the dietary CO (Figure 3), indicating that FAs inCO were proportionally absorbed and incorporated intoVLDL secreted from the liver.
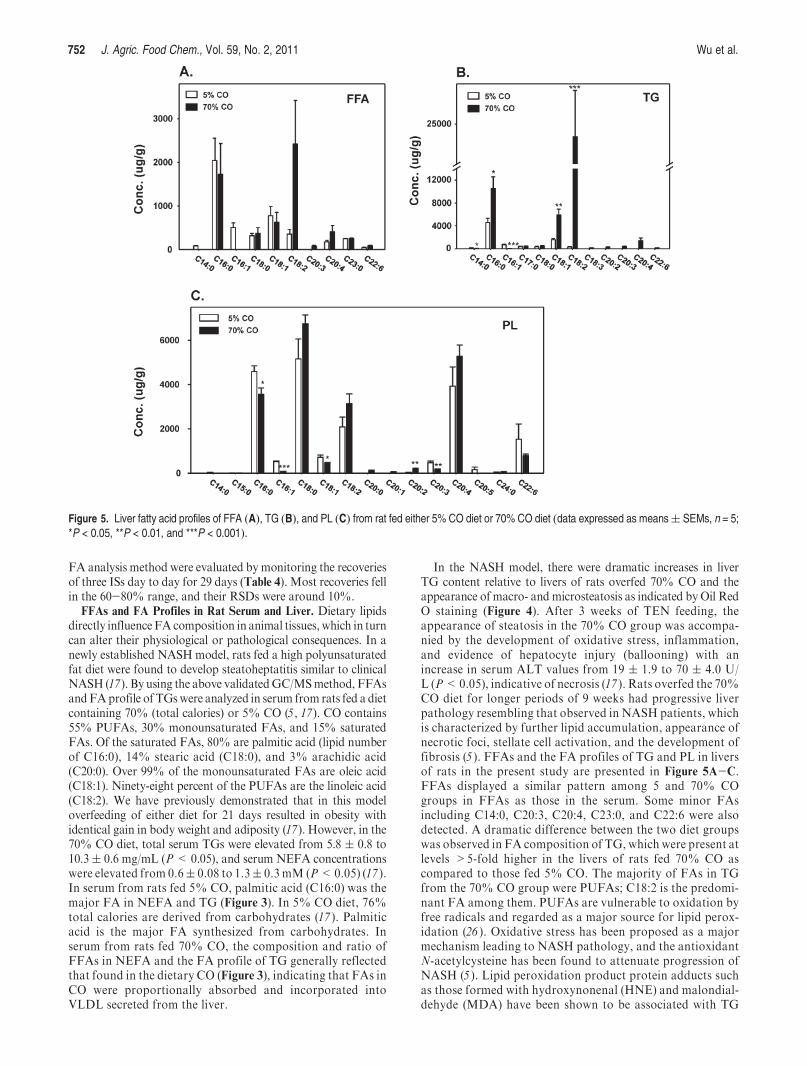
In the NASH model, there were dramatic increases in liverTG content relative to livers of rats overfed 70% CO and theappearance of macro- and microsteatosis as indicated by Oil RedO staining (Figure 4). After 3 weeks of TEN feeding, theappearance of steatosis in the 70% CO group was accompa-nied by the development of oxidative stress, inflammation,and evidence of hepatocyte injury (ballooning) with anincrease in serum ALT values from 19 ( 1.9 to 70 ( 4.0 U/L (P<0.05), indicative of necrosis (17 ). Rats overfed the 70%CO diet for longer periods of 9 weeks had progressive liverpathology resembling that observed in NASH patients, whichis characterized by further lipid accumulation, appearance ofnecrotic foci, stellate cell activation, and the development offibrosis (5 ). FFAs and the FA profiles of TG and PL in liversof rats in the present study are presented in Figure 5A-C.FFAs displayed a similar pattern among 5 and 70% COgroups in FFAs as those in the serum. Some minor FAsincluding C14:0, C20:3, C20:4, C23:0, and C22:6 were alsodetected. A dramatic difference between the two diet groupswas observed in FA composition of TG, which were present atlevels >5-fold higher in the livers of rats fed 70% CO ascompared to those fed 5% CO. The majority of FAs in TGfrom the 70% CO group were PUFAs; C18:2 is the predomi-nant FA among them. PUFAs are vulnerable to oxidation byfree radicals and regarded as a major source for lipid perox-idation (26 ). Oxidative stress has been proposed as a majormechanism leading to NASH pathology, and the antioxidantN-acetylcysteine has been found to attenuate progression ofNASH (5 ). Lipid peroxidation product protein adducts suchas those formed with hydroxynonenal (HNE) and malondial-dehyde (MDA) have been shown to be associated with TG
Figure 5. Liver fatty acid profiles of FFA (A), TG (B), and PL (C) from rat fed either 5% CO diet or 70% CO diet (data expressed as means( SEMs, n = 5;*P < 0.05, **P < 0.01, and ***P < 0.001).
Article J. Agric. Food Chem., Vol. 59, No. 2, 2011 753
lipid droplets in liver cells (4 , 5 ). It is likely that the FA sidechains on the surface of lipid droplets appearing in liver afterhigh fat overfeeding represent a major substrate for lipidperoxidation reactions and for the formation of HNE/MDAadducts with droplet-associated proteins such as perilipin andadipophilin. Such adducts may disrupt normal protein func-tion and contribute to cellular injury (27 ). It is likely thatadduct formation is highly dependent on FA composition ofthe TGs in the lipid droplets; therefore, that fewer adductswould be formed in steatotic livers following the feeding ofsaturated or monounsaturated fats as compared to polyun-saturated or w-3 fats such as fish oil. This is consistent withstudies of alcoholic liver injury in which severity of hepaticsteatohepatitis has been found to be greater in animals fedethanol in the presence of CO or fish oil as compared to thosefed the same level of ethanol in the presence of saturated ormonounsaturated fats (28 ).
In liver PL, the FA composition in the two diet groups wasremarkably similar. Stearic acid (C18:0) and arachidonic acid(C20:4) appeared to be the major FAs. Stearic acid and arachi-donic acid were most likely synthesized from dietary linoleic acidbyhydrogenation anddesaturation-elongation, respectively (29).Although levels of 18:0, 18:2, 20:2, and 20:4 were somewhathigher in PLs from the liver of rats fed 70% CO (as compared to5%CO), this did not reach statistical significance except for 20:2.However, there was a significant decrease in the content ofsaturated and monounsaturated FAs 16:0, 16:1, and 18:1.
In conclusion, after careful examination of several key prac-tical factors inGC/MSanalysis ofFAprofiles in animal tissue, wepropose a new validated procedure for analyzing FA profiles indifferent fractions of lipids from animal tissue, including FFAs,TG, and PL. Using this procedure, lipid FA profiles wereanalyzed in serum and liver from newly developed rat model ofNASH for the first time. The FA composition of FFAs and TGsin liver and plasmawas closely related to dietary lipids. Alterationof FA composition in liver FFAs and TGs to enrich the propor-tion of PUFAs susceptible to lipid peroxidation may contributeto progression of injury following development of steatosis.
ABBREVIATIONS USED
BF3, borontrifluoride; CO, corn oil; CV, coefficient of varia-tion; EI, electron ionization; FAME, fatty acid methyl ester(s);FFA, free fatty acid;GC/MS, gas chromatography/mass spectrom-etry; HCl, hydrochloric acid; H2SO4, sulfuric acid; IS, internalstandard; MeOH, methanol; PC, phosphatidyl choline; PL,phospholipid; RF, relative migration; RRF, relative responsefactor; RSD, relative standard deviation; TG, triglycerides; TLC,thin-layer chromatography; TEN, total enteral nutrition;NASH,nonalcoholic steatohepatitis.
ACKNOWLEDGMENT
We acknowledge Matthew E. Ferguson and Renee Till fortheir technical assistance.
LITERATURE CITED
(1) Jump, D. B. Fatty acid regulation of gene transcription. Crit. Rev.Clin. Lab. Sci. 2004, 41, 41-78.
(2) Hihi, A. K.; Michalik, L.; Wahli, W. PPARs: Transcriptionaleffectors of fatty acids and their derivatives. Cell. Mol. Life Sci.2002, 59, 790-798.
(3) Grimaldi, P. A. Fatty acid regulation of gene expression.Curr. Opin.Clin. Nutr. Metab. Care 2001, 4, 433-437.
(4) Kharbanda, K. K.; Todero, S. L.; Shubert, K. A.; Sorrell, M. F.;Tuma, D. J. Malondialdehyde-acetaldehyde-protein adducts increase
secretion of chemokines by rat hepatic stellate cells. Alcohol 2001, 25,123-128.
(5) Baumgardner, J. N.; Shankar, K.; Hennings, L.; Albano, E.; Badger,T. M.; Ronis, M. J. N-acetylcysteine attenuates progression of liverpathology in a rat model of nonalcoholic steatohepatitis. J. Nutr.2008, 138, 1872-1879.
(6) Poli, G.; Biasi, F.; Leonarduzzi, G. 4-Hydroxynonenal-proteinadducts: A reliable biomarker of lipid oxidation in liver diseases.Mol. Aspects Med. 2008, 29, 67-71.
(7) Peterson, B. L.; Cummings, B. S. A review of chromatographicmethods for the assessment of phospholipids in biological samples.Biomed. Chromatogr. 2006, 20, 227-243.
(8) Rohrbach, S. Effects of dietary polyunsaturated fatty acids onmitochondria. Curr. Pharm. Des. 2009, 15, 4103-4116.
(9) Myher, J. J.; Kuksis, A. General strategies in chromatographicanalysis of lipids. J. Chromatogr. B: Biomed. Appl. 1995, 671, 3-33.
(10) Gutierrez, A. M.; Reboredo, G. R.; Catala, A. Fatty acid profilesand lipid peroxidation of microsomes and mitochondria from liver,heart and brain of Cairina moschata. Int. J. Biochem. Cell Biol. 2002,34, 605-612.
(11) Han, J.; Hamilton, J. A.; Kirkland, J. L.; Corkey, B. E.; Guo, W.Medium-chain oil reduces fat mass and down-regulates expression ofadipogenic genes in rats. Obes. Res. 2003, 11, 734-744.
(12) Nikolaidis, M. G.; Petridou, A.; Mougios, V. Comparison of thephospholipid and triacylglycerol fatty acid profile of rat serum,skeletal muscle and heart. Physiol. Res. 2006, 55, 259-265.
(13) Rosenfeld, J. M. Application of analytical derivatizations to thequantitative and qualitative determination of fatty acids. Anal.Chim. Acta 2002, 465, 93-100.
(14) Eder, K. Gas chromatographic analysis of fatty acid methyl esters.J. Chromatogr. B: Biomed. Appl. 1995, 671, 113-131.
(15) Gutnikov, G. Fatty acid profiles of lipid samples. J. Chromatogr. B:Biomed. Appl. 1995, 671, 71-89.
(16) Seppanen-Laakso, T.; Laakso, I.; Hiltunen, R. Analysis of fattyacids by gas chromatography, and its relevance to research on healthand nutrition. Anal. Chim. Acta 2002, 465, 39-62.
(17) Baumgardner, J. N.; Shankar, K.; Hennings, L.; Badger, T. M.;Ronis, M. J. A new model for nonalcoholic steatohepatitis in the ratutilizing total enteral nutrition to overfeed a high-polyunsaturatedfat diet. Am. J. Physiol. Gastrointest. Liver Physiol. 2008, 294,G27-G38.
(18) Shantha, N. C.; Napolitano, G. E. Gas chromatography of fattyacids. J. Chromatogr. 1992, 624, 37-51.
(19) Antolin, E. M.; Delange, D. M.; Canavaciolo, V. G. Evaluation offive methods for derivatization and GC determination of a mixtureof very long chain fatty acids (C24:0-C36:0). J. Pharm. Biomed. Anal.2008, 46, 194-199.
(20) Morrison, W. R.; Smith, L. M. Preparation of fatty acid methyl estersand dimethylacetals from lipids with boron fluoride-methanol.J. Lipid Res. 1964, 5, 600-608.
(21) Basconcillo, L. S.; McCarry, B. E. Comparison of three GC/MSmethodologies for the analysis of fatty acids in Sinorhizobiummeliloti: Development of a micro-scale, one-vial method. J. Chro-matogr. B: Anal. Technol. Biomed. Life Sci. 2008, 871, 22-31.
(22) Morimoto, M.; Reitz, R. C.; Morin, R. J.; Nguyen, K.; Ingelman-Sundberg, M.; French, S. W. CYP-2E1 inhibitors partially amelio-rate the changes in hepatic fatty acid composition induced in rats bychronic administration of ethanol and a high fat diet. J. Nutr. 1995,125, 2953-2964.
(23) Ronis, M. J.; Korourian, S.; Zipperman, M.; Hakkak, R.; Badger,T. M. Dietary saturated fat reduces alcoholic hepatotoxicity in ratsby altering fatty acid metabolism and membrane composition.J. Nutr. 2004, 134, 904-912.
(24) Yi, L. Z.; He, J.; Liang, Y. Z.; Yuan, D. L.; Chau, F. T. Plasma fattyacid metabolic profiling and biomarkers of type 2 diabetes mellitusbased on GC/MS and PLS-LDA. FEBS Lett. 2006, 580, 68376845.
(25) Pawlosky, R. J.; Sprecher, H. W.; Salem, N., Jr. High sensitivitynegative ion GC-MSmethod for detection of desaturated and chain-elongated products of deuterated linoleic and linolenic acids. J. LipidRes. 1992, 33, 1711-1717.

754 J. Agric. Food Chem., Vol. 59, No. 2, 2011 Wu et al.
(26) Niki, E.; Yoshida, Y.; Saito, Y.; Noguchi, N. Lipid peroxidation:mechanisms, inhibition, and biological effects. Biochem. Biophys.Res. Commun. 2005, 338, 668-676.
(27) Hartley, D. P.; Kolaja, K. L.; Reichard, J.; Petersen, D. R. 4-Hydroxynonenal and malondialdehyde hepatic protein adducts inrats treated with carbon tetrachloride: Immunochemical detectionand lobular localization. Toxicol. Appl. Pharmacol. 1999, 161,23-33.
(28) Nanji, A. A.; Su, G. L.; Laposata, M.; French, S. W. Pathogenesis ofalcoholic liver disease--recent advances. Alcohol.: Clin. Exp. Res.2002, 26, 731-736.
(29) Zhou, L.; Nilsson, A. Sources of eicosanoid precursor fatty acidpools in tissues. J. Lipid Res. 2001, 42, 1521-1542.
Received for review October 1, 2010. Revised manuscript received
November 22, 2010. Accepted November 30, 2010. This study was
supported by the U.S. Department of Agriculture (6251-51000-005-
02S).Mention of trade names or commercial products in this publication
is solely for the purpose of providing specific information and does not
imply recommendation or endorsement by the U.S. Department of
Agriculture.
Related Documents