Wet weather June 2019 The UK experienced a spell of very wet weather in mid-June as a low pressure system and associated fronts brought widespread and slow moving heavy rainfall. In parts of Lincolnshire around 2.5 times the monthly average rainfall fell from 10 to 12 June, and there was further wet weather across east Wales, north-east England and eastern Scotland. This wet weather was part of a largely unsettled June, with low pressure often dominating the UK’s weather bringing extensive rainfall on many days of the month. Impacts The worst affected area was Lincolnshire, with around 600 homes in Wainfleet evacuated and nearly 130 properties flooded when the River Steeping burst its banks. There were also flooding problems across parts of east Wales with transport links affected. Weather data The analysis charts below show a north-easterly airflow affecting the UK, with a slow-moving front at the boundary between colder, drier air to the north-west and warm, moist air across the near- continent. a) Analysis chart at 00 UTC 11 June 2019

Welcome message from author
This document is posted to help you gain knowledge. Please leave a comment to let me know what you think about it! Share it to your friends and learn new things together.
Transcript
Wet weather June 2019
The UK experienced a spell of very wet weather in mid-June as a low pressure system and associated fronts brought widespread and slow moving heavy rainfall. In parts of Lincolnshire around 2.5 times the monthly average rainfall fell from 10 to 12 June, and there was further wet weather across east Wales, north-east England and eastern Scotland. This wet weather was part of a largely unsettled June, with low pressure often dominating the UK’s weather bringing extensive rainfall on many days of the month.
Impacts
The worst affected area was Lincolnshire, with around 600 homes in Wainfleet evacuated and nearly 130 properties flooded when the River Steeping burst its banks. There were also flooding problems across parts of east Wales with transport links affected.
Weather data
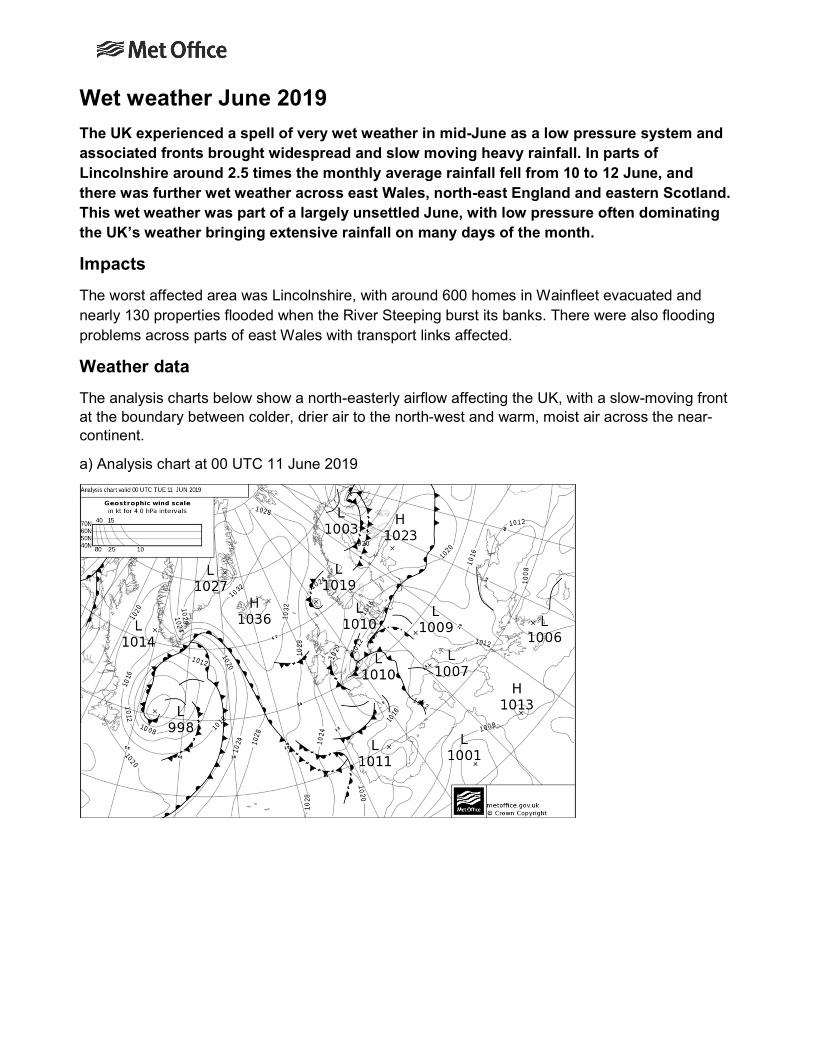
The analysis charts below show a north-easterly airflow affecting the UK, with a slow-moving front at the boundary between colder, drier air to the north-west and warm, moist air across the near-continent.
a) Analysis chart at 00 UTC 11 June 2019
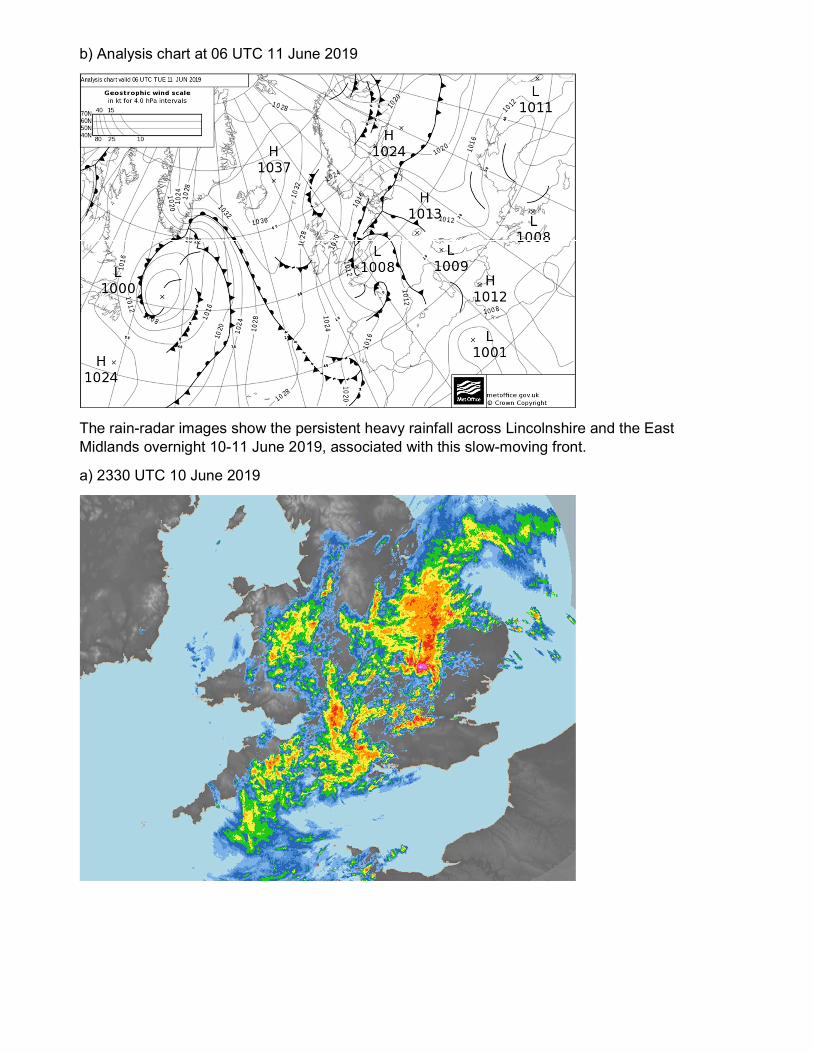
b) Analysis chart at 06 UTC 11 June 2019
The rain-radar images show the persistent heavy rainfall across Lincolnshire and the East Midlands overnight 10-11 June 2019, associated with this slow-moving front.
a) 2330 UTC 10 June 2019
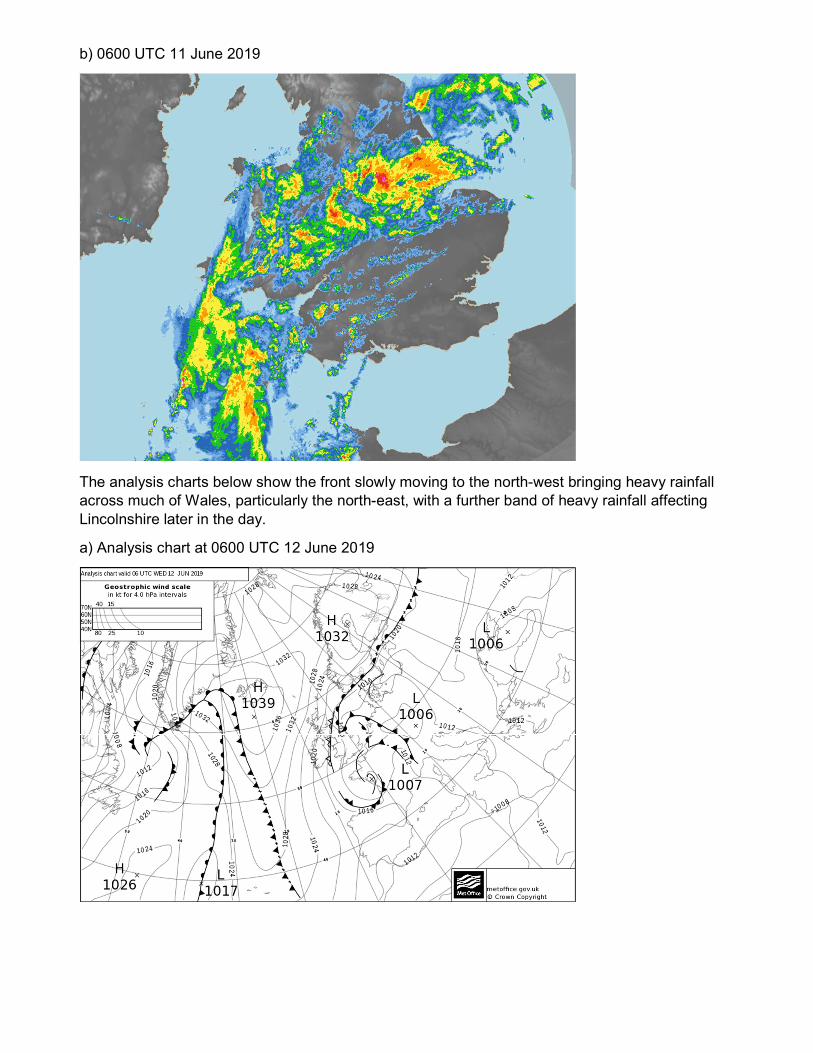
b) 0600 UTC 11 June 2019
The analysis charts below show the front slowly moving to the north-west bringing heavy rainfall across much of Wales, particularly the north-east, with a further band of heavy rainfall affecting Lincolnshire later in the day.
a) Analysis chart at 0600 UTC 12 June 2019
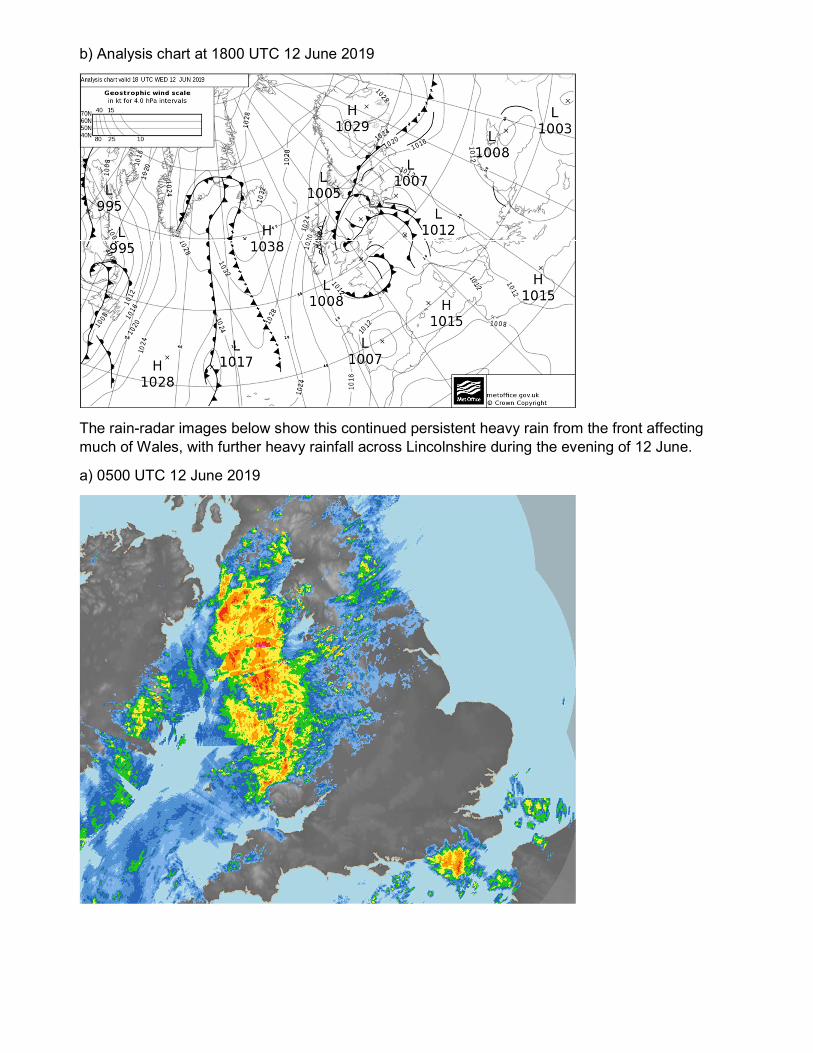
b) Analysis chart at 1800 UTC 12 June 2019
The rain-radar images below show this continued persistent heavy rain from the front affecting much of Wales, with further heavy rainfall across Lincolnshire during the evening of 12 June.
a) 0500 UTC 12 June 2019
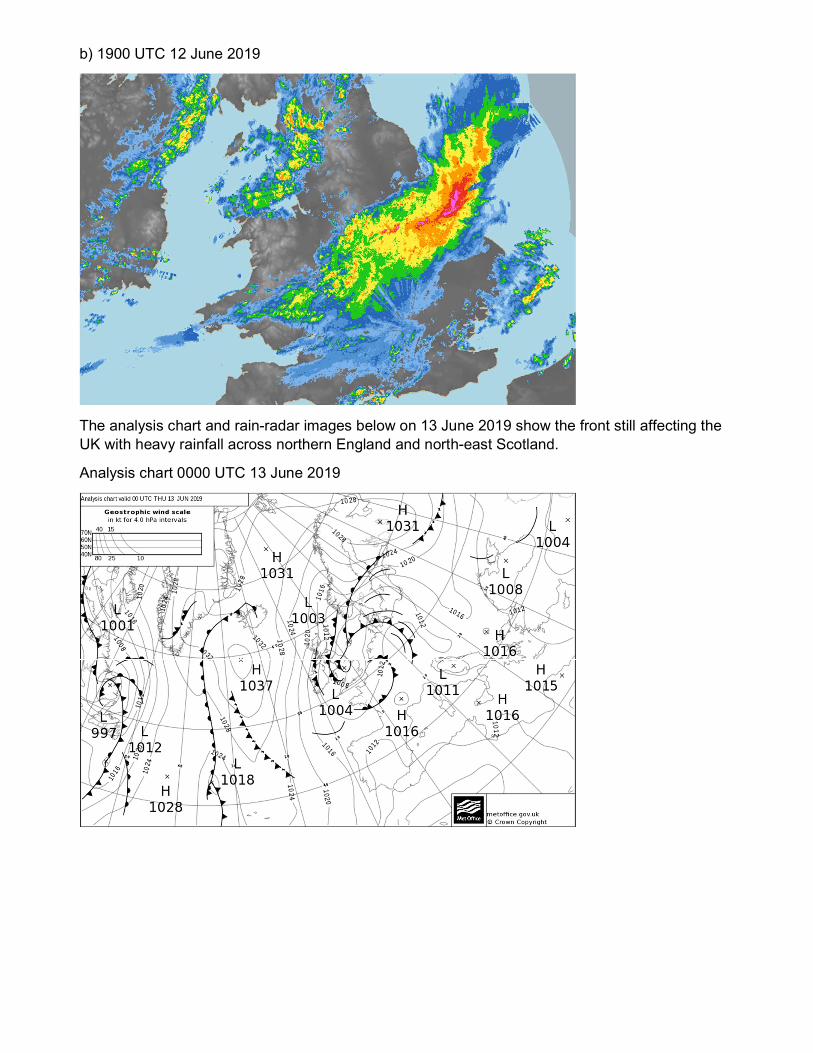
b) 1900 UTC 12 June 2019
The analysis chart and rain-radar images below on 13 June 2019 show the front still affecting the UK with heavy rainfall across northern England and north-east Scotland.
Analysis chart 0000 UTC 13 June 2019
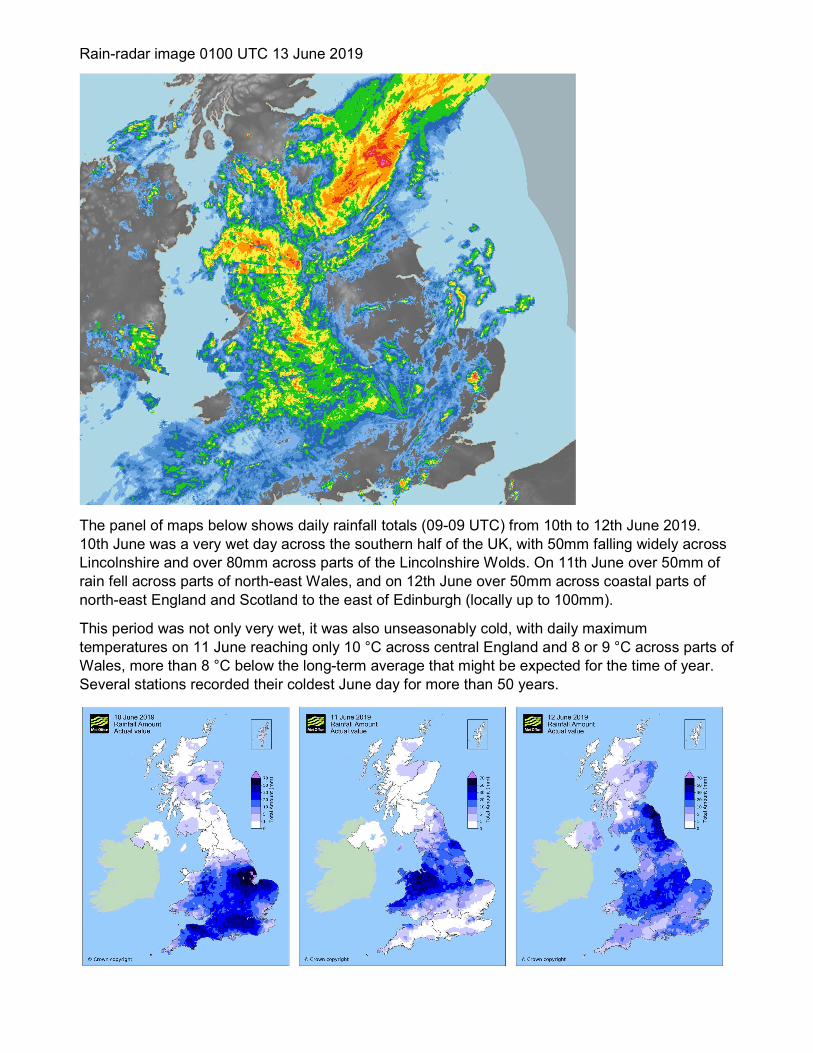
Rain-radar image 0100 UTC 13 June 2019
The panel of maps below shows daily rainfall totals (09-09 UTC) from 10th to 12th June 2019. 10th June was a very wet day across the southern half of the UK, with 50mm falling widely across Lincolnshire and over 80mm across parts of the Lincolnshire Wolds. On 11th June over 50mm of rain fell across parts of north-east Wales, and on 12th June over 50mm across coastal parts of north-east England and Scotland to the east of Edinburgh (locally up to 100mm).
This period was not only very wet, it was also unseasonably cold, with daily maximum temperatures on 11 June reaching only 10 °C across central England and 8 or 9 °C across parts of Wales, more than 8 °C below the long-term average that might be expected for the time of year. Several stations recorded their coldest June day for more than 50 years.
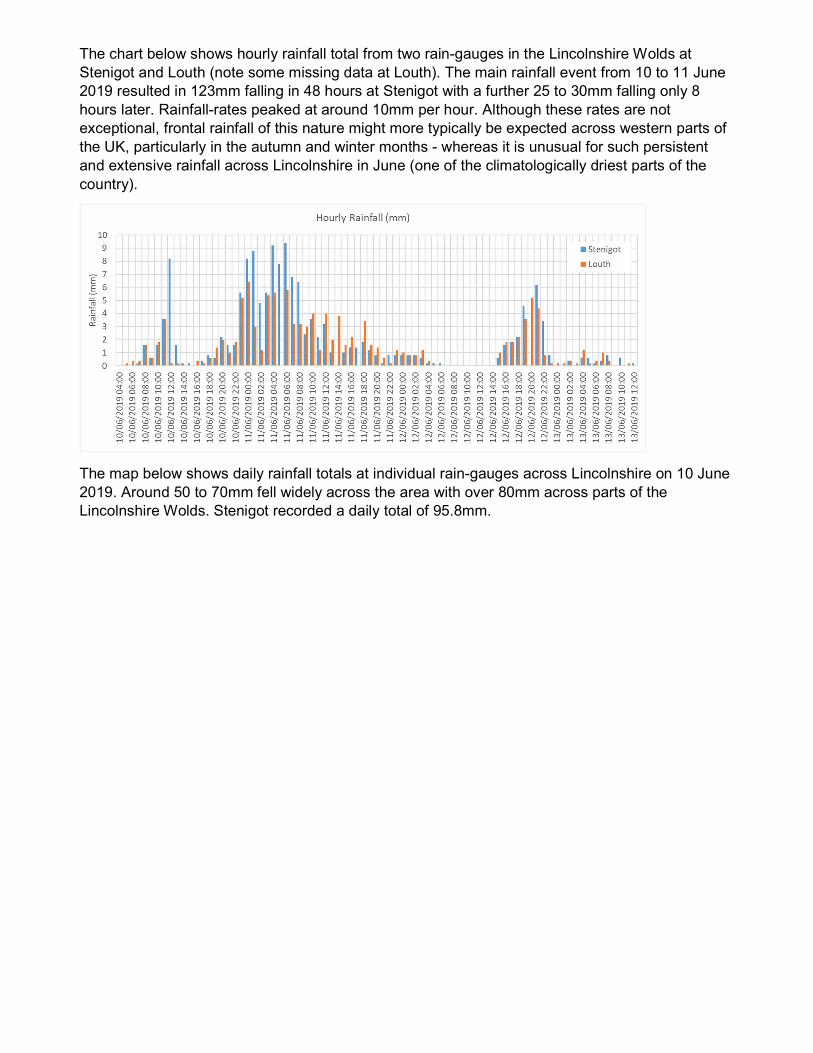
The chart below shows hourly rainfall total from two rain-gauges in the Lincolnshire Wolds at Stenigot and Louth (note some missing data at Louth). The main rainfall event from 10 to 11 June 2019 resulted in 123mm falling in 48 hours at Stenigot with a further 25 to 30mm falling only 8 hours later. Rainfall-rates peaked at around 10mm per hour. Although these rates are not exceptional, frontal rainfall of this nature might more typically be expected across western parts of the UK, particularly in the autumn and winter months - whereas it is unusual for such persistent and extensive rainfall across Lincolnshire in June (one of the climatologically driest parts of the country).
The map below shows daily rainfall totals at individual rain-gauges across Lincolnshire on 10 June 2019. Around 50 to 70mm fell widely across the area with over 80mm across parts of the Lincolnshire Wolds. Stenigot recorded a daily total of 95.8mm.
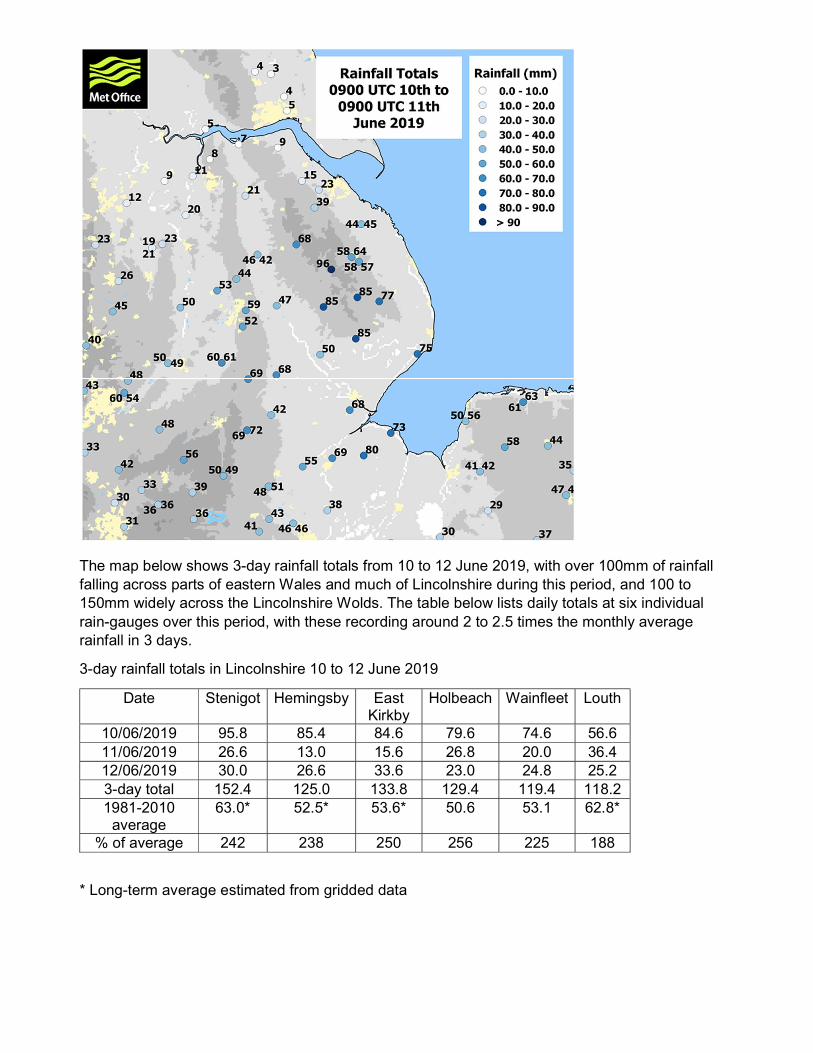
The map below shows 3-day rainfall totals from 10 to 12 June 2019, with over 100mm of rainfall falling across parts of eastern Wales and much of Lincolnshire during this period, and 100 to 150mm widely across the Lincolnshire Wolds. The table below lists daily totals at six individual rain-gauges over this period, with these recording around 2 to 2.5 times the monthly average rainfall in 3 days.
3-day rainfall totals in Lincolnshire 10 to 12 June 2019
Date Stenigot Hemingsby East Kirkby
Holbeach Wainfleet Louth
10/06/2019 95.8 85.4 84.6 79.6 74.6 56.6 11/06/2019 26.6 13.0 15.6 26.8 20.0 36.4 12/06/2019 30.0 26.6 33.6 23.0 24.8 25.2 3-day total 152.4 125.0 133.8 129.4 119.4 118.2 1981-2010
average 63.0* 52.5* 53.6* 50.6 53.1 62.8*
% of average 242 238 250 256 225 188
* Long-term average estimated from gridded data
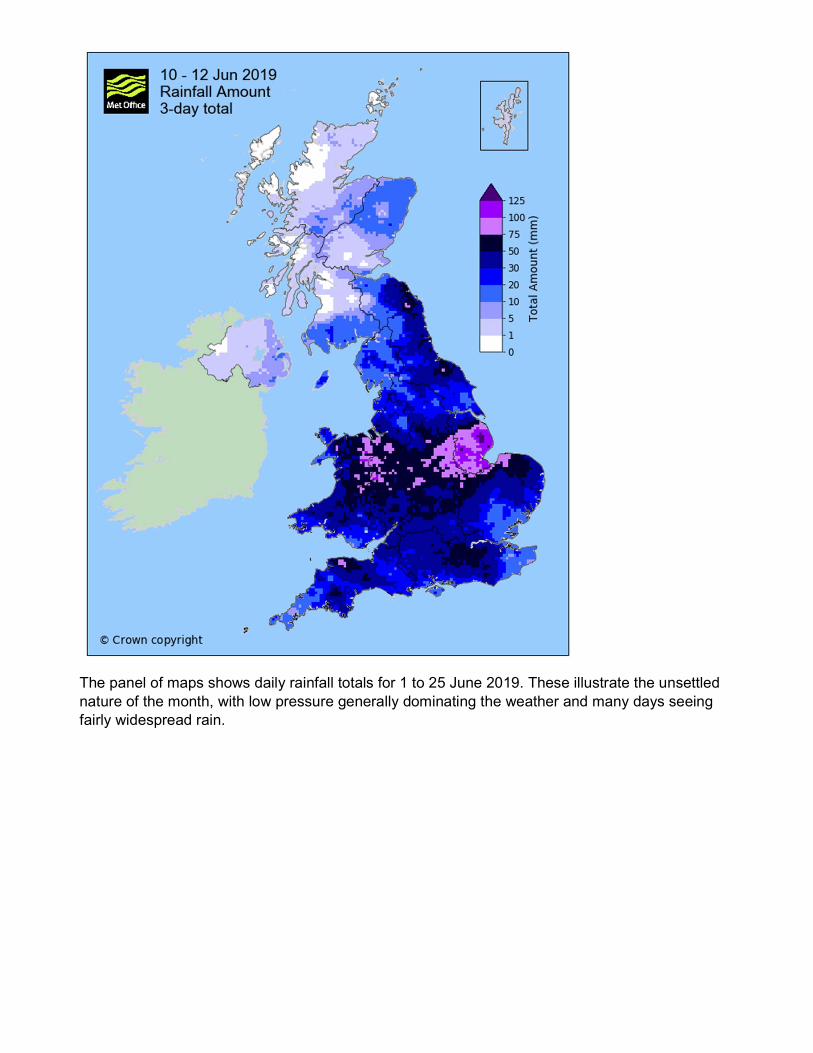
The panel of maps shows daily rainfall totals for 1 to 25 June 2019. These illustrate the unsettled nature of the month, with low pressure generally dominating the weather and many days seeing fairly widespread rain.
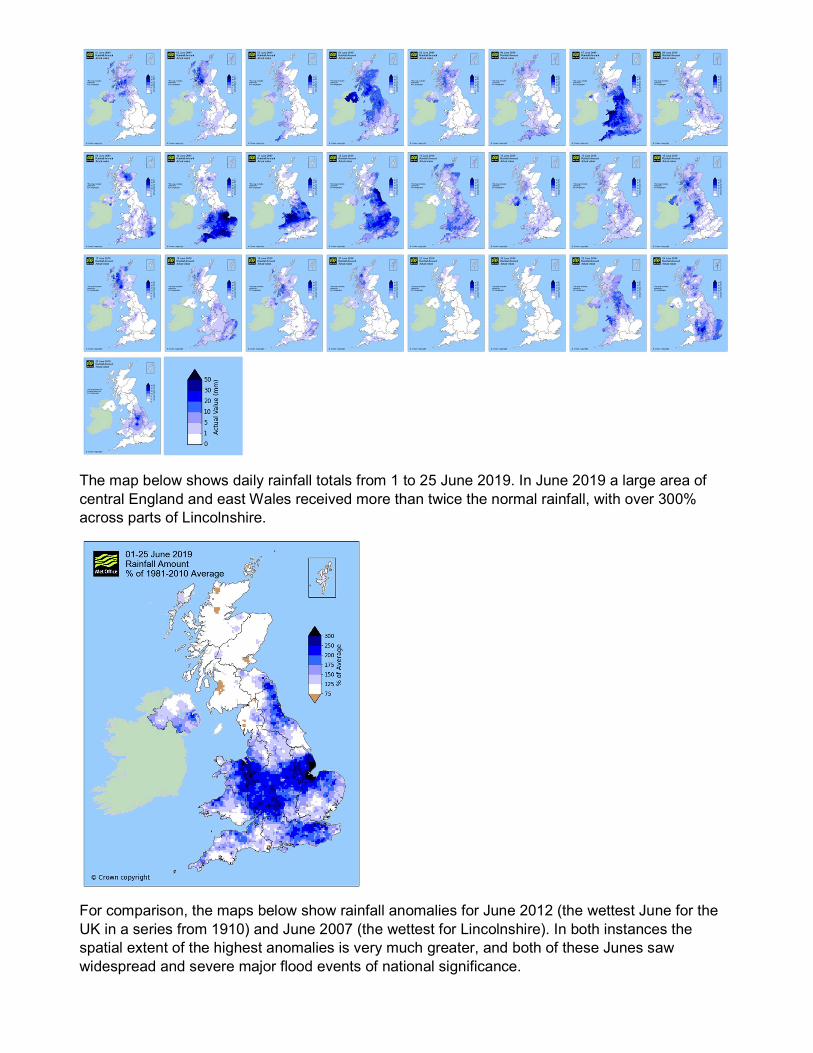
The map below shows daily rainfall totals from 1 to 25 June 2019. In June 2019 a large area of central England and east Wales received more than twice the normal rainfall, with over 300% across parts of Lincolnshire.
For comparison, the maps below show rainfall anomalies for June 2012 (the wettest June for the UK in a series from 1910) and June 2007 (the wettest for Lincolnshire). In both instances the spatial extent of the highest anomalies is very much greater, and both of these Junes saw widespread and severe major flood events of national significance.
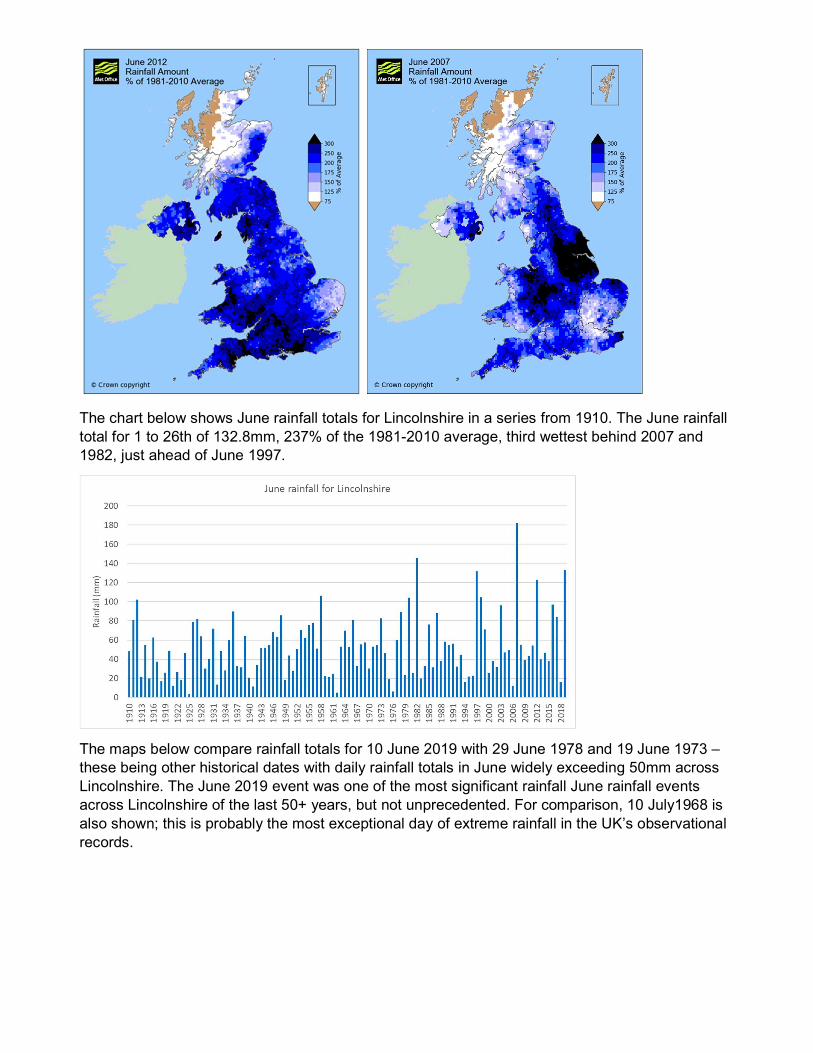
The chart below shows June rainfall totals for Lincolnshire in a series from 1910. The June rainfall total for 1 to 26th of 132.8mm, 237% of the 1981-2010 average, third wettest behind 2007 and 1982, just ahead of June 1997.
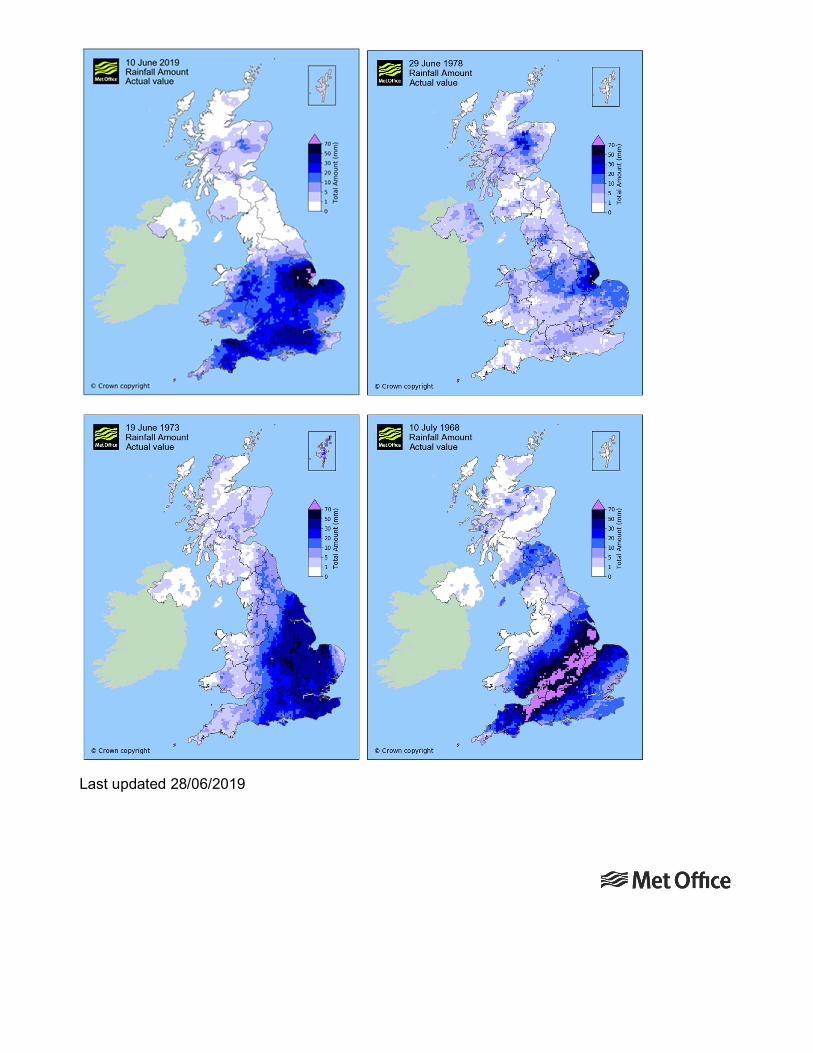
The maps below compare rainfall totals for 10 June 2019 with 29 June 1978 and 19 June 1973 – these being other historical dates with daily rainfall totals in June widely exceeding 50mm across Lincolnshire. The June 2019 event was one of the most significant rainfall June rainfall events across Lincolnshire of the last 50+ years, but not unprecedented. For comparison, 10 July1968 is also shown; this is probably the most exceptional day of extreme rainfall in the UK’s observational records.
Last updated 28/06/2019
Related Documents