sustainability Article Italy Is Fragile: Soil Consumption and Climate Change Combined Effects on Territorial Heritage Maintenance Lorenzo Fabian and Mattia Bertin * Citation: Fabian, L.; Bertin, M. Italy Is Fragile: Soil Consumption and Climate Change Combined Effects on Territorial Heritage Maintenance. Sustainability 2021, 13, 6389. https:// doi.org/10.3390/su13116389 Academic Editors: Edward Blakely, Peter Kresl, Francesco Musco and Richard Hu Received: 14 April 2021 Accepted: 29 May 2021 Published: 4 June 2021 Publisher’s Note: MDPI stays neutral with regard to jurisdictional claims in published maps and institutional affil- iations. Copyright: © 2021 by the authors. Licensee MDPI, Basel, Switzerland. This article is an open access article distributed under the terms and conditions of the Creative Commons Attribution (CC BY) license (https:// creativecommons.org/licenses/by/ 4.0/). EPiC Earth and Polis Research Centre, Università Iuav di Venezia, 30123 Venice, Italy; [email protected] * Correspondence: [email protected]; Tel.: +39-333-4649-785 Abstract: The article looks for relations between growth of expanding cities, number of catastrophes and reduction of inhabitants in inland regions. The study explores these aspects through cartographic readings aimed at highlighting the relationship between soil consumption, the abandonment of peripheral areas, and environmental risks due to floods, landslides and earthquakes. The research analyzes the whole of Italy as a case study between 1990 and 2019 to get an accurate interpretation of the relations between these phenomena. The conclusions alert us to the need to redirect Italy’s development and its resilience projects. The study outlines the need of a re-living plan for Italian inner areas. It would be the only security process really capable of taking care of the territory. Keywords: climate change; disaster; soil consumption 1. Introduction Italy is currently experiencing the effects of an expansive building cycle that took place between 1990 and 2006. This process has led to an increase in construction and the consumption of soil. This expansion has taken place in areas which have been mainly removed from agricultural use, in the richest areas of the country. The expansion has consolidated metropolitan areas and existing settlements, reinforcing the urban sprawl. This phenomenon has occurred above all in the great plains of northern and central Italy near the major gateways. These profound transformations have not only affected Italian territory through expansion. In its final phase (from 2008), the great ‘building cycle of expansion’ [1] has also produced the abandonment, underuse, or disuse of buildings, in- frastructures, and built-up areas. We can view this as an expression of ‘growth increasingly decoupled from development, which has left rubble on the ground’ [2]. In the same years, the emergencies and disasters that have affected the Italian land- mass [3] justified territorial policy choices. These policies have tended to situate territorial planning projects in a framework of emergency management and fast recovery. Urgency and emergency, removed from their strictly professional context, have caused a renunci- ation of the design and planning perspective. The rhetoric of emergency has tended to occlude the actual character of Italian territory, which by its nature is fragile, unstable, and, for the most part, very difficult to inhabit. The results of these policies can be seen in three ways. The first refers to a remedial territorial policy aimed at the rapid resolution of events without a deep understanding of local constraints. A second is concerned with the processes of city expansion in the most urbanized parts of the country with the consequence of extensive soil consumption. A third trend, in peri-urban and inland areas, is the lack of medium- and long-term planning for the maintenance of existing territorial infrastructures, such as wooded slopes and water networks, resulting in a widespread increase in fragile conditions. Climate change is acting as a catalyst for this setting of events, causing a significant increase in the number of floods, run-offs, and minor landslides on a territorial scale, testing territorial capacity for adaptation and resilience. [4] This article explores the evolution of Italian territory and the correlated increase of risk through cartographic readings. The maps produced aim to highlighting the relation- Sustainability 2021, 13, 6389. https://doi.org/10.3390/su13116389 https://www.mdpi.com/journal/sustainability

Welcome message from author
This document is posted to help you gain knowledge. Please leave a comment to let me know what you think about it! Share it to your friends and learn new things together.
Transcript
sustainability
Article
Italy Is Fragile: Soil Consumption and Climate ChangeCombined Effects on Territorial Heritage Maintenance
Lorenzo Fabian and Mattia Bertin *
�����������������
Citation: Fabian, L.; Bertin, M. Italy
Is Fragile: Soil Consumption and
Climate Change Combined Effects on
Territorial Heritage Maintenance.
Sustainability 2021, 13, 6389. https://
doi.org/10.3390/su13116389
Academic Editors: Edward Blakely,
Peter Kresl, Francesco Musco and
Richard Hu
Received: 14 April 2021
Accepted: 29 May 2021
Published: 4 June 2021
Publisher’s Note: MDPI stays neutral
with regard to jurisdictional claims in
published maps and institutional affil-
iations.
Copyright: © 2021 by the authors.
Licensee MDPI, Basel, Switzerland.
This article is an open access article
distributed under the terms and
conditions of the Creative Commons
Attribution (CC BY) license (https://
creativecommons.org/licenses/by/
4.0/).
EPiC Earth and Polis Research Centre, Università Iuav di Venezia, 30123 Venice, Italy; [email protected]* Correspondence: [email protected]; Tel.: +39-333-4649-785
Abstract: The article looks for relations between growth of expanding cities, number of catastrophesand reduction of inhabitants in inland regions. The study explores these aspects through cartographicreadings aimed at highlighting the relationship between soil consumption, the abandonment ofperipheral areas, and environmental risks due to floods, landslides and earthquakes. The researchanalyzes the whole of Italy as a case study between 1990 and 2019 to get an accurate interpretationof the relations between these phenomena. The conclusions alert us to the need to redirect Italy’sdevelopment and its resilience projects. The study outlines the need of a re-living plan for Italianinner areas. It would be the only security process really capable of taking care of the territory.
Keywords: climate change; disaster; soil consumption
1. Introduction
Italy is currently experiencing the effects of an expansive building cycle that tookplace between 1990 and 2006. This process has led to an increase in construction and theconsumption of soil. This expansion has taken place in areas which have been mainlyremoved from agricultural use, in the richest areas of the country. The expansion hasconsolidated metropolitan areas and existing settlements, reinforcing the urban sprawl.This phenomenon has occurred above all in the great plains of northern and central Italynear the major gateways. These profound transformations have not only affected Italianterritory through expansion. In its final phase (from 2008), the great ‘building cycle ofexpansion’ [1] has also produced the abandonment, underuse, or disuse of buildings, in-frastructures, and built-up areas. We can view this as an expression of ‘growth increasinglydecoupled from development, which has left rubble on the ground’ [2].
In the same years, the emergencies and disasters that have affected the Italian land-mass [3] justified territorial policy choices. These policies have tended to situate territorialplanning projects in a framework of emergency management and fast recovery. Urgencyand emergency, removed from their strictly professional context, have caused a renunci-ation of the design and planning perspective. The rhetoric of emergency has tended toocclude the actual character of Italian territory, which by its nature is fragile, unstable,and, for the most part, very difficult to inhabit. The results of these policies can be seen inthree ways. The first refers to a remedial territorial policy aimed at the rapid resolution ofevents without a deep understanding of local constraints. A second is concerned with theprocesses of city expansion in the most urbanized parts of the country with the consequenceof extensive soil consumption. A third trend, in peri-urban and inland areas, is the lack ofmedium- and long-term planning for the maintenance of existing territorial infrastructures,such as wooded slopes and water networks, resulting in a widespread increase in fragileconditions. Climate change is acting as a catalyst for this setting of events, causing asignificant increase in the number of floods, run-offs, and minor landslides on a territorialscale, testing territorial capacity for adaptation and resilience. [4]
This article explores the evolution of Italian territory and the correlated increase ofrisk through cartographic readings. The maps produced aim to highlighting the relation-
Sustainability 2021, 13, 6389. https://doi.org/10.3390/su13116389 https://www.mdpi.com/journal/sustainability
Sustainability 2021, 13, 6389 2 of 19
ship between soil consumption, the abandonment of peripheral areas, and environmentalrisks due to floods, landslides and earthquakes. The period discussed is that of the sixthbuilding cycle, between 1995 and 2010, which was the most significant urban expansionsince the post-war period in terms of intensity and duration, as identified in the CresmeInstitute’s report on the construction market [1]. The paper will demonstrate the correlationof several fundamental issues: the expansion of the built environment and the productionof urban waste areas; the abandonment of peripheral territories; and the risks of flood-ing, earthquakes, landslides and overflowing, derived from the national database editedby the Istituto Superiore Per la Ricerca Ambientale (Higher Institute for EnvironmentalResearch) [3].
By overlapping the real estate market and territorial risks, the paper aims to verify thecorrelations between these processes. This will be accomplished starting from an empiricalgeostatistical analysis, aimed at the construction of interpretative maps of the territory.As we will see in the conclusions, there are strong correlations in at least two possibleways between these aspects: (1) the abandonment of inland areas, the increase in event-related damage and the consequent increase in underuse phenomena, and (2) between soilconsumption in metropolitan areas and the increase in disaster risks in these territories.The research shows the need to direct the real estate market in the dual directions ofreducing soil consumption in metropolitan areas, and towards housing and the consequentmaintenance of inland areas at the resumption of development.
This last aspect, which is the focus of the paper, appears to be relevant for issues purelyrelated to the enhancement of the widespread ‘territorial heritage’ that characterizes Italianterritory [5]. Moreover, this is also crucial to protect urbanization processes in large urbancentres. The article starts from a conception of climate change as a global catastrophe [6,7].The authors interpret climate change as a global switch of paradigms and view the crisesof the last twenty years as a tool for interpreting the evolution of national systems. Thisconsideration allows us to grasp timely events as part of a global evolutionary process,which must be recognized and addressed in its entirety. The article therefore analyzes howalternating cycles of expansive and deflationary building processes have acted in relationto local manifestations of this global catastrophe. The study will provide an important toolfor orienting the national climate strategy. The study will also provide a replicable exampleof the approach that could be employed in similar countries in order to create and validatestatistical data.
2. Theoretical Framework
The research is based on four main theoretical ideas. The first is related to EdwardBlakely’s work on social-economic repositioning and his approach to regional studies. Thesecond is Peter Meyer’s report on the need for incremental financing for climate changeadaptation in cities. The third is the work on pre-disaster recovery planning by PhilipBerke. The fourth is the change of order in the local planning matrix proposed by MattiaBertin, Lorenzo Fabian, and Francesco Musco on the basis of extensive literature producedinternationally on these issues.
Blakely’s theory of repositioning, which finds its operational matrix in the experienceof New Orleans, [8,9] reminds us how necessary it is to rethink the development of aterritory from what it might represent in a global system in the future, rather than what itmay have been in the past. This thought intersects with several articles that have appearedsince Hurricane Katrina. These articles demonstrate how plans and policies impacted inKatrina disaster reducing the local resilience [10,11]. The overstraining of an area, its lack ofattractiveness for residency and its inability to develop new economies signal its propensityfor disaster [12,13]. This attention leads us to reflect on what relationship there is betweenan increasingly frequent number of disasters in Italy and a process of condensation ofurban growth in some areas of the country [14].
The second stimulus came from Meyer’s research on financing cities to fight climatechange [15]. The author shows how a heavy, integrative involvement of private and non-
Sustainability 2021, 13, 6389 3 of 19
routine finance is needed for an effective fight against climate impacts at the local scale. [16]We find interesting cases of this approach in Italy: Milan, Turin, the Mantua–Modena–Bologna axis, the Venice Quadrilateral [7,17]. However, these urban systems represent theareas of greatest economic growth and transformation in the country [18]. First, we askedourselves what was happening from the point of view of the effects of disaster events inareas not capable of this type of investment attraction. Second, we asked ourselves howdisasters occurred in less attractive areas might had side effect on the most attractive areasof the Country.
In order to understand the relationships between urban transformation, disaster,and adaptation opportunities, we referred to the work of Philip Berke. In particular, weborrowed from his work a perspective on adaptation that does not start from the builtenvironment, but from the potential disaster [19,20]. This paradigm shift makes it possibleto overcome a conservative status quo approach, which, in a national system such as Italythat is so stratified in heritage issues can prevent one from understanding the potentialdamage of the evolutions underway [21].
Finally, Italian research on the reversal of the local planning hierarchy, which brings theissue of risk planning to the top of city design, delivers us the opportunity to look at localdevelopment precisely from those impacts that Berke says are the key to an interpretation ofdevelopment [7,19]. Contemplating the design of the country system from the recognitionof national risk chains and understanding how they correlate with residential flows caneffectively challenge current climate change management strategies [22,23].
Finally, our research on marginality in Italy, moves from a literature that is consolidat-ing around these themes. Our most relevant reference has been Michelangelo Russo’s workon fragility, abandonment, and territorial metabolism, published in a series of reports andstudies that suggest an agenda for Italian cities and territories in order to deal with risk andland abandonment. These reports and studies suggest a query of the relationship betweenbuilding processes in Italy and the change to territorial risks [24–27]. To emphasize theurgency of this point of view we should also mention the numerous environmental studiesand research projects carried out in Italy in recent years. Those that we have consulted havedealt with: the strategic importance of territorial maintenance of non-urbanized areas tocounter territorial fragility [28,29]; the value of policies and projects aimed at valorizing andcombatting the abandonment and marginalization of inland areas [30–33]; the valorizationof diffused territorial heritage and of environmental resources [5,34].
3. Materials and Methods
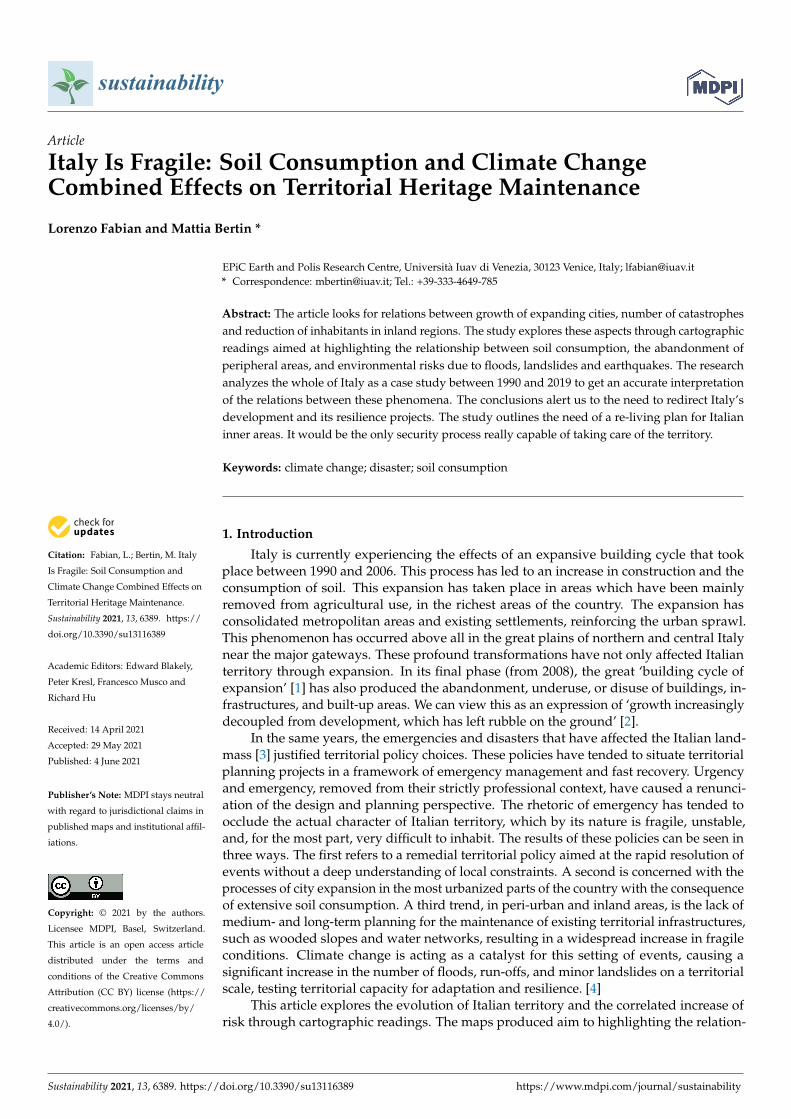
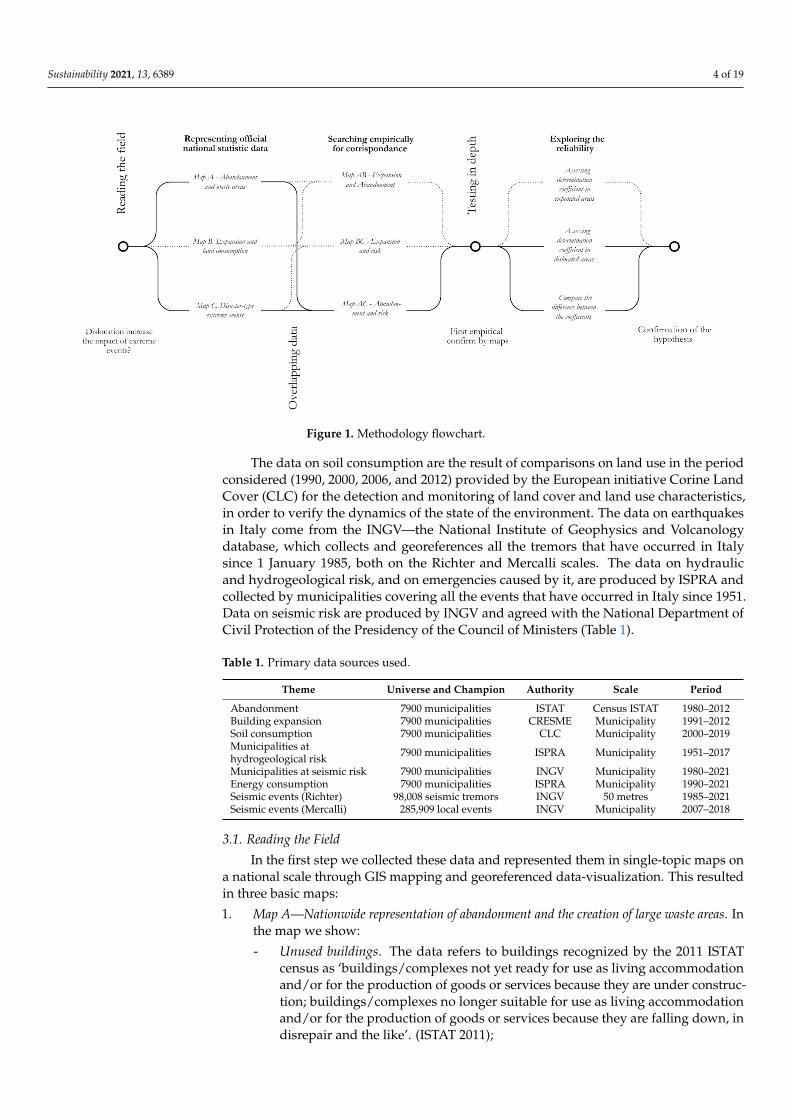
We proceeded in three steps while developing research: reading the field, which was dedi-cated to representing official national statistical data; overlapping the data, where we searched forempirical correspondences; and testing in depth, where we explored reliability (Figure 1).
In order to conduct the three research steps, we investigated the issues and mentionedtheir cartographic representation at the country scale, relying on four categories of data:soil consumption phenomena; abandonment; geological, hydrogeological, and hydraulicrisks; and the seismic events which had occurred.
We made these observations using data collected officially by the government’s sta-tistical and environmental observatories. We used five sources of data, all recognized bySISTAN, the National Statistical System of data collection and evaluation. The data onpopulation are the results of the 2012 ISTAT—the National Institute of Statistics census(the last complete census of the Italian population) and subsequent sectoral surveys by thesame institute; the reference universe is always the entire Italian population collected bycensus (the homogeneous fractions of a municipality) from all Italian municipalities. Dataon building expansion were provided by CRESME, a study centre dedicated to describingand forecasting trends in the economy and the construction market; the universe consistedof all Italian municipalities and corresponds to the sample.
Sustainability 2021, 13, 6389 4 of 19Sustainability 2021, 13, x FOR PEER REVIEW 4 of 19
Figure 1. Methodology flowchart.
We made these observations using data collected officially by the government’s sta-tistical and environmental observatories. We used five sources of data, all recognized by SISTAN, the National Statistical System of data collection and evaluation. The data on population are the results of the 2012 ISTAT—the National Institute of Statistics census (the last complete census of the Italian population) and subsequent sectoral surveys by the same institute; the reference universe is always the entire Italian population collected by census (the homogeneous fractions of a municipality) from all Italian municipalities. Data on building expansion were provided by CRESME, a study centre dedicated to de-scribing and forecasting trends in the economy and the construction market; the universe consisted of all Italian municipalities and corresponds to the sample.
The data on soil consumption are the result of comparisons on land use in the period considered (1990, 2000, 2006, and 2012) provided by the European initiative Corine Land Cover (CLC) for the detection and monitoring of land cover and land use characteristics, in order to verify the dynamics of the state of the environment. The data on earthquakes in Italy come from the INGV—the National Institute of Geophysics and Volcanology da-tabase, which collects and georeferences all the tremors that have occurred in Italy since 1 January 1985, both on the Richter and Mercalli scales. The data on hydraulic and hydro-geological risk, and on emergencies caused by it, are produced by ISPRA and collected by municipalities covering all the events that have occurred in Italy since 1951. Data on seis-mic risk are produced by INGV and agreed with the National Department of Civil Pro-tection of the Presidency of the Council of Ministers (Table 1).
Table 1. Primary data sources used.
Theme Universe and Champion Authority Scale Period Abandonment 7900 municipalities ISTAT Census ISTAT 1980–2012 Building expansion 7900 municipalities CRESME Municipality 1991–2012 Soil consumption 7900 municipalities CLC Municipality 2000–2019 Municipalities at hydrogeological risk 7900 municipalities ISPRA Municipality 1951–2017 Municipalities at seismic risk 7900 municipalities INGV Municipality 1980–2021 Energy consumption 7900 municipalities ISPRA Municipality 1990–2021 Seismic events (Richter) 98,008 seismic tremors INGV 50 metres 1985–2021 Seismic events (Mercalli) 285,909 local events INGV Municipality 2007–2018
Figure 1. Methodology flowchart.
The data on soil consumption are the result of comparisons on land use in the periodconsidered (1990, 2000, 2006, and 2012) provided by the European initiative Corine LandCover (CLC) for the detection and monitoring of land cover and land use characteristics,in order to verify the dynamics of the state of the environment. The data on earthquakesin Italy come from the INGV—the National Institute of Geophysics and Volcanologydatabase, which collects and georeferences all the tremors that have occurred in Italysince 1 January 1985, both on the Richter and Mercalli scales. The data on hydraulicand hydrogeological risk, and on emergencies caused by it, are produced by ISPRA andcollected by municipalities covering all the events that have occurred in Italy since 1951.Data on seismic risk are produced by INGV and agreed with the National Department ofCivil Protection of the Presidency of the Council of Ministers (Table 1).
Table 1. Primary data sources used.
Theme Universe and Champion Authority Scale Period
Abandonment 7900 municipalities ISTAT Census ISTAT 1980–2012Building expansion 7900 municipalities CRESME Municipality 1991–2012Soil consumption 7900 municipalities CLC Municipality 2000–2019Municipalities athydrogeological risk 7900 municipalities ISPRA Municipality 1951–2017
Municipalities at seismic risk 7900 municipalities INGV Municipality 1980–2021Energy consumption 7900 municipalities ISPRA Municipality 1990–2021Seismic events (Richter) 98,008 seismic tremors INGV 50 metres 1985–2021Seismic events (Mercalli) 285,909 local events INGV Municipality 2007–2018
3.1. Reading the Field
In the first step we collected these data and represented them in single-topic maps ona national scale through GIS mapping and georeferenced data-visualization. This resultedin three basic maps:
1. Map A—Nationwide representation of abandonment and the creation of large waste areas. Inthe map we show:
- Unused buildings. The data refers to buildings recognized by the 2011 ISTATcensus as ‘buildings/complexes not yet ready for use as living accommodationand/or for the production of goods or services because they are under construc-tion; buildings/complexes no longer suitable for use as living accommodationand/or for the production of goods or services because they are falling down, indisrepair and the like’. (ISTAT 2011);
Sustainability 2021, 13, 6389 5 of 19
- Underused dwellings. The data refers to dwellings where it is not possible torecognize the characteristics of ‘dwellings occupied by persons who have theirusual residence in them, even if temporarily absent [...]’ (ISTAT 2011);
- Abandoned sites. Locations with only unused buildings (ISTAT 2011, statisticalglossary, entry ‘unused building or complex of buildings’);
- Localities without residents. This shows all localities where the resident population,specifically ‘persons having their usual residence in the municipality’ (ISTAT2011, statistical glossary, entry ‘resident population’), is zero;
- Municipalities classified as intermediate, peripheral and ultra-peripheral by theNational Strategy for Inland Areas (SNAI 2013).
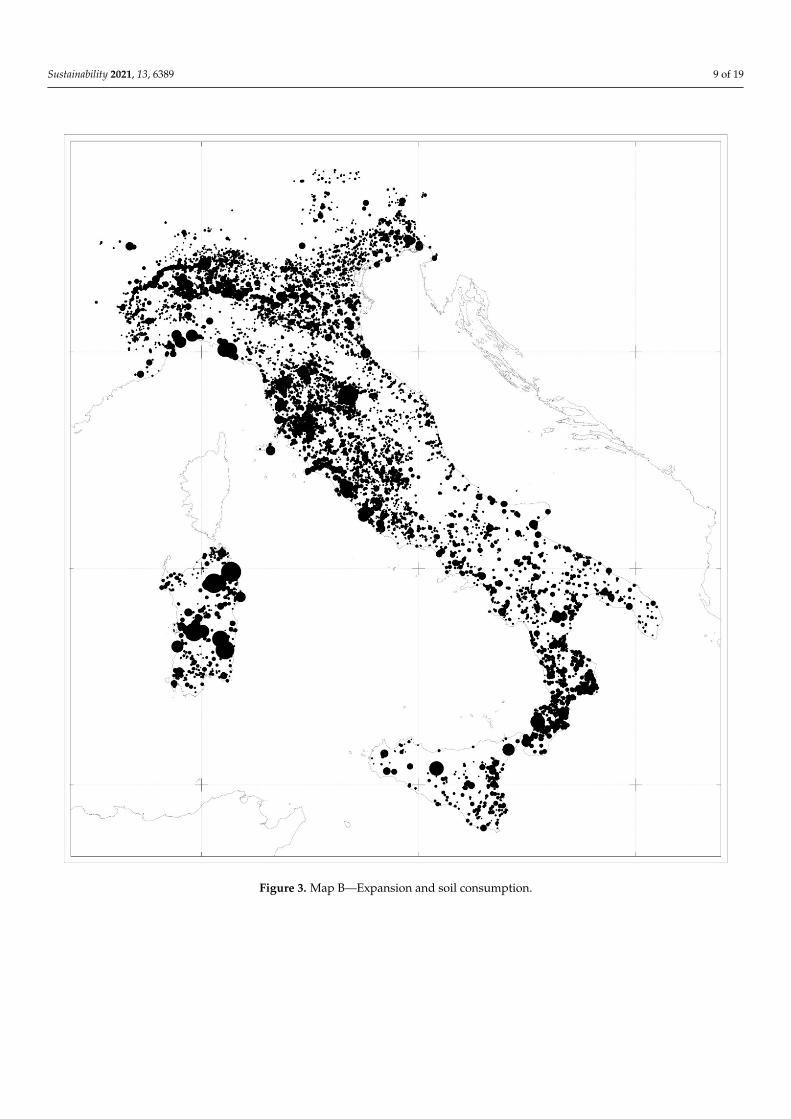
2. Map B—Expansion and soil consumption. The map shows the soil consumption calcu-lated from a comparison of land use maps based on satellite images from 1990, 2000,and 2006. (CLC 1990/2000/2006) (The National Strategy for Inland Areas (SNAI 2013)identifies inland areas as those which are significantly distant from the centers of sup-ply of essential services (education, health and mobility). The inland areas are dividedinto intermediate, peripheral and ultra-peripheral areas. This category account ap-proximately 53% of the Italian municipalities (4261). The inland areas account 23% ofthe Italian population according to the last census (13.5 million inhabitants)).
3. Map C—Extreme events of a catastrophic character (hydraulic, hydrogeological, seismic).We have superimposed the phenomena of overflow, flood, SLR, landslides, andearthquakes to create a map of land impacts. The map shows:
- Areas subject to landslides; source: ISPRA (Italian National Institute for Environ-mental Protection and Research);
- Areas subject to medium-high risk of flooding; source: ISPRA (Italian National Insti-tute for Environmental Protection and Research);
- Areas subject to polygonal and superficial landslides; source: ISPRA (Italian NationalInstitute for Environmental Protection and Research);
- Earthquakes from the year 1000 to 2014 of Richter magnitude greater than 5, fromthe parametric catalogue of Italian territories (source: reworked by the NationalInstitute of Geophysics and Volcanology);
- Seismogenic faults; source: European Seismogenic Faults Database.
These three maps provided a first basic documentation on which to develop subse-quent comparisons.
3.2. Overlapping the Data
In the second step, we carried out a process of empirical comparison between themaps to identify possible correspondences. These correspondences suggested the simplecoexistence of phenomena. First, we compared the data, and collected the aforementionedprocesses in a univocal format. We compared each of the maps with the other two. Thisproduced three correspondence maps:
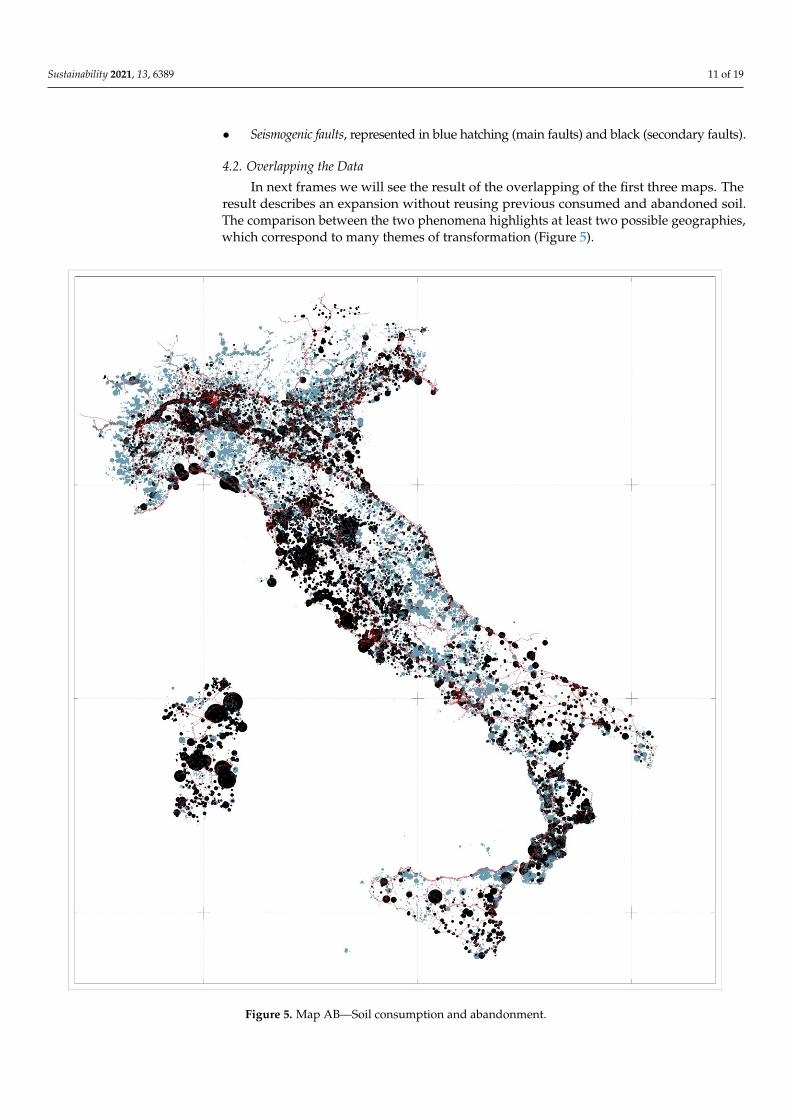
1. Map AB—Soil consumption and abandonment. The first correspondence map investigatesthe coexistence or differential location of soil consumption and land abandonmentphenomena. We developed the cartographic comparison of soil consumption andabandonment phenomena between 1990 and 2009, corresponding to the expansivebuilding cycle, and then in control form from 2008 to 2019. This classification makesit possible to map the major flows of capital and residents between different areas ofthe country, thus establishing vectors of investment and depopulation.
2. Map BC—Soil consumption and extreme events. The second correspondence map investi-gates the increase, decrease, or non-correlation between the extreme events consideredand the soil consumption processes since the last building expansion phase until today(1991–2019).
3. Map AC—Abandonment and extreme events. The third correspondence map investigatesthe increase, decrease, or non-correlation between the extreme events considered and
Sustainability 2021, 13, 6389 6 of 19
the processes of land abandonment since the last expansionary building phase to date(1991–2019).
Step 2 led to two hermeneutic-empirical comparisons. The first was between thebuilding process and the process of land abandonment by residents. The second wasbetween the process of land abandonment and the number of catastrophic impacts thathad occurred.
3.3. Testing in Depth
After the second step, we recognized a particularly significant phenomenon that wedevelop here in order to complete the presentation of the methodology: in Map BC SoilConsumption and Extreme Events, we recognized an increase in climate-change relatedimpacts but not seismic ones; in Map AC, Abandonment and Extreme Events, seismicphenomena also increase if measured in Mercalli, and not only in completely uninhabitedmunicipalities. This element, if confirmed experimentally, would be of great importance: itwould show that the increase in impacts in Italy is not only linked to the increase in climatechange phenomena but also has another origin. As is well known, the Mercalli–Cancani–Sieberg scale evaluates the intensity of an earthquake which, unlike the Richter scale, iscarried out by observing the effects that an earthquake produces on people, things, andartefacts. It therefore depends on the level of anthropization and the state of maintenanceof infrastructures and buildings in an area. This control has allowed us to establish whetherthe abandonment of the inner areas actually leads to an increase in the severity of theimpacts on inhabited areas.
To assess a control of this factor, we selected two samples of municipalities definedby the National Strategy for Inner Areas. The first sample corresponds to municipalitiesclassified as poles, i.e., the second class according to attractiveness (217 municipalities, seeTable 2 p.7). The second sample corresponds to municipalities classified as peripheral, i.e.,the penultimate class according to attractiveness (1522 municipalities). Although thereare very different numbers of samples per class, the combined surface area and numberof residents are comparable. This has allowed us to exclude cases of total abandonmentand great acceleration in transformation, instead including two classes that are morerepresentative of phenomena that are widespread on a national scale.
Table 2. Correlation between: municipalities classification in National Strategy for Inner Areas; % oflocations without inhabitants per municipality; % of unused buildings per municipality.
Class% Location
withoutInhabitants
UnusedBuildings
TotalBuildings
% UnusedBuildings
Ultraperipheral 13% 17,230.00 248,957.00 7%Peripheral 46% 95,469.00 1,296,140.00 7%Intermediate 0% 137,368.00 2,251,405.00 6%Belt 26% 161,364.00 3,359,258.00 5%Inter-municipal poles 1% 14,917.00 368,249.00 4%Poles 14% 93,407.00 2,593,382.00 4%Internal areas 59% 250,067.00 3,796,502.00 7%Central areas 41% 269,688.00 6,320,889.00 4%
We counted the number of municipalities affected by earthquakes of Mercalli intensitygreater than 2 and less than 9 per class for each year from 2007 to 2017. We calculatedthe coefficient of determination R2 of the 2007–2017 sequence for each of the two classesof samples. Finally, we compared the R2 coefficient of the two sequences to understandif indeed there were mathematically relevant different behaviours that could suggest aconnection between land abandonment and increased seismic impacts in municipalitieswith no inhabitants.
Sustainability 2021, 13, 6389 7 of 19
4. Results
The methodology allowed us to frame the Italian country system by aggregatingand relating phenomena that are often studied independently. In this section we see theresults of the methodology arising from the three steps followed, while leaving as much aspossible to the discussion section.
4.1. Reading the Field
The first step of analysis provided us with solid maps, which contained a greatconcentration of information homogeneously distributed over the whole Italian territory.Each of the maps allows a synthetic reading of the phenomenon, with a series of elementswhich are able to orient sectoral policies for the reduction of risk and abandonment. Inparticular we note three results emerging from the separate analysis of the three maps. Inthe next pages we will see in detail the frames that emerged from this first step.
From the analysis of the three maps and the outcome of the first step (see the Table 2for a presentation of this step results), we can observe some initial results:
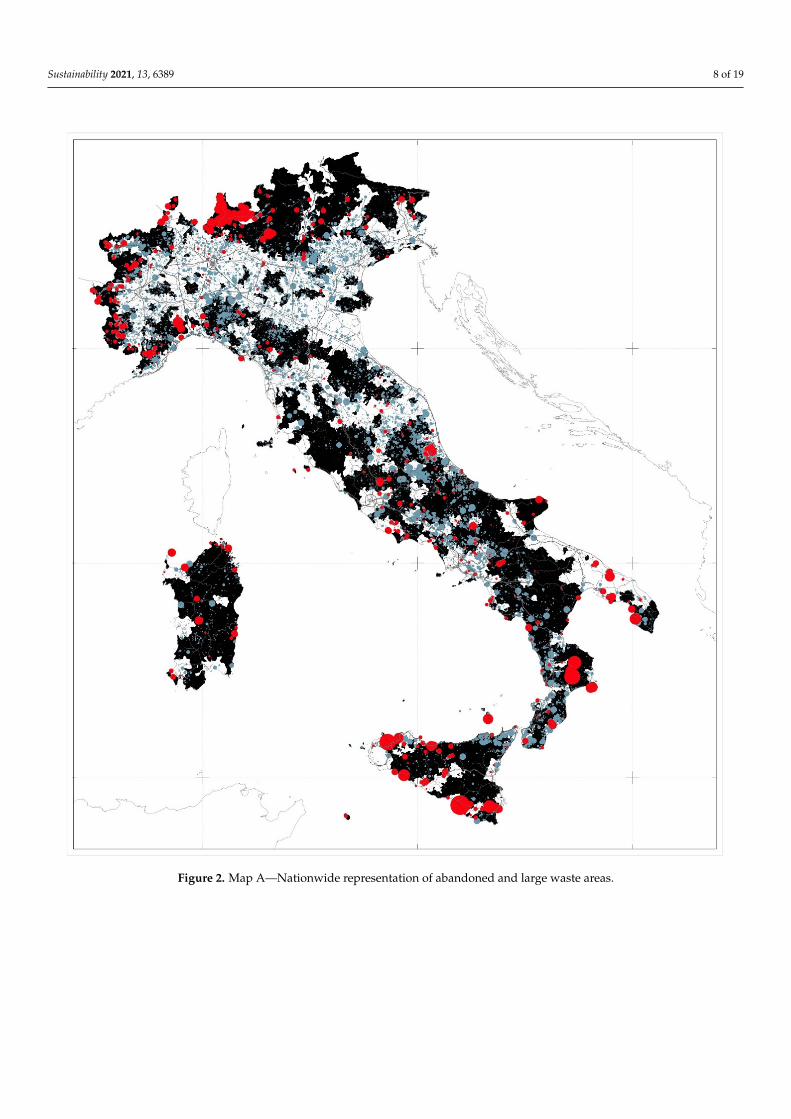
1. The spaces of abandonment correspond to the peripheral areas recognized by theNational Strategy for Inner Areas with a very-high level of overlapping. Most ofthese territories are located in mountain or foothill environments, in the Alps andApennines, and on islands. This confirmation, however, calls into question the resultsof the policies associated with the National Strategy for Inner Areas, suggesting asubstantial ineffectiveness of the approach used until now (Figures 2 and 3).
2. The spaces of expansion overlap with the aggregation poles recognized by the NationalStrategy for Inner Areas with a very-high degree of coherence. Most of them correspondto the large industrial and service centres of the North and Centre (Table 2).
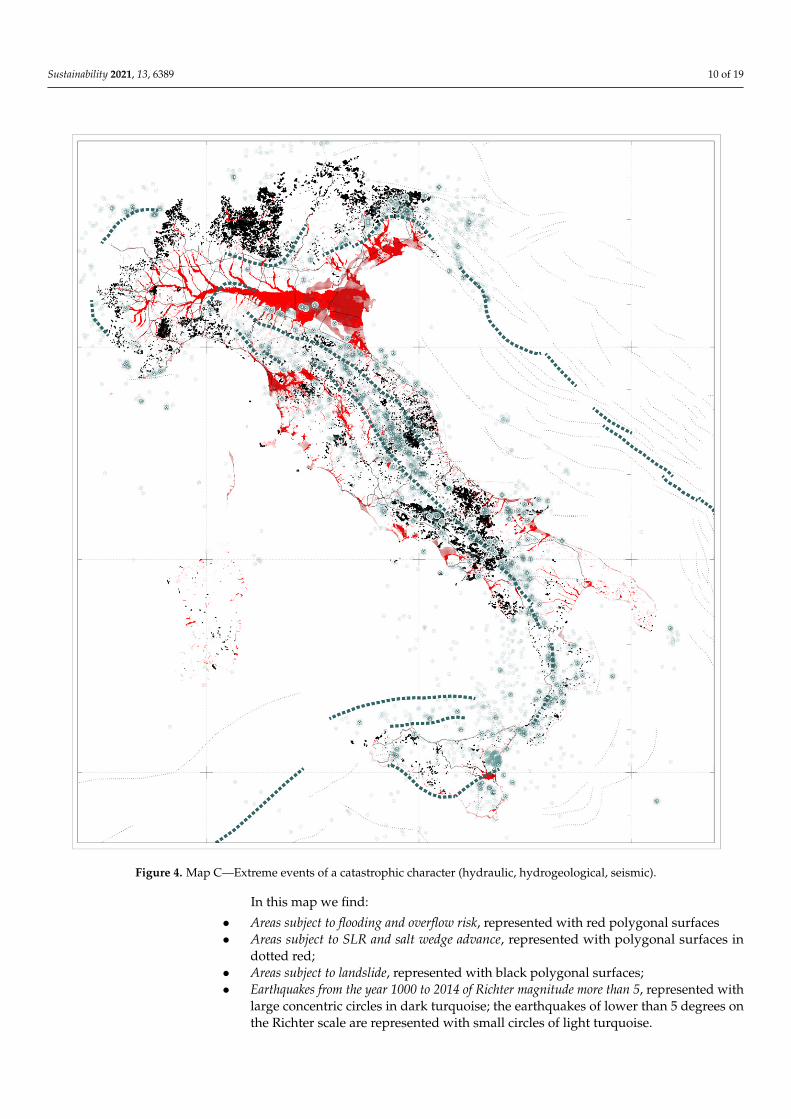
3. Seismic events are located all over the country, but with a higher density in the Apen-nine and pre-alpine areas. Landslide and geological instability events are distributedover the same areas. Most hydraulic events, on the other hand, occur in densifyinglowland areas (Figure 4).
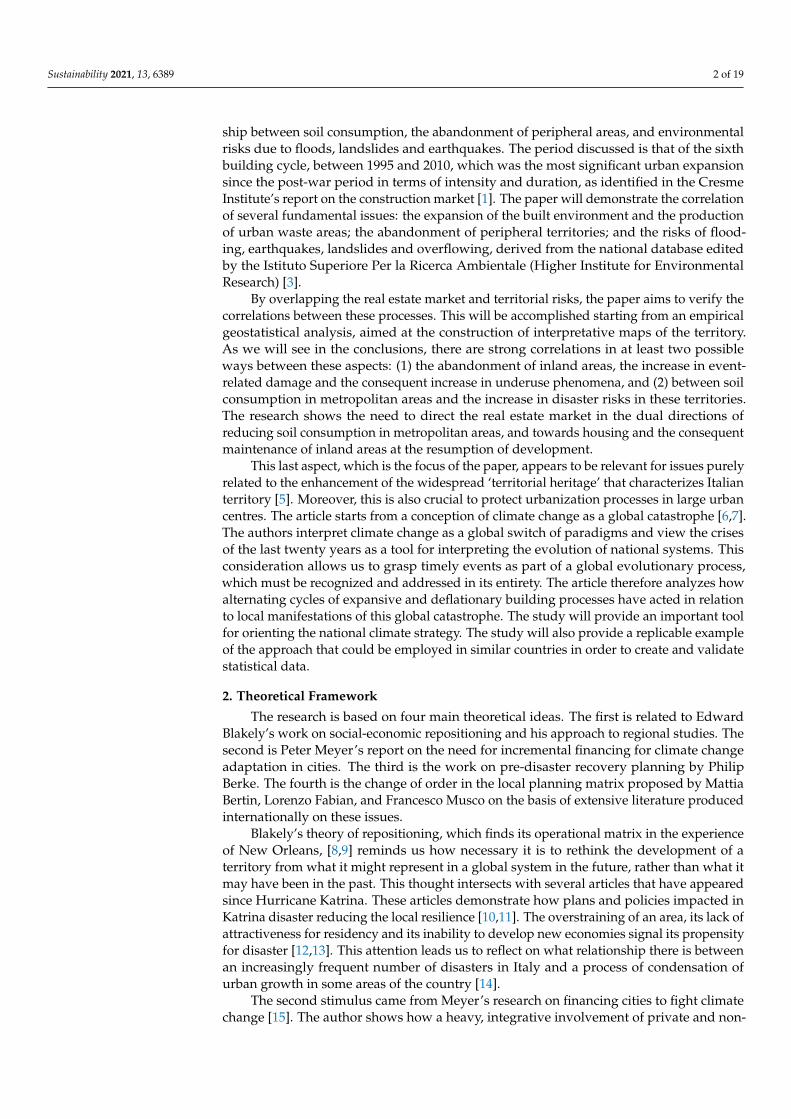
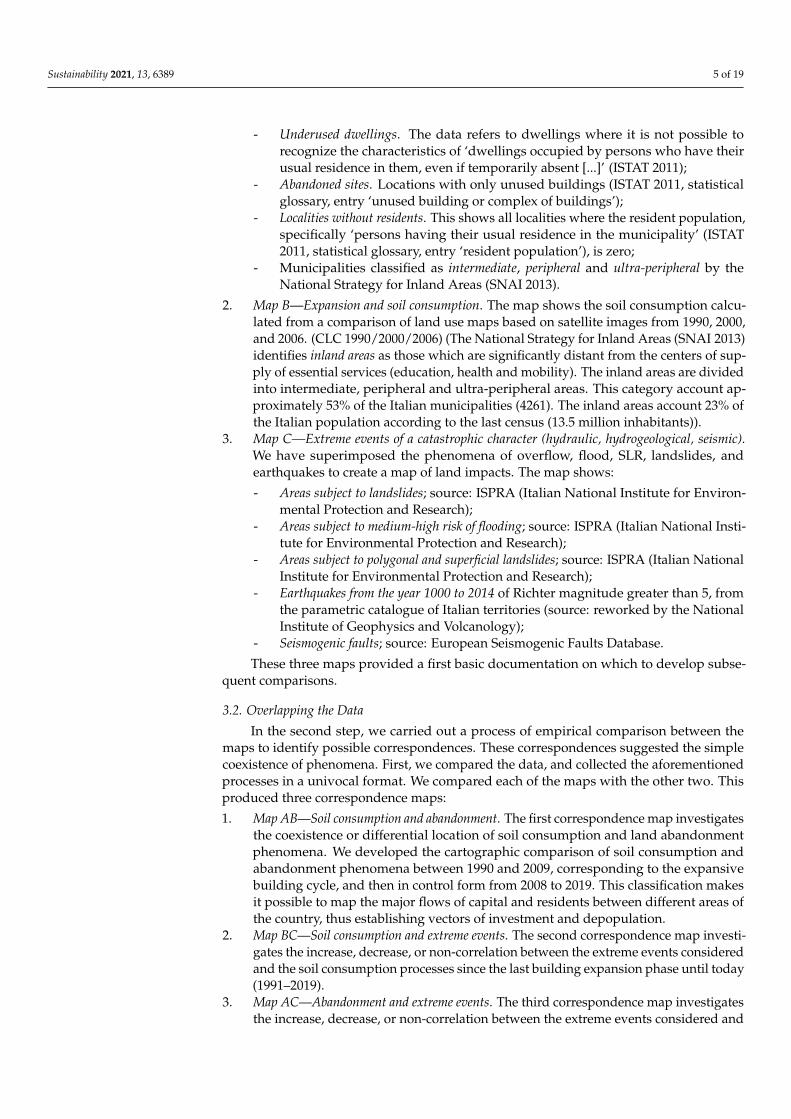
Map A has been used to study Nationwide representation of abandoned and largewaste areas (Figure 2). In this map we find:
• Unused buildings, represented by black circles proportional in size to the numberof total buildings (unused buildings/total buildings), spaced on the centroid of thereference census.
• Abandoned localities, where only unused buildings are present, represented by redcircles whose radius is proportional to the number of buildings in the locality.
• Inland areas, recognized by SNAI (see note at p. 5) and represented with black areas onthe map.
The data is represented by circles with a radius proportional to the hectares of soilconsumed spatialized in the centroid of the corresponding cartographic polygon calculatedfrom a comparison of land use maps from satellite images (CLC 1990/2000/2006).
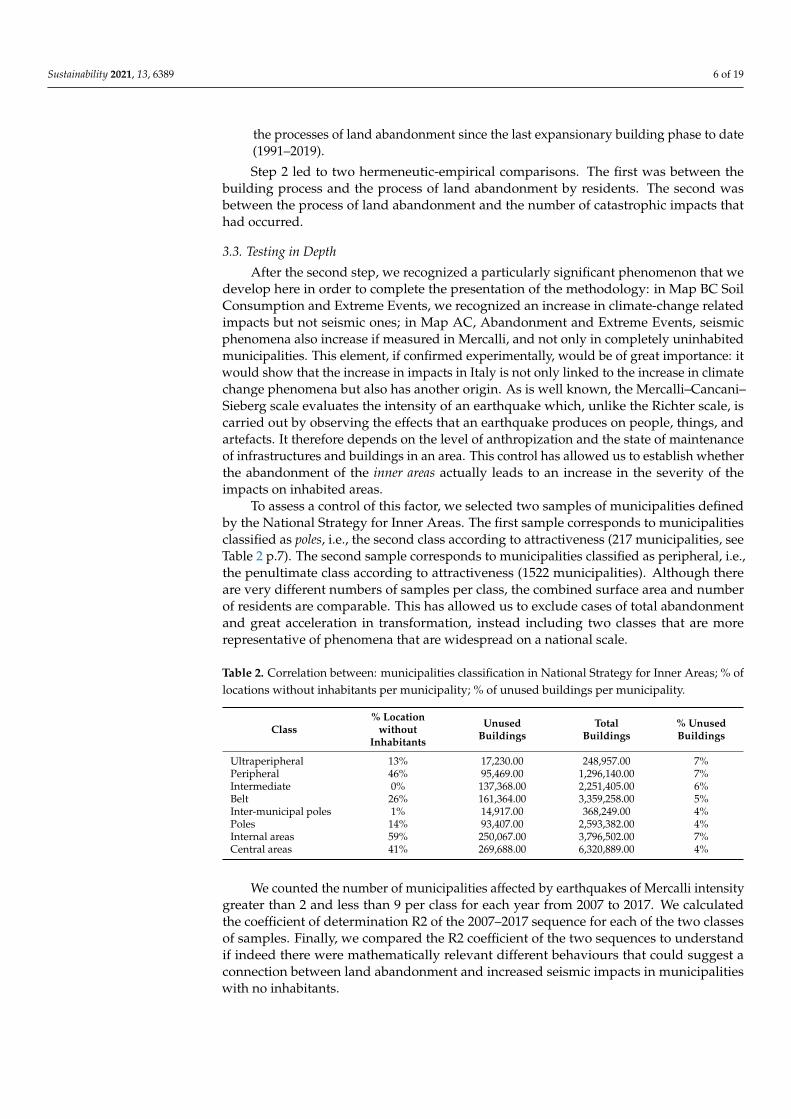
Map B and Table 3 describe the overlapping of expansion and soil consumption.
Table 3. Percentages of consumed soil in land use classes: the artificial surfaces with detail at CorineLand Cover (CLC) level 3.
CLC Code Typology of Land Use ConsumedSoil (%) in Year: 1990 2000 2006
111 Continuous urban fabric 82.4 83.2 84.8112 Discontinuous urban fabric 61.0 61.9 64.1121 Industrial or commercial areas 70.6 72.0 73.6
122 Road and rail networks andassociated spaces 66.0 65.4 69.4
123 Port areas 85.3 86.3 86.2124 Airports 29.9 30.5 37.2
Sustainability 2021, 13, 6389 8 of 19
Sustainability 2021, 13, x FOR PEER REVIEW 8 of 19
The data is represented by circles with a radius proportional to the hectares of soil consumed spatialized in the centroid of the corresponding cartographic polygon calcu-lated from a comparison of land use maps from satellite images (CLC 1990/2000/2006).
Figure 2. Map A—Nationwide representation of abandoned and large waste areas.
Map B and Table 3 describe the overlapping of expansion and soil consumption.
Figure 2. Map A—Nationwide representation of abandoned and large waste areas.
Sustainability 2021, 13, 6389 9 of 19Sustainability 2021, 13, x FOR PEER REVIEW 9 of 19
Figure 3. Map B—Expansion and soil consumption.
Table 3. Percentages of consumed soil in land use classes: the artificial surfaces with detail at Corine Land Cover (CLC) level 3.
CLC Code Typology of Land Use Consumed Soil (%) in Year: 1990 2000 2006 111 Continuous urban fabric 82.4 83.2 84.8 112 Discontinuous urban fabric 61.0 61.9 64.1 121 Industrial or commercial areas 70.6 72.0 73.6 122 Road and rail networks and associated spaces 66.0 65.4 69.4 123 Port areas 85.3 86.3 86.2 124 Airports 29.9 30.5 37.2
Figure 3. Map B—Expansion and soil consumption.
Sustainability 2021, 13, 6389 10 of 19Sustainability 2021, 13, x FOR PEER REVIEW 10 of 19
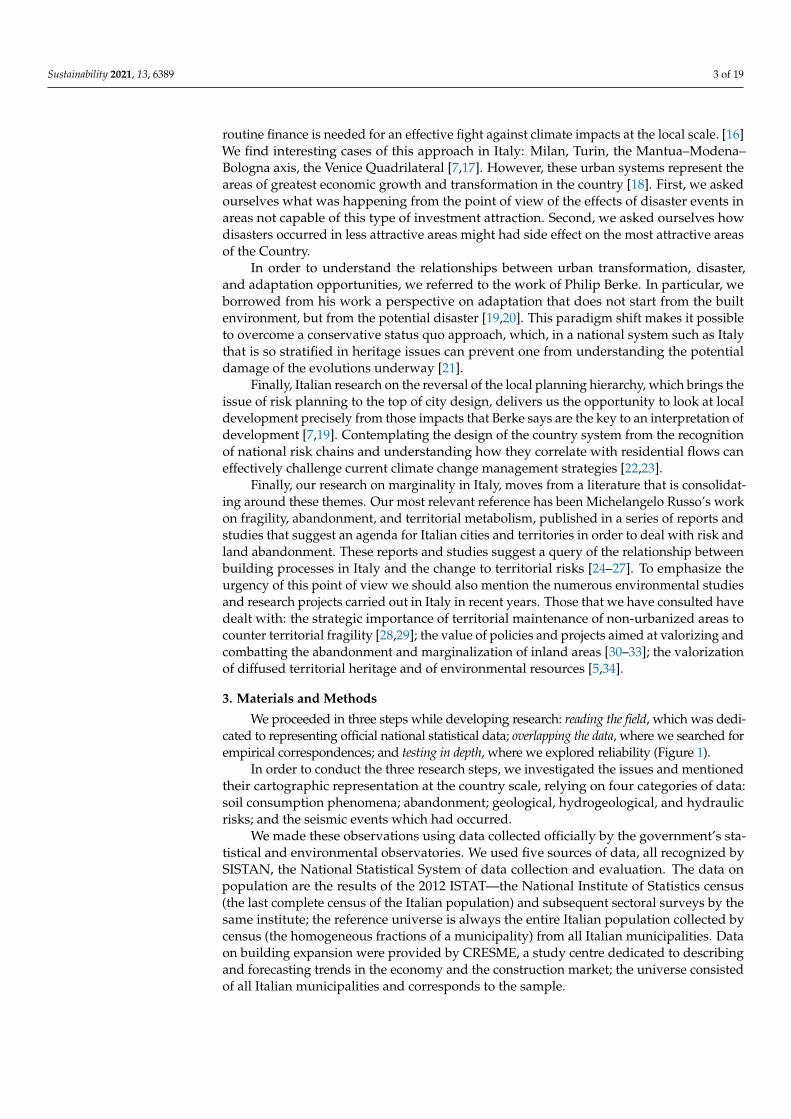
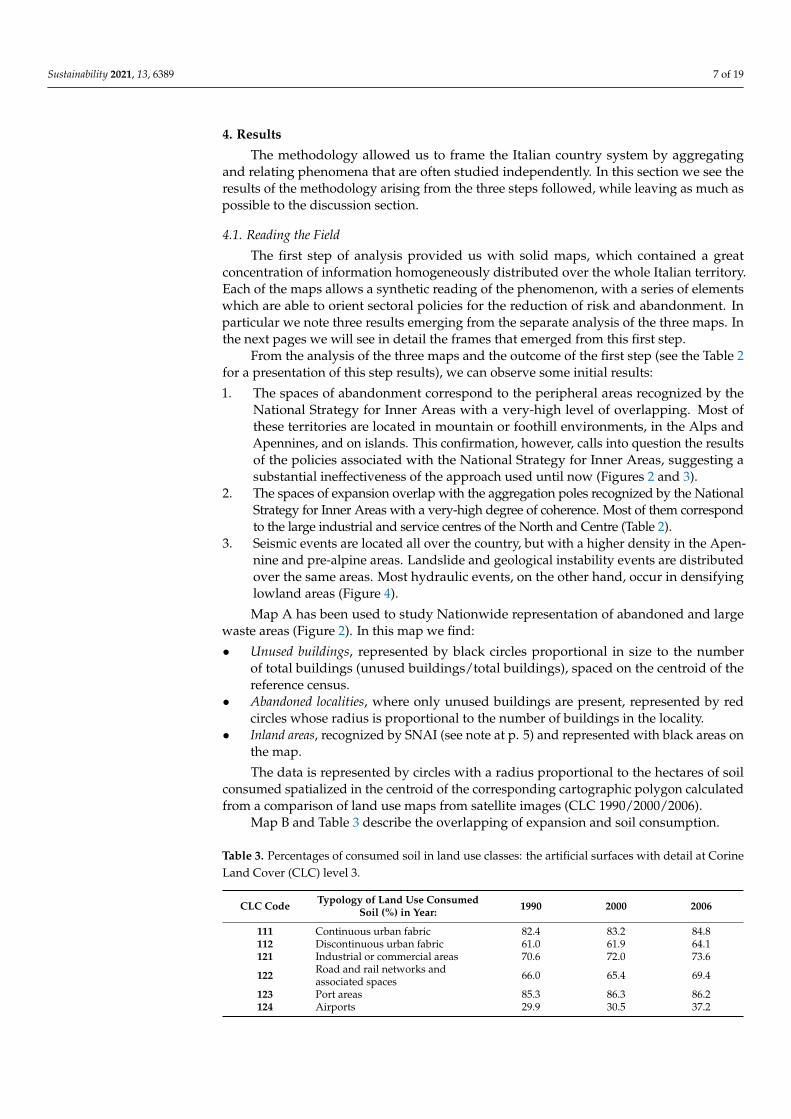
Figure 4. Map C—Extreme events of a catastrophic character (hydraulic, hydrogeological, seismic).
In this map we find: • Areas subject to flooding and overflow risk, represented with red polygonal surfaces • Areas subject to SLR and salt wedge advance, represented with polygonal surfaces in
dotted red; • Areas subject to landslide, represented with black polygonal surfaces; • Earthquakes from the year 1000 to 2014 of Richter magnitude more than 5, represented with
large concentric circles in dark turquoise; the earthquakes of lower than 5 degrees on the Richter scale are represented with small circles of light turquoise.
• Seismogenic faults, represented in blue hatching (main faults) and black (secondary faults).
4.2. Overlapping the Data
Figure 4. Map C—Extreme events of a catastrophic character (hydraulic, hydrogeological, seismic).
In this map we find:
• Areas subject to flooding and overflow risk, represented with red polygonal surfaces• Areas subject to SLR and salt wedge advance, represented with polygonal surfaces in
dotted red;• Areas subject to landslide, represented with black polygonal surfaces;• Earthquakes from the year 1000 to 2014 of Richter magnitude more than 5, represented with
large concentric circles in dark turquoise; the earthquakes of lower than 5 degrees onthe Richter scale are represented with small circles of light turquoise.
Sustainability 2021, 13, 6389 11 of 19
• Seismogenic faults, represented in blue hatching (main faults) and black (secondary faults).
4.2. Overlapping the Data
In next frames we will see the result of the overlapping of the first three maps. Theresult describes an expansion without reusing previous consumed and abandoned soil.The comparison between the two phenomena highlights at least two possible geographies,which correspond to many themes of transformation (Figure 5).
Sustainability 2021, 13, x FOR PEER REVIEW 11 of 19
In next frames we will see the result of the overlapping of the first three maps. The result describes an expansion without reusing previous consumed and abandoned soil. The comparison between the two phenomena highlights at least two possible geogra-phies, which correspond to many themes of transformation. (Figure 5)
Figure 5. Map AB—Soil consumption and abandonment.
The first of these geographies illuminates the same urban areas in which the real es-tate market has been most dynamic; this is most evident around the large cities of the Po Plain, such as the metropolitan area extending from Milan to Brescia via Bergamo, or the conurbation extending between Padua, Venice, and Treviso. In these contexts, it is possi-ble to observe how the phenomena of soil consumption and unused land coincide; unused land is sometimes an expression of abandonment, sometimes of buildings under construc-tion, and sometimes of real estate projects begun but never completed. The second de-scribes a geography of abandonment, coinciding with inland and less accessible areas,
Figure 5. Map AB—Soil consumption and abandonment.
Sustainability 2021, 13, 6389 12 of 19
The first of these geographies illuminates the same urban areas in which the realestate market has been most dynamic; this is most evident around the large cities of thePo Plain, such as the metropolitan area extending from Milan to Brescia via Bergamo, orthe conurbation extending between Padua, Venice, and Treviso. In these contexts, it ispossible to observe how the phenomena of soil consumption and unused land coincide;unused land is sometimes an expression of abandonment, sometimes of buildings underconstruction, and sometimes of real estate projects begun but never completed. The seconddescribes a geography of abandonment, coinciding with inland and less accessible areas,more evident in the Alps and Apennines, which is particularly intense in Apulia and Sicily.In this geography, unused buildings more often correspond to abandoned buildings andentire territories.
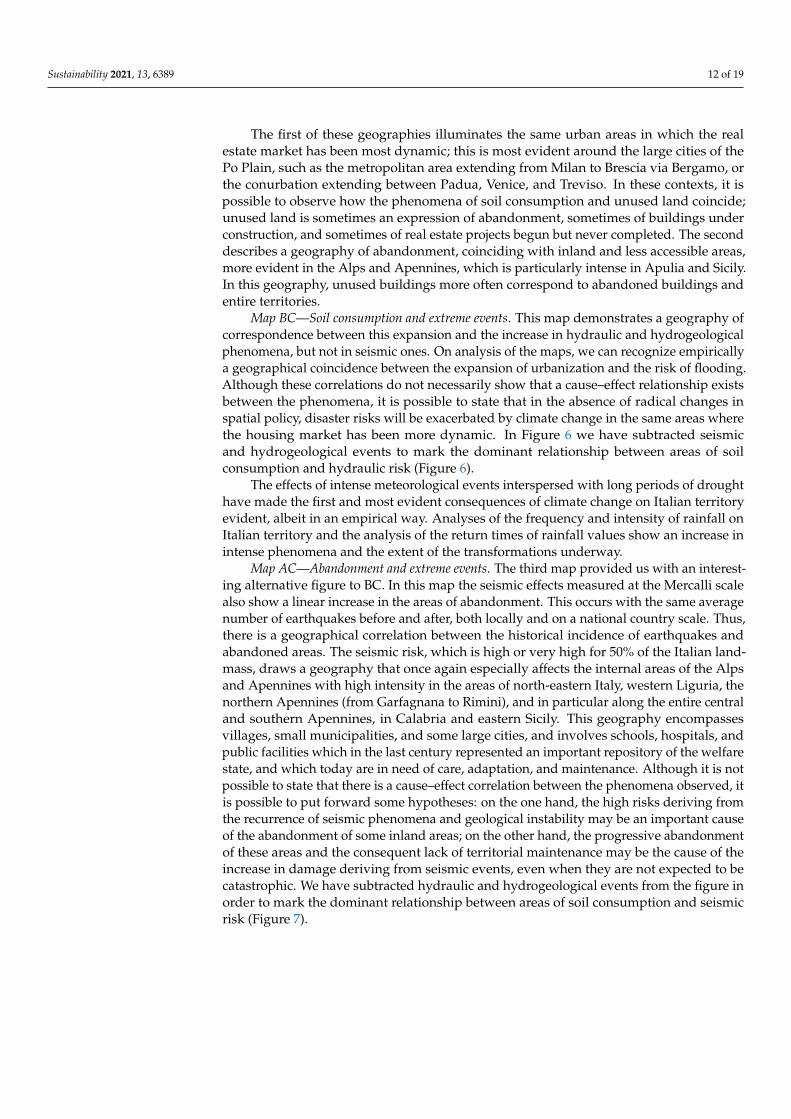
Map BC—Soil consumption and extreme events. This map demonstrates a geography ofcorrespondence between this expansion and the increase in hydraulic and hydrogeologicalphenomena, but not in seismic ones. On analysis of the maps, we can recognize empiricallya geographical coincidence between the expansion of urbanization and the risk of flooding.Although these correlations do not necessarily show that a cause–effect relationship existsbetween the phenomena, it is possible to state that in the absence of radical changes inspatial policy, disaster risks will be exacerbated by climate change in the same areas wherethe housing market has been more dynamic. In Figure 6 we have subtracted seismicand hydrogeological events to mark the dominant relationship between areas of soilconsumption and hydraulic risk (Figure 6).
The effects of intense meteorological events interspersed with long periods of droughthave made the first and most evident consequences of climate change on Italian territoryevident, albeit in an empirical way. Analyses of the frequency and intensity of rainfall onItalian territory and the analysis of the return times of rainfall values show an increase inintense phenomena and the extent of the transformations underway.
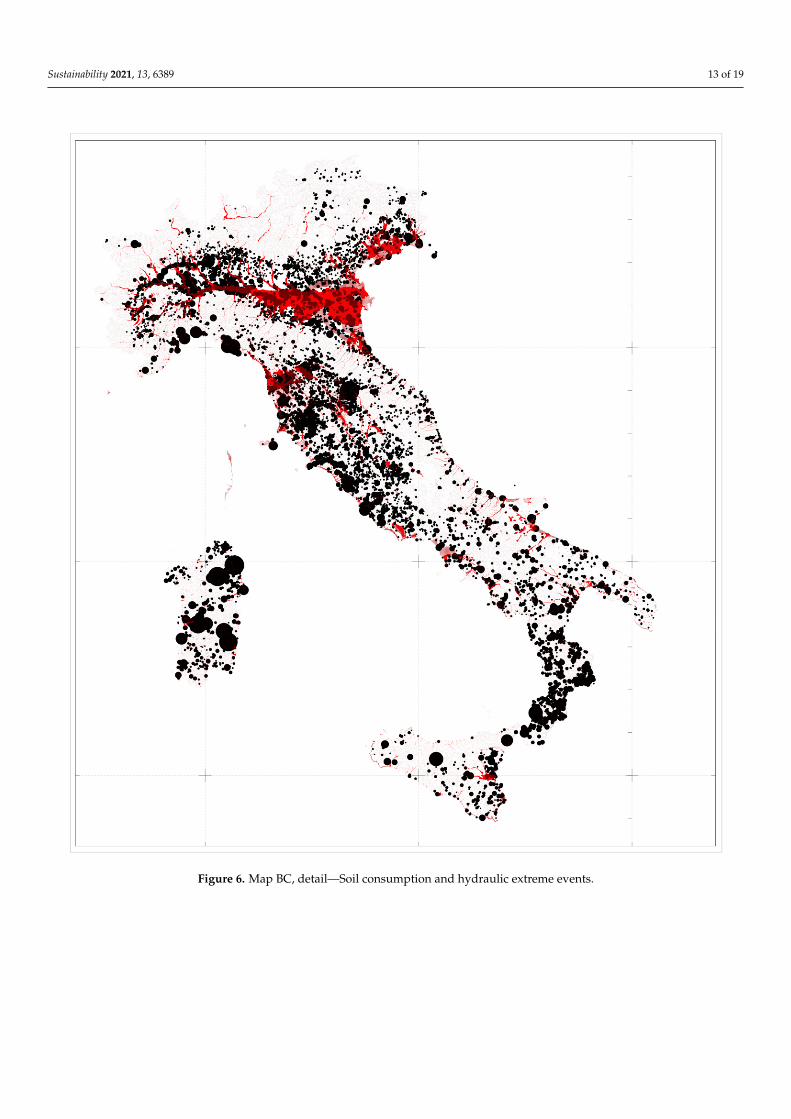
Map AC—Abandonment and extreme events. The third map provided us with an interest-ing alternative figure to BC. In this map the seismic effects measured at the Mercalli scalealso show a linear increase in the areas of abandonment. This occurs with the same averagenumber of earthquakes before and after, both locally and on a national country scale. Thus,there is a geographical correlation between the historical incidence of earthquakes andabandoned areas. The seismic risk, which is high or very high for 50% of the Italian land-mass, draws a geography that once again especially affects the internal areas of the Alpsand Apennines with high intensity in the areas of north-eastern Italy, western Liguria, thenorthern Apennines (from Garfagnana to Rimini), and in particular along the entire centraland southern Apennines, in Calabria and eastern Sicily. This geography encompassesvillages, small municipalities, and some large cities, and involves schools, hospitals, andpublic facilities which in the last century represented an important repository of the welfarestate, and which today are in need of care, adaptation, and maintenance. Although it is notpossible to state that there is a cause–effect correlation between the phenomena observed, itis possible to put forward some hypotheses: on the one hand, the high risks deriving fromthe recurrence of seismic phenomena and geological instability may be an important causeof the abandonment of some inland areas; on the other hand, the progressive abandonmentof these areas and the consequent lack of territorial maintenance may be the cause of theincrease in damage deriving from seismic events, even when they are not expected to becatastrophic. We have subtracted hydraulic and hydrogeological events from the figure inorder to mark the dominant relationship between areas of soil consumption and seismicrisk (Figure 7).
Sustainability 2021, 13, 6389 13 of 19Sustainability 2021, 13, x FOR PEER REVIEW 13 of 19
Figure 6. Map BC, detail—Soil consumption and hydraulic extreme events. Figure 6. Map BC, detail—Soil consumption and hydraulic extreme events.
Sustainability 2021, 13, 6389 14 of 19Sustainability 2021, 13, x FOR PEER REVIEW 14 of 19
Figure 7. Map AC, detail—Abandonment and seismic extreme events.
4.3. Testing in Depth After the second step, we considered it necessary to investigate the divergences be-
tween maps BC and AC with regard to seismic risk. As can be seen in Table 4, the result was a solid confirmation of what was visible from the empirical analysis of the maps. The Poles are the municipalities in economic and population growth. The Peripheries are the municipalities in decline. In the general column we see all events with a Mercalli magni-tude of over 2 degrees, which means that the events are capable of causing visible damage each year. We have also subtracted events with a Mercalli magnitude of over 9 degrees from the study to focus on the effects of events on buildings and excluding events capable of damaging road systems and the environmental landscape. In the column Poles we see the events above 2 degrees and below 9 degrees that have affected a municipality in this
Figure 7. Map AC, detail—Abandonment and seismic extreme events.
4.3. Testing in Depth
After the second step, we considered it necessary to investigate the divergencesbetween maps BC and AC with regard to seismic risk. As can be seen in Table 4, the resultwas a solid confirmation of what was visible from the empirical analysis of the maps. ThePoles are the municipalities in economic and population growth. The Peripheries are themunicipalities in decline. In the general column we see all events with a Mercalli magnitudeof over 2 degrees, which means that the events are capable of causing visible damage eachyear. We have also subtracted events with a Mercalli magnitude of over 9 degrees from
Sustainability 2021, 13, 6389 15 of 19
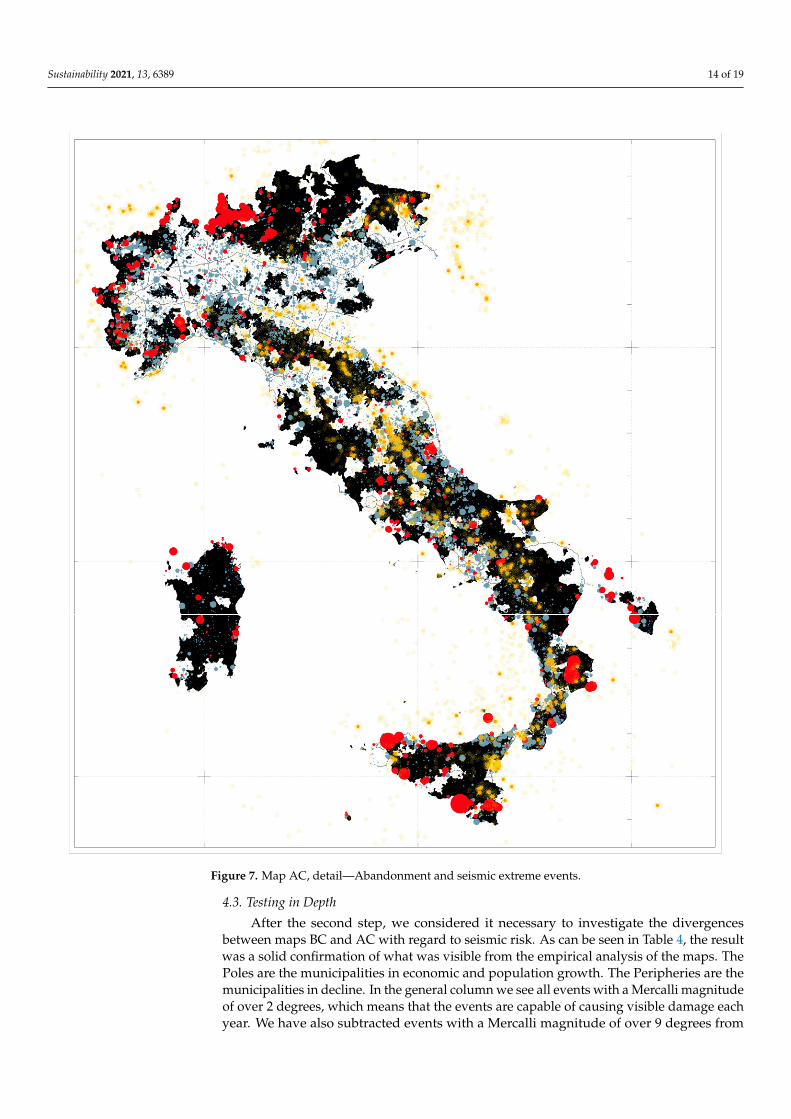
the study to focus on the effects of events on buildings and excluding events capable ofdamaging road systems and the environmental landscape. In the column Poles we seethe events above 2 degrees and below 9 degrees that have affected a municipality in thiscategory. In the Peripheries column we see the events in the same vicinity that have affectedthis category. We have normalized the data with the formula (nEvents Category/totalevents) to show the progression net of the total events for the year (see Table 4).
Table 4. Determination coefficient of the annual increase in damage per seismic event in ‘poles’ ofaggregation and ‘periphery’ of the country.
Year. Total nEvents
n Events inPoles 2 < x < 9
Poles EventsNormalized
n Events inPeripheries
2 < x < 9
PeripheriesEvents
Normalized
2007 712 433 0.608 268 0.3762008 2216 1525 0.688 573 0.2592009 31,504 6650 0.211 5362 0.172010 15,136 2462 0.162 1892 0.1252011 21,639 3201 0.148 3186 0.1472012 83,115 19,084 0.23 6902 0.0832013 27,276 5652 0.207 3493 0.1282014 17,799 3016 0.169 2299 0.1292015 14,226 2296 0.161 1900 0.1342016 47,914 9888 0.206 6439 0.1342017 24,372 3674 0.151 2592 0.106
R2 0.1782 0.365
The poles have a non-linear trend that is correlated to the total events. The pole’scoefficient of determination is not at all significant. The periphery class has a progressionwith a considerably more solid coefficient of determination. In short, we can concludeour examination of the results by mathematically certifying a strong correlation betweenabandonment of the Inner Areas and an increase in earthquake damage. This is an im-portant finding because it allows us to overcome the simple correlation between climatechange and increased damage. This coefficient provides a scientific confirmation of therelationship between the decrease of inhabitants and the increase of damage caused byextreme events.
5. Discussion
The research allows us to shed light on the processes of abandonment and densificationthat began in Italy a long time ago. The phenomenon of decades-long migration wherebylarge parts of the population move from the inner areas to the most productive areas of thecountry is well known and widely analyzed. However, this research refines the readingof the phenomenon by showing the processes and flows of production of waste areas,both in the inner areas and in the expanding areas themselves, which change morphology-consuming soil while not generating surplus soil.
As Italian cities have expanded, entire buildings, office centres, market streets, manu-facturing areas, and polluted territories have been left empty, abandoned, or underused.The great building cycle of expansion, which is now in a phase of intense deflation, hasnot only consumed substantial new portions of land, removing it from agriculture use, butit has also deposited waste of different types and sizes on the ground, which currentlyintroduces some possible geographies of waste and, through this, possible recycling strate-gies. From the analysis of the results, we discover that after the sixth building cycle, thephenomenon of soil consumption has been superimposed by processes of degradation ofother parts of the territory already urbanized in previous eras, highlighting situations thattell us of conditions of disuse or underuse more often than abandonment.
With this cartographic systematization, the research has made it possible to recognize twonew relevant points in the reading of the country. The first of these concerns the relationship
Sustainability 2021, 13, 6389 16 of 19
between urban and territorial transformations and the increase in meteorological impacts. Inthe face of this, in Italy, there appear to be serious shortcomings in both the policies in place(which are, in almost all cases, of a voluntary and emergency nature) and the territory, wherethe urban grid and the existing infrastructural support are made fragile by specific conditions: aweak hydrographic network and an increasingly impermeable soil. It is no coincidence thatmany of the territories affected by news events are located in the most populated regions withthe highest rate of waterproofing in the whole of Italy. In Italy, the municipalities affected bylandslide and hydraulic hazard are 88.3% of the total, covering about 57 million inhabitantswho are thus threatened by hydrogeological instability.
The third and most significant element recognized by the analysis concerns a strongconnection, in terms of vulnerability, between seismic risk and population concentration.This indicates the need for an extensive and urgent recycle of the welfare infrastructuresand workplace institutions of Italy. This process of abandonment and increased damage,if not countered, can only have a worsening spiral effect, in which each impact leadsto abandonment, and each abandonment causes the severity of subsequent disasters.However, this is not limited to creating localized damage: on the one hand, because themost important national arteries and corridors (as well as all the European corridors thatcross Italy) pass through these areas; on the other, because the lack of maintenance ofmountain slopes has impacts on the entire downstream hydraulic system, where the mosturbanized areas of the country are concentrated.
While the devastation and damage caused by the hydrogeological risk have madeevident the potential consequences of neglect in the maintenance of the hydraulic networkand of the cultivated slopes in mountain and hill areas, these same facts too often risk theovershadowing of another aspect that is inherent to changes in the weather patterns andthat will be all the more evident in the years to come: the link between the abandonmentof inland areas and the increase in hydraulic and hydrogeological damage on the poles,and on production and logistics systems. The local impossibility of maintenance will leadon the one hand to the impossibility of crossing the Country, and on the other hand to theincrease of uncontrolled floods. Basically, the progression coefficient in the periphery classshows that it is impossible to resolve the disaster risk here without a widespread projectto increase residential occupation. This observation is important because it shows how,in Italy, environmental and risk issues lead us to establish a close relationship betweenmetropolitan and inland areas, where the maintenance of one is also instrumental to thesafety of the other.
The same results encourage us to take a holistic look at the entire country system,going beyond the sectoral logic of the territorial project, to observe the themes of climaticrisk in deep connection with seismic risk and with maintenance and urban developmentpolicies. The main outcome of the research is perhaps a confirmation of how, in order tomake the Italian system safe, it is not possible to think of a strategy of large aggregationcentres in the plains, assisting and supporting the market with ad hoc financing. In fact, itis necessary to rethink the value and the tools of the strategy for the internal areas. Thisstrategy must conceptualize the minor elements of the Italian landscape as the centralityof a single security project. It must start from the development of infrastructures andeconomies able to restore a widespread habitability and attractiveness to the territory.
The research presented here has two conscious limits. The first, linked to the amountof data analyzed, is that of developing a rationale on a national scale that renounces aninterpretation of the local differences of these processes. This limitation could be overcomeby subsequent in-depth research that gives a picture of certain regions that are particularlyillustrative of the phenomena identified. The second, as is often the case with research intoprocesses in the era of climate change, is the availability of data only from the last 20 to 30years. This can be overcome (also as a form of control on the accuracy of this research) in 5to 10 years’ time, in order to assess the trend of what is recognized here for the first time.
A particular merit of the research, however, is its replicability in all the countries wheredata are collected from public, open, and credible sources, providing an important tool to
Sustainability 2021, 13, 6389 17 of 19
recognize dangerous phenomena where they have not been recognized and controlled inthe processes of combatting climate change.
6. Bullet Point Summary of Outcomes
• Building expansion in the sixth cycle (1990–2006) consumed land without significantlyreclaiming the main brownfield sites.
• The subsequent deflationary phase of the construction market (2007–2017) has led toan increase in the speed of abandonment of large areas of the country.
• Hydraulic and hydrogeological events are causing increasing damage throughout theentire country.
• Seismic events have led to damage of increasing intensity, but only in areas where per-manent residence has decreased, with a very significant coefficient of determination.
• A downward spiral is recognizable between decreasing permanent residence and ageneral increase in impacts, not only those related to climate change.
• We can expect an exponential increase of high-impact events in the plain poles if thereis no profound transformation of the national climate strategy due to this spiral.
• We can also, for the same reason, expect a collapse of major logistical and productionsystems due to the collapse of these local transit systems between the poles.
7. Conclusions
The article demonstrates scientifically, with a large number of data, the relationshipbetween a reduction in the number of inhabitants and an increase in the damage caused bydisasters in low attractive areas. The article also demonstrates the relationship between theexpansion of cities in the most attractive areas of the country and the increase of hydraulicrisk in these same cities. The serious seismic risk in Italy, and the increase of climate-related disasters, underline the need for a comprehensive review of national programsand policies in order to avoid the abandonment of peripheral areas and the uncontrolledexpansion of centres of aggregation. In order to develop effective territorial projects andpolicies able to combat the environmental challenges that await us, it is necessary to adopta synoptic image of the fragility of the Italian system. This image must be constructed bysuperimposing non-homogeneous phenomena such as urban development, abandonment,and territorial risks. This image is fundamental for developing a project for a resilientcountry: it can reorient our view and approach to the geographies on which to concentrateprojects and policies (e.g., maintenance and combatting the abandonment of inland areas).It should also reorient the policies of the construction market in the next building cyclein the direction of safeguarding and maintaining the territory. This article alerts us to theneed to redirect Italy’s development and resilience projects starting from a redevelopmentof the inner areas and considers living as the first engine and the only security processreally capable of taking care of the territory.
Author Contributions: Conceptualization, M.B. and L.F.; methodology, M.B.; formal analysis, M.B. andL.F.; investigation, M.B. and L.F.; writing—original draft preparation, M.B. and L.F.; visualization, L.F.;project administration, L.F. All authors have read and agreed to the published version of the manuscript.
Funding: This research was funded by EU 2014-2020 lnterreg V-A Italy-Croatia CBC Programme bySTREAM-Strategic development of flood management Project. Project number: 10249186.
Institutional Review Board Statement: Not applicable.
Informed Consent Statement: Informed consent was obtained from all subjects involved in the study.
Data Availability Statement: Not applicable.
Conflicts of Interest: The authors declare no conflict of interest.
Sustainability 2021, 13, 6389 18 of 19
References1. CRESME. Costruzioni 2011–2015. 2011. Available online: http://www.cresme.it/it/rapporti (accessed on 1 April 2021).2. Lanzani, A.S.; Zanfi, F. Un territorio ibrido e complesso, a un bivio evolutivo. In Quando L’autostrada non Basta. Infrastrutture,
Paesaggio e Urbanistica nel Territorio Pedemontano Lombardo; Lanzani, A.S., Ed.; Quodlibet: Macreta, Italy, 2013.3. ISPRA, Annuario dei Dati Ambientali-Edizione 2019, 89/2020. 2020. Available online: https://annuario.isprambiente.it/
(accessed on 1 March 2021).4. UNISDR. Global Assessment Report on Disaster Risk Reduction-Making Development Sustainable; United Nations Office for Disaster
Risk Reduction (UNISDR): Geneva, Switzerland, 2015.5. Magnaghi, A. Il Progetto Locale: Verso la Coscienza di Luogo; Bollati Boringhieri: Torino, Italy, 2013.6. Fields, B.; Thomas, J.; Wagner, J.A. Living with Water in the Era of Climate Change: Lessons from the Lafitte Greenway in
Post-Katrina New Orleans. J. Plan. Educ. Res. 2016, 37, 309–321. [CrossRef]7. Bertin, M.; Musco, F.; Fabian, L. Rethinking planning hierarchy considering climate change as global catastrophe. Clim. Risk
Manag. 2020, 30, 100252. [CrossRef]8. Blakely, E.J. Recovery of the soul: Rebuilding planning in post-Katrina New Orleans. Hous. Policy Debate 2012, 22, 117–131.
[CrossRef]9. Finn, D.; Chandrasekhar, D.; Xiao, Y. A Region Recovers: Planning for Resilience after Superstorm Sandy. J. Plan. Educ. Res. 2019.
[CrossRef]10. Olasky, M. The Politics of Disaster: Katrina, Big Government, and a New Strategy for Future Crises; W Pub Group. Thomas Nelson:
Nashville, TN, USA, 2006.11. Campanella, T.J. Urban Resilience and the Recovery of New Orleans. J. Am. Plan. Assoc. 2006, 72, 141–146. [CrossRef]12. Birch, E.; Wachter, S. Rebuilding Urban Places after Disaster: Lessons from Hurricane Katrina; University of Pennsylvania Press:
Philadeplphia, PA, USA, 2006.13. Olshansky, R.B.; Johnson, L. Clear as Mud: Planning for the Rebuilding of New Orleans; Routledge: London, UK, 2017.14. Russo, M.; Fabian, L.; Morello, E.; Musco, F. La resilienza al Cambiamento Climatico Come Paradigma dell’Agenda Urbana; Il Mulino:
Bolonga, Italy, 2017; ISBN 9788815267672.15. Meyer, P.B.; Schwarze, R. Financing climate-resilient infrastructure: Determining risk, reward, and return on investment. Front.
Eng. Manag. 2019, 6, 117–127. [CrossRef]16. Meyer, P.B. Fitzgerald: Greenovation: Urban Leadership on Climate Change. J. Am. Plan. Assoc. 2021, 87, 148–149. [CrossRef]17. Magnabosco, G.; Bertin, M.; Fabian, L. Adaptation. A methafor for the age of climate change. In AESOP 2019 Conference-Book of
Papers; IUAV: Venice, Italy, 2019; ISBN 978-88-99243-93-7.18. Fabian, L.; Munarin, S. Re-Cycle Italy; LetteraVentidue: Siracura, Italy, 2017.19. Berke, P.; Cooper, J.; Aminto, M.; Grabich, S.; Horney, J. Adaptive Planning for Disaster Recovery and Resiliency: An Evaluation
of 87 Local Recovery Plans in Eight States. J. Am. Plan. Assoc. 2014, 80, 310–323. [CrossRef]20. Berke, P.R.; Song, Y.; Stevens, M. Integrating Hazard Mitigation into New Urban and Conventional Developments. J. Plan. Educ.
Res. 2009, 28, 441–455. [CrossRef]21. Brown, D.; Platt, S.; Bevington, J. Disaster Recovery Indicators. Cambridge, MA, USA, 2010. Available online: https://www.
carltd.com/sites/carwebsite/files/CAR%20Brown%20Disaster%20recovery%20Indicators.pdf (accessed on 1 April 2021).22. Forino, G.; Von Meding, J.; Brewer, G.J. A Conceptual Governance Framework for Climate Change Adaptation and Disaster Risk
Reduction Integration. Int. J. Disaster Risk Sci. 2015, 6, 372–384. [CrossRef]23. Birkmann, J.; von Teichman, K. Integrating disaster risk reduction and climate change adaptation: Key challenges-scales,
knowledge, and norms. Sustain. Sci. 2010, 5, 171–184. [CrossRef]24. Russo, M. Resilienza e ricerca per lo sviluppo sostenibile. In Transizioni. Conoscenza e Progetto Climate Proof ; D’Ambrosio, V.,
Rigillo, M., Eds.; Napoli: Clean, Italy, 2021.25. Russo, M.; Attademo, A. Il metabolismo del rischio. In Geografie del Rischio. Nuovi Paradigmi per Il Governo del Territorio;
Galderisi, A., Di Venosa, M., Fera, G., Menoni, S., Eds.; Donzelli: Roma, Italy, 2020.26. Russo, M. Ripensare la resilienza, progettare la città attraverso il suo metabolism. Techne 2018, 15, 39–44.27. Russo, M. Circular economies and regenerative for the city: Ecology, resilience and metabolism of the urban waste areas. Circ.
Econ. Regen. City Ecol. Resil. Metab. Urban Waste Areas 2017, 102–105. [CrossRef]28. ANCE/CRESME, Primo Rapporto ANCE/CRESME, LO STATO DEL TERRITORIO ITALIANO 2012 Insediamento e Rischio
Sismico e Idrogeologico. Roma, 2012. Available online: www.ance.it/docs.docDownload.aspx?id=9182 (accessed on 1 May 2021).29. Coppola, A.; Lanzani, A.S.; Zanfi, F.; Del Fabbro, M.; Pessina, G. Ricomporre i Divari. Politiche e Progetti Territoriali Contro le
Disuguaglianze e per la Transizione Ecologica; Il Mulino: Bologna, Italy, 2021.30. SNAI. Strategia Nazionale per le Aree Interne: Definizione, Obiettivi, Strumenti e Governance. Documento Tecnico Collegato Alla Bozza di
Accordo di Partenariato Trasmessa Alla CE il 9 Dicembre 2013; Agenzia per la Coesione territorial: Roma, Italy, 2013.31. De Rossi, A. Riabitare l’Italia: Le Aree Interne tra Abbandoni e Riconquiste; Donzelli Editore: Torino, Italy, 2019.32. Carrosio, G. I giovani e la crisi socio-ecologica: Quale welfare per riabitare le aree interne? In Di Fronte al Futuro. I Giovani e le
Sfide Della Partecipazione; Delli Zotti, G., Blasutig, G., Eds.; L’Harmattan Italia Editore: Torino, Italy, 2020.

Sustainability 2021, 13, 6389 19 of 19
33. Carrosio, G.; De Renzi, A. Nelle aree interne: Una corretta gestione e valorizzazione del capitale natural. In Ricomporre iDivari. Politiche e Progetti Territoriali Contro le Disuguaglianze e per la Transizione Ecologica; Coppola, A., Lanzani, A.S., Zanfi, F.,Pessina, G., Eds.; Il Mulino: Bologna, Italy, 2021.
34. Camagni, R.; Borri, D.; Ferlaino, F. Per un concetto di capitale territorial. Crescita e Svilupp. Reg. Strum. Sist. Azioni 2009, 66–90.[CrossRef]
Related Documents