Investigation of Team Dynamics and Group Performance in the Product Engineering Process by Stephanie K. Lee SUBMITTED TO THE DEPARTMENT OF MECHANICAL ENGINEERING IN PARTIAL FULFILLMENT OF THE REQUIREMENTS FOR THE DEGREE OF BACHELOR OF SCIENCE AT THE MASSACHUSETTS INSTITUTE OF TECHNOLOGY JUNE 2006 ©2006 Stephanie K. Lee. All rights reserved. ARCHEMS The author hereby grants to MIT permission to reproduce and to distribute publicly paper and electronic copies of this thesis document in whole or in part in any medium now known or hereafter created. Signature of Author: Departnent of Mechanical Engineering May 12, 2006 Certified by: - ' Henry S. Marcus Professor of Mechanical Engineering x Thesis Supervisor Accepted by: ' John H. Lienhard V Professor of Marine Systems Chairman, Undergraduate Thesis Committee 1 MASSACHUSETTS INSTTVITE OF TECHNOLOGY AUG 0 2 2006 LIBR ARIES II ~ I I

Welcome message from author
This document is posted to help you gain knowledge. Please leave a comment to let me know what you think about it! Share it to your friends and learn new things together.
Transcript

Investigation of Team Dynamics andGroup Performance in the Product Engineering Process
by
Stephanie K. Lee
SUBMITTED TO THE DEPARTMENT OF MECHANICAL ENGINEERING INPARTIAL FULFILLMENT OF THE REQUIREMENTS FOR THE DEGREE OF
BACHELOR OF SCIENCEAT THE
MASSACHUSETTS INSTITUTE OF TECHNOLOGY
JUNE 2006
©2006 Stephanie K. Lee. All rights reserved.
ARCHEMSThe author hereby grants to MIT permission to reproduceand to distribute publicly paper and electronic
copies of this thesis document in whole or in partin any medium now known or hereafter created.
Signature of Author:Departnent of Mechanical Engineering
May 12, 2006
Certified by:- ' Henry S. Marcus
Professor of Mechanical Engineeringx Thesis Supervisor
Accepted by:' John H. Lienhard V
Professor of Marine SystemsChairman, Undergraduate Thesis Committee
1MASSACHUSETTS INSTTVITE
OF TECHNOLOGY
AUG 0 2 2006
LIBR ARIES
II ~ I I

Investigation of Team Dynamics andGroup Performance in the Product Engineering Process
by
STEPHANIE K. LEE
Submitted to the Department of Mechanical Engineeringon May 12, 2006 in partial fulfillment of the
requirements for the Degree of Bachelor of Science inMechanical Engineering
ABSTRACT
The cultural traits of a project engineering team can strongly influence the performanceof its members and the quality of the product. The 2.009 Product Engineering Processesclass provides an opportunity for investigating the relationships between group dynamicsand performance as the student groups work with customers and advisors onbrainstorming, designing, testing and construction a fully-functional mechanicalprototype over the course of a semester. Performance was measured as a function of timeusing information from the class ranking system while each team's cultural traits weremeasured using two surveys that all students were required to complete.
Results of this study revealed that the most influential traits on group performance weretask understanding, organization and creativity. Analysis of the survey data showed thatfeedback and professional communication increased while flexibility decreased as thestudent groups matured from their initial formative stages into fully defined teams. Acomparison of teams with sections that reported polar opposite team dynamics revealedthat sections with negative group dynamics performed worse than their positivecounterparts, though this trend did not hold in the context of the entire class. Investigationof the dynamic profiles of these teams revealed that organization, task understanding,creativity and efficient use of resources had the greatest influence on performance. Theresults of a direct comparison of high and low performing teams for each assignmentconfirmed this trend.
Thesis Supervisor: Henry S. MarcusTitle: Professor of Marine Systems
2

1. Introduction
Culture is a system of values widely accepted and intensely shared in anorganization. For example, some groups may emphasize teamwork and constructivecriticism, while others may promote constant personal growth. The culture of anorganization can heavily influence the overall achievement of the group and theindividual employees. The 2.009 Product Engineering Processes class provides a closesimulation of an engineering company for undergraduates in the MIT MechanicalEngineering Department. Within this class, students must work in teams to design, buildand test a working prototype of a new product by meeting a predetermined schedule ofmilestones. The goal of this thesis is to study the values and characteristics of theevolving group dynamics within the 2.009 design teams to determine their affect ongroup performance.
2. Background
Past studies on teamwork and performance have revealed that team performanceis dependent on a variety of factors and qualities within the group. Several models havebeen developed to understand the relationships between these qualities and a team'soutput. This thesis will attempt to add to the current body of research in this area bystudying teams within an academic environment instead of a corporate one.
When a team is initially formed, the team dynamics, values and cultural traits ofthe group have not been established yet. A study by Tuckman (1965) developed a modelthat describes group behavior during four formative stages before it reaches its fullperformance potential. During the initial Forming stage, team members are highlydependent on the leader for guidance and direction, have unclear individual roles andresponsibilities, and have little agreement on the team's purpose, objectives and externalrelationships. The team members fight to establish themselves in relation to one anotherduring the Storming stage, resulting in power struggles and factions that must becontrolled and focused to prevent the team from being distracted from its goals. TheNorming stage is when consensus is formed within the group and the roles andresponsibilities of each team members are clear and accepted. Commitment, unity andconsensus are strong as the team develops its working style to reach the Performingstage. This final state sees the team reach its full performance potential: all of themembers share a single vision, allowing a high degree of autonomy within the group andthe efficient achievement of the team's goals.
In 1995, Margerison & McCann performed a study on high-performing teams todetermine the most effective way to improve work output and quality. By studyingcritical success factors used by individuals and teams in a variety of industries, theydeveloped a model of nine universal work functions that must be present for any team tooptimize its performance. Some of these functions are Advising, which involves thegathering and giving of information, Innovating, which is the generation of new ideas,and Organizing, which includes the creation of a structure and resources for the team towork with.
A study by McCann & Anderson (1997) used the Margerison & McCann modelof team dynamics to improve team performance at a chemical factory. The researchers
3

distributed a 64-item questionnaire that was divided to measure eight defined workfunctions. The employees were asked to rate each activity based on its importance forsuccess in their job. A second questionnaire was distributed to participants to objectivelymeasure team performance in terms of the nine factors identified by Margerison &McCann (1995) that were associated with high-performing teams. The resulting teamprofiles were then used to provide a common starting point for improving performanceby serving as a catalyst for team development and citing specific areas that requiredimprovement.
The team profiles revealed an average low rating in Producing, which includesefficiently delivering a high quality product, and Inspecting, which involves the regularinspection of work activities and quality audits of produces and services. The work teamsdeveloped new vision and purpose statements, and a subsequent effort to improve thedeficient areas resulted in the discovery of quality issues in intermediate chemicals thatthe employees had previous been unaware of. McCann & Anderson concluded thatsuccessfully managing team performance requires identifying in what areas teams areperforming well and what areas require improvement.
Team performance in an academic environment was studied by Coleman & Craig(2004) in the 16.03 Unified Engineering class offered by the MIT Department ofAeronautics and Astronautics. Initial work found a relationship between the teams'design performance and written communication scores. There was a quantitativecorrelation between poor performance and low communication scores, but highcommunication scores did not necessarily result in successful performance. The facultyalso observed that high performing teams had good teamwork skills and technicalunderstanding in addition to generally high communication skills. Low performing teamsexhibited difficulty in meeting milestones, weak technical understanding, and frequentteamwork problems. The study concluded that the teams' performances were the likelyresults of their ability to learn, work together, make decisions and use resources. Theeffectiveness of these capabilities was then reflected in the quality of theircommunication assignments.
This thesis will be similar to prior studies by using team dynamic profiles to trackthe performance of student product development teams as they transition from their initialformative stages into maturity. The 2.009 Product Engineering Processes class providesan ideal environment to conduct this study. The class presents an opportunity to studyperformance and team dynamics because it lacks the inequalities in facilities andresources between teams often found in other organizations. All of the teams are giventhe same amount of reserved laboratory and lecture time and have access to the samemachining facilities, equipment, supplies, budgets, computers, servers, electronicmaterials, research assistance and advisors.
By measuring the evolution of different traits and comparing them to teamrankings in 2.009, this thesis will be able to study the relationship between culture andperformance and track their progress over the course of the semester.
4

3. Methods
Two separate means were used to measure performance and cultural traits: teamrankings and anonymous surveys. A statistical analysis was conducted on the datacollected to determine if there was a correlation between these two factors.
3.1 Performance
Data from the 2.009 grading system measured the performance of the studentteams during the entire length of the course. The teams were all required to meet a seriesof milestones that represented the typical product design process, from initialbrainstorming for ideas to final prototype. The class had six teams: Red, Yellow, Orange,Green, Blue and Purple. Every team had two sections of approximately seven to eightstudents, with the exception of Yellow, whose sections converged into a single team onlya few weeks into the class due to the lack of students in its laboratory section. Thoughinitial class assignments and milestones were graded based on the sections, both sectionswere required to meet together and share the same lab time and advisors. As thedevelopment of the product reached completion, the sections merged together to work asa single team of approximately 15 people. During this entire time, the students receivedindividual grades every two weeks on their design notebooks, which represent theirpersonal contributions to the team.
The three milestones that were used to analyze team performance were theinformation treasure hunt, sketch model review and mockup review. Each team wasranked on their deliverables for of each of these milestones, which represented differentstages in the product design process. The treasure hunt was designed so the sectionscould learn how to gather and research market and product information, handle problemsunder a time constraint and delegate tasks according to the different skills and schedulesof each member. Sections were evaluated according to the accuracy of their answers andquality of their citations.
The sketch model review was a continuation of the brainstorming process as thestudents focused their ideas into developing two design concepts while getting experienceworking in the laboratory and machining facilities. In addition to creating a physicalrepresentation of their ideas, the sections had to find and present market, customer andtechnical data to support their design decisions. The grading criteria for this milestoneinvolved the usefulness of sketches and CAD models, the quality and thoughtfulness ofthe designs, and the quality and relevance of the data presented. The course instructorsthen discussed among themselves all of the ideas and ranked each section on a scale from1 to 4 in the categories of the sketch model and research, with 1 being the highest rank.This milestone can represent the period during which the sections began establishingground rules, individual responsibilities and leadership roles as section members wererequired to work together and use their personal skills to finish the wide variety of tasksrequired to complete the sketch model presentation.
The last ranked milestone used for this study was the mockup review. Theprimary purpose of this assignment was for the student sections to not only furtherdevelop their design concepts but to also address key challenges associated with theirconcepts, learn how to present technical problems and solutions and to receive feedback
5

and suggestions from others. Each section was required to present mockups of theirdesigns, with an emphasis on technical feasibility, user interaction with the product, andoperational principles. Course instructed consulted with one another and ranked sectionson a scale of 1 to 5 based on the following criteria: overall progress from the sketchmodel review, effectiveness of the mockups, and solutions for critical issues.
3.2 Team Dynamics
Every 2.009 student was required to complete two surveys during the semester,called team reviews. These reviews were intended to allow the students to analyzespecific traits within the group and diagnose any issues the group may have. The surveyswere administered anonymously using a form published in a restricted section of the classwebsite. The surveys asked the students to rate 15 characteristics on a scale of 1 to 5.These qualities included adaptation, creativity, commitment, respect, organization,communication, flexibility, leadership and conflict resolution.
The first survey, designated Review A, was conducted after the after the sketchmodel milestone was due. Review B was administered after the sections merged togetherand were graded by their team color. The results of these surveys were compiled intosection profiles by the course instructors and published online for all class participants toview. The results of both surveys were discussed by the sections after they werepublished to address their strengths and weaknesses. The timeline for the class was asfollows:
Treasure Hunt Sept. 12Sketch Model Review Oct. 5Review A Oct. 14Mockup Review Oct. 20Review B Nov. 9
For this study, the culture of the 2.009 class itself was accounted for by averagingthe results of all teams for all of the characteristics. The cultural strength and traits ofeach team were distinguished using a t-test to determine their statistical significance. Thespecific traits emphasized within each team were found by determining if a team'saverage score for a trait is statistically different from the class average. The statisticallysignificant traits of the high performing teams were then compared with the traits of thelow performing teams to determine if there were distinguishing qualities that could becorrelated with performance. Teams that reported below-average levels in more thanapproximately 75% of their traits were designated "negative cultures" while teamsexhibiting the opposite trend were designated "positive cultures." Teams with negativecultures were compared with positive ones to determine if there was a correspondingaffect on their milestone rankings. Similarly, teams that exhibited consistentimprovement or decline in the rankings were also compared to see if they hadcorresponding traits that could be attributed to the changes in performance.
6

3.3 Analysis
The comparisons were conducted using a t-test, which calculated the probabilitythat the difference between two means was caused by chance. The t-test uses the equation
X2 -X 1t = - - , (1)SE(X2 - XI)
where X1 is the mean of group 1, X 2 is the mean of group 2 and SE(X2 - Xi) is the
standard error of difference between X1 and X 2 . The denominator of Equation 1 can becalculated with the variances, v2 and v1, and the number of samples, n2 and nl, of the twogroups using the formula,
SE(X 2 - X) =- vX (2)
The variance v is defined as
v=Uf 2 (3)
where the standard deviation a is
n E=a n-l (4)In Equation 4, X is the mean of the sample group, Xis the value of each sample, and n isthe total number of values in the sample group.
Since this study does not have a control group, a null hypothesis will be used toanalyze the results. This hypothesis will assume that the difference A between the means
Xl and X 2 is equal to zero. For this study, the minimum risk level ofp=0.10 will beused. This level represents that there is a 90% probability that the statistical significancein the findings did not occur by chance. The degree of freedom df, which is equal to
df = n + n2 - 2, (5)was used in conjunction with the t-test t and risk level p to determine if the results of thedata and comparisons were statistically significant.
4. Results
A comparison between the overall results of Review A and Review B revealedgeneral changes in team dynamics as the student groups matured from the initial stages ofdefining individual roles, establishing leadership positions and determining eachmember's specific personality, schedule and skills. General changes involvedimprovement in communication but a reduction in overall flexibility. The onlystatistically significant difference between the two surveys was improvement among teammembers in receiving feedback on their progress (p<0.05). This change could beattributed to the increasing emphasis on feedback associated with the milestones, with themockup review including a one hour question and answer session with class instructors.The difference may also be due to increased familiarity and comfort among teammembers, instructors and advisors with providing constructive criticism and helpful
7
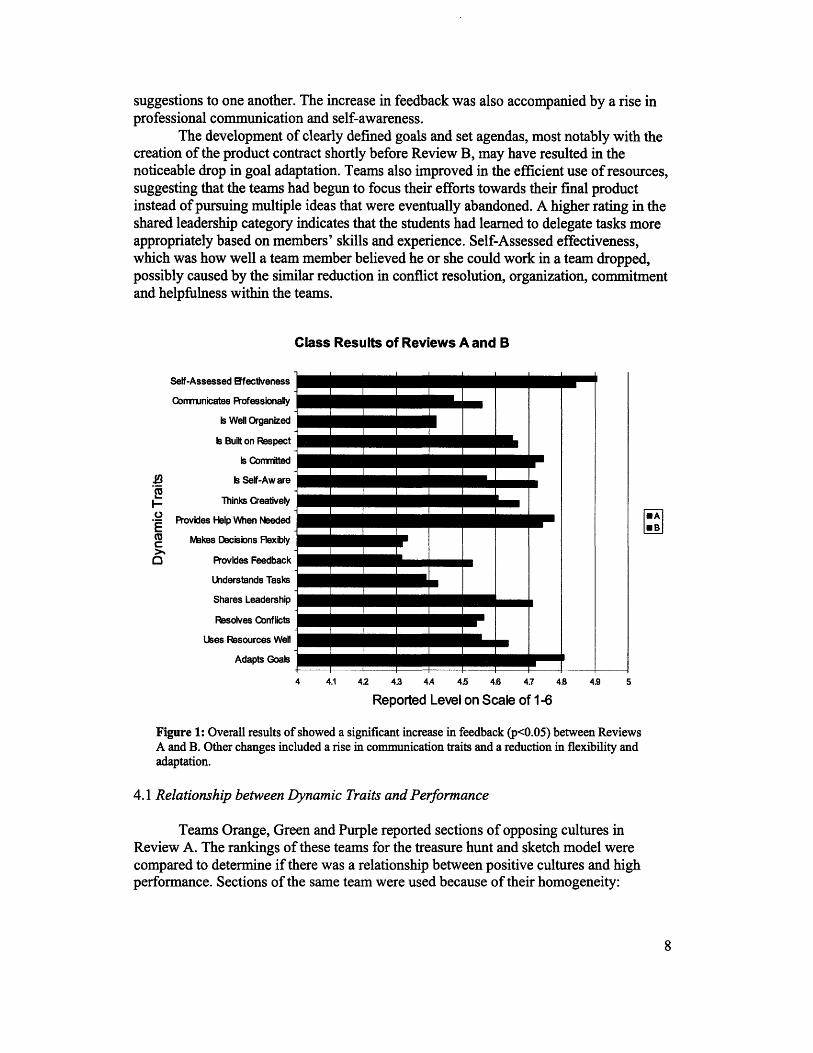
suggestions to one another. The increase in feedback was also accompanied by a rise inprofessional communication and self-awareness.
The development of clearly defined goals and set agendas, most notably with thecreation of the product contract shortly before Review B, may have resulted in thenoticeable drop in goal adaptation. Teams also improved in the efficient use of resources,suggesting that the teams had begun to focus their efforts towards their final productinstead of pursuing multiple ideas that were eventually abandoned. A higher rating in theshared leadership category indicates that the students had learned to delegate tasks moreappropriately based on members' skills and experience. Self-Assessed effectiveness,which was how well a team member believed he or she could work in a team dropped,possibly caused by the similar reduction in conflict resolution, organization, commitmentand helpfulness within the teams.
Class Results of Reviews A and B
Self-Assessed Effectiveness
ComTunicates Professionally
Is Well Organized
Is Built on Respect
Is Comritted
. _ Is Self-Aw are
Thinks Creatively
Provides Help When NeededEX1 Makes Decisions Flexibly
D Provides Feedback
Understands Tasks
Shares Leadership
Resolves Conflicts
Uses Resources Well
Adapts Goals
III III
II1I
II
rII
I
U
Lm
UrU
M-
I
U-
4 4.1 42 43 4A 45 46 4.7 4B 4.9 5
Reported Level on Scale of 1-6
Figure 1: Overall results of showed a significant increase in feedback (p<0.05 ) between ReviewsA and B. Other changes included a rise in communication traits and a reduction in flexibility andadaptation.
4.1 Relationship between Dynamic Traits and Performance
Teams Orange, Green and Purple reported sections of opposing cultures inReview A. The rankings of these teams for the treasure hunt and sketch model werecompared to determine if there was a relationship between positive cultures and highperformance. Sections of the same team were used because of their homogeneity:
8
MM
�I�I
�I
�I�I
�I�I
I
[EWA]LtBj

officially designated as a single team, the two sections shared the same workspace andreserved lab time.
The other teams were not included in this analysis because their sections were notculturally distinctive from one another. The sections of Yellow had already merged into asingle, smaller sized team, and so the dynamic traits of the original separate sectionscould not be reliably measured. Both sections of Blue exhibited 100% positive cultures.The survey indicated that a negative culture existed in Red A, with 73% of its levelsreported below average, but Red B did not have a distinctively positive or negativeculture, and therefore was not used for this comparison.
There were several possible reasons for how sections of the same team thatfrequently worked together in the same environment could have such radically differentgroup dynamics. The personalities, skills and experiences of the members in each sectioncertainly influenced the dynamics of each section. Students were assigned to teams basedon which lab times fit their personal schedules, so it was possible for some sections tohave more students experienced in leadership and engineering projects than others. Withthe advantage of having prior experience working in groups or similar undertakings,these students may have been able to form a better initial group dynamic than their lessfortunate counterparts. In all three teams with opposing cultures, students in sections withpositive cultures reported higher self-assessed effectiveness working in teams thanstudents working in the other sections, though the difference was not statisticallysignificant.
Another cause for the extreme difference in team dynamics may be the sectioninstructors. During the initial month prior to Review A, each section had differentinstructors assigned to them and did not always meet with one another, though theyshared the same conference room during the same lab time. This arrangement gave theinstructors a high degree of influence over their respective sections. Some sections mayhave had instructors who were better at answering questions, providing advice andguiding their students than their counterparts. These instructors would then give somesections an advantage over the others, resulting in the formation of a positive teamdynamic within their sections.
A possibility that may have caused such a large reported difference betweenscores may have been the proximity sections of the same team may have had with oneanother. Since the teams did meet together for at least some amount of time during theirdesignated laboratory periods, students in different sections were aware of one another'sprogress. The students may have reported the difference between the team sectionsbecause they were comparing their own work to the other's to deduce whether their traitswere better or worse than the other section's. This possibility does not fully explain whysuch different cultures coexisted together in the same environment, but it may be a reasonwhy such a large gap was reported.
A statistical comparison of survey results between sections of Orange, Green andPurple revealed several traits that all of the positive cultures reported significantly higherthan their negative counterparts. These categories were commitment, organization,professional communication, creativity and task understanding. These traits were notnecessarily higher than the class average, as shown in Figure 2. Negative sections werestatistically significant opposites from positive cultures in creativity, commitment and use
9

of resources. Negative cultures also reported low levels of professional communicationand organization.
Comparison of Sections with Positive Cultureswith the Class
Self-Assessed Effectiveness
Communicates Professionally
Is Well Organized
Is Built on Respect
-y Is Committed
Is Self-Aware
t) Thinks CreativelyC
-) Provides Help When Needed
_j Makes Decisions Flexibly-o
Provides Feedback
Understands Tasks
Shares Leadership
Resolves Conflicts
Uses Resources Well
Adapts Goals
3.5 3.7 3.9 4.1 4.3 4.5 4.7
Dynamic Traits
,*
4.9 5.1
.
= at least twosections reportedcategory assignificantly higherthan the class= sections reportedcategory assignificantly higherthan sections withnegative cultures
* ClassEN Orange B
* Purple AO Green B
5.3 5.5
Comparison of Sections with Negative Cultureswith the Class
Self-Assessed Effectiveness
Communicates Professionally
Is Well Organized
Is Built on Respect
Is Committed
Is Self-Aware
Thinks Creatively
Provides Help When Needed
Makes Decisions Flexibly
Provides Feedback
Understands Tasks
Shares Leadership
Resolves Conflicts
Uses Resources Well
Adapts Goals
3.5 3.7 3.9 4.1 4.3 4.5 4.7 4.9 5.1 5.3 5.5
Dynamic Traits
Figure 2: An analysis of sections with positive and negative cultures belonging were statisticallysignificant opposites in creativity, commitment and use of resources.
10
...................................=_~~MI
I~~~ I.....L r ..... [ .. 1.. .... .. E... ..I
.................... I..... L..... I............b................... r.rm~~~~~~~~~~mrkr~~~~~~~~~~~~~~a~~~~~~~rrrrr~~~~~~~~~~~~~~~~~km,~~~~~~~~
0a)co
CO(r0
a)-
0
· im
MZI=Bl k~
c-
· · ·
I I I I ; I

The findings on team dynamics in positive cultures were compared to aqualitative assessment conducted on the performance data. The number of ranking datapoints was too low to conduct a reliable statistical analysis.
Table 1: Rankings of Sections of Opposing Cultures of Milestones Before Review A
Section Percentage of Treasure Hunt Average Average rankpositively Rank Sketch Model before Review Areported traits Rank
Orange A 0 3 3 3
Orange B 100 1 3 2Purple A 86.67 3 2 2.5Purple B 13.33 4 4 4Green A 0 1 2.5 1.75Green B 86.67 1 2.25 1.625
The comparison showed teams with positive cultures did perform better than theirnegative counterparts, though the difference is not large. These findings also indicatedthat sections with more positive cultures in general did not always perform better thannegative cultures. For example, Green A reported all of its dynamic traits as below classaverage, yet it ranked higher in the sketch model review than Orange B, which reportedall of its traits above average. These results support the possibility that students weredirectly comparing their sections to their team counterparts when they responded to thesurveys. If this situation were the case, then students in sections with negative culturesmay have believed their group dynamic was dysfunctional when in actuality they couldhave been doing better than many other sections in the class.
Despite this possibility, negative cultures still reported themselves as significantlylower than the class in creativity, commitment and the use of resources. These traits maybe the reason why many students believed their sections had poor team dynamics. Theymay have thought their ideas were inferior to the other section's because of their lowerrank, which resulted in a low reported level of creativity even though they may have beencoming up with just as many ideas as the other section. The significantly low levels ofcommitment within negative sections therefore suggest that the students believed theywere not spending as much time on their class assignments as the students in the positivesection. Their reportedly inefficient use of resources could also be explained in this way.
4.2 Effects of the Convergence of Two Opposing Cultures on Performance
Teams Blue and Green were selected to determine how performance was affectedwhen sections of opposing cultures merged into a single culture because these two teamshad the least amount of noise in their performance data. Blue consistently dropped in therankings and Purple consistently improved, while all other teams fluctuated up and down.
11

Performance vs. Time of Purple and Green
4
' 3.5
o 3a)m 2.5
C 2o
-e 1.5C
tO 1
0.5
0
Treasure Sketch Model Mockup Technical FinalHunt Review Presentation
Chronological Order of Milestones
Figure 3: Team Purple consistently rose in the rankings while Green fell. Scores from differentmilestones were appropriately scaled to a ranking of 1-4, with 1 being the highest and 4 being thelowest. Scores for sections A and B converge because sections of the same color received thesame scores for the technical review and final presentation.
The results of Review A reveal a negative culture in Green A, with reported levelsin all 15 categories below class average and 46% of the categories significantly low(p<0.10). Most notably, Green A had extremely low levels of efficient resource use(p<0.05) and commitment (p<0.05). Green B initially had a positive culture, with 87% ofthe traits reported above average and 40% significantly higher (p<0.05). The positiveculture in Green B can be attributed to the section's slightly better performance in thesketch model review than Green A, though both sections received a rank of 3 for themockup.
After convergence into a single team, Green reported a negative culture comparedto the rest of the class in Review B, with significantly low task understanding (p<0.05),organization (p<0.05) and creativity (p<O. 10). Comparing the results with Review B,Green A improved in self-awareness and its use of resources. The added self-awarenessmay have been the result of heightened consciousness as both sections redefinedindividual roles and responsibilities and members became acquainted with the personalskills and experiences of people from the other section. Despite the improvement inresource allocation, Green team was still well below the class average in the samecategory, though not significantly so.
The merging of two opposing sections resulted in an overall positive culture inPurple team. Purple A had a positive culture with significantly high levels of goodresource use (p<0.01), commitment (p<0.01) and organization (p<0.05). Purple B hadborderline negative culture with 73% of reported traits reported as below average andonly one, professional communication, was statistically below (p<0.05). After the
12
- * -Purple A- -PurpleB
-4 Green A
--- Green B
A

sections converged, Purple retained a positive culture, with high levels of organization(p<0.01) and self-assessed effectiveness (p<0.05). The increase in the latter trait mayhave been caused by increased confidence and self-esteem among members of Purple asa result of the sections' continuous rise in the rankings.
Review B Results of Purple and Green Compared to the Class
Self-Assessed Effectiveness
Communicates Professionally
Is Well Organized
Is Built on Respect
Is Committed
_.m Is Self-Aware
I- Thinks Creatively
Provides Help When NeededE. Makes Decisions Flexibly0 Provides Feedback
Understands Tasks
Shares Leadership
Resolves Conflicts
Uses Resources Well
Adapts Goals
mam
I
lllllllllll
magaw
+IIIII
frrrrrrrrr
lmalllllll
llllll
nmlll
IEU
mmr
am
rrrrrrrn1
0=e
ri··i··riI Class
] Purple* Green
4 4.2 4.4 4.6 4.8 5 5.2
Reported Level on Scale of 1-6
Figure 4: Both Purple and Blue had sections of opposing cultures that merged into a single teamshortly before Review B. Purple reported a resultant positive culture with significantly strongorganizational skills, while Green's combined culture was pervasively negative with significantlylow organization.
As Purple's culture became more positive over time, so did their improvement inthe rankings. Purple B's culture was also not as negative as Green A's, with only 73% ofthe categories below average, as opposed to 100%. In this case, a group with a positivedynamic performed better overall than a group with a negative dynamic, even though theprevious comparison found no distinct relationship between positive cultures and goodperformance in the class. It must be noted that students completed Review B after theranking results of the mockup review were published. Based on these rankings, they mayhave rated the traits of their team as either better or worse than their responses to ReviewA. Therefore, the reported positive and negative dynamics may have been the result ofthe team's performance, and not the other way around.
The statistically significant traits measured in Review B suggest a correlationbetween organization, creativity and task understanding with performance: Green'sdecline in performance was mirrored by a significant decrease in these traits, whilePurple's improvement saw an increase, though it must be noted that Purple did not have
13
III·Wllll i M miiiiiii im
- - - l------ - 1 -l I M
M - N I-.. |--- �----- ... -11 I I
- - l- --i----- i -----
- - - - - - 1'--
- -_ l- I i-- a_ r--------- ! _l _- l I
llllffl
MMmr
=Ernst�� I
Irrrrrm,
grrrmRWFPF6
,
=33=rrr
...... · · · · · · · ·. · · ·Mm 1

statistically higher levels of task understanding in Review B. These results are consistentwith the trend found in the previous comparison between positive and negative cultures.
Another trait with possible links to performance was the use of resources. Bothsections of Purple exhibited unusually efficient resource allocation in both surveys, withPurple A reporting significantly high levels in Review A (p<0.01). In comparison, Greenhad the exactly opposite trend. This finding suggests that the use of resources may havebeen the most important factor affecting performance. Purple's efficiency in using theirtime, personnel and materials may have given them the advantage to quickly improve thequality of their deliverables and to eventually overtake the other teams in the rankings.The relationship between the use of resources and performance may also be indirect: wellprepared team members with a good comprehension of their goals would presumably usetheir resources more wisely, preventing excessive waste or effort in areas that did notcontribute to their objectives. In this case, organization and task understanding woulddirectly affect performance.
4.3 Comparison of High and Low Performing Sections
The third aspect of this study was to compare high and low performers for eachmilestone to investigate trends in their team dynamics. The best and worst rankedsections for the treasure hunt milestone were Green B and Purple B, respectively. GreenB had a reported a positive culture and Purple B had a negative culture. The earliercomparison between positive and negative cultured teams indicated that teams withpositive cultures do not necessarily perform better than sections with negative culturesoverall, yet Green B does in this particular case.
Comparison of Treasure Hunt Best (Green B) and Worst Performers (Purple B)
Self-Assessed Effectiveness
Communicates Professionally
Is Well Organized
Is Built on Respect
Is Committed
Is Self-AwareE
Thinks CreativelyProvides Help When Needed
Makes Decisions Flexibly
a Provides Feedback
Understands Tasks
Shares Leadership
Resolves Conflicts
Uses Resources Well
Adapts Goals
* Class
o Purple B
* Green B
3.5 4 4.5 5 5.5
Reported Level on Scale of 1-6
Figure 5: Green B had the largest advantage over Purple B in professional communication. Othertraits reported significantly higher than class average were creativity, organization and taskunderstanding.
14
-�8�1�8�1� �I�I�IIIIIIIIIIRII�I
allolIllIll llB
IIPII�
Illl la l l l II·~llllllllIBI L.
MBIIBIIBBI·ll Il···Lllllllll j...s1··
II I I II I I IIIIII-tlllBIII=1 | __
r�r.l········I
LLI��·���'
L·r··r··iy··i
I·lll·ll·VIII
I·········�LLU
r�r�LIL·····�LILU
�·····l··t·U1
~I"MLr
MM -MM==··~y
Z·LT···=L
Z' rrtZ~Usc=I
11N
IV-,
3333303=
II~ B~
.. Ir I·L LL nII ...

Green B reported significantly high levels of creativity, organization and taskunderstanding, which were all traits that had potential connections to performance. PurpleB was far from being the worst of all the negative sections, with only one trait,professional communication, reported significantly lower than the rest of the class.Perhaps for this assignment, this lack of professional communication resulted in the worstoverall performance, because the treasure hunt involved a collaborative effort to collectinformation from various sources. Due to the heavy emphasis on research for thisassignment, communication may have been particularly critical to success. Green Breported a significantly high level of professional communication (p<0.01), which mayhave contributed to their top rank. A comparison of the two sections revealed the greatestadvantage Green B over Purple B was indeed professional communication (p<0.001).
Interestingly, students in Purple B indicated they had high self-assessedeffectiveness and frequently provided help when needed. These results could have beencaused if Purple B had too many natural leaders who believed they were very capable atworking in a group. This possibility is supported by the low level of shared leadershipindicated by Purple B in the survey. The large amounts of help the members gave oneanother may have occurred to make up for the deficiencies in other dynamic areas.
Purple B was also the lowest performer on the sketch model, with both of itspresented ideas receiving a rank of 4 in both the model and research categories. Thehighest performer was Purple A, which received the rank of 1 in both categories for itsmanioc shredder idea.
Sketch Model Review Comparison ofBest (Purple A) and Worst (Purple B) Performers
Self-Assessed Effectiveness
Communicates Professionally
Is Well Organized
Is Built on Respect
Is Committed
I.t Is Self-Aware
Thinks Creatively
Provides Help When Needed
X Makes Decisions Flexibly
Provides Feedback
Understands Tasks
Shares Leadership
Resolves Conflicts
Uses Resources Well
Adapts Goals
Class
Purple B
*PurpleA
3.5 4 4.5 5 5.5
Reported Level on Scale of 1-6
Figure 6: Purple B was the worst performer for both the treasure hunt and the sketch modelreview, yet its students indicated they provided more help and worked better in teams than the topranked sections for both milestones.
15
II
I
ru·~LLlULM·1IILL
LU ~~LII
lII.IIIII.....I...::::bY----- [--
.Il.llll.......... l........
-- -- -- -- -------------111111
I
I
EM I
:=I
L.······
ownlb~i
=niiii
0111111111111111

A comparison of their team dynamic profiles was done to determine how sectionsbelonging to the same team, who shared the same work space and meeting times, couldhave such radically different performance results. Figure 6 showed that students in PurpleB still reported they helped each other when needed and believed they worked well inteams more than the best performer for the milestone. Purple A had significantly highercreativity (p<0.10), commitment (p<0.001), task understanding (p<0.05) and efficient useof resources (p<0.01) than the rest of the class. These four traits appeared to be consistentfor high performers and positive cultures in all of the comparisons conducted for thisstudy. This consistency suggested some degree of interrelation between these traits. Goodunderstanding of the group's goals allowed for the appropriate allocation of work andmaterials. A high degree of creativity allowed the team to adapt its ideas to new obstaclesand commitment among members helped to tackle problems well and ensure the tasks getdone quickly and effectively.
The best and worst ranked sections for the mockup review were also aconfirmation of prior trends. On average, team Orange ranked the highest with its treebarrow and rice planter concepts, while team Red ranked the lowest with its orange andbanana harvesters. Review B compiled the responses of both sections into one team, sothe dynamic profile of individual sections cannot be accurately ascertained from the data.Their levels can be inferred from the overall responses provided from the entire team.Separation of the sections' profiles for team Orange was further complicated because halfof the members of each section were exchanged, effectively changing the membership ofeach section.
Comparison of Mockup Review Best (Orange)and Worst Performers (Red)
Self-Assessed Effectiveness
Communicates Professionally
Is Well Organized
Is Built on Respect
Is Com m itted
Is Self-Aware
Thinks Creatively
.o_ Provides Help When NeededE
Makes Decisions Flexibly
Provides Feedback
Understands Tasks
Shares Leadership
Resolves Conflicts
Uses Resources Well
Adapts Goals
IIIIICIIII
>.S . ~..iiiiiiiii. w. , ;> ~~;,T-r
mm~r
9"W", -
i ' .....
MM111777=. iiiiiiii.H..=uuwlmtm
IWUrlllli
mom·?~~
=
LLLALLtiJ~LLLwm
I
i1.fWI
mm
E23 i
iL ....zg,{ vi J.iE
L ..
fllfttl"llll~f""rM.
l_I
IIIIIIIII::::::;
3.5 3.7 3.9 4.1 4.3 4.5 4.7 4.9
Reported Level on Scale of 1-6
Figure 7: Previous comparisons indicated having a negative culture is not necessarily indicativeof performance in the class, which is further indicated by teams Orange and Red.
16
I
0
m Class
nI Orange
o Red
111·1111·11111111·1111·111
-- 4_ls�?L*-qsri*·il�
MMm, 1, -, M 1
.... .. . . ....R-1M-1
!q=mm
IM-Mm
MMr i
.................
ffffMMffM* la-,,. , : .... .. ;, - , , -
111=1-17
--- ---.... .. .. - I 1-
- - =-- -- -Ye-- ah--
I I

Students in Orange and Red both reported negative dynamic profiles in Review B.This finding fit with the conclusion that negative cultures do not necessarily performworse than positive ones. Red's profile was very similar to Purple B in Review A, withprofessional communication being the only trait that was significantly below classaverage (p<0. 10). This finding suggested that the ability to separate personal andprofessional communication has an affect on performance. Orange also had a below-average level of professional communication, but it was not statistically significant.Orange also reported low significantly low levels of organization (p<0.001) and taskunderstanding (p<0.001) compared to the rest of the class.
The negative culture may have been the result of the merger that occurred inOrange for the mockup review. Orange originally had a polar dynamic, with Orange Aexhibiting a negative culture and Orange B exhibiting a positive culture. The decision forsome Orange B members to work with Orange A and vice versa may have caused someconfusion and disorganization as students had to redefine their individual responsibilitiesand accommodate others' schedules. Because the members of Orange B had not workedon the tree barrow concept before, they may not have known what work needed to bedone or how to do it, resulting in the low reported level of task understanding. As a result,members of Orange B may have indicated particularly low levels in all categories forReview B because they believed their new situation was substandard to the one theyprevious had.
5. Summary
This study tracked the rankings and dynamic profiles of the student groupsthrough their initial formative stages as they learned about the product developmentprocess. A comparison of the overall class results for the two surveys revealed that as theteams developed and students developed a common vision and learned to work with oneanother, feedback and professional communication increased among members. Flexibilityand goal adaptability simultaneously decreased as the project became more defined andindividual responsibilities were established.
An investigation of teams that had one section report a negative culture and onewith a positive culture suggested that students were comparing themselves to the othersection within their team when they completed the surveys, creating the large differencebetween the group dynamics of the two sections. Possible causes for the disparity ingroup dynamics between the two sections were the number of experienced andtechnically qualified students per section and the teaching abilities of the instructors. Thecomparison also showed that sections reporting positive cultures performed better thanthe other section within their own team, but did not necessarily rank higher in the contextof the entire class. Common traits among positive group dynamics were high levels ofcommitment, organization, professional communication, creativity and taskunderstanding. Negative group dynamics were characterized by significantly low levelsof commitment, creativity and efficient use of resources. The large difference in reportedcommitment and creativity between the two dynamic types may be the reason whystudents may have considered their group to be superior or inferior to the other.
The resulting team dynamic after sections of opposing cultures merged into asingle team also highly affected that team's performance in their assignments. The team
17

that consistently rose in the rankings had a final group dynamic that was positive, whilethe team that consistently fell in the rankings exhibited the opposite dynamic. Thesedynamic profiles may have been the result of the teams' rankings in the mockup, and notvice versa. Despite this possibility, the team showed improvement had significantly highlevels of organization, creativity, task understanding and resources. An analysis of thehigh and low performing teams for each milestone also suggested these traits were linkedwith good accomplishment.
The recurrence of above-average levels of organization, task understanding,creativity and the use of resources among high-ranked sections marked these particulartraits as the most influential on group performance. Special emphasis should be given todeveloping these behaviors to improve overall work quality within the class. Teachingstudents how to effectively organize their goals, delegate tasks, manage their budgets anduse their materials may help them to improve their overall performance. Class instructorsand section leaders should clarify milestone requirements and expectations so studentshave a good understanding of the tasks at hand so they can accomplish them in the mosteffective and efficient manner. The survey results should also be used to addressdisparate group dynamics within a team to prevent later difficulties when the two sectionsare required to work together.
7. Future Research
Though this study provided a comprehensive investigation into the effects ofgroup dynamics on performance, further studies should be conducted to determine theexact relationship between these two factors. If future classes do choose to teachorganization and resource management skills, the resulting effect on the team's dynamicprofiles can be compared to the ones derived from this study to determine their degree ofinfluence on performance. A third review could also be conducted at the very end of theclass to increase the scope of the study to include the entirety of the course, since thisstudy was limited to only observing the first two months of the semester. Interviews withstudents and observations taken by instructors throughout the product engineeringprocess could also assist future studies by providing insight into the internal groupdynamics of each team. This knowledge could then be used to explain the occurrence ofdifferent dynamic profiles, accurately interpret the analysis results and pinpoint incidentsor factors that may have caused specific changes within a team's dynamics over time.
Additional research could also be conducted on the effects of group dynamics onindividual performance. All students in the 2.009 class are required to document theirpersonal contributions to the team in notebooks that are submitted for grading on aweekly basis. This aspect of the course could be used to document individualperformance over time without affecting class logistics too adversely. Though difficultiesmay arise from confidentiality issues and different grading standards among laboratoryinstructors, the effect of group dynamics on individual performance could be investigatedby comparing changes in notebook grades and survey results over time.
18

8. References
Coleman, C. & Craig, J (2004) Using Teamwork and Communication Skills to Monitorand Strengthen the Effectiveness of Undergraduate Aerospace Engineering DesignProjects, American Society for Engineering Education.
Margerison, C.J. and McCann, D.J, Team Management: Practical New Approaches,Management Books 2000, London, 1995.
McCann, D. & Aldersea, R. (1997) Managing Team Performance: Unrealistic Vision orAttainable Reality? International Conference on Work Teams.
Tuckman, B.W. (1965) Development Sequence in Small Groups. Psychological Bulletin,Issue 63, pp.3 8 4 -3 9 9 .
19
Related Documents