Processes 2022, 10, 454. https://doi.org/10.3390/pr10030454 www.mdpi.com/journal/processes Article Investigating the Trade‐Off between Design and Operational Flexibility in Continuous Manufacturing of Pharmaceutical Tablets: A Case Study of the Fluid Bed Dryer Sheng‐Long Jiang 1,2 , Lazaros G. Papageorgiou 1 , Ian David L. Bogle 1 and Vassilis M. Charitopoulos 1, * 1 Centre for Process Systems Engineering, Department of Chemical Engineering, University College London, London WC1E 7JE, UK; sheng‐[email protected] (S.‐L.J.); [email protected] (L.G.P.); [email protected] (I.D.L.B.) 2 College of Materials Science and Engineering, Chongqing University, Chongqing 400044, China * Correspondence: [email protected] Abstract: Market globalisation, shortened patent lifetimes and the ongoing shift towards personal‐ ised medicines exert unprecedented pressure on the pharmaceutical industry. In the push for con‐ tinuous pharmaceutical manufacturing, processes need to be shown to be agile and robust enough to handle variations with respect to product demands and operating conditions. In this paper we examine the use of operational envelopes to study the trade‐off between the design and operational flexibility of the fluid bed dryer at the heart of a tablet manufacturing process. The operating flexi‐ bility of this unit is key to the flexibility of the full process and its supply chain. The methodology shows that for the fluid bed dryer case study there is significant effect on flexibility of the process at different drying times with the optimal obtained at 700s. The flexibility is not affected by the change in volumetric flowrate, but only by the change in temperature. Here the method used a black box model to show how it could be done without access to the full model equation set, as this often needs to be the case in commercial settings. Keywords: pharmaceutical manufacture; uncertainty; operational flexibility; operational envelopes; modeling 1. Introduction The power of big data, emanating from the process and from customers, is having a number of effects on manufacturing. With coordinated access to reliable data, a manufac‐ turer can respond more rapidly and efficiently to supply chain demands. However, with data comes the capability and often the demands from internal and external stakeholders (customers, shareholders, regulators, neighbours, etc.) for greater transparency of opera‐ tions. Industry is going through something of a revolution to realise these aims. It is known as Smart Manufacturing, Industry 4.0 or Digitalisation because of the capabilities enabled by greater computing power, smarter algorithms, better measurement, and wider connectivity. The smart manufacturing revolution is said to have three phases [1,2]: 1. Factory and enterprise integration and plant‐wide optimisation, 2. Exploiting manufacturing intelligence, 3. Creating disruptive business models. For the process industries, all three phases are likely to drive significant change. [1– 6]. To a considerable extent, the first phase has been well underway for a decade or more, particularly plant wide optimisation. The exploitation of big data from enhanced process measurement, as well as using data for demand, supply and the operating environment, is enabling the second phase which is also to some extent underway. Key enablers are Citation: Jiang, S.‐L.; Papageorgiou, L.G.; Bogle, I.D.L.; Charitopoulos, V.M. Investigating the Trade‐Off between Design and Operational Flexibility in Continuous Manufacturing of Pharmaceutical Tablets: A Case Study of the Fluid Bed Dryer. Processes 2022, 10, 454. https://doi.org/10.3390/pr10030454 Academic Editors: Luis Puigjaner, Antonio Espuña Camarasa, Edrisi Muñoz Mata and Elisabet Capón García Received: 7 January 2022 Accepted: 21 February 2022 Published: 24 February 2022 Publisher’s Note: MDPI stays neu‐ tral with regard to jurisdictional claims in published maps and institu‐ tional affiliations. Copyright: © 2022 by the authors. Li‐ censee MDPI, Basel, Switzerland. This article is an open access article distributed under the terms and con‐ ditions of the Creative Commons At‐ tribution (CC BY) license (http://crea‐ tivecommons.org/licenses/by/4.0/).

Welcome message from author
This document is posted to help you gain knowledge. Please leave a comment to let me know what you think about it! Share it to your friends and learn new things together.
Transcript

Processes 2022, 10, 454. https://doi.org/10.3390/pr10030454 www.mdpi.com/journal/processes
Article
Investigating the Trade‐Off between Design and Operational
Flexibility in Continuous Manufacturing of Pharmaceutical
Tablets: A Case Study of the Fluid Bed Dryer
Sheng‐Long Jiang 1,2, Lazaros G. Papageorgiou 1, Ian David L. Bogle 1 and Vassilis M. Charitopoulos 1,*
1 Centre for Process Systems Engineering, Department of Chemical Engineering, University College London,
London WC1E 7JE, UK; sheng‐[email protected] (S.‐L.J.); [email protected] (L.G.P.);
[email protected] (I.D.L.B.) 2 College of Materials Science and Engineering, Chongqing University, Chongqing 400044, China
* Correspondence: [email protected]
Abstract: Market globalisation, shortened patent lifetimes and the ongoing shift towards personal‐
ised medicines exert unprecedented pressure on the pharmaceutical industry. In the push for con‐
tinuous pharmaceutical manufacturing, processes need to be shown to be agile and robust enough
to handle variations with respect to product demands and operating conditions. In this paper we
examine the use of operational envelopes to study the trade‐off between the design and operational
flexibility of the fluid bed dryer at the heart of a tablet manufacturing process. The operating flexi‐
bility of this unit is key to the flexibility of the full process and its supply chain. The methodology
shows that for the fluid bed dryer case study there is significant effect on flexibility of the process
at different drying times with the optimal obtained at 700s. The flexibility is not affected by the
change in volumetric flowrate, but only by the change in temperature. Here the method used a black
box model to show how it could be done without access to the full model equation set, as this often
needs to be the case in commercial settings.
Keywords: pharmaceutical manufacture; uncertainty; operational flexibility; operational envelopes;
modeling
1. Introduction
The power of big data, emanating from the process and from customers, is having a
number of effects on manufacturing. With coordinated access to reliable data, a manufac‐
turer can respond more rapidly and efficiently to supply chain demands. However, with
data comes the capability and often the demands from internal and external stakeholders
(customers, shareholders, regulators, neighbours, etc.) for greater transparency of opera‐
tions. Industry is going through something of a revolution to realise these aims. It is
known as Smart Manufacturing, Industry 4.0 or Digitalisation because of the capabilities
enabled by greater computing power, smarter algorithms, better measurement, and wider
connectivity. The smart manufacturing revolution is said to have three phases [1,2]:
1. Factory and enterprise integration and plant‐wide optimisation,
2. Exploiting manufacturing intelligence,
3. Creating disruptive business models.
For the process industries, all three phases are likely to drive significant change. [1–
6]. To a considerable extent, the first phase has been well underway for a decade or more,
particularly plant wide optimisation. The exploitation of big data from enhanced process
measurement, as well as using data for demand, supply and the operating environment,
is enabling the second phase which is also to some extent underway. Key enablers are
Citation: Jiang, S.‐L.; Papageorgiou,
L.G.; Bogle, I.D.L.; Charitopoulos,
V.M. Investigating the Trade‐Off
between Design and Operational
Flexibility in Continuous
Manufacturing of Pharmaceutical
Tablets: A Case Study of the Fluid
Bed Dryer. Processes 2022, 10, 454.
https://doi.org/10.3390/pr10030454
Academic Editors: Luis Puigjaner,
Antonio Espuña Camarasa, Edrisi
Muñoz Mata and Elisabet Capón
García
Received: 7 January 2022
Accepted: 21 February 2022
Published: 24 February 2022
Publisher’s Note: MDPI stays neu‐
tral with regard to jurisdictional
claims in published maps and institu‐
tional affiliations.
Copyright: © 2022 by the authors. Li‐
censee MDPI, Basel, Switzerland.
This article is an open access article
distributed under the terms and con‐
ditions of the Creative Commons At‐
tribution (CC BY) license (http://crea‐
tivecommons.org/licenses/by/4.0/).

Processes 2022, 10, 454 2 of 12
methods to manage flexibility and uncertainty, responsiveness and agility, robustness and
security, the prediction of mixture properties and function, and new modelling and math‐
ematics paradigms [2]. The third phase is less clear, but the drivers for personalised med‐
icine may affect the pharmaceutical industry more rapidly. Over the last decade there has
been an increasing industrial and research interest in the concept of continuous pharma‐
ceutical manufacturing (CPM). CPM offers the benefits of better resource utilisation, re‐
ducing energy costs and the potential for operating at processing conditions that would
otherwise be prohibitive within the conventional batch setting [7,8]. A key issue related to
CPM is the systematic identification of the attainable regions, typically referred to as the
design space, in order to employ optimisation for the design and operation of such pro‐
cesses [9].
Pharmaceutical processes involve a number of features which challenge current
modelling and control paradigms. They involve multiple phases: solids, liquids and gases
often with multiple liquid phases; they are typically combinations of batch and continu‐
ous units; and there are tighter regulatory frameworks for their operation than for chem‐
ical processes. Litster and Bogle [10] have highlighted the potential for Smart Manufac‐
turing in processes for formulated products which is the form of many pharmaceuticals.
Formulated products are structured, multiphase products (i.e., granules, tablets, emul‐
sions, and suspensions) whose performance characteristics—critical quality attributes
(CQAs)—are just as dependent on the product structure as they are on the chemical com‐
position (see for example [11,12]). To this end, a variety of process systems engineering
tools have been investigated for materialising Quality by Design (QbD) initiatives (see for
example [13]). Diab and Gerogiorgis [14] surveyed recent development for the design
space identification and visualisation for CPM while the same authors have proposed the
use of flowsheeting for technoeconomic assessment for the synthesis and crystallisation
of rufinamide [14] and nevirapine [15]. Recognising the inherent difficulty in accurately
deriving first‐principles mechanistic models for CPM units, Boukouvala et al. [8,9] pro‐
posed the use of Kriging data‐driven models for the dynamic modelling of unit opera‐
tions. In their work, dynamic Kriging models showed the ability to efficiently adapt across
transition regimes and outperformed the accuracy of neural network modelling. Recently,
Nagy et al. [16] presented a dynamic, integrated flowsheet model for the continuous man‐
ufacturing of acetylsalicylic acid which entailed a two‐step flow synthesis and crystallisa‐
tion.
Litster and Bogle [9] outlined the potential challenges and opportunities for Smart
Manufacturing for formulated products. Pressures on healthcare providers is requiring
greater efficiency and less inventory within a more changeable regulatory environment.
Personalised medicine will require much more responsive manufacturing for specific pa‐
tient groups. The industry is expected to bring products faster to market, as the recent
pandemic has demonstrated for vaccines. This all requires greater agility and flexibility
within the context of greater uncertainty of demand and of raw materials. This will need
greater use of mature model‐based tools—for design, control and supply chain optimiza‐
tion—to enable the managing of complexity and uncertainty. Many tools are available but
there is a lack of experience and often concern about the fidelity of the models and their
ability to predict with sufficient accuracy. This is exacerbated by the tendency of optimis‐
ers to push operations to the limits of well understood operation. Recently, Chen et al. [17]
surveyed a variety of contributions from the process systems engineering community and
outlined challenges and opportunities for the deployment of digital twins in pharmaceu‐
tical and biopharmaceutical manufacturing.
Uncertainty is caused by a wide range of factors: variability in quality and supply of
raw materials, in customer demand, and in environmental and utility conditions, and in
batch processes the effects of manual operations which is required. The potential impact
of uncertainty on the quality of pharmaceutical products in the context of continuous
pharmaceutical manufacturing has been widely recognized by the FDA [18,19]. Most
plants are over‐designed to cope with such uncertainty. When data are available through
Processes 2022, 10, 454 3 of 12
extensive experimentation, multivariate statistical methods such as PLS (partial least
squares regression) and PCA (principal component analysis) [20,21] as well as Bayesian
tools have been proposed [22]. Nonetheless, investigating the design space of a process
through experimentation comes at very high costs, due to the associated raw material and
energy utilisation, and is time consuming. To overcome this issue, model‐based probabil‐
istic frameworks have been examined. Laky et al. [23] presented two algorithms for the
refinement of the flexibility test and index formulations, originally proposed by Swaney
and Grossmann [24]. Kusumo et al. [25] examined the use of a nested sampling strategy
to reduce the computational time required related to Bayesian approaches for the proba‐
bilistic characterisation of design space characterisation. In order to ensure operation
within defined ranges it is important to define these regions for complex integrated batch
processing schemes. Samsatli et al. [26] developed a multi‐scenario optimisation method
for determining operational envelopes for batch processes. Since formulated products
have a range of critical quality attributes, it is necessary that these envelopes reflect a num‐
ber of quality conditions. There has been work to include a more systematic approach to
handling uncertainty: through stochastic methods which use knowledge of the likelihood
of uncertain events or through defining more explicit operational windows where safety
and quality can be guaranteed [27,28]. More recently, in the context of CPM work has been
published on methods of global sensitivity analysis [29], flexibility analysis [23] and clus‐
tering techniques [30]. Finally, the importance of Quality by Control (QbC) has been high‐
lighted by a number of research groups [31–34]
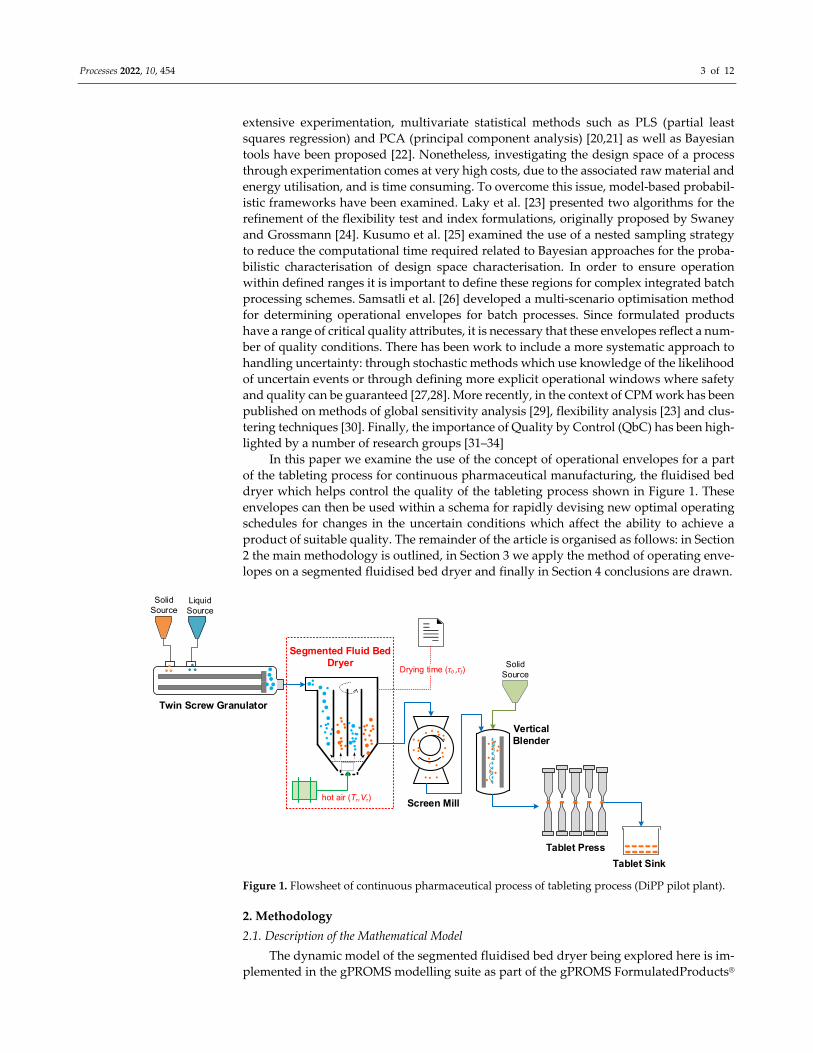
In this paper we examine the use of the concept of operational envelopes for a part
of the tableting process for continuous pharmaceutical manufacturing, the fluidised bed
dryer which helps control the quality of the tableting process shown in Figure 1. These
envelopes can then be used within a schema for rapidly devising new optimal operating
schedules for changes in the uncertain conditions which affect the ability to achieve a
product of suitable quality. The remainder of the article is organised as follows: in Section
2 the main methodology is outlined, in Section 3 we apply the method of operating enve‐
lopes on a segmented fluidised bed dryer and finally in Section 4 conclusions are drawn.
hot air (Tτ,Vτ)
0
Twin Screw Granulator
Segmented Fluid Bed Dryer
Screen Mill
Vertical Blender
Tablet Press
Tablet Sink
Solid Source
Liquid Source
Solid Source
Drying time (τ0 ,τf)
Figure 1. Flowsheet of continuous pharmaceutical process of tableting process (DiPP pilot plant).
2. Methodology
2.1. Description of the Mathematical Model
The dynamic model of the segmented fluidised bed dryer being explored here is im‐
plemented in the gPROMS modelling suite as part of the gPROMS FormulatedProducts®

Processes 2022, 10, 454 4 of 12
library [31]. The underlying mathematical formulation is based on the mechanistic model
presented by Burgschweiger et al. [35,36] and model parameters have been validated us‐
ing the Diamond Pilot Plant (DiPP) at the University of Sheffield. For the sake of brevity,
we omit the presentation of the full mathematical model and the interested reader is re‐
ferred to Burgschweiger and Tsotsas [36]. Regarding the underlying assumptions of this
model, we summarise them as follows: (i) plug flow in the bubble phase; (ii) the particle‐
free bubble phase and the suspension phase within the bed are modelled separately, (iii)
mass and heat transfer between drying gas and bubbles is significant and included in the
model; (iv) heat transfer between the bed wall, particles, suspension gas, environment and
bubble gas is also included.
2.2. Deriving the Operational Envelopes
As described in Samsatli et al. [26] the aim of deriving the operational envelopes of a
process or unit operation is to find the maximum range of uncertain operating policies
over which the design can be guaranteed to meet specific targets. The union of the maxi‐
mum range of the uncertainty operating policies is referred to as the “operational enve‐
lope”. This is particularly important for continuous pharmaceutical manufacturing as a
multistage process, since through the use of such decoupled envelopes for each unit op‐
eration it can be ensured that the product specifications can be met if we restrict ourselves
within the operating limits denoted through these envelopes.
The geometry of these envelopes can be arbitrary. However, in this work we employ
hyperrectangular geometry for the sake of computational simplicity. Mathematically, if
we denote by 𝑏 ∈ 𝑏 ,𝑏 the vector of uncertain parameters and their respective
limits, which can be inferred either by expert knowledge or based on past observations,
we seek to maximise the following objective function:
𝑧 𝑏 𝑏 (1)
where the index 𝑖 1, … ,𝑁 is the index of the parameters under investigation. Instead
of this objective function, which is non‐convex, Samsatli et al. [26] proposed the use of a
linear counterpart by introducing the difference in the magnitude of the ranges, i.e., Δ𝑏𝑏 𝑏 ∀𝑖. Following this step, Equation (1) is replaced by the linear Equation (2)
which reflects the scaled perimeter of the envelope.
𝑓1𝑁
∆𝑏 ∆𝑏
∆𝑏 ∆𝑏 (2)
Intuitively, since Equation (2) reflects a scaled perimeter the objective function range
is [0,1] with an value of 0 reflecting the minimal envelope possible, i.e., Δ Δ𝑏 ∀𝑖, and the maximal envelope feasible is obtained at the value of 1 where Δ Δ𝑏 ∀𝑖. With this modification the overall problem that maximises 𝑓 is given by model (M1).
max𝒂,𝒃𝑚𝑖𝑛,𝒃𝑚𝑎𝑥
𝑓1
𝑁𝑏
∆𝑏𝑖 ∆𝑏𝑖𝑚𝑖𝑛
∆𝑏𝑖𝑚𝑎𝑥 ∆𝑏𝑖
𝑚𝑖𝑛
𝑁𝑏
𝑖 1
Subject to
𝚽𝟎 𝒙𝟎,𝒙𝟎, 𝒚𝟎,𝒂𝟎,𝒃𝟎 𝟎 ∀𝒃 ∈ 𝒃𝑚𝑖𝑛,𝒃𝑚𝑎𝑥
𝒉 𝒙,𝒙,𝒚,𝒂,𝒃 𝟎 ∀𝒃 ∈ 𝒃 ,𝒃 , 𝑡 ∈ 0, 𝜏 , 𝜏 ∈ 𝒃
𝒈 𝒙,𝒙,𝒚,𝒂,𝒃 𝟎 ∀𝒃 ∈ 𝒃 ,𝒃 , 𝑡 ∈ 0, 𝜏 , 𝜏 ∈ 𝒃
𝚫𝒃 𝒃 𝒃
𝚫𝒃 𝚫𝒃 𝚫𝒃
(M1)

Processes 2022, 10, 454 5 of 12
In model (M1), Φ represents the set of initial conditions for the system under study;
𝒉 ∙ represents the vector of equality constraints which are part of the model, e.g.,
mass/energy balances; 𝒈 ∙ represents the vector of inequality constraints, e.g., product specifications/resource limitations; 𝒙 corresponds to differential state variables; 𝒙 their derivatives with respect to time (t); 𝒚 represents algebraic state variables; while 𝒂,𝒃 rep‐resent time variant and time invariant controls, respectively. Notice that in (M1) the upper
bound of the time horizon is also allowed to be an “envelope” variable in case one wanted
to investigate suitable bounds, for example for drying times.
Model (M1) is a semi‐infinite programming problem since it needs to be solved for
all the possible values of the 𝒃 vector of variables. To overcome this issue, a two‐step
multiscenario optimisation problem is solved in which the envelope variables are discre‐
tised as described in Samsatli et al. [26].
3. Case Study: Segmented Fluidised Bed Dryer
In this section we demonstrate the methodology using the digital model of the con‐
tinuous pharmaceutical process of the Diamond Pilot Plant (DiPP) at the University of
Sheffield, shown in Figure 1. The process is a tableting pilot plant at the heart of which is
a fluidised bed dryer (FBD) which is critical to the production of consistent quality prod‐
uct. The fluidised bed dryer (FBD) fluidises the feed granules to reduce their moisture
content. In the process high‐pressure hot air is introduced through a perforated bed of
moist solid granules. The wet solids are lifted from the bottom and when fluidised are
suspended in a stream of air. Heat transfer is accomplished by direct contact between the
wet solid and hot gases. The vaporised liquid is carried away by the gas stream. The tem‐
perature and rate of input gas can be adjusted to save energy by, for example, aiming to
shorten the drying time and manipulate the desired product (pharmaceutical granules)
quality subject to a required range for the moisture content. The FBD is typically divided
into a number of vertical segments.
As the FBD is connected with continuous twin screw granulation, the segmented FBD
will ensure the wet granules in one cell are dried whilst the incoming wet granules flow
into the neighbouring cell. Once the drying process in one cell is finished, the respective
cell is emptied pneumatically and then conveyed to the downstream unit, in this case a
mill. More segments contribute to reducing moisture but consume more time. In this
study we set the FBD equipment to have two segments. Each segment size is 0.035 m3,
with initial charge of 0.1 kg wet air and 0.1 kg granulates (lactose), with a particle density
of 750 kg/m2. With these equipment specifications and initial conditions, the drying time
is fixed by setting the volume and mass of the FBD, while temperature and flowrate of
input streams are time‐varied operating variables for achieving the moisture content ob‐
jective. We implemented a single‐factor experiment using gPROMS to investigate the ef‐
fect of drying times and the two operational parameters, temperature and flowrate of in‐
put gas, on the envelope size. Using these studies enables us to find a suitable design that
consumes less time and energy but has a bigger operational envelope.
Within a time interval 𝜏 , 𝜏 , solid particles flow through cells of the FBD, and air
with a temperature of 𝑇 𝜏 and a rate of 𝑉 τ is continuously fed to the bottom of the FBD. Through fluidisation of the particles and consequent drying of the particles, the
moisture content 𝛤 τ of feed granules is reduced to the goal of a moisture content 𝛤 (which could be a point or an interval). 𝑉 is the volumetric flowrate and 𝑇 is the temper‐
ature.
Employing the approach for traditional optimal control, we used the FBD model de‐
veloped within gPROMS as a black box model [31], adding end point and path constraints.
We used a black box model in order to show how it could be done without access to the
full model equation set since this often needs to be the case in commercial settings.
The mathematical formulation is as follows:

Processes 2022, 10, 454 6 of 12
min𝑥,𝑦,𝑇,𝑉𝜏
𝑓 Γ𝜏
Subject to:
𝛤 𝑡 Φ 𝑥 𝑡 , 𝑦,𝑇 𝑡 ,𝑉 𝑡 , , 𝜏 , 0 𝑡 𝜏
with End point constraints: 𝛤min 𝛤 𝛤max or 𝛤 𝛤max Path constraints: 𝑇min 𝑇 𝑡 𝑇max, ∀𝑡 ∈ 0, 𝜏
𝑉min 𝑉 𝑡 𝑉max,∀𝑡 ∈ 0, 𝜏 ,
(M2)
where min and max refer to the upper and lower bounds, respectively, for each opera‐
tional variable that is controllable. 𝑥 and 𝑦 refer to other model parameters that are un‐
controllable. The drying time 𝜏 is a design variable and is fixed. For each fixed value of the drying time, we applied the methodology shown in
Section 2 to find an optimal operating envelope. We were then able to explore the design
sensitivity by varying the value of the drying time to find a suitable design that consumes
less time and energy but has a bigger operational envelope. The selected design would be
the one that consumes less energy and has more flexibility.
Using the methodology shown in Section 2, to obtain an optimal balance between
design and operational variables, we let 𝑏 𝑇 ,𝑇 , 𝑉 ,𝑉 , and formulate
the following problem to determine the optimal operating envelope:
max𝑦,𝑏min,𝑏max
𝑓 ≡1
𝑁𝑏
∆𝑏𝑖 ∆𝑏𝑖min
∆𝑏𝑖max ∆𝑏𝑖
min
𝑁𝑏
𝑖 1
Subject to:
𝛤′ 𝜏 𝑓 𝑥 𝜏 , 𝑦, 𝑏𝑖, 𝜏 , 𝜏0 𝜏 𝜏𝑓
Γ𝑚𝑖𝑛 𝛤𝜏𝑓 Γ𝑚𝑎𝑥 or Γ𝜏𝑓 𝛤𝑚𝑎𝑥
𝑦min 𝑏𝑖 𝑦max
∆𝑏 𝑏 𝑏
∆𝑏 ∆𝑏 ∆𝑏
(M3)
The process modeling tool gPROMS [29] was used to implement and solve the model
to determine the optimal operating envelopes. The gPROMS modeling platform allows
existing models of processes to be converted to the envelope form and optimise their dy‐
namic operation. The solution steps are briefly illustrated as follows:
Step 1: fix the value of design variable 𝜏, the upper and lower bounds ∆𝑇,∆𝑉 and 𝛤, specify the interested range 𝑇 ,𝑇 𝑉 ,𝑉 of the bounded variables, and let
𝑇 𝑇 𝑇 𝑇 𝑇
𝑉 𝑉 𝑉 𝑉 𝑉
Step 2: generate 𝑁 scenarios, each with a different set of operational variables (𝑇,𝑉). For scenario 𝑘 1,⋯ ,𝑁 , the values are given by:
𝑇 𝑇 𝑝 𝑇 𝑇
𝑉 𝑉 𝑝 𝑉 𝑉

Processes 2022, 10, 454 7 of 12
where 𝑝 are normalized positions. For example, an optimization using two scenarios
(𝑁 2), one corresponding to the bottom left and another to the top right of the feasible region, we specify:
𝑝 0,0, … ,0 ,𝑝 1,1, … ,1
Step 3: Then we define the objective function, variables and constraints from the FBD
model within gPROMS, and solve the optimization problem to obtain the best values of
𝑇 ,𝑇 and 𝑉 ,𝑉 .
The algorithms were run on a personal computer with four 3.50 GHz processors and
16.0GB RAM using the Windows 10 operating system. The model and the approach can
be used to optimise the steady‐state and/or the dynamic behaviour of a continuous or
batch process; in this case the fluid bed dryer is continuous.
The sampling technique employed in this work was a grid‐based quasi‐Monte Carlo
sampling by using Sobol’ low discrepancy sequences [37]. They have been shown to pro‐
vide good distribution coverage even for fairly small sampling points. The design space
was partitioned into a number of square grids and then within each grid sampling points
were generated to evaluate feasibility. The interested reader is referred to Kucherenko et
al. [38] for an in‐depth discussion on the subject. In brief, for a response variable
𝑌 𝑋 ,𝑋 , … ,𝑋 which is a function of a set of input variables 𝑋 ,𝑋 , …𝑋 a unit hyper‐cube can be defined over the 𝑘‐dimensions. Combining unit hypercubes over a grid‐par‐
titioned design space with quasi‐random sequences is the most uniform possible solution
to secure coverage. This is due to the fact that quasi‐random points are selected from a
sequence whilst knowing the position of the previous points and thus filling gaps between
them [38].
We constructed an independent FBD model (M2), to minimise drying time and mois‐
ture content, respectively, subject to it being in the interval 10%, 40% . Next, we took the
following steps:
Step 1: Specify the range of the operating variables:
𝑇 ,𝑇 20 ℃, 80 ℃ , 𝑉 ,𝑉 240 m /h, 480 m /h
Step 2: Determine the feasible operating range with a drying time of 900 s which
specifies a range of outputs of interest and hence a range of inputs. We uniformly sampled
13 temperatures in the range 20,80 ℃ and 25 flow rates in the range 240,480 m /h. Next, we simulated the FBD model to detect the feasible region (i.e., 13 25 325 points) that satisfies end point and path constraints. Finally, we found all feasible solu‐
tions where the moisture falls in the range 10%, 40% . This is shown in Figure 2.

Processes 2022, 10, 454 8 of 12
Figure 2. Feasible design range for 𝑇 and 𝑉 at a drying time of 900 s.
Step 3: Run the optimisation model M3 with a drying time of 900 s to obtain the op‐
erating envelope for 𝑇 and 𝑉.
(a) When ∆𝑇 and ∆𝑉 are allowed to vary freely we obtain the optimal operational en‐
velope as shown in Figure 3 which maximises the area of the rectangle within the
feasible boundary.
(b) When we constrain the variation that T and V can have to the following range 5∆𝑇 20 ℃ and 10 ∆𝑉 60 m h⁄ , solving (M3) gives the optimal operational en‐
velope as shown in Figure 4. This maximises the envelope size while also maintaining
the maximal distance to the feasible boundary using model (M3).
Figure 3. Operational envelope for a drying time of 900 s: 𝑓 0.77.
Flo
w r
ate
V(m
3/h)

Processes 2022, 10, 454 9 of 12
Figure 4. Operational envelope for a drying time of 900 s while maintaining the maximal distance
to the feasible boundary: 𝑓 0.325.
The final stage is to explore the trade‐off between design and operational flexibility
as measured by the envelope size. The FBD model indicates that the feasible design space
varies with the drying time. Hence, we can select a best drying time by exploring the en‐
velope size. To do this we used a scenario‐based algorithm with 10 candidate drying times
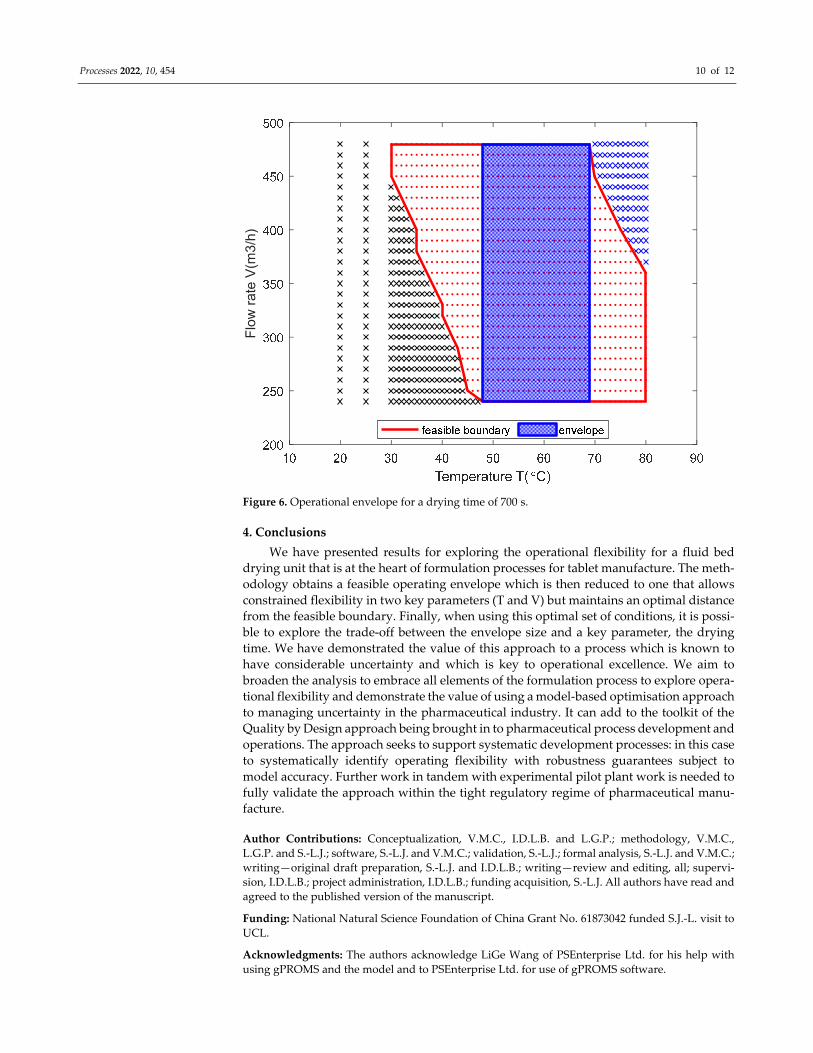
(600–1500 s) and allowed ∆𝑇 and ∆𝑉 to vary. From the results shown in Figure 5, we found that the FBD process can obtain the
maximal envelope size with 700 s (as shown Figure 6 where a larger number of sampling
points, i.e., 1000, was used to increase the resolution of the results), which means that this
design has the best flexibility using the chosen operating variables. Figure 5 shows that
there is significant effect on the flexibility of the process at different drying times with the
optimal obtained at 700 s. Interestingly, in this case, the flexibility is not affected by the change in ∆𝑉 but only by the change in temperature, for the specified ranges of uncer‐
tainty. Nonetheless, we should point out that in this work the related nonlinear program‐
ming models were solved with a local and not a global optimisation solver which could
explain some of the irregularities shown in Figure 5 for design options and envelope sizes.
Figure 5. Result of a design selection by trade‐off between envelope size and drying time.
Processes 2022, 10, 454 10 of 12
Figure 6. Operational envelope for a drying time of 700 s.
4. Conclusions
We have presented results for exploring the operational flexibility for a fluid bed
drying unit that is at the heart of formulation processes for tablet manufacture. The meth‐
odology obtains a feasible operating envelope which is then reduced to one that allows
constrained flexibility in two key parameters (T and V) but maintains an optimal distance
from the feasible boundary. Finally, when using this optimal set of conditions, it is possi‐
ble to explore the trade‐off between the envelope size and a key parameter, the drying
time. We have demonstrated the value of this approach to a process which is known to
have considerable uncertainty and which is key to operational excellence. We aim to
broaden the analysis to embrace all elements of the formulation process to explore opera‐
tional flexibility and demonstrate the value of using a model‐based optimisation approach
to managing uncertainty in the pharmaceutical industry. It can add to the toolkit of the
Quality by Design approach being brought in to pharmaceutical process development and
operations. The approach seeks to support systematic development processes: in this case
to systematically identify operating flexibility with robustness guarantees subject to
model accuracy. Further work in tandem with experimental pilot plant work is needed to
fully validate the approach within the tight regulatory regime of pharmaceutical manu‐
facture.
Author Contributions: Conceptualization, V.M.C., I.D.L.B. and L.G.P.; methodology, V.M.C.,
L.G.P. and S.‐L.J.; software, S.‐L.J. and V.M.C.; validation, S.‐L.J.; formal analysis, S.‐L.J. and V.M.C.;
writing—original draft preparation, S.‐L.J. and I.D.L.B.; writing—review and editing, all; supervi‐
sion, I.D.L.B.; project administration, I.D.L.B.; funding acquisition, S.‐L.J. All authors have read and
agreed to the published version of the manuscript.
Funding: National Natural Science Foundation of China Grant No. 61873042 funded S.J.‐L. visit to
UCL.
Acknowledgments: The authors acknowledge LiGe Wang of PSEnterprise Ltd. for his help with
using gPROMS and the model and to PSEnterprise Ltd. for use of gPROMS software.
Flo
w r
ate
V(m
3/h)

Processes 2022, 10, 454 11 of 12
Conflicts of Interest: The authors declare no conflict of interest.
Nomenclature
Symbols Definition
𝒕 time variables.
𝒙 differential state variables.
𝒙 derivatives of 𝒙 with respect to time 𝒕. 𝒚 algebraic state variables.
𝒂 time‐varying control and not bounded variables, which present the design decision vari‐
able in process.
𝒃 time‐varying control and bounded variables, which present the operational variable in
processes.
∆𝒃 sizes of the bound variables
𝑁 number of bounded variables
𝜏 processing time.
References
1. Davis, J.; Edgar, T.; Porter, J.; Bernaden, J.; Sarli, M. Smart manufacturing, manufacturing intelligence and demand‐dynamic
performance. Comput. Chem. Eng. 2012, 47, 145–156.
2. Bogle, I.D.L. A Perspective on Smart Process Manufacturing Research. Challenges for Process Systems Engineers. Engineering
2017, 3, 161–165. https://doi.org/10.1016/J.ENG.2017.02.003.
3. Li, D. Perspective for smart factory in petrochemical industry. Comput. Chem. Eng. 2016, 91, 136–148.
4. Gamer, T.; Hoernicke, M.; Kloepper, B.; Bauer, R.; Isaksson, A.J. The autonomous industrial plant—Future of process engineer‐
ing, operations and maintenance. J. Process Control 2020, 88, 101–110.
5. Kamble, S.S.; Gunasekaran, A.; Gawankar, S.A. Sustainable Industry 4.0 framework: A systematic literature review identifying
the current trends and future perspectives. Process Saf. Environ. Prot. 2018, 117, 408–425.
6. Rafiei, M.; Ricardez‐Sandoval, L.A. New frontiers, challenges, and opportunities in integration of design and control for enter‐
prise‐wide sustainability. Comput. Chem. Eng. 2020, 132, 106610.
7. Wang, Z.; Escotet‐Espinoza, M.S.; Ierapetritou, M. Process analysis and optimization of continuous pharmaceutical manufac‐
turing using flowsheet models. Comput. Chem. Eng. 2017, 107, 77–91.
8. Boukouvala, F.; Muzzio, F.J.; Ierapetritou, M.G. Design space of pharmaceutical processes using data‐driven‐based methods. J.
Pharm. Innov. 2010, 5, 119–137.
9. Boukouvala, F.; Muzzio, F.J.; Ierapetritou, M.G. Dynamic data‐driven modeling of pharmaceutical processes. Ind. Eng. Chem.
Res. 2011, 50, 6743–6754.
10. Litster, J.; Bogle, I.D.L. Smart Process Manufacturing for Formulated Products. Engineering 2019, 5, 1003–1009
11. Lakio, S.; Ervasti, T.; Tajarobi, P.; Wikström, H.; Fransson, M.; Karttunen, A.; Ketolainen, J.; Folestad, S.; Abrahmsén‐Alami, S.;
Korhonen, O. Provoking an end‐to‐end continuous direct compression line with raw materials prone to segregation. Eur. J.
Pharm. Sci. 2017, 109, 514–524. https://doi.org/10.1016/j.ejps.2017.09.018.
12. Singh, R.; Muzzio, F.J.; Ierapetritou, M.; Ramachandran, R. A Combined feed‐forward/feed‐back control system for a QbD‐
based continuous tablet manufacturing process. Processes 2015, 3, 339‐356. https://doi.org/10.3390/pr3020339.
13. Oka, S.; Sahay, A.; Meng, W.; Muzzio, F. Diminished segregation in continuous powder mixing. Powder Technol. 2017, 309, 79–
88. https://doi.org/10.1016/j.powtec.2016.11.038.
14. Diab, S.; Gerogiorgis, D.I. Process modelling, simulation and technoeconomic evaluation of crystallisation antisolvents for the
continuous pharmaceutical manufacturing of rufinamide. Comput. Chem. Eng. 2018, 111, 102–114.
15. Diab, S.; McQuade, D.T.; Gupton, B.F.; Gerogiorgis, D.I. Process design and optimization for the continuous manufacturing of
nevirapine, an active pharmaceutical ingredient for HIV treatment. Org. Process. Res. Dev. 2019, 23, 320–333.
16. Nagy, B.; Szilágyi, B.; Domokos, A.; Vészi, B.; Tacsi, K.; Rapi, Z.; Pataki, H.; Marosi, G.; Nagy, Z.K.; Nagy, Z.K. Dynamic flow‐
sheet model development and digital design of continuous pharmaceutical manufacturing with dissolution modeling of the
final product. Chem. Eng. J. 2021, 419, 129947.
17. Chen, Y.; Yang, O.; Sampat, C.; Bhalode, P.; Ramachandran, R.; Ierapetritou, M. Digital twins in pharmaceutical and biophar‐
maceutical manufacturing: A literature review. Processes 2020, 8, 1088.
18. Food and Drug Administration. Pharmaceutical cGMPs for the 21st Century—A Risk‐Based Approach; Technical Report; U.S. De‐
partment of Health and Human Services, Food and Drug Administration, Center for Drug Evaluation and Research (CDER):
Rockville, MD, USA, 2004.
19. Food and Drug Administration. Guidance for Industry Q8 Pharmaceutical Development; Technical Report August; U.S. Department
of Health and Human Services, Food and Drug Administration, Center for Drug Evaluation and Research (CDER): Rockville,
MD, USA, 2009.

Processes 2022, 10, 454 12 of 12
20. Huang, J.; Kaul, G.; Cai, C.; Chatlapalli, R.; Hernandez‐Abad, P.; Ghosh, K.; Nagi, A. Quality by design case study: An integrated
multivariate approach to drug product and process development. Int. J. Pharmaceut. 2009, 382, 23–32.
21. Garcia‐Munoz, S.; Luciani, C.V.; Vaidyaraman, S.; Seibert, K.D. Definition of design spaces using mechanistic models and geo‐
metric projections of probability maps. Org. Process. Res. Dev. 2015, 19, 1012–1023.
22. Peterson, J.J. A Bayesian approach to the ICH Q8 definition of design space. J. Biopharm. Stat. 2008, 18, 959–975.
23. Laky, D.; Xu, S.; Rodriguez, J.S.; Vaidyaraman, S.; García Muñoz, S.; Laird, C. An optimization‐based framework to define the
probabilistic design space of pharmaceutical processes with model uncertainty. Processes 2019, 7, 96.
https://doi.org/10.3390/pr7020096
24. Swaney, R.E.; Grossmann, I.E. An index for operational flexibility in chemical process design. Part I: Formulation and theory.
AIChE J. 1985, 31, 621–630.
25. Kusumo, K.P.; Gomoescu, L.; Paulen, R.; García Muñoz, S.; Pantelides, C.C.; Shah, N.; Chachuat, B. Bayesian approach to prob‐
abilistic design space characterization: A nested sampling strategy. Ind. Eng. Chem. Res. 2019, 59, 2396–2408.
26. Samsatli, N.J.; Sharif, M.; Shah, N.; Papageorgiou, L.G. Operational envelopes for batch processes. AIChE J. 2001, 47, 2277–2288.
27. Sharifian, S.; Sotudeh‐Gharebagh, R.; Zarghami, R.; Tanguy, P.; Mostoufi, N. Uncertainty in chemical process systems engineer‐
ing: A critical review. Rev. Chem. Eng. 2019, 37, 687–714.
28. Charitopoulos, V.M.; Aguirre, A.M.; Papageorgiou, L.G.; Dua, V. Uncertainty aware integration of planning, scheduling and
multi‐parametric control. Comput. Aid. Chem. Eng. 2018, 44, 1171–1176.
29. Wang, Z.; Ierapetritou, M. Global sensitivity, feasibility, and flexibility analysis of continuous pharmaceutical manufacturing
processes. Comput. Aid. Chem. Eng. 2018, 41, 189–213.
30. von Stosch, M.; Schenkendorf, R.; Geldhof, G.; Varsakelis, C.; Mariti, M.; Dessoy, S.; Vandercammen, A.; Pysik, A.; Sanders, M.
Working within the Design Space: Do Our Static Process Characterization Methods Suffice? Pharmaceutics 2020, 12, 562.
https://doi.org/10.3390/pharmaceutics12060562.
31. gPROMS, v.7.0.1; PSEnterprise: London, UK, 2021. Available online: https://www.psenterprise.com/products/gproms (accessed
on 6 September 2021).
32. Djuris, J.; Djuric, Z. Modeling in the quality by design environment: Regulatory requirements and recommendations for design
space and control strategy appointment. Int. J. Pharm. 2017, 533, 346–356.
33. Su, Q.; Ganesh, S.; Moreno, M.; Bommireddy, Y.; Gonzalez, M.; Reklaitis, G.V.; Nagy, Z.K. A perspective on Quality‐by‐Control
(QbC) in pharmaceutical continuous manufacturing. Comput. Chem. Eng. 2019, 125, 216–231.
34. Szilágyi, B.; Borsos, Á.; Pal, K.; Nagy, Z.K. Experimental implementation of a Quality‐by‐Control (QbC) framework using a
mechanistic PBM‐based non‐linear model predictive control involving chord length distribution measurement for the batch
cooling crystallization of l‐ascorbic acid. Chem. Eng. Sci. 2019, 195, 335–346.
35. Burgschweiger, J.; Groenewold, H.; Hirschmann, C.; Tsotsas, E. From hygroscopic single particle to batch fluidized bed drying
kinetics. Can. J. Chem. Eng. 1999, 77, 333–341.
36. Burgschweiger, J.; Tsotsas, E. Experimental investigation and modelling of continuous fluidized bed drying under steady‐state
and dynamic conditions. Chem. Eng. Sci. 2002, 57, 5021–5038.
37. Kucherenko, S.; Albrecht, D.; Saltelli, A. Exploring multi‐dimensional spaces: A comparison of Latin hypercube and quasi
Monte Carlo sampling techniques. arXiv Prepr. 2015, arXiv:1505.02350.
38. Saltelli, A.; Annoni, P.; Azzini, I.; Campolongo, F.; Ratto, M.; Tarantola, S. Variance based sensitivity analysis of model output.
Design and estimator for the total sensitivity index. Comput. Phys. Com. 2010, 181, 259–270.
Related Documents