See discussions, stats, and author profiles for this publication at: https://www.researchgate.net/publication/275209309 Development and evaluation of an eLearning course presentig a Regional destination. The case of "Ticino Switzerland... Conference Paper · October 2012 CITATIONS 5 READS 261 3 authors, including: Nadzeya Kalbaska University of Lugano 24 PUBLICATIONS 84 CITATIONS SEE PROFILE All content following this page was uploaded by Lorenzo Cantoni on 20 April 2015. The user has requested enhancement of the downloaded file.

Welcome message from author
This document is posted to help you gain knowledge. Please leave a comment to let me know what you think about it! Share it to your friends and learn new things together.
Transcript
Seediscussions,stats,andauthorprofilesforthispublicationat:https://www.researchgate.net/publication/275209309
DevelopmentandevaluationofaneLearningcoursepresentigaRegionaldestination.Thecaseof"TicinoSwitzerland...
ConferencePaper·October2012
CITATIONS
5
READS
261
3authors,including:
NadzeyaKalbaska
UniversityofLugano
24PUBLICATIONS84CITATIONS
SEEPROFILE
AllcontentfollowingthispagewasuploadedbyLorenzoCantonion20April2015.
Theuserhasrequestedenhancementofthedownloadedfile.

F&B AND OPERATIONS MANAGEMENT
Full Papers
FAST FOOD AND CULTURAL IMPACT: THE PERCEPTION OF CHINESE AND p. 13 SWISS CONSUMERS Reza Etemad-Sajadi & Daniela Rizzuto, Ecole hôtelière de Lausanne THE INFLUENCE OF ECOCENTRIC AND ANTHROPOCENTRIC ATTITUDES p. 23 AND INTRINSIC PRODUCT ATTRIBUTES ON ORGANIC WINE PREFERENCES Imran Rahman, Tyler Stumpf & Dennis Reynolds, Washington State University, Pullman RESTAURANT ENTREPRENEURS’ CHARACTERISTICS AND STRATEGIC ACTIONS p. 37 AND CONSIDERATIONS Christine Demen-Meier, Ecole hôtelière de Lausanne & François Pageau, Institut de tourisme et d’hôtellerie du Québec EXPLORING SERVICE SABOTAGE BEHAVIORS IN THE FOOD AND BEVERAGE p. 38 INDUSTRY Lou-Hon Sun, National Kaohsiung University of Hospitality and Tourism ETHNIC MINORITY PERCEPTIONS OF SELF-SERVICE TECHNOLOGY IN LIMITED p. 39 SERVICE RESTAURANTS Clark S. Kincaid & Seyhmus Baloglu, University of Nevada, Las Vegas (UNLV) CHALLENGES FOR PROCUREMENT IN THE UK CATERING INDUSTRY p. 47 Jane Eastham, Sheffield Hallam University FROM CRADLE-TO-CRADLE: FOOD SOURCING AND ATTITUDES OF RESTAURANTS p. 57 TO SUSTAINABLE DEVELOPMENTS. THE CASES OF THE CARIBBEAN, USA, SWITZERLAND AND WALES Ian Jenkins, Robert Bristow & Ralph Cervera, STAR (Swiss Tourism Applied Research), LRG-University of Applied Sciences Switzerland & Westfield State University, Massachusetts THE RELATIONSHIP BETWEEN THE USE OF TECHNOLOGY & SERVICE OPERATIONS p. 67 MANAGEMENT TOOLS AND HOTEL PROFITABILITY & CUSTOMER SATISFACTION Karolin Kokaz Pucciani, Ecole hôtelière de Lausanne & Jean Hurpé, Swissôtel Nankai Osaka THE RELATIONSHIP BETWEEN INDIVIDUALISM/COLLECTIVISM AND FOOD p. 81 HANDLER'S PRACTICES Ma'moun A. Habiballah, Al-Hussein Bin Talal University & Elizabeth M. Ineson, Manchester Metropolitan University
Short Papers GENERATION Y AND ORGANIC WINE: IS IT LOVE AT FIRST SIGHT? p. 82 Elena Cavagnaro, Stenden University of Applied Sciences, Academy of International Hospitality Research INFLUENCE OF FESTIVAL ATTRIBUTE QUALITIES ON SLOW FOOD TOURISTS’ p. 87 EXPERIENCE, SATISFACTION AND INTENTION TO RE-VISIT Timothy Jung, Manchester Metropolitan University, Mincheol Kim, Jeju National University & Elizabeth M. Ineson, Manchester Metropolitan University CLEANER GUESTROOMS FOR A BETTER LODGING INDUSTRY - A HACCP-BASED p. 92 MODEL FOR HOTEL HOUSEKEEPING Sheryl Kline, University of South Carolina, Jack Neal, University of Houston, Barbara Almanza, Purdue University & Olivia V. Stroia, University of South Carolina
Posters
OSTRICH MEAT AS A NEW PRODUCT IN THE HOSPITALITY OFFER IN REPUBLIC OF p. 93 MACEDONIA Gordana Petrovska-Rechkoska, Risto Rechkoski & Elena Petrovska, University “Sv.Kliment Ohridski”-Bitola, Faculty of tourism and hospitality-Ohrid, Republic of Macedonia ICT AND E-BUSINESS IN THE HOSPITALITY INDUSTRY IN THE REPUBLIC OF p. 95 MACEDONIA Mirjana Sekulovska, University St. Kliment Ohridski-Bitola, Faculty of Tourism and Hospitality-Ohrid & Emilijan Sekulovski, Politecnico di Milano O B/HRM
FINANCE
Full Papers
SPECIFICITY, FINANCIAL CONTRACT, AND LIQUIDITY OF COMMERCIAL REAL p. 96 ESTATE: A CONCEPTUAL MODEL FOR LODGING PROPERTIES Inès Blal, Ecole Hôtelière de Lausanne & Nicolas Graf, ESSEC Business School A STUDY OF THE EVOLUTION OF HIGH-END WINES IN SWITZERLAND p. 105 Philippe Masset, Jean-Philippe Weisskopf & Vincent Deboccard, Ecole hôtelière de Lausanne ACQUISITION PREMIUMS AND PERFORMANCE IMPROVEMENTS FOR ACQUIRERS p. 106 AND TARGETS IN THE LODGING INDUSTRY Jin-young Kim, Kyunghee University & Linda Canina, Cornell University THE CONDITIONAL CAPM IN THE TRAVEL AND LEISURE INDUSTRY p. 107 Alexis Beck & Philippe Masset, Ecole hôtelière de Lausanne RESTAURANT RISK: IDENTIFYING THE GAP BETWEEN RESEARCH AND INDUSTRY p. 117 PRACTICES Meng-Mei Chen & Raphael Zanoni, Ecole hôtelière de Lausanne
Posters PERFORMANCE MEASUREMENT IN THE CROATIAN HOSPITALITY INDUSRY – A p. 126 COMPARATIVE STUDY Milena Peršić , Sandra Janković & Katarina Poldrugovac, Faculty of Hospitality and Tourism Management , University of Rijeka
INNOVATION
Full Papers MANAGERIAL CAPABILITY FOR INNOVATION IN IRISH TOURISM MICRO FIRMS p. 128 Arthur Kearney & Denis Harrington, Waterford Institute of Technology
Short Papers SOCIAL ENTREPRENEURSHIP IN THE HOSPITALITY AND TOURISM INDUSTRIES p. 137 AS A BUSINESS MODEL FOR BRINGING ABOUT SOCIAL IMPROVEMENT IN DEVELOPING ECONOMIES Philip Sloan, Claudia Simons-Kaufmann & Willy Legrand, International University of Applied Sciences Bad Honnef
HOSPITABLY SOCIAL OR SOCIALLY SUSTAINABLE? AN EXAMINATION OF SOCIAL p. 142 ENTREPRENEURSHIP WITHIN THE HOSPITALITY INDUSTRY Colin Johnson, Mehmet Ergul & Geoffrey Desa, San Francisco State University
Posters A CONCEPTUAL MODEL FOR MANAGING THE HOSPITALITY INNOVATION PROCESS p. 149 Robert Harrington, University of Arkansas & Michael Ottenbacher, Heilbronn University
MARKETING
Full Papers ONLINE MARKETING PRACTICES OF DIFFERENT HOTEL SEGMENTS: CONTENT p. 150 ANALYSIS Maryam Khan, Howard University Washington CSR: ARE VISITORS WILLING TO PAY FOR RESPONSIBILITY? p. 158 Henri Kuokkanen & Michael Macdonald, Glion Institute of Higher Education CAPTURING THE GUEST EXPERIENCE IN HOTELS. PHASE TWO: EXPLORATORY p. 169 STUDY ON THE SENSORY CHARACTERISTICS OF A COMFORTABLE AND INVITING AMBIENCE Ruth Pijls & Brenda Groen, Saxion University of Applied Sciences EFFECT ON PRICES OF THE ATTRIBUTES OF THE SAILING BOATS: A HEDONIC p. 179 PRICES APPROACH Neven Sipic, Zagreb School of Business AN EXPLORATION OF THE RELEVANCE AND RECALL OF SOCIAL MEDIA IN HOTEL p. 188 ROOM PURCHASE Hilary Catherine Murphy & Meng-Mei Chen, Ecole hôtelière de Lausanne EXPLORING THE MOTIVES OF HOTEL GUESTS IN THEIR CHOICES ABOUT p. 189 SUSTAINABILITY WITH REGARD TO HOTEL STAY Arjan van Rheede & Rob J. Blomme, Hotelschool The Hague THE PRESENCE OF A VIRTUAL AGENT ON THE RESTAURANT’S WEBSITE: THE p. 195 IMPACT ON WEB-USERS’ PERCEPTION Reza Etemad-Sajadi, Ecole hôtelière de Lausanne CUSTOMERS’ LIGHTING NEEDS AND WANTS AT THE RESTAURANT p. 204 Caroline Jacquier & Agnès Giboreau, Food and Hospitality Research Center – Institut Paul Bocuse FREQUENCY AND MAGNITUDE OF EMOTIONAL DESCRIPTORS OF HOSPITALITY p. 212 CUSTOMER REVIEWS: AN INDEX VALIDATION Samad Laaroussi & Lohyd Terrier, Ecole hôtelière de Lausanne EXAMINE THE ANTECEDENTS AND OUTCOMES OF RELATIONSHIP QUALITY p. 226 Christina Geng-qing Chi, Washington State University & Wen Biyan, Jinan University HOTEL SEARCH AND SELECTION ATTRIBUTES FOR LEISURE TRAVELERS – THE p. 235 CASE OF SWISS OFFICIAL STAR RATING Horatiu Tudori & Francine Federer, Ecole hôtelière de Lausanne
STATUS-SEEKING CONSUMER BEHAVIOUR AND ITS IMPACT ON THE HOSPITALITY p. 236 CONSUMPTION OF YOUNG PROFESSIONAL FEMALES Kimberley Anne Kirk-Macaulay & Susan Horner, Bournemouth University
Short Papers USING HOTEL STORIES TO ADD NEW VALUE TO THE HOTEL EXPERIENCE p. 237 Bastienne Bernasco, Saxion University of Applied Research EXPLORING SERVICE ENCOUNTER QUALITY WITH TOURISM STUDENTS p. 242 Sanna-Mari Renfors & Vappu Salo, Satakunta University of Applied Sciences A MODIFIED ORGANIZATIONAL BUYING BEHAVIOR MODEL OF THE MEETING p. 247 PROFESSIONAL'S SITE SELECTION PROCESS Carole Sox, Sheryl Kline, Sandy Strick & Xiang Robert Li, University of South Carolina ASSESSING ATTENDEES' ATTITUDES TOWARDS A SPECIAL EVENT: APPLYING p. 248 HEDONIC DIMENSIONS Deborah Breiter, Diehdra Potter & Duncan Dickson, Rosen College of Hospitality Management University of Central Florida GUEST JOURNEY EXPERIENCE MAPPING p. 249 Jan Huizing, Karoline W. Wiegerink & Danilo Huss, Hotelschool The Hague THE SENIOR TRAVELER: PERCEPTIONS OF CHINESE SENIORS TOWARDS FUTURE p. 250 TRAVEL Howard Adler & Tong Ji, Purdue University YOUTH TRAVEL AND THEIR DESTINATION CHOICE p. 254 Ali Sukru Cetinkaya, Selcuk University, Yuliya Skorobogatova, Università della Svizzera Italiana & Muzaffer Uysal, Virginia Tech EXPLORING THE INFLUENCE OF FOUR REALMS OF EXPERIENTIAL MARKETING p. 258 ON IMPULSE BUYING IN CHINESE NEW YEAR FESTIVAL Austin Rong-Da Liang, National Kaohsiung University of Hospitality and Tourism & Jun-Shu Zhang, Shanghai Normal University IS GENERATION Y READY TO GO GREEN? p. 264 Marketa Kubickova, H. G. Parsa & K. Nusair, Rosen College of Hospitality Management University of Central Florida
Posters ONLINE HOTEL BRAND IMAGE: HOTEL MARKETING MANAGERS' PERSPECTIVES p. 265 Duangthida Nunthapirat & Hesham Al-Sabbahy, School of Hospitality and Tourism Management, University of Surrey WHICH FACTORS ARE IMPORTANT FOR CUSTOMERS CONCERNING HOTEL p. 267 LOYALTY PROGRAM DESIGN? Mareike Haas, Heilbronn University, Michael Ottenbacher Heilbronn University & Robert J. Harrington University of Arkansas GETTING TO KNOW THE CONTENT OF THE ‘WOW’ p. 269 Lysbeth Vink, Annette Kappert-White & Daphne Dekker, Hotelschool The Hague
OB/HRM
Full Papers THE EFFECTS OF HOPE AND WORK ENGAGEMENT ON FRONTLINE EMPLOYEES’ p. 272 PERFORMANCE OUTCOMES Osman M. Karatepe, Faculty of Tourism Eastern Mediterranean University WHEN EMPLOYEES WALK THE COMPANY TALK: THE BENEFITS OF INVOLVEMENT p. 281 IN CORPORATE PHILANTHROPY FOR EMPLOYEE COMMITMENT AND GOODWILL Steffen P. Raub, Ecole Hôtelière Lausanne THE IDEAL BOSS IN HOSPITALITY INDUSTRY - THE SEARCH GOES ON p. 282 Kari Nurminen, HAAGA-HELIA University of Applied Sciences THE USE OF THE PSYCHOLOGICAL CONTRACT TO EXPLAIN SELF-PERCEIVED p. 283 EMPLOYABILITY Jenny Sok, Hotelschool The Hague, Rob Blomme, Nyenrode Business University & Debbie Tromp, Hotelschool The Hague ACCEPTANCE OF LOW PAY: A STUDY OF PEOPLE IN LOW PAID JOBS p. 294 Sumeetra Ramakrishnan, Middlesex University INTERCULTURAL COMPETENCE AS AN ANTECEDENT OF FRONTLINE EMPLOYEES' p. 295 JOB ATTITUDES AND BEHAVIORS IN THE HOTEL SECTOR Ankie Hoefnagels, Maastricht Hotel Management School, Armand Odekerken, Maastricht Hotel Management School & Josee Bloemer, Radboud University EXPATRIATE MANAGERS IN THE HOSPITALITY INDUSTRY AND NEGOTIATION p. 310 SUCCESS: AN EMPIRICAL ANALYSIS OF SPANISH HOTEL CHAINS IN LATIN AMERICA Agustín Alonso, Ana Arencibia, Desiderio J. García-Almeida & Ancor Suárez, University of Las Palmas de Gran Canaria PSYCHOLOGICAL EMPOWERMENT IN THE JORDANIAN HOSPITALITY INDUSTRY: p. 311 DOES THE CONTEXT MATTER? Andrew Lockwood, University of Surrey, Hesham Al-Sabbahy, University of Surrey, Khaled Odeh, Al-Hussein bin Talal University & Samer Al-Sabi, Al-Hussein bin Talal University HUBS AND SPOKES: CHARACTERISTICS OF CAREER NETWORKS OF p. 323 MICHELIN-STARRED CHEFS Florian Aubke, Marc Stierand & Stefanie Krätz, MODUL University Vienna & NHTV Breda University of Applied Sciences TO WHAT EXTENT DOES A STAR RETAIN TALENT? p. 324 Stéphanie Pougnet, Ecole Hôtelière de Lausanne ROLE AMBIGUITY AND ROLE CONFLICT IN OUTSOURCED AND p. 325 PROPRIETARY-MANAGED SPAS Veronica Waldthausen & Demian Hodari, Ecole hôtelière de Lausanne THE INFLUENCE OF COMMUNICATION QUALITY BETWEEN SUPERIORS AND p. 327 SUBORDINATES ON THE TRANSFER OF KNOWLEDGE IN THE HOTEL INDUSTRY José Luis Ballesteros Rodríguez, Desiderio J. García Almeida, Crisanto Román Montoya & Carmen Domínguez-Falcón, Universidad de Las Palmas de Gran Canaria & Lopesan REVISITING HOSPITALITY COMPETENCIES: THE CASE OF CYPRUS p. 328 Stelios Marneros, European University of Cyprus & Anastasios Zopiatis, Cyprus University of Technology
MANAGING HUMAN RESOURCES IN HOSPITALITY. THE IMPORTANCE OF HAVING p. 337 COMMITTED EMPLOYEES. Ana Machado Sampaio, ISMAI - Instituto Superior da Maia & Angeles Cabarcos , Universidade de Santiago de Compostela “DON'T THINK THERE AREN'T CROCODILES BECAUSE THE WATER IS CALM”: A p. 347 STUDY OF WORKPLACE CONFLICT NARRATIVES FROM THE MALAYSIAN HOTEL INDUSTRY Jing Jing Lee and Lyn Glanz, Glion Institution of Higher Education Les Roches-Gruyère University of Applied Sciences EMPLOYING MIGRANT WORKERS IN THE HOSPITALITY SECTOR - A STRATEGY p. 357 FOR GAINING COMPETITIVE ADVANTAGE? Hania Janta, University of Surrey, Peter Lugosi, Oxford Brookes University, Lorraine Brown, Bournemouth University & Adele Ladkin, Bournemouth University
Short Papers HOSPITALITY AND LANGUAGE p. 358 Leanne Schreurs, Saxion Hospitality Business School ASSESSING EFFECTS OF ACCULTURATION ON SERVICE FAILURE RESPONSES: p. 363 INSIGHTS FROM AUSTRALIAN-CHINESE CONSUMERS Karin Weber, Hong Kong Polytechnic University, Beverley Sparks, Griffith Business School & Cathy Hsu, Hong Kong Polytechnic University A BETTER HOSPITALITY INDUSTRY IN THE UNITED ARAB EMIRATES: p. 364 NATIONALISATION IN ROTANA HOTELS Olga Kampaxi, Cesar Ritz Colleges A STUDY OF EMOTIONAL LABOUR OF FAST FOOD EMPLOYEES p. 365 Hazrina Ghazali, Nurhasmilaalisa Abdul Halim & Yap Sing Yee, University PUTRA Malaysia HOSPITALITY EMPLOYEE WELL-BEING: INSIGHT FROM A LUXURY HOTEL IN p. 370 THAILAND Ewa M. Mottier & Robert A. Lewis, Les Roches-Gruyère University of Applied Sciences/Les Roches International School of Hotel Management THE LOW LEVEL OF ORGANISATIONAL SOCIAL CAPITAL IN HOTELS – A NEW p. 375 ZEALAND CASE STUDY Anthony Brien, Lincoln University, Nicholas Thomas, DePaul University & Ananda Hussein, Lincoln University HOSPITALITY BUSINESS: EXPLORING A NEW RESEARCH AGENDA p. 380 Brenda Groen, Saxion University of Applied Sciences, Xander Lub, Saxion University of Applied Sciences, Ruth Pijls, Saxion University of Applied Sciences & Rene Rijnders, Dutch Board of Hotel & Catering Industry
Posters A CASE STUDY OF MANAGEMENT NEGLIGENCE RESULTING IN WORKPLACE p. 381 VIOLENCE Stuart Feigenbaum, Hotelschool Den Haag & Suzanne Murrmann, Virginia Polytechnic Institute and State University STUDY OF PROFESSIONAL EDUCATION IN THE FIELD OF TOURISM IN LATVIA p. 383 Margarita Platace & Agita Donina, Faculty of International Tourism, School of Business Administration Turiba
PEDAGOGY
Full Papers EDUCATING THE NEW GENERATION OF GLOBAL MANAGERS: TESTING CULTURAL p. 384 INTELLIGENCE FOR BUSINESS STUDY ABROAD PARTICIPANTS A.J. Singh, Chunyan Peng & Linn Van Dyne, Eli Broad College of Business Michigan State University HOSPITALITY STUDENTS’ PERCEPTIONS OF DIGITAL TOOLS FOR LEARNING AND p. 395 SUSTAINABLE DEVELOPMENT Alisha Ali, Sheffield Hallam University, Hilary Catherine Murphy, Ecole hôtelière de Lausanne & Sanjay Nadkarni, Emirates Academy HOSPITALITY EDUCATION: CREATING SUSTAINABLE EMPOWERMENT p. 396 OPPORTUNITIES FOR WOMEN IN NIGERIA Belinda Nwosu, Wavecrest College of Hospitality STUDENT DETERMINANTS OF ACADEMIC ACHIEVEMENT AND PROGRAM p. 405 COMPLETION INTENTION Brian Soule, Pennsylvania State University, James A. Busser, University of Nevada & Cynthia Carruthers, University of Nevada DEVELOPMENT AND EVALUATION OF AN ELEARNING COURSE PRESENTING A p. 406 REGIONAL DESTINATION. THE CASE OF “TICINO SWITZERLAND TRAVEL SPECIALIST” Nadzeya Kalbaska, Olena Sorokolit & Lorenzo Cantoni, Università della Svizzera italiana
Short Papers EXPECTATIONS CREATED: A REVIEW OF GRADUATE MANAGEMENT TRAINING p. 415 PROGRAMMES FROM INTERNATIONAL HOTELS’ CORPORATE WEBSITES Fang Wang & Maureen Brookes, Oxford Brookes University PERCEPTIONS OF THE IMPORTANCE OF NUMERACY AS AN EMPLOYABILITY SKILL p. 420 BY HOSPITALITY STUDENTS AND EMPLOYERS: A COMPARISON OF UNITED KINGDOM AND HONG KONG Anne Conneally & David Egan, Sheffield Hallam University EXPLORING THE IMPACT OF EXECUTIVE FUNCTIONS ON THE STUDY PROGRESS OF p. 427 HOSPITALITY STUDENTS Nije Bijvank M., Saxion University of Applied Sciences, Woelders L., VU University, Verweij C. F., Saxion University of Applied Sciences & Tonnaer G. H., Saxion University of Applied Sciences REASONS FOR DROPPING OUT OF TOURISM STUDIES p. 432 Heli Müristaja, Tiina Viin & Rita Viik, Pärnu College, University of Tartu ASSESSING THE COMPETENCIES NEEDED BY HOSPITALITY MANAGEMENT p. 437 GRADUATES IN INDIA Li-Ting (Grace )Yang, University of South Carolina, Charles G. Partlow, University of South Carolina, Jaisree Anand, Auro University & Vimal Shukla, Auro University HOSPITALITY MANAGEMENT MBA PROGRAMMES – MEETING THE EMPLOYABILITY p. 442 NEEDS OF STUDENTS AND EMPLOYERS Seth Lewis, Ealing Hammersmith West London College
EXPERIENTIAL LEARNING THEORY (ELT) PERSPECTIVE: THE CASE OF GAP YEAR p. 447 TRAVEL RESEARCH Novie Johan, University of Surrey THE IMPACT OF SUMMER STUDY ABROAD ON STUDENTS' VENTURESOMENESS: p. 448 AN EXAMINATION USING PLOG'S PSYCHOGRAPHIC PERSONALITY TYPES Makarand Mody, Susan Gordon, Howard Adler & Xinran Lehto, Purdue University PROFILING HOSPITALITY MANAGEMENT STUDENTS p. 453 Wendy Smeets, Hotelschool The Hague THE IMPORTANCE OF HOSPITALITY CONCEPT WITHIN THE TEACHING METHODS p. 459 OF VOCATIONAL COLLEGE FOR CATERING AND TOURISM MARIBOR Nataša Artič & Helena Cvikl, Vocational College for Catering and Tourism Maribor A SCHOLARSHIP OF TEACHING AND LEARNING PROJECT IN HOSPITALITY AND p. 465 TOURISM: PERCEPTIONS OF PLACE THROUGH THE PHOTO VOICES OF STUDENTS Cynthia S. Deale, East Carolina University
Poster ASSESSING INTERCULTURAL SENSITIVITY OF STUDENTS AND ACADEMIC p. 466 PROGRAMS IN HOSPITALITY Larisa Buhin Loncar & Lucija Marinov, American College of Management and Technology COMPARING ORANGES WITH APPLES? LOOKING FOR ACADEMIC AND p. 467 PRACTITIONERS INTERESTS ON SUSTAINABILITY IN HOSPITALITY Elena Cavagnaro & Ernst Jonker, Stenden UAS STUDENTS GET INVOLVED IN HOTEL RECYCLING EFFORTS p. 470 Betsy Stringam, New Mexico State University
REVENUE MANAGEMENT
Full Paper GAME-THEORETIC OPTIMIZATION IN CONJOINT PRICING p. 471 Bjorn Arenoe & Jean-Pierre van der Rest, Hotelschool The Hague
Short Paper
TOURISM, CULTURAL HERITAGE AND REVENUE MANAGEMENT p. 479 Kate Varini, Oxford Brookes University & Rafael Matos-Wasem, Institute for Tourism, HES-SO Valais
Posters HUMAN-COMPUTER INTERACTION BETWEEN THE FORECASTING SUPPORT p. 484 SYSTEM AND THE REVENUE MANAGER Larissa Koupriouchina, Hotelschool The Hague, Jean-Pierre Van Der Rest, Hotelschool The Hague & Mark Dechesne, Leiden University
STRATEGY
Full Papers WHO'S IN CHARGE NOW? THE DECISION AUTONOMY OF HOTEL GENERAL p. 486 MANAGERS Demian Hodari & Willl Hobden, Ecole hôtelière de Lausanne AN EXAMINATION OF FRANCHISEE BUSINESS START UP THROUGH AN p. 487 ENTREPRENEURIAL LENS Maureen Brookes, Oxford Brookes University, Levent Altinay, Oxford Brookes University & Ruth Yeung, Institute for Tourism Studies, Macau HOSPITALITY FOR A BETTER WORLD: IS THE HOSPITABILITY INDUSTRY p. 488 MITIGATING ITS ENVIRONMENT IMPACTS? AN EMPIRICAL STUDY ON THE HOTELIERS’ PERCEPTIONS OF ONLINE SELF-AUDIT TOOLS AND THE BARRIERS AND MOTIVATORS TO INVEST IN GREEN AND ENERGY EFFICIENT TECHNOLOGIES. Willy Legrand, Cornelius Kirsche, Philip Sloan & Claudia Simons-Kaufmann, International University of Applied Sciences Bad Honnef CARBON FOOTPRINT MITIGATION THROUGH ENERGY SMART HOTEL p. 498 BENCHMARKING: A COMPARATIVE ANALYSIS OF SELF-ADMINISTERED ENERGY AUDIT ONLINE TOOLS FOR HOTELS Willy Legrand, Sabine Allhoff, Philip Sloan & Claudia Simons-Kaufmann, International University of Applied Sciences Bad Honnef “HOSPITALITY TOMORROW”: A CASE FOR DESIGN DRIVEN INNOVATION IN p. 509 HOSPITALITY RESEARCH Xander D. Lub, Saxion University of Applied Sciences, Laura Niño Caceres,Thought Refinery & René Rijnders, Dutch Board of Hotel & Catering Industry NEW VENTURE ENTRY MODE AND COMPETITIVE DYNAMICS: AN INVESTIGATION OF p. 519 LONG-TERM HOTEL PERFORMANCE Cathy A. Enz & Linda Canina, Cornell University DEVELOPMENT OF DYNAMIC CAPABILITIES: NEW ROLE OF HOTEL MANAGEMENT p. 527 COMPANIES Mozgovaya Evelina, HEC Geneva, Haemmerli Mike, Kempinski Hotels & Ferrary Michel, HEC Geneva THE HOTEL AS THE HOLIDAY / STAY DESTINATION: TRENDS AND INNOVATIONS p. 537 Detta M. Melia & Gereva Hackett, Dublin Institute of Technology
Short Papers A SET OF TOOLS FOR THE RISK ASSESSMENT OF BUSINESS ETHICS IN AN p. 547 ORGANISATION Benjamin Wirz, University of Surrey INTERNATIONAL HOTEL EXPANSION IN INDIA: OPPORTUNITIES AND CHALLENGES p. 553 Maryam Khan, Howard University DOES CUSTOMER LOYALTY TRANSLATE INTO LONG TERM PROFITABILITY WITHIN p. 558 THE HOTEL INDUSTRY? INVESTIGATING THE IMPACT OF NET PROMOTERS ON FIRM PERFORMANCE Betsy Stringam, New Mexico State University, John Gerdes, University of South Carolina & Basak Denizci Guillet, Hong Kong Polytechnic University
AN EXPLORATION OF THE RELATIONSHIPS BETWEEN SERVICE QUALITY, p. 564 SUSTAINABLE COMPETITIVE ADVANTAGE AND FIRM PERFORMANCE. Stuart Feigenbaum, Hotelschool The Hague
Posters CORPORATE SOCIAL RESPONSIBILITY AND IMPACT ON HOTEL INDUSTRIES p. 569 Babak Khazaeli, Université de Rennes1 KEY BENCHMARKS ANALYSIS IN THE EVALUATION OF ECONOMIC PERFORMANCE p. 570 OF SPA HOTELS IN THE CZECH REPUBLIC Alexey Kondrashov, Department of Tourism, University of Economics in Prague
TOURISM
Full Papers
SHANGHAI RESIDENTS’ PERCEIVED SOCIAL AND ECONOMIC IMPACTS OF THE p. 573 WORLD EXPO 2010: INSIGHTS FROM A LONGITUDINAL STUDY Xiang Robert Li, University of South Carolina, Cathy H.C. Hsu, The Hong Kong Polytechnic University & Laura Lawton, Griffith University DESTINATION MANAGEMENT ORGANIZATIONS - QUEST FOR PRESENT AND p. 574 FUTURE SUSTAINABLE DEVELOPMENT, A CROSS-COUNTRY ANALYSIS Katarzyna Klimek, University of Applied Sciences, Institute of Tourism HOW ORGANIZATION OF HOTEL INDUSTRY AFFECTS THE TOURIST DESTINATION p. 587 POSITIONING – AN EXAMPLE OF ISTRIA TOURIST DESTINATION Nadia Pavia, Faculty of Tourism and Hospitality Management Opatija & Tamara Floricic, Juraj Dobrila University of Pula CRUISE TOURISM IN JUNEAU, ALASKA: AN INCONVENIENT TRUTH? p. 599 Barbara Hoffmann & Alice Yau, Cesar Ritz Colleges REGIONAL DEVELOPMENT IN THE TRANSITION AND POST-TRANSITION ERA: p. 600 CASE ESTONIAN TOURISM REGIONS 1991-2011 Ain Hinsberg & Tiit Kask, Estonian School of Hotel & Tourism Management EHTE SUSTAINABILITY VALUES AND TOURISTS’ DESTINATION CHOICES p. 610 E. Sirakaya-Turk, University of South Carolina & Seyhmus Baloglu, UNLV TRANSFORMATIONAL HOSPITALITY AND TOURISM: THE HEALTH AND WELLNESS p. 611 SECTORS Melanie Smith, Budapest Business School EXPLORING THE POTENTIAL OF DEVELOPING DOMESTIC TOURISM IN ROMANIA p. 621 Colin Seeley & Gelu Pui, César Ritz Colleges IS THERE A FUTURE / CAREER FOR TOURIST GUIDES? p. 631 Detta M. Melia, & Josephine Rice, Dublin Institute of Technology AN ANALYSIS OF THE CONCEPT OF “ADVENTURE” IN ADVENTURE TOURISM. p. 643 CASE STUDY: GUIDED SKI MOUNTAINEERING IN THE EUROPEAN ALPS Christine Barnes, Swiss Hotel Management School
Short Papers
MEDICAL TOURISM AS A MEANS OF COMPETITIVE ADVANTAGE: THE CASE OF p. 653 TURKEY Mehmet Ergul, San Francisco State University, Colin Johnson, San Francisco State University, Ali Sukru Cetinkaya, Selcuk University & David S. Martin, Auburn University SUSTAINABLE TOURISM DEVELOPMENT – FACTORS FOR LOCAL RESIDENTS’ p. 654 ATTITUDE TOWARDS TOURISM AND TOURISTS (THE CASE OF BULGARIA) Maria Vodenska, Tourism Department, Sofia University REDEFINING COMMUNITY-BASED TOURISM p. 659 Emmanuel Barreto, Eurofin Hospitality MAKING SPACE HOSPITABLE: UNDERSTANDING THE COMPLEXITIES OF REUSING p. 664 THE HISTORIC BUILT ENVIRONMENT FOR HOSPITALITY Ian Elsmore, Sheffield Hallam University & Tanya Rountree, Nottingham Trent University THE CITY HOSPITALITY EXPERIENCE MODEL – SHAPING A HOSPITABLE CITY p. 665 Monique van Prooijen-Lander & Karoline W. Wiegerink, Hotelschool The Hague
Posters CULTURAL ROUTES IN TURKEY; EVLIYA ÇELEBI WAY p. 670 Canan Baştemur, Kastamonu University IMPORTANCE OF SPECIAL ACTIVITIES TOURISM DEVELOPMENT AS PERSPECTIVE p. 674 SYNERGY OF INCENTIVE TRAVEL AND EXPERIENCE ECONOMY IN LITHUANIA Nida Kaladyte & Skirmante Vaitkute, Vilnius kolegija/ University of Applied Sciences Vilnius State University
FAST FOOD AND CULTURAL IMPACT: THE PERCEPTION OF CHINESE AND SWISS CONSUMERS
Reza Etemad-Sajadi*
Ecole hôtelière de Lausanne Lausanne, Switzerland
and
Daniela Rizzuto Ecole hôtelière de Lausanne
Lausanne, Switzerland [email protected]
ABSTRACT
The purpose of this research is to investigate the degree of satisfaction and loyalty of Chinese and Swiss fast-food consumers. The aim is to compare Chinese/Swiss consumers’ perception of meal quality, service quality, price and their influence on their satisfaction and loyalty. The image of fast-food restaurants in the two countries is also compared.
Key Words: Service quality, Fast-food restaurants, Customer satisfaction, Customer loyalty, Culture
INTRODUCTION
Competition in the fast food market is growing and success depends more and more on customer retention. Therefore, service improvements are the key to competitive success. To succeed in different countries, fast-food providers must adapt themselves to local preferences (Qin et al., 2010). Indeed, despite a more and more globalized world, customers have differing needs and perceptions. Although, causes of satisfaction and dissatisfaction can sometimes be generalized, there are some variations according to cultural background. Therefore, it is important to identify the specific characteristics of culturally diverse markets (Brady et al., 2001). Indeed, most studies report an effect of culture (Hofstede, 1991) on perceptions and this implies that service offerings need to be adapted to the environment (Donthu and Yoo, 1998; Furrer et al., 2000; Hoare and Butcher, 2008; Laroche et al., 2004). It is crucial to understand how customers evaluate services so firms can adapt their offerings accordingly. By adapting to the local needs and preferences a step towards superior service quality is undertaken.
The way that service quality and meal quality are perceived by local consumers will influence customers’ satisfaction and consequently their loyalty in the future. Indeed, consumer loyalty is a pre-requisite for a successful and profitable business. Several authors also argued that satisfaction is an antecedent of loyalty (Woodside et al., 1989; Cronin and Taylor, 1992; Kandampully and Suhartanto, 2000; Lovelock and Wright, 2002; Hong and Goo, 2004; Ekinci et al., 2008; Faullant et al., 2008). Service quality has a direct impact on customer satisfaction and an indirect impact on customer loyalty. However, there are several more factors that must be taken into account such as the impact of firm’s image or even the perception of price fairness. A complete picture is essential in order to truly deliver what customers desire based on their national culture.
For this research, McDonald’s was chosen as it is the world’s market leader in fast food, the local leader in Switzerland and well represented in China. McDonald’s is an example of combination between its process of globalization, standardization and adaptation to local communities (Vignali, 2001). Switzerland and China were selected to represent two different cultures. Moreover, while McDonald’s is seen as a usual fast-food restaurant in some countries, it represents a symbol in others. Our goal is to investigate the antecedents of satisfaction and loyalty of Chinese and Swiss fast-food consumers.
LITERATURE REVIEW
The relationship between service quality, satisfaction, and loyalty
Several models exist to measure the quality of service perceived by the consumers. One of the most famous is SERVQUAL. Parasuraman et al. (1988) developed SERVQUAL instrument which measures customers’ perception of the received service and relate it to their expectations and the gap measures client’s satisfaction. Indeed, consumer perception of service quality is critical for the success of a firm as it is linked with customer satisfaction and loyalty (Parasuraman et al., 1985; Cronin and Taylor, 1992; Baker and Crompton, 2000; Lee et al., 2000; Caruana, 2002; Hong and Goo, 2004; Ladhari, 2009). Customer satisfaction acts as a mediator between service quality and loyalty and has an overall stronger effect on loyalty than service quality. However, satisfaction alone may not be enough to actually achieve loyalty (Woodside et al., 1989; Cronin and Taylor, 1992; Kandampully and Suhartanto, 2000; Lovelock and Wright, 2002; Hong and Goo, 2004; Ekinci et al., 2008; Faullant et al., 2008). It was found that the majority of customers who assert to be brand loyal did switch brand recently even if they were generally satisfied with their regular brand. Therefore, in order to become loyal and profitable for the company, a customer must be highly satisfied. Any drop from total satisfaction results in a major drop in loyalty (Jones and Sasser, 1995). Moreover, less money needs to be invested in attracting new customers as highly satisfied customers spread positive word of mouth and recommend the service to others (Lovelock and Wright, 2002). As far as restaurant experience is concerned, Stevens et al. (1995) adapted SERVQUAL to the restaurant industry and called it DINESERV. Several authors argued that food, physical environment, and employee services are major components and have an impact on customer satisfaction (Ryu et al., 2012; Chow et al., 2007; Jang and Namkung, 2009). In the fast food industry, several authors studied the impact of perceived service quality on customer satisfaction and loyalty (Stevens et al., 1995; Brady et al., 2001; Qin and Prybutok, 2009; Gilbert et al., 2004; Qin et al., 2010; Johns and Howard, 1998; Law et al, 2004). The factors such as the taste of food, the outlet cleanliness, the fast service, and the friendliness of staff seem to play a major role. Moreover, two values that are gaining importance are price and nutritional values (Kara et al., 1995; Oyewole, 1999; Min, 2011). Convenient operating hours are a further significant point for consumers (Oyewole, 1999).
Challenges when dealing with customers in different countries/cultures
One of the most important research studying cultural differences between countries was done by Hofstede in 1991. He stated that differences in thinking needed to be taken into consideration if one wants to define effective solutions in a cross-cultural context. People acquire patterns of thinking, feelings and potential acting during their childhood which are formed afterwards by their social environment. Picking up on the theory of Hofstede, Laroche et al. (2004) defined culture as the sum of learned beliefs, values, and customs that create behavioural norms for a given society. Culture is one of the key constraints to complete marketing standardization. In fact, it has been noted that the inability of firms and their managers to make adjustments to the demands of the international business environment, principally due to the inability or unwillingness of managers to appreciate cultural challenges, has been cited as the principal cause of international business failures. For business success in new geographic areas, it is vital to develop strategies that adapt to the cultural environment of the country. Depending on the characteristics of the culture, the service provider needs to work harder to delight its customers. As standardization is necessary in order to control cost, managers need to ensure that they offer the same services to similar customers. However, in parallel smart firms are customizing their offerings and services to local markets (Ueletschy et al., 2008). With the trend of globalization, growth of transnational corporations, and the emergence of culture related issues, cultural differences have become significant when explaining the behaviour of consumers and designing efficient marketing strategies and tools (Weiermair and Fuchs, 2000).
Hofstede (1991) identified five dimensions of culture which are i) power distance (the extent to which the less powerful members of institutions and organisations within a country expect and accept that power is distributed unequally), ii) individualism versus collectivism (the degree of interdependence a society maintains among its members), iii) masculinity versus femininity (the fundamental issue here is what motivates people, wanting to be the best or liking what you do), iv) uncertainty avoidance (the extent to which the members of a
culture feel threatened by ambiguous or unknown situations and have created beliefs and institutions that try to avoid these), and v) long-term versus short-term orientation (the extent to which a society shows a pragmatic future-oriented perspective rather than a conventional historical short-term point of view). These cultural dimensions have been widely used in explaining customers’ perception of service quality in different cultures (Donthu and Yoo, 1998; Furrer et al., 2000; Hoare and Butcher, 2008). Donthu and Yoo (1998) analysed the effect of Hofstede’s dimensions on customers’ service quality expectations. They found that the level of expectation is higher for customers with a culture identified to be individualistic, low on power distance, short-term oriented and high on uncertainty avoidance. Laroche et al. (2004) and Ueletschy et al. (2008) found that some measures of service quality and satisfaction were constant across cultures. This suggests that some marketing measures can be standardized but that total standardization will not lead to satisfaction. Whereas consumers from collectivist and/or high uncertainty avoiding cultures tend to voice praise when they receive superior service, they are also less apt to switch service providers and to voice criticism when they receive inferior customer service. In direct contrast, consumers from individualistic and/or low uncertainty avoiding cultures are less likely to praise superior service but are more apt to switch and to voice criticism.
Culture in Switzerland versus China
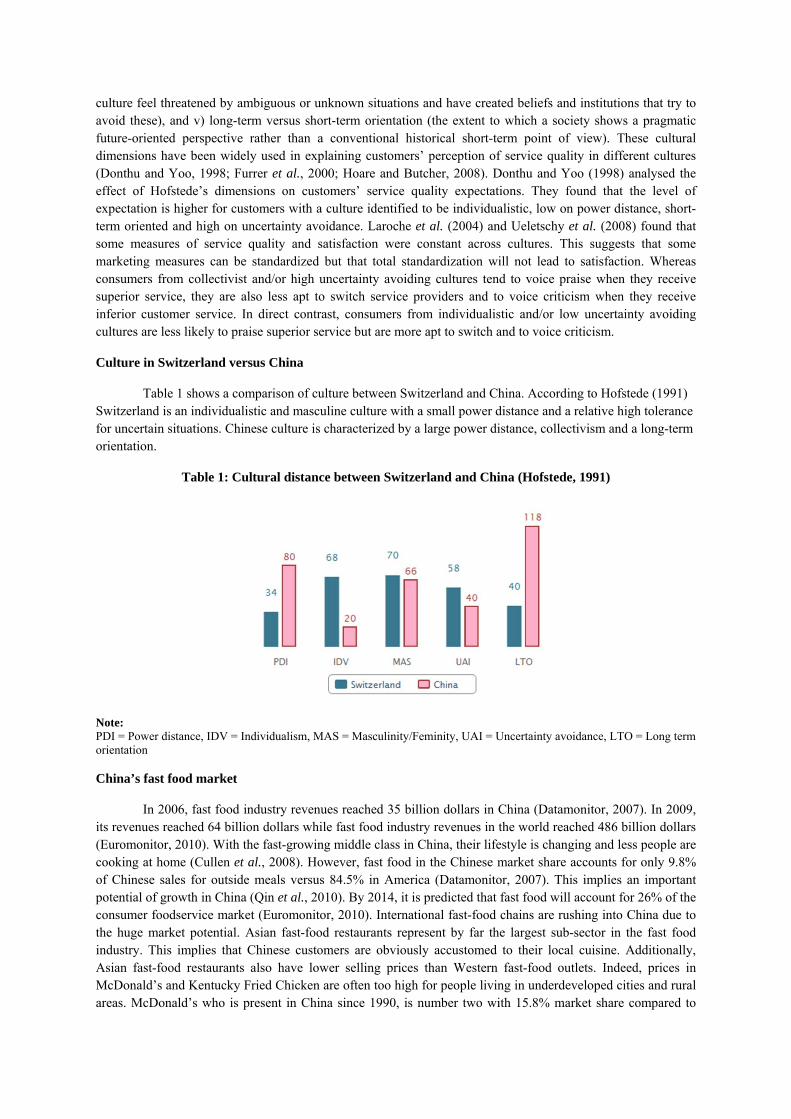
Table 1 shows a comparison of culture between Switzerland and China. According to Hofstede (1991) Switzerland is an individualistic and masculine culture with a small power distance and a relative high tolerance for uncertain situations. Chinese culture is characterized by a large power distance, collectivism and a long-term orientation.
Table 1: Cultural distance between Switzerland and China (Hofstede, 1991)
Note: PDI = Power distance, IDV = Individualism, MAS = Masculinity/Feminity, UAI = Uncertainty avoidance, LTO = Long term orientation China’s fast food market
In 2006, fast food industry revenues reached 35 billion dollars in China (Datamonitor, 2007). In 2009, its revenues reached 64 billion dollars while fast food industry revenues in the world reached 486 billion dollars (Euromonitor, 2010). With the fast-growing middle class in China, their lifestyle is changing and less people are cooking at home (Cullen et al., 2008). However, fast food in the Chinese market share accounts for only 9.8% of Chinese sales for outside meals versus 84.5% in America (Datamonitor, 2007). This implies an important potential of growth in China (Qin et al., 2010). By 2014, it is predicted that fast food will account for 26% of the consumer foodservice market (Euromonitor, 2010). International fast-food chains are rushing into China due to the huge market potential. Asian fast-food restaurants represent by far the largest sub-sector in the fast food industry. This implies that Chinese customers are obviously accustomed to their local cuisine. Additionally, Asian fast-food restaurants also have lower selling prices than Western fast-food outlets. Indeed, prices in McDonald’s and Kentucky Fried Chicken are often too high for people living in underdeveloped cities and rural areas. McDonald’s who is present in China since 1990, is number two with 15.8% market share compared to
40.2% of KFC (Euromonitor, 2010). As local products are favoured by Chinese customers, Western fast-foods such as McDonald’s must adapt their offers to the local market.
Switzerland’s fast food market
Sales of fast food remained strong in 2009, indicating that they have not suffered from or were not greatly impacted by the recent credit crunch. Indeed, they even benefited as customers downgraded from more expensive restaurants. In 2009, sales reached 1.5 billion dollars (Euromonitor, 2007). Further, the popularity of fast-food outlets among youngsters contributed to the growth. An estimated 20% of young people in Switzerland aged between 15 and 24 eat fast food more than twice a week (Euromonitor, 2010). The fast food industry is predicted to grow further, supported by time-pressed and busy customers looking for time-saving solutions (Euromonitor, 2010). Fast-food providers are challenged by the increasing health focus and campaigns sponsored by the Federal Office of Public Health and major consumer protection associations that prompt Swiss consumers to limit their fast food consumption. As a reaction to this trend, fast-food restaurants have adjusted their menu offerings. In order to cater to the health conscious clientele, they make ingredient and nutritional information available on their menus (Euromonitor, 2010). Burger fast food dominates the market with almost 50% of the total fast food value in 2009. McDonald’s is a major contributor to the fast food brand with 42% market share (Euromonitor, 2010) and its first restaurant opened in 1976.
RESEARCH FRAMEWORK
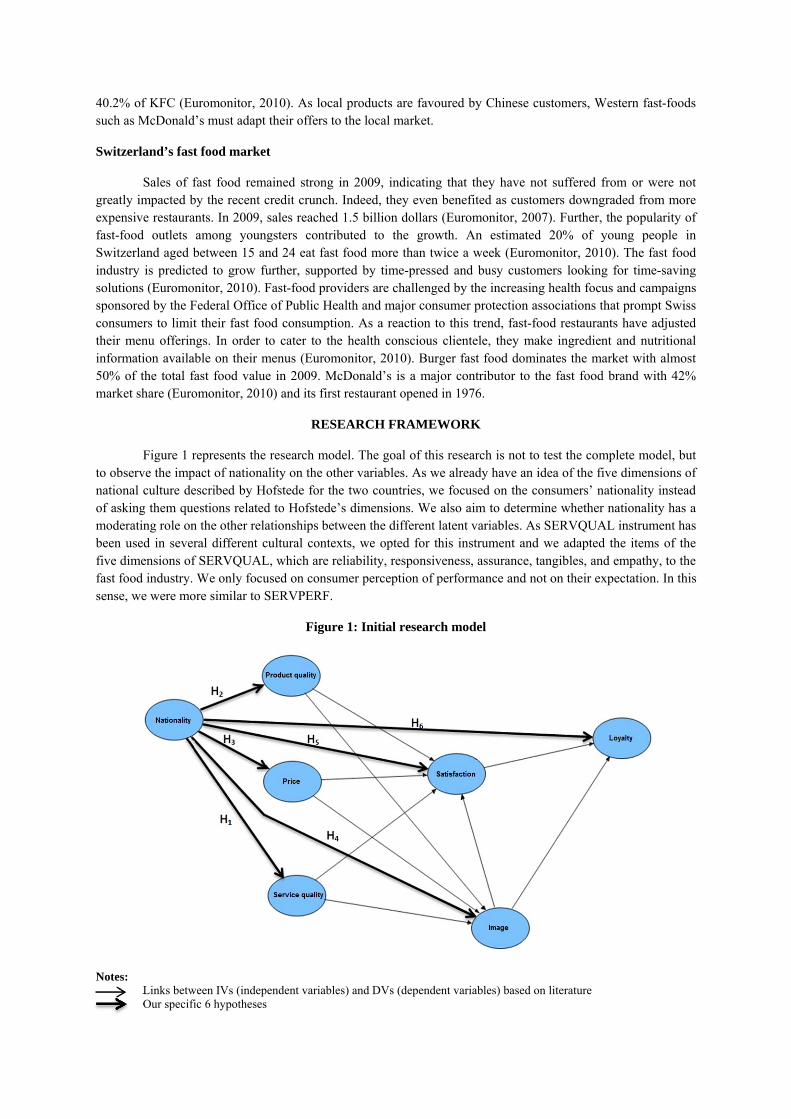
Figure 1 represents the research model. The goal of this research is not to test the complete model, but to observe the impact of nationality on the other variables. As we already have an idea of the five dimensions of national culture described by Hofstede for the two countries, we focused on the consumers’ nationality instead of asking them questions related to Hofstede’s dimensions. We also aim to determine whether nationality has a moderating role on the other relationships between the different latent variables. As SERVQUAL instrument has been used in several different cultural contexts, we opted for this instrument and we adapted the items of the five dimensions of SERVQUAL, which are reliability, responsiveness, assurance, tangibles, and empathy, to the fast food industry. We only focused on consumer perception of performance and not on their expectation. In this sense, we were more similar to SERVPERF.
Figure 1: Initial research model
Notes: Links between IVs (independent variables) and DVs (dependent variables) based on literature Our specific 6 hypotheses
METHODOLOGY
Sampling and data collection procedures
Switzerland and China were selected to represent Western and Asian cultures. We selected McDonald’s as it is globally a standardized and well-known fast-food chain. Students were chosen for our two samples. They were identified to be the current customers of fast-food restaurants and consequently possess an intuitive understanding of fast-food outlets. Further, they do not have a lot of discretionary income to spend on eating out and are therefore likely to choose cheap options such as McDonald’s. A student sample was also chosen to enhance sampling equivalence. This approach is often used for cross-cultural studies as they minimize demographic and socioeconomic variances (Clarke, 2001). Indeed, students share similar characteristics which facilitate a comparison of the variables in question. Research was facilitated through the easy access to universities and therefore to the target population. The sampling frame consists of Swiss students at Ecole hôtelière de Lausanne and University of St. Gallen, and Chinese students from the Beijing Hospitality Institute.
The questionnaire was sent to 683 Swiss students and to 572 students in China which results in a total number of 1255. A total of 118 responses were collected, 66 from Swiss students and 52 from Chinese students. This results in an overall response rate of 9.4% (9.7% for the Swiss sample, 9.1% for the Chinese sample). The relatively low response rate of the present study can be explained by the length of the questionnaire. Indeed, as we wanted to increase the reliability of respondents, we had several items for the majority of our latent variables.
Data analysis method
Data analysis was performed using ANOVA. Structural equation modeling (SEM) was also adopted to test the hypotheses because the model contains latent variables. We chose partial least square (PLS), because it does not require a large sample (Fornell and Lacker, 1981). SmartPLS 2.0 was used for the analysis. We employed a bootstrapping method (200 sub-samples) to test the significant level of regression path coefficients.
RESULTS
Reliability and validity of measures
All latent variables have a cronbach’s α higher than 0.6, which confirms that the scale reliabilities have adequate and stable measurement properties. Validity is assessed based on three main criteria, namely unidimensionality, convergent, and discriminant validity. An exploratory factor analysis can verify unidimensionalty. In our case, validity is confirmed and sufficient to support the model.
Results and discussion
Table2 shows the comparison of means between the perception of Chinese and Swiss fast-food consumers. The first major difference comes from the perception of product quality. Chinese consumers perceive a higher quality of product in McDonald’s (mean = 3.28) compared to Swiss consumers (mean = 2.25). This difference seems to be very important. On Figure 2, we see that the nationality explains 25.7% of variance of product quality perceived. Hence H2 is supported. Vignali (2001) argued that the perception of the quality of McDonald’s products varies based on the country. This point can also explain the fact that there is no significant difference of perception about price. Indeed, the perception about the fairness of the price is very similar in the two samples. Consumers in China appear to be willing to pay a higher price relative to their earnings due to the fact that they perceive a higher quality in McDonald’s products. Hence H3 is supported.
Another significant difference is the image of the company. We notice that Chinese consumers have a better image of McDonald’s (mean = 3.68) compared to Swiss consumers (mean = 3.36). Hence, H4 is supported. On can conclude that compared to China, McDonald’s managers in Switzerland should work harder
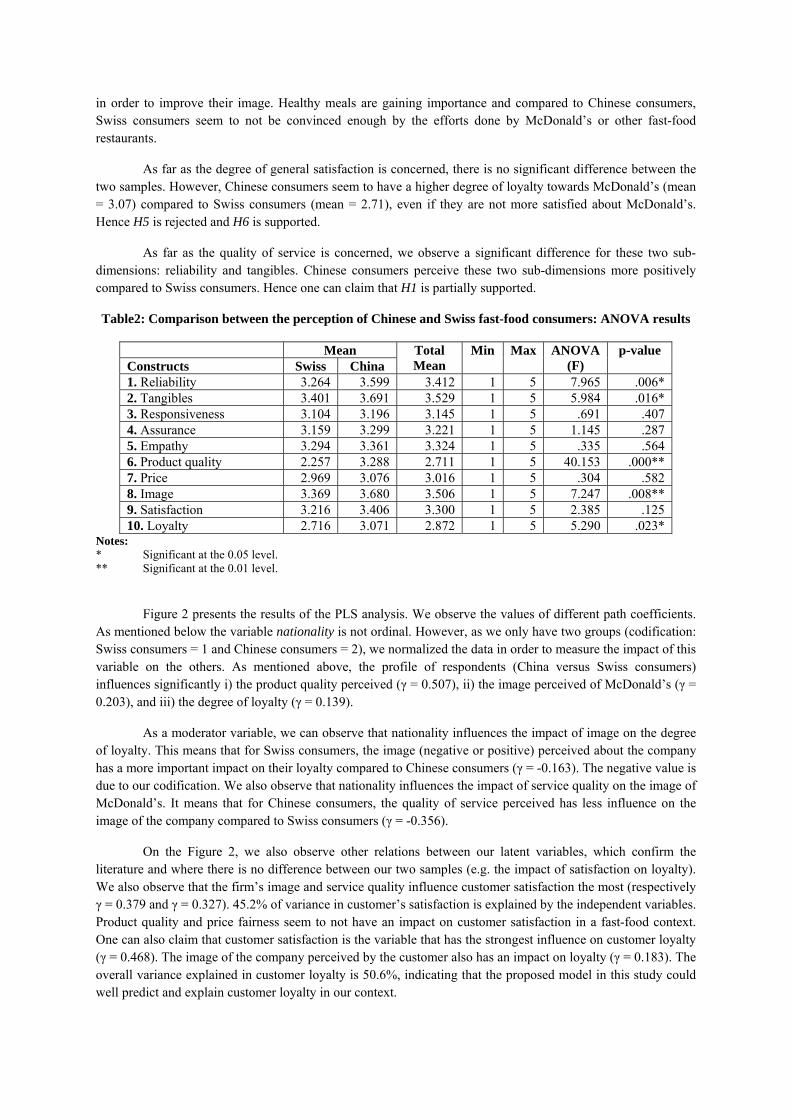
in order to improve their image. Healthy meals are gaining importance and compared to Chinese consumers, Swiss consumers seem to not be convinced enough by the efforts done by McDonald’s or other fast-food restaurants.
As far as the degree of general satisfaction is concerned, there is no significant difference between the two samples. However, Chinese consumers seem to have a higher degree of loyalty towards McDonald’s (mean = 3.07) compared to Swiss consumers (mean = 2.71), even if they are not more satisfied about McDonald’s. Hence H5 is rejected and H6 is supported.
As far as the quality of service is concerned, we observe a significant difference for these two sub-dimensions: reliability and tangibles. Chinese consumers perceive these two sub-dimensions more positively compared to Swiss consumers. Hence one can claim that H1 is partially supported.
Table2: Comparison between the perception of Chinese and Swiss fast-food consumers: ANOVA results
Mean Total Mean
Min Max ANOVA (F)
p-value Constructs Swiss China 1. Reliability 3.264 3.599 3.412 1 5 7.965 .006* 2. Tangibles 3.401 3.691 3.529 1 5 5.984 .016* 3. Responsiveness 3.104 3.196 3.145 1 5 .691 .407 4. Assurance 3.159 3.299 3.221 1 5 1.145 .287 5. Empathy 3.294 3.361 3.324 1 5 .335 .564 6. Product quality 2.257 3.288 2.711 1 5 40.153 .000** 7. Price 2.969 3.076 3.016 1 5 .304 .582 8. Image 3.369 3.680 3.506 1 5 7.247 .008** 9. Satisfaction 3.216 3.406 3.300 1 5 2.385 .125 10. Loyalty 2.716 3.071 2.872 1 5 5.290 .023*
Notes: * Significant at the 0.05 level. ** Significant at the 0.01 level.
Figure 2 presents the results of the PLS analysis. We observe the values of different path coefficients. As mentioned below the variable nationality is not ordinal. However, as we only have two groups (codification: Swiss consumers = 1 and Chinese consumers = 2), we normalized the data in order to measure the impact of this variable on the others. As mentioned above, the profile of respondents (China versus Swiss consumers) influences significantly i) the product quality perceived (γ = 0.507), ii) the image perceived of McDonald’s (γ = 0.203), and iii) the degree of loyalty (γ = 0.139).
As a moderator variable, we can observe that nationality influences the impact of image on the degree of loyalty. This means that for Swiss consumers, the image (negative or positive) perceived about the company has a more important impact on their loyalty compared to Chinese consumers (γ = -0.163). The negative value is due to our codification. We also observe that nationality influences the impact of service quality on the image of McDonald’s. It means that for Chinese consumers, the quality of service perceived has less influence on the image of the company compared to Swiss consumers (γ = -0.356).
On the Figure 2, we also observe other relations between our latent variables, which confirm the literature and where there is no difference between our two samples (e.g. the impact of satisfaction on loyalty). We also observe that the firm’s image and service quality influence customer satisfaction the most (respectively γ = 0.379 and γ = 0.327). 45.2% of variance in customer’s satisfaction is explained by the independent variables. Product quality and price fairness seem to not have an impact on customer satisfaction in a fast-food context. One can also claim that customer satisfaction is the variable that has the strongest influence on customer loyalty (γ = 0.468). The image of the company perceived by the customer also has an impact on loyalty (γ = 0.183). The overall variance explained in customer loyalty is 50.6%, indicating that the proposed model in this study could well predict and explain customer loyalty in our context.
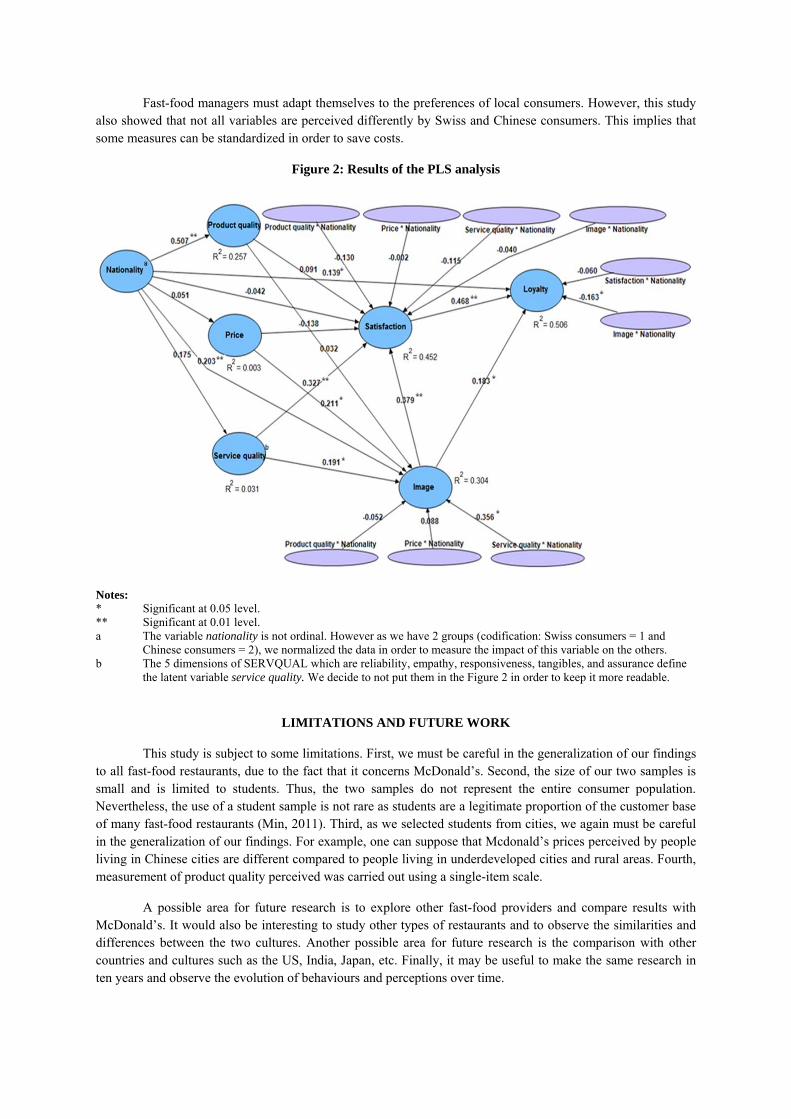
Fast-food managers must adapt themselves to the preferences of local consumers. However, this study also showed that not all variables are perceived differently by Swiss and Chinese consumers. This implies that some measures can be standardized in order to save costs.
Figure 2: Results of the PLS analysis
Notes: * Significant at 0.05 level. ** Significant at 0.01 level. a The variable nationality is not ordinal. However as we have 2 groups (codification: Swiss consumers = 1 and
Chinese consumers = 2), we normalized the data in order to measure the impact of this variable on the others. b The 5 dimensions of SERVQUAL which are reliability, empathy, responsiveness, tangibles, and assurance define
the latent variable service quality. We decide to not put them in the Figure 2 in order to keep it more readable.
LIMITATIONS AND FUTURE WORK
This study is subject to some limitations. First, we must be careful in the generalization of our findings to all fast-food restaurants, due to the fact that it concerns McDonald’s. Second, the size of our two samples is small and is limited to students. Thus, the two samples do not represent the entire consumer population. Nevertheless, the use of a student sample is not rare as students are a legitimate proportion of the customer base of many fast-food restaurants (Min, 2011). Third, as we selected students from cities, we again must be careful in the generalization of our findings. For example, one can suppose that Mcdonald’s prices perceived by people living in Chinese cities are different compared to people living in underdeveloped cities and rural areas. Fourth, measurement of product quality perceived was carried out using a single-item scale.
A possible area for future research is to explore other fast-food providers and compare results with McDonald’s. It would also be interesting to study other types of restaurants and to observe the similarities and differences between the two cultures. Another possible area for future research is the comparison with other countries and cultures such as the US, India, Japan, etc. Finally, it may be useful to make the same research in ten years and observe the evolution of behaviours and perceptions over time.
REFERENCES
Baker, D.A. and Crompton, J.L. (2000), “Quality, Satisfaction and Behavioural Intentions”, Annals of Tourism Research, Vol. 27 No. 3, pp. 785-804.
Brady, M.K., Robertson, C.J. and Cronin, J.J. (2001), “Managing behavioural intentions in diverse cultural environments: An investigation of service quality, service value and satisfaction for American and Ecuadorian fast-food customers”, Journal of International Management, Vol. 7 No. , pp. 129-149.
Caruana, A. (2002), “Service loyalty: The effects of service quality and the mediating role of customer satisfaction”, European Journal of Marketing, Vol. 36 No. 7/8, pp. 811-828.
Chow, I.H., Lau, V.P., Lo, T.Y., Sha, Z. and Yun, H. (2007), “Service quality in restaurant operations in China: decision- and experiential-oriented perspectives”, International Journal of Hospitality Management, Vol. 26 No. 3, pp. 698-710.
Clarke, I. (2001), “Extreme response style in cross-cultural research”, International Marketing Review, Vol. 18 No. 3, pp. 301-324.
Cronin, J.J. and Taylor, S.A. (1992), “Measuring Service Quality: A Re-examination and Extension”, Journal of Marketing, Vol. 56, July, pp. 55-68.
Cullen, L.T., Powell, B. and Mascarenas, D. (2008), “Eat meets west”, Time South Pacific, No. 3, January.
Datamonitor (2007), Chinese markets for fast food, Global Information, Inc., Asia Market Information & Development Company.
Donthu, N. and Yoo, B. (1998), “Cultural influences on service quality expectations”, Journal of Service Research, Vol. 1 No. 2, pp. 178-86.
Ekinci, Y., Dawes, P.L. and Massey, G.R. (2008), “An extended model of the antecedents and consequences of consumer satisfaction for hospitality services”, European Journal of Marketing, Vol. 42 No.1/2, pp. 35-68.
Euromonitor (2010), Fast-food in China, Euromonitor database.
Euromonitor (2010), Fast-food in Switzerland, Euromonitor database.
Euromonitor (2010), Global fast-food: Charting the course in a post-recession world, Euromonitor database.
Euromonitor (2007), No time to cook: fast-food, ready to eat eating and family meals, Euromonitor database.
Fornell, C.R. and Larcker, D. (1981), “Evaluating structural equation models with unobservable variables and measurement error”, Journal of Marketing Research, Vol. 18 No.1, pp. 39-50.
Furrer, O., Liu, B.S.C. and Sudharshan, D. (2000), “The relationship between culture and service quality perceptions: basis for cross-cultural market segmentation and resource allocation”, Journal of Service Research, Vol. 2 No. 4, pp. 355-371.
Gilbert, G.R., Veloutsou, C., Goode, M.M.H. and Moutinho, L. (2004), “Measuring customer satisfaction in the fast food industry: a cross-national approach”, Journal of Services Marketing, Vol. 18 No. 5, pp. 371-83.
Hoare, R.J. and Butcher, K. (2008), “Do Chinese cultural values affect customer satisfaction/loyalty?” International Journal of Contemporary Hospitality Management. Vol. 20 No. 2, pp. 156-171.
Hofstede, G. (1991), Cultures and Organizations, McGraw-Hill, New York, NY.
Hong, S. and Goo, Y.J.J. (2004), “A Causal Model of Customer Loyalty in Professional Service Firms: An Empirical Study”, International Journal of Management, Vol. 21 No. 4, pp. 531-540.
Jang, S. and Namkung, Y. (2009), “Perceived quality, emotions, and behavioral intentions: application of an extended Mehrabian-Russell model to restaurants”, Journal of Business Research, Vol. 62 No. 4, pp. 451-60.
Johns, N. and Howard, A. (1998), “Customer expectations versus perceptions of service performance in the foodservice industry”, International Journal of Service Industry Management, Vol. 9 No. 3, pp. 248-56.
Jones, T.O. and Sasser, W.E. (1995), “Why Satisfied Customers Defect”, Harvard Business Review, Nov – Dec., pp. 88-99.
Kandampully, J. and Suhartanto, D. (2000), “Customer loyalty in the hotel industry: the role of customer satisfaction and image”, International Journal of Contemporary Hospitality Management, Vol. 12 No. 6, pp. 346-351.
Kara, A., Kaynak, E. and Kucukemiroglu, O. (1995), “Marketing strategies for fast-food restaurants: A customer view”, International Journal of Contemporary Hospitality Management, Vol. 7 No. 2, pp. 16-27.
Ladhari, R. (2009), “Service quality, emotional satisfaction, and behavioural intentions: A study in the hotel industry”, Managing Service Quality, Vol. 19 No. 3, pp. 308-331.
Laroche, M., Ueltschy, L.C., Mark, S.A. and Yannopoulos, P. (2004), “Service Quality Perceptions and Customer Satisfaction: Evaluating the Role of Culture”, Journal of International Marketing, Vol. 12 No. 3, pp. 58-85.
Law, A.K.Y., Hui, Y.V. and Zhao, X. (2004), “Modeling repurchase frequency and customer satisfaction for fast food outlets”, International Journal of Quality & Reliability Management, Vol. 21 No. 5, pp. 545-63.
Lee, H., Lee, Y. and Yoo, D. (2000), “The determinants of perceived service quality and its relationship with satisfaction”, Journal of Services Marketing, Vol. 14 No. 3, pp. 217-231.
Lovelock, C. and Wright, L. (2002), Principles of Service Marketing and Management (2nd Edition), Upper Saddle River, New Jersey: Pearson Education Inc.
Min, H. (2011), “Benchmarking the service quality of fast-food restaurant franchises in the USA: A longitudinal study”, Benchmarking: An international Journal. Vol. 18, No. 2, pp. 282-300.
Oyewole, P. (1999), “Multi-Attribute Dimensions of Service Quality in the Fast-food Restaurant Industry”, Journal of Restaurant & Foodservice Marketing, Vol. 3 No. 3, pp. 65-91.
Parasuraman A., Zeithaml, V.A. and Berry, L.L. (1985), “A Conceptual Model of Service Quality and its Implications for Future Research”. Journal of Marketing. Vol. 49, pp. 41-50.
Parasuraman A., Zeithaml, V.A. and Berry, L.L. (1988), “SERVQUAL: A Multiple-Item Scale for Measuring Consumer Perceptions of Service Quality”, Journal of Retailing, Vol. 64 No. 1, pp. 12-40.
Parasuraman, A., Zeithaml, V.A. and Berry, L.L. (1994), “Reassessment of expectations as a comparison standard in measuring service quality: implications for future research”, Journal of Marketing, Vol. 58, January, pp. 111-124.
Qin, H. and Prybutok, V.R. (2009), “Service quality, customer satisfaction, and behavioural intentions in fast-food restaurants”, International Journal of Quality and Service Sciences, Vol. 1 No. 1, pp. 78-95.
Qin, H., Prybutok, V.R. and Zhao, Q. (2010), ”Perceived service quality in fast-food restaurants: empirical evidence from China”, International Journal of Quality & Reliability Management, Vol. 27 No. 4, pp. 424-437.
Ryu, K., Lee, H.R. and Kim, W.G. (2012), “The influence of the quality of the physical environment, food, and service on restaurant image, customer perceived value, customer satisfaction, and behavioral intentions”, International Journal of Contemporary Hospitality Management, Vol. 24 No. 2, pp. 200-223.
Stevens, P., Knutson, B. and Patton, M. (1995), “DINESERV: A tool for measuring service quality in restaurants”, Cornell Hotel and Restaurant Administration Quarterly, Vol. 36 No. 2, pp. 56-60.
Ueletschy, L.C., Rita, P., Laroche, M. and Bocaranda, C. (2008), “A Pan-European Approach to Customer Satisfaction: An Optimal Strategy?” The Multinational Business Review, Vol. 16 No. 3, pp. 41-71.

Vignali, C. (2001), “McDonald’s: Think global, act local – the marketing mix”, British Food Journal. Vol. 103 No. 2, pp. 97-111.
Weiermair, K. and Fuchs, M. (2000), “The impact of cultural distance on perceived service quality gaps: the case of alpine tourism”, Journal of Quality Assurance in Hospitality and Tourism. Vol. 1 No. 2, pp. 59-76.
Woodside, A.G., Frey, L.L. and Daly, R.T. (1989), “Linking Service Quality, Customer Satisfaction, and Behavioural Intention”, Journal of Health Care Marketing, Vol. 9 No. 4, pp. 5-17.
The Influence of Ecocentric and Anthropocentric Attitudes and Intrinsic Product Attributes on Organic Wine Preferences
Imran Rahman
Tyler Stumpf Prof. Dennis Reynolds ([email protected])
Washington State University Pullman, Washington, USA
Stand-up Presentation at the 2012 EuroCHRIE Conference
Lausanne, Switzerland
ABSTRACT
This experimental study, employing sensory evaluation in conjunction with a survey eliciting participants’ attitudes towards environmental issues, investigated whether ecocentric and anthropocentric values or attitudes influence consumer preference for organic wines. The means-end approach, evaluative conditioning, and consumer involvement provided the underlying theoretical foundation for the study. Despite strong theoretical underpinnings, the results indicate that taste alone among intrinsic wine attributes influenced participant preference for wines, whether organic or non-organic. Ecocentric and anthropocentric values or attitudes were found not to significantly influence participants’ preference for organic wine.
INTRODUCTION Since the advent of the “New Environmental Paradigm” (Catton & Dunlap, 1978) in the late 1970s, researchers interested in consumer behavior have paid increasing attention to the interface between society and the natural environment, including the importance of environmental consciousness as a factor that can influence human behavior (Dunlap and Catton, 1979). Now more than ever it is important to understand how consciousness of environmental issues affects consumer preferences and purchase decisions. The corresponding trend towards sustainable consumption has generated growing demand for products that incorporate social and environmental considerations into their design and delivery (Seyfang, 2007). This growing consumer demand warrants a deeper understanding of consumer purchase motivations and attitudes toward organic products (Yiridoe, 2005). The burgeoning segment of “ethical” consumers focuses on a range of issues associated with corporate responsibility, foremost among which is its concern with the environmental or ecological impact of purchase decisions (Tallontire, Rentsendorj, & Blowfield, 2001). As a result of the growing paradigm shift towards ‘eco-friendly’ lifestyles, consumers are “basing their purchasing decisions on how well products satisfy individual needs, while minimizing the negative impact on the natural environment” (Barber, Taylor, & Deale, 2010, p. 65). We observe evidence of this trend towards eco-friendly products in increasing demand for organically produced foods and beverages. Organic farming and production methods utilize natural, organic inputs and sustainable technologies to bring products in several segments—food, beverages, cosmetics, clothing, etc.—to the marketplace. Consumers concerned with sustainable consumption appreciate eco-friendly packaging practices and organic products, which they perceive as fitting their sense of identity, attitudes, and personal values (Vermeir & Verbeke, 2006). In short, today’s consumers “tend to view consumption acts both as an experience and as a slice of life” that reflects underlying values (Mora & Moscarola, 2010, p. 675). Prior studies have examined how environmental attitudes can impact purchase decisions (Balderjahn, 1988; Barber, 2010; Mainieri, Barnett, Valdero, Unipan, & Oskamp, 1997), the impact of product labeling on consumer preferences (Celhay & Passebois, 2011; Grankvist, Dahlstrand, & Biel, 2004), and factors that impact preferences for organic products (Chryssohoidis & Krystallis, 2005; Demeritt, 2002; Lodorfos & Dennis, 2008; Padel & Foster, 2005), but few, if any, studies have investigated these issues as we have, by combining three underlying theoretical approaches—means-end, evaluative conditioning, and consumer involvement. In this paper we deploy these approaches to examine factors that play into consumer purchase decisions regarding organic wines by combining a survey to elicit environmental attitudes with sensory evaluation, namely wine tasting. To our knowledge ours is the

only study of consumer preferences for organic wines that includes wine tasting and sensory evaluation in its methodology in an experimental setting. In particular, to contribute our unique approach to the literature, we conducted an empirical investigation that examines how consumer attitudes regarding environmental issues and values affect preferences for organic wines. To this end, we utilized an experimental research design to investigate the interplay between organic and non-organic wine cues, environmental attitudes, and wine preferences. The overarching purpose of this research is to extend our understanding of both the ways in which environmental attitudes affect consumer behavior and the role of product labeling in the formation of consumer perceptions, including preferences based on taste and other sensory modalities. Our methodology enabled us to examine the role of both extrinsic attributes, such as consumer values, and the intrinsic attributes of wine (taste, bouquet, and appearance) in the process through which consumers include labeling information when evaluating organic wines.
LITERATURE REVIEW
Sustainable Consumption Over the past decade, consumers have increasingly linked their consumption behaviors with social issues of personal relevance (Vermeir & Verbeke, 2006). Today’s consumer may integrate corporate ethics and social responsibility, fair trade, worker exploitation, animal rights, local economic development, nationalism, and support for diversity in addition to or instead of environmental awareness into their perceptions of and preferences for particular brands and products. As Solomon (1983, p. 319) aptly asserts, “Consumption does not occur in a vacuum; products are integral threads in the fabric of social life.” Environmental considerations are now given conspicuous prominence in the minds of contemporary consumers when making purchase decisions and lifestyle choices (Barber, Taylor, & Strick 2009). With the rise of ‘green consumerism,’ consumer identities, values, and attitudes play a pivotal role in connecting consumption activities and preferences with lifestyles and ideologies (Haanpaa, 2007). Thus, consumers may rely on the implicit social information that accompanies products in aligning purchase behaviors with desired social roles (Solomon, 1983). For example, in an effort to combine the satisfaction of personal needs with the broader societal obligations of environmental stewardship, consumers have increasingly assigned credence to the value of products made using organic processes. Organic Products Organic agricultural production omits the use of manufactured or ‘artificial’ chemical fertilizers and pesticides in order to reduce pollution and improve the quality of soil and the produce it yields (Reed, 2001; Seyfang, 2007). Proper labeling of organic agriculture products has been recognized as one of the first and most successful forms of labeling that signifies eco-friendly product attributes (Allen & Kovach, 2000). According to the United States Department of Agriculture (UDSA), the term organic is used in product labeling to indicate that the product has been certifiably produced via approved methods that “integrate cultural, biological, and mechanical practices that foster cycling of resources, promote ecological balance, and conserve biodiversity” (USDA, 2012). In addition to improving and sustaining soil health, organic production reduces surface and groundwater pollution, promotes habitat and genetic diversity protection for wildlife, and preserves significant elements of the cultural landscape such as small farms (Biao, Xiaorong, Zhuhong, & Yaping, 2003). Due to consumer emphasis on health (which we note in greater detail below) and sustainability, organic agricultural products have been growing rapidly in popularity. Organic food and beverage sales in the United States grew from $1 billion to $26.7 billion between 1990 and 2010, with total global sales reaching nearly $55 billion in 2009 (Willer & Kilcher, 2011). In addition, over 130 countries worldwide now house certified organic commercial agriculture operations (Lotter, 2003). Accordingly, researchers have become increasingly interested in organic food and beverage products. Examples from the extant literature include studies on the factors that impact organic product purchase decisions (Chryssohoidis & Krystallis, 2005; Demeritt, 2002; Lodorfos & Dennis, 2008; Padel & Foster, 2005), consumer perceptions of the quality attributes of organic foods (Hay, 1989), differences in organic food purchases based on
ethnicity (Quah & Tan, 2009) and country (Thøgersen, 2010), and consumer price considerations when making organic purchase decisions (Canavari, Nocella, & Scarpa, 2005; Doorn & Verhoef, 2011; Kalogeras, Valchovska, Baourakis, & Kalaitzis, 2009). Other studies have focused on the interface between organic products and environmental issues. In their study on organic food buyers in the Netherlands, Schifferstein and Oude-Ophuis (1998) found that these consumers are keenly interested in issues relating to nature and the environment. Grunert and Juhl (1995) reported results from Denmark that found environmental attitudes and organic food purchases were positively correlated, while Davies, Titterington, and Cochrane (1995) found that environmental concern was the primary motivation for purchasing organic food products. Finally, the association between organic products and the environment dovetails with a related interest in health. Recent trends in consumption habits exhibit a greater concern for both health and the environment on the part of consumers (Molla-Bauza, Martinez, Poveda, & Perez, 2005; Smith & Marsden, 2004). Numerous studies have shown that consumers perceive organic products as healthier and of higher quality as well as being safer for the environment (Magnusson, Arvola, Hursti, Aberg, & Sjoden, 2003; Saba & Messina, 2003; Schifferestein & Oude Ophius, 1998; Williams & Hammit, 2001). Environmental concern has been found to be a major determinant of organic food purchase decisions (Grunert, 1993; Van Dam, 1991), as has concern for health and overall animal welfare (Schifferstein & Oude-Ophuis, 1998; Soil Association, 2000; Tregear, Dent, & McGregor, 1994). As such, it seems reasonable to expect that consumers with a high level of concern for health and the environment will prefer organic wines to their non-organic counterparts. Wine and Involvement Compared with scholarly interest in aspects of consumer behavior relating to organic food purchasing decisions, relatively little attention has focused on organic beverages, including organic wines, the subject of the present study. Much as both eco-consciousness and organic food consumption (Schifferstein & Oude-Ophuis, 1998) have been characterized as benchmarks of a way of life, wine has been classified as a lifestyle beverage in its own right (Bruwer, Saliba, & Miller, 2011). Many people drink wine, that is, for more than the tactile sensations it provides. Wine helps to define a person’s identity as an expression of a desire to be associated with a particular lifestyle, social class, community, or culture. Wines can embody specific sociocultural characteristics and symbolic representativeness as well as contribute to the construction of one’s personal narrative (Mora & Moscarola, 2010). In view of these considerations, researchers use the concept of consumer involvement to help them elucidate how complex emotions and attitudes towards wine products can influence consumer choices (Barber et al., 2009; Barber, Taylor & Deale, 2010; Barber Taylor & Strick, 2010; Mora & Moscarola, 2010). Consumers are considered to be ‘involved’ with a product when the product is perceived as addressing or corresponding to something of considerable value or central importance in their lives (Vermeir & Verbeke, 2006). Zaichkowsky (1985) classifies involvement into three categories: the personal (inherent interests, values, or needs that motivate one towards an object), the physical (characteristics of an object that cause differentiation and increase interest), and the situational (something that temporarily increases the relevance of or interest in an object). Involvement and aspects of personality such as attitude are regarded as accurate predictors of environmental concern or consciousness (Antil, 1984). A handful of studies have investigated the interface between wine consumerism and environmental issues from a consumer involvement perspective. For example, Barber et al. (2009) examined how product and environmental involvement, along with knowledge and attitudes, affect purchase decisions, finding that consumer knowledge regarding environmental issues that pertain to wine is related to personal involvement with broader environmental issues, and that “involvement with wine as a product will positively impact a consumer’s belief in what they know about environmental wine issues.” The same study also suggests that consumer attitudes towards environmental issues are positively related to knowledge of environmental wine issues, and that strong attitudes regarding the environment are positively associated with willingness to purchase environmentally friendly wine. Barber, Taylor, and Deale (2010) focused on wine tourism to examine the relationship between environmental involvement, environmental attitude, behavior, and purchase intentions, finding significant relationships between strong environmental attitudes and willingness to purchase environmentally friendly wines. Barber (2010)
investigated profiles of consumers who are willing to pay a premium for green wine packaging (i.e., packaging that involves minimal environmental consequences) finding that consumers with more environmentally friendly attitudes are willing to pay a premium for such products. While these studies have yielded interesting insights into the wine consumption experience, the existing body of research does little to address consumer perceptions of either the extrinsic or intrinsic attributes of organic wines. Wine Labeling Scholars are becoming increasingly interested in the impact of wine labeling and packaging on consumer wine product evaluations. Labeling can significantly influence consumer purchase behavior and perceptions of quality, particularly among those interested in specific growing practices (Dimara & Skuras, 2005). Packaging styles can supplement labeling information to communicate distinct traits that also impact consumer perceptions and purchase behavior (Jarvis, Mueller, & Chiong, 2010). Mueller and Szolnoki (2010) used the expectancy disconfirmation approach, placing subjects in the blind condition to examine the effects of brand, grape variety, origin, and packaging, finding strong support for the impact of brand name and packaging on consumer preferences, while also reporting significant consumer demographic heterogeneity and varying responses to intrinsic and extrinsic product cues. We have mentioned the distinction between intrinsic and extrinsic product attributes, a distinction that is especially relevant for wine. After all, the culture of wine drinking focuses on intrinsic attributes such as aroma or bouquet, taste, color, or texture (Jarvis et al., 2010; Richardson et al., 1994). Yet research has shown that extrinsic attributes such as price, brand name, label imagery, and package design may also influence wine consumption and purchase behaviors (Richardson, Dick, & Jain, 1994). Boudreaux and Palmer (2007) investigated the effects of wine label imagery, label, and color on consumer perceptions of brand personality, finding significant evidence that these components of the wine label, and in particular label illustrations, do indeed affect perceptions of brand personality, which in turn impacts purchase intent. Jarvis et al. (2010) examined the impact of several wine label symbols, finding that distinct consumer segments reacted differentially to various metaphorical and non-metaphorical symbolic elements. Other studies have investigated which aspects of the wine label consumers seek out in purchase situations (Dimara & Skuras, 2005) and the relative impact of various labeling cues such as region of origin (Skuras & Vakrou, 2002; Tustin & Lockshin, 2001). While these and other studies in the wine literature have provided interesting insights into the impact of the extrinsic attributes of wine products, very little research has investigated how a wine’s extrinsic attributes influence consumer perceptions of its intrinsic attributes. One exception is Priilaid (2006), a study that involved sighted and blind tasting to illustrate how perceptions of wines’ intrinsic qualities are affected by extrinsic cues such as price, origin, and grape cultivar. The present study is a related but distinct variation of Priiliad’s, insofar as we use organic/non-organic labeling as an extrinsic cue posited to attempt to influence perceptions of intrinsic quality and overall wine preferences, which are in turn moderated by consumers’ environmental attitudes.
HYPOTHESIS DEVELOPMENT Means-End Approach The means-end approach can be used as the theoretical basis for understanding the relationship between product attributes and consumer values. Several studies have used the means-end conceptual framework to study consumer perceptions of and purchase behaviors regarding organic food (Makatouni, 2002; Zanoli & Naspetti, 2002) and wine products (Fotopoulos, Krystallis, & Ness, 2003). The means-end approach conceptualizes a product as the means through which a consumer achieves a desirable end value state (Gutman, 1982). Understanding end value states is important to both managers and consumer researchers because they play a critical role in shaping consumer decision patterns (Gutman, 1982) and are especially important in product positioning and market segmentation for high-involvement products such as wine (Judica & Perkins, 1992). The means-end approach can be modeled as a chain that starts with a consumer’s perception of a product’s attributes, which leads to perceptions about the functional and then social and psychological consequences of the
product’s use (Fotopoulos et al., 2003). These perceived consequences are governed by the values that are personally relevant to individual consumers, who will thus prefer products with attributes that help them achieve a desired end state that corresponds with their personal values (Judica & Perkins, 1992). In simple terms, consumers rely on perceived attributes or “cues” to help them make a purchase decision (Crane & Clarke, 1988).These means-end considerations result in our first research hypothesis: Hypothesis 1: The presence of an organic cue will influence subjects’ wine preferences such that
preference ratings will be significantly higher when the cue is present. When purchasing a specific food or wine product, consumers prefer specific attributes that they perceive as quality cues (signals) that pertain to the whole product. Examples of quality cues for wine can include taste, aroma, type, vintage, price, label, country of origin, and bottle enclosures. Based on the distinction between intrinsic and extrinsic cues (Olson 1977; Olson & Jacoby, 1972), taste, appearance, and bouquet are examples of intrinsic cues for wine whereas vintage and country of origin serve as extrinsic cues. Therefore, when a label or menu informs a consumer that a wine is organic (the manipulation used in this study), it is providing an extrinsic cue. Insofar as the means-end approach links product choice (the means) with product attributes and values (the ends), we expect certain product attributes and personal environmental values to determine consumer choice regarding organic wines. Thus, keeping in mind the ecological and health benefits of organic wines, ecocentrism—valuing nature for its own sake—and anthropocentrism—valuing nature because of the material or physical benefits it can provide for humans (Thompson & Burton, 1994)—are also expected to influence the preference for organic wines. Evaluative Conditioning We find further theoretical support for our study methodology in the concept of evaluative conditioning. Evaluative conditioning explains an important aspect of consumer behavior that can be used to supplement the means-end model for explaining consumer preferences. Under evaluative conditioning, a person’s evaluation of a certain stimulus may depend on, and will often change with, the pairing of that stimulus with at least one other evaluated stimulus (De Houwer, Thomas, & Baeyens, 2001). One of the earliest studies of how conditioning influences affective states was conducted by Razran (1938), who asked subjects, some of whom were eating a free lunch and some of whom were being subjected to unpleasant odors (unconditioned stimuli—stimuli that elicit a target response naturally), to evaluate paintings, music, literary quotations, political slogans, and photographs (conditioned stimuli—stimuli whose pairing with an unconditioned stimulus cause them to elicit the same target response), finding that the conditioned stimuli were rated more positively when paired with the free lunch and more negatively when paired with the unpleasant odors. Following this seminal study, scholars have written extensively on the processes by which valence (positive or negative attraction to an object) is transmitted between stimuli (Davey 1994; Levey & Martin, 1975; Martin & Levey, 1978, 1994). A typical study in this area involves pairing a neutrally valenced conditioned stimulus (CS) with a liked/disliked unconditioned stimulus (US) to measure how ratings of the neutral CS fluctuate in congruence with ratings of the US. According to Davey (1994), even conceptually neutral stimuli can have liked or disliked characteristics, and the act of pairing a CS with a congruent US will elucidate previously inconspicuous liked or disliked characteristics that may be shared by both the CS and the US. For example, “if a CS is paired with a liked US, then the liked features that are shared by the CS and US will become more salient in the CS, resulting in the participant liking the CS more” (De Houwer et al., 2001, p. 853). We posit that a similar process can be used to predict consumer evaluations of organic and non-organic wines. In our study, we conceptualized organic and non-organic wines as the stimuli on which evaluations would be conditioned. Furthermore, we incorporated the means-end approach to predict the moderating effect of environmental attitudes on consumer evaluations of wines. As Chan (1996) has pointed out, a person’s response to a stimulus depends on the attention and relevance that the individual attributes to the stimulus, and external information such as product packaging can help activate relevant decision-making mechanisms, such as ecocentric and anthropocentric attitudes. Therefore, we posit the following hypotheses:
Hypothesis 2: High ecocentric participants will assign significantly higher preference ratings than low ecocentric participants to organic wines accompanied by organic cues.
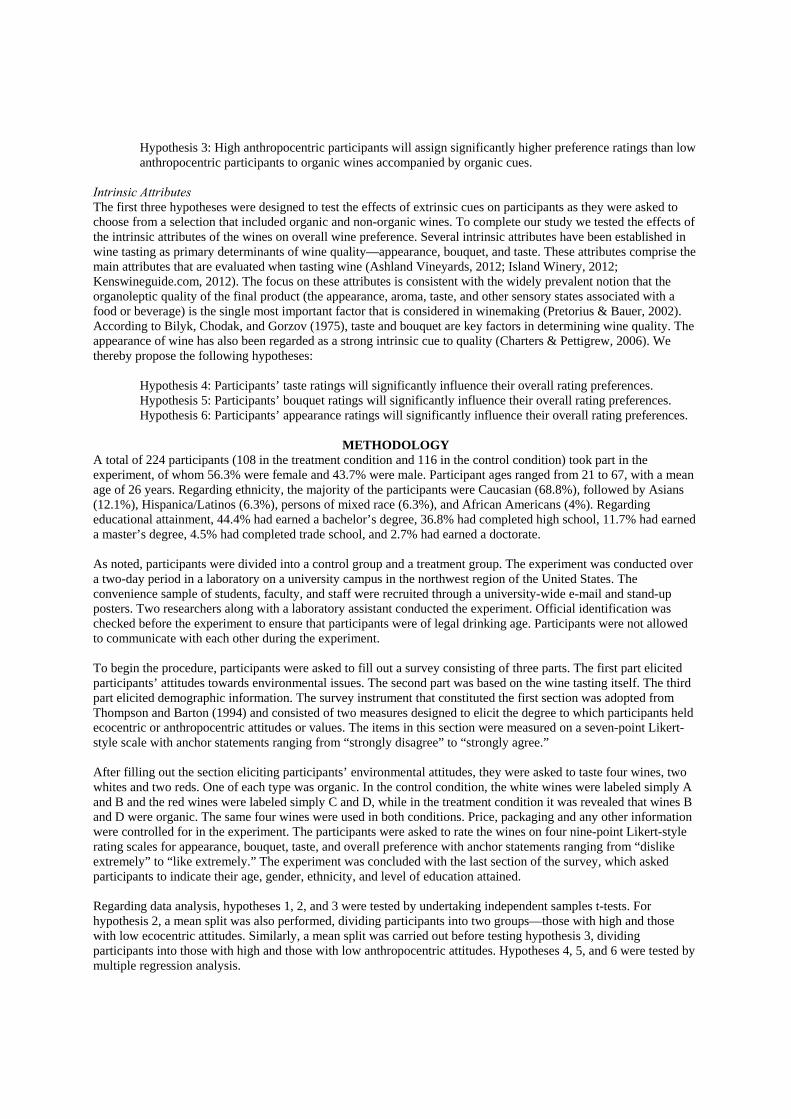
Hypothesis 3: High anthropocentric participants will assign significantly higher preference ratings than low anthropocentric participants to organic wines accompanied by organic cues.
Intrinsic Attributes The first three hypotheses were designed to test the effects of extrinsic cues on participants as they were asked to choose from a selection that included organic and non-organic wines. To complete our study we tested the effects of the intrinsic attributes of the wines on overall wine preference. Several intrinsic attributes have been established in wine tasting as primary determinants of wine quality—appearance, bouquet, and taste. These attributes comprise the main attributes that are evaluated when tasting wine (Ashland Vineyards, 2012; Island Winery, 2012; Kenswineguide.com, 2012). The focus on these attributes is consistent with the widely prevalent notion that the organoleptic quality of the final product (the appearance, aroma, taste, and other sensory states associated with a food or beverage) is the single most important factor that is considered in winemaking (Pretorius & Bauer, 2002). According to Bilyk, Chodak, and Gorzov (1975), taste and bouquet are key factors in determining wine quality. The appearance of wine has also been regarded as a strong intrinsic cue to quality (Charters & Pettigrew, 2006). We thereby propose the following hypotheses:
Hypothesis 4: Participants’ taste ratings will significantly influence their overall rating preferences. Hypothesis 5: Participants’ bouquet ratings will significantly influence their overall rating preferences. Hypothesis 6: Participants’ appearance ratings will significantly influence their overall rating preferences.
METHODOLOGY
A total of 224 participants (108 in the treatment condition and 116 in the control condition) took part in the experiment, of whom 56.3% were female and 43.7% were male. Participant ages ranged from 21 to 67, with a mean age of 26 years. Regarding ethnicity, the majority of the participants were Caucasian (68.8%), followed by Asians (12.1%), Hispanica/Latinos (6.3%), persons of mixed race (6.3%), and African Americans (4%). Regarding educational attainment, 44.4% had earned a bachelor’s degree, 36.8% had completed high school, 11.7% had earned a master’s degree, 4.5% had completed trade school, and 2.7% had earned a doctorate. As noted, participants were divided into a control group and a treatment group. The experiment was conducted over a two-day period in a laboratory on a university campus in the northwest region of the United States. The convenience sample of students, faculty, and staff were recruited through a university-wide e-mail and stand-up posters. Two researchers along with a laboratory assistant conducted the experiment. Official identification was checked before the experiment to ensure that participants were of legal drinking age. Participants were not allowed to communicate with each other during the experiment. To begin the procedure, participants were asked to fill out a survey consisting of three parts. The first part elicited participants’ attitudes towards environmental issues. The second part was based on the wine tasting itself. The third part elicited demographic information. The survey instrument that constituted the first section was adopted from Thompson and Barton (1994) and consisted of two measures designed to elicit the degree to which participants held ecocentric or anthropocentric attitudes or values. The items in this section were measured on a seven-point Likert-style scale with anchor statements ranging from “strongly disagree” to “strongly agree.” After filling out the section eliciting participants’ environmental attitudes, they were asked to taste four wines, two whites and two reds. One of each type was organic. In the control condition, the white wines were labeled simply A and B and the red wines were labeled simply C and D, while in the treatment condition it was revealed that wines B and D were organic. The same four wines were used in both conditions. Price, packaging and any other information were controlled for in the experiment. The participants were asked to rate the wines on four nine-point Likert-style rating scales for appearance, bouquet, taste, and overall preference with anchor statements ranging from “dislike extremely” to “like extremely.” The experiment was concluded with the last section of the survey, which asked participants to indicate their age, gender, ethnicity, and level of education attained. Regarding data analysis, hypotheses 1, 2, and 3 were tested by undertaking independent samples t-tests. For hypothesis 2, a mean split was also performed, dividing participants into two groups—those with high and those with low ecocentric attitudes. Similarly, a mean split was carried out before testing hypothesis 3, dividing participants into those with high and those with low anthropocentric attitudes. Hypotheses 4, 5, and 6 were tested by multiple regression analysis.
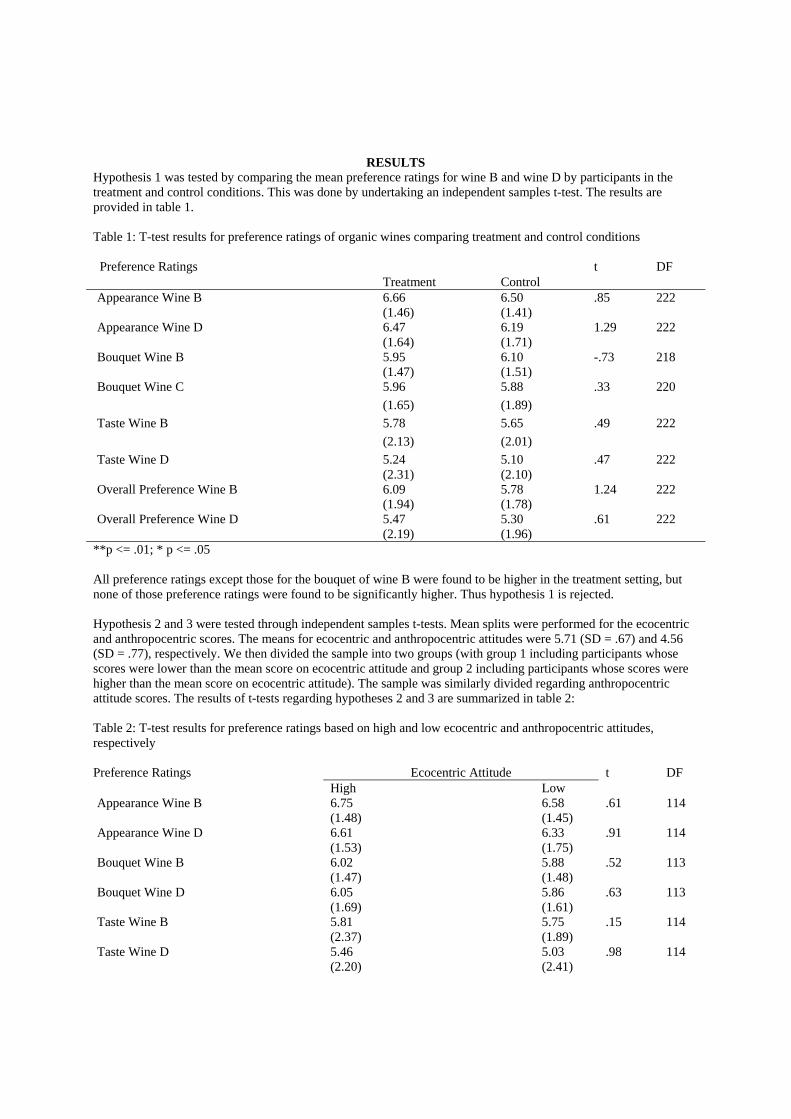
RESULTS
Hypothesis 1 was tested by comparing the mean preference ratings for wine B and wine D by participants in the treatment and control conditions. This was done by undertaking an independent samples t-test. The results are provided in table 1. Table 1: T-test results for preference ratings of organic wines comparing treatment and control conditions Preference Ratings t DF
Treatment Control Appearance Wine B 6.66 6.50 .85 222
(1.46) (1.41) Appearance Wine D 6.47 6.19 1.29 222
(1.64) (1.71) Bouquet Wine B 5.95 6.10 -.73 218
(1.47) (1.51) Bouquet Wine C 5.96 5.88 .33 220
(1.65) (1.89)
Taste Wine B 5.78 5.65 .49 222
(2.13) (2.01)
Taste Wine D 5.24 5.10 .47 222 (2.31) (2.10)
Overall Preference Wine B 6.09 5.78 1.24 222 (1.94) (1.78)
Overall Preference Wine D 5.47 5.30 .61 222 (2.19) (1.96)
**p <= .01; * p <= .05 All preference ratings except those for the bouquet of wine B were found to be higher in the treatment setting, but none of those preference ratings were found to be significantly higher. Thus hypothesis 1 is rejected. Hypothesis 2 and 3 were tested through independent samples t-tests. Mean splits were performed for the ecocentric and anthropocentric scores. The means for ecocentric and anthropocentric attitudes were 5.71 (SD = .67) and 4.56 (SD = .77), respectively. We then divided the sample into two groups (with group 1 including participants whose scores were lower than the mean score on ecocentric attitude and group 2 including participants whose scores were higher than the mean score on ecocentric attitude). The sample was similarly divided regarding anthropocentric attitude scores. The results of t-tests regarding hypotheses 2 and 3 are summarized in table 2:
Table 2: T-test results for preference ratings based on high and low ecocentric and anthropocentric attitudes, respectively Preference Ratings Ecocentric Attitude t DF
High Low Appearance Wine B 6.75 6.58 .61 114
(1.48) (1.45) Appearance Wine D 6.61 6.33 .91 114
(1.53) (1.75) Bouquet Wine B 6.02 5.88 .52 113
(1.47) (1.48) Bouquet Wine D 6.05 5.86 .63 113
(1.69) (1.61) Taste Wine B 5.81 5.75 .15 114
(2.37) (1.89) Taste Wine D 5.46 5.03 .98 114
(2.20) (2.41)
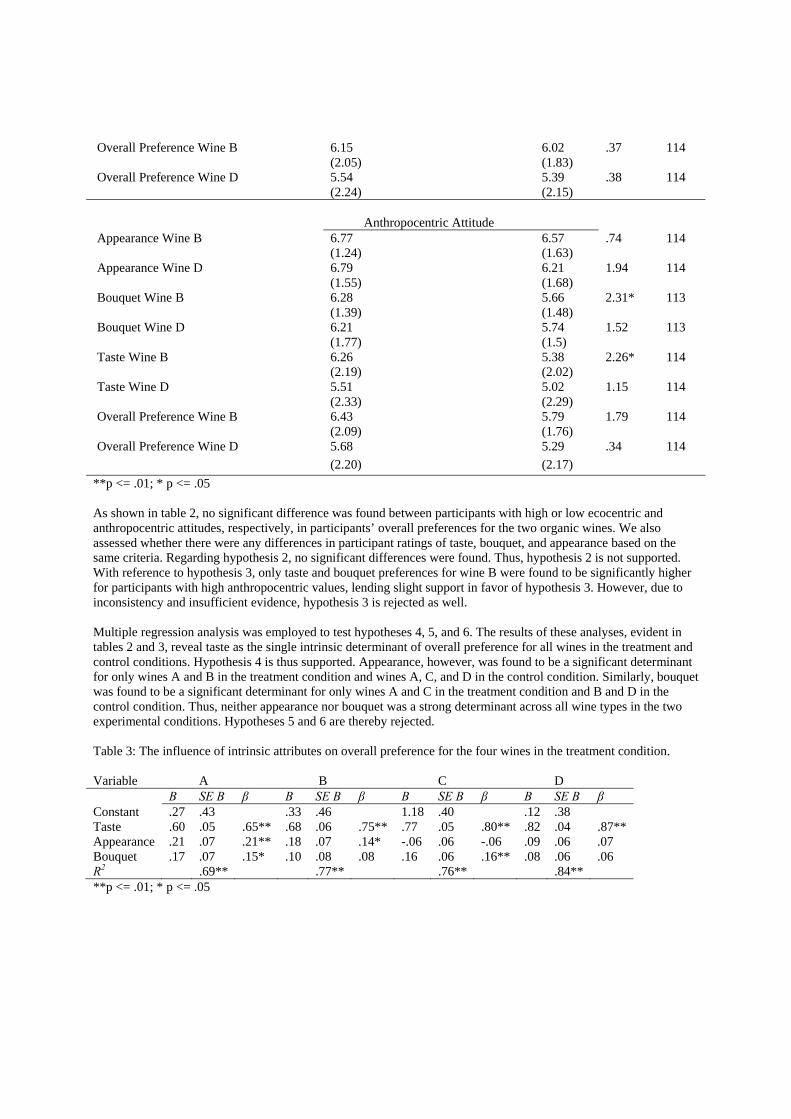
Overall Preference Wine B 6.15 6.02 .37 114 (2.05) (1.83)
Overall Preference Wine D 5.54 5.39 .38 114 (2.24) (2.15)
Anthropocentric Attitude
Appearance Wine B 6.77 6.57 .74 114 (1.24) (1.63)
Appearance Wine D 6.79 6.21 1.94 114 (1.55) (1.68)
Bouquet Wine B 6.28 5.66 2.31* 113 (1.39) (1.48)
Bouquet Wine D 6.21 5.74 1.52 113 (1.77) (1.5)
Taste Wine B 6.26 5.38 2.26* 114 (2.19) (2.02)
Taste Wine D 5.51 5.02 1.15 114 (2.33) (2.29)
Overall Preference Wine B 6.43 5.79 1.79 114 (2.09) (1.76)
Overall Preference Wine D 5.68 5.29 .34 114
(2.20) (2.17)
**p <= .01; * p <= .05 As shown in table 2, no significant difference was found between participants with high or low ecocentric and anthropocentric attitudes, respectively, in participants’ overall preferences for the two organic wines. We also assessed whether there were any differences in participant ratings of taste, bouquet, and appearance based on the same criteria. Regarding hypothesis 2, no significant differences were found. Thus, hypothesis 2 is not supported. With reference to hypothesis 3, only taste and bouquet preferences for wine B were found to be significantly higher for participants with high anthropocentric values, lending slight support in favor of hypothesis 3. However, due to inconsistency and insufficient evidence, hypothesis 3 is rejected as well. Multiple regression analysis was employed to test hypotheses 4, 5, and 6. The results of these analyses, evident in tables 2 and 3, reveal taste as the single intrinsic determinant of overall preference for all wines in the treatment and control conditions. Hypothesis 4 is thus supported. Appearance, however, was found to be a significant determinant for only wines A and B in the treatment condition and wines A, C, and D in the control condition. Similarly, bouquet was found to be a significant determinant for only wines A and C in the treatment condition and B and D in the control condition. Thus, neither appearance nor bouquet was a strong determinant across all wine types in the two experimental conditions. Hypotheses 5 and 6 are thereby rejected. Table 3: The influence of intrinsic attributes on overall preference for the four wines in the treatment condition. Variable A B C D B SE B β B SE B β B SE B β B SE B β Constant .27 .43 .33 .46 1.18 .40 .12 .38 Taste .60 .05 .65** .68 .06 .75** .77 .05 .80** .82 .04 .87** Appearance .21 .07 .21** .18 .07 .14* -.06 .06 -.06 .09 .06 .07 Bouquet .17 .07 .15* .10 .08 .08 .16 .06 .16** .08 .06 .06 R2 .69** .77** .76** .84** **p <= .01; * p <= .05
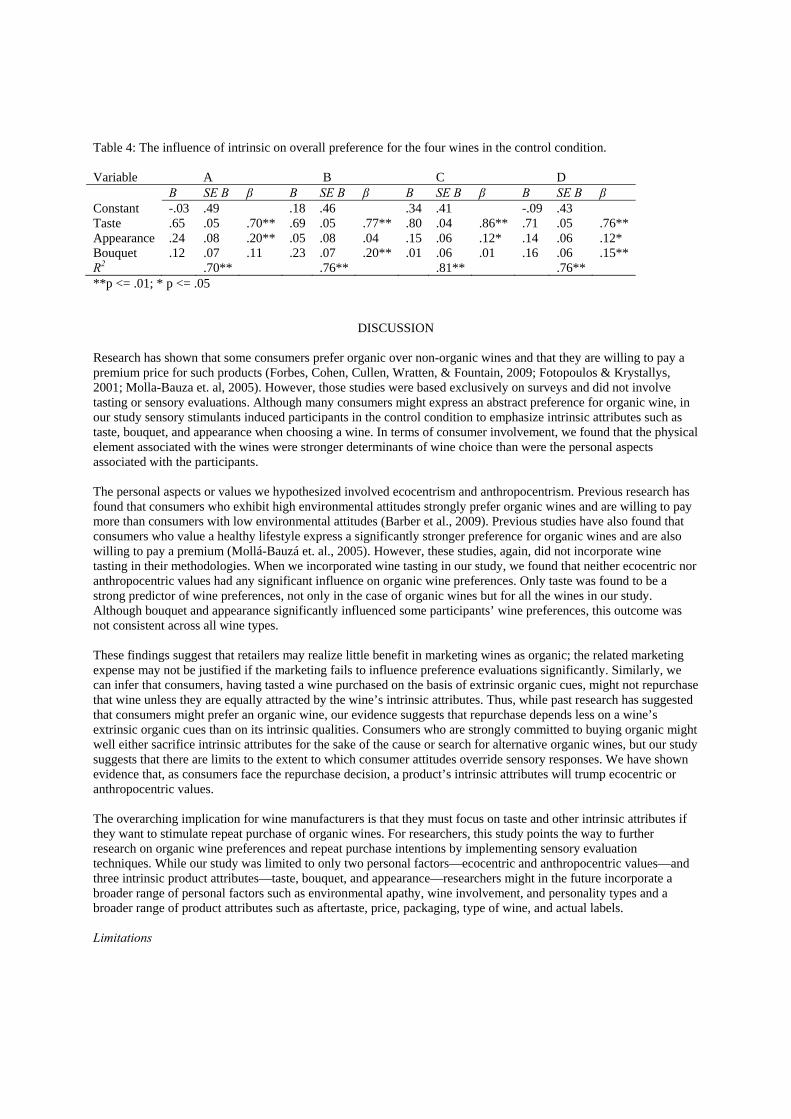
Table 4: The influence of intrinsic on overall preference for the four wines in the control condition. Variable A B C D B SE B β B SE B β B SE B β B SE B β Constant -.03 .49 .18 .46 .34 .41 -.09 .43 Taste .65 .05 .70** .69 .05 .77** .80 .04 .86** .71 .05 .76** Appearance .24 .08 .20** .05 .08 .04 .15 .06 .12* .14 .06 .12* Bouquet .12 .07 .11 .23 .07 .20** .01 .06 .01 .16 .06 .15** R2 .70** .76** .81** .76** **p <= .01; * p <= .05
DISCUSSION
Research has shown that some consumers prefer organic over non-organic wines and that they are willing to pay a premium price for such products (Forbes, Cohen, Cullen, Wratten, & Fountain, 2009; Fotopoulos & Krystallys, 2001; Molla-Bauza et. al, 2005). However, those studies were based exclusively on surveys and did not involve tasting or sensory evaluations. Although many consumers might express an abstract preference for organic wine, in our study sensory stimulants induced participants in the control condition to emphasize intrinsic attributes such as taste, bouquet, and appearance when choosing a wine. In terms of consumer involvement, we found that the physical element associated with the wines were stronger determinants of wine choice than were the personal aspects associated with the participants. The personal aspects or values we hypothesized involved ecocentrism and anthropocentrism. Previous research has found that consumers who exhibit high environmental attitudes strongly prefer organic wines and are willing to pay more than consumers with low environmental attitudes (Barber et al., 2009). Previous studies have also found that consumers who value a healthy lifestyle express a significantly stronger preference for organic wines and are also willing to pay a premium (Mollá-Bauzá et. al., 2005). However, these studies, again, did not incorporate wine tasting in their methodologies. When we incorporated wine tasting in our study, we found that neither ecocentric nor anthropocentric values had any significant influence on organic wine preferences. Only taste was found to be a strong predictor of wine preferences, not only in the case of organic wines but for all the wines in our study. Although bouquet and appearance significantly influenced some participants’ wine preferences, this outcome was not consistent across all wine types. These findings suggest that retailers may realize little benefit in marketing wines as organic; the related marketing expense may not be justified if the marketing fails to influence preference evaluations significantly. Similarly, we can infer that consumers, having tasted a wine purchased on the basis of extrinsic organic cues, might not repurchase that wine unless they are equally attracted by the wine’s intrinsic attributes. Thus, while past research has suggested that consumers might prefer an organic wine, our evidence suggests that repurchase depends less on a wine’s extrinsic organic cues than on its intrinsic qualities. Consumers who are strongly committed to buying organic might well either sacrifice intrinsic attributes for the sake of the cause or search for alternative organic wines, but our study suggests that there are limits to the extent to which consumer attitudes override sensory responses. We have shown evidence that, as consumers face the repurchase decision, a product’s intrinsic attributes will trump ecocentric or anthropocentric values. The overarching implication for wine manufacturers is that they must focus on taste and other intrinsic attributes if they want to stimulate repeat purchase of organic wines. For researchers, this study points the way to further research on organic wine preferences and repeat purchase intentions by implementing sensory evaluation techniques. While our study was limited to only two personal factors—ecocentric and anthropocentric values—and three intrinsic product attributes—taste, bouquet, and appearance—researchers might in the future incorporate a broader range of personal factors such as environmental apathy, wine involvement, and personality types and a broader range of product attributes such as aftertaste, price, packaging, type of wine, and actual labels.
Limitations
While our convenience sample included undergraduate students, graduate students, faculty, and staff members in a university setting, the majority of participants were undergraduate students, as a result of which the mean age turned out to be only 26. The results might have differed with older participants. Similarly, our participant group was not very diverse in terms of socioeconomic background. However, student samples in experimental settings are widely used in consumer attitudinal and behavioral studies and in that respect our methodology was not without precedent. In addition, the survey questions, especially those involving ecocentric and anthropocentric measures, could have resulted in social desirability bias even though anonymity and confidentiality were assured. And, as stated earlier, the modest sample size may have further limited the generalizability of our results.
CONCLUSION
As contemporary consumption habits change, reflecting a greater concern for health and the environment, it has become increasingly important to study organic products and the underlying consumer behavior in regards to purchasing and repurchasing such products. The main purpose of this study was to test the effects of ecocentric and anthropocentric values or attitudes on consumer preference for organic wines. Although some encouraging patterns emerged, there was not much support for most of our stated hypotheses. Our use of wine tasting and sensory evaluations enabled us to draw several potentially important implications for consumer preference for and repeat purchase of organic wines. Our study suggests that winemakers committed to organic methods would do well to focus on taste and other intrinsic attributes of their wines if they want to stimulate repeat purchase decisions. Our methodology, which added sensory evaluation techniques to a survey instrument, contributes to the wine and hospitality literature a potentially fruitful direction for further research on organic wine preferences and repeat purchase intentions.
REFERENCES Allen, P., & Kovach, M. (2000). The capitalist composition of organic: The potential of
markets in fulfilling the promise of organic agriculture. Agriculture and Human Values, 17 (3), 221–232.
Antil, J. (1984). Socially responsible consumers: profile and implications for public policy.
Journal of Macromarketing, 4(Fall), 18-32.
Ashland Vineyards. (2012). Wine Q and A. Retrieved June 06, 2012 from http://www.winenet.com/wine_qa.html Balderjahn, I. (1988). Personality variables and environmental attitudes as predictors of
ecologically responsible consumption patterns. Journal of Business Research, 17(1), 51- 56.
Barber, N. (2010). “Green” wine packaging: targeting environmental consumers. International
Journal of Wine Business Research, 22(4), 423–444. Barber, N., Taylor, D. C., & Deale, C. S. (2010). Wine tourism, environmental concerns, and
purchase intention. Journal of Travel and Tourism Marketing, 27, 146-165. Barber, N., Taylor, C., & Strick, S. (2009). Wine consumers environmental knowledge and
attitudes: Influence on willingness to purchase. International Journal of Wine Research, 1(1), 59–72.
Barber, N., Taylor, D. C., & Strick, S. (2010). Selective marketing to environmentally concerned wine consumers: a
case for location, gender and age. Journal of Consumer Marketing, 27(1), 64–75. Biao, X., Xiaorong, W., Zhuhong, D., & Yaping, Y. (2003). Critical impact assessment of organic agriculture.
Journal of Agricultural and Environmental Ethics, 16 (3), 297–311.
Bilyk, P. P.; Chodak, V. A., & Gorzov, M. D. (1975). Chemical composition and quality of some natural grape wines. Vinohrad, 13 (4) 89-90
Boudreaux, C. A., & Palmer, S. E. (2007). A charming little cabernet: effects of wine label design on purchase intent and brand personality. International Journal of Wine Business Research, 19, 170-186.
Bruwer, J., Saliba, A., & Miller, B. (2011). Consumer behavior and sensory preference
differences: implications for wine product marketing. Journal of Consumer Marketing, 28(1), 5–18.
Canavari, M., Nocella, G., & Scarpa, R. (2005). Stated willingness-to-pay for organic fruit and pesticide ban. Journal of Food Products Marketing, 11(3), 107-134.
Catton, W. R. Jr., Dunlap, R. E. (1978). Environmental sociology: a new paradigm. American
Sociologist, 13, 41-49. Celhay, F., & Passebois, J. (2011). Wine labelling: Is it time to break with tradition? A study of
the moderating role of perceived risk. International Journal of Wine Business Research, 23 (4), 318-337.
Chan, T.S. (1996). Concerns for Environmental Issues and Consumer Purchase Preferences: A Two-Country Study. Journal of International Consumer Marketing, 9(1), 43-55.
Charters, S. & Pettigrew, S. (2006). Product Involvement and the Evaluation of Wine Quality. Qualitative Market
Research 9(2): 181–93. Chryssohoidis, G. M., & Krystallis, A. (2005). Organic consumers’ personal values research:
testing and validating the list of values (LOV) scale and implementing a value-based segmentation task. Food Quality and Preference, 16(7), 585–599.
Crane, F., & T. Clarke. (1988). The identification of evaluative criteria and cues used in selecting services. Journal of Services Marketing 2 (2): 53-59.
Davey, G. C. L. (1994a). Defining the important theoretical questions to ask about evaluative conditioning: A reply
to Martin and Levey (1994). Behaviour Research and Therapy, 32, 307–310. Davies, A., Titterington, A.J., & Cochrane, C. (1995). Who buys organic food? a profile of the
purchasers of organic in Northern Ireland. British Food Journal, 97(10), 17–23.
De Houwer, J., Thomas, S., & Baeyens, F. (2001). Association learning of likes and dislikes: A review of 25 years of research on human evaluative conditioning. Psychological Bulletin, 127 (6), 853.
Demeritt, L. (2002). All things organic 2002: a look at the organic consumer. The Hartman
Group, Bellevue, WA.
Dimara, E. & Skuras, D. (2005). Consumer demand for informative labeling of quality food and drink products: a European Union case study. The Journal of Consumer Marketing, 22(2/3), 90-100.
Doorn. V.J., & Verhoef, P. C. (2011). Willingness to pay for organic products: Differences
between virtue and vice foods. International Journal of Research in Marketing, 28, 3, 167-180
Dunlap, R.E. & Catton, W. R. Jr. (1979). Environmental sociology. Annual Review of Sociology, 5, 243-273.
Forbes, S., Cohen, D. A., Cullen, R., Wratten, S. D., & Fountain, J. (2009). Consumer attitudes regarding
environmentally sustainable wine: An exploratory study of the new Zealand marketplace. Journal of Cleaner Production, 17(13), 1195-1199.
Fotopoulos, C. & Krystallis, A. (2001). Defining the organic consumer and his willingness to pay for selected food products in Greece: a countrywide survey. Proc. 51st Atlantic Economic Society Conference, Athens, March 13-20. pp. 1-34.
Fotopoulos, C., Krystallis, A., & Ness, M. (2003). Wine produced by organic grapes in Greece:
using means–end chains analysis to reveal organic buyers’ purchasing motives in comparison to the non-buyers. Food Quality and Preference, 14(7), 549–566.
Grankvist, G., Dahlstrand, U., & Biel, A. (2004). The impact of environmental labelling on
consumer preference: Negative vs. positive labels. Journal of Consumer Policy, 27 (2), 213-230.
Grunert, S.C. (1993). Green consumerism in Denmark: Some evidence from the OKO foods-project. Der Markt 32(3), 140-151.
Grunert, S.C. & Juhl, H.J. (1995). Values, environmental attitudes and buying of organic foods.
Journal of Economic Psychology, 16(1), 63–72. Gutman, J. (1982). A means-end chain model based on consumer categorization processes. The
Journal of Marketing, 46(Spring), 60–72. Haanpää, Leena. (2007). Consumers’ green commitment: indication of a postmodern lifestyle?
International Journal of Consumer Studies, 31 (5), 478-486. Hay, J. (1989). The consumer’s perspective on organic food. Canadian Institute of Food Science
Technology Journal, 22(2), 95–99.
Island Winery. (2012). The basics of wine tasting. Hiltonhead.com. Retrieved June 06, 2012 from http://www.hiltonhead.com/the-basics-of-wine-tasting/
Jarvis, W., Mueller, S., & Chiong, K. (2010). A latent analysis of images and words in wine choice. Australasian Marketing Journal, 18(3), 138-144. Judica, F., & Perkins, W. (1992). A means-end approach to the market for sparkling wines.
International Journal of Wine Business Research, 4(1), 10-19. Kalogeras, N., Valchovska, S., Baourakis, G., & Kalaitzis, P. (2009). Dutch consumers' willingness to pay for
organic olive oil. Journal of International Food and Agribusiness Marketing, 21(4), 286-311.
Kenswineguide.com. (2012). Wine tasting tips. Retrieved June 06, 2012 from http://www.kenswineguide.com/wine.php?page=18
Levey, A. B., & Martin, I. (1975). Classical conditioning of human ‘evaluative’ responses.
Behaviour Research and Therapy, 13 (4), 221–226. Lodorfos, G. N., & Dennis, J. (2008). Consumers’ intent: in the organic food market. Journal of Food Products
Marketing, 14(2), 17–38. Lotter, Donald. W. (2003). Organic Agriculture. Journal of Sustainable Agriculture, 21 (4), 59
128.
Magnusson M.K., Arvola, A., Hursti, U.K., Aberg, L., Sjoden, P.O. (2003). Choice of organic foods is related to perceived consequences for human health and to environmentally friendly behaviour. Appetite 2, 109-117.
Mainieri, T., Barnett, E.G., Valdero, T., Unipan, J.B., & Oskamp, S. (1997). Green buying: the
influence of environmental concern on consumer behavior. The Journal of Social
Psychology, 137(2), 189-204. Makatouni, A. (2002). What motivates consumers to buy organic food in the UK?: results from a qualitative study.
British Food Journal, 104, 345-352. Martin, I., & Levey, A. B. (1978). Evaluative conditioning. Advances in Behaviour Research and Therapy, 1 (2),
57-102. Martin, I., & Levey, A. B. (1994). The evaluative response: Primitive but necessary. Behaviour Research and
Therapy, 32 (3), 301-305. Molla-Bauza, M. B., Martinez, L. M., Poveda, A. M., & Perez, M. R. (2005). Determination of the surplus that
consumers are willing to pay for an organic wine. Spanish Journal of Agricultural Research, 3(1), 43-51. Mora, P., & Moscarola, J. (2010). Representations of the emotions associated with a wine
purchasing or consumption experience. International Journal of Consumer Studies, 34, 674-683.
Mueller, S. & Szolnoki, G. (2010). The relative influence of packaging, labeling, branding and
sensory attributes on liking and purchase intent: consumers differ in their responsiveness. Food Quality and Preference, 21, 774–783.
Olsen, J.C. (1977). Price as an informational cue: effects on product evaluations, in Woodside, A.G., Sheth, J.N. & Bennett, P.D. (Eds). Consumer and Industrial Buying Behavior, pp. 267-86.
Olson, J.C. & Jacob, J. (1972). Cue utilization in the quality perception process, in Proceedings of the Third Annual
Conference of the Association for Consumer Research, pp. 167-79. Padel, S., & Foster, C. (2005). Exploring the gap between attitudes and behavior: understanding why consumers buy
or do not buy organic food. British Food Journal, 107, 606-625.
Pretorius, I.S. & Bauer, F.F. (2002). Meeting the consumer challenge through genetically customized wine-yeast strains. Trends Biotech. 20, 426– 432.
Priilaid, D. A. (2006). Wine’s placebo effect: How the extrinsic cues of visual assessments mask
the intrinsic quality of South African red wine. International Journal of Wine Marketing, 18 (1), 17–32.
Quah, S.-H., & Tan, A. K. G. (2009). Consumer purchase decisions of organic food products: an ethnic analysis.
Journal of International Consumer Marketing, 22, 47-58.
Razran, G. H. S. (1938) Conditioning away social bias by the luncheon technique. Psychological Bulletin. 35 (November), 693.
Reed, M. (2001). Fight the future! How the contemporary campaigns of the UK organic
movement have arisen from their composting past. Sociologica Ruralis, 41(1), 131-45. Richardson, P. S., Dick, A. S., & Jain, A. K. (1994). Extrinsic and intrinsic cue effects on
perceptions of store brand quality. The Journal of Marketing, 58(October), 28–36.
Saba, A. & Messina, F. (2003). Attitudes towards organic foods and risk/benefit perception associated with pesticides. Food Quality Preference, 14(8), 637-645.
Schifferstein, H. N. J., & Oude-Ophuis, P. A. M. (1998). Health-related determinants of organic food consumption
in The Netherlands. Food Quality and Preference, 9(3) 119-133.
Seyfang, G. (2007). Growing sustainable consumption communities: The case of local organic food networks. International Journal of Sociology and Social Policy, 27, 120-134.
Skuras, D. & Vakrou, A. (2002). Consumers’ willingness to pay for origin labeled wine: a Greek case study. British
Food Journal, 104(11), 898-912.
Smith, E. & Marsden, T.K. (2004). Exploring the limits to growth in UK organics: beyond the statistical image. Journal of Rural Studies, 20, 345–357.
Soil Association. (2000). Organic Food and Farming Report. Social Association, Bristol. Solomon, M. R. (1983). The role of products as social stimuli: A symbolic interactionism
perspective. Journal of Consumer Research, 10 (3), 319–329. Tallontire, A., Rentsendorj, E.,& Blowfield, M. (2001). Ethical consumers and ethical trade: a
review of current literature. Policy Series 12. Chatham, UK: Natural Resources Institute.
Thompson, S.C.G. & Burton, M.A. (1994). Ecocentric and anthropocentric attitude toward the environment. Journal of Environmental Psychology, 14, 149-157.
Thøgersen, J. (2010). Country differences in sustainable consumption: the case of organic food.
Journal of Macromarketing, 30 (2), 171-185.
Tregear, A., Dent, J.B. & McGregor, M.J. (1994). The demand for organically-grown produce. British Food Journal, 96(4), 21-5.
Tustin, M. & Lockshin, L. (2001). Region of origin: does it really count? Australian and New
Zealand Wine Industry Journal, 16 (5), 139-143. United States Department of Agriculture (2012). Wecome to the National Organic Program. Washington, DC:
Author. Retrieved from http://www.ams.usda.gov/AMSv1.0/nop.
Van Dam, Y.K. (1991). A conceptual model of environmentally conscious consumer behaviour. In: Proceedings of the European Marketing Academy's conference - Marketing Thought around the World, Vol. 2 (pp. 463-483). Dublin: Michael Smurfit Graduate School of Business.
Vermeir, I., & Verbeke, W. (2006). Sustainable food consumption: exploring the consumer
“attitude – behavioral intention” gap. Journal of Agricultural and Environmental Ethics, 19, 169-194.
Yiridoe, E.K., Bonti-Ankomah, S. & Martin, R.C. (2005). Comparison of consumer perceptions and preference
toward organic versus conventionally produced foods: A review and update of the literature. Renewable Agriculture and Food Systems, 20(4), 193–205.
Williams, P.R.D. & Hammit J.K. (2001). Perceived risks of conventional and organic produce: pesticides, pathogens, and natural toxins. Risk Analysis, 21(2), 319-330.
Willer, H. & Kilcher, L. (2011). The World of Organic Agriculture - Statistics and
Emerging Trends 2011. FiBL-IFOAM Report. IFOAM, Bonn, and FiBL, Frick. Zaichkowsky, J.L. (1985). Measuring the involvement construct. Journal of Consumer Research,
12, 341–352. Zanoli, R., & Naspetti, S. (2002). Consumer motivations in the purchase of organic food: a
means-end approach. British Food Journal, 104(8), 643–653.
RESTAURANT ENTREPRENEURS’ CHARACTERISTICS AND STRATEGIC ACTIONS AND CONSIDERATIONS
Submitted for consideration as a Refereed Presentation at Eurochrie 2012
BY
Christine Demen-Meier Ph.D.* Professor of Marketing and Management of SMEs
Holder of the Food & Beverage Industry Chair École hôtelière de Lausanne
Le Chalet-à-Gobet Case postale 37
1000 Lausanne 25 Switzerland
François Pageau M.Sc. Professor in hospitality management
Institut de tourisme et d’hôtellerie du Québec 3535 St-Denis, Montréal, Québec, H2X3P1
Abstract: The relations between entrepreneur profile and management style having already been demonstrated, this research on the Quebec restaurant market focuses on the correlation between the characteristics of an entrepreneur’s profile and their strategic actions or considerations. Three congruent strategies were considered and measured in terms of actions and considerations: Blue Ocean, mass customization and partnerships. A survey was distributed to independent restaurateurs trough the Association des restaurateurs du Québec (378 respondents). Results show that characteristics such as “academic background” “action logic” “intention logic” “relational skills” and “personal aptitudes” are probably more important than a determinist approach to strategy choice. A model of prediction could allow entrepreneurs to understand their strategic choices and their favorable posture for a congruent strategy.
Key words: Entrepreneur, Restaurants, Strategies, SMEs,
1
EXPLORING SERVICE SABOTAGE BEHAVIORS IN THE FOOD AND BEVERAGE INDUSTRY
Lou-Hon Sun
National Kaohsiung University of Hospitality and Tourism
Kaohsiung, Taiwan, R.O.C.
E-mail: [email protected]
ABSTRACT This research attempted to classify service sabotage behaviors by food-service employees. Focus group
interviews were conducted for collecting data. A total of fifty-six first line food service employees
were interviewed. Refusal, disregard, disturbance, foolery, mistreatment, and processes simplification
were named as six categories of service sabotage behaviors.
Keywords: Service Sabotage; Misbehavior; Food-Service
ETHNIC MINORITY PERCEPTIONS OF SELF-SERVICE TECHNOLOGY IN LIMITED SERVICE RESTAURANTS
Clark S. Kincaid*
University of Nevada, Las Vegas 4505 Maryland Parkway
Las Vegas, Nevada 89154-6021 [email protected]
Seyhmus Baloglu
University of Nevada, Las Vegas 4505 Maryland Parkway
Las Vegas, Nevada 89154-6021 [email protected]
Key words: ethnic, discrimination, SST, foodservice, technology, self-service ABSTRACT
The introduction of self-service technology (SST) into the service sector, specifically the restaurant industry, has significant impact upon customers, employees, and management. Exploratory factor analysis was used to identify perceptual/cognitive dimensions of SST. A large international limited service restaurant (LSR) chain was selected for this study. Analysis revealed three dimensions which explained 71% of the variance; usefulness, confidence/risk, and ease of use. Exploratory factor analysis was used to identify perceptual/cognitive dimensions of SST. Analysis revealed three dimensions which explained 71% of the variance; Benefits, Risk, and Ease of Use. The MANOVA findings suggested Ease of Use and Risk perceptions did not vary by Ethnicity. However, Benefits and Attitude dimensions were significantly different at 0.001 probability level. Hispanics and Asians had more positive benefits and attitude than Caucasians. In addition, Hispanics and Asian are found to more likely use SST in LSR’s and recommend using the self-service ordering system to others.
The widening introduction of self-service technology (SST) in what was formerly considered to be the domain of “high-touch and low-tech” service encounters is creating, in many circumstances, a “low-touch and high-tech” service alternative. Customers now have the option of the type of service experience they prefer (i.e. self-service or personal service). Instances where customers have a choice between self-service and personal service may occur at a movie theater when deciding to purchase a ticket from a self-service kiosk or from another person at the ticket window; choosing to scan purchases at a retail outlet or interact with a cashier.
Findings from a study conducted on customer satisfaction with self-service technologies (SST)
(Meuter, Ostrom, Roundtree & Bitner, 2000) were consistent with general perceptions of declining customer service. In response to these challenges, foodservice operators are leveraging technology to improve customer service and operational efficiencies (Kontoghiorghes, 2005). Evidence of this trend is the introduction of SST in the limited service restaurant (LSR) segment. An LSR is defined as one in which the meal is commonly ordered at a counter and paid for before the meal is consumed. Involving the customer as a participant in the production of the guest experience is not a new concept (Ford & Heaton, 2001; Halbesleben & Buckley, 2004; Johnson & Jones, 2004; Lovelock, & Young, 1979; Schier, 2004; Slywotzky & Morrison, 2001). Customer inclusion in the service process within the foodservice industry has taken different forms such as assisting in producing the product (salad bars and self-service beverage stations), marketing (sharing stories of positive experiences), and supplying the organization with beneficial information (purchase records) (Bettencourt, 1997). Customer participation in the service experience can be substantial. Customers replace labor that the organization would otherwise have to pay to perform the same task. Additionally, customers often improve the quality of their experience (Ford & Heaton, 2001).
New technologies have been successfully introduced to assist front-line employees interacting with customers in the delivery of services (Fisher, 1998). The challenge for practitioners has been to get customers to use the new technologies. Customers must recognize the benefits they gain from participating in the self-service process. Utilization of the customer acting as an employee creates internal efficiencies for the organization such as reduction of labor costs, increase in sales, and standardization of service delivery.
In discussing the inclusion of customers in the service production process Ford, Heaton, & Brown
(2001) identify a number of organizational benefits. First, anything customers do for themselves, the organization does not have to do for them. Second, the more the customer participates in the service experience, the greater the likelihood the experience will meet the customers own expectations. Third, organizations may gain loyalty from participating customers who regard themselves as part of the organization’s “family”.
Researchers have recognized the importance of blending technology with the personal aspects of service delivery (Berry, 1999). What is not clear to researchers is what influence the introduction of technology-based interactions will have on satisfaction, perception of service quality, and intentions for the consumer to remain as a customer of the organization.
Preference for self-service transactions has been attributed to the intrinsic motivations received by doing things for one’s self (Bateson, 1983). Previous research indicates many desirable characteristics of SST use for customers. The perception that service encounters are less time consuming when utilizing SST meets the customer desire for a faster service transaction (Meuter, Ostrom, Bitner & Roundtree; 2000 ). Previous research by Kincaid and Baloglu (2006) found that ten percent of customers do not want to interact with service providers. Additionally, convenience, control, privacy, reliability and fun have been found to contribute to customer desire to utilize SST (Dabholkar, 1996; Dabholkar, Bobbitt and Lee, 2003; Kincaid & Baloglu, 2006).
Understanding the precursors to technology acceptance will lead towards increasing the chances for customers to embrace technology based service delivery. In this paper a process model will be developed to organize significant variables contributing to customer responses to technology introduction into the service experience in LSRs. The contributions of this study are both theoretical and practical. First, a new model of customer attitudes toward adoption of SST will be developed, extending existing theories of attitude-behavior relationships. Secondly, operators will benefit from understanding what factors affect customer attitudes and consequently influence customer behavior. The adoption of SST to enable customer service has the potential for both a positive or negative impact on customers, their attitudes, perceptions and behavior, and therefore, the potential for a service provider to
create a favorable or unfavorable impression. Consequently, it is important for service providers to determine how SST should be introduced to provide maximum acceptance and satisfaction so as to be mutually beneficial for customers and practitioners alike (Walker, Craig-Lees, Hecker and Francis, 2002). It has been suggested that a customer’s choice to use, or reject, SST is shaped by their individual willingness and capacity. Willingness is derived from a collection of factors including, for example, the perceived complexity and relative advantage created from utilizing SST (Daniel and Storey, 1997; Loh and Ong, 1998), and the perceived costs and risks associated with using the SST (Zeithaml, 1981). These, and possibly other, considerations are grounded in both customer-intrinsic personal characteristics and customer-extrinsic operational qualities.
While both the customer and the service provider may enjoy many benefits from the utilization of SST, some customers are reticent to embrace SST. Previous SST research has investigated the impact of various personal differences related to SST usage. Most notably individual difference traits have been classified into socioeconomic/demographic factors and personality traits (Schaninger & Sciglimpaglia, 1981). In addition to demographic factors customer personality influence SST usage (Dabholkar, 1996; Meuter, Bitner, Ostrom, & Brown; 2005).
Herbert and Benbasat (1994) combined concepts from the theory of reasoned action (Fishbein & Azjen, 1975) and diffusion of innovation (Rogers, 1995) to develop a model for the adoption of information technology and found support for a relationship between attitude and behavioral intention. The technology acceptance model (TAM) (Adams, Nelson, & Todd, 1992; Davis, 1989; Davis, Bagozzi, & Warshaw, 1989) extends the attitude behavior intention relationship established in the theory of reasoned action, to the adoption of computers in the workplace. These studies developed the idea that ease of use and perceived usefulness of the technology were critical constructs influencing attitude towards using the computer. What these studies failed to examine were the situational variables apart from the technology such as perceived risk or the need for human interaction. DISCRIMINATION
Codes 2000a and 2000a(b) of Title II of the Civil Rights Act of 1964 made it unlawful to discriminate or segregate individuals on the basis of race, color, religion, or national origin in settings of public accommodations. Specifically, the law was designed to eradicate “the unfairness, humiliation, and insult of racial discrimination in facilities which purport to serve the general public” (House of Representatives, 1964).
Unfortunately, racism has not been eliminated and some would suggest is not in decline but rather
manifests through indirectness, subtleness and covertness (Bonilla-Silva & Forman, 2000; Bonilla-Silva, 2002; Coates, 2008, Walsh 2009). Members of underrepresented groups are susceptible to such subtle forms of discrimination when engaging in routine business transactions (Feagin, 1991, 2000; Feagin & Sikes, 1994). Customer Racial Profiling (CRP) frequently occurs in places of public accommodation, such as hotels and restaurants and affects members of minority groups beyond those classified as black/African-American, such as Hispanics, Asians, Native Americans, and Arab Americans (Harris, Henderson, & Williams, 2005; Walsh & McGuire, 2007).
Discrimination manifests itself in a variety of ways. Hill and Tombs (2011) examined the impact of
accent of the service provider on the perception of the recipient of the service. Their findings revealed that accent had a significant effect upon the evaluation of the service provided often evoking a negative predisposition to certain accents and reducing the customers’ level of tolerance and increasing the perception of the service provider’s lack of understanding. Language has been identified as an fundamental dimension of ethnic identity and is often used in social categorization (Rakic et al., 2011). The interactive nature of the service encounter usually involves verbal communication and thus has the potential for triggering biased judgments.
In a study examining the attitudes of restaurant servers in the U.S. Brewster (2012) reported the
average respondent admitted to sometimes discriminating in their service delivery. Furthermore, 68% of respondents stated class bias; 71% expressed bias against the presence of small children; 59% reported bias with regard to customers’ sex; and, 55% describe bias against customers under 21 years of age. Customers that are perceived to be less “troublesome” and provide a more pleasant interaction with the service provider receive preferred treatment over customers to perceived to be less affluent (Dirks & Rice; 2004). Black customers have been described as being comparatively more difficult to serve than white customers (Dirks & Rice, 2004; Rusche & Brewster, 2008).
In a study of black Americans (Willming, 2001) found that 46% of the respondents perceived
discrimination while dining in a LSR. The most common forms of discrimination reported in foodservice operations included being ignored or having service denied; observing others being served first; receiving rude or discourteous service; and being treated unfairly (Brewster & Rusche, (2012).
An examination of the potential consequences of perceived discrimination on the part of customers resulted in the identification of attitudes and behaviors that may make customers feel better and reduce stress (Walsh, 2009).
Avoidance/Ignore the situation Lodge a formal complaint Decrease in customer satisfaction Negative word-of-mouth Decreased trust Decreased loyalty
The literature on discrimination provides a sound basis for the further examination of how SST is
perceived by ethnic groups and the inherent advantages/disadvantages of utilizing SST in LSR environment. METHOD
A large international LSR chain with some franchisees choosing to employ SST was selected for the study. The location selected for this study is located in a major metropolitan area of the western United States. The franchisee of this location agreed to allow data collection for this study. Data collection was performed on three consecutive days, Wednesday through Friday during the hours of 11:00 AM until 2:00 PM, the busiest hours of the day for this type of food service outlet. The LSR selected for this study offered both personal service, interaction with a traditional order-taker, and SST. Customers would select which type of service they preferred and then join the queue offering the desired service. Only individuals entering the queue to use the SST were approached by the researchers and asked if they would like to participate in a university research project. Fewer than ten individuals declined to participate in the study.
The instrument used for this study was adapted from an earlier study conducted by Curran and Meuter
(2005) investigating customer’s antecedent beliefs on utilizing ATM’s, phone banking, and online banking. All antecedent belief constructs were measured using a seven-point Likert scale with endpoints of 1 (strongly agree) and 7 (strongly disagree). The three items used to measure attitudes toward the SST used a seven-point semantic differential scale with endpoints of very good/very bad, very pleasant/very unpleasant, and strongly like/strongly dislike. The two item behavioral intention measure used a seven-point Likert scale with endpoints of extremely likely/extremely unlikely.
Data analysis consisted of several stages. First, descriptive statistics, outliers and assumptions were
assessed (Tabachnick & Fidell, 2001). Second, factor analysis by using principal component analysis procedure, and varimax rotation was performed. Several criteria were used for determining the number of factors, including Cattell’s Scree Test, eigenvalues greater than one, interpretability, stability, and over-factoring (Tabachnick & Fidell, 2001). The .40 cut-off point for the factor loadings was employed in this analysis. Third, Multivariate Analysis of Variance, with post hoc Scheffe tests, was utilized to examine variations in self-service technology beliefs, attitude and behavior due to ethnicity. RESULTS
Exploratory factor analysis was used to identify perceptual/cognitive dimensions of SST. Analysis revealed three dimensions which explained 71% of the variance; Benefits, Risk, and Ease of Use. The MANOVA findings suggested Ease of Use and Risk perceptions did not vary by Ethnicity. However, Benefits and Attitude dimensions were significantly different at 0.001 probability level. Hispanics and Asians had more positive benefits and attitude than Caucasians. In addition, Hispanics and Asian are found to more likely use self-service system in LSR’s and recommend using the self-service ordering system to others.
Data analysis consisted of several stages. First, descriptive statistics, outliers and assumptions were
assessed (Tabachnick & Fidell, 2001). Second, factor analysis by using principal component analysis procedure, and varimax rotation was performed. Several criteria were used for determining the number of factors, including Cattell’s Scree Test, eigenvalues greater than one, interpretability, stability, and over-factoring (Tabachnick & Fidell, 2001). The .40 cut-off point for the factor loadings was employed in this analysis. Third, Multivariate
Analysis of Variance, with post hoc Scheffe tests, was utilized to examine variations in self-service technology beliefs, attitude and behavior due to ethnicity.
Table 1 Measures and individual items Ease of use
Learning to use the self-service ordering system was easy for me.
It was easy for me to become skillful at using the self-service ordering system.
The self-service system was useful for ordering my food.
Risk
I feel secure ordering my food using the self-service system.
I know that the self-service system will handle my order correctly.
There is little danger that anything could go wrong when I use the self-service system.
Benefits
Using the self-service system makes ordering my food easier.
Using the self-service system improves the food ordering process.
Self-service provides more convenient service.
Self-service saves time.
The self-service system is useful for ordering my food.
Attitude
How good or bad do you feel about using the self-service ordering system?
How pleasant or unpleasant is it to use the self-service ordering system?
How much would you say you like or dislike using the self-service ordering system?
Behavior
When you have a choice, how likely are you to use a self-service system?
How likely are you to recommend using the self-service ordering system to others?
Scale: The SST items were measured on a 7-point scale, 1=strongly agree and 7=strongly disagree.
The respondents were mostly males 72%. The age distribution of participants was weighted towards 20-29 year olds (60%). Most of the participants in this study had at least some college education with only 5.6% reporting a high school education or less. These results may be more reflective of the LSR industry and the location of the LSR where the data was collected; adjacent to a well-known west coast university. The ethnic composition of participants was 47% Caucasian and 53% ethnic minorities.
Table 2 Demographic Profile
Variables N Percentage
Sex (n=212)
Male 153 72.2
Female 59 27.8
Age (n=215)
Under 20 29 13.5
21-24 61 28.4
25-29 68 31.6
30-34 24 11.2
35-up 33 15.3
Ethnicity (n=214)
Caucasian 101 47.2
Hispanic 38 17.8
Asian 46 21.5
Other 29 13.6
Education (n=215)
High school or less 12 5.6
Some college 47 21.9
College graduate 73 34.0
Graduate degree 83 38.6 Table 3 Variations in SST Evaluations by Ethnicity (N=214)
SST Factor Dimensions Caucasian (n=101)
Hispanic (n=38)
Asian (n=46)
Other (n=29)
F-test p-value
Ease of Use 1.60 1.46 1.51 1.40 0.499 0.684 Risk 2.41 2.33 2.60 2.59 0.457 0.713 Benefits 2.85a 1.75b 2.03b 1.84b 9.85 0.000* Attitudes 2.26a 1.75a,b 1.71b 1.49b 6.05 0.001* Behavioral 2.75a 1.97b 1.91b 1.44b 12.66 0.000* Note: Mean scores with different letters (a, b) are significantly different at 0.001 probability level.
Exploratory factor analysis was used to identify perceptual/cognitive dimensions of the SST. Analysis revealed three dimensions which explained 71% of the variance; Benefits, Risk, and Ease of Use. The MANOVA findings suggested Ease of Use and Risk perceptions did not vary by Ethnicity. However, Benefits and Attitude dimensions were significantly different at 0.001 probability level (Table). Hispanics, Asians, and Others had more positive benefits than Caucasians. On the other hand, Asians and Others exhibited more positive attitudes than Caucasians. In addition, Hispanics, Asians and Others are found to more likely use customer controlled dining systems in LSR’s and recommend them to others.
These findings are of particular importance to both researchers and practitioners. In examining the perceived benefits for non-Caucasians all groups found the SST to both improve the food ordering process and make the ordering food easier (significant at 0.000 probability level). Another important finding from this study is that both Asians and Hispanics identified the SST as more convenient and saving more time (significant at 0.000 probability level) than Caucasians.
The above described are findings are of particular importance to food service operators when determining the strategic deployment of SST assets. Due to the perceived benefits enjoyed by non-Caucasians operators should first look at deploying SST in locations with a high non-Caucasian demographic. The potential for both customer and employee discrimination as described in the literature review supports the strategic use of SST to increase customer satisfaction and repeat patronage.
The lack of person-to-person direct interface will eliminate from the service experience the potential
for discriminating behaviors by both the service provider and the recipient of the service. It is understood SST is not the comprehensive response to discrimination in the providing of service, for those individuals enjoying the utilization of SST the findings of this study provide a potential remedy. The exploration of customer use of SST is a very new area of research and affords an abundance of future research opportunities. First of all, other factors may be included to gain a fuller understanding of the successful implementation of SST. More studies need to be conducted to solidify our knowledge of how to introduce and implement SST in other types of foodservice operations. Given the sampling method used the results may not be generalizeable. The study did not test any alternative models which may fit the data equally well. Due to the limited application of SST in the LSR dining segment there is a need for further research to better understand how operators may successfully deploy this new technology. Areas needing examination include more demographic variables and the potential impact upon customer acceptance of SST. REFERENCES
Adams, D. Nelson, R. & Todd, P. (1992). Perceived usefulness, ease of use, and usage of information
technology: a replication. MIS Quarterly 16 (2), 222-247. Bateson, J. (1983). The self-service customer: Empirical findings. Proceedings of the American Marketing
Association, American Marketing Association, Chicago, IL, pp. 50-53. Berry, L. (1999). Discovering the Soul of Service, New York: Free Press.
Bettencourt, L. (1997). Customer voluntary performance: Customers as partners in service delivery. Journal of Retailing 73 (3), 383-406. Bonilla-Silva, E. (2002). The linguistics of color-blind racism: How to talk nasty about Blacks without sounding
racist. Critical Sociology 28 (1/2), 41-64. Bonilla-Silva, E. & Forman, T. (2000). I am not a racist but…Mapping white college student’s racial ideology
in the USA. Discourse and Society 11 (1), 50-85. Brewster, Z., (2012). Racialized customer service in restaurants: A quantitative assessment of the statistical
discrimination explanatory framework. Sociological Inquiry 82 (1), 3-28. Brewster, Z. & Rusche, S. (2012). Quantitative evidence of the continuing significance of race: Tableside
racism in full-service restaurants. Journal of Black Studies 20 (10), 1-26. Coates, R. (2008). Covert racism in the USA and globally. Sociology Compass 2 (1), 208-231. Curran, J. & Meuter, M., (2005). Self-service technology adoption: Comparing three technologies. The Journal
of Services Marketing 19 (2) 103-113. Curry, J. & Kleiner, B., (2005). New developments concerning discrimination towards customers in the
restaurant industry. Equality, Diversity and Inclusion: An International Journal 24 (5/6), 101-106. Dabholkar, P. (1994). "Technology-based service delivery: a classification scheme for developing marketing
strategies", in Swartz, T.A., Bowen, D.E. and Brown, S.W. (Eds), Advances in Services Marketing and Management, Vol. 3, JAI Press, Greenwich, CT, pp. 241-71.
Dabholkar, P. (1996). Consumer evaluations of new technology-based self-service options: An investigation of alternative models of service quality. International Journal of Research in Marketing 13 (1), 29-51.
Dabholkar, P., Bobbitt, L. & Lee, E. (2003). Understanding consumer motivation and behavior related to self-scanning in retailing: Implications for strategy and research on technology-based self-service. International Journal of Service Industry Management 14 (1), 59-95.
Daniel, E. & Storey, C. (1997). On-line banking: strategic and management challenges. Long Range Planning 30 (6), 890-898.
Davis, F. (1989). Perceived usefulness, perceived ease of use, and user acceptance of information technology. MIS Quarterly 13 (3), 319-339.
Davis, F., Bagozzi, R., & Warshaw, P. (1989). User acceptance of computer technology: a comparison of two theoretical models. Management Science 35 (8), 982-1003.
Dirks, D. & Rice, S., (2004). Dining while black: Tipping as a social artifact. Cornell Hotel and Restaurant Administration Quarterly 45 (1), 30-47.
Feagin, J., (1991). The continuing significance of race: Anti-black discrimination in public places. American Sociological Review 56 (1), 101-116.
Feagin, J., (2000). Racist America: Roots current realities, and future reparations. New York, NY: Routledge. Feagin, J. & Sikes, M. (1994). Living with racism: The Black middle-class experience. Boston, MA: Beacon. Fisher, L. M. (1998). “Here comes front office automation”. Strategy and Business 13 (4) 53-65. Fishbein, M. & Azjen, I. (1975). Belief, Attitude, Intention, and Behavior: An Introduction to Theory and
Research, Addison-Wesley, Reading, MA. Ford, R. & Heaton, C. (2001). Managing your guest as a quasi-employee. Cornell Hotel and Restaurant
Administration Quarterly 42 (2), 46-55. Ford, R., Heaton, C. & Brown, S. (2001). Delivering excellent service: Lessons from the best firms. California
Management Review 44 (1), 39-56. Harris, A., Henderson, G. & Williams, J. (2005). Courting customers: Assessing consumer racial profiling and
other marketplace discrimination. Journal of Public Policy and Marketing 24 (1), 163-171. Halbesleben, J. & Buckley, M. (2004). Managing customers as employees of the firm: New challenges for
human resource management. Personnel Review 33 (3), 351-365. Hebert, M. & Benbasat, I. (1994). Adopting technology in hospitals: The relationship between
attitudes/expectations and behaviors. Hospital and Health Services Administration 13 (3), 369-383. Hill, S. & Tombs, A., (2011). The effect of accent of service employee on customer service evaluation.
Managing Service Quality 21 (6), 649-666. Johnston, R. & Jones, P. (2004). Service productivity: Towards understanding the relationship between
operational and customer productivity. International Journal of Productivity and Performance 53 (3/4), 201-211.
Kincaid, C., & Baloglu, S. (2006). An Exploratory Study on the Impact of Self-Service Technology on Restaurant Operations. Journal of Foodservice Business Research 8(3), 55-65.
Kontoghiorghes, C. (2005). Key organizational and hr factors for rapid technology assimilation. Organization Development Journal 23 (1), 26-39.
Loh, L. & Ong, Y., (1998). The adoption of Internet-based stock trading: a conceptual framework and empirical results. Journal of Information Technology 13 (2), 81-94.
Lovelock, C. & Young, R. (1979). Look to consumers to increase productivity. Harvard Business Review 57 (3), 63-71. Meuter, M., Bitner, M., Ostrom, A. & Brown, S. (2005). Choosing among alternative service delivery modes:
An investigation of customer trial of self-service technologies. Journal of Marketing 69 (2), 61-83. Meuter, M., Ostrom, A., Roundtree, R. & Bitner, M. (2000). The influence of technology anxiety on consumer
use and experiences with self-service technologies. Journal of Business Research 56 (11) 899-906. Rakic, T., Steffens, M. & Mummendey, A. (2011). Blinded by the accent! The minor role of looks in ethnic
categorization. Journal of Personality and Social Psychology 100 (1), 16-29. Rusche, S. & Brewster, Z. (2008). Because they tip for shit! The social psychology of everyday racism in
restaurants. Sociology Compass 2 (6), 2008-2029. Rogers, E. (1995). Diffusion of Innovations, 4th Ed. The Free Press, New York, NY. Schaninger, C. & Sciglimpaglia, D., (1981). The influence of cognitive personality traits and demographics on
consumer information acquisition. Journal of Consumer Research 8 (2), 208-216. Schier, T. (2004). Willing to do the work. LSR (69). Slywotzky, A. & Morrison, D. (2001). The rise of the active customer. Marketing Management 10 (2), 22-26. Tabachnick, B. & Fidell, L., (2001). Using multivariate statistics, 4th edition. Allyn & Bacon: Boston. Walker, R., Craig-Lees, M., Hecker, R. & Francis, H. (2002). Technology-enabled service delivery: An
investigation of reasons affecting customer adoption and rejection. International Journal of Service Industry Management 13 (1) 91-106.
Walsh, G. (2009). Disadvantaged consumers’ experiences of marketplace discrimination in customer services. Journal of Marketing Management 25 (1/2), 143-169.
Walsh, G. & McGuire, D., (2007). Minority consumers’ experiences of marketplace discrimination in services: A conceptual model of antecedents and customer outcomes. Advances in Consumer Research 34, 278-279.
Willming, C. (2001). Leisure-travel behaviors of college-educated African-Americans and perceived racial discrimination. Unpublished dissertation, University of Florida.
Zeithaml, V. (1981). “How consumer evaluation processes differ between goods and services”, in Donnelly, J.H. and George, W.R. (Eds.), Marketing of Services, American Marketing Association, Chicago, IL. 181-190.
Challenges for procurement in the UK Catering industry
Jane Eastham Senior lecturer
Sheffield Hallam University Sheffield S1 1WB
ABSTRACT
This paper explores the impact of current procurement strategies and existing marketing channels on competitive position of food service operations. The highly fragmented catering sector and changes to the structure of the catering supply sector are seen to represent a threat to the attainment of strategic advantage from procurement for even the larger operations. This paper questions whether the industry needs to make more careful consideration of strategic versus operational effectiveness. Drawing on a power dependency model the paper suggests that buyers should consider their relative power position when selecting suppliers and the implications of choosing suppliers who hold a greater number of power attributes than themselves on the distribution of economic surplus within the exchange relationship. Key words Power dependency theory, local food, strategic advantage, procurement
INTRODUCTION
The term procurement refers to the sourcing decisions which are made with a view to attain
competitive advantage. Most often defined as the advantage gained over competitors in offering consumers greater value, either through lower prices, greater benefits and or service, an explanation that place great emphasis on buyers and rivals, this paper draws in one of the neglected five forces and focusing upon the threat of suppliers and the firm as a buyer. It is proposed that in increasing contested markets, both those of the buyer and supplier, successful firms need to extend their practical understanding of the factors that affect competitive advantage to understanding the power position of the buyer versus its suppliers, and not simply their relative value against other parties in delivering value to the consumer. The work puts forward the idea that the ability of the caterer to generate sufficient benefits from their business is at least in part contingent on their ability to proactively seek suppliers who hold a weaker position of leverage than themselves. Yet changes to supply sector for many catering operations has undermined their bargaining position vis -a- vis suppliers.
This paper draws upon portfolio analysis (Kraljic, 1983), Porter's five forces ( 1980; 1985) and
Power Dependency Theories to explore the impact of a highly concentrated supply market on the ability of a relatively fragmented catering sector to achieve competitive advantage. The findings are based on longitudinal research and are presented as a case study. Foodservice operations were traditionally supplied by an equally fragmented wholesale sector, but after the popularisation of the “meals from home market” and the consolidation of the retail sector this was to change. The link pin between the two events can be traced to a decision by key multiple retailers to bypass the wholesale sector in a search for sufficient volume and quality of fresh produce to meet their expanding market needs, an action that resulted in the loss of the traditional sources of supply to foodservice, the wholesale markets.
Whilst many wholesale businesses closed down, others emerged through acquisition and mergers,
thereby reducing the leverage position of even the larger foodservice businesses. This position has been exacerbated because of a wide spread decision by Fast popular dining brands to outsource food production and thereby improve labour productivity , customer numbers and the turnover generated by more competitive pricing and the more effective use of retail space. Catering supply companies offered prepared meals and furthermore reduced the costs of receiving goods by providing multi-temperature deliveries and the opportunity for single sourcing. The downside from a strategic perspective is that this means that branded foodservice operations particularly effectively reduced the numbers of available substitutes and thus increased the costs of switching suppliers.
However these events have a possibly longer term effect on the sector, and perhaps enable
interested parties to draw some key lessons. Firstly that procurement decision should weigh operational efficiency against the share attained by the buyer from the exchange relationship. Secondly environmental scanning should not only take account of hospitality industry, considerations need to be made also of suppliers, supply chains, and as well as parallel retail businesses and their dedicated distribution channels. These issues are considered in more detail in the context of “local food agenda” for which there are significant barriers for development which is a function of past current marketing structures. The paper discusses the problem of redeveloping structures of supply, particularly significant given the food security policy agenda, and discusses with reference to the portfolio/power dependency model the relative benefits of alternative structures.
CONTEXT OF THIS RESEARCH The catering sector remains a relatively fragmented sector in comparison to both the retail sector, and their
suppliers market. This is evident when it is considered that whilst there are over 4000 catering brands with 5 or more outlets, (Technomic, 2010), 25% of the supply to catering businesses comes from the two largest catering supply companies, with a further 20% supplied to caterers by the 6 key retailers both discount and mainstream who collectively supply around 60% of the total food consumed in the UK( Oxford Economics report, 2010; IGD, 2009).1 Indeed one of the key factors that have brought about the changes to the catering supply market is the consolidation of the multiple retailer sector, and the consolidation of the catering supply chain can be considered to have had a critical impact on the balance of power between caterers and their suppliers. The other is the outsourcing of food production systems as a means of increasing operational efficiency.
Recent decades have seen the both the democratisation of food service and the emergence of key brands,
with the burger bar Wimpy bars in 1950's, which was to be followed by MacDonald’s, and Burger King) and a steady development of branded pubs with the establishment brewers fare, Beefeater, and Roast in, and the emergence of pizzeria with brands such as Pizza hut in the 1980’s (Ryan, 1980,; Kotas and Davis, 1981). By the late 1990's the turnover for the burgers sector alone amounted to over 1.4 billion per annum. The sector saw also a significant growth in the Pub meal, stimulated in part by an increasingly stringent drink driving regulations. By 1995, revenue generated from meals partaken in pubs had reached a value of £3.1billion amounting to circa 1 in 6 of all meals eaten out of the home, often from branded establishments such as Brewers Fayre, Wetherspoons and Beefeater (Eastham et al, 2001). In parallel the sector noticed the growth in other key popular dining venues, with the emergence of , amongst others, Café Rouge in 1989, Nandos in 1992, Wagamma in 1993, and Frankie and Benny's in 1995. These "hard" brands, i.e. brands which were offered a product standardised in production and service styles, ambiance and product, expanded rapidly across the UK. Such standardisation presented challenges in order to ensure consistency of customer experience, furthermore typically located in areas with high rents and business rates, these business sought ways to maximise spatial and labour efficiency. By outsourcing production and later menu development to catering supply companies, they were able to standardise the product, as well as increase the ratio of meals served per labour and spatial inputs. In turn catering supply companies identified small scale manufacturing units who offered the flexibility of quick production line turnaround and small production runs necessary to this sector. However the expansion of such businesses might have been presumed to have created a significant shift in the leverage position within the food service sector. As businesses expanded it might have been presumed that their position against suppliers might be improved. The research asked the question as to whether given the switch to catering supply branded prepared foods, whether indeed this would prove to be true.
PURCHASING AS A MEANS OF COMPETITIVE ADVANTAGE
Purchasing across all sectors has been has been traditionally seen across sectors to be a clerical activity,
(Cousins, 2001) one in which having received specifications from housekeeping, sales, front office, or food and beverage the purchaser looks to find an item at the lowest cost and highest acceptable quality. This premise assumes a condition of perfect market, in that items are standardised, readily interchangeable, and that purchasers are able to make value comparisons easily, i.e. that they are buying both from a perfect market, and that the product they are
1This figure includes sales direct from retail to the consumer and through catering businesses to the consumer.
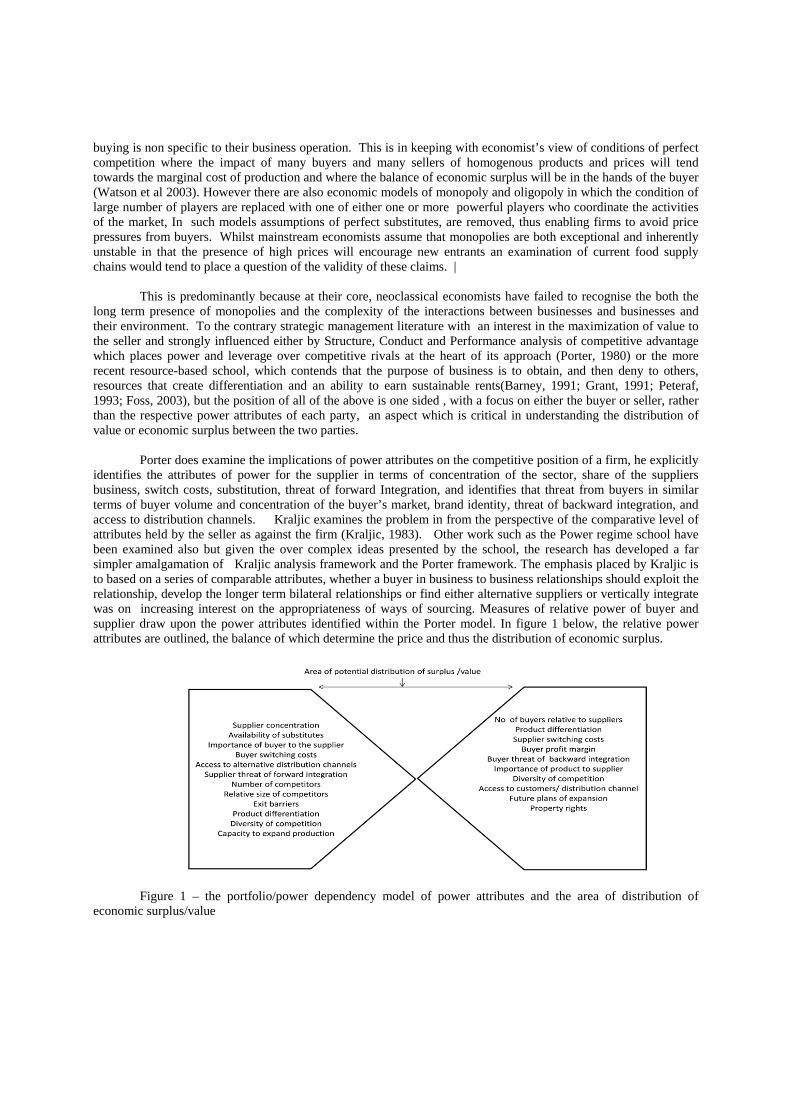
buying is non specific to their business operation. This is in keeping with economist’s view of conditions of perfect competition where the impact of many buyers and many sellers of homogenous products and prices will tend towards the marginal cost of production and where the balance of economic surplus will be in the hands of the buyer (Watson et al 2003). However there are also economic models of monopoly and oligopoly in which the condition of large number of players are replaced with one of either one or more powerful players who coordinate the activities of the market, In such models assumptions of perfect substitutes, are removed, thus enabling firms to avoid price pressures from buyers. Whilst mainstream economists assume that monopolies are both exceptional and inherently unstable in that the presence of high prices will encourage new entrants an examination of current food supply chains would tend to place a question of the validity of these claims. |
This is predominantly because at their core, neoclassical economists have failed to recognise the both the
long term presence of monopolies and the complexity of the interactions between businesses and businesses and their environment. To the contrary strategic management literature with an interest in the maximization of value to the seller and strongly influenced either by Structure, Conduct and Performance analysis of competitive advantage which places power and leverage over competitive rivals at the heart of its approach (Porter, 1980) or the more recent resource-based school, which contends that the purpose of business is to obtain, and then deny to others, resources that create differentiation and an ability to earn sustainable rents(Barney, 1991; Grant, 1991; Peteraf, 1993; Foss, 2003), but the position of all of the above is one sided , with a focus on either the buyer or seller, rather than the respective power attributes of each party, an aspect which is critical in understanding the distribution of value or economic surplus between the two parties.
Porter does examine the implications of power attributes on the competitive position of a firm, he explicitly
identifies the attributes of power for the supplier in terms of concentration of the sector, share of the suppliers business, switch costs, substitution, threat of forward Integration, and identifies that threat from buyers in similar terms of buyer volume and concentration of the buyer’s market, brand identity, threat of backward integration, and access to distribution channels. Kraljic examines the problem in from the perspective of the comparative level of attributes held by the seller as against the firm (Kraljic, 1983). Other work such as the Power regime school have been examined also but given the over complex ideas presented by the school, the research has developed a far simpler amalgamation of Kraljic analysis framework and the Porter framework. The emphasis placed by Kraljic is to based on a series of comparable attributes, whether a buyer in business to business relationships should exploit the relationship, develop the longer term bilateral relationships or find either alternative suppliers or vertically integrate was on increasing interest on the appropriateness of ways of sourcing. Measures of relative power of buyer and supplier draw upon the power attributes identified within the Porter model. In figure 1 below, the relative power attributes are outlined, the balance of which determine the price and thus the distribution of economic surplus.
Figure 1 – the portfolio/power dependency model of power attributes and the area of distribution of economic surplus/value
RESEARCH METHODOLOGY
This case study is a result of number of research activities which have spanned a period of nearly two
decades. The research approach adopted a critical realist stance in order examine the proposition that and evaluated and the research pulls from a series of studies across this period ( Eastham, 1995; Eastham, 1997; Eastham, 1999; Eastham, 2000; Eastham, 2001; Eastham, 2003; Eastham, 2005; Eastham , et al 2007 ; Eastham, 2012). The portfolio/power dependency model in the first instance is used to examine on the basis of a number of studies of the wholesale sector, retail sector and branded and non branded catering establishments and their relative power attributes, and in the second the relative power attributes of alternative hub structures. The work draws upon a range of primary research activities including action research, participant observation, interviews and questionnaires. These, in some instances, have contributed to earlier publications as identified above but were drawn together and triangulated with published and unpublished secondary sources.
CASE STUDY - STRATEGIC IMPLICATIONS OF PURCHASING STRATEGIES The study will examine implications of the current supply chain on the leverage position of the food service
sector and potential for improving their leverage position over the longer term. The structure of both the supply chain to the catering sector and that of the retail sector places the food service sector under considerable threat from its suppliers. Decisions made to outsource supply in the last 2 decades were designed to improve operational efficiency as well as brand consistency but failed to consider their strategic implications. Where both sectors, the catering and catering suppliers, were highly fragmented the issue of power imbalances and their impact on the leverage position did not arise. It is possible that with the advent of prepared food and thus the need for multi-temperature delivery systems the catering sector would have in any case experience the consolidation of their supply base, nevertheless the dramatic restructuring of the supply chain has reduced the number of alternative suppliers and tipped the balance of power into the seller’s favour. This situation is particularly so in branded operations who are reliant upon catering supply company branded pre-prepared products. However there is a further threat to the catering sector in that changes to the structure of the supply base has restricted sources of supply for those caterers wanted to return to more traditional production systems.
Retailers traditionally supplied either through intermediaries such as wholesale traders or direct from
manufacturers who would deliver directly to the store. However, as the market became more contested the larger retailers, initially, sought ways to increase competitive advantage through cutting costs within the supply chain. The introduction of a central distribution system enabled the retailers to bypassing these intermediaries and buy directly from farmers, marketing agents and importers, which enabled them to reduce the costs through the development of economies of scale as well as extend their bargaining power. In a power dominant position, retailers have effectively become gatekeepers to the consumer; controlling shelf space, as well as consumer perceptions of quality and acceptable product standards. Retailers have attempted to reduce costs further through the more finely tuned centralisation of distribution systems and the introduction of category management sourcing strategies whereby retailers are looking for fewer, larger more efficient and innovative suppliers. Both measures have resulted in the decline of the tradition sources of supply for the catering sector and indeed have in effect disconnected the link between the UK farming sector and an alternative customer base which may be illustrated by the continual decline in the percentage share of UK grown produce. In the retail sector, overall self sufficiency is around 50-60 on indigenous produce, however the problem is more acute in the catering or where costs of produce plus a lack of a distribution infrastructure make imports even more attractive.
The wholesalers, who had the capacity, switched business interests to focus upon the foodservice sector. This proved to be an effective strategy and their position was further consolidated, where catering businesses outsourced food production. This presents an interesting paradox in that whilst the caterer’s decision to outsource was a measure designed to increase productivity, but in effect it potentially had the effect of increasing total costs through augmenting costs of purchase. The choice by foodservice businesses to buy from multiple retailers, who in effect are competitors, is potentially a consequence of the loss of bargaining power against mainstream catering supply companies. Contracts with catering supply companies to produce bespoke items further inhibit their ability to switch suppliers and undermine their leverage position. This is particularly so where the catering supply companies own the recipes and furthermore manage the relationships with the food manufacturers.
What is of greater concern is that the strategic importance of procurement/ purchasing remains unrecognised by the sector. Indeed it was apparent that purchasing per se had been largely unrecognised by the hospitality industry as a whole (Yip, 1992;Whita, 2007). This is because for the most part the hospitality professionals are more concerned with the management of the dilemma of how to improve operational efficiency while at the same time " delighting the customer" rather than deploying carefully laid strategies to improve their competitive position against their suppliers. Whitbread Plc can be used as an example. In two known instances it is apparent that Whitbread Plc originally one of the key brewers in the UK, has failed to recognise the strategic importance of the purchase decision. In the first in April 2008 when it disbanded its logistics operation and outsourced to Kuehne and Nagel on a five year deal, an operation had a turnover 9 times greater than that of Whitbread. A simple examination of their relative power attributes might have suggested that there are high risks of moral hazard associated with the deal. In the second Whitbread example, it can be seen that they have deployed the services of Farmright to develop a milk dispenser that reduced cost of labour in their rapidly expanding Costa coffee brand. Farmright was supplied by 7 farmers who were utilising a grassfed spring calving system and were based in Devon, a factor heavily highlighted on the Costa website. However the capacity of the operation would appear to be in-sufficient, particularly during the winter months, to meet the expanding demand. Farmright appears to have attempted to maintain the Costa contract through acquiring additional milk supply from Dairy Crest, most probably at a higher cost than the price it normally paid to its own farmers. Early 2012 the company went into administration, owing £4 million to Dairy Crest. The cost to Costa has been possibly relatively slight, but could have been avoided if due consideration had been made as to the capacity of Farmright to deliver during the drying off period in a spring calving system.
The attrition of the wholesale sector has potentially more serious implications if the sector continually fails to recognise the strategic importance of sourcing options. The separation of the two supply chains and the erosion of traditional marketing channels, as well as the search for cheaper and cheaper sources of food instigated by both the multiple retailers and the catering supply companies , have eliminated pathways to alternative markets for farmers and local sources of supply for the catering sector. This situation was further exacerbated, where the expectations of consumers of cheap food, have driven both sectors to seek supplies from overseas, in effect resulting in a missing middle in local food infrastructure (Morley et al, 2008).The last ten years has brought increased interest in the provenance of food with an emphasis on “local food”. Yet here in lies a problem which has attracted considerable interest from Regional food groups, private enterprise, lobby groups and educational groups such as Taste Real Food. The bifurcation of supply chains to retail and catering and the loss of the traditional wholesale bulkers and de-bulkers of produce have led to the loss of access for farmers to alternative markets and the loss of local sources of supply for the catering sector (IGD 2006). However recent years have seen the development of national, regional and locally operated systems of wholesaling and logistics systems, normally identified as Food hubs. A food hub can be defined as an intermediary who takes the responsibility of bulking, gathering together, de-bulking, segmenting The solution found has been the development of food hubs, the concern here is how food hubs should be formed in order to ensure the effective of marketing channels which will facilitate both increased leverage and the growth of the local food agenda in the catering sector.
INITIATIVES AND THEIR IMPLICATIONS
Food hubs have been established by a range of organisations with a view to reconnecting the countryside in line with the Curry report. There have been numerous, public bodies, lobby groups as well as private individuals have been actively involved in putting in the distribution infrastructure Lobby groups such as Sustain have encouraged the development of sustainable procurement strategy for the London hospitals. Another initiative, the embryonic Bedford food hub, has had considerable support from the educational food group Taste Real Food which is an offshoot of the Ludlow food festival. Regional food groups such as Heart of England and East Anglia Food link have entered a collaborative relationship with the commercial distribution companies. Whilst the Bristol food group which is operated as a not for profit organisation is supported by the Artist project earth group. A further distinction has related to the nature of their involvement in the wholesaling activities of bulking and de-bulking and distribution2. Some have been actively involved in all three roles, others have required suppliers to bring their
2 The terms bulking, de-bulking and distribution are generic terms used in logistics, which refer to a. collation of products from disparate sources, in order to facilitate transportation to where they are needed geographically, breaking them down on arrival to distribute to consumers or small scale businesses.
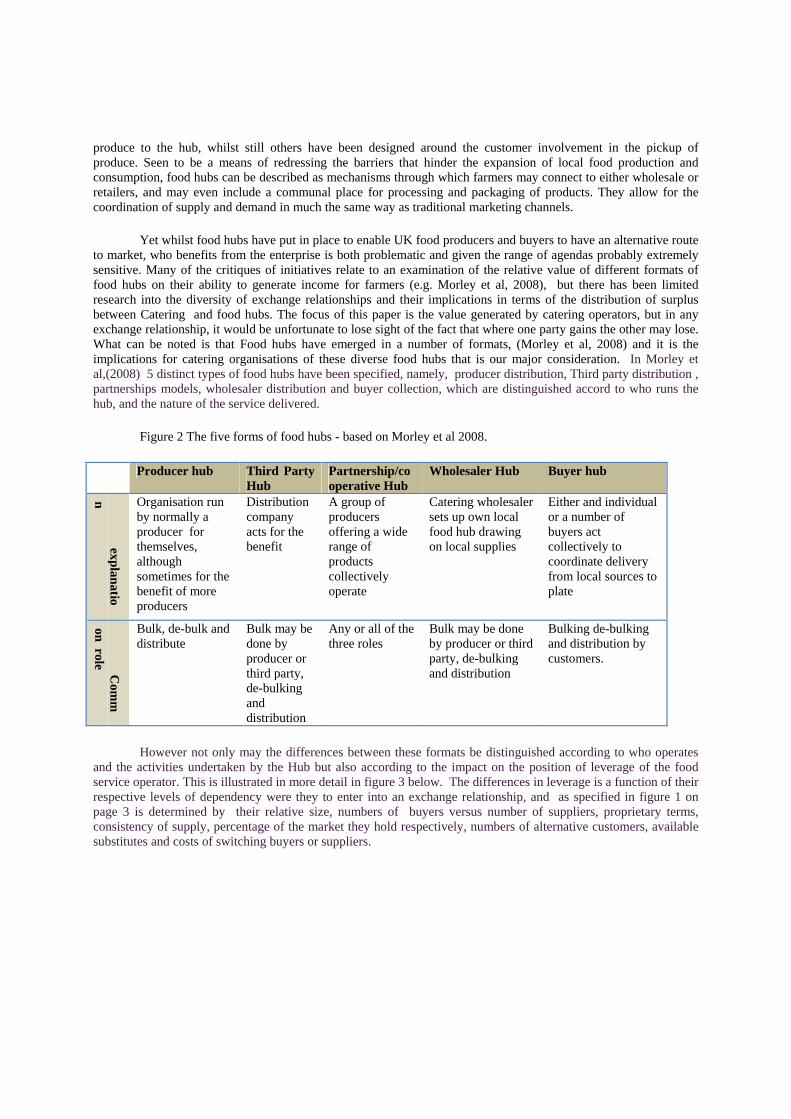
produce to the hub, whilst still others have been designed around the customer involvement in the pickup of produce. Seen to be a means of redressing the barriers that hinder the expansion of local food production and consumption, food hubs can be described as mechanisms through which farmers may connect to either wholesale or retailers, and may even include a communal place for processing and packaging of products. They allow for the coordination of supply and demand in much the same way as traditional marketing channels.
Yet whilst food hubs have put in place to enable UK food producers and buyers to have an alternative route to market, who benefits from the enterprise is both problematic and given the range of agendas probably extremely sensitive. Many of the critiques of initiatives relate to an examination of the relative value of different formats of food hubs on their ability to generate income for farmers (e.g. Morley et al, 2008), but there has been limited research into the diversity of exchange relationships and their implications in terms of the distribution of surplus between Catering and food hubs. The focus of this paper is the value generated by catering operators, but in any exchange relationship, it would be unfortunate to lose sight of the fact that where one party gains the other may lose. What can be noted is that Food hubs have emerged in a number of formats, (Morley et al, 2008) and it is the implications for catering organisations of these diverse food hubs that is our major consideration. In Morley et al,(2008) 5 distinct types of food hubs have been specified, namely, producer distribution, Third party distribution , partnerships models, wholesaler distribution and buyer collection, which are distinguished accord to who runs the hub, and the nature of the service delivered.
Figure 2 The five forms of food hubs - based on Morley et al 2008.
Producer hub Third Party Hub
Partnership/cooperative Hub
Wholesaler Hub Buyer hub
explan
ation
Organisation run by normally a producer for themselves, although sometimes for the benefit of more producers
Distribution company acts for the benefit
A group of producers offering a wide range of products collectively operate
Catering wholesaler sets up own local food hub drawing on local supplies
Either and individual or a number of buyers act collectively to coordinate delivery from local sources to plate
Com
mon
role
Bulk, de-bulk and distribute
Bulk may be done by producer or third party, de-bulking and distribution
Any or all of the three roles
Bulk may be done by producer or third party, de-bulking and distribution
Bulking de-bulking and distribution by customers.
However not only may the differences between these formats be distinguished according to who operates and the activities undertaken by the Hub but also according to the impact on the position of leverage of the food service operator. This is illustrated in more detail in figure 3 below. The differences in leverage is a function of their respective levels of dependency were they to enter into an exchange relationship, and as specified in figure 1 on page 3 is determined by their relative size, numbers of buyers versus number of suppliers, proprietary terms, consistency of supply, percentage of the market they hold respectively, numbers of alternative customers, available substitutes and costs of switching buyers or suppliers.
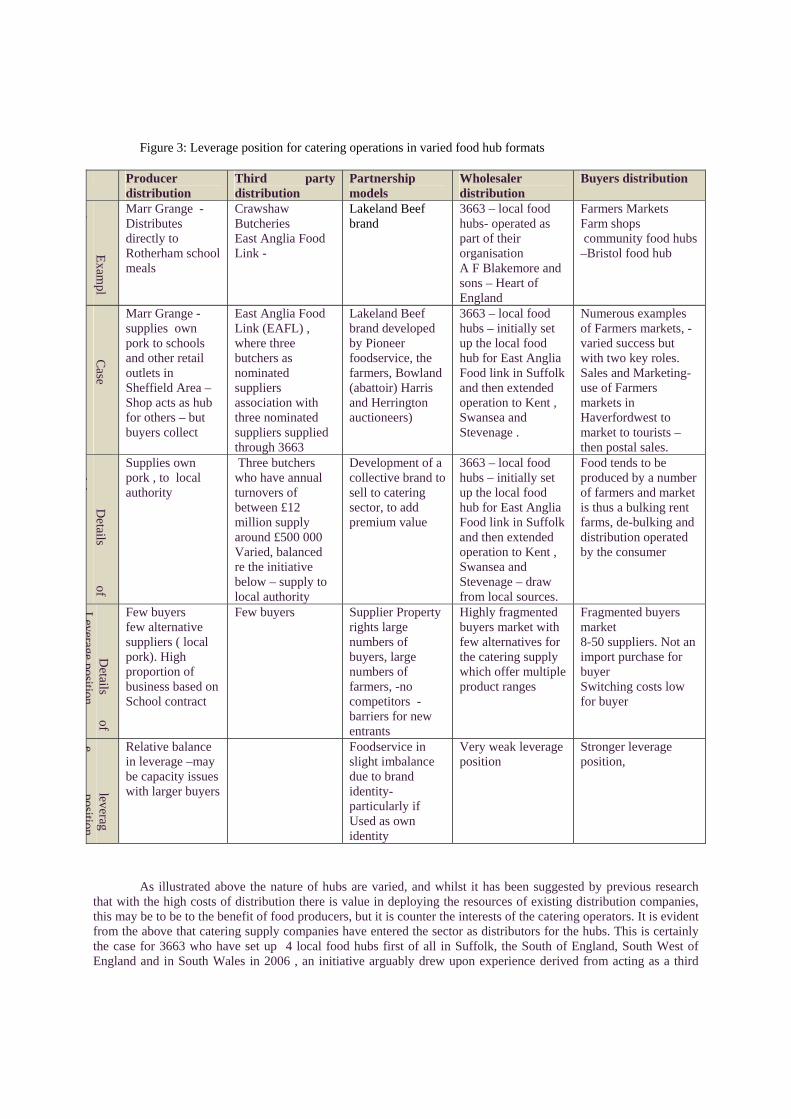
Figure 3: Leverage position for catering operations in varied food hub formats
Producer distribution
Third party distribution
Partnership models
Wholesaler distribution
Buyers distribution
Exam
pl
/ Marr Grange - Distributes directly to Rotherham school meals
Crawshaw Butcheries East Anglia Food Link -
Lakeland Beef brand
3663 – local food hubs- operated as part of their organisation A F Blakemore and sons – Heart of England
Farmers Markets Farm shops community food hubs –Bristol food hub
Case
Marr Grange - supplies own pork to schools and other retail outlets in Sheffield Area – Shop acts as hub for others – but buyers collect
East Anglia Food Link (EAFL) , where three butchers as nominated suppliers association with three nominated suppliers supplied through 3663
Lakeland Beef brand developed by Pioneer foodservice, the farmers, Bowland (abattoir) Harris and Herrington auctioneers)
3663 – local food hubs – initially set up the local food hub for East Anglia Food link in Suffolk and then extended operation to Kent , Swansea and Stevenage .
Numerous examples of Farmers markets, - varied success but with two key roles. Sales and Marketing- use of Farmers markets in Haverfordwest to market to tourists – then postal sales.
Details
of
ii
Supplies own pork , to local authority
Three butchers who have annual turnovers of between £12 million supply around £500 000 Varied, balanced re the initiative below – supply to local authority
Development of a collective brand to sell to catering sector, to add premium value
3663 – local food hubs – initially set up the local food hub for East Anglia Food link in Suffolk and then extended operation to Kent , Swansea and Stevenage – draw from local sources.
Food tends to be produced by a number of farmers and market is thus a bulking rent farms, de-bulking and distribution operated by the consumer
Details
of L
everageposition
Few buyers few alternative suppliers ( local pork). High proportion of business based on School contract
Few buyers Supplier Property rights large numbers of buyers, large numbers of farmers, -no competitors -barriers for new entrants
Highly fragmented buyers market with few alternatives for the catering supply which offer multiple product ranges
Fragmented buyers market 8-50 suppliers. Not an import purchase for buyer Switching costs low for buyer
leverage
position
Relative balance in leverage –may be capacity issues with larger buyers
Foodservice in slight imbalance due to brand identity- particularly if Used as own identity
Very weak leverage position
Stronger leverage position,
As illustrated above the nature of hubs are varied, and whilst it has been suggested by previous research that with the high costs of distribution there is value in deploying the resources of existing distribution companies, this may be to be to the benefit of food producers, but it is counter the interests of the catering operators. It is evident from the above that catering supply companies have entered the sector as distributors for the hubs. This is certainly the case for 3663 who have set up 4 local food hubs first of all in Suffolk, the South of England, South West of England and in South Wales in 2006 , an initiative arguably drew upon experience derived from acting as a third
party food hub within an initiative promoted through the East Anglia Food link in 2005, where Three councils Suffolk, Herefordshire and Cambridgeshire contracted three medium sized butchers to supply local meat to schools. In launching its own hubs the catering supply company and was able to supply a range of ambient, Chilled and Frozen foods to independent gastro pubs, as well as national brands such as Pizza Hut, Burger King, KFC and Green King (Datamonitor 2005, Bill, 2006; Anon, 2006). Similarly with the Heart of England initiative which is designed to reconnect the farmers to both the independent retailers and catering, A.F. Blakemore have signed up around 64 producers on a scheme with over a 1000 product lines. Yet the concern here is whether higher costs of produce which is an attribute of the relative position of power of the supplier makes a strategy of deploying the services of a large catering supply company a sustainable strategy. The argument would be different where issues of size etc are more balanced.
DISCUSSION
The function of the above case study was to examine the impact of relative levels of dependency or power on procurement strategies. The case study examined the factors which have lead to the current supply structure and the leverage position of much of the food service sector where the emphasis for operational efficiency has overshadowed the strategic view. The case study attempts to illustrate through the vehicle of the “local food” initiative what types of considerations need to be made by the catering operator in order with respect to the development of effective sourcing strategies. Findings from a range of research projects presented in figure 3 are by no means conclusive and indeed the level of their conclusiveness varies across projects. However the presentation of these findings is designed to be means of initiating discussion and consideration of what form of infrastructure should be developed in order to increase the position of power of catering operations. What is important to recognise is that the detail that matters, in that the actual determination of the relative power and dependency position is contingent upon detailed consideration of the unique characteristics of each buyer.
Nonetheless a comparison of the relative benefits of the formats of food hubs would seem to suggest that those food hubs which are managed by the large scale catering distribution companies place the catering in a less advantageous position than who are producer operators as in the case of Marr Grange and the initiative sponsored by the East Anglia Food link. However as illustrated by the case of Farmright and Costa considerations need to made with respect to supply characteristics of the commodity, capacity for expansion and growth strategies.
CONCLUDING REMARKS
The strategic value of purchasing within the Hospitality sector in general and the Catering sector more specifically has received little attention by academics, and rarely features in Undergraduate or Postgraduate programmes of study in UK universities. An analysis of prospecti leads one assume that there is limited coverage of purchasing and where it is considered, there is a strong focus on issues of operational efficiency. This failure to recognise the importance of Purchasing, within the hospitality industry Yip, 1992; Whita, 2007)., is largely because hospitality professionals are primarily concerned with the management of the dilemma of improving operational efficiency while at the same time " delighting the customer" rather than ensuring competitive advantage through the procurement decision. In many respects this paper reiterates the call for change, and a recognition of the increasing importance of procurement and how the comparative power attributes of both parties within the supply chain has an impact on the ability of the hospitality industry to select both operational procedures and a procurement strategy that optimises returns.
The matter is complex, factors which improve operational efficiency may be counter intuitive for the strategist. Similarly certain strategic options can have operational costs. Whilst decisions to adopt a multi-product distribution company may prove to reduce the transaction costs of delivery, there may be for example higher switching costs, particularly where the reputation and identity of the catering operator becomes intrinsically linked with the products supplied or few substitutes.
While the paper may not supply categorical answers, it is believed that the questions are interesting. In the context of local food, particularly with smaller operations the possible answer is that greater leverage to catering operations in the emergence of regional limited product ranges, where producers operate as food hubs either as
single operators, or in conjunction with other producers in a partnership model. Marr Grange is such an example, and he also sells to the wholesale sector to a number of intermediaries to the catering sector, such as Crawshaw catering butchers and also operates as a wholesaler with direct sales to Rotherham Borough council school meals. In this case it is apparent that the ability of the school meal service to buy at a comparable price to prices paid to key catering supply companies is a function of their importance to Marr Grange, in particular their share of his business. Yet considerations of these issues appear rare within the hospitality industry. Catering businesses predominantly focus upon operational issues and pay little attention to the buying function. Whilst we make this point in with particular reference to the sustainability of local food initiatives there is a much broader issue, that of the need for more proactive involvement within the supply chain by the catering industry, and an examination of the importance of strategic procurement as a significant factor which contributed certainly to gross margins but potentially to survival.
References Allen, S (2001) Changes in the Supply structure: the impact of expanding consumer choice. In Eastham J.F., Sharples A. E.& Ball, S., 2001 (Eds..) Food Supply chain management, issues for the Hospitality and Retail sectors, Oxford, Butterworth-Heinemann. Anon, (2006 , June 23rd) 3663 launches and initiative in Wales, the Publican, Retrieved from http://www.thepublican.com/story.asp?storyCode=52135. Barney, J. (1991) Firm resources and sustained competitive advantage, Journal of management , 17 (1), .99-120. Bill T. (2006) 3663 launches local food project, Catersearch.comwebsite.93, retrieved fromhttp://www.caterersearch.com/Articles/2006/01/11/304376/3663-launches-local-food-project.htm Cousins, P D. (2001) "Strategic Supply and the Management of Relationships. In Eastham J.F., Sharples A. E.& Ball, S., 2001 (Eds..) Food Supply chain management, issues for the Hospitality and Retail sectors, Oxford, Butterworth-Heinemann. Curry, D (2002) Farming and Food: a sustainable future. Policy commission on the future of farming and food, London, HMSO. Datamonitor (2005) United Kingdom, Foodservice Industry overview, Datamonitor August 2005. Eastham, J.F. Johnson, S. Shutt, J. and Allen, S (1997-1999) Action research in the wholesale markets in collaboration with Leeds business school, the Fresh produce consortium, HCIMA and ISCAN. Eastham, J.F (1995) Case study Bothams - DTI publication in conjunction with ISCAN. Eastham J.F. (1997) Developments in the food chain and the implications for independent caterers.Sheffield Eurochie. Eastham, J.F. (1999) Longitudinal study of the development of interfirm relations between wholesale market traders and independent caterers, Surrey.Eurochrie April 1999. Eastham J.F. (2000) Sourcing issues for the Organic food: - How green can organic be, Eurochie Conference April,2000. Eastham J.F., Ball S.D., and Sharples L. (2001) The catering and food retail industries: a contextual insight, in In Eastham J.F., Sharples A. E.& Ball, S., 2001 (Eds..) Food Supply chain management, issues for the Hospitality and Retail sectors, Oxford, Butterworth-Heinemann. Eastham , J.F. (2003) Farmers’ markets - a new dawn? – An evaluation of the impact of policy on rural areas under New Labour, (unpublished Masters dissertation), Sheffield Hallam University. Eastham J.F. (2005) Report to Askern Farmers Market committee on barriers to success and the impact of Askern Retailers (unpublished). June 2005. Eastham J. and Cox A. (2007) Collaborating with the Supermarkets: The Impact of Multiple Retailer Category Management on Growers and Grower Co-operatives , IPSERA conference March 2007. Eastham J.F. (2012) The value of UK agricultural marketing cooperatives as a countervailing force, (Doctorial pending.), Birmingham Business School, University of Birmingham. Emerson, R. M (1962) Power-dependence relationships, American sociological review, 27 (1) 31-41 Foss, N. J.(2003) The strategic management and transaction cost nexus : past debates, central questions and future research possibilities, Strategic organisation vol. 1 no. 2 139-169. Grant, R. ( 1991) The resource theory of competitive advantage, implications for strategy formulation, California, Management review, 22 (3), 114-135. Horizons for success (2008) UK catering industry in 2008 report, Horizon for success. Retrieved from http://wwwhrzns.com/
IGD (2000) The food project conference, 29th March 2000 London, Institute of Grocery distribution. IGD (2006) Understanding foodservice opportunities for farmers and small food producers London, Institute of Grocery distribution. IGD (2009) UK Grocery and food service outlook, London , Institute of Grocery distribution. Kotas R. and Davis, B. (1981) Food and beverage control, Glasgow, International textbook co. Morley, A., Morgan, S. & Morgan K. (2008) The missing middle of the local food infrastructure, Brass centre, Cardiff University retrieved from :http://www.brass.cf.ac.uk/uploads/Food_HubKM0908.pdf Kraljic P. 1983) Purchasing must become supply management, Harvard business review, Sept- Oct. 109-117. Oxford Economics report (2010) Economic contribution of the hospitality industry, Report prepared by Oxford economics for the British Hospitality Association. Retrieved from www.bha.org.uk/.../2010/.../BHA-Economic-Contribution-of-UK- Peteraf, M.A. (1993) the cornerstones of competitive advantage: a resource- based view, Strategic Management Journal, 14, 179-191. Porter, M. (1980) Competitive strategy, New York Free Press. Porter, M.E. (1985) Competitive Advantage, New York,. Free Press. Ryan, C. (1980) An introduction to Hotel and catering economics, Surrey, Stanley Thornes. Shaw S. A., Gibbs, J & Gray V. (1994) The Strathclyde wholesale markets study, Main report, University of Strathclyde, October 1994. Technomic (2010). Technomic top 100 chains report, Technomic retrieved from : .http://www.technomic.com/Reports_and_Newsletters/Industry_Reports/ Watson, G., Lonsdale, C., Cox, A. and Chicksand, D. (2003). Effective Demand Management inthe NHS, 12th International IPSERA Conference, Budapest, pp. 1113-1125. Whita, P. Walters, P. Davies, H. (2007). Global strategies in the international hotel industry, International Journal of Hospitality Management, Volume 26, Issue 4, December 2007, Pages 777-792. Yip, G (1992)Total Global Strategy: Managing for Worldwide Competitive Advantage, New Jersey, Prentice Hall.
From Cradle-to-Cradle: Food Sourcing and Attitudes of Restaurants to Sustainable Developments
The Cases of the Caribbean, USA, Switzerland and Wales
Working Paper
Dr Ian Jenkins, Professor Robert Bristow, Ralph Cervera
STAR (Swiss Tourism Applied Research), LRG-University of Applied Sciences, Switzerland
&
Westfield State University, Massachusetts, USA
KEYWORDS: Restaurants, GSTC, Sustainability, Quantitative Study
Preamble
This study aims to investigate how restaurants are addressing sustainability. Restaurants are at the forefront of tourism and an integral part of tourism systems and businesses (Davis et al. 2008); therefore it was considered that food outlets would have specific opinions and views on sustainable development. However, it is clear that sustainability and its definitions are not always cohesively understood or for that matter delivered by businesses in the tourism industry (Hall & Lew, 1998). This study has an international focus, sampling restaurants in the USA, Caribbean, Switzerland and UK. It has been divided into a number of project stages and is a co-operation between two universities.
The initiative for this study came from previous research using the Global Sustainability Tourism Criteria (GSTC 2009) for evaluating how tourism businesses were applying sustainable measures. The GSTC criteria have been used by this study to evaluate the attitudes of restaurants to sustainable development.
Literature Review
Sustainability has been on the political agenda for quite some time (Hall & Lew, 1998) and perhaps the Rio Summit of 1992, really highlighted its importance and relevance for many organisations, especially tourism. Academia has a plethora of texts relating to this subject, to the extent that one could assume that sustainability is now a commonly understood and accepted concept. This presumption is clearly untrue and possibly a more pessimistic viewpoint would be more realistic, especially in terms of the assimilation of sustainability principles in tourism and other sectors of business (Jackson 2009). Certainly, the ‘Green Movement’ has been around for quite some time (since the 1970s) but its incorporation into main stream business seems not so acceptable, even though certain companies do now appear to be adopting sustainable principles, for example Marks & Spencer and Virgin (Marks & Spenser 2011; Jackson 2009,).
How food is produced and the sourcing of food has been in the media spotlight for some time, nearly always raising concerns over issues related to sustainability and health. The ‘Foot and Mouth’ crisis of 2001, and the BSE crisis in the UK, certainly focused customers’ attention upon food sources. This has been underpinned by ’green food movements’ such as the Soil Association and Fair Trade labels (FairTrade 2011), which indicate to the consumer various aspects of sustainability. Certainly, the FairTrade symbol relates to one of the pillars of sustainability, that of employment; indeed the success of the FairTrade label can be seen through its proliferation within the supermarkets of developed countries.
“Fairtrade is a strategy for poverty alleviation and sustainable development. Its purpose is to create opportunities for producers and workers who have been economically disadvantaged or marginalized by the conventional trading system. If fair access to markets under better trade conditions would help them to overcome barriers to development, they can join Fairtrade.” (FairTrade 2011)
Fair Trade has been in operation for over 20 years, being first introduced in 1988 and fully recognized by 1992.
Furthermore, we now have the organic food movement whose products have become mainstream and commercialised and can be found on the shelves of most major supermarkets (Fasman, 2012; Southan 2011; Davis et al. 2008) Hence it can be surmised that there is clear evidence that consumers are becoming better educated and more aware of where their food comes from (Francis 2008) . Similar to Fair Trade, the Soil Association (UK) aims to address more environmental matters dealing with the production of food (Soil Association 2011). The Association states: ‘The Soil Association was founded in 1946 by a group of farmers, scientists and nutritionists who observed a direct connection between farming practice and plant, animal, human and environmental health’ (Soil Association 2011). This statement seems to confirm the longevity of sustainability agendas, decades before the media and globalization latched on to its principles.
Certain countries have always been concerned with where their food is sourced, so to some extent the debate about sustainable restaurants and food sources seems rather a paradox at the present moment. One could certainly cite perhaps France and Italy as countries that take their food seriously and therefore their consumers seem to be fully aware of what constitutes good food, commensurate with the notion of sustainability.
Restaurants can be seen as thermostats for sustainability, reflecting the public’s response to the sustainability agenda (Francis 2008,). Much is talked about the need for sustainability, but talking to some tourism actors, evidence emerges that perhaps the consumer is not really that interested in food sustainability or sustainability per se. Perhaps in the developing world in particular this is seen as a luxury. If you are living on or below the poverty line sustainability is hardly something you are going to be concerned about. Rather it is a pleasant, cosy concept which developed nations and their consumers can afford to debate.
In this paper the definition of sustainability is taken from the Brundtland Report (WCED 1987). This does not appear to conflict with the GSTC criteria (GSTC 2009); rather, the GSTC seems to reinforce this statement. Perhaps the biggest change since the principle of sustainability was developed has been the incorporation of the 4th pillar of sustainability: culture. It is hypothesised that culture is clearly an important element in restaurants and food sourcing. For this study, the main focus has been environmental and economic, and perhaps for many people when sustainability is mentioned, the idea of social and cultural sustainability is a little oblique. Not surprisingly sustainability has emerged from an environmental agenda rather than a social and cultural one. Nonetheless, the linkage between restaurant sustainability and the environment is not too hard to make. Food is the basis of restaurants and food production is linked to land use which impacts on the environment (Boucher 2012; Fasman 2012 ). This can be considered to be an equally significant impact as those pertaining to other tourism impacts, such as transport, waste disposal and water usage. GSTC
As discussed in the above the research was based on the Global Sustainability Criteria Partnership (GSTC 2009), which have recently been drawn up signifying a unified approach to assessment for tourism business and actors. The basis of this proposal relates to the way the Criteria have been constructed and also linked to the importance of UNWTO. The following points are the rationale for using the GSTC in this research:
GSTC clearly has a global reputation which many other criteria do not have based upon the following premises:
• Developed using private companies and validated by tourism agencies
• Summarized to 7 general sustainability segments from 60 identifiable outcomes
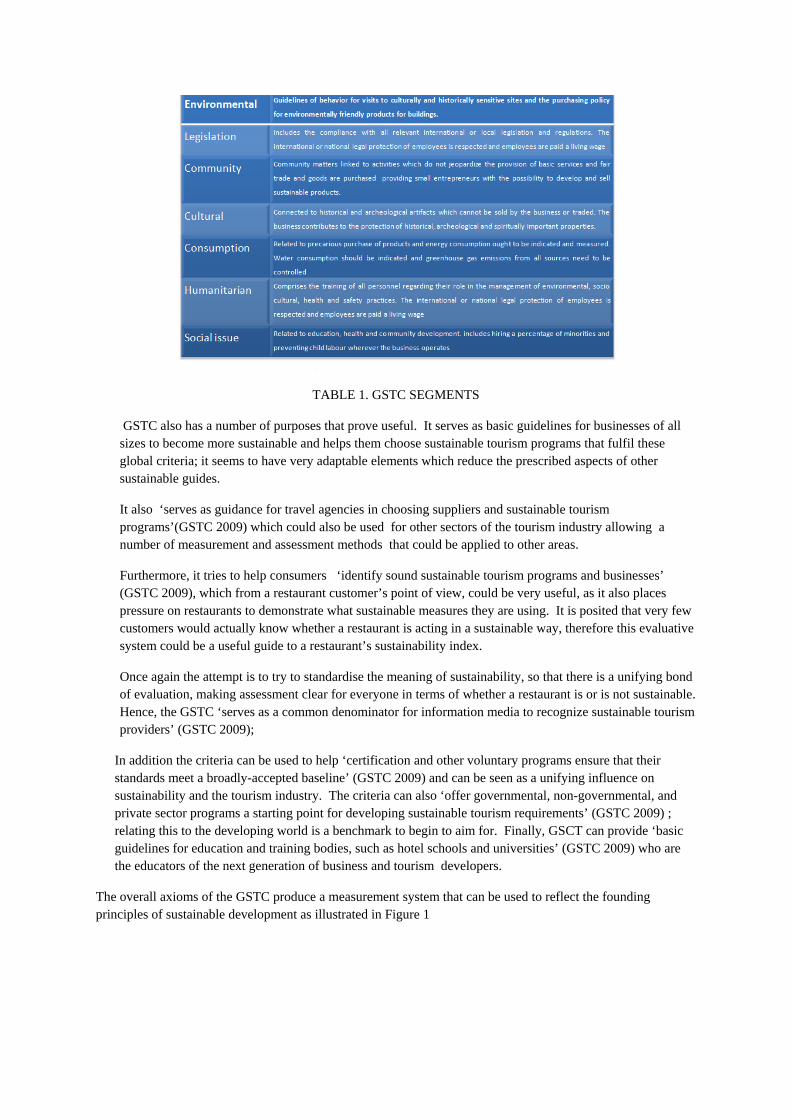
TABLE 1. GSTC SEGMENTS
GSTC also has a number of purposes that prove useful. It serves as basic guidelines for businesses of all sizes to become more sustainable and helps them choose sustainable tourism programs that fulfil these global criteria; it seems to have very adaptable elements which reduce the prescribed aspects of other sustainable guides.
It also ‘serves as guidance for travel agencies in choosing suppliers and sustainable tourism programs’(GSTC 2009) which could also be used for other sectors of the tourism industry allowing a number of measurement and assessment methods that could be applied to other areas.
Furthermore, it tries to help consumers ‘identify sound sustainable tourism programs and businesses’ (GSTC 2009), which from a restaurant customer’s point of view, could be very useful, as it also places pressure on restaurants to demonstrate what sustainable measures they are using. It is posited that very few customers would actually know whether a restaurant is acting in a sustainable way, therefore this evaluative system could be a useful guide to a restaurant’s sustainability index.
Once again the attempt is to try to standardise the meaning of sustainability, so that there is a unifying bond of evaluation, making assessment clear for everyone in terms of whether a restaurant is or is not sustainable. Hence, the GSTC ‘serves as a common denominator for information media to recognize sustainable tourism providers’ (GSTC 2009);
In addition the criteria can be used to help ‘certification and other voluntary programs ensure that their standards meet a broadly-accepted baseline’ (GSTC 2009) and can be seen as a unifying influence on sustainability and the tourism industry. The criteria can also ‘offer governmental, non-governmental, and private sector programs a starting point for developing sustainable tourism requirements’ (GSTC 2009) ; relating this to the developing world is a benchmark to begin to aim for. Finally, GSCT can provide ‘basic guidelines for education and training bodies, such as hotel schools and universities’ (GSTC 2009) who are the educators of the next generation of business and tourism developers.
The overall axioms of the GSTC produce a measurement system that can be used to reflect the founding principles of sustainable development as illustrated in Figure 1
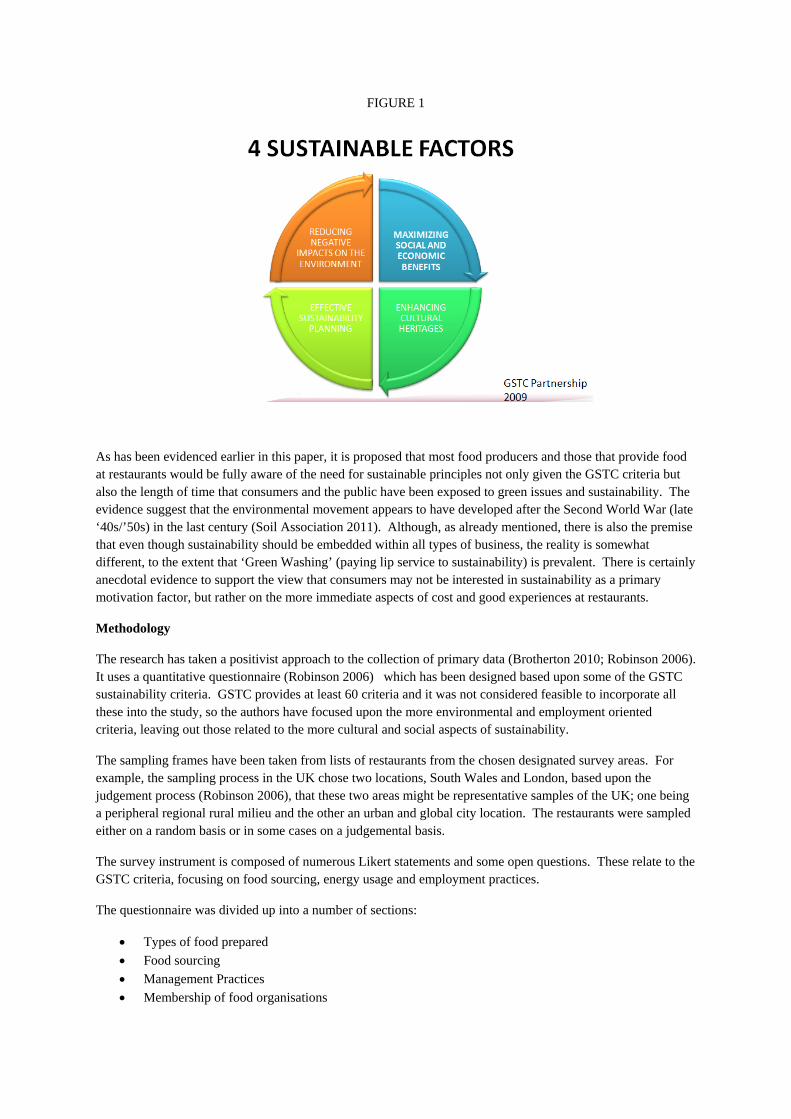
FIGURE 1
As has been evidenced earlier in this paper, it is proposed that most food producers and those that provide food at restaurants would be fully aware of the need for sustainable principles not only given the GSTC criteria but also the length of time that consumers and the public have been exposed to green issues and sustainability. The evidence suggest that the environmental movement appears to have developed after the Second World War (late ‘40s/’50s) in the last century (Soil Association 2011). Although, as already mentioned, there is also the premise that even though sustainability should be embedded within all types of business, the reality is somewhat different, to the extent that ‘Green Washing’ (paying lip service to sustainability) is prevalent. There is certainly anecdotal evidence to support the view that consumers may not be interested in sustainability as a primary motivation factor, but rather on the more immediate aspects of cost and good experiences at restaurants.
Methodology
The research has taken a positivist approach to the collection of primary data (Brotherton 2010; Robinson 2006). It uses a quantitative questionnaire (Robinson 2006) which has been designed based upon some of the GSTC sustainability criteria. GSTC provides at least 60 criteria and it was not considered feasible to incorporate all these into the study, so the authors have focused upon the more environmental and employment oriented criteria, leaving out those related to the more cultural and social aspects of sustainability.
The sampling frames have been taken from lists of restaurants from the chosen designated survey areas. For example, the sampling process in the UK chose two locations, South Wales and London, based upon the judgement process (Robinson 2006), that these two areas might be representative samples of the UK; one being a peripheral regional rural milieu and the other an urban and global city location. The restaurants were sampled either on a random basis or in some cases on a judgemental basis.
The survey instrument is composed of numerous Likert statements and some open questions. These relate to the GSTC criteria, focusing on food sourcing, energy usage and employment practices.
The questionnaire was divided up into a number of sections:
Types of food prepared
Food sourcing
Management Practices
Membership of food organisations
The survey instrument (Robinson 2006), was produced in a number of formats, initially a web based Survey Monkey questionnaire, but this was found to yield a low response rate, so that a hard copy was used and physically distributed to restaurants. The targeting of the restaurants was done by individual visits with a letter and website link and was found to produce a high response rate. The next approach was to personally deliver the questionnaire and provide a stamped addressed envelope . In some cases a return visit was made to collect the questionnaire. Currently, the average response rate stands at around 30%.
The Swiss and UK surveys are still on-going and the response rate here is somewhat mixed, with rural locations responding better than urban locations. The Caribbean was the first stage of the research and this has now been collected and analysed revealing some initial findings which are shown below.
During the summer of 2011, restaurants in the Turks and Caicos were asked to participate in a sustainable tourism survey. The survey was designed to collect general information about the business, identify sources of food served to their customers, the importance of specialty foods in their menus and then an assessment of sustainable management practices. In the fall, the survey was administered to another sample of restaurants in the Pioneer Valley region of Massachusetts, USA.
The sustainable management practices were adopted from the Global Sustainable Tourism Criteria as prepared in 2009. The GSTC has recently been improved (February 2012) to address the different concerns of destinations in general, to those of hotel and tour operators in particular. Despite the change in administering the Criteria, our questions on sustainability still remain in the GSTC under the sections devoted to “Maximize benefits to the environment and minimize negative impacts” (nine Criteria explored) and “Maximize social and economic benefits to the local community and minimize negative impacts” (one Criteria).
Data for this study come from a questionnaire administered to a sample of restaurants in both locations. The survey was designed to collect general information about the restaurant including type of cuisine offered, sources of food and concludes with a few questions about sustainable management practices. Excluded from the sample were chain and fast food restaurants. A total of 53 restaurants participated in the study, with 12 refusals (check this). Turks and Caicos Islands restaurant population was determined from phone books, websites and travel documents and then randomly selected. Pioneer Valley restaurants were randomly selected from telephone directories in Hampshire and Hampden Counties, Massachusetts. A 25% response rate in TCI and 20% rate for the region in the States were obtained.
The data has been analysed using SPSS in order to produce descriptive and inferential statistics which have been used to differentiate the data and review initial trends.
Analysis
Restaurant Sustainability, Data and Results
A variety of restaurants was surveyed and range from 15 to 150 seats with an average of 75 seats and 12 full time staff. Also, a variety of cuisines was offered with the most common being American (52.8%), Caribbean (28.3%), Italian (28.3%) Seafood (24.5%) and Vegetarian (24.5%). A few restaurants noted Asian, BBQ, Cajun, Steak and other items on their menu. Note, since most offered more than one type of food, the percentages reflect that overlap. Table 1 summarizes the main offerings.
Table 1. Cuisine offered in Sustainable Restaurant Study.
Cuisine N Percent
American 28 52.8
Caribbean 15 28.3
Healthy 5 9.4
International 5 9.4
Italian 15 28.3
Jamaican 5 9.4
Seafood 13 24.5
Vegetarian 13 24.5
The next section of the survey solicited information about the sources of food offered on the menu. Local was defined as the total travel distance from producer to restaurant and was less than 2 hours transport time. On a 1 to 5 scale with 1 being all food of this type local, 2 most of the food is local, 3 some of the food is local, to 4 where none of the food is local. For the entire sample baked goods tended to be locally sourced with most of the food being local (mean equal 2.07, while some meats and poultry were found to be locally sourced (mean equal 3.01 each). Table 2 summarizes the sources of food for the island and mainland sample.
Table 2. Sources of food in sample.
Food offered on Menu N Mean SD
Meats 51 3.0196 1.08610
Poultry 51 3.0196 1.14000
Seafood 51 2.5294 1.34689
Dairy 51 2.9020 1.20424
Produce 51 2.4706 1.00703
Baked Goods 52 2.0769 1.36979
Beverages 51 2.8235 1.12616 Note: 1 = all local, 2 = most local, 3 = some local, 4 = none is local.
Consumers desire particular characteristics in their food. Besides vegetarian, gluten free and vegan menus, customers want organic food, range free chickens and eggs, grass fed beef and so on. Managers are sensitive to these requests but also desire high quality, reasonably priced food that is readily available and uniform in size, shape and color. Table 4 highlights the importance of these items on a five point scale, with 1 being most important, and 5 being not very important. The means and standard deviations are provided.
Table 3 Importance of Food Production and Characteristics.
Food Production Concerns N Mean SD
Organic 52 2.7115 1.07259
Chemical free 50 2.4800 1.09246
Integrated Pest Management 51 2.5686 1.08176
Grass-fed 50 2.9200 0.85332
Free range 50 2.8600 0.90373
GMO free 49 2.7755 1.06586
Fish sourced from certified sustainable stocks 50 2.4000 1.06904
Price 52 1.5962 0.79852
Uniformity 51 1.6863 0.73458
Availability 51 1.4510 0.61037
Quality 51 1.1373 0.40098 Note: 1 = very important, 5 = not very important.
As might be expected quality, price, availability and uniformity were most important to restaurant managers. Next in order of importance was fish sourced from certifiable stocks, chemical free, IPM, organic, GMO free, free range, and then grass-fed. Also note the standard deviation, or the variation of responses tended to be the least for price, uniformity, availability and quality indicating the overall and consistent importance to the managers.
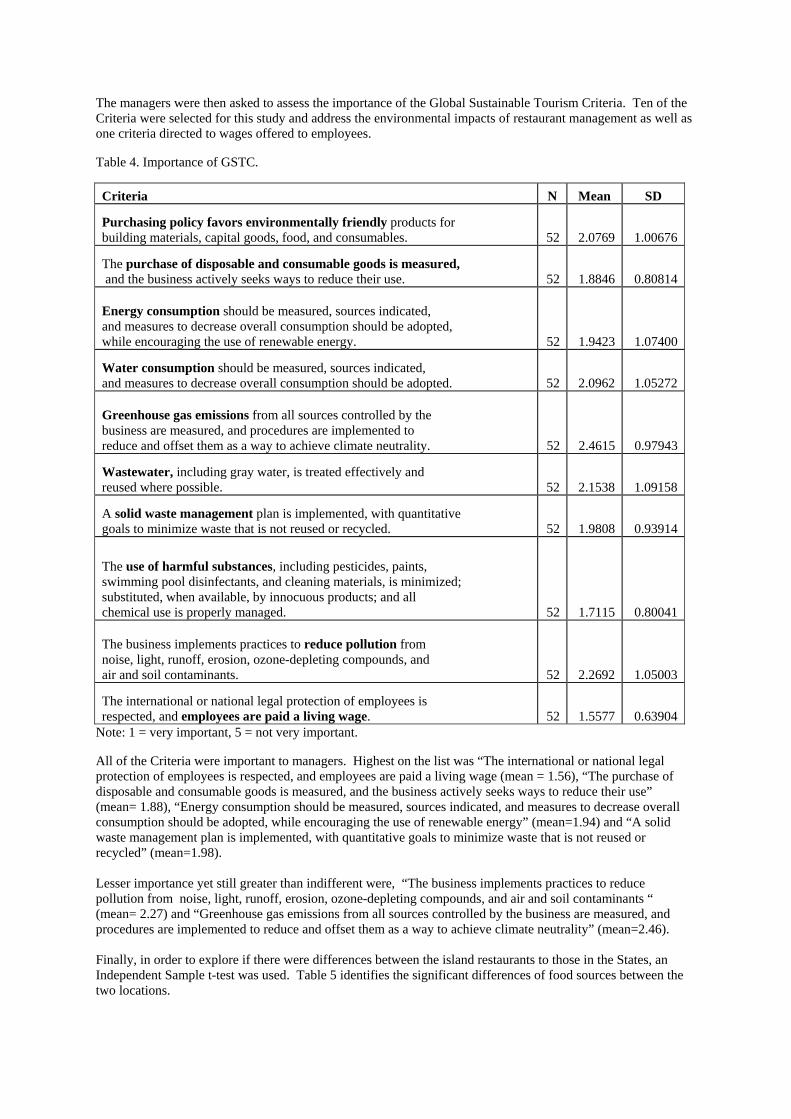
The managers were then asked to assess the importance of the Global Sustainable Tourism Criteria. Ten of the Criteria were selected for this study and address the environmental impacts of restaurant management as well as one criteria directed to wages offered to employees.
Table 4. Importance of GSTC.
Criteria N Mean SD
Purchasing policy favors environmentally friendly products for building materials, capital goods, food, and consumables. 52 2.0769 1.00676
The purchase of disposable and consumable goods is measured, and the business actively seeks ways to reduce their use. 52 1.8846 0.80814
Energy consumption should be measured, sources indicated, and measures to decrease overall consumption should be adopted, while encouraging the use of renewable energy. 52 1.9423 1.07400
Water consumption should be measured, sources indicated, and measures to decrease overall consumption should be adopted. 52 2.0962 1.05272
Greenhouse gas emissions from all sources controlled by the business are measured, and procedures are implemented to reduce and offset them as a way to achieve climate neutrality. 52 2.4615 0.97943
Wastewater, including gray water, is treated effectively and reused where possible. 52 2.1538 1.09158
A solid waste management plan is implemented, with quantitative goals to minimize waste that is not reused or recycled. 52 1.9808 0.93914
The use of harmful substances, including pesticides, paints, swimming pool disinfectants, and cleaning materials, is minimized; substituted, when available, by innocuous products; and all chemical use is properly managed. 52 1.7115 0.80041
The business implements practices to reduce pollution from noise, light, runoff, erosion, ozone-depleting compounds, and air and soil contaminants. 52 2.2692 1.05003
The international or national legal protection of employees is respected, and employees are paid a living wage. 52 1.5577 0.63904
Note: 1 = very important, 5 = not very important.
All of the Criteria were important to managers. Highest on the list was “The international or national legal protection of employees is respected, and employees are paid a living wage (mean = 1.56), “The purchase of disposable and consumable goods is measured, and the business actively seeks ways to reduce their use” (mean= 1.88), “Energy consumption should be measured, sources indicated, and measures to decrease overall consumption should be adopted, while encouraging the use of renewable energy” (mean=1.94) and “A solid waste management plan is implemented, with quantitative goals to minimize waste that is not reused or recycled” (mean=1.98). Lesser importance yet still greater than indifferent were, “The business implements practices to reduce pollution from noise, light, runoff, erosion, ozone-depleting compounds, and air and soil contaminants “ (mean= 2.27) and “Greenhouse gas emissions from all sources controlled by the business are measured, and procedures are implemented to reduce and offset them as a way to achieve climate neutrality” (mean=2.46). Finally, in order to explore if there were differences between the island restaurants to those in the States, an Independent Sample t-test was used. Table 5 identifies the significant differences of food sources between the two locations.
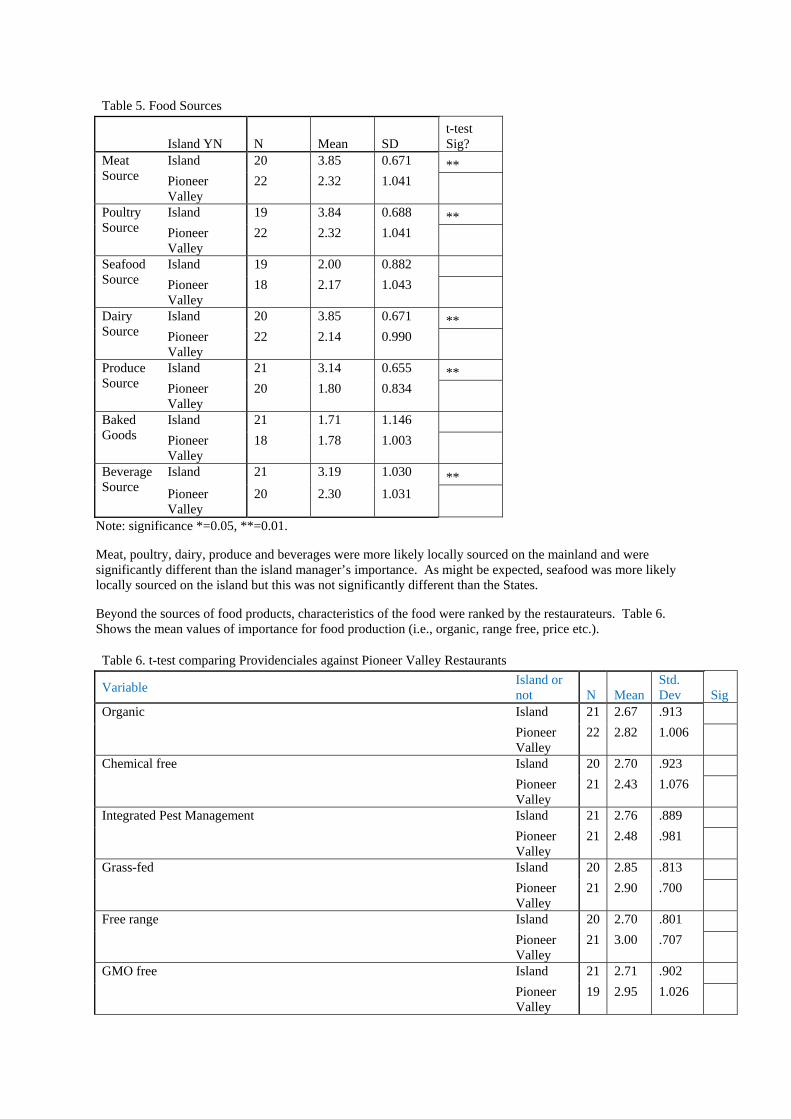
Table 5. Food Sources
Island YN N Mean SD
t-test Sig?
Meat Source
Island 20 3.85 0.671 ** Pioneer Valley
22 2.32 1.041
Poultry Source
Island 19 3.84 0.688 ** Pioneer Valley
22 2.32 1.041
Seafood Source
Island 19 2.00 0.882 Pioneer Valley
18 2.17 1.043
Dairy Source
Island 20 3.85 0.671 ** Pioneer Valley
22 2.14 0.990
Produce Source
Island 21 3.14 0.655 ** Pioneer Valley
20 1.80 0.834
Baked Goods
Island 21 1.71 1.146 Pioneer Valley
18 1.78 1.003
Beverage Source
Island 21 3.19 1.030 ** Pioneer Valley
20 2.30 1.031
Note: significance *=0.05, **=0.01.
Meat, poultry, dairy, produce and beverages were more likely locally sourced on the mainland and were significantly different than the island manager’s importance. As might be expected, seafood was more likely locally sourced on the island but this was not significantly different than the States.
Beyond the sources of food products, characteristics of the food were ranked by the restaurateurs. Table 6. Shows the mean values of importance for food production (i.e., organic, range free, price etc.).
Table 6. t-test comparing Providenciales against Pioneer Valley Restaurants
Variable Island or not N Mean
Std. Dev Sig
Organic Island 21 2.67 .913 Pioneer Valley
22 2.82 1.006
Chemical free Island 20 2.70 .923 Pioneer Valley
21 2.43 1.076
Integrated Pest Management Island 21 2.76 .889 Pioneer Valley
21 2.48 .981
Grass-fed Island 20 2.85 .813 Pioneer Valley
21 2.90 .700
Free range Island 20 2.70 .801 Pioneer Valley
21 3.00 .707
GMO free Island 21 2.71 .902 Pioneer Valley
19 2.95 1.026
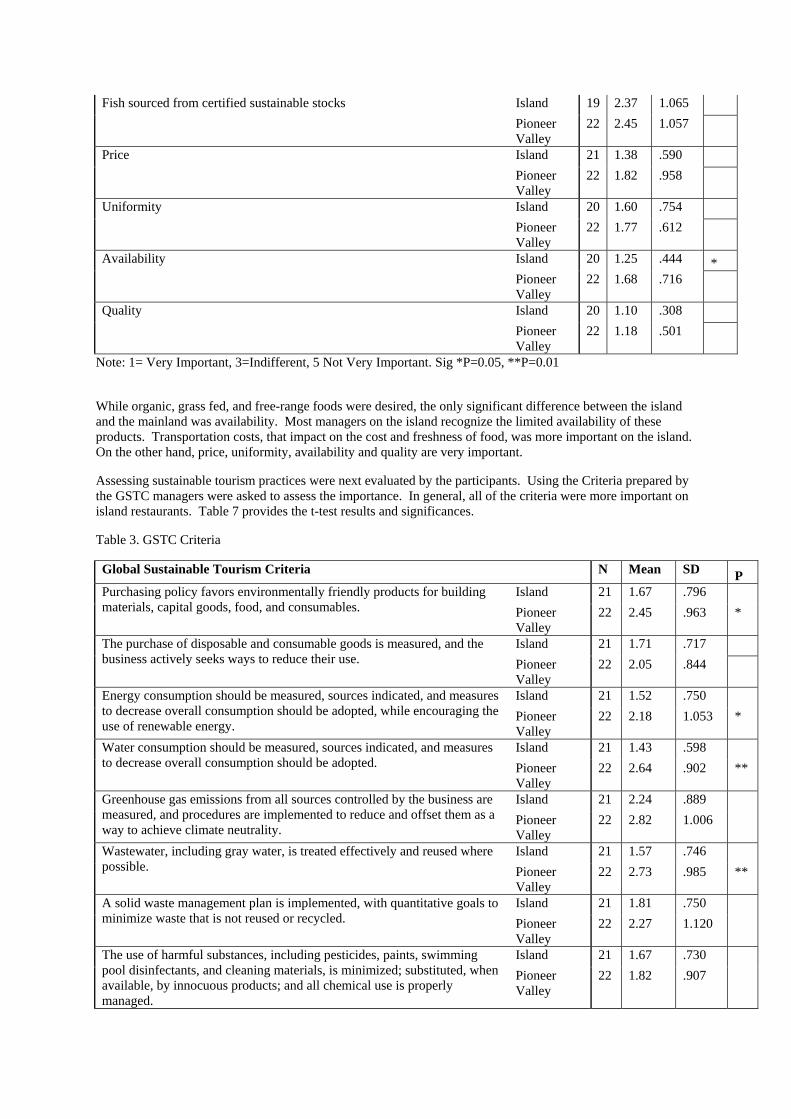
Fish sourced from certified sustainable stocks Island 19 2.37 1.065 Pioneer Valley
22 2.45 1.057
Price Island 21 1.38 .590 Pioneer Valley
22 1.82 .958
Uniformity Island 20 1.60 .754 Pioneer Valley
22 1.77 .612
Availability Island 20 1.25 .444 * Pioneer Valley
22 1.68 .716
Quality Island 20 1.10 .308 Pioneer Valley
22 1.18 .501
Note: 1= Very Important, 3=Indifferent, 5 Not Very Important. Sig *P=0.05, **P=0.01
While organic, grass fed, and free-range foods were desired, the only significant difference between the island and the mainland was availability. Most managers on the island recognize the limited availability of these products. Transportation costs, that impact on the cost and freshness of food, was more important on the island. On the other hand, price, uniformity, availability and quality are very important.
Assessing sustainable tourism practices were next evaluated by the participants. Using the Criteria prepared by the GSTC managers were asked to assess the importance. In general, all of the criteria were more important on island restaurants. Table 7 provides the t-test results and significances.
Table 3. GSTC Criteria
Global Sustainable Tourism Criteria N Mean SD P Purchasing policy favors environmentally friendly products for building materials, capital goods, food, and consumables.
Island 21 1.67 .796
*
Pioneer Valley
22 2.45 .963
The purchase of disposable and consumable goods is measured, and the business actively seeks ways to reduce their use.
Island 21 1.71 .717 Pioneer Valley
22 2.05 .844
Energy consumption should be measured, sources indicated, and measures to decrease overall consumption should be adopted, while encouraging the use of renewable energy.
Island 21 1.52 .750
*
Pioneer Valley
22 2.18 1.053
Water consumption should be measured, sources indicated, and measures to decrease overall consumption should be adopted.
Island 21 1.43 .598
**
Pioneer Valley
22 2.64 .902
Greenhouse gas emissions from all sources controlled by the business are measured, and procedures are implemented to reduce and offset them as a way to achieve climate neutrality.
Island 21 2.24 .889
Pioneer Valley
22 2.82 1.006
Wastewater, including gray water, is treated effectively and reused where possible.
Island 21 1.57 .746
**
Pioneer Valley
22 2.73 .985
A solid waste management plan is implemented, with quantitative goals to minimize waste that is not reused or recycled.
Island 21 1.81 .750
Pioneer Valley
22 2.27 1.120
The use of harmful substances, including pesticides, paints, swimming pool disinfectants, and cleaning materials, is minimized; substituted, when available, by innocuous products; and all chemical use is properly managed.
Island 21 1.67 .730
Pioneer Valley
22 1.82 .907
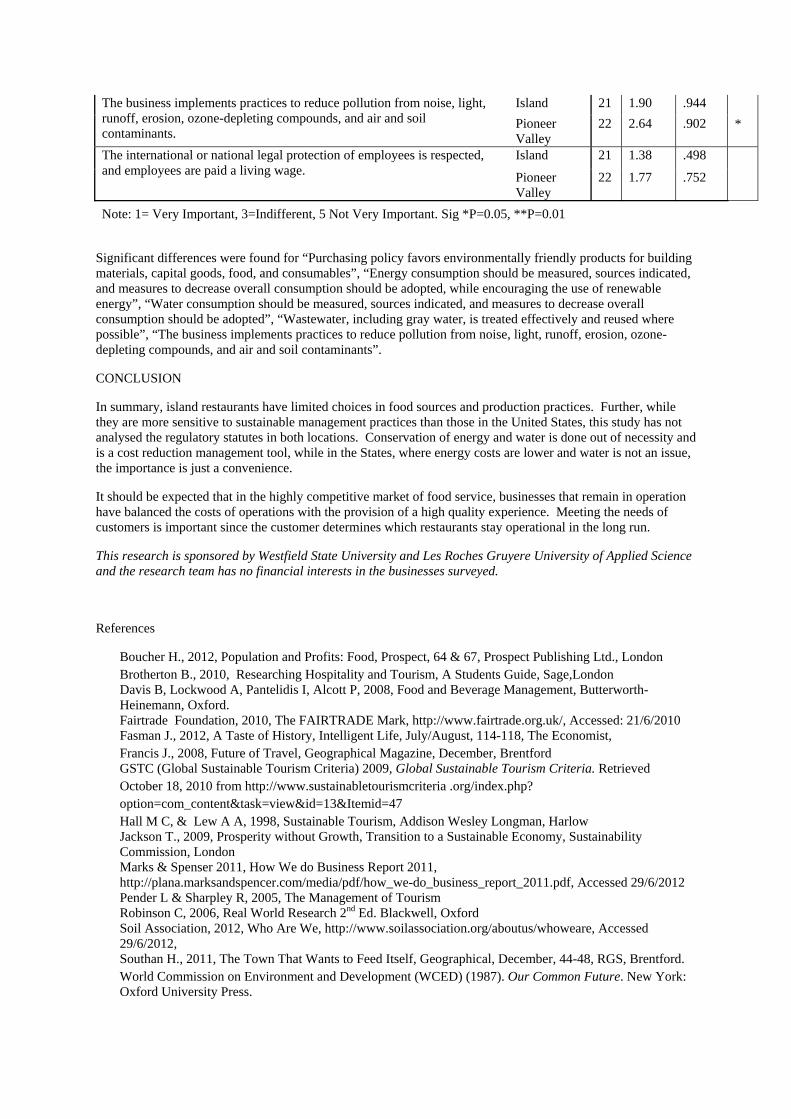
The business implements practices to reduce pollution from noise, light, runoff, erosion, ozone-depleting compounds, and air and soil contaminants.
Island 21 1.90 .944
*
Pioneer Valley
22 2.64 .902
The international or national legal protection of employees is respected, and employees are paid a living wage.
Island 21 1.38 .498
Pioneer Valley
22 1.77 .752
Note: 1= Very Important, 3=Indifferent, 5 Not Very Important. Sig *P=0.05, **P=0.01
Significant differences were found for “Purchasing policy favors environmentally friendly products for building materials, capital goods, food, and consumables”, “Energy consumption should be measured, sources indicated, and measures to decrease overall consumption should be adopted, while encouraging the use of renewable energy”, “Water consumption should be measured, sources indicated, and measures to decrease overall consumption should be adopted”, “Wastewater, including gray water, is treated effectively and reused where possible”, “The business implements practices to reduce pollution from noise, light, runoff, erosion, ozone-depleting compounds, and air and soil contaminants”.
CONCLUSION
In summary, island restaurants have limited choices in food sources and production practices. Further, while they are more sensitive to sustainable management practices than those in the United States, this study has not analysed the regulatory statutes in both locations. Conservation of energy and water is done out of necessity and is a cost reduction management tool, while in the States, where energy costs are lower and water is not an issue, the importance is just a convenience.
It should be expected that in the highly competitive market of food service, businesses that remain in operation have balanced the costs of operations with the provision of a high quality experience. Meeting the needs of customers is important since the customer determines which restaurants stay operational in the long run.
This research is sponsored by Westfield State University and Les Roches Gruyere University of Applied Science and the research team has no financial interests in the businesses surveyed.
References
Boucher H., 2012, Population and Profits: Food, Prospect, 64 & 67, Prospect Publishing Ltd., London Brotherton B., 2010, Researching Hospitality and Tourism, A Students Guide, Sage,London Davis B, Lockwood A, Pantelidis I, Alcott P, 2008, Food and Beverage Management, Butterworth-Heinemann, Oxford. Fairtrade Foundation, 2010, The FAIRTRADE Mark, http://www.fairtrade.org.uk/, Accessed: 21/6/2010 Fasman J., 2012, A Taste of History, Intelligent Life, July/August, 114-118, The Economist, Francis J., 2008, Future of Travel, Geographical Magazine, December, Brentford GSTC (Global Sustainable Tourism Criteria) 2009, Global Sustainable Tourism Criteria. Retrieved October 18, 2010 from http://www.sustainabletourismcriteria .org/index.php? option=com_content&task=view&id=13&Itemid=47 Hall M C, & Lew A A, 1998, Sustainable Tourism, Addison Wesley Longman, Harlow Jackson T., 2009, Prosperity without Growth, Transition to a Sustainable Economy, Sustainability Commission, London Marks & Spenser 2011, How We do Business Report 2011, http://plana.marksandspencer.com/media/pdf/how_we-do_business_report_2011.pdf, Accessed 29/6/2012 Pender L & Sharpley R, 2005, The Management of Tourism Robinson C, 2006, Real World Research 2nd Ed. Blackwell, Oxford Soil Association, 2012, Who Are We, http://www.soilassociation.org/aboutus/whoweare, Accessed 29/6/2012, Southan H., 2011, The Town That Wants to Feed Itself, Geographical, December, 44-48, RGS, Brentford. World Commission on Environment and Development (WCED) (1987). Our Common Future. New York: Oxford University Press.
The Relationship between the Use of Technology & Service Operations Management Tools and Hotel Profitability & Customer Satisfaction
Karolin Kokaz Pucciani* Ecole hôtelière de Lausanne
Lausanne, Switzerland Email: [email protected]
and Jean Hurpé
Swissôtel Nankai Osaka
ABSTRACT
The aim of this paper is to study the current trends concerning technological & service operations management tools used in the hospitality industry; and to investigate the relationship between the use these tools and profitability & customer satisfaction of hotels. The chosen population for this study is the Rooms Division of 4 star hotels around the world, as they are the most likely candidates to use these tools. The chosen methodology is an online questionnaire developed by using the MrInterview suite of SPSS statistical software, which was completed by 101 hotels in 50 different countries. The top 3 most used tools were: for IT – website, PMS, and GDS; for operations management tools – forecasting, statistics, and quality management. Hotels’ perception is that the use of operations management & IT tools improves their profitability and customer satisfaction (60 to 66% believe so). Statistical analysis including box plots, means plots, chi-squared tests, ANOVA, and cluster analysis are used to find statistically significant relationships: results are that hotels that use more IT tools have higher occupancy levels, and hotels that use more operations management tools have a greater participation in customer satisfaction surveys. Training and updates to these tools are found to be necessary factors as well.
Keywords: Technology, Operations Management, Hotel Occupancy Rates, Customer Satisfaction
INTRODUCTION
This research was initiated in 2010 when the economic crisis was jeopardizing hotel revenues. It was essential for hotels to find ways of improving their profitability and customer satisfaction by the use of technological (IT) and service operations management (SOM) tools which have already been used for long in the manufacturing industry to increase productivity and profitability. There is little research on the use of these tools in hotels and limited indication that hotels exploit these tools effectively (Kokaz & Murphy, 2009). However, significant impacts can be achieved on the productivity of the organization through the IT department (McLaughlin, 2007), and using operations management tools can potentially increase profitability, productivity and quality (Kokaz, 2007).
Over time, the hotel industry is beginning to implement more of these IT & SOM tools, however not at a very high speed. About 20 years ago only 11% of hotels were using SOM tools frequently (Witt & Witt, 1989), which in recent surveys, this turns out to be slightly above 30% (Kokaz & Murphy, 2011).
It is difficult to gather information about the use of IT and SOM tools in a hospitality context, as these concepts sometimes are perceived to be too complex by hotel employees and previous efforts in collecting this type of information has proven to be not easy (Kokaz and Murphy, 2009 and 2010). Bigger hotels (by number of rooms and employees) and higher service levels (4 stars and above) are more likely to use these tools, with also having more financial means at their disposal to pay for these expensive tools. The Rooms Department is the core product of the hotel with a large number of tasks. Hence, this research focuses on the Rooms division of 4 star hotels all around the world to get an overview specific to this segment with regards to the studied topic.
Therefore, the main objectives of this study are: - To explore the current use of IT & SOM tools & techniques used in the hospitality industry to identify
trends and the most commonly used tools, - To identify measures for both profitability and customer satisfaction for hotels, - To investigate the relationship between both the use of IT & SOM tools and the profitability & customer
satisfaction of hotels, both from the hotels’ perspective and through in depth statistical analysis.
LITERATURE REVIEW
The following literature review gives the reasons for the chosen target population, details the IT and SOM tools investigated in this study, and explains the chosen hotel profitability and customer satisfaction KPIs to be used in the relationship analysis.
Rooms Division
The chosen population for this study is the Rooms Division of 4 star hotels around the world, as they are the most likely candidates to use the investigated IT & SOM tools (Kokaz and Murphy, 2009). According to Walker (2009), Rooms Division is one of the key departments of a hotel and performs the key functions of the hotel. Not only it is the first point of contact with the guests, during check-in and check-out at the hotel, but also it is the core product a hotel offers. As a result, the Rooms Division should focus all its resources on providing the best service to the customer. Being the core economic and service center within the hotel, Rooms Division is the appropriate section of the hotel to run this study on.
Knowing the sub-departments of the Rooms Division of a hotel is key to anticipating and understanding how IT and SOM tools can create value for the customer and the company. According to Walker (2009), the Rooms Division of a hotel is divided into several sub-departments:
• Front office (check-in and check-out) • Reservations (sales of the rooms, switchboard) • Housekeeping • Concierge • Guest services (uniform service such as bell captain, door attendants, bell persons and guest complaints) • Yield management (the process of controlling rates and occupancy in order to maximize gross room revenue) • Security (providing guest safety and loss prevention)
IT & SOM Tools
The adoption of technology differs based on hotel’s service level (no significant difference has been observed in the number of tools used at lower levels, but higher differences observed above midscale), and as the amount of technology used increases so does the service level (Siguaw, Enz and Namasivayam, 2000). The relationship between the use of IT in upscale hotels and performance has been found to be significant and positive (Sunny et. al. 2005). Customer needs and wants are better met with IT incorporated operations than without, which would be expected to increase customer satisfaction leading to loyalty and increased revenues (Chathoth, 2007). IT tools can enhance service quality, reduce costs, improve productivity, and allow the organization to gain competitive advantage (Kasavana, Knutson & Lee, 2004). These are clear incentives for the hospitality industry to invest in IT tools. Given these indicative positive impacts of IT on performance, the following discussion helps identify the tools to be investigated in this study.
The World Wide Web not only provides all kinds of information to users, but also allows for communicating and exchanging information in real time (Cohen, 2006). Thus, the internet has become a mandatory tool for any company in the 21st century wishing to promote its products. This is especially true in the hospitality industry, where the World Wide Web has become one of the key tools for any hotel to get exposure in the market and hence generate sales. As a result, many third-party internet sites such as Trip Advisor, booking.com and others are also used for increasing room sales.
The main use of IT tools in the Rooms Division seems to be in reservations, as reservation information is the most important determinant of the hotel´s operation and the room rate is the most important attribute of the hotel (Law and Hsu, 2005). It is the information that any guest will consult before deciding to stay at the hotel. A study by Gazzoli, Kim and Palakurthi (2008) showed that internet providers and online reservation systems are the most commonly used tools for providing and consulting room rates day-to-day. Big chains experience more frequent direct reservations over their own corporate websites (81.4%) than indirect reservations over a third-party travel agency (18.6%) (Starkov and Price, 2007).
In addition to reservations, the operations of the Rooms Division use substantial IT tools. As in all organizations, in the hotel industry likewise, there is a fundamental relationship between supply and demand. Especially in the hotel industry, using IT tools enables hotels to answer quickly to customers’ needs. For instance, the Windows operating system supports several programs used in the hotel industry: (1) knowing the number and status of rooms in the hotel (vacant, occupied) through the Property Management System (PMS); (2) helping dispatch the rooms available for customers through Global Distribution System (GDS), Central Reservation System (CRS) and Reservation Management Systems; (3) managing of the property with Energy Management Systems (EMS); (4) making orders to the suppliers through the Enterprise Resource Planning (ERP); (5) knowing the customer through the Customer Relationship Management System (CRM); and finally (6) improving the revenue of the hotel through Revenue Management Systems (RMS). Unfortunately, most of these tools are not used to their full capacity. For example, a study done on data management in hotels using PMS shows the underutilization of the PMS and highlights the main issue to be the need for training (Kokaz & Murphy, 2010).
The most recent trend, which is the increasing use of smart-phone applications by providers such as Apple, may shift the power of hospitality IT tools away from Microsoft and its Windows solutions (Knowledge Factories, 2011). The importance of communication over smart-phone devices in hotels is becoming more and more important in the market of Apps and was reinforced by the launch of the iPad in 2010. Intercontinental Hotel Group decided on the 1st of April 2010 to equip their concierge desks with iPad; and then, on the 21st of December 2010, to offer concierge Apps for their customers (Intercontinental Hotel Group, 2011). By offering this new technology, the hotel group tries to enhance customer satisfaction, which may result in increased hotel performance. Another interesting tool, provided to customers by the Intercontinental Hotel Group, is the use of smart phones as a key to the rooms in its Holiday Inn Express branded properties. These hotels use a system which is entirely adapted to smart phones, an ideal tool for the business segment (Open Ways, 2010).
In summary, the IT tools that are investigated in this study are the following: • Property Management Systems (PMS) • Revenue Management System (RMS) • Global Distribution System (GDS) • Central Reservation System (CRS) • Energy Management Systems (EMS) • Enterprise Resource Planning (ERP) • Customer Relationship Management System (CRM) • Internet web-site • Smart phone application • Smart-card • Smart-phone use as a key for Rooms • Tablet PC
The hotel industry is in some regards lagging even more behind in the implementation of SOM techniques. According to a survey run by Witt and Witt (1989), 76% of hotels seldom or never use SOM tools, 13% used them occasionally and only 11% used them frequently. More recently a moderate increase in the use of these tools is seen, as the tools mature to be transferred into the hotel industry and the hotel employees become more educated. The SOM tools that are investigated in this study are the following: • Statistics (average, median, mode, standard deviation, histograms, etc.) • Probabilities and Probability Distributions • Service Mapping (flowcharts, flow diagrams, blueprints) • Capacity Management (bottleneck analysis) • Graphical tools (scatter plots, line charts, bubble charts, waterfall charts, bar charts, etc.) • Quality Management Tools (flow diagrams, check lists, Pareto charts, statistical process control charts, etc.) • Forecasting (time series, correlations, regressions, simulations, qualitative methods) • Project management tools (work breakdown structure, responsibility charts, Gant charts, critical path method, PERT – project evaluation and review techniques) • Decision making tools (decision trees, decision criteria – expected values, etc.) • Queuing analysis (queuing models with single or multiple servers) • Optimization techniques (linear programs, integer programs, goal programs, etc.) • Inventory management (ABC analysis, economic order quantity models)
Profitability KPIs
Past studies on performance measurement have identified Daily Occupancy Percentage, Average Daily Rate (ADR) and Revenue per Available Room (RevPAR) as the three most used metrics in the hotel industry (Neves and Lourenco, 2009). Another study done in 2005 with hotel general managers has identified Profit Margin, Occupancy Percentage – Month To Date, Cost of Labor Percentage, Daily Occupancy Percentage, Average Daily Rate, Total Revenue Percentage Change From Budget, Cost of Food Sold Percentage, Cost of Beverage Sold Percentage, Room Sales to Total Sales and Operating Efficiency Ratio as the most useful metrics (Schmidgall, 2006).
Occupancy rate is often mentioned as a measure of the profitability in the value chain of the Rooms Division (Jeffery & Barden, 2000). ADR, RevPAR, and occupancy rate together represents three typical measures for hotels; however by themselves they might be insufficient to look beyond day-to-day operations (Enz, Canina & Walsh, 2001).
An additional metric to be used might be the Profit per Available Room (ProfPAR) (Rohlfs, 2003). This has been shown to be a better measurement of hotel performance than RevPAR, as it produces generalized profit figures, which can be compared to other areas of a hotel. Besides, it also shows how successful managers generate income from property operations.
As a result, the following KPIs are deemed to be the most suitable metrics for a Rooms Division manager to collect information about profitability: • Occupancy rate • RevPAR • ProfPAR (income before fixed charges per number of available rooms)
Customer Satisfaction KPIs
Customer satisfaction is the emotional outcome of the comparison between a product’s perceived performance and its expected performance (Kotler, Leong, Ang and Tan, 1996). Therefore, satisfaction is understood as a function of the difference between performance and expectation (Stahl, 1999). This ultimately means that when trying to satisfy customers, hotels need to consider the experience they are providing, as well as the expectations they are generating – a fit between the two needs to be the goal of every hotelier.
Customer Satisfaction is one of the main ingredients to success for hotels on the market place (Weiser, 1995). Long-term customer relationships and repeat-business are the keys to long term business success and customer satisfaction (McColl-Kennedy & Schneider, 2000). Reichheld and Sasser (1990) stipulated that there is a positive relationship between loyalty and profitability.
As customer satisfaction clearly represents a key issue in the hospitality industry and is undergoing massive changes, IT tools and continuous customer contact are important elements in securing the success of a hotel operation (Dwivedi & Venkatsh, 2007). In the hotel industry, Customer Relationship Management (CRM) becomes a strategic imperative for attracting and increasing guests’ patronage. As the hotel industry is facing increasing competition, hoteliers have to differentiate their offer to match the customers’ needs. CRM is viewed as a tool to improve this adaptation and to also improve the communication and relationship with the customers (Sigala, 2005). A study done in the hotel industry in Malaysia analyzing the relationship between performance and CRM strategy showed significant positive relationship between the use of customer performance measures and performance (Kasim and Minai, 2009). They identified the measures on customers which should affect performance as percentage of repeat customers and the ratings from customer surveys (Kasim and Minai, 2009).
Traditionally, the usual measure of customer satisfaction involves a survey with a set of statements using a Likert scale. The participant is asked to evaluate each statement in terms of his or her perception and expectation of performance of the service measured (Kessler, 2003). It is difficult to measure customer satisfaction, because the results obtained are never representative of all hotel guests, due to the voluntary basis and the intervention of employee which might bias the data (Poria, 2004). Besides, service satisfaction might vary according to the customer’s background in terms of culture or other variables (Gilbert and Veloutsou, 2006).
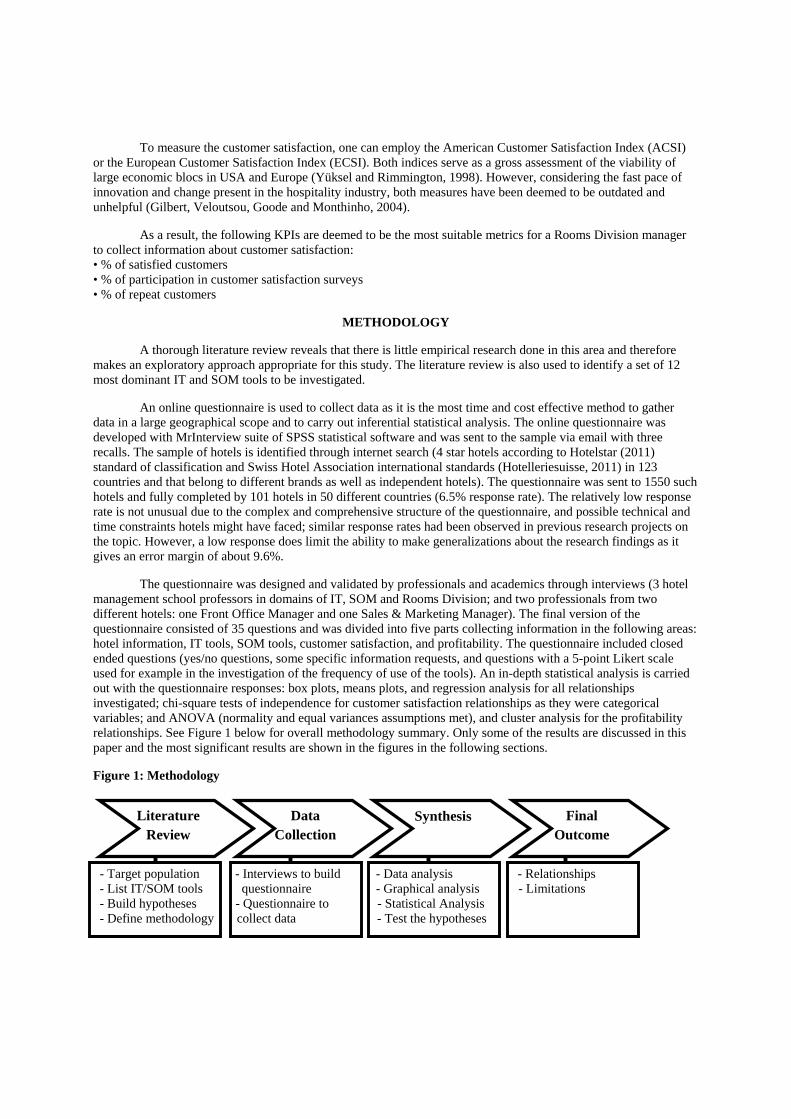
To measure the customer satisfaction, one can employ the American Customer Satisfaction Index (ACSI) or the European Customer Satisfaction Index (ECSI). Both indices serve as a gross assessment of the viability of large economic blocs in USA and Europe (Yüksel and Rimmington, 1998). However, considering the fast pace of innovation and change present in the hospitality industry, both measures have been deemed to be outdated and unhelpful (Gilbert, Veloutsou, Goode and Monthinho, 2004).
As a result, the following KPIs are deemed to be the most suitable metrics for a Rooms Division manager to collect information about customer satisfaction: • % of satisfied customers • % of participation in customer satisfaction surveys • % of repeat customers
METHODOLOGY
A thorough literature review reveals that there is little empirical research done in this area and therefore makes an exploratory approach appropriate for this study. The literature review is also used to identify a set of 12 most dominant IT and SOM tools to be investigated.
An online questionnaire is used to collect data as it is the most time and cost effective method to gather data in a large geographical scope and to carry out inferential statistical analysis. The online questionnaire was developed with MrInterview suite of SPSS statistical software and was sent to the sample via email with three recalls. The sample of hotels is identified through internet search (4 star hotels according to Hotelstar (2011) standard of classification and Swiss Hotel Association international standards (Hotelleriesuisse, 2011) in 123 countries and that belong to different brands as well as independent hotels). The questionnaire was sent to 1550 such hotels and fully completed by 101 hotels in 50 different countries (6.5% response rate). The relatively low response rate is not unusual due to the complex and comprehensive structure of the questionnaire, and possible technical and time constraints hotels might have faced; similar response rates had been observed in previous research projects on the topic. However, a low response does limit the ability to make generalizations about the research findings as it gives an error margin of about 9.6%.
The questionnaire was designed and validated by professionals and academics through interviews (3 hotel management school professors in domains of IT, SOM and Rooms Division; and two professionals from two different hotels: one Front Office Manager and one Sales & Marketing Manager). The final version of the questionnaire consisted of 35 questions and was divided into five parts collecting information in the following areas: hotel information, IT tools, SOM tools, customer satisfaction, and profitability. The questionnaire included closed ended questions (yes/no questions, some specific information requests, and questions with a 5-point Likert scale used for example in the investigation of the frequency of use of the tools). An in-depth statistical analysis is carried out with the questionnaire responses: box plots, means plots, and regression analysis for all relationships investigated; chi-square tests of independence for customer satisfaction relationships as they were categorical variables; and ANOVA (normality and equal variances assumptions met), and cluster analysis for the profitability relationships. See Figure 1 below for overall methodology summary. Only some of the results are discussed in this paper and the most significant results are shown in the figures in the following sections.
Figure 1: Methodology
- Target population - Interviews to build - Data analysis - Relationships - List IT/SOM tools questionnaire - Graphical analysis - Limitations - Build hypotheses - Questionnaire to - Statistical Analysis - Define methodology collect data - Test the hypotheses
Literature Review
Data Collection
Synthesis Final Outcome
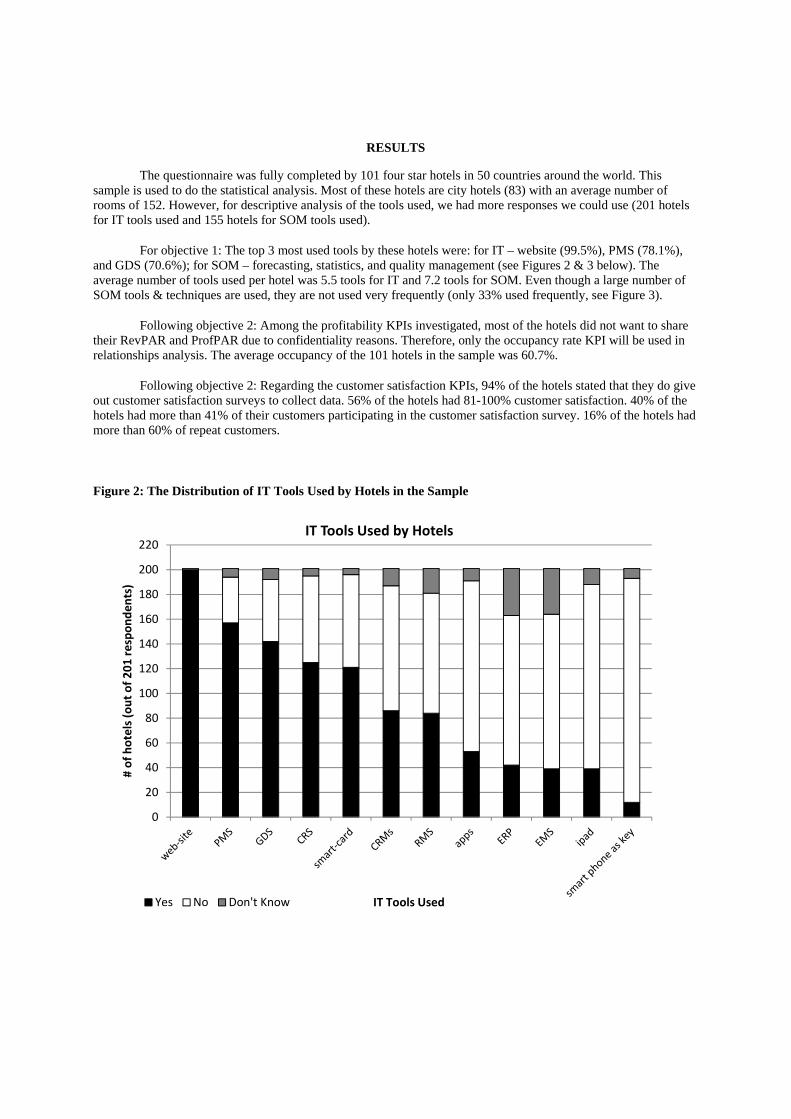
RESULTS
The questionnaire was fully completed by 101 four star hotels in 50 countries around the world. This sample is used to do the statistical analysis. Most of these hotels are city hotels (83) with an average number of rooms of 152. However, for descriptive analysis of the tools used, we had more responses we could use (201 hotels for IT tools used and 155 hotels for SOM tools used).
For objective 1: The top 3 most used tools by these hotels were: for IT – website (99.5%), PMS (78.1%), and GDS (70.6%); for SOM – forecasting, statistics, and quality management (see Figures 2 & 3 below). The average number of tools used per hotel was 5.5 tools for IT and 7.2 tools for SOM. Even though a large number of SOM tools & techniques are used, they are not used very frequently (only 33% used frequently, see Figure 3).
Following objective 2: Among the profitability KPIs investigated, most of the hotels did not want to share their RevPAR and ProfPAR due to confidentiality reasons. Therefore, only the occupancy rate KPI will be used in relationships analysis. The average occupancy of the 101 hotels in the sample was 60.7%.
Following objective 2: Regarding the customer satisfaction KPIs, 94% of the hotels stated that they do give out customer satisfaction surveys to collect data. 56% of the hotels had 81-100% customer satisfaction. 40% of the hotels had more than 41% of their customers participating in the customer satisfaction survey. 16% of the hotels had more than 60% of repeat customers.
Figure 2: The Distribution of IT Tools Used by Hotels in the Sample
0
20
40
60
80
100
120
140
160
180
200
220
# of hotels (out of 201 responden
ts)
IT Tools Used
IT Tools Used by Hotels
Yes No Don't Know
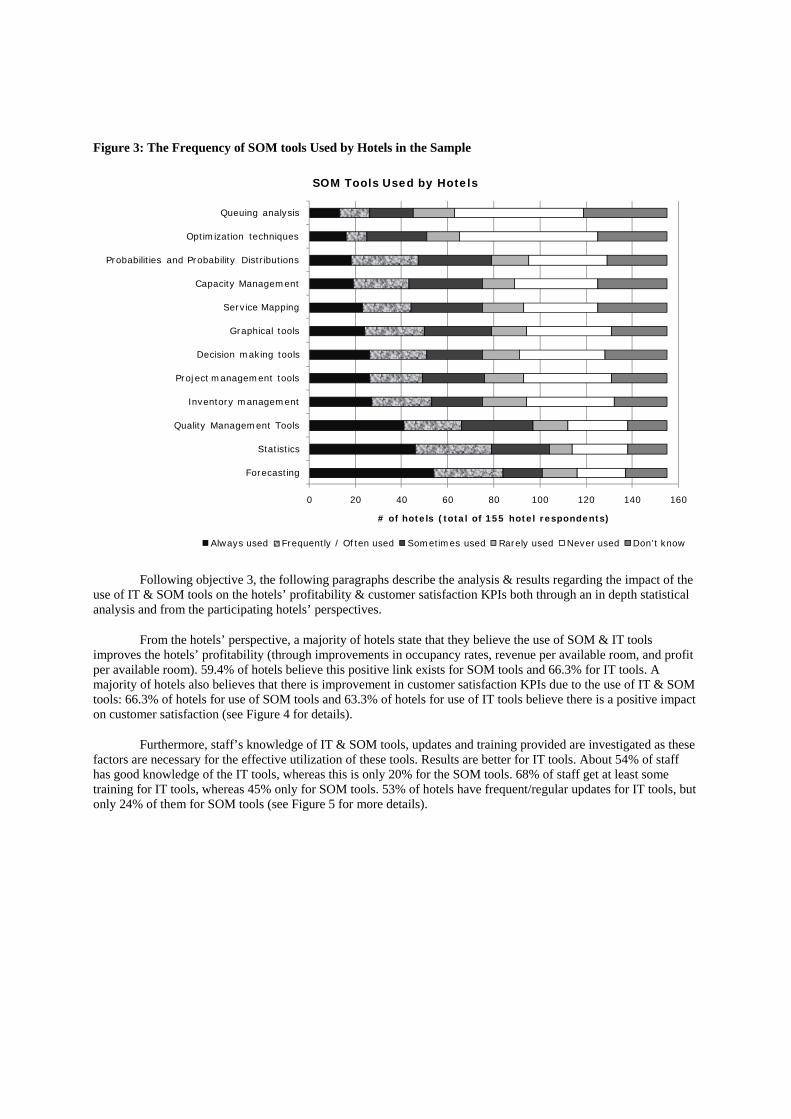
Figure 3: The Frequency of SOM tools Used by Hotels in the Sample
Following objective 3, the following paragraphs describe the analysis & results regarding the impact of the use of IT & SOM tools on the hotels’ profitability & customer satisfaction KPIs both through an in depth statistical analysis and from the participating hotels’ perspectives.
From the hotels’ perspective, a majority of hotels state that they believe the use of SOM & IT tools improves the hotels’ profitability (through improvements in occupancy rates, revenue per available room, and profit per available room). 59.4% of hotels believe this positive link exists for SOM tools and 66.3% for IT tools. A majority of hotels also believes that there is improvement in customer satisfaction KPIs due to the use of IT & SOM tools: 66.3% of hotels for use of SOM tools and 63.3% of hotels for use of IT tools believe there is a positive impact on customer satisfaction (see Figure 4 for details).
Furthermore, staff’s knowledge of IT & SOM tools, updates and training provided are investigated as these factors are necessary for the effective utilization of these tools. Results are better for IT tools. About 54% of staff has good knowledge of the IT tools, whereas this is only 20% for the SOM tools. 68% of staff get at least some training for IT tools, whereas 45% only for SOM tools. 53% of hotels have frequent/regular updates for IT tools, but only 24% of them for SOM tools (see Figure 5 for more details).
0 20 40 60 80 100 120 140 160
Forecasting
Statistics
Quality Management Tools
Inventory management
Project management tools
Decision making tools
Graphical tools
Service Mapping
Capacity Management
Probabilities and Probability Distributions
Optimization techniques
Queuing analysis
# of hotels (total of 155 hotel respondents)
SOM Tools Used by Hotels
Always used Frequently / Often used Sometimes used Rarely used Never used Don’t know
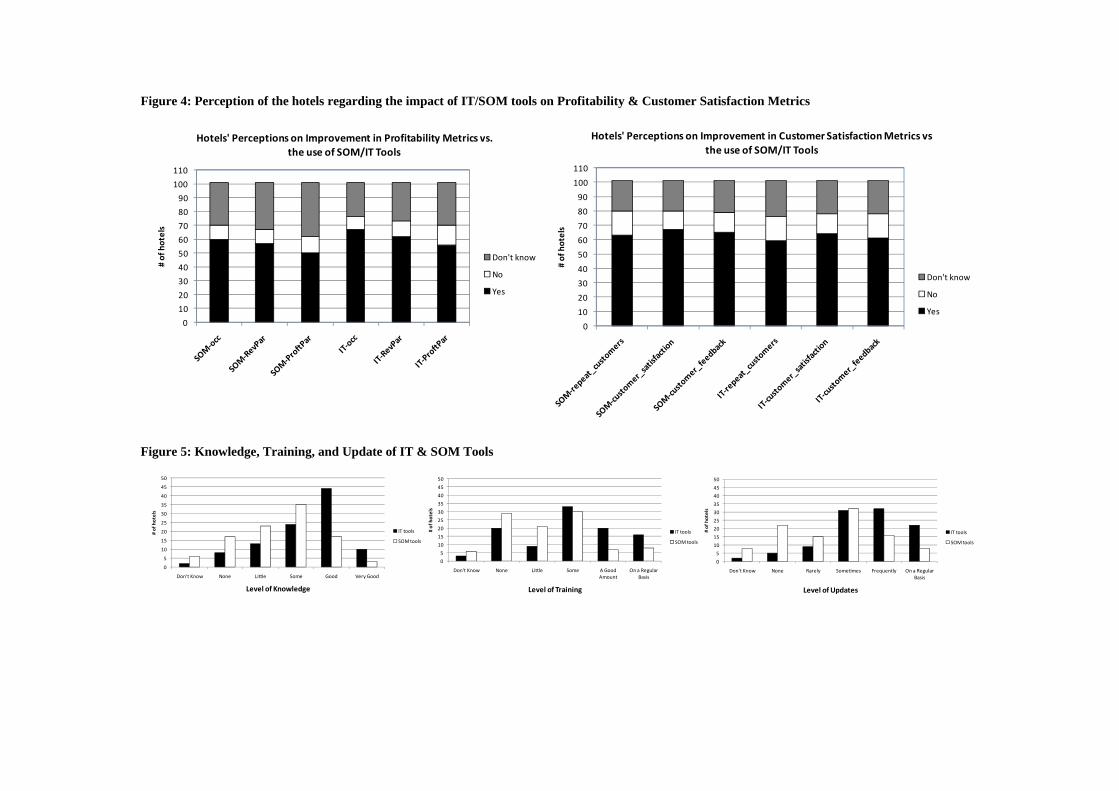
Figure 4: Perception of the hotels regarding the impact of IT/SOM tools on Profitability & Customer Satisfaction Metrics
Figure 5: Knowledge, Training, and Update of IT & SOM Tools
0
10
20
30
40
50
60
70
80
90
100
110# of hotels
Hotels' Perceptions on Improvement in Profitability Metrics vs.the use of SOM/IT Tools
Don't know
No
Yes
0
10
20
30
40
50
60
70
80
90
100
110
# of hotels
Hotels' Perceptions on Improvement in Customer Satisfaction Metrics vs
the use of SOM/IT Tools
Don't know
No
Yes
0
5
10
15
20
25
30
35
40
45
50
Don't Know None Rarely Sometimes Frequently On a Regular Basis
# of hotels
Level of Updates
IT tools
SOM tools
0
5
10
15
20
25
30
35
40
45
50
Don't Know None Little Some A Good Amount
On a Regular Basis
# of hotels
Level of Training
IT tools
SOM tools
0
5
10
15
20
25
30
35
40
45
50
Don't Know None Little Some Good Very Good
# of hotels
Level of Knowledge
IT tools
SOM tools
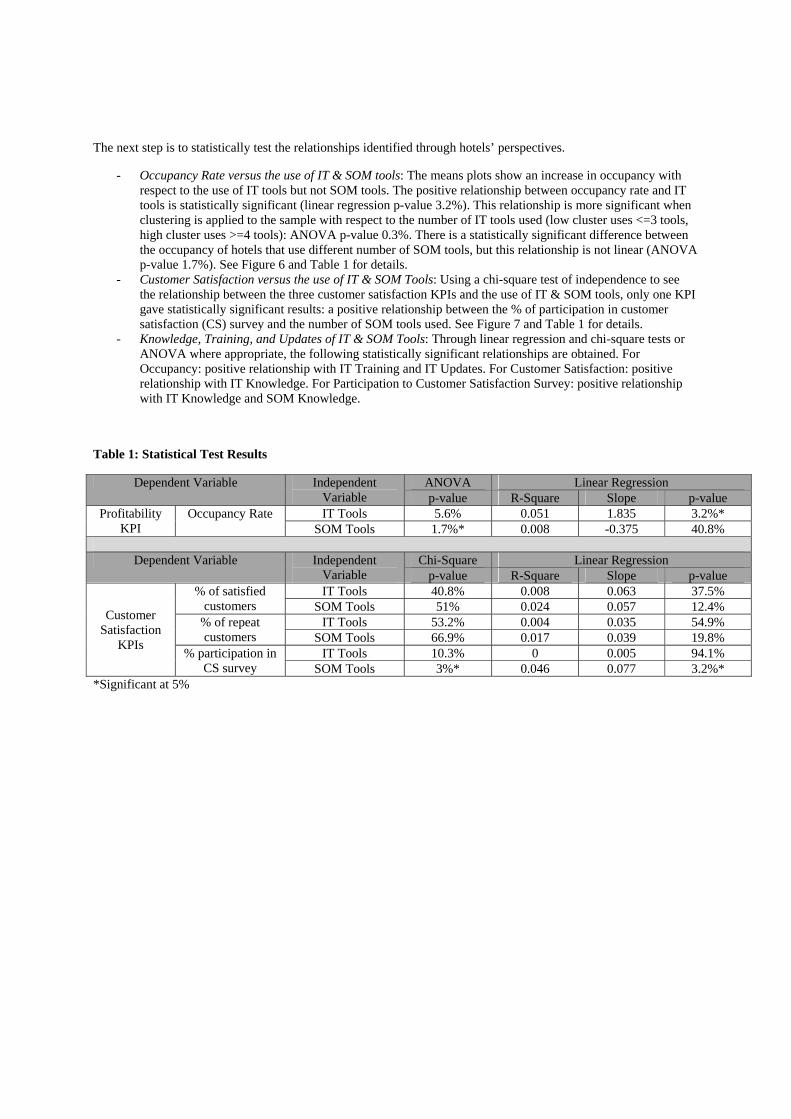
The next step is to statistically test the relationships identified through hotels’ perspectives.
- Occupancy Rate versus the use of IT & SOM tools: The means plots show an increase in occupancy with respect to the use of IT tools but not SOM tools. The positive relationship between occupancy rate and IT tools is statistically significant (linear regression p-value 3.2%). This relationship is more significant when clustering is applied to the sample with respect to the number of IT tools used (low cluster uses <=3 tools, high cluster uses >=4 tools): ANOVA p-value 0.3%. There is a statistically significant difference between the occupancy of hotels that use different number of SOM tools, but this relationship is not linear (ANOVA p-value 1.7%). See Figure 6 and Table 1 for details.
- Customer Satisfaction versus the use of IT & SOM Tools: Using a chi-square test of independence to see the relationship between the three customer satisfaction KPIs and the use of IT & SOM tools, only one KPI gave statistically significant results: a positive relationship between the % of participation in customer satisfaction (CS) survey and the number of SOM tools used. See Figure 7 and Table 1 for details.
- Knowledge, Training, and Updates of IT & SOM Tools: Through linear regression and chi-square tests or ANOVA where appropriate, the following statistically significant relationships are obtained. For Occupancy: positive relationship with IT Training and IT Updates. For Customer Satisfaction: positive relationship with IT Knowledge. For Participation to Customer Satisfaction Survey: positive relationship with IT Knowledge and SOM Knowledge.
Table 1: Statistical Test Results
Dependent Variable Independent Variable
ANOVA Linear Regression p-value R-Square Slope p-value
Profitability KPI
Occupancy Rate IT Tools 5.6% 0.051 1.835 3.2%* SOM Tools 1.7%* 0.008 -0.375 40.8%
Dependent Variable Independent
Variable Chi-Square Linear Regression
p-value R-Square Slope p-value
Customer Satisfaction
KPIs
% of satisfied customers
IT Tools 40.8% 0.008 0.063 37.5% SOM Tools 51% 0.024 0.057 12.4%
% of repeat customers
IT Tools 53.2% 0.004 0.035 54.9% SOM Tools 66.9% 0.017 0.039 19.8%
% participation in CS survey
IT Tools 10.3% 0 0.005 94.1% SOM Tools 3%* 0.046 0.077 3.2%*
*Significant at 5%
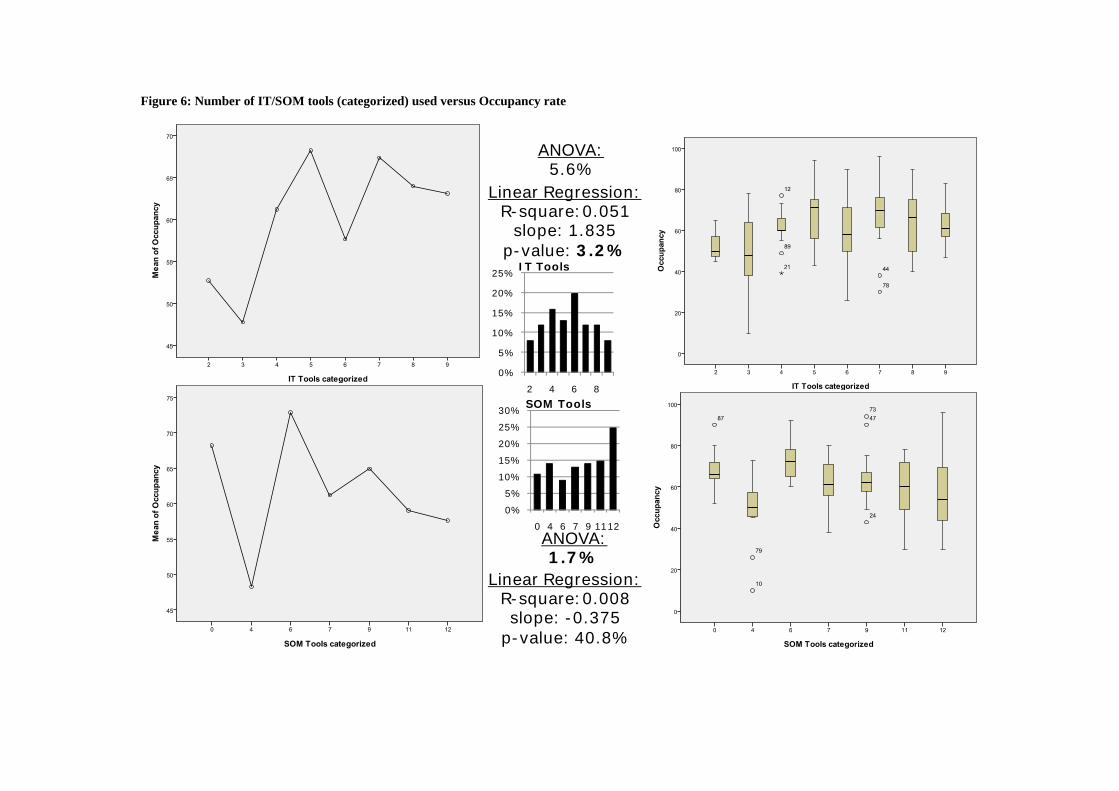
Figure 6: Number of IT/SOM tools (categorized) used versus Occupancy rate
0%
5%
10%
15%
20%
25%
30%
0 4 6 7 9 1112
SOM Tools
0%
5%
10%
15%
20%
25%
2 4 6 8
IT Tools
ANOVA: 5.6%
Linear Regression:R-square:0.051
slope: 1.835 p-value: 3.2%
ANOVA: 1.7%
Linear Regression:R-square:0.008 slope: -0.375
p-value: 40.8%
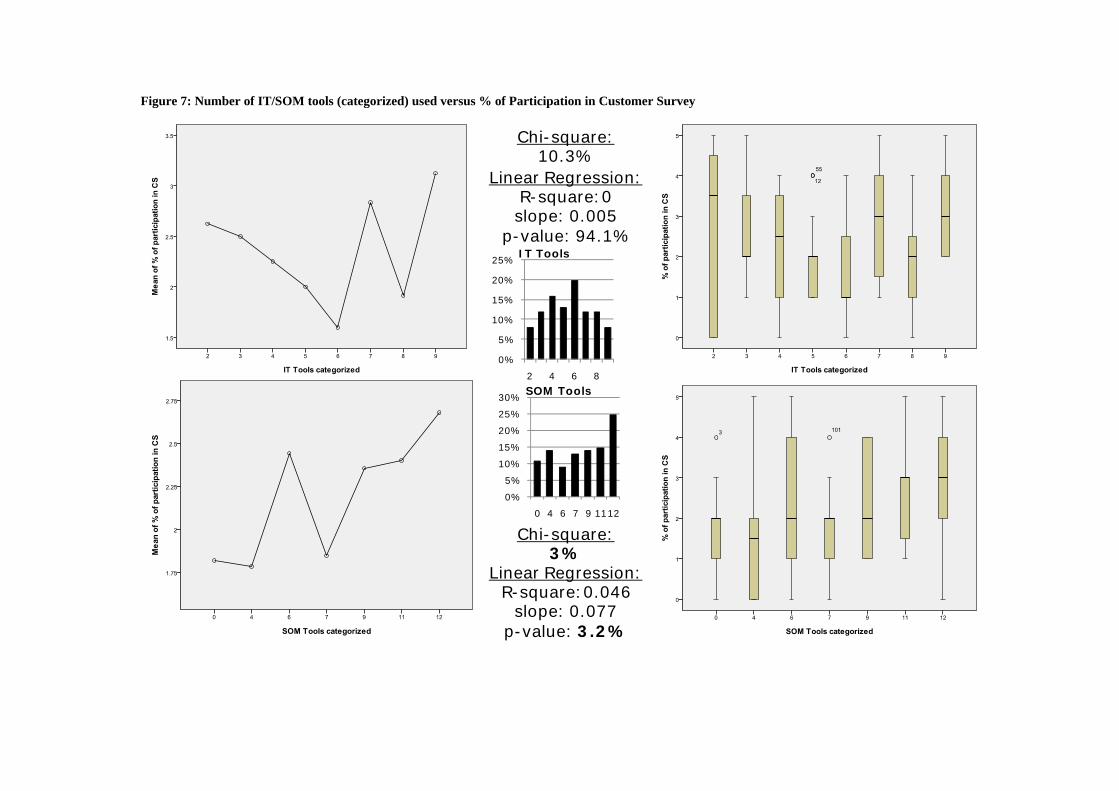
Figure 7: Number of IT/SOM tools (categorized) used versus % of Participation in Customer Survey
Chi-square: 10.3%
Linear Regression:R-square:0 slope: 0.005
p-value: 94.1%
Chi-square: 3%
Linear Regression:R-square:0.046
slope: 0.077p-value: 3.2%
0%
5%
10%
15%
20%
25%
30%
0 4 6 7 9 1112
SOM Tools
0%
5%
10%
15%
20%
25%
2 4 6 8
IT Tools
CONCLUSIONS & RECOMMENDATIONS
The current trends concerning IT & SOM tools used in the hospitality industry indicate an improvement over time in the adoption of these tools, however still remains at a relatively low level. Through the sample of 101 four star hotels in 50 countries around the world, the top 5 most used tools were identified to be: for IT tools – the hotel website, PMS, GDS, CRS and smart cards; and for SOM tools – forecasting, statistics, quality management, inventory management, and project management tools. Even though a larger number of SOM tools & techniques are used, they are not used very frequently (only 33% used frequently), which reduces their potential added value.
Clearly, having the IT & SOM tools, does not guarantee any benefits, if staff is not made aware of these tools, offered training and regular updates implemented. There appears to be not enough efforts done in these domains. In addition, hotels seem to have more knowledge & training about and updates regarding the IT tools compared to the SOM tools. More commitment is needed to offer training and provide constant updates to hotel staff to be able to fully benefit from the investments done in IT & SOM tools, and increase their impact on profitability & customer satisfaction.
Regarding the relationships investigated between the use of IT & SOM tools and profitability & customer satisfaction of hotels, some positive statistically significant links were identified, which were also backed up by hotels’ perceptions. Even though in addition to occupancy levels, RevPAR and ProfPAR were found to be the most suitable profitability KPIs, hotels were reluctant in sharing this data and so occupancy levels were used in the statistical analysis. Hotels using more IT tools have reported higher occupancy levels (significant ANOVA & positive linear regression). This was supported also by hotels’ perception showing that 66.3% of them believe there is an improvement in occupancy rates due to the use of IT tools (improvement in RevPar and ProfPar are believed to exist also by 61.4% and 55.4% of the hotels respectively). These results are in accordance with the literature review findings (Sunny et. al. 2005; Kokaz and Murphy, 2009 and 2011). In addition, providing training and regular updates have been found to have a statistically significant positive relationship with the occupancy rates. However, no statistical links have been found between the use of IT tools and customer satisfaction KPIs. Even though this is the case, hotels perception shows support by revealing 63.4% of hotels believing an improvement exists in customer satisfaction due to the use of IT tools. Also, staff having the knowledge of these tools, does have a significant positive relationship with customer satisfaction.
Concerning the SOM tools usage, a significant difference in occupancy rates by hotels using different total number of SOM tools have been identified, however this relationship was not a linearly positive one. Nevertheless, 59.4% of hotels do believe there is improvement in occupancy rates due to the use of SOM tools (56.4% and 49.5% of hotels state their belief of improvements in RevPar and ProfPar respectively). The use of SOM tools and having knowledge about these tools, have been found to have a positive relationship with the participation in customer satisfaction surveys (through chi-square tests and linear regression). Other customer satisfaction KPIs were not found to have statistically significant links. However, 66.4% of hotels do believe to have improvements in customer satisfaction due to the use of SOM tools.
The positive relationships identified statistically, also backed by hotels’ optimistic perceptions, emphasize the importance of investing in IT & SOM tools along with educating the staff about these tools through providing updates and training. Given the highly competitive nature of this industry, it will be very important to effectively manage the investment and use of these tools to keep ahead of the game. To reinforce the findings of this research, a larger sample can be analyzed and over time to monitor the trends. A more detailed study on the training of the tools versus the use and final impacts on profitability & customer satisfaction would be of high importance and have more explanatory power. Additionally, more profitability KPIs can be collected and the same relationships analyzed with them. Finally, some hotel case studies with direct interviews may result in new insights and a better understanding of the underlying mechanisms.
REFERENCES
Chathoth, P. (2007) The impact of information technology on hotel operations, service management and transaction costs: A conceptual framework for full-service hotel firms, International Journal of Hospitality Management, Vol. 26, Issue 2: pp. 395-408
Cohen, J. (2006). Why the democratic ethic of the worldwide web may be about to end. The New York Times
Dwivedi, M., Shibu, T. B., & Venkatesh, U. (2007). Social software practices on the internet implications for the hotel industry. International Journal of Contemporary Hospitality, 19 (5), 415-426
Enz, C.A., Canina, L., & Walsh, K. (2001). Hotel-industry averages: an inaccurate tool for measuring performance. Cornell Hotel and Restaurant Administration Quarterly, 42 (6), 22-32
Gazzoli, G., Kim, W. G., & Palakurthi R. (2008). Online distribution strategies and competition: are the global hotel companies getting it right? International Journal of Contemporary Hospitality Management, 20 (4), 375-387
Gilbert, G. R., & Veloutsou, C. (2006). A cross industry comparaison of customer satisfaction. Journal of Service Marketing , 298-308
Gilbert, G. R., Veloutsou, C., Goode, M. M. & Moutinho, L. (2004). Measuring customer satisfaction in the fast food industry: a cross-national approach. Journal of Service Marketing, 18 (5), 371-383
InterContinental Hotels & Resorts. (2010). InterContinental Hotels & Resorts first to equip concierge teams with Apple iPads. Retrieved March 04, 2011, from Intecontinental hotel group: http://www.ihgplc.com/index.asp?PageID=414&NewsID=2445
Jeffrey, D., & Barden, R.R.D. (2000). An analysis of daily occupancy performance: a basis for effective hotel marketing? International Journal of Contemporary Hospitality Management, 12 (3), 179-189
Kasavana, M.K., Knutson, B.J., & Lee, H. (2004). Electronic perception technology applications in food service. FIU Hospitality Review, 22 (2), 18-27
Kasim N. A. A., & Minai, B. (2009). Linking CRM Strategy, Customer performance measure and Performance in the hotel Industry. Journal of Economics and Management, 297-316
Kessler, S. (2003). In Customer Satisfaction Toolkit For ISO 9001:2000. Milwauke: William A. Tony Knowledge factories (2011). From iPhones to iHotels: How marketing is being shaped by new technologies.
Strategic Direction, 27 (1), 7-10 Kokaz, K . & Murphy, H. (2008) Service Optimization in the Hotel Sector - Adding "Value" with Technology &
Operations Management Tools. Proceedings of the Eurochrie Conference, Dubai, UAE, October, 2008 Kokaz, K . & Murphy, H. (2009) Service Operations Management Tools & Technology in Hotels - Developing a
Benchmarking Tool. Proceedings of the Eurochrie Conference, Helsinki, Finland, October, 2009 Kokaz, K . & Murphy, H. (2010). Data Management with Property Management Systems (PMS) in Hotels.
Proceedings of the Eurochrie Conference, Amsterdam, Netherlands, October, 2010 Kokaz, K. (2007) The use of operations management tools in service industries to increase productivity. Ehlite
Magazine. Lausanne, Switzerland. September 2007. Issue 18 Kokaz, K., & Murphy, H. (2011). An investigation of the exploitation of service operations management tools in the
hotel sector. Extended abstract, Proceedings of QUIS12 (pp. 143-145) Kotler, P., Leong, S. M., Ang, S. H., & Tan, C. T. (1996). Marketing Management: an Asian Perspective. Singapore:
Prentice-Hall Law, R., & Hsu, C. H. (2005). Customers' perceptions on the importance of hotel web site dimensions and
attributes. International Journal of Contemporary hospitality Management , 17 (6), 493-503 McColl-Kennedy, J., & Schneider, U. (2000). Measuring customer satisfaction: why, what and how. International
Marketing Review, 11 (7), 883-96 McLaughlin, D. (2007) Information technology Uncovered: what every financial officer should know. Corporate
Finance Review. 11, 35-39. Retrieved January 03, 2009, from Proquest database Neves, J. C., & Lourenço, S. (2009). Using data envelopment analysis to select strategies that improve the
performance of hotel companies. International Journal of Contemporary Hospitality Management, 21(6/7), 698-712. Retrieved from EBSCOhost. P.699
Open ways. (2010). Retrieved March 06, 2011, from http://www.openways.com/pages/home.html Poria, Y. (2004). Employees' interference with the distribution of guest satisfaction questionnaires. International
Journal of Contemporary Hospitality Management, 16 (5), 321-324 Reichheld, F., & Sasser, W.E. (1990). Zero defections: quality comes to services. Harvard Business Review, 68,
105-11 Rohlfs, K. (April 2003). Measuring and Understanding Hotel Profits; Profit and ProfPAR defined. Atlanta:
Hospitality research of PKF Consulting Schmidgall, R. (2006). Hospitality Industry Managerial Accounting. Sixth Edition. Michigan: Education Institute of
the American Hotel & Lodging Association Sigala, M. (2005). Integrating customer relationship management in hotel operations: managerial and operational
implications. International Journal of Hospitality Management, 391-413
Siguaw, J.,Enz, C. & Namasivayam, (2000) How Wired Are We? The State of Technology Adoption in the U.S. Hotel Industry, Cornell Hotel and Restaurant Administration Quarterly, 41 (December), 40-48
Stahl, M. (1999). Perspectives in Total Quality. Milwaukee,WI: Blackwell Starkov, M., & Price, J. (2007). Assessing share of online distribution channels in hospitality by 2010. Retrieved 12
22, 2010, from http://www.m-travel.com/news/2007/06/assessing-share.htlm Sunny H., Woo Gon K., Seungwhan J. (2005) Effect of information technology on performance in upscale hotels.
International Journal of Hospitality Management, Vol. 24, Issue 2, Pages 281-294 Walker, R. J. (2009). Introduction to Hospitality. 5th Edition. Prentice Hall Weiser, C. (1995). Championing the customer. Harvard Business Review, 73 (6), 133-16 Witt C. A. & Witt S. F. (1989) Why Productivity in the Hotel Sector is Low? Journal of Contemporary Hospitality
Management. Vol 1, No 2, pp. 28-34 Yüksel, A., & Rimmington, M. (1998). Customer satisfaction measurement. Cornell Hotel and Restaurant
Administration Quarterly, 39 (6), 60-7
The Relationship between Individualism/Collectivism and Food Handlers' Practices
Ma'moun A. Habiballah, Al-Hussein Bin Talal University
Petra, Jordan [email protected]
and Elizabeth M. Ineson*
Manchester Metropolitan University Old Hall Lane
Manchester M14 6HR, UK [email protected]
ABSTRACT
The relationship between food handlers' practices and the Individualism vs. Collectivism (I/C) cultural dimension is examined. The variables were measured quantitatively employing scaling techniques; using multi-stage cluster sampling, 347 Food and Beverage employees working in the Jordanian hotel industry were targeted. The majority were Jordanians (88.5%), male (86%), under 35 years of age (84%), working in classified hotels (94.9%) that employed under 101 employees (77.2%) and were managed locally (76%). The scales’ reliability and validity were confirmed by Cronbach’s alpha and factor analysis respectively. Standard Multiple Regression found employees' food handling practices associate positively with Individualism (r=0.610; p<0.001) and negatively with Collectivism (r=-0.459; p<0.001). Hence, a relationship between I/C and the food safety behaviour of food handlers is established. Keywords: Food handling practices; Culture; Individualism/Collectivism; Idiocentrism; Allocentrism.
Generation Y and organic wine: is it love at first sight1?
Elena Cavagnaro, PhD Professor in service studies
Stenden University of Applied Sciences, Academy of International Hospitality Research Rengerslaan 8, 8917 DD Leeuwarden
Abstract: Though interest in sustainable F&B is increasing, there is still limited research on organic wines and customers of the so called Generation Y (GY). From the existing studies a negative judgment on organic wine taste emerges. The research presented in this paper aims at better understanding GY knowledge about and judgment of organic wine trough a taste experiment followed by a focus group discussion. Outcomes suggest that GY members have not a negative opinion about organic wines, but that their choice for a wine will be led more by the (perceived) quality of the wine and the type of grape than by any sustainability claim. Keywords: organic wine; Generation Y
INTRODUCTION
After a difficult start in the 1980s, sustainability has got increasing attention by researchers, policy makers and practitioners also in the F&B sector. There is, though, still limited research on organic wines in general and in relation with Generation Y (referred to as GY) in particular. This is remarkable because, with 1.7 billion members worldwide, GY represents a huge economic force. Moreover, existing research on organic wines and GY gives mixed results. Stolz and Schmid (2008) revealed that GY has a positive health image of organic wine but also shares a negative taste perception of organic wines. Forbes et al. (2009), on the contrary, found that a slight majority of their respondents (53%) state that organic production practices will not influence the wine quality, whereas 37% believe that wine’s quality would actually be increased by sustainable production practices. Differences in quality and taste perceptions were also reported by Delmas and Grant (2010): experience with organic wine was found to be the discriminating factor.
From the above, it might be concluded that there is scope for more research on GY and organic wine.
The research presented here is part of a larger research program called ‘Greening Generation Y’ aimed at understanding the knowledge, attitude and behaviour of GY members towards sustainable products and services in order to develop innovative communication techniques to support GY choice of these products and services. The first stage of the larger study consisted of a quantitative survey (n=120) focussing on knowledge attitude and behaviour towards organic food of Dutch GY. This study confirmed Stolz and Schmid (2008) result: GY share a negative perception of the taste of organic food and wine. To better understand this outcome further research was conducted, including taste experiments. The present paper reports on the set up and major outcomes of the taste experiment and focus group focussed on organic wine.
After this introduction, the literature review will briefly touch upon existing research on GY; organic
vs. conventional wine and labelling. In the methodology the set up of the wine taste experiment and focus group discussion is described. Then main results are presented. A brief conclusion, with recommendations and limitations, closes the paper.
1 This research has been conducted with the support of Z. D’Aboy and M.van der Heide (3rd year International Hospitality Management students) and F. Struik and M. Venema (students of the Master in International Service Management). Dr. Klosse, professor in gastronomy, and Mr B. Cramwinckel, director of the Center for taste Research (Centrum voor Smaakonderzoek), have advised the author on consumers’ behavior regarding wine and on the taste experiment.
LITERATURE REVIEW
Characteristics of Generation Y (GY) A generation consists of a group of people sharing the same experiences and teaching at the same age
(Underwood, 2011). Though there are different opinions on GY’s age range (Chrysochou et al., 2012), researchers most often refer to people born after 1977 and before 1999 as GY (Lancaster & Stillman, 2002; Fountain & Fisch, 2010; Charters et al., 2011). Specific characteristic shared by GY members are: knowledge and use of internet and social media; love for luxury good, including imported wine; hedonism; authenticity and a positive attitude towards environmental issues (Underwood, 2011; Wolburg & Pokrywczynski, 2001; Noble et al., 2009; Nowak et al., 2006; Thach and Olsen, 2006).
Already in the introduction, the huge spending power of GY has been touched upon as one of the
reasons why it is important to understand GY’s knowledge, attitude and behavior towards specific products. With 1.7 billion worldwide GY represents 25.5% of the world population and is considered to be the largest consumer group in the history in terms of their buying power. This power depends on their own disposable income and on the influence they have on the family decision-making (Nowak et al., 2006; Thach & Olsen, 2006). In the Netherlands, GY’s spending power is on average € 8900 p.y. p.p. (CBS, 2008). To these reasons it might be added that GY are in their formative years: their values and beliefs can still be influenced (Underwood, 2007).
Chrysochou et al. (2012) have already noticed that GY is and will more and more become of
significant importance for the wine industry. Olsen et al. (2007) and Thach and Olsen (2006) report an increase in wine consumption by GY in the US. However, research in other countries such as the UK (Mintel, 2009), New Zealand (Teagle, Mueller, & Lockshin, 2010) and France (Kevany, 2008) shows a lower consumption of wine by GY compared to the US.
Evidence suggests that GY’s positive attitude towards the environment does not translate into
behaviour (McKenzie-Mohr & Smith, 2006; Belz & Peattie, 2009; Arbuthnott, 2009). When it comes to buying organic products, this might be caused by their higher prices. Though, research also suggests that for GY value for money is more important than low price or high quality (Qenani-Petrela et al., 2007). Or, as Thach and Olsen (2006, p. 518) state, “Generation Y is positive, practical and responsive to brands that provide quality but at a fair price”.
Organic- vs. non-organic wine “Organic farming” is “a farming system which uses organic manure and avoids or largely excludes the
use of synthetic fertilizers, pesticides and chemicals" (Gil et al., 2001, p.2). The welfare of animals is also very important, while genetically modified foods and bioengineering are not accepted (Honkanen et al., 2006). In the EU, the European Council Regulation (EEC) no. 2092/91 sets standards for the production of organic wines (Iordachescu et al., 2009). This regulation focuses on the crop in the raw state, and not on the whole process of vinification “with the result that wine can only be promoted as being made from organically grown grapes rather than as organic wine” (Sharples, 1993, p. 32). Organic wine, on the contrary, should be “made from organically grown grapes and without any added sulfites” (Delmas & Grant, 2010, p. 33).
As it was observed above, several researches show that some people judge the taste of organic wine
negatively. Stolz and Schmid (2008) suggest as a possible explanation that in the first years of organic wine production the focus was not laid on the taste of the wines. Although increased knowledge has improved the quality of organic wine significantly, some consumers might still associate eco-labels with lower quality products and might be reluctant to purchase them.
Communication and labeling Alongside taste, packaging (bottle and label) influences GY’s choice of a particular wine (Lunardo &
Guerinet, 2006). Organic products are usually identified by an eco-label. The most widely used Dutch eco-label (EKO) does not apply to wine. As stated above, in the EU, wine may only be labeled as ‘wine made from organically produced grapes’, whereas U.S. and Australian wine make use of the labels: ‘100% organic wine’; ‘organic wines’ (95% organic) and ‘wines made with organic ingredients’ for wines with at least 70% organically produced ingredients (Delmas & Grant, 2010). Finally, biodynamic agriculture labels wine as ‘biodynamic’; ‘Demeter wine’; ‘Demeter certified wine’; and ‘wine made from biodynamic grapes’ or ‘wine made from Demeter certified grapes’. All these different labels might cause confusion in clients’ mind.
METHODOLOGICAL ISSUES As stated in the introduction, the design of the present research responds to the need to better
understand GY negative expectation regarding the taste of organic products, including wine. A mere taste experiment will not suffice to this scope. Firstly because, as prof. Klosse noticed (personal communication, January 2012), it is not possible to find two wines that share exactly the same characteristics except from being organic or non-organic. This means that a taste difference, if perceived, could not be exclusively ascribed to the variable ‘organic’ and ‘non organic’. Secondly because, as the reviewed literature suggests, knowledge and attitude (e.g. about organic production processes) influence people response to organic products. These factors should therefore also be taken into account. To cope with these needs, a mixed methodology was chosen: a double-blind taste experiment with two organic and two non-organic wines; a questionnaire and a focus group discussion.
Before and after the testing participants were asked to fill in a brief questionnaire. The questionnaires,
alongside demographic information, measured knowledge (logo recognition; definition); pro-environmental attitude (NEP scale, Dunlap et al., 2000) and behaviour (drinking behaviour; reason to buy or not organic wine etc.). The focus group discussion was guided by a series of questions, derived from the literature review and from results of the survey of the larger study Greening GY2. Major attention has been here given to labelling as a communication tool.
The focus group discussion has been recorded; transcribed and independently analysed by two groups
of researchers (content analysis). Eventual differences in the analysis were discussed with the research supervisor. For this study, 14 participants in the age category of 18 till 29 years from the North of the Netherlands with a certain interest for wine were selected3. Out of the 14 participants, 6 were males and 8 females; 8 were students and 6 were young professionals. The next section will cover the main results of the study.
MAIN RESULTS
During the taste experiment 9 out of 14 respondents preferred the organic wines over the conventional wines. As expected, no respondent was able to identify organic wine from the taste only.
Taste was also a topic in the questionnaire and in the focus group discussion: 8 respondents expected a
significant difference in taste of an organic wine compared to a conventional one; 2 a negative and 4 a positive difference. Respondents who had already tasted organic wine (n=12) reported that they had both positive and negative experiences with them, similarly with conventional wines. As one respondent mentioned “both traditional and organic wines might have a good or bad taste” (l.82).
About labelling, 12 out of 14 participants saw no counter indication of stating ‘organic’ on the bottle; 2
of the 12 found it a positive sign (proud about the product). Yet all respondents insisted that the fact that a wine is organic should not be pressed too much. An eco-label (if any) should be set on the back of the bottle or, if it was at the front, it should be nicely integrated into the wine label and not pop out. A wine choice – all participants stated – is led by the grapes’ variety and the expected (or already experienced) taste, more than any logo on the bottle. Though, participants admit that wine labels play an important role in choosing a wine because they give a first impression of the wine. Also, respondents confirmed that they take the grape variety, the price and the shape of the bottle into consideration when purchasing a wine. This is in line with findings from existing literature. New is the reference to the presence of a cork as a quality indicator.
As mentioned above, knowledge was tested by showing 4 organic logos. No respondent was able to
rightly identify all logos. Best recognised are the Dutch EKO and (surprisingly) the US organic logo (9/14). Though no one of the respondents knew exactly the difference between ‘organic wine’ and ‘wine made by organically grown grapes’, 11 defined ‘organic wine’ fairly well. The NEP mean score (36.5) reveals a slightly positive attitude towards the environment, and is comparable to the score obtained in the larger study. Looking at behaviour, 12 participants state that they buy sometimes (less that tow bottles per month) organic wine.
2 Further information on the survey and the focus group will be sent on request. 3 This is only a first study on the topic. Replication is planned. Feedback from colleagues during the EuroCHRIE conference is therefore much appreciated.
The average spending on wine of Dutch people aged 16-24 is €7.20. The majority of our respondents
(8/14) spend between €5.01 and €7.50 per bottle. Our respondents are not willingly to pay more for an organic wine. Referring to Teagle et al. (2010), who state that GY uses price as a quality indicator – it might be concluded that GY does not consider ‘organic’ a clue of better quality.
CONCLUSIONS AND RECCOMENDATIONS The study suggests that tough some GY members share a negative perception about organic wines, the
majority expect from organic wine a similar experience than from conventional ones. Respondents insists that ‘organic’ is not a reason to choose a certain wine. Taste of a certain grape variety, alongside external clues offered by the bottle and price, is what guide their choice. They also observe that therefore an eventual organic logo should not interfere with the bottle and label aesthetics. Though research is needed on larger samples, on the basis of this study it might be recommended to take care that the organic logo is not too prominent on the bottle and to focus communication about organic wine on their taste. As noticed above, this study should be replicated to better substantiate its findings, both in The Netherlands and in other countries.
REFERENCE LIST CBS (2008). Gemiddeld inkomen personen (52 wk. ink.) naar geslacht en leeftijd, 2005. Retrieved May 8, 2012,
from http://statline.cbs.nl Arbuthnott, K. (2009). Education for sustainable development beyond attitude change. International Journal of
Sustainability in Higher Education, 10(2), 152-63. Belz, F., & Peattie, K. (2009). Sustainability Marketing. Chichester: John Wiley & Sons, Ltd. Charters, S., Velikova, N., Ritchie, C., Fountain, J., Thach, L., Dodd, T., et al. (2011). "eneration Y and
sparkling wines: a cross-cultural perpective". International Journal of Wine Business Research, 23(2), 161-175.
Chrysochou, P., Krystallis, A., Mocanu, A., & Lewis, R. (2012). Generation Y preferences for wine: An exploratory study. British Food Journal, 114(4), 516 - 528.
Delmas, M., & Grant, L. (2010). Eco-Labeling Strategies and Price-Premium: The Wine Industry Puzzle. Business & Society, 20(10), 1-39.
Dunlap, R. E., van Liere, K. D., Mertig, A. G., & Jones, R. E. (2000). Measuring Endorsement of the New Ecological Paradigm: A Revised NEP Scale. Journal of Social Issues, 56(3), pp. 425-442.
Forbes, S., Cohen, D., Cullen, R., Wratten, S., & Fountain, J. (2009). Consumer attitudes regarding environmentally sustainable wine: an exploratory study of the New Zealand marketplace. Journal of Cleaner Production, 17(3), 1195-1199.
Fountain, J., & Fish, N. (2010). ‘It’s a happy drink’: Australasian Generation Y’s experiences and perception of sparkling wine. 5th International Academy of Wine Business Research Conference, 8‐10 Feb. 2010, Auckland, NZ. Academy of Wine Business Research
Gil, J., Gracia, A., & Sánchez, M. (2001). Market segmentation and willingness to pay for organic products in Spain. International Food and Agribusiness Management Review, 3(2), 207-226.
Honkanen, P., Verplanken, B., & Olsen, S. (2006). Ethical values and motives driving organic food choice. Journal of Consumer Behaviour, 430(5), 420-430.
Iordachescu, A., Moore, A., & Iordachescu, G. (2009). Consumer perceptions of organic wine. International Symposium Euro - aliment 2009. Galati - Romania: The Annals of the University Dunarea de Jos of Galati (pp. 1-6).
Kevany, S. (2008, May 20). French millenials drinking less, Americans more. Retrieved May 18, 2012, from http://www.wine-business-international.com
Lancaster, L., & Stillman, D. (2002). When Generations Collide: Who They Are. Why They Clash. How to Solve the Generational Puzzle at Work. New York: Harper Collins Publishing.
Lunardo, R., & Guerinet, R. (2007). The influence of label on wine consumption: its effects on young consumers' perception of authenticity and purchasing behaviour. Proceedings of the 105th EAAE Seminar, March 8-10, Bologna, Italy.
McKenzie-Mohr, D., & Smith, W. (2006). Fostering Sustainable Behaviour: An Introduction to Community-based Social Marketing. Gabriola Island: New Society Publishers.
Mintel. (2009, June 11). Younger wine drinkers failing to engage. Retrieved May 6, 2012, from: www.wine-business-international.com
Noble, S., Haytko, D., & Phillips, J. (2009). What drives college-age Generation Y consumers. Journal of Business Research, 62(6), 617-28.
Nowak, L., Thach, L., & Olsen, J. (2006). Wowing the millenials: creating brand equity in the wine industry. Journal of Product & Brand Management, 15(5), 316-23.
Olsen, J., Thach, L., & Nowak, L. (2007). Wine for my generation: exploring how US wine consumers are socialized to wine. Journal of Wine Research, 18(1), 1-18.
Qenani-Petrela, E., Wolf, M., & Zuckerman, B. (2007). Generational differences in wine consumption. Journal of Food Distribution Research, 38(1), 119-27.
Sharples, L. (1993). Organic Wines The UK Market: A Shift to mainstream Position? International Journal of Wine Marketing, 12(1), 30-41.
Stolz, H., & Schmid, O. (2008). Consumer attitudes and expectations of organic wine.Paper presented at Organic wine and viticulture conference, Levizzano (Modena, Italy), June 18-20, 2008 accessed on May, 30 2012 from http://orgprints.org/13974/.
Teagle, J., Mueller, S., & Lockshin, L. (2010). How do millennials’ wine attitudes and behaviour differ from other generations?. Auckland: Association of Wine Business Research.
Thach, L., & Olsen, J. (2006). Market segment analysis to target young adult wine drinkers. Agribusiness, 22(3), 307-22.
Underwood, C. (2007). The Generational Imperative: Understanding Generational Differences in the Workplace, Marketplace, and Living Room. Ohio: Generational Imperative, Inc.
Underwood, C. (2011, February 23). The Millennials: Who They Are, And Why They Are A Force to be Reckoned With. Retrieved May 4, 2012, from http://enr.construction.com/people/interviews/2011/0223-ChukUnderwood-1.asp
Wolburg, J., & Pokrywczynski, J. (2001). A psychographic analysis of Generation Y college students. Journal of Advertising Research, 49(1), 33-53.
INFLUENCE OF FESTIVAL ATTRIBUTE QUALITIES ON SLOW FOOD TOURISTS’ EXPERIENCE, SATISFACTION AND INTENTION TO RE-VISIT
Timothy Jung *
Manchester Metropolitan University Hollings Faculty, Old Hall Lane Manchester M14 6HR, England
e-mail: [email protected]
Mincheol Kim Department of Management Information Systems
Jeju National University Jeju City, South Korea
e-mail: [email protected]
and
Elizabeth M. Ineson Manchester Metropolitan University
Hollings Faculty, Old Hall Lane Manchester M14 6HR, England
e-mail: [email protected]
ABSTRACT The purpose of this study is to examine the impact of a Slow Food festival’s attributes on visitors’
overall experience, their level of satisfaction and intention to revisit. A total of 209 usable data were collected and Exploratory Factor Analysis (EFA) was conducted using SPSS and AMOS 19.0. A theoretical model representing the relationships among festival attribute qualities, experience quality, satisfaction and intention to re-visit is examined using path analysis. The final model suggests that all three festival attribute qualities (programmes, amenities’ and entertainment) have direct impacts on the visitors’ overall experience and visitor satisfaction; however only amenity quality contributed directly to intention to re-visit the Slow Food festival. Contributions and implications of the study are discussed. Key Words: Slow Food festival, amenity quality, festival attributes, satisfaction, visitor experience quality, intention to re-visit.
INTRODUCTION The Slow Food movement began in Italy in 1986 and its aim is to promote local farming and then to
utilise local products, hence ingredients, to produce local traditional and regional cuisine. In this way not only is the local culture and ecosystem preserved but also the local economy and employment are boosted. More recently, the Slow City movement (Cittaslow, of which Mold is unique in being the only Welsh representative) has evolved in which the town or city promotes a high-quality environment and healthy eating based on locally grown and prepared food. Recently, the Slow City movement was expanded globally and emerged as a niche market which attracts many visitors who would like to experience local foods and culture. As the Slow Food and Slow City movements are considered as alternative approaches to sustainable tourism development, local Destination Marketing Organisations (DMOs) and their partners involved in Slow Food and Slow City movement are making efforts to promote its town or city as Slow Food tourism destination through food festival.
Mold, an historic market town in North Wales, is the first Slow City in Wales and its first Food and Drink Festival was held in September 2006 in order to promote Mold as a Slow Food and Cittaslow destination. Like any other festivals, it is imperative for food festival organisers to design a unique experience which will encourage people to visit food festival again. Therefore, it is particularly important for festival organisers to understand the key aspects of a food festival, which have a strong impact on the positive experience of visitors, their satisfaction level and intention to revisit. Despite the importance of festival attributes’ quality, no academic research has been carried out to determine the influence of festival attributes on visitors’ quality of experience, satisfaction and their intention to revisit within the context of Slow Food tourism destinations. Therefore, the aim of the present paper is to examine the impacts of festival attributes (programmes’, amenities’ and entertainment quality) on the quality of the visitors’ overall experience, their level of satisfaction and intention to re-visit Mold food festival.
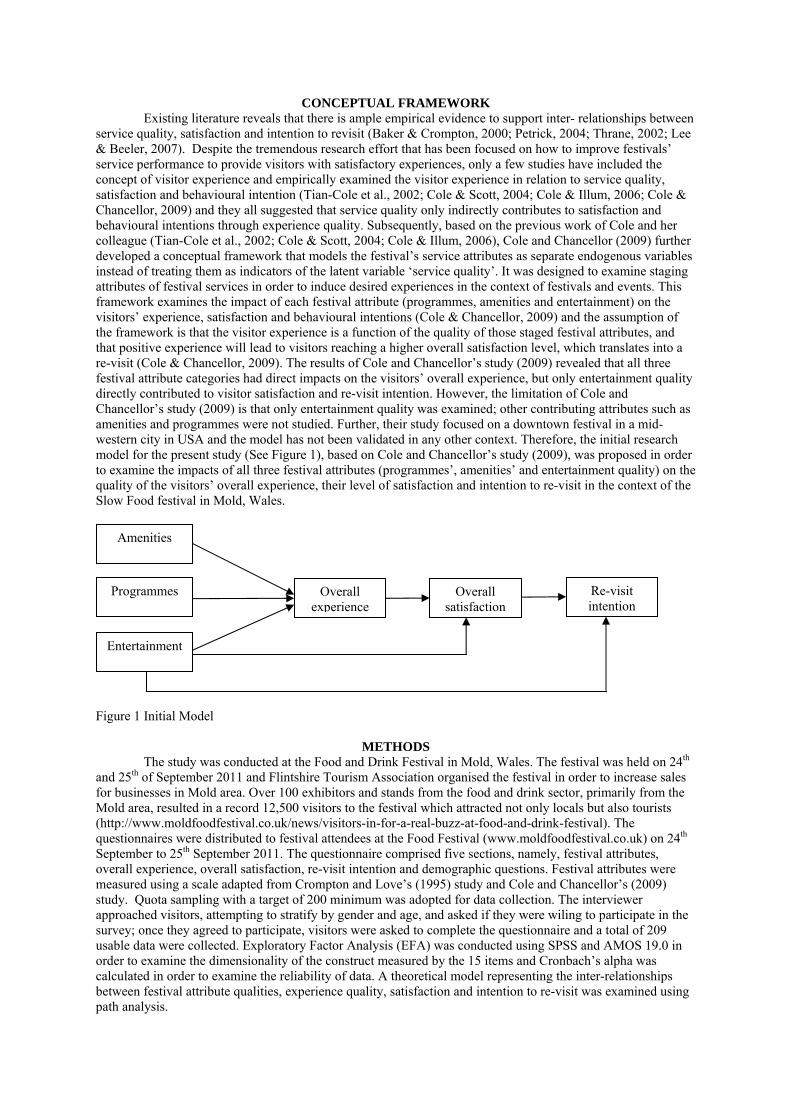
CONCEPTUAL FRAMEWORK Existing literature reveals that there is ample empirical evidence to support inter- relationships between
service quality, satisfaction and intention to revisit (Baker & Crompton, 2000; Petrick, 2004; Thrane, 2002; Lee & Beeler, 2007). Despite the tremendous research effort that has been focused on how to improve festivals’ service performance to provide visitors with satisfactory experiences, only a few studies have included the concept of visitor experience and empirically examined the visitor experience in relation to service quality, satisfaction and behavioural intention (Tian-Cole et al., 2002; Cole & Scott, 2004; Cole & Illum, 2006; Cole & Chancellor, 2009) and they all suggested that service quality only indirectly contributes to satisfaction and behavioural intentions through experience quality. Subsequently, based on the previous work of Cole and her colleague (Tian-Cole et al., 2002; Cole & Scott, 2004; Cole & Illum, 2006), Cole and Chancellor (2009) further developed a conceptual framework that models the festival’s service attributes as separate endogenous variables instead of treating them as indicators of the latent variable ‘service quality’. It was designed to examine staging attributes of festival services in order to induce desired experiences in the context of festivals and events. This framework examines the impact of each festival attribute (programmes, amenities and entertainment) on the visitors’ experience, satisfaction and behavioural intentions (Cole & Chancellor, 2009) and the assumption of the framework is that the visitor experience is a function of the quality of those staged festival attributes, and that positive experience will lead to visitors reaching a higher overall satisfaction level, which translates into a re-visit (Cole & Chancellor, 2009). The results of Cole and Chancellor’s study (2009) revealed that all three festival attribute categories had direct impacts on the visitors’ overall experience, but only entertainment quality directly contributed to visitor satisfaction and re-visit intention. However, the limitation of Cole and Chancellor’s study (2009) is that only entertainment quality was examined; other contributing attributes such as amenities and programmes were not studied. Further, their study focused on a downtown festival in a mid-western city in USA and the model has not been validated in any other context. Therefore, the initial research model for the present study (See Figure 1), based on Cole and Chancellor’s study (2009), was proposed in order to examine the impacts of all three festival attributes (programmes’, amenities’ and entertainment quality) on the quality of the visitors’ overall experience, their level of satisfaction and intention to re-visit in the context of the Slow Food festival in Mold, Wales.
Figure 1 Initial Model
METHODS The study was conducted at the Food and Drink Festival in Mold, Wales. The festival was held on 24th
and 25th of September 2011 and Flintshire Tourism Association organised the festival in order to increase sales for businesses in Mold area. Over 100 exhibitors and stands from the food and drink sector, primarily from the Mold area, resulted in a record 12,500 visitors to the festival which attracted not only locals but also tourists (http://www.moldfoodfestival.co.uk/news/visitors-in-for-a-real-buzz-at-food-and-drink-festival). The questionnaires were distributed to festival attendees at the Food Festival (www.moldfoodfestival.co.uk) on 24th
September to 25th September 2011. The questionnaire comprised five sections, namely, festival attributes, overall experience, overall satisfaction, re-visit intention and demographic questions. Festival attributes were measured using a scale adapted from Crompton and Love’s (1995) study and Cole and Chancellor’s (2009) study. Quota sampling with a target of 200 minimum was adopted for data collection. The interviewer approached visitors, attempting to stratify by gender and age, and asked if they were wiling to participate in the survey; once they agreed to participate, visitors were asked to complete the questionnaire and a total of 209 usable data were collected. Exploratory Factor Analysis (EFA) was conducted using SPSS and AMOS 19.0 in order to examine the dimensionality of the construct measured by the 15 items and Cronbach’s alpha was calculated in order to examine the reliability of data. A theoretical model representing the inter-relationships between festival attribute qualities, experience quality, satisfaction and intention to re-visit was examined using path analysis.
Amenities
Programmes
Entertainment
Overall experience
Overall satisfaction
Re-visit intention
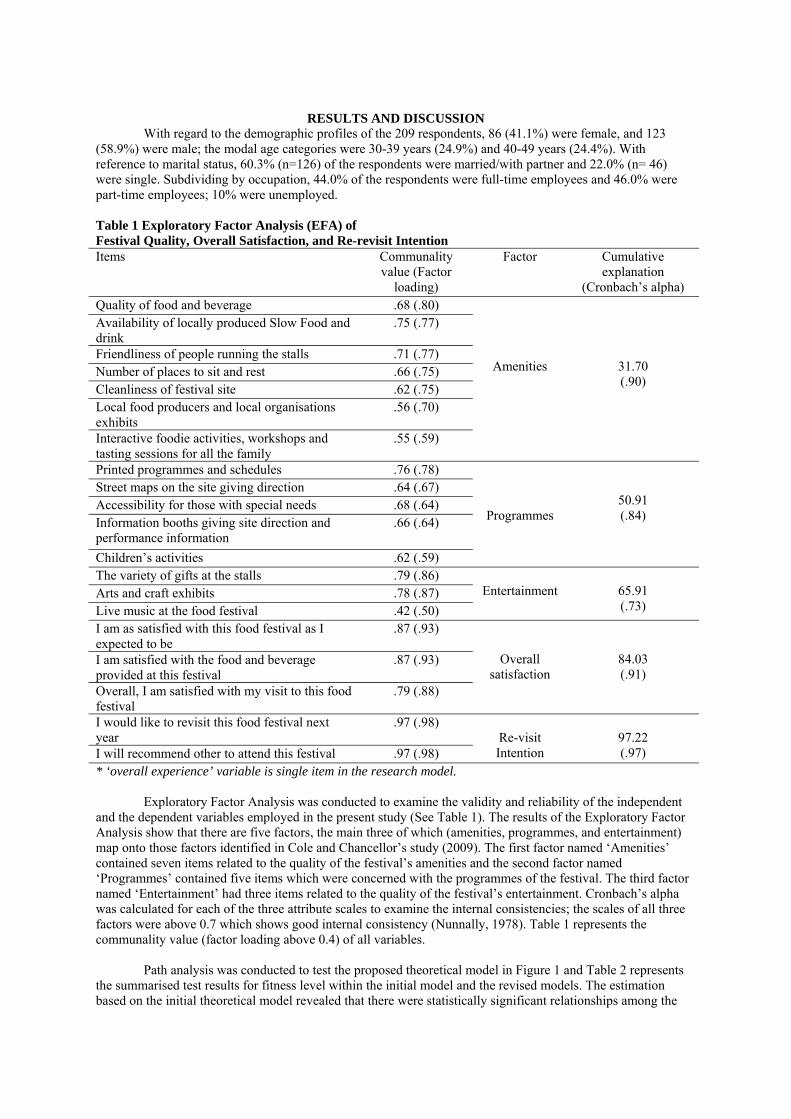
RESULTS AND DISCUSSION
With regard to the demographic profiles of the 209 respondents, 86 (41.1%) were female, and 123 (58.9%) were male; the modal age categories were 30-39 years (24.9%) and 40-49 years (24.4%). With reference to marital status, 60.3% (n=126) of the respondents were married/with partner and 22.0% (n= 46) were single. Subdividing by occupation, 44.0% of the respondents were full-time employees and 46.0% were part-time employees; 10% were unemployed. Table 1 Exploratory Factor Analysis (EFA) of Festival Quality, Overall Satisfaction, and Re-revisit Intention Items Communality
value (Factor loading)
Factor Cumulative explanation
(Cronbach’s alpha) Quality of food and beverage .68 (.80)
Amenities
31.70 (.90)
Availability of locally produced Slow Food and drink
.75 (.77)
Friendliness of people running the stalls .71 (.77) Number of places to sit and rest .66 (.75) Cleanliness of festival site .62 (.75) Local food producers and local organisations exhibits
.56 (.70)
Interactive foodie activities, workshops and tasting sessions for all the family
.55 (.59)
Printed programmes and schedules .76 (.78)
Programmes
50.91 (.84)
Street maps on the site giving direction .64 (.67) Accessibility for those with special needs .68 (.64) Information booths giving site direction and performance information
.66 (.64)
Children’s activities .62 (.59) The variety of gifts at the stalls .79 (.86)
Entertainment
65.91 (.73)
Arts and craft exhibits .78 (.87) Live music at the food festival .42 (.50) I am as satisfied with this food festival as I expected to be
.87 (.93)
Overall satisfaction
84.03 (.91)
I am satisfied with the food and beverage provided at this festival
.87 (.93)
Overall, I am satisfied with my visit to this food festival
.79 (.88)
I would like to revisit this food festival next year
.97 (.98) Re-visit Intention
97.22 (.97) I will recommend other to attend this festival .97 (.98)
* ‘overall experience’ variable is single item in the research model.
Exploratory Factor Analysis was conducted to examine the validity and reliability of the independent and the dependent variables employed in the present study (See Table 1). The results of the Exploratory Factor Analysis show that there are five factors, the main three of which (amenities, programmes, and entertainment) map onto those factors identified in Cole and Chancellor’s study (2009). The first factor named ‘Amenities’ contained seven items related to the quality of the festival’s amenities and the second factor named ‘Programmes’ contained five items which were concerned with the programmes of the festival. The third factor named ‘Entertainment’ had three items related to the quality of the festival’s entertainment. Cronbach’s alpha was calculated for each of the three attribute scales to examine the internal consistencies; the scales of all three factors were above 0.7 which shows good internal consistency (Nunnally, 1978). Table 1 represents the communality value (factor loading above 0.4) of all variables. Path analysis was conducted to test the proposed theoretical model in Figure 1 and Table 2 represents the summarised test results for fitness level within the initial model and the revised models. The estimation based on the initial theoretical model revealed that there were statistically significant relationships among the
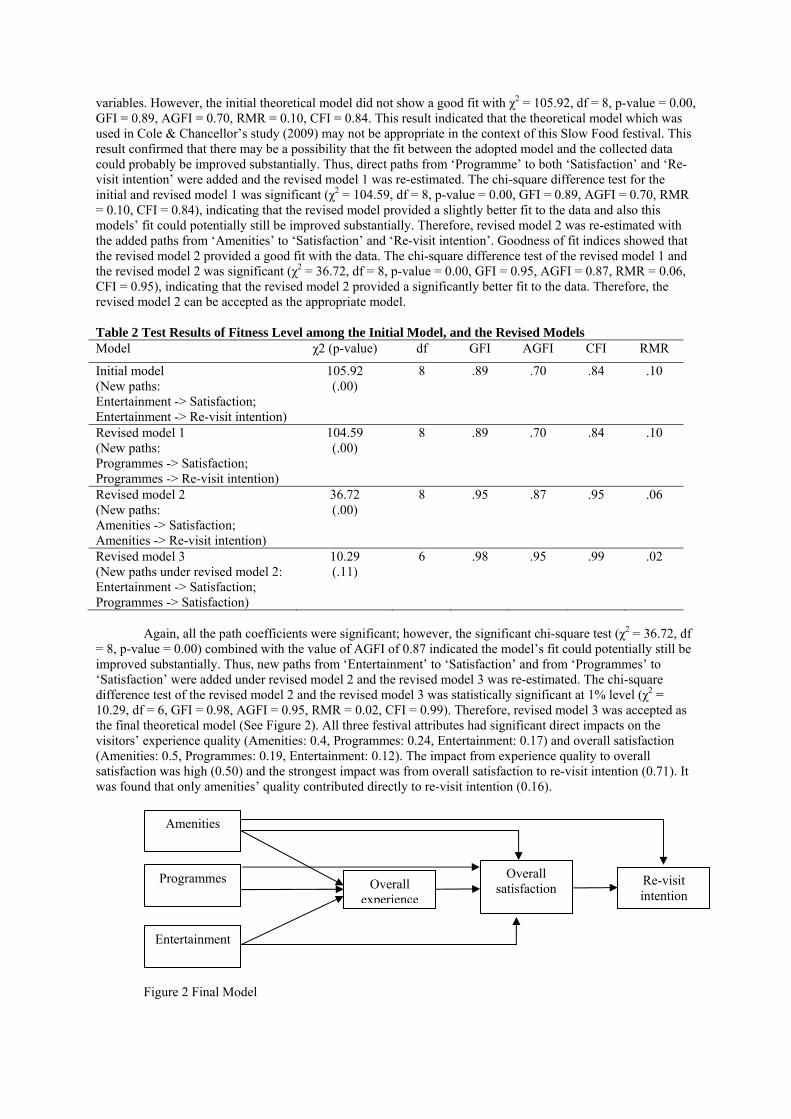
variables. However, the initial theoretical model did not show a good fit with χ2 = 105.92, df = 8, p-value = 0.00, GFI = 0.89, AGFI = 0.70, RMR = 0.10, CFI = 0.84. This result indicated that the theoretical model which was used in Cole & Chancellor’s study (2009) may not be appropriate in the context of this Slow Food festival. This result confirmed that there may be a possibility that the fit between the adopted model and the collected data could probably be improved substantially. Thus, direct paths from ‘Programme’ to both ‘Satisfaction’ and ‘Re-visit intention’ were added and the revised model 1 was re-estimated. The chi-square difference test for the initial and revised model 1 was significant (χ2 = 104.59, df = 8, p-value = 0.00, GFI = 0.89, AGFI = 0.70, RMR = 0.10, CFI = 0.84), indicating that the revised model provided a slightly better fit to the data and also this models’ fit could potentially still be improved substantially. Therefore, revised model 2 was re-estimated with the added paths from ‘Amenities’ to ‘Satisfaction’ and ‘Re-visit intention’. Goodness of fit indices showed that the revised model 2 provided a good fit with the data. The chi-square difference test of the revised model 1 and the revised model 2 was significant (χ2 = 36.72, df = 8, p-value = 0.00, GFI = 0.95, AGFI = 0.87, RMR = 0.06, CFI = 0.95), indicating that the revised model 2 provided a significantly better fit to the data. Therefore, the revised model 2 can be accepted as the appropriate model. Table 2 Test Results of Fitness Level among the Initial Model, and the Revised Models Model χ2 (p-value) df GFI AGFI CFI RMR
Initial model (New paths: Entertainment -> Satisfaction; Entertainment -> Re-visit intention)
105.92 (.00)
8 .89 .70 .84 .10
Revised model 1 (New paths: Programmes -> Satisfaction; Programmes -> Re-visit intention)
104.59 (.00)
8 .89 .70 .84 .10
Revised model 2 (New paths: Amenities -> Satisfaction; Amenities -> Re-visit intention)
36.72 (.00)
8 .95 .87 .95 .06
Revised model 3 (New paths under revised model 2: Entertainment -> Satisfaction; Programmes -> Satisfaction)
10.29 (.11)
6 .98 .95 .99 .02
Again, all the path coefficients were significant; however, the significant chi-square test (χ2 = 36.72, df
= 8, p-value = 0.00) combined with the value of AGFI of 0.87 indicated the model’s fit could potentially still be improved substantially. Thus, new paths from ‘Entertainment’ to ‘Satisfaction’ and from ‘Programmes’ to ‘Satisfaction’ were added under revised model 2 and the revised model 3 was re-estimated. The chi-square difference test of the revised model 2 and the revised model 3 was statistically significant at 1% level (χ2 = 10.29, df = 6, GFI = 0.98, AGFI = 0.95, RMR = 0.02, CFI = 0.99). Therefore, revised model 3 was accepted as the final theoretical model (See Figure 2). All three festival attributes had significant direct impacts on the visitors’ experience quality (Amenities: 0.4, Programmes: 0.24, Entertainment: 0.17) and overall satisfaction (Amenities: 0.5, Programmes: 0.19, Entertainment: 0.12). The impact from experience quality to overall satisfaction was high (0.50) and the strongest impact was from overall satisfaction to re-visit intention (0.71). It was found that only amenities’ quality contributed directly to re-visit intention (0.16).
Figure 2 Final Model
Amenities
Programmes
Entertainment
Overall experience
Overall satisfaction
Re-visit intention
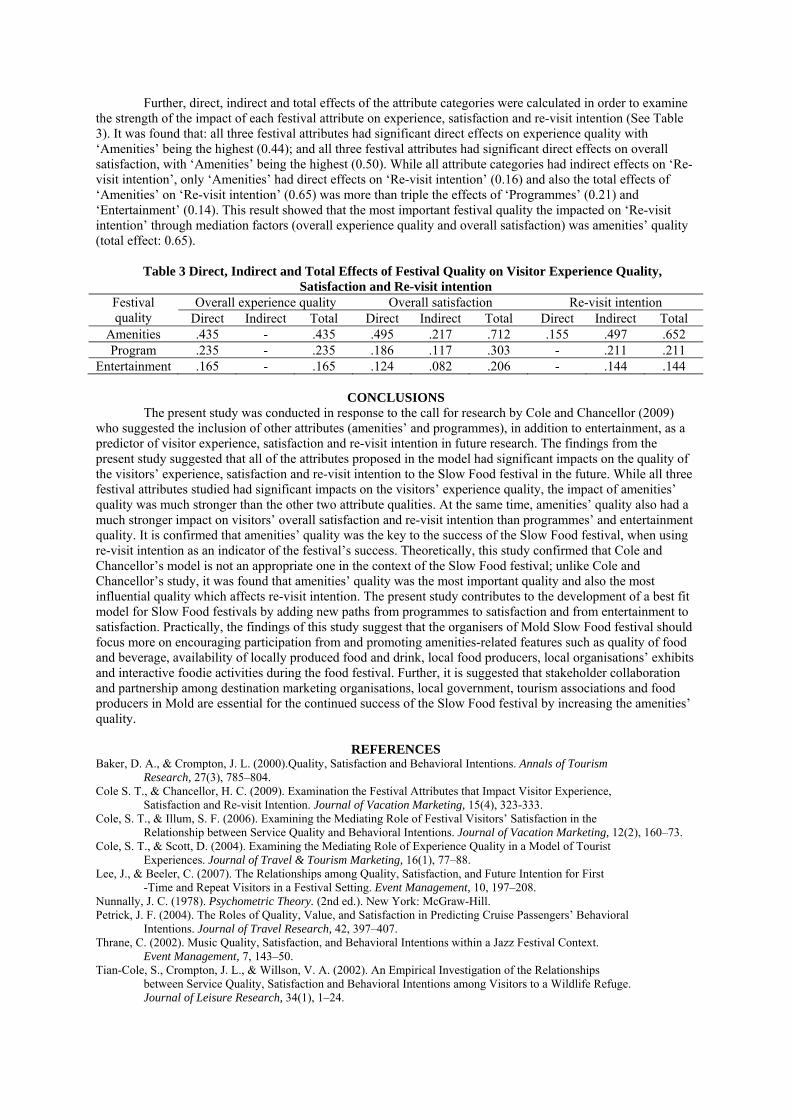
Further, direct, indirect and total effects of the attribute categories were calculated in order to examine the strength of the impact of each festival attribute on experience, satisfaction and re-visit intention (See Table 3). It was found that: all three festival attributes had significant direct effects on experience quality with ‘Amenities’ being the highest (0.44); and all three festival attributes had significant direct effects on overall satisfaction, with ‘Amenities’ being the highest (0.50). While all attribute categories had indirect effects on ‘Re-visit intention’, only ‘Amenities’ had direct effects on ‘Re-visit intention’ (0.16) and also the total effects of ‘Amenities’ on ‘Re-visit intention’ (0.65) was more than triple the effects of ‘Programmes’ (0.21) and ‘Entertainment’ (0.14). This result showed that the most important festival quality the impacted on ‘Re-visit intention’ through mediation factors (overall experience quality and overall satisfaction) was amenities’ quality (total effect: 0.65).
Table 3 Direct, Indirect and Total Effects of Festival Quality on Visitor Experience Quality,
Satisfaction and Re-visit intention Festival quality
Overall experience quality Overall satisfaction Re-visit intention Direct Indirect Total Direct Indirect Total Direct Indirect Total
Amenities .435 - .435 .495 .217 .712 .155 .497 .652 Program .235 - .235 .186 .117 .303 - .211 .211
Entertainment .165 - .165 .124 .082 .206 - .144 .144
CONCLUSIONS The present study was conducted in response to the call for research by Cole and Chancellor (2009)
who suggested the inclusion of other attributes (amenities’ and programmes), in addition to entertainment, as a predictor of visitor experience, satisfaction and re-visit intention in future research. The findings from the present study suggested that all of the attributes proposed in the model had significant impacts on the quality of the visitors’ experience, satisfaction and re-visit intention to the Slow Food festival in the future. While all three festival attributes studied had significant impacts on the visitors’ experience quality, the impact of amenities’ quality was much stronger than the other two attribute qualities. At the same time, amenities’ quality also had a much stronger impact on visitors’ overall satisfaction and re-visit intention than programmes’ and entertainment quality. It is confirmed that amenities’ quality was the key to the success of the Slow Food festival, when using re-visit intention as an indicator of the festival’s success. Theoretically, this study confirmed that Cole and Chancellor’s model is not an appropriate one in the context of the Slow Food festival; unlike Cole and Chancellor’s study, it was found that amenities’ quality was the most important quality and also the most influential quality which affects re-visit intention. The present study contributes to the development of a best fit model for Slow Food festivals by adding new paths from programmes to satisfaction and from entertainment to satisfaction. Practically, the findings of this study suggest that the organisers of Mold Slow Food festival should focus more on encouraging participation from and promoting amenities-related features such as quality of food and beverage, availability of locally produced food and drink, local food producers, local organisations’ exhibits and interactive foodie activities during the food festival. Further, it is suggested that stakeholder collaboration and partnership among destination marketing organisations, local government, tourism associations and food producers in Mold are essential for the continued success of the Slow Food festival by increasing the amenities’ quality.
REFERENCES
Baker, D. A., & Crompton, J. L. (2000).Quality, Satisfaction and Behavioral Intentions. Annals of Tourism Research, 27(3), 785–804. Cole S. T., & Chancellor, H. C. (2009). Examination the Festival Attributes that Impact Visitor Experience, Satisfaction and Re-visit Intention. Journal of Vacation Marketing, 15(4), 323-333. Cole, S. T., & Illum, S. F. (2006). Examining the Mediating Role of Festival Visitors’ Satisfaction in the
Relationship between Service Quality and Behavioral Intentions. Journal of Vacation Marketing, 12(2), 160–73. Cole, S. T., & Scott, D. (2004). Examining the Mediating Role of Experience Quality in a Model of Tourist
Experiences. Journal of Travel & Tourism Marketing, 16(1), 77–88. Lee, J., & Beeler, C. (2007). The Relationships among Quality, Satisfaction, and Future Intention for First
-Time and Repeat Visitors in a Festival Setting. Event Management, 10, 197–208. Nunnally, J. C. (1978). Psychometric Theory. (2nd ed.). New York: McGraw-Hill. Petrick, J. F. (2004). The Roles of Quality, Value, and Satisfaction in Predicting Cruise Passengers’ Behavioral Intentions. Journal of Travel Research, 42, 397–407. Thrane, C. (2002). Music Quality, Satisfaction, and Behavioral Intentions within a Jazz Festival Context.
Event Management, 7, 143–50. Tian-Cole, S., Crompton, J. L., & Willson, V. A. (2002). An Empirical Investigation of the Relationships
between Service Quality, Satisfaction and Behavioral Intentions among Visitors to a Wildlife Refuge. Journal of Leisure Research, 34(1), 1–24.
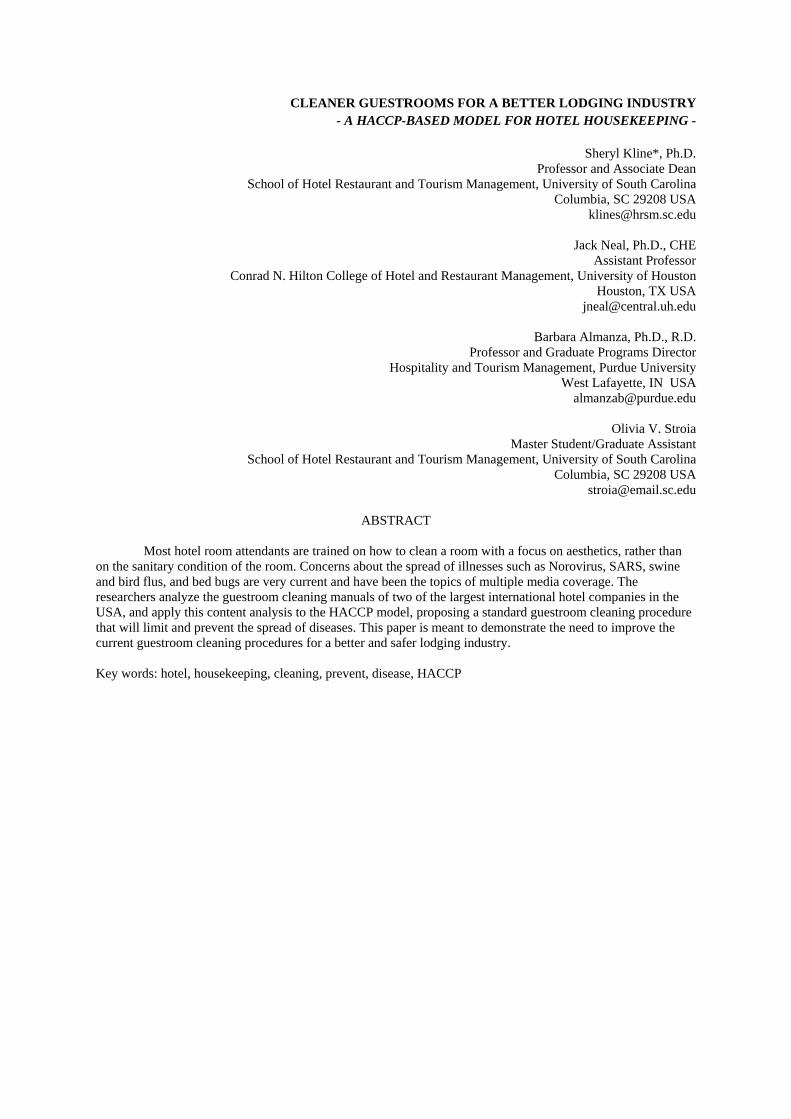
CLEANER GUESTROOMS FOR A BETTER LODGING INDUSTRY - A HACCP-BASED MODEL FOR HOTEL HOUSEKEEPING -
Sheryl Kline*, Ph.D.
Professor and Associate Dean School of Hotel Restaurant and Tourism Management, University of South Carolina
Columbia, SC 29208 USA [email protected]
Jack Neal, Ph.D., CHE
Assistant Professor Conrad N. Hilton College of Hotel and Restaurant Management, University of Houston
Houston, TX USA [email protected]
Barbara Almanza, Ph.D., R.D.
Professor and Graduate Programs Director Hospitality and Tourism Management, Purdue University
West Lafayette, IN USA [email protected]
Olivia V. Stroia
Master Student/Graduate Assistant School of Hotel Restaurant and Tourism Management, University of South Carolina
Columbia, SC 29208 USA [email protected]
ABSTRACT
Most hotel room attendants are trained on how to clean a room with a focus on aesthetics, rather than
on the sanitary condition of the room. Concerns about the spread of illnesses such as Norovirus, SARS, swine and bird flus, and bed bugs are very current and have been the topics of multiple media coverage. The researchers analyze the guestroom cleaning manuals of two of the largest international hotel companies in the USA, and apply this content analysis to the HACCP model, proposing a standard guestroom cleaning procedure that will limit and prevent the spread of diseases. This paper is meant to demonstrate the need to improve the current guestroom cleaning procedures for a better and safer lodging industry. Key words: hotel, housekeeping, cleaning, prevent, disease, HACCP
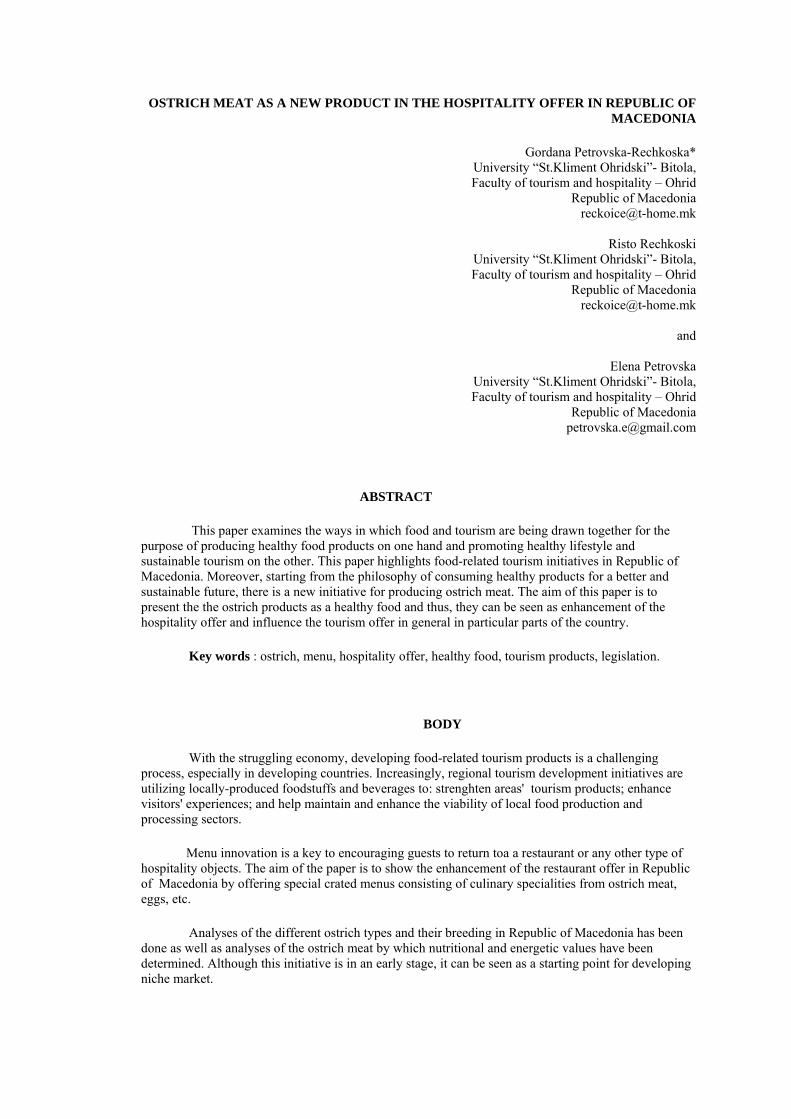
OSTRICH MEAT AS A NEW PRODUCT IN THE HOSPITALITY OFFER IN REPUBLIC OF MACEDONIA
Gordana Petrovska-Rechkoska* University “St.Kliment Ohridski”- Bitola, Faculty of tourism and hospitality – Ohrid
Republic of Macedonia [email protected]
Risto Rechkoski
University “St.Kliment Ohridski”- Bitola, Faculty of tourism and hospitality – Ohrid
Republic of Macedonia [email protected]
and
Elena Petrovska
University “St.Kliment Ohridski”- Bitola, Faculty of tourism and hospitality – Ohrid
Republic of Macedonia [email protected]
ABSTRACT
This paper examines the ways in which food and tourism are being drawn together for the purpose of producing healthy food products on one hand and promoting healthy lifestyle and sustainable tourism on the other. This paper highlights food-related tourism initiatives in Republic of Macedonia. Moreover, starting from the philosophy of consuming healthy products for a better and sustainable future, there is a new initiative for producing ostrich meat. The aim of this paper is to present the the ostrich products as a healthy food and thus, they can be seen as enhancement of the hospitality offer and influence the tourism offer in general in particular parts of the country.
Key words : ostrich, menu, hospitality offer, healthy food, tourism products, legislation.
BODY
With the struggling economy, developing food-related tourism products is a challenging process, especially in developing countries. Increasingly, regional tourism development initiatives are utilizing locally-produced foodstuffs and beverages to: strenghten areas' tourism products; enhance visitors' experiences; and help maintain and enhance the viability of local food production and processing sectors.
Menu innovation is a key to encouraging guests to return toa a restaurant or any other type of hospitality objects. The aim of the paper is to show the enhancement of the restaurant offer in Republic of Macedonia by offering special crated menus consisting of culinary specialities from ostrich meat, eggs, etc.
Analyses of the different ostrich types and their breeding in Republic of Macedonia has been done as well as analyses of the ostrich meat by which nutritional and energetic values have been determined. Although this initiative is in an early stage, it can be seen as a starting point for developing niche market.
Аnlyses of the relevant tourism literature and the promotional material of variuos destionations indicate that the role of food in marketing of destinations has until recently received very little attention gobally and locally. All indications, however, are that the local food holds much potential to enhance sustainability in tourism; contribute to authenticity of the destionation; strenghten the local economy; and provide for the environmentally friendly infrstructure.
Although results are very promising, this sector also faces different kind of problems such as: no specialized slaughterhouses for ostriches, lack of organized buy products from ostrich, etc. Republic of Macedonia is currently drafting a guide for building slaughterhouses for ostriches in accordance with modern requirements and application of HACCP standards en EU legal framework. New standards in the production of food lead manufacturers to develop programs to ensure the quality of menu components. In Macedonia there should be prepared slecial legislative framework emphasizing the produciton and breeding of ostriches. For real promotion and further development of these food-related tourism products in our country, tourism organisations should provide education to the ones involved in this process as well.
REFERENCES
Official Gazette of Republic of Macedonia (2007). Manual on minimum technical and technological requirements to meet the facilities and equipment for slaughtering ostriches and facilities and equipment for cutting meat from ostriches-, No. 11-15338/1 from 22 October.
Marinoski, N. (2012). Touristic geography of Republic of Macedonia, Ohrid.
Martinoska, S. (2008). Food processing management in the hospitality, Ohrid.
Maslinkov, B. (2001). Environmental protection, Bitola.
Presilski, S. (2008). Technology of breeding ostriches and processing of products from ostriches- Faculty of biotechnical sciences, Bitola.
Reckoska, G. (2007). Nutrition, Ohrid.
Reckoska, G. & Proeva, K. (2011). Prospects for breeding ostriches in Macedonia. Tourism, ecology, nutrition – study project, Faculty for tourism and hospitality.
Reckoska, G. (2008). Research methods for food goods, Ohrid.
This, H. (2006). Molecular gastronomy. Columbia University press, New York.
ICT and E-Business in the Hospitality Industry in The Republic of Macedonia
by: prof. Mirjana Sekulovska, PhD University St. Kliment Ohridski - Bitola
Faculty of Tourism and Hospitality - Ohrid e-mail: [email protected]
Emilijan Sekulovski, BSc. in Computer Science
Master Study in Engineering of Computing Systems Politecnico di Milano, Italy
e-mail: [email protected] Abstract This poster presentation focuses on Information and Communications Technology (ICT) and e-business in the hospitality in the Republic of Macedonia. Internet and e-commerce are organizational resources and tools that are already widely used by businesses, people, government institutions and nongovernmental organizations (NGOs). Internet usage and e-commerce are becoming a necessity in the hotel and hospitality industry. The Internet as ICT becomes more massively and more widely used for communication between hospitality venues and their customers. Not only that, but it also becomes the basis for successful presentation of those venues in the hospitality industry. Our research describes how companies in this industry in the Republic of Macedonia are using ICT for running business. Also, considering the fact that today companies in the hospitality industry are faced with relevant competitive challenge, our research is focused on the implementation of ICT and e-business in their operations as crucial to rise above the others, keep the first place and in the end hospitality for a better world. For this purpose we used poll and interviews with top management from a representative number of hotels and hospitality venues located in the Republic of Macedonia. The poster presentation, along with the data from polls and interviews will be presented in tables, and we will also include some WEB sites/portals of hotels and restaurants. Data from polls and interviews reveals that in the Republic of Macedonia the use of Internet, modern software solutions and e-commerce in the hospitality industry is growing fast. But, the classic (static) WEB sites are still the most exploited Internet service of the hotels and hospitality venues in the Republic of Macedonia. Today, WEB site implementation does not require some big investment, therefore almost all small businesses in the hospitality industry have their own WEB sites. Web sites are usually implemented in a relatively short time, and besides the information regarding the hotel, the rooms and online reservation, they often contain information for the city and its tourist attractions and various events in the cities. Polls are revealing that large and medium businesses in hospitality in Macedonia have started implementing ERP systems, which can provide a bridge towards further evolution of the e-business in this industry. Financial and accounting software applications have even greater application in the hospitality. They are cheaper than the ERP systems and can generate various financial reports useful for the hospitality management for future decision-makings. It is too soon to talk about the standardization and interoperability of ICT and e-business. According to the EU directives through the state policy of Macedonia, they will be first introduced in the state institutions. From the polls we can conclude that the main restrictions of using the ICT and e-business solutions in hospitality are the size of the company and the cost of business reengineering. Small hospitality companies believe that it is not economically reasonable to invest in developing technologies for e-business. Also, according to the polls and interviews, Internet security is another barrier when it comes to applying e-business in hospitality. The conclusion from our research is actually a general conclusion, that ICT and e-business are becoming very important factors for maintaining an effective and efficient hospitality business, support its rapid development, strengthen the market competitiveness, and thus achieving better economic development. Key words: ICT-information communication technologies, e-business, internet, hospitality, management.
SPECIFICITY, FINANCIAL CONTRACT, AND LIQUIDITY OF COMMERCIAL REAL ESTATE: A CONCEPTUAL MODEL FOR LODGING PROPERTIES.
Inès Blal *
Ecole Hôtelière de Lausanne HES-SO (University of Western Switzerland)
1000 Lausanne 25 Switzerland
Nicolas Graf ** ESSEC Business School Avenue Bernard Hirsch 95000 Cergy-Pontoise
France [email protected]
ABSTRACT
Although existing research shows that tangible attributes are critical to properties’ value, little is known about the relationship between the physical characteristics, the liquidity and the operating mode of lodging properties. Built around five propositions, the theoretical model proposed in this article integrates constructs from the real estate literature, financial contracts and Transaction Cost Economics (TCE) to depict the relationships between the liquidity of the hotel property, its specificity and its attached operating contract. This model underlies the dynamics of three highly significant phenomena in hospitality industry: the growing importance of the lodging properties as a class of asset in the real estate market, the development of asset-light strategies, and the choice and duration of contracts between asset owners and operators.
Key Words: lodging property, asset specificity, financial contract, liquidity.
INTRODUCTION
The market for lodging properties has significantly grown over the past two decades to reach a record $122 Billion in global transaction volume in 2007 (Jones Lang LaSalle, 2012). As the market is rebounding from its depressed levels of 2008 to 2010, there is little doubt it will continue to grow and remain a significant commercial real estate asset class.
The emergence of hotels as a core real estate asset class – joining the traditional group that includes retail, office, residential and industrial real estate - can be explained by three key factor: (1) the relative low performance of alternative investments, (2) the wider pool and increased sophistication of real estate investors, and (3) the asset-light strategies of most international hotel groups.
First, the decade-long low performance of equity markets, coupled with extended periods of low inflation and interest rates, have triggered capital to seek higher yields in alternative investment vehicles, including real estate. The scarcity of traditional real estate investment opportunities forced investors to broaden their investment territories and brought many to consider hotels – directly or indirectly – as potential investments (Larkin and Lam, 2007).
Secondly, the influx of new investors in the hotel market has been facilitated by the global development of Real Estate Investment Trusts (REITs) or of similar regimes, which increased the attractiveness of the industry through tax benefits. This was coupled with the increased sophistication of both the investors – with more expertise about hotels – and of the operating modes available to them, including fixed and variable leases and management contracts.
Third, the development of asset-light strategies followed by all major hotel management companies, involving the separation of the “bricks and mortar” from the management, branding and distribution of hotels, provided investors with knowledgeable and reputable partners. With this separation and the increasingly common use of management or lease contracts, as opposed to wholly owned subsidiaries, some hotel properties have likely gained in liquidity and it has become easier for investors to buy and sell them while retaining the choice to have it operated, branded and distributed by a preeminent management company.
These developments are well acknowledged by the industry and academic communities. Yet, little is known about the precise relationship between the physical characteristics, the liquidity and the operating mode of lodging properties. In other words, what roles do the physical characteristics of a hotel property play in determining its attractiveness in the real estate investment market? What makes a hotel property a more liquid investment? How does this liquidity affect the choice of the operating mode? If hotel operation is externalized, how does the asset liquidity affect the nature and duration of the operating contract?
In this conceptual article, we develop a model depicting these relationships and theoretically answer these research questions. We link arguments from TCE, financial contracting and real estate literatures to develop five propositions that contribute to the understanding of three highly significant phenomena: the growing importance of the lodging properties as a class of asset in the real estate market, the development of asset-light strategies, and the choice and duration of contracts between asset owners and operators.
LITERATURE REVIEW
Asset Specificity
Transaction Cost Economics (TCE) theory is concerned with the boundaries of the firm and details how “make” or “buy” decisions are made. The theoretical framework suggests that firms make choices that minimize the governance costs related to the acquisition of inputs necessary to the operation of the business, including the costs of searching, negotiating, bargaining, and contracting (Williamson, 1975). According to TCE, asset specificity, or the transferability of assets, is essential in shaping economic transactions and in determining the related governance costs (Rindfleusch and Heide, 1997; Riordan and Williamson, 1985). The TCE fundamental proposition is that the acquisition or sale of an asset which is specific to a contract will generate “differential costs of adaptation” (Riordan and Williamson, 1985:368). Specific assets being “nonredeployable physical and human investments that are specialized and unique to a task” (Erramilli and Rao,
1993: 21), their transfer of property have a high likelihood of generating significant costs as opposed to non-specific assets.
The main justification to linking specific assets to high transaction costs is that they generate “durable investments that are undertaken in support of particular transactions” (Williamson, 1985:55), and hence create a potential for ex- post holdup and opportunistic behavior from the party investing in the non-contractible asset. Consequently, the costs associated with the transaction are increased and augment the probability of seeing the asset integrated through hierarchical governance rather than externalized through a sequential contractual relationship.
Williamson (1996) lists six types of asset specificity in the TCE literature: site, physical asset, human asset, dedicated assets, brand name capital, and temporal. The general proposition of TCE has been extensively tested and validated empirically on all types of specific assets. Mahoney (1992) and Macher and Richman (2008) provide surveys of empirical research on the significance of asset specificity in the choice of vertical integration. The vast majority of these studies validate the TCE proposition.
TCE theory explains the costs involved in transactions – or contracts – and suggests that the tradeoff made between risk and return in a transaction is primarily governed by the notion of control obtained by ownership and integration. Yet, TCE theory does not provide many details on how organizations or agents implement effective control mechanisms through the various contractual arrangements that exist. In contrast, financial contracting theory provides detailed explanations as to the nature of the contracts and their key terms.
Financial Contracts
Financial contracting theory finds its roots in agency theory and the classic work of Jensen and Meckling (1976) which characterized firms as a nexus of contracts. Whereas agency theory is concerned with the principal-agent relationship in general, the financial contracting theory’s focus is on the determinants of the contractual terms between the principal and the agent, usually taking an investor (principal) and entrepreneur’s (agent) perspective. In other words, the financial contracting theory infers that contracts are the solutions to the conflicts of interests of agency problems between a principal and an agent.
Amongst the various issues studied in the financial contracting literature, the relationship between the liquidity of the asset, its financing and the allocation of control rights are the most relevant to our research questions. In financial contracts, the liquidity of an asset is defined by it liquidation value, which refers to the degree of redeployability of an asset in its current use and in its second-best use (Benmelech, 2009). Theoretical arguments generally suggest that liquid assets enjoy lower expected cost of financing and higher loan-to-value ratios as their market value in their current and second-best use are at or close to fair market value. Hence, the right to foreclose on an asset has a higher residual value for liquid assets, thereby diminishing the cost of financing and increasing the debt capacity of the asset (e.g. Shleifer and Vishny, 1992; Benmelech, 2009).
Theoretical arguments on the relationship between asset liquidity and debt or financial contract maturity are more ambiguous on their predictions. While most studies on the maturity of secured debts suggest that the degree of liquidity of an asset is positively related to the maturity of the debt, other studies argue that the relationship is more complex and that it is mediated by the allocation of control rights on the cash flows during the duration of the contract, and by the degree to which the ownership of the asset is transferred to the investor at the end of the contract. In the case of secured debts, Scheifer and Vishny (1992), Morellec (2001), Benmelech et al. (2005), and Benmelech, (2009) show that firms with a high proportion of liquid assets enjoy higher debt ratios with lower cost of debt and longer maturities than firms with fewer liquid assets. For instance, Benmelech (2009) studied the effect of asset liquidation value on the maturity of secured debt in the nineteenth-century U.S. railroad industry. Using the similarity of gauge between the buyer and the seller as a proxy for the salability of rolling stock and roads (i.e. liquidity of the asset), the author showed that buyers of both assets (i.e. rolling stock and roads) enjoyed a significantly higher debt ratio and maturity when the asset was liquid.
In contrast to those studies focusing on the maturity of secured debt, which assume the control of the cash flows during the duration of the contract through the collateralization of the asset and no transfer of ownership at the end of the contract – the ownership remains with the entrepreneur (i.e. the agent) and not with
the investor (i.e. the principal) – financial contracts involving an owner (i.e. investor or principal) and an operator (i.e. entrepreneur or agent) have been viewed as yielding different predictions. For instance, Gavazza (2010) studied the impact of asset liquidity on aircraft leases and showed that the liquid aircraft had longer lease maturities for capital leases, but shorter maturities in the case of operating leases. In capital leases, the lessee (i.e. the operator or the entrepreneur) acquires ownership of the asset at the maturity of the contract, while in an operating lease, no ownership is transferred and the lessor (i.e. the owner or the principal) retains the ownership of the asset. The theoretical argument explaining the relationship uncovered by Gavazza (2010) is that capital leases have a similar structure as secured debt since ownership is not transferred. Thus, as in the case of secured debt, liquid assets under capital leases enjoy higher loan-to-value ratios and longer maturities.
On the contrary, the preservation of ownership for the lessor at the end of the contract creates three incentives for both parties to engage in long-term contracts for illiquid assets (and hence, shorter-term contracts for liquid assets). First, illiquid assets being more difficult to redeploy, the lessor should favor longer contracts to avoid the potential loss resulting from the lower liquidation value of the asset. Secondly, illiquid assets require regular specific investments (i.e. non-contractible investments) which increase the probability of opportunistic behavior from either party. Hence, the lessee should also favor longer-term contracts for illiquid assets (Gavazza, 2010). Thirdly, liquid assets, when owned, offer an opportunity for the lessor to reallocate the asset to other lessees when outside options are of a higher value than in the initial lease. As a consequence, the lessor – again – should favor the option provided by shorter contracts for liquid assets (Ruzzier, 2009).
In summary, the literature on financial contracting suggests that the liquidity of an asset determines the duration of the contract between the principal and the agent. When the control rights or ownership of the asset is transferred at the end of the contract, as in the case of secured debt and capital leases, liquid assets will call for longer-term contracts than illiquid assets. On the contrary, when the control rights or ownership of the asset remains with the principal at contract maturity, then liquid assets will favor shorter-term contracts.
Real Estate Market Liquidity
Research in real estate explores market liquidity from two perspectives (Krainer et al. 2010). The first approach focuses on the real estate transaction and thus, regards illiquid markets as those where expected times to sale are long (Wheaton, 1990; Krainer, 2001). The second stream of research considers the role of debt in real estate markets and view liquidity as the cash available in the market at a certain time (Stein, 1995; Shleifer and Vishny, 1992; Kelly and LeRoy, 2007). Both research paths offer valuable insights into the relationship between liquidity and asset specificity of real estate assets. Defining market liquidity in terms of time of sale (or time on the market) relates to the question of asset redeployability from a transaction perspective. Similarly, considering market liquidity in relation to the financing and cash available on the market allows integrating findings from the financial contract theory and asset specificity to explore the dynamics relating properties specificities, liquidity and operating contracts.
In the first perspective on market illiquidity, the time to sale and marketing period are the determinants of the degree of liquidity. In other words, assets that are more difficult to transfer, or redeploy, are those that stay longer on the market and require more marketing time (Krainer, 1999; Lin and Vandell, 2007). The rationale is as follow: the real estate market is decentralized and characterized by the heterogeneity of its traded goods. As a result, research costs are higher in these markets than in financial markets, which are generally centralized and trade homogeneous goods. The buyer needs to invest in searching costs to appraise the degree of specificity of the asset. These search costs affect the marketing period and the time to sale of the real estate asset, which in turn affect its selling price, and liquidity. In sum, liquid markets are those that offer limited marketing period, time to sale and therefore low levels of search costs. In this perspective, real estate markets have “cold” and “hot” periods that are defined by the time to sale and marketing period (Krainer, 2001). As for the effect of the market on these relations, it demonstrates that financial constraints of the seller (through their available equity) affect their requirement of marketing periods and selling prices (Krainer, 2001; Genesove and Mayer, 1997; Stein, 1995).
In the real estate literature stream, which approaches market liquidity from a cash availability standpoint, illiquid markets affect the determinants of liquidation values of assets. Building on the fire sale literature in finance, this stream in real estate research proposes that the industry debt capacity affects the price of an asset in liquidation relative to its value in best use (Kelly and LeRoy, 2007; Kruse, 2002; Shleifer and Vishny, 1992, Stein 1995,). In other words, the lack of (or abundance of) financing in the asset’s industry affects the capacity
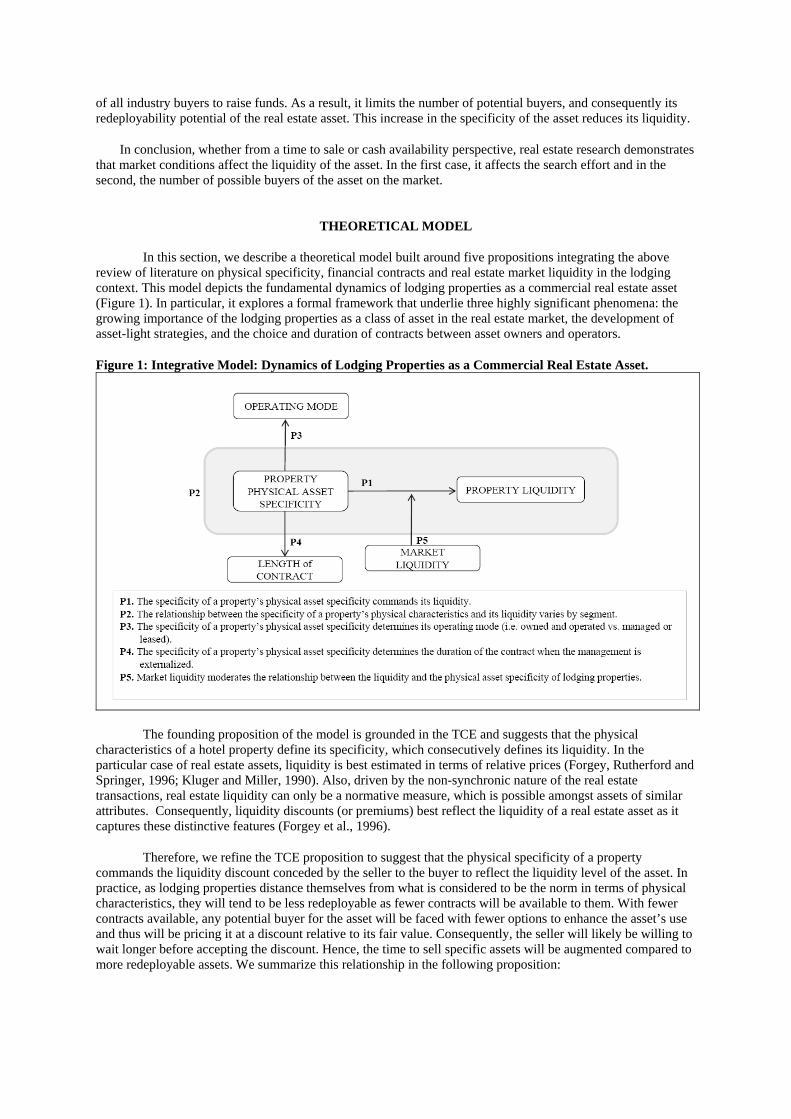
of all industry buyers to raise funds. As a result, it limits the number of potential buyers, and consequently its redeployability potential of the real estate asset. This increase in the specificity of the asset reduces its liquidity.
In conclusion, whether from a time to sale or cash availability perspective, real estate research demonstrates that market conditions affect the liquidity of the asset. In the first case, it affects the search effort and in the second, the number of possible buyers of the asset on the market.
THEORETICAL MODEL
In this section, we describe a theoretical model built around five propositions integrating the above review of literature on physical specificity, financial contracts and real estate market liquidity in the lodging context. This model depicts the fundamental dynamics of lodging properties as a commercial real estate asset (Figure 1). In particular, it explores a formal framework that underlie three highly significant phenomena: the growing importance of the lodging properties as a class of asset in the real estate market, the development of asset-light strategies, and the choice and duration of contracts between asset owners and operators.
Figure 1: Integrative Model: Dynamics of Lodging Properties as a Commercial Real Estate Asset.
The founding proposition of the model is grounded in the TCE and suggests that the physical characteristics of a hotel property define its specificity, which consecutively defines its liquidity. In the particular case of real estate assets, liquidity is best estimated in terms of relative prices (Forgey, Rutherford and Springer, 1996; Kluger and Miller, 1990). Also, driven by the non-synchronic nature of the real estate transactions, real estate liquidity can only be a normative measure, which is possible amongst assets of similar attributes. Consequently, liquidity discounts (or premiums) best reflect the liquidity of a real estate asset as it captures these distinctive features (Forgey et al., 1996).
Therefore, we refine the TCE proposition to suggest that the physical specificity of a property commands the liquidity discount conceded by the seller to the buyer to reflect the liquidity level of the asset. In practice, as lodging properties distance themselves from what is considered to be the norm in terms of physical characteristics, they will tend to be less redeployable as fewer contracts will be available to them. With fewer contracts available, any potential buyer for the asset will be faced with fewer options to enhance the asset’s use and thus will be pricing it at a discount relative to its fair value. Consequently, the seller will likely be willing to wait longer before accepting the discount. Hence, the time to sell specific assets will be augmented compared to more redeployable assets. We summarize this relationship in the following proposition:
P1. The specificity of a property’s physical asset specificity commands its liquidity.
As abovementioned, the normative nature of the evaluation that buyers and sellers establish on real estate assets implies that measuring liquidity is consistent when established within categories of similar assets. In the lodging properties investment context, similar assets are classified in market segments. There are several classification methodologies according to different variables (Berger and Chiaofaro, 2007), the most common rely on room rates (i.e.: upscale, economy), service level (i.e.: full-service or limited-service), location (i.e.: urban, airport, resort) or the customer profile (i.e.: business, convention). These classifications are used in the valuation processes to group lodging real estate properties as the correct positioning and the selection of the corresponding brand is the key for the success of a lodging property (Hanson et al., 2009). In sum, since the physical attributes of properties in each of this segment vary with the market it caters, we hypothesize that the relationship between the specificity of a property’s physical characteristics and its liquidity varies by segment. This relationship is presented in the following second proposition:
P2. The relationship between the specificity of a property’s physical characteristics and its liquidity varies by segment.
Building on this initial set of relationships derived from TCE and defining asset liquidity, we integrate the contributions of the theory on financial contract. In particular, we rely on research from this body of literature to explain how liquidity discounts determine the nature of the contract between the asset owner and the operator. We suggest that less liquid assets are more likely to be integrated and that more liquid assets are more likely to externalize the operation as in the case of management and lease contracts. As per TCE logic, less liquid assets would generate significant transaction costs related to searching and enforcing an external contract, such as a lease or management agreement. Consequently, hierarchical governance mechanism (i.e. owned and operated) is likely to be more efficient for illiquid assets as search and enforcement costs are more likely to exceed the internal governance costs.
To illustrate this relationship, consider a highly illiquid property operated by its owner. This asset’s physical attributes are highly specific to this particular operator, whose operations deviate from the standards of its market. When this illiquid asset is placed on the market for sale, potential buyers will appraise its income-generating potential as a commercial real estate investment. Since this asset was designed to fit a particular operator, the costs associated to enforce an external contract with another operator are likely to be high for the new owner. Not to mention that the investor will have to adapt the asset to the operating need of the new contract. Therefore, the option of externalizing it becomes too expensive and only potential owners-operators would be attracted by this property as they would not incur enforcement costs. We synthesize this relation in the following proposition:
P3. The specificity of a property’s physical asset specificity determines its operating mode (i.e. owned and operated vs. managed or leased).
The second stage of integration also pertains to the contributions from the theory on financial contracts. In this fourth proposition, we suggest that hotel asset liquidity affects the duration of the operating contracts. In particular, we integrate findings from the financial contracts to postulate that more liquid assets will command shorter operating contracts. Contrary to capital leases or debt, operating contracts – including operating leases and management agreements – see the ownership of the asset remain with the investor rather than with the entrepreneur. As a consequence, both parties have incentives for shorter contract durations for non-specific and liquid assets.
For example, reconsider the highly illiquid asset cited above, which is operated by its owner. In the event this owner decides to contract an operator under a lease or a management agreement, s/he will know that her/his asset will be difficult to redeploy on the market. Hence, to avoid the costs associated with having to redeploy it in the short-term, s/he will prefer to secure a longer duration for this contract. Based on the theory on financial contracts, the owner/lessor of this illiquid property aims at avoiding potential losses from the lower liquidation value of the asset. In other words, we formulate the following proposition:
P4. The specificity of a property’s physical asset specificity determines the duration of the operating contract when the management is externalized.
Finally, we complement this set of relationships with the findings from the real estate literature on the effect of market liquidity on asset liquidity. In particular, we integrate the fact that the availability of cash on the
market affects the total number of potential buyers at the time of sale of an asset and that search costs affect the time to sell and the marketing period for the asset. In other words, the degree of liquidity of the market can either amplify or reduce the effect of physical asset specificity on its liquidity. In our example of an illiquid lodging property, this means that, if the owner-operator is prospecting for a seller in an illiquid market, the liquidity of the asset is further hindered by the lack of cash for buyers or increased marketing and search costs. Hence, we postulate that:
P5. Market liquidity moderates the relationship between the liquidity and the physical asset specificity of lodging properties.
CONCLUSIONS
The contributions of the article lie in the innovative way in which it relates three bodies of knowledge into the hotel market context. It also significantly contributes to the understanding of three highly important phenomena: the growing importance of the market for lodging properties, the development of asset-light strategies, and the choice and duration of contracts between asset owners and operators. In sum, the model, through its five key relationships, depicts the dynamics of lodging properties as a commercial real estate asset class.
We mention in the introduction of this paper that the emergence of hotels as a key real estate asset class was due to the combination of three factors. First, the comparative performance of lodging properties to other asset classes, second the development of institutional public real estate equity and debt investors, and third, the asset light strategies of lodging groups. The founding proposition of this model suggests that the physical specificity of a property commands the liquidity discount conceded by the seller to the buyer. In particular, lodging properties that distance themselves from what is considered to be the norm in terms of physical characteristics will tend to be less redeployable. The fact that lodging groups pursue asset-light strategies, whereby they only operate real estate, combined with the increased role of public real estate equity and debt vehicles such as the REITs as property owners, has lead to a uniform offer of operating models. This development of new standardized offers, which allows each party to achieve its objectives and meet its needs, has lead to the development of the market for lodging properties. Consequently, this new market system has also affected the offer and duration of contracts between these two parties.
This new insights into the dynamics of lodging properties as real estate investment opens several leads for further theoretical integration as well as empirical research. Links and bridges with other findings related to the literature on TCE and financial contracts can be further examined. For instance, the integration of the works on vertical disintegrations (Jacobides, 2005) can be a subject for another conceptual combination. Decentralization and heterogeneity are not the only particularities of the real estate market and assets. This market is also characterized by unobservable owner preferences, which impact the probability of the sale of an asset in a single period (Krainer et al., 2010). This element from the real estate literature could enhance our understanding of the disintegration dynamics. Further, developing on the literature on financial contract in this setting would also lead to consider the question of the debt burden of the seller as a distorting effect on the transaction (Zhu, 2002) as the subject of future research. In particular, the impact of the loan-to-value of the seller on the liquidity premium could be examined and tested in future research endeavors.
Also, building on this model, future confirmatory studies can be conducted to empirically test these relationships. Thus, the first proposition could be tested through the examination of physical attributes of lodging properties and liquidity discounts and premium paid or conceded at their sales. This would entail the identification of norms within segments of the lodging markets that would to determine the degree of liquidity of an asset. Similarly, the fifth proposition suggesting that market liquidity moderates the relationship between asset specificity and liquidity could be tested by using “growth in sales and operating earnings” as proxy to market liquidity (Kruse, 2002) and liquidity premium as an operationalization of asset liquidity. In conclusion, future studies in these suggested areas would further contribute to our understanding of key investment questions pertaining to lodging properties as commercial real estate assets.
REFERENCES
Benmelech, E. (2009). Asset Salability and Debt Maturity: Evidence from the Nineteenth-Century American Railroads. Review of Financial Studies. 22(4), 1545-1584
Benmelech, E., Garmaise, M. Moskowitz, T. (2005). Do liquidation values affect financial contracts? Evidence
from commercial loan contracts and zoning regulation. Quarterly Journal of Economics. 120, 1121-1154.
Berger, B. B., & Chiofaro, D. J. (2007). Select-service hotels: a guide to understanding the lodging industry and
one of its most attractive segments (Unpublished Master’s Thesis). Massachusetts Institute of Technology, USA.
Erramilli, M.K., and Rao, C.P. (1993). Service Firms' International Entry-Mode Choice: A Modified Transaction-Cost Analysis Approach. Journal of Marketing. 57(3), 19-38. Forgey, F. A., Rutherford, R. C. & Springer, T. M. (1996). Search and liquidity in single-family housing. Real
Estate Economics, 24(3): 273-292. Gavazza, A. (2010). Asset liquidity and financial contracts: Evidence from aircraft leases. Journal of Financial Economics. 95, 62-84. Genesove, D. & Mayer, C. J. (1997). Equity and time to sale in the real estate market. The American Economic Review, 87(3), 255-269. Hanson, B., Mattila, A. S., O’Neil, J. W., & Kim, Y. (2009). Hotel rebranding and rescaling: effects on financial
performance. Cornell Hospitality Quarterly, 50(3), 360-370. Jacobides, M. G. (2005). Industry Change Through Vertical Disintegration: How and Why Markets Emerged in
Mortgage Banking. Academy of Management Journal, 58(3), 465-498.
Jensen, M., & Meckling, W. (1976). Theory of the firm: Managerial behavior, agency costs, and ownership structure. Journal of Financial Economics. 4: 305-360. Jones Lang Lasalle Hotels (2012, February 6). Hotel Investment Outlook 2012. Kelly, D. & LeRoy, S. (2007). Liquidity and liquidation. Economic Theory, 31(3), 553-572. Kluger, B. D. & Miller, N. G. (1990). Measuring residential real estate liquidity. Real Estate Economics, 18(2),
145-159. Krainer, J. (1999). Real estate liquidity. FRBSF Economic Review, 3, 14-26. Krainer, J. (2001). A theory of liquidity in residential real estate. Journal of Urban Economics, 49, 32-53. Krainer, J. Spiegel, M.M. & Yamori, N. (2010). Asset price persistence and real estate market illiquidity:
evidence from Japanese land values. Real Estate Economics, 38(2), 171-196. Kruse, T. (2002). Asset liquidity and the determinants of asset sales by poorly performing firms. Financial
Management, Winter, 107-129. Larkin, D. And Lam, C. (2007). Hotels – The Fifth Food Group?. Journal of Retail and Leisure Property. 6(1),
23-28. Lin, Z. & Vandell, K. D. (2007). Illiquidity and pricing biases in the real estate market. American Real Estate
and Urban Economics Association, 35(3), 291-330. Macher, J. T. and Richman, B. D. (2008). Transaction cost economics: an assessment of empirical research in
the social science. Business and Politics. 10(1), 335-361.
Mahoney, J. T. (1992). The choice of organizational form: Vertical financial ownership versus other methods of
vertical integration. Strategic Management Journal. 13(5), 559-584. Morellec, E. (2001). Asset liquidity, capital structure and secured debt. Journal of Financial Economics. 61(1),
173-206 Rindfleusch, A. and Heide, J.B. (1997). Transaction cost analysis: Past, present, and future applications. Journal
of Marketing. 61(4), 30-54. Riordan, M.H. and Williamson, O.E. (1985). Asset specificity and economic organization. International Journal
of Industrial Organization. 3(4), 365-378. Ruzzier, C. A. (2009). Asset Specificity and Vertical Integration: Williamson’s Hypothesis Reconsidered.
(Harvard Business School Working Paper 09-119). Shleifer, A. and Vishny, R. (1992). Liquidation values and debt capacity. The Journal of Finance, 47(4), 1343-
1366. Stein, J. (1995). Prices and trading volume in the housing market: a model with downpayment effects. Quarterly
Journal of Economics, 110(May), 379-406. Wheaton, W. (1990). Vacancy, search, and prices in a housing market matching model. Journal of Political
Economy, 89, 1270-1292. Williamson, O. E. (1975). Market and Hierarchies: Analysis and Antitrust Implications. New York: Free Press. Williamson, O. E. (1985). The Economic Institutions of Capitalism: Firms, Markets, Relational Contracting. New York: Free Press. Williamson, O.E. (1996). The Mechanisms of Governance. New York: Oxford University Press. Zhu, H. (2002). The case of the missing commercial real estate cycle. BIS Quarterly Review, September, 56-66.
A study of the evolution of high-end wines in Switzerland
Philippe Masset (*) [email protected]
Jean-Philippe Weisskopf
Vincent Deboccard [email protected]
Ecole Hôtelière de Lausanne
1000 Lausanne 25, Switzerland.
Abstract
In this paper, we analyze the evolution of fine wine prices over the period 2000-2010 on the Swiss market. We first estimate a fine wine index with several sub-indices (e.g. Bordeaux index, First growth index) using hand-collected hammer prices from Steinfels – the leading wine auction house in Switzerland. We then study the evolution of these wine indices. Not surprisingly, we find that high-end wines have achieved impressive returns over the last decade, with first growths from the Médoc being the very best performers. They have significantly outperformed Swiss stocks whilst maintaining a weak correlation with traditional asset classes like equities and bonds. These results confirm previous evidence that fine wine can be considered as an appealing alternative investment vehicle.
Keywords: wine, alternative assets, portfolio diversification
ACQUISITION PREMIUMS AND PERFORMANCE IMPROVEMENTS FOR ACQUIRERS AND TARGETS IN THE LODGING INDUSTRY
Jin-young Kim*
College of Hotel and Tourism Management Kyunghee University
1 Hoegi-Dong Seoul, Korea [email protected]
Linda Canina
School of Hotel Administration Cornell University
Ithaca, NY 14850, U.S.A. [email protected]
Abstract Merger and acquisition (M&A) theory suggests that mergers create value and that the offer premium is positively related to the synergistic gains. The possibility of non-value-related motivations has been raised due to the inconsistent empirical evidence. This paper analyzes manager’s motives for lodging acquisitions by examining the relationship between the offer premium and the performance changes of the target and the acquirer. We find a positive relationship only for the acquirer suggesting that the target serves as a crucial resource to improve the acquirer’s performance and the premium may be viewed as a payment for gaining control over those resources. We find no evidence for the argument of the market for corporate control or non-value-related motivations for M&A. Keywords: acquisition; premium; lodging industry
The Conditional CAPM in the Travel and Leisure Industry
Alexis Beck and Philippe Masset (*)
Ecole hôtelière de Lausanne Lausanne, Switzerland
Email: [email protected]
Abstract
This study aims at improving our understanding of hospitality stock returns and their determinants. We compare several asset pricing models and account for a variety of economic and financial factors that might affect the returns to gaming, lodging and restaurant stocks. The models compared are the static CAPM, the three-factor model of Fama and French (1992, 1993), the four-factor model of Carhart (1997) and the conditional CAPM of Ferson and Harvey (1991). So far, only a limited body of literature has addressed the issue of determining the most appropriate approach for the estimation of expected returns for hospitality companies (see, e.g., Lee, A. & Upneja, A. (2008)). This paper therefore aims at filing this gap.
Keywords: travel industry, hospitality industry, asset pricing models, CAPM, Fama-French, Conditional CAPM
1. INTRODUCTION AND LITERATURE REVIEW
It is generally agreed upon that investors will expect a higher return to compensate for a greater risk. However, while a significant part of research in finance is devoted to determining how investors as a whole value financial assets and cash flows, still many questions remain about how they perceive and quantify the risk-return relationship. Many models have been put forth over the last few decades but none has yet been able to fully explain how investors decide what premium to demand for a given level of risk.
A large number of studies have since tried to analyze and test the performance of the CAPM in explaining the returns on various securities. However, the empirical results of these papers do not tend to support the model in its original form as expected returns on many securities could not be explained satisfactorily by their systematic risk only. Many attempts have been made to devise other models that would correct the faults of the CAPM. Conditional models allow the risk factors to vary from period to period by making them functions of other variables, thus conditioning the risk factors (rather than the return itself). They are very similar in concept to the multi-factor model of Merton (1973) but bring an additional intuitive appeal by accounting for the dynamic nature of the world (Jagannathan and Wang, 1996) while keeping the general concept simple.
One of the problems associated with conditional models is that the state variables must be determined beforehand (Fama, French, 2004). In their work, Fama and French (1992, 1993) focus on the persistent anomalies that have been identified in many articles. The bottom line of their work is the development of a three factor model that supports the view that, while the CAPM might hold unconditionally (period per period), investors’ perception of risk might not be limited to systematic risk only.
This view is also shared in the lodging industry, where stocks are suspected to be consistently undervalued. A research paper by Lee and Upneja (2007) provides some empirical support to this claim. Following some evidence that the CAPM might be outperformed by other multi-factor models like the Fama-French (1992, 1993) model in predicting expected returns on hospitality stocks, Lee and Upneja (2008) and Lagji (2010) develop alternative models that include more “hospitality-specific” factors. Their results tend to confirm the failings of the single-factor CAPM in the industry. However, the body of literature on the subject remains quite limited and an efficient model for explaining the expected return (cost of equity) on hospitality stocks has yet to be developed. This paper thus aims at filling this gap. More specifically, it intends to test whether the advantage of the conditional CAPM of allowing integration of industry specific factors can provide better performance than the static CAPM and the Fama-French three-factor model.
The structure of the paper is as follows. In section 2, we describe our dataset and explain how we derive the various asset pricing models. Section 3 presents and analyses the empirical results and section 4 concludes.
2. METHODOLOGY AND DATA
Four particular sectors of the travel and leisure industry are considered: restaurants and bars, hotels, gambling and airlines. A conditional CAPM is initially derived and then compared to the other two most widely used models namely, the traditional CAPM and the Fama-French model. This provides an objective benchmark for measuring its performance.
The study is conducted for the US market since (i) more hospitality stocks are listed, which allows for a larger sample to be studied and thus generally better statistical significance; and (ii) the US market is by far the largest in market capitalization and volume, which should suggest a more efficient market and in turn reduce mispricing biases and time lags (Cornelius, 1993; Fama, 1998).
a. Model Selection
The conditional version of the CAPM as it was presented above seems the most appropriate model for the following reasons. First, it allows for variation through time of the parameters of the CAPM. As Jagannathan and Wang (1996) note, this idea of adjustment of the model to the conditions prevailing at the time of the test is more in line with the dynamic nature of the economy.
Second, in addition to allowing the adjustment of the parameters through time, it allows to adapt this variation with respect to the industry-specific risk factors of the assets being considered. This feature appears to be crucial in light of the findings of Lee and Upneja (2007, 2008) that support the fact that hospitality stocks might be undervalued and that it might be the case that investors’ perception of risk is multi-factorial. It emphasizes the importance of a better model, more adapted to the specifications of the hospitality industry.
Finally, the conditional CAPM maintains the intuitive appeal that has made the CAPM so popular. Furthermore, the addition of other variables (other than the systematic risk) does not necessarily involve complex data manipulation as it is the case with the Fama and French model. This last point is particularly important from an operationalization perspective. It is often forgotten but the ultimate objective of research is to deliver new knowledge and methods for them to be put in practice. Just as explanatory power has utility, complexity has disutility and one must take the two into account to evaluate a model. One too complex to be adopted in practice would therefore be no better than the CAPM.
Conceptually, the tested model takes the form of a time-series regression of observed excess returns on lodging stocks over multiple conditioning factors.
b. Model Derivation
For simplicity throughout the derivation of the model, let initially each of the conditioning factors be equal to such that the CAPM alpha and beta parameters can be written as followed
, , (1)
, , (2)
Expressing the general formula of the conditional CAPM in its regressive form one obtains equation (3), where ei is the error term.
, , (3)
The second step in the derivation is to substitute equations (1) and (2) into (3). In the interest of legibility, let also the market risk premium, , , , be equal to MRP.
, , (4)
Finally, distributing the terms and aggregating the error terms, which are all assumed to be normally distributed and uncorrelated, one obtains the general form of the conditional CAPM in equation (5).
, , (5)
The test procedure involves evaluating the alpha and beta as well as the and loading factors for each of the three conditioning variables through ordinary least squares regression.
c. The Conditioning Factors
The fundamental idea of a conditional CAPM model is to allow for time variation of both the market alpha and beta through explanatory state variables. This relies on the hypothesis that an asset’s systematic risk, its exposition to the business cycle, is multifactorial. In that sense, only macroeconomic variables should be economically meaningful in this framework as systematic risk, if indeed multifactorial, should be a function of systematic factors. Prior to more thorough analysis, a few of them appear of particular relevance to the present study.
LIBOR (L) – The effect of central banks’ discount rates has been successfully demonstrated by Chen, Huang and Chi (2008) and Chen (2011) but this effect has not been tested with a continuous scale and therefore ignores the amplitude of the changes. Discount rates are also not continuously adjusted and are therefore not as variable as other macroeconomic indicators. Furthermore, because of their corrective response nature, the changes in discount rates typically occur with a significant lag with respect to the state of the economy. On the other hand, the London Interbank Offered Rate (LIBOR) may act as a more dynamic proxy for base short-term interest rates.
Inflation (core) (I) – As argued by Chen, Roll and Ross (1986), financial theory suggests that inflation should be a determinant of systematic risk. They even provide empirical evidence in support of this statement in their study in which they evaluate the effect of changes in the consumer price index (CPI) on US stock returns.
Term Yield Spread (TS) – In the same study, Chen, Roll and Ross (1986), separate the effect of short term, unexpected inflation from that of long term, expected inflation. While unexpected inflation is measured by changes in the CPI, they use the spread between T-Bills and long term Treasury Bonds to proxy expected (equilibrium) inflation. This assumption is based on two essential theories: (i) the liquidity preference theory that states that the yield curve represents expectations about future short term interest rates to which investors apply a liquidity premium for longer terms for having to hold the asset for a longer period; and (ii) Fischer’s equation that states that nominal interest rates are approximately equal to real interest rates plus inflation. The LT/ST yield spread is also a useful forecaster of the business cycle since it proxies the shape of the yield curve. Based on the theory that the yield curve represents investors’ expectation about future short-term interest rates and given high interest rates are typically observed during economic expansion phases, a large spread might indicate the market expects an improvement of the economic activity.
Credit Risk Spread (CS) – The spread between the aggregated BAA and AAA graded corporate bonds has been used extensively in the literature to measure the credit risk in the market. An increasing spread can be the result of either an increase in the price of risk or a higher magnitude of risk in the market. This is because when investors anticipate an economic downturn, they tend to react by selling risker bonds to buy safer assets. This pushes low-quality bonds prices down and the yield up. In that sense, credit risk spread, just like term spread, can be interpreted as a forecaster of the business cycle (Gomes and Schmid, 2009). While some studies use it as a proxy for the excess return on the market portfolio (Evans, 1994; Jagannathan and Wang, 1996), some include it as a separate factor. For instance, Valkanov (2006), employs it in a multifactor non-CAPM model and applies to four sectors (financials, transportation, utilities and industrial) in the US over the period 1980-2001. He finds the credit spread to be significant for the financials and transportation sectors and only marginally so (0.10 level) for the other two. This factor, however, has not been tested in the context of hospitality stocks to my knowledge.
Crude Oil Price (O) – There is an obvious relationship between the performance in the travel and tourism industry and oil prices. Variation in oil prices as a determinant of systematic risk has received encouraging support from Boehme et al. (2008) in the broad market however the question remains as to whether this applies as well to the hospitality industry.
Volatility (V) – Stock price volatility has become an increasingly popular measure of market sentiment and futures and options contracts have been trading on the volatility index (VIX) since 2004 and 2006, respectively. Volatility is related to the theories of behavioral finance and this might be a reason why it was proven a significant systematic risk factor by Boehme et al. (2008). Perhaps its success lies in the fact that it captures elements of investors’ behavior that the traditional beta is unable to measure. In fact, DeBondt and Thaler (1985) show that investors tend to overreact upon disclosure of new unexpected information, which cause temporary imbalances and mispricing that return to equilibrium by creating volatility. This phenomenon is also covered by Olsen (1998) in his comprehensive review article on the implication of behavioral finance for price volatility. Furthermore, according to Schiller (1998), investors’ overconfidence and reluctance to change underlie a large number of behavioral finance theories and is one of the reasons that might explain overreaction and volatility as poor investment decisions are adjusted more drastically.
Exchange Rates (X) – Empirical evidence regarding the impact of exchange rates on stock returns and more specifically on systematic risk is still ambiguous. Graf (2008) in fact observes limited support of it in his study on US-listed hotel firms from 1998 to 2007. Nevertheless, it appears to be a major determinant of sales volume in the hospitality industry and thereby deserves further attention and investigation. In the context of US stocks, the CAD/USD exchange rate is supposed to be especially important, for Canada is the first country of origin of inbound visitors and the first in inbound tourism expenditures.
While the aforementioned variables appear to be relevant for the hospitality industry, all might not be suitable for simultaneous use in a multifactorial model, for too many variables tend to reduce the model’s stability by introducing noise through collinearity. In order to determine which variables should be retained in the final model, we have analyzed the correlations among the various variables.1
TS could reasonably be omitted since its very strong correlation with L suggests most of its potential impact on systematic risk could be effectively captured by L. Furthermore, as argued by Chen, Roll and Ross (1986), TS can also be interpreted as a measure of equilibrium inflation, which explains its correlation with Ic. CS also exhibits similar properties though its correlation with L is much lower but still relatively high. As argued by Gomes and Schmidt (2009), the credit risk spread can act as a proxy for the market’s expectations about the health of the economy, and so can L and TS. This is the reason why the correlations between the three variables are significant. Excluding TS and CS would then avoid potential redundancy problems.
Oil prices (O) and Core Inflation (Ic) could easily be combined by taking a measure of total inflation based on the CPI for all items including food and energy. This solution would integrate the part of total inflation that is more relevant to restaurants: food, while not excluding the energy component that is presumably significant to the other three sectors studied. Total inflation (I) is however slightly correlated with MRP but the very small magnitude should not cause major issues.2
Return Volatility (V) features significant correlations with all the other factors but O and X. According to the theories of the behavioral finance field, it is also strongly linked to the business cycle as it tends to surge during bearish periods when the fear and uncertainty is higher among actors in the market (and vice versa). In that sense, it can also be considered as a “contrarian” proxy for the state of the economy. This implies that its information about systematic risk should for the most part already be reflected in L which was chosen as the most appropriate variable for representing latent expectations about the business cycle. Therefore, it is reasonable to assume that the variable V could be excluded from the final model to improve its stability without major loss of information.3
1 Results available from the authors upon request. 2 Robustness tests were also performed to confirm the two variables could effectively be combined. Regressions were run using both Ic and O and either Ic or O. The outcome was a decrease or no clear improvement in adjusted R2 (less than 1%) in all cases for the four portfolios compared to using I alone as it the case in the final model. 3 A final set of tests were executed to determine whether the exclusion of stock-return volatility in the model could be accomplished at no significant loss of explanatory power. A version of the model to which V was added as a variable was
This reorganization results in the use of three conditioning variables on systematic risk: LIBOR, Total inflation and the USD/CAD exchange rate. While MRP is not in itself a conditioning factor, it is necessarily maintained in the model in order to preserve its intuition as a CAPM-based model.
d. Data
The data used was taken from Thomson Reuters Datastream database. 20 years of monthly time series were queried from January 1992 to December 2011 (240 observations per series) on the last day of the month. Throughout this paper, subscripts t apply to the end of the period except for growth rates (returns)4 which represent the growth over the period t. Formally, growth rates are calculated as the value at the end of the current period (t) divided by the value at the end of the previous period (t-1). Time series of the two Fama-French model factors (SMB and HML) were directly taken from French’s online database.
All firms classified under Datastream industry group classifications (i) Restaurants and Bars, (ii) Hotels, (iii) Gambling and (iv) Airlines traded on the NYSE or NASDAQ and whose listing was their primary quote. Furthermore, firms for which either adjusted price, market value or trading volume information was missing for the current and previous periods were excluded. Hence, firms were only included on their second month of trading so that a return could be calculated. The sample was also controlled for minimum liquidity based on shares turnover by volume (number of traded shares divided by outstanding shares) to avoid mispricing biases caused by illiquidity on the market. For each sector, firms were ranked by their average shares turnover over their trading period and those in the bottom 5 percentiles were excluded from the total sample. This procedure also avoids having firms with trading volumes fluctuating around a pre-defined threshold coming in and out of a portfolio during its listed period.
For each period t, firms that qualified given the criteria cited above were retained and classified in the according portfolio. Returns on the four portfolios created were calculated as the sum of the market values of all the qualifying firms at the end of the period divided by the sum the same firms’ market values at the beginning of the period. In other terms, only stocks that qualified for both the current and previous periods were included in the portfolio return calculation. Table 1 shows the average number of firms per period in each portfolio for the entire 20-year period.
Table 1 – Average Number of Constituents
Portfolio Average Number of
Firms
Restaurants and Bars 60
Hotels 16
Gambling 29
Airlines 12
The domination of a few large firms in comparison to their industry might however conceal the risk-return behavior of the smaller firms, effectively reducing the sample size to these. This would lessen the economic significance of the findings as they would more likely represent a handful of firms with presumably similar risk exposition profiles because of their size. All our four portfolios are indeed largely dominated by a few firms. Over the sample period, the three largest firms within each industry have on average concentrated 40% to 80% of the overall industry market capitalization. Hence, although the value-weighted returns might be more representative of the industry from an economic standpoint, they conceal much of the behavior of smaller stocks. Yet the interest here is not as much the evolution of the industry as a whole as the reaction of stock returns to changes in the risk level. Hence equally-weighted portfolios should better represent the typical behavior of a stock in each industry and, as it was argued before, reveal the reaction of smaller capitalizations. These are the portfolios that were used in the study.
compared to the final model devised in this study in which V is excluded. For all four portfolios, the addition of volatility as a factor did not improve the adjusted R2 significantly. 4 Variables calculated as growth rates are the returns on the four portfolios and the S&P 500 as well as I, Ic, O and X and the constructed variables based on them.
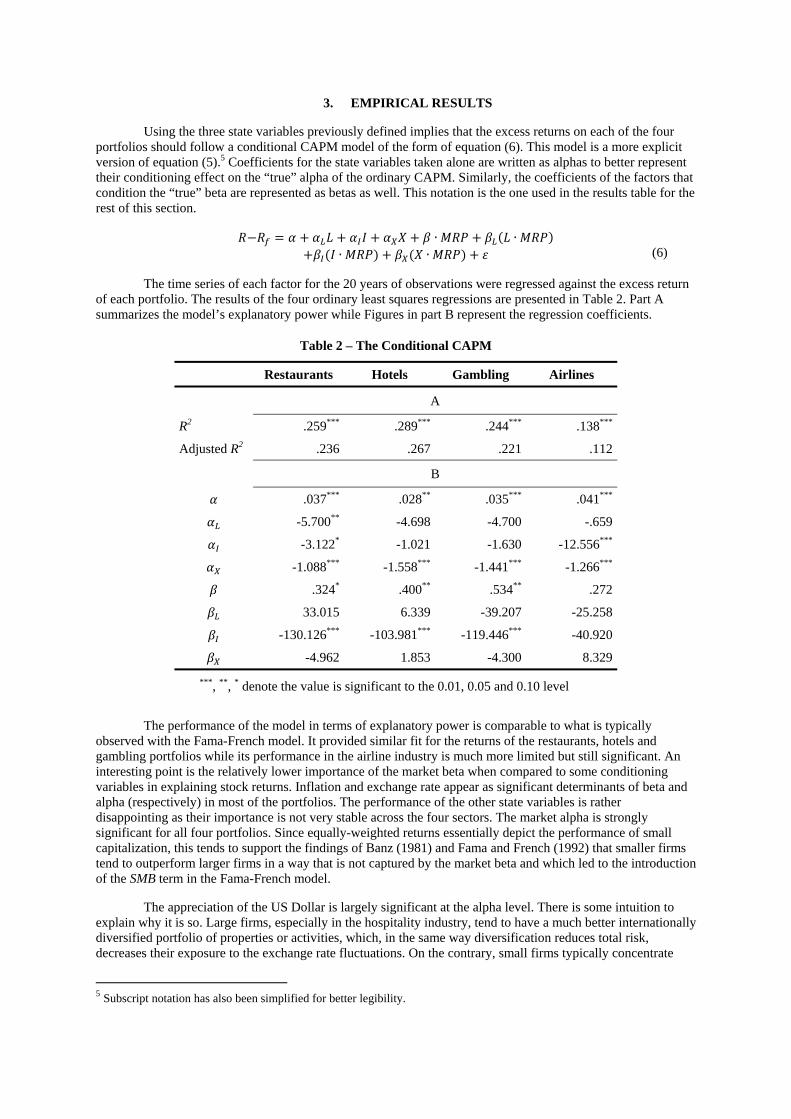
3. EMPIRICAL RESULTS
Using the three state variables previously defined implies that the excess returns on each of the four portfolios should follow a conditional CAPM model of the form of equation (6). This model is a more explicit version of equation (5).5 Coefficients for the state variables taken alone are written as alphas to better represent their conditioning effect on the “true” alpha of the ordinary CAPM. Similarly, the coefficients of the factors that condition the “true” beta are represented as betas as well. This notation is the one used in the results table for the rest of this section.
∙ ∙
∙ ∙ (6)
The time series of each factor for the 20 years of observations were regressed against the excess return of each portfolio. The results of the four ordinary least squares regressions are presented in Table 2. Part A summarizes the model’s explanatory power while Figures in part B represent the regression coefficients.
Table 2 – The Conditional CAPM
Restaurants Hotels Gambling Airlines
A
R2 .259*** .289*** .244*** .138***
Adjusted R2 .236 .267 .221 .112
B
.037*** .028** .035*** .041***
-5.700** -4.698 -4.700 -.659
-3.122* -1.021 -1.630 -12.556***
-1.088*** -1.558*** -1.441*** -1.266***
.324* .400** .534** .272
33.015 6.339 -39.207 -25.258
-130.126*** -103.981*** -119.446*** -40.920
-4.962 1.853 -4.300 8.329
***, **, * denote the value is significant to the 0.01, 0.05 and 0.10 level
The performance of the model in terms of explanatory power is comparable to what is typically observed with the Fama-French model. It provided similar fit for the returns of the restaurants, hotels and gambling portfolios while its performance in the airline industry is much more limited but still significant. An interesting point is the relatively lower importance of the market beta when compared to some conditioning variables in explaining stock returns. Inflation and exchange rate appear as significant determinants of beta and alpha (respectively) in most of the portfolios. The performance of the other state variables is rather disappointing as their importance is not very stable across the four sectors. The market alpha is strongly significant for all four portfolios. Since equally-weighted returns essentially depict the performance of small capitalization, this tends to support the findings of Banz (1981) and Fama and French (1992) that smaller firms tend to outperform larger firms in a way that is not captured by the market beta and which led to the introduction of the SMB term in the Fama-French model.
The appreciation of the US Dollar is largely significant at the alpha level. There is some intuition to explain why it is so. Large firms, especially in the hospitality industry, tend to have a much better internationally diversified portfolio of properties or activities, which, in the same way diversification reduces total risk, decreases their exposure to the exchange rate fluctuations. On the contrary, small firms typically concentrate
5 Subscript notation has also been simplified for better legibility.
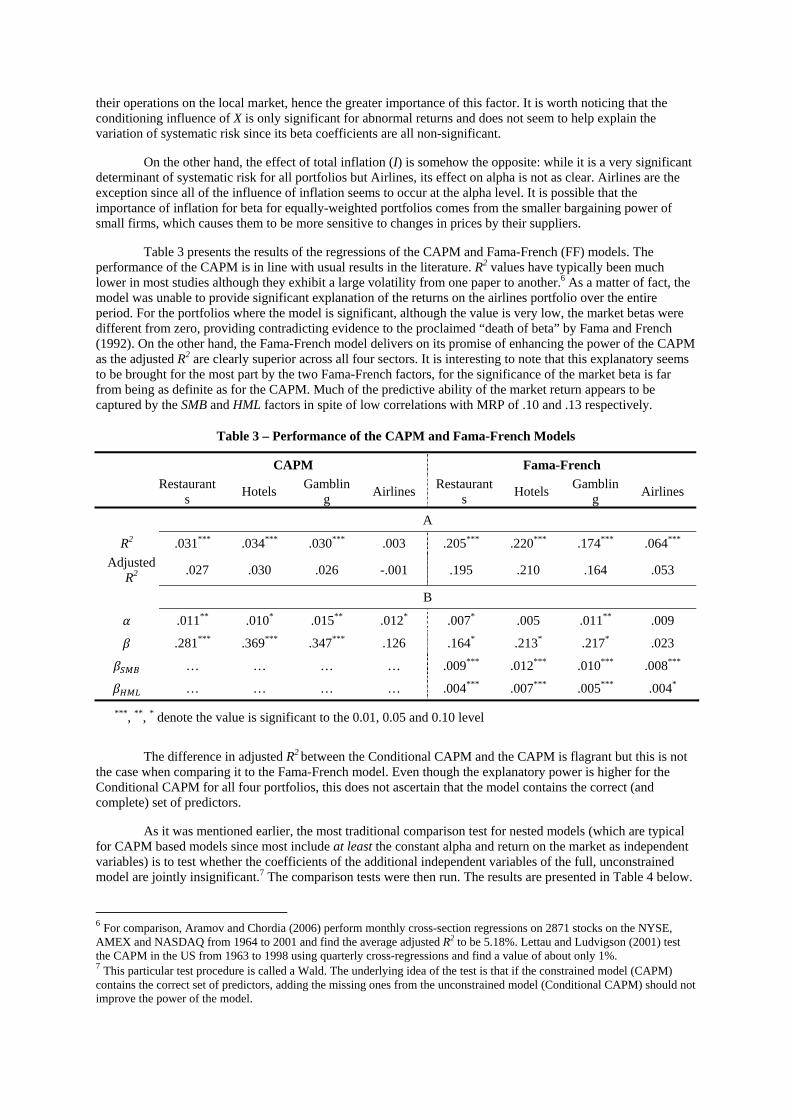
their operations on the local market, hence the greater importance of this factor. It is worth noticing that the conditioning influence of X is only significant for abnormal returns and does not seem to help explain the variation of systematic risk since its beta coefficients are all non-significant.
On the other hand, the effect of total inflation (I) is somehow the opposite: while it is a very significant determinant of systematic risk for all portfolios but Airlines, its effect on alpha is not as clear. Airlines are the exception since all of the influence of inflation seems to occur at the alpha level. It is possible that the importance of inflation for beta for equally-weighted portfolios comes from the smaller bargaining power of small firms, which causes them to be more sensitive to changes in prices by their suppliers.
Table 3 presents the results of the regressions of the CAPM and Fama-French (FF) models. The performance of the CAPM is in line with usual results in the literature. R2 values have typically been much lower in most studies although they exhibit a large volatility from one paper to another.6 As a matter of fact, the model was unable to provide significant explanation of the returns on the airlines portfolio over the entire period. For the portfolios where the model is significant, although the value is very low, the market betas were different from zero, providing contradicting evidence to the proclaimed “death of beta” by Fama and French (1992). On the other hand, the Fama-French model delivers on its promise of enhancing the power of the CAPM as the adjusted R2 are clearly superior across all four sectors. It is interesting to note that this explanatory seems to be brought for the most part by the two Fama-French factors, for the significance of the market beta is far from being as definite as for the CAPM. Much of the predictive ability of the market return appears to be captured by the SMB and HML factors in spite of low correlations with MRP of .10 and .13 respectively.
Table 3 – Performance of the CAPM and Fama-French Models
CAPM Fama-French
Restaurant
s Hotels
Gambling
Airlines Restaurant
s Hotels
Gambling
Airlines
A
R2 .031*** .034*** .030*** .003 .205*** .220*** .174*** .064***
Adjusted R2 .027 .030 .026 -.001 .195 .210 .164 .053
B
.011** .010* .015** .012* .007* .005 .011** .009
.281*** .369*** .347*** .126 .164* .213* .217* .023
… … … … .009*** .012*** .010*** .008***
… … … … .004*** .007*** .005*** .004*
***, **, * denote the value is significant to the 0.01, 0.05 and 0.10 level
The difference in adjusted R2 between the Conditional CAPM and the CAPM is flagrant but this is not
the case when comparing it to the Fama-French model. Even though the explanatory power is higher for the Conditional CAPM for all four portfolios, this does not ascertain that the model contains the correct (and complete) set of predictors.
As it was mentioned earlier, the most traditional comparison test for nested models (which are typical for CAPM based models since most include at least the constant alpha and return on the market as independent variables) is to test whether the coefficients of the additional independent variables of the full, unconstrained model are jointly insignificant.7 The comparison tests were then run. The results are presented in Table 4 below.
6 For comparison, Aramov and Chordia (2006) perform monthly cross-section regressions on 2871 stocks on the NYSE, AMEX and NASDAQ from 1964 to 2001 and find the average adjusted R2 to be 5.18%. Lettau and Ludvigson (2001) test the CAPM in the US from 1963 to 1998 using quarterly cross-regressions and find a value of about only 1%. 7 This particular test procedure is called a Wald. The underlying idea of the test is that if the constrained model (CAPM) contains the correct set of predictors, adding the missing ones from the unconstrained model (Conditional CAPM) should not improve the power of the model.
Comparing the Conditional CAPM to the Fama-French model cannot be performed using the same test as for the CAPM since the two models are not nested as both models contain predictors that the other lacks. Joint significance is then not appropriate in this situation. Instead, a Davidson-MacKinnon (1981) J-test can be performed.8 The concept of the test is similar to the Wald test performed in part A of Table 4 in that it tries to verify which of the two compared models includes the best set of predictors.
Table 4 – Comparison Tests
Restaurants Hotels Gambling Airlines
A – Conditional CAPM vs CAPM
F 11.879*** 13.838*** 10.928*** 6.0425***
Sig. (DoF = 232) (.000) (.000) (.000) (.000)
B – Conditional CAPM vs Fama-French
Fitted (FF) on CCAPM
t-stat .805*** .793*** .789*** .868***
Sig. (2-tailed) (.000) (.000) (.000) (.001)
Fitted (CCAPM) on FF
t-stat .857*** .859*** .868*** .935***
Sig. (2-tailed) (.000) (.000) (.000) (.000)
***, **, * denote the value is significant to the 0.01, 0.05 and 0.10 level. Part A displays the results of Wald tests with null hypothesis that the returns are described by the constrained model (CAPM). Part B displays the results of both ways of J-tests.
Not surprisingly, for all portfolios, the results of the Wald test comparing the Conditional CAPM to the traditional CAPM lead to conclusion that the conditional version outperforms the static one as the addition of the conditioning factors increase the explanatory power of the model by a significant amount. This provides a clear and definite answer to the hypothesis that the Conditional CAPM outperforms the CAPM, as the performance of the Conditional CAPM appears higher than the CAPM in all sectors.
The comparison between the Conditional CAPM and Fama-French models on the other hand is not as straightforward, as it can be seen from the J-tests in part B of Table 4. In fact, the addition of the missing variables of one model to the other did help improve the power of both models.9 Based on the adjusted R2 values alone, the Conditional CAPM should be preferred to the Fama-French in all cases but according to the comparison test, it cannot be inferred that the model contains the right and complete set of predictors since the combined model’s power is significantly higher. It is therefore not possible to provide an accurate answer regarding the superiority of the Conditional CAPM over Fama-French. Rather, the combination of the two models is preferred to each taken separately. Its performance is summarized in Table 5.
It is possible to notice that the adjusted R2 values indeed increase with the addition of the SMB and HML factors, which remain clearly significant in the encompassing model. It is also very important to note that the significant coefficient values are consistent in terms of magnitude, sign and significance with both the
8 The idea of the test is to add the fitted value of the coefficients of the first model to the second model as additional predictors. If the R2 of the obtained “general” model is not significantly increased then the added predictors from the first model do not help towards improving the model and the second model is assumed to contain the right set of predictors among the pooled variables of the two models. This procedure implies that the test be performed in both ways to test whether both models contain significant predictors when added to the other model. The J-test is very similar to the Cox test, which is often used in this situation, but is preferred because of its less restrictive assumptions. 9 Identical test conclusions were reached using the more traditional Cox and Encompassing tests.
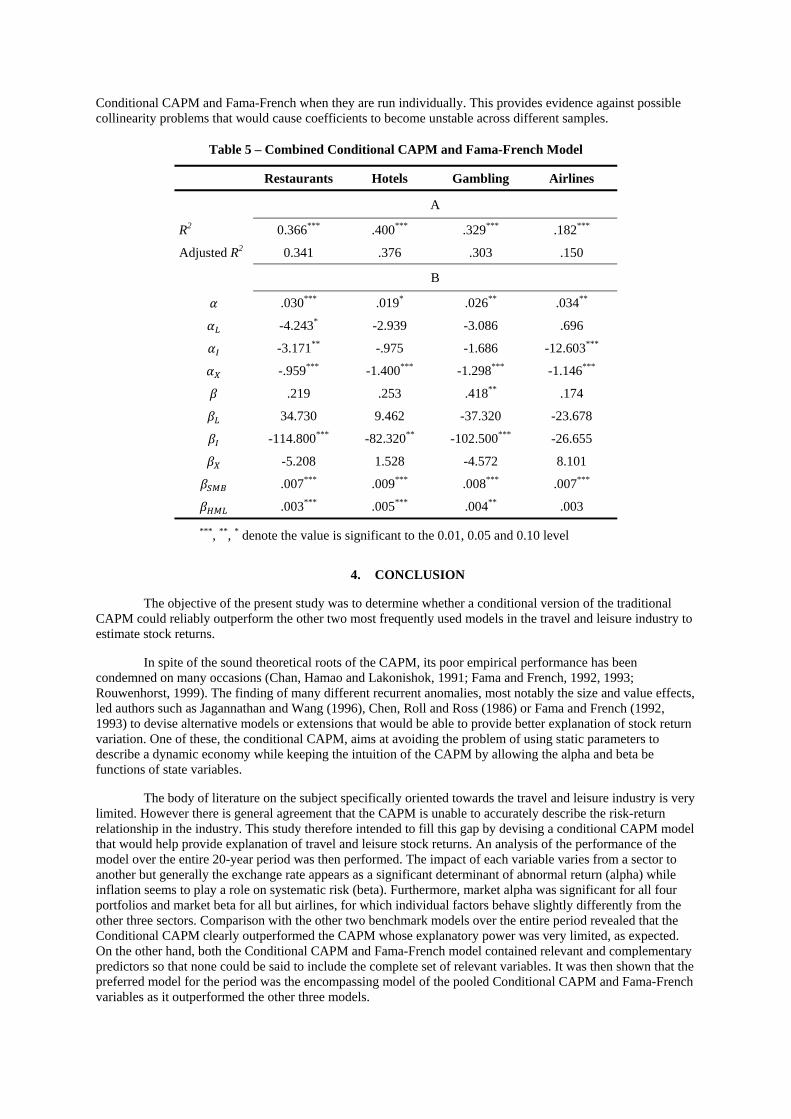
Conditional CAPM and Fama-French when they are run individually. This provides evidence against possible collinearity problems that would cause coefficients to become unstable across different samples.
Table 5 – Combined Conditional CAPM and Fama-French Model
Restaurants Hotels Gambling Airlines
A
R2 0.366*** .400*** .329*** .182***
Adjusted R2 0.341 .376 .303 .150
B
.030*** .019* .026** .034**
-4.243* -2.939 -3.086 .696
-3.171** -.975 -1.686 -12.603***
-.959*** -1.400*** -1.298*** -1.146***
.219 .253 .418** .174
34.730 9.462 -37.320 -23.678
-114.800*** -82.320** -102.500*** -26.655
-5.208 1.528 -4.572 8.101
.007*** .009*** .008*** .007***
.003*** .005*** .004** .003
***, **, * denote the value is significant to the 0.01, 0.05 and 0.10 level
4. CONCLUSION
The objective of the present study was to determine whether a conditional version of the traditional CAPM could reliably outperform the other two most frequently used models in the travel and leisure industry to estimate stock returns.
In spite of the sound theoretical roots of the CAPM, its poor empirical performance has been condemned on many occasions (Chan, Hamao and Lakonishok, 1991; Fama and French, 1992, 1993; Rouwenhorst, 1999). The finding of many different recurrent anomalies, most notably the size and value effects, led authors such as Jagannathan and Wang (1996), Chen, Roll and Ross (1986) or Fama and French (1992, 1993) to devise alternative models or extensions that would be able to provide better explanation of stock return variation. One of these, the conditional CAPM, aims at avoiding the problem of using static parameters to describe a dynamic economy while keeping the intuition of the CAPM by allowing the alpha and beta be functions of state variables.
The body of literature on the subject specifically oriented towards the travel and leisure industry is very limited. However there is general agreement that the CAPM is unable to accurately describe the risk-return relationship in the industry. This study therefore intended to fill this gap by devising a conditional CAPM model that would help provide explanation of travel and leisure stock returns. An analysis of the performance of the model over the entire 20-year period was then performed. The impact of each variable varies from a sector to another but generally the exchange rate appears as a significant determinant of abnormal return (alpha) while inflation seems to play a role on systematic risk (beta). Furthermore, market alpha was significant for all four portfolios and market beta for all but airlines, for which individual factors behave slightly differently from the other three sectors. Comparison with the other two benchmark models over the entire period revealed that the Conditional CAPM clearly outperformed the CAPM whose explanatory power was very limited, as expected. On the other hand, both the Conditional CAPM and Fama-French model contained relevant and complementary predictors so that none could be said to include the complete set of relevant variables. It was then shown that the preferred model for the period was the encompassing model of the pooled Conditional CAPM and Fama-French variables as it outperformed the other three models.
In conclusion it can be said with reasonable assurance that based on the results of the tests that were performed that the conditional CAPM model devised in this study can provide better results than the CAPM but should be seen as a complement to the Fama-French model, for the SMB and HML factors still capture information that the Conditional CAPM was unable to integrate.
5. BIBLIOGRAPHY
Banz, R. W. (1981). The Relationship Between Return and Market Value of Common Stocks. Journal of Financial, 9(1), 3-18.
Boehme, R., Danielsen, B. R., Kumar, P., & Sorescu, S. M. (2006). Estimation Risk, Information and the Conditional CAPM: Theory and Evidence. Working Paper.
Chan, L. K., Hamao, Y., & Lakonishok, J. (1990). Fundamentals and Stock Returns in Japan. Working Paper, Columbia University.
Chen, M.-H. (2011). An Event Study Analysis of U.S. Hospitality Stock Prices' Reaction to Fed Policy Announcements. International CHRIE Conference-Refereed Track. Retrieved from http://scholarworks.umass.edu/refereed/ICHRIE_2011/Wednesday/8
Chen, M.-H., Huang, S.-S., & Chi, C. G. (2008). Changes in Monetary Policy and Hospitality Stock Returns. International CHRIE, (pp. 87-94). Atlanta.
Chen, N.-F., Roll, R., & Ross, S. A. (1986). Economic Forces and the Stock Market. The Journal of Business, 59(3), 383-403.
Cornelius, P. K. (1993). A Note on the Informational Efficiency of Emerging Stock Markets. Review of World Economics, 129(4), 820-828.
Davidson, R., & MacKinnon, J. G. (1981). Several Tests for Model Specification in the Presence of Alternative Hypotheses. Econometrica, 49, 781-793.
DeBondt, W. F., & Thaler, R. H. (1987). Evidence on Investor Overreaction and Stock Market Seasonality. Journal of Finance, 42(3), 557–581.
DeBondt, W., & Thaler, R. (1985). Does the Stock Market Overreact? Journal of Finance, 40, 793-805. Evans, M. D. (1994). Expected Returns, Time-Varying Risk, and Risk Premia. The Journal of Finance, 49(2),
655-679. Fama, E. F. (1998). Market Efficiency, Long-Term Returns and Behavioral Finance. Journal of Financial
Economics, 49(3), 283-306. Fama, E. F., & French, K. R. (1992). The Cross-Section of Expected Stock Returns. Journal of Finance, 47(2),
427–465. Fama, E. F., & French, K. R. (1993). Common Risk Factors in the Returns on Stocks and Bonds. Journal of
Financial Economics, 33(1), 3–56. Fama, E. F., & French, K. R. (2004). The Capital Asset Pricing Model: Theory and Evidence. Journal of
Economic Perspectives, 18(3), 25–46. Gomes, J. F., & Schmid, L. (2009). Equilibrium Credit Spreads and the Macroeconomy. Working Paper. Graf, N. S. (2008). A Step Toward the Identification of Unsystematic Risk Factors: The Case of Foreign
Exchange Exposure and Property Ownership Structure of U.S. Multinational Hotel Companies. 2008 International CHRIE Conference, (pp. 146-154). Atlanta.
Jagannathan, R., & Wang, Z. (1996). The Conditional CAPM and the Cross-Section of Expected Returns. The Journal of Finance, 51(1), 3-53.
Lagji, G. (2010). Excess Return Estimate and Risk Factors in Hospitality Firms. Masters Thesis, University of Massachusetts.
Merton, R. C. (1973). An Intertemporal Capital Asset Pricing Model. Econometrica, 41(5), 867-887. Olsen, R. A. (1998). Behavioral Finance and Its Implications for Stock-Price Volatility. Financial Analysts
Journal, 54(2), 10-18. Rouwenhorst, K. G. (1999). Local return factors and turnover in emerging stock markets. Journal of Finance,
54, 1439–1464. Shiller, R. (1998). Human Behavior and the Efficiency of the Financial System. Working Paper, National
Bureau of Economics. Valkanov, R. (2006). A Test of the Predictability of Stock Returns. Working Paper, University of California
Berkley, Haas School of Management.
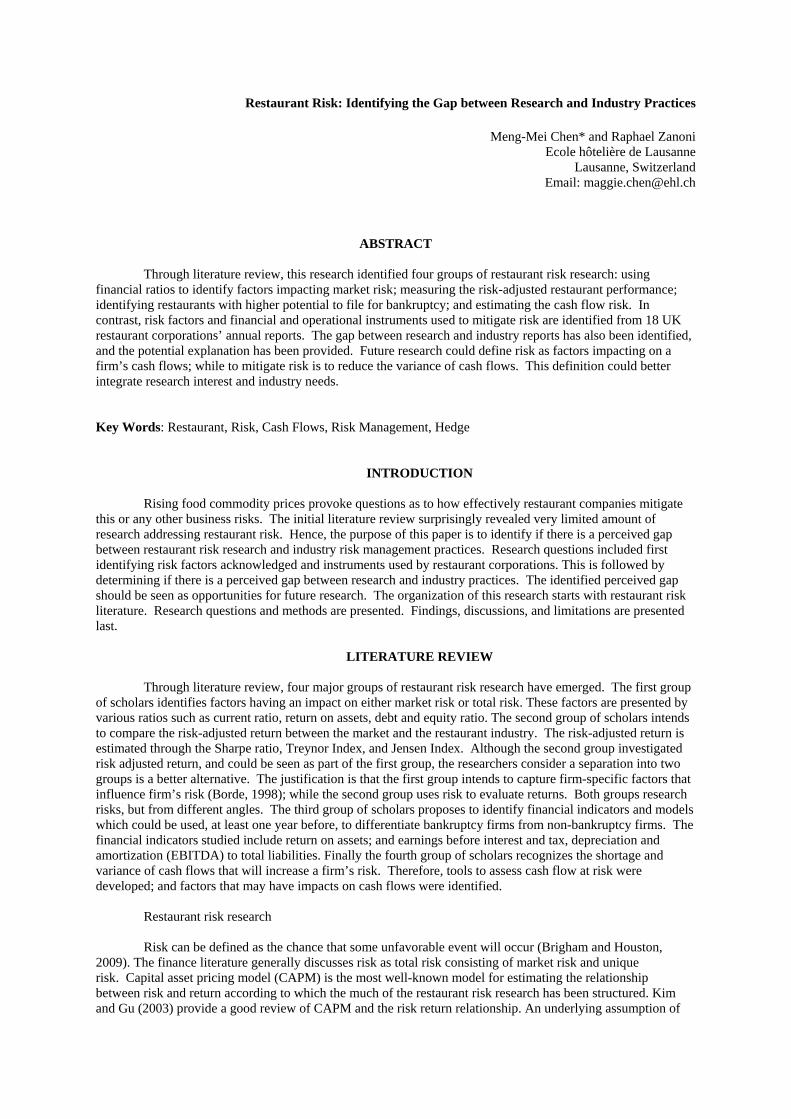
Restaurant Risk: Identifying the Gap between Research and Industry Practices
Meng-Mei Chen* and Raphael Zanoni Ecole hôtelière de Lausanne
Lausanne, Switzerland Email: [email protected]
ABSTRACT
Through literature review, this research identified four groups of restaurant risk research: using
financial ratios to identify factors impacting market risk; measuring the risk-adjusted restaurant performance; identifying restaurants with higher potential to file for bankruptcy; and estimating the cash flow risk. In contrast, risk factors and financial and operational instruments used to mitigate risk are identified from 18 UK restaurant corporations’ annual reports. The gap between research and industry reports has also been identified, and the potential explanation has been provided. Future research could define risk as factors impacting on a firm’s cash flows; while to mitigate risk is to reduce the variance of cash flows. This definition could better integrate research interest and industry needs.
Key Words: Restaurant, Risk, Cash Flows, Risk Management, Hedge
INTRODUCTION
Rising food commodity prices provoke questions as to how effectively restaurant companies mitigate this or any other business risks. The initial literature review surprisingly revealed very limited amount of research addressing restaurant risk. Hence, the purpose of this paper is to identify if there is a perceived gap between restaurant risk research and industry risk management practices. Research questions included first identifying risk factors acknowledged and instruments used by restaurant corporations. This is followed by determining if there is a perceived gap between research and industry practices. The identified perceived gap should be seen as opportunities for future research. The organization of this research starts with restaurant risk literature. Research questions and methods are presented. Findings, discussions, and limitations are presented last.
LITERATURE REVIEW
Through literature review, four major groups of restaurant risk research have emerged. The first group
of scholars identifies factors having an impact on either market risk or total risk. These factors are presented by various ratios such as current ratio, return on assets, debt and equity ratio. The second group of scholars intends to compare the risk-adjusted return between the market and the restaurant industry. The risk-adjusted return is estimated through the Sharpe ratio, Treynor Index, and Jensen Index. Although the second group investigated risk adjusted return, and could be seen as part of the first group, the researchers consider a separation into two groups is a better alternative. The justification is that the first group intends to capture firm-specific factors that influence firm’s risk (Borde, 1998); while the second group uses risk to evaluate returns. Both groups research risks, but from different angles. The third group of scholars proposes to identify financial indicators and models which could be used, at least one year before, to differentiate bankruptcy firms from non-bankruptcy firms. The financial indicators studied include return on assets; and earnings before interest and tax, depreciation and amortization (EBITDA) to total liabilities. Finally the fourth group of scholars recognizes the shortage and variance of cash flows that will increase a firm’s risk. Therefore, tools to assess cash flow at risk were developed; and factors that may have impacts on cash flows were identified.
Restaurant risk research Risk can be defined as the chance that some unfavorable event will occur (Brigham and Houston,
2009). The finance literature generally discusses risk as total risk consisting of market risk and unique risk. Capital asset pricing model (CAPM) is the most well-known model for estimating the relationship between risk and return according to which the much of the restaurant risk research has been structured. Kim and Gu (2003) provide a good review of CAPM and the risk return relationship. An underlying assumption of
this model is that unique risk, which is inherent in a specific investment, can be eliminated through diversification and investors will only be compensated for the market risk that is taken on (Brealey, Myers, and Allen, 2010). Market risk is measured by beta, is inherent to the entire market and cannot be diversified away.
As part of the first group of restaurant risk research, both Borde (1998), Kim, Ryan, Ceschini (2007)
have found a negative relationship between profitability and market risk. Profitability is measured by return on assets (Borde, 1998) and return on invested capital (Kim et al., 2007). It suggests that high efficiency in using assets to generate returns helps to lower risk. Firms with superior performance may face a low probability of loss and therefore exhibit low risk (Borde, 1998).
Liquidity is positively related to the market risk (Kim, et al. 2007; Ceschini, 2005; Gu and Kim, 2002;
Borde, 1998). Liquidity is measured through either quick ratio (Kim, et al. 2007; Ceschini, 2005) or current ratio (Borde, 1998); and represents the opportunity cost of investing in marketable securities instead of in high-earning operating assets. A high dividend payout ratio is negatively related to market risk, since cash not invested in the business should be paid out (Borde, 1998).
The relationship between growth and market risk is not clear. Growth, represented by the growth in
earnings before interest and taxes (EBITGRO), is found to be positively related to market risk by Borde (1998), but is found to be irrelevant to market risk by Kim et al. (2007) and Ceschini (2005).
Financial leverage, measured by the debt to equity ratio, is found to have a positive relationship
with market risk (Kim, et al., 2007; Ceschini, 2005). Financial leverage, measured by equity to total assets, is found to be unrelated to market risk and total risk (Borde, 1998).
Firm size and efficiency are irrelevant to market risk (Kim et al., 2007). Firm size is measured by the
total capitalization, while efficiency is measured by the receivable turnover ratio (Kim, et al., 2007). Factors impacting unique risk have been identified as profitability, leverage, and the firm
size. Profitable firms and bigger firms have less unique risk, while firms with higher financial leverage or operating leverage have more market risk (Hsu and Jang, 2008).
Factors impacting total risk have been identified as return on assets (ROA), growth, and
liquidity. While growth of EBIT and liquidity are positively related to total risk, ROA is negatively related to total risk (Borde, 1998).
To summarize, the impact of a wide range of factors on market risk, unique risk, and total risk has been
researched to date, mainly through the use of financial ratios. Researchers attempt to identify factors which may have impact on the market risk, because investors will only be compensated by taking on market risk. The findings are valuable for investors. However, since unique risk accounts for most of the total risk of an average stock (Kim and Gu, 2003), the findings are of limited use for managers of restaurant companies.
The second group of restaurant risk research is based on the assumption that investors prefer the
highest return given the same level of risk, and the lowest risk given the same level of return. Sharpe Ratio, Treynor Index, and Jensen Index measure the relationship between risk and risk-adjusted performance. Due to different study periods and classifications, previous research findings did not reach a congruent conclusion. Kim et al. (2003) found, between 1996-2000, full-service restaurants, economy/buffet restaurants, and fast-food restaurants all provided lower return and higher risk than the market did. Measured by Sharpe Ratio, Treynor Index, and Jensen Index, three restaurant segments under performed the market. Among the three restaurant segments, fast-food restaurants had the best return and lowest risk (Kim, et al., 2003). Madanoglu, Lee, and Kwansa (2008) found, between 1998-2002, that casual dining outperformed fast food and the market in return and Sharpe Ratio. Kim, Zhong, Chen, and Karadag (2009) found, between 1998-2004, that although economy/buffet restaurants provided higher return than the restaurant industry and fast-food, and full-service segments did, it also had the highest standard deviation, which is an indicator of total risk. Furthermore, economy/buffet restaurants outperformed three market indexes during the same period. However, except NASDAQ composite, economy/buffet restaurants had higher standard deviation than NYSE composite and S&P 500 did. Use of the Sharpe Ratio confirmed economy/buffet restaurants outperformed the restaurant industry and the other two segments (Kim, et al., 2009). The major contribution of this group of research is to quantify the risk and return relationship for investors through the Sharpe Ratio, Treynor Index, and Jensen Index.
The third group of restaurant research shows that EBIT to total liabilities ratio (Gu, 2002), EBITDA to
total liabilities and ROA (Youn and Gu, 2010) could differentiate potential bankrupt and non-bankrupt restaurants. This group of researchers also compare the accuracy of different methods including the multiple discriminant model, the logit model, and the artificial neural network model, in predicting and identifying bankruptcy firms (Kim and Gu, 2006; Kim and Gu, 2003; Gu, 2002). Bankruptcy destroys investors’ wealth and could cause substantial loss to creditors. If investors and lenders could predict bankruptcy, they could reduce their risk.
The fourth group of research evolves around cashflow at Risk (CFaR), a tool that has been developed
to estimate the likelihood of extreme events that could produce significant drops in cash flows (Stein, Usher, LaGattuta, Youngen, 2001). Considering that a shortage of cashflow is among the most damaging risks in the industry, CFaR is a valuable tool for restaurant managers. Jang, Park and Lee (2011) examined CFaR for the restaurant industry in the US, and found full-service restaurants, firms with smaller market capitalization and lower profitability have higher cashflow risk. The cashflow data used in the research inherently accounts for the combined effects of all relevant risks that a firm may face, and could not address the firms’ specific risk components facing managers (Jang et al., 2011). Madanoglu, Olsen, Kwansa (2010) examined how 30 industry risk factors impact on operating cash flows. Three factors, Output, PPI Meats, and PPI restaurants, explained over 75% of the variance. Specifically, risk factors included in Output are food cost, labor cost, and industrial production. PPI Meats are three meat-related producer price variables. PPI restaurants consist of two industrial production variables and one employment variable. To summarize, these researchers emphasis the importance of cash flows, and the risk caused by the cash flow variances.
Not limited by the word ‘risk’, research addressing managers concern and factors, which may lead to
bankruptcy, has been reviewed to provide a more comprehensive understanding of risk. Previous research found managers’ concerns include finding and retaining skilled employees, offering competitive compensation and benefits; government taxation, legal liabilities, government interference; cash flow management, cost control; advertising, customer satisfaction, and customer relationship (Enz, 2004). Factors contributing to bankruptcies include being new in the market, being independent instead of franchised, located in a restaurant concentrated area (Parsa, Self, Djite, and King, 2005). Concerns and bankrupt likelihood are different among independent managers and franchised managers (Enz, 2004; Parsa, et al., 2005). It’s worth noting that subjects for research addressing restaurant risk and managers concerns are different. Restaurant risk research use corporation data, while managers’ concern research was able to collect data from independent restaurants and restaurant corporations.
Recommendations to mitigate risk Recommendations include improving operating results through enhancing sales, controlling costs,
managing liquidity, and managing debt. To enhance sales, restaurant companies should count on improving sales from existing properties, instead of opening new properties (Youn, et al., 2010; Kim et al., 2003). To improve revenues and control costs at the same time, companies should consolidate through M&A, review menus, recruit and retain qualified employees, and improve marketing (Kim, et al., 2003). Sufficient human resources and internal control are needed in supporting growth (Borde, 1998). Companies should manage liquidity by either investing in operating assets or distributing to shareholders (Borde, 1998). Companies should be aware of the financial risk caused by financial leverage, and use less debt financing (Kim, et al., 2007; Mao and Gu, 2008). It can be concluded that the research on tools to mitigate risks in the restaurant industry is scarce, with a high proportion of them being operational tools that are described only in a broad manner.
METHODS
The aim of this research is to identify if there is a gap between restaurant risk research and industry operation. Restaurant corporations are required by government to disclose the risk they are exposed to. Therefore, the first research question is to examine risk identified from restaurant corporations’ annual reports.
Research question 1: What are the most frequently identified risks found in restaurant corporations’
annual reports? Literature reviewed summarized recommendations to mitigate risk. On the other hand, restaurant
corporations disclose tools to mitigate risk. The second research question is to identify the tools used to mitigate risk, and presented in the annual reports by restaurant corporations.
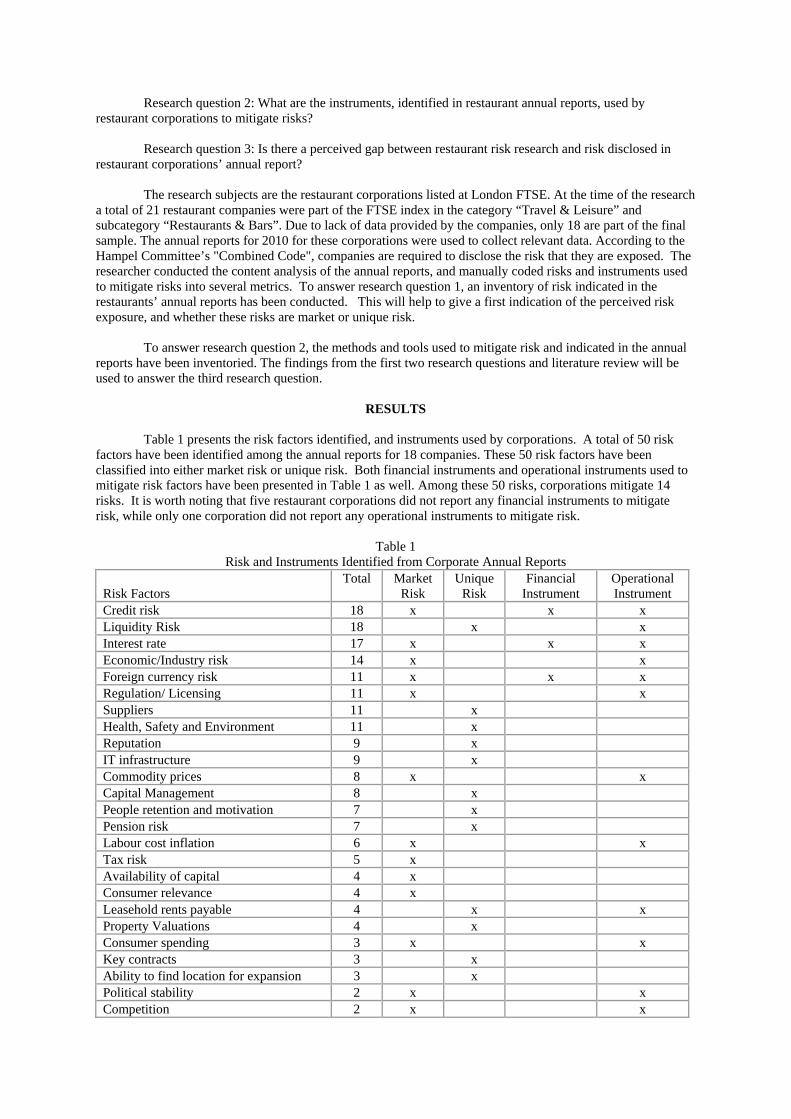
Research question 2: What are the instruments, identified in restaurant annual reports, used by restaurant corporations to mitigate risks?
Research question 3: Is there a perceived gap between restaurant risk research and risk disclosed in
restaurant corporations’ annual report? The research subjects are the restaurant corporations listed at London FTSE. At the time of the research
a total of 21 restaurant companies were part of the FTSE index in the category “Travel & Leisure” and subcategory “Restaurants & Bars”. Due to lack of data provided by the companies, only 18 are part of the final sample. The annual reports for 2010 for these corporations were used to collect relevant data. According to the Hampel Committee’s "Combined Code", companies are required to disclose the risk that they are exposed. The researcher conducted the content analysis of the annual reports, and manually coded risks and instruments used to mitigate risks into several metrics. To answer research question 1, an inventory of risk indicated in the restaurants’ annual reports has been conducted. This will help to give a first indication of the perceived risk exposure, and whether these risks are market or unique risk.
To answer research question 2, the methods and tools used to mitigate risk and indicated in the annual
reports have been inventoried. The findings from the first two research questions and literature review will be used to answer the third research question.
RESULTS
Table 1 presents the risk factors identified, and instruments used by corporations. A total of 50 risk
factors have been identified among the annual reports for 18 companies. These 50 risk factors have been classified into either market risk or unique risk. Both financial instruments and operational instruments used to mitigate risk factors have been presented in Table 1 as well. Among these 50 risks, corporations mitigate 14 risks. It is worth noting that five restaurant corporations did not report any financial instruments to mitigate risk, while only one corporation did not report any operational instruments to mitigate risk.
Table 1
Risk and Instruments Identified from Corporate Annual Reports Risk Factors
Total Market Risk
Unique Risk
Financial Instrument
Operational Instrument
Credit risk 18 x x x Liquidity Risk 18 x x Interest rate 17 x x x Economic/Industry risk 14 x x Foreign currency risk 11 x x x Regulation/ Licensing 11 x x Suppliers 11 x Health, Safety and Environment 11 x Reputation 9 x IT infrastructure 9 x Commodity prices 8 x x Capital Management 8 x People retention and motivation 7 x Pension risk 7 x Labour cost inflation 6 x x Tax risk 5 x Availability of capital 4 x Consumer relevance 4 x Leasehold rents payable 4 x x Property Valuations 4 x Consumer spending 3 x x Key contracts 3 x Ability to find location for expansion 3 x Political stability 2 x x Competition 2 x x
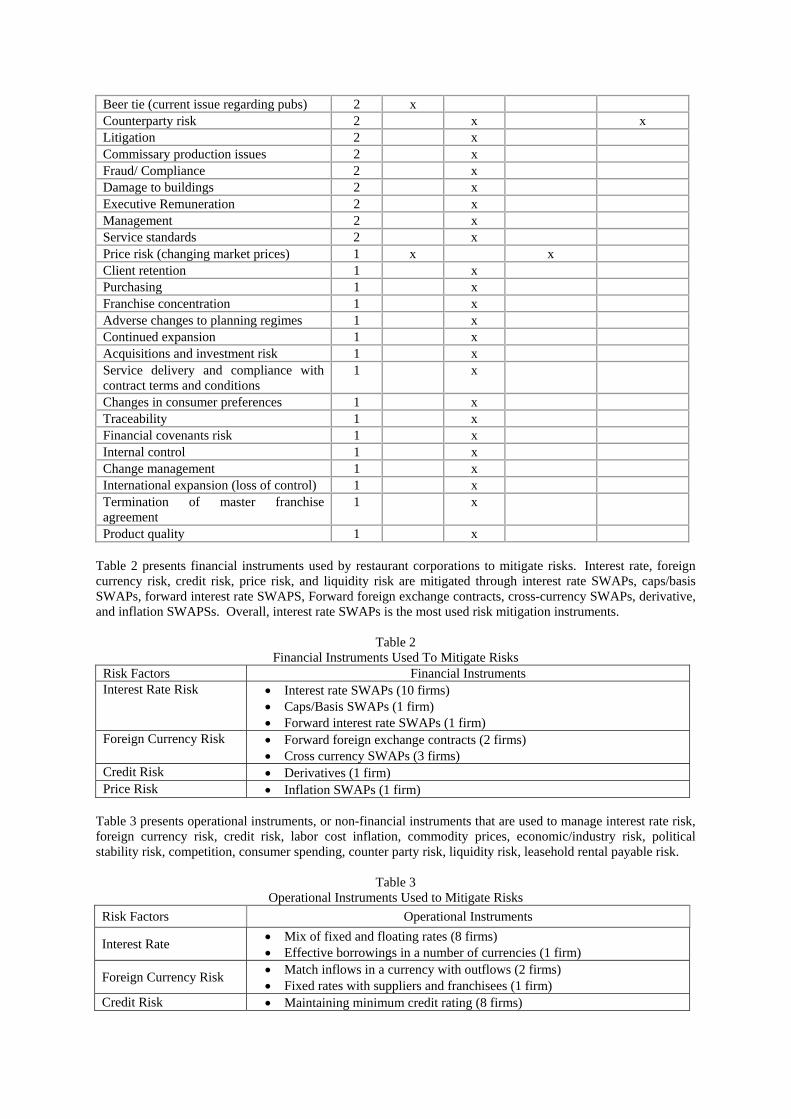
Beer tie (current issue regarding pubs) 2 x Counterparty risk 2 x x Litigation 2 x Commissary production issues 2 x Fraud/ Compliance 2 x Damage to buildings 2 x Executive Remuneration 2 x Management 2 x Service standards 2 x Price risk (changing market prices) 1 x x Client retention 1 x Purchasing 1 x Franchise concentration 1 x Adverse changes to planning regimes 1 x Continued expansion 1 x Acquisitions and investment risk 1 x Service delivery and compliance with contract terms and conditions
1 x
Changes in consumer preferences 1 x Traceability 1 x Financial covenants risk 1 x Internal control 1 x Change management 1 x International expansion (loss of control) 1 x Termination of master franchise agreement
1 x
Product quality 1 x Table 2 presents financial instruments used by restaurant corporations to mitigate risks. Interest rate, foreign currency risk, credit risk, price risk, and liquidity risk are mitigated through interest rate SWAPs, caps/basis SWAPs, forward interest rate SWAPS, Forward foreign exchange contracts, cross-currency SWAPs, derivative, and inflation SWAPSs. Overall, interest rate SWAPs is the most used risk mitigation instruments.
Table 2 Financial Instruments Used To Mitigate Risks
Risk Factors Financial Instruments Interest Rate Risk Interest rate SWAPs (10 firms)
Caps/Basis SWAPs (1 firm) Forward interest rate SWAPs (1 firm)
Foreign Currency Risk Forward foreign exchange contracts (2 firms) Cross currency SWAPs (3 firms)
Credit Risk Derivatives (1 firm) Price Risk Inflation SWAPs (1 firm)
Table 3 presents operational instruments, or non-financial instruments that are used to manage interest rate risk, foreign currency risk, credit risk, labor cost inflation, commodity prices, economic/industry risk, political stability risk, competition, consumer spending, counter party risk, liquidity risk, leasehold rental payable risk.
Table 3 Operational Instruments Used to Mitigate Risks
Risk Factors Operational Instruments
Interest Rate Mix of fixed and floating rates (8 firms) Effective borrowings in a number of currencies (1 firm)
Foreign Currency Risk Match inflows in a currency with outflows (2 firms) Fixed rates with suppliers and franchisees (1 firm)
Credit Risk Maintaining minimum credit rating (8 firms)
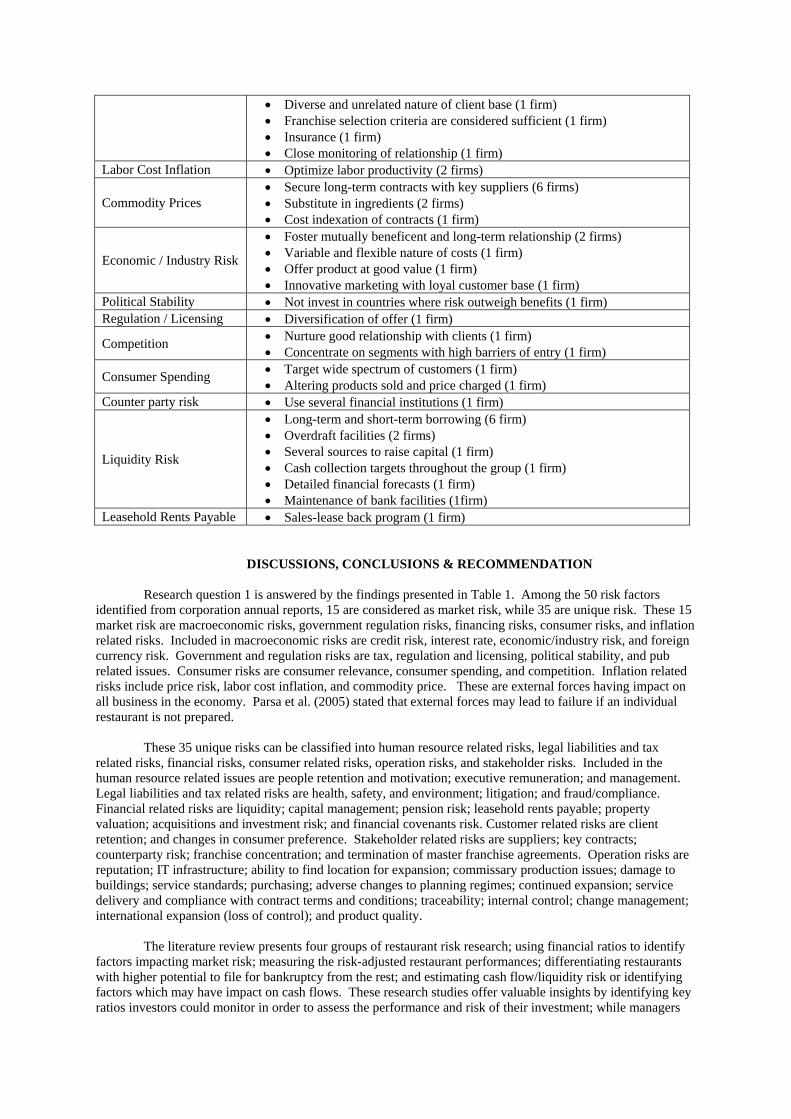
Diverse and unrelated nature of client base (1 firm) Franchise selection criteria are considered sufficient (1 firm) Insurance (1 firm) Close monitoring of relationship (1 firm)
Labor Cost Inflation Optimize labor productivity (2 firms)
Commodity Prices Secure long-term contracts with key suppliers (6 firms) Substitute in ingredients (2 firms) Cost indexation of contracts (1 firm)
Economic / Industry Risk
Foster mutually beneficent and long-term relationship (2 firms) Variable and flexible nature of costs (1 firm) Offer product at good value (1 firm) Innovative marketing with loyal customer base (1 firm)
Political Stability Not invest in countries where risk outweigh benefits (1 firm) Regulation / Licensing Diversification of offer (1 firm)
Competition Nurture good relationship with clients (1 firm) Concentrate on segments with high barriers of entry (1 firm)
Consumer Spending Target wide spectrum of customers (1 firm) Altering products sold and price charged (1 firm)
Counter party risk Use several financial institutions (1 firm)
Liquidity Risk
Long-term and short-term borrowing (6 firm) Overdraft facilities (2 firms) Several sources to raise capital (1 firm) Cash collection targets throughout the group (1 firm) Detailed financial forecasts (1 firm) Maintenance of bank facilities (1firm)
Leasehold Rents Payable Sales-lease back program (1 firm)
DISCUSSIONS, CONCLUSIONS & RECOMMENDATION
Research question 1 is answered by the findings presented in Table 1. Among the 50 risk factors
identified from corporation annual reports, 15 are considered as market risk, while 35 are unique risk. These 15 market risk are macroeconomic risks, government regulation risks, financing risks, consumer risks, and inflation related risks. Included in macroeconomic risks are credit risk, interest rate, economic/industry risk, and foreign currency risk. Government and regulation risks are tax, regulation and licensing, political stability, and pub related issues. Consumer risks are consumer relevance, consumer spending, and competition. Inflation related risks include price risk, labor cost inflation, and commodity price. These are external forces having impact on all business in the economy. Parsa et al. (2005) stated that external forces may lead to failure if an individual restaurant is not prepared.
These 35 unique risks can be classified into human resource related risks, legal liabilities and tax
related risks, financial risks, consumer related risks, operation risks, and stakeholder risks. Included in the human resource related issues are people retention and motivation; executive remuneration; and management. Legal liabilities and tax related risks are health, safety, and environment; litigation; and fraud/compliance. Financial related risks are liquidity; capital management; pension risk; leasehold rents payable; property valuation; acquisitions and investment risk; and financial covenants risk. Customer related risks are client retention; and changes in consumer preference. Stakeholder related risks are suppliers; key contracts; counterparty risk; franchise concentration; and termination of master franchise agreements. Operation risks are reputation; IT infrastructure; ability to find location for expansion; commissary production issues; damage to buildings; service standards; purchasing; adverse changes to planning regimes; continued expansion; service delivery and compliance with contract terms and conditions; traceability; internal control; change management; international expansion (loss of control); and product quality.
The literature review presents four groups of restaurant risk research; using financial ratios to identify
factors impacting market risk; measuring the risk-adjusted restaurant performances; differentiating restaurants with higher potential to file for bankruptcy from the rest; and estimating cash flow/liquidity risk or identifying factors which may have impact on cash flows. These research studies offer valuable insights by identifying key ratios investors could monitor in order to assess the performance and risk of their investment; while managers
could use them to monitor and assess their companies’ performance and risk. However, the examined variables from restaurant risk literature and findings from Table 1 are different.
The examined variables from literature include profitability, liquidity, growth, financial leverage, dividend payout ratio, ROA, Sharpe Ratio, Treynor Index, Jensen Index, EBIT or EBITDA to total liabilities ratios, and CFaR. On the contrary, risk factors presented in Table 1 have been identified from corporation annual reports; and could be seen as forces or variables which may create uncertainty or risk to corporation performances. In other words, there may be relationships between risk factors identified in Table 1 impacting on examined variables from restaurant literature. The only research that actually links corporate identified risk variable to risk is by Madanoglu et al (2010). In this study, they found labor cost, food cost, and industrial product contributed to more than half of the cash flow variances (Madanoglu, et al., 2010).
The explanation of the gap between almost all restaurant risk literature and corporation risk factors
could be that researchers are grounded by the CAPM model (Kim, et al., 2003) and the risk-return relationship notion (Kim, et al., 2009; Kim, et al., 2007). The assumption of CAPM is that investors will be compensated by taking on the market risk, not by taking on the unique risk which could be eliminated by diversification. Given the same level of risk, investors will prefer investment with the highest return. Given the same level of return, investors will prefer investment with the lowest risk. Most researchers examined factors which may have impact on the market risk. However, CAPM model is more valuable to investors who are interested in the risk and return relationship (Kim, et al., 2009), than managers who are more interested in understanding factors which may contribute to overall risks. As shown in Table 1, managers need to prepare for external forces caused by macroeconomic factors, and to manage unique risks in their operations. In addition, unique risk accounts for most of the total risk for restaurant corporations (Kim, et al., 2003). Therefore, research needs to expand from understanding market risk to unique risk (Parsa, et al., 2005).
It may be constructive to define risk as factors impacting cash flows and the variance of cash flows, as
shown in Jang et al. (2011) and Madanoglu et al. (2010). The wealth of investors is maximized when future operating cash flows are maximized and the variance of future operation cash flows is minimized (Madanoglu, et al., 2008; Kim, et al., 2003). A corporation’s value is the sum of the present value of all future cash flows (Maganoglu, et al., 2010; Vernimmen, et al. 2009). Therefore, any factors, which may have negative impacts on the cash flows, especially the operating cash flows, could be seen as risky (Maganoglu, et al., 2010). Managers should minimize the potential impact caused by risk factors on the amount and variances of cash flows. The effect of mitigation could be assessed through the variance of cash flows. Taking this approach, the risk factors could be more aligned to manager’s operation decisions and to shareholders’ interests. Furthermore, this approach implies any risk factors, whether market risk or unique risk, needs to be mitigated.
Most factors identified in Table 1 have been examined in general restaurant literature (Enz, 2004;
Parsa, et al., 2005) or general business literature. Most general restaurant literature identified risk factors, but did not quantify the financial impact of these risk factors on the firm’s risk. For example, the managers concern over finding and retaining skilled employees (Enz, 2004). However, what is the financial impact of this concern on a firm’s cash flows? Could this concern be translated into a longer recruitment period for new hiring while simultaneously a longer over-time pay period for existing labor force, and reduce the firm’s cash flows? Another example will be the raising of the minimum wage. What is the financial impact of raising minimum wage to a firm’s cash flows? A relationship quantifying the impact of risk factors on cash flows could assist managers to prioritize their resources to address the most risky factors. While general business literature have addressed most of these risk factors, their findings could be examined under the restaurant industry domain, and under different segments. Kim et al. (2003) stated that different restaurant segments are subject to various operating and financing risks. Applying general business research in to the restaurant industry should contribute more understanding of restaurant risks for restaurant managers.
Research question 2 is answered by Table 2 and Table 3. Findings from Table 2 show that
corporations are using more sophisticated financial instruments to mitigate risks, but these financial instruments have not been addressed in the restaurant literature. On the contrary, researchers have examined the exposure of interest rate and foreign currency risks, as well as the extent of hedging for the lodging industry (Lee and Jang, 2010; Singh, 2009; Singh and Upneja, 2007). Table 2 presents a comparable picture for the restaurant industry to the lodging industry in financial instruments used. The most popular hedging instruments is SWAPS; and the lack of future contracts indicating the restaurant industry may prefer customization and flexibility offered by forward contracts (Singh, et al., 2007). Table 3 presents operational instruments or operational strategies to mitigate risks. Based on Table 2 and 3, future research should quantify the impacts of these financial and operational instruments on restaurants’ risk or cash flows, and examine their effectiveness.
Given the literature review, findings presented in Table 1, 2, and 3, there is a perceived gap between
current restaurant risk literature and industry practices. The perceived gap should be recognized as research opportunities. Work from Jang et al. (2011) and Madanoglu et al. (2010) contribute to fill the gap. Nevertheless, further research is necessary for the advancement of the field. As advocated by Singh (2009) and Singh et al. (2007), researchers could assess the magnitude of financial hedging and operational hedging, as well as their impacts on restaurant companies’ cash flows and earnings.
Operational instruments have been used by corporations to mitigate both financial and operational risk.
None of the operational methods identified in the literature review have been mentioned in annual reports. This could be explained by the fact that operational methods recommended by scholars are not of a specific nature. The methods applied by the companies, as can be seen on Table 3, are of a wide range. The most mentioned operational instruments are: taking on debt with a mix of fixed and floating rates to counter interest rate risk; to maintain minimum credit ratings of third-parties to prevent credit risk; secure long-term contracts with key suppliers to counter commodity price risk; and maintain lending sources for both long-term and short-term borrowing to reduce liquidity risk. Whereas financial instruments are more suited to larger companies, operational instruments are also suitable for small and medium enterprises. SME restaurants may consider using these operational policies to mitigate risk.
Restaurant risk researches have been built on public corporations, due to the availability of financial
data. Previous research has showed different concerns among independent restaurant and franchised restaurant managers (Enz, 2004). Given the heterogeneous nature of the restaurant industry, and the high proportion of SMEs, restaurant risk research could further expand study subjects to include private companies and SMEs.
The first contribution of this research is identifying four groups of restaurant risk research through the
literature review. The second research contribution is to present the financial instruments and operational instruments used by public corporations to mitigate risk. The third research contribution is to advocate future restaurant risk research to define risk as variables having impact on a firm’s cash flows; and to investigate the impact of risk factors on a firm’s cash flows. This approach also contributes to restaurant managers who are responsible for taking operational procedures to mitigate total risk, including both market risk and unique risk.
The first limitation of this research is trading the comprehensiveness of the literature review for
focusing on restaurant risk literature. The emphasis is to review restaurant risk related literature, therefore literature not entirely focusing on the restaurant industry is excluded. The second limitation is that the researchers examined all 2010 annual reports from only 18 corporations. The decision is to emphasize the comprehensiveness from a small sample over diversities from a large sample. Future research could examine risk factors identified from restaurant corporations from different countries, or over several years to identify changes.
In conclusion, by comparing restaurant risk literature review, and risk factors identified from
corporation annual reports, this research identified future research topics which could fill in the current gap between industry practices and academic research. Risk should be defined as factors impacting on a firm’s cash flows. To mitigate risk is to reduce the variance of cash flows. Existing restaurant risk literatures are scarce (Jang, et al., 2011); and contribute more to the benefits of corporation investors than of managers. While general restaurant literatures (Enz, 2004; Parsa, et al., 2005) may examine broader risk factors, they have not developed quantitative relationships between risk factors and cash flows. Future research should examine and develop quantitative relationships between risk factors and the variance of cash flows. In addition, research could assess the effectiveness of mitigating instruments on a firm’s cash flows as advocated by Singh (2009) and Singh et al. (2007). Last, future research could expand to private companies and SMEs.
REFERENCES
Borde, S. (1998). Risk diversity across restaurants. Cornell Hospitality Quarterly, 39(2), 64-69. Brealey, R.A., Myers, S.C. and Allen F. (2010). Principles of Corporate Finance. New York: McGraw-Hill
Companies. Brigham, E.F. and Houston, J.F. (2009). Fundamentals of Financial Management. Mason: South-Western
Cengage Learning. Ceschini, S. (2005). Analyzing risk in the restaurant industry (Unpublished master’s thesis, Oklahoma State
University, USA). Retrieved from http://digital.library.okstate.edu/etd/umi-okstate-1291.pdf
Enz, C.A. (2004). Issues of concern for restaurant owners and managers. Cornell Hotel and Restaurant Administration Quarterly, 45(4), 315-332.
Gu, Z. (2002). Analyzing bankruptcy in the restaurant industry: A multiple discriminant model. Hospitality Management, 21, 25-42.
Gu, Z. and Kim, H. (2002). Determinants of restaurant systematic risk: A reexamination. Journal of Hospitality Financial Management, 10(1).
Hsu, L., & Jang, S. (2008). The determinants of the hospitality industry’s unsystematic risk: A comparison between hotel and restaurant firms. International Journal of Hospitality and Tourism Administration. 9(2), 105-127
Jang, S., Park, K., and Lee, J. (2011). Estimating cashflow-at-risk (CFaR): A comparables approach for restaurant firms. Cornell Hospitality Quarterly, 52(3), 232-240.
Kim, H. and Gu, Z. (2003). Risk-adjusted performance: A sector analysis of restaurant firms. Journal of Hospitality & Tourism Research, 27(2), 200-216.
Kim, H. and Gu, Z. (2006). Predicting restaurant bankruptcy: A logit model in comparison with a discriminant model. Journal of Hospitality & Tourism Research, 30(4), 474-493.
Kim, W.G., Ryan, B., and Ceschini, S. (2007). Factors affecting systematic risk in the US restaurant industry. Tourism Economics, 13(2), 197-208.
Kim, W.G., Zhong, J., Chen, M., Karadag, E. (2009). Risk-adjusted performance of three restaurant segments in the USA. Tourism economics, 15(1), 139-152.
Lee, S. K. and Jang, S. (2010). Internationalization and exposure to foreign currency risk: An examination of lodging firms. International Journal of Hospitality Management, 29, 701-710.
Madanoglu, M., Lee, K., and Kwansa, F. (2008). Risk-return analysis of fast-food versus casual-dining restaurants: Who moved my cheeseburger? Journal of Hospitality and Tourism Research, 32(3), 327-340.
Madanoglu, M., Olsen, M.D., Kwansa, F.A. (2010). Restaurant industry risk dimensions and their influence on operating cash flows. (July 30, 2010). International CHRIE Conference-Referred Track: Page 12.
Mao, Z., and Gu, Z. (2008). The relationship between financial factors and firm performance: Empirical evidence from U.S. restaurant firms. Journal of Foodservice Business Research, 11(2), 138-159.
Parsa, H.G., Self, J.T., Njite, D. and King, T. (2005). Why restaurants fail? Cornell Hotel and Restaurant Administration Quarterly, 46(3), 304-321.
Singh, A. (2009). The interest rate exposure of lodging firms. International Journal of Hospitality Management, 28, 135-143.
Singh, A. and Upneja, A. (2007). Extend of hedging in the US lodging industry. Hospitality Management, 26, 764-776.
Stein, J.C., Usher, S.E., LaGattuta, D. and Youngen, J. (2001). A comparable approach to measuring cashflow-at-risk for non-financial firms. Journal of applied corporate finance, 13(4), 100-109.
Vernimmen, P., Quiry, P., Dallocchio, M., Le Fur, Y., and Salvi, A. (2009). Corporate Finance Theory and Practice. West Sussex: John Wiley & Sons Ltd.
Youn, H. and Gu, Z. (2010). Predict US restaurant firm failures: The artificial neural network model versus logistic regression model. Tourism and Hospitality Research, 10(3), 171-187.
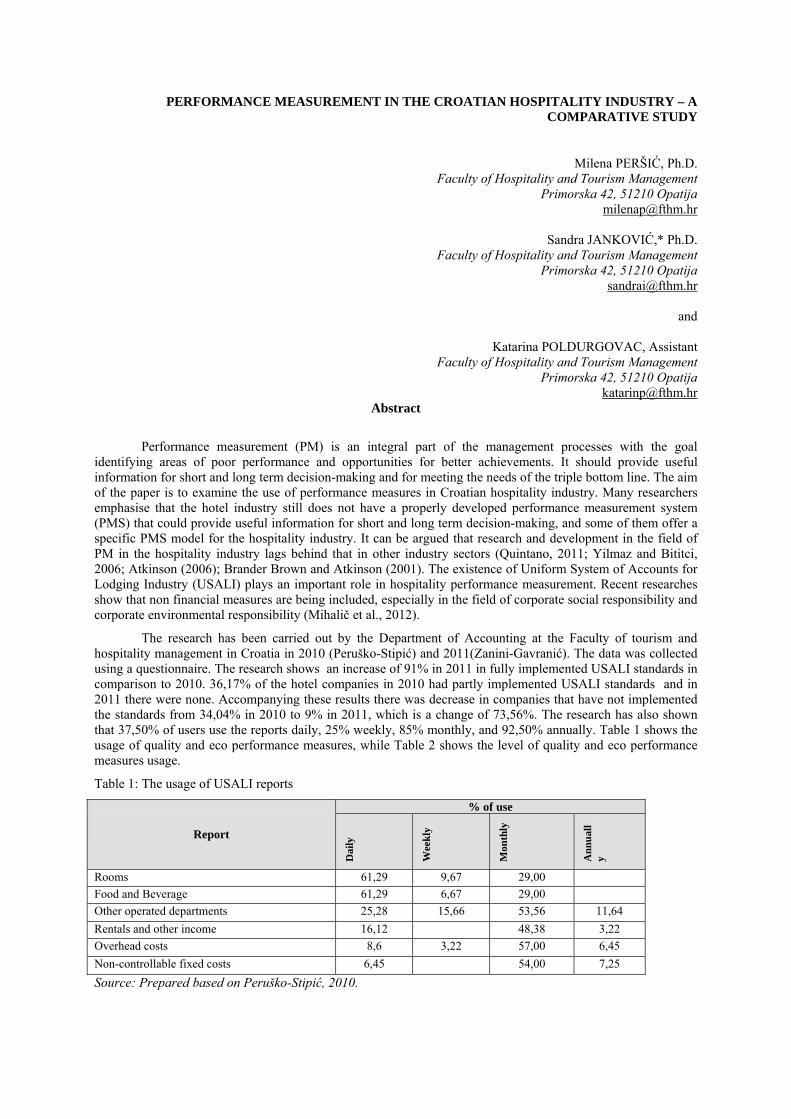
PERFORMANCE MEASUREMENT IN THE CROATIAN HOSPITALITY INDUSTRY – A COMPARATIVE STUDY
Milena PERŠIĆ, Ph.D. Faculty of Hospitality and Tourism Management
Primorska 42, 51210 Opatija [email protected]
Sandra JANKOVIĆ,* Ph.D.
Faculty of Hospitality and Tourism Management Primorska 42, 51210 Opatija
and
Katarina POLDURGOVAC, Assistant Faculty of Hospitality and Tourism Management
Primorska 42, 51210 Opatija [email protected]
Abstract
Performance measurement (PM) is an integral part of the management processes with the goal identifying areas of poor performance and opportunities for better achievements. It should provide useful information for short and long term decision-making and for meeting the needs of the triple bottom line. The aim of the paper is to examine the use of performance measures in Croatian hospitality industry. Many researchers emphasise that the hotel industry still does not have a properly developed performance measurement system (PMS) that could provide useful information for short and long term decision-making, and some of them offer a specific PMS model for the hospitality industry. It can be argued that research and development in the field of PM in the hospitality industry lags behind that in other industry sectors (Quintano, 2011; Yilmaz and Bititci, 2006; Atkinson (2006); Brander Brown and Atkinson (2001). The existence of Uniform System of Accounts for Lodging Industry (USALI) plays an important role in hospitality performance measurement. Recent researches show that non financial measures are being included, especially in the field of corporate social responsibility and corporate environmental responsibility (Mihalič et al., 2012).
The research has been carried out by the Department of Accounting at the Faculty of tourism and hospitality management in Croatia in 2010 (Peruško-Stipić) and 2011(Zanini-Gavranić). The data was collected using a questionnaire. The research shows an increase of 91% in 2011 in fully implemented USALI standards in comparison to 2010. 36,17% of the hotel companies in 2010 had partly implemented USALI standards and in 2011 there were none. Accompanying these results there was decrease in companies that have not implemented the standards from 34,04% in 2010 to 9% in 2011, which is a change of 73,56%. The research has also shown that 37,50% of users use the reports daily, 25% weekly, 85% monthly, and 92,50% annually. Table 1 shows the usage of quality and eco performance measures, while Table 2 shows the level of quality and eco performance measures usage.
Table 1: The usage of USALI reports
Report
% of use
Dai
ly
Wee
kly
Mon
thly
An
nu
all
y
Rooms 61,29 9,67 29,00
Food and Beverage 61,29 6,67 29,00
Other operated departments 25,28 15,66 53,56 11,64
Rentals and other income 16,12 48,38 3,22
Overhead costs 8,6 3,22 57,00 6,45
Non-controllable fixed costs 6,45 54,00 7,25
Source: Prepared based on Peruško-Stipić, 2010.
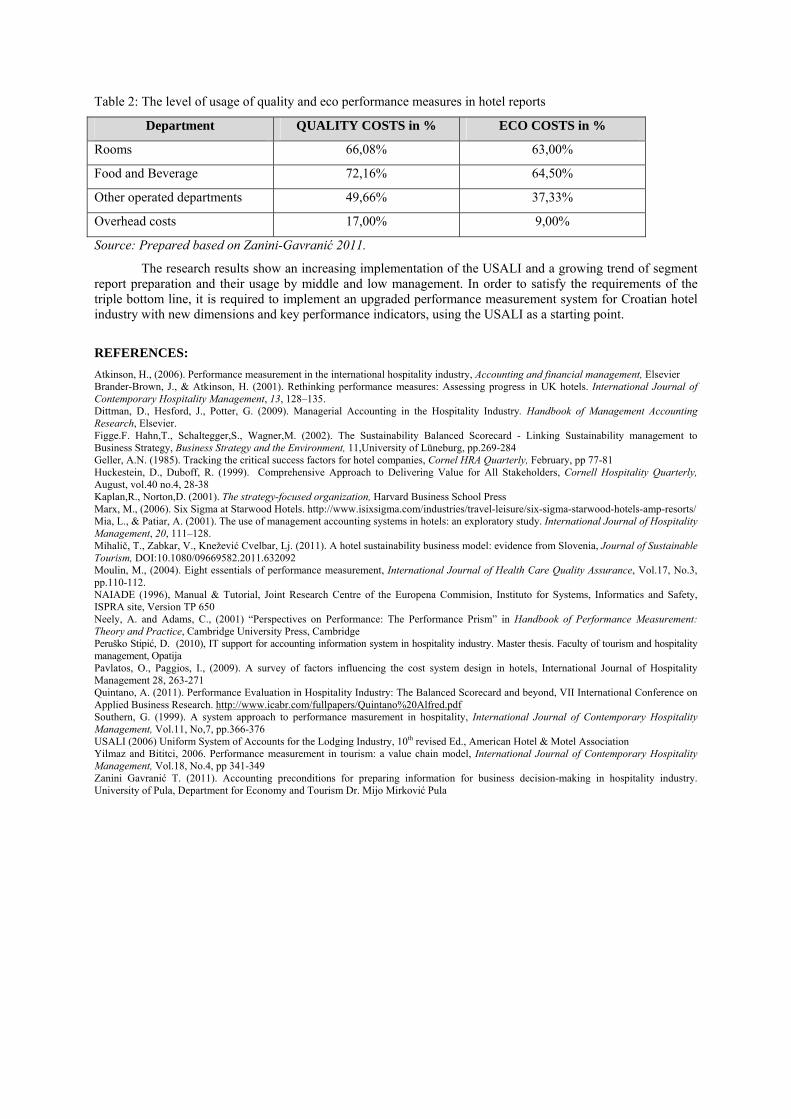
Table 2: The level of usage of quality and eco performance measures in hotel reports
Department QUALITY COSTS in % ECO COSTS in %
Rooms 66,08% 63,00%
Food and Beverage 72,16% 64,50%
Other operated departments 49,66% 37,33%
Overhead costs 17,00% 9,00%
Source: Prepared based on Zanini-Gavranić 2011.
The research results show an increasing implementation of the USALI and a growing trend of segment report preparation and their usage by middle and low management. In order to satisfy the requirements of the triple bottom line, it is required to implement an upgraded performance measurement system for Croatian hotel industry with new dimensions and key performance indicators, using the USALI as a starting point.
REFERENCES:
Atkinson, H., (2006). Performance measurement in the international hospitality industry, Accounting and financial management, Elsevier Brander-Brown, J., & Atkinson, H. (2001). Rethinking performance measures: Assessing progress in UK hotels. International Journal of Contemporary Hospitality Management, 13, 128–135. Dittman, D., Hesford, J., Potter, G. (2009). Managerial Accounting in the Hospitality Industry. Handbook of Management Accounting Research, Elsevier. Figge.F. Hahn,T., Schaltegger,S., Wagner,M. (2002). The Sustainability Balanced Scorecard - Linking Sustainability management to Business Strategy, Business Strategy and the Environment, 11,University of Lüneburg, pp.269-284 Geller, A.N. (1985). Tracking the critical success factors for hotel companies, Cornel HRA Quarterly, February, pp 77-81 Huckestein, D., Duboff, R. (1999). Comprehensive Approach to Delivering Value for All Stakeholders, Cornell Hospitality Quarterly, August, vol.40 no.4, 28-38 Kaplan,R., Norton,D. (2001). The strategy-focused organization, Harvard Business School Press Marx, M., (2006). Six Sigma at Starwood Hotels. http://www.isixsigma.com/industries/travel-leisure/six-sigma-starwood-hotels-amp-resorts/ Mia, L., & Patiar, A. (2001). The use of management accounting systems in hotels: an exploratory study. International Journal of Hospitality Management, 20, 111–128. Mihalič, T., Zabkar, V., Knežević Cvelbar, Lj. (2011). A hotel sustainability business model: evidence from Slovenia, Journal of Sustainable Tourism, DOI:10.1080/09669582.2011.632092 Moulin, M., (2004). Eight essentials of performance measurement, International Journal of Health Care Quality Assurance, Vol.17, No.3, pp.110-112. NAIADE (1996), Manual & Tutorial, Joint Research Centre of the Europena Commision, Instituto for Systems, Informatics and Safety, ISPRA site, Version TP 650 Neely, A. and Adams, C., (2001) “Perspectives on Performance: The Performance Prism” in Handbook of Performance Measurement: Theory and Practice, Cambridge University Press, Cambridge Peruško Stipić, D. (2010), IT support for accounting information system in hospitality industry. Master thesis. Faculty of tourism and hospitality management, Opatija Pavlatos, O., Paggios, I., (2009). A survey of factors influencing the cost system design in hotels, International Journal of Hospitality Management 28, 263-271 Quintano, A. (2011). Performance Evaluation in Hospitality Industry: The Balanced Scorecard and beyond, VII International Conference on Applied Business Research. http://www.icabr.com/fullpapers/Quintano%20Alfred.pdf Southern, G. (1999). A system approach to performance masurement in hospitality, International Journal of Contemporary Hospitality Management, Vol.11, No,7, pp.366-376 USALI (2006) Uniform System of Accounts for the Lodging Industry, 10th revised Ed., American Hotel & Motel Association Yilmaz and Bititci, 2006. Performance measurement in tourism: a value chain model, International Journal of Contemporary Hospitality Management, Vol.18, No.4, pp 341-349 Zanini Gavranić T. (2011). Accounting preconditions for preparing information for business decision-making in hospitality industry. University of Pula, Department for Economy and Tourism Dr. Mijo Mirković Pula
Managerial capability for innovation in Irish tourism micro firms
Mr Arthur Kearney, Doctoral student, School of Business, Waterford Institute of Technology, Waterford.
Professor Denis Harrington *, Head of Graduate Business,
School of Business, Waterford Institute of Technology, Waterford. Telephone 00 353 51 302427; email [email protected]
Abstract
Tourism micro firms can play a vital role in Irish economic regeneration. These firms face significant competitiveness challenges, which can be overcome through innovation. Research into managerial capability for innovation has concentrated on larger firms, opening a research gap in the micro firm literature. A critical review of literature premised on the resource based and dynamic capabilities perspectives is used to develop a tentative theoretical model of managerial capability for innovation in the tourism micro firm. The potential for future research, based on qualitative methodology is argued and contributions at the level of practice, policy and academic research are posited.
Key words: Micro-firm; innovation; managerial capability; competitiveness.
THE IRISH TOURISM INDUSTRY
The tourism industry is a vital contributor to economic and social activity in Ireland. In 2010 it sustained over 180,000 jobs (T.R.I.G. 2011) making a G.D.P. contribution of 2.7 billion euro (Department of Taoiseach, 2011). Tourism is primarily indigenous in nature (Failte Ireland, 2012), and counterbalances the high dependence of the Irish economy on foreign investment. The economic recession which affected the Irish economy has led to a renewed interest in the tourism industry, as a potential source of economic growth and national recovery (Department of Taoiseach, 2011). Realisation of this potential remains contingent on addressing and overcoming some deep competitiveness challenges which are both external and internal to the industry. The external challenges are largely driven by high cost structures which emerged during the pre 2008 economic boom: these cost burdens include high property costs; competition from hotels which are effectively insolvent but maintained by government support; high levels of taxation; low levels of consumer confidence and high labour costs (Failte Ireland, 2012). There is also the challenge from the globalisation of the tourism industry which is being transformed by competitive forces, namely the proliferation of new information technologies, low cost transport connections and increasingly volatile consumer behaviour as tourism customers become more sophisticated and knowledgeable (Sundbo, 2007). Finally funding is also a key challenge with many firms deprived of credit facilities (I.T.I.C., 2011). Recent government policy decisions have begun to show awareness of the competitiveness challenges which the industry faces and, specifically, there has been an implementation of the deregulation of industry labour markets; reductions in value added tax on industry services; reductions in airport charges and the provision of funding, at industry level, to improve marketing of
the industry (Department of Taoiseach, 2012). Internally tourism firms face considerable competitiveness challenges with the solutions to these challenges frequently within the ambit of the general managers of these firms. There are deficits in terms of the capability of management, and though there has been considerable investment in management development over the past ten years, this remains an area that warrants further research attention today (Failte Ireland, 2010). Specifically tourism industry managers take an inward focus, often failing to engage with environmental change (Hallin and Marnburg, 2007); they lack experience of innovation (Failte Ireland, 2010) and leave human resources underdeveloped (Baum, 2007).
INNOVATION
Traditionally innovation has been assigned an important role in the tourism industry as a leverage mechanism for providing profitable new products and services (Sundbo et al. 2007). While continuing to emphasise the role of product/ service innovation, more recent research in tourism has expanded the nature of innovation and posited that the generation of such innovation involves complex organisational processes (Camison & Montfort-Mir, 2011). In an Irish context there have been calls for greater innovation by tourism firms (Department of Taoiseach, 2011). However there are concerns that these firms are failing to engage proactively with innovation activities, especially at the level of the firm. Specific reasons for this lack of engagement by smaller tourism firms are: a lack of experience of innovation which induces a risk intolerance among managers and employees; a lack of awareness of the importance of this activity; a lack of time leading to inadequate levels of strategic thinking; an inward focus of tourism businesses whereby firms are slow to receive signals of environmental change and a lack of tailored market information, with firms often exhibiting marketing competences but ones which are inappropriate to their size (Failte Ireland, 2010).
TOURISM MICRO FIRMS
Almost ninety percent of Irish tourism firms are micro firms employing less than ten employees and possessing a turnover of less than two hundred and fifty thousand euro (European Commission, 2012). They contribute to economic growth, competitiveness and employment of both national and regional economies (Komppula, 2004). They are also contributors to the sustainability of local communities through the provision of seasonal employment (Morrison, 2006). Micro firms are unique organisational entities distinct from large, medium sized or small firms. They are dominated by an owner/ manager figure who owns resources and manages the firm at operational and strategic levels (Devins et al. 2005).
This dominance is manifest in impacts on the organisation’s employees (Chell, 1985); culture (Kruse cited in Devins et al. 2005 and stakeholder engagement (Greenbank, 2000). Communication in the micro firm is informal in nature and patterned through complex social narratives (Kelliher and Reinl, 2009). The assets and resources of micro firms are limited (Phillipson et al. 2004) creating challenges in terms of supporting the long term development of the business. These assets and resources are often premised on simple technologies and processes (Liberman-Yaconi et al. 2010) which are easily imitated by competing firms and new entrants to the industry. Owner/ managers of micro firms exhibit preference for operational as opposed to strategic work (O’Dwyer and Ryan, 2000) supporting the development of knowledge of all aspects of the firm but, potentially, creating a barrier to long term strategic thinking and business development (Beaver, 2007). Decision making processes in micro firms are rooted in intuition and heuristics (Greenbank, 2000) and differ fundamentally from the more formal and rational decision making mechanisms found in larger firms (Liberman-Yaconi et al. 2010). Micro firms are characterised by being embedded within local community environments (Phillipson et al. 2004) and sometimes within the context of a family (Oughton et al. 2003; Wheelock and Baines, 1998). This embedded nature generates both positive impacts on the firm, through the creation of resource endowments (Phillipson et al. 2006 but also, simultaneously, barriers to change and new ideas (Atterton, 2007).
The tourism micro firm is identified as possessing characteristics which can enable innovation (Corrocher et al. 2009; Walsh et al. 2009). The structure of the micro firm facilitates the development of simple communication mechanisms which enable the narratives of the owner/ manager (Kelliher and Reinl, 2009) to
shape an innovation culture. Micro firms are close to market with owner/ manager involvement in day to day business activities enabling the sensing of market signals (O’Dwyer and Ryan, 2000). The dominant role of the owner/ manager enables a risk taking focus, which facilitates innovation (Morrison and Conway, 2007). Micro firms develop innovation which is often incremental in nature (Thomas et al. 2011), informal (Simpson, 2001) and is shaped by powerful suppliers and customers (Corrocher et al. 2009). Premised on this review of literature micro firm innovation is defined. It is the creative use of resources and development of firm level capabilities which generates new commercial outcomes through the development of new products and services; the reconfiguration of organisational processes; and the development of new modes of market access. Inherent in this innovation is the important role of the owner/ manager, who through the development of innovation, continuously develops managerial capability for innovation, which of itself becomes a source of sustainable competitive advantage within the micro firm.
BARRIERS TO INNOVATION IN TOURISM MICRO FIRMS
Micro firms are characterised by numerous and often deep barriers which inhibit the emergence and development of innovation. These barriers may be grouped into owner/ manager barriers; internal barriers and external barriers (Table 1). The operational focus of many micro firm owner/ managers inhibits innovation through the immersion of this individual in day to day work and a failure to utilise the market information which though readily available remains unanalysed (O’Dwyer and Ryan, 2000). Managerial resources in the form of time are consumed by poor time management (Samujh, 2011). Owner/ managers manage their firms on the basis of lifestyle objectives as opposed to objectives which are narrowly economic (Greenbank, 2000). Risk intolerance emerges where there is a fear of losing family owned assets (Wheelock and Baines, 1998) and the slowness of response and the fear of change which this risk intolerance creates, makes innovation both difficult and, at times, unlikely to take place. While the dominance of owner/ manager possesses potential to develop communication and organisational culture (Kelliher and Reinl, 2009), this characteristic of micro firms may prove a barrier to innovation where it is manifest as a reluctance to sacrifice control inhibiting communication and the sharing of ideas (Chell, 1985). Internally micro firm assets and resources are limited (Phillipson et al. 2004) and there is a lack of awareness of the potential of human resources leading to their under development by owner/ managers (Matlay, 1999). Externally, the nature of the micro environment renders innovation generation difficult as the firm is often simply a price taker in a rapidly changing environment (Kelliher and Reinl, 2009). The limited resources of the micro firm render this challenge particularly difficult. While larger firms possess well honed marketing competences, enabling active market engagement and proactive anticipation of market change, the micro firm relies on the owner/ manager’s own engagement with the market (Devins et al. 2005; Greenbank, 2000). The micro firm also lacks market power of larger firms. Similarly micro firm embeddedness, while providing access to resources, may become a barrier to innovation where strong ties between stakeholders and the firm strengthen the maintenance of the status quo, building ramparts against new ideas and nurturing a dominant logic which is inclement towards innovation (Atterton, 2007).
Table 1: Micro firm innovation barriers
Internal barriers External barriers Owner/ manager barriers Human resource constraints Environmental turbulence Operational focus Asset / resource limitations Embeddedness Risk intolerance Lifestyle motivation Time constraints Owner/ manager dominance
MANAGERIAL CAPABILITY FOR INNOVATION
Despite the significance of innovation for micro tourism firms relatively little research has been carried out in the area (Corrocher et al. 2009). Simpson (2001), in a theoretical paper, argues the importance of an approach to micro firm innovation based on the insights of cognitive psychology. Thomas et al. (2011), in a critical review of tourism small firm research, argue the dearth of studies in the area, specifically highlighting the limited research into innovation in the very small tourism firm. Contemporaneously there has been increasing interest in how managerial capability can shape and influence innovation, however this research concentrates on larger firms (Salaman and Storey, 2009). While there is specific research into the nature of managerial capability in the work of Byrne et al. (2009), Mol and Birkinshaw (2009), Hamel et al. (2008) and Moss Kanter (2006) this work takes an organisational as opposed to a managerial focus. Hence a research gap in the literature has been identified as to what is the nature of managerial capability for innovation in micro tourism firms? The present paper builds a theoretical model of managerial capability for innovation in tourism micro firms. The building of this model is guided by four research questions. These are 1. What is the nature of tourism micro firm innovation? 2. What is the extent of tourism micro firm management capability? 3. What is the nature of tourism micro firm management capability for innovation? 4. How does management capability for innovation impact on innovation in tourism micro firms?
THEORETICAL FRAMEWORK
One perspective through which this gap in the research may be viewed is through the lens of the resource based view (Barney, 2001; Barney, 1991; Wernerfelt, 1984) and the related dynamic capabilities approach (Winter, 2003; Eisenhardt and Martin, 2000; Teece et al. 1997). Resources are stocks of available factors that are under the control of the organisation (Amit and Schoemaker, 1993). Capabilities are activities which an organisation can accomplish (Grant, 1996) and capabilities possess intangible qualities due to dependence on people (Nothnagel, 2008) . In the micro firm the owner/ manager, by virtue of playing a dominant role, is the key resource allocator (Greenbank, 2000) and plays a vital role in developing and shaping capabilities (Kelliher and Reinl, 2009). Critically from the perspective of long term competitiveness the owner/ manager who takes a more strategic perspective in shaping capabilities (Beaver, 2007) can shape the emergence of dynamic capabilities, deeply rooted learning capabilities (Winter, 2003) within the micro firm, which enable proactive engagement of the firm with environmental change (Eisenhardt and Martin, 2000). Therefore it is argued that managerial capability, understood as the human capability, builds an organisation’s long term competitive advantage (Groysberg et al. 2006; Barney, 2001), and is a capability which can lead to micro firm innovation.
MICRO FIRM MANAGERIAL CAPABILITY CRITERIA
In this section it is argued that the nature of the micro firm environment presents owner/ managers with three primary sources of resources. One source of resources exists in the form of endowments such as are present in the family context or the local community context, where both contexts provide the firm, where the owner/ manager is capable of interacting with the resources embedded in these contexts, with a resource which can be developed towards competitive advantage. Families offer social and emotional support to owner/ managers (Samujh, 2011), supply the micro firm with low cost, flexible labour (Wheelock and Baines, 1998) and contribute to decision making (Habershon and Williams, 1999 cited in Morrison, 2006) while local communities enable owner/ managers to gain access to both social support, as in membership of unofficial business fraternities and knowledge of the rules of the local business game (Phillipson et al. 2006). A second source of resources takes the form of a stakeholder environment, theorised as strong and weak ties (Granovetter, 1973), which provide the owner/ manager with a source of resources manifest as sources of business advice and innovation opportunities, which managerial capability may leverage (Atterton, 2007; Phillipson et al. 2004) and which helps to overcome the resource poverty characteristic of the micro firm (Liberman-Yaconi et al. 2010). The third source of resources is predicated on the closeness of the micro firm owner/ manager to the market
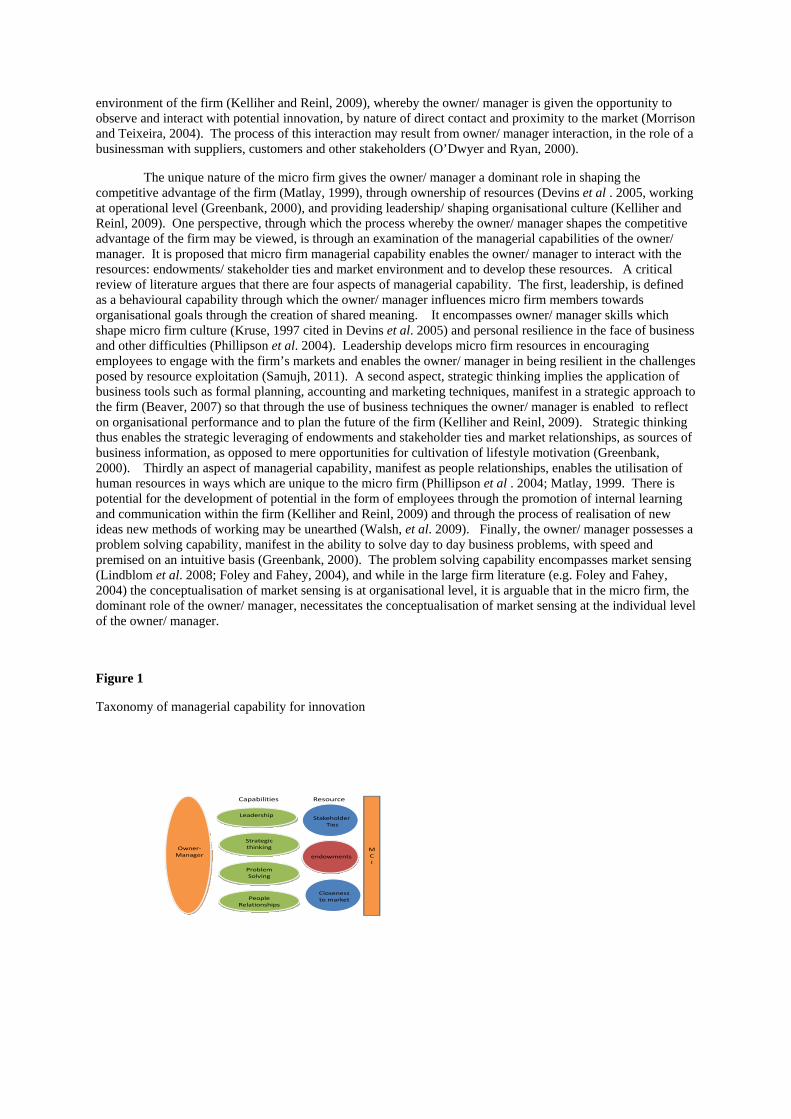
environment of the firm (Kelliher and Reinl, 2009), whereby the owner/ manager is given the opportunity to observe and interact with potential innovation, by nature of direct contact and proximity to the market (Morrison and Teixeira, 2004). The process of this interaction may result from owner/ manager interaction, in the role of a businessman with suppliers, customers and other stakeholders (O’Dwyer and Ryan, 2000).
The unique nature of the micro firm gives the owner/ manager a dominant role in shaping the competitive advantage of the firm (Matlay, 1999), through ownership of resources (Devins et al . 2005, working at operational level (Greenbank, 2000), and providing leadership/ shaping organisational culture (Kelliher and Reinl, 2009). One perspective, through which the process whereby the owner/ manager shapes the competitive advantage of the firm may be viewed, is through an examination of the managerial capabilities of the owner/ manager. It is proposed that micro firm managerial capability enables the owner/ manager to interact with the resources: endowments/ stakeholder ties and market environment and to develop these resources. A critical review of literature argues that there are four aspects of managerial capability. The first, leadership, is defined as a behavioural capability through which the owner/ manager influences micro firm members towards organisational goals through the creation of shared meaning. It encompasses owner/ manager skills which shape micro firm culture (Kruse, 1997 cited in Devins et al. 2005) and personal resilience in the face of business and other difficulties (Phillipson et al. 2004). Leadership develops micro firm resources in encouraging employees to engage with the firm’s markets and enables the owner/ manager in being resilient in the challenges posed by resource exploitation (Samujh, 2011). A second aspect, strategic thinking implies the application of business tools such as formal planning, accounting and marketing techniques, manifest in a strategic approach to the firm (Beaver, 2007) so that through the use of business techniques the owner/ manager is enabled to reflect on organisational performance and to plan the future of the firm (Kelliher and Reinl, 2009). Strategic thinking thus enables the strategic leveraging of endowments and stakeholder ties and market relationships, as sources of business information, as opposed to mere opportunities for cultivation of lifestyle motivation (Greenbank, 2000). Thirdly an aspect of managerial capability, manifest as people relationships, enables the utilisation of human resources in ways which are unique to the micro firm (Phillipson et al . 2004; Matlay, 1999. There is potential for the development of potential in the form of employees through the promotion of internal learning and communication within the firm (Kelliher and Reinl, 2009) and through the process of realisation of new ideas new methods of working may be unearthed (Walsh, et al. 2009). Finally, the owner/ manager possesses a problem solving capability, manifest in the ability to solve day to day business problems, with speed and premised on an intuitive basis (Greenbank, 2000). The problem solving capability encompasses market sensing (Lindblom et al. 2008; Foley and Fahey, 2004), and while in the large firm literature (e.g. Foley and Fahey, 2004) the conceptualisation of market sensing is at organisational level, it is arguable that in the micro firm, the dominant role of the owner/ manager, necessitates the conceptualisation of market sensing at the individual level of the owner/ manager.
Figure 1
Taxonomy of managerial capability for innovation
Problem Solving
Strategic thinking
Leadership
PeopleRelationships
endowments
Owner‐Manager
StakeholderTies
Closeness to market
MCI
Capabilities Resource
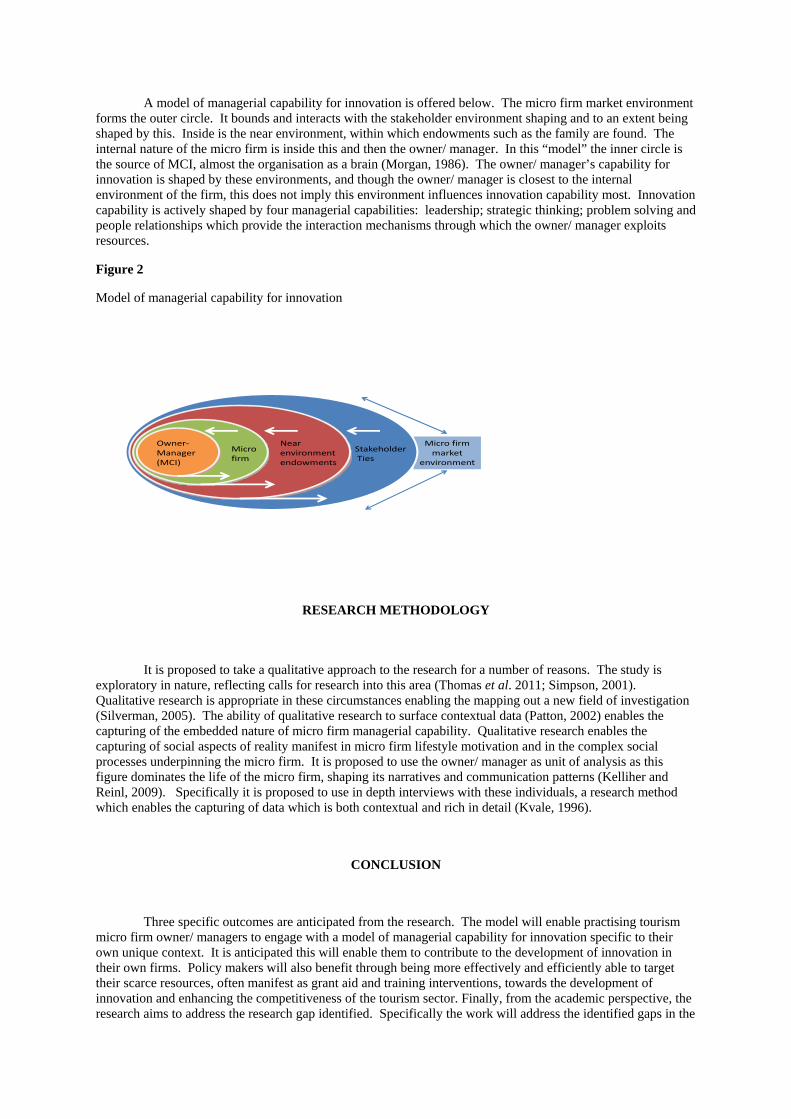
A model of managerial capability for innovation is offered below. The micro firm market environment forms the outer circle. It bounds and interacts with the stakeholder environment shaping and to an extent being shaped by this. Inside is the near environment, within which endowments such as the family are found. The internal nature of the micro firm is inside this and then the owner/ manager. In this “model” the inner circle is the source of MCI, almost the organisation as a brain (Morgan, 1986). The owner/ manager’s capability for innovation is shaped by these environments, and though the owner/ manager is closest to the internal environment of the firm, this does not imply this environment influences innovation capability most. Innovation capability is actively shaped by four managerial capabilities: leadership; strategic thinking; problem solving and people relationships which provide the interaction mechanisms through which the owner/ manager exploits resources.
Figure 2
Model of managerial capability for innovation
Micro firm market
environment
Near environmentendowments
Microfirm
Owner‐Manager(MCI)
StakeholderTies
RESEARCH METHODOLOGY
It is proposed to take a qualitative approach to the research for a number of reasons. The study is exploratory in nature, reflecting calls for research into this area (Thomas et al. 2011; Simpson, 2001). Qualitative research is appropriate in these circumstances enabling the mapping out a new field of investigation (Silverman, 2005). The ability of qualitative research to surface contextual data (Patton, 2002) enables the capturing of the embedded nature of micro firm managerial capability. Qualitative research enables the capturing of social aspects of reality manifest in micro firm lifestyle motivation and in the complex social processes underpinning the micro firm. It is proposed to use the owner/ manager as unit of analysis as this figure dominates the life of the micro firm, shaping its narratives and communication patterns (Kelliher and Reinl, 2009). Specifically it is proposed to use in depth interviews with these individuals, a research method which enables the capturing of data which is both contextual and rich in detail (Kvale, 1996).
CONCLUSION
Three specific outcomes are anticipated from the research. The model will enable practising tourism micro firm owner/ managers to engage with a model of managerial capability for innovation specific to their own unique context. It is anticipated this will enable them to contribute to the development of innovation in their own firms. Policy makers will also benefit through being more effectively and efficiently able to target their scarce resources, often manifest as grant aid and training interventions, towards the development of innovation and enhancing the competitiveness of the tourism sector. Finally, from the academic perspective, the research aims to address the research gap identified. Specifically the work will address the identified gaps in the
literature regarding the call for greater research into tourism micro firm innovation (Thomas et al. 2011; Sundbo et al. 2007) and, specifically, the roles played by owner/ managers in developing innovation (Morrison, 2006; Simpson, 2001) thus contributing to an evolving knowledge base in the tourism micro firm context.
References
Amit, R. & Schoemaker, P. (1993). Strategic assets and organisational rent. Strategic Management Journal, 14 (1), 33-46.
Atterton, J. (2007). The ‘strength of weak ties’: Social networking by business owners in the Highlands and Islands of Scotland. Sociologia Ruralis, 47 (3), 228-245.
Barney, J. (2001). Is the resource based “view” a useful perspective for strategic management research: Yes. Strategic Management Journal, 26 (1), 41-56.
Barney, J. (1991). Firm resources and sustained competitive advantage. Strategic Management Journal, 17 (1), 99-120.
Baum, T. (2007). Human resources in tourism: Still waiting for change. Tourism Management, 28 (6), 1383-1399.
Beaver, G. (2007). The strategy payoff for smaller enterprises. Journal of Business Strategy, 28 (1), 11-17.
Byrne, C., Mumford, M., Barrett, J. & Vessey, W. (2009). Examining the leaders of creative efforts: What do they do and what do they think about. Creativity and Innovation Management, 18 (4), 256-268.
Camison, C. and Montfort-Mir, V. (2012). Measuring innovation in tourism from the Schumpeterian and dynamic capabilities. Tourism Management, 33 (4), pp.776-789.
Chell, E. (1985). The entrepreneurial personality: A few ghosts laid to rest? International Small Business Journal, 3 (3), 43-54.
Corrocher, N., Cusmano, L. & Morrison, A. (2009). Modes of innovation in knowledge-intensive business services: Evidence from Lombardy. Journal of Evolutionary Economics, 19 (1), 173-196.
Department of Taoiseach (2012). Programme for government progress report, Retrieved February 12th 2012, from http://www.taoiseach.gov/irish/
Department of Taoiseach (2011), Innovation task force: progress report. Retrieved January 10th 2012 from http://www.taoiseach.gov/irish/innovation
Devins, D., Gold, J., Johnson, S. & Holden, R. (2005). A conceptual model of management learning in micro businesses: Implications for research and policy. Education and Training, 47 (8-9), 540-551.
Eisenhardt, K. and Martin, J. (2000). Dynamic capabilities: What are they? Strategic Management Journal. 21 (10-11), 1105-1121.
European Commission (2012). Small and medium sized enterprises Retrieved February 15th 2012 from http://ec.europa.eu/enterprise/policies/sme/facts-figures-analysis/performance-review/index_en.htm
Failte Ireland (2012). Annual report, Retrieved March 15th 2012, from http://www.failteireland.ie
Failte Ireland (2010), Fostering an innovation culture in Irish Tourism. Retrieved November 22nd 2011, from, http://www.failteireland.ie/Information-Centre/Publications/Reviews---Reports/Policy/Innovation_Paper_22-12-2010.
Foley, A. and Fahy, J. (2004). ‘Towards a further understanding of the development of market orientation in the firm: A conceptual framework based on the market-sensing capability’. Journal of Strategic Marketing, 12 (2) 219-230.
Grant, R. (1996). Toward a knowledge based theory of the firm. Strategic Management Journal, 17 (1), 109-122.
Granovetter, M. (1973). The strength of weak ties. American Journal of Sociology, 78 (6), 1360-1380.
Greenbank, P. (2000). Training micro-business owner-managers: A challenge to current approaches. Journal of European Industrial Training, 24 (7), 403-411.
Groysberg, B., MacLean, A. & Nohria, N. (2006). Are leaders portable? Harvard Business Review, 84 (5), 1-12
Hallin, C. & Marnburgh, E. (2007). In times of uncertainty in the hotel industry: Hotel director’s decision-making and coping strategies for dealing with uncertainty in change activities. Scandinavian Journal of Hospitality and Tourism. 7 (4), pp.15-25
Hamel, G., Birkinshaw, J. and Mol, M. (2008). Management innovation, Academy of Management Review, 33 (4), 825-845.
I.T.I.C. (2011). Tourism opportunity: Driving economic renewal. Retrieved April 18th 2012 from http://www.itic.ie/fileadmin/docs/ITIC-TourismOpportunity_Final_Draft_SB_230111.pdf
Kelliher, F. & Reinl, L. (2009). A resource-based view of micro-firm management practice. Journal of Small Business and Enterprise Development, 16 (3), pp.521-532.
Komppula, R. (2004). Success and growth in rural tourism micro-businesses in Finland: Financial or lifestyle objectives. In R. Thomas (eds), Small firms in tourism: International perspectives. Elsevier: London. 115-137.
Kvale, S. (1983). The qualitative research interview: A phenomenological and hermeneutical mode of understanding. Journal of Phenomenological Psychology, 14 (2), pp.171-196.
Liberman-Yaconi, L., Hooper, T. & Hutchings, K. (2010). Toward a model of understanding strategic decision-making in micro firms: Exploring the Australian information technology sector. Journal of Small Business Management, 48 (1), 70-95.
Lindblom, A., Olkkonen, R., Kajalo, S. and Mitronen, L. (2008). Market sensing capability and business performance of retail entrepreneurs. Contemporary Management Research, 4 (3), 219-236.
Matlay, H. (1999). Employee relations in small firms: A micro business perspective. Employee Relations, 21 (3), 285-295.
Mol, M. & Birkinshaw, J. (2006). The sources of management innovation: when firms introduce new management practices, Journal of Business Research, 62 (12), 1269-1280.
Morgan, G. (1986). Images of organisation, Thousand Oaks: Sage.
Morrison, A. & Conway, F. (2007). The status of the small hotel firm. The Service Industries Journal, 27 (1), 47-58.
Morrison, A. (2006). A contextualisation of entrepreneurship. International Journal of Entrepreneurial Behaviour and Research, 12 (4), 192-209.
Morrison, A. and Teixeira, R. (2004) ‘Small business performance: A tourism sector focus’, Journal of Small Business and Enterprise Development, 11 (2), pp.166-173.
Moss Kanter, R. (2006). Innovation: The classic traps. Harvard Business Review, 84 (11), 72-83.
Nothnagel, K. (2008), Empirical research within resource based theory, London: Gabler.
Oughton, E., Wheelock, J. & Baines, S. (2003). Micro business and social inclusion in rural households: A comparative analysis. Sociologia Ruralis, 43 (4), pp.331-348.
O’Dwyer, M. & Ryan, E. (2000). Management development issues for owners/ managers of micro-enterprises. Journal of European Industrial Training, 24 (6), 345-353.
Patton, M. (2002). Qualitative research and evaluation methods. Thousand Oaks: Sage.
Phillipson, J., Gorton, M. & Laschewski, L. (2006). Local business co-operation and the dilemmas of collective action: Rural micro-business networks in the North of England. Sociologia Ruralis, 46 (1), 40-59.
Phillipson, J., Bennett, K., Lowe, P. & Raley, M. (2004). Adaptive responses and asset strategies: The experience of rural micro-firms and foot and mouth disease. Journal of Rural Studies, 20, .227-243.
Salaman, G. & Storey, J. (2009). Managerial dilemmas: Exploiting paradox for strategic change. London: John Wiley & Sons.
Samujh, H. (2011). Micro businesses need support: Survival precedes sustainability. Corporate Governance, 11 (1), 15-28.
Simpson, B. (2001). Innovation and the micro-enterprise. International Journal of Services Technology and Management, 2 (3-4), 377-387.
Silverman, D. (2005). Doing qualitative research: A practical handbook. London: Sage.
Sundbo, J., Orfila Sintes, F. & Sorensen, F. (2007) ‘The innovative behaviour of tourism firms- Comparative studies of Denmark and Spain’. Research Policy, 36 (1) 88-106.
Teece, D., Pisano, G. & Shuen, A. (1997), ‘Dynamic capabilities and strategic management’. Strategic Management Journal, 18 (7), pp.509-533.
Thomas, R., Shaw, G. & Page, S. (2011). Understanding small firms in tourism: A perspective on research trends and challenges. Tourism Management, 32 (5), 963-976.
Tregear, A. (2005). Lifestyle, growth or community involvement? The balance of goals of U.K. artisan food producers. Entrepreneurship and Regional Development, 17 (1), 1-15.
T.R.I.G. (2011). Second progress report from the tourism renewal implementation group. Retrieved February 19th 2012 from http://www.itic.ie/2011/docs/TRG
Walsh, M., Lynch, P. and Harrington, D. (2009) ‘Towards a conceptualisation of the innovativeness construct’, Retrieved February 2012 from: http://www.wit.ie/Research/ResearchGroupsCentres/Groups/RIKON/Publications
Wernerfelt, B. (1984). A resource based view of the firm. Strategic Management Journal. 5 (2), 171-180.
Wheelock, J. & Baines, S. (1998). Dependency or self-reliance? The contradictory case of work in UK small business families. Journal of Family and Economic Issues, 19 (1), 53-73.
Winter, S. (2003). Understanding dynamic capabilities. Strategic Management Journal, 24 (10), 991-995.
Social entrepreneurship in the hospitality and tourism industries as a business model for bringing about social improvement in developing economies
Philip Sloan International University of Applied Sciences Bad Honnef – Bonn
Muelheimerstrasse 38 Bad Honnef 53604, Germany
e-mail: [email protected]
Claudia Simons-Kaufmann International University of Applied Sciences Bad Honnef – Bonn
Muelheimerstrasse 38 Bad Honnef 53604, Germany
e-mail: [email protected]
Willy Legrand International University of Applied Sciences Bad Honnef – Bonn
Muelheimerstrasse 38 Bad Honnef 53604, Germany
e-mail: [email protected]
ABSTRACT
Using 3 case studies from sustainable hospitality and tourism destinations this paper reports on
preliminary research set in developing economies in order to understand the development of social entrepreneurship in this context. The applicability of sustainable hospitality management systems as a means of fostering wellbeing for under-privileged sections of indigenous societies is analysed. Preliminary conclusions show that the positive effects of employing local indigenous people in these Hospitality operations far outweigh minimal negative aspects and that local infrastructures including schools, libraries and roads have all come about as a direct result. In addition, the authors wish to contribute to the further development of the theory of social entrepreneurship in the context of the hospitality and tourism industries in developing economies.
Key words: social entrepreneurship, community-based sustainable hospitality and tourism, social value INTRODUCTION
Tourism has become a major activity in our society and an increasingly important sector in terms of economic and social development. (Giaoutzi and Nijkamp, 2006). The aim of this paper is to show how the tourism and hospitality industries have the means to provide opportunities for poverty alleviation and wellbeing for under privileged people in developing economies through the process of social entrepreneurship. Poverty is one of the severest problems in almost all developing countries and constitutes a limiting factor to development. Todaro (1998) defines development as both an improved physical reality and a state of being where individuals in society can secure the means for obtaining a better life. Lack of capital, education, business skills present serious obstacles for poor people wishing to move up the economic ladder and participate in economic growth (Todaro, 1998: 18).
Edgell (2006) suggests that tourism “has the potential to participate in, change, and improve the social,
cultural, economic, political, and ecological dimensions of our future lifestyles.” Virtually all nations practice tourism as a development strategy using it as a means of “earning foreign exchange, creating employment, promoting deprived regions and developing infrastructure” (Singh, 2003). The boom in all forms of tourism and hospitality has given rise to millions of new jobs and increased economic prosperity in countries around the world. Although the numbers of international arrivals decreased by 4% in 2009, UNWTO forecasts an increase of between 3%-4% for 2011. In 2008 tourism and hospitality generated US $946 billion in export earnings (UNWTO, 2010). Consequently, there is growing potential for enterprise development and employment creation, which in turn, stimulates further investment and supports the development of local services. As a result, it generates income and can forward productive intercultural understanding. It also has the potential for earning substantial foreign exchange and contributing to the balance of payments. Developing countries typically have comparative advantages in the tourism. They not only possess land, sun, sea, and adventure possibilities but also assets like wildlife, landscape and cultural experiences which are all demanded by consumers from richer and often more densely populated countries. Unless properly managed, tourism can have many negative effects on
the environment and on local society. In primitive and isolated areas, the arrival of too many visitors can even cause local people to leave their settlements and move to new areas where they can remain undisturbed. (Brunet, et al., 2001). Basu (2003) emphasises the development of destinations should be fundamentally built around local participation, representation and empowerment, the promotion of local interests, the preservation of local landscapes, cultures and heritage, and the matching of the industry to local carrying capacity. Singh (2003) supports this, as “community involvement in policy framing, planning and development of local resources and monitoring success and failure of the project” lead to a more “authentic, meaningful and satisfying experience for both the visitor and the visited.” Singh argues that there is a great number of examples, where tourism development contributes towards economic growth, but where societal effects were ignored. Therefore, Singh (2003) concludes that “no tourism development however ingeniously conceived, can foster sustainability if it fails to respect the needs and aspirations of the local people. It has to be a community industry to become viable, sustainable and self-perpetuating.” Consequently, sustainable tourism and hospitality development should not only involve the local population, but should actively preserve local culture.
By definition, social entrepreneurs practicing sustainable hospitality and tourism are opposed to any
negative or societal impacts (UNWTO, 1987). The hospitality and tourism industries are considered to have been among the first industries to embrace the principles sustainability (Johnson 2002). “With the publishing of Agenda 21 for the Industries in 1992, individual businesses were encouraged to adopt codes of conduct, promoting sustainable travel and tourism best practices for the first time (Sloan et al. 2009:7).” The foundations of sustainable development were set by the United Nations World Commission on Environment and Development (WCED) who formulated the Brundtland Report “Our Common Future” in 1987. The World Tourism Organization (UNWTO, 1987) defines sustainability in the context of tourism as a set of principles referring “to environmental, economic and socio-cultural aspects of tourism development, and a suitable balance [which] must be established between these three dimensions to guarantee long-term sustainability” (UNWTO, 2006).
Until the 1990’s economic policy making did not fully embrace social impacts very much, in the last
twenty years consideration for environmental and latterly social aspects of business gained ground in economic and developmental theory and practice, companies began to realize that they have responsibilities towards the “wider” community (Baumüller et al. 2011: 4). One of the best known “social entrepreneurs” who took the argument further and addressed social gains more than financial gains was Muhammed Yunus who started a micro-lending scheme for the poor (Yunus, 2007). Reis (1999) and Paton (2003) also recognised that entrepreneurship is also an important factor driving the growth of the social emancipation and the integration of deforised minorities. They drew attention to the emergence of a new type business governance model by introducing the concept of hybrid service in organizations that promote social entrepreneurship. As emphasized by Fowler (2000), any socially minded enterprise whether in tourism or elsewhere requires “a specific type of capability to manage a non-profit-for-profit organisation under one roof”. As the term social entrepreneurship implies, it is multi-disciplinary and draws on what were previously two distinct research directions (“society” and ‘entrepreneurship’). While other approaches follow the principle of profit first or complementarity of social and corporate objectives, social entrepreneurs use entrepreneurial principles to organize, create and manage a venture with the primary aim of bringing about social change. Unlike a business entrepreneur who typically measures performance in terms of profit and return, a social entrepreneur measures success in terms of progress towards the creation of social values (Baumüller et al. 2011: 11). Nevertheless there is no commonly accepted definition and it is not clear if the attribute non-profit or profit-seeking distinguishes a social entrepreneur or business from a “normal” business. Hybrid forms and organizations may also exist. The same semantic dilemna holds for non governmental organisations applying entrepreneurial approaches.
A common thread running through all academic literature is the element of social problem-solving as
the primary mission for social entrepreneurial organizations. Social entrepreneurship is not a philanthropic or charity approach to poverty reduction, it offers an approach based on the strategic use of market forces to promote social improvements. In brief, social entrepreneurial activities can be seen as initiatives that mainly focus on creating social value and where the creation of economic value, if present, is seen as a necessary means to ensure financial viability (Mair & Marti, 2006). Although numerous studies have been carried out in the field of entrepreneurship as a driving force for social change following purely capitalist doctrine (e.g. Scott and Venkataraman, 2000) in the field of hospitality research, little attention has been paid to social entrepreneurship. During the last 21 years only 2% of the articles published in the top hospitality and tourism journals have addressed the topic (Lin, 2008). Research into the implications of social entrepreneurship for the hospitality industry is virtually nonexistent. A reoccurring theme in the literature on social sustainability in tourism, is the significance of the community and local development (e.g. Edgell 2006), where the importance of a participatory
planning and development process is stressed. Moreover, socially equitable tourism should not merely involve the community, but a substantial share of the profits should benefit the local population. Again, academics agree that this is beneficial for both tourism organisations and the host community, “the full involvement of local communities in the tourism sector not only benefits them [...], but also improves the tourism experience” (Edgell 2006). METHODOLOGY
This research was the result of several online contacts with the selected destinations. 5 were initially contacted and 3agreed to take part. All respondents were required to supply a 10-15 page written report on their ventures, 1/4 page summaries are included in this paper. These reports supplied offer a wealth of background information on the state before and after the projects’ inception on local society, the environment, economic development and local culture. In addition, the respondents were asked to describe the development of their projects pointing out not only successes but also the problems they encountered. They were then requested to answer an open ended on-line questionnaire. This was considered the best way by the authors to undertake a contextual analysis of similar situations in multiple organisations. The 3 lodge hotels were selected as the units of analysis for theoretical as well as practical reason. Firstly, the types of accommodation in this research are designed to appeal primarily to Western tourists who largely wish to experience an authentic vacation where they will enjoy local traditional culture in an un-spoilt environment. The establishments offer a particular combination of meal and drink services, staff and guests operate generally to given social codes where Western norms are met. In the Inkaterra case study guests were told in advance that they would only experience local cultural behavior and that no attempt to westernize the experience would be made. The strong desire to make the tourist experience more digestible to foreign tourists can of course be disturbing for some indigenous local people whose own social behavior codes are at odds with those of their tourist guests and even their own traditional interpretation of hospitality. However, it must be stated, that these very differences in behavior have been proven to be factors that attract visitors to what can be referred to as the cultural component of tourism in at least two of the cases. Each of the operations questioned has a stated policy of achieving equitable employment opportunities while protecting the natural environment and achieving financial profit while hopefully stimulating regional socio-economic development. The following case study summaries come from three very different socially and ecologically diverse destinations yet perform all the principles sustainability within hospitality. While each has its own goals and challenges, each hotel strives to regenerate damaged biodiversity, educate local communities in rural cultures and maintain financially successful hotel lodges that reach a wide customer base of travellers and vacationers. Chumbe Island Coral Park Ltd in Zanzibar/Tanzania, Case Study Summary
This case study on Chumbe Island Coral Park focuses on sustainability initiatives established by the hotel and a marine research centre. It strives to work with the local people on issues of education, sustainable fishing, preservation of coral-rag forests and of course the coral reefs in Zanzibar, Tanzania. Chumbe Island is registered with the World Conservation Monitoring Center and has exceeded anticipated goals in community aid and in the protection of biodiversity. Chumbe Coral Park organises excursions for local schools offering educational programs on the reef and forest habitat as well as classes in children’s snorkeling and swimming. Village fishermen, who previously practiced fishing in all areas of the reserve, now respect the boundaries of the coral park and fish only outside the protected areas. Previously the coral reef was not valued by local people and the relationship between the resort developers and the fisherman was strained. The fishermen did not want to accept that this was not their fishing territory. They agreed to learn from former fisherman turned park rangers and slowly began to understand that the fish would slowly migrate outside the boundaries, which would be to the fisherman’s benefit. Through providing fisherman the opportunity to become park rangers, a form of social entrepreneurial tourism has developed. The park rangers now manage the Coral Reef Sanctuary. In supporting the local economy, Chumbe purchases local food produce from spice and fish markets which provides around 90% of their needs in their hotel lodge restaurant. Buying locally grown produce supports farmers in the region, local women are employed to cook and serve meals based on local traditions. These women are also employed as operatives in the Chumbe lodge hotel. Job opportunities are also offered by international research institutions who have set up a highly reputable marine research centre. Profits from the hospitality operations are re-invested into conservation area management and free island excursions for local school children through environmental educational programs.
The Periyar Tiger Reserve, Kumily in Kerala, India, Case Study Summary
The Kumily eco-tourist lodge in Kerala, India is home to important ecosystems sustaining roughly 30% of India’s plant, animal and freshwater species. However, like many areas in the country the environment faces issues such as deforestation, paddy field conversions and disruption of black water ecosystems which have all led to increased levels of poverty and social upheaval. The social entrepreneurial mission of the Kumily project leaders reveals the importance of linking community development with biodiversity conservation within protected areas without harming the livelihood of local people or degrading the natural environment by means of tourism. Originally funded by the India Ecodevelopment Organisation Project the Periyar Tiger Reserve produces not only benefits for the environment and well being for local people but also revenue for the local economy that funds improvements to local infrastructure such as roads and schools. One of the key benefits is the integration of tourists in the life of the villages by introducing them to local activities based on traditional knowledge. Tourists lodge with local people in so called “homestays” where the villagers open up their homes to the westerners who both gain valuable insights into local culture and provide financial support to a traditional way of life. Locals also work as guides, rickshaw drivers and plantation farmers who in turn provide food products to their visitors. They also have the opportunity of working in the local hotels where they make no secret about learning the trade while harbouring the hope to one day have their own accommodation operation.
The Case of Inkaterra - Pioneering Ecotourism in Peru, Case Study Summary
This case study focuses on Inkaterra Amazonica and how they have over the years pioneered a new form of social entrepreneurship and environmentally friendly tourism in Latin America. The project has given much needed support to local cultures through staff trained to develop a sustainable retreat resort. All have expert knowledge of surrounding ecosystems and the immense regional biodiversity. Inkaterra has successfully created a market for high quality, luxurious, sustainable hospitality and tourism. The first hotel project was in the Ese’eja - Sonene community where travelers were introduced to local communal traditions exemplified by hunter and gatherer lifestyles.. Another benefit to the communities is the training given by locally educated personnel to represent the interests of Inkaterra in local governments. Benefits such as accommodation, food, airfare and insurance are provided to the local staff of Inkaterra. This, along with educational support, health campaigns, agro-forestry workshops raising the awareness of biodiversity are just some of the activities of Inkaterra in their contact with local communities. In addition to providing an example to all social entrepreneurs and environmental stewards, Inkaterra is now a financial profit making organization. Starting from humble beginnings in the Amazonian rainforest where all services are non-existent the organisation overcame enormous difficulties in obtaining equipment and an indigenous population that although were more than happy to cooperate required extensive training. This conversion to the principles of sustainable tourism and hospitality has been achieved in such a way as to not endanger cultural heritage.
CONCLUSIONS
The research presented sets out to contribute to the further the understanding and development of social entrepreneurship theory in the context of the hospitality and tourism industries in developing economies. The 3 respondents to the questionnaire brought to light an intriguing picture of relationships between management models, entrepreneurship and indigenous local work forces . The research indicates that due to the many different variables no one social entrepreneurial model for the Industry exists. The social challenges of hybrid hospitality and tourism organisations are embedded within the context in which they operate. An assumption of this research was that indigenous peoples in developing economies represent a defavorised section of the population. The study suggests that the expected outcome of all the businesses but especially in the Chumbe Island project is the maximisation of social benefits determined by the creation of a new type of organisation characterized by a high degree of financial independence from grants and charities.. This aspect was inferred through the responses but is in no way proven. The three case studies show that such hybrid organisational forms consist of a combination of democratic and stewardship initiatives enacted in various proportions Hopefully, the main message for Industry consists in the fact that this study contradicts a popular perception that companies cannot combine the financial profit motive with the promotion of social values and that in order to be socially and environmentally responsible companies need to be idealistic and impractical from a main stream management point of view. Social benefits can indeed be achieved without losing focus on business objectives. The number of companies surveyed in this research was relatively small and critics could even point out that
sustainable hospitality is a particular niche product. However, the social commitment of the interviewed companies should guide and inspire entrepreneurs in the future to create both social and economic value.
This study shows that in terms of bringing social harmony to the work place and creating successful hospitality and tourism ventures, social entrepreneurship can produce many advantages in terms of added value. It can also be concluded that hospitality operations are perfectly suitable for local populations with no previous understanding of the hospitality product or international visitor standards. In all the destinations the staff and in some cases the lower and middle management positions were occupied by local employees with little or non-existant educational levels. These case studies show that in an age of minimal assistance for defarorised minorities governments and civil society can gather some comfort for the future of social entrepreneurial hospitality ventures from these success stories REFERENCES Basu (2003). „Is Sustainable Tourism Development Possible? Broad Issues Concerning Australia and Papua New Guinea in Ghosh, R.N., Siddique, M.A.B, and Gabbay, R. (2003). Tourism and Economic Development: Case studies from the Indian Ocean region. Hampshire: Ashgate Publishing Ltd. Baumueller, H. & Ladenburger, C. & von Braun, J. (2011) Innovative business approaches for the reduction of extreme poverty and marginality? ZEF Working Paper Series 80, Bonn. Brunet, S., J. Bauer, T. De Lacy, and K. Tshering. 2001. Tourism Development in Bhutan: Tensions between Tradition and Modernity. Journal of Sustainable Tourism 9(3): 243–263. Edgell, D.L. (2006). Managing Sustainable Tourism: A Legacy for the Future. New York: The Haworth Hospitality Club. Fowler, A., (2000). "Breaking The Politics Of The Aid Chain - The Case For A Systems Approach To Impact Measurement", @lliance, Vol. 5, No. 3, pp. 31-32, Charity Aid Foundation, London. Giaoutzi, M., and Nijkamp, P. (eds.) (2006). Tourism and Regional Development: New Pathways. Hants: Ashgate Johnson, S. (2000). Literature Review on Social Entrepreneurship. Canadian Centre for Social Entrepreneurship, pp. 1-17. Johnson, C. (2002). Mintel Report on Sustainable Development in Hotels. Travel and Tourism Analyst. Lin, L. (2008). A review of entrepreneurship research published in the hospitality and tourism management journals. Tourism management , 29 (5): pp. 1013 – 1022. Mair, J., & Marti, I. (2006). Social entrepreneurship research: a source of explanation, prediction, and delight. Journal of World Business, 41(1): pp. 36-44. Paton, R. (2003). Managing and measuring social entreprises. London: SAGE. Reis, T. (1999). Unleashing the new resources and entrepreneurship for the common good: A scan, synthesis Scott, S., and Venkataraman, S. (2000). The promise of entrepreneurship as a field of research. Academy of Management Review, 25(1): pp. 217-226. Singh, T.V. (2003). „Tourism and Development: Not an Easy Alliance‟ in Ghosh, R.N., Siddique, M.A.B, and Gabbay, R. Tourism and Economic Development: Case studies from the Indian Ocean region. Hampshire: Ashgate Publishing Ltd Todaro, M. (1998). Economic Development, Harlow. United Nations World Commission on Environment and Development (1987). Our common future: Report of the World commission on environment and development. Retrieved April 20, 2011, from http://www.worldinbalance.net/agreements/1987-brundtland.html UNWTO (2006). Sustainable Development of Tourism. Retrieved April 20, 2011, from http://www.unwto.org/std/mission/en/mission.php Yunus, M. (2007: Creating a world without Poverty: Social business and the future of capitalism, New York.
Hospitably Social or Socially Sustainable? An examination of social entrepreneurship within the hospitality industry.
GeoffreyDesa
SanFranciscoStateUniversity
SanFrancisco,California,USA
ColinJohnson*
SanFranciscoStateUniversity
SanFrancisco,California,USA
MehmetErgul
SanFranciscoStateUniversity
SanFrancisco,California,USA
ABSTRACT
In its broadest sense, social entrepreneurship may be defined as the innovative use of resources to explore and exploit opportunities that meet a social need in a sustainable manner. Despite being widely reported in the generic business world, examples of social entrepreneurship within the hotel and tourism industries do not seem to have often been reported or analyzed. The paper examines cases of hospitality entrepreneurship, structured through three theoretical lenses from classical entrepreneurship that each attempt to explain the equilibrating process that drives the establishment of new ventures (Zahra et al 2009).
SOCIAL ENTREPRENEURSHIP: A HOSPITALITY PERSPECTIVE
Social entrepreneurship, a term used to describe innovative approaches to solve social problems, has received a lot of recent attention. Non-profits and non-governmental organizations, foundations, governments, individuals and corporations promote, fund, and advise social entrepreneurs around the world. In this article we explore the dynamic relationship between social mission and commercial viability within the restaurant industry. Through a comparative case study of three sustainable, socially conscious food service organizations in the San Francisco Bay Area, we explore viable business models within the social entrepreneurship domain. Social Entrepreneurship
Research on social entrepreneurship is growing rapidly (Defourny & Nyssens, 2008; Zahra et al., 2008; Desa, 2009) as scholars are beginning to study social ventures operating in diverse geographical areas with varying levels of economic and institutional development, such as the United States (Short, Moss & Lumpkin, 2009), United Kingdom (Salamon et al., 2004), Western Europe (Borzaga & Spear, 2004, Mendoza & Vernis 2008), Latin America, Asia, and Africa (Bornstein, 2004; Austin, Marquez & Reficco, 2006). While there are
some differences in how social entrepreneurship is conceptualized, the striking commonality in this body of work across a wide range of activities, organizational forms, and sectors, is that such entrepreneurship is conducted in the public interest to target markets and customers that traditional profit-maximizing commerce has overlooked or insufficiently served. Specifically, we employ Mair & Marti’s (2006: 37) definition of social entrepreneurship as “a process involving the innovative use and combination of resources to pursue opportunities to catalyze social change and/or address social needs”. In line with Austin et al (2006), we contend that social entrepreneurship is a subset of the broader field of entrepreneurship and complementary to commercial entrepreneurship. Social entrepreneurship includes innovative, social value creating activity that can occur within or across the nonprofit, business, or government sectors (Austin et al 2006:2). Tension Between Social and Financial Bottom Lines The principal theoretical differences between social and commercial entrepreneurship center on different approaches toward a) Market failure: Social entrepreneurs address needs for public goods (Weisbrod 1975, 1977) or needs not served by commercial market forces as a result of contract failure (Nelson & Krashinsky 1973), b) Performance drivers: The primary emphasis is on social impact rather than maximizing financial return and, c) Organizational mission: The creation of public goods vs. private economic gain changes the strategic focus of the organization (Austin et al 2006, Fottler 1981). To guide our discussion we draw upon three theoretical lenses from classical entrepreneurship that each attempt to explain the equilibrating process that drives the establishment of new ventures (Zahra et al 2009). From our field study, we provide examples of each type of social entrepreneur, and identify the associated business model necessary to maintain a dual social-economic bottom line. We conclude with a discussion of the implications of social entrepreneur categories on venture growth and social welfare improvement. Social Venture Approaches Toward Equilibration.
The typology is built upon alternative conceptualizations of the equilibrating process of entrepreneurship as derived from Hayek (1945), Kirzner (1973) and Schumpeter (1942). We provide illustrative examples from the hospitality industry of these three types of social entrepreneurs: Social Bricoleurs, Social Constructionists and Social Engineers. Though these entrepreneurs share a passion for pursuing social issues, major differences exist among them in how they discover social needs (i.e., search processes), pursue social opportunities, and impact the broader social system. We also look at the business models employed by each type of social entrepreneur in pursuit of the opportunity.
Type 1: Social Bricoleurs: Social entrepreneurs who act on locally discovered opportunities with locally available resources.
“There is beyond question, a body of very important but unorganized knowledge...the knowledge of the particular circumstances of time and place. It is with respect to this that practically every individual has some advantage over all others in that he possesses unique information of which beneficial use might be made”. (Hayek 1945: 522)
Hayek's (1945) work highlights the critical role that private, local knowledge or contextual information play in the entrepreneurial process. Rather than describing markets as rational, broadly understood and predictable arenas, Hayek emphasizes the ‘kaleidic’ nature of the landscape (Zahra et al 2009), inhabited by individuals with minds unobservable and inaccessible to external actors, and in possession of tacit knowledge. This tacit feature leads some individuals to make informed and intuitive judgments based on data not easily codified or transferred between individuals or across organizations (Nelson and Winter, 1982; Conner and Prahalad, 1996, Lam 2000).
Complementary to Hayek's position of entrepreneurship as a result of idiosyncratic, local or tacit knowledge is Levi-Strauss' (1966) concept of bricolage. Baker and Nelson (2005) consider bricolage characteristically entrepreneurial because it involves combining existing resources to solve problems and leverage new opportunities. Consistent with Hayek's premise of asymmetric knowledge, successful bricolage requires intimate knowledge of both local environmental conditions and locally available resources.
Equilibrating function: Social Bricoleurs perform an important equilibrating function by socializing a community toward addressing a local social problem. Without them, many social needs would remain unaddressed or unrecognized. Even though the solutions they craft are sometimes small in scale and limited in scope, they help assuage serious local social problems. As a result, Zahra et al (2008) suggest that Social Bricoleurs move us closer to what Parsons (1971) described as an ideal “social equilibrium” where social peace and order exist. These entrepreneurs derive their power to act from being in the right place at the right time, as well as possessing the skills to address needs not on the radar screens of larger and less proximate parties. As a result of their localized and oftentimes tacit knowledge, Social Bricoleurs are uniquely positioned to discover local social needs where they can leverage their motivation, expertise and personal resources to create and enhance social wealth.
Hospitality Industry Example: Five Green Forks
Five green forks is a sustainable accreditation system for the food service industry. The company has recognized that the restaurant/food service and hospitality industries are rife with inefficiencies, including Inefficient use of resources, time constraints, high labor turnover and often outdated management and organizational dynamics. High proportions of food from US restaurants end up in land-fill and restaurants are seen to operate significantly behind other industry norms in terms of energy efficiency.
Five Green forks recognizes that a major market opportunity exists to enable restaurants to operate in a more sustainable manner that will be more in line with the demands of green consumers.
Social Bricoleur Business Model: Fee for service
The fee-for-service model of social enterprise commercializes its social services, and then sells them directly to the target populations or "clients," individuals, firms, communities, or to a third party payer (Alter 2001). The fee-for-service model is usually embedded: the social program is the business, its mission centers on rendering social services in the sector it works in. The social enterprise achieves financial self-sufficiency through fees charged for services. This income is used as a cost-recovery mechanism for the organization to pay the expenses to deliver the service and business expenses such as marketing associated with commercializing the social service. Surpluses (net revenue) may be used to subsidize social programs that do not have a built-in cost-recovery component.
Five green forks exemplifies the fee for service model in the hospitality industry. Through the Mission– aligning strategies, Five green forks creates an embedded business model in which the social mission is the business. Five green forks also focuses on revenue generation directly through client businesses, and the social impact is delivered through reduced inefficiencies in the business and improved performance of restaurants with greatly enhanced sustainability of the business model.
Type 2: Social Constructionists: Social entrepreneurs who build, launch and operate ventures which tackle those social needs that are inadequately addressed by existing institutions, businesses, NGOs and government agencies.
Opportunities do not necessarily arise from an entrepreneur's specific local knowledge, but rather from their alertness to opportunities which they leverage by developing products, goods and services. (Kirzner, 1973: 71, emphasis added).
Kirznerian entrepreneurs successfully and profitably exploit opportunities by addressing those customer needs not yet realized by current providers. Though commercial entrepreneurs seek profits by quickly identifying and exploiting market opportunities, the needs that Social Constructionists identify and pursue typically center on creating social wealth (Zahra et al 2009, Fowler 2000). The need for these organizations arises because for-profit companies often do not have the incentive to address social problems, while non-profit organizations may not have the cognitive basis or the means to develop a solution (Desa & Kotha 2006).
Successful social constructionists are often alert to opportunities, bold and innovative in action (Dees, 1998; Zahra et al 2008, Johnson, 2000), acting as if they can accurately forecast future events and bring about a future desired state (Mueller & Thomas 2001). They also develop organizations to match the scale and scope of the social needs they seek to address.
Social Equilibrating Function: In contrast to Social Bricoleurs who improvise solutions to local social problems, Social Constructionists seek to remedy broader social problems by planning and developing formalized or systemized scalable solutions to meet growing needs or could be transferred to new and varied social contexts (Grant, 1996). These entrepreneurs' advantages do not stem from local knowledge; they result from their unique capacity to spot and pursue those opportunities that generate social wealth by creating and reconfiguring the processes enacted to deliver goods and services. This opportunity spotting capacity can arise from knowledge bridged from past-specialized experience, a direct search for meaning, or strategic alliances (Desa & Kotha 2006).
As a result, social constructionist initiatives that leverage the resources and collaborative capabilities of individuals, for-profit and not-for-profit organizations can create mutually beneficial outcomes that, in turn, generates a sustained momentum toward a new social equilibrium (Pearce and Doh, 2005, Zahra et al 2009).
Hospitality Industry Example: Karma Kitchen
Karma Kitchen was started in Berkley California in 2007 by a small number of volunteers who attempted to bring the spirit of gifting into a mainstream restaurant. It offers a unique dining experience by making no charge for the meal or service. Since its beginning over 24,000 meals have been cooked and served by its completely volunteer workforce. Karma Kitchen seeks to embody the three tenets of the organization, to move from a transactional relationship to trust, from a feeling of isolation to that of community and from a belief in scarcity to that of abundance. The restaurant provides the vehicle for these paradigm shifts to take place.
Social Constructionist Business Model: Market Intermediary model
The market intermediary model of social enterprise provides services to its target population or "clients," small producers (individuals, firm or cooperatives), to help them access markets. Social enterprise services add value to client-made products through product development; credit assistance, or marketing assistance. The market intermediary either purchases the client-made products outright or takes them on consignment, and then sells the products in high margin markets at a mark-up (Alter 2001). The market intermediary model is usually embedded: the social program is the business, its mission centers on strengthening markets and facilitating clients' financial security by helping them develop and sell their products. The social enterprise achieves financial self-sufficiency through the sale of its client-made products. Income is used to pay the business' operating expenses and to cover program costs of rendering product development, marketing and credit services to clients.
Karma Kitchen exemplifies one specific subset of the market intermediary business model, by focusing on a “gift economy”. The social mission is embedded within the business, the return to the “clients” preparing food is not monetary self-sufficiency, but ‘soul-sufficiency’ achieved through acts of volunteerism. Income is generated from the market of diners who eat for free, but offer charitable contributions for future diners or volunteer time to sustain the operation.
Type 3: Social Engineers: Social entrepreneurs who tackle complex social problems in the face of inadequate institutions, entrenched governments or resistant business elites (Carney and Gedajlovic 2002, Mair & Marti 2009).
In capitalist reality as distinguished from its textbook picture, it is not price competition which counts but the competition from the new commodity, the new technology, the new source of supply, the new type of organization –competition which commands a decisive cost or quality advantage and which strikes not at the margins of the profits and the outputs of the existing firms but at their foundations and their very lives.Schumpeter 1942, Capitalism, Socialism and Democracy: 82
Social Engineers differ significantly from the other two social entrepreneurial types because they identify systemic problems within the social systems and structures and address them by bringing about revolutionary change. Social Engineers often introduce dramatic changes in the social sphere, resembling what Schumpeter's (1942) entrepreneurs perform in the world of business enterprise. They act as prime movers of innovation and change, engendering “gales of creative destruction” to destroy dated systems, structures and processes to be replaced by newer and more suitable ones (Zahra et al 2009).
Social Equilibrating Function: By fracturing existing and often dominant institutions and replacing them with more socially efficient ones, Social Engineers can have a profound influence on society. Consequently, they can be a powerful force for social change. This is especially true where entrenched incumbents and prevailing practices have become formidable barriers to reform. Given the “systemic” nature of the problems they target, Social Engineers often attack national, transnational or global social issues. Social engineers may also engage in catalytic alliances (Waddock and Post 1995: 951) and use the media as a strategic resource to place an issue on the public agenda and change public attitudes. These alliances usually tackle difficult and complex social problems and reshape public attitudes about these problems. They may also help generate dramatically different patterns of resource allocations and service delivery methods. Social engineers may not necessarily fix social problems, but rather inspire others to spearhead social change.
Hospitality Industry Example: Table for Two
Table for Two seeks to address the opposing problems of obesity and malnutrition. TFT partners with restaurants and cafeterias that will provide a branded “TFT” meal. The meal has to be of nutritionally balanced to receive the TFT label. A 25 cent surcharge is added to the price of the meal. The revenue from the surcharge is used to pay for school lunches in African countries including Uganda, Rwanda, Ethiopia and South Africa.
Social Engineer Business Model: Service subsidization model
The service subsidization model of social enterprise sells products or services to an external market and uses the income it generates to fund its social programs. The service subsidization model is usually integrated: business activities and social programs overlap, sharing costs, assets, operations, income and often program attributes. Although the service subsidization model is employed primarily as a financing mechanism--the business mandate is separate from its social mission--the business activities may enlarge or enhance the organization's mission (Alter 2001).
For effective social engineers, commercialization of core social services leads to enterprise activities that are close in nature to the organization's social programs and may enhance the mission. In financial terms the business benefits from leveraging and cost sharing relationships, and provides a stream of unrestricted revenue to subsidize, amplify or wholly fund one or more social services.
Table for Two exemplifies the service subsidization model by creating an integrated overlap between the social mission in Africa and the social + financial mission in developed countries. By providing aggressively-priced healthy meals that tackle the issue of obesity in developed countries, Table for Two creates a viable business that directly subsidizes the provision of meals for children in under-developed parts of Africa.
DISCUSSION AND CONCLUSIONS
This is an exploratory study with examples of the three categories of social bricoleurs, social constructivists and social engineers being presented.
Five green forks provides a good example of an hospitality industry social bricoleur. San Francisco within the USA has long been at the vanguard of social and environmental progress especially in terms of energy efficiency and new and existing building regulations (especially through LEED). Five green forks brings these themes together seamlessly for the food service industry. It is a model that can also be codified and used in other regions, however and can be replicated in Asia and Europe.
Karma Kitchen through its emphasis on ‘gifting” and the moving of the customer relationship from transaction to trust shows the social constructionist model of the program being the business. Within the food service industry, it is hard for an enterprise to exist with a zero appearing on the bottom of each bill presented to the customer. Karma Kitchen, however, appears to tap into a willingness of both customers and service and back of house staff to provide their services for the greater good, thereby transforming the business model one meal at a time
Table for Two was used as a service subsidization model that effectively seeks to brand its core social programs through the support of major donors. It’s very clear social mission of “redistributing calories” from those that have too many to those that have too few, may be seen to be intuitively appealing to many major corporations and individual donors with a social conscience who wish to address one of the most glaring injustices in the world today: while almost one billion people go hungry each day roughly the same amount consume too many calories.
Although these are just three examples, it may be fair to assume that through their influence new equilibriums will be achieved in the future.
REFERENCES:
Alter, S. K., & (US), S. T. C. (2001). Managing the Double Bottom Line: A Business Planning Guide for Social Enterprises: Workbook. Pact Publications.
Austin, J., Márquez, P., Reficco, E., Berger, G., & others. (2005). Building new business value chains with low income sectors in Latin America. RANGAN, v. Kasturi; QUELCH, John A.; HERRERO, Gustavo, 193–206.
Austin, J., Stevenson, H., & Wei-Skillern, J. (2006). Social and commercial entrepreneurship: Same, different, or both? Entrepreneurship Theory and Practice, 30(1), 1–22.
Baker, T., & Nelson, R. E. (2005). Creating something from nothing: Resource construction through entrepreneurial bricolage. Adm. Sci. Q., 50(3), 329–366.
Bornstein, D. (2004). How to change the world : social entrepreneurs and the power of new ideas. Oxford, UK: Oxford University Press.
Borzaga, C., & Spear, R. (2004). Trends and challenges for co-operatives and social enterprises in developed and transition countries.
Carney, M., & Gedajlovic, E. (2002). The co-evolution of institutional environments and organizational strategies: The rise of family business groups in the ASEAN region. Organization Studies, 23(1), 1–29.
Conner, K. R., & Prahalad, C. K. (1996). A resource-based theory of the firm: Knowledge versus opportunism. Organization science, 477–501.
Dees, J. G. (1998). The meaning of social entrepreneurship. Comments and suggestions contributed from the Social Entrepreneurship Funders Working Group, 6pp.
Defourny, J., & Nyssens, M. (2008). Social enterprise in Europe: recent trends and developments. Social enterprise journal, 4(3), 202–228.
Desa, G. (2009). Social entrepreneurship: snapshots of a research field in emergence. In K. Hockerts, J. Mair, & J. Robinson (Eds.), Values and opportunities in social entrepreneurship. Oxford, UK: Palgrave Macmillan.
Desa, G., & Kotha, S. (2006b). Technology Social Ventures and Innovation: Understanding the Innovation Process at Benetech. The New Social Entrepreneurship: What Awaits Social Entrepreneurial Ventures. Northampton, MA: Edward Elgar.
Fottler, M. D. (1981). Is management really generic? Academy of Management Review, 1–12.
Fowler, A. (2000). NGDOs as a moment in history: beyond aid to social entrepreneurship or civic innovation? Third World Quarterly, 21(4), 637–654.
Grant, R. M. (1996). Toward a knowledge-based theory of the firm. Strategic management journal, 17, 109–122.
Hayek, F. A. von. (1945). The use of knowledge in society. The American Economic Review, 35(4), 519–530.
Johnson, S. (2000). Literature Review on Social Entrepreneurship. The Canadian Centre for Social Entrepreneurship. Retrieved from http://www.bus.ualberta.ca/ccse/Publications/
Kirzner, I. (1973). Competition and Entrepeneurship. Chicago and London: University of Chicago Press.
Lam, A. (2000). Tacit knowledge, organizational learning and societal institutions: an integrated framework. Organization studies, 21(3), 487–513.
Lévi-Strauss, C. (1966). The savage mind. [Chicago]: University of Chicago Press.
Mair, J. M. (2004). Social Entrepreneurship: What are we talking about?, A framework for future research.
Mair, J., & Marti, I. (2009). Entrepreneurship in and around institutional voids: A case study from Bangladesh. Journal of Business Venturing, 24(5), 419–435..
Mendoza, X., & Vernis, A. (2008). The changing role of governments and the emergence of the relational state. Corporate Governance, 8(4), 389–396.
Mueller, S. L., & Thomas, A. S. (2001). Culture and entrepreneurial potential: A nine country study of locus of control and innovativeness. Journal of Business Venturing, 16(1), 51–75.
Nelson, R., & Krashinsky, M. (1973). Two major issues of public policy: Public policy and organization of supply. Public subsidy for day care of young children, 32–55.
Nelson, R. R., & Winter, S. G. (1982). An evolutionary theory of economic change. Belknap press.
Parsons, T. (1971). The system of modern societies. Prentice-Hall Englewood Cliffs, NJ.
Pearce II, J. A., & Doh, J. P. (2005). The High Impact of Collabor. MIT Sloan Management Review.
Salamon, L. M., Sokolowski, S. W., & List, R. (2004). Global civil society. Center for Civil Society Studies, Institute for Policy Studies, The Johns Hopkins University.
Schumpeter, J. A. (1942). Capitalism, Socialism and Democracy. London: Unwin University Books.
Short, J. C., Moss, T. W., & Lumpkin, G. T. (2009). Research in social entrepreneurship: Past contributions and future opportunities. Strategic entrepreneurship journal, 3(2), 161–194.
Waddock, S. A., & Post, J. E. (1995). Catalytic alliances for social problem solving. Human Relations, 48(8), 951–973.
Weaver, D. B. (2001b). The encyclopedia of ecotourism. CABI.
Weisbrod, B. A. (1975). Toward a theory of the voluntary non-profit sector in a three-sector economy. Institute for Research on Poverty, University of Wisconsin–Madison..
Zahra, S. A., Gedajlovic, E., Neubaum, D. O., & Shulman, J. M. (2009). A typology of social entrepreneurs: Motives, search processes and ethical challenges. Journal of Business Venturing, 24(5), 519–532.
Zahra, S. A., Rawhouser, H. N., Bhawe, N., Neubaum, D. O., & Hayton, J. C. (2008). Globalization of social entrepreneurship opportunities. Strategic Entrepreneurship Journal, 2(2), 117–131. doi:10.1002/sej.43
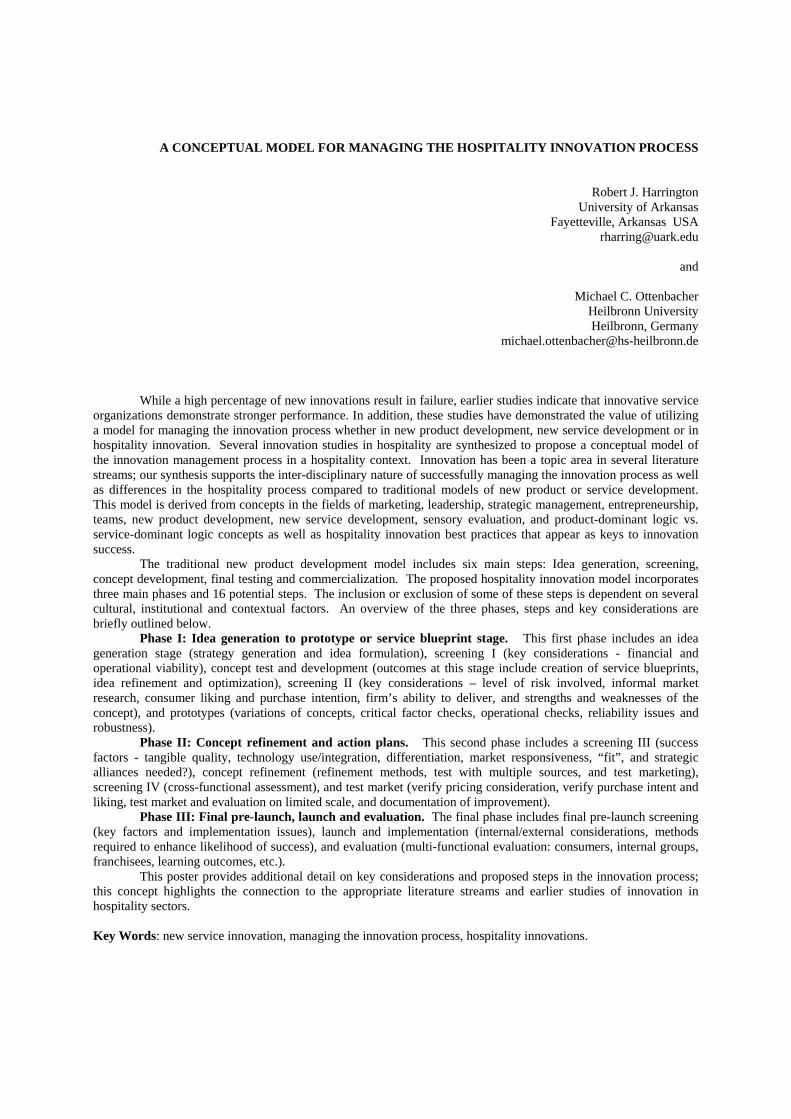
A CONCEPTUAL MODEL FOR MANAGING THE HOSPITALITY INNOVATION PROCESS
Robert J. Harrington University of Arkansas
Fayetteville, Arkansas USA [email protected]
and
Michael C. Ottenbacher
Heilbronn University Heilbronn, Germany
While a high percentage of new innovations result in failure, earlier studies indicate that innovative service organizations demonstrate stronger performance. In addition, these studies have demonstrated the value of utilizing a model for managing the innovation process whether in new product development, new service development or in hospitality innovation. Several innovation studies in hospitality are synthesized to propose a conceptual model of the innovation management process in a hospitality context. Innovation has been a topic area in several literature streams; our synthesis supports the inter-disciplinary nature of successfully managing the innovation process as well as differences in the hospitality process compared to traditional models of new product or service development. This model is derived from concepts in the fields of marketing, leadership, strategic management, entrepreneurship, teams, new product development, new service development, sensory evaluation, and product-dominant logic vs. service-dominant logic concepts as well as hospitality innovation best practices that appear as keys to innovation success.
The traditional new product development model includes six main steps: Idea generation, screening, concept development, final testing and commercialization. The proposed hospitality innovation model incorporates three main phases and 16 potential steps. The inclusion or exclusion of some of these steps is dependent on several cultural, institutional and contextual factors. An overview of the three phases, steps and key considerations are briefly outlined below. Phase I: Idea generation to prototype or service blueprint stage. This first phase includes an idea generation stage (strategy generation and idea formulation), screening I (key considerations - financial and operational viability), concept test and development (outcomes at this stage include creation of service blueprints, idea refinement and optimization), screening II (key considerations – level of risk involved, informal market research, consumer liking and purchase intention, firm’s ability to deliver, and strengths and weaknesses of the concept), and prototypes (variations of concepts, critical factor checks, operational checks, reliability issues and robustness).
Phase II: Concept refinement and action plans. This second phase includes a screening III (success factors - tangible quality, technology use/integration, differentiation, market responsiveness, “fit”, and strategic alliances needed?), concept refinement (refinement methods, test with multiple sources, and test marketing), screening IV (cross-functional assessment), and test market (verify pricing consideration, verify purchase intent and liking, test market and evaluation on limited scale, and documentation of improvement).
Phase III: Final pre-launch, launch and evaluation. The final phase includes final pre-launch screening (key factors and implementation issues), launch and implementation (internal/external considerations, methods required to enhance likelihood of success), and evaluation (multi-functional evaluation: consumers, internal groups, franchisees, learning outcomes, etc.).
This poster provides additional detail on key considerations and proposed steps in the innovation process; this concept highlights the connection to the appropriate literature streams and earlier studies of innovation in hospitality sectors.
Key Words: new service innovation, managing the innovation process, hospitality innovations.
Online marketing practices of different hotel segments: content analysis
Maryam Khan, Ph.D. Howard University
Washington, D C, USA Email: [email protected]
ABSTRACT
The purpose of this study is to evaluate the websites of full-service luxury, full-service, and limited-service hotels using content analysis. Seven criteria consisting of 72 items were evaluated. The finding reveals websites of different hotel segments were somewhat similar regarding facility, reservation, and contact information. However, luxury and full-service hotels have more information and extra web features compared to limited-service hotels. Several differences relating to hotels’ overall website look, design, and navigation scheme exists, for example, virtual tours and audio feed, green-hotel information, pet policies, and social network sites. The majority of the hotels are using some form of social media. The finding of this research would be of interest to hotel operators/researchers as it highlights innovative marketing strategies.
Key Words: Internet, hotel marketing, website, social media, online marketing
INTRODUCTION
The lodging industry has been in existence ever since the first traveler looked for a place to spend the night thousands of years ago. Over the years, these facilities have evolved and have been known as ordinaries, taverns, inns, hotels, motels, resorts, and bed and breakfasts. According to AH&LA report (2011), the lodging industry in the USA has over 51,015 properties with over 4.8 million guest rooms. It generates $99.3 billion in sales and supports more than 7.5 billion jobs. During the past decade, advancement in technology has significantly shaped the way that the lodging industry plans, controls, manages, and markets operations.
The Internet is being increasingly used as an important communication and distribution channel to
market all types of business. The hospitality and tourism industry started using internet as part of its marketing strategy in the 90’s (Connolly et al., 1998). Its validity as an advertising and marketing strategy has been already established (Kasavana et al., 1996). The internet advent has introduced a variety of new marketing tools which are accessible by both large and small organizations. The size, type, or location of the hotel has no effect on the use of internet as a marketing tool (Connolly and Sigala, 2001; Sigala, 2001; Parets, 2002). In today’s unstable economy, with tightened budgets and reduced staffing, hospitality marketers are increasingly turning to online marketing solutions. The online marketing channel was the only growth channel in 2009 and the trend is expected to continue (Anonymous 1, 2010). The Internet presents limitless opportunities to engage with customers and offers the potential to develop powerful and long lasting relationships. Not only are consumers overwhelmingly choosing the Internet as their source for travel information, but the web often provides the most cost-effective solution for travel marketers. While the GDS (Global Distribution System) and voice booking is declining, the Internet CRS (Central Reservation System) booking for top 30 hotel brands is growing. According to AH&LEF lodging survey (2010) new technologies are becoming more common. Wireless Internet in hotels rose to 94% from 91% in 2008. Overall it is predicted that 50 to 70 percent of all hotel bookings will be made online in 2012. In addition, social networking platform is being used by 75% of the hotel operations.
The Internet has changed how hotels market their product and services. Today just having a presence
on the web is not enough. Consumers are driving the content of the web. With 44% of internet users active in social media, many hotels are looking into social networking as a cost-effective way to attract and maintain customer relations (Anonymous 2, 2010). According to Gartner Research, the worldwide social media revenues are estimated to exceed $10 billion in 2012, approximately a 41.4 % rise from 2010 (Peak, 2011). Social media has evolved into an interactive, two-way communication tool. Today’s digitally driven consumers broadcast their experiences directly online via social media. Over 60 percent of consumers researching products through online sources learned about a specific brand through social networking sites. Social media is increasingly becoming a favorite platform for consumers to express their brand loyalty and are promoting the brand they like or don’t like. Besides having a well-designed website, the lodging industry is looking toward social media sites, such as, Twitter, Facebook, Flickr, Blog, Web apps, and YouTube to attract potential customers. Therefore, it is not surprising that hotel companies, in order to stay competitive, are shifting marketing dollars to online channels at the expense of traditional channels. With the importance given to Internet marketing and the advent of new social media channels of distributions, the purpose of this study is to evaluate the websites of three hotel segments using content analysis, namely, full-service luxury, full-service, and limited-service hotels. The finding of this study would benefit the hotel operators by highlighting the current internet marketing practices used by different hotel segments.
REVIEW OF LITERATURE
A review of research show that there have been several studies devoted to Internet marketing and lodging websites (Murphy, et al., 1996; Sigala, 2001; Leong, 2001; Wan, 2002; Chung and Law, 2003; Baloglu and Pekcan, 2006; Law and Hsu, 2006). Murphy et al. used five search engines to identify 32 features from 36 hotels in Florida. The 32 features were divided into four categories: promotion and marketing, service and information, interactivity and technology, and management. Leong (2001) studied the marketing strategies and role of information technology by local hotels in Singapore. The findings show that though most hotels appear to have successfully adopted the marketing concept, their level of commitment seems to be insignificant. Sigala (2001) reported that hotels in Greece are using their Internet and interactive capabilities in a limited manner. The majority of the hotels are using the Internet to disseminate information and receive reservation requests through e-mail, whereas very few are using the Internet for more sophisticated activities. Wan (2002) examined the websites of international tourist hotels and tour wholesalers in Taiwan. Three evaluation criteria, user interface, variety of information, and presence or absence of online reservation system were used. It was reported that 50% of hotels have websites and most hotels provide on-line reservations.
Content analysis was used by Baloglu and Pekcan (2006) to examine the websites of a select group of 4 and 5 star hotels in Turkey in terms of design characteristics and site marketing practices on the Internet. It was reported that hotels in Turkey are not using the Internet to its full potential and not effectively e-marketing their hotels. Another study examined two groups of international hotel website users on their perceived importance level of specific dimensions and attributes on hotel websites. The findings showed no significant difference in most of the included dimensions and attributes between these two groups of users (Law and Hsu, 2006). However, reservation information and room rates were rated as the most important dimension and the most important attribute respectively. The aforementioned studies show that hotels around the world are using the Internet extensively to position and market their products and services on the web. It was also evident that none of these studies include the advent of social media, use of search engine, pet friendly and green properties, language options, currency calculator, and interactive customer relations. The present study includes these items in its evaluation of hotel websites.
PURPOSE OF STUDY
The purpose of this study was to evaluate the websites of three hotel segments using content analysis, namely, full-service luxury, full-service, and limited-service hotels. The finding of this study would be of interest to hotel operators and researchers as it highlight online marketing strategies currently used by different hotel segments.
CONCEPTUAL FRAMEWORK
Web-based marketing and the Internet has become an important channel of distribution for the lodging sector. Just like a hotel lobby, a hotel’s website provides the “first moment of truth” experience to its customers. The web page design, content, navigation, management, and usability are very important for it to be an effective marketing tool. In order to achieve this goal, a conceptual framework was formed to evaluate the hotel website. Seven criteria with 72 items were evaluated in this study. These criteria were based on a thorough review of several global hotel websites. The seven criteria are: Reservation information; Facility information; Contact information; Social media; Area information; Web design; and Web management. The seven criteria and items are discussed below:
1. Reservation information criteria cover all the items that are necessary to help and facilitate a customer
to reserve a room online easily with least hassle. This include information relating to room rates, availability, payment options, cancellation policies, secured payment guarantee, toll-free phone number, currency calculator, multilingual options, and hotel policy.
2. Facility information criteria include all items that provide necessary information to make a room
reservation possible. This is the most important criteria as it displays the brand or product to the customer. It creates a curiosity while satisfying customers’ information needs. It includes a history of the facility, hotel features, guest room descriptions and photos, virtual tours, audio feed, a list of hotel amenities, hotel promotions, dining options, fitness or spa options, meeting and events information, green hotel policies, pet policies, safety and security tips, and star ratings.
3. Contact information criteria include the location address, phone number, toll-free number, fax number, FAQ (frequently asked questions), guest feedback, chat-now, and guest comments section. If the guest needs more information or is having problem navigating the website, contact information will be very helpful.
4. Social media criteria include links to Facebook, Twitter, Flickr, YouTube, Mobile apps, LinkedIn,
Google+, Blog, TripAdvisor, RSS feed, and/or live chat. With an overwhelming majority of the online population engaged in social networking, hotel websites find social media as a cost effective way to engage customer’s attention.
5. Area information criteria include information such as, site map, driving directions, parking, public
transportation, airport information, shuttle service, local tourist attractions, weather report, and local time. Information about the destination is important for customers to make an informed decision.
6. Website design criteria include photos, virtual tour, color scheme, clear details or too much clutter. A well designed, informative, attractive, and interactive website will entice the customer to take a good look at the hotel website.
7. Website management deals with how effectively the site is managed and maintained. It includes up-to-
date information, down load features, down load time, user friendliness, interactive capability, search engines, and links to other sites.
METHODOLOGY
Population and sample
The focus of this study was to analyze the website contents of three hotel segments in Washington, DC, USA. These segments are: 1) Full-service luxury hotels - hotels that offer rooms, variety of food and beverage options, meeting space, room service, fitness and spa, concierge floors, and personalized service. Most of these hotels have 4 star or 5 diamond ratings; 2) Full-service hotels – hotels that offer rooms, food service options, meeting space, fitness, room service, concierge floors, and other amenities. Majority of these hotels have 3 diamond ratings; and 3) Limited-service hotels – mostly economy hotels which offer only rooms and some hotels may also offer complimentary breakfast.
Methodology and data collection
This study used content analysis to analyze the websites of selected hotels from the Washington, DC,
area (USA). Washington, DC is a major tourist destination that attracts both national and international visitors. Tourism to the capital city grew by 5.9% and international visitation by 13% in 2010 (Destination DC, 2010). DC is home to a variety of hotel properties that cater to the needs of travelers from all around the world. Some of world’s well-known hotels are located in Washington, DC. Therefore, it is considered a viable location to conduct hotel website content analysis. The hotel listing found on the Destination DC web site (the official tourism website for Washington, DC) was used to identify the select hotels (Destination DC, 2012). A structured questionnaire based on seven criteria consisting of 72 items was used to evaluate the contents of hotel web sites. These seven criteria were: Reservation information; Facility information; Contact information; Social-media, Area information; Website design; and Website management. Description of each criteria and content items is given in the conceptual framework section. In order to limit the influence of type of computer, time of the day, and internet connection during content analysis, efforts were made to use the same computer, same internet connection, and timings of day. A total of 106 hotels were content analyzed from January 27 to February 15, 2012. Each hotel site was visited three times if it was not accessible the first time. Majority of the hotels were accessible the first time. Out of 106 hotels, 13 were full-service luxury hotels, 65 were full-service hotels, and 28 were limited-service hotels. Each hotel web site was viewed and the questionnaire checked for 72 items. Descriptive analysis was used to compare the three hotel segments’ web contents.
FINDINGS and DISCUSSION
This study used seven criteria including 72 items to evaluate the websites of three segments of hotels, namely, full-service luxury hotels, full-service hotels, and limited service hotels. From the findings it was evident that almost all types of hotels have some kind of presence on the Internet and are using it extensively to promote their products and services. The full-service luxury hotels have the majority of the 72 items on their website compared to the other two segments, and full-service hotels have more items compared to limited-service hotels. Websites of the three hotel segments of hotels were somewhat similar when it comes to facility and reservation information. However, luxury and mid-level hotels have more information, more photos, and extra amenities and services compared to limited-service hotels. Several differences relating to hotels’ overall web site look, design, search engine, and navigation scheme exist. Other notable differences were found relating to items, for example: food service options, virtual tours and audio feed, green hotel information, pet policies, food and beverage promotions, social media links, weather, multilingual options, and links to other sites. The seven criteria used in this study to evaluate the three hotel segments are discussed below.
Reservation information:
A review of the hotel websites shows that each luxury hotel website is unique and creative. It has attractive and colorful web pages displaying reservation information including room rates, payment options, view or/and cancel reservation options, reservation policies, toll-free numbers, and currency calculators. Only a
couple of luxury hotels have “chat with an agent now” and “email now” option to engage the customer during reservation process. Few luxury hotels also use airline calendar type pop ups to select available dates. Most of the full-service hotels are very similar to luxury hotels as far as reservation information is concerned. The majority of full-service and limited-service hotels are brand names and the websites of chains and franchises are similar to the parent company websites. The positioning is focused on the brand and links are provided to real-time online reservations and links to parent company website. For example, on a Hilton website there are links to the company’s history, careers, privacy policy, hotel policies, and Hilton HHonors. All types of hotels offer variety of room rates, for example, discount, corporate, government, AAA, and other packages. Luxury and full-service hotels provide currency calculator upfront, but it was hard to find for limited-service hotels. It takes at least five clicks to get information and reserve a room on luxury hotel website compared to three to four clicks on full-service hotel website and less than three clicks for limited-service hotel website. In fact, all the reservation information is provided on the main page for limited-service hotels, which makes it easier and faster, whereas, the other two segments give more information about extra amenities and services before the reservation can be made. Sixty-five percent of all hotels have access to multilingual sites out of which 92% are luxury hotels, 70% are full-service hotels, and 32% are limited-service hotels. For a destination like Washington, DC that draws lot of international travelers, having a website with a multilingual link would be very helpful. Many of these hotels have links to four to nine language options. Facility information:
Almost all of the hotel types describe their lodging history. Specifically, all the luxury hotels have a story to tell about their historic and political background. The majority of luxury hotels display a list of exclusive amenities with colorful photos, exclusive chef driven food service options, unique spa and fitness services, frequent guest programs, and meeting facility options. But there are differences between the three hotel segments when it relates to virtual tours, audio feed, food service options, fitness and spa services, green hotel policy, and pet friendly policies as shown in Table 1. Thirty-two percent of all hotels have virtual tour on their websites. Almost 46% of luxury hotels, 35% of full-service hotels, and 11% of limited-service hotels are using virtual tour features on their websites to appeal to online customers. Twenty-two percent of all hotels also have audio feed along with virtual tour. Here too more luxury hotels (46%) have audio feed compared to full-service hotels (35%) and limited-service hotels (0%). While luxury and full-service hotels display a variety of food and beverage options, select limited-service hotels emphasize complimentary breakfast promotions and links to nearby restaurants. With so much importance given to greening of the lodging industry, about 33% of all hotels have green initiatives displayed on their websites. It was evident that a vast majority of luxury hotels (69%) had some green initiatives in place compared to full-service (38%) and limited-service hotels (only 4%). For example, Hay Adams Hotel provides details about their environmental policies and also has a carbon calculator, whereas the Park Hyatt offers “hypo-allergenic rooms.” The Fairmont Hotel proudly display’s various green hotel awards, whereas, the Four Season’s offers green meetings, and Hotel Sofitel exhibits green key hotel award. Besides going green many lodging properties are going pet friendly as well. In this study, about 30% of all hotels have pet friendly policies with an additional fee. A majority of luxury full-service hotels (38%) have pet friendly policies compared to full-service (32%) and limited service hotels (21%). In the facility information criteria it can be said that full-service luxury hotels lead the way when it comes to hotel websites having virtual tours, audio feeds, food and beverage options, fitness and spa facilities, green hotel initiatives, and pet friendly properties (See Table 1). Moreover, all luxury hotels are either 4 diamond or five star hotels and full-service hotels have a 3 diamond ratings. The majority of the luxury hotels display their star rating and awards on its websites.
Contact information
Having contact information on the website is a very important criteria and it is no surprise that all three segments of hotels have property address, phone number and fax number on the first page of the website, but not all of the hotels have email address, frequently asked questions, or guest comment links. Social media
Instead of having a website that read like a static online brochure, the use of social media and other search engines can create an interactive site that constantly engages the customer’s attention. With a majority of the online population using online social media networks, marketers are depending on their customers to spread the word. Recommendation from a friend is more powerful than any other form of marketing strategies. Consumers are reaching beyond search engines and tuning into new channels such as Facebook, Twitter, Flickr, YouTube, Google+, LinkedIn, Blog, and mobile apps. By having a Facebook page link on its website, a hotel
can interact with its customers, and those customers in turn share their interest with their friends. Twitter, the micro-blogging site, offer creative ways (within 140 characters) for the hotel to extend its brand and engage the customer. A hotel can tweet its promotions or other events to its online customers and spread the word instantly. By having YouTube and Flickr sites on its webpage a hotel allows the customer to share photos and videos of their hotel stay with their friends.
The extensive use of social media as a marketing strategy by hotels in this study is evident in Table 2.
A majority of all the hotels combined are using Facebook (70%) and Twitter (62%) compared to Flickr (9%), Mobile app (22%), YouTube (20%), Blog (19%), Google+ (15%), and E brochure (15%). Email, LinkedIn, Chat-now, or TripAdvisor (6% or less hotels are using these channels) is not that popular with this group of hotels or it can be said that consumers in general are just getting started with these new social media channels. Overall it appears that full-service luxury hotels in this study are utilizing more social media network platforms compared to full-service and limited-service hotels. Though social media sites do allow the hotels to push their promotions or property news quickly at a low-cost, there are certain drawbacks that need to be addressed. The disadvantage of social networking sites is that it is time consuming and it has to be updated and monitored constantly. A negative tweet or blog of a disgruntle customer cannot be left without a timely, prompt, and proper response. Another matter to be addressed is the ROI (Return on Investment) on these new channels of distribution. Social media success is measured by visibility and interaction. It creates lot of interaction, but does this interaction and visibility result in added revenue!
Area information
With Washington, DC, being a major tourist destination for international and national travelers, it is not surprising that almost all of the hotels in this study have surrounding area information on their websites. This includes information, such as, location, site map, driving directions, parking options and fees, public transportation, airport information, and destination attraction links. During the spring season, many hotels were seen promoting the Cherry Blossom Festival to lure travelers. About 50% of the hotels provide information on shuttle bus services and about 20% show local time on their site next to weather report. Approximately 35% of all hotels provide weather information on its website. Majority of luxury hotels (38%) and full-service hotels (37%) display weather reports compared to limited-service hotels (28%).
Website design and management
A hotel might have the best looking website, but if it is not managed properly or is not user friendly the hotel may lose a potential customer. In this study, all luxury hotels appear to have attractive websites with colorful and engaging photos but not all hotels had a “virtual tour” or “audio feed” available. Full-service and limited-service hotels were mostly brand name hotels, and these hotels’ websites were very consistent with their brand image. Websites of limited-service hotels were very simple with not much clutter and easy to use. The majority of the hotels’ website design and content was increasingly user friendly and the information was easily available. There were two instances when the virtual tour button led to page error. Most of the information for the limited-service hotels is provided on the main homepage, which makes it easier and faster to manage. It took at least five clicks to get information and reserve a room on luxury hotel websites compared to three to four clicks on full-service hotel web site. Since these hotels pride themselves about their exclusive amenities, they encourage customers to browse a little longer by displaying an array of products and services.
CONCLUSION
The findings of this study demonstrate that web-based marketing and the Internet has become an
important channel of distribution for the lodging sector. All three hotel segments have a presence on the web and the majority of these hotels are utilizing some form of social media network to engage the customers’ attention. Facebook and Tweeter seem to be more popular social media networks for hotels in Washington, DC, compared to Flickr, YouTube, Google+, Blog and others. The 72 items used in this study for the seven criteria to evaluate the three hotel segments appear to be valid. Since the majority of the luxury and full-service hotels appear to have these items on their web pages. It was also evident that besides social media, hotels are also promoting green hotel policies and pet friendly properties. In conclusion it can be said that hotels in order to be effective should understand what the potential customer is looking for and provide a user friendly and easy to navigate website. The website should have a clear objective with the potential customer in mind. The focus should be to create an online presence, to differentiate the business, and to draw in potential customers. The seven criteria used in this study can be a guideline to hotel operators to include information based on the needs
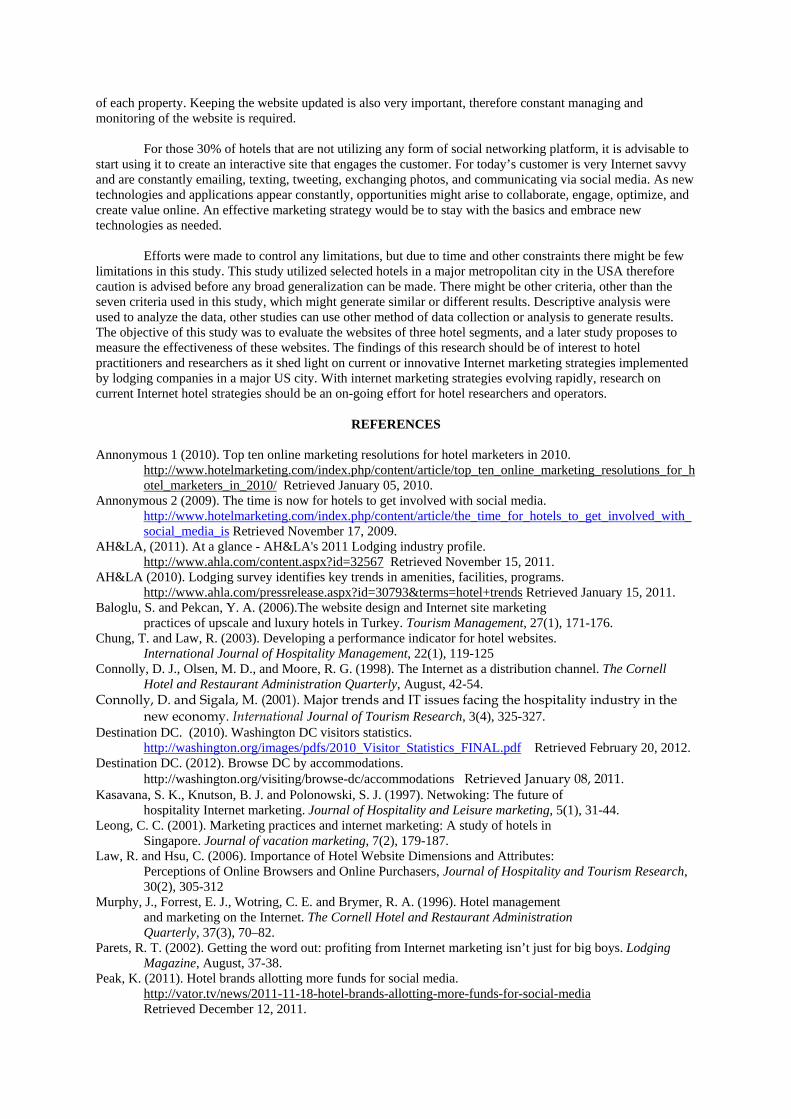
of each property. Keeping the website updated is also very important, therefore constant managing and monitoring of the website is required.
For those 30% of hotels that are not utilizing any form of social networking platform, it is advisable to
start using it to create an interactive site that engages the customer. For today’s customer is very Internet savvy and are constantly emailing, texting, tweeting, exchanging photos, and communicating via social media. As new technologies and applications appear constantly, opportunities might arise to collaborate, engage, optimize, and create value online. An effective marketing strategy would be to stay with the basics and embrace new technologies as needed.
Efforts were made to control any limitations, but due to time and other constraints there might be few
limitations in this study. This study utilized selected hotels in a major metropolitan city in the USA therefore caution is advised before any broad generalization can be made. There might be other criteria, other than the seven criteria used in this study, which might generate similar or different results. Descriptive analysis were used to analyze the data, other studies can use other method of data collection or analysis to generate results. The objective of this study was to evaluate the websites of three hotel segments, and a later study proposes to measure the effectiveness of these websites. The findings of this research should be of interest to hotel practitioners and researchers as it shed light on current or innovative Internet marketing strategies implemented by lodging companies in a major US city. With internet marketing strategies evolving rapidly, research on current Internet hotel strategies should be an on-going effort for hotel researchers and operators.
REFERENCES
Annonymous 1 (2010). Top ten online marketing resolutions for hotel marketers in 2010.
http://www.hotelmarketing.com/index.php/content/article/top_ten_online_marketing_resolutions_for_hotel_marketers_in_2010/ Retrieved January 05, 2010.
Annonymous 2 (2009). The time is now for hotels to get involved with social media. http://www.hotelmarketing.com/index.php/content/article/the_time_for_hotels_to_get_involved_with_social_media_is Retrieved November 17, 2009.
AH&LA, (2011). At a glance - AH&LA's 2011 Lodging industry profile. http://www.ahla.com/content.aspx?id=32567 Retrieved November 15, 2011.
AH&LA (2010). Lodging survey identifies key trends in amenities, facilities, programs. http://www.ahla.com/pressrelease.aspx?id=30793&terms=hotel+trends Retrieved January 15, 2011.
Baloglu, S. and Pekcan, Y. A. (2006).The website design and Internet site marketing practices of upscale and luxury hotels in Turkey. Tourism Management, 27(1), 171-176.
Chung, T. and Law, R. (2003). Developing a performance indicator for hotel websites. International Journal of Hospitality Management, 22(1), 119-125
Connolly, D. J., Olsen, M. D., and Moore, R. G. (1998). The Internet as a distribution channel. The Cornell Hotel and Restaurant Administration Quarterly, August, 42-54.
Connolly, D. and Sigala, M. (2001). Major trends and IT issues facing the hospitality industry in the new economy. International Journal of Tourism Research, 3(4), 325-327.
Destination DC. (2010). Washington DC visitors statistics. http://washington.org/images/pdfs/2010_Visitor_Statistics_FINAL.pdf Retrieved February 20, 2012.
Destination DC. (2012). Browse DC by accommodations. http://washington.org/visiting/browse-dc/accommodations Retrieved January 08, 2011.
Kasavana, S. K., Knutson, B. J. and Polonowski, S. J. (1997). Netwoking: The future of hospitality Internet marketing. Journal of Hospitality and Leisure marketing, 5(1), 31-44.
Leong, C. C. (2001). Marketing practices and internet marketing: A study of hotels in Singapore. Journal of vacation marketing, 7(2), 179-187.
Law, R. and Hsu, C. (2006). Importance of Hotel Website Dimensions and Attributes: Perceptions of Online Browsers and Online Purchasers, Journal of Hospitality and Tourism Research, 30(2), 305-312
Murphy, J., Forrest, E. J., Wotring, C. E. and Brymer, R. A. (1996). Hotel management and marketing on the Internet. The Cornell Hotel and Restaurant Administration Quarterly, 37(3), 70–82.
Parets, R. T. (2002). Getting the word out: profiting from Internet marketing isn’t just for big boys. Lodging Magazine, August, 37-38.
Peak, K. (2011). Hotel brands allotting more funds for social media. http://vator.tv/news/2011-11-18-hotel-brands-allotting-more-funds-for-social-media Retrieved December 12, 2011.
Sigala, M. (2001). Modeling e-marketing strategies: Internet presence and exploitation of Greek hotels. Journal of Hospitality and Tourism Marketing, 11(2/3), 83-97.
Wan, C. S. (2002). The websites of international tourist hotels and tour wholesalers in Taiwan. Tourism Management. 23 (2002), 155–160.
Table 1. Facility information for full-service luxury, full-service, and limited-service hotels
Table 2. Social media information for full-service luxury, full-service, and limited-service hotels
Items All hotels=106 Full-service luxury =13
Full-service=65 Limited-service =28
Virtual tour 32 (30%) 6 (46%) 23 (35%) 3 (11%) Audio feed 22 (22%) 6 (46%) 16 (25%) 0 Food service options
81 (76%) 13 (100%) 63 (97%) 5 (18%)
Fitness and Spa 73 (69%) 12 (92%) 57 (88%) 4 (14%) Green hotel policy
35 (33%) 9 (69%) 25 (38%) 1 (4%)
Pet friendly policy
32 (30%) 5 (38%) 21 (32%) 6 (21%)
Items Total hotels=106
Full-service luxury =13
Full-service=65 Limited-service =28
E Brochure 16 (15%) 3 (23%) 9 (14%) 4 (14%) Face book 74 (70%) 10 (77%) 47 (72%) 17 (61%) Flickr 10 (9%) 3(23%) 7 (11%) 0 Twitter 66 (62%) 10 (77%) 39 (60%) 17 (61%) YouTube 21 (20%) 6 (46%) 15 (23%) 0 Mobile apps 23 (22%) 3 (23%) 19 (29%) 1 (4%) Blog 20 (19%) 3 (23%) 13 (20%) 4 (14%) Google+ 16 (15%) 2 (15%) 7 (11%) 7 (25%) Email 4 (4%) 2 (15%) 2 (3%) 0 LinkedIn 3 (3%) 1 (8%) 2 (3%) 0 Chat-now 6 (6%) 2(15%) 4(6%) 0 Trip Advisor
6 (6%) 0 3 (5%) 3 (11%)
CSR: ARE VISITORS WILLING TO PAY FOR RESPONSIBILITY?
Henri Kuokkanen*, Lecturer
Les Roches Gruyère University of Applied Science Glion Institute of Higher Education
CH-1630 Bulle, Switzerland e-mail: [email protected]
Michael Macdonald, Lecturer
Les Roches Gruyère University of Applied Science Glion Institute of Higher Education
CH-1630 Bulle, Switzerland e-mail: [email protected]
Abstract
The business opportunity of Corporate Social Responsibility (CSR), proposed by Porter and Kramer (2006), is the promotion of CSR as a competitive advantage rather than as a cost. This study hypothesizes that financial benefits are yet to be fully realized due to a mismatch between current supply and demand for CSR. Based on a sample of visitors to the alpine resort of Zermatt in Switzerland, a statistical analysis was conducted on the respondents’ perceptions of the importance of CSR, their past responsible purchase decisions and their willingness to pay extra for responsibility in the future. The findings point to a dislocation between the respondents’ perception of the importance of responsibility and their actions; they further suggest that if CSR were defined according to consumer perceptions, it could have an impact on future purchase behaviour.
INTRODUCTION
The business opportunity of Corporate Social Responsibility (CSR), proposed by Porter and Kramer (2006), is the promotion of the idea of CSR as a competitive advantage rather than a cost, suggesting that consumer purchase decisions could be influenced by the inclusion of responsibility. However, achieving this in practice has proved difficult. Many researchers have attempted to establish a connection between social and financial performances of companies, but results have been mixed, ranging from mildly positive to neutral (Margolis & Walsh, 2003; Orlitzky, Schmidt, & Rynes, 2003; Waddock & Graves, 1997). Thus, unlocking the “Holy Grail” of CSR, converting the consumer interest in CSR expressed in a multitude of surveys (Vogel, 2006, p. 47), into a competitive advantage and financial benefits, remains unaccomplished to date.
A real-life relationship between the tourism and hotel sector and the surrounding environment exists (Kasim, 2006) and thus hospitality and tourism businesses cannot remain oblivious to their responsibilities. International travel agencies have started promoting responsibility in various forms on their websites, and some even attempt to involve the customers themselves in the activities (Thomas Cook, 2009; Travelocity, 2010; Virgin Holidays, 2011). To respond to the call for standards in measurement, organizations such as Sustainable Travel International (2009) work to create certification programs to increase trust in the ecological and responsible messages delivered by operators. This raises the question of whether these initiatives are targeted at increasing profits, or are merely a hygiene factor.
With the growing interest in responsibility, ever more scholarly work on the supply of CSR in tourism and hospitality has emerged (Argandona, 2010; Golja & Krstinic Nizic, 2010; Henderson, 2007; Holcomb, Upchurch, & Okumus, 2007; Sheldon & Park, 2011). Hospitality researchers have also begun to explore the link between social and financial performance; the results have been mixed, similar to the wider performance-link studies (Lee & Park, 2009; Kang, Lee, & Huh, 2010). One element of CSR in hospitality and tourism has, however, received less attention. Ironically, this is the customer, usually considered the central element around which everything should revolve in a service business. This paper attempts to explore the business potential CSR could offer as a competitive advantage, from the customer perspective. Furthermore, we investigate how much interest visitors typically take in the existing supply of CSR when participating in holiday activities and events. In other words, we will ask one of the oldest questions in economics: does the supply of CSR meet the demand?
CORPORATE SOCIAL RESPONSIBILITY
The origins of CSR can be traced back to 1950’s. Carroll (1999), himself a key academic in the field, names Howard Bowen ‘the father of CSR’ based on Bowen’s work during the 50’s. Carroll (1979) formulated a fundamental conceptual model of CSR, indicating that companies have several responsibilities including economic, legal, ethical and discretionary ones. He later developed this concept into his widely referenced CSR pyramid, which suggests that the four different levels of responsibility build on each other, with philanthropic responsibilities (an evolution from discretionary responsibility) forming the top of the pyramid (Carroll, 1991). Another groundbreaking contribution to CSR research was the stakeholder theory of Freeman (1983): the notion that companies should acknowledge all groups impacted by their actions rather than emphasizing only the shareholders. Donaldson and Preston (1995) and Jones (1995) advanced this theory by formulating instrumental and normative approaches, a division based on whether stakeholder management is perceived as a means to improve business performance, or an ethical requirement. Modern CSR largely builds on these fundamental theories. Additionally, the Triple Bottom Line (TBL) model of Elkington (1997), dividing responsibility into economic, social and environmental areas, is widely applied among practitioners, especially in CSR reporting.
Scholars have attempted to establish a relationship between Corporate Social Performance (CSP) and Corporate Financial Performance (CFP), using reputation rankings such as KLD or Fortune to measure CSP and accounting or stock market valuations to measure CFP. The results of these studies have been mixed; while some researchers have found a positive link between the two variables (Orlitzky et al., 2003; Waddock & Graves, 1997), others were not able to establish any significant connection (Margolis & Walsh, 2003; Griffin & Mahon, 1997). A study by Berman, Wicks, Kotha and Jones (1999) evaluated the relationship between stakeholder management style and financial performance, but did not find a direct connection; instead, their results indicated a moderating role of stakeholder management style between company strategy and performance.
Research in marketing has proposed that consumers identifying themselves with a company are the key for a successful business relationship, and this requires clear and coherent communication of company identity (Bhattacharya & Sen, 2003). Luo and Bhattacharya (2006) studied the link between CSR and customer satisfaction; their findings demonstrate that for innovative companies, CSR can increase customer satisfaction and competitiveness, while less innovative companies may actually suffer from investment in CSR. Despite
these findings Oberseder, Schlegelmilch and Gruber (2011) make an important point in asking why even socially aware consumers seem to ignore CSR in marketing.
CSR in tourism and hospitality
In tourism and hospitality the concept of CSR is usually encompassed by the term sustainable tourism, though no single definition exists and terminology is still plentiful (Dolnicar, 2006). The World Tourism Organisation’s (WTO) Global Code for Ethics in Tourism, which emphasizes controlling the effects of tourism on both social and environmental levels, is adopted in this paper (UNWTO, 2011). It must be noted that several authors have criticized the notion of sustainable tourism as a feasible and ethical concept (McKercher, 1993; Sharpley, 2000; Liu, 2003). Furthermore, Lansing and de Vries (2007) claimed that there is not enough evidence of sustainability in tourism for it to be an ethical choice and not mere advertisement.
The supply of responsibility in tourism and hospitality is an established field of research, and many exploratory studies have concentrated on the CSR actions of hospitality businesses (Holcomb et al., 2007; Henderson, 2007; Sheldon & Park, 2011). In one of the early studies, Holcomb et al. (2007) examined the information that top hotel companies present in their CSR reporting and found that discussing donations, diversity policies and CSR vision and mission were the most common items. Henderson (2007) investigated the actions undertaken by hotel companies in Thailand after the tsunami of 2004 and found that efforts coincided with CSR theories; both philanthropic and business motives behind the actions were observed. Argandona (2010) analyzed responsibility in Spanish hotels, and concluded by suggesting that CSR might be the future path to maintain the competitiveness of Spain as a tourist destination. A survey by Golja and Nizic (2010) in Croatia revealed the low level of CSR reporting and environmental awareness within the three regions studied. Investigating the US travel industry, Sheldon and Park (2011) concluded that environmental CSR initiatives dominate the supply; however, no definite explanation for this was stated and the researchers suspected that easier implementation of such activities may play a role. These studies illustrate the focus of research on the existing supply of responsibility, and while exploring the field well, there is little discussion of the reasons for selecting some actions over others; customer demand of responsibility is not addressed.
Earlier, Miller (2001) examined CSR in the UK, again from the supply side, by interviewing a variety of officials and tour operators. His results revealed that the tour operators anticipated future change to be principally driven by customers, while National Tourism Organizations unanimously agreed that change would arise from government. This industry emphasis on responsibility was confirmed by Sheldon and Park (2011), who found that the travel industry in the US strongly agrees on the importance of CSR, and that almost a quarter of the companies in their study had employed a dedicated CSR employee. A study made in Cape Town by Frey and George (2009) suggests a gap between the attitude businesses have towards responsibility and the actions they take. Among the stated obstacles creating this gap were costs and competition.
In the past few years, researchers have taken up the challenge of exploring the CSP-CFP link within the tourism and hospitality industries. Clavier-Cortés, Molina-Azorin, Pereira-Moliner, and Lopez-Gamero (2007) were not able to find a significant link between the environmental pro-activeness of Spanish hotels and their financial performance, though some positive correlation between the two was evident. On the other hand, Nicolau (2008) found that stock markets reacted in a positive way to CSR announcements in his sample group of Spanish hotels, indicating that CSR could benefit shareholders and not only project ethical behaviour. The difference between these results could arise from the indicators of financial performance employed; stock markets tend to react to expectations of higher returns before these returns materialize in accounting.
Studies from the US support the Spanish mixed results. Lee and Park (2009) investigated the link between CSR and financial performance in US hotels and casinos, and found that CSR activities can enhance the profitability of hotels, provided that the hotel is financially strong enough to bear the initial costs of CSR. This connection was not evident for casinos, and the authors suggest that customers perceive gambling differently; the fit between CSR and gambling may be weak. In line with the earlier findings, Kang et al. (2010) arrived at mixed results when analyzing the impact of CSR activities in four different hospitality and tourism related industries: hotels, restaurants, casinos and airlines. Lee and Heo (2009) used US hotels and restaurants to study whether customer satisfaction would be a mediating factor between CSR actions and company performance but found no evidence to support their hypothesis. However, positive CSR and customer satisfaction appeared to be linked to company market value. They concluded that this could indicate the involvement of factors related to employees or communities, with the link between customers and CSR remaining ambiguous. The evidence suggests that CSR in hospitality and tourism has not been a guaranteed source of extra profit, but some promising examples exist. In a survey delving beyond the basic CSP-CFP link, Garay and Font (2011) discovered that within the Spanish tourism SME –sector the reasons for CSR activities are largely altruistic; however, an intriguing detail was that the companies motivated by other reasons, such as competitiveness, had a stronger CSP-CFP link. The study did not attempt to decipher this finding, but a
performance-oriented business might intrinsically be better motivated at defining consumer demand and thus excel in attracting customers, including with CSR.
Jamrozy (2007) suggested a model of sustainability as part of tourism marketing based on the TBL structure, but customer preferences were not considered in his work. Kasim (2004) studied whether responsibility affected tourists’ choices in Malaysia and discovered that customers were reluctant to change hotels or pay extra for more responsible operators. Instead, much emphasis was put on the quality of the holiday experience. The results of Bohdanowicz and Zientara (2008), interviewing the customers of Scandic hotels, were more encouraging. The respondents first listed CSR activities they found worthwhile, and afterwards slightly over 50% of them stated that the attractiveness of the hotel chain would be increased through such actions; the rest indicated no impact. Thus customer-defined CSR seemed to make a difference.
Consumers and CSR as a competitive advantage
Fuller, Hanlan and Wilde (2007) developed the concept of latent demand, presented by Kotler, Brown, Adam and Armstrong (2001), into a key competitive factor in tourism and argued that “latent demand may be defined as an activity not demanded by consumers at a particular time because the cost of supplying the activity is regarded as too high, but which, if supplied, would be demanded by consumers” (Fuller et al., 2007, p. 85). This concept could provide a key to designing CSR actions that meet consumer demand.
Orlitzky et al. (2003) discovered that reputational indices of CSP demonstrate a stronger correlation with CFP than other variables tested in the study. Margolis and Walsh (2003) tied their mixed CSP-CFP results to how CSR benefits the society, suggesting that consumer demand for certain benefits could be an explanatory variable. Findings on the importance of “fit” between the company and its business environment regarding the CSR activities undertaken (Brammer & Pavelin, 2006; Husted & Allen, 2007) seem to support the idea that consumer demand for CSR varies. Some activities appear more desirable than others, depending on the business and the individuals. Mohr and Webb (2005) uncovered the potential of CSR in altering consumers’ evaluation of a company and their purchase intentions. Inoue and Lee (2011) worked out the effect of the various CSR dimensions on financial performance, and their findings confirmed that all dimensions have a different effect on profitability. Their results thus suggest that consumers have different preferences for various aspects of CSR. This underscores how understanding demand is essential when companies design CSR programs.
In a conceptual paper on implementation of CSR in marketing, Maignan, Ferrell and Ferrell (2005) take a partially demand-oriented view by suggesting a stakeholder model that identifies stakeholders and their concerns as part of CSR implementation. Sen and Bhattacharya (2001) concluded that consumers react to CSR based on C–C congruence (Consumer-Company congruence), the perceived overlap between the companys’ CSR and the consumers’ own values. Their results also suggest that CSR might directly and indirectly alter purchase decisions. Dolnicar and Leisch (2008) analyzed tourists’ appreciation of environmental actions in Australia, and concluded that tourists can be segmented based on the size of their ecological footprint. The study concentrated on the environment, and did not attempt to establish whether the respondents would be willing to pay more if their criteria were met. Women and older respondents were defined as the most attractive target groups for environmental advertising. François-Lecompte and Prim-Allaz (2010) found that the French tourist sector also contains groups characterized as responsible tourists. These indications of the existence of responsible customer segments encourage exploring demand for CSR; this could provide a potential solution for converting responsibility into a competitive advantage through meeting related consumer expectations.
Ecotourism, as opposed to sustainable tourism, has been described as demand-oriented (Dolnicar, 2006). However, as Sharpley (2006) notes, demand for ecotourism is no proof of the existence of ecotourists – there is scant evidence of ecotourism customers being more eco-friendly than average tourists. Thus, Dolnicar, Crouch and Long (2008) urge that more research should concentrate on environment-friendly tourists to define them and determine their environmental demands. There is no reason that this approach could not be expanded to encompass all stakeholders, not only the environment.
CSR is an established business concept, with the supply and effects of CSR studied widely. However, a review of the literature suggests a gap related to consumer demand for CSR, particularly in tourism and hospitality. Meeting customer demand is essential when searching for the competitive advantage through CSR advocated by Porter and Kramer (2006). While responsibility is promoted as a potential marketing tool, the findings on its effects on financial performance are mixed. This paper takes a demand-oriented approach to investigate why the CSP-CFP link has been inconsistent, by considering consumer perceptions of CSR. First we ask whether consumers actually consider responsibility and incorporate it in their choices; we hypothesize that currently consumers do not act based on the importance they place on CSR because the supply is dislocated from the demand.
H1: The supply of responsibility in holiday activities and events does not match customer demand.
CSP-CFP studies offer some support for the idea of financial benefits from CSR. Research findings have also suggested that some hospitality customers find CSR worthwhile. Thus we test the hypothesis that responsibility could create a competitive advantage by consumers being willing to pay more for a service that meets their demand for responsibility, drawing on the concept of latent demand in suggesting that there is demand but only for a desirable choice of CSR.
H2: Responsibility can be a source of competitive advantage for businesses in holiday activities and events.
METHODOLOGY
This study employed quantitative methods, to investigate the CSR-consumer link, and to build on previous quantitative studies in the area of consumers’ preferences and attitudes towards companies and CSR (Mohr & Webb, 2005; Bhattacharya & Sen, 2003). The data was collected using questionnaires, a standard approach when studying consumer preferences, with the questions focusing on three different variables: the perceived importance of responsibility, responsible choices made in the past and willingness to pay extra for responsibility in the future. A seven point Likert-scale (Strongly agree – Strongly disagree) was used to measure the respondents’ level of acceptance of the statements given. According to Lozano, Garcia-Cueto and Muniz (2008), the optimal number of alternatives on a Likert-scale is between four and seven, and reliability and validity increase with alternatives as long as the respondents are capable of distinguishing between them. We felt that when trying to establish the level of the tie between beliefs and actions, more choice is essential. The questionnaire was piloted at the Montreux Christmas market in December 2010, and French and German versions were translated by native speakers to assure validity between the languages.
Questions associated with the importance of responsibility measured agreement with statements related to event and holiday activity organizers practicing responsibility, using the questions of Mohr and Webb (2005) as guidance. Statements such as ‘Responsibility and sustainability in holiday activities and events are important’ were used to devise the variable. Practical responsible choices made by the respondents in the past were measured using statements such as ‘I have paid extra to choose an event or holiday activity that is responsible or environmentally sustainable’. Finally, the questions associated with willingness to pay extra were oriented towards the respondents’ future intentions to select a more expensive provider, assuming the responsibility of a product / service would satisfy them. The approach of ‘paying extra’ was chosen not because responsibility would always cost more, but because a choice between a responsible and a normal product, ceteris paribus, might make the analysis invalid; the choice for responsibility might be too obvious. Statements such as ‘I could consider paying extra for responsible and sustainable practises if the arguments were convincing” were used.
The questionnaires were distributed in March 2011 among visitors to the Swiss alpine resort of Zermatt, located at the foot of the Matterhorn. Zermatt was selected as it is a destination for both daily and longer-term visitors. Additionally, the international reputation of the resort allows for a better mix of domestic and foreign tourists. A Saturday was chosen as many package holidays and apartment rentals start and end on Saturdays; along with regional day-visitors, the turnover was thus maximized. As Zermatt is a no-car village, all visitors must travel the last stretch of the trip (Täsch-Zermatt) by a rail shuttle. With the permission of the rail company, we distributed the questionnaires at the beginning of the train ride and collected them at the end of the 12-minute trip. Passengers of every second row on each side of the compartment were asked to participate in the questionnaire. This stratified random sampling prevented the selection of ‘suitable’ candidates as the row pattern was pre-determined, increasing the validity for testing statistical significance. Few visitors declined to participate. A total of 273 questionnaires were collected, and after excluding local residents, the sample size was 266 visitors. The questionnaires were generally completed properly but N varies across the results due to some missing answers.
Data Preparation
The first step was to create the three variables and test them using Cronbach’s alpha. Two questions were excluded from the analysis; they created a significant deviation in the alpha, and a post-study examination of the questions suggested issues that were not discovered during the pilot run. Thus the variables consisted of two to four questions and each variable scored a qualifying alpha of over 0.7. The use of seven-point Likert scales, combined with averaging over multiple questions, justified considering the data as interval, although the disqualification of two questions limits interpretation of the results.
When testing for normality of the variables, only ‘responsible choices made’ fulfilled the criteria on skewness and kurtosis (skewness / kurtosis < 1 and (measure / std. error of measure) < 2). A closer examination of the two other variables revealed that ‘importance of responsibility’ and ‘willingness to pay extra’ were highly skewed toward “Mostly Agree”’; ‘importance of responsibility’ also demonstrated a significant double peak
between “Mostly agree” and “Strongly agree”. Facing the choice of normalizing the data or using only non-parametric tests, normalization was preferred. Several authors have criticized the use of non-parametric tests on non-normal data, including Zimmerman (2000) for a false sense of security and Tanizaki (1997) for low statistical power. A logarithmic transformation LG10 (8 – value) was performed to normalize the variables to a level acceptable for statistical analysis based on skewness and kurtosis, with the sample size of 266 supporting normality conditions. Visual inspection of Q-Q plots suggested that the data is distributed roughly in a linear fashion versus normal distribution, but a Kolmogorov-Smirnov test contradicted this. Tukey (1986), among others, has criticized the use of interval-based statistics with Likert-type data. Due to the mixed normality results we decided to run parallel non-parametric tests to increase the reliability of the analysis. The results presented here are based on parametric tests but in all cases non-parametric tests confirmed the results to overcome this limitation.
Additionally, to test the first hypothesis, whether visitors base their purchase decision on the responsibility offering, ‘importance of responsibility’ and ‘responsible choices made’ (without normalisation) were regrouped into seven Likert categories. This enabled cross-tabulation and further analysis of the two variables.
FINDINGS
Males were slightly over-represented in the sample (56%). Approximately 80% of respondents fell within the age category of 25-64, and they were fairly evenly spread within this range (the most frequent group was 45-54 year-olds). All levels of education were represented, but higher education was overemphasized, as half of the respondents held a bachelors’ or masters’ degree and another 10% a doctorate. This is not surprising for a high-end resort such as Zermatt.
Table 1: * indicates significant (p<0.05) differences between categories (non-normalized original means reported).
Category Item Percentage Mean importance of responsibility
Mean past responsible choices made
Mean willingness to pay extra
Gender Female Male
44% 56%
5.98 5.73
(F = 4.996*)
4.39 3.93
(F = 4.898*)
5.40 4.99
(F = 7.16*)
To understand the sample more thoroughly before testing the hypotheses, differences between categories were tested using ANOVA (p<0.05) for each normalized variable. Levene’s statistic (p>0.4 for all variables) confirmed the homogeneity of variances in each case. Age and education had no significant impact on any of the three variables. However, as shown in Table 1, women were more positively inclined towards responsibility for each variable, the difference between the genders increasing as perceptions should produce action, from 0.25 to 0.46. The non-parametric Mann-Whitney U and Kruskal-Wallis tests confirmed these results; women seem to be more disposed towards responsibility than men.
Does supply meet demand?
The first research objective was to investigate whether respondents found the supply of responsibility currently offered appealing. Should current responsibility genuinely meet the demand of the respondents, the responsible choices made should match the perceived importance of responsibility, and the means of the two variables should come from the same distribution. Correlation analysis suggested that the two are linked, with a Pearson correlation of 0.506 (p < .001). On the other hand, the level of agreement with ‘importance of responsibility’ (M = 5.81, SD = 0.92) was higher than the level of ‘responsible choices made’ (M = 4.11, SD = 1.38), indicating that there is a discrepancy in how perceived importance translates into actions (paired samples t-test using normalised variables, t = 39.7, p < 0.001).
To further analyze the nature of this lag, the variables ‘responsible choices made’ and ‘importance of responsibility’, placed back into the seven original Likert categories, were cross tabulated (Figure 1). While correlation between the variables is visually evident, the tabulation also suggests that the there are consistently fewer responsible choices made compared to the perceived importance of responsibility; visually, the 45-degree line created by the gray cells does not extend from the top left to the lower right corner as indicated by the dotted lines. The cross-tabulation thus suggests that the actions taken by the respondents lag behind the importance they perceive in responsibility. The number of respondents indicating any disagreement with the importance of responsibility was very low with a total of 4 respondents disagreeing, and thus these groups were excluded from further analysis.
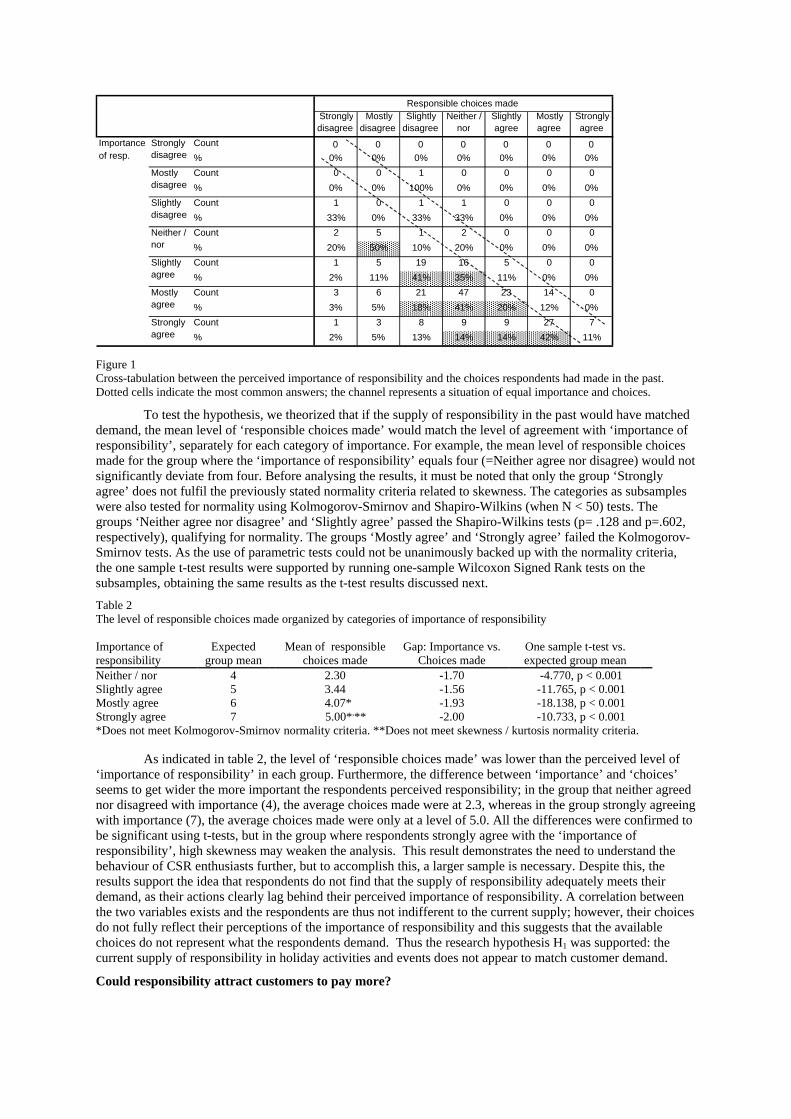
Figure 1 Cross-tabulation between the perceived importance of responsibility and the choices respondents had made in the past. Dotted cells indicate the most common answers; the channel represents a situation of equal importance and choices.
To test the hypothesis, we theorized that if the supply of responsibility in the past would have matched demand, the mean level of ‘responsible choices made’ would match the level of agreement with ‘importance of responsibility’, separately for each category of importance. For example, the mean level of responsible choices made for the group where the ‘importance of responsibility’ equals four (=Neither agree nor disagree) would not significantly deviate from four. Before analysing the results, it must be noted that only the group ‘Strongly agree’ does not fulfil the previously stated normality criteria related to skewness. The categories as subsamples were also tested for normality using Kolmogorov-Smirnov and Shapiro-Wilkins (when N < 50) tests. The groups ‘Neither agree nor disagree’ and ‘Slightly agree’ passed the Shapiro-Wilkins tests (p= .128 and p=.602, respectively), qualifying for normality. The groups ‘Mostly agree’ and ‘Strongly agree’ failed the Kolmogorov-Smirnov tests. As the use of parametric tests could not be unanimously backed up with the normality criteria, the one sample t-test results were supported by running one-sample Wilcoxon Signed Rank tests on the subsamples, obtaining the same results as the t-test results discussed next.
Table 2 The level of responsible choices made organized by categories of importance of responsibility Importance of responsibility
Expected group mean
Mean of responsible choices made
Gap: Importance vs. Choices made
One sample t-test vs. expected group mean
Neither / nor 4 2.30 -1.70 -4.770, p < 0.001 Slightly agree 5 3.44 -1.56 -11.765, p < 0.001 Mostly agree 6 4.07* -1.93 -18.138, p < 0.001 Strongly agree 7 5.00*,** -2.00 -10.733, p < 0.001 *Does not meet Kolmogorov-Smirnov normality criteria. **Does not meet skewness / kurtosis normality criteria.
As indicated in table 2, the level of ‘responsible choices made’ was lower than the perceived level of ‘importance of responsibility’ in each group. Furthermore, the difference between ‘importance’ and ‘choices’ seems to get wider the more important the respondents perceived responsibility; in the group that neither agreed nor disagreed with importance (4), the average choices made were at 2.3, whereas in the group strongly agreeing with importance (7), the average choices made were only at a level of 5.0. All the differences were confirmed to be significant using t-tests, but in the group where respondents strongly agree with the ‘importance of responsibility’, high skewness may weaken the analysis. This result demonstrates the need to understand the behaviour of CSR enthusiasts further, but to accomplish this, a larger sample is necessary. Despite this, the results support the idea that respondents do not find that the supply of responsibility adequately meets their demand, as their actions clearly lag behind their perceived importance of responsibility. A correlation between the two variables exists and the respondents are thus not indifferent to the current supply; however, their choices do not fully reflect their perceptions of the importance of responsibility and this suggests that the available choices do not represent what the respondents demand. Thus the research hypothesis H1 was supported: the current supply of responsibility in holiday activities and events does not appear to match customer demand.
Could responsibility attract customers to pay more?
Strongly disagree
Mostly disagree
Slightly disagree
Neither / nor
Slightly agree
Mostly agree
Strongly agree
Count 0 0 0 0 0 0 0
% 0% 0% 0% 0% 0% 0% 0% Count 0 0 1 0 0 0 0
% 0% 0% 100% 0% 0% 0% 0% Count 1 0 1 1 0 0 0
% 33% 0% 33% 33% 0% 0% 0% Count 2 5 1 2 0 0 0
% 20% 50% 10% 20% 0% 0% 0% Count 1 5 19 16 5 0 0
% 2% 11% 41% 35% 11% 0% 0% Count 3 6 21 47 23 14 0
% 3% 5% 18% 41% 20% 12% 0% Count 1 3 8 9 9 27 7
% 2% 5% 13% 14% 14% 42% 11%
Importance of resp.
Strongly disagree Mostly disagree Slightly disagree Neither / nor Slightly agree Mostly agree Strongly agree
Responsible choices made
The second part of the analysis concentrated on exploring whether responsibility could motivate customers to pay more for a holiday activity or event; in other words, to create a competitive advantage for a business. This analysis attempted to establish a link between the perceived importance of responsibility and the willingness to pay extra for a responsible service in the future, provided the respondents find the message of responsibility convincing. An analysis of variable means showed that the respondents’ agreement with the importance of responsibility (M = 5.81, SD = 0.92) was higher than their agreement with willingness to pay extra for it (M = 5.19, SD = 1.38). Ranking the means of all the three variables in order demonstrated that the respondents agreed most with the importance of responsibility; willingness to pay extra ranked second (M = 5.19); and responsible choices made in the past came last (M = 4.11), indicating decreasing agreement when intentions are expected to turn into actions. Similarly, Pearson correlation between perceived importance and willingness to pay extra was 0.612 (p < 0.000) while the correlation between perceived importance and choices made in the past was 0.54 (p < 0.000).
The next phase was to analyze whether perceived importance can explain changes in willingness to pay extra for responsibility in the future. A linear regression model was fitted with ‘perceived importance’ as the independent variable and ‘willingness to pay extra’ as the dependent variable. Category variables (gender, age and education) were tested as dummy variables but they were removed as they weakened the adjusted R squared value. Regression through origin (RTO) was also explored; as a result of the logarithmic transformation both variables could be zero at the same time. Comparison of RTO and model with a constant showed that the constant was significant and the standard error smaller in the later model, and thus RTO was rejected (Eisenhauer, 2003).
The results show that perceived importance of responsibility partly predicts future willingness to pay. Perceived importance is not the only criteria for willingness to pay extra, as the adjusted R-squared value is fairly low at 0.373; however, there is a significant connection between the two variables (F = 151.258, p < 0.000). When perceived importance increases by one standard deviation, willingness to pay extra increases by 0.612 standard deviations (t-test 12.3, p<0.000), supporting the expectation that responsibility could provide a potential competitive advantage. Based on this regression, respondents seem willing to take future actions if responsibility is part of their value system, which is the case for a large segment of the respondents, although currently this link is not strong. The residuals of the regression fulfil the criteria for normality based on a visual inspection of the P-P plot. The scatter plot of residuals show a slight funnel shape but overall homoscedasticity can be assumed. The Durbin-Watson statistic (1.741) suggests independence of the errors. Thus the regression fulfils the conditions for statistical validity.
The results support the idea that responsibility could be a competitive advantage if correctly presented, as importance of responsibility is a predictor for willingness to pay extra. Although the link is not strong, it does exist. The potential reasons for the relative weakness of the link, however, are of key interest and will be discussed later. Furthermore, the higher correlation between the perceived importance of responsibility and the willingness to pay extra, compared with the correlation between the importance of responsibility and responsible choices made in the past, suggests that responsibility may have more potential to create a competitive advantage in the future than it does in its current form. Responsibility must be convincing though, as determined in the questions concerning the variable ‘willingness to pay extra’. With this evidence, the research hypothesis H2 was somewhat supported: Responsibility can be a source of competitive advantage for businesses in holiday activities and events.
DISCUSSION AND CONCLUSIONS
The results of this study offer support for the hypothesis that there is a dislocation between supply and demand of responsibility within the domain of holiday activities and events. While the respondents are not oblivious to efforts made by operators and organizers, the actions they have taken clearly lag behind the importance they place on responsibility. If supply met demand, the perceived importance should convert more directly into actions, whereas at present there is a significant difference. The dislocation could partly explain the mixed findings in many of the hospitality related CSP-CFP studies (Clavier-Cortés et al., 2007; Nicolau, 2008; Lee & Park, 2009; Kang et al., 2010). While these studies attempted to discover a link between CSR activities and financial performance, they were either concentrated on only one domain within hospitality (e.g. hotels, casinos) or used the domain as a factor to explain the strength of the link. The attitude of consumers towards a mixed group of CSR activities was not included in these studies. Consumer preference for some activities over others could explain why some of the companies fared better than others in these studies, creating the mixed overall picture described earlier.
The demand of consumers for responsibility has not been studied nearly as widely as the supply of CSR or the CSP-CFP link, especially within hospitality and tourism. In marketing, responsibility has been considered as a potential factor to be incorporated in business, and the conceptual “C-C congruence” of Sen and
Bhattacharya (2001) could be an explanatory factor for the results of this study. The respondents may not perceive that the typical CSR activities undertaken align with their understanding of responsibility, and thus their actions clearly demonstrate less enthusiasm than their beliefs and values would predict. There is evidence that tourists can be categorized based on environmental attitudes and responsibility (Dolnicar & Leisch, 2008; François-Lecompte & Prim-Allaz, 2010), and these tourists often are customers for holiday activities and events. The findings of Dolnicar and Leisch (2008) found support in this study; women seem to be a more attractive target group for CSR activities as they are more willing to pay extra for it. However, this initial categorization is only the beginning, and future research could delve deeper into understanding the values and preferences ofe CSR-oriented categories of visitors and tourists. Inoue and Lee (2011) suggested that different dimensions of CSR have different impacts on profitability, but this analysis could be taken further. Instead of merely dividing CSR into dimensions, the dimensions might be split into separate actions. Studying the consumers’ reactions to individual actions could reveal what kind of CSR is “in demand”, and would help in finding the key to competitive advantage through CSR.
Before launching such a study, it is important to know whether CSR, even if designed according to consumer preferences, could actually be a source of extra profits for businesses. In this study, the benefits of CSR for a company were simulated through the visitors’ expressed willingness to pay more for a responsible holiday activity or event. Simply offering a choice between a responsible and non-responsible service could lead to insignificant results; if the price was the same, the respondents could easily be led to select the responsible alternative. On the other hand, willingness to pay more indicates a readiness to contribute scarce resources to the cause, in this case making a financial commitment toward certain business practices. The results of this study somewhat support the research hypothesis, according to which their perceived importance of responsibility increases consumers’ willingness to pay more for it. The reputation of Zermatt as a high-end resort must also be taken into account when interpreting the results, as the visitors may be wealthier than visitors to an average ski resort. This may play a role in being prepared to pay more, and the high percentage of visitors with post-graduate degrees supports this observation.
It must be noted that the regression results may be clouded by the respondents’ own perceptions of what “meaningful” responsibility is. This was deliberately left somewhat vague in the questionnaire, as defining “meaningful” would have been impossible at this stage. Despite this shortfall, the link between perceived importance of responsibility and willingness to pay more for it is encouraging for two reasons. First, it supports the potential of responsibility as a competitive advantage through marketing (Jamrozy, 2007; Porter & Kramer, 2006; Mohr & Webb, 2005), and validates the call for further research into categories of customers. Second, it builds on earlier results that found hospitality customers favourably inclined towards CSR (Bohdanowicz & Zientara, 2008) and offers hope that older results, in which responsible actions were rejected (Kasim, 2004), are the past. The link between the two variables was not strong in this study, and this calls for further investigation into details of consumer preferences for responsibility to discover other significant contributing factors. The results do, however, suggest that a link exists, and thus it could be possible to obtain competitive advantage through responsibility, provided that the supply is correct.
The results of the analysis of the choices made within groups, categorized based on the respondents’ perceived importance of responsibility, indicated that the group strongly agreeing with importance of responsibility was highly skewed. Further research into this particular group could provide valuable insights into why even socially aware consumers seem to ignore CSR in marketing, an issue raised by Oberseder et al. (2011). After all, it is these enthusiasts that are the prime candidates for businesses to provide extra revenue through responsible practice.
The popularity of CSR studies within hospitality is growing rapidly. This paper aims to contribute to an area of lesser attention: the consumer demand for CSR. A demand-led approach, concentrating on consumers and their perceptions, was taken to determine the current and potential business benefits of CSR. For practitioners, this paper provides some insights for the process of planning CSR policies and activities by emphasizing the importance of customer interest in these actions. This study concentrated on responsibility as part of events and holiday activities, and it should be expanded to cover tourism and hospitality as wider fields. CSR appears to have potential as a competitive advantage, but unless consumers are consulted, this potential may never be realized.
REFERENCES Argandona, A. (2010). Corporate Social Responsibility in the Tourism Industry: Some Lessons from the Spanish
Experience. IESE Business School Working Paper No. 844. Available at SSRN: http://ssrn.com/abstract=1593592.
Berman, S., Wicks, A. C., Kotha, S., & Jones, T. M. (1999). Does stakeholder orientation matter? The relationship between stakeholder management models and firm financial performance. Academy of Management Journal, 42(5), 488-506.
Bhattacharya, C. B., & Sen, S. (2003, April). Consumer-Company Identification: A Framework for Understanding Consumers’ Relationships with Companies. Journal of Marketing, 67, 76-88.
Bohdanowicz, P., & Zientara, P. (2008). Corporate Social Responsibility in Hospitality: Issues and Implications. A Case Study of Scandic. Scandinavian Journal of Hospitality and Tourism, 8(4), 271-293.
Brammer, S. J., & Pavelin, S. (2006). Corporate Reputation and Social Performance: The Importance of Fit. Journal of Management Studies, 43(3), 435-455.
Carroll, A. B. (1979). A Three-Dimensional Conceptual Model of Corporate Performance. Academy of Management Review, 4(4), 497-505.
Carroll, A. B. (1991). The Pyramid of Corporate Social Responsibility: Toward the Moral Management of Organizational Stakeholders. Business Horizons, 34(4), 39-48.
Carroll, A. B. (1999). Carroll (1999) Corporate social responsibility - Evolution of a Definitional Concept. Business and Society, 38(3), 268-295.
Clavier-Cortés, E., Molina-Azorin, J. F., Pereira-Moliner, J., & Lopez-Gamero, M. D. (2007). Environmental Strategies and Their Impact on Hotel Performance. Journal of Sustainable Tourism, 15(6), 663-679.
Dolnicar, S. (2006). Nature-Conserving Tourists: The Need for a Broader Perspective. Anatolia: An International Journal of Tourism and Hospitality Research, 17(2), 197-210.
Dolnicar, S., & Leisch, F. (2008). Selective marketing for environmentally sustainable tourism. Tourism Management, 29, 672-680.
Dolnicar, S., Crouch, G. I., & Long, P. (2008). Environment-friendly Tourists: What Do We Really Know About Them? Journal of Sustainable Tourism, 16(2), 197-210.
Donaldson, T., & Preston, L. E. (1995). THE STAKEHOLDER THEORY OF THE CORPORATION - CONCEPTS, EVIDENCE, AND IMPLICATIONS. Academy of Management Review, 20(1), 65-91.
Eisenhauer, J. G. (2003). Regression through the Origin. Teaching Statistics, 25(3), 76-80. Elkington, J. B. (1997). Cannibals With Forks: The Triple Bottom Line of 21st Century Business. Oxford:
Capstone Publishing. François-Lecompte, A., & Prim-Allaz, I. (2010). Les Français et le tourisme durable proposition d'une
typologie. Revue Management et Avenir, 29, 308-326. Freeman, R. E., & Reed, D. L. (1983). Stockholders and Stakeholders: A New Perspective on Corporate
Governance. CALIFORNIA MANAGEMENT REVIEW, XXV(3), 88-106. Frey, N., & George, R. (2010). Responsible tourism management: The missing link between business owners’
attitudes and behaviour in the Cape Town tourism industry. Tourism Management, 31, 621-628. Fuller, D., Hanlan, J., & Wilde, S. (2007). The Identification and Implementation of Key Competitive Factors
for Tourism Based Firms. International Journal of Hospitality & Tourism Administration, 36(1), 73- 90. Garay, L., & Font, X. (2011). Doing good to do well? Corporatesocial responsibility reasons, practices and
impacts in small and medium accommodation enterprises. International Journal of Hospitality Management.
Golja, T., & Krstinic Nizic, M. (2010). Corporate social responsibility in tourism - The most popular tourim destinations in Croatia: comparative analysis. Management, 15(2), 107-121.
Griffin, J. J., & Mahon, J. F. (1997). The Corporate Social Performance and Corporate Financial Performance Debate: Twenty-Five Years of Incomparable Research. Business and Society, 36(1), 5-31.
Henderson, J. C. (2007). Corporate social responsibility and tourism: Hotel companies in Phuket, Thailand, after the Indian Ocean tsunami. Hospitality Management, 26, 228-239.
Holcomb, J. L., Upchurch, R. S., & Okumus, F. (2007). Corporate social responsibility: what are top hotel companies reporting? International Journal of Contemporary Hospitality Management, 19(6), 461-475.
Husted, B. W., & Allen, D. B. (2007). Corporate Social Strategy in Multinational Enterprises: Antecedents and Value Creation. Journal of Business Ethics, 74, 345-361.
Inoue, Y., & Lee, S. (2011). Effects of different dimensions of corporate social responsibility on corporate financial performance in tourism-related industries. Tourism Management, 32, 790-804.
Jamrozy, U. (2007). Marketing of tourism: a paradigm shift toward sustainability. International Journal of Culture, Tourism and Hospitality Research, 1(2), 117-130.
Jones, T. M. (1995). INSTRUMENTAL STAKEHOLDER THEORY - A SYNTHESIS OF ETHICS AND ECONOMICS. Academy of Management review, 20(2), 404-437.
Kang, K. H., Lee, S., & Huh, C. (2010). Impacts of positive and negative corporate social responsibility activities on company performance in the hospitality industry. International Journal of Hospitality Management, 29, 72-82.
Kasim, A. (2004). Socio-Environmentally Responsible Hotel Business: Do Tourists to Penang Island, Malaysia Care? Journal of Hospitality and Leisure Marketing, 11(4), 5-28.
Kasim, A. (2006). The Need for Business Environmental and Social Responsibility in the Tourism Industry. International Journal of Hospitality & Tourism Administration, 7(1), 1-22.
Kotler, P., Brown, L., Adam, S., & Armstrong, G. (2001). Marketing (5th ed.). Frenches Forest, Sydney: Pearson Education.
Lansing, P., & De Vries, P. (2007). Sustainable Tourism: Ethical Alternative or Marketing Ploy. Journal of Business Ethics, 72(1), 77-85.
Lee, S., & Heo, C. Y. (2009). Corporate social responsibility and customer satisfaction among US publicly traded hotels and restaurants. International Journal of Hospitality Management, 28, 635-637.
Lee, S., & Park, S. (2009). Do socially responsible activities help hotels and casinos achieve their financial goals? International Journal of Hospitality Management, 28, 105-112.
Liu, Z. (2003). Sustainable Tourism Development: A Critique. Journal of Sustainable Tourism, 11(6), 459-475. Lozano, L. M., Garcia-Cueto, E., & Muniz, J. (2008). Effect of the Number of Response Categories on the
Reliability and Validity of Rating Scales. Methodology, 4(2), 73-79. Luo, X., & Bhattacharya, C. B. (2006). Corporate Social Responsibility, Customer Satisfaction, and Market
Value. Journal of Marketing, 70(4), 1-18. Maignan, I., Ferrell, O., & Ferrell, L. (2005). A stakeholder model for implementing social responsibility in
marketing. European Journal of Marketing, 39(9/10), 956-977. Margolis, J. D., & Walsh, J. P. (2003). Misery Loves Companies: Rethinking Social Initiatives by Business.
Administrative Science Quarterly, 48, 268-305. McKercher, B. (1993). Some fundamental truths about tourism: understanding tourism's social and
environmental impacts. Journal of Sustainable Tourism, 1(1), 6-16. Mohr, L. A., & Webb, D. J. (2005). The Effects of Corporate Social Responsibility and Price on Consumer
Responses. The Journal of Consumer Affairs, 39(1), 121-147. Nicolau, J. (2008). CORPORATE SOCIAL RESPONSIBILITY: Worth-Creating Activities. Annals of Tourism
Research, 35(4), 990-1006. Oberseder, M., Schlegelmilch, B. B., & Gruber, V. (2011). ‘‘Why Don’t Consumers Care About CSR’’ - A
Qualitative Study exploring the role of csr in consumption decisions. Journal of Business Ethics. doi:10.1007/s10551-011-0925-7
Orlitzky, M., Schmidt, F. L., & Rynes, S. L. (2003). Corporate Social and Financial Performance: A Meta-analysis. Organization Studies, 24(3), 403-441.
Porter, M. E., & Kramer, M. R. (2006). Strategy and Society: The Link between Competitive Advantage and Corporate Social Responsibility. Harvard Business Review, 84, 78-92.
Sen, S., & Bhattacharya, C. (2001). Does Doing Good Always Lead to Doing Better? Consumer Reactions to Corporate Social Responsibility. Journal of Marketing Research, 38(2), 225–244.
Sharpley, R. (2000). Tourism and Sustainable Development : Exploring the Theoretical Divide. Journal of Sustainable Tourism, 8(1), 1-15.
Sharpley, R. (2006). Ecotourism: A Consumption Perspective. Journal of Ecotourism, 5(1/2), 7-22. Sheldon, P. J., & Park, S. (2011). An Exploratory Study of Corporate Social Responsibility in the U.S. Travel
Industry. Journal of Travel Research, 50(4), 392-407. Sustainable Travel International. (2009). Our Programs: Eco-Certification. Retrieved June 18, 2011, from
http://www.sustainabletravelinternational.org/documents/sustainabletourismcertification.html Tanizaki, H. (1997). Power comparison of non-parametric tests: Small-sample properties from Monte Carlo
experiments. Journal of Applied Statistics, 24, 603-632. Thomas Cook. (2009). Sustainable Tourism. Retrieved June 18, 2011, from
http://www.thomascook.com/sustainable-tourism/ Travelocity. (2010). Travel for good. Retrieved June 18, 2011, from
http://www.travelocity.com/TravelForGood/index.html Tukey, J. W. (1986). The collected works of John W. Tukey (Volume IV): Philosophy and principles of data
analysis 1965-1986. Monterey, CA: Wadsworth & brooks/Cole. UNWTO. (2011). Global Code of Ethics for Tourism. Retrieved July 29, 2011, from
http://www.unwto.org/ethics/index.php Virgin Holidays. (2011). About Virgin Holidays: Responsible Tourism. Retrieved June 18, 2011, from
http://www.virginholidays.co.uk/info/about/who_are_we/responsible.aspx Vogel, D. (2006). The Market for Virtue: The Potential and Limits of Corporate Social Responsibility.
Washington DC: Brookings Institution Press. Waddock, S. A., & Graves, S. B. (1997). The Corporate Social Performance – Financial Performance Link.
Strategic Management Journal, 18(4), 303-319. Zimmerman, D. W. (2000). Statistical significance levels of nonparametric tests biased by heterogeneous
variances of treatment groups. Journal of General psychology, 127, 354-364.
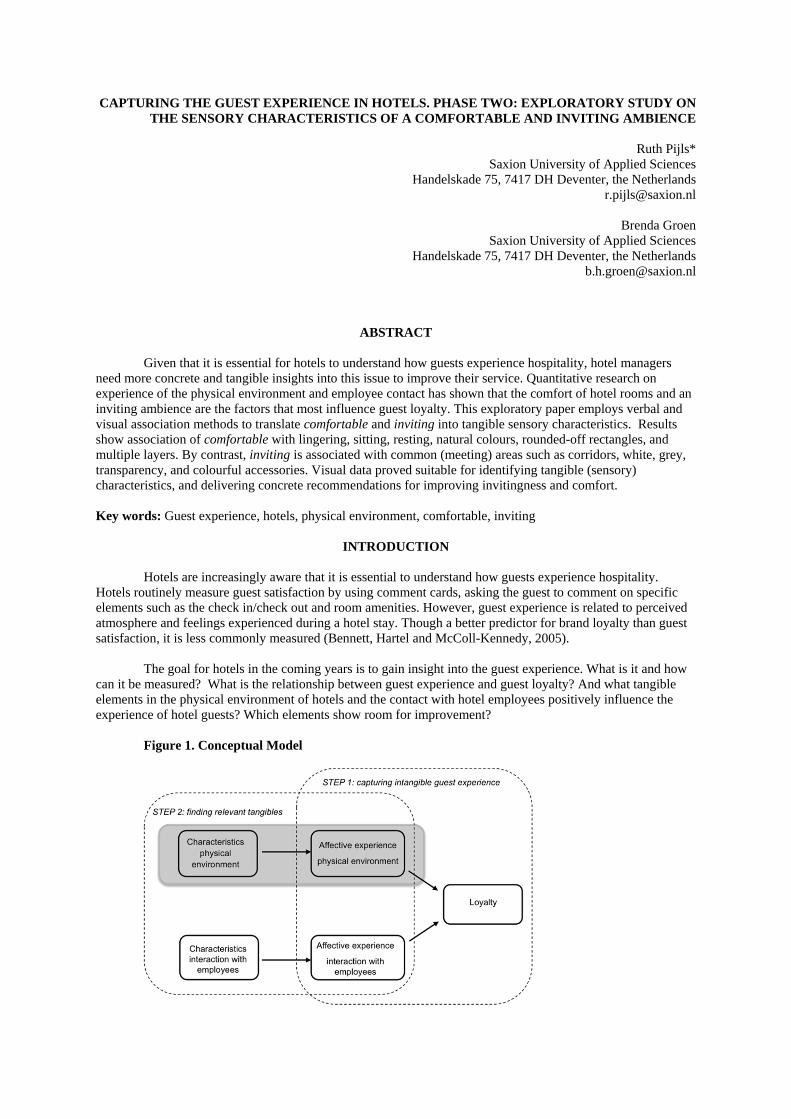
CAPTURING THE GUEST EXPERIENCE IN HOTELS. PHASE TWO: EXPLORATORY STUDY ON THE SENSORY CHARACTERISTICS OF A COMFORTABLE AND INVITING AMBIENCE
Ruth Pijls*
Saxion University of Applied Sciences Handelskade 75, 7417 DH Deventer, the Netherlands
Brenda Groen Saxion University of Applied Sciences
Handelskade 75, 7417 DH Deventer, the Netherlands [email protected]
ABSTRACT
Given that it is essential for hotels to understand how guests experience hospitality, hotel managers need more concrete and tangible insights into this issue to improve their service. Quantitative research on experience of the physical environment and employee contact has shown that the comfort of hotel rooms and an inviting ambience are the factors that most influence guest loyalty. This exploratory paper employs verbal and visual association methods to translate comfortable and inviting into tangible sensory characteristics. Results show association of comfortable with lingering, sitting, resting, natural colours, rounded-off rectangles, and multiple layers. By contrast, inviting is associated with common (meeting) areas such as corridors, white, grey, transparency, and colourful accessories. Visual data proved suitable for identifying tangible (sensory) characteristics, and delivering concrete recommendations for improving invitingness and comfort. Key words: Guest experience, hotels, physical environment, comfortable, inviting
INTRODUCTION
Hotels are increasingly aware that it is essential to understand how guests experience hospitality. Hotels routinely measure guest satisfaction by using comment cards, asking the guest to comment on specific elements such as the check in/check out and room amenities. However, guest experience is related to perceived atmosphere and feelings experienced during a hotel stay. Though a better predictor for brand loyalty than guest satisfaction, it is less commonly measured (Bennett, Hartel and McColl-Kennedy, 2005).
The goal for hotels in the coming years is to gain insight into the guest experience. What is it and how can it be measured? What is the relationship between guest experience and guest loyalty? And what tangible elements in the physical environment of hotels and the contact with hotel employees positively influence the experience of hotel guests? Which elements show room for improvement?
Figure 1. Conceptual Model
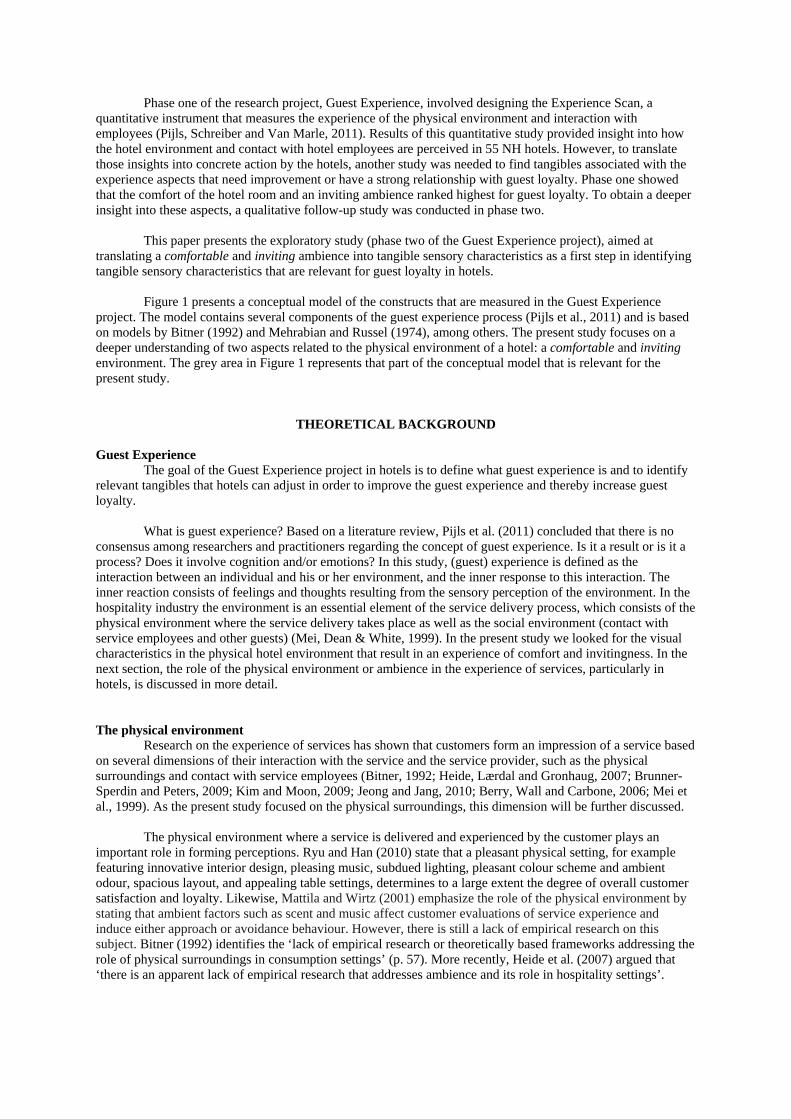
Phase one of the research project, Guest Experience, involved designing the Experience Scan, a quantitative instrument that measures the experience of the physical environment and interaction with employees (Pijls, Schreiber and Van Marle, 2011). Results of this quantitative study provided insight into how the hotel environment and contact with hotel employees are perceived in 55 NH hotels. However, to translate those insights into concrete action by the hotels, another study was needed to find tangibles associated with the experience aspects that need improvement or have a strong relationship with guest loyalty. Phase one showed that the comfort of the hotel room and an inviting ambience ranked highest for guest loyalty. To obtain a deeper insight into these aspects, a qualitative follow-up study was conducted in phase two.
This paper presents the exploratory study (phase two of the Guest Experience project), aimed at translating a comfortable and inviting ambience into tangible sensory characteristics as a first step in identifying tangible sensory characteristics that are relevant for guest loyalty in hotels. Figure 1 presents a conceptual model of the constructs that are measured in the Guest Experience project. The model contains several components of the guest experience process (Pijls et al., 2011) and is based on models by Bitner (1992) and Mehrabian and Russel (1974), among others. The present study focuses on a deeper understanding of two aspects related to the physical environment of a hotel: a comfortable and inviting environment. The grey area in Figure 1 represents that part of the conceptual model that is relevant for the present study.
THEORETICAL BACKGROUND Guest Experience
The goal of the Guest Experience project in hotels is to define what guest experience is and to identify relevant tangibles that hotels can adjust in order to improve the guest experience and thereby increase guest loyalty.
What is guest experience? Based on a literature review, Pijls et al. (2011) concluded that there is no
consensus among researchers and practitioners regarding the concept of guest experience. Is it a result or is it a process? Does it involve cognition and/or emotions? In this study, (guest) experience is defined as the interaction between an individual and his or her environment, and the inner response to this interaction. The inner reaction consists of feelings and thoughts resulting from the sensory perception of the environment. In the hospitality industry the environment is an essential element of the service delivery process, which consists of the physical environment where the service delivery takes place as well as the social environment (contact with service employees and other guests) (Mei, Dean & White, 1999). In the present study we looked for the visual characteristics in the physical hotel environment that result in an experience of comfort and invitingness. In the next section, the role of the physical environment or ambience in the experience of services, particularly in hotels, is discussed in more detail. The physical environment Research on the experience of services has shown that customers form an impression of a service based on several dimensions of their interaction with the service and the service provider, such as the physical surroundings and contact with service employees (Bitner, 1992; Heide, Lærdal and Gronhaug, 2007; Brunner-Sperdin and Peters, 2009; Kim and Moon, 2009; Jeong and Jang, 2010; Berry, Wall and Carbone, 2006; Mei et al., 1999). As the present study focused on the physical surroundings, this dimension will be further discussed. The physical environment where a service is delivered and experienced by the customer plays an important role in forming perceptions. Ryu and Han (2010) state that a pleasant physical setting, for example featuring innovative interior design, pleasing music, subdued lighting, pleasant colour scheme and ambient odour, spacious layout, and appealing table settings, determines to a large extent the degree of overall customer satisfaction and loyalty. Likewise, Mattila and Wirtz (2001) emphasize the role of the physical environment by stating that ambient factors such as scent and music affect customer evaluations of service experience and induce either approach or avoidance behaviour. However, there is still a lack of empirical research on this subject. Bitner (1992) identifies the ‘lack of empirical research or theoretically based frameworks addressing the role of physical surroundings in consumption settings’ (p. 57). More recently, Heide et al. (2007) argued that ‘there is an apparent lack of empirical research that addresses ambience and its role in hospitality settings’.
Within the physical environment, a distinction can be made between different types of elements. Most categorizations are based on the dimensions introduced by Bitner (1992), and contain the subdivision of the physical environment into ‘ambient conditions’, ‘functionality and lay-out’ and ‘design’ (Heide, Lærdal and Gronhaug, 2007; Brunner-Sperdin and Peters, 2009; Liu and Jang, 2009). Ambient conditions are background features such as temperature, air quality, noise, music, lighting and olfaction (Bitner 1992). In a review of empirical research on servicescapes, Kearney, Kennedy and Coughlan (2007) state that music has received most attention (Milliman, 1992; Spangenberg, Grohmann and Sprott, 2005). Other variables that have been researched, according to Kearny et al., are olfaction (Bone and Ellen, 1999; Spangenberg et al., 2005), colour (Chebat and Morin, 2007), and lighting (Summers and Herbert, 2001). Functionality and lay-out refer to spatial arrangement of the interior (lay-out), furnishing and equipment (Bitner, 1992). Furnishing is defined as an element that directly affects the comfort and performance of both customers and employees in the servicescape (Bitner, 1992; Harris and Ezeh, 2008). Arneill and Devlin (2002) show that visual interpretations of the furnishings of a context contribute to the perceived service quality. Lay-out also affects people’s impression of the service environment. Aubert-Gamet (1997) states that ‘the internal layout of buildings may either ease or restrict movement, thereby evoking a sense of crowding or spaciousness’. In turn, the extent of crowding of personal space affects people’s mood and behaviour (Kaya and Erkip, 1999). Design refers to aesthetic elements such as architecture and intangible aspects of the physical surroundings (Slåtten and Mehmetoglu, 2010). According to Alonso and Ogle (2008), for hotels, for example, design is a significant tool in enhancing the building’s attractive appeal, creating an atmosphere in the public arena. Nguyen and Leblanc (2002) argue that décor and visual symbols, used to create an appropriate atmosphere within the servicescape, can influence a customer’s belief about whether a firm is trustworthy or untrustworthy, expensive or affordable (Bitner, 1992), and successful or unsuccessful (Nguyen and Leblanc, 2002). Use of visual images in qualitative research Elements of the physical environment can be described in words, but also visualized. The use of visual imagery in qualitative research reveals information with a depth and richness beyond that available from text alone. Images can serve as a tool for understanding informants’ deep emotions and experiences that are not always easily articulated through words (Hunting & Conroy, 2011). Zaltman (1997) argues for the use of research methods that take into account the nature of thought production, which includes both verbal and non-verbal elements. The majority of human communication is non-verbal and people’s thoughts and emotions often occur unconsciously. Therefore, pictures can serve as entry points for concepts and associations stored in memory (Coulter and Zaltman, 1994).
The use of visual images in qualitative research can be divided into two categories. The first category contains research in which subjects are confronted with visual stimuli and are asked to react to those images by, for example, making a selection or talking about what they see. Here, visual images function as cues for storytelling (Donoghue, 2000) or cues for retrieving memories, as often used in clinical psychology. Research on brand image, product development and advertising (Chang & Huang, 2009; Coulter and Zaltman, 1994) often uses a second approach. Subjects are asked to produce visual stimuli, for example by taking pictures or creating collages (Chang and Huang, 2009; Hunting and Conroy, 2001). In the Zaltman Metaphor Elicitation Technique (ZMET), developed by Zaltman, respondents also choose their own images. Coulter and Zaltman (1994) argue that the participants’ control of the visual stimuli increases the likelihood of uncovering important customer issues not previously considered.
Analysing visual data Literature on the use of visual data collection describes techniques that use visual methods to elicit data rather than methods analysing these visual data (Gleeson, 2011). According to Braun and Clark (2006), thematic analysis is a method for identifying, analysing and reporting patterns (themes) within visual data. A theme captures an element in the data that is relevant for the research question. Braun and Clark (2006) distinguish two approaches to thematic analysis: inductive or ‘bottom up’ (Frith & Gleeson, 2004) and deductive or ‘top down’. An inductive approach means the themes identified are strongly linked to the data themselves, and they may have little relationship to the specific questions to the participants. Neither would they be driven by the researcher’s theoretical interest in the area or topic. Inductive analysis is therefore ‘a process of coding the data without trying to fit it into a pre-existing coding frame, or the
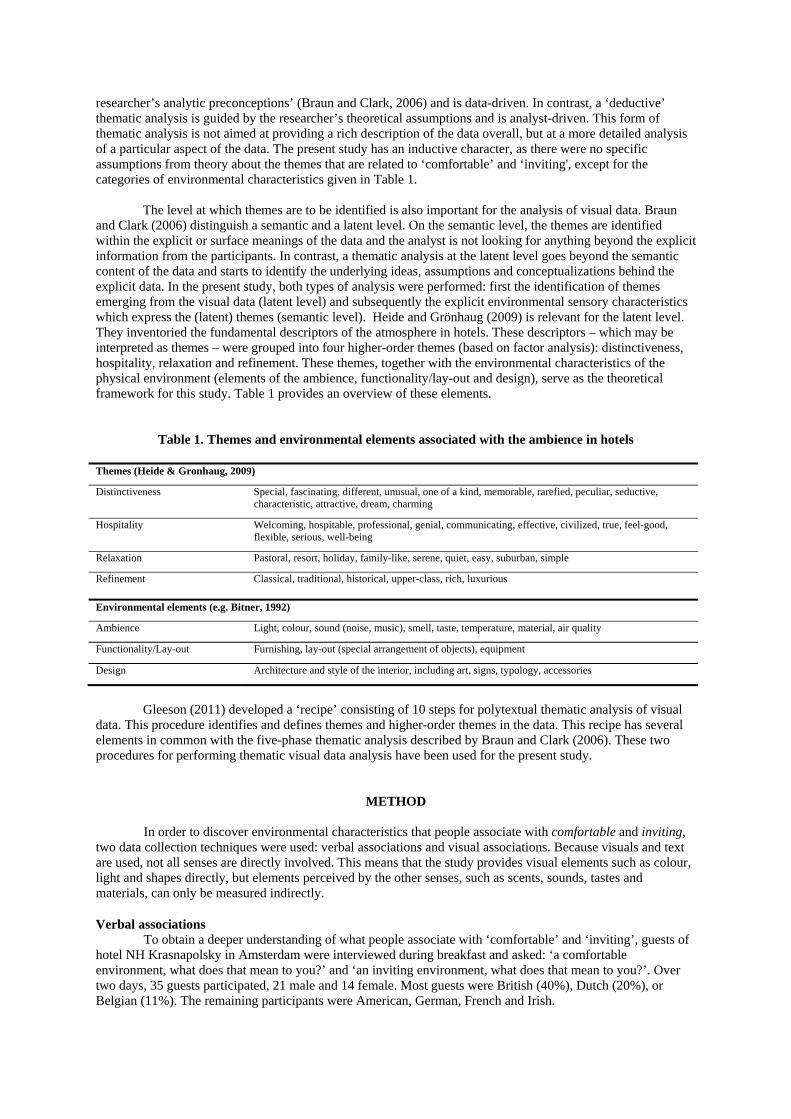
researcher’s analytic preconceptions’ (Braun and Clark, 2006) and is data-driven. In contrast, a ‘deductive’ thematic analysis is guided by the researcher’s theoretical assumptions and is analyst-driven. This form of thematic analysis is not aimed at providing a rich description of the data overall, but at a more detailed analysis of a particular aspect of the data. The present study has an inductive character, as there were no specific assumptions from theory about the themes that are related to ‘comfortable’ and ‘inviting', except for the categories of environmental characteristics given in Table 1.
The level at which themes are to be identified is also important for the analysis of visual data. Braun and Clark (2006) distinguish a semantic and a latent level. On the semantic level, the themes are identified within the explicit or surface meanings of the data and the analyst is not looking for anything beyond the explicit information from the participants. In contrast, a thematic analysis at the latent level goes beyond the semantic content of the data and starts to identify the underlying ideas, assumptions and conceptualizations behind the explicit data. In the present study, both types of analysis were performed: first the identification of themes emerging from the visual data (latent level) and subsequently the explicit environmental sensory characteristics which express the (latent) themes (semantic level). Heide and Grönhaug (2009) is relevant for the latent level. They inventoried the fundamental descriptors of the atmosphere in hotels. These descriptors – which may be interpreted as themes – were grouped into four higher-order themes (based on factor analysis): distinctiveness, hospitality, relaxation and refinement. These themes, together with the environmental characteristics of the physical environment (elements of the ambience, functionality/lay-out and design), serve as the theoretical framework for this study. Table 1 provides an overview of these elements.
Table 1. Themes and environmental elements associated with the ambience in hotels
Themes (Heide & Gronhaug, 2009)
Distinctiveness Special, fascinating, different, unusual, one of a kind, memorable, rarefied, peculiar, seductive, characteristic, attractive, dream, charming
Hospitality Welcoming, hospitable, professional, genial, communicating, effective, civilized, true, feel-good, flexible, serious, well-being
Relaxation Pastoral, resort, holiday, family-like, serene, quiet, easy, suburban, simple
Refinement Classical, traditional, historical, upper-class, rich, luxurious
Environmental elements (e.g. Bitner, 1992)
Ambience Light, colour, sound (noise, music), smell, taste, temperature, material, air quality
Functionality/Lay-out Furnishing, lay-out (special arrangement of objects), equipment
Design Architecture and style of the interior, including art, signs, typology, accessories
Gleeson (2011) developed a ‘recipe’ consisting of 10 steps for polytextual thematic analysis of visual
data. This procedure identifies and defines themes and higher-order themes in the data. This recipe has several elements in common with the five-phase thematic analysis described by Braun and Clark (2006). These two procedures for performing thematic visual data analysis have been used for the present study.
METHOD
In order to discover environmental characteristics that people associate with comfortable and inviting, two data collection techniques were used: verbal associations and visual associations. Because visuals and text are used, not all senses are directly involved. This means that the study provides visual elements such as colour, light and shapes directly, but elements perceived by the other senses, such as scents, sounds, tastes and materials, can only be measured indirectly.
Verbal associations To obtain a deeper understanding of what people associate with ‘comfortable’ and ‘inviting’, guests of hotel NH Krasnapolsky in Amsterdam were interviewed during breakfast and asked: ‘a comfortable environment, what does that mean to you?’ and ‘an inviting environment, what does that mean to you?’. Over two days, 35 guests participated, 21 male and 14 female. Most guests were British (40%), Dutch (20%), or Belgian (11%). The remaining participants were American, German, French and Irish.
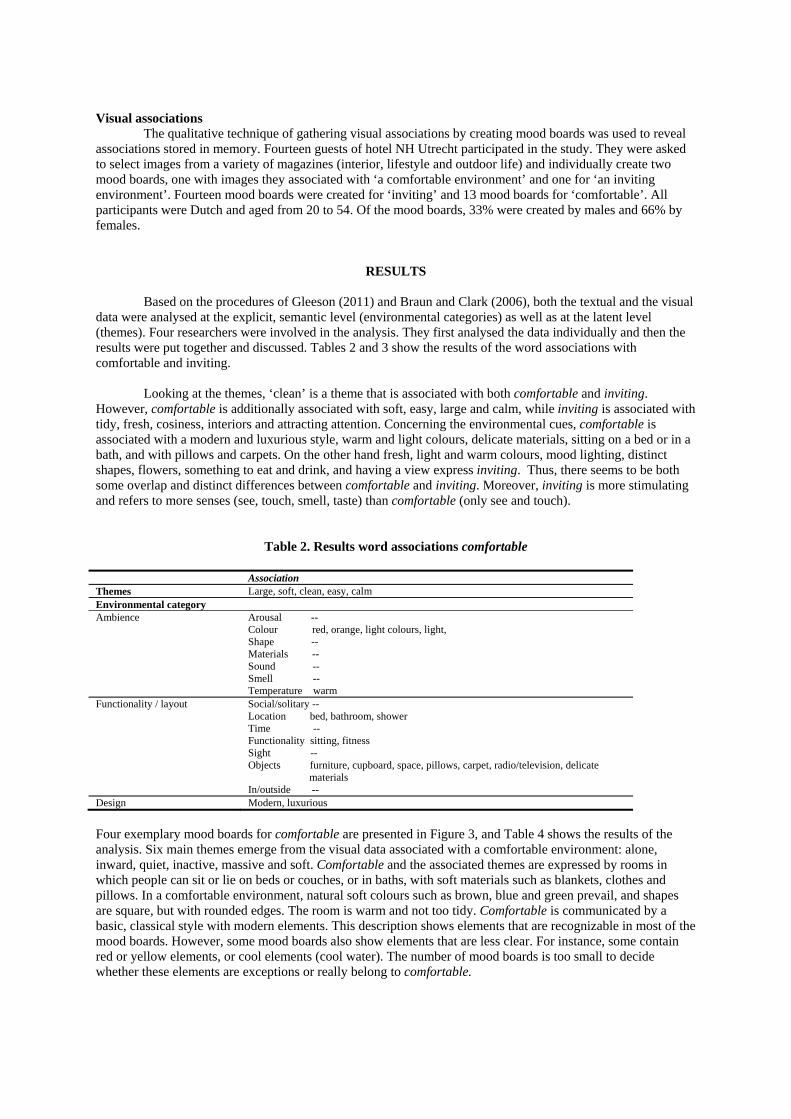
Visual associations The qualitative technique of gathering visual associations by creating mood boards was used to reveal associations stored in memory. Fourteen guests of hotel NH Utrecht participated in the study. They were asked to select images from a variety of magazines (interior, lifestyle and outdoor life) and individually create two mood boards, one with images they associated with ‘a comfortable environment’ and one for ‘an inviting environment’. Fourteen mood boards were created for ‘inviting’ and 13 mood boards for ‘comfortable’. All participants were Dutch and aged from 20 to 54. Of the mood boards, 33% were created by males and 66% by females.
RESULTS
Based on the procedures of Gleeson (2011) and Braun and Clark (2006), both the textual and the visual data were analysed at the explicit, semantic level (environmental categories) as well as at the latent level (themes). Four researchers were involved in the analysis. They first analysed the data individually and then the results were put together and discussed. Tables 2 and 3 show the results of the word associations with comfortable and inviting. Looking at the themes, ‘clean’ is a theme that is associated with both comfortable and inviting. However, comfortable is additionally associated with soft, easy, large and calm, while inviting is associated with tidy, fresh, cosiness, interiors and attracting attention. Concerning the environmental cues, comfortable is associated with a modern and luxurious style, warm and light colours, delicate materials, sitting on a bed or in a bath, and with pillows and carpets. On the other hand fresh, light and warm colours, mood lighting, distinct shapes, flowers, something to eat and drink, and having a view express inviting. Thus, there seems to be both some overlap and distinct differences between comfortable and inviting. Moreover, inviting is more stimulating and refers to more senses (see, touch, smell, taste) than comfortable (only see and touch).
Table 2. Results word associations comfortable
Association Themes Large, soft, clean, easy, calm Environmental category Ambience Arousal --
Colour red, orange, light colours, light, Shape -- Materials -- Sound -- Smell -- Temperature warm
Functionality / layout Social/solitary -- Location bed, bathroom, shower Time -- Functionality sitting, fitness Sight -- Objects furniture, cupboard, space, pillows, carpet, radio/television, delicate materials In/outside --
Design Modern, luxurious
Four exemplary mood boards for comfortable are presented in Figure 3, and Table 4 shows the results of the analysis. Six main themes emerge from the visual data associated with a comfortable environment: alone, inward, quiet, inactive, massive and soft. Comfortable and the associated themes are expressed by rooms in which people can sit or lie on beds or couches, or in baths, with soft materials such as blankets, clothes and pillows. In a comfortable environment, natural soft colours such as brown, blue and green prevail, and shapes are square, but with rounded edges. The room is warm and not too tidy. Comfortable is communicated by a basic, classical style with modern elements. This description shows elements that are recognizable in most of the mood boards. However, some mood boards also show elements that are less clear. For instance, some contain red or yellow elements, or cool elements (cool water). The number of mood boards is too small to decide whether these elements are exceptions or really belong to comfortable.
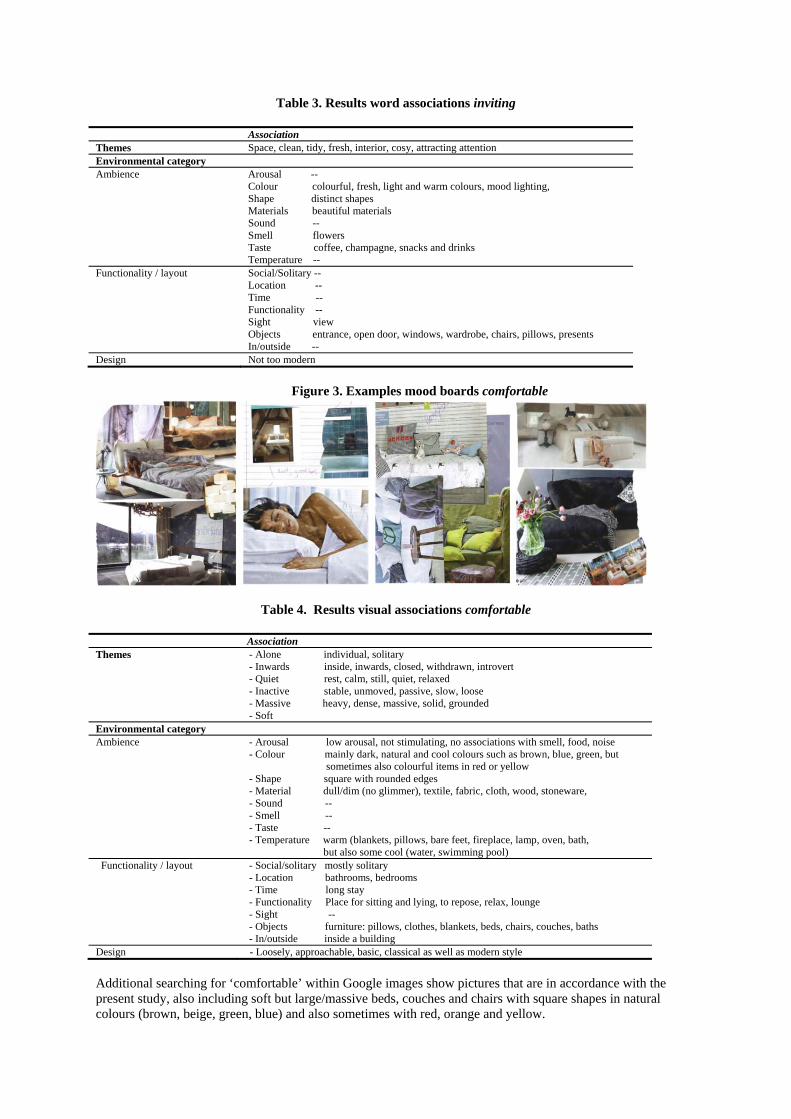
Table 3. Results word associations inviting
Association Themes Space, clean, tidy, fresh, interior, cosy, attracting attention Environmental category Ambience Arousal --
Colour colourful, fresh, light and warm colours, mood lighting, Shape distinct shapes Materials beautiful materials Sound -- Smell flowers Taste coffee, champagne, snacks and drinks Temperature --
Functionality / layout Social/Solitary -- Location -- Time -- Functionality -- Sight view Objects entrance, open door, windows, wardrobe, chairs, pillows, presents In/outside --
Design Not too modern
Figure 3. Examples mood boards comfortable
Table 4. Results visual associations comfortable
Association Themes - Alone individual, solitary
- Inwards inside, inwards, closed, withdrawn, introvert - Quiet rest, calm, still, quiet, relaxed - Inactive stable, unmoved, passive, slow, loose - Massive heavy, dense, massive, solid, grounded - Soft
Environmental category Ambience - Arousal low arousal, not stimulating, no associations with smell, food, noise
- Colour mainly dark, natural and cool colours such as brown, blue, green, but sometimes also colourful items in red or yellow - Shape square with rounded edges - Material dull/dim (no glimmer), textile, fabric, cloth, wood, stoneware, - Sound -- - Smell -- - Taste -- - Temperature warm (blankets, pillows, bare feet, fireplace, lamp, oven, bath, but also some cool (water, swimming pool)
Functionality / layout - Social/solitary mostly solitary - Location bathrooms, bedrooms - Time long stay - Functionality Place for sitting and lying, to repose, relax, lounge - Sight -- - Objects furniture: pillows, clothes, blankets, beds, chairs, couches, baths - In/outside inside a building
Design - Loosely, approachable, basic, classical as well as modern style
Additional searching for ‘comfortable’ within Google images show pictures that are in accordance with the present study, also including soft but large/massive beds, couches and chairs with square shapes in natural colours (brown, beige, green, blue) and also sometimes with red, orange and yellow.
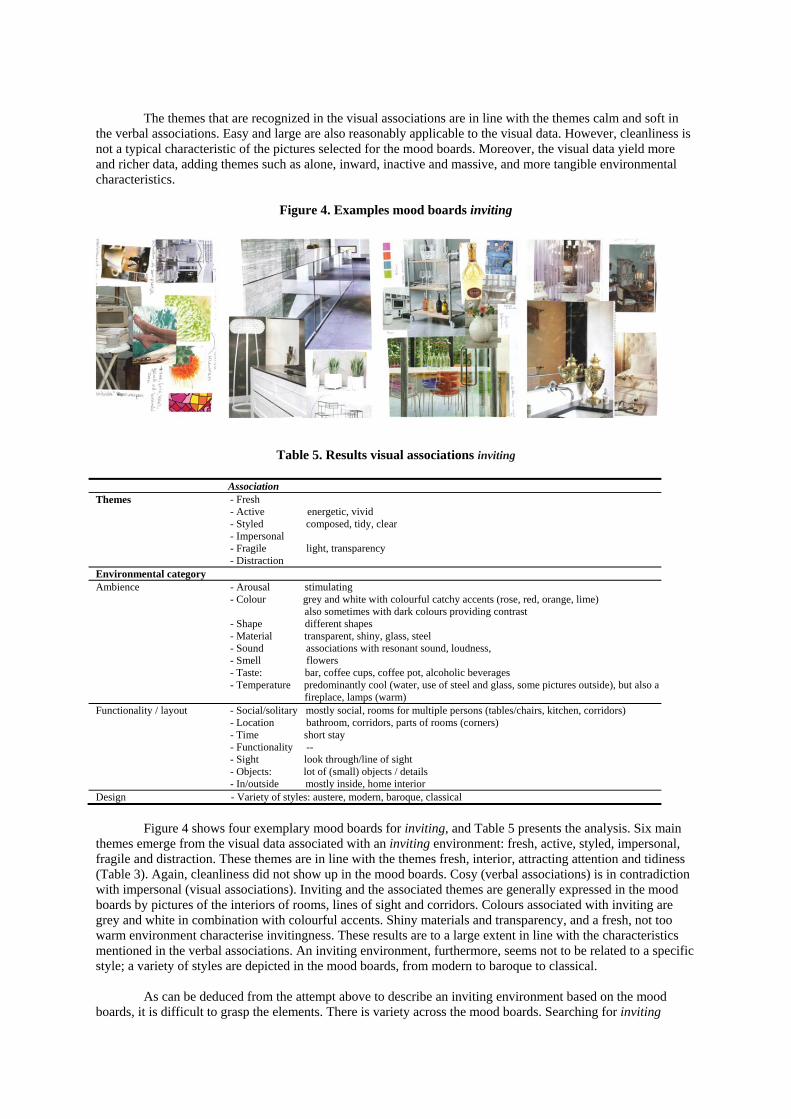
The themes that are recognized in the visual associations are in line with the themes calm and soft in the verbal associations. Easy and large are also reasonably applicable to the visual data. However, cleanliness is not a typical characteristic of the pictures selected for the mood boards. Moreover, the visual data yield more and richer data, adding themes such as alone, inward, inactive and massive, and more tangible environmental characteristics.
Figure 4. Examples mood boards inviting
Table 5. Results visual associations inviting
Association Themes - Fresh
- Active energetic, vivid - Styled composed, tidy, clear - Impersonal - Fragile light, transparency - Distraction
Environmental category Ambience - Arousal stimulating
- Colour grey and white with colourful catchy accents (rose, red, orange, lime) also sometimes with dark colours providing contrast - Shape different shapes - Material transparent, shiny, glass, steel - Sound associations with resonant sound, loudness, - Smell flowers - Taste: bar, coffee cups, coffee pot, alcoholic beverages - Temperature predominantly cool (water, use of steel and glass, some pictures outside), but also a fireplace, lamps (warm)
Functionality / layout - Social/solitary mostly social, rooms for multiple persons (tables/chairs, kitchen, corridors) - Location bathroom, corridors, parts of rooms (corners) - Time short stay - Functionality -- - Sight look through/line of sight - Objects: lot of (small) objects / details - In/outside mostly inside, home interior
Design - Variety of styles: austere, modern, baroque, classical
Figure 4 shows four exemplary mood boards for inviting, and Table 5 presents the analysis. Six main themes emerge from the visual data associated with an inviting environment: fresh, active, styled, impersonal, fragile and distraction. These themes are in line with the themes fresh, interior, attracting attention and tidiness (Table 3). Again, cleanliness did not show up in the mood boards. Cosy (verbal associations) is in contradiction with impersonal (visual associations). Inviting and the associated themes are generally expressed in the mood boards by pictures of the interiors of rooms, lines of sight and corridors. Colours associated with inviting are grey and white in combination with colourful accents. Shiny materials and transparency, and a fresh, not too warm environment characterise invitingness. These results are to a large extent in line with the characteristics mentioned in the verbal associations. An inviting environment, furthermore, seems not to be related to a specific style; a variety of styles are depicted in the mood boards, from modern to baroque to classical. As can be deduced from the attempt above to describe an inviting environment based on the mood boards, it is difficult to grasp the elements. There is variety across the mood boards. Searching for inviting
within Google images shows pictures of places indoors but also outdoor locations (i.e. holiday destinations) and many images of people spreading their arms and people with flirtatious looks (mostly women). Thus, people seem to play a significant role in the case of inviting. It seems to be much harder to design an inviting environment compared to a comfortable environment, since comfortable is probably indeed associated with the physical environment, while for inviting the appearance and behaviour of people may play a considerable role.
CONCLUSION AND DISCUSSION
The present study provides insight into what constitutes a comfortable and an inviting environment, as well as insight into using visual data in investigating guest experience. Comfortable is associated with themes such as alone, inward, quiet, inactive, massive, large and soft. These themes refer to a large extent to the element ‘relaxation’, one of the four elements of the ambience in hotels as defined by Heide and Grönhaug (2009). A comfortable environment can be expressed by tangible elements in the (hotel) environment such as bed(room)s, bath(room)s, couches, soft materials including carpets, blankets and pillows, natural soft colours such as brown, blue and green, and square shapes with rounded edges. Furthermore, basic or classical styles with modern elements cause an environment to be experienced as comfortable. Inviting is associated with themes such as fresh, active, styled, fragile and attracting attention. An inviting environment can be expressed by tangible elements in the (hotel) environment such as lines of sight, corridor details in rooms, where people can meet each other and have a bite or a drink, grey and white in combination with colourful accents, shiny materials such as glass and steel, and a fresh, not too warm environment. An inviting environment is difficult to describe and to visualise: the responses and mood boards do not show a consistent representation of inviting. The appearance and behaviour of people is most probably an essential element for an inviting ambience. However, the human component was not included in this study, and this may explain the variety of images on the mood boards. Further research on ‘inviting’ should include the characteristics of people’s appearance and behaviour. Pictures found through Google images support this idea, since people are present on a large proportion of the images. The themes related to inviting are related to the element ‘distinctiveness’, as defined by Heide and Grönhaug (2009). The overlap can be expected to become even larger when the human component is added. The characteristics associated with comfortable and inviting are based on the verbal associations of 35 hotel guests and 27 mood boards. Further research, yielding more data, is necessary to confirm the outcome of the present exploratory study and further investigate the variability in characteristics. A larger number of mood boards will show whether these characteristics are exceptions or really belong to comfortable. A comparison of the results of the visual associations with those for the mood boards shows that the latter indeed deliver more in-depth and richer information, in accordance with Hunting & Conroy (2011), among others. Mood boards appeal to more sensory channels, provide more associations, and elicit more tangible elements and deeper information regarding the themes, despite the fact that the choice of images was limited to those in the magazines that were provided for the mood boards. These limitations may be overcome by asking participants to supply photographs of situations or places that they associate with inviting or comfortable. Even so, the verbal and the visual associations turned out to be complementary. This suggests that multiple methods for data collection should be used, preferably including additional methods using sound, touch, taste and smell. Finally, in the present study the researchers analysed/interpreted the mood boards, while in the next phase the participants will be asked, prior to the analysis, to explain why they selected particular pictures.
RELEVANCE FOR PRACTICE How does the outcome of this study help hotels in directing the experience of their guests? The results of the Experience Scan performed in phase one of the project on guest experience in hotels showed that the comfort of the hotel room and an inviting ambience ranked highest for guest loyalty. However, to increase guest loyalty by making the ambience more inviting and the hotel room more comfortable, we need a greater understanding of the tangible elements that make people perceive an environment as comfortable and/or inviting.
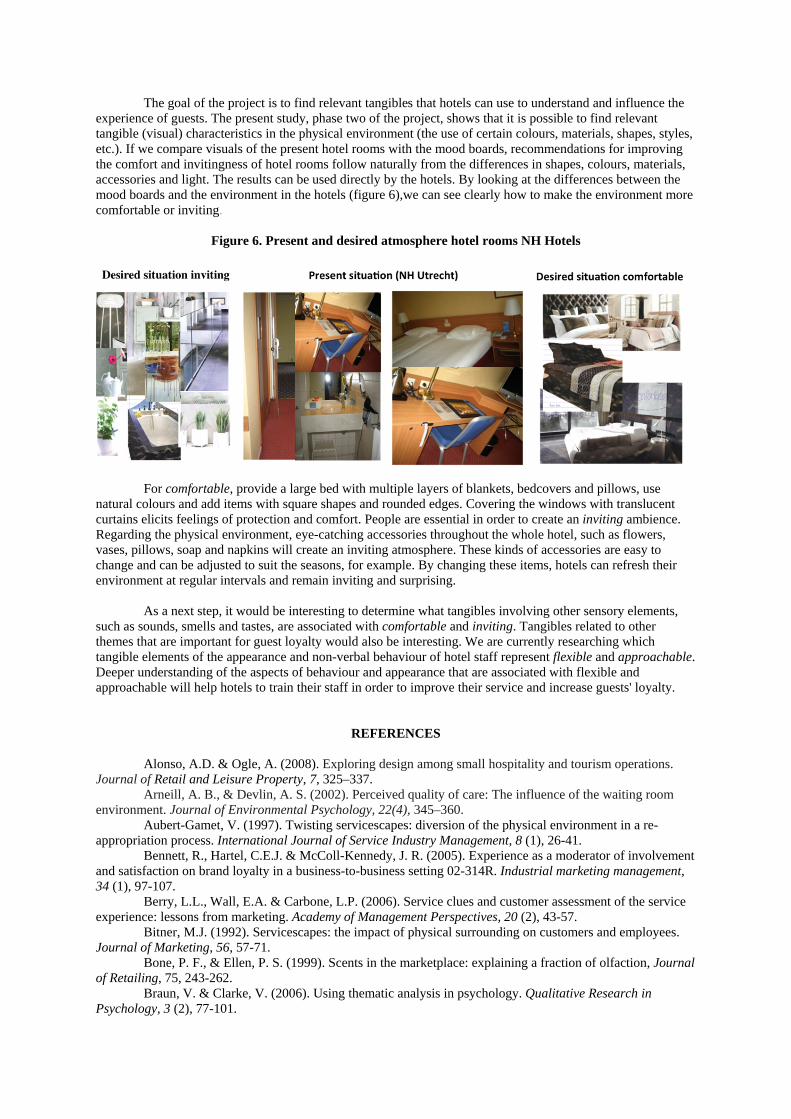
The goal of the project is to find relevant tangibles that hotels can use to understand and influence the experience of guests. The present study, phase two of the project, shows that it is possible to find relevant tangible (visual) characteristics in the physical environment (the use of certain colours, materials, shapes, styles, etc.). If we compare visuals of the present hotel rooms with the mood boards, recommendations for improving the comfort and invitingness of hotel rooms follow naturally from the differences in shapes, colours, materials, accessories and light. The results can be used directly by the hotels. By looking at the differences between the mood boards and the environment in the hotels (figure 6),we can see clearly how to make the environment more comfortable or inviting.
Figure 6. Present and desired atmosphere hotel rooms NH Hotels
For comfortable, provide a large bed with multiple layers of blankets, bedcovers and pillows, use natural colours and add items with square shapes and rounded edges. Covering the windows with translucent curtains elicits feelings of protection and comfort. People are essential in order to create an inviting ambience. Regarding the physical environment, eye-catching accessories throughout the whole hotel, such as flowers, vases, pillows, soap and napkins will create an inviting atmosphere. These kinds of accessories are easy to change and can be adjusted to suit the seasons, for example. By changing these items, hotels can refresh their environment at regular intervals and remain inviting and surprising. As a next step, it would be interesting to determine what tangibles involving other sensory elements, such as sounds, smells and tastes, are associated with comfortable and inviting. Tangibles related to other themes that are important for guest loyalty would also be interesting. We are currently researching which tangible elements of the appearance and non-verbal behaviour of hotel staff represent flexible and approachable. Deeper understanding of the aspects of behaviour and appearance that are associated with flexible and approachable will help hotels to train their staff in order to improve their service and increase guests' loyalty.
REFERENCES
Alonso, A.D. & Ogle, A. (2008). Exploring design among small hospitality and tourism operations. Journal of Retail and Leisure Property, 7, 325–337. Arneill, A. B., & Devlin, A. S. (2002). Perceived quality of care: The influence of the waiting room environment. Journal of Environmental Psychology, 22(4), 345–360. Aubert-Gamet, V. (1997). Twisting servicescapes: diversion of the physical environment in a re-appropriation process. International Journal of Service Industry Management, 8 (1), 26-41.
Bennett, R., Hartel, C.E.J. & McColl-Kennedy, J. R. (2005). Experience as a moderator of involvement and satisfaction on brand loyalty in a business-to-business setting 02-314R. Industrial marketing management, 34 (1), 97-107.
Berry, L.L., Wall, E.A. & Carbone, L.P. (2006). Service clues and customer assessment of the service experience: lessons from marketing. Academy of Management Perspectives, 20 (2), 43-57.
Bitner, M.J. (1992). Servicescapes: the impact of physical surrounding on customers and employees. Journal of Marketing, 56, 57-71.
Bone, P. F., & Ellen, P. S. (1999). Scents in the marketplace: explaining a fraction of olfaction, Journal of Retailing, 75, 243-262.
Braun, V. & Clarke, V. (2006). Using thematic analysis in psychology. Qualitative Research in Psychology, 3 (2), 77-101.
Brunner-Sperdin, A. & Peters, M. (2009). What influences guests’ emotions? The case of high quality hotels. International Journal of Tourism Research, 11, 171-183.
Chang, T.Y. & Huang, K.L. (2009). The intrinsic value of emotional probes. Paper presented at IASDR 2009, 18-22 October, Seoul.
Chebat, J.C. & Morrin, M. (2007). Colors and cultures: exploring the effects of mall décor on consumer perceptions. Journal of Business Research, 60 (3), 189-196.
Coulter, R.H. & Zaltman, G. (1994). Using the Zaltman metaphor elicitation technique to understand brand images. Advances in Consumer Research, 21, 501-507.
Donoghue, S. (2000). Projective techniques in consumer research. Journal of Family Ecology and consumer sciences, 28, 47-53.
Frith, H., & Gleeson, K. (2004). Clothing and embodiment: Men managing body image and appearance. Psychology of Men and Masculinity, 5(1), 40-48.
Gleeson, K. (2011). Polytextual thematic analysis for visual data - pinning down the Analytic. In: Reavy, R. (ed), Visual methods in Psychology, (pp. 314-329). New York, Psychology Press.
Harris, L.C. & Ezeh, C. (2008). Servicescape and loyalty intentions: an empirical investigation. European Journal of Marketing, 42 (3), 390-422.
Heide, M. & Gronhaug, K. (2009). Key factors in guests’ perception of hotel atmosphere. Cornell Hospitality Quarterly, 50 (1), 29-43.
Heide, M., Lærdal, K. & Gronhaug, K. (2007). The design and management of ambiance – implications for hotel architecture and service. Tourism Management, 28, 1315-1325.
Hunting, M. & Conroy, D. (2011). The Visual Component: Use of Images to Enhance Multimodal Research. Paper presented at ANZMAC 2011, 28-30 November, Perth.
Jeong, E.H. & Jang, S.C. (2010). Restaurant experiences triggering positive electronic word-of-mouth (eWOM) motivations. International Journal of Hospitality Management, 29, 356-366.
Kaya, N. & Erkip, F. (1999). Invasion of personal space under the condition of short-term crowding: a case study on an automatic teller machine. Journal of Environmental Psychology 19 (2), 183-189.
Kim, W. & Moon, Y. (2009). Customers’ cognitive, emotional, and actionable response to the servicescape: a test of the moderating effect of the restaurant type. International Journal of Hospitality Management, 28 (1), 144 -156.
Kearney, T., Kennedy, A. & Coughlan, J. (2007). Servicescapes: a review of contemporary empirical research. Paper presented at Sixteenth Annual Frontiers in Service Conference, San Francisco, 2007.
Liu, Y. & Jang, S.S. (2009). The effects of dining atmospherics: an extended Mehrabian-Russel model. International Journal of Hospitality Management, 28, 494-503.
Mattila, A.S, & Wirtz, J. (2001). Congruency of scent and music as a driver of in-store evaluations and behaviour. Journal of Retailing, 77, 273-89.
Mehrabian A. & Russell J. A. (1974). An approach to environmental psychology. Cambridge: MIT Press.
Mei, A. W. O., Dean, A. M., & White, C. J. (1999). Analysing service quality in the hospitality industry. Managing Service Quality, 9(2), 136-143.
Milliman, R.E. (1986). The influence of background music on the behaviour of restaurant patrons. Journal of Consumer Research, 13, 286-289.
Nguyen, N. & Leblanc, G. (2002). Contact personnel, physical environment and the perceived corporate image of intangible services by new clients. International Journal of Service Industry Management, 13, 242-62.
Pijls, R., Schreiber, G.H. & Van Marle, R.S.F. (2011). Capturing the guest experience in hotels. Phase one: theoretical background and development of the Guest Experience Scan. Paper presented at EuroCHRIE, Dubrovnik, 19-22 0ctobre 2011.
Ryu, K. & Han, H. (2010). Influence of Physical Environment on Disconfirmation, Customer Satisfaction, and Customer Loyalty for First-time and Repeat Customers in Upscale Restaurants. Paper presented at ICHRIE, Massachusetts, 28-30 July 2010.
Slåtten , A.T. & Mehmetoglu, M. (2010). Atmospheric experiences that emotionally touch customers. A case study from a winterpark. Managing Service Quality, 19, 721-727.
Spangenberg, E., Grohmann, B. & Sprott, D. (2005). It’s beginning to smell and (sound) a lot like Christmas: the interactive effects of ambient scent and music in a retail setting. Journal of Business Research, 58, 1583-1589.
Summers, A.T. & Hebert, P.R. (2001). Shedding some light on store atmospherics. Influence of illumination on consumer behaviour. Journal of Business Research, 54, 145-150.
Zaltman, G. (1997). Rethinking Market Research: Putting People Back In. Journal of Marketing Research, 34, 424-437.
EFFECT ON PRICES OF THE ATTRIBUTES OF THE SAILING BOATS: A HEDONIC PRICES
APPROACH
Neven Sipic Zagreb School of Business
Zagreb, Croatia email: [email protected]
ABSTRACT
This article examines the effect on price of different characteristics of sailing boats in the nautical segment of travel and tourism industry. The effect on price is estimated under the hedonic function by means of ordinary least squares model (OLS), as the data used in study are cross-sectional. Some 10,791 prices were gathered from approximately 400 sailboats from adriatica.net, a largest web based site for renting travel/tourism products in Croatia. The study reveals huge price differences between sail boats of different sizes, coupled with practically no difference between boats of same size but different brand. Other attributes with a significant effect on price are season, number of rental days, ship length, number of cabins, year of production, skipper, and number of persons. The resulting equation can assist charter companies in shaping inflation-proof pricing and investment strategies.
Keywords: pricing; hedonic functions; sailboats; ordinary least squares model; Croatia.
INTRODUCTION
The purpose of this study is to examine the determinants of sailboat rental prices. The practical significance of research lies in its potential to aid in developing a model for determining rental prices of nautical tourism products in Croatia. This possible model would be useful to charter rental agencies, travel agencies, governmental and tourism institutions, as well as other interested investors. There are many ways to go about determining rental price for a sailing boat. However, it is essential to produce a mathematical formula that will provide an easy way of determining sailboat rental prices. This will help charter companies determine a practical and competitive price. Building on the research of price determination in the real estate industry which used hedonic pricing model, the study involved the collection, compilation, and analysis of contemporary data on sailing boat attributes, characteristics, specifications, and prices in the scope of adriatica.net website database. The research includes collection and analysis of quantitative data from the above-mentioned web site. The crux of this research lies in the extensive collection of raw data that will help to determine the variables, variations in pricing model, averages, and regressions using the hedonic pricing model. The results and findings will be discussed using descriptive and inferential statistics. The challenge of price determination concerns those in the academic world, as well as those in business sphere. Academia proposes how it should be determined, and offers solutions (i.e. means of doing it), businesses can use it and benefit from its application. Since there has been very little research on this topic, professionals in the industry are not accustomed in using and implementing research results. This and other quantitative research may help businesses develop future plans, through more accurate predictions, measurements and the simplification of otherwise complex material. This study is significant for multiple reasons. Its initial practical use is in aiding charter companies in determining their sailing boat rental prices. Moreover, it offers a theoretical way for solving practical problems facing businesses, charter companies, tourist agencies, and the government. This could be a great tool for those companies wishing to better manage their prices, and to re-evaluate their current pricing systems and databases (or lack of). This research and the proposed results should provide a model for companies to determine if they are over pricing or under pricing. Such information can help companies become a competitive player in this growing industry. By having a mathematical formula that would easily show a price for renting a boat, charter companies could increase their efficiencies, and become a price leader by having comparative and competitive advantage over the others. These are some of the ways Croatian charter companies can battle the increasing surge of foreign companies trying to capitalize on this fast growing market. Even banks have started giving away “easy-to-pay” loans to ones wanting to become ship owners realizing it is a win-win position for both parties (based on the previous data which show a huge growth in both profits and number of yachtsmen entrepreneurs).
LITERATURE REVIEW
Studies Using Hedonic Model One of the most extensively used models in real estate research has been the hedonic model. Despite significant simplifications in the assumptions the model has proven to be empirically viable, especially in examination of the relationship between the property values and preferences for its different attributes. Specifically, the value or price of the property is defined as a function of the bundle of its attributes. The model’s methods have long been used in research, before Court (1939) formally proposed the name hedonic in his seminal paper on price indexes in automobile studies. Stemming from the Greek word hedonikos, the name relates to the derivation of utility from consumption of goods and services. The theoretical and statistical foundations of hedonic price theory are found in the works of Lancaster (1966), Rosen (1974), and Feenstra (1995). The early hedonic literature focuses on the explanations of the attribute or characteristic price. One understanding of it, proposed by Court (1939), views the attribute price as consumer’s willingness to pay for the attribute. Lancaster (1966) expanded on this by “…breaking away from the traditional approach that goods are the direct objects of utility and, instead, supposing that it is the properties or characteristics of the goods from which the utility is derived”. Furthermore, Lancaster’s theory goes to say that goods are arranged in groups based on their attributes and that in the group they are consumed in various combinations. Rosen (1974) altered Lancaster’s approach and assumed that goods within a group are consumed discretely. In other words, consumers do not maximize their utility by purchasing a bundle of goods with desired characteristics, but by consuming one that has the most desirable combination of them. Rosen assumed a non-linear relationship between price of a good and its attributes, while Lancaster saw this relationship as linear. The differences between Lancaster’s and Rosen’s approaches are not mutually exclusive as they seem to apply to different types of goods. Lancaster’s
theory best applies to non-durable goods, while Rosen’s applies to durable goods.
Studies on Price Determinants in the Tourism Industry Research on sailing boat rental price determinants has so far been non-existent. The most extensive research done on price determinants using hedonic model, as stated before, is in the real estate industry (especially research on price determinants in housing). However, there is a recent trend of using hedonic model in tourism research. The following is the body of knowledge in tourism research on hedonic price models: The influence of dependent variables on hotel room prices (Coenders, Espinet, and Saez 2003; Israeli 2002; Monty and Skidmore 2003; White and Mulligan 2002), inclusive tour or package tour prices (Aguilo, Alegre, and Riera 2001; Aguilo, Alegre, and Sard 2003; Clewer, Pack, and Sinclair 1992; Espinet et al. 2003; Papatheodorou 2002; Sinclair, Clewer, and Pack 1990; Taylor 1995), restaurant prices (Gunawardana and Havrila 1996), and airfare prices (Schwieterman 1995). The most significant article that inspired this study is the one by Coenders, Espinet, and Saez (2003). As mentioned above, the biggest influence for this study was Coenders, Espinet, and Saez (2003) article “Effect on prices of the attributes of holiday hotels: a hedonic prices approach." Unlike the combination of time series and cross-sectional modeling (used in that study), which is random effects method (mixed modeling or panel modeling), this study introduces cross-sectional modeling by using ordinary least squares method (OLS), specifically log linear model. The real difference is that Coenders, Espinet, and Saez are using data based on information on the months from May to October for a time period from1991 to 1998. On the other hand, the data used in this study is for the month of July (two dimensions opposed to one). The results found by both of the studies are similar. One of the most relevant characteristics of a sailing boat in determining price is its length; likewise, Coenders, Espinet, and Saez found the most relevant characteristics of a hotel to price is star category. That article has identified some important variables that affect the price paid by tourists in the sun-and-beach segment, for which the major motivations of tourists are basically the same worldwide. Such results were found in this study where important variables affect the price paid by tourists in nautical tourism, specifically sailing boat rental. The previously mentioned study also found that many of the hotel room characteristics have no significance in explaining the price, and the difference between prices. This study also showed that the majority of boat characteristics are irrelevant for price determination. However, a few significant ones provided a healthy model which explains a lot of functions, even correlation between the attributes. Another informative article on the matter is a study done on Norwegian sun-and-beach package tours by Christer Thrane. Thrane followed the work of Espinet and provided a research similar to his. The researcher used two regression models to show the difference between a model without hotel star rating variable, and model with the hotel star rating variable.
METHODOLOGY
Theory For this study, Hedonic regression, or more generally hedonic theory, is used. It is a method of estimating demand or prices in economics. It decomposes the item being researched into its constituent characteristics, and obtains estimates of the value of each characteristic. Essentially, it assumes a separate market for each attribute. One of the ways for estimating it is by using ordinary least squares (OLS) regression analysis. Usually, a dummy variable (an attribute vector) is assigned to each attribute or group of attributes. Each characteristic within a vector is either included in the regression or not, by multiplying it by either 1 or 0. In nautical tourism, it is used to adjust for the problems associated with studying a good that is as heterogeneous as a sailing boat. Because sailing boats are different, it is difficult to estimate the demand for them generically. Instead, it is assumed that a boat can be broken down into characteristics such as number of cabins, or number of beds. In this study, different characteristics specific to sailing boats were used. A hedonic regression equation treats these attributes (or bundles of attributes) separately, and estimates prices (in the case of an additive model) or elasticity (in the case of a log model) for each of them. This information can be used to construct a price index that can be used to compare the rental price of sailboats in different cities, regions and countries, or to do time series analysis. As with Consumer Price Index (CPI) calculations, hedonic pricing can be used to correct for quality changes in constructing a sailing boat price index. It can also be used to analyze the demand for various sailboat characteristics, and sailboat demand in general. The Hedonic model may be estimated using ordinary least squares (OLS) regression analysis, which is used for the purpose of this study. Least squares or ordinary least squares (OLS) regression analysis is a mathematical optimization technique which, when given a series of measured data, attempts to find a function which closely approximates the data (a "best fit"). It attempts to minimize the sum of the squares of the ordinate differences (called residuals) between points generated by the function and corresponding points in the data.) The formulas essential to this study are theoretical (a.), statistical (econometrical) (b.), and practical (c.).
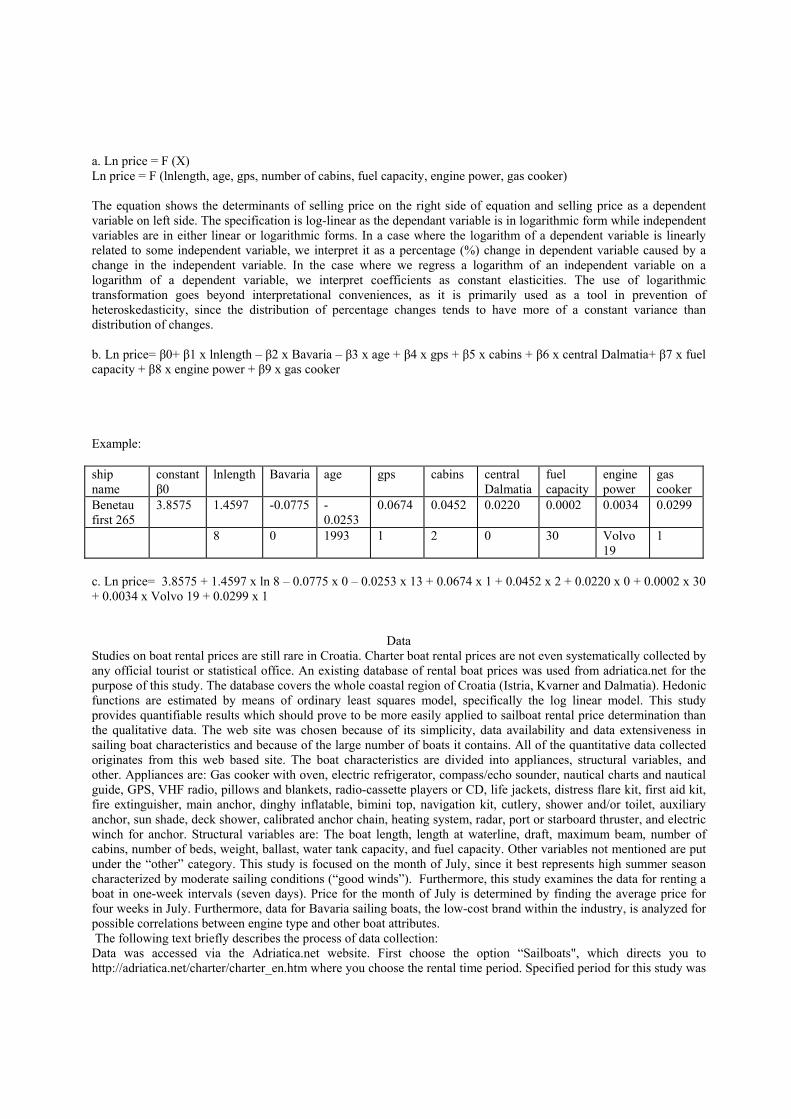
a. Ln price = F (X) Ln price = F (lnlength, age, gps, number of cabins, fuel capacity, engine power, gas cooker) The equation shows the determinants of selling price on the right side of equation and selling price as a dependent variable on left side. The specification is log-linear as the dependant variable is in logarithmic form while independent variables are in either linear or logarithmic forms. In a case where the logarithm of a dependent variable is linearly related to some independent variable, we interpret it as a percentage (%) change in dependent variable caused by a change in the independent variable. In the case where we regress a logarithm of an independent variable on a logarithm of a dependent variable, we interpret coefficients as constant elasticities. The use of logarithmic transformation goes beyond interpretational conveniences, as it is primarily used as a tool in prevention of heteroskedasticity, since the distribution of percentage changes tends to have more of a constant variance than distribution of changes. b. Ln price= β0+ β1 x lnlength – β2 x Bavaria – β3 x age + β4 x gps + β5 x cabins + β6 x central Dalmatia+ β7 x fuel capacity + β8 x engine power + β9 x gas cooker Example: ship name
constant β0
lnlength Bavaria age gps cabins central Dalmatia
fuel capacity
engine power
gas cooker
Benetau first 265
3.8575 1.4597 -0.0775 -0.0253
0.0674 0.0452 0.0220 0.0002 0.0034 0.0299
8 0 1993 1 2 0 30 Volvo 19
1
c. Ln price= 3.8575 + 1.4597 x ln 8 – 0.0775 x 0 – 0.0253 x 13 + 0.0674 x 1 + 0.0452 x 2 + 0.0220 x 0 + 0.0002 x 30 + 0.0034 x Volvo 19 + 0.0299 x 1
Data Studies on boat rental prices are still rare in Croatia. Charter boat rental prices are not even systematically collected by any official tourist or statistical office. An existing database of rental boat prices was used from adriatica.net for the purpose of this study. The database covers the whole coastal region of Croatia (Istria, Kvarner and Dalmatia). Hedonic functions are estimated by means of ordinary least squares model, specifically the log linear model. This study provides quantifiable results which should prove to be more easily applied to sailboat rental price determination than the qualitative data. The web site was chosen because of its simplicity, data availability and data extensiveness in sailing boat characteristics and because of the large number of boats it contains. All of the quantitative data collected originates from this web based site. The boat characteristics are divided into appliances, structural variables, and other. Appliances are: Gas cooker with oven, electric refrigerator, compass/echo sounder, nautical charts and nautical guide, GPS, VHF radio, pillows and blankets, radio-cassette players or CD, life jackets, distress flare kit, first aid kit, fire extinguisher, main anchor, dinghy inflatable, bimini top, navigation kit, cutlery, shower and/or toilet, auxiliary anchor, sun shade, deck shower, calibrated anchor chain, heating system, radar, port or starboard thruster, and electric winch for anchor. Structural variables are: The boat length, length at waterline, draft, maximum beam, number of cabins, number of beds, weight, ballast, water tank capacity, and fuel capacity. Other variables not mentioned are put under the “other” category. This study is focused on the month of July, since it best represents high summer season characterized by moderate sailing conditions (“good winds”). Furthermore, this study examines the data for renting a boat in one-week intervals (seven days). Price for the month of July is determined by finding the average price for four weeks in July. Furthermore, data for Bavaria sailing boats, the low-cost brand within the industry, is analyzed for possible correlations between engine type and other boat attributes. The following text briefly describes the process of data collection: Data was accessed via the Adriatica.net website. First choose the option “Sailboats", which directs you to http://adriatica.net/charter/charter_en.htm where you choose the rental time period. Specified period for this study was
from 1/6/2007 (Date of Departure) till 12/29/2006 (Date of Return), in order to get the listing of all the boats being available for rent in 2007. There are also several options one can choose to make the search more specific. However, to get the most data possible, the following options were selected before the search was conducted. “All sailboats” under boat type; number of persons is specified as “one," overall length as “not important," and “whole Adriatic” as region or port. When all those options were entered, the search was carried out. This listed 58 pages of sailboats each having 8 on average. The data range was approximately 464 sailboats. There were also a total of 56 boat characteristics.
EMPIRICAL ANALYSIS AND RESULTS Prior studies on hotel room price determinants and plain logic dictate that some attributes obviously explain a lot about the price (Coenders, Espinet, and Saez 2003; Israeli 2002; Monty and Skidmore 2003; White and Mulligan 2002). In those studies such characteristics were room size, number of beds, hotel location, etc. What is expected of this study is to show positive relations with the length of the sailboat, the number of cabins, the number of beds, the year in which it was made, the sailboat brand, etc. Analysis The following explains what was expected of each boat attribute prior to the analysis of the data and the collection of the results: 1 Industry recognizes certain brands as market leaders in price, others in luxury, design, and some in the functionality they serve (i.e. regatta sailboats made for races or serial boats that provide minimum of luxury but a plethora characteristics positively affecting the performance). Depending on its perceived function to the renter, the boat is chosen among numerous alternatives. Sailing boat brands, such as Bavaria and Salona are definitely “the least expensive” boats to buy, thus their rental price is accordingly set, and make an optimal choice for price conscientious customers. Such customers may prefer maximum space, and look for boats that offer maximum number of cabins, and thus beds. On the other hand, Benetau and Janeau are brands that offer an abundance of gadgets, a sleek design, are made of the finest materials, and serve to people less concerned with price. Those boats, in most occasions, have several types that one can choose from. The sailing boat may have a single spacious cabin with plenty of space throughout the vessel, or even the best usage of space in terms of sleeping accommodations. Sailboats such as Sun Fast, Sun Odyssey, Y, Elan, Feeling, Oceanis, SAS, Hunter, Gib Sea, Aventure, DuFour, Grand Soleil, and First are average priced brands that prove to be good alternatives when looking for a moderate luxury, performance, and price. 2 Season (i.e. seasonality) is probably the single most important attribute, after the boat length, in determining the appropriate rent price. It is highly significant for the model. Seasons can be divided in several ways, of which the most common one is “season” and “off season”. Additional ways to categorize seasonality, specific for Croatia and other Mediterranean countries is the following: The main season is from the beginning of July till the end of August. The Semi-season is from the mid May until the end of June, and through the entire month of September. Additional seasons include the Christmas season and the Easter semi-season. Periods from late January until Easter, from Easter until May, and from October until December are considered off season, and are much more affordable than other periods characterized by high demand. 3 The number of days one seeks to rent a sailboat, as shown in this study (which is a general renting policy worldwide), are 7, 14, and 21 days. Daily rental price diminishes as the number of rent days increases. So, a daily rate for 21 days of rent is much less than a daily rate for 7 days of rent. When renting for 14 days, daily rate is usually somewhere in between the two previously mentioned. 4 Ship length, which shows the biggest correlation to price, is the single most significant boat attribute in determining boat rental price. The longer the ship, the more cabins it has, beds, and most often other amenities, thus the final rental price is also higher. It is important to note that the number of cabins and the number of beds are highly dependent of each other, and increase together proportionally. 5 The number of cabins is expected to be a significant boat characteristic, and is very important to boat renters, since it usually determines the number of beds available in the vessel, which has shown to be a priority among yachtsmen seeking to rent a sailboat. 6 The number of beds, as discussed before, is important since it determines the boat’s carrying capacity (i.e. the number of people than can reside in it for a number of days specified by the rental agreement). 7 The year of production is an important price determinant because the value of the boat is expected to decrease as time passes. Since the boat’s net value decreases, the rental price also decreases. However, there is a line to which a price decreases, below which it rarely drops. That is probably because older boats are not up for rent because of their poor condition, or they are renovated and rented for premium prices. The price also falls as the boat ages, not only because of wear and tear, but also because of its unattractive old-fashioned design and decreased sailing performances compared to the newer models. The maintenance costs are also an important factor, since they increase as the boat
ages. 8 The engine type somewhat shows significance in that it follows the latest technologies, and as a boat is newer, so is the engine type and its fuselage (i.e. how much fuel it spends) and performance. 9 Draft tends to be bigger as the boat is longer and heavier. The estimate is that it does not have special significance in rental price determination. 10 Maximum beam is somewhat of value in price determination in the sense that as the boat is longer it is also wider, which provides more space inside the vessel and ultimately raises the rental price. 11 The length of the hull is likely to be significant in determining price, in that by showing the correlation with boat length, they increase proportionally. Also, the longer the hull length, the greater the boat's stability, and thus the crew's security. 12 The length at waterline is simply the reflection of the boat’s stability. 13 Another factor to stability is the boat’s weight. The heavier the boat, the more stable the boat. However, the heavier the boat is, the bigger the decrease is in its sailing speed and maneuverability. 14 Ballast is contributing to boat’s stability. 15 Water capacity does not seem like a significant attribute in determining price. Water is important as a source of liquid for drinking on-board, cooking, and washing the vessel, however it does not seem to be significant in determining the rental price). 16 Fuel capacity is somewhat significant in that it gives you an estimate of how long the boat can go without refilling the gas (i.e. the distance it can cross). It is important in conserving space that might be used for carrying spare fuel tanks to have safety supplies. 17 The Compass/Echo sounder is the first dummy variable used in this study. It is somewhat standard equipment for boats, and I would expect that sailboats which did not list it among its attributes simply lacked the information because owners forgot to include it in their offer (i.e. the list of boat characteristics). (Table 2) 18 VHF radio is a part of boat equipment that is required by law. In some boats, the information about it was omitted, probably because of data insufficiency. 19 Electric shore connection with cable/water hose with connectors may or may not be included among boat amenities, since the majority of marinas and harbors have this available for boaters’ use. However, most of the boats carry it as a safety net for instances in when the boat's battery needs to be charged and/or the water tanks need to be refilled in places lacking the infrastructure to facilitate the yachtsmen’ needs. 20 An electric refrigerator is a must in every boat, and the estimate would be that some boats did not have data on it because of the omission and data insufficiency. 21 Gas cooker with oven follows the same argument used for an electric refrigerator. 22 Pillows and blankets are offered in some boats, while not in others. The reason is that some owners clean sheets after they have been used, while other owners require the renters to bring their own pillows and blankets, to reduce their costs. Many people even prefer to bring their own, so the demand for them in a boat is lower, thus the supply follows it accordingly. 23 Radio-cassette player or CD is also a must in a boat since it offers entertainment to yachtsmen. Its significance is minor in determining the rental price. 24 The law requires all vessels to have life jackets to protect passengers from drowning, which is why all the boats have it in their inventory. The number of life jackets on the sailboat has to correspond with its carrying capacity, as described by law. 25 Distress flare kit, first aid kit, and fire extinguisher are also present in all the boats due to law requirements. A few boats did not have them listed in their inventory probably due to data inaccuracy. 26 Main anchor is obviously required for every boat on the sea. 27 Dinghy (inflatable) is a part of additional equipment. It enables the yachtsmen’s easier access to the shore when the boat is anchored. It certainly seems that this attribute should raise the boat’s rental price. 28 The harbor location seems not to influence the final rental price. However, it is important for the guests since they always look for a convenient place to embark on a voyage. The following harbor locations were used in this study: Pula, Zadar, Sukosan (Zadar), Sibenik, Primosten (Sibenik), Split, Trogir, Kastel Gomilica (Trogir), Jezera (the island of Murter), Murter (the island of Murter), Dubrovnik, Vodice, and Biograd. It has been noticed that boats in Central Dalmatia are priced above the average, which places it in the “pricy” region to rent a boat. 29 The region the sailing boat is located in is irrelevant except for accessibility. It correlates with harbor location, and does not influence rental price. 30 Spinnaker/Blister is additional equipment for experienced yachtsmen who often pay extra for such commodities. It has no influence on rental price, since it is paid separately. 31 Hiring a skipper is an option for inexperienced yachtsmen wanting professional guidance of an experienced captain who can suggest everything from harbor selection, local entertainment to teaching boaters how to sail and
operate the vessel. It has no influence on rental price since it is paid separately. It is an extra cost for the renters. 32 Outboard engine, another additional equipment item, is used for dinghy (inflatable) for faster transport of boaters to the shore when the boat is anchored. It may be also used in cases of main engine malfunction. It has no influence on rental price since it is paid separately. It is an extra cost on the renters. 33 The number of people the boat can accommodate is determined by the number of beds that are determined by the number of cabins. It shows the optimal number of people that a sailboat can facilitate. The boat can accommodate more people when it has a number of extra beds available, which increases a boat’s carrying capacity. 34 Navigation kit is special equipment for advanced and professional boaters who can efficiently make use of it. It has poor correlation to rental price. 35 Cutlery usually accommodates the number of people a boat can carry, that is, it is related to number of people the boat can accommodate which was already discussed. 36 Shower/toilet is a cabin within a ship that provides a space for personal hygiene that every boat should have. Some of the boat owners obviously omitted this information probably thinking it is presumed a boat has a toilet facility. 37 Final cleaning is additional service sometimes included in rental price and charged additionally and separately from the rental price. It has no influence on rental price since it is paid separately. It is an extra cost for the renters. 38 Auxiliary anchor is additional equipment for those who may lose their main anchor and serves as an additional feeling of safety during bad weather when the boat is anchored. It increases the boat stability when it is not in operation. 39 Sun shade and bimini top are commodities most boaters prefer, since majority of yachtsmen rent sailboats during the summer, which is characterized by having the many sunny days. They also protect the crew from the sun and sun-related dangers (UV radiation). They are somewhat significant in price determination, but not enough to be included in the major attributes that influence final price. 40 Deck shower is extra equipment bigger boats usually have. It is frequently used during the summer, mainly for rinsing off sea/ocean water (salt). 41 Size of genoa sail is important for experienced yachtsmen who want to maximize sail’s size for better sailing performance and a boat speed while using wind power. It is commonly used in combination with the main sail. 42 The size of main sail is also important for experienced yachtsmen who want to maximize sail’s size for better sailing performance, and a boat speed while using wind power. It is commonly used during low or medium strength winds. 43 Calibrated anchor chain serves as additional equipment for easier anchoring. 44 The number of extra beds attribute is important for increasing boat’s carrying capacity. Boats with extra beds usually have a higher demand. It somewhat increases boat's rental price. 45 Transit log is a document required by law. It gives description of a boat and its equipment and the information on people currently using it. It is commonly used for chartered boats and is important for easier police identification. 46 Heating is a characteristic very few boats have. Usually larger boats posses such an attribute. It should be an insignificant sailboat characteristic, since the boats are mostly used during the summer months. 47 Radar is a luxury only mega-sailboats have at their disposal. It simplifies navigation and provides a precise positioning system, and is greatly appreciated by most boaters. However, it is not a necessity for boaters renting sailboats. It is more often found in motor yachts. It significantly increases rental price. 48 Port or starboard thruster is a necessity mega-sailboats have. It eases maneuvering in small spaces where big boats are hard to operate. It is significant in increasing rental price. It is a luxury that boats with crew members usually have. 49 Electric winch for anchor is used by larger vessels for easier anchoring. It has some significance in rental price, but boats rarely posses such a device.
SUMMARY AND FUTURE RESEARCH RECOMMENDATIONS The goal of this paper has been the examination of the sailboat attributes and current rental prices for the month of July using seven day rental period as a template. The results produced were expected, and proved the common belief that the boat length is the most important attribute for determining its rental price. Furthermore, other attributes such as engine type/power, number of cabins, and fuel capacity as well proved to be important in price determination, even more than thought off. This article has identified some variables that affect sailboat rental price for which the major ones are the same across the world. Croatia, the newest discovery in nautical tourism, can be considered a perfect fit for this article which will
hopefully indicate its usefulness even outside Croatia. The growing stage of nautical tourism in the country still needs more variety in sailboat types to adjust its offer to the consumers’ needs. The characteristics that allow an increase in sailboat rental price can also be seen as attributes. There are many ways for expanding on this research. Considered options could include the research being extended to other months (maybe even the whole year), so seasonal changes can be visible. Such study could better describe the variations between sailboat rental prices and possibly reveal more important results. After that, the data from other countries can be included and some generalities can be drawn that could affect the whole region, or even larger area. Formally assessing extensive data might lead to results that could be generalized for sailboat rental prices universally. Furthermore, studies involving motor boats and catamarans could be conducted, giving charter companies important tools for determining rental prices of all the products they offer. This would lead to better understanding of price determination in general, especially in nautical tourism. The research can be expanded beyond tourism into other fields lacking scientific support for pricing goods and/or services. Since this tourism issue is still not explored adequately, the supplementary research may lead to a greater body of knowledge being produced for the betterment of the industry and academia.
REFERENCES
Aguilo, Eugeni, Joaquin Alegre, and Maria Sard (2003). Examining the Market Structure of the German and UK Tour Operating Industries Through an Analysis of Package Holiday Prices. Tourism Economics: the Business and Finance of Tourism and Recreation. Čorak, Sanda, and Zrinka Marušić (2005). Ministarstvo Mora, Turizma, Prometa I Razvitka RH, Institute for Tourism. Zagreb: Nautika TOMAS. Espinet, J M., M Saez, G Coenders, and M Fluvia (2003). Effect on Prices of the Attributes of Holiday Hotels: a Hedonic Prices Approach. Tourism Economics: the Business and Finance of Tourism and Recreation. Gracan, Daniela (2005). Uloga Nautickog Turizma U Repoziciranju Turizma Istarske Zupanije. Tourism and Hospitality Management Journal 11. 17 Oct. 2006 http://www.fthm.hr/hrv/zs_rad/casopisi/web-vol11-2.pdf Gržetić, Zvonko, and Srećko Favro (2006). Studija Razvitka Nautickog Tuirizma Hrvatske. Hydrographic Institute of the Republic of Croatia- Split. Hydrographic Institute of the Republic of Croatia. 10 Nov. 2006 <http://www.hhi.hr/srnth/3.pdf Haroutunian, Stephan (2005). Using Brochure Information for the Hedonic Analysis of Holiday Packages. Tourism Economics: the Business and Finance of Tourism and Recreation 11. Klein, Yehuda L., Jeffrey P. Osleeb, and Mariano R. Viola (2004). Tourism Generated-Earnings in the Coastal Zone: a Regional Analysis. Journal of Coastal Research. Kolega, Josip (2004). NautičKi Turizam – Jedan Od Najperspektivnijih Oblika Hrvatskog Turizma. Hrvatsko Geografsko Drustvo.17 Oct. 2006 http://www.geografija.hr/novosti.asp?id_novosti=387&id_projekta=0&trazi= Marušić, Zrinka, Siniša Horak, and Sanda Čorak (2006). Attitudes and Expenditures of Yachtsman in Croatia. Institut Za Turizam, Zagreb. 17 Oct. 2006 http://bib.irb.hr/prikazi-rad?&rad=199920> Monty, Ben, and Mark Skidmore (2003). Hedonic Pricing and Willingness to Pay for Bed and Breakfast Amenities in Southeast Wisconsin. Journal of Travel Research. Papatheodorou, Andreas (2002). Exploring Competitiveness in Mediterranean Resorts. Tourism Economics: the Business and Finance of Tourism and Recreation. S, Dijana C (2006). Stanje I Razvoj Ponude Nautickog Turizma U Republici Hrvatskoj, Stavovi Nauticara Visoke Skole Za Turisticki Menadzment U Sibeniku. Elektronicki Zbornik Radova. 17 Oct. 2006.

http://www.vstsi.hr/TIM/Vol1_1.pdf Thrane, Christer (2005). Hedonic Price Models and Sun-and-Beach Package Tours: the Norwegian Case. Journal of Travel Research 43 (2005): 302-308. Weber, S (2002). Stavovi i potrošnja turista u Hrvatskoj. TOMAS, Institut za turizam. 17 Oct. 2006. http://www.mmtpr.hr/UserDocsImages/SRNT-IZR.pdf
AN EXPLORATION OF THE RELEVANCE AND RECALL OF SOCIAL MEDIA IN HOTEL ROOM PURCHASE
Hilary Catherine Murphy & Meng-Mei Chen Ecole hôtelière de Lausanne
Lausanne, Switzerland
Email: [email protected]
Abstract
Though some research has focused on social media as a marketing tool, the relevance and recall of social media sites during the purchase process has not been fully examined, particularly in comparison to other marketing channels. Recall has been one of the key metrics used to measure effective communication and the main aim of this paper is to investigate the recall of the various websites visited during an online session and the relevance of social media in the context of the purchase of a hotel room. Given this relatively un-researched topic, an exploratory research approach and observation method is adopted. A goal-directed scenario with 19 participants is designed and the hotel purchase behaviour of the participants is monitored and recorded via Desktop Screen Record 5 software. In addition, on the completion of the goal directed scenario, a further “unaided vs. aided recall” method is used, using a short questionnaire to measure recall to compare to actual sites recorded during the experiment. This qualitative research approach reveals that though participants visit social media sites at various stages of the purchase process, these are the least relevant channels. Results also show that there are several anomalies between their tracked behaviour and their recall / aided recall. Though limitations are evident in the small sample and qualitative approach, some managerial implications are suggested regarding channel optimisation.
Keywords: Hotel booking channels, social media, recall, relevance
EXPLORING THE MOTIVES OF HOTEL GUESTS IN THEIR CHOICES ABOUT
SUSTAINABILITY WITH REGARD TO HOTEL STAY
Arjan van Rheede, PhD * Senior Research Fellow Hotelschool The Hague
Brusselselaan 2 2587 AH The Hague, the Netherlands
Email: [email protected] Tel: 31 (0) 70 3512481 Fax: 31 (0) 70 3512155
Rob J. Blomme, PhD Director Research Hotelschool The Hague
Hotelschool The Hague Brusselselaan 2
2587 AH The Hague, the Netherlands Email: [email protected]
Tel: 31 (0) 70 3512481 Fax: 31 (0) 70 3512155
Abstract
The hospitality industry is starting to take responsibility for environmental sustainability (Van Rheede,
and Blomme, 2012). Knowing the motives and the ambition level of guests can be an important driver for organizations to formulate a more sophisticated sustainability policy (e.g.: Van Rheede and Blomme, 2012, Greenhoteliers, 2005). Will sustainable practices motivate – certain type of - hotel guests to select a hotel, or pay a premium price? This paper discusses the results of testing a validated questionnaire on “awareness of environmental consequences” (AC) in a hotel. The study has found additional evidence, based on Cronbach alpha and a Factor Analysis, that the alternative explanation of the AC scales - 3 components of benefits and cost of (in) action - were reliable and valid. Key Words: Hotel guest, Awareness of, Corporate Social Responsibility, Environmental sustainability,
Validated questionnaire.
Introduction
There continues to be a great deal of attention for green issues in the hospitality industry (see for
example, Van Rheede and Blomme, 2012, 2010a 2010b, Sloan, Legrand, & Chen, 2009 and Holcomb, Upchurch, Randall and Okumus, 2007). When running a sustainable business, decisions on products and technology are important, but actual behaviour is important too. Knowing the motives and the ambition level of both guests and employees might be an important driver for organizations to formulate a more sophisticated sustainability policy (e.g: Greenhoteliers, 2005).
How is attention on sustainability affecting the guests’ stay. Will this motivate – a certain type of -
hotel guests to select a hotel, or are they willing to pay a premium price? So how do guests experience sustainability in a hotel setting, this question is not yet answered (Van Rheede and Blomme, 2012). Both psychology and economic approaches have been developed. Ryan (2011) distinguishes the following scientific fields that focus on this: Conservation Psychology, Environmental & Resource Economics and Ecological Economics. The psychological approach focusses on individuals, while the other approaches are on an aggregated level.
The motives of consumers have been studied in other settings – outside the hospitality. The measures
that have been developed will be applied in this explorative study to this topic in the hospitality industry. Ryan (2011) argues that conversation psychology focuses on two issues: The examination of
cognitions and emotions of individuals to the natural world, and the exploration of the drivers of environmentally friendly behaviour. An important topic which is discussed amongst conservation psychologists is the importance of values which not only lead to specific attitudes and preconceptions about the environment but might be also more stable than belief constructs and emotions. Ryan stresses that values are a result of how individuals value the environment cognitively and emotionally. How people value the environment is rather stable over a long period, is influenced by the social context and personal traits, and is constructed in a interaction process in which people are actually moving in an environmental context and as a result psychological attributes are affected and developed. Hence, this value orientation can be used also to examine group values and ethical norms to investigate the attitudes and underlying values of guests on environmental issues.
According to Ryan (2011) the perspective of environmental & resource economics examines the relationship between resource use options and the way how agents value the environment. Agents comprises all actors such as individuals, institutions, organizations and societies who are eligible to act of have the power or authority to act in this relationship. Environmental & resource economics has its roots in neo-classical economy and considers the environment as a source of valuable human consumption materials which demands specialised management and conservation (Ryan, 2011: 54). The environment has only significant value when it contributes to the quality of the human condition as well in the present as in the future. Hence, the environmental & resource economics approach examines the value of the environment and in which way this will contribute to human wellbeing now and in the future instrumentally.
The instrumental approach by the environmental & resource economics has been criticised by the ecological economics. The main critique is that the environmental & resource economics are using an utilitarian framework for granted but are neglecting principle ethics of issues such as intergenerational and intragenerational fairness, and the discussions involved in valuing the loss of human life, the detrimental effects of migration on human populations and the intrinsic rights of non-human life (Ryan, 2011: 60). Therefore, ecological economists are focusing on the intrinsic value of the environment which has value in its own right and sake.
Present study
The three discussed approaches are providing us with different angles to examine the attention of
guests on sustainability. Although many research studies have been conducted to this topic, not many studies have been conducted to guests’ attitudes and values on sustainability in the hospitality industry. Hence, this supports the necessity of this study.
The measures that are developed will be applied in this explorative study to this topic in the hospitality industry. This study uses the Awareness of Consequences (AC) scale; a value-based approach to environmental concern (Hansla 2011, Ryan and Spash, 2008 and De Groot and Steg, 2007). This approach can be placed under the umbrella of Conservation Psychology. One important reason to choose for this approach is because it looks
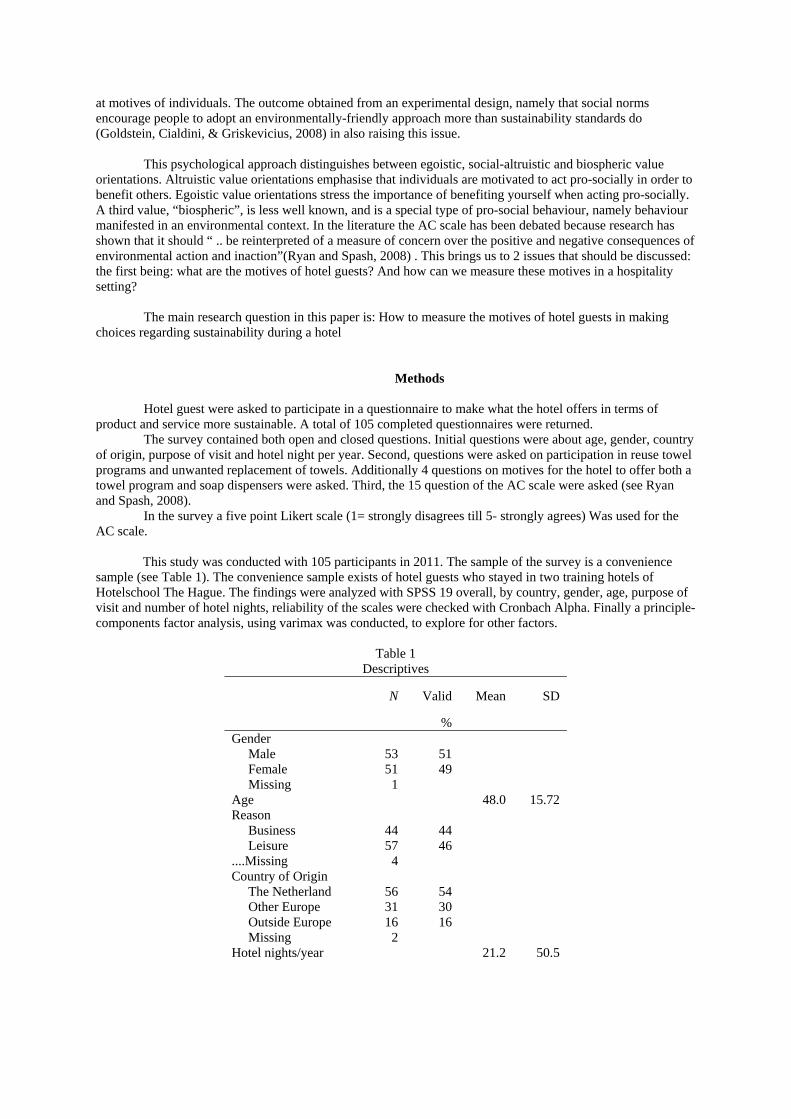
at motives of individuals. The outcome obtained from an experimental design, namely that social norms encourage people to adopt an environmentally-friendly approach more than sustainability standards do (Goldstein, Cialdini, & Griskevicius, 2008) in also raising this issue.
This psychological approach distinguishes between egoistic, social-altruistic and biospheric value
orientations. Altruistic value orientations emphasise that individuals are motivated to act pro-socially in order to benefit others. Egoistic value orientations stress the importance of benefiting yourself when acting pro-socially. A third value, “biospheric”, is less well known, and is a special type of pro-social behaviour, namely behaviour manifested in an environmental context. In the literature the AC scale has been debated because research has shown that it should “ .. be reinterpreted of a measure of concern over the positive and negative consequences of environmental action and inaction”(Ryan and Spash, 2008) . This brings us to 2 issues that should be discussed: the first being: what are the motives of hotel guests? And how can we measure these motives in a hospitality setting?
The main research question in this paper is: How to measure the motives of hotel guests in making
choices regarding sustainability during a hotel
Methods Hotel guest were asked to participate in a questionnaire to make what the hotel offers in terms of
product and service more sustainable. A total of 105 completed questionnaires were returned. The survey contained both open and closed questions. Initial questions were about age, gender, country
of origin, purpose of visit and hotel night per year. Second, questions were asked on participation in reuse towel programs and unwanted replacement of towels. Additionally 4 questions on motives for the hotel to offer both a towel program and soap dispensers were asked. Third, the 15 question of the AC scale were asked (see Ryan and Spash, 2008).
In the survey a five point Likert scale (1= strongly disagrees till 5- strongly agrees) Was used for the AC scale.
This study was conducted with 105 participants in 2011. The sample of the survey is a convenience
sample (see Table 1). The convenience sample exists of hotel guests who stayed in two training hotels of Hotelschool The Hague. The findings were analyzed with SPSS 19 overall, by country, gender, age, purpose of visit and number of hotel nights, reliability of the scales were checked with Cronbach Alpha. Finally a principle-components factor analysis, using varimax was conducted, to explore for other factors.
Table 1
Descriptives
N Valid
%
Mean SD
Gender Male Female Missing
53 51
1
51 49
Age 48.0 15.72 Reason Business Leisure ....Missing
44 57
4
44 46
Country of Origin The Netherland Other Europe Outside Europe Missing
56 31 16
2
54 30 16
Hotel nights/year
21.2 50.5
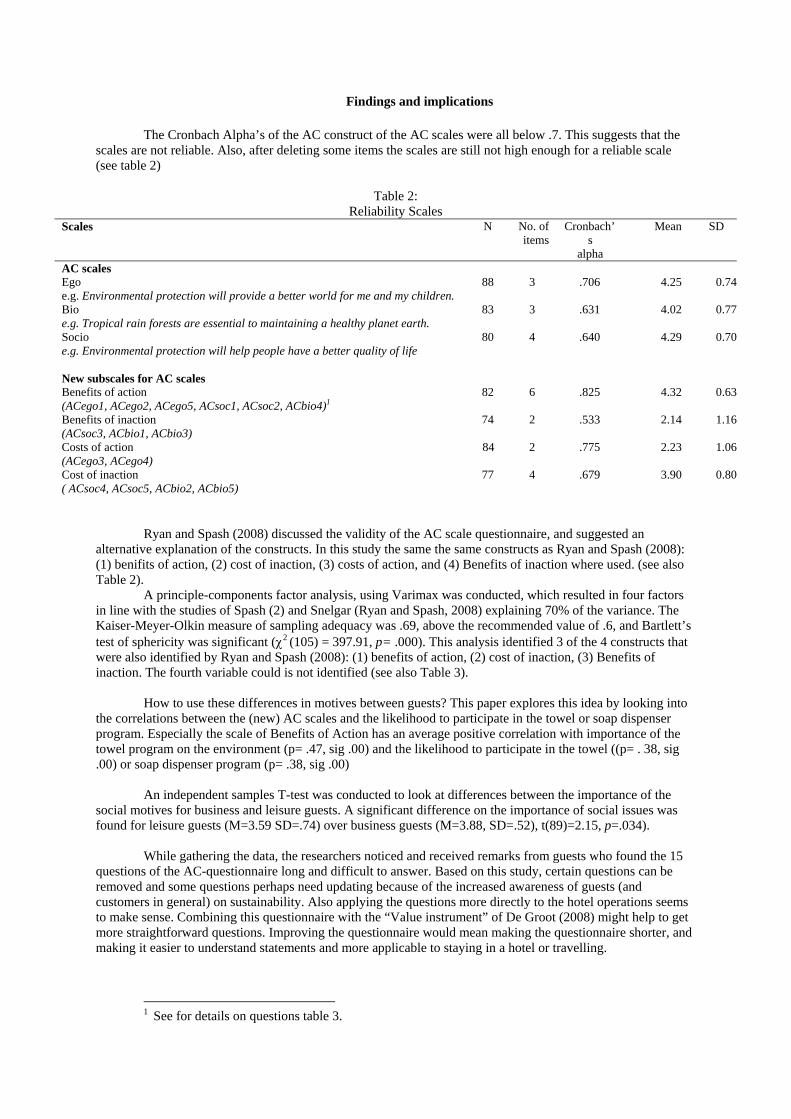
Findings and implications
The Cronbach Alpha’s of the AC construct of the AC scales were all below .7. This suggests that the scales are not reliable. Also, after deleting some items the scales are still not high enough for a reliable scale (see table 2)
Table 2:
Reliability Scales Scales N No. of
items Cronbach’
s alpha
Mean SD
AC scales Ego e.g. Environmental protection will provide a better world for me and my children.
88 3 .706 4.25 0.74
Bio e.g. Tropical rain forests are essential to maintaining a healthy planet earth.
83 3 .631 4.02 0.77
Socio e.g. Environmental protection will help people have a better quality of life
80 4
.640 4.29 0.70
New subscales for AC scales Benefits of action (ACego1, ACego2, ACego5, ACsoc1, ACsoc2, ACbio4)1
82 6 .825 4.32 0.63
Benefits of inaction (ACsoc3, ACbio1, ACbio3)
74 2 .533 2.14 1.16
Costs of action (ACego3, ACego4)
84 2 .775 2.23 1.06
Cost of inaction ( ACsoc4, ACsoc5, ACbio2, ACbio5)
77 4 .679 3.90 0.80
Ryan and Spash (2008) discussed the validity of the AC scale questionnaire, and suggested an
alternative explanation of the constructs. In this study the same the same constructs as Ryan and Spash (2008): (1) benifits of action, (2) cost of inaction, (3) costs of action, and (4) Benefits of inaction where used. (see also Table 2).
A principle-components factor analysis, using Varimax was conducted, which resulted in four factors in line with the studies of Spash (2) and Snelgar (Ryan and Spash, 2008) explaining 70% of the variance. The Kaiser-Meyer-Olkin measure of sampling adequacy was .69, above the recommended value of .6, and Bartlett’s test of sphericity was significant (2 (105) = 397.91, p= .000). This analysis identified 3 of the 4 constructs that were also identified by Ryan and Spash (2008): (1) benefits of action, (2) cost of inaction, (3) Benefits of inaction. The fourth variable could is not identified (see also Table 3).
How to use these differences in motives between guests? This paper explores this idea by looking into
the correlations between the (new) AC scales and the likelihood to participate in the towel or soap dispenser program. Especially the scale of Benefits of Action has an average positive correlation with importance of the towel program on the environment (p= .47, sig .00) and the likelihood to participate in the towel ((p= . 38, sig .00) or soap dispenser program (p= .38, sig .00)
An independent samples T-test was conducted to look at differences between the importance of the
social motives for business and leisure guests. A significant difference on the importance of social issues was found for leisure guests (M=3.59 SD=.74) over business guests (M=3.88, SD=.52), t(89)=2.15, p=.034).
While gathering the data, the researchers noticed and received remarks from guests who found the 15
questions of the AC-questionnaire long and difficult to answer. Based on this study, certain questions can be removed and some questions perhaps need updating because of the increased awareness of guests (and customers in general) on sustainability. Also applying the questions more directly to the hotel operations seems to make sense. Combining this questionnaire with the “Value instrument” of De Groot (2008) might help to get more straightforward questions. Improving the questionnaire would mean making the questionnaire shorter, and making it easier to understand statements and more applicable to staying in a hotel or travelling.
1 See for details on questions table 3.
Table 3:
Factor analysis
Component
1
BoA
2
CoI
3
BoI
4
?
ACsoc2 Environmental protection will help people have a better quality of life ,844
ACego1 Environmental protection will provide a better world for me and my children ,831
ACsoc1 Environmental protection benefits everyone ,781
ACego2 Environmental protection is beneficial to my health ,683
ACbio4 Tropical rain forests are essential to maintaining a healthy planet earth ,559
ACsoc4 The effects of pollution on public health are worse than we realise ,816
ACsoc5 Pollution generated here harms people all over the earth ,798
ACego5 A clean environment provides me with better opportunities for recreation* ,545
ACsoc3 We don’t need to worry much about the environment because future generations
will be better able to deal with these problems than we are
,830
ACbio1 While some local plants and animals may have been harmed by environmental
degradation, over the whole earth there has been little effect
,781
ACego4 Laws to protect the environment limit my choice and personal freedoms ,625
ACego3 Protecting the environment will threaten jobs for people like me ,547
ACbio3 Claims that current levels of pollution are changing earth’s climate are exaggerated -,844
ACbio5 Modern development threatens wildlife ,686
ACbio2 Over the next several decades, thousands of species will become extinct* ,507
* factor loaded in study Ryan and Spash (2008) on another component.
The study has not solved the debate on what actually is measured by the AC questionnaire. The results
of the study, based on Cronbach alpha and a factor analyse, support the alternative explanation of the scales. Three out of the four scales for benefits and cost of (in) action were found reliable and valid. The original eco-, socio - and biospheric value scales were not reliable in this study, and are therefore not valid.
A limitation of this study is that at both hotel locations the actual sustainability practices applied in the
hotel are limited. During the research soap dispensers were being tested. Some regular guests complained in this period about missing amenities such as individual soap and shower gel. And other complains by the guests were empty soap dispensers, because housekeeping did not replace them in time.
Another limitation of this study was the limited sample size. Some scales are based on 74 valid items (see Table 2).
Follow-up research will also include ideas of Environmental & Resource Economics and Ecological
Economics. The study to be performed will include a conjoint analysis. This will help to gain a more realistic idea what drives guests’ behaviour. Additionally, actual experiments with more sustainable and less sustainable rooms can be applied where guests themselves can decide which room they prefer (with one variable a premium prices for one alternative).
The result of this study is the first step to help the hospitality industry choose their sustainability
measures in line with the motives of their (hotel) guests. The preliminarily results show a preference of the hotel guests for measures related to ‘benifits of action’ and ‘costs of inaction (m=4.3 and m=3.9, see table 2). When a hotel applies measures on sustainability that are linked to those motives, it is likely that hotel guests will be more positive about these measures, and their overall experience in the hotel.
References
Greenhotelier (2005). Saving energy in kitchens. 37(1): 1-4.
De Groot, J.I.M., Steg, L. (2007). Value orientation and einvironmental beliefs in five countries: Validity of an instrumetn to measure egoistic, altruistic and biospheric value orientations. Journal of Cross-Cultural Psychology, 38, 318-332.
De Groot, J.I.M (2008). Mean or green: value orientations, morality and prosocial behaviour, Thesis, Rijksuniversiteit Groningen.
Goldstein, N. J., Cialdini, R. B., & Griskevicius, V. (2008). A room with a viewpoint: Using social norms to motivate environmental conservation in hotels. Journal of Consumer Research, 35, 472-482.
Hansla, André (2011). Value Orientation, Awareness of Consequences, and Environmmental Concern, University of Gothenburg, Sweden.
Ryan, A. and Spash, C.L. (2008). Measuring “Awareness of environmental consequences”: two scales and two interpretations, CSIRO Working Paper Series 2008-10: Canberra.
Ryan, A (2011). An exploration of the descriptive validity of surveys designed to measure psychological and economic definitions of environmental value. http://hdl.handle.net/1885/8857 [Accessed the 15th of May 2012].
Van Rheede, A. & Blomme R.J.. (upcoming publication), Sustainable practices in hospitality: a research. Advances in hospitality and Leisure, Vol. 8.
Van Rheede, A., Blomme R.J. & Tromp D.M. (2010a), Sustainability in the Dutch hospitality industry Review of the current practice in a theoretical framework, CRRC conference Marseille.
Van Rheede, A., Blomme R.J. & Tromp D.M. (2010b), Exploring the adoption of Eco-labels in the Dutch hospitality industry: the impact of government actions and guests expectations, EUROCHRIE conference Amsterdam.
Acknowledgement
The authors would like to thank the following persons who helped us in the preparation of this paper. Kevin Simmonds, Global Market Intelligence Manager, Diversey UK Services Limited for his help during the design of the study and Sjaak Smit, Manager Skotel The Hague / Skotel Amsterdam and all the practical students and instructurs at the Skotel for helping us with the collecting the questionnaire.
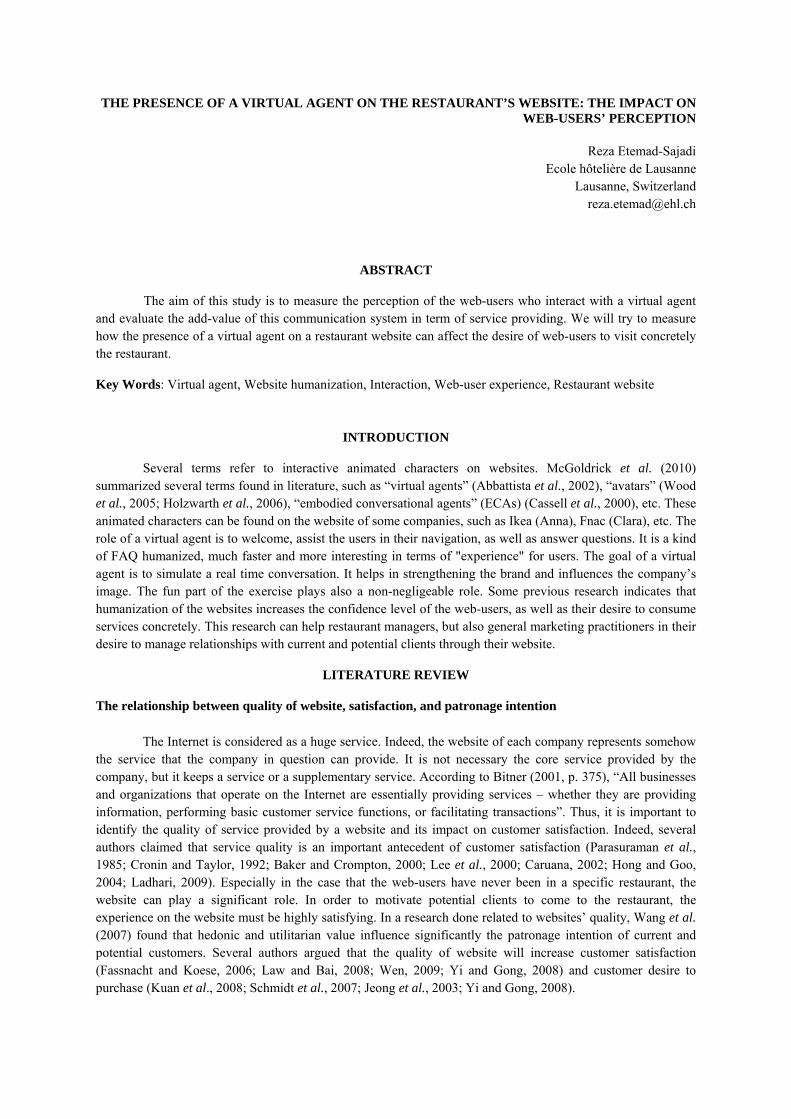
THE PRESENCE OF A VIRTUAL AGENT ON THE RESTAURANT’S WEBSITE: THE IMPACT ON WEB-USERS’ PERCEPTION
Reza Etemad-Sajadi
Ecole hôtelière de Lausanne Lausanne, Switzerland
ABSTRACT
The aim of this study is to measure the perception of the web-users who interact with a virtual agent and evaluate the add-value of this communication system in term of service providing. We will try to measure how the presence of a virtual agent on a restaurant website can affect the desire of web-users to visit concretely the restaurant.
Key Words: Virtual agent, Website humanization, Interaction, Web-user experience, Restaurant website
INTRODUCTION
Several terms refer to interactive animated characters on websites. McGoldrick et al. (2010) summarized several terms found in literature, such as “virtual agents” (Abbattista et al., 2002), “avatars” (Wood et al., 2005; Holzwarth et al., 2006), “embodied conversational agents” (ECAs) (Cassell et al., 2000), etc. These animated characters can be found on the website of some companies, such as Ikea (Anna), Fnac (Clara), etc. The role of a virtual agent is to welcome, assist the users in their navigation, as well as answer questions. It is a kind of FAQ humanized, much faster and more interesting in terms of "experience" for users. The goal of a virtual agent is to simulate a real time conversation. It helps in strengthening the brand and influences the company’s image. The fun part of the exercise plays also a non-negligeable role. Some previous research indicates that humanization of the websites increases the confidence level of the web-users, as well as their desire to consume services concretely. This research can help restaurant managers, but also general marketing practitioners in their desire to manage relationships with current and potential clients through their website.
LITERATURE REVIEW
The relationship between quality of website, satisfaction, and patronage intention
The Internet is considered as a huge service. Indeed, the website of each company represents somehow the service that the company in question can provide. It is not necessary the core service provided by the company, but it keeps a service or a supplementary service. According to Bitner (2001, p. 375), “All businesses and organizations that operate on the Internet are essentially providing services – whether they are providing information, performing basic customer service functions, or facilitating transactions”. Thus, it is important to identify the quality of service provided by a website and its impact on customer satisfaction. Indeed, several authors claimed that service quality is an important antecedent of customer satisfaction (Parasuraman et al., 1985; Cronin and Taylor, 1992; Baker and Crompton, 2000; Lee et al., 2000; Caruana, 2002; Hong and Goo, 2004; Ladhari, 2009). Especially in the case that the web-users have never been in a specific restaurant, the website can play a significant role. In order to motivate potential clients to come to the restaurant, the experience on the website must be highly satisfying. In a research done related to websites’ quality, Wang et al. (2007) found that hedonic and utilitarian value influence significantly the patronage intention of current and potential customers. Several authors argued that the quality of website will increase customer satisfaction (Fassnacht and Koese, 2006; Law and Bai, 2008; Wen, 2009; Yi and Gong, 2008) and customer desire to purchase (Kuan et al., 2008; Schmidt et al., 2007; Jeong et al., 2003; Yi and Gong, 2008).
The impact of the virtual agent on web-user experience
On Internet, it is more complicated to establish a social connection between the company and the potential client (Schijns, 2003). Indeed, the social distance is one of the major reasons. Social distance is described as the feeling of warmth and sociability within a website (Gefen and Straub, 2003). One of the cues to the perception of social presence is interactivity (Keeling et al., 2010). Several researchers analyzed the impact of social presence on behavioral intention (Gefen and Straub, 2003). The use of a virtual agent can reduce the social distance. Indeed, the virtual agent can increase the website experience and indirectly the desire of clients to visit and patronage the company. Moreover, the virtual agent effectively increases online trust (Steinbrück et al., 2002). However, customer trust related to a restaurant website can be different from trust related to an e-commerce website.
METHODOLOGY
In this research we applied the virtual agent to the website of the restaurant called Berceau des Sens (restaurant of Ecole hôtelière Lausanne). With the help of a computer service company named Askom, we developed a virtual agent named Laura (see Figure 1). Initially, we trained Laura to answer basic questions. For that we collected a database of FAQ found on more than 50 restaurant websites. We started by teaching to Laura to answer to these questions. In a second step, we integrated it to the restaurant’s website and tested it with the users (learning phase). These interactions helped to improve the response satisfactory rate. This means that the virtual agent will evolve and improve its knowledge based on its interactions. We estimate to 80% the percentage of successful answers given by Laura (in the cases when the questions are linked with the restaurant). Based on interviews we did with virtual agent developers, they estimate that a good virtual agent will answer to 70-90%. It requires too much cost to develop an agent capable to have a better score.
Figure 1: The virtual agent Laura developed and used in our case
Measures
We used and readapted WEBQUAL in order to measure the website quality perceived. Indeed, WEBQUAL is an instrument for assessing the usability, information, and service interaction quality. To adapt it to restaurant industry, we selected ten of the twelve dimensions of WEBQUAL which are: a) informational fit-to-task (the information provided meets task needs and improves performance), b) tailored communication (tailored communication between consumers and the firm), c) visual appeal (the aesthetic of the website), d) innovativeness (the creativity and uniqueness of the website), e) emotional appeal (the emotional effect of using the website and intensity of involvement), f) ease of use (easy to understand where to find the information and easy to operate/navigate), g) relative advantage (better than other ways of interacting with the company), h) trust (secure communication and observance of information privacy), i) consistent image (the website image is compatible with the image projected by the firm), j) response time (time to get a response after a request or an
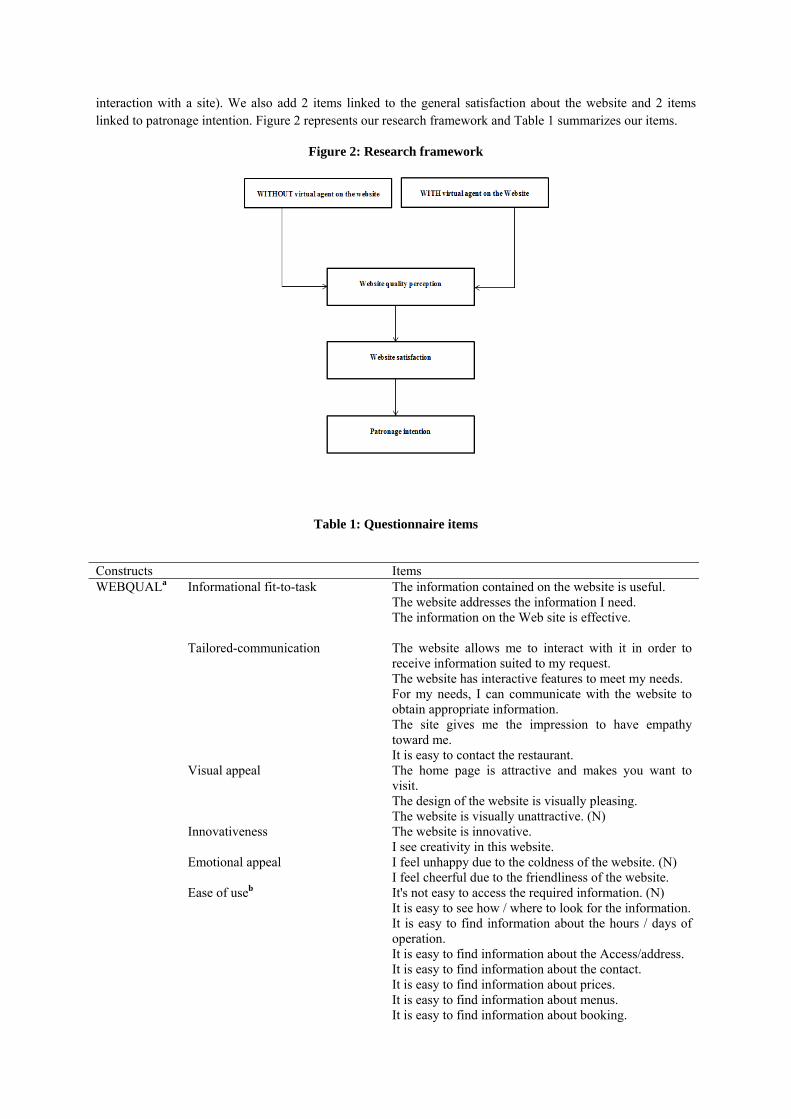
interaction with a site). We also add 2 items linked to the general satisfaction about the website and 2 items linked to patronage intention. Figure 2 represents our research framework and Table 1 summarizes our items.
Figure 2: Research framework
Table 1: Questionnaire items
Constructs Items WEBQUALa Informational fit-to-task
The information contained on the website is useful. The website addresses the information I need. The information on the Web site is effective.
Tailored-communication
The website allows me to interact with it in order to receive information suited to my request. The website has interactive features to meet my needs. For my needs, I can communicate with the website to obtain appropriate information. The site gives me the impression to have empathy toward me. It is easy to contact the restaurant.
Visual appeal
The home page is attractive and makes you want to visit. The design of the website is visually pleasing. The website is visually unattractive. (N)
Innovativeness
The website is innovative. I see creativity in this website.
Emotional appeal
I feel unhappy due to the coldness of the website. (N) I feel cheerful due to the friendliness of the website.
Ease of useb It's not easy to access the required information. (N) It is easy to see how / where to look for the information. It is easy to find information about the hours / days of operation. It is easy to find information about the Access/address. It is easy to find information about the contact. It is easy to find information about prices. It is easy to find information about menus. It is easy to find information about booking.
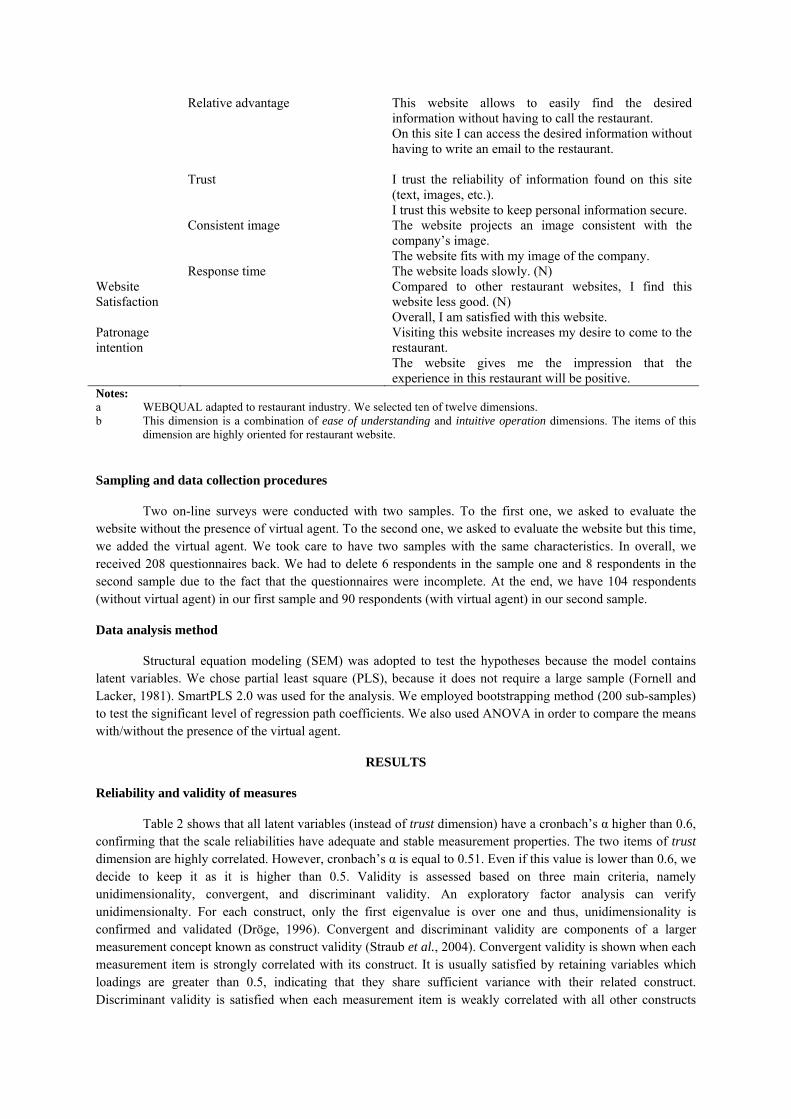
Relative advantage
This website allows to easily find the desired information without having to call the restaurant. On this site I can access the desired information without having to write an email to the restaurant.
Trust
I trust the reliability of information found on this site (text, images, etc.). I trust this website to keep personal information secure.
Consistent image
The website projects an image consistent with the company’s image. The website fits with my image of the company.
Response time The website loads slowly. (N) Website Satisfaction
Compared to other restaurant websites, I find this website less good. (N) Overall, I am satisfied with this website.
Patronage intention
Visiting this website increases my desire to come to the restaurant. The website gives me the impression that the experience in this restaurant will be positive.
Notes: a WEBQUAL adapted to restaurant industry. We selected ten of twelve dimensions. b This dimension is a combination of ease of understanding and intuitive operation dimensions. The items of this
dimension are highly oriented for restaurant website.
Sampling and data collection procedures
Two on-line surveys were conducted with two samples. To the first one, we asked to evaluate the website without the presence of virtual agent. To the second one, we asked to evaluate the website but this time, we added the virtual agent. We took care to have two samples with the same characteristics. In overall, we received 208 questionnaires back. We had to delete 6 respondents in the sample one and 8 respondents in the second sample due to the fact that the questionnaires were incomplete. At the end, we have 104 respondents (without virtual agent) in our first sample and 90 respondents (with virtual agent) in our second sample.
Data analysis method
Structural equation modeling (SEM) was adopted to test the hypotheses because the model contains latent variables. We chose partial least square (PLS), because it does not require a large sample (Fornell and Lacker, 1981). SmartPLS 2.0 was used for the analysis. We employed bootstrapping method (200 sub-samples) to test the significant level of regression path coefficients. We also used ANOVA in order to compare the means with/without the presence of the virtual agent.
RESULTS
Reliability and validity of measures
Table 2 shows that all latent variables (instead of trust dimension) have a cronbach’s α higher than 0.6, confirming that the scale reliabilities have adequate and stable measurement properties. The two items of trust dimension are highly correlated. However, cronbach’s α is equal to 0.51. Even if this value is lower than 0.6, we decide to keep it as it is higher than 0.5. Validity is assessed based on three main criteria, namely unidimensionality, convergent, and discriminant validity. An exploratory factor analysis can verify unidimensionalty. For each construct, only the first eigenvalue is over one and thus, unidimensionality is confirmed and validated (Dröge, 1996). Convergent and discriminant validity are components of a larger measurement concept known as construct validity (Straub et al., 2004). Convergent validity is shown when each measurement item is strongly correlated with its construct. It is usually satisfied by retaining variables which loadings are greater than 0.5, indicating that they share sufficient variance with their related construct. Discriminant validity is satisfied when each measurement item is weakly correlated with all other constructs
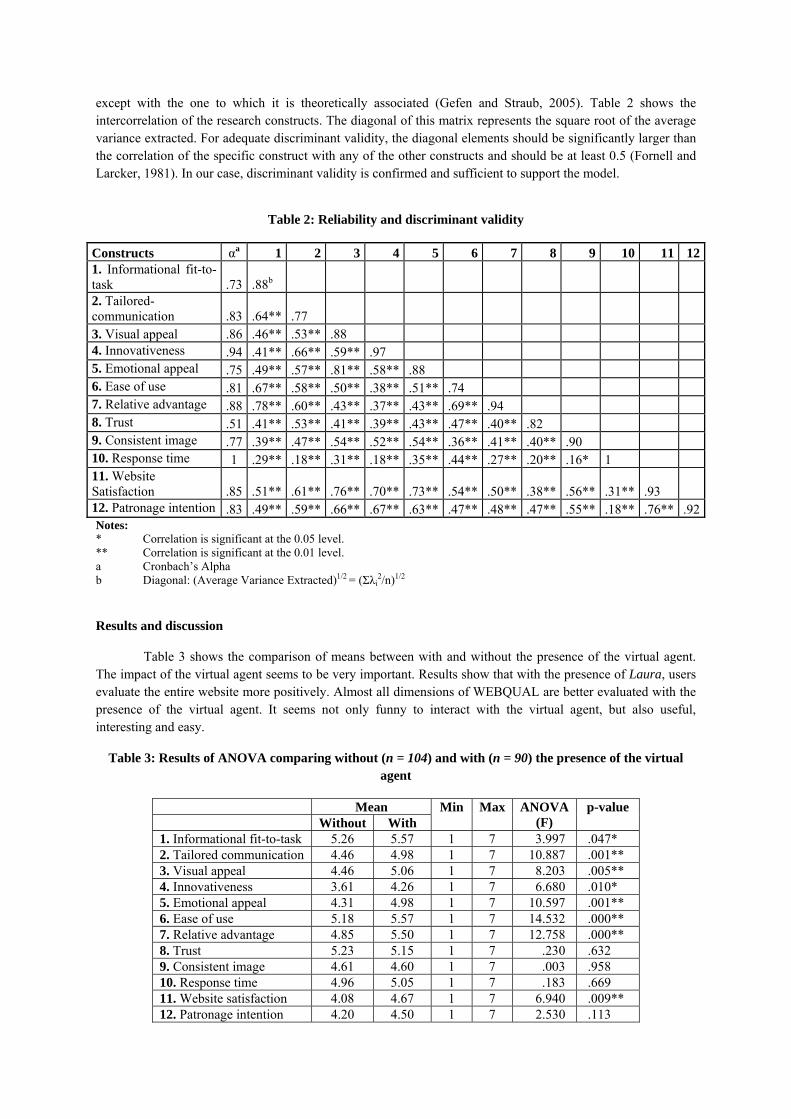
except with the one to which it is theoretically associated (Gefen and Straub, 2005). Table 2 shows the intercorrelation of the research constructs. The diagonal of this matrix represents the square root of the average variance extracted. For adequate discriminant validity, the diagonal elements should be significantly larger than the correlation of the specific construct with any of the other constructs and should be at least 0.5 (Fornell and Larcker, 1981). In our case, discriminant validity is confirmed and sufficient to support the model.
Table 2: Reliability and discriminant validity
Constructs αa 1 2 3 4 5 6 7 8 9 10 11 121. Informational fit-to-task .73 .88b 2. Tailored-communication .83 .64** .77 3. Visual appeal .86 .46** .53** .88 4. Innovativeness .94 .41** .66** .59** .97 5. Emotional appeal .75 .49** .57** .81** .58** .88 6. Ease of use .81 .67** .58** .50** .38** .51** .74 7. Relative advantage .88 .78** .60** .43** .37** .43** .69** .94 8. Trust .51 .41** .53** .41** .39** .43** .47** .40** .82 9. Consistent image .77 .39** .47** .54** .52** .54** .36** .41** .40** .90 10. Response time 1 .29** .18** .31** .18** .35** .44** .27** .20** .16* 1 11. Website Satisfaction .85 .51** .61** .76** .70** .73** .54** .50** .38** .56** .31** .93 12. Patronage intention .83 .49** .59** .66** .67** .63** .47** .48** .47** .55** .18** .76** .92 Notes: * Correlation is significant at the 0.05 level. ** Correlation is significant at the 0.01 level. a Cronbach’s Alpha b Diagonal: (Average Variance Extracted)1/2 = (Σλi
2/n)1/2
Results and discussion
Table 3 shows the comparison of means between with and without the presence of the virtual agent. The impact of the virtual agent seems to be very important. Results show that with the presence of Laura, users evaluate the entire website more positively. Almost all dimensions of WEBQUAL are better evaluated with the presence of the virtual agent. It seems not only funny to interact with the virtual agent, but also useful, interesting and easy.
Table 3: Results of ANOVA comparing without (n = 104) and with (n = 90) the presence of the virtual agent
Mean Min Max ANOVA (F)
p-value Without With 1. Informational fit-to-task 5.26 5.57 1 7 3.997 .047* 2. Tailored communication 4.46 4.98 1 7 10.887 .001** 3. Visual appeal 4.46 5.06 1 7 8.203 .005** 4. Innovativeness 3.61 4.26 1 7 6.680 .010* 5. Emotional appeal 4.31 4.98 1 7 10.597 .001** 6. Ease of use 5.18 5.57 1 7 14.532 .000** 7. Relative advantage 4.85 5.50 1 7 12.758 .000** 8. Trust 5.23 5.15 1 7 .230 .632 9. Consistent image 4.61 4.60 1 7 .003 .958 10. Response time 4.96 5.05 1 7 .183 .669 11. Website satisfaction 4.08 4.67 1 7 6.940 .009** 12. Patronage intention 4.20 4.50 1 7 2.530 .113
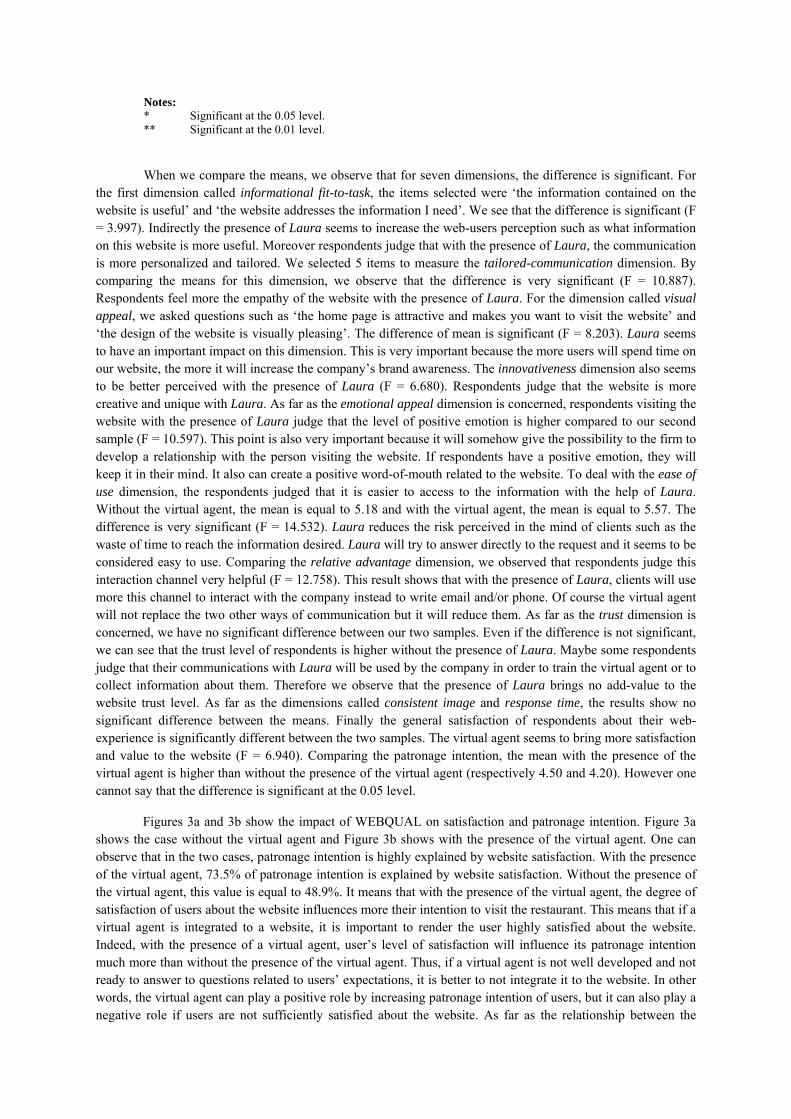
Notes: * Significant at the 0.05 level. ** Significant at the 0.01 level.
When we compare the means, we observe that for seven dimensions, the difference is significant. For the first dimension called informational fit-to-task, the items selected were ‘the information contained on the website is useful’ and ‘the website addresses the information I need’. We see that the difference is significant (F = 3.997). Indirectly the presence of Laura seems to increase the web-users perception such as what information on this website is more useful. Moreover respondents judge that with the presence of Laura, the communication is more personalized and tailored. We selected 5 items to measure the tailored-communication dimension. By comparing the means for this dimension, we observe that the difference is very significant (F = 10.887). Respondents feel more the empathy of the website with the presence of Laura. For the dimension called visual appeal, we asked questions such as ‘the home page is attractive and makes you want to visit the website’ and ‘the design of the website is visually pleasing’. The difference of mean is significant (F = 8.203). Laura seems to have an important impact on this dimension. This is very important because the more users will spend time on our website, the more it will increase the company’s brand awareness. The innovativeness dimension also seems to be better perceived with the presence of Laura (F = 6.680). Respondents judge that the website is more creative and unique with Laura. As far as the emotional appeal dimension is concerned, respondents visiting the website with the presence of Laura judge that the level of positive emotion is higher compared to our second sample (F = 10.597). This point is also very important because it will somehow give the possibility to the firm to develop a relationship with the person visiting the website. If respondents have a positive emotion, they will keep it in their mind. It also can create a positive word-of-mouth related to the website. To deal with the ease of use dimension, the respondents judged that it is easier to access to the information with the help of Laura. Without the virtual agent, the mean is equal to 5.18 and with the virtual agent, the mean is equal to 5.57. The difference is very significant (F = 14.532). Laura reduces the risk perceived in the mind of clients such as the waste of time to reach the information desired. Laura will try to answer directly to the request and it seems to be considered easy to use. Comparing the relative advantage dimension, we observed that respondents judge this interaction channel very helpful (F = 12.758). This result shows that with the presence of Laura, clients will use more this channel to interact with the company instead to write email and/or phone. Of course the virtual agent will not replace the two other ways of communication but it will reduce them. As far as the trust dimension is concerned, we have no significant difference between our two samples. Even if the difference is not significant, we can see that the trust level of respondents is higher without the presence of Laura. Maybe some respondents judge that their communications with Laura will be used by the company in order to train the virtual agent or to collect information about them. Therefore we observe that the presence of Laura brings no add-value to the website trust level. As far as the dimensions called consistent image and response time, the results show no significant difference between the means. Finally the general satisfaction of respondents about their web-experience is significantly different between the two samples. The virtual agent seems to bring more satisfaction and value to the website (F = 6.940). Comparing the patronage intention, the mean with the presence of the virtual agent is higher than without the presence of the virtual agent (respectively 4.50 and 4.20). However one cannot say that the difference is significant at the 0.05 level.
Figures 3a and 3b show the impact of WEBQUAL on satisfaction and patronage intention. Figure 3a shows the case without the virtual agent and Figure 3b shows with the presence of the virtual agent. One can observe that in the two cases, patronage intention is highly explained by website satisfaction. With the presence of the virtual agent, 73.5% of patronage intention is explained by website satisfaction. Without the presence of the virtual agent, this value is equal to 48.9%. It means that with the presence of the virtual agent, the degree of satisfaction of users about the website influences more their intention to visit the restaurant. This means that if a virtual agent is integrated to a website, it is important to render the user highly satisfied about the website. Indeed, with the presence of a virtual agent, user’s level of satisfaction will influence its patronage intention much more than without the presence of the virtual agent. Thus, if a virtual agent is not well developed and not ready to answer to questions related to users’ expectations, it is better to not integrate it to the website. In other words, the virtual agent can play a positive role by increasing patronage intention of users, but it can also play a negative role if users are not sufficiently satisfied about the website. As far as the relationship between the
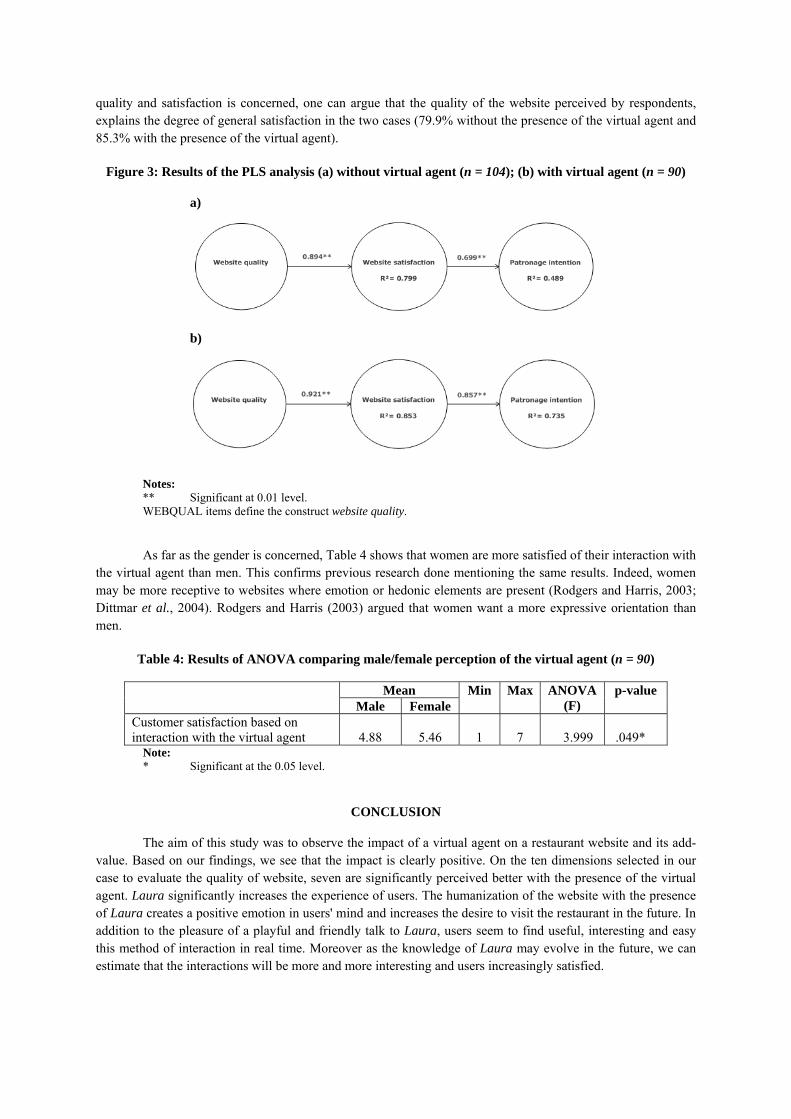
quality and satisfaction is concerned, one can argue that the quality of the website perceived by respondents, explains the degree of general satisfaction in the two cases (79.9% without the presence of the virtual agent and 85.3% with the presence of the virtual agent).
Figure 3: Results of the PLS analysis (a) without virtual agent (n = 104); (b) with virtual agent (n = 90)
a)
b)
Notes: ** Significant at 0.01 level. WEBQUAL items define the construct website quality.
As far as the gender is concerned, Table 4 shows that women are more satisfied of their interaction with
the virtual agent than men. This confirms previous research done mentioning the same results. Indeed, women may be more receptive to websites where emotion or hedonic elements are present (Rodgers and Harris, 2003; Dittmar et al., 2004). Rodgers and Harris (2003) argued that women want a more expressive orientation than men.
Table 4: Results of ANOVA comparing male/female perception of the virtual agent (n = 90)
Mean Min Max ANOVA (F)
p-value Male Female
Customer satisfaction based on interaction with the virtual agent 4.88 5.46 1 7 3.999 .049*
Note: * Significant at the 0.05 level.
CONCLUSION
The aim of this study was to observe the impact of a virtual agent on a restaurant website and its add-value. Based on our findings, we see that the impact is clearly positive. On the ten dimensions selected in our case to evaluate the quality of website, seven are significantly perceived better with the presence of the virtual agent. Laura significantly increases the experience of users. The humanization of the website with the presence of Laura creates a positive emotion in users' mind and increases the desire to visit the restaurant in the future. In addition to the pleasure of a playful and friendly talk to Laura, users seem to find useful, interesting and easy this method of interaction in real time. Moreover as the knowledge of Laura may evolve in the future, we can estimate that the interactions will be more and more interesting and users increasingly satisfied.
REFERENCES
Abbattista, F., Anderson, V., Anderson, H. H. K., Lops, P. and Semeraro, G. (2002), “Evaluating Virtual Agents
for E-Commerce”, First International Joint Conference on AAMAS, Bologna, Italy.
Baker, D.A. and Crompton, J.L. (2000), “Quality, Satisfaction and Behavioural Intentions”, Annals of Tourism
Research, Vol. 27 No. 3, pp. 785-804.
Bitner, M.J., (2001), “Service and technology: opportunities and paradoxes”, Managing Service Quality, Vol. 11
No. 6, pp. 375-379.
Caruana, A. (2002), “Service loyalty: The effects of service quality and the mediating role of customer
satisfaction”, European Journal of Marketing, Vol. 36 No. 7/8, pp. 811-828.
Cassell, J., Sullivan, J., Prevost, S. and Churchill, E. (2000), Embodied Conversational Agents, Cambridge,
MA: MIT Press.
Cronin, J.J. and Taylor, S.A. (1992), “Measuring Service Quality: A Re-examination and Extension”, Journal of
Marketing, Vol. 56, July, pp. 55-68.
Dittmar, H., Long, K. and Meek, R. (2004), “Buying on the internet: gender difference in on-line and
conventional buying motivations”, Sex Roles, Vol. 50 No. 5/6, pp. 423-444.
Dröge, C. (1996), How valid are measurements?, Research Issues, Eli Broad Graduate School of Management,
Michigan State University.
Fassnacht, M. and Koese, I. (2006), “Quality of electronic services: conceptualizing and testing a hierarchical
model”, Journal of Service Research, Vol. 9 No. 1, pp. 19-37.
Fornell, C.R. and Larcker, D. (1981), “Evaluating structural equation models with unobservable variables and
measurement error”, Journal of Marketing Research, Vol. 18 No.1, pp. 39-50.
Gefen, D. and Straub, D. (2005), “A practical guide to factorial validity using Pls-graph: tutorial and annotated
example”, Communications of the Association for Information Systems, Vol. 16 No.5, pp. 91-109.
Holzwarth, M., Janiszewski, C. and Neumann, M.M. (2006), “The Influence of Avatars on Online Consumer
Shopping Behavior”, Journal of Marketing, Vol. 70 No. 4, pp. 19-36.
Hong, S. and Goo, Y.J.J. (2004), “A Causal Model of Customer Loyalty in Professional Service Firms: An
Empirical Study”, International Journal of Management, Vol. 21 No. 4, pp. 531-540.
Jeong, M., Oh, H. and Gregoire, M. (2003), “Conceptualizing web site quality and its consequences in the
lodging industry”, International Journal of Hospitality Management, Vol. 22 No. 2, pp. 161-175.
Keeling, K., McGoldrick, P. and Beatty, S. (2010), “Avatars as salespeople: Communication style, trust, and
intentions”, Journal of Business Research, Vol. 63, pp. 793-800.
Kuan, H.H., Bock, G.W. and Vathanophas, V. (2008), “Comparing the effects of web site quality on customer
initial purchase and continued purchase at e-commerce web sites”, Behaviour and Information
Technology, Vol. 27 No. 1, pp. 3-16.
Ladhari, R. (2009), “Service quality, emotional satisfaction, and behavioural intentions: A study in the hotel
industry”, Managing Service Quality, Vol. 19 No. 3, pp. 308-331.
Law, R. and Bai, B. (2008), “How do the preferences of online buyers and browers differ on the design and
content of travel web sites?”, International Journal of Contemporary Hospitality Management, Vol. 20
No. 4, pp. 388-400.
Lee, H., Lee, Y. and Yoo, D. (2000), “The determinants of perceived service quality and its relationship with
satisfaction”, Journal of Services Marketing, Vol. 14 No. 3, pp. 217-231.
McGoldrick, P. J., Keeling, K. A. and Beatty, S.F. (2008), “A typology of roles for avatars in online retailing”,
Journal of Marketing Management, Vol.24 No. 3-4, pp. 433-461.
Parasuraman A., Zeithaml, V.A. and Berry, L.L. (1985), “A Conceptual Model of Service Quality and its
Implications for Future Research”. Journal of Marketing. Vol. 49, pp. 41-50.
Rodgers, S. and Harris, M.A. (2003), “Gender and e-commerce: an exploratory study”, Journal of Advertising
Research, Vol. 43 No. 3, pp. 322-329.
Schmidt, S., Cantallops, A.S. and Santos, C.P.d. (2007), “The characteristics of hotel web sites and their
implications for web site effectiveness”, International Journal of HospitalityManagement, Vol. 27 No.
4, pp. 504-516.
Straub, D., Boudreau, M.-C. and Gefen, D. (2004), “Validation guidelines for IS positivist research”,
Communications of the Association for Information Systems, Vol. 14, pp. 380-426.
Wang, L.C., Baker, J. Wagner, J.A. and Wakefield, K. (2007), “Can a retail web site be social?”, Journal of
Marketing, Vol. 71 No. 3, pp. 143-157.
Wen, I. (2009), “Factors affecting the online travel buying decision: a review”, International Journal of
Contemporary Hospitality Management, Vol. 21 No. 6, pp. 752-765.
Wood, N.T., Solomon, M.R. and Englis, B.G. (2005), “Personalisation of Online Avatars: Is the Messenger as
Important as the Message?”, International Journal of Internet Marketing and Advertising, Vol. 2 No. 1,
pp. 143-161.
Yi, Y. and Gong, T. (2008), “The electronic service quality model: the moderating effect of customer self-
efficacy”, Psychology and Marketing, Vol. 25 No. 7, pp. 587-601.
Customers’ lighting needs and wants at the restaurant
Caroline Jacquier* & Agnès Giboreau
Food and Hospitality Research Center – Institut Paul Bocuse
8 chemin du trouillat, 69130 Ecully, FRANCE
[email protected]; [email protected]
ABSTRACT
Many researchers have underlined the influence of the lighting on mood, subjective impression and on food consumption. However, light is often underestimated in the conception of a restaurant. The question is which customers’ expectations for lighting are. In-depth interviews were conducted with 22 consumers on their lighting needs and wants at the restaurant. In addition, 3 waiters have been interviewed to give their professional opinion concerning lighting. Customers underlined different needs according to the period of the day, the social environment and the type of the restaurant where they eat. And their wanting about lighting is functional or aesthetic according to their activity during the meal. Different scenarios are recommended to take into account customers’ lighting needs and wants.
Keywords: Restaurant, Lighting, Qualitative method, Perception, Attractive Environment.
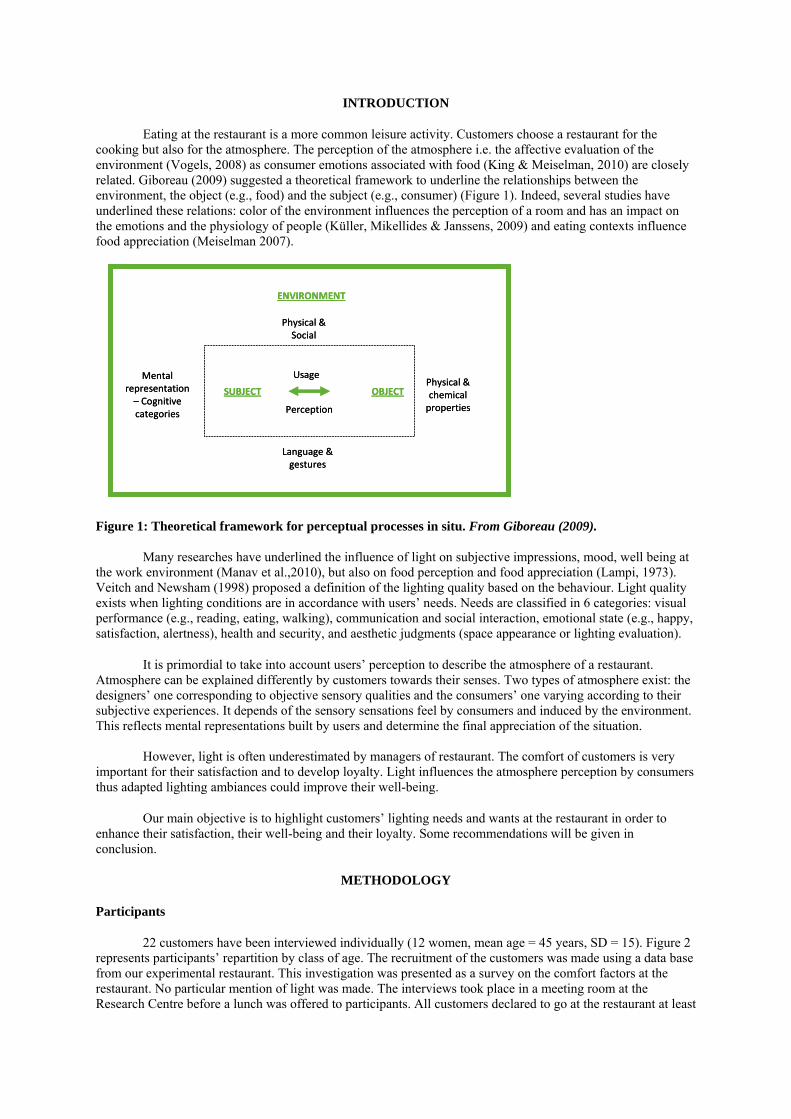
INTRODUCTION
Eating at the restaurant is a more common leisure activity. Customers choose a restaurant for the cooking but also for the atmosphere. The perception of the atmosphere i.e. the affective evaluation of the environment (Vogels, 2008) as consumer emotions associated with food (King & Meiselman, 2010) are closely related. Giboreau (2009) suggested a theoretical framework to underline the relationships between the environment, the object (e.g., food) and the subject (e.g., consumer) (Figure 1). Indeed, several studies have underlined these relations: color of the environment influences the perception of a room and has an impact on the emotions and the physiology of people (Küller, Mikellides & Janssens, 2009) and eating contexts influence food appreciation (Meiselman 2007).
Physical & chemical properties
OBJECTSUBJECT
UsageMental representation – Cognitive categories
ENVIRONMENT
Perception
Language & gestures
Physical &Social
Physical & chemical properties
OBJECTSUBJECT
UsageMental representation – Cognitive categories
ENVIRONMENT
Perception
Language & gestures
Physical &Social
Figure 1: Theoretical framework for perceptual processes in situ. From Giboreau (2009).
Many researches have underlined the influence of light on subjective impressions, mood, well being at the work environment (Manav et al.,2010), but also on food perception and food appreciation (Lampi, 1973). Veitch and Newsham (1998) proposed a definition of the lighting quality based on the behaviour. Light quality exists when lighting conditions are in accordance with users’ needs. Needs are classified in 6 categories: visual performance (e.g., reading, eating, walking), communication and social interaction, emotional state (e.g., happy, satisfaction, alertness), health and security, and aesthetic judgments (space appearance or lighting evaluation).
It is primordial to take into account users’ perception to describe the atmosphere of a restaurant. Atmosphere can be explained differently by customers towards their senses. Two types of atmosphere exist: the designers’ one corresponding to objective sensory qualities and the consumers’ one varying according to their subjective experiences. It depends of the sensory sensations feel by consumers and induced by the environment. This reflects mental representations built by users and determine the final appreciation of the situation.
However, light is often underestimated by managers of restaurant. The comfort of customers is very important for their satisfaction and to develop loyalty. Light influences the atmosphere perception by consumers thus adapted lighting ambiances could improve their well-being.
Our main objective is to highlight customers’ lighting needs and wants at the restaurant in order to enhance their satisfaction, their well-being and their loyalty. Some recommendations will be given in conclusion.
METHODOLOGY
Participants
22 customers have been interviewed individually (12 women, mean age = 45 years, SD = 15). Figure 2 represents participants’ repartition by class of age. The recruitment of the customers was made using a data base from our experimental restaurant. This investigation was presented as a survey on the comfort factors at the restaurant. No particular mention of light was made. The interviews took place in a meeting room at the Research Centre before a lunch was offered to participants. All customers declared to go at the restaurant at least
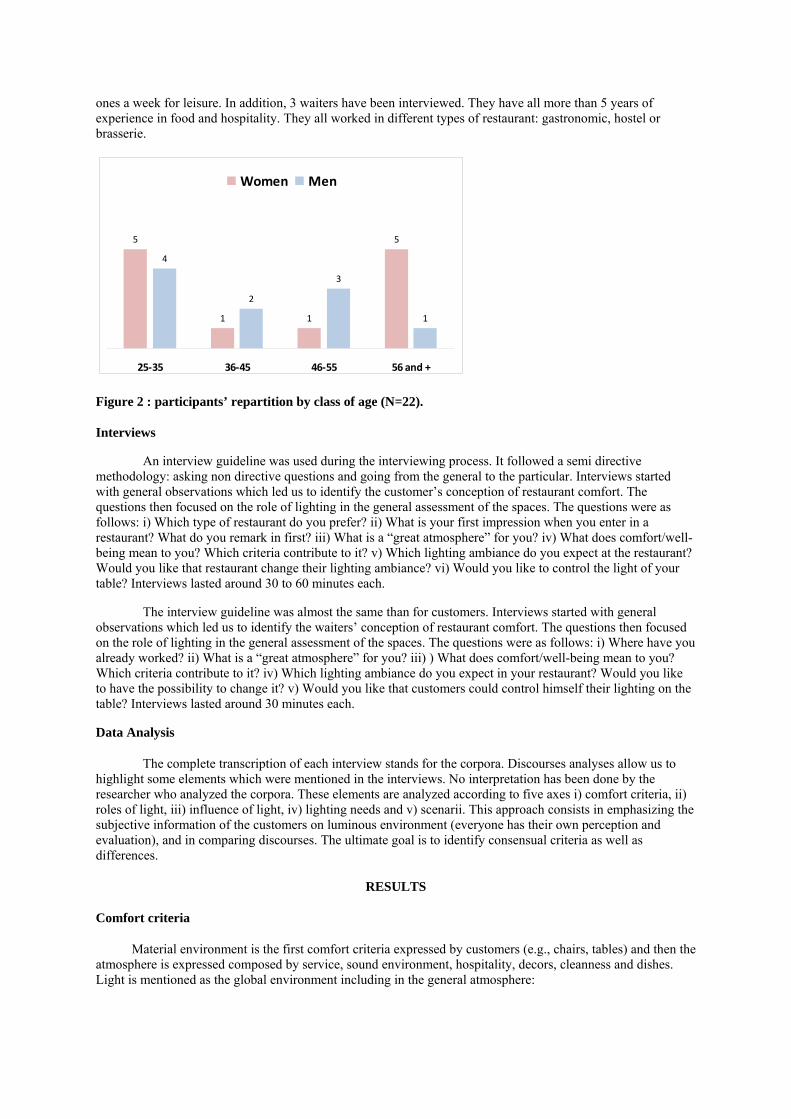
ones a week for leisure. In addition, 3 waiters have been interviewed. They have all more than 5 years of experience in food and hospitality. They all worked in different types of restaurant: gastronomic, hostel or brasserie.
5
1 1
5
4
2
3
1
25‐35 36‐45 46‐55 56 and +
Women Men
Figure 2 : participants’ repartition by class of age (N=22).
Interviews
An interview guideline was used during the interviewing process. It followed a semi directive methodology: asking non directive questions and going from the general to the particular. Interviews started with general observations which led us to identify the customer’s conception of restaurant comfort. The questions then focused on the role of lighting in the general assessment of the spaces. The questions were as follows: i) Which type of restaurant do you prefer? ii) What is your first impression when you enter in a restaurant? What do you remark in first? iii) What is a “great atmosphere” for you? iv) What does comfort/well-being mean to you? Which criteria contribute to it? v) Which lighting ambiance do you expect at the restaurant? Would you like that restaurant change their lighting ambiance? vi) Would you like to control the light of your table? Interviews lasted around 30 to 60 minutes each.
The interview guideline was almost the same than for customers. Interviews started with general observations which led us to identify the waiters’ conception of restaurant comfort. The questions then focused on the role of lighting in the general assessment of the spaces. The questions were as follows: i) Where have you already worked? ii) What is a “great atmosphere” for you? iii) ) What does comfort/well-being mean to you? Which criteria contribute to it? iv) Which lighting ambiance do you expect in your restaurant? Would you like to have the possibility to change it? v) Would you like that customers could control himself their lighting on the table? Interviews lasted around 30 minutes each.
Data Analysis
The complete transcription of each interview stands for the corpora. Discourses analyses allow us to highlight some elements which were mentioned in the interviews. No interpretation has been done by the researcher who analyzed the corpora. These elements are analyzed according to five axes i) comfort criteria, ii) roles of light, iii) influence of light, iv) lighting needs and v) scenarii. This approach consists in emphasizing the subjective information of the customers on luminous environment (everyone has their own perception and evaluation), and in comparing discourses. The ultimate goal is to identify consensual criteria as well as differences.
RESULTS
Comfort criteria
Material environment is the first comfort criteria expressed by customers (e.g., chairs, tables) and then the atmosphere is expressed composed by service, sound environment, hospitality, decors, cleanness and dishes. Light is mentioned as the global environment including in the general atmosphere:
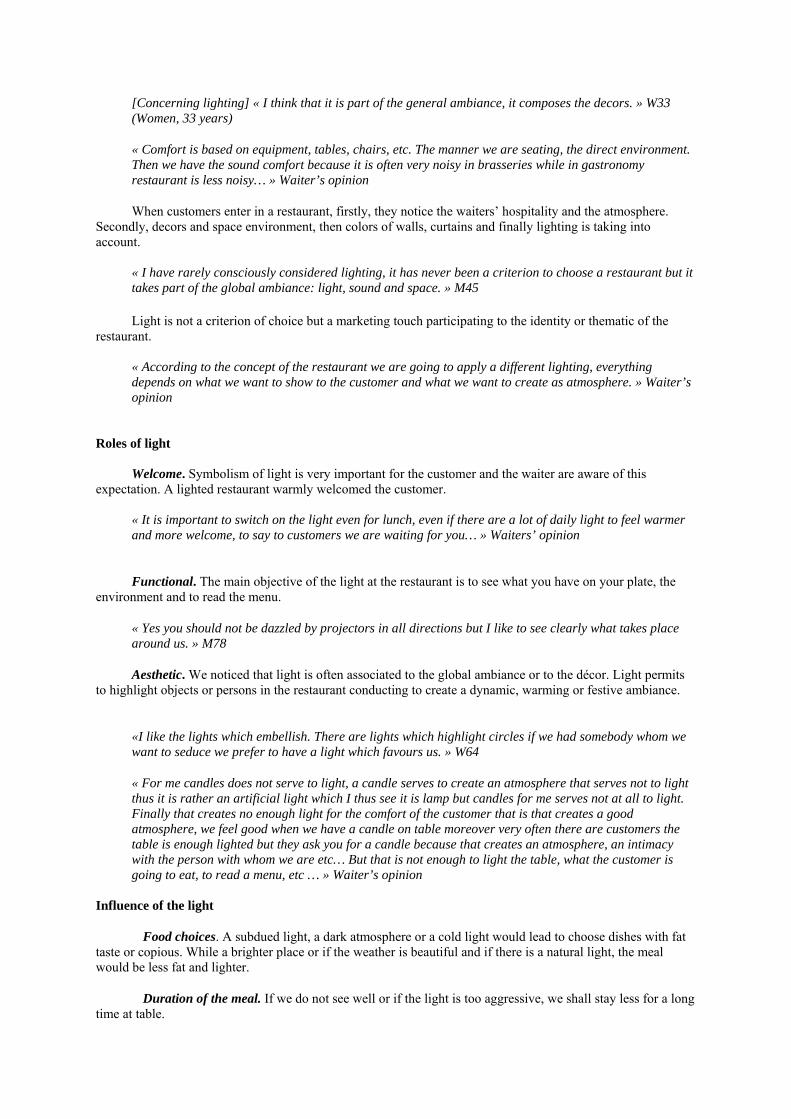
[Concerning lighting] « I think that it is part of the general ambiance, it composes the decors. » W33 (Women, 33 years)
« Comfort is based on equipment, tables, chairs, etc. The manner we are seating, the direct environment. Then we have the sound comfort because it is often very noisy in brasseries while in gastronomy restaurant is less noisy… » Waiter’s opinion
When customers enter in a restaurant, firstly, they notice the waiters’ hospitality and the atmosphere. Secondly, decors and space environment, then colors of walls, curtains and finally lighting is taking into account.
« I have rarely consciously considered lighting, it has never been a criterion to choose a restaurant but it takes part of the global ambiance: light, sound and space. » M45
Light is not a criterion of choice but a marketing touch participating to the identity or thematic of the
restaurant.
« According to the concept of the restaurant we are going to apply a different lighting, everything depends on what we want to show to the customer and what we want to create as atmosphere. » Waiter’s opinion
Roles of light
Welcome. Symbolism of light is very important for the customer and the waiter are aware of this expectation. A lighted restaurant warmly welcomed the customer.
« It is important to switch on the light even for lunch, even if there are a lot of daily light to feel warmer and more welcome, to say to customers we are waiting for you… » Waiters’ opinion
Functional. The main objective of the light at the restaurant is to see what you have on your plate, the environment and to read the menu.
« Yes you should not be dazzled by projectors in all directions but I like to see clearly what takes place around us. » M78
Aesthetic. We noticed that light is often associated to the global ambiance or to the décor. Light permits to highlight objects or persons in the restaurant conducting to create a dynamic, warming or festive ambiance.
«I like the lights which embellish. There are lights which highlight circles if we had somebody whom we want to seduce we prefer to have a light which favours us. » W64
« For me candles does not serve to light, a candle serves to create an atmosphere that serves not to light thus it is rather an artificial light which I thus see it is lamp but candles for me serves not at all to light. Finally that creates no enough light for the comfort of the customer that is that creates a good atmosphere, we feel good when we have a candle on table moreover very often there are customers the table is enough lighted but they ask you for a candle because that creates an atmosphere, an intimacy with the person with whom we are etc… But that is not enough to light the table, what the customer is going to eat, to read a menu, etc … » Waiter’s opinion
Influence of the light
Food choices. A subdued light, a dark atmosphere or a cold light would lead to choose dishes with fat taste or copious. While a brighter place or if the weather is beautiful and if there is a natural light, the meal would be less fat and lighter.
Duration of the meal. If we do not see well or if the light is too aggressive, we shall stay less for a long time at table.
Atmosphere perception. In a dark place, people are quieter, less noisy while when the light is livelier, people are more excited.
“ [Brasserie] Because on a lively place very lit with a lot of noise many traffic we are tired and the nervousness is high whereas when we work in gastronomic restaurant we finish the day more relaxed generally it is really noticeable on both types of restaurant… " Waiter’s opinion
All this verbatim shows the influence of the light on the satisfaction and indirectly on the development of customer loyalty. It thus seems that a reflection around the light and around the lighting of the dining room is essential for a restaurant owner. For example, if the place is too dark and there is not enough light to read the menu, certain customers will not return.
Lighting needs
Customers emphasize that their lighting needs are related to several variables. We identified several situations for which needs in lighting of the users are different. The occasion and the moment of the day are strictly connected: at noon, the lunches are very often business lunches, while in the evening the dinner is more festive between friends, in family or in couple. The moment of the year, the season associated with the weather report and thus the outside natural light also modify needs in terms of lighting, especially in noon. The expectations towards the type of restaurant and/or the level of range of the restaurant will not also be the same.
The moment of the day. At noon, the meals are very often for business thus needs are important in terms of light for having a dialogue with the interlocutor, for observing these reactions, its behavior, a lively and stimulating light is preferred. The major objective of the lunch is to feed. While in the evening, more often between friends or in family thus we need less light, less strong light, more subdued that is a discreet light which does not draw the attention: an indirect lighting, on the sides which lights walls and decoration. The evening, the customers go to the restaurant to relax and eat by pleasure. The light is going to relax and to create an intimate atmosphere.
“Noon, well lit restaurant, to see what we have in our plate, after the evening it is particular: more cosy atmosphere, more subdued, not big lively lights, more pleasant, as if we were in our salon. In noon generally it is often within the framework of the work, the fact of being exposed to the light it is not important but in the evening it is good to be in an a little more intimate atmosphere. …” M30
What also characterizes noon, it is the presence of natural light that lead to a very clear and bright place.
«The light creates an atmosphere especially in the evening, at noon we have the daylight. » W58 “According to the moments of the day, the lighting is totally different because generally we take advantage of the daylight to light its room, we try to decrease a maximum the energy consumption especially now.” Waiter’s opinion.
Concerning colors, at noon, colors yellow, blue or green lead to a more cheerful place, while the evening, the atmosphere is more festive thus warmed colors as red, orange were expressed by customers. These warmed colors create a warming atmosphere as at home.
The social environment. The persons with whom we go to the restaurant are also a factor of variation of needs in light. In family or during a meal with colleagues, the light needs to be more important for seeing itself, for exchanging. With friends or in couple, the level of light can be lower. In couple, the atmosphere wants more subdued to create a more intimate, romantic atmosphere. It is also convenient to the relaxation. In terms of lighting, this subdued atmosphere can be translated by candles or light on the table: a discreet light which creates a private atmosphere and a light which embellishes. Concerning colors, the yellow, the green and the blue correspond to the relaxation.
“In couple, felted light and in group, more lively light because so big table, more difficult communication between feet of the table.” M51
The weather or the season. Changes of atmosphere can be also envisaged according to the seasons and thus the corresponding weather report. It exists a congruence according to the seasons with the proposed menu and the light. In summer, most of people prefer to eat outside and thus to take advantage of natural light, for the
lunch but also for the dinner, the light is not aggressive. In summer, the customers less need light than the winter: discreet lights on the table. The colors of the lightings are more floral or yellow. In winter, so the weather is gray, the customers need to find of the luminosity in the restaurant. Colors are warmer: orange, red, etc.
“In winter, I prefer when there is more light. (...) I would say that in summer if I have the feeling that the light is less strong, that would disturb me less. On the other hand in winter it is clear that I like having a little more light. (...) Clear and yellow light rather the summer and conversely I prefer white light in winter.” M40
The type of restaurant. Customer expectations also depend on types of restaurant that they chose. They expect that the bright atmosphere is in coherence with the cooking, the concept and the theme of the restaurant. In these cases, the bright atmosphere is more easily accepted if there is a harmony with the spirit of the restaurant because it is the food which is highlighted in these restaurants.
“In the brasserie Georges, a lot of neon, that does not disturb me because I know what to expect. According to the type of restaurant that we choose the atmosphere be going to be friendlier, more intimate...” M51
“The lighting has to adapt itself to the spirit of the restaurant, traditional or contemporary where the light is going to be different where we want to be surprised (…) The lighting has to adapt itself to the structure, to the room (…) The light has to be in adequacy with the environment. It is a little bit paradoxical because the customer likes to be surprised but he likes to have his marks.” Waiter’s opinion
The change of atmosphere allows surprising the customer but while keeping the integrity of the basic concept of the restaurant which the customer likes. Also, according to the level of range of the restaurant, the expectations can be different in terms of bright atmosphere. Furthermore, the light can be associated with the cleanliness of the restaurant.
Scenarios
What is paradoxical is that the customers wish to feel as at home but also as host. Thus, it is necessary to try to recreate the atmosphere of their housing environment by surprising them. It is worth noting that the scenario has to be in accordance with the theme of the restaurant and that there is a coherence in the change of atmosphere.
Different scenarios have been proposed by customers (e.g., dynamic lighting: brightness at the beginning of the meal and dimming at the end of the meal). Few parameters have been cited by customers to induce lighting changes. For instance, customers declare to want high-intense lighting at the beginning of the meal, at the entrance or with colleagues. This dynamics would follow the evolution of the menu, but also implies an individual management of every table or all the tables should have the same rhythm (e.g. the experimental restaurant of the Research Centre of the Institute Paul Bocuse).
“To read the menu we need all the same the light and then after if we, for example, have an apéritif we can dim the light, when the dish arrives we can raise just a little, because when we eat we need to see what we eat, but for example for the apéritif if there is a little less light, a little more subdued atmosphere, it is more pleasant.” W32
« We could imagine a rather strong light to begin because we meet each other, because we have an apéritif, because we need to see itself and then as the meal begins we decrease a little the light by putting very precise points of light on the table and then we could end the meal with small notes of colour. We would leave in a traditional way to end in a contemporary way that would be funny to see. I think that customer would be surprised by this change, can be that he would have the impression of dinner in 3 or 4 different establishments.” Waiter’s opinion
The dynamic light can guide the customer to its table and create a “Waouh effect” which personalizes and gives an identity to the restaurant.
Another recurring idea cited by the customers but also by the waiters is the separation of the room in small areas to isolate tables, for example by means of bright curtains. This diversity of small areas and
"privative" sectors is perceived as an argument of development of customer loyalty. The possibility of proposing two rooms is positively accepted by the customers.
“For me it is a choice of the restaurant owner in the room in which he welcomes us. I do not find that inconsistent that a restaurant has 4 rooms and that in and whether it is 4 different bright atmospheres.” W44
“For me it is always important to stay on this principle to create a space for the customer that it does not feel he in the middle of a room, that he feels that his table it is the center of the room. " Waiter’s opinion
Otherwise, participants would control the light of their table by themselves while others consider themselves as guests so they do not want to do anything. The latter is in agreement with the point of view of waiters.
“Anyway I always thought that the customer had to be there to take advantage but he had to avoid interacting with what we propose him because very often that be the latest fashion for a moment to make the customer interact but I think that we deviate from what we want to propose really and what we propose him and we risk to have a rather important modification of the end product which we wanted to present. " Waiter’s opinion
CONCLUSION
The role of the light
However in the sector of the catering and hotel business, the light plays an important role, most of the time unconsciously. The light is a strong symbol that the customer is welcome; a lit lamp means to the customer that we wait for him.
The light is also going to influence the behavior of the customers at the restaurant and is thus going to have an effect on their comfort and their well-being. It is thus important for the restaurant owner to take into account this sensory aspect during the conception and the creation of his establishment (Ryu & Han, 2011).
The light has two very different roles: the first one is to emphasize people and objects that is an aesthetic dimension while the second is to light to allow certain activities, it is the functional dimension. The light is often associated with the decoration, in the atmosphere and the customers do not pay it particularly attention. On the other hand, when they are disturbed by a lack or a surplus of light and when it prevents them from making an activity, they perceive the lighting.
Needs in terms of lighting are variable according to the situations
To the restaurant, needs vary, mainly, according to the moment of the day (lunch, dinner), the occasions and the persons who accompany us (family, friends, colleagues).
The recommendations in terms of scenarios
It is important to take into account these various situations at the restaurant to imagine the various scenarios that can be proposed. Various scenarios were proposed in the results section. However, the parameters to be made vary are only a few of them: the luminous intensity, the color of the light, the orientation and the position of lamps and also the number of light sources. Thanks to the modification of these parameters, numerous scenarios can be envisaged but a number restricted by scenarios countered preferable not to complicate the access to the system by the customer and the restaurant owner.
The customer of the restaurant considers as a guest at his host thus he wants to be surprised and taken care. The implementation of dynamic and automatic scenarios is relevant to surprise the customer and satisfy him. Furthermore, the creation of various rooms with different bright atmospheres could answer customer expectations according to the situations (work, leisure).
A difficulty revealing by all the professionals of the catering and hotel business is the sustainability of a bright atmosphere. The changes of staff and the changes of arrangement of the furniture lead to a loss of the harmony of the direction and the result can be annoying for the final user.
Managers of restaurant have to think about the lighting during the conception of their project and especially to make it durable. Indeed, many studies have shown the importance of the light in a customer’s experience. Our study has evidenced that it is relevant to take care of several aspects for lighting as situations (e.g., lunch or diner), target population and parameters of variation. The main proposal would be to have the opportunity to instate different areas in the restaurant differently lighted or to have only one service starting at the same time with a dynamic lighting (e.g., this is conceivable at the experimental restaurant of the Institut Paul Bocuse).
REFERENCES
Giboreau, A. (2009) De l'analyse sensorielle au jugement perceptif : l'exemple du toucher, Habilitation à diriger des recherches, Université Claude Bernard Lyon 1, 12 février 2009.
King, S.C., & Meiselman, H.L. (2010). Development of a method to measure consumer emotions associated with foods. Food Quality and Preference, 21(2), 168-177.
Küller, R., Mikellides, B., & Janssens, J. (2009). Color, Arousal, and Performance – A comparison of three experiments. Color Research & Application, 34(2), 141–152.
Lampi E. (1973). Hotel and Restaurant Lighting. Cornell Hotel and Restaurant Administration Quarterly, 13, 58-64.
Manav, B., Kutlu, R. G., & Küçükdoğu, M. S. (2010). The Effects of Colour and Light on Space Perception. Colour and Light in Architecture First International Conference 2010 Proceedings.
Meiselman, H. L. (2007). The impact of context and environment on consumer food choice. In Frewer L. & van Trijp H. (Eds.) Understanding consumers of food products (pp. 67–92). Cambridge: Woodhead.
Ryu, K., & Han, H. New or repeat customers: How does physical environment influence their restaurant experience? International Journal of Hospitality Management, 30(3), 599-611.
Veitch, J.A., & Newsham, G. R. (1998). Lighting Quality and Energy-Efficiency Effects on Task Performance, Mood, Health, Satisfaction and Comfort. Journal of the Illuminating Engineering Society. 27(1):107–29.
Vogels, I. (2008). Atmosphere Metrics: Development of a Tool to Quantify Experienced Atmosphere. International Symposium Creating an Atmosphere.
Frequency and magnitude of Emotional descriptors of hospitality customer reviews: an index validation
Samad Laaroussi & Lohyd Terrier
Ecole hôtelière de Lausanne Lausanne, Switzerland
Email: [email protected] [email protected]
ABSTRACT
The main objective of this paper is first to validate from the customers’ point of view the accuracy of the
emotional word descriptors based on Geneva Affective Label Coder (Scherer, 2005). What word is mostly describing a specific emotion? Which word is stronger than the others in describing the same emotion? The final objective of this exploratory research is to build an emotional index that measures, based on expressed commentaries, how customers are delighted or frustrated by a brand or a specific property. Methods initially used are a literature review, followed by a quantitative approach where respondents were asked to rank various terms depending on the intensity with which they described a specific emotion. The final version of the dictionary will be applied to over 50 random properties, located in London with approximately 2685 commentaries and 500,000 words to assess the accuracy of the suggested emotional index. Key words: social media, commentaries, text-mining, emotions descriptors
INTRODUCTION
The terms user generated content (UGC) and social media are often used interchangeably with Web 2.0 (Constantinides & Fountain, 2008; Kaplan & Haenlein, 2010). As hospitality organizations place more emphasis on social media for communication and feedback from customers and potential customers, it is important to examine the emotions, also referred to as sentiments, expressed in the context of social media in the post-purchase sharing of experiences. Emotion acts as a “memory marker” (Ahn, Liu & Soman, 2007), therefore it raises important issues as to how customers summarize their hotel experience in text-based commentaries on sites such as TripAdvisor. Particularly of interest are how they express emotions in these commentaries and how the negative and positive emotions are translated into words. The words people use reveal important aspects of their hotel experience evaluation. It is now broadly accepted that our consumption behavior and decisions are significantly influenced by our emotions (Kwortnik & Ross, 2007). In the context of decision-making processes, Morris, Woo, Geason & Kim (2002) concluded that emotions are twice as important as “facts” in the process by which people make buying decisions. The hospitality industry is more than ever an experience provider and consumers are not only buying a room or a meal but an extended stay or event. The hotel is often only one component of an experience which could also be in the context business, leisure or business / leisure. Therefore, depending on the travel motivation, the emotions experienced in a hotel vary by nature and intensity (Barsky & Nash, 2002). Emotions are subjective reactions that could be generated by a positive or negative stimulus in the hotel service scape (Barsky & Nash, 2002). Consequently, a measurement of the emotional experience based on the word expressed by guests may enhance our understanding not only of the drivers of on line recommendation but also the key differentiating factors from one brand to another.
Anonymity in online environments allows people to express themselves and assume authority which they could not as easily claim in an offline situation (Brown & Reingen, 2001). Earlier research (Murphy &
Holzgreve, 2008) show that motivation is usually altruistic but that the highest ranking negative motivation to publish comments is to” warn others” that they have had a negative experience rather than motives of “revenge” or “venting anger”. In the positive motivations, it is clear that both the motivation to comment, to support the hotel and share a positive experience is significant. This motivation and desire to share emotions and opinions is facilitated and encouraged by the wealth of platforms that are now available online, with commercial websites like TripAdvisor, which are actively soliciting opinions from hotel guests, particularly those that have booked through their partner travel agencies.
LITERATURE REVIEW
Emotions Studies regarding emotions have created considerable debated since James (1890) and Lange (1885)
foundational works. To avoid going into any of these details, related to the theoretical and methodological debates, we chose to focus on the cognitive evaluation approach (Sander, Grandjean & Scherer, 2005; Siemer, Mauss & Gross, 2007), such as the actual reference, to give meaning, differentiate and evaluate emotions (Coppin and Sander, 2010). They depend on the fact that the release of an emotion is due to a cognitive evaluation of a stimuli. To be more precise, an emotion would be a sequence of steps generating the subjective feeling that we would consider as an emotional episode. Going back to Scherer’s (2001) definition, the emotion would correspond to “a group of episodic variations within several parts of the organism, responding to events evaluated as important for the organism”. In other words, we should consider an emotion as a dynamical phenomenon, to which the manifest character is only an aspect. Scherer (1984) postulates indeed that an emotion is multidimensional, and implies five dimensions:
- (a) a component evaluating the cognitive aspect of the stimuli or situation, that would be an aspect part of the emotional process (Clore & Ortony, 2000),
- (b) a physiological component, - (c) a motor expression component (facial and vocal expression, posture and gestural), - (d) a motivational component, including tendency to action, - (e) a subjective feeling component, reflecting emotional experiences.
It is very frequent that this last component tends to be considered as an emotion and not only as one of its component. The subjective feeling corresponds to the changes operated in the four other emotional process components (Scherer, 2005). In the case of a client that discovers a dead insect in his bath.
- (a) He is surprised to find an insect in his bath - (b) This surprise, directly linked to the unpleasant nature of the stimuli, generates an increase of the
general level of activity, his eyes and his mouth opens… - (c) His face crunches, he jumps back - (d) He moves away from the insect - (e) He feels disgust
A few days later, when he will give his opinion regarding his stay in the hotel, it is this emotion, disgust, that will influence his speech. This conception of emotion answers the critics made towards basic emotions theories (Ekman, 1992), such as setting limits to the study of emotions, to seven primary emotions (surprise, anger, joy, sadness, fear, contentment and disgust) and reducing the precision of the emotional episode evaluation (Mandler, 1984). In fact, this model, suggests redrawing any theoretical limits to the amount of emotions. Potentially, every stimuli evaluation could generate a particular emotion.
Measuring Emotions On this basis, accepting this definition also implies reconsidering and multiplying the tools used to measure
emotions (Mauss & Robinson, 2009). Therefore, complete methods that could measure each aspect of an emotion do not yet exist. Thus, according to the objectives of the research, an emotion will be measured by the nervous system activity (although these results are still discussed, Cacioppo, Berntson, Larsen, Poehlmann & Ito, 2000), the level of arousal (Mauss & Robinson, 2009), the cerebral system activity (Izard, 2007; Panksepp,
2007), behavior measurement such as facial movement (Ekman & Friesen, 1971), or self-report measures (Robinson & Clore, 2002). These, could help come closer to the perception an individual will have of the emotional episode by asking him to auto-evaluate this episode. Furthermore, according to Robinson and Clore (2002) the self-report measures – when reporting to recent emotional episodes – provide a correct measurement of the subjective feeling experienced by the individuals. These self-report measures may become a reality through two types of methods:
- The first one implies asking individuals to report the experienced emotion by choosing one amongst a set of emotions. If this method allows collecting relatively simple answers, it also implies a restriction in the individual’s choice of answers. Furthermore, these categories are usually linked to the researchers’ objectives, and therefore could possibly direct and influence the individual’s answers.
- The second method requires individuals to express the emotion experienced in a free manner. Doing so, researchers avoid restricting individuals’ answers, getting closer to a natural setting, comparable to an online hotel journey survey. Nevertheless, giving entire freedom to individuals to name their emotions makes the results data process more complex. In fact, the custom aspect of this method, usually translates, in terms of results, into a considerable amount of labels, but a considerable lack of occurrence. It is therefore up to the researchers to realize a category, a posteriori, able to process the obtained quantitative results. This categorization, based on a semantic or intuitive ground, on X theory or Y theory, also brings the question related to the researcher’s subjectivity up.
To answer this question, and face the problems linked to a subjective coding of the emotional answers, Scherer (2005) suggests the use of a standard tool: The Geneva Affective Label Coder. Inspired by a macro Excel program, the GALC allows the coding of any written message with the help of 36 affective categories, each including words that enhances the use of a natural language, used to describe an emotion (synonym and associated words). This tool was created from an experimental survey, used to collect verbal labels involved in the description of episodes, or emotional situation, and several preexisting inquiries conducted on emotional terms (Averill, 1975; Gehm and Scherer, 1988; Russell, 1983). It enables a certain coordination of the collected data coded in a free manner, using a basic emotion glossary, based on cognitive evaluation theories (Coppin & Sanders, 2010). To this day, the GALC allows the coding of individual’s answers, according to the following categories: Admiration, amusement, anger, anxiety, being touched, boredom, compassion, contempt, contentment, desperation, disappointment, disgust, dissatisfaction, envy, fear, feeling love, gratitude, guilt, happiness, hatred, hope, humility, interest / enthusiasm, irritation, jealousy, joy, longing, lust, pleasure /enjoyment, pride, relaxation / serenity, relief, sadness, shame, surprise, tension /stress and two other categories (negative and positive) (Scherer, 2005). Nevertheless, the GALC may define the emotional valence of a message, it doesn’t yet give any information regarding the intensity of it. In fact, labels such as happy and euphoric may be related to the joy emotional category, they don’t necessarily express it with the same intensity. Yet, the intensity of an emotion is an essential aspect to define the impact it has, and also the reading the individual will make of it (Sonnemans & Frijda, 1994).
Emotions expressed online and hotels Are emotions online different? Certainly there are now more opportunities to express one’s opinions and
thoughts than ever before with a potentially wider audience including less censorship and more multi-media sharing of content. Social desirability of responses and monitoring it implies classic criticisms against self-report measures (Mauss & Robinson, 2009). Therefore, we could even think that online emotions are closer to reality than emotions measured with traditional tools. Desmet, Güiza Caiedo & Van Hout (2009) state that hotels do not generally measure emotions and rely on an assessment of service attributes rather than emotional measurements i.e. guest surveys. Desmet et al. (2009) gather data from customers regarding the online context using 14 emotions indicators and drew conclusions that particular eliciting conditions gave rise to particular emotions with the most common positive emotions expressed as enjoyment, satisfaction and admiration with the negative emotions most expressed concerning hygiene.
The main objectives of this paper are: 1. To validate from the customers’ point of view the accuracy of the word descriptors developed in the
“Geneva Affective Label Coder”, in the context of hotel customer reviews. 2. To apply and validate the accuracy of an emotional index (based on comments from Tripadvisor) by
investigating the differences between “Five star/ luxury” and “Economy /budget” hotels in term of emotions scores.
METHODOLOGY
Our methodology is divided in two steps Step 1: Based on the GALC, a dictionary composed of 14 positive emotions and 11 negative was created. On
this basis, a survey was created and published online. A snowball sampling technique was applied allowing to build a sample of 95 respondents. All respondents were asked to classify the key words associated with each of the 25 emotions by classifying them, based on their own point of view, according to their intensity levels. The survey clearly asked the respondents to project them-selves in the context of hotels comments. Therefore, we were able to calculate an average weight for the 101 word descriptors associated with the 25 emotions. Not all the words were equally interpreted by the reader or the publisher of commenst about hotel customer experiences. Theoretically, this allowed calculating the emotional load average, based on the frequency of a particular word in a comment left by a customer. By subtracting the total score of positive emotions from the negative ones, we were able to calculate an emotional net score index.
Step 2: consisted in applying our theoretical emotional net score index to a set of unsolicited comments collected
through Tripadvisor. London hotel properties were chosen as a test market for our emotional index because of its variety of proprieties and international travelers with a good combination of business and leisure. For a comparative purposes and for this paper only, this sampling frame was divided into “Five star/ luxury” and “Economy /budget” hotels. There are 107 economy /budget hotels category and 68 in the category of five star/ luxury rated in tripadvisor.com. Within each of these two samples, 30 properties are randomly selected and the 50 to 100 most recent comments were used per hotel. The sample of our study was composed of 30 economy /budget hotels (16 from one star and 14 of two star rating) and 1767 unique commentaries are collected. The five star/ luxury category is composed of 10 hotels with a total 918 commentaries collected to calculate the emotional net score index (ENSI) for each of these properties located in London. The total of commentaries used in this study was 2685 (> 500 000 descriptive words). The last step consisted of comparing the ENSI with the Ranking calculated by Tripadvisor based on the 1069 hotels located in the region of London.
RESULTS
An average weight for the 101 word descriptors associated with the 25 emotions was computed (appendix n°1). The theoretical formulation of the emotional net score index (ENSI) was the following:
ENSI = ∑npositiveemoscore ∑nnegativeemoscore Where ∑npositiveemoscore ∑ descriptors ∗ avergeweight nemotion
The ENSI for the total properties in our sample was calculated (appendix n°2). The ENSI score were then compared to the actual score attributed by Tripadvisor based on the total reviews collected for 1069 hotels in the region of London by using a correlation analysis. The results show a strong significant relationship (P= -0.735) sig 0.01 and proves the accuracy of the ENSI in estimating and classifying hotel performance based on the emotions they generate to their customers. On the other hand the strength of the relationship clearly varies by segment. In the Graph n°1 the listing of the hotels on the X axe is ascending from
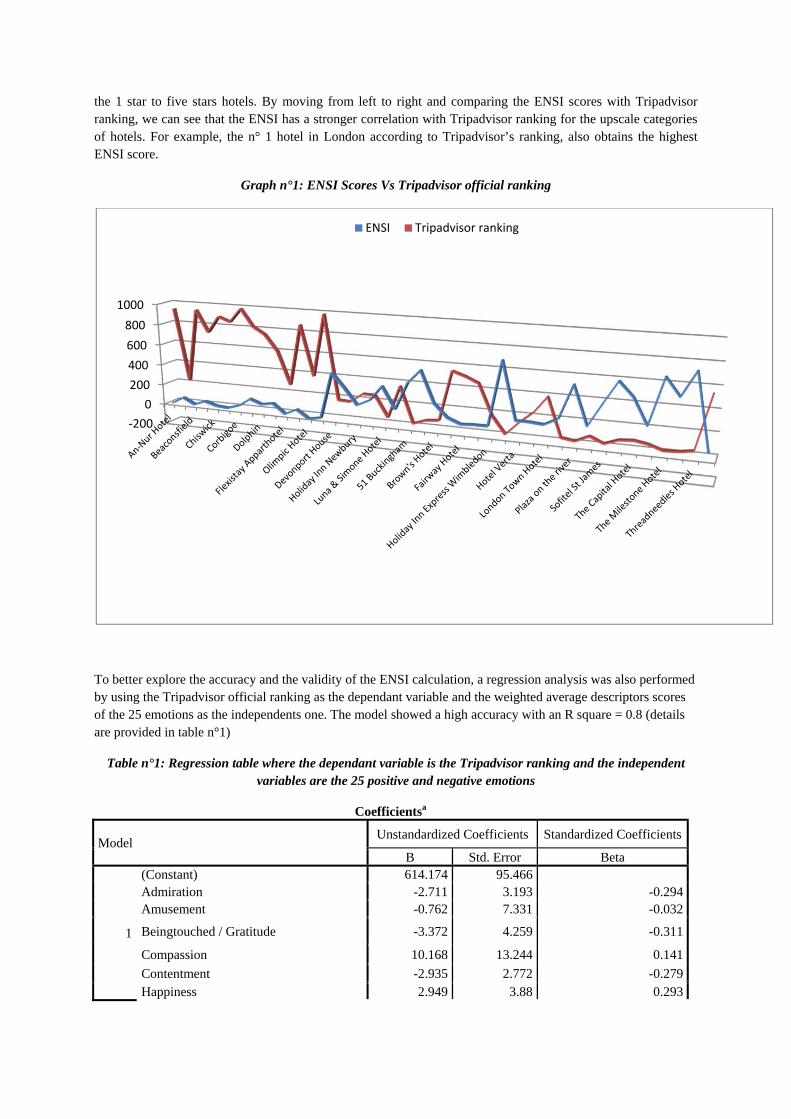
the 1 star to five stars hotels. By moving from left to right and comparing the ENSI scores with Tripadvisor ranking, we can see that the ENSI has a stronger correlation with Tripadvisor ranking for the upscale categories of hotels. For example, the n° 1 hotel in London according to Tripadvisor’s ranking, also obtains the highest ENSI score.
Graph n°1: ENSI Scores Vs Tripadvisor official ranking
To better explore the accuracy and the validity of the ENSI calculation, a regression analysis was also performed by using the Tripadvisor official ranking as the dependant variable and the weighted average descriptors scores of the 25 emotions as the independents one. The model showed a high accuracy with an R square = 0.8 (details are provided in table n°1)
Table n°1: Regression table where the dependant variable is the Tripadvisor ranking and the independent variables are the 25 positive and negative emotions
Coefficientsa
Model Unstandardized Coefficients Standardized Coefficients
B Std. Error Beta
1
(Constant) 614.174 95.466 Admiration -2.711 3.193 -0.294Amusement -0.762 7.331 -0.032
Beingtouched / Gratitude -3.372 4.259 -0.311
Compassion 10.168 13.244 0.141
Contentment -2.935 2.772 -0.279Happiness 2.949 3.88 0.293
‐200
0
200
400
600
800
1000
ENSI Tripadvisor ranking
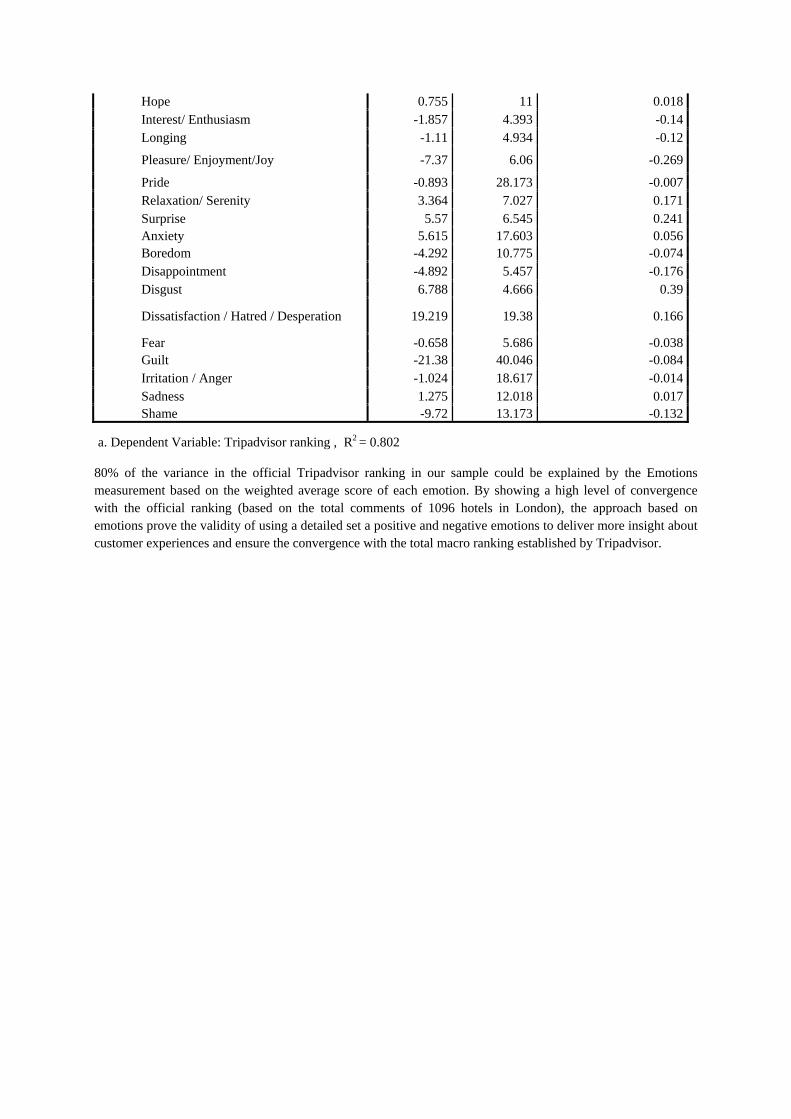
Hope 0.755 11 0.018Interest/ Enthusiasm -1.857 4.393 -0.14Longing -1.11 4.934 -0.12
Pleasure/ Enjoyment/Joy -7.37 6.06 -0.269
Pride -0.893 28.173 -0.007Relaxation/ Serenity 3.364 7.027 0.171Surprise 5.57 6.545 0.241Anxiety 5.615 17.603 0.056Boredom -4.292 10.775 -0.074Disappointment -4.892 5.457 -0.176Disgust 6.788 4.666 0.39
Dissatisfaction / Hatred / Desperation 19.219 19.38 0.166
Fear -0.658 5.686 -0.038Guilt -21.38 40.046 -0.084Irritation / Anger -1.024 18.617 -0.014Sadness 1.275 12.018 0.017Shame -9.72 13.173 -0.132
a. Dependent Variable: Tripadvisor ranking , R2 = 0.802
80% of the variance in the official Tripadvisor ranking in our sample could be explained by the Emotions measurement based on the weighted average score of each emotion. By showing a high level of convergence with the official ranking (based on the total comments of 1096 hotels in London), the approach based on emotions prove the validity of using a detailed set a positive and negative emotions to deliver more insight about customer experiences and ensure the convergence with the total macro ranking established by Tripadvisor.
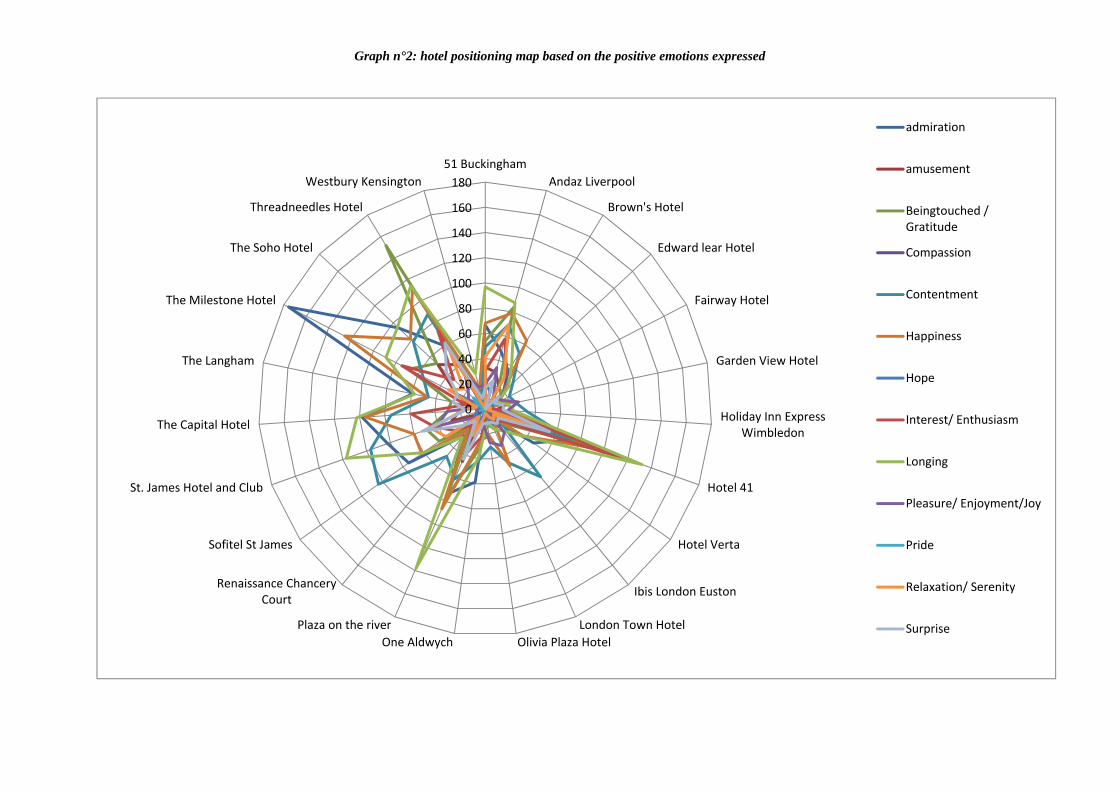
Graph n°2: hotel positioning map based on the positive emotions expressed
0
20
40
60
80
100
120
140
160
180
51 Buckingham
Andaz Liverpool
Brown's Hotel
Edward lear Hotel
Fairway Hotel
Garden View Hotel
Holiday Inn ExpressWimbledon
Hotel 41
Hotel Verta
Ibis London Euston
London Town Hotel
Olivia Plaza HotelOne Aldwych
Plaza on the river
Renaissance ChanceryCourt
Sofitel St James
St. James Hotel and Club
The Capital Hotel
The Langham
The Milestone Hotel
The Soho Hotel
Threadneedles Hotel
Westbury Kensington
admiration
amusement
Beingtouched /Gratitude
Compassion
Contentment
Happiness
Hope
Interest/ Enthusiasm
Longing
Pleasure/ Enjoyment/Joy
Pride
Relaxation/ Serenity
Surprise
Graph n°2 reveals the positioning of the five stars hotels in our sample based on the positive emotion set. The number one hotel in London Hotel 41 shows clearly a high ability of generating a combination of positive emotion exceeding the competition. The other hotels can also identify the emotion that clearly differentiates them on the market.
CONCLUSIONS AND RECOMMENDATIONS
The objective of this research was to adapt the GALC in hospitality field. To do this, we have reduced Scherer's categories (2005) in 25 categories making sense to assess the quality of a hotel. Here, our dictionary, more than just a description of the emotional content of a message, can access its intensity. This is essential both to assess the valence of a message (positive and negative intensity), but also to create messages. In the interest of the comparability and cumulativeness of findings from different studies, we propose to use this index in future research on this topic. Thus, the results can be compared on a common basis (e.g. to create scenarios, or comments, needed to study emotions).
Beyond the mere validation of our dictionary, results also show that the emotional score allows us to predict the ranking of a hotel on Tripadvisor. Therefore, it offers to hoteliers the opportunity to assess the emotional impact of their hotel and to measure impact of this variable on its ranking on Tripadvisor. Finally, beyond the simple ranking on Tripadvisor, the emotional impact of a product is an essential element of customer satisfaction. Hoteliers could then use the dictionary to determine the variables on which they must work and those on which they can rely.
From a methodological point of view, the usage of unstructured and unsolicited data from Tripadvisor shows a real opportunity for researchers to understand more about customer experience without using the classical survey methods. The challenge is to translate this raw material and give a meaning to it by quantifying a qualitative content. For this purpose, the results of our research are very promising and encouraging to continue exploring this new field. On the other hand, there are obvious limitations related to the two samples used in this research and mainly the sample used to test the accuracy of the ENSI related only to London city hotels.
Based on our approach, hoteliers can now explore the impact of the experience their deliver to their customers and their ability to generate certain type of emotions. It is not only anymore about how satisfied my customers are about my hotel but how delighted, relaxed or inspired there are. Hoteliers can exploit the emotional appeal in these commentaries to improve brand image or sales conversions through search engine marketing optimization. The most frequent or important word descriptors could be used to improve the organic ranking through search engine websites. The set of positive and negative emotions could also be used to generate positioning maps (Graph n°2) and give hotelier a clear idea of how their value proposition and the brand values are perceived and interpreted by the customer. Additionally, identifying the key emotions that provoke recommendations is critical to hoteliers as they might concentrate on stimulating these emotions, through both tangible elements and non-tangible elements to encourage repeat visits and visible recommendation trough customer review websites and social media.
REFERENCES Ahn, H-K, Liu, M., & Soman, D. (2009), Memory markers: How consumers recall the duration of experiences, Journal of Consumer Psychology, 19 , 508-516. Averill, J.R. (1975). A Semantic Atlas of Emotional Concepts, JSAS Catalog of Selected Documents in Psychology 5, 330. (Ms. No. 421) Barsky, J., & Nash, L. (2002). Evoking emotion; affective keys to hotel loyalty. Cornell Hotel and Restaurant Administration Quarterly, 43(1), 39-46. Brown, J. J., & Reingen, P. H., (1987). Social Ties and Word-of-Mouth Referral Behaviour. Journal of Consumer Research, 14, 350-362. Cacioppo, J. T., Berntson, G. G., Larsen, J. T., Poehlmann, K. M., & Ito, T. A. (2000). The psychophysiology of emotion. In M. Lewis & J. M. Haviland-Jones (Eds.), The handbook of emotion. New York: Guildford Press. Clore, G.L., & Ortony, A. (2000). Cognition in emotion: always, sometimes or never? In R.D. Lane, & L. Nadel (Eds.), Cognitive neuroscience of emotion (pp. 24-61). Oxford: Oxford University Press. Coppin, G., & Sander, D. (2010). Théories et concepts contemporains en psychologie de l’émotion. In C. Pelachaud (Ed.). Systèmes d’Interaction Emotionnelle (pp. 25-56). Paris : Hermès Science. Constantinides, E., & Fountain, J.S. (2008). Web 2.0: Conceptual Foundations and Marketing Issues. Journal of Direct Marketing, Data and Digital Marketing Practice: Special Issue: Web 2.0, 9(3), 231-244. Retrieved March 17, 2010, from ABI/INFORM Global database. Desmet, P.M.A., Güiza Caicedo, D., & Van Hout, M, (2009). Differentiating Emotional Hotel Experiences. Paper and presentation at EuroCHRIE Helsinki. Ekman, P., & Friesen,W. V. (1971). Constants across cultures in the face and emotion. Journal of Personality and Social Psychology, 17(2), 124-129. Ekman, P. (1992). An argument for basic emotions. Cognition and Emotion, 6, 169-200. Gehm, Th. and Scherer, K.R. (1988). Factors Determining the Dimensions of Subjective Emotional Space, in K.R. Scherer (ed.) Facets of Emotion: Recent Research (pp. 99–114). Hillsdale, NJ: Erlbaum. James, W. (1890). The Principles of Psychology. Dover Publications. Kaplan, A.M., & Haenlein, M. (2010). Users of the World Unite! The Challenges and Opportunities of Social Media. Business Horizons, 53(1), 59-68. [Retrieved February 26, 2010, from ScienceDirect database.] Kwortnik, R.J., & Ross, W.T. (2007). The Role of Positive Emotions in Experiential Decisions, International Journal of Research in Marketing, 24, 324-335. Lange, C. (1885). Om Sinsbevaegelser : Et psykfysiologiske Studie. Copenhague : Rasmussen. Mandler, G. (1984). Mind and Body. New York: Norton Mauss, I. B., & Robinson, M. D. (2009). Measures of emotion: A review. Cognition and Emotion, 23, 209-237. Morris, J. D., Woo, C., Geason, J. A., & Kim, J. (2002). The power of affect: Predicting intention. Journal of Advertising Research, 42(3), 7-17.
Panksepp, J. (2007). Neurologizing the psychology of affects: How appraisal-based constructivism and basic emotion theory can coexist. Perspectives on Psychological Science, 2(3), 281_295. Robinson, M. D., & Clore, G. L. (2002). Episodic and semantic knowledge in emotional selfreport: Evidence for two judgment processes. Journal of Personality & Social Psychology, 83(1), 198_215. Russell, J.A. (1983). Pancultural aspects of the human conceptual organization of emotions, Journal of Personality and Social Psychology, 45, 1281-8. Sander, D., Grandjean, D., & Scherer, K.R. (2005). A system approach to appraisal mechanisms in emotion. Neural Networks, 18, 317-352. Scherer, K.R. (1984). On the nature and function of emotion: a component process approach. In Scherer, K.R. & Ekman, P. (Eds.). Approaches to emotion (pp. 293-317). Hillsdale, Erlbaum. Scherer, K.R. (2001). Appraisal considered as a process of multi-level sequential checking. In K.R. Scherer, A. Schorr, & T. Johnstone (Eds.). Appraisal processes in emotion: Theory, Methods, Research (pp. 92-120). New York and Oxford: Oxford University Press. Scherer, K.R. (2005). What are emotions? And how should they be measured? Social Science Information, 44(4), 695-729. Siemer, M., Mauss, I., & Gross, J.J. (2007). Same situation – different emotions: How appraisals shape our emotions. Emotion, 7, 592-600. Sonnemans, J., & Frijda, N.H. (1994). The structure of Subjective Emotional Intensity. Cognition & Emotion, 8(4), 329-350.
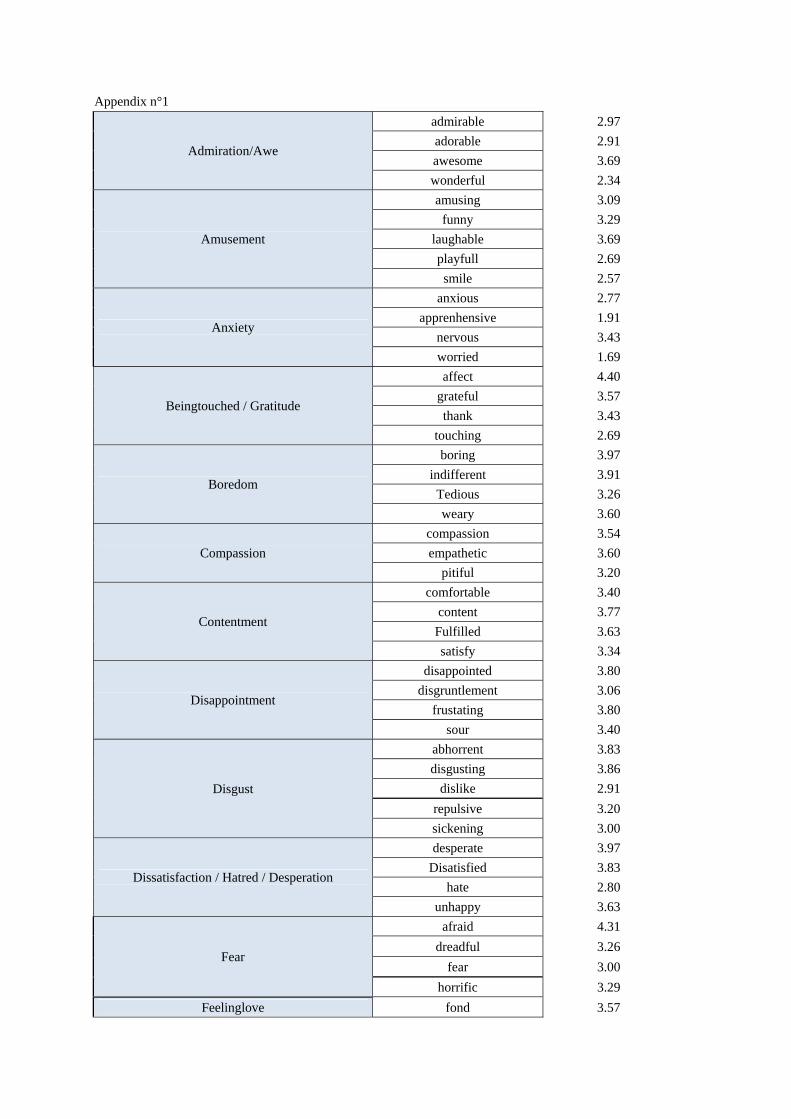
Appendix n°1
Admiration/Awe
admirable 2.97
adorable 2.91
awesome 3.69
wonderful 2.34
Amusement
amusing 3.09
funny 3.29
laughable 3.69
playfull 2.69
smile 2.57
Anxiety
anxious 2.77
apprenhensive 1.91
nervous 3.43
worried 1.69
Beingtouched / Gratitude
affect 4.40
grateful 3.57
thank 3.43
touching 2.69
Boredom
boring 3.97
indifferent 3.91
Tedious 3.26
weary 3.60
Compassion
compassion 3.54
empathetic 3.60
pitiful 3.20
Contentment
comfortable 3.40
content 3.77
Fulfilled 3.63
satisfy 3.34
Disappointment
disappointed 3.80
disgruntlement 3.06
frustating 3.80
sour 3.40
Disgust
abhorrent 3.83
disgusting 3.86
dislike 2.91
repulsive 3.20
sickening 3.00
Dissatisfaction / Hatred / Desperation
desperate 3.97
Disatisfied 3.83
hate 2.80
unhappy 3.63
Fear
afraid 4.31
dreadful 3.26
fear 3.00
horrific 3.29
Feelinglove fond 3.57
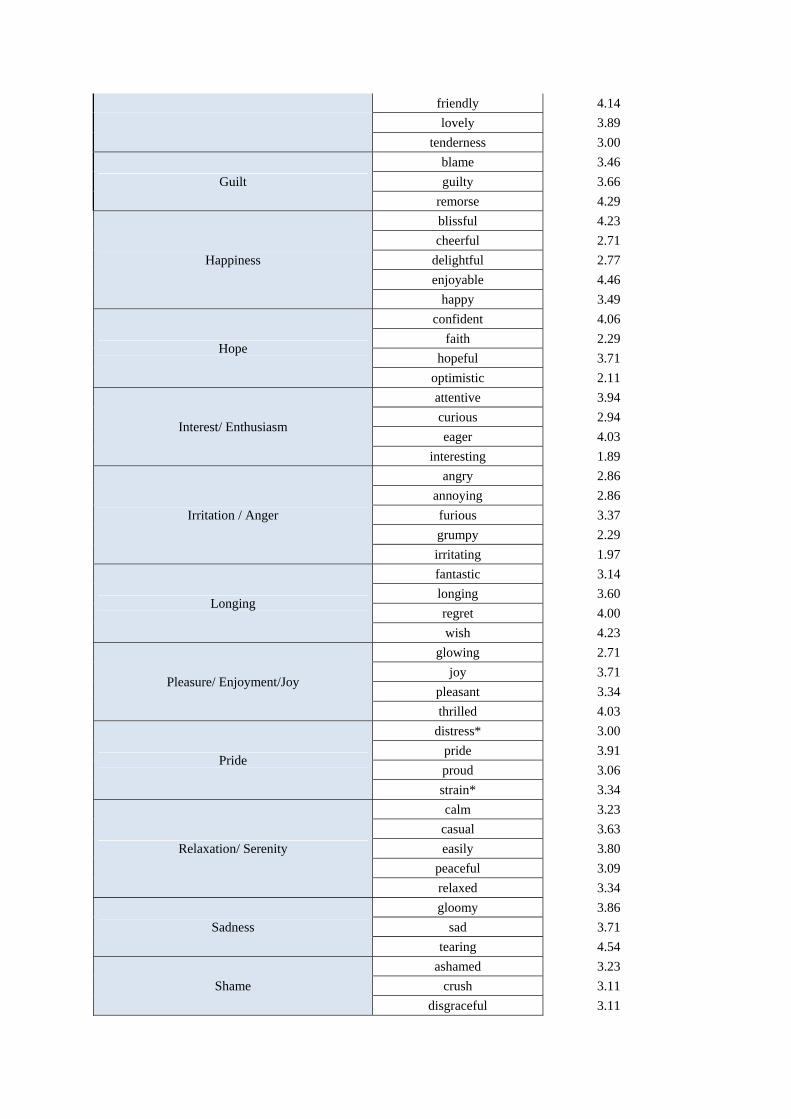
friendly 4.14
lovely 3.89
tenderness 3.00
Guilt
blame 3.46
guilty 3.66
remorse 4.29
Happiness
blissful 4.23
cheerful 2.71
delightful 2.77
enjoyable 4.46
happy 3.49
Hope
confident 4.06
faith 2.29
hopeful 3.71
optimistic 2.11
Interest/ Enthusiasm
attentive 3.94
curious 2.94
eager 4.03
interesting 1.89
Irritation / Anger
angry 2.86
annoying 2.86
furious 3.37
grumpy 2.29
irritating 1.97
Longing
fantastic 3.14
longing 3.60
regret 4.00
wish 4.23
Pleasure/ Enjoyment/Joy
glowing 2.71
joy 3.71
pleasant 3.34
thrilled 4.03
Pride
distress* 3.00
pride 3.91
proud 3.06
strain* 3.34
Relaxation/ Serenity
calm 3.23
casual 3.63
easily 3.80
peaceful 3.09
relaxed 3.34
Sadness
gloomy 3.86
sad 3.71
tearing 4.54
Shame
ashamed 3.23
crush 3.11
disgraceful 3.11

embarrassing 3.57
shame 4.57
Surprise
amazing 3.86
astonishing 3.51
stunning 4.40
surprising 4.09
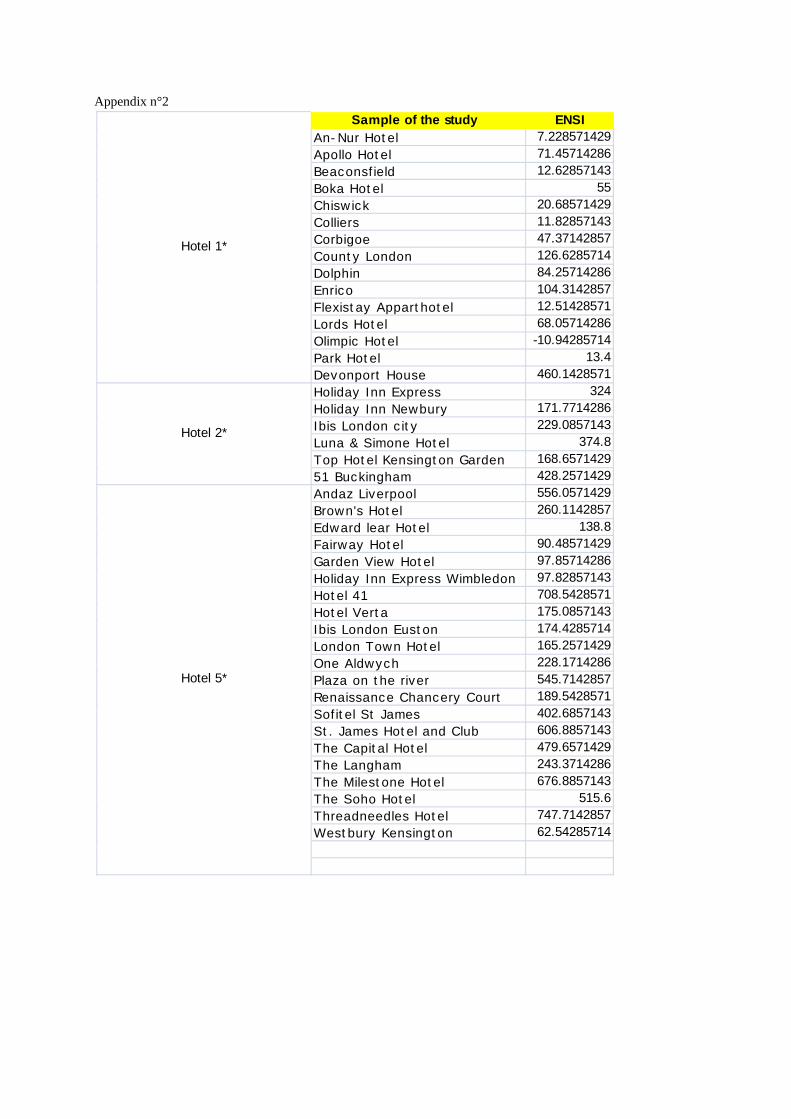
Appendix n°2
Sample of the study ENSIAn-Nur Hotel 7.228571429
Apollo Hotel 71.45714286
Beaconsfield 12.62857143
Boka Hotel 55
Chiswick 20.68571429
Colliers 11.82857143
Corbigoe 47.37142857
County London 126.6285714
Dolphin 84.25714286
Enrico 104.3142857
Flexistay Apparthotel 12.51428571
Lords Hotel 68.05714286
Olimpic Hotel -10.94285714
Park Hotel 13.4
Devonport House 460.1428571
Holiday Inn Express 324
Holiday Inn Newbury 171.7714286
Ibis London city 229.0857143
Luna & Simone Hotel 374.8
Top Hotel Kensington Garden 168.6571429
51 Buckingham 428.2571429
Andaz Liverpool 556.0571429
Brown's Hotel 260.1142857
Edward lear Hotel 138.8
Fairway Hotel 90.48571429
Garden View Hotel 97.85714286
Holiday Inn Express Wimbledon 97.82857143
Hotel 41 708.5428571
Hotel Verta 175.0857143
Ibis London Euston 174.4285714
London Town Hotel 165.2571429
One Aldwych 228.1714286
Plaza on the river 545.7142857
Renaissance Chancery Court 189.5428571
Sofitel St James 402.6857143
St. James Hotel and Club 606.8857143
The Capital Hotel 479.6571429
The Langham 243.3714286
The Milestone Hotel 676.8857143
The Soho Hotel 515.6
Threadneedles Hotel 747.7142857
Westbury Kensington 62.54285714
Hotel 1*
Hotel 2*
Hotel 5*
Examine the Antecedents and Outcomes of Relationship Quality
Christina Geng-qing Chi, Ph. D. (Corresponding Author)
School of Hospitality Business Management Washington State University
Pullman, Washington, USA 99164 Tel: (509) 335-5828 Fax: (509) 335-3857
Email: [email protected]
Wen Biyan, Ph. D. School of Management, Jinan University
Guangzhou, P. R. China 510632 Email: [email protected]
In this study, the authors examined the antecedents and outcomes of relationship quality. Drawing on consumer behavior and service marketing literature, the authors proposed a comprehensive model that hypothesized the interrelationships between service fairness (interactional, procedural and distributive justice), service quality (hard quality and soft quality, customer satisfaction, customer trust, affective commitment, repurchase intentions, and word-of-mouth intentions. The LISREL results indicate that 1) relationship quality is consist of three interrelated components: customer satisfaction, trust and affective commitment; and a causal chain is established that satisfaction influences trust which in term influences commitment; 2) perceived justice and service quality are antecedents to relationship quality; 3) the outcomes of relationship quality are customers’ repurchase and referral intentions, with customer satisfaction, trust and affective commitment all directly leading to referral and WOM intentions. Key words: relationship quality; perceived justice; hard quality; soft quality; affective commitment; trust
Introduction
Quality of customer relationships has been widely studied in the academic marketing literature for the past three decades (e.g. Crosby et al. 1990; Bejou et al. 1996; Bowen and Shoemaker, 1998; Garbarino and Johnson, 1999; Scanlan and McPhail, 2000; Roberts et al. 2003; Huang and Chiu, 2006; Hyun 2010). Earlier studies concentrated more on industrial products, but in recent years the focus has changed to services, either business-to-business or business-to-customers. The main research questions addressed by these studies are related to the conceptualization of relationship quality and/or its antecedents and consequences. Depending on survey contexts, the antecedents of relationship quality that were examined vary considerably from study to study. Athanasopoulou (2009) summarized these antecedents into four major categories: 1) characteristics of the two relationship parties (buyer and seller), for example, similarity between seller and buyer; seller’s attributes such as their expertise/strengths, reputation, and their ethical behaviors and orientation; buyer and seller’s orientation towards relationships, etc.; 2) characteristics of the relationship, for instance, length/duration of the relationship, relationship termination/switching costs, relationship benefits, the nature and quality of communication between the two relationship parties, etc.; 3) characteristics of the product/service offered, for example, product performance, service quality, etc.; and 4) the role of environment such as economic, political, technical, etc. There were more consensuses on the consequences of relationship quality. High quality relationships will result in increased customer retentions/loyalty, which is the ultimate goal that companies pursue in order to maintain a sustainable competitive edge.
The hospitality industry has long been interested in developing high quality relationships with their customers, and different studies have attempted to discover what lead to relationship quality. For example, Bowen and Shoemaker (1998) examined antecedents of building relationships with luxury hotel guests, including benefits, value, certainty and trust. Scanlan and McPhail (2000) identified four attributes that were most influential in forming long term relationships with business travelers at upscale hotels: personalization, social bonding, reliability and familiarization. Kim, Han and Lee (2001) studied three variables that may affect relationship quality in luxury hotels: guest confidence, guest contact and communication between frontline employees and hotel guests. In another study that’s conducted in luxury hotel setting, Kim and Cha (2002) investigated four constructs that may influence relationship quality: customer orientation, relational orientation, mutual disclosure, and service provider attributes. There are also relationship quality studies conducted in other hospitality segments. For instance, Lee and Hiemstra (2001) investigated relationship quality from meeting planners’ perspective and tested the following factors that may affect relationship quality: frequency and feedback of communication; salespersons’ expertise, willingness and power; gender difference, and turnover. Kim, Lee and Yoo (2006) selected luxury restaurants as the survey context and studied seven predictors to relationship quality: physical environment, food quality, customer orientation, communication, relationship benefits, and price fairness. Hyun (2010) examined what factors influence relationship quality in the chain restaurant industry and identified five attributes: food quality, service quality, price, location and environment.
However, few previous studies paid attention to the role of perceived justice in the development of cooperative long-standing relationships, even though researchers in philosophy and social psychology suggest that justice is the starting point in relationship building between organizations and individuals. In the marketing literature, perceived justice is primarily studied in the service recovery context whereby perceived justice is found to be a major contributing factor to customers’ post recovery satisfaction and positive behaviors (Tax et al. 1998; Blodgett et al. 1997; Chebat and Slusarczyk 2005). Additionally, a few marketing channel relationships studies examined fairness as a determinant of relationship quality (Kumar et al. 1995; Anderson and Weitz, 1989, 1992). This study will measure the role of perceived justice in relationship development during normal service delivery and consumption settings.
Numerous studies supported that service quality, i.e. customers’ evaluation of a service provider’s
performance, will lead to customer satisfaction and loyalty (e.g. Cronin and Taylor 1992; Anderson and Sullivan 1993; Anderson et al., 1994). This study will study service quality as another antecedent to long term relationship between service firms and customers.
Drawing on consumer behavior and service marketing literature, a comprehensive model was proposed
that hypothesized the interrelationships between service fairness (interactional, procedural and distributive justice), service quality (hard quality and soft quality, customer satisfaction, customer trust, affective commitment,
repurchase intentions, and word-of-mouth intentions. The model was tested using data collected from eight hotels located in different parts of China.
LITERATURE REVIEW
Components of Relationship Quality (RQ)
Relationship quality between end customers and companies refers to customers’ perceptions of how well the relationship fulfills their needs (Hennig-Thurau et al. 1997). Although there is no common consensus on the conceptualization of relationship quality, it is regarded as an overarching concept that consists of several key components. Athanasopoulou (2009) conducted a comprehensive literature review of relationship quality studies from 1987 to March 2007. He observed that most studies operationalized relationship quality with three dimensions: satisfaction, trust and affective commitment, especially in service-related research. This study adopted the same approach. In this study, satisfaction refers to customers’ overall evaluative judgment about their service/product consumption experience (Westbrook & Oliver 1991; Westbrook 1987). Trust exists when customers have confidence on a company’s integrity and are willing to rely on the company to provide long-term interests for them (Morgan and Hunt, 1994; Crosby et al., 1990). Commitment is defined as customers’ enduring desire to maintain a long term relationship with a company (Moorman et al. 1992). Affective commitment reflects a customer’s emotional attachment to a company and is based on feelings of identification, affiliation and loyalty (Gundlach et al. 1995; Mattila 2006). Customer satisfaction is at the core of relationship quality. When a customer is not satisfied with the service provided by a company, he/she cannot be expected to have a good relationship with the company. Trust is the cornerstone of long-term relationships, which is cultivated over the course of successful and satisfactory interactions between customers and firms (Nicholson et al 2001). Commitment is another essential ingredient for successful long-term relationships (Gundlach et al 1995) and it is built on customer satisfaction and trust. The relationship literature has treated the three core variables of relationship quality as interrelated rather than independent, and established a causal chain that satisfaction influences trust which in term influences commitment (Garbarina and Johnson 1999; Morgan and Hunt 1994). Therefore the following hypotheses were drawn:
H1: customer satisfaction has positive influence on a) customers’ trust for the company, and b) customers’
affective commitment. H2: customer trust has positive influence on customers’ affective commitment.
Antecedents of RQ Service Fairness
According to social exchange theory, people tend to assess the equity of an exchange in terms of outcome, procedure and interactions between exchange parties, and determine their behaviors thereafter (Adams, 1965). Justice theory can be used to explain the relationship between customers and service enterprises during various service encounters. Distributive justice refers to customers’ perceived fairness of the outcomes received from a service exchange. Procedural justice concerns customers opinions on a service company’s process and procedures used in arriving at the outcomes. Interactional justice addresses customers’ views on the attitude and behavior with which the service company and its staff treat them (Blodgett et al. 1993), such as being respectful, polite, and fair. Previous studies indicated that customers’ justice evaluation affects their level of satisfaction which further leads to customers’ trust and commitment (Andreassen, 2000; Hocutt et al., 1997; Sparks and McColl-Kennedy, 2001; Tax et al. 1998; DeWitt et al., 2007). The following hypotheses are therefore developed:
H3: a) Interactional justice, b) procedural justice, and c) distributive justice have positive influence on
customer satisfaction.
Service Quality Service quality refers to customers’ overall impression of the relative inferiority/superiority of an
organization and its services (Bitner and Hubbert, 1994). Service quality has received considerable attention in the marketing literature due to the key role it plays in differentiating service products and building competitive edge. The most well-known scale to measure service quality (SERVQUAL) was developed by Parasuraman, Zeithaml, and Berry (1985, 1988) who proposed a five-factor structure (22 items): reliability, responsiveness, assurance, empathy and tangibles. Johnston (1995) developed a more complete list of service quality determinants (include all SERVQUAL items) and found that some determinants are primarily satisfiers and others are predominantly
dissatisfiers. Driver and Johnston (2001) classified Johnston’s list of attributes (1995) as interpersonal and non-interpersonal (shorthand as soft and hard, respectively). Hard (non-interpersonal) quality entails attributes such as availability, comfort, cleanliness/tidiness, functionality, and security; while soft (interpersonal) quality includes attributes such as attentiveness/helpfulness, care, communication, courtesy, and friendliness. The link between service quality and satisfaction has been well established (Cronin and Taylor 1992; Anderson and Sullivan 1993; Anderson et al., 1994; Cronin et al. 2000; Baker and Crompton 2000), it is thus proposed that:
H4: a) Hard quality and b) soft quality have positive influence on customer satisfaction.
Relationship between service fairness and service quality Berry (1995) has pointed out in On Great Services that fairness/justice and service quality are inseparable.
If a customer thinks a service company is not fair, he will also think the company has poor service quality. Service fairness is expected to influence service quality because justice dimensions correspond with factors that determine quality (Brady and Cronin 2001). However, few empirical studies investigated the relationship between service fairness and service quality. Han et al. (2008) examined an integrative service loyalty model in which service fairness and service quality were two evaluative antecedents to customer satisfaction, and service fairness was found to significantly influence service quality which in turn influenced customer satisfaction. Aurier and Siadou-Martin (2007) studied the impact of the three justice dimensions on service quality and satisfaction in the context of a customer experience evaluation (service delivery). They observed significant direct effects of perceived justice on service quality, and indirect effects of justice on customer satisfaction via quality. More specifically, service quality in their study was operationalized as outcome quality (the core service), interaction quality (functional quality), and environment quality. Outcome and environment quality are similar to hard quality in our study, while interaction quality is close to soft quality. Aurier and Siadou-Martin (2007) hypothesized the path leading distributive justice to outcome quality, and the paths leading procedural and interactional justice to interaction quality, all of which were found to be significant. Based on the above review, we propose:
H6: a) Procedural justice and b) distributive justice have positive influence on hard quality. H7: a) Interactional justice and b) procedural justice have positive influence on soft quality.
Outcomes of RQ There are a lot of benefits derived from strong relationship quality between a company and its customers, among them, the most prominent ones are customer retention/loyalty and their positive WOM intentions (Garbarino et al, 1999; Verhoef et al, 2002; Kim et al, 2001; Kim & Cha, 2002; Lee & Hiemstra, 2001; Hennig-Thurau et al, 2002; Gustafsson et al. 2005; Papassapa & Miller 2007; Kim et al, 2006; Hyun 2010). Strong relationship quality indicates that customers are satisfied with a company’s past performance, trust the company’s future performance and feel emotional commitment to the company (Roberts et al. 2003; Hyun 2010). Satisfied customers are more inclined to behave in a way that’s beneficial to the company. Customer trust and commitment also lead to cooperative and positive behaviors that are conductive to company success. In other words, when customers develop high quality relationship with a company, they are more likely to engage in repurchase and referral behaviors. Consequently, it is hypothesized that:
H9: customer satisfaction has positive influence on a) customers’ repurchase intentions, and b) WOM intentions.
H10: customer trust has positive influence on a) customers’ repurchase intentions, and b) WOM intentions. H11: customers’ affective commitment has positive influence on a) customers’ repurchase intentions, and b)
WOM intentions.
Conceptual Model
A comprehensive literature review showed a lack of empirical studies examining service fairness and service quality simultaneously as antecedents to relationship quality. In order to explore in depth the antecedents and outcome of relationship quality, a conceptual model was proposed as shown in Figure 1. In this model, service fairness was conceptualized as three dimensions: interactional justice, procedural justice and distributive justice. Service quality was operationalized with two dimensions: hard quality and soft quality. Customer satisfaction is related to customers’ evaluation of their service consumption experience. Trust represents the trust customers have
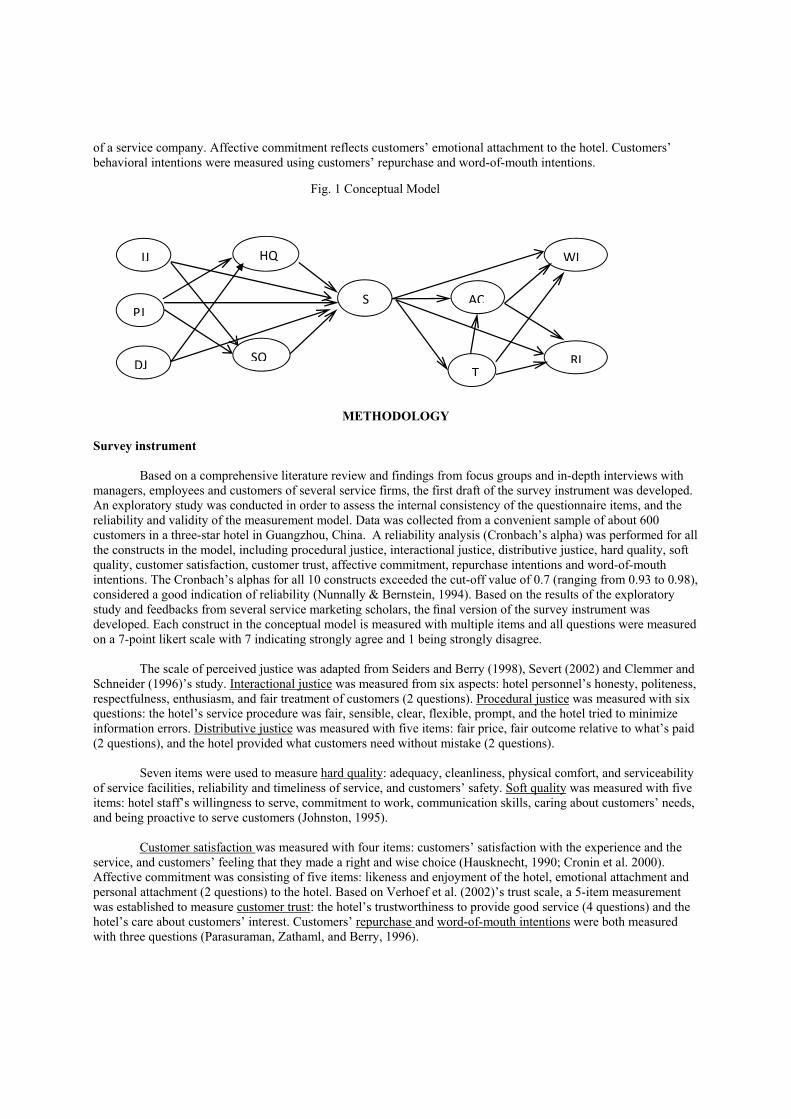
of a service company. Affective commitment reflects customers’ emotional attachment to the hotel. Customers’ behavioral intentions were measured using customers’ repurchase and word-of-mouth intentions.
METHODOLOGY
Survey instrument
Based on a comprehensive literature review and findings from focus groups and in-depth interviews with managers, employees and customers of several service firms, the first draft of the survey instrument was developed. An exploratory study was conducted in order to assess the internal consistency of the questionnaire items, and the reliability and validity of the measurement model. Data was collected from a convenient sample of about 600 customers in a three-star hotel in Guangzhou, China. A reliability analysis (Cronbach’s alpha) was performed for all the constructs in the model, including procedural justice, interactional justice, distributive justice, hard quality, soft quality, customer satisfaction, customer trust, affective commitment, repurchase intentions and word-of-mouth intentions. The Cronbach’s alphas for all 10 constructs exceeded the cut-off value of 0.7 (ranging from 0.93 to 0.98), considered a good indication of reliability (Nunnally & Bernstein, 1994). Based on the results of the exploratory study and feedbacks from several service marketing scholars, the final version of the survey instrument was developed. Each construct in the conceptual model is measured with multiple items and all questions were measured on a 7-point likert scale with 7 indicating strongly agree and 1 being strongly disagree.
The scale of perceived justice was adapted from Seiders and Berry (1998), Severt (2002) and Clemmer and
Schneider (1996)’s study. Interactional justice was measured from six aspects: hotel personnel’s honesty, politeness, respectfulness, enthusiasm, and fair treatment of customers (2 questions). Procedural justice was measured with six questions: the hotel’s service procedure was fair, sensible, clear, flexible, prompt, and the hotel tried to minimize information errors. Distributive justice was measured with five items: fair price, fair outcome relative to what’s paid (2 questions), and the hotel provided what customers need without mistake (2 questions).
Seven items were used to measure hard quality: adequacy, cleanliness, physical comfort, and serviceability
of service facilities, reliability and timeliness of service, and customers’ safety. Soft quality was measured with five items: hotel staff’s willingness to serve, commitment to work, communication skills, caring about customers’ needs, and being proactive to serve customers (Johnston, 1995).
Customer satisfaction was measured with four items: customers’ satisfaction with the experience and the
service, and customers’ feeling that they made a right and wise choice (Hausknecht, 1990; Cronin et al. 2000). Affective commitment was consisting of five items: likeness and enjoyment of the hotel, emotional attachment and personal attachment (2 questions) to the hotel. Based on Verhoef et al. (2002)’s trust scale, a 5-item measurement was established to measure customer trust: the hotel’s trustworthiness to provide good service (4 questions) and the hotel’s care about customers’ interest. Customers’ repurchase and word-of-mouth intentions were both measured with three questions (Parasuraman, Zathaml, and Berry, 1996).
Fig. 1 Conceptual Model
IJ
PJ
DJ
HQ
SQ
S AC
T
WI
RI
In order to reduce the number of estimated coefficients and increase indicator reliability and estimated coefficients stability, the items of each construct were split into two groups and the mean of each group was used as construct indicators (Sweeney et al., 1999; Han et al., 2008).
Survey procedure and sampling
This study was conducted in two stages. First an exploratory study was implemented to examine the reliability and validity of the measurement model, using data collected from a three star hotel in Guangzhou, China (located in the southeast part of China). A total of 800 surveys were distributed to hotel guests by the front office staff during the checked-out, and 588 usable ones were received, indicating a response rate of 73.5%. In the exploratory sample, more than half of the respondents were male (56.8%). Large percentage of the respondents (65.2%) was aged between 31 and 50, with approximately 20% of the respondents 30 years old and under, and another 14.3% over 50 years old. A large majority of the respondents (65.9%) were college/university graduates or post graduates. The following were the respondents’ occupation profile: public sector (18.3%), private enterprises (33.2%), and self-employed (40.7%).
Next, a validation study was conducted with data drawn from eight hotels located in various regions of
China: Gansu (northwest), Henan (north central), Hubei (south central), Yunnan (southwest), and Inner Mongolia (north). These hotels were independent domestic hotels with different star ratings: five of them were rated two-star and two were rated three-star by China’s National Tourism Bureau (http://www.travelchinaguide.com/hotel/rate.asp). Questionnaires were mailed to the general managers of these hotels with detailed survey procedure instructions. One thousand and twenty nine (1,029) usable surveys were collected from 1,300 surveys distributed by the front office staff to guests when they checked out, representing a 79.2% response rate. As for validation sample, male respondents accounted for about half (51.4%). Over half of the respondents (57%) were aged between 31 and 50, with 35.6% of the respondents 30 years old and under, and 7.6% over 50 years old. Over sixty percent of the respondents (62.2%) were college/university graduates or post graduates. It was almost an equal split in terms of the respondents’ occupation: public sector (26.7%), private enterprises (27.6%), and self-employed (25.1%).
RESULTS
Analysis of measurement model
In the exploratory study, the Cronbach of the 10 constructs is between 0.93 and 0.96, which shows the high internal consistency of each construct. Confirmatory factor analysis was conducted to test the measurement model using LISREL 8.80. The various measures of overall model goodness-of-fit suggest a satisfactory model fit. χ² value is 302.61 with 154 degrees of freedom (p < 0.001). Due to the χ² value’s sensitivity to sample size and model complexity, other goodness-of-fit indices were also used to assess the overall fit of the measurement model. The χ² value over degrees of freedom is 1.965, between 2.0 and 3.0; NFI, NNFI, CFI, IFI, RFI, GFI and AGFI are respectively 0.98, 0.99, 0.99, 0.99, 0.97, 0.96, 0.93 - all greater than the recommended level of 0.90; RMR is 0.072 and RMSEA is 0.041, smaller than the cut off value of 0.08 (Hu and Bentler, 1999).
Next the uni-dimensionality, reliability and validity of the measurement model were assessed. All indicator
loadings were found to be significant at the 0.01 level, confirming the posited relationships among indictors and constructs. The composite reliability (CR) of each variable exceeds the suggested level of 0.70, indicating the internal consistency among the 11 sets of construct indicators. All average variance extracted (AVE) values are larger than the minimum cutoff of 0.5, suggesting that the indicators are representative of the latent constructs. The convergent validity for the measurement model is thus established. To examine the discriminant validity of the measurement model, the AVE values for the latent constructs were compared to the squared correlations between the corresponding constructs (Fornell and Larcker, 1981), and none of the squared correlations surpasses the AVE. The above tests indicated that the discriminant validity is upheld for the measurement model.
Analysis of structural model
In the validation study, the structural model was estimated using maximum likelihood estimation. The fit indices of the model are as follows: χ² value = 852.18 with 183 degrees of freedom (p < 0.001); NFI = 0.99; NNFI =
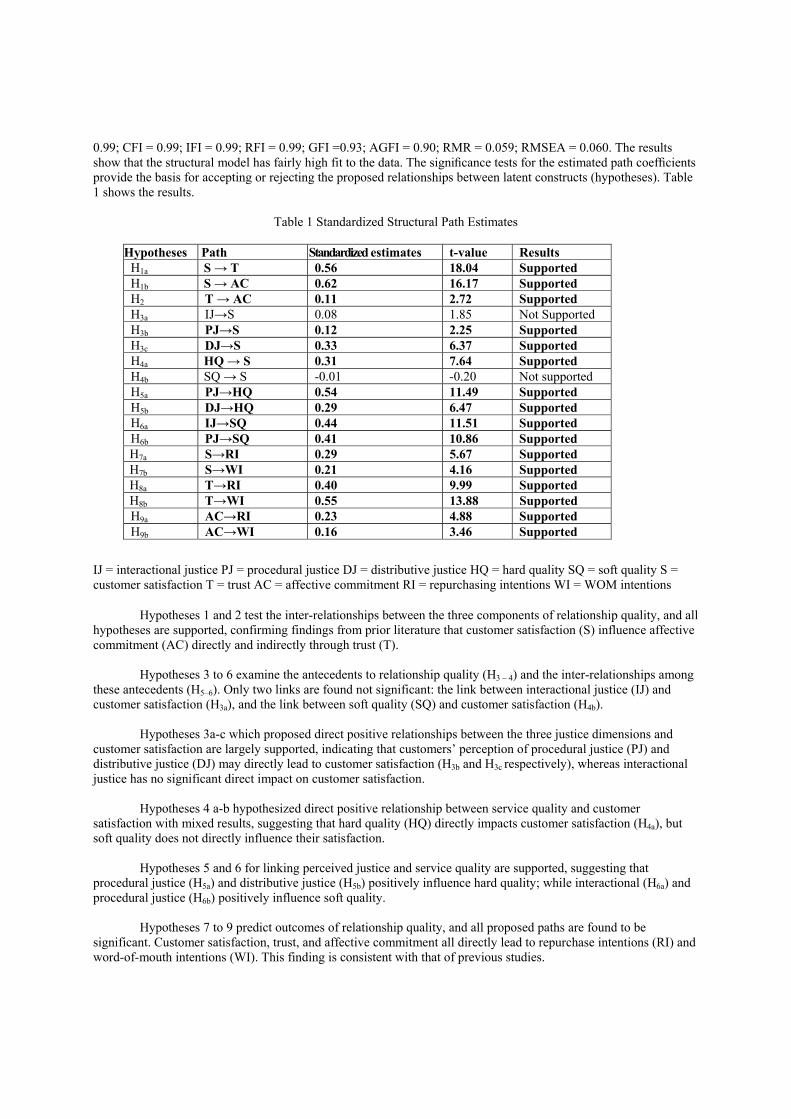
0.99; CFI = 0.99; IFI = 0.99; RFI = 0.99; GFI =0.93; AGFI = 0.90; RMR = 0.059; RMSEA = 0.060. The results show that the structural model has fairly high fit to the data. The significance tests for the estimated path coefficients provide the basis for accepting or rejecting the proposed relationships between latent constructs (hypotheses). Table 1 shows the results.
Table 1 Standardized Structural Path Estimates
Hypotheses Path Standardized estimates t-value Results
H1a S → T 0.56 18.04 Supported H1b S → AC 0.62 16.17 Supported H2 T → AC 0.11 2.72 Supported H3a IJ→S 0.08 1.85 Not Supported H3b PJ→S 0.12 2.25 Supported H3c DJ→S 0.33 6.37 Supported H4a HQ → S 0.31 7.64 Supported H4b SQ → S -0.01 -0.20 Not supported H5a PJ→HQ 0.54 11.49 Supported H5b DJ→HQ 0.29 6.47 Supported H6a IJ→SQ 0.44 11.51 Supported H6b PJ→SQ 0.41 10.86 Supported
H7a S→RI 0.29 5.67 Supported H7b S→WI 0.21 4.16 Supported H8a T→RI 0.40 9.99 Supported H8b T→WI 0.55 13.88 Supported H9a AC→RI 0.23 4.88 Supported H9b AC→WI 0.16 3.46 Supported
IJ = interactional justice PJ = procedural justice DJ = distributive justice HQ = hard quality SQ = soft quality S = customer satisfaction T = trust AC = affective commitment RI = repurchasing intentions WI = WOM intentions
Hypotheses 1 and 2 test the inter-relationships between the three components of relationship quality, and all hypotheses are supported, confirming findings from prior literature that customer satisfaction (S) influence affective commitment (AC) directly and indirectly through trust (T).
Hypotheses 3 to 6 examine the antecedents to relationship quality (H3 – 4) and the inter-relationships among
these antecedents (H5–6). Only two links are found not significant: the link between interactional justice (IJ) and customer satisfaction (H3a), and the link between soft quality (SQ) and customer satisfaction (H4b).
Hypotheses 3a-c which proposed direct positive relationships between the three justice dimensions and
customer satisfaction are largely supported, indicating that customers’ perception of procedural justice (PJ) and distributive justice (DJ) may directly lead to customer satisfaction (H3b and H3c respectively), whereas interactional justice has no significant direct impact on customer satisfaction.
Hypotheses 4 a-b hypothesized direct positive relationship between service quality and customer
satisfaction with mixed results, suggesting that hard quality (HQ) directly impacts customer satisfaction (H4a), but soft quality does not directly influence their satisfaction.
Hypotheses 5 and 6 for linking perceived justice and service quality are supported, suggesting that
procedural justice (H5a) and distributive justice (H5b) positively influence hard quality; while interactional (H6a) and procedural justice (H6b) positively influence soft quality.
Hypotheses 7 to 9 predict outcomes of relationship quality, and all proposed paths are found to be
significant. Customer satisfaction, trust, and affective commitment all directly lead to repurchase intentions (RI) and word-of-mouth intentions (WI). This finding is consistent with that of previous studies.
Conclusions
The LISREL results indicate that 1) relationship quality is consist of three interrelated components: customer satisfaction, trust and affective commitment; and a causal chain is established that satisfaction influences trust which in term influences commitment; 2) perceived justice and service quality are antecedents to relationship quality; 3) the outcomes of relationship quality are customers’ repurchase and referral intentions, with customer satisfaction, trust and affective commitment all directly leading to referral and WOM intentions. The results of this study validated the major hypothesis of this paper: customers’ judgment of service fairness and service quality play an important role in customer-enterprise relationship which in turn affects customers’ post consumption behaviors.
REFERENCES Anderson E. W., Fornell C., Lehmann D. R., 1994. Customer satisfaction, market share, and profitability:
Findings from Sweden. Journal of Marketing 58(July), 53-66. Anderson E. W., Sullivan M. W., 1993. The antecedents and consequences of customer satisfaction for
firms. Marketing Science 12(2), 125-143. Andreassen T. W., 2000. Antecedents to satisfaction with service recovery. European Journal of Marketing
34(2), 156-175. Aurier P., Siadou-Martin B., 2007. Perceived justice and consumption experience evaluation: A qualitative
and experimental investigation. International Journal of Service Industry Management 18(5), 450-471. Baker D. A., Crompton J. L., 2000. Quality, satisfaction and behavioral intentions. Annals of Tourism
Research 27(3), 785-804. Bejou, D., Wray, B. and Ingram, T.N. (1996), “Determinants of relationship quality: an artificial neural
network analysis”, Journal of Business Research, Vol. 36 No. 2, pp. 137-43. Berry L. L., 1995. On Great Service: A Framework for Action. The Free Press, New York, NY. Bitner, M.J., and Hubbert, A.R., 1994. Encounter satisfaction versus overall satisfaction versus quality. In:
Rust, R.T., and R.L. Oliver (eds.). Service Quality: New Directions in Theory and Practice. Thousand Oaks, CA: Sage Publications, 72-94.
Blodgett J. G., Donna J. H., Tax S. S., 1997. The effects of distributive, procedural, and interactional justice on post-complaint behavior. Journal of Retailing 73 (2), 185-210.
Bowen, J.T. and Shoemaker, S. (1998), “Loyalty: a strategic commitment”, Cornell Hotel and Restaurant Administration Quarterly, Vol. 39 No. 1, February, pp. 12-25.
Chebat J., Slusarczyk W., 2005. How emotions mediate the effects of perceived justice on loyalty in service recovery situations: An empirical study. Journal of Business Research 58, 664-673.
Clemmer E. C., Schneider B., 1996. Fair service. In: Teresa A. S., Bowen D. E., Brown S. W. (Eds.). Advances in Services Marketing and Management 5, 109-126.
Cronin J. J. Jr., Brady M. K., Hult G. T. M., 2000. Assessing the effects of quality, value, and customer satisfaction on consumer behavioral intentions in service environments. Journal of Retailing 76(2), 193-218.
Cronin J. J. Jr., Taylor S. A., 1992. Measuring service quality: A reexamination and extension. Journal of Marketing 56(3), 55-68.
Crosby, L.A., Evans, K.R. and Cowles, D. (1990), “Relationship quality in services selling: an interpersonal influence perspective”, Journal of Marketing, Vol. 54 No. 3, pp. 68-81.
DeWitt T., Nguyen D. T., Marshall R., 2007. Exploring customer loyalty following service recovery: The mediating effect of trust and emotions. Journal of Service Research 10, 269-281.
Driver C., Johnston R., 2001. Understanding service customers: the value of hard and soft attributes. Journal of Service Research 3(2), 130-139.
Fornell C., Larcker D. F., 1981. Evaluating structural equation models with unobservable variables and measurement error. Journal of Marketing Research 18(1), 39-50.
Garbarino, E. and Johnson, M.S. (1999), “The different roles of satisfaction, trust, and commitment in customer relationships”, Journal of Marketing, Vol. 63 No. 2, April, pp. 70-87.
Han X., Kwortnik R. J., Wang C., 2008. Service loyalty: An integrative model and examination across service contexts. Journal of Service Research 11(1), 22-42.
Hennig-Thurau, T. and Klee, A. (1997), “The impact of customer satisfaction and relationship quality on customer retention – a critical reassessment and model development”, Psychology & Marketing, Vol. 14 No. 8, December, pp. 737-65.
Hocutt M. A., Ghakrabory G., Mowen J. C., 1997. The impact of perceived justice on customer satisfaction and intention to complain in a service recovery. Advances in Consumer Research 24, 457-463.
Hu, L., and Bentler, P. M., 1999. Cutoff criteria for fit indexes in covariance structure analysis: Conventional criteria versus new alternatives. Structural Equation Modeling 6, pp. 1-55.
Huang, H.H. and Chiu, C.K. (2006), “Exploring customer satisfaction, trust and destination loyalty in tourism”, Journal of American Academy of Business, Vol. 10 No. 1, pp. 156-9.
Johnston, R., 1995. The determinants of service quality: Satisfiers and dissatisfiers. International Journal of Service Industry Management 6(5), 53-71.
Kim, W. G. and Cha, Y. (2002), “Antecedents and consequences of relationship quality in hotel industry”, International Journal of Hospitality Management, Vol. 21 No. 4, pp. 321-38.
Kim,W. G., Han, J. S., & Lee, E. (2001). Effects of relationship marketing on repeat purchase and word-of-mouth. Journal of Hospitality &Tourism Research, 25(3), 272-288.
Kumar, N., Scheer, L.K. and Steenkamp, J.E. (1995), “The effects of supplier fairness on vulnerable resellers”, Journal of Marketing Research, Vol. 32 No. 1, pp. 54-65.
Moorman, C., Zaltman, G. and Deshpande´, R. (1992), “Relationships between providers and users of market research: the dynamics of trust within and between organizations”, Journal of Marketing Research, Vol. 29 No. 3, pp. 314-28.
Morgan, R.M. and Hunt, S.D. (1994), “The commitment-trust theory of relationship marketing”, Journal of Marketing, Vol. 58 No. 3, July, pp. 20-38.
Nunnally, J. C., & Bernstein, I. H., 1994. Psychometric theory (3rd ed). New York: McGraw-Hill. Papassapa, R. and Miller, K.E. (2007), “Relationship quality as a predictor of B2B customer loyalty”,
Journal of Business Research, Vol. 60 No. 1, pp. 21-31. Parasuraman A., Zeithaml V. A., Berry L. L., 1985. A conceptual model of service quality and its
implications for future research. Journal of Marketing 49(4), 41-50. Parasuraman A., Zeithaml V. A., Berry L. L., 1988. SERVQUAL: A multiple-item scale for measuring
consumer perceptions of service quality. Journal of Retailing 64(1), 12-40. Scanlan, L. and McPhail, J. (2000), “Forming service relationships with hotel business travellers: the
critical attributes to improve retention”, Journal of Hospitality & Tourism Research, Vol. 24 No. 4, pp. 491-513. Sparks B. A., McColl-Kennedy J. R., 2001. Justice strategy options for services recovery setting. Journal of
Business Research 54, 209-218. Sweeney J. C., Souter G. N., Johnson L. W., 1999. The role of perceived risk in the quality-value
relationship: A study in a retail environment. Journal of Retailing 75(1), 77-105. Tax S. S., Brown S. W., Chandrashekaran M., 1998. Customer evaluations of service complaint
experiences: Implications for relationship marketing. Journal of Marketing 62(2), 60-76. Verhoef P. C., Franses P. H., Hoekstra J. C., 2001. The effect of relational constructs on customer referrals
and number of services purchased from a multiservice provider: Does age of relationship matter? Journal of the Academy of Marketing Science 30, 202-216.
HOTEL SEARCH AND SELECTION ATTRIBUTES FOR LEISURE TRAVELERS – THE CASE OF SWISS OFFICIAL STAR RATING
Horatiu Tudori*, Senior lecturer Ecole hôtelière de Lausanne
Francine Federer, Graduate Ecole hôtelière de Lausanne
[email protected] Abstract The paper compares the usage of the Swiss Official Star Rating versus different information sources
such as traveler review platforms, social media or online travel agencies, and new hotel selection attributes such as user generated hotel reviews. The study examines the usage of the star rating filter existing on search websites compared to other online filters. The survey consists in a self-administrated questionnaire distributed on paper (93 responses) and online (265 responses). The study demonstrates empirically that the Swiss Official Star Rating system is frequently used as online filter, but it is not a source of information consulted frequently and it is not an important attribute to consider by leisure travelers when selecting a hotel.
Status-Seeking Consumer Behaviour and its Impact on the Hospitality Consumption of Young Professional
Females
Kimberley Anne Kirk-Macaulay Bournemouth University UK
Dorset House Talbot Campus
Fern Barrow Poole, Dorset BH12 5BB
e mail: [email protected]
Dr Susan Horner Bournemouth University UK
Dorset House Talbot Campus
Fern Barrow Poole, Dorset BH12 5BB
e mail: [email protected]
ABSTRACT
Understanding consumer behaviour in hospitality purchasing is essential (Williams 2002). The large variety of goods and services available in the modern world allow consumers to make clear statements about their values, personalities and aspirations (Peter and Olson 2005). This research investigated the effect of status-seeking hospitality consumer behaviour amongst young professional females (YPFs), an important new market segment. A focus group was used to elicit ideas, raise issues and gain a greater understanding of consumer behaviour relating to hospitality decisions. Indications are that status-seeking consumption is highly prevalent amongst the segment and that elements such as the ideal and actual self-concepts, reference groups and media exposure all have an impact on the choices of where to eat and drink.
Keywords: Young Females, Consumer Behaviour, Hospitality Marketing
1
Using Hotel Stories to add new value to the hotel experience
Bastienne Bernasco, MA
Team manager Saxion Hospitality Business School,
Saxion University of Applied Sciences Kerklaan 21
7311 AA Apeldoorn The Netherlands
Abstract This paper describes how a hotel stories exhibition triggers two hypotheses about the relevance to hoteliers of works of art reflecting hotel experiences. The paper assumes that such sources can inform hotel staff on the guest experience in novel ways, and that this information will contribute to their emotional intelligence. On the basis of literature research, the concepts of hospitality and emotional intelligence are explored. The hypotheses are tested using the hosting qualities and by using the resulting labels in an experimental session with hotel management students. The results show that artistic source materials can reveal people’s associations with and emotional experiences of hotels. Further research should focus on the investigation of fictional narratives as reflections of hotel experiences. Key words: guest experience—hotel narratives—emotional intelligence
2
Introduction: The Hotel Stories project
The Hotel Stories exhibition is a multimedia art exhibition open to the general public from 31 May-16 September 2012. The exhibition was initiated by Saxion Hospitality Business school and co-produced by CODA museum, both located in Apeldoorn, the Netherlands. The aim of the exhibition was to show how the hotel experience has been constructed in fictional and non-fictional stories. The exhibition was developed by a project team of creative designers, content researchers, marketing staff, hoteliers, artists and students from Saxion Hospitality Business School and Saxion Academy of Creative Technology.
Hotel stories can be found in many art genres. Hotels form an inspirational backdrop for films,
literature, songs, photographic art and video. No wonder: hotels are in many ways predictable and recognizable. Hotels are made up of fixed and standardized elements: the hotel sign, the receptionist welcoming the guest, the exchange of money for hospitality, the room, the hotel bar, the concierge, and so on. But hotels are used as more than just a décor. Many stories have tapped into the common or universal experiences that anyone who has stayed in a hotel, recognizes. Successful storytellers create “stories that stick” by applying storytelling schemes (Heath, D. & Heath, C., 2007). What makes good stories memorable is that they have a core message, are surprising, make use of concrete details and capture people’s emotions. What makes hotel stories interesting for hospitality experts in particular, is the way in which they “boil down” the variety of everyday, real hotel experiences into a widely recognized “essence” of the hotel experience.
The Hotel Stories project collected a database of stories from film, television series, literature, pop
music, video art, photography, games, blogs and websites, and even classical music. Fictional material was complemented with documentary material and descriptions of historic events. Some of the stories had become urban legends, such as the Bed-In for Peace by John Lennon and Yoko Ono at the Amsterdam Hilton, or the more gruesome events such as suicides of celebrity pop stars.
This database was quickly recognized for its potential uses in research. The central issue was
formulated as: “What can hotel stories teach us about the hotel experience of people who work and stay in hotels?” Theoretical Framework
Hotels can be defined as organisations where people expect to provide and receive hospitality.
Hospitality has been defined using socio-cultural and historical perspectives and management perspectives. Lashley (2008) sought to integrate these perspectives and argued that “an understanding of hospitality as a human relationship involving people in host and guest roles is essential to better inform the marketing of hospitality and tourism operations.” [Lashley, 2008, p.6]. This understanding of hospitality needs to be considered within the framework of the experience economy, where goods and services must be experientialized because customers seek rewarding, memorable and pleasurable consumption experiences. (Pine and Gilmore, 1999).
The guest experience has been conceptualized in the Guest Journey Model (Thijssen, 2007), which
shows that experiences occur when guests engage in activities that involve their emotions and their senses. Guests award meaning to experiences by evaluating, repeating or recommending the experience. Lashley (2008) holds that hospitality staff should be welcoming and that good hosting leads to strangers becoming friends (Lashley, 2008, p. 26). Hospitality companies such as Ritz Carlton and Singapore Airlines have shown that their service will be recounted in “legends of service excellence” because they maintain a consistent dedication to people, their guests and employees. (Solnet, Kandampluuly and Kralj, 2010, p.895).
Hotel staff and guests will influence each other’s emotional wellbeing, if only because of their close
contact within the confined spaces of the hotel. The investigation of emotions is still at its beginning in the field of economics and in tourism in particular (Brunner-Sperdin, 2009, p. 180). Emotional intelligence was defined in the Bar-On model (2006.), as effectively understanding oneself and others and relating well to people, and adapting to and coping with the immediate surroundings to be more successful in dealing with environmental demands. Qualifying the Bar-On model is the Trait Emotional Intelligence Theory, which acknowledges that emotional intelligence is composed of personality traits that can only be measured subjectively. (Petrides, 2010, p. 138). Certain emotional profiles will be advantageous in some contexts but not in others. (Petrides, 2010, p. 138).
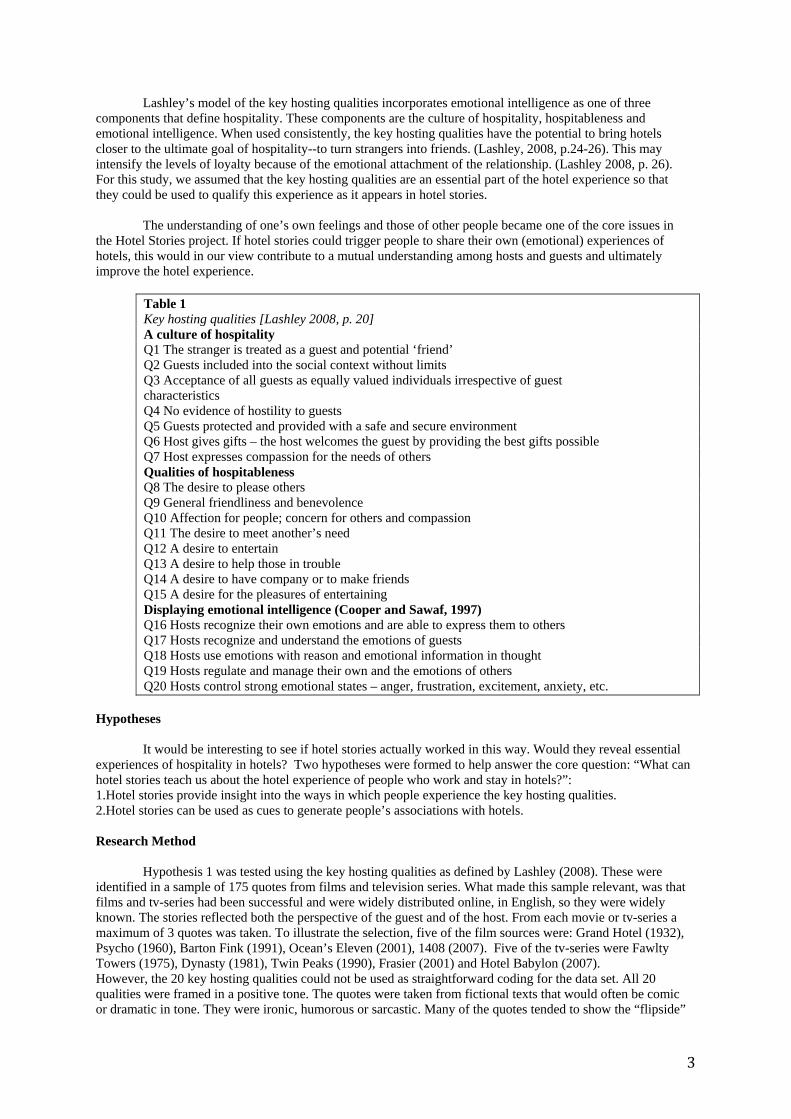
3
Lashley’s model of the key hosting qualities incorporates emotional intelligence as one of three components that define hospitality. These components are the culture of hospitality, hospitableness and emotional intelligence. When used consistently, the key hosting qualities have the potential to bring hotels closer to the ultimate goal of hospitality--to turn strangers into friends. (Lashley, 2008, p.24-26). This may intensify the levels of loyalty because of the emotional attachment of the relationship. (Lashley 2008, p. 26). For this study, we assumed that the key hosting qualities are an essential part of the hotel experience so that they could be used to qualify this experience as it appears in hotel stories.
The understanding of one’s own feelings and those of other people became one of the core issues in
the Hotel Stories project. If hotel stories could trigger people to share their own (emotional) experiences of hotels, this would in our view contribute to a mutual understanding among hosts and guests and ultimately improve the hotel experience.
Table 1 Key hosting qualities [Lashley 2008, p. 20] A culture of hospitality Q1 The stranger is treated as a guest and potential ‘friend’ Q2 Guests included into the social context without limits Q3 Acceptance of all guests as equally valued individuals irrespective of guest characteristics Q4 No evidence of hostility to guests Q5 Guests protected and provided with a safe and secure environment Q6 Host gives gifts – the host welcomes the guest by providing the best gifts possible Q7 Host expresses compassion for the needs of others Qualities of hospitableness Q8 The desire to please others Q9 General friendliness and benevolence Q10 Affection for people; concern for others and compassion Q11 The desire to meet another’s need Q12 A desire to entertain Q13 A desire to help those in trouble Q14 A desire to have company or to make friends Q15 A desire for the pleasures of entertaining Displaying emotional intelligence (Cooper and Sawaf, 1997) Q16 Hosts recognize their own emotions and are able to express them to others Q17 Hosts recognize and understand the emotions of guests Q18 Hosts use emotions with reason and emotional information in thought Q19 Hosts regulate and manage their own and the emotions of others Q20 Hosts control strong emotional states – anger, frustration, excitement, anxiety, etc.
Hypotheses
It would be interesting to see if hotel stories actually worked in this way. Would they reveal essential
experiences of hospitality in hotels? Two hypotheses were formed to help answer the core question: “What can hotel stories teach us about the hotel experience of people who work and stay in hotels?”: 1.Hotel stories provide insight into the ways in which people experience the key hosting qualities. 2.Hotel stories can be used as cues to generate people’s associations with hotels. Research Method
Hypothesis 1 was tested using the key hosting qualities as defined by Lashley (2008). These were
identified in a sample of 175 quotes from films and television series. What made this sample relevant, was that films and tv-series had been successful and were widely distributed online, in English, so they were widely known. The stories reflected both the perspective of the guest and of the host. From each movie or tv-series a maximum of 3 quotes was taken. To illustrate the selection, five of the film sources were: Grand Hotel (1932), Psycho (1960), Barton Fink (1991), Ocean’s Eleven (2001), 1408 (2007). Five of the tv-series were Fawlty Towers (1975), Dynasty (1981), Twin Peaks (1990), Frasier (2001) and Hotel Babylon (2007). However, the 20 key hosting qualities could not be used as straightforward coding for the data set. All 20 qualities were framed in a positive tone. The quotes were taken from fictional texts that would often be comic or dramatic in tone. They were ironic, humorous or sarcastic. Many of the quotes tended to show the “flipside”
4
of hospitality. For example, a host would not treat a stranger as a guest and potential friend, but would decline service, make fun of him or lose his temper. To account for this style phenomenon, data were classified “positive”, “negative” or “modified” (if used to create comic effects).
The underlying assumption in coding and classifying the data in this way, was that the occurrence of
each of the 20 qualities would show the relative importance attached to each of these qualities by the (fictional) persons involved in the guest-host interaction. As part of the coding method, one of the qualities was altered slightly so that it would relate to the quotes. Q3, giving gifts, was also used to describe the provision of luxury comforts such as rooms service, amenities etc. In the negative sense Q3 occurred when guests steal hotel luxuries, such as towels, lamps etc. (because hosts do not give these as gifts).
To test hypothesis 2, all quotes were first briefly summarized in terms of what hotels meant to people,
what function they had for people, what events happened in hotels and what people did and experienced in hotels. These brief descriptions were condensed to a one-word label, to see if a pattern could be made visible of recurring topics. The 175 quotes generated 35 one-word labels. These labels were then marked for frequency. Results
With reference to hypothesis 1, the top 3 of qualities most referred to was: Q6: (36: 15 negative, 4 positive, 17 modified), Q3: (34: 6 negative, 4 positive, 24 modified) Q1: (20: 8 negative, 3 positive, 9 modified). The top 3 of qualities least referred to was: Q11 (0), Q13 (0), Q14 (1 modified). A tentative conclusion might be that the key hosting qualities based on hospitableness do not lead to
stories or dramatizations of the experience of these qualities. Three of the qualities based on the culture of hospitality are recognized and used in stories but then usually in an ironic or negative sense—hosts usually do not perform the way they should. Qualities displaying emotional intelligence hardly occur (2-5 instances).
With reference to hypothesis 2, the labels occurring more than 10 times were:
Indulgence (22); Fear (17); Anyone (14); Personal-Impersonal (19); Lust-love (19). This indicates that while guests expect to be indulged and get the privacy to engage in romantic and erotic relations, they might also be concerned about safety and about the way hotels recognize them as unique individuals.
The labels were then used in a focus group session consisting of hotel management students, as most
of them had been hosts and guests at hotels. Participants were first asked to associate freely on the word “hotel”. This generated mostly positive associations related to luxury, leisure, good service and beautiful locations. They were then shown some of the original film excerpts. They then read the quotes in film and movie excerpts, as well as the one-word labels. They were then asked to share their memories and associations of hotels and finally, to use the labels to form short meaningful word clusters. The experiment generated quite varied associations and personal stories of hotels, which supports the conclusion that hotel stories can be used as an innovative cue to uncover memories and associations of hotels.
Table 3 One-word labels generating word clusters 1: Privacy + chase + hiding + protection + prison = hotels enable people to escape or hide. 2: Anyone + impersonal + standard + bodies + loneliness = hotels do not recognize people as individuals. 3: Indulgence + friendliness = hotels show friendliness and indulge people. 4: Fear + depression + anger = hotels cause negative emotions. 5: Love + lust + prostitution + privacy = hotels encourage people to engage in romantic and (illicit) sexual encounters. 6: Limits + privacy + indulgence = hotels isolate and indulge people. Indulgence suggests abandoning control. 7: Anyone + privacy + personal + impersonal + standard= hotels accept people as “anyone”, rather than as “someone”. People are not recognized as individuals.
Recommendations for further study
Marketeers usually look at guest reviews to assess the hotel experience. Hotel stories are different
from the realistic evaluation of hotels found in guest reviews. They are hidden in people’s memories and touch
5
on emotional experiences of hotels. As such, they may provide insights into how people really feel about hotels. Reaching this understanding will require extensive research. It should be based on a comprehensive database of stories or narratives about the hotel experience. It must incorporate theoretical insights from areas such as service management, host-guest encounters, multimedia discourse analysis, storytelling, emotional intelligence, and socio-cultural studies. This short paper has attempted to validate that hotel stories will provide novel starting points to understand and improve the reality of the hotel experience.
References Bar-On, R.,The Bar-On model of emotional-social intelligence (ESI). Psicothema, 18 , suppl., 13-25. (2006) Brunner-Sperdin, A. and Peters, M., What Influences Guests’ Emotions? The Case of High-quality Hotels. International Journal of Tourism Research, 169-183 (2009) Gilmore, J.H. and Pine, B.J. II, Differentiating hospitality operations via experiences. Why selling service is not enough. Cornell Hotel and Restaurant Administration Quarterly, 43(3), 87-96 (2002) Heath, C. & Heath, D., Made to Stick (2007) Heide, M. & Gronhaug, K., Key Factors in Guests’ Perception of Hotel Atmosphere, Cornell Hospitality Quarterly, 29-42 (2009) Lashley, C. (2008), Handbook of Hospitality Marketing Management, p.4-31 (2008) Petrides, K.V., Trait Emotional Intelligence Theory, Industrial and Organizational Psychology, 3, p.136-139 (2010) Solnet, D., Kandampully, J. and Kralj, Legends of Service Excellence: The Habits of Seven Highly Effective Hospitality Companies, Journal of Hospitality Marketing & Management, 19, 889-908 (2010) Thijssen, T., Groen, B. and Pijls, R., Klantbeleving begrijpen, meten en bevorderen, FMI 12, 87-89 (2009) Wu, C. and Liang, R-D, Effect of experiential value on customer satisfaction with service encounters in luxury hotel-restaurants. International Journal of Hospitality Management, 586-593 (2009)
EXPLORING SERVICE ENCOUNTER QUALITY WITH TOURISM STUDENTS
Sanna-Mari Renfors *, MSSc. Senior lecturer in tourism, Satakunta University of applied sciences, Tiedepuisto 3, Finland,
Vappu Salo, Ed.D. Senior lecturer in tourism, Satakunta University of applied sciences, Tiedepuisto 3, Finland,
ABSTRACT
This practical paper reflects a practice how to integrate teaching with research activities in order to provide an opportunity for bachelor students studying tourism to learn behavioural skills needed in service delivery. The paper presents a study regarding service encounter quality that serves as students’ active learning process. For this study the students gather data during three different courses visiting tourism organizations as mystery quests, observing employees’ behaviour in different contexts and writing a narrative about their perceptions. We as the teachers and the researchers translate the data with the help of our students into customer-defined service encounter quality criteria that also assist regional tourism organizations to target their service delivery efforts in a more specific manner. The criteria is developed using thematic analysis.
Keywords: service encounter, service quality, active learning, critical incident technique
INTRODUCTION TO SERVICE ENCOUNTER QUALITY
Encounters between customers and front-line employees are a critical component of service quality (Chandon, Leo, & Philippe, 1997). What happens in these encounters has a significant impact on the perceived service. Nickson, Warhurst, and Dutton (2005) state that for service organizations these interactions are crucial as they aim to create high quality service encounters. According to Bitner, Booms, and Tetreault (1990) interaction is the service from customers’ point of view, yet front-line employees are not trained to understand customers. Thus, service organizations need to have better understanding how customers evaluate employees’ performance in service encounters (Winstead, 2000).
Employees’ behaviours will impact on customers’ perceptions of service quality in service encounters (Bitner et al., 1990). Customers’ service quality evaluations are based almost entirely upon the behaviors of frontline employees, and organizations rely heavily upon these employees to improve overall service quality provision (Farrell, Souchon, & Durden, 2001). Thus, the behaviours of employees play an important role in shaping customers’ perceptions of service quality. This is also noticed by Wilson (2001) who highlighted the fact that successful management of service delivery involves the co-ordination of employees’ behaviours in service encounters. In order to manage quality in these encounters, it is important to understand how these behaviours are perceived from customers’ perspective.
Previous studies have also identified interaction as a critical dimension of service quality (Grönroos, 1984; Lehtinen & Lehtinen, 1991; Brady & Cronin, 2001). Interaction service quality is produced in the interaction between the customer and the employee (Lehtinen & Lehtinen, 1991). According to Brady and Cronin (2001) customers’ perceptions of the interpersonal interactions is a dimension of perceived service quality. Grönroos (1984) conceptualise this as functional quality meaning the manner in which the service is delivered in terms of the interactions during the service encounter. Farrell et al. (2001) refer to service quality implementation behaviour, which they defined as “behaviours associated with the implementation of the organization’s service quality policy”. This service quality implementation behaviour represents the service delivery process and the functional quality.
We define quality by focusing on the front-line employee’s behaviours in a service encounter. We follow the narrow definition of Suprenant and Solomon (1987) and define service encounter as a dyadic interaction between the customer and the front-line employee. Thus, service encounter quality is the customer’s personal, subjective perception and qualitative evaluation of the employee’s behaviours in a service encounter.
INTEGRATING TEACHING WITH RESEARCH & DEVELOPMENT
In the Satakunta University of Applied Sciences students participate in the research and development activities. Therefore, we are conducting a study about service encounter quality with tourism students. The study concentrates on exploring customers’ perceptions of service encounter quality and expressing their requirements as specific front-line employee behaviours. As a result customers’ requirements are translated into customer-defined service encounter quality criteria that can act as a guideline for the front-line employees. We are not concentrating on the outcomes of the process or on the physical surroundings of the service, but in the delivery of the service and on customers’ subjective evaluations of employees’ behaviors. We do not establish target levels or weight the behaviours.
This study is integrated with teaching and the data gathering is executed during three different courses. The data is collected by first, second and third year tourism bachelor students acting as customers during their customer service, restaurant management and travel agency management courses. The aim is to teach about customer perceptions of service encounter quality in different contexts and how the interactions between customers and employees affect perceived quality. By doing this, their understanding about customers’ needs towards the front-line employees’ behaviours in service encounter increases. Therefore the study serves as their active learning process.
Active learning suggests students learn better when they are fully engaged in the learning process (Inks
& Avila, 2008). In addition, research indicates that active leaning is effective when it comes to behavioural skill development (Inks & Avila, 2008). This method is suitable, because according to Gremler, Hoffman, Keaveney, & Wright (2000, 36) students are often both service consumers and service employees and these activities help them to understand how their own experiences relate to the course material and learning objectives. Students’ past service experiences also allow them to construct new knowledge fairly easily based on existing cognitive structures (Wright, Bitner, & Zeithaml, 1994, 9). Thus, the paper also reflects a practice how to integrate teaching with research activities in order to provide an opportunity for tourism students to learn critical workplace skills and to develop current teaching methods and practices in tourism bachelor programme.
In the Satakunta University of Applied Sciences research activities serve also its region by helping organizations to develop their operations successfully. Thus, the criteria are also a valuable management tool and assist tourism organizations to target their service delivery efforts in a more specific manner. After the study we can also employ this same practice and help individual organizations to create their own specific, context-related criteria with the help of our students. The criteria can then be used to determine employee’s training and development needs. By using these criteria employees also have clear instructions how to perform their job. According to Wilson et al. (2008) the criteria provide direction, guidance and feedback to employees in ways to achieve customer satisfaction. The criteria can also be developed further and used as a basis of perceptual measurement through the use of surveys or employee monitoring providing feedback on employee performance.
In sum, the study regarding service encounter quality has a two-fold purpose. First, it acts as a tourism students’ active learning process. Second, it assists regional tourist organizations to target their service delivery efforts and to improve service encounter quality.
RESEARCH METHODS
Data collection
The data collection of this qualitative study is organized during three different courses. The students that gather the data are both male and female, ranging in age from 20 to 65 years. Their age range is very vast because the degree programme is targeted both to youth and adult learners. The students usually work during their studies in various service jobs, hence they have gained work experience.
Mystery shopping and critical incident techniques are used as the data collection tools. Previously Czepiec (1983) has used mystery shopping when teaching marketing principles. Borin, Metcalf, and Tietje (2008) expressed that observation and mystery shopping techniques are effective when preparing students to understand customers. Farber and Fox (1994) as well as Sautter and Hanna (1994) employed critical incident
technique in services marketing courses. Tomkins (2009) asked leisure management students to reconstruct prior learning from critical incidents experienced in the workplace using storytelling technique.
The critical incident technique (CIT) is the most used qualitative approach when measuring service quality. Because the importance of service encounters in building perceptions, researchers have analysed encounters to determine the sources of customer favourable and unfavourable impressions by using the critical incident technique (Wilson et al., 2008, 92). The critical incident technique (Flanagan, 1954) is an attempt to identify the most important aspects of job behaviour. It consists of a set of procedures for collecting observations of human behaviour and classifying them in such a way as to make them useful in addressing practical problems (Flanagan, 1954). A critical incident is a specific interaction between a customer and an employee that is especially satisfying or especially dissatisfying (Bitner et al., 1990). We employ this technique and a critical incident is considered as an employee behaviour that is especially satisfying or dissatisfying according to the customer.
The main data consists of narratives (n=92) written by second year tourism students (n=92) acting as mystery quests in face-to-face service encounters. In this study the students are asked to visit a restaurant or a travel agent, to observe employees’ behaviours and to write an evaluative, detailed narrative about their perceptions in a chronological order. The observation is unstructured, and the students are informed to pay particular attention into critical incidents in the encounter. We do not want to use the traditional check list used in mystery shopping nor the students to observe any specific behaviour. The observation is unstructured, because we want to understand the point of view of the customer in his own words. We also have four group discussions with the students, where they can express their opinions about employee’s behaviour and the critical incidents.
The second year students (n=30) gather also narratives (n=90) regarding voice-to-voice service encounters in different tourism organizations (restaurants, travel agencies, tourism information centres, hotels, airlines). Each student is asked to phone three tourism organizations acting as a mystery quest, to observe employees’ behaviours and to write an evaluative narrative about the experiences. The students are also informed to pay particular attention into critical incidents in the encounter.
Furthermore additional data is gathered by first year tourism students using the critical incident
technique as a retrospective method. The students (n=42) interview restaurant quests (n=84) and ask them to remember and to describe a specific negative or a positive critical incident they have had. The students write a detailed description of the incidents (n=84). The third year students also conduct narrative interviews of employees (n=18) and supervisors (n=18) in order to get their perspective of service encounter quality. They are asked to describe front-line employees’ behaviours in a service encounter and to identify the critical incidents.
Data analysis
All together we have three different data sets. The first set includes the narratives and interviews
collected in the face-to-face restaurant context, the second set of narratives is collected in the face-to-face travel agency context and the third set represent narratives from voice-to-voice encounters in different tourism context. These three data sets are analysed first separately, and in the end similarities are determined across the contexts.
We analyze the data in interpretive fashion, because we do not treat narratives as reports of facts. We
choose interpretative approach also because Gremler (2004, 79) point out that service researchers should consider taking a more interpretive approach in analyzing the CIT data. Gremler (2004) recommends that when analyzing the data the researchers should gain insight from interpreting respondent’s experiences instead of reporting facts. Our approach is interpretative, because we analyze the incidents with interpretation from the respondent and want to gain insight from interpreting customer’s experiences. Therefore longer sections describing positive and negative incidents are chosen as a unit of analysis.
The aim of the analysis is to identify themes emerging from the data. According to Riessman (2004) thematic approach is useful for finding common thematic elements across participants and the events they report. In thematic analysis narratives are examined as they are written in order to find patterns of themes (Eriksson & Kovalainen, 2008, 219). Thus, in the analysis the focus is on the content of the narratives and on the critical incidents the narratives include.
Our approach is inductive, hence patterns are formed as they emerge from the data. First, we examine
and code the text closely. We organize customers’ perceptions relating to similar topics into categories
describing specific front-line employees’ behaviours. When the themes are beginning to emerge, we take each theme separately and re-examine the original data for information relating to the themes. When constructing the final form of each theme, we consider also the previous theory regarding service encounter quality. In the report we illustrate the themes with vivid quotations from the original texts. When the analysis is conducted, all the categories and the behaviours they include together form the service encounter quality criteria. Both researchers code the data independently and the categories are compared. We also use a third researcher, whose task is to analyse the data and find any possible controversies.
In May 2012 the students have gathered all the necessary data. The next phase is the data analysis, which should be conducted in the autumn 2012-winter 2013.
REFERENCES Bitner, M., Booms, B., & Tetreault, M. (1990). The service encounter: Diagnosing favourable and unfavourable
incidents. Journal of Marketing, 54, 71–84.
Borin, N., Metcalf, L., & Tietje, B. (2008). Implementing Assessment in an Outcome-Based Marketing Curriculum. Journal of Marketing Education, 30, 150–159.
Brady, M., & Cronin, J. (2001). Some new thoughts on conceptualizing perceived service quality: A hierarchical approach. Journal of Marketing, 65, 34–49.
Chandon, J-L., Leo, P-Y., & Philippe, J. (1997). Service encounter dimensions – a dyadic perspective:
Measuring the dimensions of service encounters as perceived by customers and personnel. International Journal of Service Industry Management, 8, 65–86.
Czepiec, H. (1983). The mystery shopper technique as an experiential exercise to teach undergraduate marketing
principles. Journal of Marketing Education, 5, 33–36. Eriksson, P., & Kovalainen, A. (2008). Qualitative methods in business research. London: Sage. Farber, B., & Fox, K. (1994). Training marketing students to be service problem solvers: A framework for
integrating training for services (FITS). Journal of Marketing Education, 16, 81–93. Farrell, A., Souchon, A., & Durden, G. (2001). Service encounter conceptualisation: employees’ service
behaviours and customers’ service quality perceptions. Journal of Marketing Management, 17, 577–593.
Flanagan, J. (1954). The critical incident technique. Psychological Bulletin, 5, 327–358.
Gremler, D. (2004). The critical incident technique in service research. Journal of Service Research, 7, 65–89.
Gremler, D., Hoffman, K., Keaveney, S., & Wright. L. (2000). Experiential learning exercises in services marketing courses. Journal of Marketing Education, 22, 35-44.
Grönroos, C. (1984). A service quality model and its marketing implications. European Journal of Marketing,
18, 35–42. Inks, S., & Avila, R. (2008). Preparing the next generation of sales professionals through social, experiential, and
immersive learning experiences. Journal for Advancement in Marketing Education, 13, 47–55. Lehtinen, U., & Lehtinen, J. (1991). Two approaches to service quality dimensions. The Service Industries
Journal, 11, 287–303.
Nickson, D., Warhurst, C., & Dutton, E. (2005). The importance of attitude and appearance in the service
encounter in retail and hospitality. Managing Service Quality, 15, 195–208. Riessman, C. (2004). Narrative analysis. In M. Lewis-Beck, A. Bryman, A. & T. Futing Liao (Eds.), The Sage
Encyclopedia of Social Science Research Methods (pp. 705–709), Vol. 3. London: Sage. Sautter, E., & Hanna, J. (1994). Using the critical incident technique as a learning tool in services marketing
course. Journal of Marketing Education, 16, 94–100. Suprenant, C., & Solomon, M. (1987). Predictability and personalization in the service encounter. Journal of
Marketing, 51, 86–96. Tomkins, A. (2009). “It was a great day when…”; An exploratory case study if reflective learning through
storytelling. Journal of Hospitality, Leisure, Sport & Tourism Education, 8, 123–131. Wilson, A., Zeithaml, V., Gremler, M., & Bitner, D. (2008). Services marketing: Integrating customer focus
across the firm. London: McGraw-Hill. Winstead, K. (2000). Service behaviors that lead to satisfied customers. European Journal of Marketing, 34,
399–417. Wright, L., Bitner, M., & Zeithaml, V. (1994). Paradigm shifts in business education: using active learning to
deliver services marketing content. Journal of Marketing Education, 16, 5–19.
A Modified Organizational Buying Behavior Model of the Meeting Professional’s Site Selection Process
Carole Sox Doctoral Student
University of South Carolina/School of Hotel, Restaurant and Tourism Management Columbia, SC USA
Sheryl Kline, Ph.D. Associate Dean
University of South Carolina/School of Hotel, Restaurant and Tourism Management [email protected]
Sandy Strick, Ph.D.
Interim Department Chair University of South Carolina/School of Hotel, Restaurant and Tourism Management
Xiang (Robert) Li, Ph.D. Associate Professor
University of South Carolina/School of Hotel, Restaurant and Tourism Management [email protected]
ABSTRACT:
This conceptual paper reviews the site selection processes for association, corporate and government meetings, and proposes a modified and more comprehensive model for the overall site-selection process within the MEEC industry. This modified model proposes that the first step in the site selection process is to identify which type of meeting is being planned (corporate, government or association). Once determined, the planner then reviews the variables impacting the meeting type, and addresses the buying stages for final site selection.
Assessing attendees’ attitudes towards a special event: Applying hedonic dimensions
Deborah Breiter, Ph.D. * Professor
Rosen College of Hospitality Management University of Central Florida
9907 Universal Blvd. Orlando, FL 32819
Diehdra Potter Student
Rosen College of Hospitality Management University of Central Florida
9907 Universal Blvd. Orlando, FL 32819
Duncan Dickson, Ed..D. Assistant Professor
Rosen College of Hospitality Management University of Central Florida
9907 Universal Blvd. Orlando, FL 32819
[email protected] Abstract: Hedonic scales have been used for over 50 years to measure customers’ preferences in relation to sensory experiences. In the fields of hospitality and tourism, a number of authors have employed hedonic scales in their work. Event researchers have utilized hedonic scales as well to measure aspects of fairs and festivals. But the niche market of special events used as fundraisers has rarely been investigated. The study proposed here will fill a gap in the research by examining how attendees at this type of event rate the elements of event design and the overall hedonic value of the event. Key words: Special events, fundraising, hedonic scales, event design
GUEST JOURNEY EXPERIENCE MAPPING
Jan Huizing, Drs.*
Professor of Marketing & Strategy and Research Fellow City Hospitality& City Marketing Hotelschool The Hague/ City Hospitality & City Marketing
Brusselselaan 2, 2587 AH, The Hague, Netherlands [email protected]
Karoline W. Wiegerink, Dr. Professor and Chair of City Hospitality & City Marketing
Hotelschool The Hague/ City Hospitality & City Marketing Brusselselaan 2, 2587 AH, The Hague, Netherlands
and
Danilo S. Huss, Mr. International Fast Track Student and Honorary Member City Hospitality & City Marketing
Hotelschool The Hague/ City Hospitality & City Marketing Sonnenweg 7, 79618, Rheinfelden, Germany
ABSTRACT
This short paper reveals the current practice of Guest Journey Experience Mapping, illustrated on one specific case. Guest Journey Experience Mapping has the purpose to provide customer insight about how guests experience certain services, and it is part of the modern marketing topic Service Design Thinking. The case was conducted by Hotelschool The Hague’s City Hospitality and City Marketing Chair Team within the framework of a research-project called “Service Design in Tourism” and in co-operation with two of the destination marketing organisations of The Hague: Bureau Binnenstad and Stichting Marketing Haagse Binnenstad . Various other Service Design Thinking tools such as Personas or the innovative MyServiceFellow application are applied within the practice. The practice’s process and implications further reveal benefits for the service owner, and additional stakeholders. Key Words: Customer Insights, Guest Journey Experience Map, Marketing, Service Design, Service Management, Stakeholders
The Senior Traveler: Perceptions of Chinese Seniors Towards Future Travel
Howard Adler Ed.D Professor Purdue University
West Lafayette, Indiana [email protected]
Tong Ji, M.S. Purdue University
West Lafayette, Indiana
Abstract
This research examined motivations and attitudes of Chinese senior citizens towards travel attributes. The senior travel market in China is one of the fastest growing markets in the world and will continue to grow as disposable income increases. A semi structured interview was conducted with 40 Chinese senior citizens in the Beijing area. Results from the interviews indicated that Chinese seniors were extremely dependent on the income and travel decisions of their adult children. In addition Chinese seniors preferred to travel to Asian destinations because of familiarity with food and customers. Seniors also discussed reasons why international travel and travel in general was difficult for them.
Key Words: Chinese seniors, Senior travel, Chinese travel market, barriers to travel
Introduction and Background
Currently seniors constitute approximately 1/5 of the worlds population and will reach 1/3 of the worlds population by 2050 (World Population Prospect 2004). In Asia the percentage of people aged 65 and older will almost triple by 2040 ( U.N. 2004). China is aging faster than any other country of similar stature. The number of Chinese seniors and the group’s rate of growth is significantly large. By the middle of the 21st century there will be 400 million Chinese aged 60 and over ( Mao & Song 2004). There is a great deal of research regarding senior travelers from Western Countries ( Bai, Smith,Cai & O’Leary 1999) and on Asian seniors from developed countries such as Japan and Korea. However very little has been done regarding the new and upcoming Chinese market. The Chinese senior travel market is expected to be very different from either Western countries or other Asian countries ( Hsu,Cai & Wong 2006). For most Chinese seniors, traveling after retirement could mean the first time that they have actually traveled. Chinese seniors will be dependent on their adult children who have grown richer during the last 20 years. China is growing old before it grows rich ( Economist, 2005). This bond is only growing stronger as the generation consist of more only children born under the one child policy.
Purpose of the Study
The purpose of the present research is to identify the perceptions of Chinese seniors towards travel. The major objectives of the study include (a) determining the major preferences of Chinese senior travelers,(b) what role do relationships with family members play and what are their influence in travel decisions (c) analyze the constraints that seniors will encounter when traveling and (d) what do Chinese tourism product and service providers need to do to improve and better attract and serve the Chinese Senior market. Seniors often face more barrier when they travel compared to younger travelers due to their physical, emotional and financial situation. Other limitations include lack of a companion to travel with, perceptions that they are too old to travel and the fear of disapproval by others as well as feeling guilty about traveling ( McGuire, 1984).
Review of the Literature
The Asian Travel Market
Among existing studies regarding Asia, most have focused on more developed Asian countries such as Japan and Korea ( Mak, Carlile & Dai 2005). Seniors in those countries are more affluent and more open to western culture. Participating in travel activities has become a style trend among seniors after their retirement. Research on the Korean market has shown that most seniors feel that they are capable of traveling and consider traveling as a way to improve their physical and mental
condition (Lee & Tidewell, 2005). The study also found that Korean seniors take their families attitudes very seriously and that their opinions can become a major deterrent for seniors if the travel activities are not fully supported by their families.
In relation to the Chinese senior travel market, one study interviewed 27 seniors in Beijing and Shanghai. They built a travel motivation model which included external and internal desires. Results indicated a major travel motivation is that it is subject to personal financial conditions and the availability of time both of which were affected by their family support ( Hsu, Cai and Wong 2007). Li and Luo’ study ( 2006) of senior travel behavior in Guangzhou found that traveled stated and relatives attitudes was a major barrier to traveling.
Cultural Influences
The accumulation of shared meaning, rituals, norms, traditions among members of a society distinguishes members of one society from another (Solomon 1996). Hofstede (2001) noted that “ Culture is to human collectivity what personality is to the individual”. There is a great amount of information in the literature which supports the fact that national culture is one of the forces which influence consumer behavior (Litvin, Crotts and Hefner 2004. One of the most famous of the most influential research was Hofstede ( 1980) who identified four value dimensions that distinguish individuals in different societies: power distance, uncertainty avoidance, individual-collectivism and masculinity-femininity. A fifth construct was added in 2001 related to the Confusian idea of long term orientation versus short term orientation. He evaluated 66 nations and created an index score for the five constructs. If visitors tolerance for risk and uncertainty is less than that of their host country travelers will engage in risk reducing behaviors by doing such things as (1) spending more time in planning trips, (2) use of travel packages, (3) use of tour operators, (4) traveling in larger numbers, and (5) fever destinations according to Money and Crotts ( 2003)
Chinese seniors tend to feel more responsible to their families ( Yan & Sorenson 2004). It is not unusual for Chinese seniors to live with their children after retirement to take care of their grandchildren and because their own children want this. Therefore research to explore and identify the different characteristics of the Chinese senior travel market is essential. Chinese seniors are different from other seniors around the world in that they grew up in a politically and diplomatically isolated communist regime and they did not have the financial means to travel. The majority of seniors who are able to travel today come from the more prosperous coastal regions are able to travel. Even today the majority of seniors living in rural areas are not able to travel intensively due to financial constraints. They are more likely to start traveling with cheaper less risky domestic trips, especially considering the fact that China is a big country with many things to do and see.
To most Chinese seniors who have grown up under the influence of Confucianism, their family always included married children and their grandchildren and they usually live with their married children. The children feel obligated to provide financial support for their senior parents. If there is any conflict between traveling and their family, seniors are more apt to give up traveling ( Hsu, Cai & Wong, 2007). Confucian emphasis on work and study does not leave much tie for leisure activities including travel ( Chang, 1972). Another factor which influenced or could deter Asian seniors from traveling related to their own or other’s perceptions about being “too old” to travel ( Kirkbridge & Tang 1992).
Even with the aforementioned fact, many Chinese travel agents have not recognized the potential of the upcoming senior markets. In fact many have implemented policies discriminating by price in favor of the young ( Hsu, Cai & Wong 2007). Customers 55 and older are charged higher prices in order to participate in tour groups.
Methodology
The present study used a qualitative research methodology by means of administering a semi structured personal interview. The questions were designed after a thorough review of the related literature. The researcher chose the capital city of Beijing. Although rural residents account for a larger percentage of the total population, citizens from urban areas have much higher incomes and propensity to travel. Citizens of Beijing have a longer life expectancy that most other Chinese urban areas ( Xi, 2004). The survey instrument consisted of 3 parts. Part 1 consisted of seniors travel preferences and how their adult children affected these. The second section of the survey was open ended questions related to difficulties seniors encountered when traveling, and the third part of the survey related to demographic questions. The interviews were conducted at Bejing Behai Park and Beijing Capital International Airport. In total 40 seniors ( 55 and over) were interviewed in Mandarin and the results were analyzed according to the themes stated in the objectives of the research.
Findings and Discussion
The findings were grouped into various themes uncovered through the interviews. Among the 40 seniors who were interviewed, 47% were male and 52.5% were female. Somewhat over 77% were married and 23 % reported that they were widowed. None of the widowed individuals reported that they had remarried. Fifty percent reported that they live with their spouse and children and 45% said that they lived with only their spouse and 5% alone. Seventy five percent of the seniors noted that they were fully retired with the rest still working part time or full time. Results indicated that while Chinese seniors intend to travel to a greater extent than in the past, they feel obligated to consult with and travel with their children whenever possible. They also felt that traveling domestically was their first preference before they would even consider traveling internationally. Seniors also felt that the physical strains of travel would be a major limitation in their future considerations.
The majority of the interviewed seniors lived in the Beijing area and reported that the number one domestic place they had traveled to was Shanghai mainly to see the World exposition of 2010, followed by Lijang and Dali, followed by Sanya, Xiamen, and Guilin. In regards to international travel many considered traveling to Hong Kong and Macau as international destinations since they had to have visas to go there. Taiwan was also high on the list because of distant family living there. A total of 31 seniors claimed that they have international travel experience with the most concentrations of trips to Japan followed by Singapore, United States, France, Germany, Italy and Britain. Seniors reported that the most popular region was Asia because of the similarities of cultures to theirs as well as the shorter travel distances, less expensive prices and similar foods. A few seniors mentioned that taking longer flights would inconvenience them because of having to get up and go to the bathroom frequently and they did not want to be embarrassed.
Seniors who had not traveled overseas were asked whether they would like to do so in the future. Eight responded that they would like to but even with the help of their families they would could not afford the major expenses. Another reason for their fear of taking overseas trip was because of the language differences. Many mentioned that if they had a choice that the United States would be their future choice. They would prefer to either travel to these places with their children or on all inclusive tour packages. While travel abroad is still considered a luxury by most Chinese most seniors felt that it was worth the money. Twenty seven of the seniors reported that their children had paid for their last few trips and that their travel was based around the travel schedules of their children. These same seniors noted that they were very proud of their children for paying for their travel expenses. A few seniors said that they could afford to pay for their own trips and did not want to put the financial burden on their children.
Some of the seniors reported that they had stopped traveling for various reasons. One such reason was the birth of grandchildren that they had to stay at home and care for. Others reported that they felt that they were too old to take any out of town trips. A major reason behind this related to the fact that physical difficulties had slowed them down and made it hard to be away from home. Another area of discomfort on the part of seniors was that they felt that they do not trust travel agents because the agencies make it difficult for them and only care of money and not giving them good service. In fact a few of them felt that they were discriminated against because some of the travel agents charged seniors more money for trips than people who were in younger age categories that they know.
Many of the seniors spent a great deal of time watching television therefore one third reported that they felt that radio and television was important to them in gaining information and making decisions about travel. An equal number said that reading books and magazines and newspapers was important to them in their travel planning.
Conclusions
Chinese travel agencies should be aware that Chinese seniors are a very powerful market in China and that their purchasing power is closely tied to their children. In 20 more years the children of these seniors will become seniors themselves and will have long memories of organizations that have not taken care of their children. While Chinese seniors do not make as much use of the internet as their children, they do view television and magazines as important advertising and information sources, therefore advertisers should not put all their efforts into internet ads only. Chinese seniors prefer domestic locations but are slowly branching out into more adventuresome destinations, however they still prefer Asia. Seniors are concerned with health issues when traveling, so travel modes and destinations should help seniors to alleviate these fears by educating them on the excellent healthcare options that are available.
References:
World Population Prospect: The 2004 Revision Population Database (2004). Retrieved from http://esa.un.org
Bai, B.,Smith, W., Cai, L. & O’Learly, J.T. (1999). Senior-sensitive segments: Looking at traveler behavior. In K.S. Chon, The Practice of Graduate Research in Hospitality and Tourism. Binghamton, N.Y.: Haworth Press
Chang, P.K. ( 1972). Korea: Past and Present. Seoul: Kwangmyong Publishing
Crotts, J and S, Litvin ( 2003) “ Cross Cultural Research: Are Researchers Better Serving by Knowing Respondents. Journal of Travel Research Research 42 (2) 186-190
Money, B. and J Crotts (2003). The Effects of Uncertainty Avoidance on Information Search, Planning and Purchases of International Travel Vacations, “ Tourism Management 24 (1): 192-202
Economist. (2005) It is the people , stupid. March 5 ( Special Section:5)
Eisenhardt, K. (1989). Building theories from case study research. Academy of Management Review, 44, 532-550
Hofstede, G (1997) Cultures and Organizations, London, Mc Graw Hill
Hofstede, G (2001) Cultural Consequences, Thousand Oaks, CA, Sage Publications,
Hsu, C., Cai, L.,& Wong, K. (2007) A model of senior tourism motivations, Tourism Management, 28, 1262-1273
Kirkbride, P.S. & Tang, S.Y. (1992) Management development in Nanyang Chinese societies of southern Asia, Journal of Management Development, 11 (2), 54-66
Lee, S. H. & Tideswell, C. (2005). Understanding attitudes towards leisure travel and the constraints faced by senior Koreans. Journal of Vacation Marketing, 11, 249-263
Li, M., & Luo, S. (2006) The study of senior traveler behavior in Guangzhou. China Tourism Research, 2, 37-47
Mak, J., Carlile, L. & Dai, S (2005). Impact of population on aging on Japanese international travel. Journal of Travel Research, 44 (2) 151-162
McGuire, F.A.,Boyd, R.K., & Tedrick, R.t. (1996) Leisure and Ageing: Ulyssean living in later life. Sagamore publishing
Xi, Y. (2000) Senior Travel Market Looks Prosperous, Beijing Youth Daily Retrieved from http://www.unn.com.cn/GB/channel128
Yan, J, & Sorenson, R. L. (2004). The influence of Confucian ideology on conflict in Chinese family business. International Journal of Cross Cultural Management, 4 (1), 19.
YOUTH TRAVEL AND THEIR DESTINATION CHOICE
Ali Sukru Cetinkaya* Selcuk University
Visiting Professor at Virginia Tech Turkey
Yuliya Skorobogatova Università della Svizzera Italiana
Exchange Master Student at Virginia Tech Switzerland
and
Muzaffer Uysal, PhD. Virginia Tech
Abstract
Tourism is a highly dynamic industry affected by various factors such as fashion, climate change, economic development, etc. The current trend shows an increasing importance of youth tourism. More and more younger people travel every year, their expenditure and length of stay at the destination increases as well. This paper is aimed at investigating the process of their destination choice considering such factors as travel motives, perceived risks and barriers and the role of social media. It is hoped that the results of this research reveal valuable information for practitioners in the tourism industry, particularly for destination management and marketing entities.
Key Words: youth travel, destination choice, push and pull factors, perceived barriers, social media.
Introduction
Youth tourism starts to play an increasingly important role in the travel industry. Around 160 million young travelers make at least one international trip a year, which makes up over 20% of international tourist arrivals. The segment shows a stable growth of 3-5% a year. Such factors as growing frequency to travel (from 6.2 trips over 5 years in 2002 to 7.3 in 2007) and increased total expenditure (by 39% in the years 2002-2007) makes youth tourism market a strategically important research area (UNWTO, 2008). However, few works were recently focused on young travelers and their travel preferences. Thus, this paper aims at investigating the destination choice process of young travelers addressing such issues as travel motives, perceived risks and barriers and the role of social media. It is expected that proposed theoretical model will help to better understand youth travelers as a market segment and apply this knowledge for both more efficient marketing campaigns and tourism development.
There is a plethora of research concerning destination choice (Baloglu & McCleary, 1999; Hong, Lee,
Lee, & Jang, 2009; Mohammad & Som, 2010; Vengesayi, 2008). However, little attention is given to the particular segment of young travelers. Information about their motivation to travel or risk perception is quite limited. Moreover, social media is one of the latest trends in the tourism industry, influencing both marketing and management of tourism destinations (Parra-Lopez, Buichand-Gidumal, Gutierrez-Tano, & Diaz-Armas, 2011; Tribe, 2006). Young people are known to be the first users of Information Technologies. Various social
network platforms such as Facebook and Goggle+ are inherent part of modern life. Thus, it will be important to investigate the role of social network in pre-trip phase. Therefore, this current tries to answer the following questions:
1. What factors are crucial for youth tourism in making a decision about their next tourism destination? 2. How is a destination choice of young tourists influenced by travel motives, perceived barriers and
social media?
Literature review
The theoretical model chosen for this paper consists of four main parts: travel motives, perceived barriers, role of social media, and destination choice. Each part is based on the previous research and adapted according to the current theoretical model and the research question.
Travel motives: Certain reasons (motives) for travel may correspond to certain benefits that are to be
valued and obtained at the destination site.One of the most widely accepted approaches to studying travel motivation is push and pull factors (Baloglu & Uysal, 1996). For the given research paper the push and pull factors are extracted from the work of Mohammad and Som (2010) and combined with attributes of a tourist destination which Pandza (2007) determines as “the most important attributes of tourist destination for tourists’ perception”. She identifies the key role of perceived quality of transportation, accommodation, food and beverage, tourism infrastructure, emotional experience and tourists’ attractions. These attributes were added to the questionnaire.
Perceived Barriers: Making travel decisions is not a simple task since a tourist must make decisions
regarding timing, transportation mode, budget, secondary destinations, and activities in addition to the primary destination. Moreover, every potential traveler faces a certain level of risk in traveling because the travel experience relies on intangible services that are consumed simultaneously with production (Zeithaml, 1981).
Modern travel is characterized by instability both political and economic. Moreover, every individual traveler acts based on his or her own perceived risks and barriers. The given construct is designed to investigate the perceived barriers of young travelers when they chose destinations. Thus, the theoretical models of Han (2005) and Wolfe (2002) were combined.
Social Media: In the last few years, we have seen a huge growth of user-generated content on the
Internet through the use of a series of tools that have generically been defined as online social media, although other terms such as Web 2.0 technologies have also been used (Sigala & Marinidis, 2009). Younger tourists make intensive use of social media and they have thus been called the Net generation (Tapscott, 2009). In this study, it will be examined how young generation (Net generation) chooses a tourism destination based on the effect of social media. The most popular social media sites (Web 2.0 sites) include wikis e.g., Wikitravel, blogs e.g., Travelblog and microblogs e.g., Twitter, social networks e.g., Facebook, media sharing sites e.g., Flickr, YouTube, review sites e.g., TripAdvisor, and voting sites e.g., Digg (Zarrella, 2010). In the case of social electronic networks such as Facebook, much information is accessible only to network members and sharing of personal profiles is an essential feature. In order to investigate the construct, the theoretical model proposed by Parra-Lopez et al. (2011) was applied.
Destination Choice: The destination choice is the ultimate decision of a potential traveler and it is also
the ultimate dependent variable in the study. The construct items of probability and willingness to visit any destination were used to determine their intention to visit a destination.
Based on the literature review of relevant studies and constructs, the following hypotheses were proposed:
H1: There is a positive direct relation between social media and travel motives. H2: There is a negative direct relation between social media and perceived risks. H3: There is a positive direct relation between social media and destination choice.
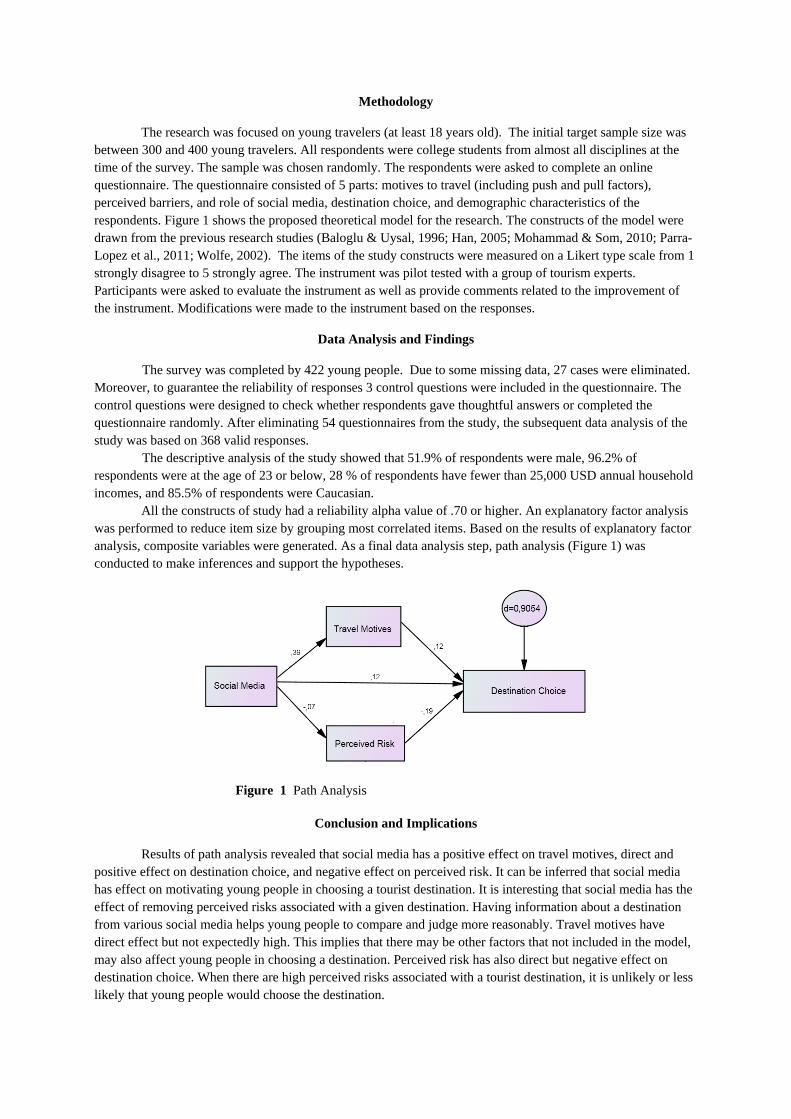
Methodology
The research was focused on young travelers (at least 18 years old). The initial target sample size was between 300 and 400 young travelers. All respondents were college students from almost all disciplines at the time of the survey. The sample was chosen randomly. The respondents were asked to complete an online questionnaire. The questionnaire consisted of 5 parts: motives to travel (including push and pull factors), perceived barriers, and role of social media, destination choice, and demographic characteristics of the respondents. Figure 1 shows the proposed theoretical model for the research. The constructs of the model were drawn from the previous research studies (Baloglu & Uysal, 1996; Han, 2005; Mohammad & Som, 2010; Parra-Lopez et al., 2011; Wolfe, 2002). The items of the study constructs were measured on a Likert type scale from 1 strongly disagree to 5 strongly agree. The instrument was pilot tested with a group of tourism experts. Participants were asked to evaluate the instrument as well as provide comments related to the improvement of the instrument. Modifications were made to the instrument based on the responses.
Data Analysis and Findings
The survey was completed by 422 young people. Due to some missing data, 27 cases were eliminated. Moreover, to guarantee the reliability of responses 3 control questions were included in the questionnaire. The control questions were designed to check whether respondents gave thoughtful answers or completed the questionnaire randomly. After eliminating 54 questionnaires from the study, the subsequent data analysis of the study was based on 368 valid responses.
The descriptive analysis of the study showed that 51.9% of respondents were male, 96.2% of respondents were at the age of 23 or below, 28 % of respondents have fewer than 25,000 USD annual household incomes, and 85.5% of respondents were Caucasian.
All the constructs of study had a reliability alpha value of .70 or higher. An explanatory factor analysis was performed to reduce item size by grouping most correlated items. Based on the results of explanatory factor analysis, composite variables were generated. As a final data analysis step, path analysis (Figure 1) was conducted to make inferences and support the hypotheses.
Figure 1 Path Analysis
Conclusion and Implications
Results of path analysis revealed that social media has a positive effect on travel motives, direct and positive effect on destination choice, and negative effect on perceived risk. It can be inferred that social media has effect on motivating young people in choosing a tourist destination. It is interesting that social media has the effect of removing perceived risks associated with a given destination. Having information about a destination from various social media helps young people to compare and judge more reasonably. Travel motives have direct effect but not expectedly high. This implies that there may be other factors that not included in the model, may also affect young people in choosing a destination. Perceived risk has also direct but negative effect on destination choice. When there are high perceived risks associated with a tourist destination, it is unlikely or less likely that young people would choose the destination.
The study also revealed valuable information for practitioners in the tourism industry, particularly for the destination management organizations (DMOs). Social media should become the first channel to interact with this market. Knowing the importance of the salient aspects of the youth travel market in relation to destination factors, virtual and digital oriented tourism market may allow DMOs to develop more customized destination management opportunities. The results of this research and the proposed model may also serve as a framework for further research in examining mediating and possible moderating variables.
References
Baloglu, S., & McCleary, K. W. (1999). A model of destination image formation. Annals of Tourism Research, 26(4), 868-897.
Baloglu, S., & Uysal, M. (1996). Market segments of push and pull motivations: a canonical correlation approach. International Journal of Contemporary Hospitality Management, 8(3), 32-38.
Han, J. Y. (2005). The relationships of perceived risk to personal factors, knowledge of destination, and travel purchase decisions in international leisure travel. ProQuest Dissertations and Theses, 0338(0247), 248 p.
Hong, S. K., Lee, S. W., Lee, S., & Jang, H. (2009). Selecting Revisited Destinations. Annals of Tourism Research, 36(2), 268-294. doi: DOI 10.1016/j.annals.2009.01.001
Mohammad, B. A. M. A.-H., & Som, A. P. M. (2010). An Analysis of Push and Pull Travel Motivations of Foreign Tourists to Jordan. International Journal of Business and Management, 5(12), 41-50.
Pandza, E. (2007). Attributes of Tourist Destination as Determinants of Tourist perceived Value. nternational Journal of Management Cases, 9(3/4).
Parra-Lopez, E., Buichand-Gidumal, J., Gutierrez-Tano, D., & Diaz-Armas, R. (2011). Intentions to use social media in organizing and taking vacation trips. Computers in Human Behavior, 27(2), 640-654. doi: DOI 10.1016/j.chb.2010.05.022
Sigala, M. & Marinidis, D. (2009). Exploring the transformation of tourism firms’ operations and business models through the use of web map services. In Paper presented at the European and Mediterranean Conference on Information Systems 2009 (EMCIS 2009), Founded and organised by the Information Systems Evaluation and Integration Group, Brunel University, UK. 13–14 July 2009, Izmir, Turkey.
Tapscott, D. (2009). Grown up digital : how the net generation is changing your world. New York: McGraw-Hill.
Tribe, J. (2006). The truth about tourism. Annals of Tourism Research, 33(2), 360-381. doi: 10.1016/j.annals.2005.11.001
UNWTO, W. T. O.-. (2008). Youth travel matters: understanding the global phenomenon of youth travel. Madrid, Spain.
Vengesayi, S. (2008). Destination Attractiveness: Are There Relationships with Destination Attributes. The Business Review, Cambridge, 10(2), 289-294.
Wolfe, K. L. (2002). Investigating seeking and escaping aspects of tourists' motivations and specific barriers of travel: A study of two national park sites. ProQuest Dissertations and Theses, 0338(0100), 162 p.
Zarrella, D. (2010). The social media marketing book. Beijing; Sebastopol, CA: O'Reilly.
Zeithaml, V. A., & Bitner, M. J. (2000). Services Marketing: integrating customer focus across the firm (2nd ed.). Boston: McGraw-Hill Companies, Inc.
Acknowledgements This paper presentation is granted and supported by Selcuk University, Directorate of the Scientific
Researches Projects Committee (BAP). Authors thank the Selcuk University Rectorate for supplying this grant.
Exploring the Influence of Four Realms of Experiential Marketing on Impulse Buying in Chinese
New Year Festival
Austin Rong-Da Liang*, assistant professor Department of Recreation and Tourism Management/National Kaohsiung University of Hospitality and
Tourism Address: No. 1, Songhe Rd., Xiaogang Dist., Kaohsiung City 812, Taiwan (R.O.C.)
Email: [email protected] Jun-Shu Zhang Master of Industrial Economics
Department of Industrial Economics/Shanghai Normal University Email: [email protected]
Abstract
Scholars of tourism and event practitioners both believe that event management and marketing are important issues in the 21 century, although few studies have investigated the specific consumers’ behavior associated with cultural festivals. This study thus focuses on a cultural festival (Chinese New Year Festival) and examines the influence of experiential marketing realms on impulse buying. Using a questionnaire survey, 743 valid samples were collected in three popular spring product streets in Taiwan. The logistic regression results indicate that educational experience, entertainment experience, esthetic experience and escapist experience positively affect impulse buying. The implications and contributions of this work are discussed in the conclusions.
Keywords: Chinese New Year Festival, Impulse buying, Experiential Marketing Realms.
1. Introduction
Scholars (Felsenstein & Fleischer, 2003; Formica & Uysal, 1998; Van Der Wagen & Carlos, 2005) argue that events increase the demand for local tourism, improve the identity of the local residents, and are key elements to attract tourists (Allen et al., 2008; Getz, 2008). Such events not only have social and financial benefits for the local community, but also attract tourists in the off-peak season (Chang, 2006; Getz, 2008; Lee and Beeler, 2009). Therefore, scholars of tourism and event practitioners both claim that event management and marketing are important research issues.
Yeung and Yee (2011) stated that although many event marketing studies have been carried out, few examine the specific purchase patterns in specific festive settings. For example, Tkacynski, and Rundle-Thiele (2011) reported that five studies examine consumption behaviors in cultural festive out of 120 event segmentation researches, with most of them focusing on Korean cultural events (Boo and Busser, 2006; Boo, Ko, and Blazey, 2007). Park, Kim and Forney (2006) also stated that exploring the influences of specific situational elements on consumers’ impulse buying could help to clarify certain aspects of consumer behavior. As the statement of Getz (2008), this study argues that cultural events are important and provide unique tourism/retailing environments for consumers. Meanwhile, we focus on the Chinese New Year Festival and impulse buying, because it is the most important of all the festivals for Chinese, and is also associated with specific cultural and consumption behavior.
In addition, event activities are part of the experience economy (Pine and Gilmore, 1998), and the aim of the event activities is to establish a temporary creative space to attract tourists (Prentice and Andersen, 2003; Mossberg, 2008; Richards and Wilson, 2004). Therefore, this study believes that adopting a experiential marketing perspective is an effective way to discuss the impulse buying behavior. Overall, this study aims to understand: (1) the specific impulse buying behaviors that occur in a specific event background, and (2) the antecedents of consumers’ impulse buying behavior in Chinese New Year Festival.
2. Literature review
2.1 Impulse buying
Impulse buying refers to making unplanned and immediate purchases based on a stimulus, and is often accompanied by feelings of excitement and pleasure and/or a powerful urge to buy (Rook, 1987). Park, et al. (2006) reported that previous studies focus on the definition of and the differences between impulse and non-impulse purchase behavior. Weinberg and Gottwald (1982) argued that impulse purchase included: (1)
affective-high emotional activation, (2) cognitive-low cognitive control, and (3) reactive-reactive behavior based on a specific motivating situation. Therefore, unplanned and sudden purchases in a specific time and location can be defined as impulse purchases. Stern (1962) proposed that impulse buying can be divided into four categories: (1) pure impulsive buying – new product or emotional appeals make consumers feel curious, and thus they purchase the product. (2) Reminder impulsive buying – when consumer see the product and recall related product information or past experiences, and this results in buying behavior. (3) Suggestion impulsive buying – the consumers have no related knowledge or consumption experience, but decide to buy the product after seeing it. (4) Planned impulsive buying – consumer have their own buying plan, and decide to buy the product because of a discount or promotion program. These four categories have common characteristics, in that with all the consumers are motivated by external stimuli, as proposed by Stern (1962).
2.2 The relationship between experiential marketing and impulse buying at a festival activity
In the tourism literature, the key motivating factor for travel is self-educate (Prentice, 2004; Masberg and Silverman, 1996). Prentice’s (2004) romantic paradigm suggests that tourists are thought to be motivated to “consume the extraordinary” and learn new things. Williams (2006) stated that many tourism activities include educational elements factors, such as education program, landscape background information. As the definition of education experience, that are designed to actively engage consumers and enhance their desire to learn new things (Pine and Gilmore, 1998). In other words, an educational experience is an active and absorptive consumption activity, and consumers play vital roles in creating their own experiences. Consumers can thus participate in the tourism activities with the aim of obtaining good memories (Poulsson and Kale, 2004), learn new things, and then make impulse purchases.
H1: Educational experiences have a positive influence on the consumers’ impulse buying in the street during the Chinese New Year season.
The definition of escapist experience is “the extent to which an individual is completely engrossed and absorbed in the activity” (Csikszentmihalyi 1990). Tourism provides many chances to have escapist experiences. Tourists also search for ‘authenticity’ (Boorstin, 1964) to compensate for their ‘inauthentic lives’ they experience at home (MacCannel, 1973).For instance, Krippendorf (1987) proposed that vacations are a means of “escape aids, problem solvers, suppliers of strength, energy, new lifeblood and happiness”
H2: Escapist experiences have a positive influence on the consumers’ impulse buying in the street during the Chinese New Year season.
Pine and Gilmore (1998) noted that companies deliver the feeling of delight to consumers, and entertainment is a necessary component of tourism products (Hughes and Benn, 1995). For instance, cruise ships vacation provide stimulating environments and have even been characterized as theme parks (Showker and Sehlinger, 1998; Wood, 2004), with nightly shows, comedians, live music bands, and casino-style gaming. Quan and Wang (2004) proposed that celebrations create different kinds of pleasurable entertainment activities, so consumers can experience specific entertainment feelings when they participate in a tourism activity (e.g., tasting food when traveling). In other words, tourism activities offer abundant and diverse forms of entertainment for consumers, and this may lead to impulse buying.
H3: Entertainment experiences have a positive influence on the consumers’ impulse buying in the street during the Chinese New Year season.
Aesthetic experience represents the consumers’ interpretation with regard to the physical environment. Bitner (1992) divides the physical environment into three dimensions: ambient conditions; spatial layout and functionality, and signs, symbols and artifacts. Bellenger, Robertson and Hirschman (1978) argued that the shopping environment has a strong ability to influence impulse buying. Mehrabian and Russell (1974) indicated that environmental factor,s emotions, and individual shopping trends in specific store environments have strong correlations with each other. For example, Peck and Childers (2006) replicated the research of Rook and Fisher (1995), and demonstrated that individual and environmental touch-related factors (e.g., music or lighting) enhance consumers’ desire to engage in impulse buying. Researchers also recognize that aesthetics play an important role in consumer behavior, decision making and service evaluation (e.g., Turley and Milliman, 2000; Brady and Cronin, 2001).
H4: Aesthetic experiences have a positive influence on the consumers’ impulse buying in the street during the Chinese New Year season.
3. Research method
The scale used in this study was developed from previous studies and modified to apply to the Chinese New Year context. The questionnaire consisted of three parts intended to assess experiential marketing realms and Chinese New Year purchase behavior, and collect demographic information. The final questionnaire contained five-point Likert scale questions, with responses ranging from strongly disagree (1) to strongly agree (5). In the first part, the experiential marketing realms were divided into Chinese New Year shopping knowledge (educational experience), street market shows (entertainment experience), store decoration (aesthetic experience), and escaping daily cares (escapist experience)1. This study considered the individual and interacting effects of these experiential marketing realms based on the statement of Yeung and Yee (2010) and then developed 16 items. After a pilot study with 15 consumers, 14 items were used to measure the consumer’s impulse buying in the street during the Chinese New Year season. The statements used in the questionnaire explained various conditions with the presence or absence of the four realms of experiential marketing discussed above. For example, “the shopkeeper tells me a lot of knowledge about Chinese New Year goods” refers to for stand-along experiential marketing realm; “the shopkeeper tells me a lot of knowledge about Chinese New Year goods, the show in the store makes the shopping more interesting, and the store decoration is attractive” refers to a combination of three experiential marketing realms. Impulse buying was measured with a nominal scale, with yes or no responses. In the second part, seven questions were used to measure shopping behavior in the street during the Chinese New Year season. (e.g., time and money spent). Finally, demographic information was collected from seven questions that gathered details of the respondents' gender, age, income, profession, and so on, adapted from Park et al. (2006).
Data collection points were identified based on Taiwan’s regional shopping and infrastructure characteristics. Each region in Taiwan has its own Chinese New Year shopping street. In this study, Taiwan was geographically divided into three regions: north, central and south. The best known New Year shopping street in each region was then selected based on market size, management system, and level of government support (e.g., public transportation access, advertising, and so on). Using this approach, Tihua Street in Taipei, Tianjin Street in Taichung, and Middle San Fung Street in Kaohsiung were selected for data collection. Rest areas and public transportation stations were selected as sampling locations since, as Finneran and Zhang (2005) noted, consumer experience is often very easily acquired after purchases have been completed. A total of 750 questionnaires were collected (250 from each area). Excluding erroneous and incomplete responses, 743 questionnaires were deemed valid.
4. Statistical results
The sampling locations were the most famous Chinese New year shopping streets in Taiwan, including Tihua Street (north area), Middle San Fung Street (south area) and Tianjin Street (middle area). The results indicated that the majority of respondents were female (73.4%), and the largest group were over 40 years old (39.7%) and married with children (49.8%), and buyers of Chinese New Year products. Most respondents (37.1%) were housewives or worked in the service industry. Over half the respondents (52.8%) had more than seven years work experience and a monthly income (49.5%) of between NTD$20,000 and NTD$40,000.
This study adopts the approach used in Yeung and Yee (2010) to test the individual and interactive influential effects of the various experiential marketing realms on impulse buying based on logistic regression. The Chi-square result for the model was 1467.684 (464.121) with a df of 4, and the p-value < 0.001, indicating an adequate fit of the data to the model; in other words, one or more of the EVs could significantly predict the DV. In addition, the Cox and Snell’s R-Square equaled .164, which attempted to imitate the interpretation of the multiple R-Square based on the log likelihood of the final model vs. log likelihood for the baseline model. Although its maximum was less than 1, it was difficult to interpret. The 1the shopkeeper tells me a lot of knowledge about Chinese New Year goods(educational experiences); the peddle show in the store makes the shopping more interesting(entertainment experiences); the store decoration is attractive (aesthetic experiences); The shopping process let me escaped from the vexation of daily life (escapist experiences).
Nagelkerke R-Square, which divides Cox and Snell's R-Square by its maximum in order to achieve a measure that ranges from 0 to 1 equaled .226. The Hosmer and Lemeshow goodness-of-fit was 0 (df=3, p> .5) at the fifth iteration of the estimation. The overall correct prediction rate was 71.6% when using the cutoff value of 0.5 to reflect the tendency to purchase at the spring product street during the Chinese New Year Festival. These values indicate that the model had good predictive power. The Wald test In order to test the hypotheses, and the results indicated that all the hypotheses were accepted at the 95% confidence level, with p values less than 0.01. It can thus be concluded that there are relationships between each marketing realm and impulse purchases. The resulting model is as follows:
Ln(pi/1-pi) = -.592+2.672 × educational experience (Exp(β)=14.472, p<.001) + 1.120 × aesthetic experience (Exp(β)=3.064, p<.001) + 2.341 × entertainment experience (Exp(β) = 10.396, p<.001) + .863 × escapist experience (Exp(β) = 2.369, p<.001).
The model shows that educational and entertainment experiences have the highest positive effect, followed by aesthetic and escapist experience. In other words, the odds of a of a consumer impulse purchase will be increased by 14.472 and 10.396 times by implementing educational and entertainment experiences, respectively. In addition, the implementation of aesthetic and escapist experience will increase the odds of a consumer impulse purchase by 3.064 times and 2.369 times respectively.
Table 1 Logistic regression analysis results. Variable
β S.E. Exp(β) 95%CI for Exp(β)
lower upper Wald df p-
value Educational experience 2.672 .083 14.472 12.288 17.044 1025.08 1 .000 Escapist experience 1.120 .064 3.064 2.700 3.477 301.70 1 .000 Entertainment experience
2.341 .077 10.396 8.942 12.086 928.04 1 .000
Aesthetic experience .863 .064 2.369 2.091 2.684 183.48 1 .000 Constant -.592 .046 .553 166.99 1 .000
5. Discussion and conclusions
Exploring the consumption behavior in the cultural festival activities (Alen, et al., 2008; Getz, 2008) is an important topic in the festival tourism field (Mossberg, 2008; Tkacynski, and Rundle-Thiele, 2011), while experiential marketing attempts to present new experiences for consumers (Williams, 2006). The Chinese New Year Festival has a number of traditional cultural features (e.g. family reunion dinners, posters of Spring Festival couplets and staying up late on New Year's Eve), and also stimulates consumers’ to make special purchases. Therefore, it is worth examining impulse buying behavior during New year shopping from an experiential marketing mix perspective. This research follows the call of Park et al. (2006) and Yeung and Yee (2010) to investigate specific buying models in a festival context, and fills the gap in existing research on this topic. Meanwhile, this paper adopts the analysis method used in Yeung and Yee (2010) to evaluate various experiences’ individual and interactive effects on impulse buying. Therefore, the results of this research have important contributions, both academically and empirically.
First, according to Yeung and Yee (2010), a logistic regression test is an effective way to examine experiential marketing mix’s influence on impulse buying. The results show that educational experience, aesthetic experience, escapist experience and entertainment experience have very positives influence on festival shopping impulse buying behavior, and thus hypotheses 1 to 4 are supported. As argued by Poulsson and Kale (2004), experience is an attractive activity that is co-created by producers and consumers. Educational experience means individuals are eager to learn knowledge about festival goods. For example, the teamed bread with jujube has a Chinese name that is a homophone for getting rich, and may foster the impulse purchase when consumers obtained this information. This result supports the proposal of previous research, that educational experience helps consumers play a co-create rule in the consumption process (Pine and Gilmore, 1998) and that consumers like to learn by themselves (Prentice, 2004; Yarnal and Kerstetter, 2005). Entertainment experience is also a key factor influencing impulse buying behavior, and many vendors try to sell their goods in humorous and interesting ways. that consumers find entertaining (Getz, 2008; Wood, 2004). Aesthetic experience means the stalls are decorated with seasonal object, which make people feel the holiday is coming.
There are three limitations to this study. First, the Chinese New Year festival occurs in China, Taiwan,
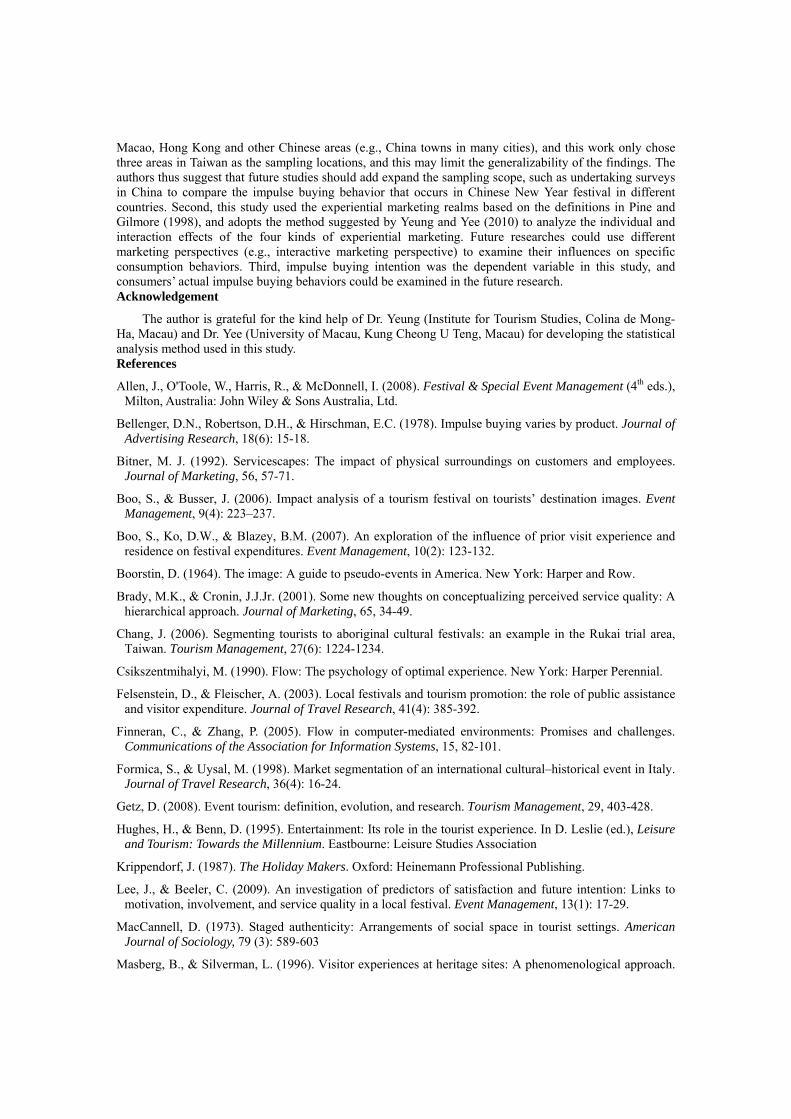
Macao, Hong Kong and other Chinese areas (e.g., China towns in many cities), and this work only chose three areas in Taiwan as the sampling locations, and this may limit the generalizability of the findings. The authors thus suggest that future studies should add expand the sampling scope, such as undertaking surveys in China to compare the impulse buying behavior that occurs in Chinese New Year festival in different countries. Second, this study used the experiential marketing realms based on the definitions in Pine and Gilmore (1998), and adopts the method suggested by Yeung and Yee (2010) to analyze the individual and interaction effects of the four kinds of experiential marketing. Future researches could use different marketing perspectives (e.g., interactive marketing perspective) to examine their influences on specific consumption behaviors. Third, impulse buying intention was the dependent variable in this study, and consumers’ actual impulse buying behaviors could be examined in the future research. Acknowledgement
The author is grateful for the kind help of Dr. Yeung (Institute for Tourism Studies, Colina de Mong-Ha, Macau) and Dr. Yee (University of Macau, Kung Cheong U Teng, Macau) for developing the statistical analysis method used in this study. References
Allen, J., O'Toole, W., Harris, R., & McDonnell, I. (2008). Festival & Special Event Management (4th eds.), Milton, Australia: John Wiley & Sons Australia, Ltd.
Bellenger, D.N., Robertson, D.H., & Hirschman, E.C. (1978). Impulse buying varies by product. Journal of Advertising Research, 18(6): 15-18.
Bitner, M. J. (1992). Servicescapes: The impact of physical surroundings on customers and employees. Journal of Marketing, 56, 57-71.
Boo, S., & Busser, J. (2006). Impact analysis of a tourism festival on tourists’ destination images. Event Management, 9(4): 223–237.
Boo, S., Ko, D.W., & Blazey, B.M. (2007). An exploration of the influence of prior visit experience and residence on festival expenditures. Event Management, 10(2): 123-132.
Boorstin, D. (1964). The image: A guide to pseudo-events in America. New York: Harper and Row.
Brady, M.K., & Cronin, J.J.Jr. (2001). Some new thoughts on conceptualizing perceived service quality: A hierarchical approach. Journal of Marketing, 65, 34-49.
Chang, J. (2006). Segmenting tourists to aboriginal cultural festivals: an example in the Rukai trial area, Taiwan. Tourism Management, 27(6): 1224-1234.
Csikszentmihalyi, M. (1990). Flow: The psychology of optimal experience. New York: Harper Perennial.
Felsenstein, D., & Fleischer, A. (2003). Local festivals and tourism promotion: the role of public assistance and visitor expenditure. Journal of Travel Research, 41(4): 385-392.
Finneran, C., & Zhang, P. (2005). Flow in computer-mediated environments: Promises and challenges. Communications of the Association for Information Systems, 15, 82-101.
Formica, S., & Uysal, M. (1998). Market segmentation of an international cultural–historical event in Italy. Journal of Travel Research, 36(4): 16-24.
Getz, D. (2008). Event tourism: definition, evolution, and research. Tourism Management, 29, 403-428.
Hughes, H., & Benn, D. (1995). Entertainment: Its role in the tourist experience. In D. Leslie (ed.), Leisure and Tourism: Towards the Millennium. Eastbourne: Leisure Studies Association
Krippendorf, J. (1987). The Holiday Makers. Oxford: Heinemann Professional Publishing.
Lee, J., & Beeler, C. (2009). An investigation of predictors of satisfaction and future intention: Links to motivation, involvement, and service quality in a local festival. Event Management, 13(1): 17-29.
MacCannell, D. (1973). Staged authenticity: Arrangements of social space in tourist settings. American Journal of Sociology, 79 (3): 589-603
Masberg, B., & Silverman, L. (1996). Visitor experiences at heritage sites: A phenomenological approach.
Journal of Travel Research, 34(4): 20-25.
Mehrabian, A., & Russell, J.A. (1974). The basic emotional impact of environments, Perceptual and Motor Skills. 38: 283-301.
Mossberg, L. (2008). Extraordinary experiences through storytelling. Scandinavian Journal of Hospitality and Tourism, 8(3): 195-210.
Park, E.J., Kim, E.Y., & Forney, J.C. (2006). A structural model of fashion-oriented impulse buying behavior. Journal of Fashion Marketing and Management, 10(4): 433-446
Peck, J., & Childers, T.L. (2006). If I touch it I have to have it: Individual and environmental influences on impulse purchasing. Journal of Business Research, 59, 765-769.
Pine, B.J., & Gilmore, J.H. (1998). Welcome to the experience economy. Harvard Business Review, 76(4): 96-105 .
Poulsson, S.H.G., & Kale, S.H. (2004). The experience economy and commercial experiences. The Marketing Review, 4(3): 267-277.
Prentice, R., & Andersen, V. (2003). Festival as creative destination. Annals of Tourism Research, 30(1): 7-30.
Prentice, R.C. (2004). Tourist motivation and typologies. In: A. Lew, M. Hall, & A.M. Williams (eds.), A Companion to Tourism (pp. 261-279). Blackwell, Oxford: Blackwell.
Quan, S., & Wang, N. (2004). Towards a structural model of the tourist experience: an illustration from food experiences in tourism. Tourism Management, 25(3): 297-305.
Richards, G., & Wilson, J.C. (2004). The impact of cultural events on city image: Rotterdam cultural capital of Europe 2001. Urban Studies, 41(10): 1931-1951.
Rook, D.W. (1987). The buying impulse. Journal of Consumer Research, 14(2): 189-199.
Rook, D.W., & Fisher, R.J. (1995). Normative influences on impulse buying behavior. Journal of Consumer Research, 22(3): 305-313.
Showker, K., & Sehlinger, B. (1998). The Unofficial Guide to Cruises. New York: Macmillan.
Stern, H. (1962). The significance of impulse buying today. Journal of Marketing, 26: 59-62.
Teye, V., & Leclerc, D. (2002). the white Caucasian and ethnic minority cruise markets: Some motivational perspectives. Tourism Management, 19(2): 153-160.
Tkaczynski, A., & Rundle-Thiele, S.R. (2011). Event segmentation: A review and research agenda. Tourism Management, 32: 426-434.
Turley, L.W., & Milliman, R.E. (2000). Atmospheric effects on shopping behavior: A review of the experimental evidence. Journal of Business Research, 49(2): 193-211.
Van Der Wagen, L., & Carlos, B. (2005). Event management for tourism, cultural, business and sporting events. Frenchs Forest: Pearson Education Australia.
Weinberg, P., & Gottwald, W. (1982). Impulsive consumer buying as a result of emotion. Journal of Business Research, 10(1): 43-57.
Williams, A. (2006). Tourism and hospitality marketing: Fantasy, feeling and fun. International Journal of Contemporary Hospitality Management, 18(6): 482-495.
Wood, R.E. (2004). Cruise ships: Deterritorialized destinations. In L. Lumsdon (ed.), Tourism and Transport: Issues and Agendas for the New Millennium (133-145). London: Elsevier.
Yarnal, C.M., & Kerstetter, D. (2005). Casting off: An exploration of cruise ship space, group tour behavior, and social interaction. Journal of Travel Research, 43(4): 368-379.
Yeung, R.M.W., & Yee, W.M.S. (2010). Chinese New Year festival: Exploring consumer purchase intention at the flower market in Macau. International Journal of Hospitality Management, 29(2): 291-296.
Is Generation Y Ready to Go Green?
Marketa Kubickova* Rosen College of Hospitality Management
University of Central Florida [email protected]
H. G. Parsa
Rosen College of Hospitality Management University of Central Florida
K. Nusair Rosen College of Hospitality Management
University of Central Florida [email protected]
Abstract
Today, protection of the environment has become a global issue, one, that businesses can’t overlook. In addition, generation Y (also called the Millennial Generation) is becoming a significant part of lodging consumer segment in the US. Previous studies have pointed out the influence of image on future consumer behavior. The purpose of this paper is to analyze the determinants of green hotel image on word-of-mouth, willingness to pay, and revisit intentions in the context of Generation Y. A structural equation model (SEM) has been estimated. Findings support the hypothesis that image has effect on word-of-mouth, willingness to pay, and revisit intentions. In addition, theoretical and practical implications are being discussed before the article concludes with limitations and directions for future research. Keywords: green hotels, generation Y, word-of-mouth, image, willingness to pay, revisit intentions, structural equation model
Online Hotel Brand Image: Hotel Marketing Managers’ Perspectives
Duangthida Nunthapirat* PhD Researcher
School of Hospitality and Tourism Management University of Surrey,
Guildford, Surrey GU2 7XH [email protected]
Hesham Al-Sabbahy, Dr.
Programme Director, MSc International Hotel Management School of Hospitality and Tourism Management
University of Surrey, Guildford, Surrey GU2 7XH
Key words: Brand Image, Online Brand Image, Hotel, Internet, Marketing
It is becoming difficult to ignore the importance of brand image management in the virtual
world. The internet has been used directly and indirectly to boost brand awareness, brand recognition and brand loyalty (Porter & Claycomb, 1997). Although the concept of brand image has received a lot of attention in the literature, there is little agreement on the definition of brand image. It is suggested that five factors affect brand image in customer mind. These are brand associations, brand personality, brand attitude, past experience, and marketing communication (Levy & Glick; 1973; Keller’ 1993; Sirgy 1985; Gardner & levy, 1995).
The influence of the internet on individual’s perceptions and behaviours necessitates a change in how brands are managed. The internet offers an array of platforms for customers to express their views and share their experiences on a scale that was never possible before. As such, the internet offers an unrivalled transparent medium for brands to become more visible and stronger if managed effectively, or exposed and vulnerable if not. Despite this change in how people communicate and formulate their perceptions, there is very little research to address how the management of marketing and brands is responding especially in hospitality industry
The current study builds on two theoretical approaches: online brand equity based on cognitive and emotive psychology and online brand attributes based on functional and emotional brand evaluation to form online corporate brand image (Christodoulides & de Chernatony 2004; Da Silva & Syed Alwi, 2008). Although, Da Silva & Syed Alwi (2008) have found ease of use, personalization, security and customer care are important factors to determine brand image of the online e-tailer, their findings are based on bookstore rather than hotel context. The current study investigates marketing managers’ views on how brands may be managed online using semi-structured interviews with a sample from the UK and Thailand. The findings suggest some distinct factors in the virtual context as opposed to offline brand image. From managers’ perspective, brand concept, online brand attributes, e-image, and online marketing channels are key factors in creating brand image. There seems to be a divergence between what managers think and how previous research suggests brand image is formulated from the customer perspective.
Given the lack of research on examining online brand image, this study furthers understanding of this phenomenon. The paper offers implication for hospitality marketers for managing brand image online. It is recommended that further studies be conducted with hotel customers in order to assess and validate the dimensions of online brand image and how they impact on subsequent behaviour. References
Christodoulides, G., & De Chernatony, L. (2004). Dimensionalising on- and offline brands' composite equity. Journal of Product & Brand Management, 13(3), 168-179.
Da Silva, R. V., & Syed Aiwi, S. F. (2008). Online brand attributes and online corporate brand images. European Journal of Marketing, 42(9/10), 1039-1058.
Gardner, B. G., & Levy, S. J. (1955). The Product and the Brand. Harvard Business Review(March-April), 33-39.

Keller, K. L. (1993). Conceptualizing, Measuring, Managing Customer-Based Brand Equity. Journal of Marketing, 57(1), 1-22.
Levy, S. J., & Glick, I. O. (1973). Image and Symbolism; Marketing Manager's Handbook. Chicago: Stewart Britt II.
Porter, S., S., & Claycomb, C. (1997). The influence of brand recognition on retail store image. Journal of Brand Management, 6(6), 373-387.
Sirgy, M. J. (1985). Using Self-Congruity and Ideal Congruity to Predict Purchase Motivation. Journal of Business Research, 13, 195-206.
WHICH FACTORS ARE IMPORTANT FOR CUSTOMERS CONCERNING HOTEL LOYALTY PROGRAM DESIGN?
Mareike Haas
Heilbronn University Heilbronn, Germany
Michael Ottenbacher* Heilbronn University Heilbronn, Germany
and
Robert J. Harrington University of Arkansas Fayetteville, AR, USA
Abstract
Before making substantial investments in loyalty programs (LPs), it is advisable to first understand the factors that are important for customers and that encourage them to participate in a loyalty program (Ashley et al., 2011). According to Leenheer et al. (2007), the design of a LP has a significant influence on the likelihood whether a customer participates in a program or not. Unfortunately, there exists a knowledge gap of the factors that are important for a customer concerning LP design (e.g. McCall and Voorhees, 2010) and little is known about “the factors that determine how such programs are evaluated by consumers” (Kivetz and Simonson, 2002:155). This knowledge gap might exist due to the fact that especially in the hospitality industry, many loyalty generating strategies are developed by managers with little or no consultation with their customers regarding their preferences (Dubé and Renaghan, 1999). Additionally, LPs are often not understood by managers and therefore misapplied (O’Brien and Jones, 1995). According to Liu and Yang (2009), a LP’s design comprises the three key elements (1) participation requirements, (2) point structure and (3) rewards. Thus, this study aims to address a research gap in the hotel literature. Therefore, the aim is to find out which factors are important for customers concerning hotel loyalty program (LP) design. Data was collected through a face-to-face survey in Germany in the fall of 2011. The questionnaire was made up of three sections. The survey contained an introduction section, followed by a section that asked the respondents how important specific factors are regarding hotel LP design, and ended with the third section containing demographic questions about the interviewees. The sample consisted of 250 people from whom 54,8 % were female and 45,2 % were male. For testing whether the hypotheses can be verified or falsified, the method of large-sample tests of hypotheses is used, a so-called T-Test. The aim of this statistical method is to make a decision about a hypothesis (Mendenhall et al., 1993). The T-Tests are performed in a 1 % significance level. The results of the study suggest that two factors are important for customers concerning hotel LP design: (1) easy to understand rules which are not changed too often and (2) point thresholds that are not too high so that they can be reached in a reasonable time. While not significant, hotel LPs that make it possible for its members to collect or redeem points without needing to carry the LP card and (2) hotel LPs with at least three different tier levels were rated as important by customers. Nevertheless, this study has limitations. For example, the sample size and that the survey was a face-to-face survey and thus, the respondents could have been influenced by the interviewer to give a desired answer (Scholl, 2003). Another limitation is that the survey was only conducted in a German context.
Key Words: loyalty program design, hotels
References Ashley, C., Noble, S., Donthu, N. & Lemon, K. (2011). Why customers won’t relate: obstacles to relationship marketing engagement. Journal of Business Research, 64(7): 749-756. Dubé, L. & Renaghan, L. (1999). Building customer loyalty: guests' perspectives on the lodging industry's functional best practices (Part I). Cornell Hospitality Quarterly, 40(5): 78-88. Kivetz, R. & Simonson, I. (2002). Earning the right to indulge: effort as a determinant of customer preferences toward frequency program rewards. Journal of Marketing Research, 39(2): 155-170. Leenheer, J., Van Heerde, H., Bijmolt, T. & Smidts, A. (2007). Do loyalty programs really enhance behavioral loyalty? An empirical analysis accounting for self-selecting members. International Journal of Research in Marketing, 24(1): 31-47. Liu, Y. & Yang, R. (2009). Competing loyalty programs: impact of market saturation, market share and category expandability. Journal of Marketing 73(1): 93-108. McCall, M. & Voorhees, C. (2010). The drivers of loyalty program success: an organizing framework and research agenda. Cornell Hospitality Quarterly, 51(1): 35-52. Mendenhall, W., Reinmuth, J. and Beaver, R. (1993). Statistics for Management and Economics. Belmont: Duxbury Press. O'Brien, L., & Jones, C. (1995). Do rewards really create loyalty. Harvard Business Review, 73(3): 75-82. Scholl, A. (2003). Die Befragung, Sozialwissenschaftliche Methode und Kommunikationswissenschaftliche Anwendung. Konstanz: UVK Verlagsgesellschaft mbH.
GETTING TO KNOW THE CONTENT OF THE ‘WOW’
Key Words: Quality, Service, Customer Experience, Customer Retention, Competitive Strategy
Authors:
Lysbeth Vink* (Corresponding author)
Hospitality Instructor Hotelschool The Hague
Brusselselaan 2 2587 AH Den Haag
Annette Kappert-White
Hospitality Lecturer Hotelschool The Hague
Brusselselaan 2 2587 AH Den Haag
Dr. Daphne Dekker
Lector Hospitality, Personality & Behaviour Hotelschool The Hague
Brusselselaan 2 2587 AH Den Haag
INTRODUCTION
The WOW factor has been branded and wielded by companies to describe new products and experiences for generations, yet there are very few studies that have objectively defined what it is, assessed its ‘manipulativeability’, or determined its true impact on quality within the hospitality industry. Despite extensive research conducted to understand the relationship between fulfillment and customer satisfaction (Kano, 1984), the conclusion that “customer experience” has replaced price, product and service as the new competitive strategy (Shaw and Ivens, 2002), little has been done to understand the relationship between experience, quality and guest retention (Reichheld, 2012).
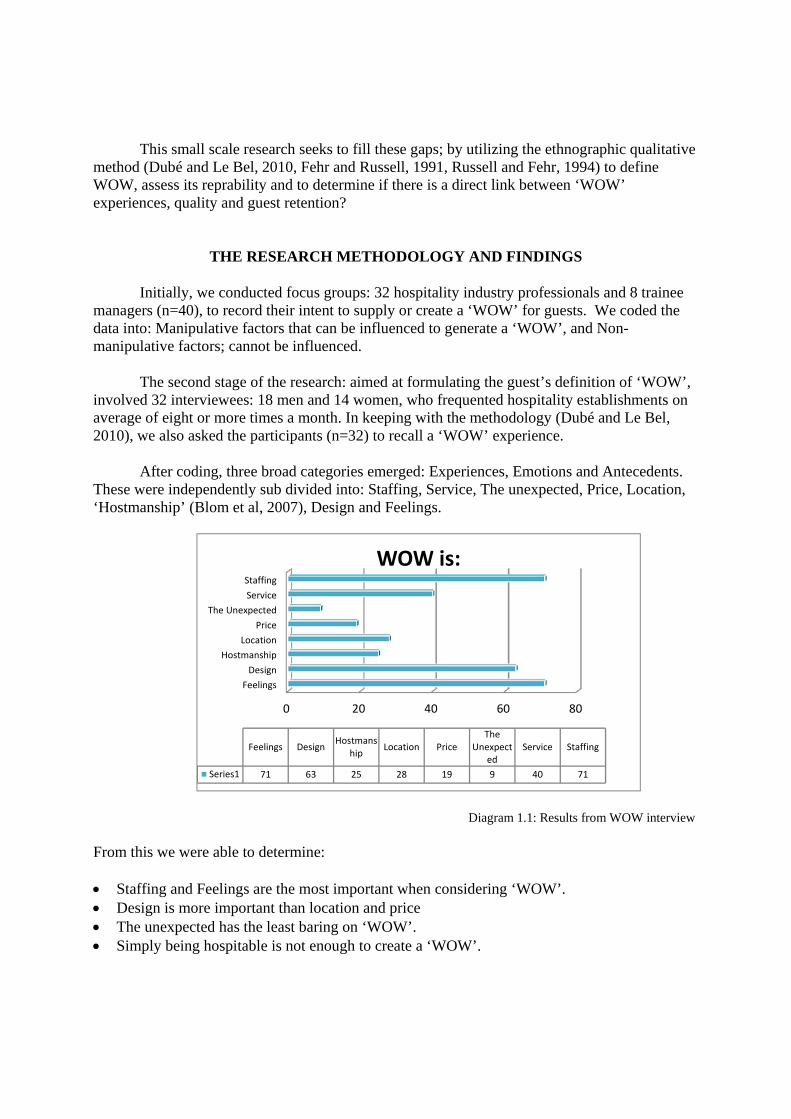
This small scale research seeks to fill these gaps; by utilizing the ethnographic qualitative method (Dubé and Le Bel, 2010, Fehr and Russell, 1991, Russell and Fehr, 1994) to define WOW, assess its reprability and to determine if there is a direct link between ‘WOW’ experiences, quality and guest retention?
THE RESEARCH METHODOLOGY AND FINDINGS
Initially, we conducted focus groups: 32 hospitality industry professionals and 8 trainee managers (n=40), to record their intent to supply or create a ‘WOW’ for guests. We coded the data into: Manipulative factors that can be influenced to generate a ‘WOW’, and Non-manipulative factors; cannot be influenced.
The second stage of the research: aimed at formulating the guest’s definition of ‘WOW’, involved 32 interviewees: 18 men and 14 women, who frequented hospitality establishments on average of eight or more times a month. In keeping with the methodology (Dubé and Le Bel, 2010), we also asked the participants (n=32) to recall a ‘WOW’ experience.
After coding, three broad categories emerged: Experiences, Emotions and Antecedents. These were independently sub divided into: Staffing, Service, The unexpected, Price, Location, ‘Hostmanship’ (Blom et al, 2007), Design and Feelings.
Diagram 1.1: Results from WOW interview From this we were able to determine: Staffing and Feelings are the most important when considering ‘WOW’. Design is more important than location and price The unexpected has the least baring on ‘WOW’. Simply being hospitable is not enough to create a ‘WOW’.
0 20 40 60 80
Feelings
Design
Hostmanship
Location
Price
The Unexpected
Service
Staffing
Feelings DesignHostmans
hipLocation Price
TheUnexpect
edService Staffing
Series1 71 63 25 28 19 9 40 71
WOW is:
DISCUSSION AND CONCLUSION
Although not a direct request, many of the participants gave their definition of ‘WOW’:
‘WOW is an emotional experience; a sort of eruption inside!’ ‘A nostalgic feeling of being at home’ ‘Genuine staff, who smiled and cared’
From these findings we can conclude that despite some naturally occurring ‘WOWs’, they can recreated. However, in response to our final question; more data is required, hence we intend to host a round table talk with: leading industry professionals, hospitality staff and guests, to determine any relationship between WOW, quality and guest retention.
Nevertheless, we are able to conclude that creating a ‘WOW’ should be part of an organization’s culture, time and investment must be allocated to staff training, and despite factors: Service and Feelings, being preferred over others, having all of them in correct proportions, will enhance the guest’s experience.
Finally, we acknowledge that further research needs to be conducted to: identify
resources required to ‘WOW’ a guest and to locate examples of good practice in the Dutch Hospitality industry.
LIST OF REFERENCES
Blom, O. & Gunmasson, J. (2007) Hostmanship. Vardskapet Utveckling AB
Dubé, L. & Le Bel, J. (2010). The concept and structure of Laypeople’s concept of pleasure. Cognition & Emotion, 17, 263-295.Fehr, B., & Russell, J. A. (1991). The concept of love viewed from a prototype perspective. Journal of Personality and Social Psychology, 60, 425-438. Kano, N., N. Seraku, F. Takahashi and S. Tsuji: "Attractive Quality and Must-be Quality", Hinshitsu. The Journal of the Japanese Society for Quality Control, (April 1984), pp. 39 -48. Reichheld, F, (2012) The value in wowing your customers. Harvard Business review Russell, J. A., & Fehr, B. (1994). Fuzzy concepts in a fuzzy hierarchy: Varieties of anger. Journal of Personality and Social Psychology, 67, 186_205.
Shaw, C. and J. Ivens (2002). Building Great Customer Experiences. Palgrave Macmillan, New
York.
THE EFFECTS OF HOPE AND WORK ENGAGEMENT ON FRONTLINE EMPLOYEES’ PERFORMANCE OUTCOMES
Osman M. Karatepe
Faculty of Tourism Eastern Mediterranean University
Gazimagusa, TRNC via Mersin 10, Turkey
E-mail: [email protected] This paper proposes and tests a research model that investigates whether work engagement (WE) mediates the effect of hope on job performance (JP), service recovery performance (SRP), and extra-role customer service (ERCS). These relationships were tested using data gathered from full-time frontline hotel employees and their managers in Romania. The results from structural equation modeling (SEM) suggest that the impact of hope on JP, SRP, and ERCS is fully mediated by WE. Based on the results reported in this study, several useful implications concerning acquisition and retention of frontline employees who can display high quality performance in the workplace are provided. Key Words: Hope, Hotel employees, Performance outcomes, Romania, Work engagement
Introduction
At a time of increasing competition from other hospitality firms, intensifying customer demands, and rapid rates of technological change, hospitality managers need to acquire and retain frontline employees who can deliver quality services to customers, return disgruntled customers to a state of satisfaction after a service failure, and go beyond their formal role requirements for meeting or even exceeding customer expectations (cf. Deery, 2008; Kusluvan, Kusluvan, Ilhan, & Buyruk, 2010). Hopeful frontline employees who are engaged in their work can show successful performance in service encounters.
As a positive psychological strength, hope is defined as “a cognitive set that is based on a reciprocally
derived sense of successful (a) agency (goal-directed determination) and (b) pathways (planning of ways to meet goals)” (Snyder et al., 1991, p. 571). Hope includes both willpower and waypower thinking (Avey, Luthans, & Jensen, 2009). Employees need to have the will and a viable means to achieve a specific task (Luthans, Norman, Avolio, & Avey, 2008). As a motivational construct, WE refers to “a positive, fulfilling, work-related state of mind that is characterized by vigor, dedication, and absorption” (Schaufeli, Salanova, Gonzáles-Romá, & Bakker, 2002, p. 74). Employees high in hope are more engaged in their work, because they have more goal oriented strategies and are motivated for goal achievement (Bakker & Demerouti, 2008). These employees in turn perform successfully in the workplace.
Against this background, the current paper proposes and tests a research model that examines whether
WE acts as a mediator of the effect of hope on JP, SRP, and ERCS. JP, SRP, and ERCS are the three organizationally valued performance outcomes used in the present study (e.g., Karatepe, 2011; Karatepe & Sokmen, 2006). Data obtained from frontline hotel employee-manager dyads in Romania are utilized to assess these relationships.
This paper contributes to the existing knowledge base in the following ways. First, hope is an important personal resource for accomplishing a specific task. There are several studies indicating that personal resources (e.g., self-efficacy, self-esteem) increase employee performance through WE (e.g., Bakker & Demerouti, 2008; Xanthopoulou, Bakker, Heuven, Demerouti, & Schaufeli, 2008). However, very little is known about the relationship between hope and WE in the relevant literature (Ouweneel, Le Blanc, Schaufeli, & van Wijhe, 2012). In addition, the hospitality management and marketing literature is devoid of empirical research concerning the effect of hope on WE in frontline service jobs in the hotel industry. This is surprising, because frontline employees have intense face-to-face or voice-to-voice interactions with customers, provide feedback about customer requests and problems to managers, and have to perform effectively in service delivery and complaint handling processes. More importantly, empirical research regarding WE as a mechanism that links personal resources to performance outcomes is scarce (Rich, LePine, & Crawford, 2010).
Second, Line and Runyan’s (2012) recent study on hospitality marketing research demonstrates that the
overwhelming majority of the empirical studies have used self-report data that are prone to common method bias. Common method bias is a potential threat to the magnitudes of relationships among variables. Consistent
with the suggestions made by Podsakoff, MacKenzie, Lee, and Podsakoff (2003), this study collects data from multiple sources and measures frontline employees’ JP, SRP, and ERCS as assessed by their managers. Third, engaged employees display better performance than nonengaged employees. Specifically, Bakker (2011) argues that engaged employees have positive emotions and regularly work on their personal resources. Bakker (2011) also discusses that engaged employees dedicate their skills and energy resources to their work and transfer their engagement to other people in their immediate work environment (Bakker, 2011). Therefore, understanding the previously mentioned relationships would provide useful strategies for acquiring and retaining high performing employees in the organization. Finally, to the best of the author’s knowledge, this is the first study in the hospitality management and marketing literature that links hope to JP, SRP, and ERCS through WE using data gathered from frontline hotel employees and their managers.
Research model and hypotheses
Research model
The research model in Figure 1 demonstrates the study relationships. Specifically, the model proposes that employees high in hope have elevated levels of WE. Such employees in turn display higher JP, SRP, and ERCS. In short, WE has a full mediating role in the relationship between hope and performance outcomes. As discussed by Rich et al. (2010), it is critical to examine WE that can serve as a mechanism through which personal resources or personality variables influence performance outcomes. The model also indicates that gender is treated as a control variable, because it may significantly influence study variables and confound the relationships (e.g., Karatepe, 2011; Karatepe & Sokmen, 2006; Sonnentag, Mojza, Binnewies, & Scholl, 2008). Hypotheses Hope seems to share some similarities with other personality variables such as self-efficacy and core self-evaluations. As cogently argued by Peterson and Byron (2008), self-efficacy and core self-evaluations do not consist of the pathways dimension of hope. Consistent with Peterson and Byron’s (2008) study, hope is conceptualized and measured as “individuals’ psychological appraisal of their general level of hopefulness” (p. 788). There are several studies that hope enhances JP, job satisfaction, and organizational commitment and reduces stress symptoms, job search behaviors, and turnover intentions (Avey et al., 2009; Peterson & Byron, 2008; Youssef & Luthans, 2007). However, very little is known about the relationship between hope and WE. It appears that agency thoughts (e.g., positive past experiences) motivate employees to pursue or take advantage of strategies that would result in achievement of goals. When employees find that the strategy they prefer to pursue seems to prove difficult, they focus on other alternative strategies to overcome problems or difficulties to reach their goals. While pursuing strategies that would lead to goal attainment, employees are engaged in their work. That is, employees high in hope direct their energy in pursuing strategies through WE. In short, personal resources, due to their motivational potential, enhance employees’ WE (Bakker & Demerouti, 2008). In Ouweneel et al.’s (2012) study, it was reported that hope had a positive impact on WE. Therefore, the following hypothesis is proposed: Hypothesis 1. Hope is positively related to WE. JP, SRP, and ERCS are the three organizational valued performance outcomes used in the current study. JP refers to “the level of productivity of an individual employee, relative to his or her peers, on several job-related behaviors and outcomes” (Babin & Boles, 1998, p. 82), while SRP refers to frontline employees’ abilities and actions to resolve a service failure to the satisfaction of the customer (Babakus, Yavas, Karatepe, & Avci, 2003). In addition, ERCS is defined as “discretionary behaviors of contact employees in serving customers that extend beyond formal role requirements” (Bettencourt & Brown, 1997, p. 41). Although not abundant in the current literature, there is empirical evidence that employees with higher WE perform effectively in service delivery and complaint handling processes and display ERCS behaviors for meeting or even exceeding customer expectations (Bakker & Demerouti, 2008; Karatepe, 2011; Xanthopoulou et al., 2008). Therefore, the following hypotheses are proposed: Hypotheses 2. WE is positively related to (a) JP, (b) SRP, and (c) ERCS.
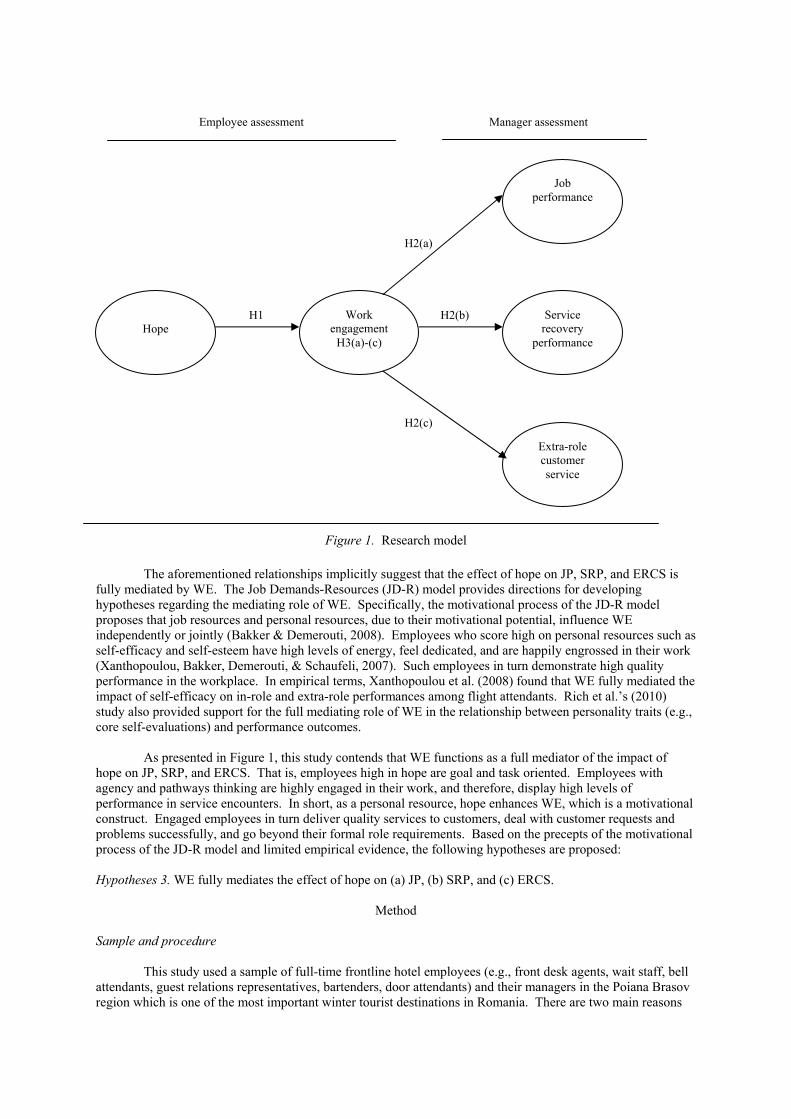
Figure 1. Research model The aforementioned relationships implicitly suggest that the effect of hope on JP, SRP, and ERCS is fully mediated by WE. The Job Demands-Resources (JD-R) model provides directions for developing hypotheses regarding the mediating role of WE. Specifically, the motivational process of the JD-R model proposes that job resources and personal resources, due to their motivational potential, influence WE independently or jointly (Bakker & Demerouti, 2008). Employees who score high on personal resources such as self-efficacy and self-esteem have high levels of energy, feel dedicated, and are happily engrossed in their work (Xanthopoulou, Bakker, Demerouti, & Schaufeli, 2007). Such employees in turn demonstrate high quality performance in the workplace. In empirical terms, Xanthopoulou et al. (2008) found that WE fully mediated the impact of self-efficacy on in-role and extra-role performances among flight attendants. Rich et al.’s (2010) study also provided support for the full mediating role of WE in the relationship between personality traits (e.g., core self-evaluations) and performance outcomes. As presented in Figure 1, this study contends that WE functions as a full mediator of the impact of hope on JP, SRP, and ERCS. That is, employees high in hope are goal and task oriented. Employees with agency and pathways thinking are highly engaged in their work, and therefore, display high levels of performance in service encounters. In short, as a personal resource, hope enhances WE, which is a motivational construct. Engaged employees in turn deliver quality services to customers, deal with customer requests and problems successfully, and go beyond their formal role requirements. Based on the precepts of the motivational process of the JD-R model and limited empirical evidence, the following hypotheses are proposed: Hypotheses 3. WE fully mediates the effect of hope on (a) JP, (b) SRP, and (c) ERCS.
Method Sample and procedure This study used a sample of full-time frontline hotel employees (e.g., front desk agents, wait staff, bell attendants, guest relations representatives, bartenders, door attendants) and their managers in the Poiana Brasov region which is one of the most important winter tourist destinations in Romania. There are two main reasons
Hope
Work engagement
H3(a)-(c)
Service recovery
performance
Job performance
Extra-role customer service
H1
H2(a)
H2(b)
H2(c)
Employee assessment Manager assessment
for choosing frontline employees in the present study. First, frontline employees have frequent face-to-face or voice-to-voice interactions with customers, represent the hotel to customers and other related parties, and have to be high performers in service encounters. Second, frontline employees provide useful information about customer expectations and complaints to management of the hotel. At the time of this study there were 7 four-star hotels and only 1 five-star hotel in the Poiana Brasov region. Managements of these hotels agreed to participate in the current study. However, they did not allow the researcher to directly contact their employees. Therefore, self-administered questionnaires that consisted of information about the assurance of anonymity and confidentiality were distributed to frontline employees through their managers. Each frontline employee sealed the questionnaire in an envelope and placed it in a special box. The researcher received the questionnaires from this box. The employee questionnaire included the hope and WE measures and items pertaining to age, gender, education, and organizational tenure. The manager questionnaire consisted of the JP, SRP, and ERCS measures. The researcher prepared a master list that comprised the names of frontline hotel employees. Each employee in this list was assigned an identification number. An identification number appeared on each employee’s questionnaire. An identification number was also written on each manager questionnaire. Managers evaluated each frontline employee’s JP, SRP, and ERCS under their supervision. A total number of 123 questionnaires were distributed to frontline employees. 114 questionnaires were returned by the cut-off date for data collection. However, 110 questionnaires had complete information. That is, 110 questionnaires were returned, yielding a response rate of 89.4%. Such a response rate is comparable to other studies (e.g., Boles, Wood, & Johnson, 2003). These employee questionnaires were also matched with the manager questionnaires using the identification number. Forty-one respondents (37%) ranged in age from 18-27 years, while 43 respondents (39%) ranged in age from 28-37 years. The rest were older than 37. The sample consisted of 64 (58%) males and 46 (42%) females. In terms of educational attainment, 7 respondents (6%) had primary school education, while 55 respondents (50%) had secondary and high school education. Forty-two respondents (38%) had two- and four-year college degrees. The rest had graduate degrees. The sample included 73 respondents (66%) with tenures of five years or less. Twenty-six respondents (24%) had tenures between 6 and 10 years. The rest had been with their hotel for eleven or more years. Measurement
All variables were measured through multiple items in the current literature. Twelve items from Snyder et al. (1991) were used to measure hope. Sample items are ‘I can think of many ways to get out of a jam’ and ‘I energetically pursue my goals.’ Response options for items in hope ranged from 4 (definitely true) to 1 (definitely false). The shortened version of the Utrecht WE scale was used to operationalize WE (Schaufeli, Bakker, & Salanova, 2006). Specifically, this scale consisted of nine items. Sample items are ‘At my work, I feel bursting with energy’, ‘I am enthusiastic about my job’, and ‘I feel happy when I am working intensely.’ Responses to items in WE were rated on a seven-point frequency rating scale ranging from 6 (always) to 0 (never). Five items adapted from Babin and Boles (1998) were used to measure JP. Sample items include ‘This employee is a top performer’ and ‘This employee knows more about services delivered to customers than others.’ Five items came from Boshoff and Allen (2000) for operationalizing SRP. Sample items are ‘Considering all the things this employee does, he/she handles dissatisfied customers quite well’ and ‘No customer this employee deals with leaves with problems unresolved.’ Finally, ERCS was measured through 5 items from Bettencourt and Brown (1997). Sample items include ‘This employee voluntarily assists customers even if it means going beyond job requirements’ and ‘This employee willingly goes out of his/her way to make a customer satisfied.’ Responses to items in JP, SRP, and ERCS were rated on five-point scales ranging from 5 (strongly agree) to 1 (strongly disagree).
The back-translation method was used to prepare the employee and manager questionnaires.
According to the back translation method, the researcher prepared the employee and manager questionnaires in English. Then, two bilingual individuals (fluent in both Romanian and English) participated independently in the translation process. Finally, the researcher further checked the two versions of the employee and manager questionnaires in English for any inconsistencies. The employee questionnaire was tested with a pilot sample of 10 frontline employees. The manager questionnaire was tested with a pilot sample of 5 managers. There was no need to make changes in the questionnaires as a result of each pilot study.
Data analysis This study utilized a two-step approach that included confirmatory factor analysis (CFA) and SEM (Anderson & Gerbing, 1988). The first step consisted of the assessment of the measurement model in terms of convergent and discriminant validity (Anderson and Gerbing, 1988; Fornell and Larcker, 1981). The second step included a model comparison through the χ2 difference test. This is also consistent with the suggestions made by James, Mulaik, and Brett (2006) that it is important to identify the model which seems to offer useful explanations against the model that does not. The relationships shown in the research model were tested using the SEM. The overall χ2 measure, CFI [Comparative fit index], IFI [Incremental fit index], RMSEA [Root mean square error of approximation], and SRMR [Standardized root mean square residual] were used to evaluate model fit. The sample size of this study seems to be congruent with many suggestions that pertain to the minimum sample size of 100 for SEM (Hair, Black, Babin, & Anderson, 2010). Reliability of each variable was measured based on composite reliability (Bagozzi & Yi, 1988). All of these analyses were employed through LISREL 8.30 (Joreskog & Sorbom, 1996).
Results Measurement results Several items were dropped during CFA due to low standardized loadings (< .50) and correlation measurement errors. That is, four items from the hope measure, two items each from the WE, JP, and SRP measures were dropped during CFA. The results demonstrated that there was an acceptable fit of the five-factor model on the basis of a number of fit statistics (χ2 = 421.37, df = 289; χ2 / df = 1.46; CFI .91; IFI = .92; RMSEA .065; SRMR .062). The magnitudes of the standardized loadings ranged from .60 to .91. The average variance extracted by each variable was greater than .50. That is, the average variance extracted by hope, WE, JP, SRP, and ERCS were .52, .66, .65, .71, and .67, respectively. The average variance extracted by each variable was also larger than the respective shared variance. Overall, there was evidence of convergent and discriminant validity (Anderson & Gerbing, 1988; Fornell & Larcker, 1981). Table 1 presents means, standard deviations, correlations of study variables, and composite reliability. The results show that female employees perform better than male employees. This is consistent with the work of Karatepe and Sokmen (2006) that female employees are more relationship oriented, and therefore, seem to display more caring behaviors to customers or complainants in service encounters. As reported in Table 1, composite reliability for each construct was also larger than the .60 threshold. In short, the results revealed that the measures were reliable (Bagozzi & Yi, 1988). Table 1 Means, Standard Deviations, Correlations of Study Variables, and Reliability Variables 1 2 3 4 5 6 1. Gender 1.000 2. Hope .116 1.000 3. Work engagement .113 .628 1.000 4. Job performance .209 .344 .380 1.000 5. Service recovery performance .132 .290 .346 .721 1.000 6. Extra-role customer service .143 .432 .532 .694 .680 1.000 Mean .42 2.82 3.26 3.38 3.33 3.27 Standard deviation .50 .60 1.06 .88 .93 .89 Composite reliability - .90 .93 .85 .88 .91
Note. Composite scores for each construct were calculated by averaging respective item scores. Correlations .209 are significant at the .05 level. Structural model results
The fully mediated model (χ2 = 445.36, df = 313) is compared with the partially mediated model (χ2 =
441.09, df = 310) via the χ2 difference test (p < .05). The fully mediated model seems to have a better fit than the partially mediated model (∆χ2 = 4.27, ∆df = 3, not significant). Therefore, the results for the fully mediated model are used to assess the study relationships. Consequently, the results reveal that the fully mediated model fits the data acceptably (χ2 = 445.36, df = 313; χ2 / df = 1.42; CFI .92; IFI = .92; RMSEA .062; SRMR .066).
The results in Figure 2 show that hope has a significant positive impact on WE (β21 = .68, t = 6.26). Such a finding provides empirical support for hypothesis 1. The results also demonstrate that WE significantly and positively influences JP (β32 = .39, t = 3.84), SRP (β42 = .37, t = 3.54), and ERCS (β52 = .57, t = 5.84). Therefore, hypotheses 2(a), 2(b), and 2(c) are supported.
The results in Figure 2 reveal that all standardized indirect effects are significant. Specifically, the
standardized indirect effect of hope on JP (.27), SRP (.25), and ERCS (.39) through WE is significant based on Sobel test. Hence, there is empirical support for hypotheses 3(a), 3(b), and 3(c). Gender does not significantly affect hope (γ11 = .11, t = 1.05), WE (γ21 = .03, t = .36), JP (γ31 = .18, t = 1.89), SRP (γ41 = .10, t = 1.02), and ERCS (γ51 = .09, t = 1.10). As a control variable, gender does not confound the relationships among study variables. In addition, the results account for 1% of the variance in hope, 46% in WE, 20% in JP, 15% in SRP, and 34% in ERCS.
Discussion and Implications
This study proposes and tests a research model that examines WE as a mediator of the effect of hope on
JP, SRP, and ERCS. These relationships are tested using data obtained from full-time frontline hotel employees and their managers in Romania. All hypotheses are supported by the empirical data. There are several useful findings arising from this study. First, the result concerning the relationship between hope and WE suggests that hopeful frontline employees pursue strategies to reach their goals by feeling vigor, being involved and happily immersed in their work. Such employees also take advantage of alternative paths to achieve their goals. This finding lends credence to limited empirical evidence in the current literature (Ouweneel et al., 2012). Second, the results pertaining to the effect of WE on JP, SRP, and ERCS suggest that engaged employees perform effectively in the workplace. A close examination of the SEM results also suggests that WE appears to have a stronger impact on ERCS than on JP and SRP. That is, frontline employees with higher WE attach a priority to exceeding customer expectations through their ERCS behaviors. The results regarding the effect of WE on JP, SRP, and ERCS are consistent with the works of Karatepe (2011) and Xanthopoulou et al. (2008).
Third, the results suggest that WE is a full mediator of the effect of hope on JP, SRP, and ERCS. As a personal resource, hope enhances JP, SRP, and ERCS through WE. Consistent with the precepts of the JD-R model (Bakker & Demerouti, 2008), employees with agency and pathways thinking are engaged in their work, and therefore, perform effectively in service delivery process, respond to customer requests and complaints successfully, and perform activities that are not included in their formal role requirements. In short, this study contributes to the current knowledge base by examining WE as a mediator of the relationship between hope and performance outcomes based on data gathered from frontline hotel employee-manager dyads in Romania.
There are several useful implications for managers emerging from the study findings. The foremost
implication of this study appears to be related to the hiring mechanism in the organization. That is, it is important for managers to acquire a pool of engaged employees. However, managers should make sure that the shortened version of the Utrecht WE scale that is used during the selection process should always be checked in terms of validity for frontline service jobs in the hotel industry. Such an implication is important, because engaged employees regularly work on their personal resources (i.e., hope), transfer their engagement to other individuals in their immediate work environment, and display high levels of performance in the workplace (Bakker, 2011). Training also seems to be a critical tool for enabling employees to set challenging goals, consider contingency planning for coping with potential problems, and avoid false hope (cf. Peterson & Byron, 2008; Youssef & Luthans, 2007). Employees’ elevated levels of WE, when coupled with these training programs, would give rise to better JP, SRP, and ERCS. Consequently, the abovementioned implications would be helpful for hotel managers to acquire and retain employees who may display high levels of performance in the organization.
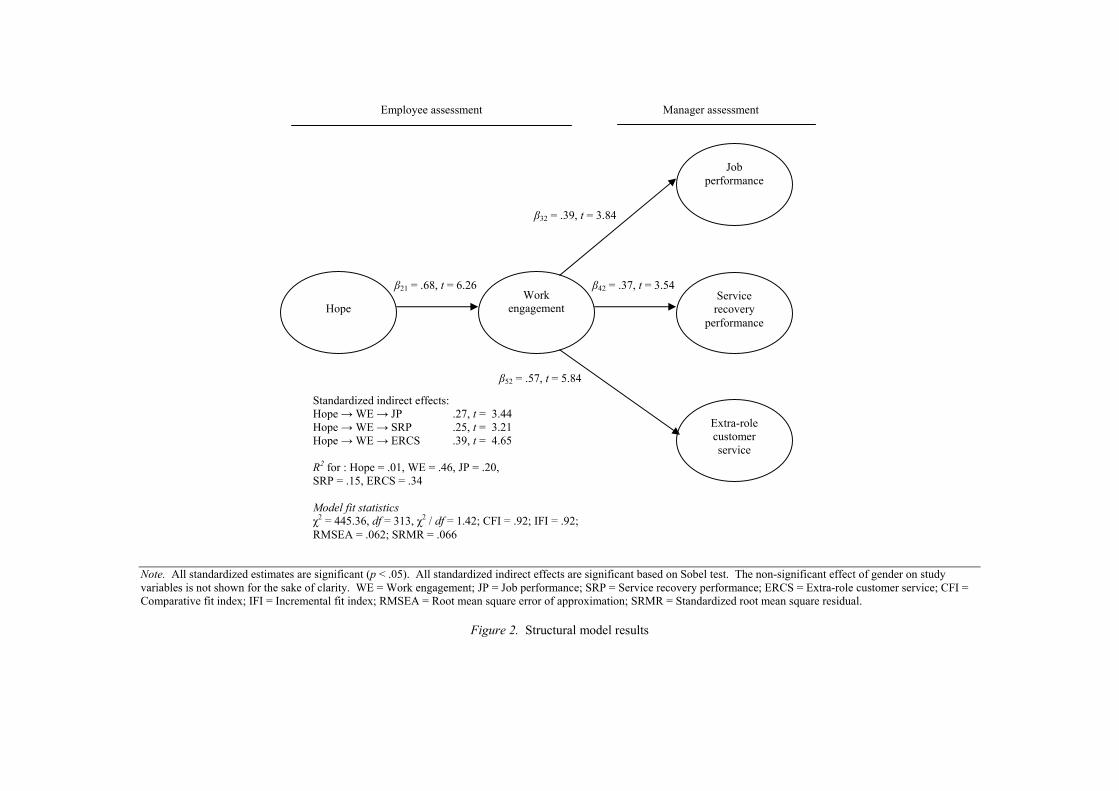
Note. All standardized estimates are significant (p < .05). All standardized indirect effects are significant based on Sobel test. The non-significant effect of gender on study variables is not shown for the sake of clarity. WE = Work engagement; JP = Job performance; SRP = Service recovery performance; ERCS = Extra-role customer service; CFI = Comparative fit index; IFI = Incremental fit index; RMSEA = Root mean square error of approximation; SRMR = Standardized root mean square residual.
Figure 2. Structural model results
Service recovery
performance
Hope
Work engagement
Job performance
Extra-role customer service
β21 = .68, t = 6.26
Employee assessment Manager assessment
Standardized indirect effects: Hope → WE → JP .27, t = 3.44 Hope → WE → SRP .25, t = 3.21 Hope → WE → ERCS .39, t = 4.65 R2 for : Hope = .01, WE = .46, JP = .20, SRP = .15, ERCS = .34 Model fit statistics χ2 = 445.36, df = 313, χ2 / df = 1.42; CFI = .92; IFI = .92; RMSEA = .062; SRMR = .066
β32 = .39, t = 3.84
β42 = .37, t = 3.54
β52 = .57, t = 5.84
This study is not without its limitations. Specifically, cross-sectional data were used to assess hypotheses. With this realization, in future studies collecting longitudinal data would be useful for making causal inferences. The present study tested JP, SRP, and ERCS as performance outcomes. Including other performance outcomes such as creative performance, team performance, and coworker performance in future studies would provide a detailed analysis of the mediating role of WE. Hope is one of the dimensions of psychological capital. In future studies examining WE as a mediator of the effect of psychological capital on the abovementioned outcomes would be beneficial. In addition, all relationships were tested using the individual frontline employees as the unit of analysis. In future studies assessing the study relationships at the organizational level would enhance the understanding concerning WE as a mediator. In closing, replication studies with large sample sizes in different tourism and hospitality settings in Romania and other countries are needed for broadening the database in this research stream. References
Anderson, J. C., & Gerbing, D. W. (1988). Structural equation modeling in practice: A review and recommended two-step approach. Psychological Bulletin, 103(3), 411-423.
Avey, J. B., Luthans, F., & Jensen, S. M. (2009). Psychological capital: A positive resource for combating employee stress and turnover. Human Resource Management, 48(5), 677-693.
Babakus, E., Yavas, U., Karatepe, O. M., & Avci, T. (2003). The effect of management commitment to service quality on employees’ affective and performance outcomes. Journal of the Academy of Marketing Science, 31(3), 272-286.
Babin, B., & Boles, J. S. (1998). Employee behavior in a service environment: A model and test of potential differences between men and women. Journal of Marketing, 62(2), 77-91.
Bagozzi, R. P., & Yi, Y. (1988). On the evaluation of structural equation models. Journal of the Academy of Marketing Science, 16(1), 74-94.
Bakker, A. B. (2011). An evidence-based model of work engagement. Current Directions in Psychological Science, 20(4), 265-269.
Bakker, A. B., & Demerouti, E. (2008). Towards a model of work engagement. Career Development International, 13(3), 209-223.
Bettencourt, L. A., & Brown, S. W. (1997). Contact employees: Relationships among workplace fairness, job satisfaction and prosocial service behaviors. Journal of Retailing, 73(1), 39-61.
Boles J. D., Wood, J. A., & Johnson, J. (2003). Interrelationships of role conflict, role ambiguity, and work-family conflict with different facets of job satisfaction and the moderating effects of gender. Journal of Personal Selling and Sales Management, 28(2), 99-113.
Boshoff, C., & Allen, J. (2000). The influence of selected antecedents on frontline staff’s perceptions of service recovery performance. International Journal of Service Industry Management, 11(1), 63-90.
Deery, M. (2008). Talent management, work-life balance and retention strategies. International Journal of Contemporary Hospitality Management, 20(7), 792-806.
Fornell, C., & Larcker, D. F. (1981). Evaluating structural equation models with unobservable variables and measurement error. Journal of Marketing Research, 18(1), 39-50.
Hair, J. F., Jr., Black, W. C., Babin, B. J., & Anderson, R. E. (2010). Multivariate data analysis: A global perspective. 7th. ed. Upper Saddle River, New Jersey: Pearson Education.
James, L. R., Mulaik, S. A., & Brett, J. M. (2006). A tale of two methods. Organizational Research Methods, 9(2), 233-244.
Joreskog, K., & Sorbom, D. (1996). LISREL 8: user’s reference guide. Chicago: Scientific Software International, Inc.
Karatepe, O. M. (2011). Procedural justice, work engagement, and job outcomes: Evidence from Nigeria. Journal of Hospitality Marketing and Management, 20(8), 855-878.
Karatepe, O. M., & Sokmen, A. (2006). The effects of work role and family role variables on psychological and behavioral outcomes of frontline employees. Tourism Management, 27(2), 255-268.
Kusluvan, S., Kusluvan, Z., Ilhan, Z., & Buyruk, L. (2010). The human dimension: A review of human resources management issues in the tourism and hospitality industry. Cornell Hospitality Quarterly, 51(2), 171-214.
Line, N. D., & Runyan, R. C. (2012). Hospitality marketing research: Recent trends and future directions. International Journal of Hospitality Management, 31(2), 477-488.
Luthans, F., Norman, S. M., Avolio, & Avey, J. B. (2008). The mediating role of psychological capital in the supportive organizational climate-employee performance relationship. Journal of Organizational Behavior, 29(2), 219-238.
Ouweneel, E., Le Blanc, P. M., Schaufeli, W. B., & van Wijhe, C. I. (2012). Good morning, good day: A diary study on positive emotions, hope, and work engagement. Human Relations, doi:10.1177/0018726711429382
Peterson, S. J., & Byron, K. (2008). Exploring the role of hope in job performance: Results from four studies. Journal of Organizational Behavior, 29(6), 785-803.
Podsakoff, P. M., MacKenzie, S. B., Lee, J. Y., & Podsakoff, N. P. (2003). Common method biases in behavioral research: A critical review of the literature and recommended remedies. Journal of Applied Psychology, 88(5), 879-903.
Rich, B. L., LePine, J. A., & Crawford, E. R. (2010). Job engagement: Antecedents and effects on job performance. Academy of Management Journal, 53(3), 617-635.
Schaufeli, W. B., Bakker, A. B., & Salanova, M. (2006). The measurement of work engagement with a short questionnaire: A cross-national study. Educational and Psychological Measurement, 66(4), 701-716.
Schaufeli, W. B., Salanova, M., Gonzáles-Romá, V., & Bakker, A. B. (2002). The measurement of engagement and burnout: A two sample confirmatory factor analytic approach. Journal of Happiness Studies, 3(1), 71-92.
Snyder, C. R., Harris, C., Anderson, J. R., Holleran, S. A., Irving, L. M., Sigmon, S. T., Yoshinobu, L., Gibb, J., Langelle, C., & Harney, P. (1991). The will and the ways: Development and validation of an individual-differences measure of hope. Journal of Personality and Social Psychology, 60(4), 570-585.
Sonnentag, S., Mojza, E. J., Binnewies, C., & Scholl, A. (2008). Being engaged at work and detached at home: A week-level study on work engagement, psychological detachment, and affect. Work and Stress, 22(3), 257-276.
Xanthopoulou, D., Bakker, A. B., Demerouti, E., & Schaufeli, W. B. (2007). The role of personal resources in the job demands-resources model. International Journal of Stress Management, 14(2), 121-141.
Xanthopoulou, D., Bakker, A. B., Heuven, E., Demerouti, E., & Schaufeli, W. B. (2008). Working in the sky: A diary study on work engagement among flight attendants. Journal of Occupational Health Psychology, 13(4), 345-356.
Youssef, C. M., & Luthans, F. (2007). Positive organizational behavior in the workplace. Journal of Management, 33(5), 774-800.
WHEN EMPLOYEES WALK THE COMPANY TALK: THE BENEFITS OF INVOLVEMENT IN CORPORATE PHILANTHROPY FOR EMPLOYEE COMMITMENT AND GOODWILL
Steffen P. Raub
Ecole Hôtelière Lausanne Lausanne, Switzerland
ABSTRACT
Corporate philanthropy is often viewed as a vehicle for fostering employee commitment. However, research suggests that it does not always accomplish this goal. We propose that involving employees in corporate philanthropy encourages more benevolent attributions for philanthropy, thereby promoting higher attitudinal and behavioral commitment. In Study 1, a field study, employee involvement in corporate philanthropy predicted higher attitudinal and behavioral commitment to the firm. In Study 2, a laboratory experiment, participants reported higher attitudinal and behavioral commitment to a company when it was described as involving employees in philanthropy. In both studies, benevolent attributions mediated this relationship. We discuss implications of this research for understanding the impact of corporate philanthropy on a particularly important group of stakeholders — employees.
Key words: Benevolent attributions, corporate philanthropy, corporate social responsibility, commitment, involvement, participation.
THE IDEAL BOSS IN HOSPITALITY INDUSTRY - THE SEARCH GOES ON A Qualitative Analysis of Hospitality Students’ Views of Leadership Traits
Kari Nurminen
MSc., CHE, Sen. Lecturer HAAGA-HELIA University of Applied Sciences
Ratapihantie 13 FI-00520 Helsinki [email protected]
Abstract
This paper studies the picture of the ideal hospitality leader in the mind of the hospitality student. The research is explorative and qualitative in nature; the data was collected in 38 classes 12.11.2007 - 01.11.2011 at HAAGA-HELIA. Observations were reduced into six categories. The ideal boss demonstrates professional qualities, a positive personality, team membership, excellent communication, results orientation and encouraging subordinates. International classes stress personality and results orientation, as Finnish classes emphasize team membership and values such as equality. Consequently, hospitality industry and educators alike benefit from recognizing generation Y expectations. This suggests further study with larger populations and with an international focus.
Key words: Leadership, managers, hospitality, students, generation Y
THE USE OF THE PSYCHOLOGICAL CONTRACT TO EXPLAIN SELF-PERCEIVED EMPLOYABILITY
Jenny Sok * Hotelschool The Hague
Brusselselaan 2 2587 AH The Hague, The Netherlands
T: +31 (0)70 351 24 81 F: +31 (0)70 351 21 55
E-mail: [email protected]
Rob Blomme Nyenrode Business University
Straatweg 25 3621 BG Breukelen, The Netherlands
E-mail: [email protected]
Debbie Tromp Hotelschool The Hague
Brusselselaan 2 2587 AH The Hague, The Netherlands
E-mail: [email protected]
*corresponding author
ABSTRACT
This study examines the relationship between psychological contract and self-perceived employability (intra-organizational mobility intentions, employee development and perceived labor market opportunities). A survey was filled out by 247 hospitality workers, all alumni of the Hotelschool The Hague. Our results suggest that offering intra-organizational) mobility and development opportunities and autonomy can stimulate employees’ (perception of) employability. It is especially important for organizations to know and match the needs of women and older workers regarding development and mobility opportunities. Keywords: Perceived employability; psychological contract; intra-organizational mobility intentions; employee development; perceived labor market opportunities
INTRODUCTION
Employability refers to the extent to which an employee is capable of gaining and maintaining employment (Hillage and Pollard 1998). The subject came to the fore because organizations, operating in a rapidly changing environment, have an increasing need for flexible and employable workers (Fugate, Kinicki and Ashforth 2004). For individual employees these developments entail that they have to work on their employability constantly (Hall and Mirvis 1995; Rothwell and Arnold 2007). Scholars seek to understand what contributes to employees’ employability, particularly since one of the most important challenges in many industries nowadays is to attract and retain highly educated personnel (Walsh and Taylor 2007). Also in the hospitality industry, where the focus of this study lies, management-level turnover is growing (Blomme, Tromp and Van Rheede 2010; Walsh and Taylor 2007). This industry is characterized by long, irregular and unpredictable working hours and is often associated with work-family conflict (Cleveland et al. 2007). These work characteristics are potential work stressors associated with turnover intentions. Although stimulating worker’s feelings of employability may result in losing employees to other employers, an employability (development oriented) culture has been found to relate negatively to turnover intentions (Nauta, Van Vianen, Van der Heijden, Van Dam and Willemsen 2009). So, in the social exchange relationship that today’s employers and employees have, insight into the relationship between employer’s practices
on the one hand, and the perception of employees on how employable they are on the other hand, can be advantageous for both employers and employees.
Increasingly, the psychological contract is seen as an important framework for understanding the modern employer-employee relationship. ‘Psychological contract’ is defined as “individual beliefs regarding the terms and conditions of a reciprocal exchange agreement between that focal person and another party” (Rousseau 1989 p. 123). The psychological contract is founded on Social Exchange Theory (Blau 1964), in which it is expected that the employee’s perception of the employer’s practices will affect his or her feeling of obligation to reciprocate in terms of attitudes and behaviors (Rousseau 1989). Particularly the social exchange perspective of the psychological contract approach can be fruitful in employability research. In the employer-employee relationship of today, employers provide employees with opportunities to become or remain employable (Hall and Mirvis, 1995). In return, employees develop skills and experiences that ensure employability, such as employee development, intra-organizational and external mobility intentions (Hillage and Pollard 1998; Van der Heijde and Van der Heijden 2006; Ten Brink 2004). Therefore, as suggested by Thijssen, Van der Heijden and Rocco (2008), we studied employability within the theoretical framework of the psychological contract. This study aims to extend the research into the relationship between the psychological contract and (perceived) employability, which has not been well-examined (Thijssen et al. 2008).
Employability has been defined and measured in many ways. Since we focused on the perceived reciprocal relationship with the employer via the psychological contract, we also wanted to include attitudinal elements, instead of only capabilities. Therefore, we adopted the broader view on employability of Hillage and Pollard (1998). They state that employability can encompass not only knowledge and skills (Rothwell and Arnold 2007) but also perceptions on the capacity of gaining employment on the internal or external labor market (Van der Heijde and Van der Heijden 2006), developmental and mobility elements, such as willingness to manage their own employment transitions within organizations and willingness to learn (Hillage and Pollard 1998). In this paper, we focus on an internal and an external employability measure as dependent variables (Torka, Geurts, Sanders and Van Riemsdijk 2010), and a developmental measure (Hillage and Pollard 1998). All three measures have received relatively little attention in the literature so far and can be considered to be important in relation to psychological contract.
‘Intra-organizational mobility intentions’ refer to the extent to which employees are willing to fulfill the
current position in another department or to fulfill another (upward or lateral) position within the same organization (Fugate et al. 2004; Thijssen et al. 2008). Willingness to make lateral movements can be seen as fulfilling the employee obligation to remain employable (Thijssen et al. 2008). Hall and Mirvis (1995) state that intra-organizational mobility opportunities can help employees to remain employable, although these changes do not necessarily suggest an upward promotion. Scandura and Lankau suggested that employees who experience a good work-home balance will react with intentions to reciprocate with loyalty and commitment (1997). This could result in more willingness to accept another job within the organization. Ten Brink’s study (2004) showed indeed, that the more opportunities for a good work-family balance their employer offered, the more employees were willing to change their job or their workplace. Others found that autonomy and job content positively influenced employees’ willingness to move within the organization (Schyns and Von Collani 2002). It can also be expected that other positive employer practices, such as offering development opportunities, intra-organizational mobility opportunities and promotion opportunities, job security, a clear task description and high salary will be reciprocated with the intention to fulfill another job within the organization. However, Ten Brink’s results suggested that in some types of organizations, the more positive the job content, job security and clarity of the task description was evaluated, the less willing employees were to change their job or workplace within the organization (2004).
‘Employee development’ refers to the extent to which employees develop knowledge and skills for their
current and future positions (Hall and Mirvis 1995). In the present view on psychological contract, development and mobility intentions are viewed at as career self-management responsibilities, or employee obligations (Rousseau 1995; Thijssen et al. 2008). A review of the literature suggests that perceptions of the work situation are important antecedents of employees’ development. It has been found that job and task changes can give rise to job enrichment and fulfillment of development needs (e.g., Birdi, Allan, and Warr 1997). More specifically, researchers found that career development support and job content were related to development (Van Dam 2004; Ten Brink 2004). In the same way we expect other positive practices, such as offering work-home flexibility, intra-organizational mobility and promotion opportunities, a clear task description, job security and a high compensations to positively influence development activity of the employee. On the other hand, ten Brink found that, the more clear the task description
was and the higher the salary, the less employees seemed to develop themselves; but only in some types of organizations.
‘Perceived labor market opportunities’ encompasses the individual’s beliefs about how easy it is, to find
new employment in the external market (Rothwell and Arnold 2007). We followed Ten Brink’s suggestion (2004) to include this external employability measure in our analyses. Previous research found autonomy and job content to predict occupational self-efficacy, suggesting individuals feel competent enough to manage new tasks in extra-organizational alternatives (Schyns and Von Collani 2002). In the same line of reasoning it can be expected that positive employer practices, such as work-home flexibility, high compensations, a clear task description and job security, development, intra-organizational mobility and promotion opportunities will enhance employees’ feelings of competency, and therefore of external employability.
Considering the relationships found in the literature, the general expectation about the relationship between the psychological contract and employability is that the more employees evaluate the state of the psychological contract as positive, the more they will be willing to be flexible and adaptable, and fulfill a position in a different department; the more they will feel obligated to keep developing themselves; and the more positive they will evaluate their chances on finding a job elsewhere. Therefore, we hypothesize:
H 1. The psychological contract measures relate positively to perceived employability.
Women can be expected to have a different notion of the psychological contract than men. For example, they seem to expect less in terms of pay and promotion and “trade” these benefits for flexibility (Herriot, Manning and Kidd 1997). Several studies have shown that women receive a lower wages for the same work, fewer opportunities for development, education, training and promotion, and less job security (International Labour Office 2010). Also, women experience fewer job alternatives with their current employer (Goudswaard 2003; cited in Torka et al. 2010). We therefore expect women to be also less positive about their job content and autonomy. Because women in the hospitality industry have been found to experience more work-home stress than men (Doherty 2004; Blomme et al. 2010), we expect them to evaluate work-home flexibility as being lower. Therefore, the general expectation is that women score lower on the assessment of their psychological contract than men. Moreover, as a result of being offered fewer opportunities, we also expect women to show less intra-organizational mobility intentions and development, and perceive their external opportunities as being lower, compared to those of men. Our hypotheses are, therefore:
H 2a. The mean groups scores on the psychological contract construct are lower for women, compared to those of men.
H 2b. The mean group scores for perceived employability are lower for women, compared to those of men.
Because both genders have been found to value certain employer’s practices differently, we expect relations
between psychological contract and employability to differ for women and men. For example, men seem to value pay and promotion opportunities more, while women trade these benefits for work-home flexibility (Herriot et al. 1997). Also, research within the hospitality industry has shown that employer’s practices influence men’s and women’s intention to leave and commitment differently (Walsh and Taylor 2007; Doherty 2004; Blomme et al. 2010); for example, work-family conflict was associated strongly with women’s intention to leave the organization. We hypothesize, therefore, that different employer’s practices might also have different influences on the perception of employability, willingness to work in another department, development and perception of external employability of women and men:
H 2c. Gender is a moderator for the relation between the psychological contract and perceived employability.
Since the proportion of the workforce aged over 45 is increasing steadily in North America and Europe
(European Commission 2005), organizations struggle to adapt to the needs and abilities of older workers (Bal, Jansen, Van der Velde, de Lange and Rousseau 2010). It has been argued, that employees of different ages perceive their psychological contract differently (Thijssen et al. 2008; Hess and Jespen 2009). For example, the opportunities for development offered by organizations have been found to diminish with age (Birdi et al. 1997). Also, older
workers’ might be less prepared to develop (Van der Heijden et al. 2009). Some studies have found internal as well as external employability and age to be negatively correlated (Van der Heijden et al. 2009; Rothwell and Arnold 2007). Age has also been found to negatively relate to attitudes towards employability, within a current employer (Van Dam, 2004).We therefore expect the psychological contract measures, as well as the perceived employability levels to be lower for older workers. In this study we compare two age groups: ‘under-forty or forty’ and ‘over-forty’, comparing being mid-career or older (Finkelstein and Farrell 2007; Van der Heijden et al. 2009). Our hypotheses regarding age differences are:
H3a. The mean groups scores on the psychological contract construct are lower for over-forties, compared to those of younger employees.
H 3b. The mean group scores for perceived employability are lower for older employees, compared to those of younger employees.
We also expect relations between psychological contract and employability to differ for younger and older
employees. For example, development opportunities might be valued more by younger workers (Van der Heijden et al. 2009; Lub, Nije Bijvank, Bal, Blomme and Schalk 2011, in press). Findings of research within the hospitality industry suggest that also job content is more important to younger employees (Lub et al. 2011, in press). Older workers place more value on work-life balance, autonomy and job security. Furthermore, older workers were found to be less affected by psychological contract breach (Bal et al. 2010), and therefore, in general, more positive reciprocal behavior might be expected of them. It can therefore be expected that different employer’s practices lead to different employability outcomes, for younger and older employees. We hypothesize, therefore:
H 3c. Age is a moderator for the relation between the psychological contract and perceived employability.
METHODS Sampling
Data for this study were collected using the alumni of the Hotelschool The Hague, an internationally oriented hotel management school in the Netherlands. The respondents were working in the hospitality industry, defined as food, lodging, transportation, attractions and entertainment (e.g., theme parks, casinos) and events (e.g., Yu 2008; Christie-Mill 2008) all over the world. For the confirmatory factor analysis of the psychological contract measure, we had access to two different samples. Sample 1, our study sample, (2006) consisted of 247 respondents, 157 males (64%) and 90 females (36%). In this sample, the mean age was 37.3; 167 of the respondents were 40 years or younger (68%) and 80 were over forty (32%). Most respondents had a bachelor’s degree in higher professional education (n = 218; 88%), the others (12%) had a master’s degree, mostly MBA. Sample 2 (2008) consisted of 135 respondents, 75 males and 60 females (56% and 44% respectively). In this sample most of the respondents were between 23 and 43 years old (84.5%). In this sample, most of the respondents had a bachelor’s degree in higher professional education (n = 317), the others (22.1%) had a master’s degree. Measures
Psychological contract was measured with Ten Brink’s validated questionnaire (2004) measuring the “state” of the contract, referring to employee’s perception of what the organization offers them in terms of many different intrinsic and extrinsic employment practices. It builds on work from other scholars (Van Dijk 1997; Schalk, Freese and Van den Bosch 1995; Herriot, Manning and Kidd 1997; Meyer and Allen 1997; Rousseau 1990; all cited in: Ten Brink 2004). The 36 items refer to a broad set of frequently used transactional and relational elements: job content (five items), work autonomy (three items), working atmosphere (seven items), development opportunities (six items), intra-organizational mobility opportunities (three items), work/family balance (four items), clear task description (three items), job security (one item), promotion opportunities (one item), and salary (three items). The three outcomes variables were measured by adapting and adding to Ten Brink’s instruments (2004), developed for measuring employability. Intra-organizational mobility intentions were measured using three items, such as: “I am willing to perform my current position in another department”. Employee development was assessed adding one item to ten Brink’s instrument (2004): “I develop new skills and knowledge for jobs in the same profession in the future”.
Perceived labor market opportunities were measured using three items, such as: “If I wanted, I could easily find a new job elsewhere”, as suggested but not researched by Ten Brink (2004). Items of all measures were scored on a five-point scale, ranging from 1 (totally disagree) to 5 (totally agree). All measures showed acceptable internal consistencies, with Cronbach’s αs ranging from .70 to .90. (Table 2). Analyses
Confirmatory factor analysis (CFA) was executed using the AMOS 19 computer program (Arbuckle 2010), a. to confirm Ten Brink’s measuring instrument for this particular group of respondents (hospitality workers) in two independent data sets (sample 1, 2006 and sample 2, 2008), b. to compare the final seven-factor solution with a higher order one-factor model (sample 1 and 2), and c. to test cross-group validity for both genders and age-groups; the latter analyses were only conducted for sample 1, because of the small sample size of sample 2. We used the change in chi-square (∆χ2) and the associated change in degrees of freedom (∆df) to compare models, combined with the fit measures CFI, change in CFI (∆CFI), SRMR, RMSEA and change in RMSEA (∆ RMSEA) (Stevens 2009). Constraining, respectively, the factor loadings (model b), variances and co-variances (model c), and residuals (model d) to be equal for both genders and age-groups, made it possible to assess a significant reduction in fit in each subsequent step. When factors are correlated it is important to examine whether the factor correlations can be explained by one or more higher-order factors (Stevens 2009). We performed several second-order analyses, varying with different combinations of variables, based on the literature. Mean scores and Pearson correlations were computed for all psychological contract and employability variables. Independent-Samples T tests were performed to test differences in mean scores on the psychological contract and the employability measures, between men and women, and between younger employees and those who were over 40. Hierarchical stepwise regression (SPSS 19.0) was used to assess the relative contribution of employer practices to employability; for the total group of respondents, and separately for men and women and both age groups, because the sample size was too small to include interaction terms.
RESULTS Confirmatory factor analyses
We conducted confirmatory analyses (CFA) on the psychological contract variables. None of the correlations between the original items exceeded .80 (Stevens 2009). We removed six items because their loadings on the first factor were below .30, or because the second highest loading exceeded .30 and counted for 4/5 of the loading on the first scale (Stevens 2009; Ten Brink 2004). For the same reason the complete work atmosphere scale was removed. The remaining measuring instrument contained 23 items. The seven scales were work-home flexibility, job content, autonomy, development opportunities, a clear task description, salary and intra-organizational mobility opportunities, the three single-item variables were job security, performance related pay and promotion opportunities. Construct validity was assessed by inspecting the standardized factor loadings, which were all >.50 and statistically significant. Internal consistency reliability was assessed with Cronbach’s α, that ranged from .74 to .90 (Table 2). The fit measures of the final model were acceptable (Table 1). We considered χ2 and χ2 /df, which was < 2, comparative fit index (CFI) was >.90, the root mean square error of approximation (RMSEA) was below .06 and the standardized root mean square (SRMR) was <.08 (Hu and Bentler 1999). The fit measures of model 5 for the, much smaller, sample of 2008 were slightly worse; SRMR was just above .08, and RMSEA was <.08, which indicates an ‘acceptable fit’ (Hu and Bentler 1999).
Higher order analyses showed that all factors combined could be represented by one second-order factor (Table 1, model 2 and 5), which can be viewed at as an overriding construct (Stevens 2009). However, since we were interested in the potential differential contributions of each construct, we decided to continue our analyses with using the psychological contract variables separately. Second, despite the acceptable fit of the higher-order factor, both samples show a significant change in χ2, and in sample 2 the change in CFI >.01 (Cheung and Rensvold 2002). In future research studies however, combining the psychological contract factors could prove to be useful.
The multi-group analyses showed that the model could be accepted for males, females, younger employees
and over-forties (Table 1). Despite the fact that χ2 increased significantly in models 3b and 4b, 4c and 4d, the
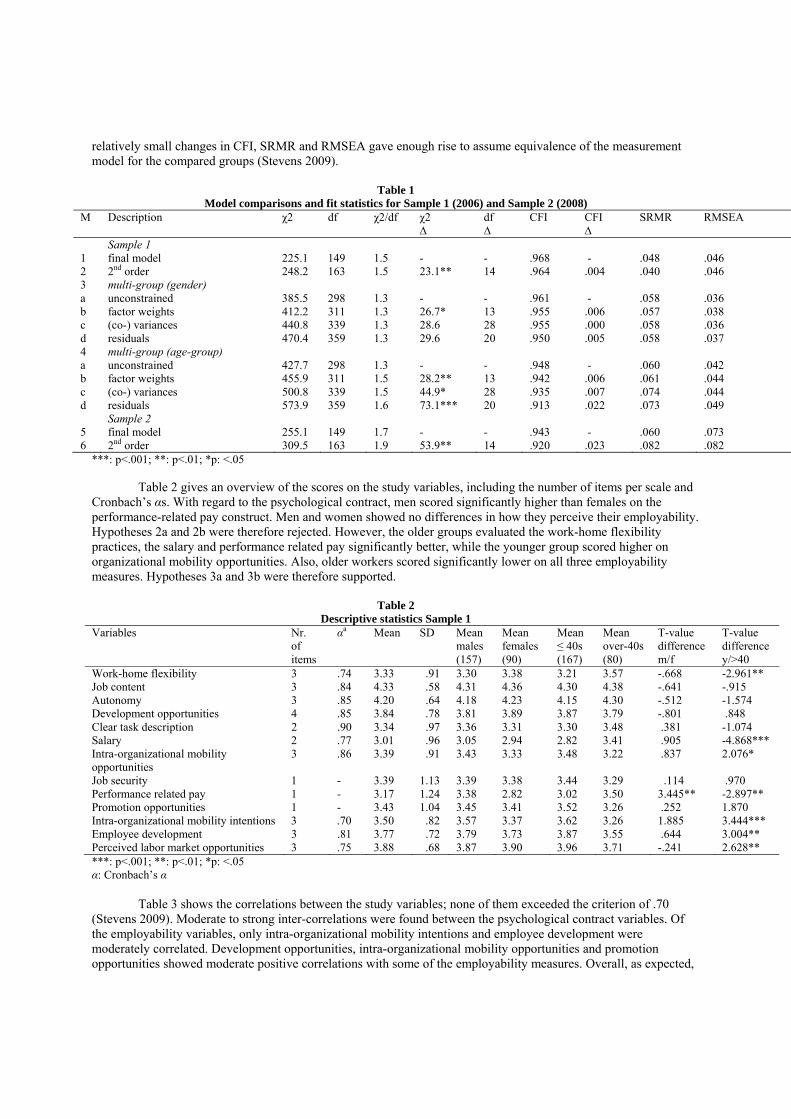
relatively small changes in CFI, SRMR and RMSEA gave enough rise to assume equivalence of the measurement model for the compared groups (Stevens 2009).
Table 1 Model comparisons and fit statistics for Sample 1 (2006) and Sample 2 (2008)
M Description χ2 df χ2/df χ2 ∆
df ∆
CFI CFI ∆
SRMR RMSEA
Sample 1 1 final model 225.1 149 1.5 - - .968 - .048 .046 2 2nd order 248.2 163 1.5 23.1** 14 .964 .004 .040 .046 3 multi-group (gender) a unconstrained 385.5 298 1.3 - - .961 - .058 .036 b factor weights 412.2 311 1.3 26.7* 13 .955 .006 .057 .038 c (co-) variances 440.8 339 1.3 28.6 28 .955 .000 .058 .036 d residuals 470.4 359 1.3 29.6 20 .950 .005 .058 .037 4 multi-group (age-group) a unconstrained 427.7 298 1.3 - - .948 - .060 .042 b factor weights 455.9 311 1.5 28.2** 13 .942 .006 .061 .044 c (co-) variances 500.8 339 1.5 44.9* 28 .935 .007 .074 .044 d residuals 573.9 359 1.6 73.1*** 20 .913 .022 .073 .049 Sample 2 5 final model 255.1 149 1.7 - - .943 - .060 .073 6 2nd order 309.5 163 1.9 53.9** 14 .920 .023 .082 .082
***: p<.001; **: p<.01; *p: <.05
Table 2 gives an overview of the scores on the study variables, including the number of items per scale and Cronbach’s αs. With regard to the psychological contract, men scored significantly higher than females on the performance-related pay construct. Men and women showed no differences in how they perceive their employability. Hypotheses 2a and 2b were therefore rejected. However, the older groups evaluated the work-home flexibility practices, the salary and performance related pay significantly better, while the younger group scored higher on organizational mobility opportunities. Also, older workers scored significantly lower on all three employability measures. Hypotheses 3a and 3b were therefore supported.
Table 2 Descriptive statistics Sample 1
Variables
Nr. of items
αa Mean SD Mean males (157)
Mean females (90)
Mean ≤ 40s (167)
Mean over-40s (80)
T-value difference m/f
T-value difference y/>40
Work-home flexibility 3 .74 3.33 .91 3.30 3.38 3.21 3.57 -.668 -2.961** Job content 3 .84 4.33 .58 4.31 4.36 4.30 4.38 -.641 -.915 Autonomy 3 .85 4.20 .64 4.18 4.23 4.15 4.30 -.512 -1.574 Development opportunities 4 .85 3.84 .78 3.81 3.89 3.87 3.79 -.801 .848 Clear task description 2 .90 3.34 .97 3.36 3.31 3.30 3.48 .381 -1.074 Salary 2 .77 3.01 .96 3.05 2.94 2.82 3.41 .905 -4.868*** Intra-organizational mobility opportunities
3 .86 3.39 .91 3.43 3.33 3.48 3.22 .837 2.076*
Job security 1 - 3.39 1.13 3.39 3.38 3.44 3.29 .114 .970 Performance related pay 1 - 3.17 1.24 3.38 2.82 3.02 3.50 3.445** -2.897** Promotion opportunities 1 - 3.43 1.04 3.45 3.41 3.52 3.26 .252 1.870 Intra-organizational mobility intentions 3 .70 3.50 .82 3.57 3.37 3.62 3.26 1.885 3.444*** Employee development 3 .81 3.77 .72 3.79 3.73 3.87 3.55 .644 3.004** Perceived labor market opportunities 3 .75 3.88 .68 3.87 3.90 3.96 3.71 -.241 2.628** ***: p<.001; **: p<.01; *p: <.05 α: Cronbach’s α
Table 3 shows the correlations between the study variables; none of them exceeded the criterion of .70 (Stevens 2009). Moderate to strong inter-correlations were found between the psychological contract variables. Of the employability variables, only intra-organizational mobility intentions and employee development were moderately correlated. Development opportunities, intra-organizational mobility opportunities and promotion opportunities showed moderate positive correlations with some of the employability measures. Overall, as expected,
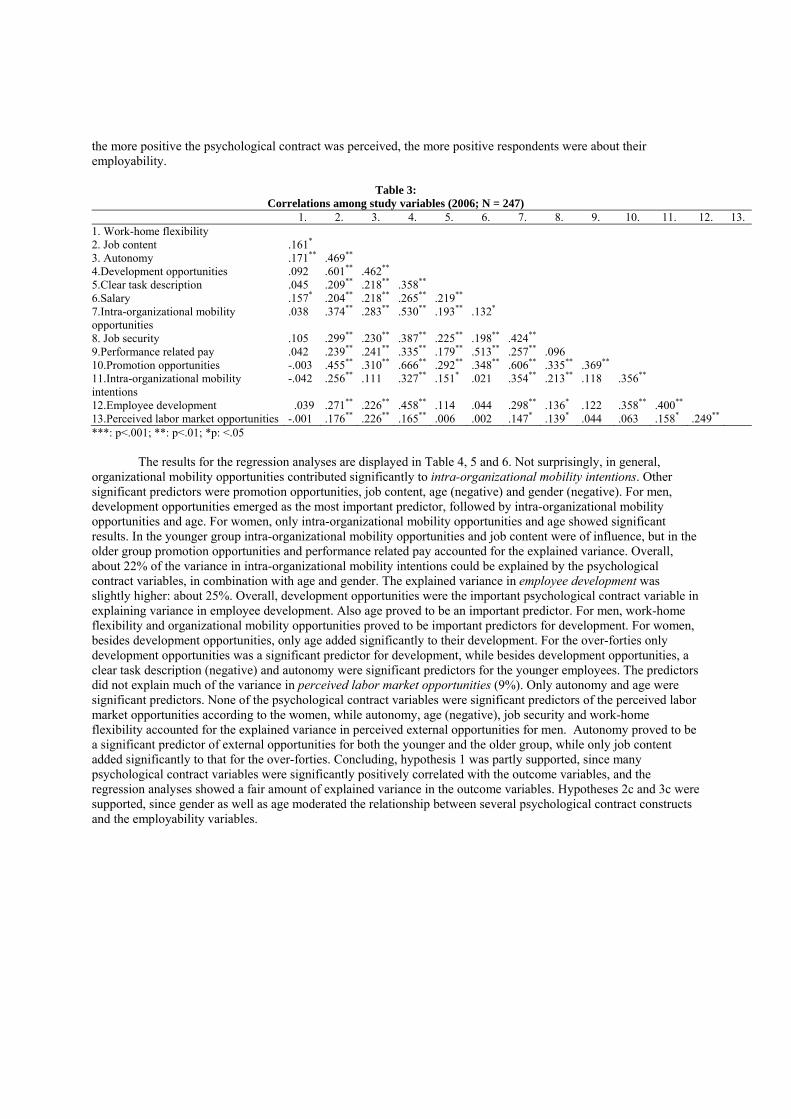
the more positive the psychological contract was perceived, the more positive respondents were about their employability.
Table 3: Correlations among study variables (2006; N = 247)
1. 2. 3. 4. 5. 6. 7. 8. 9. 10. 11. 12. 13. 1. Work-home flexibility 2. Job content .161* 3. Autonomy .171** .469** 4.Development opportunities .092 .601** .462** 5.Clear task description .045 .209** .218** .358** 6.Salary .157* .204** .218** .265** .219** 7.Intra-organizational mobility opportunities
.038 .374** .283** .530** .193** .132*
8. Job security .105 .299** .230** .387** .225** .198** .424** 9.Performance related pay .042 .239** .241** .335** .179** .513** .257** .096 10.Promotion opportunities -.003 .455** .310** .666** .292** .348** .606** .335** .369** 11.Intra-organizational mobility intentions
-.042 .256** .111 .327** .151* .021 .354** .213** .118 .356**
12.Employee development .039 .271** .226** .458** .114 .044 .298** .136* .122 .358** .400** 13.Perceived labor market opportunities -.001 .176** .226** .165** .006 .002 .147* .139* .044 .063 .158* .249** ***: p<.001; **: p<.01; *p: <.05
The results for the regression analyses are displayed in Table 4, 5 and 6. Not surprisingly, in general, organizational mobility opportunities contributed significantly to intra-organizational mobility intentions. Other significant predictors were promotion opportunities, job content, age (negative) and gender (negative). For men, development opportunities emerged as the most important predictor, followed by intra-organizational mobility opportunities and age. For women, only intra-organizational mobility opportunities and age showed significant results. In the younger group intra-organizational mobility opportunities and job content were of influence, but in the older group promotion opportunities and performance related pay accounted for the explained variance. Overall, about 22% of the variance in intra-organizational mobility intentions could be explained by the psychological contract variables, in combination with age and gender. The explained variance in employee development was slightly higher: about 25%. Overall, development opportunities were the important psychological contract variable in explaining variance in employee development. Also age proved to be an important predictor. For men, work-home flexibility and organizational mobility opportunities proved to be important predictors for development. For women, besides development opportunities, only age added significantly to their development. For the over-forties only development opportunities was a significant predictor for development, while besides development opportunities, a clear task description (negative) and autonomy were significant predictors for the younger employees. The predictors did not explain much of the variance in perceived labor market opportunities (9%). Only autonomy and age were significant predictors. None of the psychological contract variables were significant predictors of the perceived labor market opportunities according to the women, while autonomy, age (negative), job security and work-home flexibility accounted for the explained variance in perceived external opportunities for men. Autonomy proved to be a significant predictor of external opportunities for both the younger and the older group, while only job content added significantly to that for the over-forties. Concluding, hypothesis 1 was partly supported, since many psychological contract variables were significantly positively correlated with the outcome variables, and the regression analyses showed a fair amount of explained variance in the outcome variables. Hypotheses 2c and 3c were supported, since gender as well as age moderated the relationship between several psychological contract constructs and the employability variables.
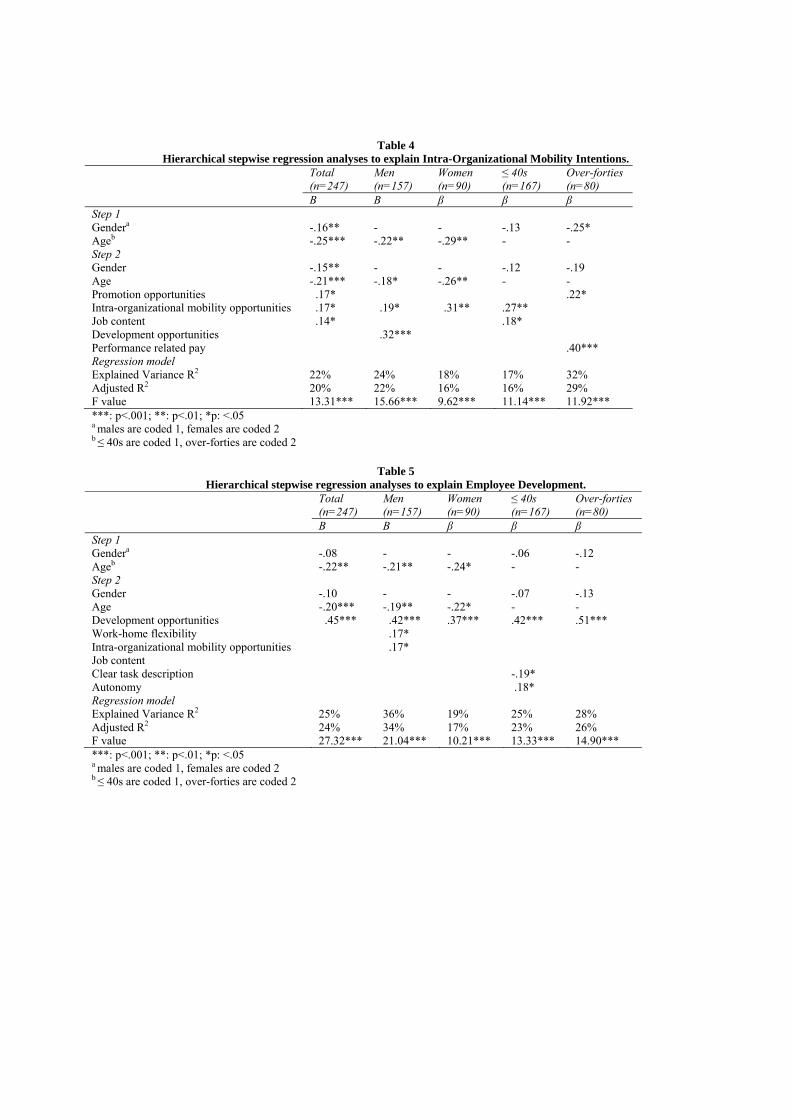
Table 4 Hierarchical stepwise regression analyses to explain Intra-Organizational Mobility Intentions.
Total (n=247)
Men (n=157)
Women (n=90)
≤ 40s (n=167)
Over-forties (n=80)
Β Β β β β Step 1 Gendera -.16** - - -.13 -.25* Ageb -.25*** -.22** -.29** - - Step 2 Gender -.15** - - -.12 -.19 Age -.21*** -.18* -.26** - - Promotion opportunities .17* .22* Intra-organizational mobility opportunities .17* .19* .31** .27** Job content .14* .18* Development opportunities .32*** Performance related pay .40*** Regression model Explained Variance R2 22% 24% 18% 17% 32% Adjusted R2 20% 22% 16% 16% 29% F value 13.31*** 15.66*** 9.62*** 11.14*** 11.92*** ***: p<.001; **: p<.01; *p: <.05 a males are coded 1, females are coded 2 b ≤ 40s are coded 1, over-forties are coded 2
Table 5 Hierarchical stepwise regression analyses to explain Employee Development.
Total (n=247)
Men (n=157)
Women (n=90)
≤ 40s (n=167)
Over-forties (n=80)
Β Β β β β Step 1 Gendera -.08 - - -.06 -.12 Ageb -.22** -.21** -.24* - - Step 2 Gender -.10 - - -.07 -.13 Age -.20*** -.19** -.22* - - Development opportunities .45*** .42*** .37*** .42*** .51*** Work-home flexibility .17* Intra-organizational mobility opportunities .17* Job content Clear task description -.19* Autonomy .18* Regression model Explained Variance R2 25% 36% 19% 25% 28% Adjusted R2 24% 34% 17% 23% 26% F value 27.32*** 21.04*** 10.21*** 13.33*** 14.90*** ***: p<.001; **: p<.01; *p: <.05 a males are coded 1, females are coded 2 b ≤ 40s are coded 1, over-forties are coded 2
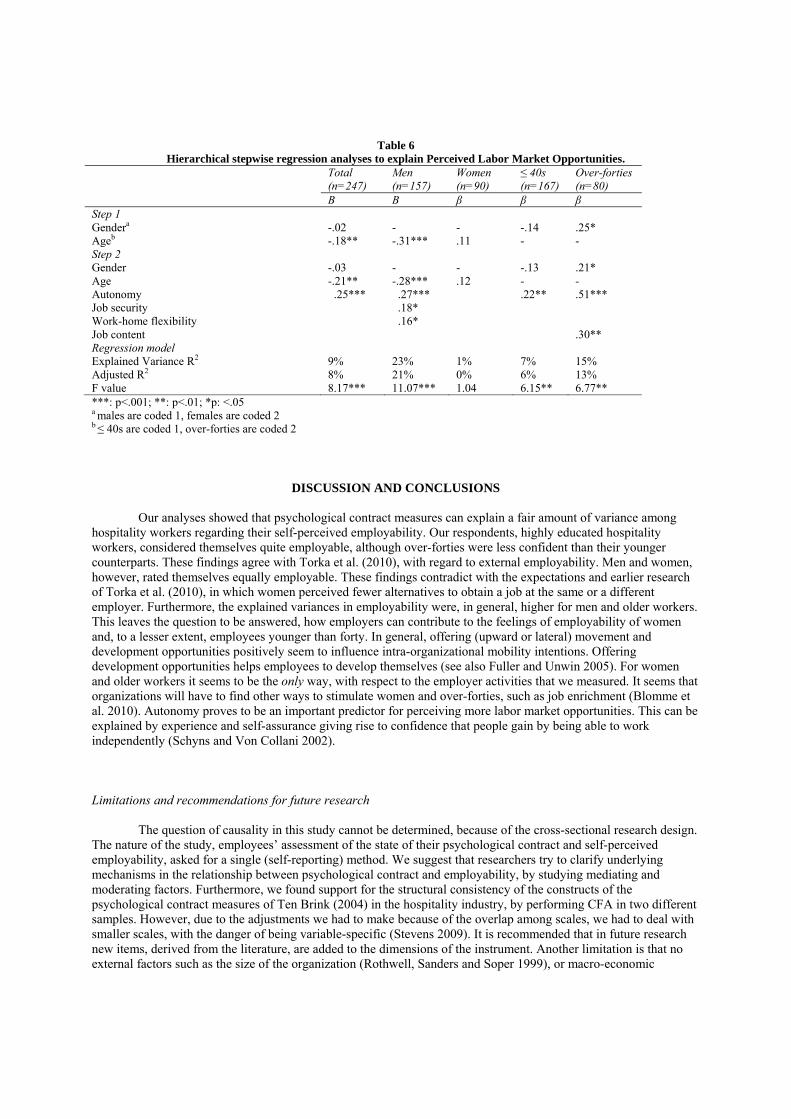
Table 6 Hierarchical stepwise regression analyses to explain Perceived Labor Market Opportunities.
Total (n=247)
Men (n=157)
Women (n=90)
≤ 40s (n=167)
Over-forties (n=80)
Β Β β β β Step 1 Gendera -.02 - - -.14 .25* Ageb -.18** -.31*** .11 - - Step 2 Gender -.03 - - -.13 .21* Age -.21** -.28*** .12 - - Autonomy .25*** .27*** .22** .51*** Job security .18* Work-home flexibility .16* Job content .30** Regression model Explained Variance R2 9% 23% 1% 7% 15% Adjusted R2 8% 21% 0% 6% 13% F value 8.17*** 11.07*** 1.04 6.15** 6.77** ***: p<.001; **: p<.01; *p: <.05 a males are coded 1, females are coded 2 b ≤ 40s are coded 1, over-forties are coded 2
DISCUSSION AND CONCLUSIONS
Our analyses showed that psychological contract measures can explain a fair amount of variance among hospitality workers regarding their self-perceived employability. Our respondents, highly educated hospitality workers, considered themselves quite employable, although over-forties were less confident than their younger counterparts. These findings agree with Torka et al. (2010), with regard to external employability. Men and women, however, rated themselves equally employable. These findings contradict with the expectations and earlier research of Torka et al. (2010), in which women perceived fewer alternatives to obtain a job at the same or a different employer. Furthermore, the explained variances in employability were, in general, higher for men and older workers. This leaves the question to be answered, how employers can contribute to the feelings of employability of women and, to a lesser extent, employees younger than forty. In general, offering (upward or lateral) movement and development opportunities positively seem to influence intra-organizational mobility intentions. Offering development opportunities helps employees to develop themselves (see also Fuller and Unwin 2005). For women and older workers it seems to be the only way, with respect to the employer activities that we measured. It seems that organizations will have to find other ways to stimulate women and over-forties, such as job enrichment (Blomme et al. 2010). Autonomy proves to be an important predictor for perceiving more labor market opportunities. This can be explained by experience and self-assurance giving rise to confidence that people gain by being able to work independently (Schyns and Von Collani 2002). Limitations and recommendations for future research
The question of causality in this study cannot be determined, because of the cross-sectional research design. The nature of the study, employees’ assessment of the state of their psychological contract and self-perceived employability, asked for a single (self-reporting) method. We suggest that researchers try to clarify underlying mechanisms in the relationship between psychological contract and employability, by studying mediating and moderating factors. Furthermore, we found support for the structural consistency of the constructs of the psychological contract measures of Ten Brink (2004) in the hospitality industry, by performing CFA in two different samples. However, due to the adjustments we had to make because of the overlap among scales, we had to deal with smaller scales, with the danger of being variable-specific (Stevens 2009). It is recommended that in future research new items, derived from the literature, are added to the dimensions of the instrument. Another limitation is that no external factors such as the size of the organization (Rothwell, Sanders and Soper 1999), or macro-economic
circumstances such as unemployment rates (Torka et al. 2010) were included in the analyses. Also, personality factors could reveal more about the underlying mechanisms of the relations (Tokar, Fischer and Subich 1998; Mignonac 2008). More research is needed to explain the age differences concerning employability and psychological contract (Thijssen et al. 2008). Our sample was too small to include another age-group, but we suggest that researchers, in future research, also study employees over-fifty (Armstrong-Stassen and Schlosser 2008; Bal et al. 2010). Practical implications
In the hospitality industry, as in other industries, management-level turnover is growing rapidly (Walsh and Taylor 2007), and today’s human resources (HR) managers are pressed to attract and retain highly educated personnel. Much can be gained however, by knowing and responding to the expectations that different groups of employees have of their employers. Our results suggest that offering mobility and development opportunities and autonomy can help to stimulate employees’ (perception of) employability. Concluding, especially with regard to women and older workers, we want to stress the importance for organizations of knowing their needs regarding development and mobility opportunities (see also Armstrong-Stassen and Schlosser 2008; Thijssen et al. 2008; Bal et al. 2010).
REFERENCES Arbuckle, J.L. (2010). Amos 19 User’s Guide. IBM. Armstrong-Stassen, M., & Schlosser, F. (2008). Benefits of a supportive development climate for older workers.
Journal of Managerial Psychology, 23, 419-437. Bal, P. M., Jansen, P. G. W., Velde, M. E. G. Van der, Lange, A. H. de, & Rousseau, D. M. (2010). The role of
future time perspective in psychological contracts: A study among older workers. Journal of Vocational Behavior, 76, 474–486.
Birdi, K., Allan, C., & Warr, P. (1997). Correlates and perceived outcomes of four types of employee development activity. Journal of Applied Psychology, 82, 845–857.
Blau, P. M. (1964). Exchange and power in social life. New York: John Wiley & Sons. Blomme, R. J., Tromp, D. M., & Rheede, A. Van (2010). The use of psychological contract to explain turnover
intentions in the hospitality industry: A research study on the impact of gender on the turnover intentions of highly educated employees. The International Journal of Human Resource Management, 21, 144-162.
Cheung, G. W., & Rensvold, R. B. (2002). Evaluating goodness-of-fit indexes for testing measurement invariance. Structural Equation Modeling, 9, 233-255.
Christie-Mill, R. (2008). The inter-relationships between leisure, recreation, tourism, and hospitality. In B. Brotherton & R. C. Wood (Eds.), The SAGE Handbook of Hospitality Management (pp. 90-107). London: Sage publications.
Cleveland, J.N., O’Neill, J.W., Himelright, J.L., Harrison, M.M., Crouter, A.C. & Drago, R. (2007). Work and family issues in the hospitality industry: Perspectives of entrants, managers, and spouses. Journal of Hospitality and Tourism Research, 31, 275-298.
Conway, N., & Briner, R. B. (2005). Understanding Psychological Contracts at Work. A Critical Evaluation of Theory and Research. Oxford: University Press.
Doherty , L. ( 2004 ). Work-life balance initiatives: Implications for women . Employee Relations, 26, 433-452 . European Commission (2005). Confronting demographic change: A new solidarity between the generations.
Brussels: European Commission. Finkelstein, L. M., & Farrell, S. K. (2007). An expanded view of age bias in the workplace. In K. S. Shultz & G. A.
Adams (Eds.), Aging and work in the 21st century, 73-109. Mahwah: Lawrence Erlbaum Associates. Fugate, M., Kinicki, A. J., & Ashforth, B. E. (2004). Employability: A psycho-social construct, its dimensions, and
applications. Journal of Vocational Behavior, 65, 14-38. Fuller, A., & Unwin, L. (2005). Older and wiser? Workplace learning from the perspective of older
employees. International Journal of Lifelong Education, 24, 21-39. Hall, D. T., & Mirvis, P. H. (1995). Careers as lifelong learning. In A. Howard (Ed.), The changing nature of work.
(pp. 323-361). San Francisco: Jossey-Bass. Herriot, P., Manning, W. E. G., & Kidd, J. M. (1997). The content of the psychological contract. British Journal of
Management, 8, 151-162. Hess, N., & Jespen, D. M. (2009). Career stage and generational differences in psychological
Contracts. Career Development International, 14, 261-283. Hillage J., & Pollard, E. (1998). Employability: developing a framework for policy analysis. GB: Department for
Education and Employment. Hu, L., & Bentler, P. M. (1999). Cut-off criteria for fit indexes in covariance structure analysis: Conventional criteria
versus new alternatives. Structural Equation Modeling, 6, 1–55. International Labour Office (2010). Global Employment Trends for Women. Geneva: ILO. Lub, X., Nije Bijvank, M., Bal, M., Blomme, R., & Schalk, R. (2011, in press). Different or alike? Exploring the
psychological contract and commitment of different generations of hospitality workers. International Journal of Contemporary Hospitality Management, 24.
Mignonac, K. (2008). Individual and contextual antecedents of older managerial employees' willingness to accept intra-organizational job changes, The International Journal of Human Resource Management, 19, 582-599.
Nauta, A., Vianen, A. Van, Heijden, B. Van der, Dam, K. Van & Willemsen, M. (2009). Journal of Occupational and Organizational Psychology, 82, 233–251.
Rothwell, W., Sanders, E. S., & Soper, J. G. (1999). ASTD models for workplace learning and performance-roles, competencies and outputs. Alexandria: American Society for Training & Development.
Rothwell, A., & Arnold, J. (2007). Self-perceived employability: Development and validation of a scale. Personnel Review, 36, 23−41.
Rousseau, D. M. (1989). Psychological and implied contracts in organizations. Employee Responsibilities and Rights Journal, 2, 121-139.
Rousseau, D. M. (1995). Psychological contracts in organizations. Thousand Oaks, CA: Sage publications. Schyns, B., & Collani, G. Von (2002). A new occupational self-efficacy scale and its relation to personality
constructs and organizational variables. European Journal of Work and Organizational Psychology, 11, 219-241.
Smithson, J., & Lewis, S. (2000). Is job insecurity changing the psychological contract? Personnel Review, 29, 680-702.
Stevens, J. P. (2009). Applied multivariate statistics for the social sciences. New York: Routledge. Ten Brink, B. E. H. (2004). Psychological Contract: A useful concept? Amsterdam, VU. Thijssen, J. G. L., Heijden, B. I. J. M. Van der, & Rocco, T. S. (2008). Toward the Employability-Link Model:
Current Employment Transition to Future Employment Perspectives. Human Resource Development Review, 7, 165-183.
Tokar, D. M., Fischer, A. R., & Subich, L. M. (1998). Personality and Vocational Behavior: A Selective Review of the Literature, 1993–1997. Journal of Vocational Behavior, 53, 115–153.
Torka, N., Geurts, P., Sanders, K., & Riemsdijk, M. Van (2010). Antecedents of perceived intra- and extra-organisational alternatives - The case of low-educated supermarket employees in Central European transition countries. Personnel Review, 39, 269-286.
Van Dam, K. (2004). Antecedents and consequences of employability orientation. European Journal of Work and Organizational Psychology, 13, 29-51.
Van der Heijde, C. M., & Heijden, B. I. J. M. Van der (2006). A competence-based and multidimensional operationalization and measurement of employability. Human Resource Management, 45, 449-476.
Van der Heijden, B. I. J. M., Lange, A. H. de, Demerouti, E., & Heijde, C. M. Van der (2009). Age effects on the employability-career success relationship. Journal of Vocational Behavior, 74, 156-164.
Yu, L. (2008). The structure and nature of the international hospitality industry. In B. Brotherton & R. C. Wood (Eds). The SAGE Handbook of Hospitality Management (pp. 62-90). London: Sage publications.
Acceptance of low pay: a study of people in low paid jobs
Dr Sumeetra Ramakrishnan Department of Health and Social Sciences
Middlesex University Hendon, London
NW4 4BT [email protected]
ABSTRACT The aim of this research through empirical analysis was to understand the acceptance of low pay. The study employed a rough measure of acceptance as that of ‘not searching for a better job’. A quantitative data analysis was carried out through questionnaires distributed to individuals working in the hotel, restaurant and travel sectors in London. A total of 152 questionnaires of full time employees were used for the purpose of this study. The sample overall portrayed low pay, lower hours of work and limited aspirations. Searching had a significant influence on perceived opportunities and overtime availability was defined as the key characteristic of a better job. The findings provide an interesting insight of an extremely low paid group. Key words: Acceptance, low pay, perceived opportunities, aspirations, hospitality workers
INTERCULTURAL COMPETENCE AS AN ANTECEDENT OF FRONTLINE EMPLOYEES’ JOB ATTITUDES AND BEHAVIORS IN THE HOTEL SECTOR
Ankie Hoefnagels Ma*
Senior Lecturer in Communication Management Maastricht Hotel Management School
Bethlehemweg 2, 6202 NX, Maastricht, the Netherlands [email protected]
Armand Odekerken BSc Mba
Senior Lecturer in Business Administration Maastricht Hotel Management School
Bethlehemweg 2, 6202 NX, Maastricht, the Netherlands [email protected]
Josee Bloemer Phd
Professor of Market Analysis and Relationship Management Radboud University, Faculty of Management Studies
Thomas van Aquinostraat 3.2.10, 6500 HK, Nijmegen, the Netherlands [email protected]
ABSTRACT
This study explores the effect of frontline employees’ intercultural competence on work engagement, job
satisfaction, service attentiveness and organizational citizenship behavior. Using survey data from 169 Dutch hotel front office staff members in the Netherlands, a conceptual model is tested in which intercultural competence acts as a driver of positive job attitudes and behaviors. Analyses show that work engagement is a powerful mediator between the frontline employee’s intercultural competence and job satisfaction.
KEY WORDS
Intercultural competence, work engagement, job satisfaction, relationship quality, service attentiveness, organizational citizenship behavior
INTRODUCTION
The hospitality sector has increasingly become a global business. Recent estimates show that the number of worldwide international tourist arrivals grew by over 4% in 2011 to 980 million and is expected to reach the billion mark by 2012 (UNWTO, 2011).This growth in international travel, combined with shifting economic power to emerging markets like the BRIC countries (Ng, Lee, & Soutar, 2007) leads to increased attention for intercultural service encounters, the encounters in which the host and the guest have different cultural backgrounds (Sharma, Tam, & Kim, 2009; Stauss & Mang, 1999) . These intercultural service encounters are likely to add complexity to the service interaction because of potentially differing expectations and service scripts of both participants (Solomon, Surprenant, Czepiel, & Gutman, 1985b). Culturally different customers have even been found to perceive discrimination in some employee’s behavior, leading to perceptions of inequitable service and lower satisfaction levels (Barker & Hartel, 2004). Because hotels traditionally host guests from all corners of the world, and can be categorized as high-contact services, catering for the needs of people with culturally diverse backgrounds is already an important determinant of success in this industry. But the above-mentioned global trends will make it even more crucial to deal competently with culturally diverse guests.
Frontline employees tend to prepare for intercultural service encounters by acquiring culture-specific knowledge at the country-level. Examples of this type of knowledge are for instance that German guests appreciate
being addressed in a formal manner or that Chinese guests’ business cards must be accepted with both hands and deliberate care. Though this factual knowledge is certainly relevant, it may be subject to within- country variance or even be obsolete due to cultural changes, like hybridization or contamination (Craig & Douglas, 2006). Besides that, the variety in the international guest population is very large. Considering this, it may not be effective to deal with intercultural service encounters on the basis of a ‘cultural recipe-book’. Therefore, rather than culture-specific knowledge of several guest-cultures, a more generic intercultural competence should be required, consisting of an affective, cognitive and behavioral component. In other words “the ability to deal effectively and appropriately with culturally diverse people, based on one’s knowledge, skills and attitude” (Deardorff, 2004). There is a growing agreement among practitioners and academics on the thought that a global mindset is a critical success factor which is positively related to business performance (Levy, Beechler, Taylor, & Boyacigiller, 2007).
Besides being highly international, the hotel sector is also highly competitive. Because of the relation between perceived service quality and the performance of the hotel in terms of market share, profitability and return on investment (Heskett, Jones, Loveman, Sasser, & Schlesinger, 1994), the employee’s performance in the ‘moment of truth’ (Carlzon, 1989), i.e. the service encounter, makes a crucial difference. In an intercultural service encounter, both the guest and the service provider are responsible for success or failure (Sharma, 2009). However, it is the employee’s behavior that makes a substantial difference in the guest’s perceptions of the quality of the service encounter (Brady and Cronin, 2001; Zeithamml et al, 2009). Therefore, hotel managers have a vested interest in attracting and keeping employees who show initiative, are committed to high quality performance standards, are satisfied with their jobs, feel energetic and dedicated, absorbed in their work and willing to go the extra mile. The corporate need for engaged workers is also illustrated by best-selling books that make this case (Covey, 2004).
Therefore, the focus of this study is to test if there is a relation between a frontline employee’s intercultural
competences on the one hand, and his/her job attitude and behavior towards the organization and the customer on the other hand.
The findings of this study will have implications for both academics and managers. First of all, though
intercultural competence has proved to be a predictor of well-being, performance and success in an expatriate context (J.G Ponterotto et al., 2007 ; Van Oudenhoven, Zee, & Van Kooten, 2001), there is relatively little empirical evidence for the role of intercultural competence in intercultural service settings. This study will add to the literature by testing a model in which both intercultural competence and performance indicators are incorporated. Moreover, though the intercultural service encounter has been examined from the customer’s perspective (Mattila, 1999) less attention has been devoted to the role of service employees in these encounters. In addition, while the value of having intercultural competent staff makes sense intuitively, the concept has not been tested in the marketplace. As a result, management is reluctant to make the training investments until they see some evidence of its benefits (Sizoo, Plank, Iskat, & Serrie, 2005). If intercultural competence indeed enhances work engagement and leads to increased levels of job satisfaction and extra-role behavior towards the customer and the organization, this would provide managerial support for the consideration of intercultural competence in both recruitment and training efforts of hotel companies.
In the following sections, we will discuss the theoretical justification for our conceptual model as well as
the conceptualization of its constituent variables on the basis of a literature study. This is followed by a description of the sample strategy and the methodology that was used to test the model. Finally, we will discuss our results and their implications for theory and practice.
THEORETICAL BACKGROUND
Intercultural service encounters, in which the host and the guest have different cultural backgrounds are likely to add complexity to the service interaction (Stauss & Mang, 1999). A theoretical underpinning for this complexity can be found in role theory (Broderick, 1999; Solomon, Surprenant, Czepiel, & Gutman, 1985a). According to role theory, people are social actors who learn appropriate behaviors to the position they occupy in
society. Role theory suggests that each party in a service encounter has learned a set of behaviors that are appropriate to that situation. The role patterns can lead to a role script within the service encounter.
Customers and employees from different cultures may have different role expectations and have been socialized with different service scripts. These dissimilar cultural backgrounds may surface during intercultural service encounters (Sharma et al., 2009; Wang & Mattila, 2010), lead to misunderstandings and conflict, and result in an unhappy customer, a frustrated provider, and lost business (Donthu & Yoo, 1998; Liu, Furrer, & Sudharshan, 2001; Sizoo, Iskat, Plank, & Serrie, 2003).
Another feature of service encounters is that they are often fairly routine, i.e. they take place in an almost automatic style with a minimum of cognitive activity. In contrast to this, intercultural service encounters are likely to require mindfulness, characterized by a state of alertness, active information processing and the ability to create and refine categories and an awareness of multiple perspectives (Langer & Moldoveanu, 2000). Frontline employees are supposed to display a chameleonic ability to adjust to the international guest’s expectations while at the same time maintaining their authenticity. They are required to make a cognitive effort to orient their behavior as the predictability of the role enactment is diminished. This is likely to require high levels of intercultural competence.
The second theoretical lens that we employ in this study is the job-demands resources model (JD-R)
(Bakker, Demerouti, & Verbeke, 2004). This model has been developed within the field of positive organizational behavior that is concerned with individual psychological states and human strengths that influence employee performance (Luthans, 2002). According to the JD-R model, job demands are stressors that may evoke strain if they exceed the employee’s adaptive capability. Employees in intercultural service encounters face several unique demands, such as customer diversity, limited predictability of customer needs and behaviors which may lead to role conflict. The JD-R model defines job resources as those aspects of the job that a) reduce job demands, b) are instrumental in achieving work goals and c) stimulate personal growth, learning and development (Demerouti & Bakker, 2007). The central construct of the JD-R model is work engagement, a positive, fulfilling, work-related state of mind that is characterized by vigor, dedication and absorption (Bakker & Demerouti, 2008). Engaged employees have a sense of energetic and effective connection with their work activities and see themselves as being able to deal well with the demands of their job. According to the JD-R model, work engagement mediates the relationship between job resources on the one hand, and positive organizational outcomes - such as organizational citizenship behavior- on the other hand. Besides job characteristics such as organizational and supervisor support, personal characteristics of the employee are considered as important resources (Suanet & Van de Vijver, 2009). In this study we focus only on intercultural competence which we suggest to be an important resource for service employees in intercultural service contexts and helpful to cope with the demands of customer diversity.
From the above discussion, we find that intercultural competence and work engagement are two important
constructs to be used in the study of the employee perspective on intercultural service encounters. In the next section, we present our conceptual model, describe the five constructs based on our extensive review of the intercultural competence and service encounter literature and build hypotheses about the relationships between these constructs.
Figure 1 Conceptual Model
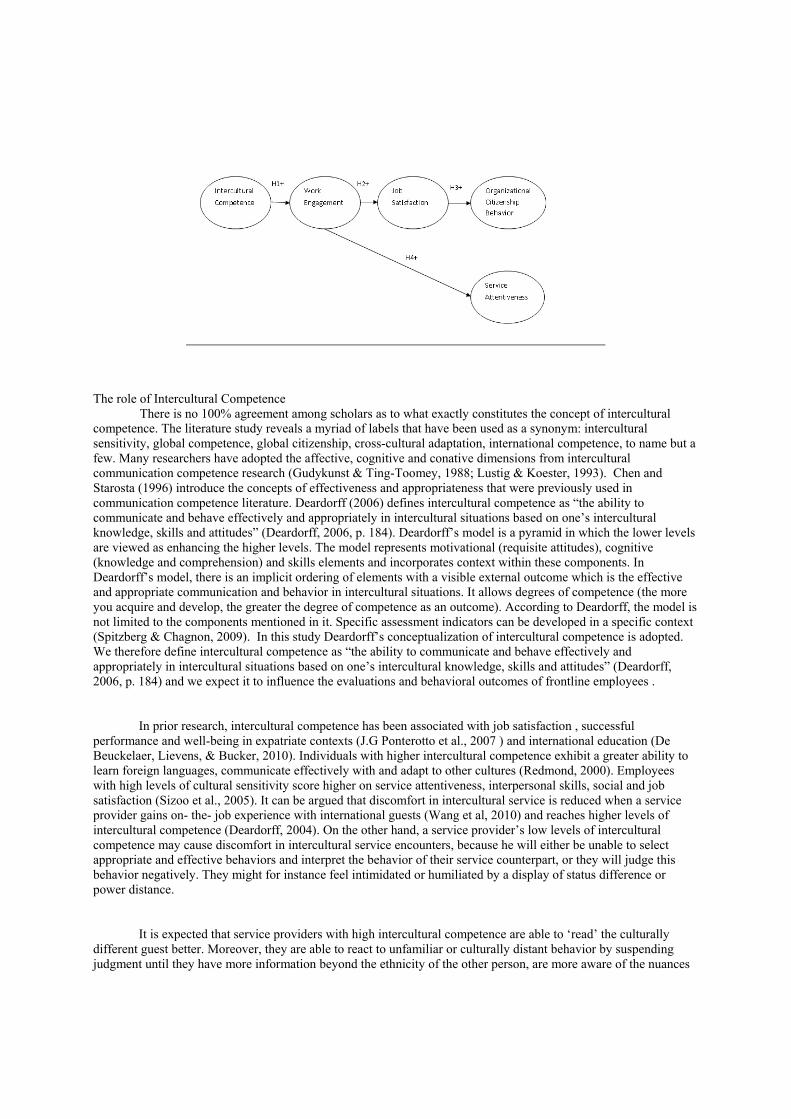
The role of Intercultural Competence There is no 100% agreement among scholars as to what exactly constitutes the concept of intercultural
competence. The literature study reveals a myriad of labels that have been used as a synonym: intercultural sensitivity, global competence, global citizenship, cross-cultural adaptation, international competence, to name but a few. Many researchers have adopted the affective, cognitive and conative dimensions from intercultural communication competence research (Gudykunst & Ting-Toomey, 1988; Lustig & Koester, 1993). Chen and Starosta (1996) introduce the concepts of effectiveness and appropriateness that were previously used in communication competence literature. Deardorff (2006) defines intercultural competence as “the ability to communicate and behave effectively and appropriately in intercultural situations based on one’s intercultural knowledge, skills and attitudes” (Deardorff, 2006, p. 184). Deardorff’s model is a pyramid in which the lower levels are viewed as enhancing the higher levels. The model represents motivational (requisite attitudes), cognitive (knowledge and comprehension) and skills elements and incorporates context within these components. In Deardorff’s model, there is an implicit ordering of elements with a visible external outcome which is the effective and appropriate communication and behavior in intercultural situations. It allows degrees of competence (the more you acquire and develop, the greater the degree of competence as an outcome). According to Deardorff, the model is not limited to the components mentioned in it. Specific assessment indicators can be developed in a specific context (Spitzberg & Chagnon, 2009). In this study Deardorff’s conceptualization of intercultural competence is adopted. We therefore define intercultural competence as “the ability to communicate and behave effectively and appropriately in intercultural situations based on one’s intercultural knowledge, skills and attitudes” (Deardorff, 2006, p. 184) and we expect it to influence the evaluations and behavioral outcomes of frontline employees .
In prior research, intercultural competence has been associated with job satisfaction , successful performance and well-being in expatriate contexts (J.G Ponterotto et al., 2007 ) and international education (De Beuckelaer, Lievens, & Bucker, 2010). Individuals with higher intercultural competence exhibit a greater ability to learn foreign languages, communicate effectively with and adapt to other cultures (Redmond, 2000). Employees with high levels of cultural sensitivity score higher on service attentiveness, interpersonal skills, social and job satisfaction (Sizoo et al., 2005). It can be argued that discomfort in intercultural service is reduced when a service provider gains on- the- job experience with international guests (Wang et al, 2010) and reaches higher levels of intercultural competence (Deardorff, 2004). On the other hand, a service provider’s low levels of intercultural competence may cause discomfort in intercultural service encounters, because he will either be unable to select appropriate and effective behaviors and interpret the behavior of their service counterpart, or they will judge this behavior negatively. They might for instance feel intimidated or humiliated by a display of status difference or power distance.
It is expected that service providers with high intercultural competence are able to ‘read’ the culturally
different guest better. Moreover, they are able to react to unfamiliar or culturally distant behavior by suspending judgment until they have more information beyond the ethnicity of the other person, are more aware of the nuances
of different cultures, and are able to use this knowledge to adjust their own behavior (Sharma et al., 2009; Triandis, 2006). For instance, when an Arabic guest displays high power distance to a low power distance service provider. Or when an Asian guest is unable to express himself in English, an intercultural competent service provider can arguably bridge this distance by behaving flexibly and look for creative solutions.
Work Engagement Work engagement is one of the aspects of an emerging trend in organizational psychology that studies ‘Positive Organizational Behavior’; focusing on what makes people function optimally rather than what makes them ill or become burn-out. POB studies individual positive psychological conditions and human resource strengths that are related to employee well being or performance improvement (Bakker, Schaufeli, Leiter, & Taris, 2008). Both job resources, such as autonomy and supervisor support, and personal resources, such as self-efficacy and competences are considered antecedents of work engagement in the work engagement model developed by Bakker et al (Bakker & Demerouti, 2008; Demerouti & Bakker, 2007; Wilmar B Schaufeli et al., 2001). In their conceptualization, work engagement is defined as ‘a positive, fulfilling, work-related state of mind that is characterized by vigor, dedication and absorption (Bakker et al., 2008). Engaged employees have a sense of energetic and effective connection with their work activities and see themselves as being able to deal well with the demands of their job. Other related definitions also emphasize the dual roles of both cognition and emotion in creating a state of engagement.
Work engagement has been linked to a number of positive consequences at both individual and organizational levels. Employee engagement is positively associated with resources like task variety and the opportunity to learn and develop. It is also positively related to individual’s intentions, behaviors and self-efficacy (Saks, 2006). Possible consequences of work engagement that have been found pertain to positive attitudes towards work and towards the organization, such as job satisfaction, organizational commitment, and low turnover intention (Demerouti et al., 2001; Salanova et al., 2000; Schaufeli, Taris & Van Rhenen, 2003), but also to positive organizational behavior such as personal initiative and learning motivation (Sonnentag, 2003), extra-role behavior (Salanova, Agut & Peiró, 2003), proactive behavior (Salanova et al., 2003) and organizational citizenship behavior (Saks, 2006). Finally, work engagement has been positively related to job performance. For instance, a study among about one-hundred Spanish hotels and restaurants showed that employees’ levels of work engagement had a positive impact on the service climate of these hotels and restaurants, which, in its turn, predicted employees' extra-role behavior as well as customer satisfaction (Salanova, Agut, & Peiró, 2003). Intercultural competence can be considered as a personal resource of the employee that has proven to be a strong predictor of well-being, satisfaction and service attentiveness in several contexts. Because the interaction with culturally diverse guests is a daily element of the hotel frontline employee’s job, the development of this employee’s intercultural competence is likely to be an important resource for both the employee and the organization. An employee who has developed this competence is better able to ‘read’ the international guest and, we argue, will be more dedicated to and invigorated by providing service to culturally diverse guests. Therefore, we expect that: H1: There is a positive association between intercultural competence and work engagement Job Satisfaction
Job satisfaction refers to the extent to which the employees feel satisfied with the kind of work they do and with the nature of their job (Mukherjee & Malhotra, 2006). Job satisfaction has been conceptualized as a job attitude (P. Podsakoff, S. MacKenzie, R. Moorman, & R. Fetter, 1990). A service provider’s job satisfaction is highly important for the success and survival of a firm. Low job satisfaction has been associated with low performance, limited service quality and reduced customer satisfaction (Batt and Moynihan, 2002). Low job satisfaction can also lead to higher staff turnover (Shields and Ward, 2001) which generates substantial costs for the organization. In the context of this study, job satisfaction is considered an attitude. The cumulative perspective of satisfaction is applied, whereby employee satisfaction is based on multiple encounters between the service provider and a range of international guests. In prior research, work engagement has been positively linked to job satisfaction (Saks, 2006; Salanova, Bakker, & Llorens, 2006). Employees who are intercultural competent, are likely to appreciate the challenges of meeting the expectations of a range of international guests more. Generally, employees feel higher overall satisfaction with their job as well as its
various facets if their performance is appreciated by customers (Schoefer & Ennew, 2005). If a frontline employee is able to tune in to the needs and expectations of foreign guests, is open to developing new behavioral categories and feels engaged in encounters with these guests, he is likely to experience more satisfaction with his job. Therefore, we expect the following relation: H2: There is a positive association between work engagement and job satisfaction Extra-Role Behavior: attentiveness to foreign customers and Organizational Citizenship Behavior
According to role theory, two dimensions of role performance can be distinguished; in-role versus extra-role performance (Tsaur & Lin, 2004). In a service context, in-role performance concerns the task performance of an employee’s formal job requirements in interacting with a customer in contrast with extra-role performance which involves activities that support the customer and the organization but are not specifically required of employees. In this study, we distinguish two types of extra-role performance behaviors. First of all, extra-role behavior towards foreign guests, which we label as Service Attentiveness (Sizoo et al., 2005) and extra-role behavior towards the organization, which we label as Organizational Citizenship Behavior (Organ, Podsakoff, & MacKenzie, 2006). Going the extra mile for the organization: Organizational Citizenship Behavior
Work behavior that is discretionary, not directly or explicitly recognized by the formal reward system and that, in the aggregate, promotes the effective functioning of the organization (Katz, 1964) is labeled as ‘organizational citizenship behavior’ by Organ (1988). Organ proposed a taxonomy of OCB that included altruism, conscientiousness, sportsmanship, courtesy and civic virtue. Podsakoff et al (1990) operationalized Organ’s dimensions, and the resulting OCB scales have served as the basis for OCB measurement in a large number of empirical studies(MacKenzie, Podsakoff, & Fetter, 1991; Moorman, 1993). OCB has been linked to the conceptually similar construct of extra-role behavior (Organ et al., 2006), behavior that attempts to benefit the organization and that goes beyond existing role expectation (Organ et al., 2006, p.33). In the literature, we find OCB linked to antecedents as personality characteristics and leadership behavior (Organ & Ryan, 1995). It has also been suggested that avoidance of stress and other unpleasant emotional states, maintenance of positive mood and job satisfaction might enhance organizational citizenship behavior (Organ et al., 2006). Furthermore, multiple studies have been conducted on the relationship between OCBs and organizational performance (Podsakoff and MacKenzie, 1994; Walz and Niehof, 1996; Koy, 2001). Finally, OCB also extends to the customer; Podsakoff, Blume and Whiting (2009) found a positive relation between OCBs and customer satisfaction. On the basis of evidence from the literature, we therefore expect extra-role behavior towards the organization to be positively linked to job satisfaction: H3: There is a positive association between job satisfaction and organizational citizenship behavior Going the extra mile for the guest: Service Attentiveness
Behaviors like anticipating the guest’s needs, being able to handle problems and complaints, dealing with the unexpected, reacting personably and making a special effort, are generally associated with service –minded behavior ( Samenfink, 1994). Yet these behaviors are particularly salient in the context of an intercultural service encounter where the guest’s and host’s expectations of this behavior may differ. It can be argued that an intercultural competent service provider is able to select the appropriate behavior for a wide range of culturally different guests based on his cultural- general and cultural- specific knowledge, his skills and attitude which have led to his shifted frame of reference. Individuals with high intercultural competence are more motivated to learn different languages, are open to learning about and from other cultures (Redmond, 2000), they are more empathic, open-minded, emotionally stable and are better able to adjust their social norms and role interpretations to those of people with culturally dissimilar backgrounds(K. Van der Zee & Van Oudenhoven, 2000). Because of their cultural openness and adaptability, they enjoy interacting with foreign customers. Therefore, we expect that they have more willingness to go the extra mile: H4: There is a positive association between work engagement and service attentiveness
METHODOLOGY
Sample and Procedures
We tested our hypotheses using data collected from Dutch Front Office Employees in two to five star hotels with at least 30 rooms, and at least 30% international guests in the Netherlands, in an urbanized area, comprising the cities of Utrecht, Amsterdam, Rotterdam and The Hague.
Prior to data-collection, the questionnaire was pilot tested for legibility and face validity by a sample of 5 receptionists from local hotels. Furthermore, the survey was pre-tested among a sample of 35 Hotel Management students with at least six months experience in the front office of a hotel. This pretest showed adequate reliability of all the scales used. On the basis of the pre-test some items were revised and some changes were made to the format of the questionnaire to enhance legibility.
The hospitality branch organization ‘Koninklijk Horeca Nederland’ was approached. They provided a mail address list of their members in the Randstad area. The General Managers of 250 hotels were approached for permission by letter. This resulted in a pool of 70 hotels who granted their support. Of the total sample, 243 Front Office staff members filled in the questionnaire. The dataset was inspected for incomplete questionnaires, extreme answers, and respondents that did not meet the sampling criteria, for instance on nationality. The response from two star hotels appeared to be relatively low. Therefore, the two star hotels were removed from the sample. Through this rigorous procedure, the dataset was reduced to 169 respondents. Questionnaire development
This section describes the measurement instrument that was used. The entire questionnaire was in Dutch. All scales were borrowed from existing instruments. Some statements were slightly reformulated to make them more appropriate for the hotel service setting. English language scales were translated and back-translated by a qualified translator. Unless indicated otherwise, all items were rated on a 7-point Liker Scale (‘completely disagree’ – ‘completely agree’). The questionnaire consists of three sections. Section 1 consists of 12 background questions about gender, age, education, work experience, experience abroad and linguistic skills. Section 2 contains 64 items measuring the constructs of the conceptual model. These will be explained in more detail below. Section 3 consists of 8 questions about the hotel, such as location, member of hotel chain, star qualification, and number of rooms, percentage business guests and percentage foreign guests. Intercultural Competence
Intercultural competence is operationalized by the Multicultural Personality Questionnaire (Van der Zee & Oudenhoven, 2001) This instrument integrates the cognitive, behavioral and attitudinal dimensions in a ‘multicultural personality’ construct, consisting of five traits, which can be considered as the internal outcome of Deardorff’s (2006) conceptualization, the prerequisite for effective and appropriate behavior . Many theorists have argued that personality traits exist at various levels of abstraction(Allport, 1961; Eysenck, 1947) The five Multicultural Personality traits can be considered as so-called ‘surface traits’. These are defined as enduring dispositions, inclinations or tendencies to behave within a certain context. Surface traits are closer to the specific behaviors needed to achieve a certain performance than basic personality traits(Brown, Mowen, Donavan, & Licata, 2002). First of all ‘Cultural Empathy’, defined as the capacity to clearly project an interest in others as well as to obtain and to reflect a reasonably complete and accurate sense of another’s thoughts, feelings and/or experiences (Ruben 1976). The second dimension is ‘Open-mindednes’, referring to an open and unprejudiced attitude toward out-group members and different cultural norms and values (Arthur and Bennett, 1995). Thirdly, ’Flexibility’ means that one has to be able to switch easily from one strategy to another because the familiar ways of handling things will not necessarily work in a culturally different setting (Arthur and Bennett 1995). The fourth dimension ‘Emotional Stability’ refers to the tendency to remain calm in stressful situations versus a tendency to show strong emotional reactions under stress. Hammer et al (1978) define the ability to deal with psychological stress as a key dimension of intercultural effectiveness. The fifth and last dimension is ‘Social Initiative’. This is defined as the tendency to approach social situations in an active way, to take initiatives and to be able to establish and maintain
contacts (Hawes and Kealy, 1981). McCall (1994) mentions ‘the courage to make things happen’ as a clue to intercultural competence. The five multicultural personality dimensions have predicted variance in criterion variables beyond the variance accounted for by Big Five personality measures (Joseph G. Ponterotto, 2008). Thus, they add cultural dimensionality to, and are also closer to focal service behaviors than general personality measures.
The Multicultural Personality construct has demonstrated construct and predictive validities over a range of outcome indices in different sample groups (e.g. expatriates, students), using a combination of research methods (e.g. Leone, Van der Zee, Van Oudenhoven, Perugini & Ercolani (2005). The five distinctive dimensions of intercultural competencies have consistently emerged from multi-group confirmatory factor analyses and they predicted the different facets of international orientation and adjustment. In a group of expatriates based in Taiwan, MPQ predicted effective personal, professional and social adaptation (Van Oudenhoven, Mol & Van der Zee (2003). On interpersonal relations, individuals who have high as opposed to low MPQ scores, indicated less negative reactions to potentially stressful situations involving cross-cultural contact (Van der Zee, van Oudenhoven & Grijs (2004). In our study, we collapse the five MPQ dimensions into the three dimension model, in accordance with van der Zee (K. I. Van Der Zee, Ali, & Haaksma, 2007); cultural empathy and openmindedness are combined as ‘cultural openness’, emotional stability and flexibility are combined as ‘adaptability’. The third dimension is ‘social initiative’. We use the short, 30-item version of the MPQ to operationalize the concept of Intercultural Competence in a hotel service setting. Work Engagement
Work engagement is measured by means of the short, 9 item version of the Utrecht Work Engagement Scale (UWES) , that includes the three elements of work engagement; vigor, dedication and absorption. Vigor is assessed by items that refer to high levels of energy and resilience, the willingness to invest effort, not being easily fatigued, and persistence in the face of difficulties. Dedication is assessed by items that refer to deriving a sense of significance from one’s work, feeling enthusiastic and proud about one’s job, and feeling inspired and challenged by it. Absorption is measured by items that refer to being totally and happily immersed in one’s work and having difficulties detaching oneself from it so that time passes quickly and one forgets everything else that is around.
Psychometric analyses with the UWES have shown factorial validity (Salanova, Schaufeli, Llorens, Pieró & Grau, 2000; Schaufeli et al., 2002a; Schaufeli, Martínez, Marques-Pinto, Salanova & Bakker, 2002b; Schaufeli, Taris & Van Rhenen, 2003). Moreover, the three dimensions are closely inter-related. Correlations between the three scales usually exceed .65 (e.g., Demerouti et al., 2001; Salanova et al., 2000; Schaufeli et al., 2002a, 2002b), whereas correlations between the latent variables range from about .80 to about .90 (Salanova et al., 2000; Schaufeli et al., 2002a, 2002b). Besides that, the internal consistency of the three scales of the UWES is good. That is, in all cases values of Cronbach's α are equal to or exceed the critical value of .70 (Nunnaly & Bernstein, 1984). The nine-item version of the UWES has also demonstrated factorial validity, internal consistency and test-retest reliability (Wilmar B. Schaufeli, Bakker, & Salanova, 2006). Job Satisfaction
Job satisfaction is operationalized as overall job satisfaction and measured with three items based on Hackman and Oldham’s (1976) Job Diagnostic Survey which has been widely used in other studies (e.g.Mukherjee & Malhotra, 2006). Extra-role behavior towards foreign guests
This construct is operationalized by means of 7 items from the Service Attentiveness Scale (Sizoo et al., 2005). This scale was specifically developed to measure service attentiveness towards foreign guests, is based on research in the food service sector (Samenfink, 1994). It contains items such as ‘I make an effort to make a foreign guest feel comfortable’, and ‘I adjust the way that I deliver service to the preferences of the foreign guest’. Organizational Citizenship Behavior
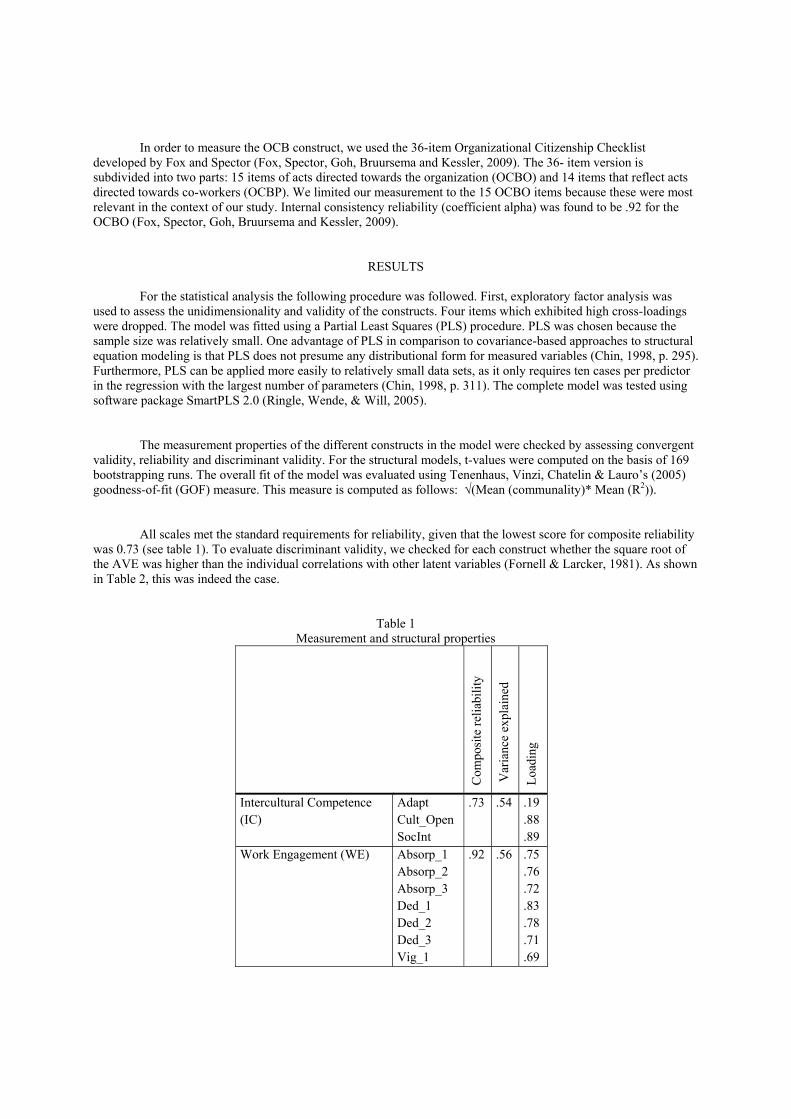
In order to measure the OCB construct, we used the 36-item Organizational Citizenship Checklist developed by Fox and Spector (Fox, Spector, Goh, Bruursema and Kessler, 2009). The 36- item version is subdivided into two parts: 15 items of acts directed towards the organization (OCBO) and 14 items that reflect acts directed towards co-workers (OCBP). We limited our measurement to the 15 OCBO items because these were most relevant in the context of our study. Internal consistency reliability (coefficient alpha) was found to be .92 for the OCBO (Fox, Spector, Goh, Bruursema and Kessler, 2009).
RESULTS For the statistical analysis the following procedure was followed. First, exploratory factor analysis was
used to assess the unidimensionality and validity of the constructs. Four items which exhibited high cross-loadings were dropped. The model was fitted using a Partial Least Squares (PLS) procedure. PLS was chosen because the sample size was relatively small. One advantage of PLS in comparison to covariance-based approaches to structural equation modeling is that PLS does not presume any distributional form for measured variables (Chin, 1998, p. 295). Furthermore, PLS can be applied more easily to relatively small data sets, as it only requires ten cases per predictor in the regression with the largest number of parameters (Chin, 1998, p. 311). The complete model was tested using software package SmartPLS 2.0 (Ringle, Wende, & Will, 2005).
The measurement properties of the different constructs in the model were checked by assessing convergent validity, reliability and discriminant validity. For the structural models, t-values were computed on the basis of 169 bootstrapping runs. The overall fit of the model was evaluated using Tenenhaus, Vinzi, Chatelin & Lauro’s (2005) goodness-of-fit (GOF) measure. This measure is computed as follows: √(Mean (communality)* Mean (R2)).
All scales met the standard requirements for reliability, given that the lowest score for composite reliability was 0.73 (see table 1). To evaluate discriminant validity, we checked for each construct whether the square root of the AVE was higher than the individual correlations with other latent variables (Fornell & Larcker, 1981). As shown in Table 2, this was indeed the case.
Table 1 Measurement and structural properties
Com
posi
te r
elia
bili
ty
Var
ianc
e ex
plai
ned
Loa
ding
Intercultural Competence (IC)
Adapt Cult_Open SocInt
.73 .54 .19 .88 .89
Work Engagement (WE) Absorp_1 Absorp_2 Absorp_3 Ded_1 Ded_2 Ded_3 Vig_1
.92 .56 .75 .76 .72 .83 .78 .71 .69
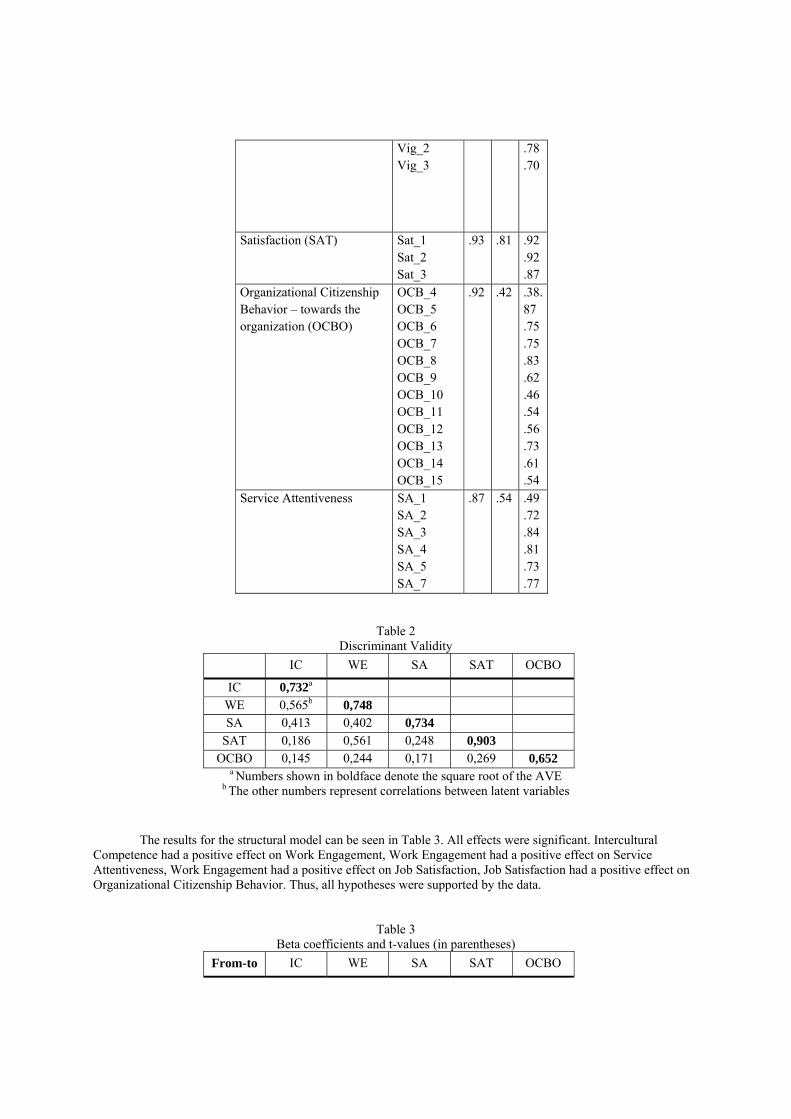
Vig_2 Vig_3
.78
.70
Satisfaction (SAT)
Sat_1 Sat_2 Sat_3
.93 .81 .92 .92 .87
Organizational Citizenship Behavior – towards the organization (OCBO)
OCB_4 OCB_5 OCB_6 OCB_7 OCB_8 OCB_9 OCB_10 OCB_11 OCB_12 OCB_13 OCB_14 OCB_15
.92 .42 .38.87 .75 .75 .83 .62 .46 .54 .56 .73 .61 .54
Service Attentiveness SA_1 SA_2 SA_3 SA_4 SA_5 SA_7
.87 .54 .49 .72 .84 .81 .73 .77
Table 2 Discriminant Validity
IC WE SA SAT OCBO
IC 0,732a WE 0,565b 0,748 SA 0,413 0,402 0,734
SAT 0,186 0,561 0,248 0,903 OCBO 0,145 0,244 0,171 0,269 0,652
a Numbers shown in boldface denote the square root of the AVE b The other numbers represent correlations between latent variables
The results for the structural model can be seen in Table 3. All effects were significant. Intercultural Competence had a positive effect on Work Engagement, Work Engagement had a positive effect on Service Attentiveness, Work Engagement had a positive effect on Job Satisfaction, Job Satisfaction had a positive effect on Organizational Citizenship Behavior. Thus, all hypotheses were supported by the data.
Table 3 Beta coefficients and t-values (in parentheses)
From-to IC WE SA SAT OCBO
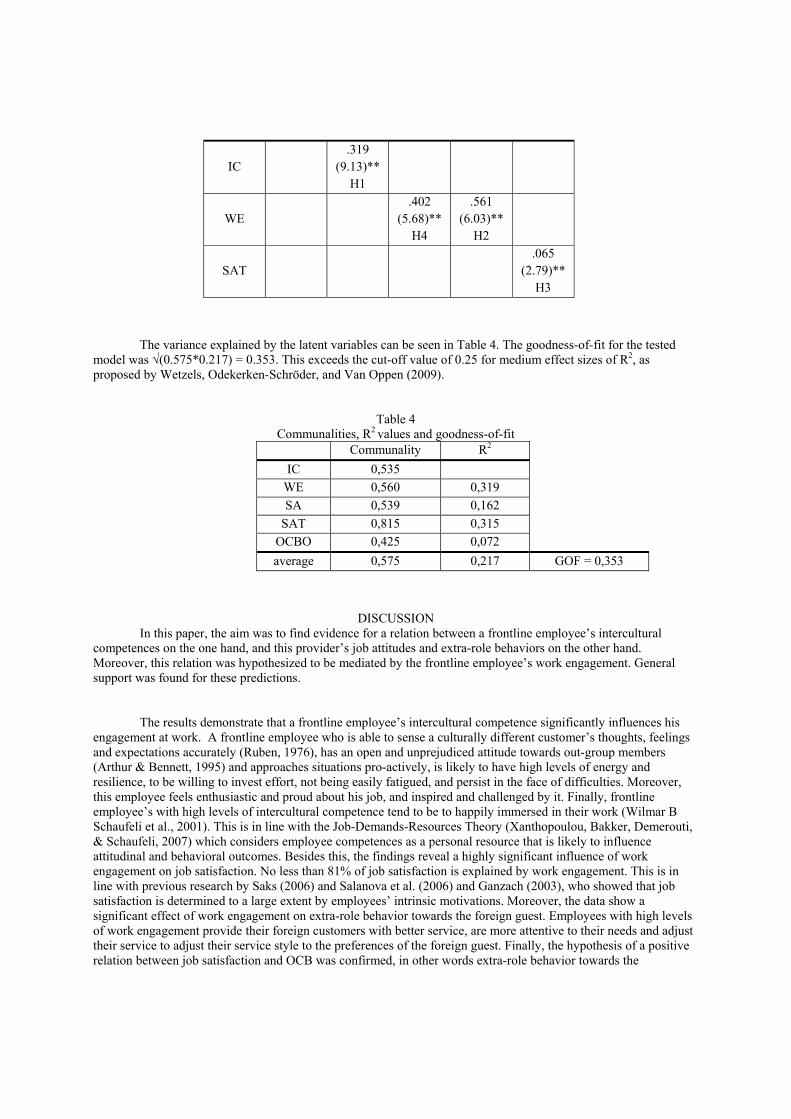
IC .319
(9.13)** H1
WE .402
(5.68)** H4
.561 (6.03)**
H2
SAT .065
(2.79)** H3
The variance explained by the latent variables can be seen in Table 4. The goodness-of-fit for the tested model was √(0.575*0.217) = 0.353. This exceeds the cut-off value of 0.25 for medium effect sizes of R2, as proposed by Wetzels, Odekerken-Schröder, and Van Oppen (2009).
Table 4 Communalities, R2 values and goodness-of-fit
Communality R2
IC 0,535
WE 0,560 0,319
SA 0,539 0,162
SAT 0,815 0,315
OCBO 0,425 0,072
average 0,575 0,217 GOF = 0,353
DISCUSSION In this paper, the aim was to find evidence for a relation between a frontline employee’s intercultural
competences on the one hand, and this provider’s job attitudes and extra-role behaviors on the other hand. Moreover, this relation was hypothesized to be mediated by the frontline employee’s work engagement. General support was found for these predictions.
The results demonstrate that a frontline employee’s intercultural competence significantly influences his engagement at work. A frontline employee who is able to sense a culturally different customer’s thoughts, feelings and expectations accurately (Ruben, 1976), has an open and unprejudiced attitude towards out-group members (Arthur & Bennett, 1995) and approaches situations pro-actively, is likely to have high levels of energy and resilience, to be willing to invest effort, not being easily fatigued, and persist in the face of difficulties. Moreover, this employee feels enthusiastic and proud about his job, and inspired and challenged by it. Finally, frontline employee’s with high levels of intercultural competence tend to be to happily immersed in their work (Wilmar B Schaufeli et al., 2001). This is in line with the Job-Demands-Resources Theory (Xanthopoulou, Bakker, Demerouti, & Schaufeli, 2007) which considers employee competences as a personal resource that is likely to influence attitudinal and behavioral outcomes. Besides this, the findings reveal a highly significant influence of work engagement on job satisfaction. No less than 81% of job satisfaction is explained by work engagement. This is in line with previous research by Saks (2006) and Salanova et al. (2006) and Ganzach (2003), who showed that job satisfaction is determined to a large extent by employees’ intrinsic motivations. Moreover, the data show a significant effect of work engagement on extra-role behavior towards the foreign guest. Employees with high levels of work engagement provide their foreign customers with better service, are more attentive to their needs and adjust their service to adjust their service style to the preferences of the foreign guest. Finally, the hypothesis of a positive relation between job satisfaction and OCB was confirmed, in other words extra-role behavior towards the
organization. Apparently, satisfied employees are willing to go beyond their formal in-role expectations and contribute voluntarily to their organization’s success. For instance, by accepting extra projects or by giving advice about the optimization of the working environment. This finding fits in with prior research (Podsakoff et al., 2009).
The findings contribute to the literature because, to our knowledge, a conceptual model in which intercultural competence is linked to work engagement , job attitudes and extra-role behaviors has not been tested empirically yet. There are also managerial implications, which will be explained below.
From a managerial perspective, the findings show that in an international service environment, the development of intercultural competence adds value to the workforce. Intercultural competence is a personal resource that can be trained, coached and developed. It implies that frontline employees who are intercultural competent, do not only possess culture-specific knowledge about their foreign guests, but also the skills and attitude required to provide optimum service to this diverse customer-base. In the light of globalization and the emergence of new markets such as Russia, India and China , which are culturally distant to many European destinations (House, Javidan, Hanges, & Dorfman, 2002), it would be wise for hotel managers to integrate intercultural competence in their recruitment and development policies. In order to develop and acknowledge the intercultural competence of their frontline staff, hotels should offer their employees personal responsibility in their jobs and allow them to deviate from the standard service script, if a culturally distant customer requires this. This form of empowerment will likely result in extra-role behavior towards the organization. Finally, hotel companies could incorporate their staff’s intercultural competence in their marketing communication efforts. For instance, by encouraging their foreign customers to express their special requests.
Hotel companies experiencing intercultural service encounters are recommended to invest in identifying, motivating and retaining service employees with high levels of intercultural competence or training and developing these competencies with existing staff. Employees with high levels of intercultural competence are more engaged in their daily operations and are more willing to go the extra mile for both the customer and the organization. Eventually, in accordance with the service profit chain (Heskett et al., 1994), this will help companies to build a more satisfied and loyal customer-base and profitability in today’s increasingly diverse and competitive marketplace. In a competitive environment as the international hotel industry, this might make a critical difference.
LIMITATIONS AND SUGGESTIONS FOR FURTHER RESEARCH
Like most research, our study has its limitations. Firstly, we focused on front office employees, because they are very suitable due to their boundary-spanning role and their substantial impact on the guest’s perceived service quality (Hartline & Jones, 1996). We could address the issue of generalizability by including employees from other hotel departments, such as food service, or by involving a broader range of service sectors with an international clientele, such as airlines and tourism (Yu, Weiler, & Ham, 2002). Secondly, within the Job- Demands- Resources model (Bakker et al., 2004), we have limited ourselves to the links between Intercultural Competence as a personal resource, work engagement and attitudes/behaviors. For a more comprehensive grasp of what constitutes the frontline employee’s role in intercultural service encounters, it is recommendable to also test the influence of job resources, such as peer and supervisor support and job demands such as work pressure, emotional, mental and physical demands. Since working in the hotel industry has often been associated with emotional labor (Hochschild, 1983; Lovell, 2009; Price & Arnould, 1999), it would be recommendable to test the role of intercultural competence in the full JD-R model. A third limitation is the fact that we have used a self-assessment questionnaire, which may have been subject to socially desirable responses. This may explain the low loadings of the ‘adaptability’ scale and 3 OCB-O items. In future studies, social desirability could be remedied first of all by controlling for it and by means of multi-level assessment, in which the respondent’s intercultural competence is also assessed by the supervisor and the customer, taking all sides of the ‘ service-triad’ into consideration. Fourthly, single method bias may be a shortcoming of our study. The use of experimental designs, observations, critical incidents, computer simulations and discourse could be a valuable addition to the survey methodology. We also recommend an adjustment of the 30-item MPQ instrument, which has been validated primarily in an expat and educational context. For the hotel service context, a specific selection and wording of items is advised.
The authors would like to thank Valerie Jurrij, Merijn Gerats, Annemarijn Ouwehand and Aviva Stuit for
the data collection and the two anonymous reviewers of this paper for their valuable comments
References
Allport, G. (1961). Pattern and Growth in Personality. New York: Holt, Rinehart and Winston. Arthur, W., & Bennett, W. (1995). The international assignee: the relative importance of factors perceived to
contribute to success. personnel Psychology, 48, 99-114. Bakker, A., & Demerouti, E. (2008). Towards a model of work engagement. Career Development International,
13(3), 209-223. Bakker, A., Demerouti, E., & Verbeke, W. (2004). Using the job demands resources model to predict burnout and
performance. Human Resource Management 43, 83-104. Bakker, A., Schaufeli, W., Leiter, M., & Taris, T. (2008). Work Engagement: an emerging concept in occupational
health psychology. Work and Stress, 22(3), 187-200. Barker, S., & Hartel, C. (2004). Intercultural service encounters: An exploratory study of customer experiences.
Cross Cultural Management, 11(1), 3-14. Broderick, A. J. (1999). Role Theory and the Management of Service Encounters. The Service Industries Journal,
19(2), 117-131. Brown, T. J., Mowen, J. C., Donavan, D. T., & Licata, J. W. (2002). The Customer Orientation of Service Workers:
Personality Trait Effects on Self-and Supervisor Performance Ratings. Journal of Marketing Research, 39(1), 110-119.
Chin, W. W. (1998). The partial least squares approach to structural equation modeling. In G. A. Marcoulides (Ed.), Modern Business Research Methods (pp. 295-336). Mahwah, New Jersey: Lawrence Erlbaum Associates.
Covey, S. (2004). The Seven Habits of Highly Effective. New York: Free Press. Craig, S., & Douglas, S. (2006). Beyond national culture: implications of cultural dynamics for consumer research.
International Marketing Review, 23(2), 322-342. De Beuckelaer, A., Lievens, F., & Bucker, J. (2010). The Role of Faculty Members' Cross-cultural Competencies in
their Perceived Teaching Quality: Evidence from Culturally-diverse Classes in Four European Countries. The Journal of Higher Education, 83(2).
Deardorff, D. (2006). Identification and assessment of interculturalcompetence as a student outcome of internationalisation. Journal of Studies in International Education, 10(3), 241-266.
Demerouti, E., & Bakker, A. (2007). Towards a model of work engagement. Journal of managerial Psychology, 22, 309-328.
Donthu, N., & Yoo, B. (1998). Cultural Influences on Service Expectations. Journal of Service Research, 1(2), 178-186.
Eysenck, H. (1947). Dimensions of Personality. London: Routledge and Keagan Paul. Fornell, C., & Larcker, D. F. (1981). Evaluating structural equation models with unobservable variables and
measurement error. Journal of Marketing Research, 28(1), 39-50. Ganzach, Y. (2003). Intelligence, education, and facets of job satisfaction. Work and Occupations, 30, 97- 122. Gudykunst, W., & Ting-Toomey, S. (1988). Culture and interpersonal communication. Newbury Park, CA: Sage
Publications. Hartline, M., & Jones, K. (1996). Employee performance cues in a hotel service environment: Influence on
perceived service quality, value, and word-of-mouth intentions. Journal of Business Research, 35(3), 207-215. doi: Doi: 10.1016/0148-2963(95)00126-3
Heskett, J., Jones, T., Loveman, G., Sasser, W., & Schlesinger, L. (1994). Putting the Service Profit Chain to work. Harvard Business Review, March-April 1994, 164-174.
Hochschild, A. (1983). The Managed Heart: Commercialization of Human Feeling. Berkeley: University of California Press.
House, R., Javidan, M., Hanges, P., & Dorfman, P. (2002). Understanding cultures and implicit leadership theories across the globe: an introduction to project GLOBE. Journal of World Business, 37(1), 3-10. doi: 10.1016/s1090-9516(01)00069-4
Katz, D. (1964). The motivational basis of organizational behavior Behavioral Science, 9, 131-146. Langer, E. J., & Moldoveanu, M. (2000). The Construct of Mindfulness. Journal of Social Issues, 56(1), 1-9. doi:
10.1111/0022-4537.00148
Levy, O., Beechler, S., Taylor, S., & Boyacigiller, N. (2007). What we talk about when we talk about /`global mindset/': Managerial cognition in multinational corporations. J Int Bus Stud, 38(2), 231-258.
Liu, B. S., Furrer, O., & Sudharshan, D. (2001). The relationship between culture and behavioral intentions toward services. Journal of Service Research, 4(2), 118-129.
Lovell, G. (2009). Can I trust you? An exploration of the role of trust in hospitality service settings. Tourism & Hospitality Planning and Development, 6(2), 145-157.
Lustig, M. W., & Koester, J. (1993). Methodological Issues in the study of intercultural communication competence. In R. W. Wiseman & J. Koester (Eds.), Intercultural Communication competence (pp. 153-167). Newbury Park: Sage.
MacKenzie, S., Podsakoff, P., & Fetter, R. (1991). Organizational Citizenship Behavior and objective productivity as determinants of managerial evaluations of salespersons’ performance. . Organizational Behavior and and Human Decision Processes, 50, 123-150.
Mattila, A. S. (1999). The role of culture in the service evaluation process. Journal of Service Research, 1(3), 250-261.
Moorman, R. (1993). The influence of cognitive and affective based job satisfaction measures on the relationship between satisfaction and organizational citizenship behavior Human Relations, 46, 759-776.
Mukherjee, A., & Malhotra, N. (2006). Does role clarity explain employee-perceived service quality? A study of antecedents and consequence in call centres. International Journal of Service Industry Management, 17(5), 444-473.
Ng, S. I., Lee, J. A., & Soutar, G. N. (2007). Tourists' intention to visit a country: The impact of cultural distance. Tourism Management, 28(6), 1497-1506. doi: DOI: 10.1016/j.tourman.2006.11.005
Organ, D. (1988). Organizational Citizenship Behavior: the Good Soldier Syndrome. Lexington MA: Lexington Books.
Organ, D., Podsakoff, P., & MacKenzie. (2006). Organizational Citizenship Behavior: its nature, antecedents and consequences London: Sage Books.
Organ, D., & Ryan, K. (1995). A meta-analytical review of attitudinal and dispositional predictors of organizational citizenship behavior Personnel Psychology 82, 262-270.
Podsakoff, P., Blume, B., Whiting, S., & Podsakoff, M. (2009). Individual- and organizational level consequences of organisational citizenship behaviors: a meta-analysis Journal of applied psychology 94 (1), 121-141.
Podsakoff, P., MacKenzie, S., Moorman, R., & Fetter, R. (1990). Transformational Leader Behaviors and their effects on followers’ trust in leader, satisfaction and organizational citizenship behaviors Leadership Quarterly,, 1(2), 107-142.
Podsakoff, P. M., MacKenzie, S. B., Moorman, R. H., & Fetter, R. (1990). Transformational leader behaviors and their effects on followers' trust in leader, satisfaction, and organizational citizenship behaviors. [doi: DOI: 10.1016/1048-9843(90)90009-7]. The Leadership Quarterly, 1(2), 107-142.
Ponterotto, J. G. (2008). Theoretical and empirical advances in multicultural counseling and psychology. In S. D. Brown & R. W. Lent (Eds.), Handbook of Counseling psychology (pp. 121-140). Hoboken, NJ: Wiley.
Ponterotto, J. G., Costa-Wofford, C. I., Brobst, K. E., Spelliscy, D., Kacanski, J. M., Scheinholtz, J., & Martines, D. (2007 ). Multicultural personality dispositions and psychological well-being Journal of Social Psychology, 147 ((2), 119-135
Price, L., & Arnould, E. (1999). Commercial friendships: Service Provider-Client Relationships in Context. Journal of Marketing, 63(4), 38-56.
Redmond, M. V. (2000). Cultural distance as a mediating factor between stress and intercultural communication competence. International Journal of Intercultural Relations, 24(1), 151-159. doi: Doi: 10.1016/s0147-1767(99)00028-0
Ringle, C. M., Wende, S., & Will, A. (2005). SmartPLS (Version 2.0 (beta)). Hamburg: University of Hamburg. Retrieved from http://www.smartpls.de
Ruben, B. D. (1976). Assessing communication competence for intercultural communication adaptation. Groups and Organization studies, 1(3), 334-354.
Saks, A. (2006). Antecedents and consequences of employee engagement. Journal of managerial Psychology, 21(7), 600-619.
Salanova, M., Bakker, A., & Llorens, S. (2006). Flow at Work: Evidence for an Upward Spiral of Personal and Organizational Resources*. Journal of Happiness Studies, 7(1), 1-22. doi: 10.1007/s10902-005-8854-8
Samenfink, W. H. (1994). A Quantitative Analysis of Certain Interpersonal Skills Required in the Service Encounter. Journal of Hospitality & Tourism Research, 17(2), 1-15. doi: 10.1177/109634809401700202
Schaufeli, W. B., Bakker, A. B., & Salanova, M. (2006). The Measurement of Work Engagement With a Short Questionnaire. Educational and Psychological Measurement, 66(4), 701-716. doi: 10.1177/0013164405282471
Schaufeli, W. B., Taris, T., Le Blanc, P. M., Peeters, M. C., Bakker, A. B., & de Jonge, J. (2001). Maakt arbeid gezond? Op zoek naar de bevlogen werknemer. / Work and health: The quest for the engaged worker. Psycholoog, 36(9), 422-428.
Schoefer, K., & Ennew, C. (2005). The Impact of Perceived Justice on Consumers' Emotional Responses to Service Complaint Experiences. Journal of Services Marketing, 19(5), 261-270.
Sharma, P., Tam, J. L. M., & Kim, N. (2009). Demystifying Intercultural Service Encounters. Journal of Service Research, 12(2), 227-242. doi: 10.1177/1094670509338312
Sizoo, S., Iskat, W., Plank, R., & Serrie, H. (2003). Cross-Cultural Service Encounters in the Hospitality Industry and the Effect of Intercultural Sensitivity on Employee Performance. [Article]. International Journal of Hospitality & Tourism Administration, 4, 61-77.
Sizoo, S., Plank, R., Iskat, W., & Serrie, H. (2005). The effect of intercultural sensitivity on employee performance in cross-cultural service encounters. Journal of Services Marketing, 19(4), 245-255.
Solomon, M. R., Surprenant, C., Czepiel, J. A., & Gutman, E. G. (1985a). A Role Theory Perspective on Dyadic Interactions: The Service Encounter Journal of marketing (Vol. 49, pp. 99-111): American Marketing Association.
Solomon, M. R., Surprenant, C., Czepiel, J. A., & Gutman, E. G. (1985b). A role theory perspective on dyadic interactions: the service encoutner. Journal of marketing, 49(Winter), 99-111.
Spitzberg, B., & Chagnon, G. (2009). Conceptualizing intercultural competence. In D. Deardorff (Ed.), The Sage Handbook of Intercultural Competence (pp. 3-52). Thousand Oaks sage.
Stauss, B., & Mang, P. (1999). 'Culture shocks' in inter-cultural service encounters. Journal of Services Marketing, 13(4/5), 329-346.
Suanet, I., & Van de Vijver, F. (2009). Perceived Cultural Distance and Acculturation between Russian and Exchange Students. Journal of Community and Applied Social Psychology, 19(3), 182-197.
Tenenhaus, M., Vinzi, V. E., Chatelin, Y.-M., & Lauro, C. (2005). PLS Path Modeling. Computational Statistics & Data Analysis, 48(1), 159-205.
Triandis, H. C. (2006). Cultural intelligence in organizations. Group & Organization Management, 31(1), 20-26. Tsaur, S.-H., & Lin, Y. C. Y.-C. (2004). Promoting service quality in tourist hotels: the role of HRM practices and
service behavior. Tourism Management, 25(4), 471-481. UNWTO. (2011). International Tourism to reach one billion in 2012. UNWTO Tourism Barometer Retrieved 01-
17-12, 2012 Van Oudenhoven, J. P., Zee, K. v. d., & Van Kooten, M. (2001). Succesful adaptation strategies according
expatriates. International Journal of Intercultural Relations, 25, 467-482. Van der Zee, K., & Oudenhoven, J. P. v. (2001). The multicultural personality questionnaire: reliability and validity
of self and other ratings of multicultural effectiveness. Journal of Research in Personality, 35, 278-288. Van der Zee, K., & Van Oudenhoven, P. (2000). The Multicultural Personality Questionnaire: A Multidimensional
Instrument of Multicultural Effectiveness. European Journal of Personality, 144(4), 291-309. Van Der Zee, K. I., Ali, A. J., & Haaksma, I. (2007). Determinants of effective coping with cultural
transition among expatriate children and adolescents. Anxiety, Stress and Coping, 20(1), 25-45 Wang, C.-y., & Mattila, A. S. (2010). A grounded theory model of service providers' stress, emotion and coping
during intercultural service encounters. Managing Service Quality, 20(4). Wetzels, M., Odekerken-Schröder, G., & Van Oppen, C. (2009). Using PLS Path Modeling for Assessing
Hierarchical Construct Models: Guidelines and Empirical Illustration. MIS Quarterly, 33(1), 177-195. Xanthopoulou, D., Bakker, A., Demerouti, E., & Schaufeli, W. (2007). The role of personal resources in the job
demands resources model. International Journal of Stress Management, 14, 121-141. Yu, X., Weiler, B., & Ham, S. (2002). Intercultural communication and mediation: A framework for analysing the
intercultural competence of Chinese tour guides. Journal of Vacation Marketing, 8(1), 75-87. doi: 10.1177/135676670200800108
Expatriate managers in the hospitality industry and negotiation success:
An empirical analysis of Spanish hotel chains in Latin America
Agustín Alonso
Ana Arencibia
Desiderio J. García-Almeida *
Ancor Suárez
University of Las Palmas de Gran Canaria
Contact author: Desiderio J. García-Almeida
ABSTRACT
Many multinational corporations employ expatriate managers from the home country to lead the operations in the subsidiaries set up in host countries. Firms in the hospitality industry are not an exception and top management usually assigns expatriate managers to work in hotels abroad. Those expatriate managers need many interpersonal skills, and negotiation becomes a topic of interest in that context. Several factors that can influence negotiation success by expatriates are explored and seven research hypotheses are set. The empirical data to test those hypotheses were obtained from Spanish general managers in Latin America. Results show the relevance of the level of organizational decentralization, the expatriate’s adjustment to the local culture, and his/her emotional control as determinants of negotiation success.
KEYWORDS
Expatriates, negotiation, hotel chains, internationalization
PSYCHOLOGICAL EMPOWERMENT IN THE JORDANIAN HOSPITALITY INDUSTRY: DOES THE CONTEXT MATTER?
Andrew Lockwood
University of Surrey, UK, Guildford [email protected]
Hesham Al-Sabbahy
University of Surrey, UK, Guildford [email protected]
Khaled Odeh
Al-Hussein bin Talal University, Jordan, Ma'an. [email protected]
Samer Al-Sabi
Al-Hussein bin Talal University, Jordan, Ma'an [email protected]
ABSTRACT
The aim of this study is to examine the psychological empowerment construct within the Jordanian hospitality industry. The multi-dimensional scale developed by Spreitzer 1995 was used. A total of 800 questionnaires were distributed to a sample of frontline employees, and out of these a total of 682 usable questionnaires were used in the analysis. The results of the Exploratory Factor Analysis (EFA) introduced a two dimensional structure. The results of t-tests and one-way ANOVA revealed that only employees’ nationality and educational level could be used to segment employees based on their perception of the psychological empowerment overall and on the extracted dimensions. Implications and recommendations for future research are presented Key words Psychological empowerment, Restaurants, Hotels, Jordan, Hospitality, Frontline Employees
INTRODUCTION
The Hospitality Industry is characterised as a continuous operation and it has unstable customer demand. This emphasises the importance of managing the interactions between customer contact employees and customers. The quality of service is determined by the actions of employees whose ability, knowledge, loyalty and experience may vary, and whose reaction to customers may differfrom one to another (Lewis and McCann, 2004). Due to the rapid changes in the business environment, competitive strategies and customer demands (Cho et al., 2006), human resource departments have begun to improve the performance of their organisations using empowerment as a tool for handling rapid changing and complex situations, with the purpose of establishing satisfactory solutions that can respond to customer demands and improve the quality of service (Ginnodo, 1997).
Despite abundant studies of employee empowerment in the organisational and services marketing literature (e.g. Conger and Kanungo, 1988; Thomas and Velthouse, 1990; Bowen and Lawler, 1992; Fulford and Enz, 1995; Spreitzer, 1995), much remains unexplored about the concept itself and its possible consequences in the hospitality industry. Whereas Spreitzer’s model suggests that psychological empowerment is a four dimensional construct namely: meaning, competence, self-determination and impact, research in hospitality has revealed that psychological empowerment has different results with regards to its dimensionality. Some researchers have shown that it has only three dimensions: meaning, competence and influence (e.g. Fulford and Enz 1995; Hancer and George 2003; and Amenumey, 2007), while others have shown only two dimensions: attitude and influence (George and Kim, 2005). This might be due to the context in which the original Spreitzer model was tested, namely from the manager’s perspective rather than the employees, and in a manufacturing context where a clear division between departments might make managers feel that they can have impact within their organisations. Given the position of frontline employees in the hospitality industry and the nature of the decisions that they can take, it is likely that theirs feeling of being empowered arise in a different way from those in managerial positions. It may be more critical for a manager than for a non-manager to perceive having some impact within their department to feel empowered. As such, there is a real need to retest the concept in the hospitality context and from the employees’ perspective to verify the construct and its dimensions, as well as identify the characteristics of service employees who are more likely to feel empowered and embrace the practices that reflect this.
The current study was conducted in Jordan. Many of the previous studies on psychological empowerment have been conducted in the context of western economies and very little research has been done in the Middle East in general and Jordan in particular. However, there is evidence to suggest that different geographic, industrial contexts, cultural valuesas well as demographic factors (e.g. Fock et al., 2011; Dimitriades, 2005; Boudrias et al., 2004; Hui et al., 2004; Sigler and Pearson, 2000) can provide different interpretations of the dimensions of empowerment. In addition, theJordanian context provides a different cultural environment within which to explore the dimensions of psychological empowerment in the hospitality industry and how these may or may not vary from other (western) contexts. As such, this research will contribute to the empowerment literature by testing a generally accepted theory in a different context.
THEORETICAL BACKGROUND
There are two main approaches to understanding employee empowerment in the management literature: a structural/relational frame and a motivational/psychological frame. First, structural empowerment is understood as those managerial and organisational practices that create the necessary conditions to empower workers (Bowen and Lawler, 1995, 1992; Cunningham, et al., 1996; Forrester, 2000; Klidas, 2007). Power, in this context, is viewed as the “the ability to get things done, to mobilise resources, to get and use whatever it is the person needs” (Kanter, 1977, p.166). In this respect, empowerment concerns all individuals in the organisation, in whatever position, at whichever level, as they are assigned tasks, which they must perform. Thus, empowerment has been defined as “the notion of developing decision-making authority and responsibility for the control and enhancement of product and/or service quality to the point of production” Klidas (2001, p.27). Empowerment also has been seen as sharing with frontline employees four organizational ingredients: power, information, knowledge and skills, and rewards (Bowen and Lawler, 1995). Bowen and Lawler stress that if any of these essential components are missing, then true empowerment will not exist.
By comparison, as a psychological construct, empowerment has received comparatively less attention. Psychological empowerment can be viewed as an individual’s feeling toward their jobs and it is reflected in their assessments of their own ability to perform their jobs. More specifically, the psychological approach focuses on the employees’ intrinsic motivation rather than on the managerial practices used to increase the individuals’ levels of power. Power here means energy, thus to empower can also mean to energize (Thomas and Velthouse, 1990). That is, empowerment is conceptualized here as a state of mind, rather than something management does to employees. Spreitzer (1995a, p.1444) defined psychological empowerment as an “intrinsic task motivational construct manifested in four cognitions: meaning, competence, self-efficacy, and impact. Together, these four cognitions reflect an active rather than a passive, orientation to a work role”.
Lee and Koh (2001) argued that the term empowerment is ambiguous conceptually, and is often used interchangeably with similar words, such as authority delegation, motivation, self-efficacy, job enrichment, employee ownership, self-determination, self-control, self-influence, self-leadership, high-involvement, and participative management. They therefore suggested that empowerment should really be seen as a new concept defining it as: “The psychological state of a subordinate perceiving four dimensions of meaningfulness, competence, self-determination and impact, which is affected by the empowering behaviours of the supervisor” Lee and Koh, (2001, p.686 ).
DEFINITION AND DIMENSION OF PSYCHOLOGICAL EMPOWERMENT
The starting point in psychological empowerment began with Conger and Kanungo (1988) who considered empowerment to be an enabling process. Thus, empowerment is seen as a motivational construct focused on enabling employees rather than simply delegating to them. Utilizing Bandura’s (1977) self-efficacy concept, they considered empowerment as a process by which the organisation creates conditions for heightening motivation for task accomplishment through the development of a strong sense of personal efficacy. Although, this empowerment experience, in turn, is maintained by Conger and Kanungo (1988, p.476) to increase “both imitation and persistence of subordinates’ task behaviour”, Thomas and Velthouse (1990) disagree with Conger’s definition, because they considered that empowerment is multifaceted and cannot be captured by a single concept.
Thomas and Velthouse (1990) therefore built on the work of Conger and Kanungo (1988) with a focus on management practices that enable employees by enhancing their self-efficacy. Thomas and Velthouse (1990) developed a psychological model of empowerment that focused on the power of organisational practices to energise or internally motivate employees rather than just enable them. These researchers identified empowerment with a type of motivation that they refer to as “intrinsic task motivation”. They believed that this allowed employees to derive positive value directly from their job tasks. Hence, they proposed that psychological empowerment results from a set of cognitions, called task assessments, connected to an individual’s task role: self-determination, meaning, competence (i.e. self-efficacy) and impact, stating also that these task assessments influence behaviour through both reinforcement and expectancy dynamics. Strong perceptions of these four variables generate positive feelings in workers that reinforce their task efforts. They also shape workers’ experiences about receiving these intrinsic rewards in the future. Thus, here the employees themselves rather than anything else determine if they are empowered or not and their perceived level of empowerment.
Spreitzer (1992) took another step forward from the work of Conger and Kanungo (1988) and Thomas
and Velthouse (1990); she attempted to develop an operational definition of empowerment and validated a measure of psychological empowerment in the manufacturing context. Her research provided support for the “construct validity of psychological empowerment in the workplace” with the four dimensions together contributing to an overall construct of empowerment. These dimensions are: Meaning: a sense of meaning is the value of the work goal, judged in relation to an individual’s own values (Thomas and Velthouse, 1990). Competence or Self-efficacy: this is an important motivational construct, which refers to a belief in one’s capability to perform the work activities with the necessary skills (Gist, 1987). Self-determination: this is an individual’s sense of having choice in initiating and regulating actions (Deci et al., 1989). It reflects autonomy. Impact: this is the final dimension, and, refers to the degree, to which one can influence strategic, administrative, or operating outcomes at work (Ashforth, 1989).
According to her validation study (1995a; 1995b; 1996), Spreitzer found, that these four components all contributed to a person’s sense of empowerment. In another study, of manufacturing managers and lower-level service employees, Spreitzer and her colleagues (1997) found that different empowerment dimensions are related to different outcomes (effectiveness, satisfaction, and job related strain), and no single dimension was related to all work outcomes. They, therefore, concluded that employees must experience all four of the empowerment dimensions in order for the organisation to achieve the desired outcomes (Spreitzer et al., 1997).
PSYCHOLOGICAL EMPOWERMENT IN THE HOSPITALITY INDUSTRY Over the last decades, considerable attention has been given by both researchers and practitioners to the concept of empowerment in the hospitality industry. At the practical level, Lashley (1999) notices that the increasing interest of the hospitality industry in gaining competitive advantage through service quality leads hospitality organizations to increase their emphasis on empowerment as a human resource strategy. On the other hand, the hospitality literature reveals that the majority of research efforts have focussed on the organizational practices and managerial role in creating empowering conditions and there is a scarcity of literature so far on psychological empowerment.
The antecedents and outcomes of psychological empowerment were first explored by Sparrowe (1994).
Sparrowe confirmed the factor structure of the Thomas and Velthouse (1990) model in the hospitality industry. Sparrowe’s (1994) study of over thirty-three different hospitality organizations revealed that the relationship between subordinates and supervisors will generate feelings of having meaningful work, competence and impact. On the other hand, psychological empowerment failed to predict employees’ pay satisfaction while it influenced significantly and negatively on employees’ withdrawal behaviour. Another study by Fulford and Enz (1995) used a modified version of Spreitzer’s (1995) scale to study employee empowerment in the club industry. Fulford and Enz found that service delivery performance and employee satisfaction were influenced significantly but differently by one or more dimensions. Several other studies (e.g., Corsun and Enz 1999; George and Thomas 2003; Kim and George, 2005; Amenumey, 2007 and Chiang and Jang 2008) focused on the relationships between certain organisational factors and psychological empowerment components. Corsun and Enz (1999) assert a relationship between an employee’s feeling of psychological empowerment and the supportive work climate in which care and trust prevail. Amenumey (2007) found that service climate was significantly related to hotel employees’ perceptions of empowerment. Chiang and Jang (2008) reported that supportive leadership behaviour played an important role in influencing the managerial trust and organizational culture that support decision making and job autonomy and consequently encourage empowerment in the hotel industry.
The four dimensions of empowerment outlined by Spreitzer (1995) were further evaluated by several
studies (Fulford and Enz 1995; Hancer and George 2003; Kim and George, 2005; Amenumey, 2007; Odeh, 2008 and Stander and Rothmann, 2009). Fulford and Enz (1995), for example, validated the four empowerment dimensions in a club environment. According to their findings, the two dimensions of empowerment; impact and self-determination; are thought to overlap conceptually when applied to a service industry. Thus they found that the items from the dimensions of impact and self-determination loaded onto just one factor, creating a single dimension they called influence. The other two dimensions (meaning and competence) were consistent with those conceptualized by Spreitzer (1995). Subsequently, Hancer and George (2003) assessed the influence of perceived empowerment on employees in an empirical study of a number of restaurants, where data were collected from lower level employees. The result of this study provides support for this three dimensional structure of empowerment (meaningfulness, competence and influence) in a service industry. Finally, (Kim and George 2005 and Al-Sabi, 2011) confirmed a two dimensional structure of the construct in five star hotels and high end luxury restaurants; on one hand, they found self-determination and impact overlapped to introduce a new dimension “Influence”, on the other competence and meaningfulness collapsed significantly into a second single dimension they called “job attitudes”.
To conclude, the concept of empowerment has been examined by several researchers. However, the
inconsistency in the outcomes regarding the dimensions of the construct raises the issue of construct validity. Indeed, the debate regarding the number of dimensions and their validity in the service context in general and the hospitality industry in particular reflects a real need for more studies that should be done to evaluate the construct itself, its antecedents and outcomes in different environments. The mixed findings in the literature, and
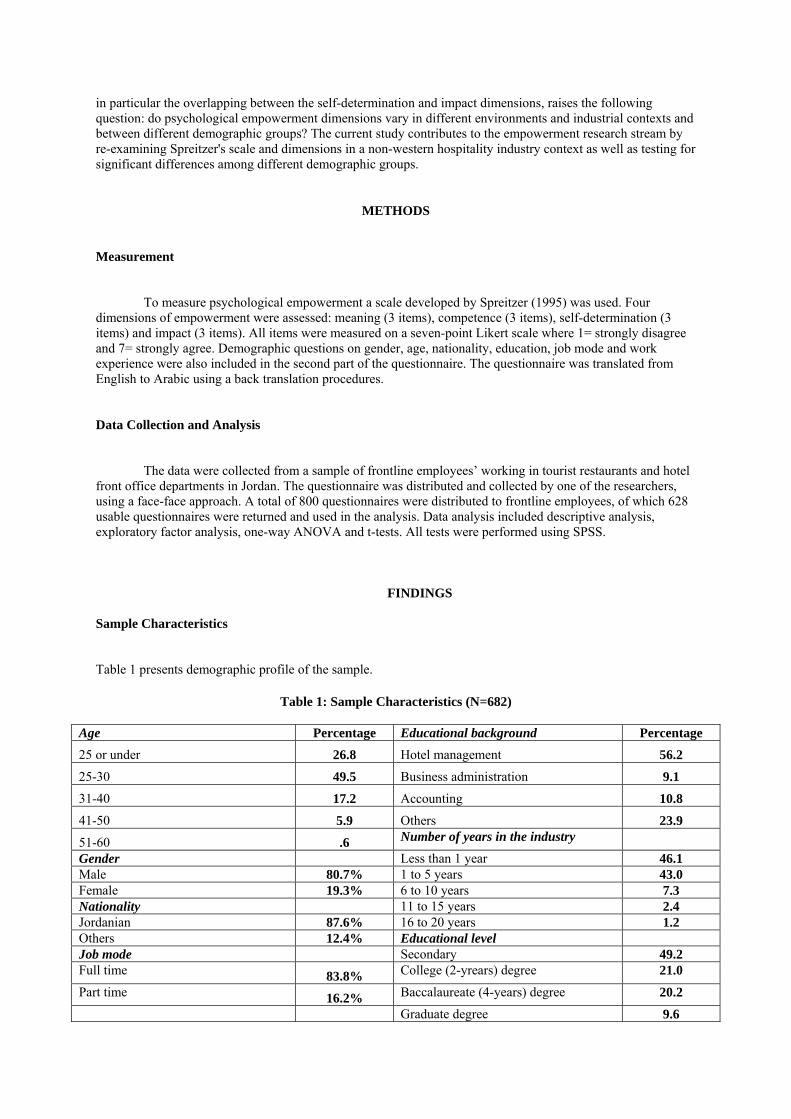
in particular the overlapping between the self-determination and impact dimensions, raises the following question: do psychological empowerment dimensions vary in different environments and industrial contexts and between different demographic groups? The current study contributes to the empowerment research stream by re-examining Spreitzer's scale and dimensions in a non-western hospitality industry context as well as testing for significant differences among different demographic groups.
METHODS
Measurement
To measure psychological empowerment a scale developed by Spreitzer (1995) was used. Four dimensions of empowerment were assessed: meaning (3 items), competence (3 items), self-determination (3 items) and impact (3 items). All items were measured on a seven-point Likert scale where 1= strongly disagree and 7= strongly agree. Demographic questions on gender, age, nationality, education, job mode and work experience were also included in the second part of the questionnaire. The questionnaire was translated from English to Arabic using a back translation procedures. Data Collection and Analysis
The data were collected from a sample of frontline employees’ working in tourist restaurants and hotel
front office departments in Jordan. The questionnaire was distributed and collected by one of the researchers, using a face-face approach. A total of 800 questionnaires were distributed to frontline employees, of which 628 usable questionnaires were returned and used in the analysis. Data analysis included descriptive analysis, exploratory factor analysis, one-way ANOVA and t-tests. All tests were performed using SPSS.
FINDINGS
Sample Characteristics Table 1 presents demographic profile of the sample.
Table 1: Sample Characteristics (N=682)
Age Percentage Educational background Percentage
25 or under 26.8 Hotel management 56.2
25-30 49.5 Business administration 9.1
31-40 17.2 Accounting 10.8
41-50 5.9 Others 23.9
51-60 .6 Number of years in the industry
Gender Less than 1 year 46.1 Male 80.7% 1 to 5 years 43.0 Female 19.3% 6 to 10 years 7.3 Nationality 11 to 15 years 2.4 Jordanian 87.6% 16 to 20 years 1.2 Others 12.4% Educational level Job mode Secondary 49.2 Full time 83.8% College (2-yrears) degree 21.0
Part time 16.2% Baccalaureate (4-years) degree 20.2
Graduate degree 9.6
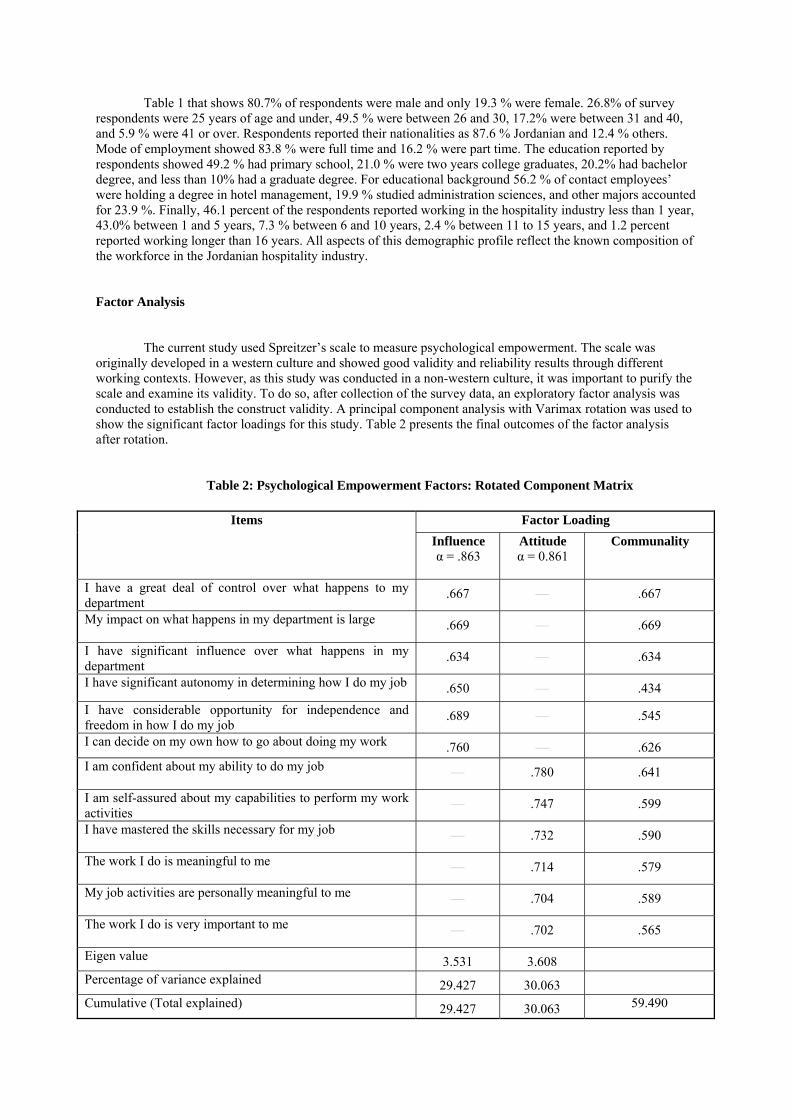
Table 1 that shows 80.7% of respondents were male and only 19.3 % were female. 26.8% of survey respondents were 25 years of age and under, 49.5 % were between 26 and 30, 17.2% were between 31 and 40, and 5.9 % were 41 or over. Respondents reported their nationalities as 87.6 % Jordanian and 12.4 % others. Mode of employment showed 83.8 % were full time and 16.2 % were part time. The education reported by respondents showed 49.2 % had primary school, 21.0 % were two years college graduates, 20.2% had bachelor degree, and less than 10% had a graduate degree. For educational background 56.2 % of contact employees’ were holding a degree in hotel management, 19.9 % studied administration sciences, and other majors accounted for 23.9 %. Finally, 46.1 percent of the respondents reported working in the hospitality industry less than 1 year, 43.0% between 1 and 5 years, 7.3 % between 6 and 10 years, 2.4 % between 11 to 15 years, and 1.2 percent reported working longer than 16 years. All aspects of this demographic profile reflect the known composition of the workforce in the Jordanian hospitality industry. Factor Analysis
The current study used Spreitzer’s scale to measure psychological empowerment. The scale was originally developed in a western culture and showed good validity and reliability results through different working contexts. However, as this study was conducted in a non-western culture, it was important to purify the scale and examine its validity. To do so, after collection of the survey data, an exploratory factor analysis was conducted to establish the construct validity. A principal component analysis with Varimax rotation was used to show the significant factor loadings for this study. Table 2 presents the final outcomes of the factor analysis after rotation.
Table 2: Psychological Empowerment Factors: Rotated Component Matrix
Items
Factor Loading
Influence α = .863
Attitude α = 0.861
Communality
I have a great deal of control over what happens to my department
.667 __ .667
My impact on what happens in my department is large .669 __ .669
I have significant influence over what happens in my department
.634 __ .634
I have significant autonomy in determining how I do my job .650 __ .434
I have considerable opportunity for independence and freedom in how I do my job
.689 __ .545
I can decide on my own how to go about doing my work .760 __ .626
I am confident about my ability to do my job __ .780 .641
I am self-assured about my capabilities to perform my work activities
__ .747 .599
I have mastered the skills necessary for my job __ .732 .590
The work I do is meaningful to me __ .714 .579
My job activities are personally meaningful to me __ .704 .589
The work I do is very important to me __ .702 .565
Eigen value 3.531 3.608
Percentage of variance explained 29.427 30.063
Cumulative (Total explained) 29.427 30.063 59.490
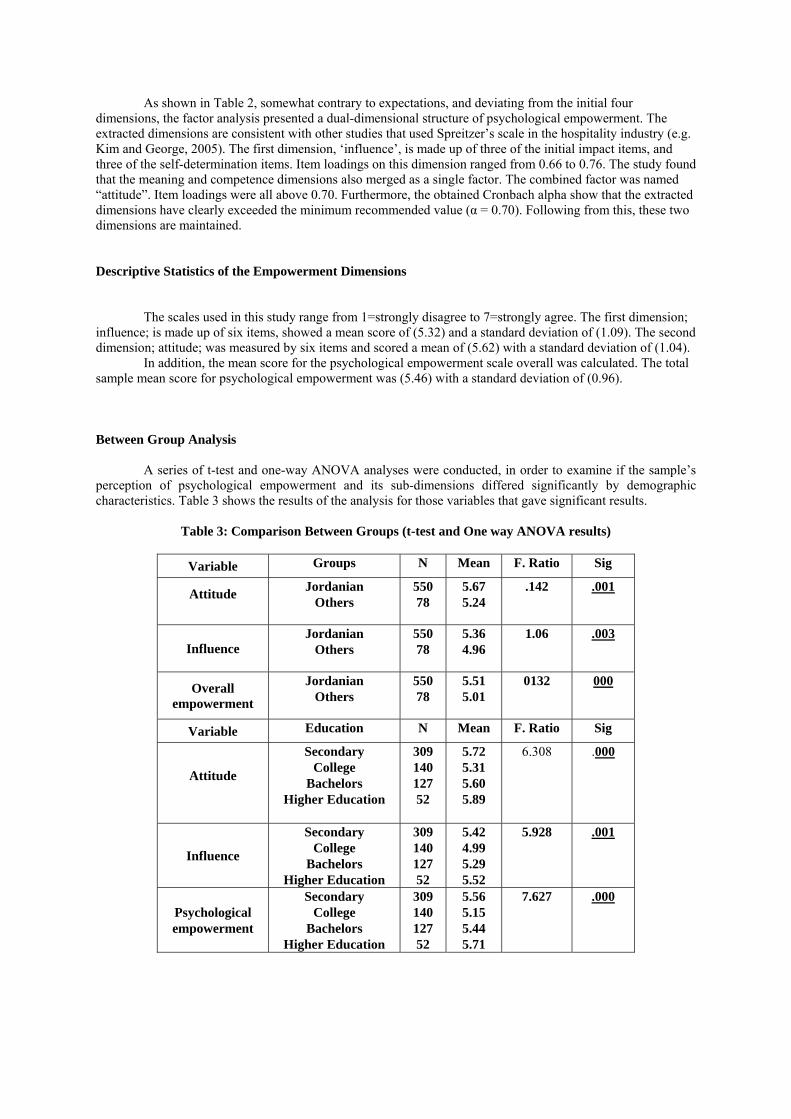
As shown in Table 2, somewhat contrary to expectations, and deviating from the initial four dimensions, the factor analysis presented a dual-dimensional structure of psychological empowerment. The extracted dimensions are consistent with other studies that used Spreitzer’s scale in the hospitality industry (e.g. Kim and George, 2005). The first dimension, ‘influence’, is made up of three of the initial impact items, and three of the self-determination items. Item loadings on this dimension ranged from 0.66 to 0.76. The study found that the meaning and competence dimensions also merged as a single factor. The combined factor was named “attitude”. Item loadings were all above 0.70. Furthermore, the obtained Cronbach alpha show that the extracted dimensions have clearly exceeded the minimum recommended value (α = 0.70). Following from this, these two dimensions are maintained.
Descriptive Statistics of the Empowerment Dimensions The scales used in this study range from 1=strongly disagree to 7=strongly agree. The first dimension;
influence; is made up of six items, showed a mean score of (5.32) and a standard deviation of (1.09). The second dimension; attitude; was measured by six items and scored a mean of (5.62) with a standard deviation of (1.04).
In addition, the mean score for the psychological empowerment scale overall was calculated. The total sample mean score for psychological empowerment was (5.46) with a standard deviation of (0.96). Between Group Analysis
A series of t-test and one-way ANOVA analyses were conducted, in order to examine if the sample’s perception of psychological empowerment and its sub-dimensions differed significantly by demographic characteristics. Table 3 shows the results of the analysis for those variables that gave significant results.
Table 3: Comparison Between Groups (t-test and One way ANOVA results)
Variable Groups N Mean F. Ratio Sig
Attitude
Jordanian Others
550 78
5.67 5.24
.142 .001
Influence Jordanian
Others 550 78
5.36 4.96
1.06 .003
Overall empowerment
Jordanian Others
550 78
5.51 5.01
0132 000
Variable Education N Mean F. Ratio Sig
Attitude
Secondary College
Bachelors Higher Education
309 140 127 52
5.72 5.31 5.60 5.89
6.308 .000
Influence
Secondary College
Bachelors Higher Education
309 140 127 52
5.42 4.99 5.29 5.52
5.928 .001
Psychological empowerment
Secondary College
Bachelors Higher Education
309 140 127 52
5.56 5.15 5.44 5.71
7.627 .000
As presented in Table 3, out of the eight demographic characteristics, only employees’ nationality and educational level yielded a statistically significant difference. In terms of nationality, Jordanian employees perceived that they had more influence over their job tasks than other employees did and had higher attitude scores. In the same pattern, Jordanian workers reported a statistically significant higher level of overall psychological empowerment than other nationalities. Based on the educational level characteristic, employees with university education or higher reported higher scores on the overall empowerment score and both of its dimensions.
DISCUSSION OF FINDINGS
This study investigated psychological empowerment in the hospitality industry in Jordan. The 12-item
scale developed by Spreitzer (1995) was adapted for measuring the psychological empowerment of a sample of frontline employees in Jordanian hospitality industry. The original scale had four dimensions. These dimensions are: meaning, competence, self-determination and impact. To validate the scale and its sub-components in the Jordanian hospitality environment, principal components factor analysis was undertaken. A two-factor structure was obtained as a result of this analysis, following the pattern of Kim and George (2005). Table (2) shows that two of the original dimensions, namely meaning and competence, merged into single factor called attitude. It was also found that both the self-determination and impact dimensions from the original scale merged to form a new dimension; influence. The findings of this study matched previous studies that used Spreitzer’s scale in the hospitality industry (Fulford and Enz, 1995; Hancer and George, 2003; Amenumey, 2007).
The two factor structure shows that the psychological empowerment construct is highly influenced by the industry and working environment. Amenumey (2007) contended in his study that the social behaviourism philosophy, which assumes that the type of interaction between group and organisational members influences their interpretations of specific matters in question, can be one of the issues that explains different conceptualisations in different organisations and studies. In different studies that have resulted in either a two-factor or a three-factor solution, there has been some combination between self-determination and impact on the one hand and between meaning and competence on the other. Fulford and Enz (1995) noted that “self-determination and impact may indeed combine when the organisation under study is small, the levels of management are fewer (less bureaucratic), and the nature of the work brings employees directly into contact with the customer (service firm versus manufacturing organisation)” (p. 165). Boudrias, Gaudreau, and Laschinger (2004) also found that the self-determination and impact dimensions of psychological empowerment had something in common and that they could be reflected in one single dimension, while Stander and Rothmann (2009) pointed out in their study that the relationship between meaning and competence is strong and it seems that, although these are separate dimensions, they are strongly related. Therefore, it is important to consider that implementing empowerment in different types of organisational structures may influence employees’ perception of their value and their belief about how well they will perform their goals or tasks, and their ability and choice in influencing, initiating and regulating their own work.
After examining the factor structure, the scores for psychological empowerment and the scores for the extracted dimensions were calculated for the study sample. The mean score of psychological empowerment was 5.46. The scores for the two dimensions of psychological empowerment were also calculated. The attitude dimension had a mean score of 5.62 and the influence factor score was 5.31. From the mean scores of the psychological empowerment construct and its dimensions, it could be concluded that Jordanian workers exhibit a relatively high level of overall psychological empowerment in the hospitality industry. Employees reported their work to be meaningful, that they were competent in doing their tasks and that they had influence and control over their tasks and work related issues. The higher score was for attitude, and the lower was the perception of influence. These results indicated that employees felt that how competent they were in doing their job and how meaningful their job was for them, were more positive than their ability to control and influence their jobs or work related issues.
In this study, eight demographic factors were used to describe the study’s sample. These included employees’ gender, age, nationality, job mode, educational background, educational level, experiences, and job tenure. To explore the effect of these factors on the psychological empowerment perception, a series of t-tests and one-way ANOVA were conducted. The results indicated that among all the demographic variables, the
nationality and the educational level were the only variables to yield a significant impact on overall psychological empowerment. This study found that Jordanian employees perceived themselves as more psychologically empowered (5.11) than other nationalities’ employees did (4.82). Likewise, in examining the educational level characteristic, it was found that those having a college or higher degree reported higher scores on overall empowerment (5.17) than did those with a secondary or lesser level of education (4.82). This result did not match Hancer and George’s (2003) findings that the less educated employees reported higher levels of empowerment than higher educated employees.
As discussed earlier, this study has confirmed the two factor structure of psychological empowerment in Jordanian hospitality industry. This finding in general, and the emergent new dimension of influence, in particular, matches the previous studies that investigated the concept in the hospitality context (e.g., Fulford and Enz, 1995; Hancer and George, 2003; Amenumey, 2007). This study is not exceptional in relation to that. However, as the individual’s perception of the influence dimension is based on freedom to choose which tasks to do and how to do them, as well as the ability to have influence over their organisation’s issues, this dimension, not surprisingly, has the lowest score compared with the other empowerment components (attitude). The explanation of this might be because the nature of the frontline employees’ job in the hospitality context reveals limited decision making and impact beyond their work area level. The second possible explanation, which is related to the context of the study, is that the nature of the Arab working context reveals a concentration of important decisions being in management’s hands, and it is likely that this affects the perception of influence. Finally, investigating a study like this in the Jordanian hospitality industry, and looking for high levels of expectations with regard to services and guests, it would be expected that the industry would employ relatively well experienced, trained and qualified employees. It is, therefore, not surprising that the employees would find their attitudes toward their work to be more positive (having confidence in their values and beliefs on how well they will perform their goals and tasks while they are interacting with their guests) as well as having a high level of trust in their abilities and choices in influencing, initiating and regulating their own work.
CONCLUSION, RECOMMENDATIONS AND FUTURE RESEARCH
The main objective was to measure employees’ psychological empowerment in Jordanian hospitality industry. For this objective a scale developed by Spreitzer (1995) was used. The 12 item scale was initially developed to measure four dimensions: meaning, competence, self-determination and impact. The results of the factor and reliability analysis indicated that the Arabic version of the Spreitzer (1995) scale worked in the Jordanian hospitality environment. The findings indicated that the meaning and competence dimensions didn’t match the original scale. One the other hand, a new dimension “influence” has emerged. However, this result was consistent with Odeh (2008) and Amenumey (2007) but it was not consistent with Kim and George (2005), who found that employees perceived their influence more positively than their attitudes in their work tasks, units, departments and organisations. After that, employees’ perceptions of psychological empowerment overall, and the extracted factors, were examined. At the aggregate level, the results indicate that the sampled employees perceived themselves as being highly psychologically empowered. At the dimensional level, the results indicated that most employees have a high perception of confidence in their values and beliefs, and on how well they will perform their goals and tasks (attitude), whereas their perception of trust in their abilities and choices in influencing, initiating and regulating their own work (influence) was relatively lower. Finally, the t-test and one-way ANOVA analyses indicated only two demographic factors (e.g., nationality and educational level) that significantly influenced employees’ perceptions concerning psychological empowerment overall, and its dimensions.
This study has tested the Spreitzer (1995) scale in a non-western working context. It is one of the research efforts that attempt to validate the translated scale into the Arabic language. However, the consistency of the current study outcomes with the hospitality literature gives more validity to the translated scale as a tool that can be used in future research. Moreover, it also supported the generalisability of the two factors of the psychological empowerment construct in a non-western environment and in the service context in particular. This leads to support the main argument of the current research that the context of the study has influence on employee's perception of empowerment.
Related to this, researchers in developing countries are suggested to do more research concerning psychological empowerment, and to validate and expand the theory of empowerment. In particular, studies that test the scale in non-service contexts and/or from a managerial perspective could test further the four factor structure of the construct as originally developed by Spreitzer (1995). In this study, however, the two structural factors are consistent with the hospitality literature. Therefore, comparing the results between managerial and non-managerial jobs in the hospitality industry is highly recommended, so that the validity of the current research can be generalised. This study looked at psychological empowerment theory, thus future research can examine other perspectives of empowerment (e.g., team empowerment, structural empowerment). More specifically, examining the organisational practices and managers’ role in enhancing an employee’s empowerment is significant in the Jordanian restaurants. In particular, research could look into some antecedents of employees’ empowerment such as service culture, leadership behaviour, information sharing, rewards, etc.
REFERENCES Al-Sabi, S. (2011), “The Effect of Empowerment on the Service Recovery Performance of Front Office
Agents in Five Star Hotels in Jordan”, Unpublished PhD thesis, University of Surrey.
Amenumey, E. (2007), “Psychological Climate, Psychological Empowerment and Empowered Behaviour: A Study in a Luxury Hotel Group”, Unpublished PhD thesis, University of Surrey.
Ashforth, B. (1989). The Experience of Powerlessness in Organization, Organizational Behaviour and Human Decision Process, 43, 207-242.
Bandura, A. (1977), “Self-efficacy: toward a unifying theory of behavioural change”, Psychology Review, Vol. 84, pp. 191-215.
Bandura, A. (1989), “Human agency in social cognitive theory”, American Psychologist, Vol. 44 (9), pp. 1175-1184.
Bell, N.E. and Staw, B.M. (1989), People as sculptors versus sculpture: The roles of personality and personal control in organizations. In: Arthur, M.B., Hall, D.T., and Lawrence B.S. Handbook of Career Theory, New York, Cambridge University Press, pp. 232-251.
Bitner, M.J, Booms, B. and Tetreault, M.S. (1990), “The Service Encounter: Diagnosing Favourable and Unfavourable Incidents”, Journal of Marketing, Vol. 45, No 1, pp. 71-84.
Bounrias, J., Gaudreau, P. and Laschinger, H.S. (2004), “Testing the Structure of Psychological Empowerment: Dose Gender Make a Difference?”,Educational and Psychological Measurement, Vol.64, No.5, October, pp.861-877.
Bowen, D.E and Lawler, E.E. (1992), “The Empowerment of Service Workers: What, Why, How, and When”, Sloan Management Review, Vol.31 (Spring), pp. 31-40.
Bowen, D.E. and Lawler, E.E. (1995), “Empowering Service Employees”, Sloan Management Review, Vol.36, (summer), pp.73-83.
Brymer, R.A. (1991), “Employee Empowerment: A Guest-Driven Leadership Strategy”, Cornell Hotel and Restaurant Administration Quarterly, Vol.32 No.1, pp 58-68.
Chiang, CF. and Jang, S, (2008), “The Antecedents and Consequences of Psychological Empowerment: the Case of Taiwan’s Hotel Companies”, Journal of Hospitality & Tourism Research, Vol.32, No1, pp 1-22.
Cho, S., Woods, R.H. Jang S.S. and Erdem, M. (2006), “Measuring the impact of human resources management practice on hospitality firms’ performances”, Hospitality Management, Vol.25, pp.262-277.
Conger, J.A. and Kanungo, R.N. (1988), “The Empowerment Process: Integrating Theory and Practice”, TheAcademy of Management Review, Vol. 13, No.3, pp 471-482.
Corsun, D.L. and Enz, C.A. (1999), “Predicting Psychological Empowerment Among Service Workers: The Effect of Support-Based Relationships”, Human Relations, Vol.52, No.2, pp.205-224.
Cunningham, I., Hyman, J. and Baldry, C. (1996), “Empowerment: The Power to do what?”,Industrial Relations Journal, Vol.27, No.2, pp.143-154.
Deci, E.L., and Ryan, R.M. (1985), Intrinsic Motivation and Self-Determination in Human behaviour, Plenum Press: New York.
Deci, E.L., Connell, J.P. and Ryan, R.M. (1989), “Self-determination in a work organization” Journal of Applied Psychology, Vol. 74 (4), pp. 580-590.
Dimitriades, Z.S. (2005), “Employee Empowerment in the Greek Context”, International Journal of Manpower, Vol.26, pp. 80-92.
Ekinci, Y. (2002), “A Review of the Theoretical Debates on the Measurement of Service Quality: Implications for Hospitality Research”, Journal of Hospitality& Tourism Research, Vol.26, No.3, pp.199-216.
Fock, H. Chiang, F. Au, K, and Hui, M.K. (2011), “The Moderating Effect of Collectivistic Orientation in Psychological Empowerment and Job Satisfaction Relationship”, International Journal of Hospitality Management, Vol.30, pp319-328.
Forrester, R. (2000), “Empowerment: Rejuvenating a Potent Idea”, Academy of Management Executive, Vol.14, No 3, pp 67-80.
Fulford, M.D., and Enz, C.A. (1995), “The Impact of Empowerment on Service Employees”, Journal of managerial issues, Vol.7, No.2, pp.161-176.
Ginnodo, B. (1997), The Power of Empowerment, Arlington heights, Illinois: Pride Publications, Inc. Gist, M. (1987).Self-efficacy: Implications for Organizational Behaviour and Human resource Management,
Academy of Management Review, 12, 427-485. Grönroos, C. (2001), Service Management and Marketing: A Customer Relationship Management
Approach, Second Edition, John Wiley & Sons, LTD. Gummesson, E. (1991), “Truth and Myths in Service Quality”, International Journal of Service Industry
Management, Vol.2, No. 3, pp. 7-16. Hackman, J.R., and Oldham, G.R. (1980), Work redesign, Reading, MA: Addison-Wesley. Hancer, M. and George, R.T. (2003), “Psychological Empowerment of Non-Supervisory Employees Working in
Full-service Restaurants”, Hospitality Management, Vol.22, Issue.1, pp.3-16. Hartline, M.D. and Ferrell, O.C. (1996), “The Management of Customer-Contact Employees: An Empirical
Investigation”, Journal of Marketing, Vol.60, No.4, pp.52-70. Honold, L. (1997), “A Review of the Literature on Employee Empowerment”, Empowerment in
Organisations, Vol.5, No.4, pp. 202-212. Huie, M.K., Au, K. and Fock, H. (2004), “Empowerment Effects Across Cultures”, Journal of International
Business Studies, Vol.35, pp.46-60. Kanter, R.M. (1977), Men and Women of the Corporation, Basic Books, New York. Kim, B. and George, R.T. (2005), “The Relationship between Leader-Member Exchange (LMX) and
Psychological Empowerment: A Quick Casual Restaurants Employee Correlation Study”, Journal of Hospitality & Tourism Research, Vol.29, No. 4 (November), pp.468-483.
Kirkman, B.L. and Rosen, B. (1999), “Beyond Self-Management: Antecedents and Consequences of Team Empowerment”, Academy of Management Journal, Vol.42, No.1, pp. 58-74.
Klidas, A., Berg P. and Wilderom, C. (2007), “Managing Employee Empowerment in Luxury Hotels in Europe”, International Journal of Service Industry Management, Vol.18, No.1, pp.70-88.
Klidas, A.K. (2001), Employee Empowerment in the European Hotel Industry: Meaning, process and Cultural Relativity. Amsterdam: Thala Thesis.
Lashley, C. (1996), “Research Issues for Employee Empowerment in Hospitality Organisation”, International Journal of Hospitality Management, Vol.15, No.4, pp.333-346.
Lashley, C. (1999), “Employee Empowerment in Services: A framework for Analysis”, Personnel Review, Vol. 28, No.3, pp 169-191.
Lashley, C. (2000), “Empowerment through Involvement: A Case Study of TGI Fridays Restaurants”, Personnel Review, Vol.29, No.6, pp.791-815.
Lashley, C. (2001), Empowerment: HR Strategies for Service Excellence, Butterworth-Heinemann. Lee, M. and Koh, J. (2001), “Is Empowerment Really a New Concept?”,International Journal of Human
Resource Management, Vol.12, No.4.pp684-695. Lewis, B.R., and McCann, P. (2004), “Service failure and recovery: evidence from the hotel industry”,
International Journal of contemporary Hospitality Management, Vol. 16 (1), pp. 6-17. Liden, R.C. and Arad, S. (1996), “A power Perspective of Empowerment and Work Group: Implications for
Human Resources Management Research”, Research in Personnel and Human Resources Management, Vol.14, pp.205-251.
Odeh, K.A. (2008), The Impact of Front line Employee Empowerment on Service Quality in the Jordanian Restaurant Industry, PhD thesis, University of Surrey.
Quinn, R.E. and Spreitzer, G.M. (1997), “The Road to Empowerment: Seven Questions Every Leader Should Consider”, Organisational Dynamics, Vol.26, Issue.2 (Autumn), pp. 37-49.
Sigler, T.H, and Pearson, C.M. (2000), “Creating an Empowering Culture: Examining the Relationship between Organizational Culture and Perceptions of Empowerment”, Journal of Quality Mangmenent, Vol.5, pp27-52.
Sparrowe, R.T. (1994), “Empowerment in the Hospitality Industry: an Exploration of Antecedents and Outcomes”, Hospitality Research Journal, Vol.17, No.3, pp.51-73.
Spreitzer, G.M. (1995a), “Psychological Empowerment in the Workplace: Dimensions, Measurement, and Validation”, the Academy of Management Journal, Vol. 38, No.5, pp 1442-1465.
Spreitzer, G.M. (1995b), “An Empirical Test of a Comprehensive Model of Interpersonal Empowerment in The
Workplace”, American Journal of Community Psychology, Vol.23, No.5, pp.601-629. Spreitzer, G.M. (1996), “Social Structural Characteristics of Psychological Empowerment”, Academy of
Management Journal, Vol.39, No.2, pp.483-504. Spreitzer, G.M. Janasz, S.C. and Quinn, R.B. (1999), “Empowered to Lead: The Role of Psychological
Empowerment in Leadership”, Journal of Organisational Behaviour, Vol.20, Issue.4, pp.511-526. Spreitzer, G.M. Kizilos, M.A. and Nason, S.W. (1997), “A Dimensional Analysis of the Relationship between
Psychological Empowerment and Effectiveness, Satisfaction, and Strain”, Journal of Management, Vol.23, No.5, pp. 679-704.
Spreitzer, G.M. Mishra, A.K. (1999), “Giving Control without Losing Control”, Group and Organisation
Management, Vol. 24, No. 2, pp. 155-188. Stander, M.W., and Rothmann, S. (2009), “Psychological empowerment of employees in selected organisations
in South Africa”, Journal of Industrial Psychology, Vol. 35 (1), pp.1-8. Thomas, K.W. and Velthouse, B.A. (1990), “Cognitive Elements of Empowerment: an “Interpretive” Model of
Intrinsic Task Motivation”, Academy of Management Review, Vol.15, No.4, pp 666-681. Zeithaml, V.A, and Bitner, M.J. (2003), Service Marketing: Integrating Customer Focus Across the Firm,
3rd edition, McGraw-HILL.
HUBS AND SPOKES: CHARACTERISTICS OF CAREER NETWORKS OF MICHELIN-STARRED CHEFS
Florian Aubke*
Department of Tourism and Hospitality Management MODUL University Vienna
Email: [email protected]
Marc Stierand Academy of Hotel and Facility Management
NHTV Breda University of Applied Sciences Email: [email protected]
Stefanie Krätz
MODUL University Vienna
Abstract
Despite a general fascination for the work of haute cuisine chefs, this profession has sparsely been subject to scientific study, although advances have been made in exploring some aspects of creativity and culinary innovation. Understanding creativity as a systemic phenomenon, this study pursues the question of “who makes a star-decorated chef?” The career progression of 262 German Michelin-starred chefs was examined. The majority of three-star chefs are closely connected to a strong core with densely connected chefs and restaurants, suggesting that few restaurants function as ‘career hubs’. Similarly, some chefs are more influential in forming the network structure than others. The findings of this study introduce an alternative approach to studying culinary creativity which contrasts network structure and individual agency.
Keywords
Gastronomy, Michelin, Network Analysis, Career Progression, Creativity
TO WHAT EXTENT DOES A STAR RETAIN TALENT?
Stéphanie POUGNET Ecole Hôtelière de Lausanne – IFSOM Institute Chalet-à-Gobet, 100 Lausanne 25, Switzerland
Université de Grenoble – Laboratoire CERAG - UMR 5820 ED275 BP 47, 38040 Grenoble Cedex 9, France
[email protected] Abstract: In the European restaurant industry, the war for talent is exacerbated by the war for stars. Within the context of a “culinary underbelly” culture, the talent management practices of restaurants are contingent. In particular, gaining or losing a Michelin-star can lead to changes in how a restaurant acquires, develops and retains talent. These contingent changes may be explained. Thanks to a literature review of how some researchers address talent management issues in the restaurant industry in general, and of the contingent factors that charaterise the European restaurant industry in particular, especially in relation to its specific “star-system”, not only will we set a path to understand the impact of stars on talent attraction and retention, but we will also define practical implications.
Key-words: European Michelin-star restaurants; talent retention; contingency theory; management of change; third-party evaluation / certification; occupational culture.
Role Ambiguity and Role Conflict in Outsourced and Proprietarily-Managed Spas
Veronica Waldthausen Ecole hôtelière de Lausanne
Chalet-à-Gobet 1000 Lausanne 25
Switzerland [email protected]
Demian Hodari* Ecole hôtelière de Lausanne
Chalet-à-Gobet 1000 Lausanne 25
Switzerland [email protected]
(*corresponding author)
Key Words: Role Ambiguity, Role Conflict, Job Satisfaction, Role Stress, Outsourcing, Spas, Hospitality
The outsourcing of auxiliary services in the hotel industry has become increasingly prevalent as organizations often consign their non-core activities to specialist firms that are able to perform these functions much more effectively and efficiently. Despite the benefits, the delivery of peripheral hotel services by third parties can become complex, particularly due to conflicting organizational cultures, structures and management policies. This can directly impact human resource issues since employees may have trouble meeting the different organizations’ potentially contradictory demands (Hemmington & King, 2000).
The hotel’s spa department suffers from particularly high rates of employee turnover due in part to poor communication and uncertain expectations. The lack of employee satisfaction, coupled with the hotel’s lack of expertise in managing spas and spa personnel, are among the reasons that hotels increasingly outsource the management of their spas to third-party spa management companies rather than rely on proprietary management (Lenhart, 2002).
The lack of clear expectations and uncertainty about whom to report to has been shown in other industries to lead to two role stressors: role ambiguity and role conflict (e.g., Onyemah, 2008; Walker, Churchill, & Ford, 1975). These two role stressors, which result in increased turnover and reduced job satisfaction (Rizzo, House, & Lirtzman, 1970), are caused by insufficient communication, unclear policies, a lack of close supervision, and having to report to both internal and external supervisors (e.g., Kahn et al., 1964); and are all present in outsourcing relationships where managers must assume a boundary-spanning role in order to coordinate the relationship across the different organizations (Adler, 2003; Solli-Saether, 2011).
This study investigated whether there is a difference in the levels of role ambiguity and role conflict between outsourced and proprietary managed hotel spas. It hypothesized that when spa management is consigned to a third party then the level of role ambiguity and role conflict would be greater since in outsourced companies stakeholders from multiple firms are typically involved in shaping management policies and decisions.
A self-administered, internet-mediated questionnaire was used to collect data from eleven international hotel companies and five specialized spa management firms globally. Product moment correlations were used to gain an overview of the relationship between the variables. Hypothesis tests were conducted using the Mann-Whitney U test to determine whether the outsourced and non-outsourced responses were similar enough to permit the assumption that they were drawn from the same population.
The analysis of 166 completed questionnaires found no significant differences in the level of role ambiguity and role conflict between proprietary-managed spas and spas that work with a third party. Several explanations for this were put forth during interviews with spa industry experts. First, spa managers who work with a third party communicate frequently with only one of the stakeholders, usually the third party since they are experts in the field, thereby reducing role conflict and thus stress. Second, while the level of stress was not different, the sources of stress that lead to role conflict and role ambiguity varied. Third, communication between the spa manager and the third party were surprisingly frequent, which was initially thought to be a significant problem since previous studies had found a lack of communication to be directly correlated with higher levels of role ambiguity.
Managerial implications resulting from this study include recommendations for improved training for spa managers and enhanced communication channels and frequency between these managers and their supervisors. In addition, the results should provide additional arguments to hotel owners and managers who opt for outsourcing their spa that such a decision does not seem to weaken the spa manager’s job satisfaction, an important finding since managerial turnover in the spa is a real and costly reality in the industry today. Further research examining the impact of outsourcing in the hotel and spa industries on employee satisfaction, strategy implementation, and customer satisfaction is recommended.
THE INFLUENCE OF COMMUNICATION QUALITY BETWEEN SUPERIORS AND
SUBORDINATES ON THE TRANSFER OF KNOWLEDGE IN THE HOTEL INDUSTRY
José Luis Ballesteros Rodríguez*
Departamento de Economía y Dirección de Empresas Universidad de Las Palmas de Gran Canaria
Desiderio J. García Almeida Departamento de Economía y Dirección de Empresas
Universidad de Las Palmas de Gran Canaria [email protected]
Crisanto Román Montoya Lopesan
San Bartolomé de Tirajana [email protected]
Carmen Domínguez-Falcón Departamento de Economía y Dirección de Empresas
Universidad de Las Palmas de Gran Canaria [email protected]
ABSTRACT
This paper will analyze the influence of internal communication practices in the organization as a way
to influence the upward vertical knowledge transfer. To that end an empirical study has been conducted in a leading hotel chain in the Canary Islands in which the opinions of 187 employees have been analyzed using structural equation modeling. The results show that superior's motivation to communication with their subordinates may influence the increased presence of communication of such aspects as innovation and performance. The existence of an adequate level of communication on these issues favorably influences the subordinate's perception that there is a close relationship with the superior. Finally, this fluid relationship is positively related to upward vertical knowledge transfer.
Keywords: Knowledge transfer, communication management, superior-subordinate communication
relationship, hospitality industry
REVISITING HOSPITALITY COMPETENCIES: THE CASE OF CYPRUS
Stelios Marneros European University of Cyprus
Nicosia, Cyprus email: [email protected]
and
Anastasios Zopiatis
Cyprus University of Technology Limassol, Cyprus
email: [email protected]
ABSTRACT
Competencies are probably one of the most popular subjects in scholarly hospitality research. Numerous scholars are trying to clarify the required “success” competencies for hospitality professions for the last 30 years. Despite the plethora of studies there seems to be a consistent inconsistency both in terms of utilized methodologies and findings. Moreover, the narrow geographic origin of most of these studies may not reflect how unique and complex hospitality environments in regions such as Asia, Europe and Africa are. This study takes a slightly different approach since it investigates the perception of hospitality professionals in Cyprus, a major Mediterranean tourist destination, as to what they consider to be the most important competencies necessary for a successful career, as well as the degree to which these competencies are developed by hospitality graduates entering the industry. Findings derived are of value to stakeholders both in the industry and academia. Keywords: Hospitality Industry, Competencies, Education, Cyprus
INTRODUCTION
Many argue that the primary objective of education is to provide the industry with high-caliber individuals able to meet the demands and challenges of their specific career choice (Hansson, 2001; Christou, 2002). For the past 30 years, with the utilization of numerous methodologies, scholars attempted to clarify the required “success” competencies for hospitality professions (Tas, 1988; Okeiyi et al., 1994; Kay and Russette, 2000; Christou, 2002; Chung-Herrera et al., 2003; Kay and Moncarz, 2004; Testa and Sipe, 2011). Despite the plethora of competency-related studies, Zopiatis (2010: 460) argues that such findings should be viewed with caution since “…there appears to be an inconsistency as to the methodologies utilized, the competencies under consideration and the actual competencies revealed as most and least important.”
In an attempt to further explore hospitality “success” competencies, aiming to contribute to the existing body of knowledge, this study takes a slightly different approach. The primary purpose is to investigate the perception of hospitality professionals as to which they consider the most important competencies necessary for a successful career, as well as the degree these competencies are developed by hospitality graduates entering the industry.
LITERATURE REVIEW
As previously stated, many scholars have investigated hospitality competencies from an array of perspectives. The following section will provide a definition of what constitutes a competency, an overview of competency models, and a review of the most notable competency studies in hospitality and tourism literature. What is a Competency?
Many competency definitions have surfaced over the years from academic literature. One of the most cited definitions is suggested by Boyatzis (1982: 97) who defines competency as “an underlying characteristic of a person which results in effective and/or superior performance in a job”, whereas Spencer and Spencer describe a competency (1993: 9) as “an underlying characteristic of an individual that is causally related to criterion-referenced effective and/or superior performance in a job or situation”. In a recently published work, Zopiatis (2010: 460) defines competency as “as the personal qualities and talents needed to do a pre-described
job effectively and efficiently according to established quantifiable organizational standards able to meet specific goals.” Competency Frameworks/Models
Competency frameworks have been introduced and utilized by scholars in an attempt to investigate this complex subject from an array of perspectives. Going back more than 50 years, Katz (1955) proposed a model with three distinctive domains; technical, human and conceptual skills. Katz model formed the basis for Sandwith’s (1993) five domain model (conceptual/creative, leadership, interpersonal, administrative and technical), which is probably the most cited framework in hospitality literature (see the work of Tas et al., 1996; Kay and Russette, 2000; Hu, 2010; Zopiatis, 2010). Another framework, the Competing Values Framework (CVF), which emerged from the original work of Quinn et al. (1996), also captured the attention of hospitality scholars and has been extensively utilized in related studies (see the work of Dimmock, 1999; Walo, 2001; Dimmock et al., 2003). Reflecting on four classic models of organizational theory, CVF proposes eight managerial leadership roles: mentor, facilitator, monitor, coordinator, director, producer, broker and innovator. Competency Studies in the Hospitality and Tourism Industry Numerous competencies related studies have been conducted over the years by hospitality and tourism scholars. Nevertheless, despite the quantity, a certain element of caution is necessary when trying to reflect upon the findings and safely reach some conclusions. Factors such as the methodology utilized, the sample size, the geographic location, the conceptual framework applied (if any), and the uniqueness of the particular hospitality environment tend to provide mixed messages even to the most informed hospitality reader. Table 1 (see next page) exhibits nine notable competency studies conducted in the hospitality and tourism industry.
RESEARCH METHODOLOGY
In an attempt to further explore hospitality “success” competencies, and aiming to contribute to the existing body of knowledge, this study purpose is to investigate the perception of hospitality professionals as to which they consider the most important competencies necessary for a successful career, as well as the degree to these competencies are developed by hospitality graduates entering the industry. Reflecting the study’s primary purpose, the following three research questions were formulated:
RQ1. Which competencies are perceived by hospitality professionals as important for career success in the hospitality industry? RQ2. To what degree these competencies are developed by hospitality graduates entering the industry? RQ3. Do the professionals’ perceptions differ with regards to their age, gender, educational background, managerial level and functional/operational area? Following a comprehensive review of existing literature, a quantitative survey was developed in order
to address the three postulated research questions. Thirty competency statements, falling into five competency domains, which are closely related to Sandwith’s (1993) model, were included in the survey. Respondents were asked to provide their perceived level of importance on each of the thirty statements, as well as, the degree to which these competencies are developed by hospitality graduates entering the industry. Finally, the survey includes numerous demographic and other background questions that will enable the researchers to further explore the topic in order to address the third research question.
The research involved input by individuals (n=186) currently holding full-time managerial positions in
hotel establishments in Cyprus, with the utilization of a quantitative survey. Prior to administration, the questionnaires were pilot-tested for reliability with the test-re-test method and for validity with a panel of experts, both from academia and the industry. Minor changes were conducted to the original survey following the comments and suggestions of the experts. The surveys, which were addressed to hotel general managers and two departmental heads, were administered either through the mail or via a direct personalized distribution. Descriptive and inferential statistics - namely frequencies, reliability analysis (Cronbach's Alpha), independent sample t-test, and one-way ANOVA were utilized in analyzing the data and addressing the research questions. Moreover, quadrant analysis was conducted to create a two-by-two matrix of the competencies under investigation based on high or low perceived level of importance and high or low level of perceived development of graduates entering the industry. It is important to note that numerous hospitality studies (see, for example, Zopiatis, 2010; Beldona and Cobanoglu, 2007) have utilized quadrant analysis mainly because it is a “low-cost, easily understood technique that can yield important insights” (Martilla and James, 1977: 79).
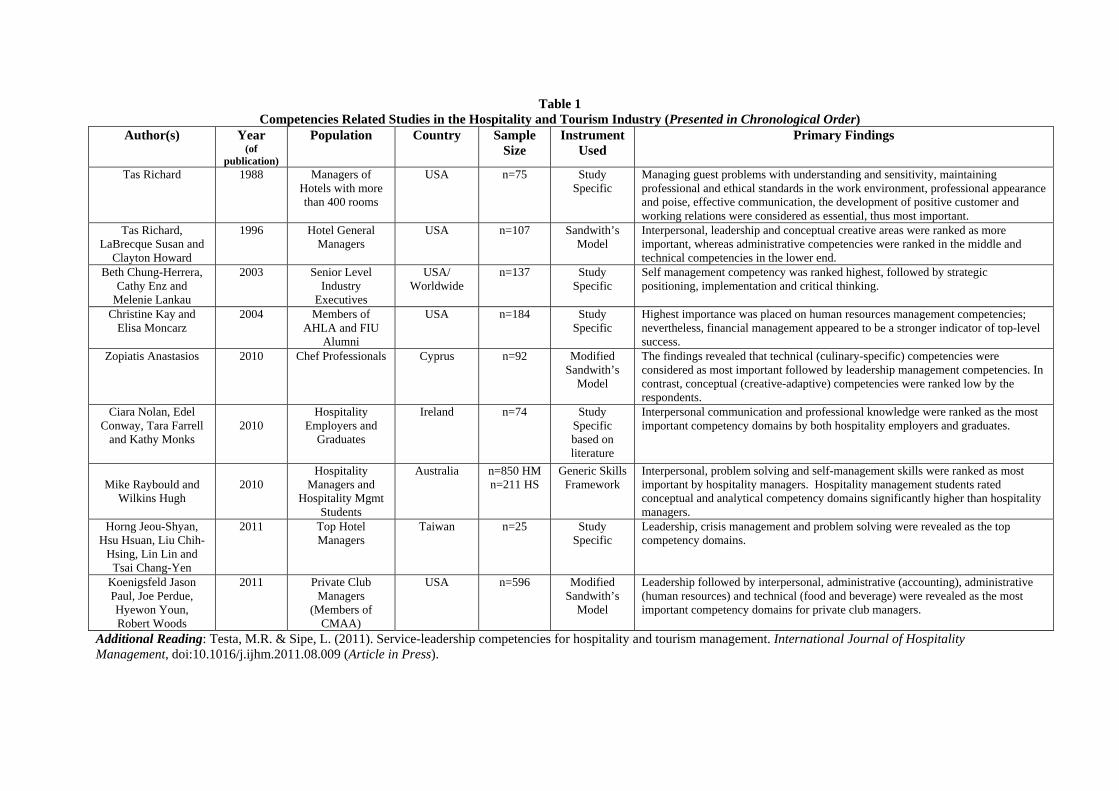
Table 1 Competencies Related Studies in the Hospitality and Tourism Industry (Presented in Chronological Order)
Author(s) Year (of
publication)
Population Country Sample Size
Instrument Used
Primary Findings
Tas Richard 1988 Managers of Hotels with more than 400 rooms
USA n=75 Study Specific
Managing guest problems with understanding and sensitivity, maintaining professional and ethical standards in the work environment, professional appearance and poise, effective communication, the development of positive customer and working relations were considered as essential, thus most important.
Tas Richard, LaBrecque Susan and
Clayton Howard
1996 Hotel General Managers
USA n=107 Sandwith’s Model
Interpersonal, leadership and conceptual creative areas were ranked as more important, whereas administrative competencies were ranked in the middle and technical competencies in the lower end.
Beth Chung-Herrera, Cathy Enz and
Melenie Lankau
2003 Senior Level Industry
Executives
USA/ Worldwide
n=137 Study Specific
Self management competency was ranked highest, followed by strategic positioning, implementation and critical thinking.
Christine Kay and Elisa Moncarz
2004 Members of AHLA and FIU
Alumni
USA n=184 Study Specific
Highest importance was placed on human resources management competencies; nevertheless, financial management appeared to be a stronger indicator of top-level success.
Zopiatis Anastasios 2010 Chef Professionals Cyprus n=92 Modified Sandwith’s
Model
The findings revealed that technical (culinary-specific) competencies were considered as most important followed by leadership management competencies. In contrast, conceptual (creative-adaptive) competencies were ranked low by the respondents.
Ciara Nolan, Edel Conway, Tara Farrell
and Kathy Monks
2010
Hospitality Employers and
Graduates
Ireland n=74 Study Specific based on literature
Interpersonal communication and professional knowledge were ranked as the most important competency domains by both hospitality employers and graduates.
Mike Raybould and
Wilkins Hugh
2010
Hospitality Managers and
Hospitality Mgmt Students
Australia n=850 HM n=211 HS
Generic Skills Framework
Interpersonal, problem solving and self-management skills were ranked as most important by hospitality managers. Hospitality management students rated conceptual and analytical competency domains significantly higher than hospitality managers.
Horng Jeou-Shyan, Hsu Hsuan, Liu Chih-
Hsing, Lin Lin and Tsai Chang-Yen
2011 Top Hotel Managers
Taiwan n=25 Study Specific
Leadership, crisis management and problem solving were revealed as the top competency domains.
Koenigsfeld Jason Paul, Joe Perdue, Hyewon Youn, Robert Woods
2011 Private Club Managers
(Members of CMAA)
USA n=596 Modified Sandwith’s
Model
Leadership followed by interpersonal, administrative (accounting), administrative (human resources) and technical (food and beverage) were revealed as the most important competency domains for private club managers.
Additional Reading: Testa, M.R. & Sipe, L. (2011). Service-leadership competencies for hospitality and tourism management. International Journal of Hospitality Management, doi:10.1016/j.ijhm.2011.08.009 (Article in Press).
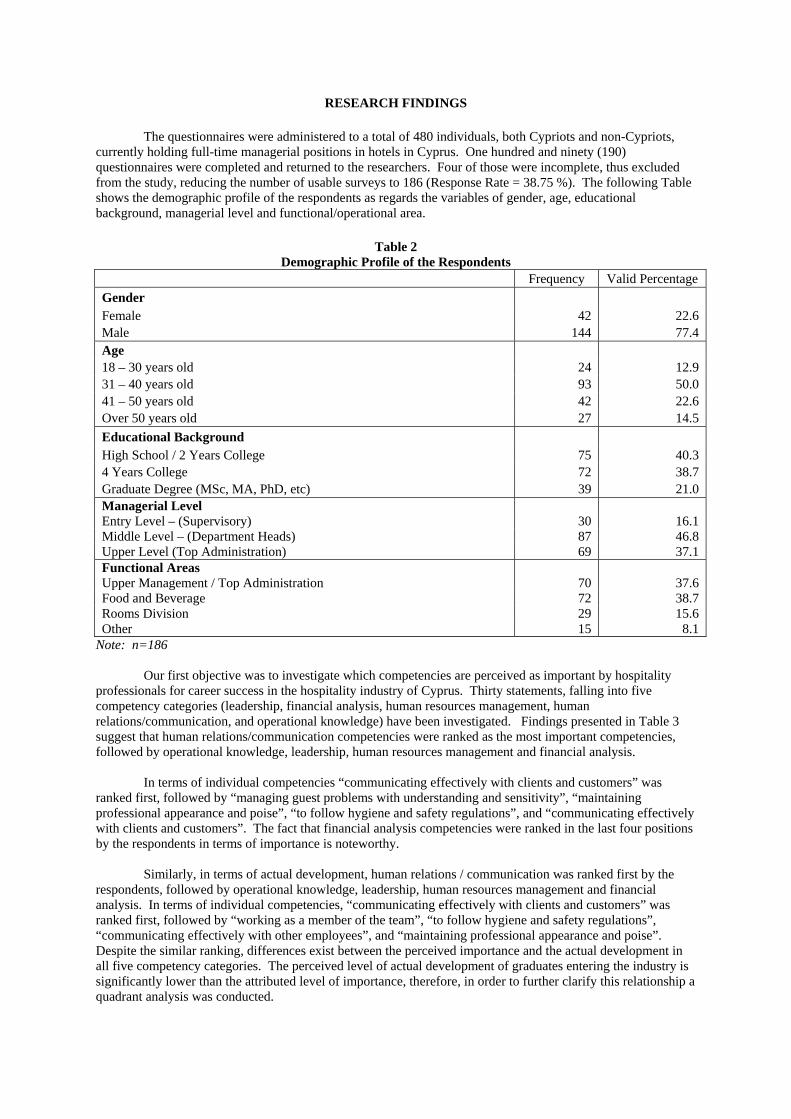
RESEARCH FINDINGS
The questionnaires were administered to a total of 480 individuals, both Cypriots and non-Cypriots, currently holding full-time managerial positions in hotels in Cyprus. One hundred and ninety (190) questionnaires were completed and returned to the researchers. Four of those were incomplete, thus excluded from the study, reducing the number of usable surveys to 186 (Response Rate = 38.75 %). The following Table shows the demographic profile of the respondents as regards the variables of gender, age, educational background, managerial level and functional/operational area.
Table 2
Demographic Profile of the Respondents Frequency Valid Percentage
Gender Female 42 22.6 Male 144 77.4 Age 18 – 30 years old 24 12.9 31 – 40 years old 93 50.0 41 – 50 years old 42 22.6 Over 50 years old 27 14.5
Educational Background High School / 2 Years College 75 40.3 4 Years College 72 38.7 Graduate Degree (MSc, MA, PhD, etc) 39 21.0 Managerial Level Entry Level – (Supervisory) 30 16.1 Middle Level – (Department Heads) 87 46.8 Upper Level (Top Administration) 69 37.1 Functional Areas Upper Management / Top Administration 70 37.6 Food and Beverage 72 38.7 Rooms Division 29 15.6 Other 15 8.1
Note: n=186 Our first objective was to investigate which competencies are perceived as important by hospitality
professionals for career success in the hospitality industry of Cyprus. Thirty statements, falling into five competency categories (leadership, financial analysis, human resources management, human relations/communication, and operational knowledge) have been investigated. Findings presented in Table 3 suggest that human relations/communication competencies were ranked as the most important competencies, followed by operational knowledge, leadership, human resources management and financial analysis.
In terms of individual competencies “communicating effectively with clients and customers” was
ranked first, followed by “managing guest problems with understanding and sensitivity”, “maintaining professional appearance and poise”, “to follow hygiene and safety regulations”, and “communicating effectively with clients and customers”. The fact that financial analysis competencies were ranked in the last four positions by the respondents in terms of importance is noteworthy.
Similarly, in terms of actual development, human relations / communication was ranked first by the
respondents, followed by operational knowledge, leadership, human resources management and financial analysis. In terms of individual competencies, “communicating effectively with clients and customers” was ranked first, followed by “working as a member of the team”, “to follow hygiene and safety regulations”, “communicating effectively with other employees”, and “maintaining professional appearance and poise”. Despite the similar ranking, differences exist between the perceived importance and the actual development in all five competency categories. The perceived level of actual development of graduates entering the industry is significantly lower than the attributed level of importance, therefore, in order to further clarify this relationship a quadrant analysis was conducted.
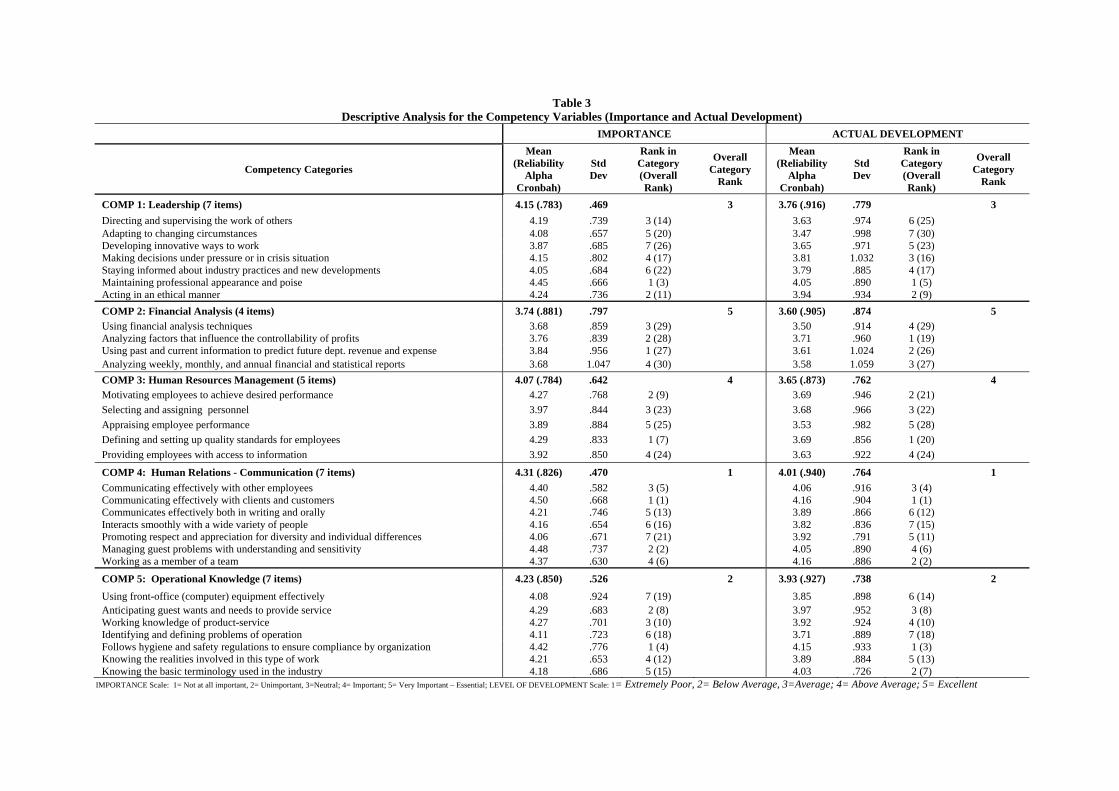
Table 3 Descriptive Analysis for the Competency Variables (Importance and Actual Development)
IMPORTANCE ACTUAL DEVELOPMENT
Competency Categories
Mean (Reliability
Alpha Cronbah)
Std Dev
Rank in Category (Overall Rank)
Overall Category
Rank
Mean (Reliability
Alpha Cronbah)
Std Dev
Rank in Category (Overall Rank)
Overall Category
Rank
COMP 1: Leadership (7 items) 4.15 (.783) .469 3 3.76 (.916) .779 3
Directing and supervising the work of others 4.19 .739 3 (14) 3.63 .974 6 (25) Adapting to changing circumstances 4.08 .657 5 (20) 3.47 .998 7 (30) Developing innovative ways to work 3.87 .685 7 (26) 3.65 .971 5 (23) Making decisions under pressure or in crisis situation 4.15 .802 4 (17) 3.81 1.032 3 (16) Staying informed about industry practices and new developments 4.05 .684 6 (22) 3.79 .885 4 (17) Maintaining professional appearance and poise 4.45 .666 1 (3) 4.05 .890 1 (5) Acting in an ethical manner 4.24 .736 2 (11) 3.94 .934 2 (9)
COMP 2: Financial Analysis (4 items) 3.74 (.881) .797 5 3.60 (.905) .874 5
Using financial analysis techniques 3.68 .859 3 (29) 3.50 .914 4 (29) Analyzing factors that influence the controllability of profits 3.76 .839 2 (28) 3.71 .960 1 (19) Using past and current information to predict future dept. revenue and expense 3.84 .956 1 (27) 3.61 1.024 2 (26) Analyzing weekly, monthly, and annual financial and statistical reports 3.68 1.047 4 (30) 3.58 1.059 3 (27)
COMP 3: Human Resources Management (5 items) 4.07 (.784) .642 4 3.65 (.873) .762 4
Motivating employees to achieve desired performance 4.27 .768 2 (9) 3.69 .946 2 (21) Selecting and assigning personnel 3.97 .844 3 (23) 3.68 .966 3 (22)
Appraising employee performance 3.89 .884 5 (25) 3.53 .982 5 (28) Defining and setting up quality standards for employees 4.29 .833 1 (7) 3.69 .856 1 (20)
Providing employees with access to information 3.92 .850 4 (24) 3.63 .922 4 (24)
COMP 4: Human Relations - Communication (7 items) 4.31 (.826) .470 1 4.01 (.940) .764 1
Communicating effectively with other employees 4.40 .582 3 (5) 4.06 .916 3 (4) Communicating effectively with clients and customers 4.50 .668 1 (1) 4.16 .904 1 (1) Communicates effectively both in writing and orally 4.21 .746 5 (13) 3.89 .866 6 (12) Interacts smoothly with a wide variety of people 4.16 .654 6 (16) 3.82 .836 7 (15) Promoting respect and appreciation for diversity and individual differences 4.06 .671 7 (21) 3.92 .791 5 (11) Managing guest problems with understanding and sensitivity 4.48 .737 2 (2) 4.05 .890 4 (6) Working as a member of a team 4.37 .630 4 (6) 4.16 .886 2 (2)
COMP 5: Operational Knowledge (7 items) 4.23 (.850) .526 2 3.93 (.927) .738 2
Using front-office (computer) equipment effectively 4.08 .924 7 (19) 3.85 .898 6 (14) Anticipating guest wants and needs to provide service 4.29 .683 2 (8) 3.97 .952 3 (8) Working knowledge of product-service 4.27 .701 3 (10) 3.92 .924 4 (10) Identifying and defining problems of operation 4.11 .723 6 (18) 3.71 .889 7 (18) Follows hygiene and safety regulations to ensure compliance by organization 4.42 .776 1 (4) 4.15 .933 1 (3) Knowing the realities involved in this type of work 4.21 .653 4 (12) 3.89 .884 5 (13) Knowing the basic terminology used in the industry 4.18 .686 5 (15) 4.03 .726 2 (7)
IMPORTANCE Scale: 1= Not at all important, 2= Unimportant, 3=Neutral; 4= Important; 5= Very Important – Essential; LEVEL OF DEVELOPMENT Scale: 1= Extremely Poor, 2= Below Average, 3=Average; 4= Above Average; 5= Excellent
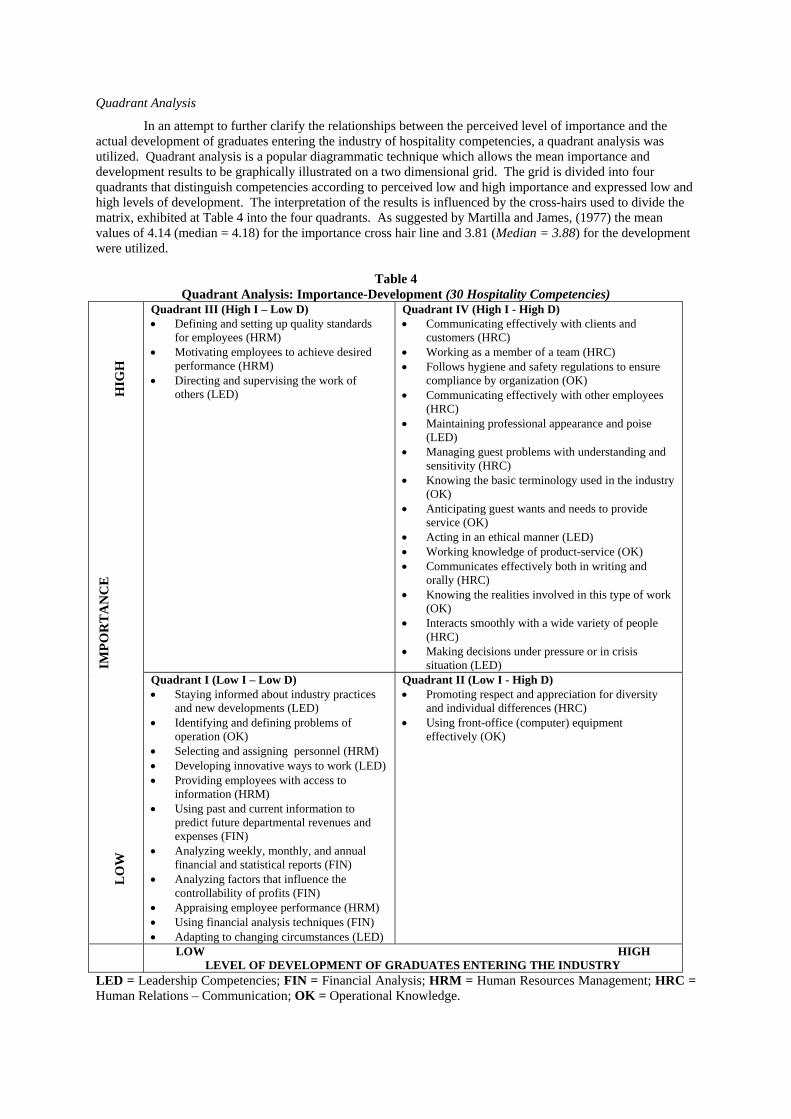
Quadrant Analysis
In an attempt to further clarify the relationships between the perceived level of importance and the actual development of graduates entering the industry of hospitality competencies, a quadrant analysis was utilized. Quadrant analysis is a popular diagrammatic technique which allows the mean importance and development results to be graphically illustrated on a two dimensional grid. The grid is divided into four quadrants that distinguish competencies according to perceived low and high importance and expressed low and high levels of development. The interpretation of the results is influenced by the cross-hairs used to divide the matrix, exhibited at Table 4 into the four quadrants. As suggested by Martilla and James, (1977) the mean values of 4.14 (median = 4.18) for the importance cross hair line and 3.81 (Median = 3.88) for the development were utilized.
Table 4
Quadrant Analysis: Importance-Development (30 Hospitality Competencies)
IMP
OR
TA
NC
E
LO
W
HIG
H
Quadrant III (High I – Low D) Defining and setting up quality standards
for employees (HRM) Motivating employees to achieve desired
performance (HRM) Directing and supervising the work of
others (LED)
Quadrant IV (High I - High D) Communicating effectively with clients and
customers (HRC) Working as a member of a team (HRC) Follows hygiene and safety regulations to ensure
compliance by organization (OK) Communicating effectively with other employees
(HRC) Maintaining professional appearance and poise
(LED) Managing guest problems with understanding and
sensitivity (HRC) Knowing the basic terminology used in the industry
(OK) Anticipating guest wants and needs to provide
service (OK) Acting in an ethical manner (LED) Working knowledge of product-service (OK) Communicates effectively both in writing and
orally (HRC) Knowing the realities involved in this type of work
(OK) Interacts smoothly with a wide variety of people
(HRC) Making decisions under pressure or in crisis
situation (LED) Quadrant I (Low I – Low D) Staying informed about industry practices
and new developments (LED) Identifying and defining problems of
operation (OK) Selecting and assigning personnel (HRM) Developing innovative ways to work (LED) Providing employees with access to
information (HRM) Using past and current information to
predict future departmental revenues and expenses (FIN)
Analyzing weekly, monthly, and annual financial and statistical reports (FIN)
Analyzing factors that influence the controllability of profits (FIN)
Appraising employee performance (HRM) Using financial analysis techniques (FIN) Adapting to changing circumstances (LED)
Quadrant II (Low I - High D) Promoting respect and appreciation for diversity
and individual differences (HRC) Using front-office (computer) equipment
effectively (OK)
LOW HIGH LEVEL OF DEVELOPMENT OF GRADUATES ENTERING THE INDUSTRY
LED = Leadership Competencies; FIN = Financial Analysis; HRM = Human Resources Management; HRC = Human Relations – Communication; OK = Operational Knowledge.
Quadrant I displays competencies that are perceived by the respondents as low in both importance and actual level of development. Based on the findings, quadrant one includes all four financial analysis competencies, three out of the seven leadership competencies, three human resources management competencies and only one operational knowledge competency. Quadrant II includes competencies that are perceived high in the actual level of development but are perceived low in terms of importance. “Promoting respect and appreciation for diversity and individual differences”, and “using front-office equipment effectively” are the only two competencies that fall into this category. The competencies of “defining and setting up quality standards for employees”, “motivating employees to achieve desired performance”, and “directing and supervising the work of others”, which fall into Quadrant III, require the immediate attention of stakeholders. These three competencies are perceived as important by the respondents however, their actual level of development is low. Finally, Quadrant IV includes fourteen competencies which are considered high in both importance and development. It is important to note that six out of the seven human relations/communication competencies, and five out of seven operational knowledge competencies are included in this category. Differences according to Demographic and other Characteristics
Finally, the study aimed to investigate whether there are any significant differences between the professionals’ competency perceptions of importance and actual development upon entering the industry according to variables such as age, gender, educational background, managerial level and functional/operational area. In order to address this, a number of independent sample t-tests and one-way Analysis of Variance (ANOVA) with post hoc multiple comparison tests (Tukey Honesty Significant Difference) were conducted. The primary results from the comparisons are:
Age: Differences in terms of importance were revealed in the competencies of human resources management (f=3.941; p= .009), human relations / communication (f=4.042; p= .008); financial analysis (f=3.155; p= .026), and leadership (f=7.324; p= .000). In all cases, respondents between 20 and 30 years of age attribute more importance compared to their older counterparts. In terms of the actual level of development, differences exist in all five competency categories. Similarly to the importance ratings, respondents between the ages of 20 to 30 attribute higher levels of actual development in all five categories.
Gender: One significant difference exists suggesting that men attribute more importance to human resources management competencies compared to women (t=3.321; p=.001). No differences were revealed amongst the respondents in terms of the actual level of development of graduates entering the industry.
Educational Background: In terms of importance, significant differences (p<0.05) were revealed in all five competency categories. Overall, respondents with higher academic qualifications attributed more importance to all five categories. Similarly, significant differences were also found in three out of the five competency categories in regards to actual development. Operational knowledge and leadership were revealed as the only categories without a difference.
Managerial Level: Significant differences in terms of importance were revealed in the competency categories of human relations / communication (f=4.950; p= .008), and financial analysis (f=3.165; p= .045). In regards to human relations / communication, respondents holding upper and middle level managerial positions attribute more importance, whereas in financial analysis, respondents holding entry level positions are the ones who attribute more importance. Moreover, differences in two categories, human relations / communication (f=4.576; p= .012) and operational knowledge (f=5.762; p= .004) were revealed in terms of actual development. In both cases differences exist between respondents holding mid-level managerial positions, who perceive a higher level of development, and their upper and lower level counterparts.
Functional / Operational Areas: Three differences exist amongst the respondents according to their operational area in the perceived level of importance of the five categories. In particular, differences exist in human relations / communication (f=5.548; p= .001), operational knowledge (f=3.451; p= .018) and financial analysis (f=6.047; p= .001). In terms of financial analysis, respondents working in the food and beverage division attributed significantly less importance to such competencies compared to their colleagues working in upper management, rooms, and other divisions. Finally, findings revealed no significant differences in terms of actual development in any of the five retained competency categories. The following section of the paper provides a brief discussion of the research findings, including the
likely implications of the findings for the industry’s major stakeholders.
DISCUSSION, IMPLICATIONS AND CONCLUSIONS This study set out to investigate the perceived importance level of hospitality competencies as
attributed by industry professionals in Cyprus. Adding to existing knowledge on hospitality competencies, the study highlights the importance professionals attribute on human relations / communication competencies, and operational knowledge. Moreover, findings of the study, in accordance to Zopiatis (2010) study, fail to reaffirm the notion suggested by numerous scholars (see for example Chung-Herrera et al., 2003; Kay and Moncarz, 2004) that generic management competencies, especially finance, have become more important at the expense of industry-technical knowledge. The fact that financial analysis competencies were ranked extremely low by the respondents is noteworthy.
Special attention should be given to the three competencies which are perceived as important by
industry professionals whereas their actual level of development of hospitality graduates entering the industry is low. Relevant to human resources and leadership, the three competencies should be viewed in relation to formal management development programs and other initiatives. Furthermore, it is important to realize that competencies such as the ability to motivate, direct and supervise others are extremely difficult to nurture in a purely theoretical and academic environment. Empirical engagement in the actual hospitality environment will most certainly enhance the competencies of newly hires towards such operational imperatives.
The study also revealed significant differences amongst the respondents according to demographic and
other characteristics. Interestingly, respondents between 20 and 30 years of age, all members of the newest generation of hospitality professionals, attribute more importance to all competency categories, except operational knowledge. Similarly, respondents with higher academic credentials attribute more importance to all five competency categories. Both findings may suggest a shift towards more westernized beliefs as to the necessity of generic management knowledge in reaching the top echelons of the profession.
These findings should be viewed with an element of caution, in terms of generalization, since they
depict the unique environment of the hospitality industry of Cyprus based on the views of a homogeneous – all full time hospitality managers - sample. Findings may be utilized to enhance the horizons of educators currently developing or delivering related courses, assist students in clarifying current industry demands, and aid hospitality professionals in providing competency-specific training programs, especially to their new hires. Moreover, educators should get the industry involved when it comes to developing or revising the academic curriculum. Academia’s reluctance to engage hospitality professionals in such a crucial function may result in programs incapable of satisfying even the fundamental needs of the industry.
Finally, new knowledge, which has ensued, may inspire academic scholars to further investigate this
topic in their respective professional environment from an array of different perspectives. It is suggested that scholars investigate competencies in relation to both personal (for example, career planning and development) and organizational success (for example, competencies in relation to cultural and management style differences). Finally, continuous vigilance by all stakeholders is crucial in defining, cultivating and promoting the “success” competencies of the hospitality professions in an era of unprecedented changes and uncertainty.
REFERENCES Beldona, S. & Cobanoglu, C. (2007). Importance-Performance analysis of guest technologies in the lodging
industry. Cornell Hotel and Restaurant Administration Quarterly, 48(3): 299–312. Boyatzis, R. (1982). The Competent Manager: A Model for Effective Performance. New York: John Wiley and
Sons. Christou, E. (2002). Revisiting competencies for hospitality management: Contemporary views of the
stakeholders. Journal of Hospitality & Tourism Education, 14(1): 25–32. Chung-Herrera, B.G., Enz, C.A. & Lankau, M.J. (2003). Grooming future hospitality leaders: A competencies
model. Cornell Hotel and Restaurant Administration Quarterly, 44(3): 17–25. Dimmock, K. (1999). Management style and competitive strategies among tourism firms in the Northern Rivers.
Tourism Management, 20(3): 323-339.
Dimmock, K., Breen, H. & Walo, M. (2003). Management Competencies: An Australian assessment of tourism and hospitality students. Journal of the Australian and New Zealand Academy of Management, 9(1): 12–26.
Hansson, B. (2001). Competency models: are self perceptions accurate enough? Journal of European Industrial
Training, 25(9): 428-441. Hu, M.L.M. (2010). Developing a core competency model of innovative culinary development. International
Journal of Hospitality Management, 29(4): 582-590. Jeou-Shyana, H, Hsuan, H., Chih-Hsing, L., Lin, L. & Chang-Yen, T. (2011). Competency analysis of top
managers in the Taiwanese hotel industry. International Journal of Hospitality Management 30(4): 1044–1054.
Katz, R.L. (1955). Skills of an effective administrator. Harvard Business Review, 33(1): 33-42. Kay, C. & Moncarz, E. (2004). Knowledge, skills, and abilities for lodging management success. Cornell Hotel
and Restaurant Quarterly, 45(3): 285-298. Kay, C. & Russette, J. (2000). Hospitality-management competencies: Identifying managers’ essential skills.
Cornell Hotel and Restaurant Administration Quarterly, 41(2): 52–63. Koenigsfeld, J.P., Perdue, J., Youn, H. & Woods, R.H. (2011). The changing face of competencies for club
managers. International Journal of Contemporary Hospitality Management, 23(7): 902-922. Martilla, J.A. & James, J.C. (1977). Importance-performance analysis. Journal of Marketing, 41(1): 77–79. Nolan, C., Conway, E., Farrell, T. & Monks, K. (2010). Competency needs in Irish hotels: employer and
graduate perspectives. Journal of European Industrial Training, 34(5): 432-454. Okeiyi, E., Finley, D. & Postel, R.T. (1994). Food and beverage management competencies: educators, industry
and student perspectives. Hospitality & Tourism Educator, 6(4): 37–40. Quinn, R., Faerman, S., Thompson, M. & McGrath, M. (1996). Becoming a Master Managers: A Competency
Framework, 2nd ed. New York: John Wiley and Sons. Raybould, M. & Wilkins, H. (2005). Over qualified and under experienced: Turning graduates into hospitality
managers. International Journal of Contemporary Hospitality Management, 17(3): 203-216. Sandwith, P. (1993). A hierarchy of management training requirements: the competency model. Public
Personnel Management, 22(1): 43–62. Spencer, L. & Spencer, S. (1993). Competence at Work: Models for Superior Performance. New York: John
Wiley & Sons, Inc. Tas, F.R., LaBrecque, V.S. & Clayton, R.H. (1996). Property-management competencies for management
trainees. Cornell Hotel and Restaurant Administration Quarterly, 37(4): 90–96. Tas, R.F. (1988). Teaching future managers. Cornell Hotel & Restaurant Administration Quarterly, 29(2): 41-
43. Testa, M.R. & Sipe, L. (2011). Service-leadership competencies for hospitality and tourism management.
International Journal of Hospitality Management, doi:10.1016/j.ijhm.2011.08.009 (Article in Press). Walo, M. (2001). Assessing the contribution of internship in developing Australian tourism and hospitality
students’ management competencies. Asia-Pacific Journal of Cooperative Education, 2(1): 12-28. Zopiatis, A. (2010). Is it art or science? Chef’s competencies for success. International Journal of Hospitality
Management, 29(3): 459-467.
Managing Human Resources in Hospitality. The Importance of Having Committed Employees.
Ana Machado Sampaio*
ISMAI - CEDTUR, Portugal, [email protected]
Av. Carlos Oliveira Campos, 4470-690 S. Pedro de Avioso, Portugal
Ángeles Lopez Cabarcos Universidad de Santiago de Compostela, España,
ABSTRACT Organizational commitment is an attitude, an orientation towards organizations that connects
or attracts a person identity to the organization. It is a psychological attachment that contributes positively to the overall performance of the organization. The main goal of this investigation is to study organizational commitment in hospitality employees, and organizational justice as predictor and organizational citizenship behaviors as result of it. Through structural equations, it was possible to conclude that organizational justice is related to all three components of organizational commitment, and organizational citizenship behavior results only from affective and continuance commitment. This study shows that if employees feel they are being treated fairly they will commit and part of this commitment will contribute to the development of voluntary behaviors for the benefit of their organization.
Key-words: organizational commitment, organizational justice, organizational citizenship behaviours, hospitality industry.
LITERATURE REVIEW
Organizational commitment is the strength of identification between an individual and the organization (Lee, 1971) and in a competitive environment as today, having individuals that identify and dedicate themselves to the organization is very important (Tansky, Gallagher, and Wetzel 1997). It is a way of being that leads all individuals to act coherently with their beliefs and their involvement with the organization (Mathieu & Zajac, 1990; Meyer & Allen, 1997; Porter, Steers, Mowday, & Boulian, 1974). This psychological link can assume different intensities contributing to the behavioural orientation of the individuals, especially when expectations and quality conditions are not met or do not work (McNeese-Smith, 1996). A committed employee is willing to exert a considerable effort on behalf of the organization and desires to maintain organizational membership (Porter et al., 1974).
With research, organizational commitment was recognized as being a multidimensional
variable (Angle & Perry, 1981; Dunham, Grube, & Castenada, 1994; Mathieu & Zajac, 1990), allowing us to talk about different types of organizational commitment. Meyer & Allen (1984; 1991; 1997) identified and defined affective, continuance and normative commitment. Affective commitment concerns the emotional connection, identification and involvement of the individual with the organization (Mowday, Porter, & Steers, 1982). Continuance commitment is related to the individual’s perception of the existent costs in leaving the organization (Meyer & Allen, 1991; Meyer, Allen, & Gellatly, 1990). Normative commitment is a feeling of duty to the organization, based in norms and personal values (Meyer & Allen, 1997; Meyer & Allen, 1997) It is based on an opinion, a moral obligation of remaining in the organization (Wiener, 1982) and has the tendency to develop when a worker internalizes the organizations’ norms through socialization, receiving the benefits that lead to act reciprocally or to establish a loyalty contract with the organization (Rego, Pina e Cunha, & Souto, 2007). All types of commitment are important but for managers employees affectively committed are the more desirable, since they stay in the organization because they really want (Cha, Cichy, & Kim, 2011; Meyer, Allen, & Smith, 1993). Organizational commitment has been related with: employee behaviors and performance effectiveness; attitudinal, affective and cognitive constructs; characteristics of the employee’s role; and employee’s personal characteristics (Angle & Perry, 1981; Bateman & Strasser, 1984; Porter et al., 1974).
Organizational justice cares about the description and explanation of justice in the workplace
as essential for an efficient functioning of the organizations and for the satisfaction of its members
(Greenberg, 1990). It refers to the study of individuals’ perceptions in an organization (Greenberg, 1987) about the received treatment and their behavioural reaction to these perceptions (Lam, Schaubroeck, & Aryee, 2002). Initially, only two main sources of organizational justice were identified: procedural and distributive justice (Moideenkutty, Blau, Kumar, & Nalakath, 2001; Rego, 2000a). Later, a third component grew in importance, namely interactional justice. Procedural justice cares about the process, about the justice of the means used to reach the ends (Lind & Tyler, 1988; Thibaut & Walker, 1975). It is related with the justice inherent to the decisions that affect employees (Trevor & Nyberg, 2008). The distributive component corresponds to the perceived justice about the amount of compensations that workers receive comparatively to their contributions (Yoon & Thye, 2002). Derived from procedural justice, interactional justice analyses the consideration taken by peoples’ rights, respect for individual dignity or a honest and true relationship among workers, the adequate explanation about the decisions taken (taking into account other peoples’ opinion) and assessments based on accurate and impartial information (Rego, 2000b).
Several authors have studied the influence of organizational justice on organizational
commitment and in its types, trying to collect evidences that lead, in a neutral context, the employee to reinforce his organizational commitment (Colquitt, Conlon, Wesson, Porter, & Ng, 2001; Jamaludin, 2011; Leventhal, 1980; Lowe & Vodanovich, 1995; Restubog, Bordia, & Bordia, 2009). Employees that feel they are being treated with justice have found to be more dedicated and having more emotional delivery towards the organization (Goleman, 1998). According to the literature review, for this study, the following hypotheses were proposed: H1: Organizational justice relates in a positive way with the workers’ affective commitment; H2: Organizational justice relates in a positive way with the workers’ normative commitment; H3: Organizational justice relates in a positive way with the workers’ continuance commitment.
Organizational citizenship behaviors (OCB) are voluntary behaviors not recognized by the
organizational formal reward systems (Chegini, 2009; Organ, 1988). These behaviors, which are discretionary because they go beyond what is formally defined by the organization, promote more efficiency and a better global performance. It is a type of extra-work behavior (punctuality, good and positive presence and attitude, volunteering or helping others) that its presence cannot be enforced and absence penalized (Organ, 1988, 1997). Several conceptually different dimensions of OCB were identified. In their investigation, for example, Van Dyne, Graham, & Dienesch (1994), based on the dimensions found by Graham & Keely (1992) - obedience, organizational loyalty and organization participation-, developed an OCB measure where three forms of participation were found: social, protection and functional (Graham & Keely, 1992; Van Dyne, Graham, & Dienesch, 1994). But as Podsakoff, Ahearne, & MacKenzie (1997) mentioned, managers and researchers still have many difficulties in distinguishing these concepts and agreeing with a core body of dimensions. So, in most part of the studies OCB analyzed as whole.
OCB have been growing in interest as possible results of organizational commitment (Cho,
Johanson, & Guchait, 2009; Johnson & Chang, 2006; Lavelle et al., 2008). According to the literature review, for this study, the following hypotheses were proposed: H4: Affective commitment relates positively with organizational citizenship behaviours; H5: Normative commitment relates positively with organizational citizenship behaviours; H6: Continuance commitment relates positively with organizational citizenship behaviours.
Finally, some authors have found that organizational justice relates positively with OCB
(Fassina, Jones, & Uggerslev, 2008; Hemdi & Nasurdin, 2007; Kim, Ok, & Lee, 2009; Leung, Wang, & Smith, 2001; Moorman, 1991; Nadiri & Tanova, 2010; Wu & Wang, 2008; Zhang & Agarwai, 2009), being its antecedent, so a new hypothesis was proposed, H7: Organizational justice relates positively with OCB.
METHODOLOGY
Participants The population target of study is constituted by 1,995 workers from 47 hotels in northern
Portugal. With several purposes the portuguese government divided the country in seven regions and adopted the Nomenclature of Territorial Units for Statistics (NUTS II). The North is one of the seven regions and was chosen due to its representativeness in tourism sector: not being the largest, it has been a good sample of the country tourism results and behaviors. The requirements were that all hotels had
been rated with four or five stars and had been working for more than a year, since the goal of the study made indispensable the existence of a certain specialization in hospitality management, probably absent from lower category hotels or with less experience /antiquity in market.
Once selected the study population, it was calculated the sample through statistical procedures for finite samples (e=±5%; p=q=0.5; level of confidence = 95%). The process of data collection started in August 2008 and ended in December 2008, obtaining a total of 325 valid questionnaires (162 women and 163 men; 37.7 years on average; 69.8% with non universitary studies; 61% with temporary contract; 7 years of antiquity on average; 82% work in medium size companies).
Procedure After an extensive data search with all the institutions related to the tourism sector and the
portuguese hospitality industry (National Statistic Institute – INE and Portugal Tourism Institute – ITP, Portuguese Association of Hotel Directors - ADHP), a list with all four and five hotels of the northern region was constructed. Every hotel manager was contacted by letter and by email with a presentation of the study and requesting their cooperation. The questionnaire was available online and by paper to all hotel employees. The collection of the questionnaires was made by the research group or by the hotel managers. The data and the hypotheses were analyzed by Structural Equation Modelling (SEM) with AMOS 16 and SPSS 16.0. By using SEM we can test statistically in a simultaneous analysis the whole system of variables to determine the extend to which it is consistent with the data. This technique also allows to incorporate unobserved and observed variables.
Instruments Three different concepts were analyzed – organizational justice (OJ), organizational
commitment (OC) and OCB – and the scales used had been already highly used and had good results in terms of reliability and validity in other Portuguese studies.
Organizational justice was measured with a scale based on the work of Moorman (1991) and
Colquitt (2001) and adapted to Portugal by Rego (2000b). Rego based on bibliography and 57 exploratory interviews with persons from different industries and in different positions, developed 17 items used as a whole related to three basic concepts: distributive justice, interactional justice and procedural justice. Examples of included items are: “In general, the rewards I get are fair”, “My superior shows genuine interest in me”. All items were measured with a Likert scale ranging from 1 (completely false) to 6 (completely true) points.
OCB was measured with a scale developed by Rego (1999) for portuguese organizations
based on Borman & Motowidlo (1993) scale. In total, there were 20 items used as a whole related to four concepts: team spirit, conscientiousness (obedience behaviours and resources protection), spirit of initiative / proactivity and organizational identification / loyalty. Examples of included items are: “When something doesn’t work, I try alternatives that work”, “ I share my knowledge and experience with other organizational members”, “ I encourage friends and family to use the products or services of the organization”. All items were measured with a Likert scale ranging from 1 (It doesn’t apply at all) to 6 (It applies completely).
Organizational commitment was measured with a scale developed from Meyer & Allen
(1997) and adapted to Portugal by Rego (2002b). In this study 14 items analyzed the three components of organizational commitment: affective commitment (AC) – 5 items, normative commitment (NC) – 4 items and continuance commitment (CC) – 5 items. Some of the items included are: “I really care about the future of my organization” (affective commitment); “I feel in dept with my organization” (normative commitment); “I feel I have few opportunities if I leave the organizational” (continuance commitment). All items were evaluated through a Likert scale ranging from 1 (The statement does not apply to me) to 7 (The statement applies completely to me) points.
RESULTS Before analyzing the hypotheses, a study of the psychometric properties of the scales was
performed. Concerning organizational commitment scale, the first step consisted in analyzing the reliability of the scale through Cronbach’s α analysis. The results indicated that three organizational commitment dimensions presented minimum recommend levels of reliability (Hair, Anderson, Tatham, & Black, 1999), not being necessary to eliminate any item – affective commitment (α=0.839), normative commitment (α=0.853) and continuance commitment (α=0.922).
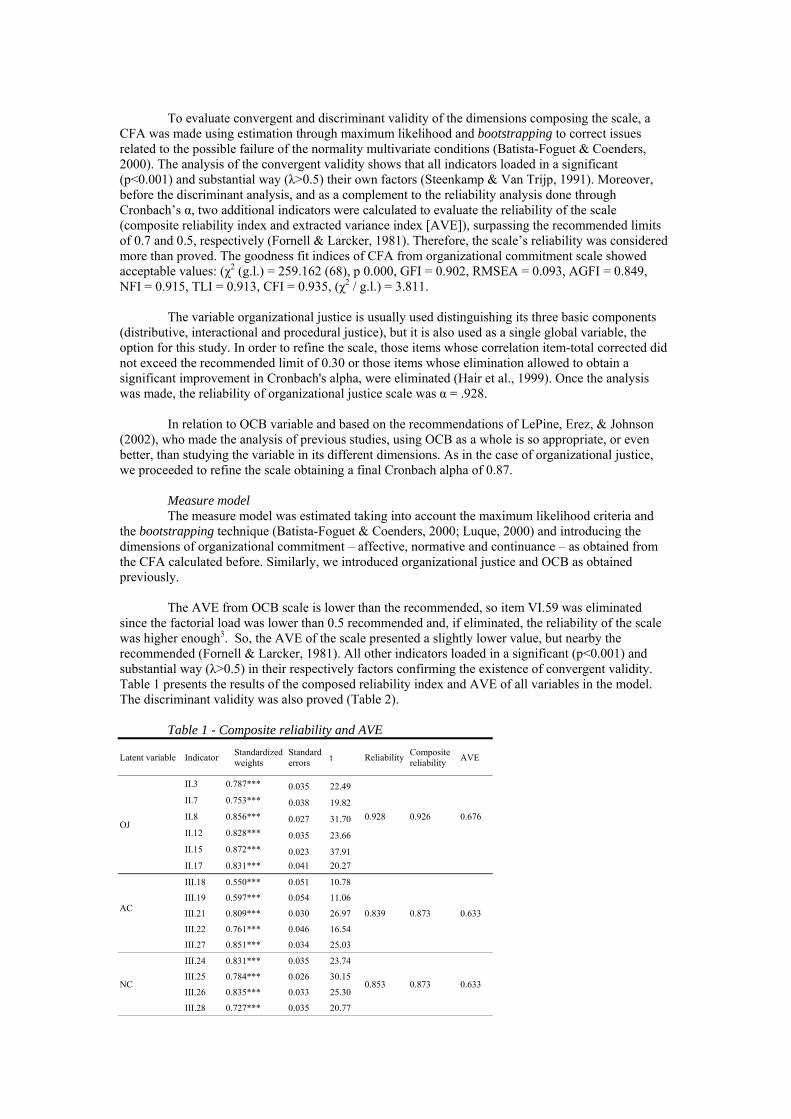
To evaluate convergent and discriminant validity of the dimensions composing the scale, a
CFA was made using estimation through maximum likelihood and bootstrapping to correct issues related to the possible failure of the normality multivariate conditions (Batista-Foguet & Coenders, 2000). The analysis of the convergent validity shows that all indicators loaded in a significant (p<0.001) and substantial way (λ>0.5) their own factors (Steenkamp & Van Trijp, 1991). Moreover, before the discriminant analysis, and as a complement to the reliability analysis done through Cronbach’s α, two additional indicators were calculated to evaluate the reliability of the scale (composite reliability index and extracted variance index [AVE]), surpassing the recommended limits of 0.7 and 0.5, respectively (Fornell & Larcker, 1981). Therefore, the scale’s reliability was considered more than proved. The goodness fit indices of CFA from organizational commitment scale showed acceptable values: (χ2 (g.l.) = 259.162 (68), p 0.000, GFI = 0.902, RMSEA = 0.093, AGFI = 0.849, NFI = 0.915, TLI = 0.913, CFI = 0.935, (χ2 / g.l.) = 3.811.
The variable organizational justice is usually used distinguishing its three basic components
(distributive, interactional and procedural justice), but it is also used as a single global variable, the option for this study. In order to refine the scale, those items whose correlation item-total corrected did not exceed the recommended limit of 0.30 or those items whose elimination allowed to obtain a significant improvement in Cronbach's alpha, were eliminated (Hair et al., 1999). Once the analysis was made, the reliability of organizational justice scale was α = .928.
In relation to OCB variable and based on the recommendations of LePine, Erez, & Johnson
(2002), who made the analysis of previous studies, using OCB as a whole is so appropriate, or even better, than studying the variable in its different dimensions. As in the case of organizational justice, we proceeded to refine the scale obtaining a final Cronbach alpha of 0.87.
Measure model The measure model was estimated taking into account the maximum likelihood criteria and
the bootstrapping technique (Batista-Foguet & Coenders, 2000; Luque, 2000) and introducing the dimensions of organizational commitment – affective, normative and continuance – as obtained from the CFA calculated before. Similarly, we introduced organizational justice and OCB as obtained previously.
The AVE from OCB scale is lower than the recommended, so item VI.59 was eliminated
since the factorial load was lower than 0.5 recommended and, if eliminated, the reliability of the scale was higher enough3. So, the AVE of the scale presented a slightly lower value, but nearby the recommended (Fornell & Larcker, 1981). All other indicators loaded in a significant (p<0.001) and substantial way (λ>0.5) in their respectively factors confirming the existence of convergent validity. Table 1 presents the results of the composed reliability index and AVE of all variables in the model. The discriminant validity was also proved (Table 2).
Table 1 - Composite reliability and AVE
Latent variable Indicator Standardized weights
Standard errors
t ReliabilityComposite reliability
AVE
OJ
II.3 0.787*** 0.035 22.49
0.928 0.926 0.676
II.7 0.753*** 0.038 19.82
II.8 0.856*** 0.027 31.70
II.12 0.828*** 0.035 23.66
II.15 0.872*** 0.023 37.91
II.17 0.831*** 0.041 20.27
AC
III.18 0.550*** 0.051 10.78
0.839 0.873 0.633
III.19 0.597*** 0.054 11.06
III.21 0.809*** 0.030 26.97
III.22 0.761*** 0.046 16.54
III.27 0.851*** 0.034 25.03
NC
III.24 0.831*** 0.035 23.74
0.853 0.873 0.633 III.25 0.784*** 0.026 30.15
III.26 0.835*** 0.033 25.30
III.28 0.727*** 0.035 20.77
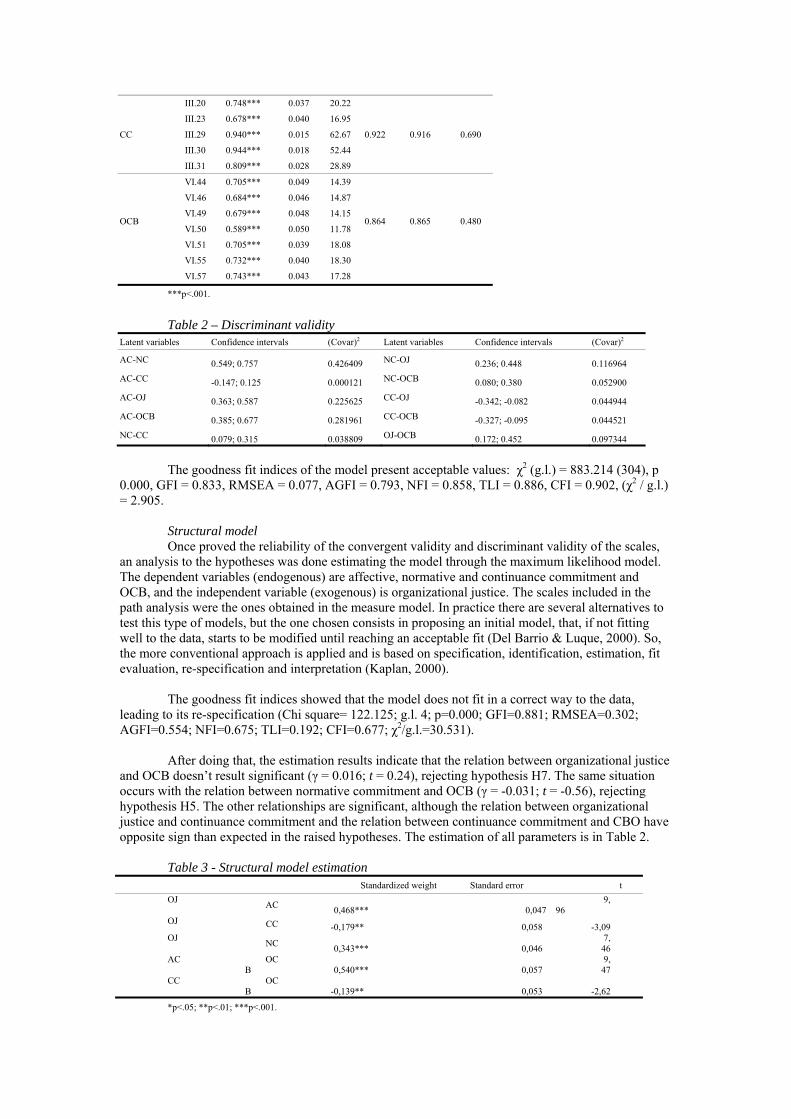
CC
III.20 0.748*** 0.037 20.22
0.922 0.916 0.690
III.23 0.678*** 0.040 16.95
III.29 0.940*** 0.015 62.67
III.30 0.944*** 0.018 52.44
III.31 0.809*** 0.028 28.89
OCB
VI.44 0.705*** 0.049 14.39
0.864 0.865 0.480
VI.46 0.684*** 0.046 14.87
VI.49 0.679*** 0.048 14.15
VI.50 0.589*** 0.050 11.78
VI.51 0.705*** 0.039 18.08
VI.55 0.732*** 0.040 18.30
VI.57 0.743*** 0.043 17.28
***p<.001.
Table 2 – Discriminant validity
Latent variables Confidence intervals (Covar)2 Latent variables Confidence intervals (Covar)2
AC-NC 0.549; 0.757 0.426409 NC-OJ 0.236; 0.448 0.116964
AC-CC -0.147; 0.125 0.000121 NC-OCB 0.080; 0.380 0.052900
AC-OJ 0.363; 0.587 0.225625 CC-OJ -0.342; -0.082 0.044944
AC-OCB 0.385; 0.677 0.281961 CC-OCB -0.327; -0.095 0.044521
NC-CC 0.079; 0.315 0.038809 OJ-OCB 0.172; 0.452 0.097344
The goodness fit indices of the model present acceptable values: χ2 (g.l.) = 883.214 (304), p
0.000, GFI = 0.833, RMSEA = 0.077, AGFI = 0.793, NFI = 0.858, TLI = 0.886, CFI = 0.902, (χ2 / g.l.) = 2.905.
Structural model Once proved the reliability of the convergent validity and discriminant validity of the scales,
an analysis to the hypotheses was done estimating the model through the maximum likelihood model. The dependent variables (endogenous) are affective, normative and continuance commitment and OCB, and the independent variable (exogenous) is organizational justice. The scales included in the path analysis were the ones obtained in the measure model. In practice there are several alternatives to test this type of models, but the one chosen consists in proposing an initial model, that, if not fitting well to the data, starts to be modified until reaching an acceptable fit (Del Barrio & Luque, 2000). So, the more conventional approach is applied and is based on specification, identification, estimation, fit evaluation, re-specification and interpretation (Kaplan, 2000).
The goodness fit indices showed that the model does not fit in a correct way to the data,
leading to its re-specification (Chi square= 122.125; g.l. 4; p=0.000; GFI=0.881; RMSEA=0.302; AGFI=0.554; NFI=0.675; TLI=0.192; CFI=0.677; χ2/g.l.=30.531).
After doing that, the estimation results indicate that the relation between organizational justice
and OCB doesn’t result significant (γ = 0.016; t = 0.24), rejecting hypothesis H7. The same situation occurs with the relation between normative commitment and OCB (γ = -0.031; t = -0.56), rejecting hypothesis H5. The other relationships are significant, although the relation between organizational justice and continuance commitment and the relation between continuance commitment and CBO have opposite sign than expected in the raised hypotheses. The estimation of all parameters is in Table 2.
Table 3 - Structural model estimation
Standardized weight Standard error t
OJ AC
0,468*** 0,0479,
96 OJ CC -0,179** 0,058 -3,09 OJ
NC 0,343*** 0,046
7,46
AC OCB 0,540*** 0,057
9,47
CC OCB -0,139** 0,053 -2,62
*p<.05; **p<.01; ***p<.001.
The results indicate that organizational justice explains 22.1% of affective commitment,
12.0% of normative commitment and 3.5 % of calculate commitment of hospitality workers in northern Portugal. Additionally, affective and calculate commitment explain 33.0% of organizational citizenship behaviours.
Concerning the model fit, despite Chi square value continues to be significant, it’s necessary
to take into account that sample sizes bigger than 200 have the tendency to penalize the model fit, converting it into an unreliable indicator (James, Mulaik, & Brett, 1982). All fit indexes are inside the established boundaries: χ2 (g.l.) = 2.555 (3), p 0.000; GFI = 0.997; RMSEA = 0; AGFI = 0.984; NFI = 0.993; TLI = 1; CFI = 1; (χ2 / g.l.) = 0.120. R2 of each endogenous variable is: R2 (CC) = 0.035, R2
(CA) = 0.221, R2 (CBO) = 0.330, R2 (CN) = 0.120.
DISCUSSION Affective commitment and normative commitment showed to be related with organizational
justice, so the hypotheses H1 and H2 from the proposed model were proved. The relationship between continuance commitment and organizational justice showed to be significant, although with the opposite sign than expected in the raised hypotheses, so H3 was not proved. It is possible to assume that organizational justice is a good predictor of affective, normative and continuance commitment, as several other authors have proved before (Chai-Amonphaisal & Ussahawanitchakit, 2008; Hendrix, Robbins, Miller, & Summers, 1998; Hopkins & Weathington, 2006; Meyer et al., 1993). The reason for the lack of positive relationship between continuance commitment and organizational justice can, in this case, be justified by the sample characteristics. In Portuguese hospitality industry people have low levels of training, high turnover rates and very discrepant wages, so their perception of organizational justice is not probably the variable that more contributes to the feeling of having to commit towards the organization due to the lack of alternatives.
According to Blau (1964) and the principle of reciprocity, people react and interact with the
organizations that benefit them. When workers realize that they are receiving positive actions from the organizations, they relate more intensively and feel the duty of answering with the same type of committed behavior. For Greenberg (1996) people behave in an altruistic way to the organization if they believe they are being treated fairly and will continue in the future. In terms of practice, managers who search to promote and maintain a fair environment can expect to have committed employees and by that waves of good feelings inside the organization, dedication, search for perfection and also creation of role models that other workers tend to imitate. This reality is positive for the organization in many different ways, for example the clients’ perceptions of the service.
OCB are crucial to efficiency and efficacy, innovation, performance and the flexibility needed
in organizations (Organ, 1988; Pierce, Gardner, Cummings, & Dunham, 1989; Walz & Niehoff, 2000). Some researchers have also proved the relation between organizational commitment and OCB (Morrison, 1994; O’Reilly & Chatman, 1986; Organ & Ryan, 1995). Specifically, there is empirical evidence that affective commitment is a good predictor of OCB (Gautam, Dick, Wagner, Upadhyay, & Davis, 2005). The more they feel connected with the organization (for example, because they feel they are being treated with justice), more behaviors in favor of the organization they will show. On the other hand, when employees feel they have no other job alternatives beyond the organization, they tend to develop more OCB as a security mechanism: they work late without expecting rewards, they help colleagues or they behave in benefit of the organization (McFarlin & Sweeney, 1992). According to the literature, the hypothesis H4 was proved. The hypothesis H5 from the proposed model could not be proved, since the relationship between normative commitment, namely, the sense of moral duty to stay in the organization and OCB could not be tested. In the same way, the relationship between continuance commitment and OCB showed to be significant, although with the opposite sign than expected in the raised hypotheses, so H6 was not proved. The reason to justify this is again related with the characteristics of the people in the sample, which show low levels of training and high turnover rates. This explains that only those who develop bonds of affective commitment are willing to carry out OCB. Other reason can be related to the difficulty that still exists in differentiating what is and is not a discretionary behavior.
The final hypothesis of the model was the relation between organizational justice and OCB.
The empirical study proved that organizational justice wasn’t related with this type of behaviors: H7
could not be proved. Managers can not expect the employees to go beyond was is a functional obligation just because they are being treated with justice. They will do what is in their competence but to go further, more emotional bonds have to be promoted.In literature the results have been very different. Moorman et al. (1993) in a study conducted with television workers could not test the relation between the two variables, however other authors found some positive, although weak, results, since not all the components of organizational justice were related to OCB (Moorman, 1991). As mentioned in literature review, OCB are more susceptible to be the influenced by attitudes (organizational commitment or job satisfaction) than by perceptions (organizational justice). Tansky (1993) concluded that justice perceptions had overall influence in job satisfaction and in organizational commitment but didn’t have a direct impact in OCB (Podsakoff & MacKenzie, 1993). The effects of the first variable over the second were moderated by job satisfaction. According to Organ (1994) this relation could get stronger if moderating variables were included, since people can react differently to situations of (in)justice. One of these moderators proposed in the literature is personality characteristics (Rego, 2002).
CONCLUSIONS
The importance of the tourism activity to the nations has been gorwing and htis is possible to understabd by the number of studies appearing concerning different variables. Although starting more with financial and economic concerns, managers now recognize that the study of human resources is equally or even more important. Hospitality industry is continuously modifying and is highly competitive – the differentiation is more and more difficult. In a service context, with the intabgility and heterogeneity, having human resources committed and feeling they are being treated fairly can lead to positive behaviors on behalf of the organization that in turn will contribute to a better global performance, reaching the desiring differentiation and loyalty. Employees are more capable of managing promptly and willingness the processes involved. With this research it was possible to prove that employees that feel they receive the right amount of rewards, that the procedures of defining these rewards and the relationship established with managers is fair, influences their connection and their feeling of duty and gratitude towards the organization. Affective commitment plays an important role in influencing extra-role behaviors that benefit the organizationa, from the employees. With the emotional connection established between organizaton and employees, altruistic behaviors can occur and benefit the first. Portuguese hospitality employees have specific characteristics that didn’t allow to prove any other relationship.
LIMITATIONS
This study has some limitations. The principal one is that this research has used data collected from a single-sitting self-report measure, so the dependent and independent variables have been informed by the same person and at the same time. This causes a bias associated with the measurement method (Campbell & Fiske, 1959). To avoid this common problem in social studies, several procedures have been carried out to minimize the effects of this problem and assess its scope. Firstly, we used validated and tested scales in other studies previously in order to eliminate a potential ambiguity of the items (Podsakoff & MacKenzie, 1993). Secondly, managers of the hotels told the participants of the study that their responses would be treated anonymously so they should answer them honestly, but some can still doubt. Thirdly, the dependent variables of the study were located after the independent ones, avoiding or minimizing the influence of consistency artifacts (Salancik & Pfeffer, 1977). According to Podsakoff and colleagues, these procedures should reduce the feeling of the participants to be evaluated, making less probably they answer based on the perception of the desires (or research aims) of the interviewer. Finally, we used the test by a factor of Harman (1967) to estimate the bias of common method variance. If there is a common variance in the data, the solution non-rotated of a exploratory factor analysis with all the variables of the study (51) reflects the existence of a single factor that explains most of the variance (Christmann, 2000). The results of this factor analysis revealed the existence of ten factors with eigenvalues greater than one, that explain 70.5% of the total variance, being the explained variance by the first factor of 25,4%. These results show that the bias associated with common method variance is a problem not too relevant in this work.
Facts to take into account for future lines of investigation are to considerer some variables as
possible moderators and conduct the same study in other regions in order to compare results.
REFERENCES
Angle, H., & Perry, J. (1981). An Empirical Assessment of Organizational Commitment and
Organizational Effectiveness. Administrative Science Quarterly, 26(1), 1-14. Bateman, T. S., & Strasser, S. (1984). A Longitudinal Analysis of the Antecedents of Organizational
Commitment. Academy of Management Journal, 27(1), 95-112. Batista-Foguet, J. M., & Coenders, G. (Eds.). (2000). Modelo de Ecuaciones Estructurales (Structural
Equation Models). Madrid. Blau, P. M. (1964). Exchange and Power in Social Life. New York: Wiley. Campbell, D. T., & Fiske, D. W. (1959). Convergent and Discriminant Validation by the Multitrait-
Multimethod Matrix. Psychological Bulletin, 56(2), 81-105. Cha, J., Cichy, R. F., & Kim, S. (2011). Commitment and Volunteer-Related Outcomes Among Private
Club Board and Committee Momber Volunteer Leaders. Journal of Hospitality & Tourism Research, 35(3), 308-333.
Chai-Amonphaisal, K., & Ussahawanitchakit, P. (2008). Model of the Relationship Among Human Resources Pratices, Organizational Climate, Organizational Justice, Affective Commitment and Job Performance. Review of Business Research, 8(2), 47-58.
Chegini, M. G. (2009). The Relationship Between Organizational Justice and Organizational Citizenship Behavior. American Journal of Economics and Business Administration, 1(2), 171-174.
Cho, S., Johanson, M. M., & Guchait, P. (2009). Employees Intent to Leave: A Comparison of Determinants of Intent to Leave versus Intent to Stay. International Journal of Hospitality Management, 3(374-381).
Christmann, P. (2000). Effects of "Best Practices" of Environmental Management on Cost Advantage: The Role of Complementary Assets. Academy of Management Journal, 43(4), 663-680.
Colquitt, J. A., Conlon, D. E., Wesson, M. J., Porter, C. O. L. H., & Ng, K. Y. (2001). Justice at the Millennium: A Meta-Analytic Review of 25 Years of Organizational Justice Research. Journal of Applied Psychology, 86(3), 425-445.
Del Barrio, S., & Luque, T. (2000). El Análisis de Ecuaciones Estructurakes. In Pirámide (Ed.), Técnicas de Análisis de Datos en Investigación de Mercados. Madrid.
Dunham, R. B., Grube, J. A., & Castenada, M. B. (1994). Organizational Commitment: The Utility of an Integrative Definition. Journal of Apllied Psychology, 79(3), 370-380.
Fassina, N. E., Jones, D. A., & Uggerslev, K. L. (2008). Meta-Analitic Tests of Relationships Between Organizational Justice and Citizenship Behavior: Testing Agent-System and Shared-Variance Models. Journal of Organizational Behavior, 29(6), 805-828.
Fornell, C., & Larcker, D. (1981). Structural Equation Models with Unobservable Variables and Measurement Error. Journal of Marketing Research, 18(1), 39-50.
Gautam, T., Dick, R. V., Wagner, U., Upadhyay, N., & Davis, A. J. (2005). Organizational Citizenship Behavior and Organizational Commitment in Nepal. Asian Journal of Social Psychology, 8(3), 305-314.
Goleman, D. (1998). Working with Emotional Intelligence. New York: Bantam Books. Graham, J. W., & Keely, M. (1992). Hirschman's Loyalty Construct. Employee Responsabilities and
Rights Journal, 5(3). Greenberg, J. (1987). A Taxonomy of Organizational Justice Theories. Academy of Management
Review, 12(1), 9-22. Greenberg, J. (1990). Organizational Justice: Yesterday, Today and Tomorrow. Journal of
Management, 16, 399-432. Hair, J. F., Anderson, R. E., Tatham, R. L., & Black, W. C. (1999). Multivariate Analysis. New York. Harman, H. H. (1967). Modern Factor Analysis. Chicago: University of Chicago Press. Hemdi, M. A., & Nasurdin, A. M. (2007). Investigating the Influence of Organizational Justice on
Hotel Employees' Organizational Citizenship Behavior Intentions and Turnover. Journal of Human Resources in Hospitality & Tourism, 7(1), 1-23.
Hendrix, W. H., Robbins, T., Miller, J., & Summers, T. P. (1998). Effects of Procedural and Distributive Justice on Factors Predictive of Turnover. Journal of Social Behavior and Personality, 13(4), 611-632.
Hopkins, S. M., & Weathington, B. L. (2006). The Relationships between Justice Perceptions, Trust and Employee Attitudes in a Downsized Organizational. The Journal of Psychology, 140(5), 477-498.
Jamaludin, Z. (2011). Developing a "Though to Copy" Competative Advantage (Organizational Commitment) through Perceived Organizational Justice. Journal of Global Management, 1(1), 57-70.
James, L. R., Mulaik, S. A., & Brett, J. M. (1982). Causal Analysis: Assumptions, Models and Data. Johnson, R. E., & Chang, C.-H. (2006). "I" is to Continuance as "We" is to Affective: The Relevance
of the Self-concept for Organizational Commitment. Journal of Organizational Behavior, 27(549-570).
Kaplan, D. (2000). Structural Equation Modeling: Foundations and Extensions. In SAGE (Ed.), Advanced Quantitative Techniques in the Social Sciences series (Vol. 10).
Kim, W., Ok, C., & Lee, M. J. (2009). Antecedents of Service Employees' Organizational Citizenship Behaviors in Full-Service Restaurants in Korea. Cornell Hospitality Quarterly, 50(2), 180-197.
Lam, S. S. K., Schaubroeck, J., & Aryee, S. (2002). Relationship Between Organizational Justice and Employee Work Outcomes: A Cross-National Study. Journal of Organizational Behavior, 23(1), 1-18.
Lavelle, J. J., Brockener, J., Konovsky, M. A., Price, K. H., Henley, A. B., Taneja, A., et al. (2008). Commitment, Procedural Fairness and Organizational Citizenship Behavior: A Multifoci Analysis. Journal of Organizational Behavior.
Lee, S. M. (1971). An Empirical Analysis of Organizational Identification. Academy of Management Journal, 14(2), 213-226.
LePine, J. A., Erez, A., & Johnson, D. E. (2002). The Nature and Dimensionality of Organizational Citizenship Behavior: A Critical Review and Meta-Analysis. Journal of Applied Psychology, 87, 52-65.
Leung, K., Wang, Z., & Smith, P. B. (2001). Job Attitudes and Organizational Justice in Joint Venture Hotels in China: The Role of Expatriate Managers. The International Journal of Human Resource Management, 12(6), 926-945.
Leventhal, G. S. (1980). What should be done with Equity Theory? New Approaches to the Study of Fairness in Social Relationships. In K.Gergen, M.Greenberg & R.Willis (Eds.), Social Exchange: Advances in Theory and Research (pp. 27-55). New York: Plenum Press.
Lind, E. A., & Tyler, T. (1988). The Social Psychology of Procedural Justice. New York: Plenum. Lowe, R. H., & Vodanovich, S. J. (1995). A Field Study of Distributive and Procedural Justice as
Predictors of Satisfaction and Organizational Commitment Journal of Business and Psychology, 10(1), 99-114.
Luque, T. (2000). Técnicas de Análisis de Datos en Investigación de Mercadis. Madrid. Mathieu, J. E., & Zajac, J. M. (1990). A Review and Meta-Analysis of Antecedents, Correlates and
Consequences of Organizational Commitment. Psychological Bulletin, 108(2), 171-194 McFarlin, D. B., & Sweeney, P. D. (1992). Distributive and Procedural Justice as Predictors of
Satisfaction with Personal and Organizational Outcomes. Academy of Management Journal, 35(3), 626-637.
McNeese-Smith, D. K. (1996). Increasing Employee Productivity, Job Satisfaction, and Organizational Commitment. Hospital & Health Services Administration, 41(2), 160-175.
Meyer, J. P., & Allen, N. J. (1984). Testing the "Side-Bet Theory" of Organizational Commitment: Some Methodological Considerations. Journal of Apllied Psychology, 69(3), 372-378.
Meyer, J. P., & Allen, N. J. (1991). A Three Component Conceptualization of Organizational Commitment. Human Resource Management Review, 1(1), 61-89.
Meyer, J. P., & Allen, N. J. (1997). Commitment in the Workplace: Theory, Research and Apllication (Advanced Topics in Organizational Behavior): Sage Publications.
Meyer, J. P., Allen, N. J., & Gellatly, I. R. (1990). Affective and Continuance Commitment to the Organization: Evaluation of Measures and Analysis of Concurrent and Time-Lagged Relations. Journal of Apllied Psychology, 75, 710-720.
Meyer, J. P., Allen, N. J., & Smith, C. A. (1993). Commitment to Organizations and Occupations: Extension and Test of a Three-Component Conceptualization. Journal of Applied Psychology, 78, 538-551.
Moideenkutty, U., Blau, G., Kumar, R., & Nalakath, A. (2001). Perceived Organizational Support as a Mediator of the Relationship of Perceived Situational Factors to Affective Organizational Commitment. Applied Psychology, 50(4), 615-634.
Moorman, R. H. (1991). The Relationship Between Organizational Justice and Organizational Citizenship Behaviors: Do Fairness Perceptions Influence Employee Citizenship? Journal of Applied Psychology, 76(6), 845-855.
Morrison, E. W. (1994). Role Definitions and Organizational Citizenship Behavior: The Importance of the Employee's Perspectives. Academy of Management Journal, 37, 1543-1567.
Mowday, R., Porter, L. W., & Steers, R. M. (1982). Employee-Organizational Linkages: The Psychology of Commitment, Absenteeism and Turnover. New York: Academic Press, Inc.
Nadiri, H., & Tanova, C. (2010). An Investigation of the Role of Justice in Turnover Intentions, Job Satisfaction, and Organizational Citizenship Behavior in Hospitality Industry. International Journal of Hospitality Management, 29(1), 22-41.
O’Reilly, C. A., & Chatman, J. (1986). Organizational Commitment and Psychological Attachment: The Effects of Compliance, Identification, and Internalization on Prosocial Behaviour. Journal of Applied Psychology, 71(3), 492-499.
Organ, D. W. (1988). Organizational Citizenship Behavior: The Good Soldier Syndrome: Lexington. Organ, D. W. (1997). Organizational Citizenship Behavior: It's Constrcut Clean-Up Time. Human
Performance, 10(2), 85-97. Organ, D. W., & Ryan, K. (1995). A Meta-Analytic Review Of Attitudinal And Dispositional
Predictors Of Organizational Citizenship Behavior. Personnel Psychology, 48. Pierce, J. L., Gardner, E. A., Cummings, L. L., & Dunham, R. B. (1989). Organization-Based Self-
Esteem: Construct Definition, Operationalizations, and Validation. Academy of Management Journal, 32, 622-648.
Podsakoff, P. M., & MacKenzie, S. B. (1993). Citizenhsip Behavior and Fairness in Organizations: Issues and Directions for Future Research. Employee Responsabilities and Rights Journal, 6(3).
Porter, L. W., Steers, R. M., Mowday, R. T., & Boulian, P. V. (1974). Organizational Commitment, Job Satisfaction, and Turnover among Psychiatric Technicians. Journal of Applied Psychology, 59(5), 603-609
Rego, A. (2000a). Justiça Organizacional - na Senda de uma Nova Vaga? In Iglu (Ed.), Estudos Organizacionais: Novas Perspectivas na Administração de Empresas. Uma Colectânea Luso-Brasileira (pp. 251-283). São Paulo.
Rego, A. (2000b). Justiça Organizacional: Desenvolvimento e Validação de Um Instrumento de Medida. Psicologia, XIV(2), 285-307.
Rego, A. (2002). Justiça e Cidadania nas Organizações - O Papel Moderador das Preferências Éticas. Revista de Administração de São Paulo, 37(2), 83-101.
Rego, A., Pina e Cunha, M., & Souto, S. (2007). Workplace Spirituality, Commitment and Self-Reported Individual Performance. An Empirical Study. Management Research: The Journal of the Iberoamerican Academy of Management, 5(3), 163-183.
Restubog, S. L. D., Bordia, P., & Bordia, S. (2009). The Interactive Effects of Procedural Justice and Equity Sensitivity in Predicting Responses to Psychological Contract Breach: An Interactionist Perspective. Journal of Business and Psychology, 24(2), 165-178.
Salancik, G. R., & Pfeffer, J. (1977). An Examination of Need-Satisfaction Models of Job Attitudes. Administrative Science Quarterly, 22(3), 427-456.
Steenkamp, J. B. E. M., & Van Trijp, H. C. M. (1991). The Use of Lisrel in Validating Marketing Constructs. International Journal of Research in Marketing, 8(4), 283-399.
Tansky, J. W. (1993). Justice and Organizational Citizenship Behavior: What is the Relationship? Employee Responsabilities and Rights Journal, 6(3), 195-207.
Thibaut, J. W., & Walker, L. (1975). Procedural Justice. A Psychological Analysis. Hillsdale, NJ: Erlbaum Associates, New York.
Trevor, C. O., & Nyberg, A. J. (2008). Keeping your Headcount When all About You are Losing Theirs: Downsizing, Voluntary Turnover Rates and the Moderating Role of HR Practices. Academy of Management Journal, 51(2), 259-276.
Van Dyne, L., Graham, J. W., & Dienesch, R. M. (1994). Organizational Citizenship Behavior: Construct Redefinition, Measurement and Validation. Academy of MAnagement Journal, 37(4), 765-802.
Walz, S. M., & Niehoff, B. P. (2000). Organizational Citizenship Behaviors: Their Relationship to Organizational Efectiveness. Journal of Hospitality & Tourism Research, 24(3), 301-319.
Wiener, Y. (1982). Commitment in Organizations: A Normative View. The Academy of Management Review, 7(3), 418-428.
Wu, X., & Wang, C. (2008). The Impact of Organizational Justice on Employees' Pay Satisfaction, Work Attitudes and Performance in Chinese Hotels. Journal of Human Resources in Hospitality & Tourism, 7(2), 181-195.
Yoon, J., & Thye, S. (2002). A Dual Process Model of Organizational Commitment. Job Satisfaction and Organizational Support. Work and Occupations, 29(1), 97-124.
Zhang, H., & Agarwai, N. C. (2009). The Mediating Roles of Organizational Justice on the Relationships between HR Practices and Workplace Outcomes: An Investigation in China. The International Journal of Human Resource Management, 20(3), 676-693.
‘Don't think there aren’t crocodiles because the water is calm’: A study of workplace conflict narratives from the Malaysian Hotel industry
Authors: Jing Jing Lee and Lyn Glanz* Glion Institution of Higher Education Les Roches-Gruyère University of Applied Sciences,
Rue de l'Ondine 20,CH-1630 Bulle Switzerland, [email protected]*
Abstract
Who takes responsibility for dealing with conflicts that arise in the cross-cultural world of hospitality? This paper reports on a study aimed at exploring if there are cultural and style differences in the management of workplace conflicts evident in narratives of 5* hotel property employees in Malaysia. The qualitative research investigated workplace conflicts searching for evidence of cultural characteristics and conflict management styles that occurred at a dyadic level conflict process (Korsgaard, Jeong, Mahony and Pitariu 2008). A conceptual framework was built based on Rahim’s (2011) Dual Concern model and Kozan’s (1997) Three Cultural Models of conflict management. These models were then tested through narratives collected, with Hofstede’s dimensions of culture (1991) applied to distinguish cultural characteristics throughout the study.
KEY WORDS: Hospitality, Conflict Management, Culture, Malaysia, Narratives
Introduction Employees in the hospitality industry today are exposed to boundless interaction and communication with
people from different lifestyles and cultures. Within that interaction, the development, expression and resolution of conflict may vary from culture to culture (Ramirez 2010; Doucet, Jehn, Weldon, Chen, & Wang, 2009;Brew, and Cairns, 2004; Miyahara, Kim Shin & Yoon, 1998 ). This study will first investigate research into conflict in hospitality, and then look at conflict episodes, to explicit their meaning in the workplace context. It will consider the process resulting from interpersonal tension within the same team due to individual differences (Passos & Caetanol, 2005) so that dyadic interactions (Korsgaard et al, 2008) are the focus of the study. In addition, sense making (Weick, 1995) plays a significant role in the manifestation of conflict process in terms of each individual’s inference process of “naming” and “blaming” leading to negative emotions and conflict management responses (Korsgaard, et al, 2008) - considered as fundamental to conflict processes. Outcomes of conflict management - described as managers’ adoption of approach to conflict handling within the workplace setting (Lipsky & Avgar, 2010) are also considered.The study adopts a narrative approach to test evidence of the elements contained in Rahim (2002) and Kozan’s (1997) conflict management models to attempt to provide valuable information for conflict management in a multicultural working environment.
The study of conflict in hospitality literature Conflict is an acknowledged issue in the hospitality industry. Research into an industry that relies very
heavily on human capital inevitably focuses on all aspects of human interaction. The ‘right’ employee is seen as fundemental to hospitality operations, with the potential to augment the chance of success for organisations (Davidson, 2003; Karatepe et al.2009) so there is considerable research on employee turnover in hospitality (Ryan, Ghazali,and Mohsin, 2011; Tracey and Hinkin, 2008 Moncarz et al.2009;) where inter employee conflict, along with stress, often appears as an implied factor but tends to be relegated to a minor factor when related to poor working conditions and compensation antisocial work hours, poor training, and dysfunctional customer behaviours. Work has been carried out on conflict and stress arising especially in customer encounters, related to emotional labour and burnout (Kim, 2008, Dormann and Zapf, 2004, Pizam, 2004; Morris and Feldman, 1996 Krone et al 1989). Relationship conflict is said to decrease hospitality employees' satisfaction and psychological well-being. (Medina et al 2005) Some research suggests good working relationships with colleagues on the other hand, (Vieira, A. 2005) can mitigate turnover intent and have impact in delivering the brand promise (Punjaisri et al.2008). However, not all authors agree with the concept of highly efficient, well motivated teams in the hospitality industry. Both Ingram et al (1997) and Richards et al (2012) found that inter-group conflicts are endemic to teams in the hospitality industry . Richards et al propose that ‘teamwork in the hospitality industry results in a paradox for employees, who typically view teamwork as a form of control. Employees are presented with the language of teamwork, yet continue to work in a highly individualised and somewhat antagonistic environment’(Richards, Chillas, and Marks, 2012.pp237).
Grandey et al (2010) has identified differences in informal rules and norms relating to the control of displaying emotion in relation to ‘targets’ i.e customers versus co-workers that suggest co-workers may be in receipt of higher level emotion including anger (Fitness, 2000; Sloan, 2004) than customers in workplace encounters.Conflict as an element in the functioning of teams (Lichtenstein et al 2004) and in relation to the relationship with superiors has been explored. The importance of managerial support (He, Li, and Lai, 2011) in employee commitment as well as more negative managerial behaviours( Law et al 1995; Faulkner and Patiar 1997) suggest the management of conflict within organisations could be significant to the organisational health of companies. There are specific studies of the aggressive behaviors of supervisors or coworkers in the workplace, (Ben-Zur and Yagil, 2005; Grandey et al 2002), bullying (Murray-Gibbons and Gibbons, 2007) sexual harassment (Lu, and Kleiner, 2001,) and communication barriers arising from the diversity of cultures involved in a global industry (Madera 2011).
Conflict definitions, process and levels There is no all-inclusive definition about conflict (Rose, Suppiah, Uli, and Othman, 2007; Nair 2008) and
among definitions offered some have been strongly generalized, or in contrast, intentionally designed to suit specific research interests (Rahim, 2011). A well used definition of conflict is that of a process in which one party perceives that its interests are being opposed or set back by another party (Buelens, Van Den Broeck, Vanderheyden, Kreitner and Kinicki, 2006). Conflict researchers have often defined the term in reference to Pondy’s (1967) conflict episode theory which suggests the stages of conflict as being: latent conflict; perceived conflict; felt conflict; manifest conflict and conflict aftermath . In his early work, Pondy (1967) saw conflict as a transitory interruption in the life of organisations but then on reflection (1989) postulated that conflict was in fact the inherent state for organisations with co-operation being fleeting and impermanent. In research in this area, then, conflict’s role as a ‘natural’ state in organisations has underpinned research (Rahim 2011; Kozan 1997; and Bakhare 2010) both as as a potentially disruptive occurrence e.g on relationships (Lipsky & Avgar, 2010;Ford et al 1975) with dysfunctional conflict threatening organizational interests (Buelens et al., 2006) or potentially constructive e.g.in thriving group work performances (Passos & Caetano, 2005).
Bakhare (2010) classified intergroup conflict categories into three main categories, on the basis of
organisational levels being the organizational, group and individual conflicts. Subsequently, each categories were then differentiated into inter and intra subcategories, for instance, intergroup and intragroup conflicts. Korsgaard, et al (2008) model breaks up any grouping of conflicts into three specific levels, namely the individual, dyadic and team level,providing more in-depth analysis into the antecedent phenomenon at each level. Moreover, the research explores into the emergence of conflict by having the process divided into three stages of factors - inputs, behaviour, sense making process (Korsgaard et al., 2008).
Both Pondy’s (1967) and Korsgaard et al., (2008)’s models illustrate coherent and corresponding understanding of a conflict emergence process. First of all, conflicts arise with the beginning of latent conflicts, which prompts individuals or parties to participate in constructing stereotypes or emotional involvements. Acting as a review of antecedents prior to an emergence of conflict, these stages contain factors that are grouped based on Deutsch’s (1949) structural model of conflict, the task characteristics and social context, which are congruent to influencing each stage of the process. Dovetailing into this theory is the more comprehensive Inputs-behaviour-sense-making model, which groups conflicts into three levels, namely the individual, dyadic and team level (Korsgaard et al., 2008). In this model conflict participants then engage in the sense making process, where naming and blaming take place, which then leads to the emergence of conflict (Korsgaard, et al., 2008). This paper will consider conflicts that emerge between two individuals i.e dyadic level..
Conflict Management If conflicts are managed effectively, it is said to be a way to enhance work performance, which then leads to
attaining business goals (Nicolaides, 2007). If conflicts are handled ineffectively, considered dysfunctional conflict, it is then seen as having negative impacts on an organization, for example in terms of labour relations and productivity (Chan, Huang and Ng, 2007). Conflict management involves designing effective strategies to minimize the construction of dysfunctional conflicts and enhancing the construction of functional conflicts (Rahim, 2002). Rahim’s Dual Concern Model (2002) of conflict management styles has been applied by many conflict management researchers (Ahmed, Nawaz, Shaukat & Usman, 2010; Rahim and Psenicka, 2002; Desivilya & Eizen, 2005) and is promoted as a theory to manage organisational conflict (Rahim, 2002); problem solving and bargaining strategies for managing interpersonal conflict (Rahim and Psenicka, 2002) and as an intergrated framework of intra-team
conflict management patterns to investigate conflict management in work teams (Desivilya and Eizen, 2005). Kim, Wang, Kondo and Kim (2009), have also applied this model conducting similar research to study conflict management styles in East Asian countries. The model consists of the two basic dimensions: concern for self and concern for others (Rahim, 2002; Rahim, 2011). In the model Rahim (2011) has identified five interpersonal conflict management styles: 1.The Integrating or problem solving style involves collaboration between parties; 2. The Obliging or accommodating style has a strong element of self-sacrifice on the part of one party, who acts as a “conflict absorber” (Rahim 2011); 3. The Dominating or competing style, indicates a high concern for self and low concern for others; 4. The Avoiding or suppression style, indicates a low concern for both self and others and results in sidestepping conflict issues; 5. The Compromising style indicates an intermediate concern for self and others and involves give-and-take or sharing approaches to conflict management. The dependability of the model has been criticised (Sorenson, Morse and Savage 1999), for its solitary focus on instrumentality and it also a model rooted in Non-Asian, mostly Western perspectives. The Dualistic Model of Harmony (Leung, Koch and Lu, 2002) has since been established, acting as a supplement to the usual dual-concern model, elaborating on the Confucian concept of harmony which is useful for application in conflict management studies especially in Asia.
Kozan’s (1997) conflict management model introduces three conflict management cultural sub-models namely the Harmony, Confrontational and Regulative Models. Each model has different characteristics that are identified through different elements illustrated in a conflict process (Kozan, 1997). So as an example, in the behaviour element, three different manifestations are predicted depending on which of three conflict resloution styles-(harmony);confrontation and compromise(confrontation) and avoidance or forcing(regulative)- is ascendant. Eight elements are mapped against the three conflict management styles. Although Kozan’s (1997) model may be relatively outdated as compared to Rahim’s (2011) model which is still repeatedly applied in recent conflict management studies, Kozan’s (1997) still appears to be one of the most effective models for studying conflict management styles across culture, providing its comprehensiveness in uncovering each element of each conflict management type in a conflict process.
Conflict and Culture The standard dimensions used in research studies into cross cultural conflict remain Hofestede’s cultural
dimensions. According to Hofstede (1991) values and cultures are deeply interlinked to each other. His model identifies four cultural dimensions, namely power distance(PDI), individualism(IDV), masculinity(MAS) and uncertainty avoidance(UAI). In addition, a fifth dimension, long-term orientation which is based on Confucian dynamism was added later (Hofstede and Bond 1988)but it was not applied on Malaysia.
Many have considered Hofstede’s model as the most comprehensive and straightforward in its measurement of national culture (Lim, 2001). Although criticised (e.g.Jackson 2011), the dimensions have been so widely applied in relation to cross cultural studies and retain currency in current research because of their continued revision and application. As this paper concerns conflict narratives drawn from a Malaysian sample and so it is useful to consider Hofstede’s dimensions for the country despite the difficulties arising from Hofstede somewhat overlooking the subcultures that occur within nations (Bhopal & Rowley, 2005). Hofstede’s research indicates that Malaysia has the highest score of PDI. This means that in Malaysia’s organisational context, there is a high distance between members that are powerful and members that are powerless. The second highest score for Malaysia is its MAS implying more competitive and assertive values, followed by UAI. In terms of UAI which is a little lower than average, in between being the uncertainty accepting and avoiding cultures, Malaysia seem to have a balance between two. Therefore, they may be rule-oriented, emotional but but at the same time, also tolerance to opinions that differ to what they were used to, and less expected to express emotions when faced uncertainty Lastly, the model shows the lowest score among all in terms of individualism. This indicates that the Malaysian generally values peace and harmony, a relatively strong collectivist country (geert-hofstede.com 2009).
Methodology
The main purpose of the research was to test conflict model elements in a sample group with a specific focus on individuals’ perceptions and meaning of specific workplace conflict situations. The study of narratives, which are known as an experience told in a sequence way (Saunders, Lewis & Thornhill, 2009) was adopted. This study looked for the presence of elements of existing Rahim (2002) and Kozan’s (1997) models in the narratives of conflict between dyads. Narratives were seen as particularly suitable as a means to capture sensemaking moments within emerging conflicts. In sensemaking, apparently random moments of revelation can quickly invalidate long held belief and behaviour as a consequence of countless variables. Weick (1995) accepts the methodological
problems this causes but suggests noticing, manipulation, interpretation and framing are all legitimate ways helping others understand the actions of people in everyday life. Referents and accounts are given when a moment in the process of evolving is ‘frozen’ (Glanz 2003) and could give insights into the naming and blaming sensemaking process described in Korsgaard, et al.’s model (2008). .
The study was carried out in Malaysia and data was collected from multicultural employees in a five-star hotel in Kuala Lumpur. Eight responses and a total of nine stories were successfully collected. Following a short (3 participants) pilot study to check interview questions for length etc, the first approach taken was to conduct interviews in electronic interviews through emails followed-up by telephone interviews. All telephone interviews and follow-up interviews were audio recorded and transcribed. Participants were asked to tell two stories of workplace conflict that they had witnessed between two other employees. Five semi-structured questions were added to help participants to describe an incident: 1)How would you describe the participants? (Personality, performance, attitude, experience…) 2.What was the conflict about and how did it arise? 3)What happened? (Emotions, actions, reactions involved…)4)How was it resolved?5)What other comments do you have about the conflict management part of your story? Please be as descriptive as possible.
In their answers participants were encouraged to use whichever of three languages that they felt most comfortable with (English, Malay or/and Chinese) and these were subsequently translated.. The narratives collected were first transcribed. Then, data were examined for culture values and conflict styles evidence. Subsequently, the cultural characteristics identified were categorized by adopting Hofstede’s (1991) cultural dimension model, and the conflict management styles were categorized by elements of Rahim’s (2011) and Kozan’s (1997) conflict management models. Considering the complexity of Kozan’s (1997) model, a matrix table was drawn up after categorization examples as shown in Table 1. Subsequently, result patterns were analyzed and further compared with Hofstede’s cultural values for interpretation and comments.
Results First cultural aspects were identified in the narratives. In terms of Power Distance Index (PDI), many stories
showed evidence of a strong PDI phenomenon within the conflict process. For instance, participant 6A was described as a person who “follows instructions given by 6B”, “conflict still ongoing, feels frustrated and being treated unfairly, yet he is still working in harmony with 6B after the conflict”. Next, in a different setting, participant 7B was narrated as “friendly with people of the same job level but not towards colleagues of the lower levels”. This shows some congruence with Hofstede’s (2009) high PDI ranking for Malaysian society (2009).
A suggestion of a strong Uncertainty Avoidance Index (UAI) was also distinguished in participant 6A and 6B. To elaborate, although it was clearly something was wrong in the working relationship between the two, Narrator 6 stresses on the point that there were no intentions of breaking the ice, voicing up for themselves or discussing the grudge in the relationship that was touched upon. Thus, both participants seem to have a low acceptance of uncertainty. Further, participant 7A also chose to resign from his duties instead of clarifying the upset relationship he had with participant 7B (Narrator 7 indicated that many people felt that 7B was not at all trying to resolve the conflict but had an intention of laying off 7A). In this case possibly 7A was trying to avoid the uncertainty of being laid off, thus “solving” the issue by resigning.
Referring back to the case of participants 6A and 6B, the masculinity (MAS) dimension was also said to have played a role in that specific conflict situation that was initially categorized as an UAI situation. Chiefly, it may be due to 6B, who takes a more assertive stance than the other. Subsequently, in terms of individualism (IDV), considering Hofstede’s perception of Malaysian being the collectivist country (geert-hofstede.com 2009), congruencies were evidenced in this research to his study, for instance both participants 6A and 7A did not want to bring up dissatisfactions during the conflict, possibly values strong ties when working in group to preserve harmony.
However, some results from the research differed from Hofstede’s cultural dimension model of Malaysia. For instance, Hofstede indicated that there is a high notion of collectivism in the Malaysian culture. Contradictorily, there was still high individualist evidence identified from participants such as 6B, 8A and 8B. 6B was said to “always work according to her own way” likewise not appreciating the tie with the group, whereas 8A and 8B working individually due to the different priorities in working styles. Responses were next analysed in relation to Rahim’s (2011) Dual Concern Model. Narrative evidence was found when analysing the conflict process at dyadic level that could be categorized into Rahim’s (2011) five conflict styles. Examples of these are given below:
A strong integrating style was identified from Participant 1A and 1B in the first story. “So what happened after that was they went into that same parameter, of what we've discussed, meeting at 2.30pm and eventually talking to each other, they eventually became very good friends, they are now working together actually, after many years…… And they are still working together today…”.
A Dominating style was then illustrated by participant 7B, when Narrator 7 describes the process as “7B gets angry and started to scold 7A in front of his staff members for more than 30 minutes and explain how stupid he was. He also threw things 7A. He did not resolve the issue went around the company gossiping about it”. Also: “It was rather a silent conflict, having things going in both participants’ mind”. This is an avoiding style evidence referred to participants 2A and 2B. In addition, “none of them voiced up after the incident about any dissatisfaction…. until the promotion of 2A to another department”. From here, a strong avoiding style was subsequently implied on participant 2A again, for her strong indication in “see no evil, hear no evil, speak no evil” by just leaving the department without any resolution to the situation (Rahim, 2011, p.28).
The Compromising style was also strongly evidenced from participants 6A and 6B when they were involved a give-and-take situation. According to Narrator 6, “In the end, they had to talk to each other anyway… to solve the problem … but it wasn’t until the very last minute… 6B talked to the client, and 6A waited for the payment”, which constituted a no-win/no-lose style (Rahim, 2011).
The evidence presented has shown strong fit of distinguishing hotel workers’ conflict management styles with Rahim’s (2011) categorization method. Despite its much generalised concept which added on its frequency of being applied in related study field (Ahmed, Nawaz, Shaukat & Usman, 2010; Rahim and Psenicka, 2002; Desivilya and Eizen, 2005) it was of interest to have found no evidence for an obliging style among the nine narratives collected. In the context of Hofstede’s cultural studies, it could be postulated that this might be due to specific characteristics of Malaysia’s collective nature.
Next storytelling responses were mapped and analyzed in relation to Kozan’s (1997) Three Cultural Models of Conflict Management. To identify any patterns in elements identified in the conflict process, the 9 collected stories were firstly mapped against the model in separate tables. The patterns distinguished were then presented in the model again and shown in the form of a matrix as illustrated in Table 1. In general, the approach in collecting storytelling narratives produced a wide range of diversity according to Kozan’s (1997) comprehensive cultural-based conflict management model. Based on storytelling evidence presented in Table 1, it shows a distinctive variance of each element’s matrix figure. Certain elements appeared more often than others. For instance, “emotion” and “behaviour” appeared highly influential in the structure of storytelling. This means that many participants who were involved in dyadic level conflict situations tend to see those elements as more influential and therefore demonstrate them, making them more identifiable. “Thoughts” and “antecedent conditions” appear to be important elements, followed by “outcome criteria”.
Surprisingly, the “nonmanagerial third party” element was found not to have appeared at all among any of the conflict process stories analysed. The element discussed among the eight narrators, but the nonmanagerial third parties discussed were merely people who they talked to, having non-conflict-management related intention such as participant 5B’s intention of “gathering opinions from other people”, and in the scenario of story 9 where peers’ roles were “bad-mouthing” or “manipulating gossips”. Ultimately, they did not allow themselves to be directly involved in the conflict, only as a “secondary role” of the story. This shows that people generally do not consider that element as an effective one to consider while managing conflict. Reflecting on Hofstede’s study, this might be due to Malaysia as a country high in UAI, in which they may restrict or avoid non-managerial intervention to be involved in the situation since they prioritize the avoidance of uncertainties.
Moreover, in terms of conflict management style pattern’s distribution across the matrix, “emotions” were discussed rather equally in Harmony and Confrontational styles. In contrast, “outcome criteria” shows most prevalence in its strong discussion in Harmony conflict management style. Although there remains a mixture of components from other Confrontational and Regulative styles, the Harmony style still predominated the general matrix pattern.
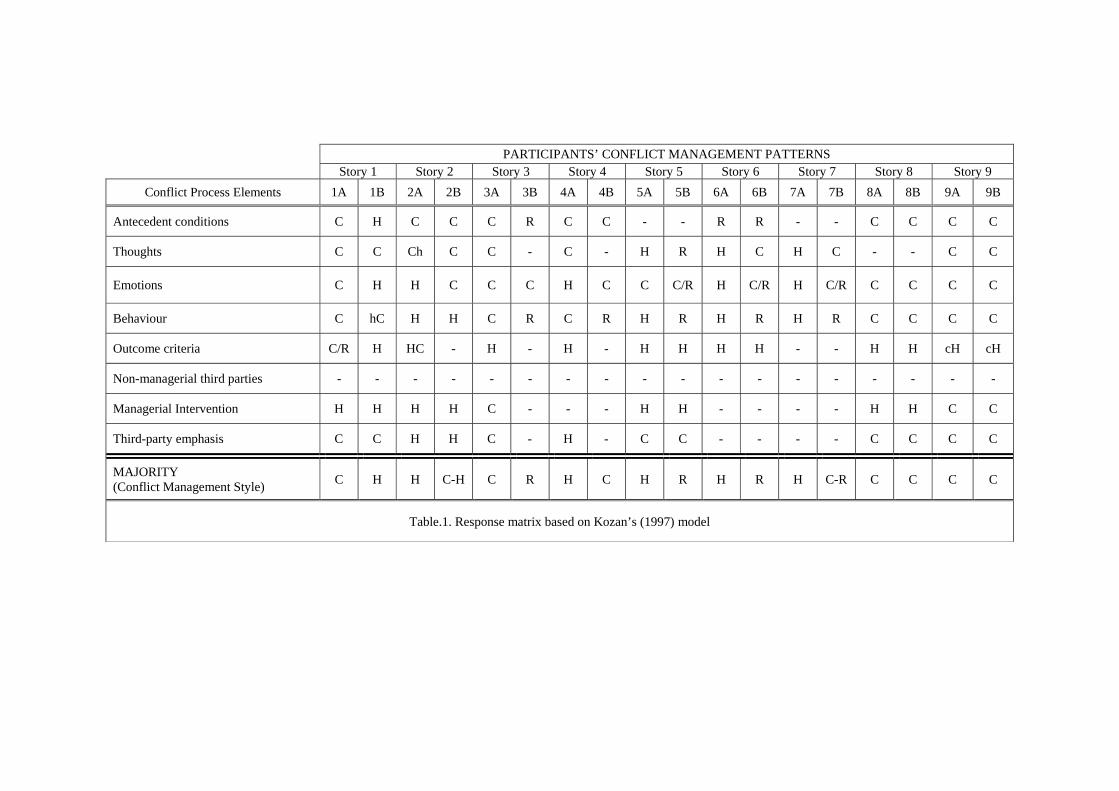
PARTICIPANTS’ CONFLICT MANAGEMENT PATTERNS Story 1 Story 2 Story 3 Story 4 Story 5 Story 6 Story 7 Story 8 Story 9
Conflict Process Elements 1A 1B 2A 2B 3A 3B 4A 4B 5A 5B 6A 6B 7A 7B 8A 8B 9A 9B
Antecedent conditions C H C C C R C C - - R R - - C C C C
Thoughts C C Ch C C - C - H R H C H C - - C C
Emotions C H H C C C H C C C/R H C/R H C/R C C C C
Behaviour C hC H H C R C R H R H R H R C C C C
Outcome criteria C/R H HC - H - H - H H H H - - H H cH cH
Non-managerial third parties - - - - - - - - - - - - - - - - - -
Managerial Intervention H H H H C - - - H H - - - - H H C C
Third-party emphasis C C H H C - H - C C - - - - C C C C
MAJORITY (Conflict Management Style)
C H H C-H C R H C H R H R H C-R C C C C
Table.1. Response matrix based on Kozan’s (1997) model
7
Similarly, “managerial intervention” displayed a steong showing of Harmony style conflict management. Although this element was not identified in some of the stories, it is worth the discussion together with “outcome criteria” as it complies substantially with Hofstede’s indication of Malaysia being a collectivist country.
“Third party emphasis” element was also highlighted the Confrontational model. In this case, an individual emphasis third party intervention in conflicts as a reasonable and fair approach in solving conflicts. This is also congruent to Hofstede’s perception of due to a high PDI in Malaysia, where it was further demonstrated by referring to stories 8 and 9 which consists of the Chinese, Indian and Malay Malaysian culture. In this case, it also fits into Weick’s (1997) study in terms of the “social” sense making property, where senesmaking relies on reference to others, either real or imagined.
Conclusion The main purpose of the study was to explore if there are cultural and style differences in the management of
workplace conflicts through the exploration of narratives of Hotel employees in Malaysia. Four objectives were created to achieve the aim of the study. First of all, the first objective was to investigate into intragroup conflict process at dyadic level through narratives of workplace conflicts. Then, the second and third objectives were to identify evidence of cultural characteristics and conflict management style within a dyadic level conflict process. And lastly, to test Rahim (2011) and Kozan’s (1997) conflict management style models by seeking evidence of the models in workplace narratives.
The first objective has found out that the narratives of workplace conflicts did contribute to the investigation into intragroup conflict process at dyadic level. Evidence was found all four cultural dimensions of Hofstede’s cultural dimension model (2009). The exploration of the dimensions appear to indicate that within a conflict process, hotel employees in Malaysia tend to display cultural characteristics that are highly related to the concept of power distance and uncertainty avoidance.
Ultimately, both Rahim (2011) and Kozan (1997)’s model were reviewed in evidence of model elements that are able to crucially distinguish conflict management style of an individual. Thus, it was found that for the applied model of Rahim’s (2011), four out of five conflict management styles were found evidenced from the series of analysis on narratives collected. However, dominating and compromising styles were found most prevalent to the study. This is because both styles were evidenced from the population closest to the selected samples for the study. Given the findings also show fit with Hofstede’s suggested cultural dimensions, it appears that Malaysians display conflict handling style that fits with known cultural characteristics.
In regard to Kozan’s (1997) cultural-based conflict management model, evidence was found that of all elements in the conflict process were managed to be identified from the narratives collected. Findings found that “emotions” and “behaviour” elements were found most prevalent while identifying one’s conflict management style. There were also interesting findings, for example a main exception in the last reported element, “nonmanagerial third parties”. Among the nine stories collected from a diverse population which even have crossed the study scope to other nationalities, there were no individuals who considered that particular element in a conflict process to assist in managing conflict.
To conclude, this study’s approach has indicated an extensive overview of conflict process, conflict management and the cultural indications on how a conflict management style was “allocated” to an individual. Although this sample size is not large enough to make recommendations on industry practice, in general, it may be said that any individuals working in the multicultural hotel working environment should never overlook the importance of culture associated with an individual’s conflict management style.As mentioned, this research was conducted with a relatively small sample to study on cross cultural conflict. Therefore, future researchers should consider and extended size of sample for a better grasp of a specific culture to be analyzed in a more in-depth basis. A larger study over a longer timeframe could also provide a wider range of workplace conflicts to be collected, creating a more extensive view of workplace conflict stories to be more deeply examined.
References
Ahmed, I., Nawaz, M.M., Shaukat, M.Z. & Usman, A. (2010). “Personality does affect conflict handling style: Study of Future Managers.” International Journal of trade, economics and finance,1, 268-270.
Bakhare, R.(2010). “The Manager and Conflict Management”. SCMS Journal of Indian Management,7,41-57.
Ben-Zur, H., Yagil, D. (2005), "The relationship between empowerment, aggressive behaviors of customers, coping, and burnout", European Journal of Work and Organizational Psychology, Vol. 14 No.1, pp.81-99.
Bhopal, M., & Rowley, C. (2005) “Ethnicity as a Management Issue and Resource: Examples from Malaysia.” Asia Pacific Business Review, 553-574.
Brew, F.P & Cairns, D.R.,(2004) “Styles of managing interpersonal workplace conflict in relation to status and face concern: a study with Anglos and Chinese.” International Journal of Conflict Management, 10444068, 2004, Vol. 15, Issue 1
Buelens, M., Van Den Broeck, H., Vanderheyden, K., Kreitner, R., & Kinicki, A. (2006). “Power, politics and conflict:” Organizational Behaviour (3rd ed.). Berkshire: McGraw-Hill Education.
Chan, K.W., Huang, X. & Ng P.M. (2008). “Managers’ conflict management styles and employee attitudinal outcomes: The mediating role of trust”. Asia Pacific Journal of Managment, 25, 277–295
Davidson, M.C.G.,Manning, M., Brosnan & P., Timo, N. (2002), "Organizational climate, perceived customer satisfaction and Revpar per available room in four and five star Australian hotels", Tourism Analysis, Vol. 6 No.2, pp.13-25.
Desivilya, H. S., & Eizen, D. (2005). “Conflict Management in Work Teams: The Role of Social Self-Efficacy and Group Identification.” The International Journal of Conflict Management, 183-208.
Deutsch, M. (1949), "A theory of co-operation and competition", Human Relations, Vol. 2 No.2, pp.129-52. Doucet, L., Jehn, K. A., Weldon, E., Chen, X. & Wang, Z. (2009).“Cross-cultural differences in conflict management.”
International Journal of Conflict Management, 20(4), 355-376.
Ford, N.M., Walker, O.C. Jr,& Churchill, G.A. (1975), "Expectation specific measures of the intersender conflict and role ambiguity experienced by salesmen", Journal of Business Research, Vol. 3 No.2, pp.95-112.
geert-hofstede.com/hofstede_malaysia.shtml (2009). Geert Hofstede cultural dimension. Retrieved October 1, 2011.
He Y, Li W, &Lai K.K, (2011) "Service climate, employee commitment and customer satisfaction: Evidence from the hospitality industry in China", International Journal of Contemporary Hospitality Management, Vol. 23 Iss: 5, pp.592 – 607
Hofstede G. (1991) ‘Cultures and Organizations: Software of the Mind.’ London McGraw-Hill
Hofstede, G.,& Bond, M.H. (1988), "The Confucian connection: from cultural roots to economic growth", Organizational Dynamics, Vol. 16 No.4, pp.5-21.
Fitness, J. (2000), "Anger in the workplace: an emotion script approach to anger episodes between workers and their superiors, co-workers and subordinates", Journal of Organizational Behavior, Vol. 21 No.2, pp.147-62.
Glanz, L., (2003) ‘Expatriate Stories: a vehicle of professional development abroad?’ Journal of Managerial Psychology. Special Expatriation issue Vol. 18 No. 3 pp259-274
Grandey A, Rafaeli A, Ravid S., Wirtz J., & Steiner,D.D. (2010) "Emotion display rules at work in the global service economy: the special case of the customer", Journal of Service Management, Vol. 21 Iss: 3, pp.388 – 412
Grandey, A.A., Tam, A.P.,& Brauburger, A.L. (2002), "Affective states and traits in the workplace: diary and survey data from young workers", Motivation and Emotion, Vol. 26 No.1, pp.31-55.
Ingram, H., Teare, R., Scheuing, E.,& Armistead, C. (1997), "A systems model of effective teamwork", The TQM Magazine, Vol. 9 No.2, pp.118-27.
Jackson,T. (2011) "From cultural values to cross-cultural interfaces: Hofstede goes to Africa", Journal of Organizational Change Management, Vol. 24 Iss: 4, pp.532 - 558
Karatepe, O.M., Yorganci, I., &Haktanir, M. (2009), "Outcomes of customer verbal aggression among hotel employees", International Journal of Contemporary Hospitality Management, Vol. 21 No.6, pp.713-33.
Korsgaard, M.A., Jeong, S.S., Mahony, D.M., & Pitariu, A.H. (2008). “A Multilevel View on Intragroup Conflict.” Journal of Management, 34, 1222-1252.
Kozan, M. K. (1997). Culture and Conflict Management: A Theoretical Framework. The International Journal of Conflict Management, 338-360.
Kim, T. Y., Wang, C., Kondo, M. & Kim, T.H. (2007) “Conflict management styles: the differences among the Chinese, Japanese and Koreans”. International Journal of Conflict Management, 18(1), 23-41.
Law, J., Pearce, P.L.,& Woods, B.A. (1995), "Stress and coping in tourist attraction employees", Tourism Management, Vol. 16 No.4, pp.277-84.
Leung, K., Koch, P. T. & Lu, L. (2002). “A dualistic model of harmony and its implications for conflict management in Asia.” Asia Pacific Journal of Management, 19, 201-220.
Lim, L. (2001). “Work-related values of Malays and Chinese Malaysians”. International Journal of Cross Cultural Management, 1(2), 209-226.
Lipsky, D.B. & Avgar, A.C. (2010). “The conflict over conflict management.” Dispute Resolution Journal, 62, 11-43.
Lu C-J, & Kleiner, B.H.(2001) "Discrimination and harassment in the restaurant industry", International Journal of Sociology and Social Policy, Vol. 21 Iss: 8/9/10, pp.192 - 205
Madera, J.M.(2011) "Removing communication barriers at work: What workforce diversity means for the hospitality industry", Worldwide Hospitality and Tourism Themes, Vol. 3 Iss: 4, pp.377 - 380
Medina F.J., Munduate L, Dorado M.A., Martínez I., & Guerra,J.M (2005) "Types of intragroup conflict and affective reactions", Journal of Managerial Psychology, Vol. 20 Iss: 3/4, pp.219 - 230
Miyahara, A., Kim, M. S., Shin, H. C., & Yoon, K. (1998). Conflict resolution styles among "collectivist" cultures: A comparison between Japanese and Koreans. International Journal of Intercultural Relations, 22, 505-525.
Moncarz, E., Zhao, J.,& Kay, C. (2009), "An exploratory study of US lodging properties' organisational practices on employee turnover and retention", International Journal of Contemporary Hospitality Management, Vol. 21 No.4, pp.437-58.
Murray-Gibbons, R.,& Gibbons, C. (2007), "Occupational stress in the chef profession", International Journal of Contemporary Hospitality Management, Vol. 19 No.1, pp.32-42.
Nair, N. (2008) "Towards understanding the role of emotions in conflict: a review and future directions", International Journal of Conflict Management, Vol. 19 Iss: 4, pp.359 - 381
Nicolaides, A. (2007). “The role of the Hospitality Managers in Conflict Management”. Journal of Travel & Tourism Research, 7, 103-112.
Passos, A.M. & Caetano, A. (2005). “Exploring the effects of intragroup conflict and past performance feedback on team effectiveness. “Journal of Managerial Psychology, 20, 231-244.
Pondy, L. R. (1967). “ Organizational Conflict: Concepts and Models” Administrative Science Quarterly,12, 296-320.
Pondy, L.R. (1989), "Reflections on organizational conflict", Journal of Organizational Change Management, Vol. 2 No.2, pp.94-8.
Punjaisri, K., Wilson, A., & Evanchitzky, H. (2008), "Exploring the influences of internal branding on employees' brand promise delivery: implications for strengthening customer-brand relationships", Journal of Relationship Marketing, Vol. 7 No.4, pp.407-24.
Rahim, M. A. (2011). Managing conflict in Organizations. New Brunswick, New Jersey: Transaction Publisher.
Rahim, M. A. (2002). “Toward A Theory of Managing Organizational Conflict” The International Journal of Conflict Management, 206-235.
Rahim M.A. & Psenicka C. (2002). “A model of emotional intelligence and conflict management strategies: A study in seven countries” The International Journal of Organizational Analysis, 10, 302-326.
Ramirez, A.R. (2010). “Impact of cultural intelligence level on conflict resolution ability: A conceptual model and research proposal” Emerging Leadership & Entrepreneurship, 3, 42-56.
Richards J, Chillas S., & Marks A., (2012) "“Every man for himself”: Teamwork and customer service in the hospitality industry", Employee Relations, Vol. 34 Iss: 3, pp.235 - 254
Rose, R. C., Suppiah, W. R., Uli, J., & Othman, J. (2007). “A Face Concern Approach to Conflict Management - A Malaysian Perspective” Journal of Social Sciences, 2, 121-126.
Ryan C, Ghazali, H., & Mohsin,A. (2011) "Determinants of intention to leave a non-managerial job in the fast-food industry of West Malaysia", International Journal of Contemporary Hospitality Management, Vol. 23 Iss: 3, pp.344 - 360
Saunders, M., Lewis, P. & Thornhill, A. (2009). Research Methods for business students (5th ed.). Harlow, England: Prentice Hall.
Sloan, M. (2004), "The effects of occupational characteristics on the experience and expression of anger in the workplace", Work and Occupations, Vol. 31 No.1, pp.38-72.
Sorenson, R.L., Morse, E.A.,& Savage, G.T. (1999), "A test of the motivations underlying choice of conflict strategies in the dual-concern model", International Journal of Conflict Management, Vol. 10 No.1, pp.25-44.
Tracey, J., Hinkin, T. (2008), "Contextual factors and cost profiles associated with employee turnover", Cornell Hospitality Quarterly, Vol. 49 No.1, pp.12-27.
Vieira, A. (2005), "Delivering quality service: all for one?", Journal of Quality Assurance in Hospitality & Tourism, Vol. 6 No.1/2, pp.25-42.
Weick, K. E. (1995). Sensemaking in Organizations. United States of America: Sage Publications.
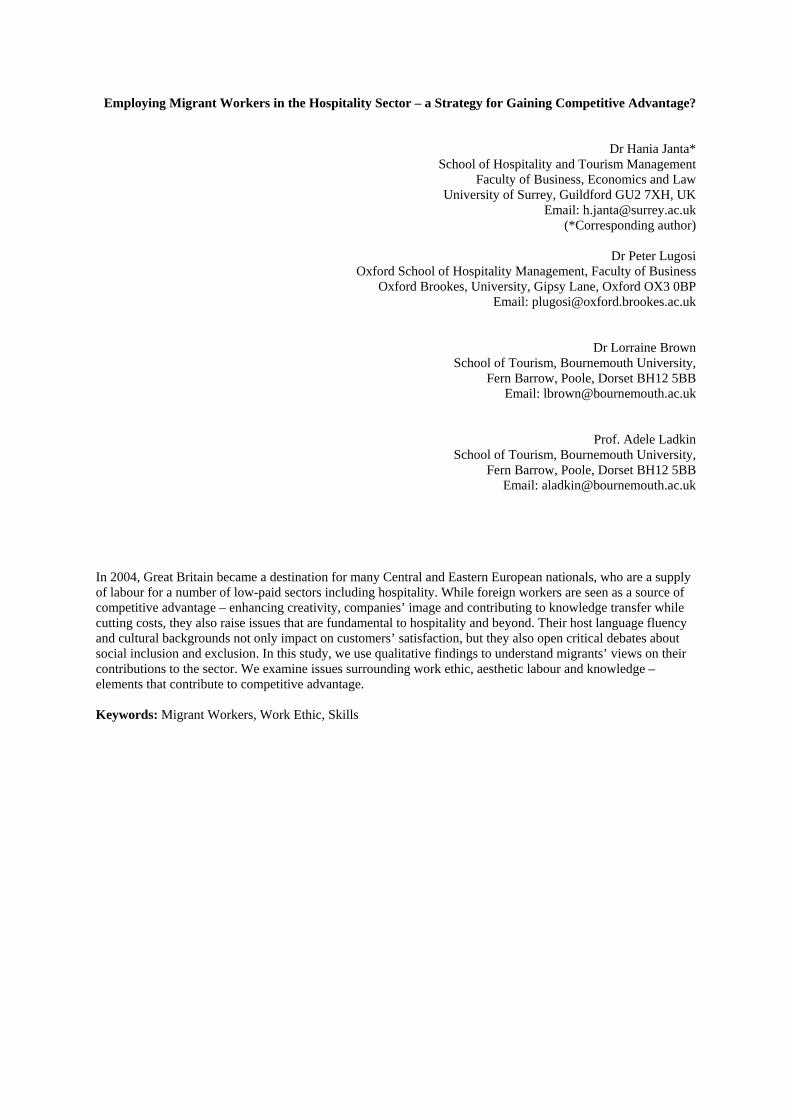
Employing Migrant Workers in the Hospitality Sector – a Strategy for Gaining Competitive Advantage?
Dr Hania Janta* School of Hospitality and Tourism Management
Faculty of Business, Economics and Law University of Surrey, Guildford GU2 7XH, UK
Email: [email protected] (*Corresponding author)
Dr Peter Lugosi
Oxford School of Hospitality Management, Faculty of Business Oxford Brookes, University, Gipsy Lane, Oxford OX3 0BP
Email: [email protected]
Dr Lorraine Brown School of Tourism, Bournemouth University,
Fern Barrow, Poole, Dorset BH12 5BB Email: [email protected]
Prof. Adele Ladkin School of Tourism, Bournemouth University,
Fern Barrow, Poole, Dorset BH12 5BB Email: [email protected]
In 2004, Great Britain became a destination for many Central and Eastern European nationals, who are a supply of labour for a number of low-paid sectors including hospitality. While foreign workers are seen as a source of competitive advantage – enhancing creativity, companies’ image and contributing to knowledge transfer while cutting costs, they also raise issues that are fundamental to hospitality and beyond. Their host language fluency and cultural backgrounds not only impact on customers’ satisfaction, but they also open critical debates about social inclusion and exclusion. In this study, we use qualitative findings to understand migrants’ views on their contributions to the sector. We examine issues surrounding work ethic, aesthetic labour and knowledge – elements that contribute to competitive advantage. Keywords: Migrant Workers, Work Ethic, Skills
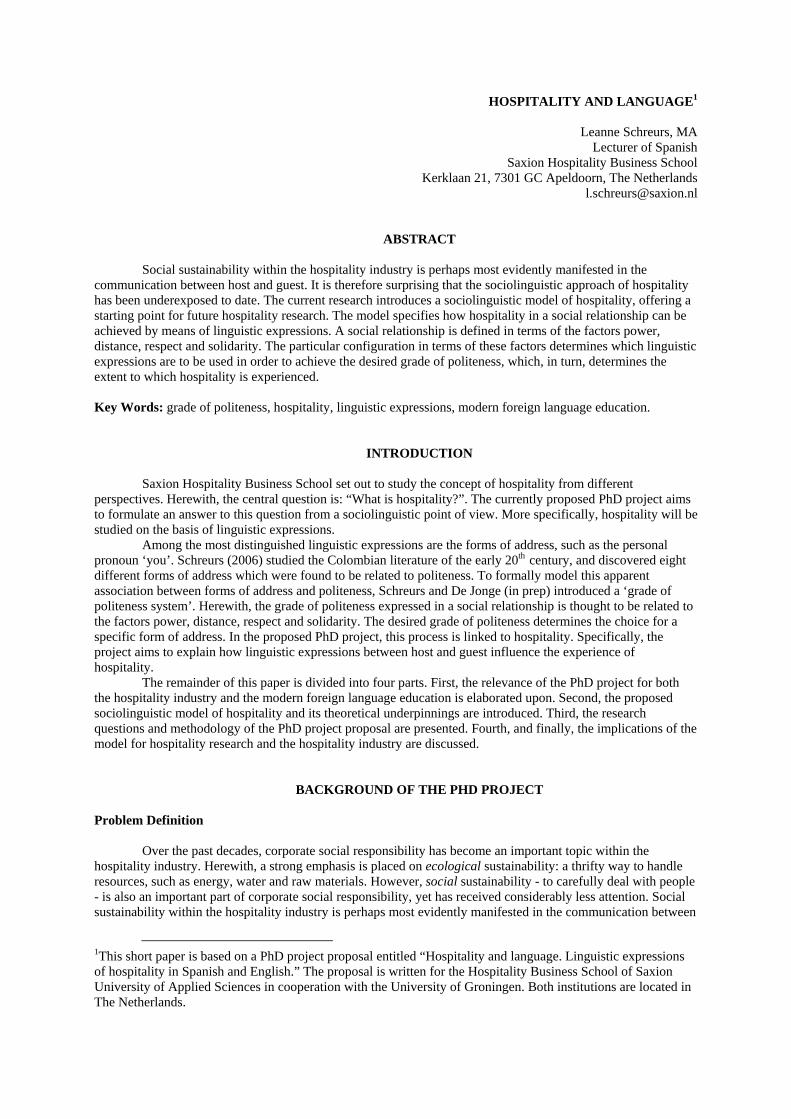
HOSPITALITY AND LANGUAGE1
Leanne Schreurs, MA Lecturer of Spanish
Saxion Hospitality Business School Kerklaan 21, 7301 GC Apeldoorn, The Netherlands
ABSTRACT Social sustainability within the hospitality industry is perhaps most evidently manifested in the
communication between host and guest. It is therefore surprising that the sociolinguistic approach of hospitality has been underexposed to date. The current research introduces a sociolinguistic model of hospitality, offering a starting point for future hospitality research. The model specifies how hospitality in a social relationship can be achieved by means of linguistic expressions. A social relationship is defined in terms of the factors power, distance, respect and solidarity. The particular configuration in terms of these factors determines which linguistic expressions are to be used in order to achieve the desired grade of politeness, which, in turn, determines the extent to which hospitality is experienced.
Key Words: grade of politeness, hospitality, linguistic expressions, modern foreign language education.
INTRODUCTION Saxion Hospitality Business School set out to study the concept of hospitality from different
perspectives. Herewith, the central question is: “What is hospitality?”. The currently proposed PhD project aims to formulate an answer to this question from a sociolinguistic point of view. More specifically, hospitality will be studied on the basis of linguistic expressions.
Among the most distinguished linguistic expressions are the forms of address, such as the personal pronoun ‘you’. Schreurs (2006) studied the Colombian literature of the early 20th century, and discovered eight different forms of address which were found to be related to politeness. To formally model this apparent association between forms of address and politeness, Schreurs and De Jonge (in prep) introduced a ‘grade of politeness system’. Herewith, the grade of politeness expressed in a social relationship is thought to be related to the factors power, distance, respect and solidarity. The desired grade of politeness determines the choice for a specific form of address. In the proposed PhD project, this process is linked to hospitality. Specifically, the project aims to explain how linguistic expressions between host and guest influence the experience of hospitality.
The remainder of this paper is divided into four parts. First, the relevance of the PhD project for both the hospitality industry and the modern foreign language education is elaborated upon. Second, the proposed sociolinguistic model of hospitality and its theoretical underpinnings are introduced. Third, the research questions and methodology of the PhD project proposal are presented. Fourth, and finally, the implications of the model for hospitality research and the hospitality industry are discussed.
BACKGROUND OF THE PHD PROJECT
Problem Definition Over the past decades, corporate social responsibility has become an important topic within the
hospitality industry. Herewith, a strong emphasis is placed on ecological sustainability: a thrifty way to handle resources, such as energy, water and raw materials. However, social sustainability - to carefully deal with people - is also an important part of corporate social responsibility, yet has received considerably less attention. Social sustainability within the hospitality industry is perhaps most evidently manifested in the communication between
1This short paper is based on a PhD project proposal entitled “Hospitality and language. Linguistic expressions of hospitality in Spanish and English.” The proposal is written for the Hospitality Business School of Saxion University of Applied Sciences in cooperation with the University of Groningen. Both institutions are located in The Netherlands.
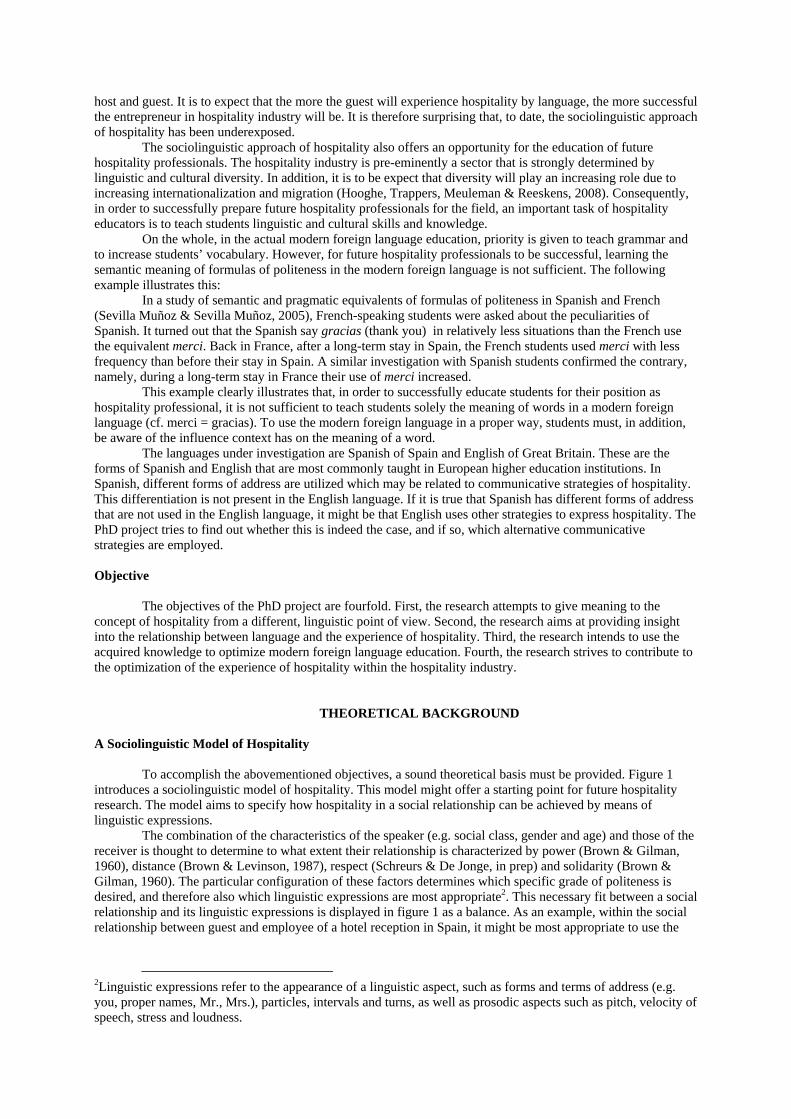
host and guest. It is to expect that the more the guest will experience hospitality by language, the more successful the entrepreneur in hospitality industry will be. It is therefore surprising that, to date, the sociolinguistic approach of hospitality has been underexposed.
The sociolinguistic approach of hospitality also offers an opportunity for the education of future hospitality professionals. The hospitality industry is pre-eminently a sector that is strongly determined by linguistic and cultural diversity. In addition, it is to be expect that diversity will play an increasing role due to increasing internationalization and migration (Hooghe, Trappers, Meuleman & Reeskens, 2008). Consequently, in order to successfully prepare future hospitality professionals for the field, an important task of hospitality educators is to teach students linguistic and cultural skills and knowledge.
On the whole, in the actual modern foreign language education, priority is given to teach grammar and to increase students’ vocabulary. However, for future hospitality professionals to be successful, learning the semantic meaning of formulas of politeness in the modern foreign language is not sufficient. The following example illustrates this:
In a study of semantic and pragmatic equivalents of formulas of politeness in Spanish and French (Sevilla Muñoz & Sevilla Muñoz, 2005), French-speaking students were asked about the peculiarities of Spanish. It turned out that the Spanish say gracias (thank you) in relatively less situations than the French use the equivalent merci. Back in France, after a long-term stay in Spain, the French students used merci with less frequency than before their stay in Spain. A similar investigation with Spanish students confirmed the contrary, namely, during a long-term stay in France their use of merci increased.
This example clearly illustrates that, in order to successfully educate students for their position as hospitality professional, it is not sufficient to teach students solely the meaning of words in a modern foreign language (cf. merci = gracias). To use the modern foreign language in a proper way, students must, in addition, be aware of the influence context has on the meaning of a word.
The languages under investigation are Spanish of Spain and English of Great Britain. These are the forms of Spanish and English that are most commonly taught in European higher education institutions. In Spanish, different forms of address are utilized which may be related to communicative strategies of hospitality. This differentiation is not present in the English language. If it is true that Spanish has different forms of address that are not used in the English language, it might be that English uses other strategies to express hospitality. The PhD project tries to find out whether this is indeed the case, and if so, which alternative communicative strategies are employed. Objective
The objectives of the PhD project are fourfold. First, the research attempts to give meaning to the
concept of hospitality from a different, linguistic point of view. Second, the research aims at providing insight into the relationship between language and the experience of hospitality. Third, the research intends to use the acquired knowledge to optimize modern foreign language education. Fourth, the research strives to contribute to the optimization of the experience of hospitality within the hospitality industry.
THEORETICAL BACKGROUND
A Sociolinguistic Model of Hospitality To accomplish the abovementioned objectives, a sound theoretical basis must be provided. Figure 1
introduces a sociolinguistic model of hospitality. This model might offer a starting point for future hospitality research. The model aims to specify how hospitality in a social relationship can be achieved by means of linguistic expressions.
The combination of the characteristics of the speaker (e.g. social class, gender and age) and those of the receiver is thought to determine to what extent their relationship is characterized by power (Brown & Gilman, 1960), distance (Brown & Levinson, 1987), respect (Schreurs & De Jonge, in prep) and solidarity (Brown & Gilman, 1960). The particular configuration of these factors determines which specific grade of politeness is desired, and therefore also which linguistic expressions are most appropriate2. This necessary fit between a social relationship and its linguistic expressions is displayed in figure 1 as a balance. As an example, within the social relationship between guest and employee of a hotel reception in Spain, it might be most appropriate to use the
2Linguistic expressions refer to the appearance of a linguistic aspect, such as forms and terms of address (e.g. you, proper names, Mr., Mrs.), particles, intervals and turns, as well as prosodic aspects such as pitch, velocity of speech, stress and loudness.
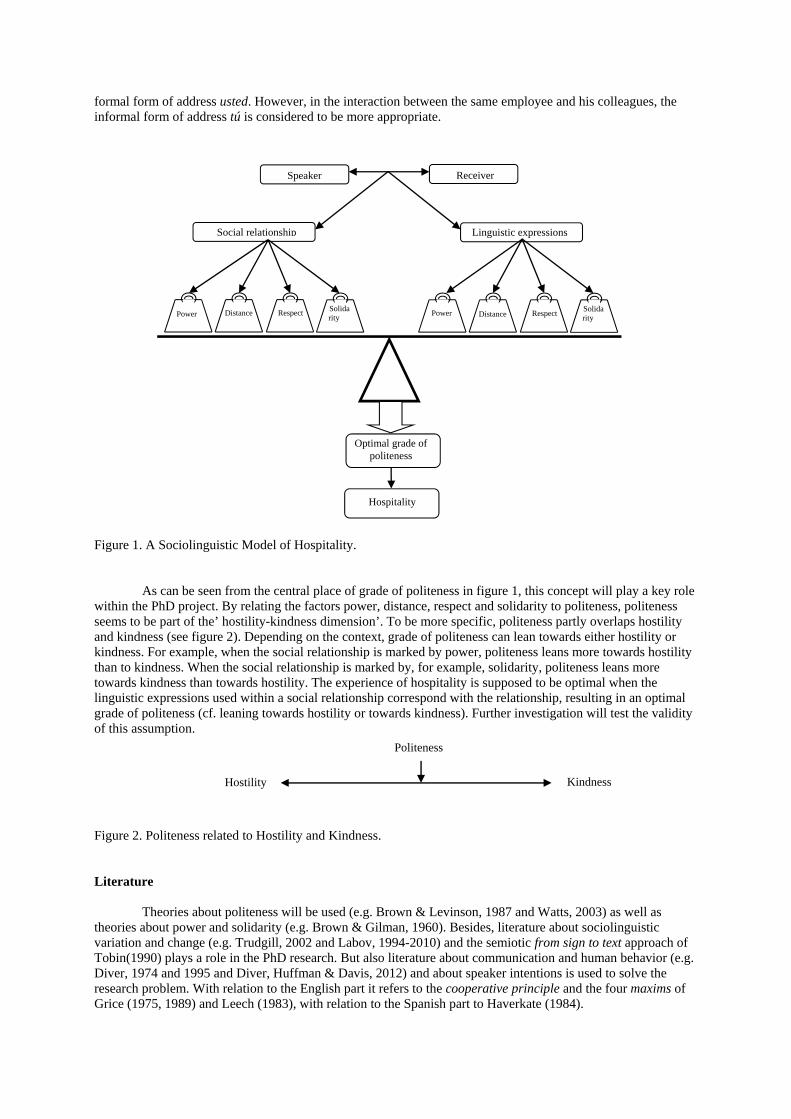
formal form of address usted. However, in the interaction between the same employee and his colleagues, the informal form of address tú is considered to be more appropriate.
Figure 1. A Sociolinguistic Model of Hospitality.
As can be seen from the central place of grade of politeness in figure 1, this concept will play a key role
within the PhD project. By relating the factors power, distance, respect and solidarity to politeness, politeness seems to be part of the’ hostility-kindness dimension’. To be more specific, politeness partly overlaps hostility and kindness (see figure 2). Depending on the context, grade of politeness can lean towards either hostility or kindness. For example, when the social relationship is marked by power, politeness leans more towards hostility than to kindness. When the social relationship is marked by, for example, solidarity, politeness leans more towards kindness than towards hostility. The experience of hospitality is supposed to be optimal when the linguistic expressions used within a social relationship correspond with the relationship, resulting in an optimal grade of politeness (cf. leaning towards hostility or towards kindness). Further investigation will test the validity of this assumption.
Figure 2. Politeness related to Hostility and Kindness. Literature
Theories about politeness will be used (e.g. Brown & Levinson, 1987 and Watts, 2003) as well as
theories about power and solidarity (e.g. Brown & Gilman, 1960). Besides, literature about sociolinguistic variation and change (e.g. Trudgill, 2002 and Labov, 1994-2010) and the semiotic from sign to text approach of Tobin(1990) plays a role in the PhD research. But also literature about communication and human behavior (e.g. Diver, 1974 and 1995 and Diver, Huffman & Davis, 2012) and about speaker intentions is used to solve the research problem. With relation to the English part it refers to the cooperative principle and the four maxims of Grice (1975, 1989) and Leech (1983), with relation to the Spanish part to Haverkate (1984).
Social relationship
Optimal grade of politeness
Linguistic expressions
Hospitality
Receiver
Power Distance Respect Solida rity
Power Distance RespectSolida rity
Speaker
Hostility Kindness
Politeness
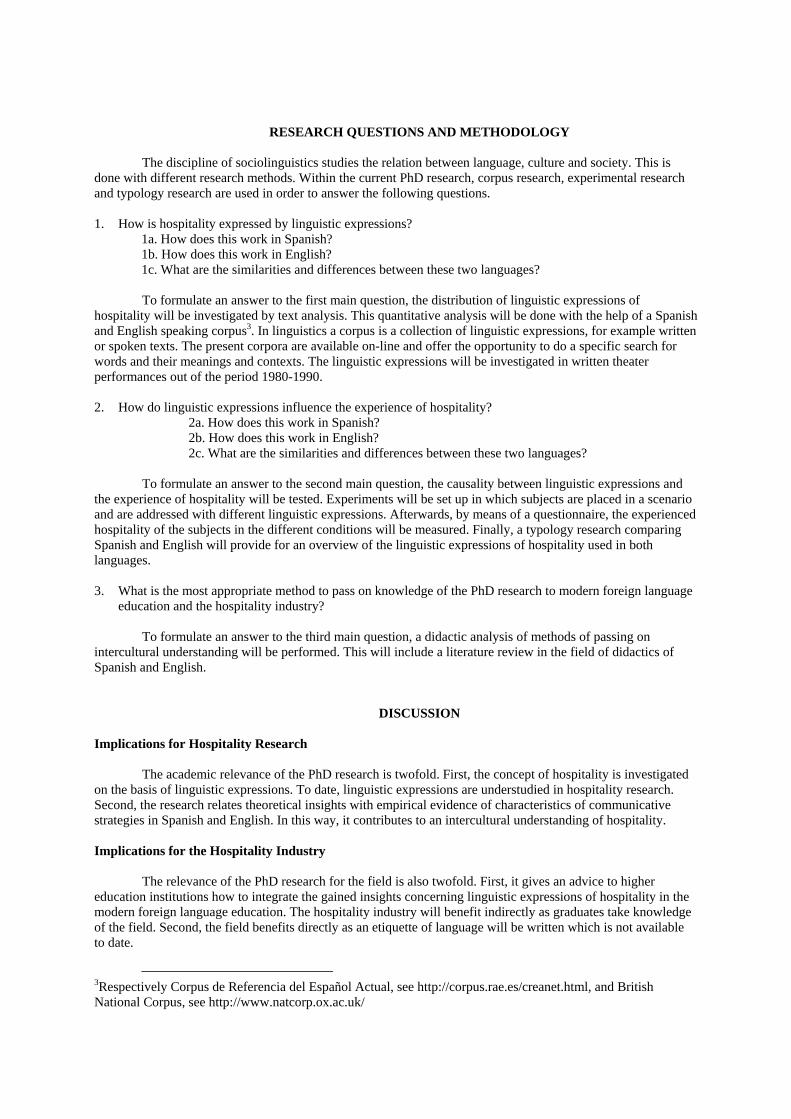
RESEARCH QUESTIONS AND METHODOLOGY The discipline of sociolinguistics studies the relation between language, culture and society. This is
done with different research methods. Within the current PhD research, corpus research, experimental research and typology research are used in order to answer the following questions.
1. How is hospitality expressed by linguistic expressions?
1a. How does this work in Spanish? 1b. How does this work in English? 1c. What are the similarities and differences between these two languages? To formulate an answer to the first main question, the distribution of linguistic expressions of
hospitality will be investigated by text analysis. This quantitative analysis will be done with the help of a Spanish and English speaking corpus3. In linguistics a corpus is a collection of linguistic expressions, for example written or spoken texts. The present corpora are available on-line and offer the opportunity to do a specific search for words and their meanings and contexts. The linguistic expressions will be investigated in written theater performances out of the period 1980-1990.
2. How do linguistic expressions influence the experience of hospitality?
2a. How does this work in Spanish? 2b. How does this work in English? 2c. What are the similarities and differences between these two languages?
To formulate an answer to the second main question, the causality between linguistic expressions and the experience of hospitality will be tested. Experiments will be set up in which subjects are placed in a scenario and are addressed with different linguistic expressions. Afterwards, by means of a questionnaire, the experienced hospitality of the subjects in the different conditions will be measured. Finally, a typology research comparing Spanish and English will provide for an overview of the linguistic expressions of hospitality used in both languages.
3. What is the most appropriate method to pass on knowledge of the PhD research to modern foreign language
education and the hospitality industry? To formulate an answer to the third main question, a didactic analysis of methods of passing on
intercultural understanding will be performed. This will include a literature review in the field of didactics of Spanish and English.
DISCUSSION
Implications for Hospitality Research The academic relevance of the PhD research is twofold. First, the concept of hospitality is investigated
on the basis of linguistic expressions. To date, linguistic expressions are understudied in hospitality research. Second, the research relates theoretical insights with empirical evidence of characteristics of communicative strategies in Spanish and English. In this way, it contributes to an intercultural understanding of hospitality.
Implications for the Hospitality Industry
The relevance of the PhD research for the field is also twofold. First, it gives an advice to higher
education institutions how to integrate the gained insights concerning linguistic expressions of hospitality in the modern foreign language education. The hospitality industry will benefit indirectly as graduates take knowledge of the field. Second, the field benefits directly as an etiquette of language will be written which is not available to date.
3Respectively Corpus de Referencia del Español Actual, see http://corpus.rae.es/creanet.html, and British National Corpus, see http://www.natcorp.ox.ac.uk/
Hospitality industry can also benefit from the gained insights by making their employees aware of the effect of language on hospitality, for example, by means of a training. Finally, the implementation or adaptation of a communication protocol of, for example, the reception of a hotel, can be realized.
REFERENCES
Brown, R. & Gilman, A. (1960). The pronouns of power and solidarity (3rd ed.). In: T.A. Sebeok, (Ed.). Style in Language (pp. 253-276). Cambridge, MA: Massachusetts Institute of Technology.
Brown, P. & Levinson, S.C. (1987). Politeness: Some Universals in Language Usage (18th ed.). Cambridge: University Press.
Diver, W. (1974). Substance and value in linguistic analysis. Semiotext(e), 1, 13-30. Diver W. (1995). Theory. In: E. Contini-Morava & B. Goldberg, (Eds.). Meaning as Explanation: Advances in
Sign-Based Linguistics. Berlijn: Mouton de Gruyter. Diver, W., Huffman, A. & Davis, J. (2012). Language: Communication and Human Behaviour: the Linguistic
Essays of William Diver. Leiden: Brill. Grice, H.P. (1975). Logic and conversation. In: P. Cole & J. Morgan, (Eds.). Syntax and Semantics, 3: Speech
Acts (pp. 41–58). New York: Academic Press. Grice, H.P. (1989). Studies in the Way of Words (SWW). Cambridge MA: Harvard University Press. Haverkate, H. (1984). Speech Acts, Speakers and Hearers: Reference and Referential Strategies in Spanish.
Amsterdam/Philadelphia: John Benjamins Publishing Company. Hooghe, M., Trappers, A., Meuleman, B. & Reeskens, T. (2008). Migration to European countries: A structural
explanation of patterns, 1980–2004. International Migration Review, 42 (2), 476-504. doi:10.1111/j.1747-7379.2008.00132.x
Labov, W. (1994-2010). Principles of Linguistic Change. Oxford: Blackwell. Leech, G. (1983). Principles of Pragmatics. London: Longmans. Schreurs, L. (2006). Las formas de tratamiento en la obra de Tomás Carrasquilla (1858-1940). Estudio sobre el
español colombiano antioqueño. (unpublished manuscript, to consult via: http://www.frederieke.com/scriptie.pdf).
Schreurs, L. & De Jonge, R. (in prep). Las formas de tratamiento en el siglo XVIII: Estudio sobre el español colombiano antioqueño.
Sevilla Muñoz, J. & Sevilla Muñoz, M. (2005). La equivalencia semántica y pragmática de las fórmulas de cortesía. Found on 23rd of November 2011 on the internet: http://cvc.cervantes.es/trujaman/anteriores/febrero_05/01022005.htm
Tobin, Y. (1990). Semiotics and Linguistics. London/New York: Longman. Trudgill, P. (2002). Sociolinguistic Variation and Change. Washington: Georgetown University Press. Watts, R.J. (2003). Politeness. Key Topics in Sociolinguistics. Cambridge: University Press.
Assessing Effects of Acculturation on Service Failure Responses: Insights from Australian-Chinese Consumers
Karin Weber* Associate Professor
School of Hotel & Tourism Management Hong Kong Polytechnic University
Hong Kong SAR, China E-mail:[email protected]
Beverley Sparks
Professor Griffith Business School
Griffith University, PMB 50, GCMC, 9726, QLD Australia
Cathy Hsu Professor
School of Hotel & Tourism Management Hong Kong Polytechnic University
Hong Kong SAR, China
* Corresponding Author
Abstract Drawing on acculturation theory, the purpose of this study was to identify differences in perceptions of and responses to service failures among Chinese consumers who have lived for extended periods in a Western culture, and in the process have adopted different acculturation strategies. Utilizing an experimental design, data was collected from 600 ethnic Chinese who resided in two major cities in Australia. Their perceptions of a service failure were ascertained, with particular consideration of the impact of the location of the service failure (Australia versus Mainland China) and the occasion (family versus business) Results indicate significant differences among respondents, depending on the extent of their acculturation., that need to be considered by service providers targeting multi-cultural customers. Keywords: Acculturation, Chinese consumers, service failure
A Better Hospitality Industry in the United Arab Emirates: Nationalisation in Rotana Hotels
Olga Kampaxi, Dr Lecturer
Cesar Ritz Colleges Englisch-Gruss Strasse 43
CH 3902 Switzerland
ABSTRACT
With a strong emphasis on Nationalisation in the private sector from the United Arab Emirates Government, Rotana Hotels launched the Duroob Programme, to attract more GCC Nationals. With the Emirate population being a minority in their own country (Al-Ali, 2008) and every sector government or private competing for the best, a challenging task was at hand. The Emiratis for various reasons ranging from social, cultural, working conditions are not attracted to join the hospitality sector. Emiratisation percentages achieved by the hotel industry in 2006 as reported by The National Human Resource Development & Employment Authority (TANMIA, 2007) have achieved less than 1% in relation to their manning. Despite an internal quota, Rotana was still struggling to meet the target of two per cent. This paper explores the Nationalisation journey of Rotana Hotels, lessons learnt, and ways to overcome the challenges.
Key words: Emiratisation, Hospitality, Nationalisation, Employment Practices, Retention, Rotana Group
A STUDY OF EMOTIONAL LABOUR OF FAST FOOD EMPLOYEES
Dr. Hazrina Ghazali* Lecturer
University PUTRA Malaysia Serdang, Selangor, Malaysia
Nurhasmilaalisa Abdul Halim Tutor
University PUTRA Malaysia Serdang, Selangor, Malaysia [email protected]
and
Yap Sing Yee
Student University PUTRA Malaysia Serdang, Selangor, Malaysia
Abstract
This study aims to investigate the level of agreement on emotional labour strategies that include standard scripts, dress code and acting. A survey questionnaire used to underpin this study and 170 respondents participated in this study. Data were analysed by using SPSS and findings found that the use of standard scripts, dress code and acting had from moderate to high level of agreement on employees’ emotion. Results also found that standard scripts helped employees to better understand about customers and improve their social skills. Fast food employees agreed that dress code enable them to be more sociable and lead more strengths than weakness. Results also revealed that acting assisted fast food employees to satisfy the customer requirements. Key Words: Emotional labour; Standard scripts; Dress codes; Acting; Fast food industry; Kuala Lumpur
INTRODUCTION
Emotional labour is relatively a new concept that has only been given attention in recent years. Fundamentally, emotional labour is the responsibility of service staff in managing their emotions, feelings and behaviours in workplace (Diefendorff & Richard, 2003). They were expected to be an actor in order to convey the positive emotions, such as friendliness and kindliness to enhance customer loyalty and experiences (Ashkanasy, Hartel & Daus, 2002; Hochschild, 1979; Kim, 2008). The frontline workers who engaged in emotional labours are required to handle the feelings of their customers and themselves (Hochschild, 1983). For example, they are required to presenting smiles, creating eye contacts and performing real caring to customers’ demands. Nevertheless, they should not always display their actually emotions and feelings whereas they have to reveal the emotions that more benefits to the establishment and less consider their true feeling (Hochschild, 1983; Groth, Hennig-Thurau and Walsh, 2009). This study arises because majority of the researches were in done in other countries especially in Western countries. In Malaysia, researches on ‘emotional labour’ has not yet widely explored. The most helpful piece was done by Motaghi-Pisheh and Harianto (2011). They carried out research about emotional labour of employee hotel in Penang, Malaysia and found that surface acting was the primary factor of various kinds of workplace violence. On the other hand, this current research aimed to investigate the influences of emotional labour strategies, such as standard scripts, dress code and acting on emotion management of fast food employees. Accordingly, the specific study objectives were ; a) to determine the relationship of employing the standard scripts towards emotion management of fast food employee ; b) to identify the relationship of dress codes towards emotion regulation of fast food employee and to distinguish the relationship of acting towards emotion adjustment of fast food employee.
LITERATURE REVIEW
Standard Scripts
One of the alternatives to monitor employees who have higher interactions with customers is by introducing a general guideline like scripts. Scripts have been widely applied in service industry (Hubbert, Sehorn and Brown, 1995; Schank and Albelson 1997; Volden and Johnston, 1999). Nottenburg and Shoben (1980) explained that scripts of restaurants anywhere in the world are almost identical, yet the primary distinction was the technique to manage the scripts. For example, major script norms of employees in fast food restaurant were greetings guests at the entrance and counter, taking order, offering and suggesting menu, accepting payment, preparing food and expressing thank to customers (Hsu and Chiang, 2010). Script referred to a generalized episode that was effective for producing a stereotypical situation (Schank and Abelson, 1997). On the other hand, it can be viewed as the sequence of actions which an individual should performed for ensuring the certain event to take place (Alberson, 1981; Pryor and Merluzzi, 1985). Dress Codes
Dress code of an organization can be exemplified as uniform wear by employees when they are
performing duties. Associational uniforms are not only encompass the dress like shirts, blouses, skirts and pants but also included artifact, such as name card, ornaments and smock linen over garment (Rafaeli and Pratt, 1993). Frequently, dress code integrates the process of transferring the enormous vary of indescribable meanings through nonverbal cues (Damhorst, 1990). Thus, it is an effective instrument to convey an individual’s characteristics, personality, emotions, and behaviours to others (Stone, 1962). In view of that, Solomon (1987) acknowledged that the investments of institutions in the aspect of worker’s attires are approximately achieving billions of dollars every year. Dress code is the most noticeable feature of an establishment (Ludicke, 1990). It portrayed the image of the establishment and also improved the organization overall presentation (Nelson and Bowen, 2000). They futher elaborated that code of dress played the significant role in process of constructing brand identity of an establishment. It was a powerful tool to convey the organization concepts and values to customers. Similarly, suitable uniform enables the employees to be more sociable and easier to carry out their duty (Laptisky and Smith, 1981; Lennon and Miller, 1984). Acting
Act can be defined as an action of role playing to pretend the expression of certain behaviour
(Hyperdictionary, 2009). In other words, acting can be illustrated as sacrifice of truthfully convey their true self (Stomer and Devine, 2008). Principally, Hochschild (1983) recognized that employees perform emotional labour practice through two techniques including surface acting and deep acting. Surface acting is emphasises on the external behaviours which including the imitating the ideal emotions through verbal and nonverbal cues while the inner feelings remain constant. In detail, surface acting requires staffs carefully to present the emotions that not actually being felt. It incorporates the process of faking and exaggerating the external attitudes and behaviours without modifying inner feelings. Therefore, there are contradictions between their reveal behaviour and felt emotions. This scenario has taken place because of the actions of management to restrain the display emotions of employees by rules. Furthermore, deep acting is stresses on the inner feelings when employees strive hard to regulate their actual emotions and behaviours (Hochschild, 1983). Deep acting integrates the suppression of inner feelings and also careful consideration of their felt emotions (Beal et al, 2006; Motaghi-Pisheh and Harianto, 2011).
METHODOLOGY
This study employed a quantitative approach and respondents were selected by a convenience sampling. Prior to data collection process, permission was obtained from the managers on duty and respondents were given a full explanation about the research and confirmed the information gathered was solely for the purpose of the study. A total of 200 questionnaires were distributed to employees who were currently worked at selected fast food outlets which located in the shopping mall within Klang Valley. A 170 usable responses were returned for analysis accounted for 85 percent response rate. The development of the survey questionnaire was based on study done by Seymour (2000). The questionnaire consisted of four parts. Part A of the questionnaire included questions on the usage of standard scripts and Part B was to identify the relationship of
dress codes toward employee’s emotion. In Part C, questions asked on the aspect of acting or authenticity. Lastly, Part D included questions on employee’s personal information. Respondents were requested to specify their level of agreement based on the 5-point Likert scale in the questionnaires where ‘1’ equals to ‘strongly disagree’ and ‘5’ equals to ‘strongly agree’.
FINDINGS
The sample includes a higher number of males (56.5 percent) than female employees (43.5 percent). Majority of respondents were between 21 years old to 29 years old (64.7 percent) and followed by those aged below than 20 years old (28.2 percent). The analyses of survey were done using Statistical Package for Social Science (SPSS) version 19. Findings found that the use of standard scripts, dress code and acting had from moderate to high level of agreement on employees’ emotion. Descriptive results found that standard scripts helped employees to better understand about customers as well as improve their social skills. The result showed that standard scripts improved interpersonal skills of employees and further assisted them to be aware of customers’ requirements in order to convey the high quality services. Similarly, fast food employees agreed that dress code enable them to be more sociable and subsequently lead more strengths than weakness. Result of this study are consistent with the perceptions of Laptisky and Smith (1981) as well as Lennon and Miller (1984) that employees are able to build up more friendliness and pleasurable companionship with customers through proper dress codes. Finally, result also revealed that acting assisted fast food employees to satisfy the customer requirements. The details of the results are shown in Table 1.
Table 1 Mean Score and Standard Deviation of Respondents
Dimension Items Mean Standard Deviation
Standard scripts Provide me better understanding about the customers’ behaviors
4.09 0.752
Improve my social skills 4.09 0.827 Decrease my ability to communicate with the customers
3.48 1.116
Dress codes Enable me to be more sociable 4.1 0.71 Construct a sense of self concept 3.78 0.853
Acting Develop the mutual understanding between customers and me
3.99 0.73
Assist me to satisfy the customer requirements
3.99 0.75
Enable me to provide personalized services
3.99 0.726
Cause me lose my own personality 3.59 1.030 Note: 1 = strongly disagree, 2 = disagree, 3 = neutral, 4 = agree, 5 = strongly agree
CONCLUSIONS The concept of ‘emotional labour’ has not received very much attention yet in Malaysian fast food
industry. From a managerial perceptive, this study shed light by providing information on ‘emotional labour’ and managing employee emotions. Firstly, higher agreement levels on practical functions of emotional labour strategies indicated that standard scripts, dress codes and acting should be practised to enhance the service quality and customer satisfactions. Secondly, effective recruitment system is the essential procedure to select right job candidates who suite with the professions. Ang et al, (2010) recommended that one of the dominant techniques is to request the job applicants to undergo personality test or emotional intelligence test during interview process. Higher ranking of emotional intelligent indicates that they are performing deep acting (McShane and Von Glinow, 2010). Thus, they have higher capability to cope with their inner feelings and display behaviours. On the other hand, higher grading of personality test will signify that they have strong affirmative characteristics and affectivity (Chu, 2002). Kim (2008) drawn that managements should hire individuals who possess higher extraversion but lack in neuroticism because they have adopted deep acting and able offer more sincere and faithfulness services. In short, management can evaluate the actual behaviours and attitudes along with the ability to manage their emotions via personality and emotional intelligence tests. Apart from that, leaders should be educated to direct their employees’ emotions, empower their subordinates, manage customer complaints and offer responses to customers via proper modes (Chu, 2002). In fast food industry context, managers should always understand and recognize emotional dedication of employees through proper
compensation or reward. For instance, Ang et al. (2010) declared that salary and wages of employees should be always based on their painstaking efforts. Likewise, incentives and promotional opportunities should be proposed to employees who have outstanding performances. As this study is believed to be the first such study in the Malaysian fast food context, the findings, it is hoped will help the managers at the head offices to plan crucial strategies in managing their employees and ultimately help the employee not only to improve their job performance but also deliver quality service to customers. The results from this study potentially may be used to help fast food employees to better manage their emotion when deals with customers.
REFERENCES
Abelson, R. P. (1981). Psychological status of the script concept. American Psychologist, 36(7), 715-729. Ang, M. C. H., Supinah, R., Japang, M., & Nasah, C. R. J. (2010). Service with a smile: A human resources
perspective of emotional labor. Retrieved July 19, 2011, from http://eprints.ums.edu.my/2834/1/ar0000000050.pdf
Ashkanasy, N. M., Hartel, C. E. J., & Daus, C. S. (2002). Diversity and emotion: The new frontiers in
organizational behavior research. Journal of Management, 28(3), 307-338. Beal, D. J., Trougakos, J. P., Weiss, H. M., & Green, S. G. (2006). Episodic processes in emotional labor:
Perceptions of affective delivery and regulation strategies. Journal of Applied Psychology, 91(5), 1053-1065.
Bitner, M. J. (1995). Building service relationships: It’s all about promises. Journal of the Academy of
Marketing Science, 23(4), 246-251. Chu, P. C. (1997). Actors and scripts: Object-oriented simulation of enterprise systems. Journal of Systems and
Software, 37(3), 187-199. Damhorst, M. L. (1990). In search of a common thread: Classification of information communicated through
dress. Clothing and Textiles Research Journal, 8(2), 1-12. Gioia, D. A., Donnellon, A., & Sims, H. P., Jr. (1989). Communication and congnition in appraisal: A tale of
two paradigms. Oraganization Studies, 10(4), 503-530. Diefendorff, J. M., & Richard, E. M. (2003). Antecedents and consequences of emotional display rule
perceptions. Journal of Applied Psychology, 88(2), 284-294. Gross, E., & Stone, G. P. (1964). Embarrassment and the analysis of role requirements. American Journal of
Sociology, 70(1), 1-15. Hsu, T. H., & Chiang, C. Y. (2010). Script comparisons during service encounters in fast-food chains. Tourism Hubbert, A. R., Sehorn, A. G., & Brown, S. W. (1995). Service expectation: The customer versus the provider.
International Journal of Service Industry Management, 6(1), 6-21. Hochschild, A. R. (1979). Emotion work, feeling rules, and social structure. American Journal of Sociology,
85(3), 551-575. Hochschild, A. R. (1983). The managed heart: Commercialisation of human feeling. Berkeley, CA: University
of California Press. Hyperdictionary. (2009). Act. Retrieved June 25, 2011, from
http://www.hyperdictionary.com/search.aspx?define=act Kim, H. J. (2008). Hotel service providers’ emotional labor: The antecedents and effects on burnout.
International Journal of Hospitality Management, 27(2), 151-161.
Lapitsky, M., & Smith, C. M. (1981). Impact of clothing on impressions of personal characteristics and writing ability. Home Economic Research Journal, 9(4), 327-355.
Leidner, R. (1993). Fast food, fast talk: Service work and the routinization of everyday life. Berkeley, CA:
University of California Press. Lennon, S. J., & Miller, F. G. (1984). Salience of physical appearance in impression formation. Home
Economics Research Journal, 13(2), 95-104. Ludicke, S. C. (1990). 90s uniforms project image to guests. Lodging, 4, 77-78. Nelson, K., & Bowen, J. (2000). The effect of employee uniforms on employee satisfaction. The Cornell Hotel
and Restaurant Administration Quarterly, 41(2), 86-95. Schank, R. C., & Abelson, R. P. (1997). Scripts, plans, goals and understanding: An inquiry into human
knowledge structures. Hillsdale, NJ: Lawrence Erlbaum Associates. Seymour, D. (2000). Emotional labor: A comparison between fast food and traditional service work.
International Journal of Hospitality Management, 19(2), 159-171. Shoemaker, S. (1996). Scripts: Precursor of consumer expectations. Cornell Hotel and Restaurant
Adminstration Quarterly, 31(1), 42-53. Stone, G. P. (1962). Appearance and the self. In A.M. Rose (Ed.), Human behavior and social processes: An
interactionist approach (pp. 86-118). New York: Houghton Mifflin. Stormer, F., & Devine, K. (2008). Acting at work: Facades of conformity in academia. Journal of Management
Inquiry, 17(2), 112-134. Solomon, M. R. (1987). Standard issue. Psychology Today, 21(12), 30-31. Pryor, J. B., & Merluzzi, T. V. (1985). The role of expertise in processing social interaction scripts. Journal of
Experimental Social Psychology, 21(4), 362-379. McShane, S. L., & Von Glinow, M. A. (2010). Organizational behavior: Emerging knowledge and practice for
the real world (5th ed.). Boston: McGraw-Hill. Motaghi-Pisheh, M. H., & Harianto. (2011). Investigating the occurrence of workplace aggression of front-line
staff of hotel industries in Penang Island by assigning emotional labour as predictor. Retrieved June 23, 2011, from www.eurojournals.com/IBBA_10_15.pdf
Nottenburg, G., & Shoben, E. J. (1980). Scripts as linear orders. Journal of Experimental Social Psychology,
16(4), 329-347. Rafaeli, A. (1993). Dress and behavior of customer contact employee: A framework for analysis. Advances in
Service Marketing and Management, 2, 175-211. Volden, J., & Johnston, J. (1999). Cognitive scripts in autistic children and adolescents. Journal of Autism and
Development Disorder, 29(3), 203-211.
HOSPITALITY EMPLOYEE WELL-BEING:
INSIGHT FROM A LUXURY HOTEL IN THAILAND
Ewa M. Mottier* Les Roches-Gruyère University of Applied Sciences/Les Roches International School of
Hotel Management, 3975 Bluche, Crans-Montana, Switzerland, [email protected]
Robert A. Lewis Les Roches-Gruyère University of Applied Sciences/Les Roches International School of
Hotel Management, 3975 Bluche, Crans-Montana, Switzerland, [email protected]
ABSTRACT
This study aims to evaluate the experiences of hotel employees at the Mandarin Oriental Bangkok and to show how the new employee centre called the ‘O-Zone’ contributes to employees’ well-being. Questionnaires, containing attitude scales and opened-ended questions, measured the perceptions of employees. The study suggests that the creation of the O-Zone employee centre increased positive opinions of employee facilities. The results of this research also reveal that the O-Zone positively influenced employees’ motivation. This contributes to a deeper understanding of hotel employees’ satisfaction and motivation in the Thai context.
Keywords: employee well-being, luxury hotel employees, Thailand
INTRODUCTION
Sparks et al. (2001) suggest that the use of technology, globalization, organizational restructuring and work scheduling transform the nature of work in many organizations. Vanhala and Tuomi (2003) argue that personal satisfaction constitutes an important factor of employee well-being. This study aims to investigate employees’ perceived satisfaction and motivation at the Mandarin Oriental Bangkok before and after the opening of the new employee centre, called the ‘O-Zone’. The O-Zone is a centre on the 2nd floor of the hotel’s River Wing dedicated to employees. It groups together recreation and relaxation areas together with the traditional elements of hotel employee needs, such as changing areas and uniforms.
LITERATURE REVIEW
Human resources management in the hospitality industry faces challenges in employee hiring and retention (Breiter et al., 2002). Organisations try to attract and retain the best employees by offering enhanced working conditions. According to Vanhala and Tuomi (2006), human resources practices, such as recognition or continuous improvement, are positively related to employee satisfaction (cf. Taris and Schreurs, 2009). Employees’ well-being is dependent on organization support (Eisenberg et al., 1986 cited in Kim et al. 2009). Organisational support emphasises the recognition of employees who outperform (Scott, 1994). Susskind et al. (2000) found that organizational support perceived by employees influenced job satisfaction. Kim et al. (2009) also demonstrated the positive relationship between organisational support and job satisfaction. Organisational practice perceived by employees and their well-being are strongly related (Schultz et al., 1995, Kalliath et al. 2000 cited in Vanhala and Tuomi, 2006). According to Vanhala and Tuomi (2003), employee well-being is related to the working environment and organisational climate. The positive association between satisfaction in the workplace and job satisfaction is also echoed by So Young (2006).
Panmunin’s (1993) research about employees’ job satisfaction in the Thai hotel industry shows that
hospitality employees are satisfied with their job. One of the reasons for their satisfaction is a good working environment offered by hotel companies in Thailand. Churint’s (2010) study investigated hotel employee retention in Thailand. However, the order of importance is inverted for operational level employees.
Attracting and retaining employees is one of the challenges faced by human resources management in
the hospitality industry (Breiter et al, 2002). Kovach (1987), based on a longitudinal study amongst workers, developed ten motivational factors. Among them, working conditions are important. Working conditions experienced by participants in the Poulston study (2009) indicate that their motivation would be inhibited because of dissatisfaction with their working conditions. Maroudas et al. (2008) studied employees’ motivation in the luxury hotel industry. Therefore, employees are motivated when they are supported by management (Parfyonova, 2009). DiPietro’s (2007) study shows that creating a positive work environment helps improve overall motivation. Maneenetr (2010) studied employee motivation and working behaviour in the tourism business in Thailand.
The above literature review reveals the following research questions (which were investigated within
the context of the Mandarin Oriental Bangkok): - How do employees at the Mandarin Oriental Bangkok perceive satisfaction from the O-Zone? - How do employees at the Mandarin Oriental Bangkok perceive effects of the O-Zone on employee
motivation?
METHODOLOGY
This study is based on an exploratory case study approach (Yin, 2009). The new employee centre opened in November 2010 and contains all elements of a hotel. The O-Zone is divided into ten distinctive areas: Sell, Fashion, His, Hers, Health, Café 48, Talent, Mind, Dream and Relax. Research questions were investigated through the interpretation of replies retrieved in questionnaires.
Access to the study was approved by the general manager of the Mandarin Oriental hotel Bangkok.
The hotel had already implemented the O-Zone when access was given for this study. This study therefore measures employees’ perceptions of their experiences (before and after) of the O-Zone at one point in time. Data collected for this research is based on self-administered questionnaires, distributed by researchers through
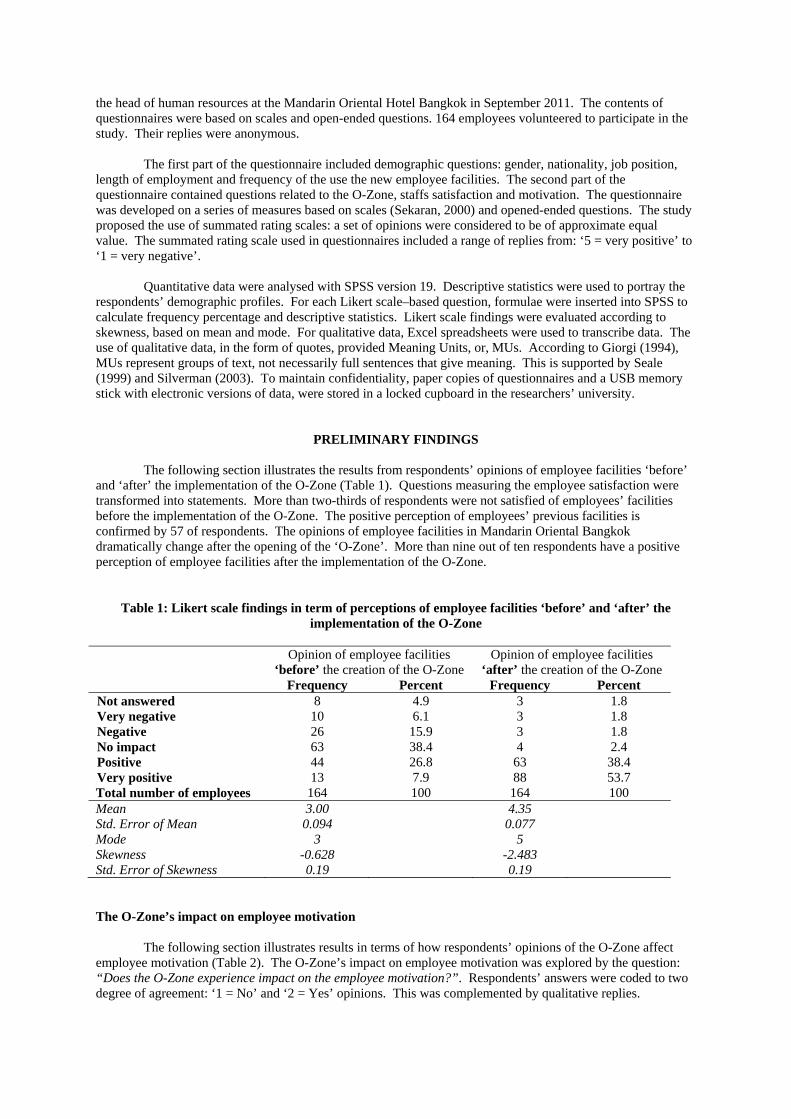
the head of human resources at the Mandarin Oriental Hotel Bangkok in September 2011. The contents of questionnaires were based on scales and open-ended questions. 164 employees volunteered to participate in the study. Their replies were anonymous.
The first part of the questionnaire included demographic questions: gender, nationality, job position,
length of employment and frequency of the use the new employee facilities. The second part of the questionnaire contained questions related to the O-Zone, staffs satisfaction and motivation. The questionnaire was developed on a series of measures based on scales (Sekaran, 2000) and opened-ended questions. The study proposed the use of summated rating scales: a set of opinions were considered to be of approximate equal value. The summated rating scale used in questionnaires included a range of replies from: ‘5 = very positive’ to ‘1 = very negative’.
Quantitative data were analysed with SPSS version 19. Descriptive statistics were used to portray the
respondents’ demographic profiles. For each Likert scale–based question, formulae were inserted into SPSS to calculate frequency percentage and descriptive statistics. Likert scale findings were evaluated according to skewness, based on mean and mode. For qualitative data, Excel spreadsheets were used to transcribe data. The use of qualitative data, in the form of quotes, provided Meaning Units, or, MUs. According to Giorgi (1994), MUs represent groups of text, not necessarily full sentences that give meaning. This is supported by Seale (1999) and Silverman (2003). To maintain confidentiality, paper copies of questionnaires and a USB memory stick with electronic versions of data, were stored in a locked cupboard in the researchers’ university.
PRELIMINARY FINDINGS
The following section illustrates the results from respondents’ opinions of employee facilities ‘before’ and ‘after’ the implementation of the O-Zone (Table 1). Questions measuring the employee satisfaction were transformed into statements. More than two-thirds of respondents were not satisfied of employees’ facilities before the implementation of the O-Zone. The positive perception of employees’ previous facilities is confirmed by 57 of respondents. The opinions of employee facilities in Mandarin Oriental Bangkok dramatically change after the opening of the ‘O-Zone’. More than nine out of ten respondents have a positive perception of employee facilities after the implementation of the O-Zone.
Table 1: Likert scale findings in term of perceptions of employee facilities ‘before’ and ‘after’ the implementation of the O-Zone
Opinion of employee facilities
‘before’ the creation of the O-Zone Opinion of employee facilities
‘after’ the creation of the O-Zone Frequency Percent Frequency Percent
Not answered 8 4.9 3 1.8 Very negative 10 6.1 3 1.8 Negative 26 15.9 3 1.8 No impact 63 38.4 4 2.4 Positive 44 26.8 63 38.4 Very positive 13 7.9 88 53.7 Total number of employees 164 100 164 100 Mean 3.00 4.35 Std. Error of Mean 0.094 0.077 Mode 3 5 Skewness -0.628 -2.483 Std. Error of Skewness 0.19 0.19
The O-Zone’s impact on employee motivation
The following section illustrates results in terms of how respondents’ opinions of the O-Zone affect employee motivation (Table 2). The O-Zone’s impact on employee motivation was explored by the question: “Does the O-Zone experience impact on the employee motivation?”. Respondents’ answers were coded to two degree of agreement: ‘1 = No’ and ‘2 = Yes’ opinions. This was complemented by qualitative replies.
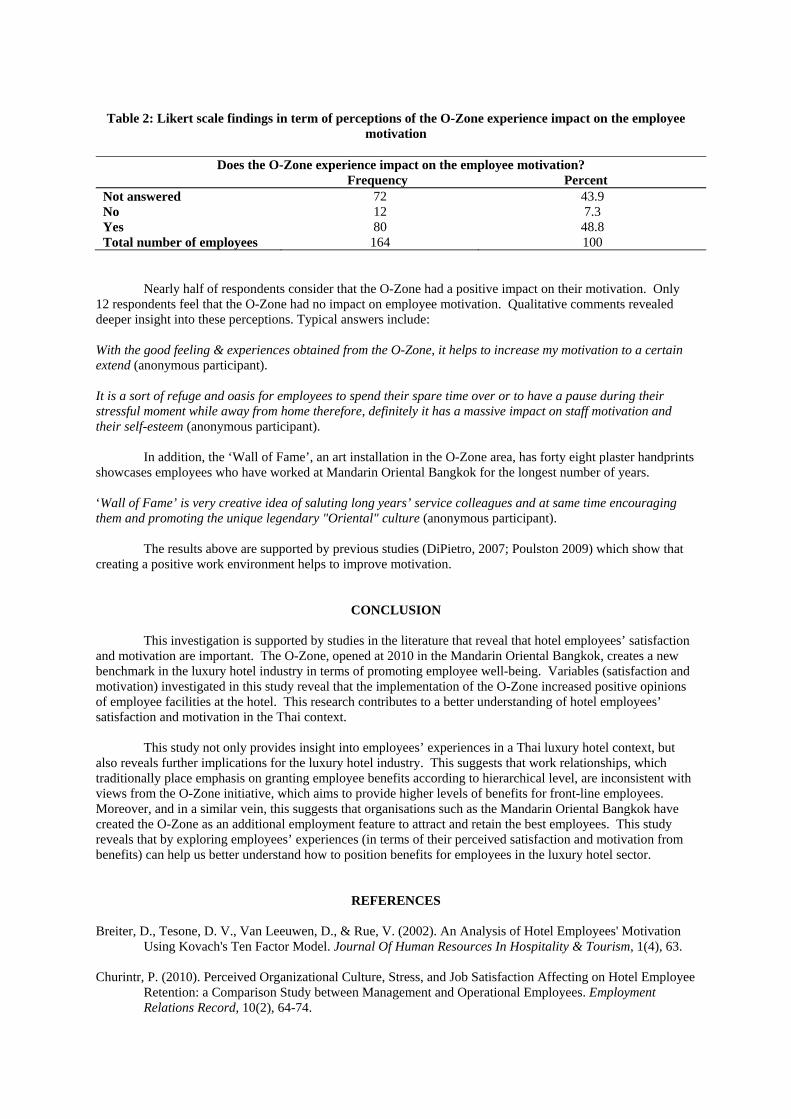
Table 2: Likert scale findings in term of perceptions of the O-Zone experience impact on the employee
motivation
Does the O-Zone experience impact on the employee motivation? Frequency Percent
Not answered 72 43.9 No 12 7.3 Yes 80 48.8 Total number of employees 164 100
Nearly half of respondents consider that the O-Zone had a positive impact on their motivation. Only 12 respondents feel that the O-Zone had no impact on employee motivation. Qualitative comments revealed deeper insight into these perceptions. Typical answers include: With the good feeling & experiences obtained from the O-Zone, it helps to increase my motivation to a certain extend (anonymous participant). It is a sort of refuge and oasis for employees to spend their spare time over or to have a pause during their stressful moment while away from home therefore, definitely it has a massive impact on staff motivation and their self-esteem (anonymous participant).
In addition, the ‘Wall of Fame’, an art installation in the O-Zone area, has forty eight plaster handprints showcases employees who have worked at Mandarin Oriental Bangkok for the longest number of years.
‘Wall of Fame’ is very creative idea of saluting long years’ service colleagues and at same time encouraging them and promoting the unique legendary "Oriental" culture (anonymous participant).
The results above are supported by previous studies (DiPietro, 2007; Poulston 2009) which show that creating a positive work environment helps to improve motivation.
CONCLUSION
This investigation is supported by studies in the literature that reveal that hotel employees’ satisfaction and motivation are important. The O-Zone, opened at 2010 in the Mandarin Oriental Bangkok, creates a new benchmark in the luxury hotel industry in terms of promoting employee well-being. Variables (satisfaction and motivation) investigated in this study reveal that the implementation of the O-Zone increased positive opinions of employee facilities at the hotel. This research contributes to a better understanding of hotel employees’ satisfaction and motivation in the Thai context.
This study not only provides insight into employees’ experiences in a Thai luxury hotel context, but
also reveals further implications for the luxury hotel industry. This suggests that work relationships, which traditionally place emphasis on granting employee benefits according to hierarchical level, are inconsistent with views from the O-Zone initiative, which aims to provide higher levels of benefits for front-line employees. Moreover, and in a similar vein, this suggests that organisations such as the Mandarin Oriental Bangkok have created the O-Zone as an additional employment feature to attract and retain the best employees. This study reveals that by exploring employees’ experiences (in terms of their perceived satisfaction and motivation from benefits) can help us better understand how to position benefits for employees in the luxury hotel sector.
REFERENCES
Breiter, D., Tesone, D. V., Van Leeuwen, D., & Rue, V. (2002). An Analysis of Hotel Employees' Motivation Using Kovach's Ten Factor Model. Journal Of Human Resources In Hospitality & Tourism, 1(4), 63.
Churintr, P. (2010). Perceived Organizational Culture, Stress, and Job Satisfaction Affecting on Hotel Employee
Retention: a Comparison Study between Management and Operational Employees. Employment Relations Record, 10(2), 64-74.
DiPietro, R. B., & Condly, S. J. (2007). Employee Turnover in the Hospitality Industry: An Analysis Based on
the CANE Model of Motivation. Journal Of Human Resources In Hospitality & Tourism, 6(1), 1-22. Giorgi, A. (1994). A Phenomenological Perspective on Certain Qualitative Research Method. Journal of
Phenomenological Research, Vol. 25, No.2, pp.190-220. Kim H.J, Tavitiyaman P. & Kim W.G., (2009). Behaviors: the Mediating Role of Job Satisfaction, Journal of
Hospitality & Tourism Research. Kovach, K. A. (1987). What Motivates Employees? Workers and Supervisors Give Different Answers. Business
Horizons, 30(5), 58. Maneenetr, T. (2010). Motivation And Working Behavior In Frontier Tourism Business Of Thailand-Laos.
International Business & Economics Research Journal, 9(4), 105-112. Maroudas, L., Kyriakidou, O., & Vacharis, A. (2008). Employees' motivation in the luxury hotel industry: the
perceived effectiveness of human-resource practices. Managing Leisure, 13(3/4), 258-271. Panmunin, W. (1993). Whats happening to thai hospitality? Cornell Hospitality Quarterly, 34(3), 60-60. Parfyonova, N. (2009). Employee motivation, performance and well-being: The role of managerial support for
autonomy, competence and relatedness needs. Proquest Dissertations And Theses. Poulston, J. M. (2009). Working Conditions in Hospitality: Employees' Views of the Dissatisfactory Hygiene
Factors. Journal Of Quality Assurance In Hospitality & Tourism, 10(1), 23-43. Sekaran, U. (2000). Research Methods for Business. John Wiley and Sons, New York. Scott, S. (1994). Determinants of innovative behavior: A path model of individual innovation in the workplace.
Academy of Management Journal, 37(3). Seale, C. (1999). The Quality of Qualitative Research. Sage, London. Silverman, D. (2003). Doing Qualitative Research. A Practical Handbook. Sage, London. So Young, L. (2006). Expectations of employees toward the workplace and environmental satisfaction.
Facilities, 24(9/10). Sparks, K., Faragher, B., & Cooper, C. L. (2001). Well-being and occupational health in the 21st century
workplace. Journal of Occupational and Organizational Psychology, 74, 489-509. Susskind, A. M., Borchgrevink, C. P., Kacmar, K., & Brymer, R. A. (2000). Customer Service Employees'
Behavioral Intentions And Attitudes: An Examination Of Construct Validity And A Path Model. International Journal of Hospitality Management, 19(1), 53.
Taris, T. W., & Schreurs, P. G. (2009). Well-being and organizational performance: An organizational-level test
of the happy-productive worker hypothesis. Work & Stress, 23(2), 120-136. Yin, R. (2009). Case Study Research: Design and Methods. Sage, London. Vanhala, S., & Tuomi, K.. (2006). HRM, Company Performance and Employee Well-being. Management
Revue, 17 (3). 241-255. Vanhala, S., & Tuomi, K. (2003). Individual, Organizational and Work-Related Determinants of Employee
Well-Being. EBS Review, (17), 70-81.
The low level of organisational social capital in hotels – a New Zealand case study
Anthony Brien, DR* Lincoln University, P O Box 84 Lincoln, New Zealand
Nicholas Thomas, DR DePaul University, Chicago, United States
Ananda Hussein, Mr Lincoln University, P O Box 84 Lincoln, New Zealand
ABSTRACT
Hotels, like other organisations seek increased productivity, however, achieving this can be more challenging for service sectors organisations than those in manufacturing due to the significant use of human capital.
Developing and maintaining a positive level of Organisational Social Capital (OSC) is said to be a productivity enhancement strategy, however, for a hotel to use OSC as a tool for increased productivity it must first measure its OSC level. This research presents the New Zealand hotel industry’s OSC level, the initial stage within a longitudinal study to understand how OSC impacts productivity. A total of 509 employees from thirty-one hotels participated in this research.
KEY WORDS
Organisation Social Capital, Hotels, New Zealand
INTRODUCTION
The service-intensive nature of the hotel industry presents challenges regard productivity enhancement as it is subject to the Baumol Effect (Baumol, 1967) which suggests there is a limit to how (physically) productive service employees can be. To their credit, hotels already use employee productivity enhancement tools such as technology, leadership, innovation, training, etc. however, one less known employee-productivity-enhancer is that of the organisation’s ‘social capital’.
This paper reports the findings of the first stage of a longitudinal research project within the New
Zealand hotel industry; the measurement of employees’ perceptions of their hotels (Organisational) Social Capital (OSC).The research problem that the longitudinal research project sets out to investigate is: Does a hotel’s intangible human capital elements, such as its social capital, impact productivity? The theoretical foundation for this research is drawn from Coleman (1988) who suggests that the level of an organisations social capital may affect productivity, that is, the higher the OSC level the more opportunity for increased productivity and vice-versa. While the researchers intuitively support Coleman’s views, this research sets out to over time test Coleman’s hypothesis in the service sector, in this instance, the hotel industry of New Zealand.
Coleman’s (1988) theoretical base is supported in that the concept of OSC has its roots in the macro
concept of Social Capital (SC) (Cohen, 1988; Putnam, 2000; Requena, 2003; Svendsen & Sorensen, 2006) which is said to encompass the elements of participation, networks, reciprocity and trust. Funnelling from SC to OSC the literature suggests that OSC consists, to varying degrees, of the variables: commitment, communication, influence, trust and social relations (Bolino, Turnley, & Bloodgood, 2002; Carmeli, Ben-Hador, Waldman, & Rupp, 2009; Helliwell & Huang, 2010; Requena, 2003). This research adds to the general knowledge of OSC while particularly focusing on the service sector and provides a benchmark to which future research can be compared.
The New Zealand hotel industry is relatively small in terms of the number of hotels; therefore, the
researchers were able to undertake a whole-of-country employee OSC perception study; such a study had not
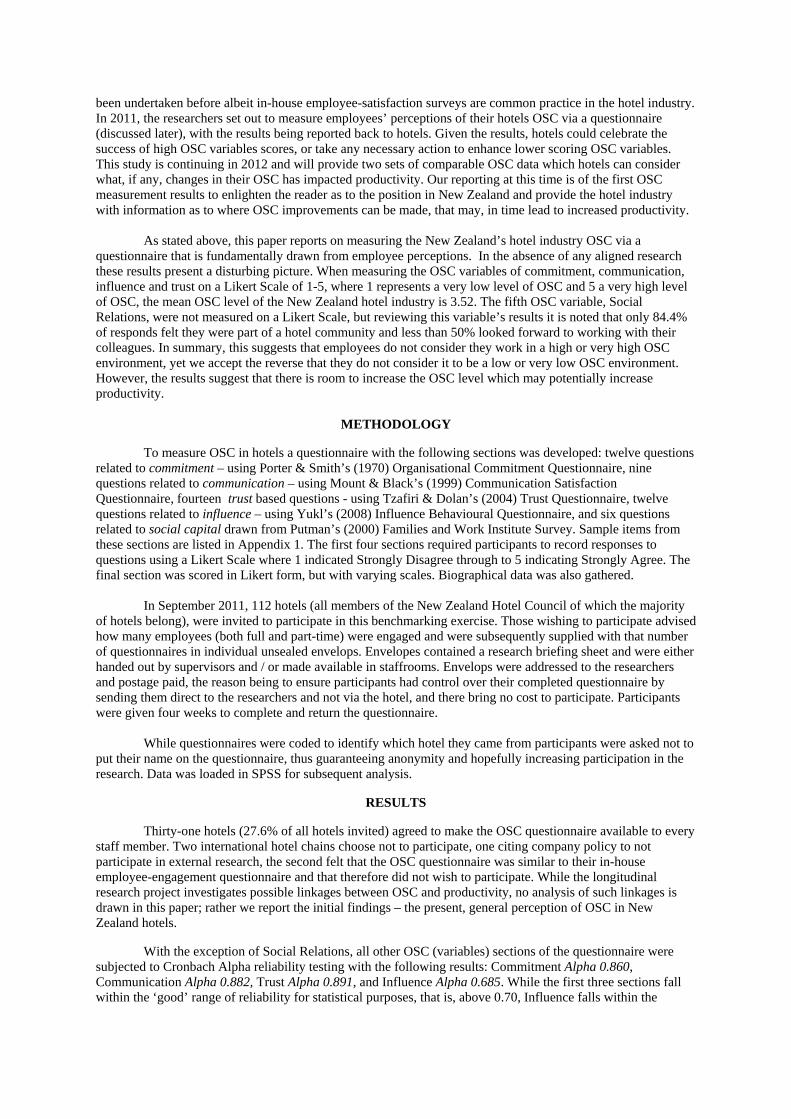
been undertaken before albeit in-house employee-satisfaction surveys are common practice in the hotel industry. In 2011, the researchers set out to measure employees’ perceptions of their hotels OSC via a questionnaire (discussed later), with the results being reported back to hotels. Given the results, hotels could celebrate the success of high OSC variables scores, or take any necessary action to enhance lower scoring OSC variables. This study is continuing in 2012 and will provide two sets of comparable OSC data which hotels can consider what, if any, changes in their OSC has impacted productivity. Our reporting at this time is of the first OSC measurement results to enlighten the reader as to the position in New Zealand and provide the hotel industry with information as to where OSC improvements can be made, that may, in time lead to increased productivity.
As stated above, this paper reports on measuring the New Zealand’s hotel industry OSC via a
questionnaire that is fundamentally drawn from employee perceptions. In the absence of any aligned research these results present a disturbing picture. When measuring the OSC variables of commitment, communication, influence and trust on a Likert Scale of 1-5, where 1 represents a very low level of OSC and 5 a very high level of OSC, the mean OSC level of the New Zealand hotel industry is 3.52. The fifth OSC variable, Social Relations, were not measured on a Likert Scale, but reviewing this variable’s results it is noted that only 84.4% of responds felt they were part of a hotel community and less than 50% looked forward to working with their colleagues. In summary, this suggests that employees do not consider they work in a high or very high OSC environment, yet we accept the reverse that they do not consider it to be a low or very low OSC environment. However, the results suggest that there is room to increase the OSC level which may potentially increase productivity.
METHODOLOGY
To measure OSC in hotels a questionnaire with the following sections was developed: twelve questions related to commitment – using Porter & Smith’s (1970) Organisational Commitment Questionnaire, nine questions related to communication – using Mount & Black’s (1999) Communication Satisfaction Questionnaire, fourteen trust based questions - using Tzafiri & Dolan’s (2004) Trust Questionnaire, twelve questions related to influence – using Yukl’s (2008) Influence Behavioural Questionnaire, and six questions related to social capital drawn from Putman’s (2000) Families and Work Institute Survey. Sample items from these sections are listed in Appendix 1. The first four sections required participants to record responses to questions using a Likert Scale where 1 indicated Strongly Disagree through to 5 indicating Strongly Agree. The final section was scored in Likert form, but with varying scales. Biographical data was also gathered.
In September 2011, 112 hotels (all members of the New Zealand Hotel Council of which the majority
of hotels belong), were invited to participate in this benchmarking exercise. Those wishing to participate advised how many employees (both full and part-time) were engaged and were subsequently supplied with that number of questionnaires in individual unsealed envelops. Envelopes contained a research briefing sheet and were either handed out by supervisors and / or made available in staffrooms. Envelops were addressed to the researchers and postage paid, the reason being to ensure participants had control over their completed questionnaire by sending them direct to the researchers and not via the hotel, and there bring no cost to participate. Participants were given four weeks to complete and return the questionnaire.
While questionnaires were coded to identify which hotel they came from participants were asked not to
put their name on the questionnaire, thus guaranteeing anonymity and hopefully increasing participation in the research. Data was loaded in SPSS for subsequent analysis.
RESULTS
Thirty-one hotels (27.6% of all hotels invited) agreed to make the OSC questionnaire available to every staff member. Two international hotel chains choose not to participate, one citing company policy to not participate in external research, the second felt that the OSC questionnaire was similar to their in-house employee-engagement questionnaire and that therefore did not wish to participate. While the longitudinal research project investigates possible linkages between OSC and productivity, no analysis of such linkages is drawn in this paper; rather we report the initial findings – the present, general perception of OSC in New Zealand hotels.
With the exception of Social Relations, all other OSC (variables) sections of the questionnaire were subjected to Cronbach Alpha reliability testing with the following results: Commitment Alpha 0.860, Communication Alpha 0.882, Trust Alpha 0.891, and Influence Alpha 0.685. While the first three sections fall within the ‘good’ range of reliability for statistical purposes, that is, above 0.70, Influence falls within the
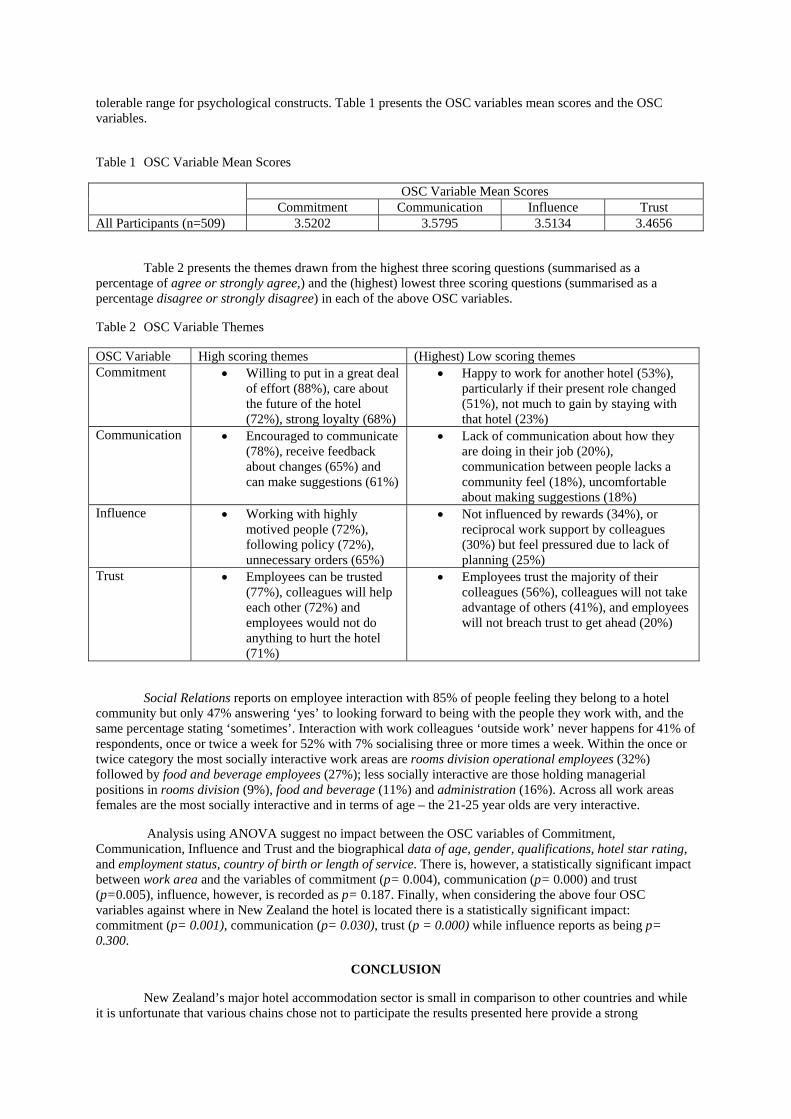
tolerable range for psychological constructs. Table 1 presents the OSC variables mean scores and the OSC variables.
Table 1 OSC Variable Mean Scores
OSC Variable Mean Scores Commitment Communication Influence Trust
All Participants (n=509) 3.5202 3.5795 3.5134 3.4656
Table 2 presents the themes drawn from the highest three scoring questions (summarised as a percentage of agree or strongly agree,) and the (highest) lowest three scoring questions (summarised as a percentage disagree or strongly disagree) in each of the above OSC variables.
Table 2 OSC Variable Themes
OSC Variable High scoring themes (Highest) Low scoring themes Commitment Willing to put in a great deal
of effort (88%), care about the future of the hotel (72%), strong loyalty (68%)
Happy to work for another hotel (53%), particularly if their present role changed (51%), not much to gain by staying with that hotel (23%)
Communication Encouraged to communicate (78%), receive feedback about changes (65%) and can make suggestions (61%)
Lack of communication about how they are doing in their job (20%), communication between people lacks a community feel (18%), uncomfortable about making suggestions (18%)
Influence Working with highly motived people (72%), following policy (72%), unnecessary orders (65%)
Not influenced by rewards (34%), or reciprocal work support by colleagues (30%) but feel pressured due to lack of planning (25%)
Trust Employees can be trusted (77%), colleagues will help each other (72%) and employees would not do anything to hurt the hotel (71%)
Employees trust the majority of their colleagues (56%), colleagues will not take advantage of others (41%), and employees will not breach trust to get ahead (20%)
Social Relations reports on employee interaction with 85% of people feeling they belong to a hotel community but only 47% answering ‘yes’ to looking forward to being with the people they work with, and the same percentage stating ‘sometimes’. Interaction with work colleagues ‘outside work’ never happens for 41% of respondents, once or twice a week for 52% with 7% socialising three or more times a week. Within the once or twice category the most socially interactive work areas are rooms division operational employees (32%) followed by food and beverage employees (27%); less socially interactive are those holding managerial positions in rooms division (9%), food and beverage (11%) and administration (16%). Across all work areas females are the most socially interactive and in terms of age – the 21-25 year olds are very interactive.
Analysis using ANOVA suggest no impact between the OSC variables of Commitment, Communication, Influence and Trust and the biographical data of age, gender, qualifications, hotel star rating, and employment status, country of birth or length of service. There is, however, a statistically significant impact between work area and the variables of commitment (p= 0.004), communication (p= 0.000) and trust (p=0.005), influence, however, is recorded as p= 0.187. Finally, when considering the above four OSC variables against where in New Zealand the hotel is located there is a statistically significant impact: commitment (p= 0.001), communication (p= 0.030), trust (p = 0.000) while influence reports as being p= 0.300.
CONCLUSION
New Zealand’s major hotel accommodation sector is small in comparison to other countries and while it is unfortunate that various chains chose not to participate the results presented here provide a strong
representation of the overall New Zealand hotel OSC level. The developed questionnaire appears to be a robust instrument to use in measuring OSC and while it is accepted that there is no comparable research either within New Zealand or internationally, the mid-range results, that is ‘3’ on a scale of 1-5 of the first four variables, is not a good news story for the hotel industry; indeed no means scores in any of the OSC variable made it into the ‘agree’ or ‘strongly agree’ category.
Having noted the bad news in the above paragraph, Table 2 presents the good news, but overall is impacted by the significant number of participants reporting neither agree nor disagree or disagree/strongly disagree in the various OSC variables. That said, this signals where strategies need to be put in place to enhance areas. Trust is said to be fundamental to the variables of commitment, communication and influence and takes time to build, however, it is noted that this is the lowest mean scoring variable – this suggest a challenge for the industry. Trust continues to rank the lowest variable within each of the separate star ratings and within this, five star hotels has the lowest level of trust.
Social Relations results presents concerns and what could be considered ‘usual’ results. The vast majority of employees feel they are part of a hotel community, but of concern is that nearly 50% of employees only sometimes looking forward to working with their colleagues. While the latter response, however, possibly understandable as every employee has ‘off’ days with colleagues – this is possibly a breeding-ground for discontentment and may link to the overall low OSC mean and areas of trust. There is perhaps no surprise that it is the young employees who are much more socially interactive. For hotels, the challenge would appear to be to move the usual results ‘factors’ to merge with the looking forward to working with colleagues, doing so may the lift other OSC variables.
From a practical point of view, knowing what OSC variables impact with biographical factors could be helpful when considering instigating OSC enhancement strategies or attracting and retaining employees. Overarching ANOVA analysis of the data set suggests that with the exception of social relations, the only statistically significant impact is that of work area and commitment, communication and trust, with the same impact in terms of zone (where in New Zealand the hotel is located). With respect to the latter, trust is stronger in the South Island where there is a much less diverse culture and much smaller hotels/population. The impact in work area is mainly with the OSC variable of communication and differs across all areas.
The researchers continue to analyse the dataset to pull more details results that will be of benefit to the hotel industry in practical terms and continue their reporting back to the industry.
The results reported in this paper contribute to the literature in terms of understanding OSC in the hotel
industry, an area that has received little attention and is thus not well understood. The longitudinal approach that this research is taking in its investigation of links between OSC and productivity will also contribute significantly to future literature.
INVITATION TO PARTICIPATE IN THIS ON GOING RESEARCH
The authors of this research wish to expand the base of participants to that of other countries so that international comparisons can be made between OSC levels. Interested research wishing to be involved should contact the authors.
APPENDIX 1 Sample questions from the OSC Questionnaire
Commitment: I am willing to put in a great deal of effort beyond that normally expected in order to help this hotel be successful I would do almost any job asked of me in order to keep working for this hotel
Communication: The communication I receive about all sorts of things in this hotel is about right – not too much or too little There is lots of communication between my colleagues (not job related or from management)
Influence: I am influenced to do something when I know it is hotel policy People offer to do something for me in exchange for me doing something for them
Trust: My colleagues will keep the promises they make My colleagues actions and behaviours are not consistent
Social Relations: How many of these close friends are people you work with in this hotel? Do you look forward to being with the people you work with at this hotel each day?
REFERENCES
Baumol, W. (1967). Macroeconomics of unbalanced growth: the anatomy of urban crisis. American Economic Review, 57(3), 415-426.
Bolino, M. C., Turnley, W. H., & Bloodgood, J. M. (2002). Citizenship Behavior and the Creation of Social Capital in Organizations. The Academy of Management Review, 27(4), 505-522.
Carmeli, A., Ben-Hador, B., Waldman, D. A., & Rupp, D. E. (2009). How Leaders Cultivate Social Capital and Nurture Employee Vigor: Implications for Job Performance. Journal of Applied Psychology, 94(6), 1553-1561.
Cohen, E. (1988). Traditions in the qualitative sociology of tourism. Annals of Tourism Research, 15(1), 29-46. Coleman, J. S. (1988). Social Capital in the Creation of Human Capital. American Journal of Sociology,
94(S95-S120). Helliwell, J. F., & Huang, H. F. (2010). How's the job? well-being and social capital in the workplace. Industrial
& Labor Relations Review, 63(2), 205-227. Mount, D., & Back, K.-J. (1999). A Factor-Analytic Study of Communication Satisfaction in the Lodging
Industry. Journal of Hospitality and Tourism Research, 23(4), 401-418. Porter, & Smith. (1970). Organisational Commitment Questionnaire. Retrieved from
www.regent.edu/acad/global/.../Example%20Measure%20Paper.doc Putnam, R. (2000). Families and Work Institute Survey: Families and Work Institute. Requena, F. (2003). Social capital, satisfaction and quality of life in the workplace. Social Indicators Research,
61(3), 331. Svendsen, G., & Sorensen, J. (2006). The socioeconomic power of social capital: A double test of Putnam's
civic society argument. International Journal of Sociology and Social Policy, 26(9/10), 411-429. Tzafrir, S., & Dolan, S. (2004). "Trust Me: a scale for measuring manager-employee trust". Management
Research, 32(3), 115-132. Yukl, G., Seifert, C., & Chavez, C. (2008). Validation of the extended Influence Behavior Questionnaire. The
Leadership Quarterly, 19, 609-621.
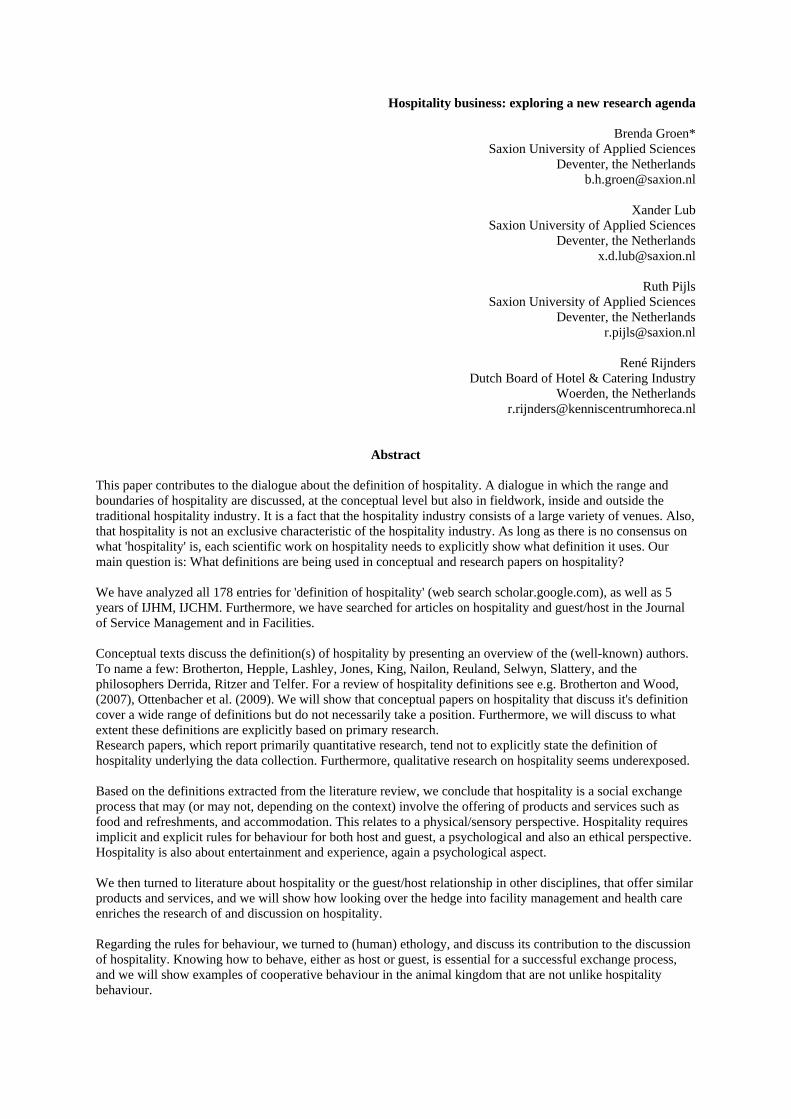
Hospitality business: exploring a new research agenda
Brenda Groen* Saxion University of Applied Sciences
Deventer, the Netherlands [email protected]
Xander Lub
Saxion University of Applied Sciences Deventer, the Netherlands
Ruth Pijls Saxion University of Applied Sciences
Deventer, the Netherlands [email protected]
René Rijnders
Dutch Board of Hotel & Catering Industry Woerden, the Netherlands
Abstract This paper contributes to the dialogue about the definition of hospitality. A dialogue in which the range and boundaries of hospitality are discussed, at the conceptual level but also in fieldwork, inside and outside the traditional hospitality industry. It is a fact that the hospitality industry consists of a large variety of venues. Also, that hospitality is not an exclusive characteristic of the hospitality industry. As long as there is no consensus on what 'hospitality' is, each scientific work on hospitality needs to explicitly show what definition it uses. Our main question is: What definitions are being used in conceptual and research papers on hospitality? We have analyzed all 178 entries for 'definition of hospitality' (web search scholar.google.com), as well as 5 years of IJHM, IJCHM. Furthermore, we have searched for articles on hospitality and guest/host in the Journal of Service Management and in Facilities. Conceptual texts discuss the definition(s) of hospitality by presenting an overview of the (well-known) authors. To name a few: Brotherton, Hepple, Lashley, Jones, King, Nailon, Reuland, Selwyn, Slattery, and the philosophers Derrida, Ritzer and Telfer. For a review of hospitality definitions see e.g. Brotherton and Wood, (2007), Ottenbacher et al. (2009). We will show that conceptual papers on hospitality that discuss it's definition cover a wide range of definitions but do not necessarily take a position. Furthermore, we will discuss to what extent these definitions are explicitly based on primary research. Research papers, which report primarily quantitative research, tend not to explicitly state the definition of hospitality underlying the data collection. Furthermore, qualitative research on hospitality seems underexposed. Based on the definitions extracted from the literature review, we conclude that hospitality is a social exchange process that may (or may not, depending on the context) involve the offering of products and services such as food and refreshments, and accommodation. This relates to a physical/sensory perspective. Hospitality requires implicit and explicit rules for behaviour for both host and guest, a psychological and also an ethical perspective. Hospitality is also about entertainment and experience, again a psychological aspect. We then turned to literature about hospitality or the guest/host relationship in other disciplines, that offer similar products and services, and we will show how looking over the hedge into facility management and health care enriches the research of and discussion on hospitality. Regarding the rules for behaviour, we turned to (human) ethology, and discuss its contribution to the discussion of hospitality. Knowing how to behave, either as host or guest, is essential for a successful exchange process, and we will show examples of cooperative behaviour in the animal kingdom that are not unlike hospitality behaviour.
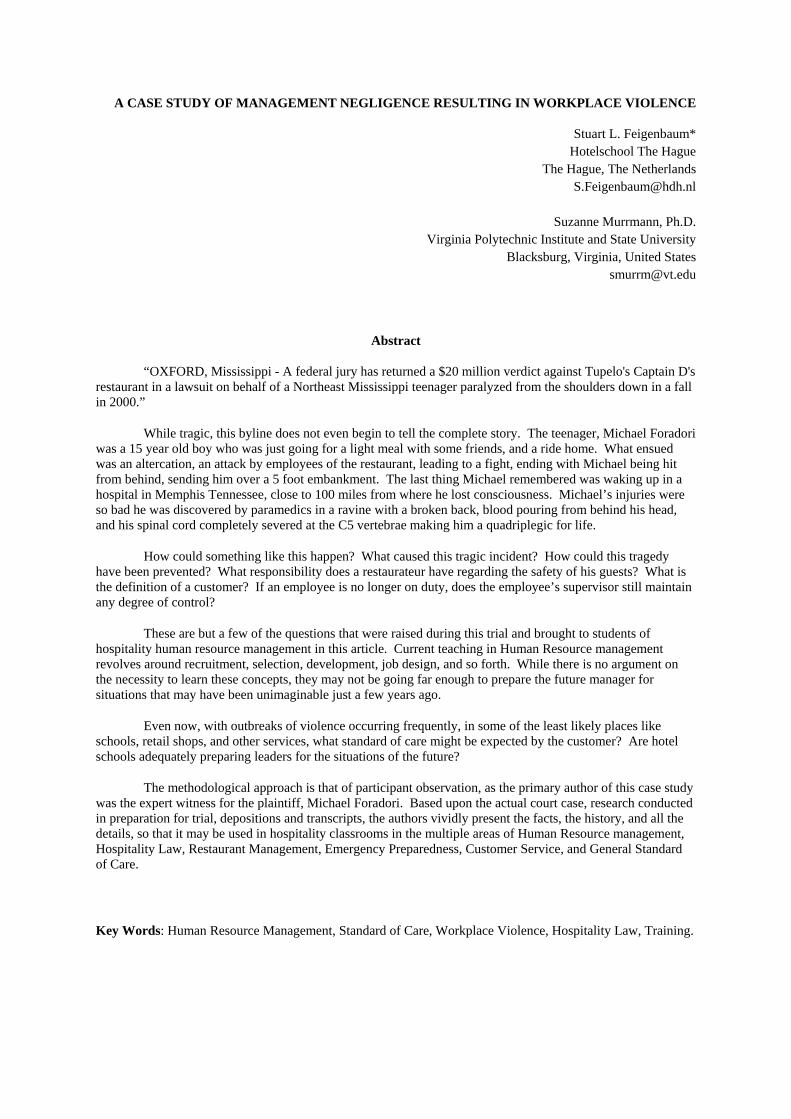
A CASE STUDY OF MANAGEMENT NEGLIGENCE RESULTING IN WORKPLACE VIOLENCE
Stuart L. Feigenbaum* Hotelschool The Hague
The Hague, The Netherlands [email protected]
Suzanne Murrmann, Ph.D.
Virginia Polytechnic Institute and State University Blacksburg, Virginia, United States
Abstract
“OXFORD, Mississippi - A federal jury has returned a $20 million verdict against Tupelo's Captain D's restaurant in a lawsuit on behalf of a Northeast Mississippi teenager paralyzed from the shoulders down in a fall in 2000.”
While tragic, this byline does not even begin to tell the complete story. The teenager, Michael Foradori was a 15 year old boy who was just going for a light meal with some friends, and a ride home. What ensued was an altercation, an attack by employees of the restaurant, leading to a fight, ending with Michael being hit from behind, sending him over a 5 foot embankment. The last thing Michael remembered was waking up in a hospital in Memphis Tennessee, close to 100 miles from where he lost consciousness. Michael’s injuries were so bad he was discovered by paramedics in a ravine with a broken back, blood pouring from behind his head, and his spinal cord completely severed at the C5 vertebrae making him a quadriplegic for life.
How could something like this happen? What caused this tragic incident? How could this tragedy have been prevented? What responsibility does a restaurateur have regarding the safety of his guests? What is the definition of a customer? If an employee is no longer on duty, does the employee’s supervisor still maintain any degree of control?
These are but a few of the questions that were raised during this trial and brought to students of hospitality human resource management in this article. Current teaching in Human Resource management revolves around recruitment, selection, development, job design, and so forth. While there is no argument on the necessity to learn these concepts, they may not be going far enough to prepare the future manager for situations that may have been unimaginable just a few years ago.
Even now, with outbreaks of violence occurring frequently, in some of the least likely places like schools, retail shops, and other services, what standard of care might be expected by the customer? Are hotel schools adequately preparing leaders for the situations of the future?
The methodological approach is that of participant observation, as the primary author of this case study was the expert witness for the plaintiff, Michael Foradori. Based upon the actual court case, research conducted in preparation for trial, depositions and transcripts, the authors vividly present the facts, the history, and all the details, so that it may be used in hospitality classrooms in the multiple areas of Human Resource management, Hospitality Law, Restaurant Management, Emergency Preparedness, Customer Service, and General Standard of Care.
Key Words: Human Resource Management, Standard of Care, Workplace Violence, Hospitality Law, Training.

We conclude that hospitality (research) will benefit from an increased use of definitions and scientific rigor, more qualitative research, especially into the psychological aspects, and multidisciplinary research. This will lead to fresh insights in hospitality, an extended (but shared) territory for hospitality research; and last but not least crossovers between disciplines which might lead to new entrepreneurial challenges. Key Words: literature review, definition of hospitality, social exchange, facility management, health care, ethology
References Brotherton, B. & Wood, R.C. (2008). The nature and meanings of “Hospitality”. In: Brotherton, B. & Wood, R.C. (Eds.) The Sage Handbook of Hospitality Management (pp. 37-61).London, UK: Sage Ottenbacher, M., Harrington, R., & Parsa, H. G. (2009). Defining the hospitality discipline: A discussion of pedagogical and research implications. Journal of Hospitality and Tourism Research, 33(3), 263-283.
Study of professional education in the field of tourism in Latvia
Margarita Platace, Mg.Ped. MBA Lecturer
Agita Donina*, MBA Lecturer
School of Business Administration Turiba, Faculty of International Tourism Graudu 68, Riga, LV-1058, Latvia,
[email protected] [email protected]
Abstract Key words – tourism industry, quality of professional education, professional qualification, professions in tourism In the period of time between May 2011 and February 2012 Latvian State Development Agency together with several cooperation partners carried out a project, which was worked out within the framework of the European Social Fund activity Development of a sectoral qualifications system and increasing the efficiency and quality of vocational education. Various sectors in Latvia, including the tourism industry were studied within the framework of the Project and educators of Turiba University participated as experts. The research results will be used to enhance Professional tourism education programme in accordance to the needs of the sector. The tourism research dataset consisted of 3442 enterprises or 40% of enterprises registered in that sector including accommodation and catering service enterprises, travel agencies, tour operators and other travel service related enterprises. The industry experts pointed out that there is a potential for the development of the tourism industry in Latvia. However, it has to be taken into account that the potential foreign and local tourists will be more demanding in future with regards to professional service quality, the level of which greatly depends on the performance of tourism professionals. Results show that 70% of employees in tourism industry are within the age group up to 45 years, the average salary is approximately 427 EUR; moreover the salary is low compared to the level of education. Despite the low salaries the tendency of tourism industry employees’ turnover is rather low and does not exceed 10%.
92% of employers rate professional skills of sales and communication with guests as most important criteria. Demonstration of good working skills and foreign language knowledge were also marked as important, while the presence of educational document or certificate is not considered to be of primary importance. The evaluation of the knowledge and skills of the young employees who have graduated from professional schools during the last three years shows that in many cases the professional knowledge was evaluated as average or low, pointing to the fact that the education provided by the professional educational establishment does not meet the requirements of the industry. There are 75 educational establishments in Latvia where 38 travel industry related professions can be obtained- higher educational establishments, colleges, and professional tourism and hospitality schools among them. However education acquired at an educational establishment is evaluated at rather low rate; it shows the discrepancy between the quality of knowledge provided by the educational establishments and industry requirements The industry description provided comprehensive information characterising the whole tourism industry and can be used by employers, educators and professional education students to gain additional information regarding the connection between the tourism sector and the education sector. The wide range of informative materials will help form an adequate industry professional qualification structure as it is the basis for working out and updating the profession standards and designing a professional education programme on module based approach.
EDUCATING THE NEW GENERATION OF GLOBAL MANAGERS: Testing Cultural Intelligence for Business Study Abroad Participants
A.J. Singh (Ph.D.) The School of Hospitality Business
Eli Broad College of Business Michigan State University
East Lansing, Michigan USA
Telephone: (517) 353-9211 E-mail: [email protected]
Chunyan Peng
Ph.D. Candidate Department of Management
Eli Broad College of Business Michigan State University
East Lansing, Michigan USA
Telephone: (517) 432-3512 [email protected]
Linn Van Dyne (Ph.D.)
Professor Department of Management
Eli Broad College of Business Michigan State University
East Lansing, Michigan USA
Telephone: (517) 432-3512 [email protected]
ABSTRACT With the pervasiveness of multinational corporations in today’s global economy, the need for competent managers with a global mindset to manage enterprises, people and functions across cultures will inevitably increase. The challenge for College of Business study abroad programs is to meet this need by structuring study abroad programs to increase the student’s capability to function effectively in situations characterized by cultural diversity. Key words: Cultural Intelligence, Study Abroad, Global competency, Global Leadership, Cultural adaptation, Global effectiveness.
INTRODUCTION
Context and Background
Forty years ago, at a time when the concept was still foreign, Marshall McLuhan popularized the idea that the world had become a “global village” (McLuhan, 1964). Today, the term is no longer alien, to the extent that many believe that the Globalization of Markets and Production has reached a “tipping point,” in which the world economy has moved away from self-contained entities to an interdependent global economic system. Most recently, Thomas L. Friedman effectively helped the business world visualize the implications of this phenomenon, in his bestselling book, “The World is Flat”(Friedman, 2005). Whereas, McLuhan’s transformational technology was the Television, Friedman highlights the internet and other “flatteners” as drivers of globalization. The globalization phenomenon, he argues, is resulting in the leveling of the global competitive playing field and has “empowered individuals to collaborate and compete globally.” The accompanying structural shift resulting from these forces has critical implications for the new generation of managers and the business of educating managers.
Definition of the Global Manager
Operating in this global playing field is a breed of managers called “Global Managers” or “Transnational Managers.” These managers are usually assigned to a position with cross border responsibilities, are flexible and open minded, with a broad understanding of international business and ability to work across cultural and functional boundaries. They perceive global competition as an opportunity and are able to balance the simultaneous demands of global integrations and national responsiveness (Bartlett & Ghoshal, 1989; 1992; Pucik, 1991). It is commonly agreed that there is no “universal global manager” that fits the broad definition of a global manager. However, Bartlett and Ghoshal state that there are “groups of specialists - typically business managers, country managers, and functional managers – who all must share a transnational perspective. Coordinating the activities of these three specialists is a corporate manager (Bartlett and Ghoshal, 1992).
In addition to the functional aspect of this managerial job, the new generation of global managers needs to possess a vital frame of reference known as: The Global Mindset. The notion is not new and was referenced by Socrates over 2000 years ago when he said; “I am not an Athenian or a Greek but a citizen of the world.” These famous words which define the global mindset are more relevant today than ever before.
The Role of Study Abroad in Educating the New Generation of Global Managers
With the pervasiveness of multinational corporations in today’s global economy, the need for competent managers with a global mindset to manage enterprises, people, and functions across cultures is increasing. The challenge for College of Business study abroad programs is to meet this need by identifying the appropriate knowledge, skills, and abilities required for managers to succeed in this environment and to design study abroad programs so they help participants enhance their intercultural capabilities. These new programs, with specific educational objectives, will benefit industry, students, and the College of Business study abroad programs. The industry will gain by getting future employees who are better prepared to be effective global business managers. Students will benefit from a richer experiences with higher employment potential. Study abroad programs will gain a new set of metrics for assessing effectiveness of study abroad that go beyond simply measuring the number of students who participate in study abroad.
PURPOSE
The purpose of the research was to design a study abroad program that incorporated intercultural experiential learning activities as well as multi-rater feedback on participant’s Cultural Intelligence (CQ) capabilities before and after study abroad. This allowed us to compare CQ scores with the world-wide norms, compare CQ scores based on gender and ethnicity, and finally, using pre-post survey comparisons determine if the study abroad program changed CQ scores of participants. Students traveled to India, China, and Japan to study hospitality and general business in these countries.
BRIEF OVERVIEW OF THE LITERATURE ON CULTURAL INTELLIGENCE
Although an understanding of the importance of intercultural skills has been acknowledged in the literature for many years (Benson, 1978), cultural intelligence (CQ), defined as the capability to function effectively in culturally diverse settings is a relatively new construct which was introduced by Earley and Ang in 2003. Cultural intelligence is based on Sternberg and Detterman’s (1986) integration of the various views of intelligence as represented by four complementary capabilities: metacognitive, cognitive, motivational, and behavioral. CQ is unique because it focuses on capabilities with special relevance to intercultural contexts. The significance of CQ is demonstrated by the rapid and ongoing advances in our understanding of the conceptualization of CQ (Ang & Van Dyne, 2008b; Ng, Van Dyne, & Ang, 2009a), measurement of CQ (e.g. Ang, Van Dyne, Koh, Ng, Templer, Tay, & Chandrasekar, 2007; Van Dyne, Ang, Ng, Rockstuhl, Tan, & Koh, 2012), nomological network of CQ (Ang, Van Dyne, & Koh, 2006; Ang, Van Dyne, & Tan, 2011; Kim, & Van Dyne, 2012; Ng, Van Dyne, & Ang 2012; Rockstuhl, Seiler, Ang, Van Dyne, & Annen, 2011; Templar, Tay, & Chandrasekar, 2006), and practical application of CQ (Livermore, 2006, 2010; Ng, Van Dyne, & Ang, 2009b; Van Dyne, Ang, & Livermore, 2010).
The four dimensions of CQ include metacognitive CQ (strategy), cognitive CQ (knowledge),
motivational CQ (drive), and behavioral CQ (action). Meta-cognitive CQ reflects the processes individuals use to plan, apply, and adjust their cultural knowledge. Those with high metacognitive CQ are able to anticipate what will happen in cross-cultural situations and adjust their mental models when their expectations are inaccurate. Cognitive CQ reflects the general knowledge about how cultures are similar and how they are different. Those with high cognitive CQ have rich cognitive structures that provide them with deep understanding how culture shapes attitudes, cognitions, affect, and behavior. Motivational CQ reflects the magnitude of energy applied toward learning about and functioning in cross-cultural situations. Those with high motivational CQ genuinely enjoy culturally diverse experiences, recognize the benefits they can gain from intercultural encounters, and have the confidence to be effective in culturally diverse settings. Finally, behavioral CQ reflects the ability a person has to exhibit appropriate verbal and non-verbal actions when interacting with people from different cultures. Those with high behavioral CQ show flexibility in their actions in response to cultural characteristics of the situation.
Of primary relevance to the research we report in this paper is the fact CQ represents a malleable set of capabilities (Ang & Van Dyne, 2008a) that can be enhanced by education, training, and experience (Van Dyne, Ang, & Koh, 2008), such as study abroad. In sum, the CQ steam of research is particularly attractive for extending models of strategic leadership and focusing on ways to develop the next generation of global managers.
RESEARCH METHOD
Respondent Profile
Participants in this study included 93 undergraduate students at Michigan State University who enrolled in four study abroad programs to Asian destinations during 2007-2009. To encourage participation, we provided CQ feedback reports both before and after the study abroad experience. Each program included pre-departure sessions, approximately five weeks outside the United States, and post-
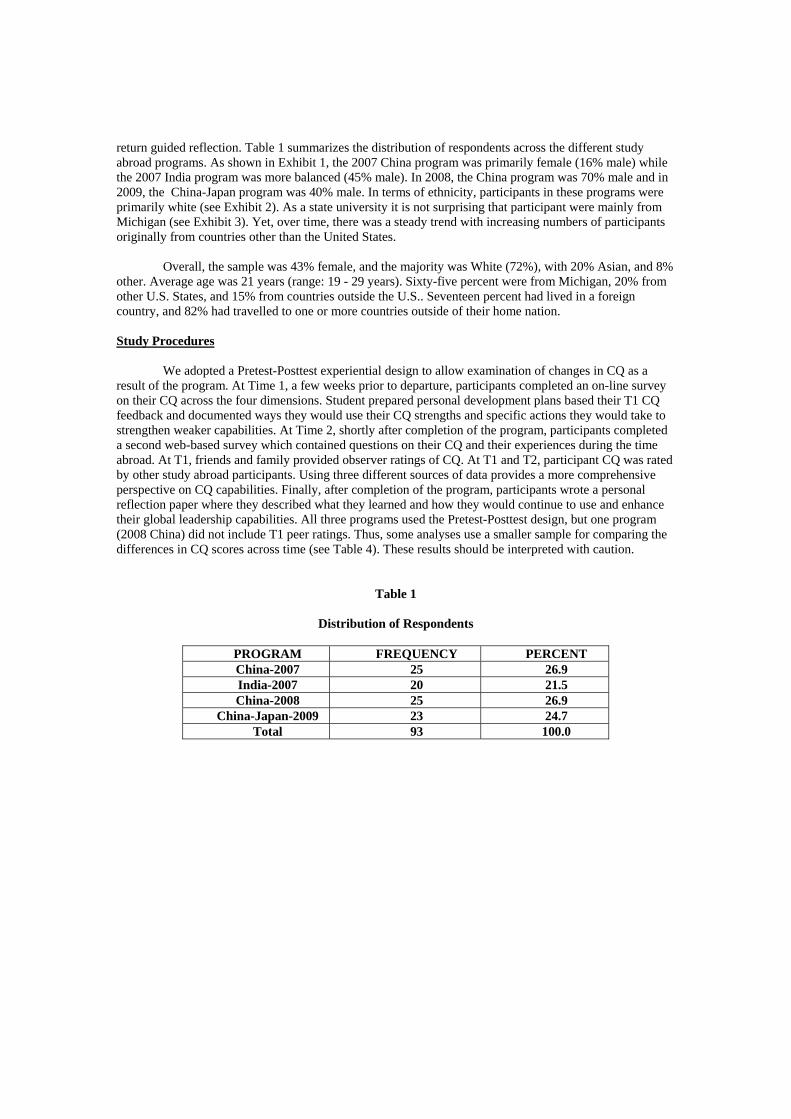
return guided reflection. Table 1 summarizes the distribution of respondents across the different study abroad programs. As shown in Exhibit 1, the 2007 China program was primarily female (16% male) while the 2007 India program was more balanced (45% male). In 2008, the China program was 70% male and in 2009, the China-Japan program was 40% male. In terms of ethnicity, participants in these programs were primarily white (see Exhibit 2). As a state university it is not surprising that participant were mainly from Michigan (see Exhibit 3). Yet, over time, there was a steady trend with increasing numbers of participants originally from countries other than the United States.
Overall, the sample was 43% female, and the majority was White (72%), with 20% Asian, and 8%
other. Average age was 21 years (range: 19 - 29 years). Sixty-five percent were from Michigan, 20% from other U.S. States, and 15% from countries outside the U.S.. Seventeen percent had lived in a foreign country, and 82% had travelled to one or more countries outside of their home nation.
Study Procedures
We adopted a Pretest-Posttest experiential design to allow examination of changes in CQ as a result of the program. At Time 1, a few weeks prior to departure, participants completed an on-line survey on their CQ across the four dimensions. Student prepared personal development plans based their T1 CQ feedback and documented ways they would use their CQ strengths and specific actions they would take to strengthen weaker capabilities. At Time 2, shortly after completion of the program, participants completed a second web-based survey which contained questions on their CQ and their experiences during the time abroad. At T1, friends and family provided observer ratings of CQ. At T1 and T2, participant CQ was rated by other study abroad participants. Using three different sources of data provides a more comprehensive perspective on CQ capabilities. Finally, after completion of the program, participants wrote a personal reflection paper where they described what they learned and how they would continue to use and enhance their global leadership capabilities. All three programs used the Pretest-Posttest design, but one program (2008 China) did not include T1 peer ratings. Thus, some analyses use a smaller sample for comparing the differences in CQ scores across time (see Table 4). These results should be interpreted with caution.
Table 1
Distribution of Respondents
PROGRAM FREQUENCY PERCENT China-2007 25 26.9 India-2007 20 21.5 China-2008 25 26.9
China-Japan-2009 23 24.7 Total 93 100.0
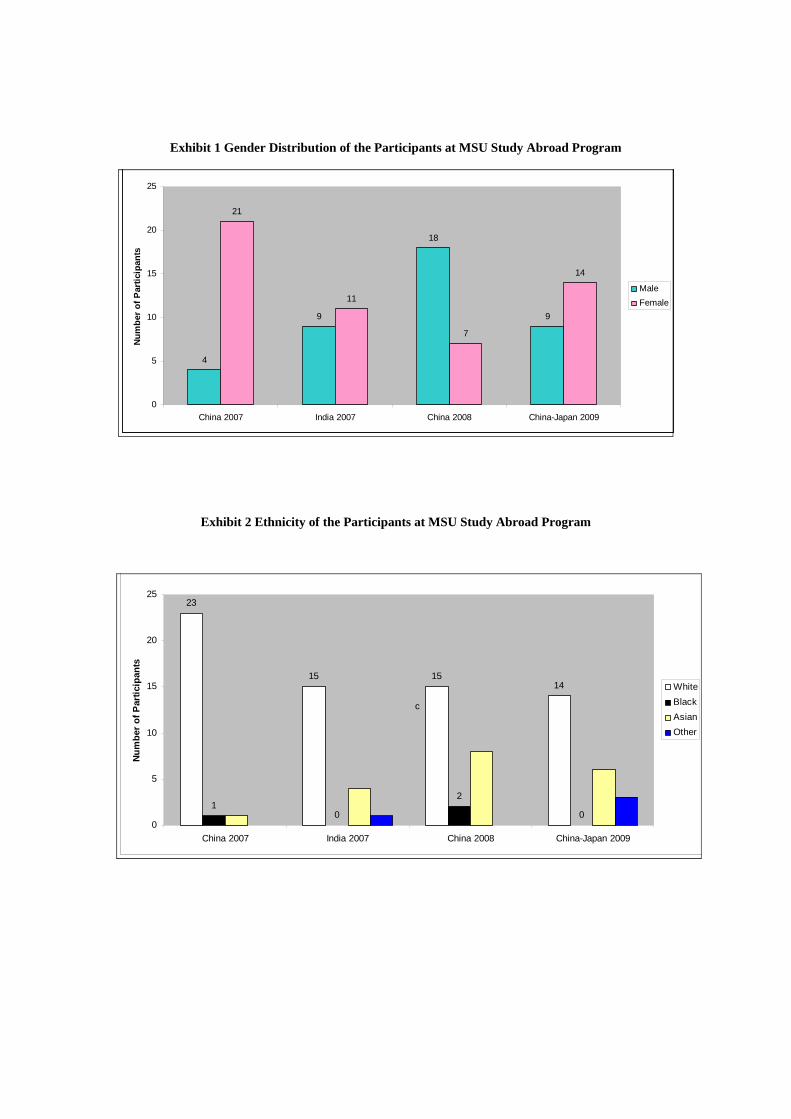
Exhibit 1 Gender Distribution of the Participants at MSU Study Abroad Program
4
9
18
9
21
11
7
14
0
5
10
15
20
25
China 2007 India 2007 China 2008 China-Japan 2009
Nu
mb
er o
f P
arti
cip
ants
Male
Female
Exhibit 2 Ethnicity of the Participants at MSU Study Abroad Program
23
15 1514
10
2
00
5
10
15
20
25
China 2007 India 2007 China 2008 China-Japan 2009
Nu
mb
er o
f P
arti
cip
ants
White
Black
Asian
Other
c
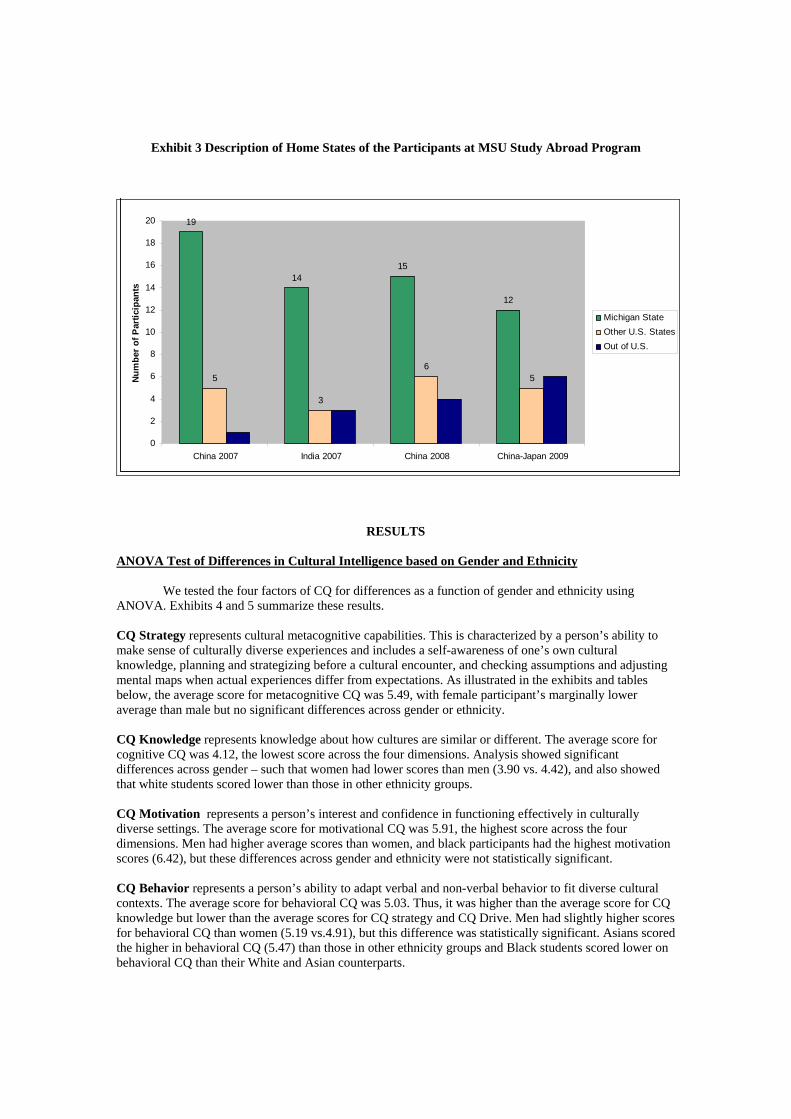
Exhibit 3 Description of Home States of the Participants at MSU Study Abroad Program
19
1415
12
5
3
65
0
2
4
6
8
10
12
14
16
18
20
China 2007 India 2007 China 2008 China-Japan 2009
Nu
mb
er o
f P
arti
cip
ants
Michigan State
Other U.S. States
Out of U.S.
RESULTS
ANOVA Test of Differences in Cultural Intelligence based on Gender and Ethnicity
We tested the four factors of CQ for differences as a function of gender and ethnicity using ANOVA. Exhibits 4 and 5 summarize these results.
CQ Strategy represents cultural metacognitive capabilities. This is characterized by a person’s ability to make sense of culturally diverse experiences and includes a self-awareness of one’s own cultural knowledge, planning and strategizing before a cultural encounter, and checking assumptions and adjusting mental maps when actual experiences differ from expectations. As illustrated in the exhibits and tables below, the average score for metacognitive CQ was 5.49, with female participant’s marginally lower average than male but no significant differences across gender or ethnicity. CQ Knowledge represents knowledge about how cultures are similar or different. The average score for cognitive CQ was 4.12, the lowest score across the four dimensions. Analysis showed significant differences across gender – such that women had lower scores than men (3.90 vs. 4.42), and also showed that white students scored lower than those in other ethnicity groups. CQ Motivation represents a person’s interest and confidence in functioning effectively in culturally diverse settings. The average score for motivational CQ was 5.91, the highest score across the four dimensions. Men had higher average scores than women, and black participants had the highest motivation scores (6.42), but these differences across gender and ethnicity were not statistically significant. CQ Behavior represents a person’s ability to adapt verbal and non-verbal behavior to fit diverse cultural contexts. The average score for behavioral CQ was 5.03. Thus, it was higher than the average score for CQ knowledge but lower than the average scores for CQ strategy and CQ Drive. Men had slightly higher scores for behavioral CQ than women (5.19 vs.4.91), but this difference was statistically significant. Asians scored the higher in behavioral CQ (5.47) than those in other ethnicity groups and Black students scored lower on behavioral CQ than their White and Asian counterparts.
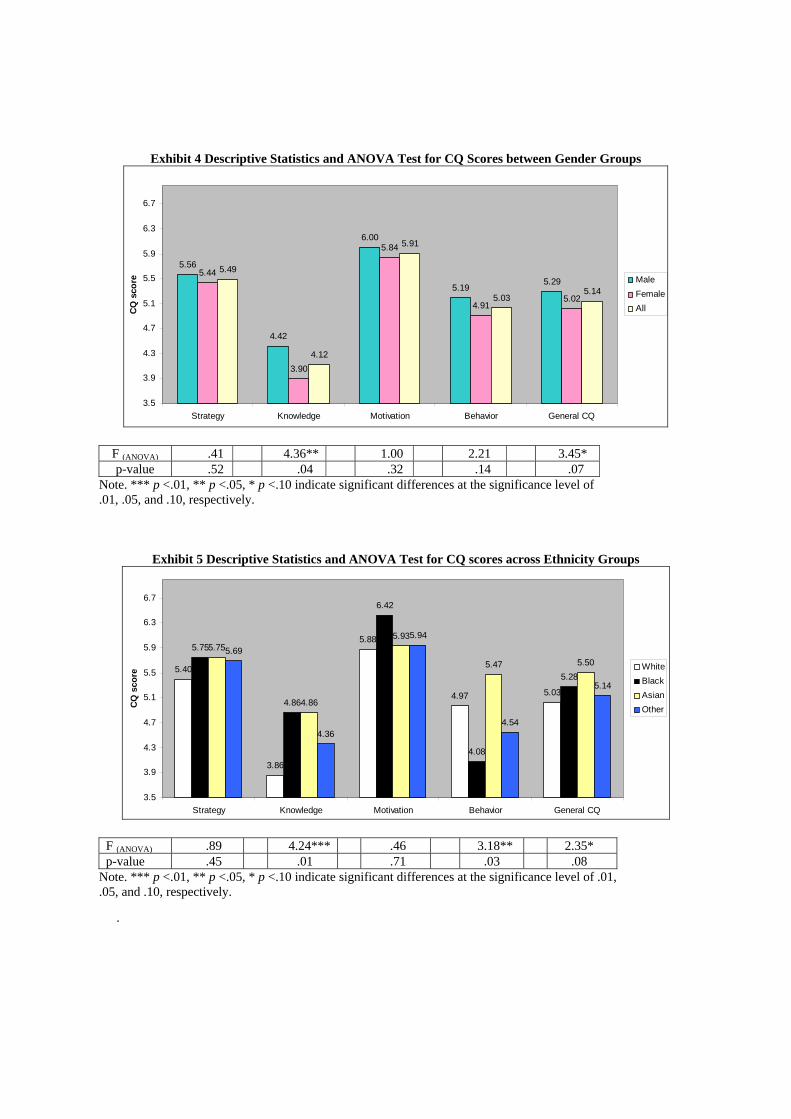
Exhibit 4 Descriptive Statistics and ANOVA Test for CQ Scores between Gender Groups
5.56
4.42
6.00
5.195.29
5.44
3.90
5.84
4.915.02
5.49
4.12
5.91
5.035.14
3.5
3.9
4.3
4.7
5.1
5.5
5.9
6.3
6.7
Strategy Knowledge Motivation Behavior General CQ
CQ
sco
re Male
Female
All
F (ANOVA) .41 4.36** 1.00 2.21 3.45* p-value .52 .04 .32 .14 .07
Note. *** p <.01, ** p <.05, * p <.10 indicate significant differences at the significance level of .01, .05, and .10, respectively.
Exhibit 5 Descriptive Statistics and ANOVA Test for CQ scores across Ethnicity Groups
5.40
3.86
5.88
4.97 5.03
5.75
4.86
6.42
4.08
5.28
5.75
4.86
5.93
5.47 5.505.69
4.36
5.94
4.54
5.14
3.5
3.9
4.3
4.7
5.1
5.5
5.9
6.3
6.7
Strategy Knowledge Motivation Behavior General CQ
CQ
sco
re
White
Black
Asian
Other
F (ANOVA) .89 4.24*** .46 3.18** 2.35* p-value .45 .01 .71 .03 .08
Note. *** p <.01, ** p <.05, * p <.10 indicate significant differences at the significance level of .01, .05, and .10, respectively.
.
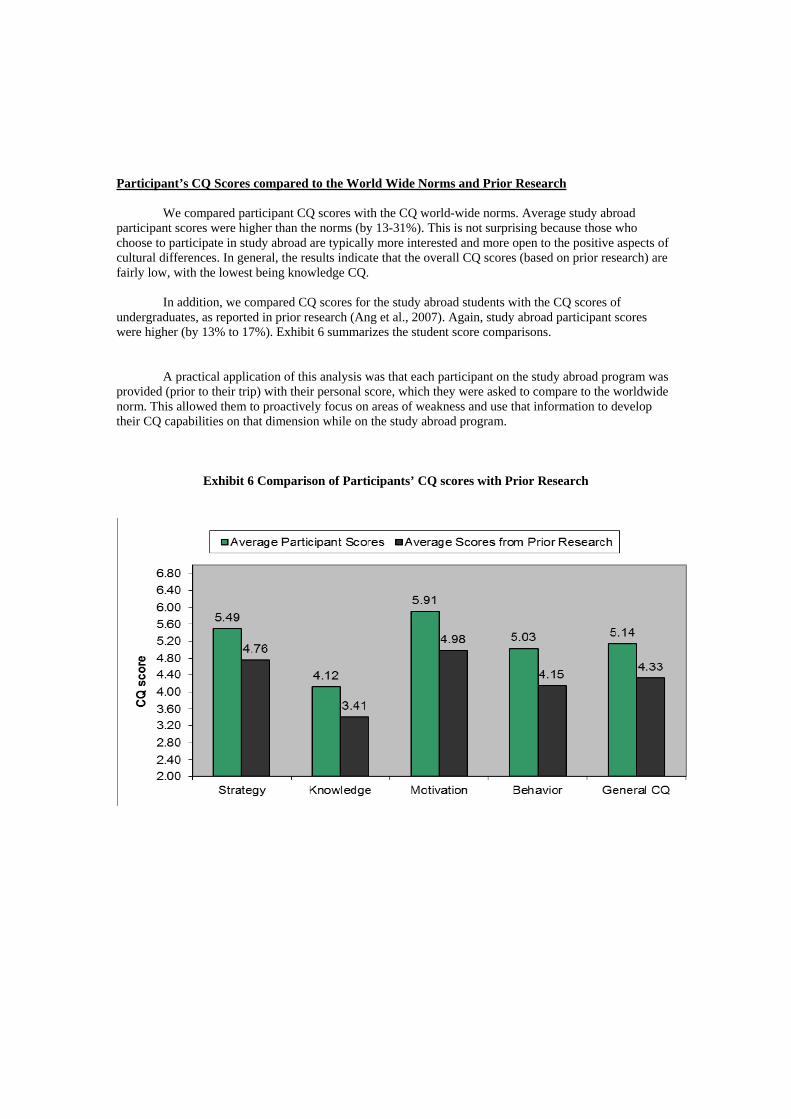
Participant’s CQ Scores compared to the World Wide Norms and Prior Research
We compared participant CQ scores with the CQ world-wide norms. Average study abroad participant scores were higher than the norms (by 13-31%). This is not surprising because those who choose to participate in study abroad are typically more interested and more open to the positive aspects of cultural differences. In general, the results indicate that the overall CQ scores (based on prior research) are fairly low, with the lowest being knowledge CQ.
In addition, we compared CQ scores for the study abroad students with the CQ scores of undergraduates, as reported in prior research (Ang et al., 2007). Again, study abroad participant scores were higher (by 13% to 17%). Exhibit 6 summarizes the student score comparisons.
A practical application of this analysis was that each participant on the study abroad program was
provided (prior to their trip) with their personal score, which they were asked to compare to the worldwide norm. This allowed them to proactively focus on areas of weakness and use that information to develop their CQ capabilities on that dimension while on the study abroad program.
Exhibit 6 Comparison of Participants’ CQ scores with Prior Research
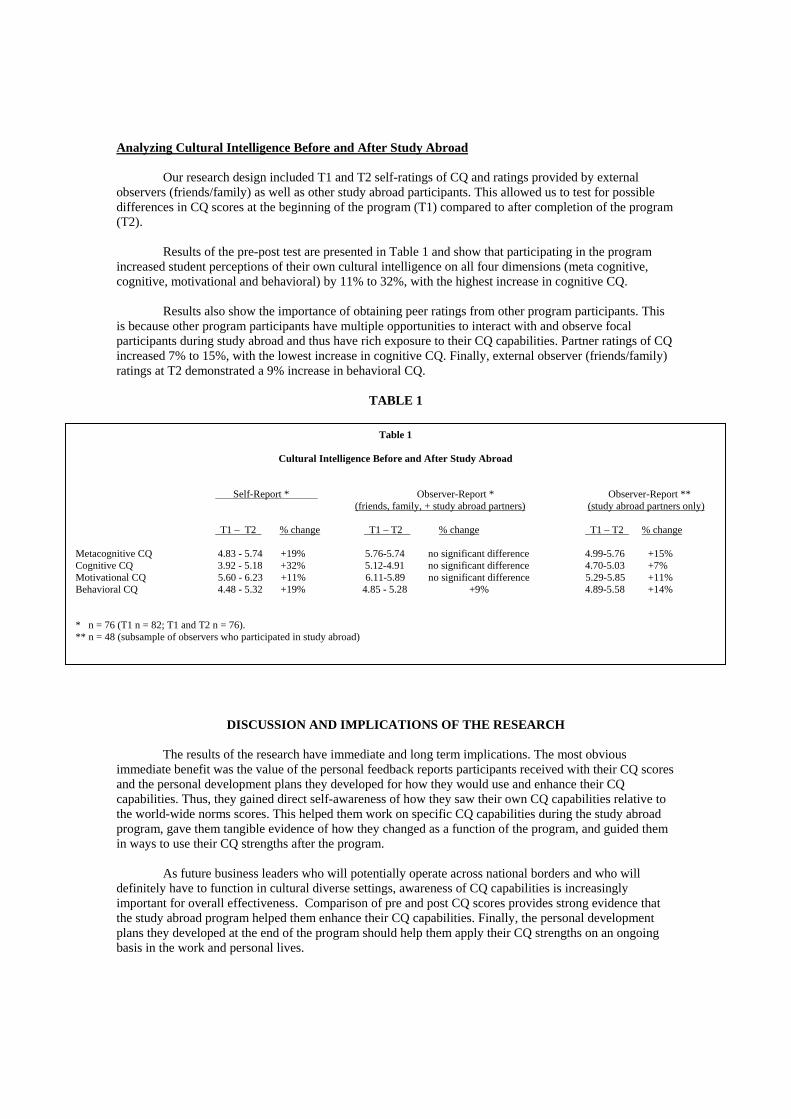
Analyzing Cultural Intelligence Before and After Study Abroad
Our research design included T1 and T2 self-ratings of CQ and ratings provided by external observers (friends/family) as well as other study abroad participants. This allowed us to test for possible differences in CQ scores at the beginning of the program (T1) compared to after completion of the program (T2).
Results of the pre-post test are presented in Table 1 and show that participating in the program
increased student perceptions of their own cultural intelligence on all four dimensions (meta cognitive, cognitive, motivational and behavioral) by 11% to 32%, with the highest increase in cognitive CQ.
Results also show the importance of obtaining peer ratings from other program participants. This
is because other program participants have multiple opportunities to interact with and observe focal participants during study abroad and thus have rich exposure to their CQ capabilities. Partner ratings of CQ increased 7% to 15%, with the lowest increase in cognitive CQ. Finally, external observer (friends/family) ratings at T2 demonstrated a 9% increase in behavioral CQ.
TABLE 1
DISCUSSION AND IMPLICATIONS OF THE RESEARCH
The results of the research have immediate and long term implications. The most obvious immediate benefit was the value of the personal feedback reports participants received with their CQ scores and the personal development plans they developed for how they would use and enhance their CQ capabilities. Thus, they gained direct self-awareness of how they saw their own CQ capabilities relative to the world-wide norms scores. This helped them work on specific CQ capabilities during the study abroad program, gave them tangible evidence of how they changed as a function of the program, and guided them in ways to use their CQ strengths after the program.
As future business leaders who will potentially operate across national borders and who will definitely have to function in cultural diverse settings, awareness of CQ capabilities is increasingly important for overall effectiveness. Comparison of pre and post CQ scores provides strong evidence that the study abroad program helped them enhance their CQ capabilities. Finally, the personal development plans they developed at the end of the program should help them apply their CQ strengths on an ongoing basis in the work and personal lives.
Table 1
Cultural Intelligence Before and After Study Abroad
Self-Report * Observer-Report * Observer-Report **
(friends, family, + study abroad partners) (study abroad partners only)
T1 – T2 % change T1 – T2 % change T1 – T2 % change
Metacognitive CQ 4.83 - 5.74 +19% 5.76-5.74 no significant difference 4.99-5.76 +15% Cognitive CQ 3.92 - 5.18 +32% 5.12-4.91 no significant difference 4.70-5.03 +7% Motivational CQ 5.60 - 6.23 +11% 6.11-5.89 no significant difference 5.29-5.85 +11% Behavioral CQ 4.48 - 5.32 +19% 4.85 - 5.28 +9% 4.89-5.58 +14% * n = 76 (T1 n = 82; T1 and T2 n = 76). ** n = 48 (subsample of observers who participated in study abroad)
Based on these results we recommend that organizers and facilitators of study abroad programs include assessment and feedback of pre- and post- CQ scores as a standard part of their programs. This will help structure study abroad experiences so that students focus on how their capabilities compare with the world-wide norms and then use this information to further enhance their CQ capabilities.
For additional information on cultural intelligence, see http:/www.culturalq.com
REFERENCES
Ang, S., & Van Dyne, L. (Eds.) (2008a). Handbook on cultural intelligence: Theory, measurement and
applications. Armonk, NY: M.E. Sharpe. Ang, S., & Van Dyne, L., (2008b). Conceptualization of cultural intelligence: Definition, distinctiveness,
and nomological network. In S. Ang, & L. Van Dyne, (Eds.) Handbook on cultural intelligence: Theory, measurement and applications (pp. 3-15). Armonk, NY: M.E. Sharpe.
Ang, S., Van Dyne, L., & Koh, C. 2006. Personality Correlates of the Four Factor Model of Cultural
Intelligence. Group and Organization Management, 31, 100-123. Ang, S., Van Dyne, L., Koh, C.K.S., Ng, K.Y., Templer, K.J., Tay, C., & Chandrasekar, N.A. (2007).
Cultural intelligence: Its measurement and effects on cultural judgment and decision making, cultural adaptation, and task performance. Management and Organization Review, 3, 335-371
Ang, S., Van Dyne, L., & Tan, M.L. (2011). Cultural intelligence. In. R. J. Sternberg & S. B. Kaufman
(Eds.), Cambridge Handbook on Intelligence (pp. 582-602). New York: Cambridge Press. Benson, P. G. 1978. Measuring cross-cultural adjustments: The problem of criteria. International Journal
of Intercultural Relations, 2, 21-36. Bartlett, C. A., and Ghoshal, S. (1989).Managing across borders: The transnational solution.
Massachusetts: Harvard Business School Press Bartlett, C. A., and Ghoshal, S. (1992), What is a Global Manager. Harvard Business Review,
September/October: 124-132. Earley, P. C., & Ang, S. (2003). Cultural Intelligence: Individual interactions across cultures. Palo Alto,
CA: Stanford University Press. Friedman, T. L. (2005). The world is flat. A brief history of the twenty-first century. New York: Farrar,
Straus and Giroux.
Kim, Y.J., & Van Dyne, L. (2012). Cultural intelligence and international leadership potential: The importance of contact for members of the majority. Applied Psychology: An International Review, 61, 272-294).
Livermore, D. (2006). Serving with Eyes Wide Open: Doing short-term missions with cultural intelligence. Grand Rapids, MI: Baker Books.
Livermore, D. (2010). Leading with cultural intelligence: The new secret to success. New York: American Management Association.
McLuhan, M. (1964). Understanding media: The extensions of man. New York: McGraw Hill.
Ng, K.Y., Van Dyne, L., & Ang, S. (2009a). From experience to experiential learning: Cultural intelligence as a learning capability for global leader development. Academy of Management Learning and Education, 8, 511-526.
Ng, K.Y., Van Dyne, L., & Ang, S. (2009b). Developing global leaders: The role of international
experience and cultural intelligence. In W.H. Mobley, Y. Wang, & M. Li (Eds.), Advances in global leadership, 5, 225-250. Bingley, UK: Emerald Group Publishing.
Ng, K.Y., Van Dyne, L., & Ang, S. (2012). Cultural intelligence: A review, reflections, and
recommendations for future research. In A.M. Ryan, F.T. Leong, & F.L. Oswald (Eds.), Conducting multinational research: Applying organizational psychology in the workplace (pp. 29-58). Washington, DC: American Psychological Association.
Rockstuhl, T., Seiler, S., Ang, S., Van Dyne, L, & Annen, H. (2011). Beyond general intelligence (IQ) and
emotional intelligence (EQ): The role of cultural intelligence (CQ) on cross-border leadership effectiveness in a globalized world. Journal of Social Issues, 67, 825-840.
Sternberg, R. J., & Detterman, D. K. (1986). What is intelligence? Contemporary viewpoints on its nature
and definition. Norwood, NJ: Ablex. Templer, K. J., Tay, C., & Chandrasekar, A. 2006. Motivational cultural intelligence, realistic job preview,
realistic living conditions preview, and cross-cultural adjustment. Group and Organization Management, 31 (1), 154-173.
Van Dyne, L., Ang, S., & Koh, C. (2008). Development and validation of the CQS: The cultural intelligence scale. In S. Ang, & L. Van Dyne, (Eds.) Handbook on cultural intelligence: Theory, measurement and applications (pp. 16-38). Armonk, NY: M.E. Sharpe.
Van Dyne, L., Ang, S., & Livermore, D. (2010). Cultural intelligence: A pathway for leading in a rapidly
globalizing world. In K.M. Hannum. B. McFeeters, & L. Booysen (Eds.), Leading across differences (pp. 131-138). San Francisco, CA: Pfeiffer.
Van Dyne, L., Ang, S., Ng, K.-Y., Rockstuhl, T., Tan, M.L., & Koh, C. (2012). Sub-dimensions of the four
factor model of cultural intelligence: Expanding the conceptualization and measurement of cultural intelligence (CQ). Social and Personal Psychology: Compass, 6/4, 295-313.
HOSPITALITY STUDENTS’ PERCEPTIONS OF DIGITAL TOOLS FOR LEARNING AND SUSTAINABLE DEVELOPMENT
Alisha Ali
Sheffield Hallam University, Sheffield, UK Email: [email protected]
Hilary Catherine Murphy Ecole hôtelière de Lausanne, Switzerland
Email: [email protected]
Sanjay Nadkarni Emirates Academy, UAE
Email: [email protected]
Abstract
This purpose of this paper is to interpret how students utilise technology in their learning activities and the implications for sustainability. It reports on the comparison drawn between final year undergraduate hospitality students at three academic institutions in UAE, England and Switzerland. An exploratory approach is deployed at this initial stage of research where students’ perceptions were gauged through a series of focus groups conducted at each institution. They were asked to identify their most used learning activities, the related eLearning tools and how these eTools impacted on their perceptions of sustainability. The research reveals that, though there are similarities between institutions, there are clear differences in perceptions of the relationship between learning activities, eLearning tools and sustainable development. Understanding how students engage with eLearning tools for sustainable development can benefit Universities by improving their Education for Sustainable Development strategy. It also provides students with an awareness of their role in sustainable development and it contributes to their employability as it makes them more globally aware citizens. Key Words: sustainability, digital tools/eTools, students’ learning
HOSPITALITY EDUCATION: CREATING SUSTAINABLE EMPOWERMENT OPPORTUNITIES FOR WOMEN IN NIGERIA
Belinda Nwosu FIH
Wavecrest College of Hospitality 75 Adisa Bashua Street, Surulere, Lagos, Nigeria
Abstract
This paper provides an overview of women empowerment and hospitality education in Nigeria. The aim of this study was to identify the extent to which hospitality education had empowered graduates in their professional and economic circumstances. The scope was limited to an all-female Monotechnic offering tertiary-level programmes in hospitality. The literature identifies education, employment and economic independence as variables for measuring women empowerment. Eighty-one graduates were administered questionnaires. The findings show relationships between educational attainments, type of employment engaged in and the range of income of respondents. Finally, the recommendations address the Millennium Development Goals (MDGs) particularly in the promotion of sustainable initiatives for women through hospitality education.
Keywords: women empowerment, hospitality education, Nigeria
INTRODUCTION
Mosedale (2005) and Eyben & Napier-Moore (2009) estimate that there are as many definitions of women empowerment as there are stakeholders in the field. In simple terms, empowerment offers women the power that they need in order to intervene in their own lives; that which they need in order to achieve well-being for themselves, their families and communities. The forms that express this state of empowerment include education, economic independence, access to finance, professional opportunities, gender equality, social obligations, participation in political life and many others (ALF, 1997; Flintan, 2008; Gholipour, Rahiman, Mirzamani & Zehtabi, 2010; UN, 2010).
A prevalent voice lent to the debate on women empowerment is that of the feminist movement which presents an image of a war between the sexes. This study works from the premise that views women empowerment as the cooperation between men and women to build a more just society (WFS, 2009); recognition of rights, duties and the inherent dignity of every contributor towards this world project. The reality of the exploitation and disregard for women in society however, cannot be ignored. In situations where women are relegated to the fringes of society, with little or no opportunity to take fair share of responsibilities for the development of their families and communities necessarily gives rise to imbalances that range from domestic violence to sexual abuse, from poverty to child delinquency (Mosedale, 2005).
The extent to which women can be empowered to protect and develop themselves outside unhealthy dependencies will be considered through the fundamental themes of education, employment and economic independence. The proverbial adage - teach a man to fish and you have fed him for life - gives to the educated the means that they need to take charge of life situations, earn a living and develop themselves. For women in sub-Saharan Africa, this is particularly relevant as shown in a United Nations report that for every 100 boys, only 67 girls gain access to higher education (UN, 2010).
The study in case is a female-only tertiary institution in Nigeria offering diploma qualifications in hospitality operations and management. The entry point is the two-year Ordinary National Diploma (OND) with introductory courses in hospitality operations and a 4-month period of supervised work experience in relevant sectors of the Industry before the completion of the second year. A pre-requisite for commencing the two years of management-related courses to obtain the Higher National Diploma (HND) is a 12-month internship. Primarily targeted towards young women from disadvantaged backgrounds, the programme is enhanced by a mentoring system and guest lecture series. These provides opportunities for resolving personal challenges and networking with Industry role models, both of which are key in guiding students to aspire and attain excellence in their personal and professional lives. This model of education and training was developed to address the needs of the Nigerian woman
in an environment where the historical antecedent of inequality has been to give priority to the male child, especially in the field of education (Adebayo, 2011).
Hospitality education has at this time become a veritable tool for empowering women in Africa, given the increased growth rate in international tourism and new infrastructure developments taking place around the continent (UNWTO, 2011; African Business, 2011; Ward, 2009). The question then is whether this potential for women empowerment is demonstrable in a hospitality-context? The aim of this study therefore is to identify to what extent the education received in the Monotechnic has empowered graduates in their professional and economic circumstances, and to make recommendations for improving the existing model.
LITERATURE REVIEW
The strategic importance of women empowerment derives from the far-reaching effects that it has on families and society. To borrow from an adage, a woman empowered is the village empowered, the role of woman in nurturing and developing life places her in a position of influence over individuals and consequently whole communities. This role must be acknowledged and appreciated for its unique contribution to sustainability. No society can develop and grow in a healthy manner without the presence of women who are equally free to develop in all facets of their daily lives - personal, social, professional, economic or political. The concept of women empowerment is not limited to the Third World. What form women empowerment eventually takes in a community is determined by the socio-cultural circumstances of the environment. For the developed countries, women empowerment may be defined mainly along the lines of equal pay, participation in political life and sexuality (Mosedale, 2005). Within the Nigerian context however, the impediments to women empowerment have been defined by gender stereotyping, illiteracy, poverty, religious beliefs and discrimination (Agu, 2007; Lasiele, 1999).
Needless to say, in the bid to address the domination and abuse of women in society over the years, there has been an equally dangerous trend in the depreciation of the value contributions that women make with respect to home life and child rearing. That women decide to give up careers and raise children does not imply disempowerment (Flintan, 2008). On the contrary, it is a choice to be equally respected. For any true emancipation to occur, women need to be women, recognized and appreciated in their femininity, rather than in a pseudo-feminine character modelled on the masculine.
In defining women empowerment therefore, one must consider who is being empowered and in what context this empowerment takes place. To limit the meaning of empowerment to the provision of education, access to finance, employment and other such indicators might be detrimental in the long term. It leads to an oversimplification of the issue in an attempt to define it strictly along pragmatic lines. The fact that one is earning does not imply by default that one is empowered (MLR, 2012). The human person, male or female, is a sum total of many parts. The fulfilment of human existence goes beyond the material, which makes explains the paradox often encountered where people who are materially poor seem to be more generous than those who lack little. Women empowerment therefore does not exist in a vacuum but is conditioned by culture, religion and other social constructs within which it is sought (Chaudhary, Chani & Pervaiz, 2012; Gholipour et al, 2010; Flintan, 2008; Mosedale, 2005; Anju, Sidney & Boender, 2002).
Given the multifaceted dimension of empowerment it is best understood as a process rather than an end in itself; empowerment for something rather than for the sake of empowerment alone (Mosedale, 2005). How then does the concept of empowerment get measured? The literature reveals little consensus on an accepted method for measuring empowerment. A number of authors have drawn variables ranging from ‘hard indicators’ such as income, health and educational attainment, to more ‘soft indicators’ such as relationships, marriage, decision-making in the home, etc. (Flintan, 2008; Mosedale, 2005; Williams, 2005, Anju et al, 2002). Be that as it may, it is accepted that education, employment and earning offer women a degree financial independence and so is one powerful means of measuring empowerment (Gholipour et al, 2010; Grown, 2010).
The UN Millennium Development Goals (2010) show that:
“In every developing region except the CIS, men outnumber women in paid employment, women are largely relegated to more vulnerable forms of employment, women are over-represented in informal employment, with its lack of benefits and security and top-level jobs still go to men — to an overwhelming degree” (p.1)
The key factors responsible for this disparity appear to be in one way related to the access or even level of educational attainment of women. To compete in the global economy today, knowledge is not an option but a necessity; the more women access this knowledge, the more likely this disparity between the genders will be addressed (Bose, Ahmad & Hossain, 2009; ADF, 2008; Agu, 2007; Adebayo, 2011). In fact, it is the access to tertiary education that Nwaubani (2007) considers as the ‘bedrock of women empowerment.’ With education, opportunities for self-development are created either through employment or entrepreneurship. Once achieved, these allow for some degree of control over resources and decision-making which in turn allows for more sustainable living (Adebayo, 2011; Mosedale, 2005).
The United Nations World Tourism Organisation (2008) reports that 60-70% of women employed in the
tourism industry are women. This highlights the contributory role that the tourism and hospitality industry plays in creating opportunities for economic empowerment through employment and entrepreneurship at all levels in society (Ampumuza, Van der Heijden, Hendriks, Klunder, Mazurek, Van de Mosselaer, Ong, Pan & Van Rumpt, 2008; Senhidemi, 2009; McMillan, O'Gorman.& MacLaren, 2011). From the informal to the formal sector, opportunities to sustain one’s person and family through service to others are the defining feature of this industry.
Specifically, the hospitality and tourism industry in Nigeria has experienced phenomenal growth especially in the areas of foodservice and accommodation where a growing number of Nigerian-owned and international brands have entered and continue to swell the market. Two years after it entered the market in 2009, Kentucky Fried Chicken (KFC) has opened over 20 outlets with plans to open another 19 underway, this being a $90million investment (The News Africa, 2012); likewise, the influx of international hotel brands into the Nigerian market has also opened up an area for employment opportunities (African Business, 2011).
The role of hospitality education in developing the manpower to sustain these investments is clear. Culturally, Nigerians are well known for their hospitality, it forms a way of life for the vast number of people. However, the transition of informal to formal hospitality provision that allows for competitiveness in the global market is yet to be satisfactorily achieved. One reason for this pull towards the informal sector has been linked to high unemployment rates in Nigeria (Awogbenle & Iwuamadi, 2010). In order to survive therefore, young people are instead forced to take up whatever jobs that can be found rather than developing themselves in careers of choice. Hospitality education is a fairly new development within the formal education sector and has developed in three phases - the first phase being the colonial and early independence era with the introduction of City & Guilds qualifications at the craft-level (NABTEB, 2012); the second phase spanning the late 1970s to date saw the introduction and consolidation of hotel and catering management studies at the polytechnic level (NBTE, 2012) ; the third phase in the last 5-6 years has seen the introduction of Bachelor and Master degrees at university level (UTME, 2012). There are however a number of Nigerians who have sought these higher qualifications in institutions overseas. This growth in the forms and scale of hospitality education provision is evidence of the demand for knowledge and skills to support the sector.
METHODOLOGY
The literature identified variables such as income, educational attainment and employment as indicators of
the extent to which empowerment has been achieved (Flintan, 2008; Mosedale, 2005; Williams, 2005, Anju et al, 2002; Gholipour et al, 2010; Grown, 2010). The aim of this study was to identify to what extent the education received in the Monotechnic has empowered graduates in their professional and economic situation, and to make recommendations for improving the existing model. This section will attempt to communicate the rationale for the data collection methods adopted and an acknowledgement of the limitations of this study.
Bearing in mind, the nature of the data needed to provide answers to the question, a quantitative approach was considered appropriate for this study. The rationale for an empirical study was to examine the extent to which the theory of women empowerment, education and economic freedom actually relate to the reality of life among the graduates of the Monotechnic. Specifically, the survey method using a questionnaire with a mix of closed and open-ended questions was adopted.
The target population for the study was graduates of the Monotechnic across its 37-year history. Ideally, the
responses from across this range of years would have generated valuable data but for the constraints of
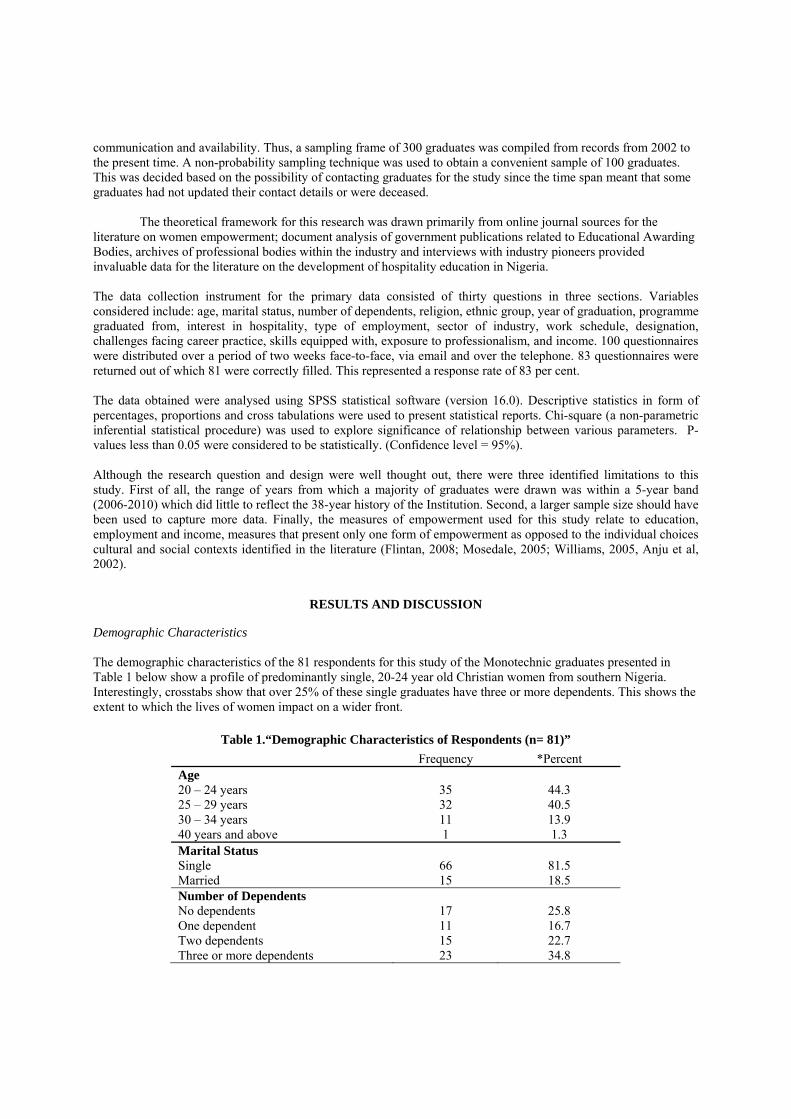
communication and availability. Thus, a sampling frame of 300 graduates was compiled from records from 2002 to the present time. A non-probability sampling technique was used to obtain a convenient sample of 100 graduates. This was decided based on the possibility of contacting graduates for the study since the time span meant that some graduates had not updated their contact details or were deceased.
The theoretical framework for this research was drawn primarily from online journal sources for the
literature on women empowerment; document analysis of government publications related to Educational Awarding Bodies, archives of professional bodies within the industry and interviews with industry pioneers provided invaluable data for the literature on the development of hospitality education in Nigeria.
The data collection instrument for the primary data consisted of thirty questions in three sections. Variables considered include: age, marital status, number of dependents, religion, ethnic group, year of graduation, programme graduated from, interest in hospitality, type of employment, sector of industry, work schedule, designation, challenges facing career practice, skills equipped with, exposure to professionalism, and income. 100 questionnaires were distributed over a period of two weeks face-to-face, via email and over the telephone. 83 questionnaires were returned out of which 81 were correctly filled. This represented a response rate of 83 per cent. The data obtained were analysed using SPSS statistical software (version 16.0). Descriptive statistics in form of percentages, proportions and cross tabulations were used to present statistical reports. Chi-square (a non-parametric inferential statistical procedure) was used to explore significance of relationship between various parameters. P-values less than 0.05 were considered to be statistically. (Confidence level = 95%). Although the research question and design were well thought out, there were three identified limitations to this study. First of all, the range of years from which a majority of graduates were drawn was within a 5-year band (2006-2010) which did little to reflect the 38-year history of the Institution. Second, a larger sample size should have been used to capture more data. Finally, the measures of empowerment used for this study relate to education, employment and income, measures that present only one form of empowerment as opposed to the individual choices cultural and social contexts identified in the literature (Flintan, 2008; Mosedale, 2005; Williams, 2005, Anju et al, 2002).
RESULTS AND DISCUSSION Demographic Characteristics The demographic characteristics of the 81 respondents for this study of the Monotechnic graduates presented in Table 1 below show a profile of predominantly single, 20-24 year old Christian women from southern Nigeria. Interestingly, crosstabs show that over 25% of these single graduates have three or more dependents. This shows the extent to which the lives of women impact on a wider front.
Table 1.“Demographic Characteristics of Respondents (n= 81)”
Frequency *Percent Age 20 – 24 years 25 – 29 years 30 – 34 years 40 years and above
35 32 11 1
44.3 40.5 13.9 1.3
Marital Status Single Married
66 15
81.5 18.5
Number of Dependents No dependents One dependent Two dependents Three or more dependents
17 11 15 23
25.8 16.7 22.7 34.8
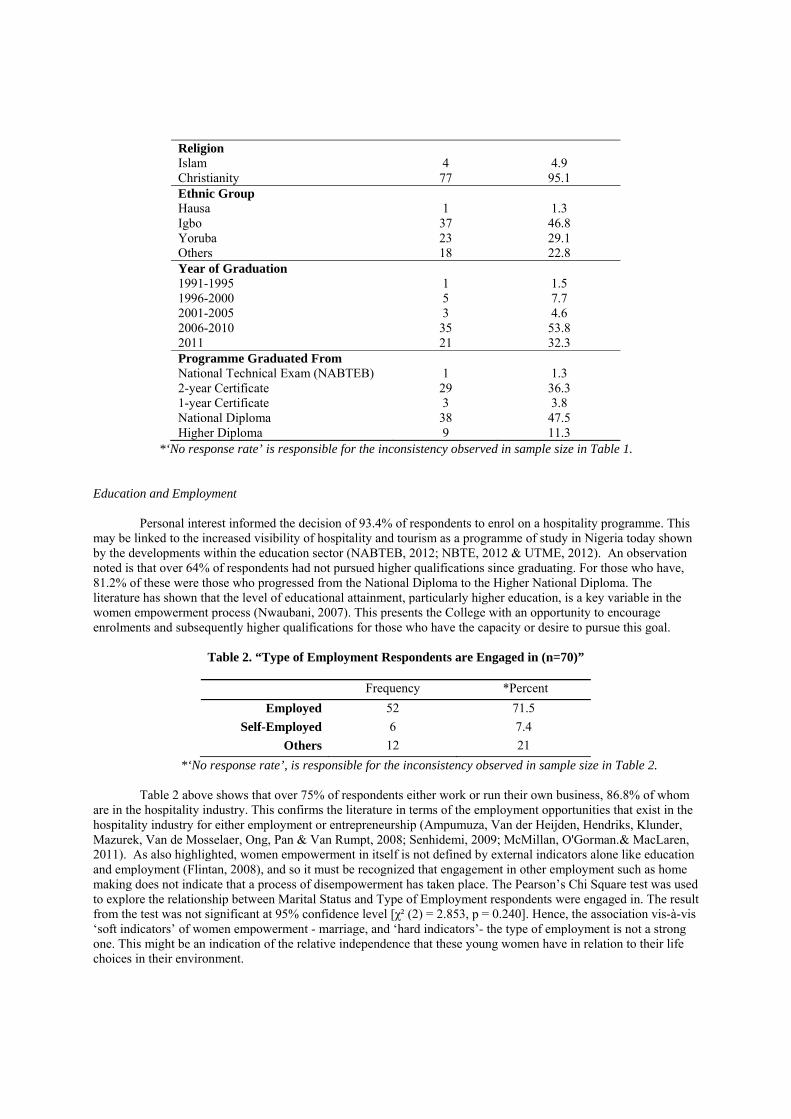
Religion Islam Christianity
4
77
4.9
95.1 Ethnic Group Hausa Igbo Yoruba Others
1
37 23 18
1.3
46.8 29.1 22.8
Year of Graduation 1991-1995 1996-2000 2001-2005 2006-2010 2011
1 5 3
35 21
1.5 7.7 4.6
53.8 32.3
Programme Graduated From National Technical Exam (NABTEB) 2-year Certificate 1-year Certificate National Diploma Higher Diploma
1
29 3
38 9
1.3
36.3 3.8
47.5 11.3
*‘No response rate’ is responsible for the inconsistency observed in sample size in Table 1. Education and Employment
Personal interest informed the decision of 93.4% of respondents to enrol on a hospitality programme. This may be linked to the increased visibility of hospitality and tourism as a programme of study in Nigeria today shown by the developments within the education sector (NABTEB, 2012; NBTE, 2012 & UTME, 2012). An observation noted is that over 64% of respondents had not pursued higher qualifications since graduating. For those who have, 81.2% of these were those who progressed from the National Diploma to the Higher National Diploma. The literature has shown that the level of educational attainment, particularly higher education, is a key variable in the women empowerment process (Nwaubani, 2007). This presents the College with an opportunity to encourage enrolments and subsequently higher qualifications for those who have the capacity or desire to pursue this goal.
Table 2. “Type of Employment Respondents are Engaged in (n=70)”
Frequency *Percent
Employed 52 71.5
Self-Employed 6 7.4
Others 12 21
*‘No response rate’, is responsible for the inconsistency observed in sample size in Table 2.
Table 2 above shows that over 75% of respondents either work or run their own business, 86.8% of whom are in the hospitality industry. This confirms the literature in terms of the employment opportunities that exist in the hospitality industry for either employment or entrepreneurship (Ampumuza, Van der Heijden, Hendriks, Klunder, Mazurek, Van de Mosselaer, Ong, Pan & Van Rumpt, 2008; Senhidemi, 2009; McMillan, O'Gorman.& MacLaren, 2011). As also highlighted, women empowerment in itself is not defined by external indicators alone like education and employment (Flintan, 2008), and so it must be recognized that engagement in other employment such as home making does not indicate that a process of disempowerment has taken place. The Pearson’s Chi Square test was used to explore the relationship between Marital Status and Type of Employment respondents were engaged in. The result from the test was not significant at 95% confidence level [χ² (2) = 2.853, p = 0.240]. Hence, the association vis-à-vis ‘soft indicators’ of women empowerment - marriage, and ‘hard indicators’- the type of employment is not a strong one. This might be an indication of the relative independence that these young women have in relation to their life choices in their environment.
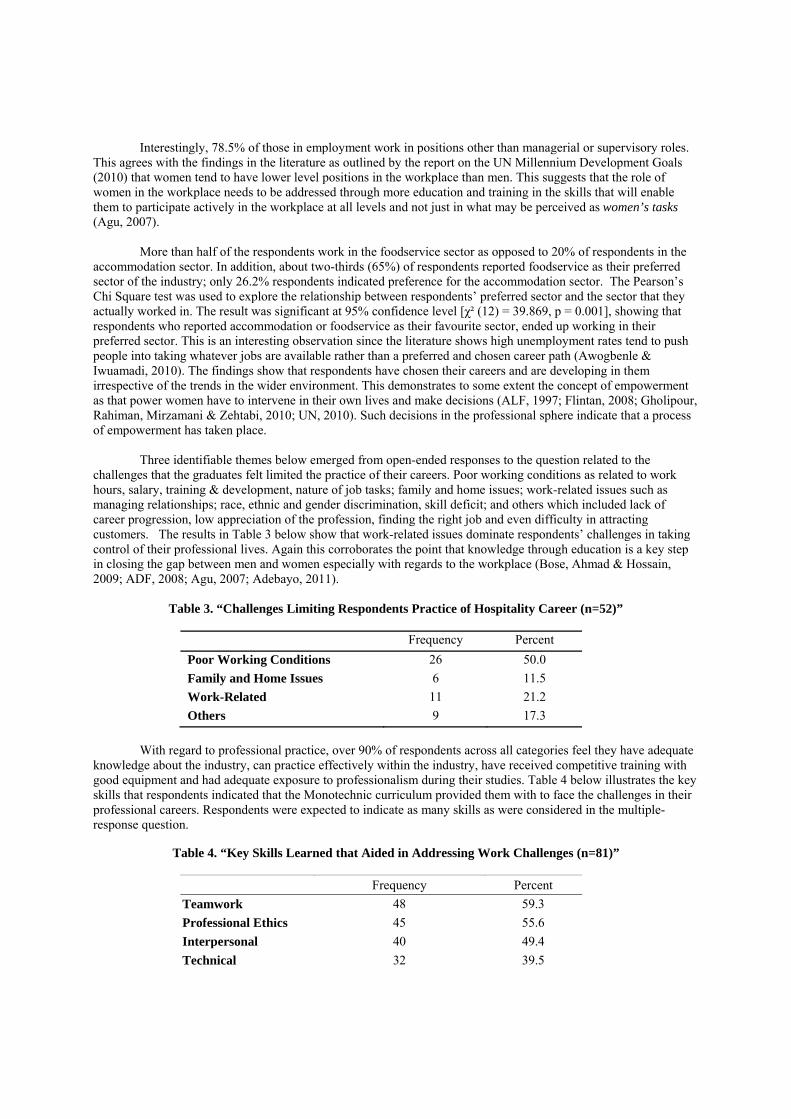
Interestingly, 78.5% of those in employment work in positions other than managerial or supervisory roles. This agrees with the findings in the literature as outlined by the report on the UN Millennium Development Goals (2010) that women tend to have lower level positions in the workplace than men. This suggests that the role of women in the workplace needs to be addressed through more education and training in the skills that will enable them to participate actively in the workplace at all levels and not just in what may be perceived as women’s tasks (Agu, 2007).
More than half of the respondents work in the foodservice sector as opposed to 20% of respondents in the
accommodation sector. In addition, about two-thirds (65%) of respondents reported foodservice as their preferred sector of the industry; only 26.2% respondents indicated preference for the accommodation sector. The Pearson’s Chi Square test was used to explore the relationship between respondents’ preferred sector and the sector that they actually worked in. The result was significant at 95% confidence level [χ² (12) = 39.869, p = 0.001], showing that respondents who reported accommodation or foodservice as their favourite sector, ended up working in their preferred sector. This is an interesting observation since the literature shows high unemployment rates tend to push people into taking whatever jobs are available rather than a preferred and chosen career path (Awogbenle & Iwuamadi, 2010). The findings show that respondents have chosen their careers and are developing in them irrespective of the trends in the wider environment. This demonstrates to some extent the concept of empowerment as that power women have to intervene in their own lives and make decisions (ALF, 1997; Flintan, 2008; Gholipour, Rahiman, Mirzamani & Zehtabi, 2010; UN, 2010). Such decisions in the professional sphere indicate that a process of empowerment has taken place.
Three identifiable themes below emerged from open-ended responses to the question related to the
challenges that the graduates felt limited the practice of their careers. Poor working conditions as related to work hours, salary, training & development, nature of job tasks; family and home issues; work-related issues such as managing relationships; race, ethnic and gender discrimination, skill deficit; and others which included lack of career progression, low appreciation of the profession, finding the right job and even difficulty in attracting customers. The results in Table 3 below show that work-related issues dominate respondents’ challenges in taking control of their professional lives. Again this corroborates the point that knowledge through education is a key step in closing the gap between men and women especially with regards to the workplace (Bose, Ahmad & Hossain, 2009; ADF, 2008; Agu, 2007; Adebayo, 2011).
Table 3. “Challenges Limiting Respondents Practice of Hospitality Career (n=52)”
Frequency Percent
Poor Working Conditions 26 50.0
Family and Home Issues 6 11.5
Work-Related 11 21.2
Others 9 17.3
With regard to professional practice, over 90% of respondents across all categories feel they have adequate
knowledge about the industry, can practice effectively within the industry, have received competitive training with good equipment and had adequate exposure to professionalism during their studies. Table 4 below illustrates the key skills that respondents indicated that the Monotechnic curriculum provided them with to face the challenges in their professional careers. Respondents were expected to indicate as many skills as were considered in the multiple-response question.
Table 4. “Key Skills Learned that Aided in Addressing Work Challenges (n=81)”
Frequency Percent
Teamwork 48 59.3
Professional Ethics 45 55.6
Interpersonal 40 49.4
Technical 32 39.5
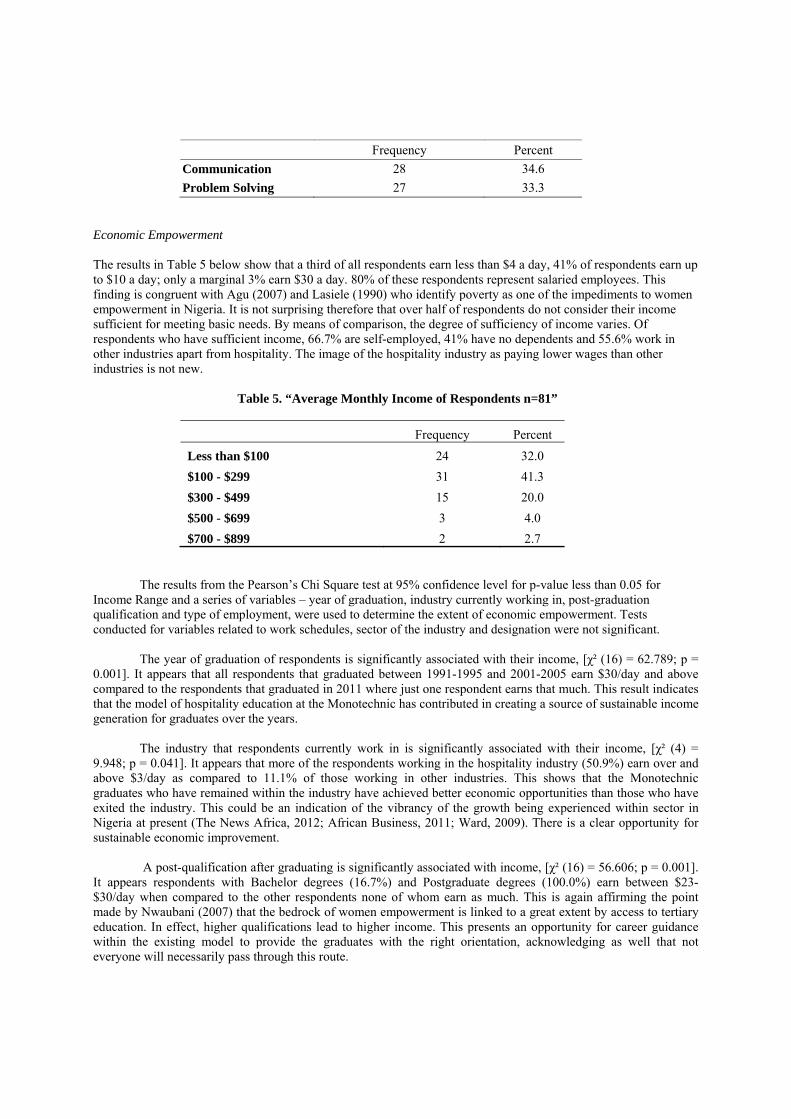
Frequency Percent
Communication 28 34.6
Problem Solving 27 33.3
Economic Empowerment The results in Table 5 below show that a third of all respondents earn less than $4 a day, 41% of respondents earn up to $10 a day; only a marginal 3% earn $30 a day. 80% of these respondents represent salaried employees. This finding is congruent with Agu (2007) and Lasiele (1990) who identify poverty as one of the impediments to women empowerment in Nigeria. It is not surprising therefore that over half of respondents do not consider their income sufficient for meeting basic needs. By means of comparison, the degree of sufficiency of income varies. Of respondents who have sufficient income, 66.7% are self-employed, 41% have no dependents and 55.6% work in other industries apart from hospitality. The image of the hospitality industry as paying lower wages than other industries is not new.
Table 5. “Average Monthly Income of Respondents n=81”
Frequency Percent
Less than $100 24 32.0
$100 - $299 31 41.3
$300 - $499 15 20.0
$500 - $699 3 4.0
$700 - $899 2 2.7
The results from the Pearson’s Chi Square test at 95% confidence level for p-value less than 0.05 for
Income Range and a series of variables – year of graduation, industry currently working in, post-graduation qualification and type of employment, were used to determine the extent of economic empowerment. Tests conducted for variables related to work schedules, sector of the industry and designation were not significant.
The year of graduation of respondents is significantly associated with their income, [χ² (16) = 62.789; p = 0.001]. It appears that all respondents that graduated between 1991-1995 and 2001-2005 earn $30/day and above compared to the respondents that graduated in 2011 where just one respondent earns that much. This result indicates that the model of hospitality education at the Monotechnic has contributed in creating a source of sustainable income generation for graduates over the years.
The industry that respondents currently work in is significantly associated with their income, [χ² (4) =
9.948; p = 0.041]. It appears that more of the respondents working in the hospitality industry (50.9%) earn over and above $3/day as compared to 11.1% of those working in other industries. This shows that the Monotechnic graduates who have remained within the industry have achieved better economic opportunities than those who have exited the industry. This could be an indication of the vibrancy of the growth being experienced within sector in Nigeria at present (The News Africa, 2012; African Business, 2011; Ward, 2009). There is a clear opportunity for sustainable economic improvement.
A post-qualification after graduating is significantly associated with income, [χ² (16) = 56.606; p = 0.001].
It appears respondents with Bachelor degrees (16.7%) and Postgraduate degrees (100.0%) earn between $23-$30/day when compared to the other respondents none of whom earn as much. This is again affirming the point made by Nwaubani (2007) that the bedrock of women empowerment is linked to a great extent by access to tertiary education. In effect, higher qualifications lead to higher income. This presents an opportunity for career guidance within the existing model to provide the graduates with the right orientation, acknowledging as well that not everyone will necessarily pass through this route.
The type of employment is significantly associated with income range, [χ² (8) = 25.122; p = 0.001]. It
appears that only those respondents who work in paid employment (27.3%) earn $10/day and above as compared to the other respondents in self or other employment that recorded none earning up to this amount. This presents an interesting finding that graduates of the Monotechnic earn more from paid employment than from entrepreneurship. It would be a point in case for future research to explore the extent of this observation for a larger sample of graduates.
CONCLUSION
Women in Africa are among the world’s most vulnerable people; a situation that has persisted due to social inequalities, some of which have been identified as gender stereotyping, illiteracy, poverty, religious beliefs and discrimination (Agu, 2007; Lasiele, 1999). Suggestions for addressing this imbalance have been charted by the UN Millennium Development Goals, particularly the third goal which seeks to promote gender equality and empower women at all levels of education by 2015 (UN, 2010). Numerous authors have identified women empowerment as being more readily achieved with increased access to education, employment opportunities and consequently economic independence. The study has shown that the model of education and training offered at the Monotechnic has to some extent, addressed these key elements of the empowerment process by providing the needed access to education at the tertiary level, the acquisition of employable skills in a viable and growing economic sector, and the opportunity to achieve some degree of economic freedom. It was demonstrated that the income for graduates is significantly associated with the length of time in employment, particularly paid employment; that this employment is within the hospitality industry, and that higher qualifications have been acquired since graduating. In conclusion, this study reinforces the understanding that hospitality education does play a significant role in the on-going dialogue for women empowerment. Capacity-building attained through the acquisition of knowledge and skills places women in a position to take charge of their lives by engaging either in paid employment or as entrepreneurs. Thus, a silent but effective revolution within the hospitality sector has been taking place, creating sustainable opportunities for self-realisation among women in Nigeria.
REFERENCES
Adebayo, O. A. (2011). Empowerment of Women in Wage Employment in Nigeria: The Relevance of Workers Education. Journal of Social Science, 27(1), 59-65.
Africa Leadership Forum (1997). Empowering Women for the 21st Century: The Challenges of Politics, Business, Development & Leadership. Summary Report at the 9th Annual Conference Accra, Ghana 27-29 Jan 1997, 44-50.
African Business (2011, November 1). Radísson Blu leads Lagos Hotel Boom African Business, 8. African Development Forum VI (2008). Empowering African Women. Report from the 6th African Development
Forum (ADF VI) Action, Addis Ababa, Ethiopia 19-21 Nov 2008, 1-6. Agu, S. (2007). Gender Equality, Education and Women Empowerment: The Nigerian Challenge. Multidisciplinary
Journal of Research Development, 8(2), 1-7. Ampumuza, C., Van der Heijden, F., Hendriks, N., Klunder, R., Mazurek, J., Van de Mosselaer, F., Ong, E., Pan, S.,
& Van Rumpt, I. (2008). Women Empowerment through Tourism, Research Project at Wageningen University, The Netherlands, Supervisor: Drs. I. Ateljevic.
Anju M., Sidney, R., & Boender, C. (2002). Measuring Women’s Empowerment as a Variable in International Development, Background Paper at World Bank Workshop on Poverty and Gender: International Centre for Research on Women, Jun 28, 2002
Ashley, C., De Brine, P., Lehr, A., & Wilde, H. (2007). The Role of the Tourism Sector in Expanding Economic Opportunity The Fellows of Harvard College, Overseas Development Institute, International Business Leaders Forum
Awogbenle, A.C., & Iwuamadi, K.C. (2010) Youth Unemployment: Entrepreneurship Development Programme as an Intervention Mechanism. African Journal of Business Management, 4(6), 831-835
Bose, M., Ahmad, A. & Hossain, M. (2009). The Role of Gender in Economic Activities with Special Reference to Women's Participation and Empowerment in Rural Bangladesh. Gender, Technology & Development, 13(1), 69-102.
Chaudhary, A., Chani, M.I. & Pervaiz, Z. (2012). Analysis of Different Approaches to Women Empowerment: A Case Study of Pakistan World Applied Sciences Journal 16(7), 971-980.
Eyben, R., & Napier-Moore, R. (2009). Choosing Words with Care? Shifting Meanings of Women Empowerment in International Development Third World Quarterly, 30(2), 285-300.
Flintan, F. (2008). Report on Women’s Empowerment in Pastoral Societies. Ethiopia: Addis Ababa. Gholipour, A., Rahiman, A., Mirzamani, A., & Zehtabi, M. (2010). Impact Model of Women’s Empowerment
International Business Research. 3(1), 57-65. Grown, C. (2010). Economics, Assets and Empowerment Development, 53(2), 168-171. Jemide, A., Kukoyi, D., & Greg, N. (2008). More Appetite for Emerging Markets International Financial Law
Review, 27(7), 70-72. Joint Admissions and Matriculation Board (2012). Brochure. Retrieved May 8, 2012, from
http://www.jamb.org.ng/unifiedtme/brochure Lasiele, Y. (1999). Women Empowerment in Nigeria: Problems, Prospects & Implications for Counseling The
Counselor 17 (1), 132-137. McMillan, C., O'Gorman, K., & MacLaren, A. (2011). Commercial Hospitality: A Vehicle for the Sustainable
Empowerment of Nepali Women International Journal of Contemporary Hospitality Management, 23(2), 189-208.
Monthly Labour Review (2012). The Chicken and the Egg, 135(3), 67 Mosedale, S. (2005). Assessing Women’s Empowerment: Towards a Conceptual Framework Journal of
International Development, 17(2), 243-257. National Board for Technical Education (2012). Brief History of National Board for Technical Education (NBTE).
Retrieved May 8, 2012 from http://www.nbte.gov.ng/history.html. National Business & Technical Examination Board (2012). Brief History of NABTEB. Retrieved May 8, 2012 from
http://www.nabtebnigeria.org/history.html Nwaubani, O. (2000). Women Education and National Development in Nigeria. In Emergent Issues in Nigerian
Education. Lagos: Mukugamu Press. Senhidemi, A. (2009, December 17). KFC promises employment, opens in Nigeria. The Nation Online Newspaper.
Retrieved April 26, 2012 from: http://thenationonlineng.net/web2/articles/29157/1/KFC-promises-employment-opens-in-Nigeria/Page1.html
The News Africa Online (2012). The KFC Effect. Retrieved April 26, 2012 from http://thenewsafrica.com/2012/04/16/the-kfc-effect April 16, 2012
United Nations (2010). Millennium Development Goals Fact Sheet Goal 3: Promote Gender Equality and Empower Women Retrieved April 26, 2012 from http://www.un.org/millenniumgoals/gender.shtml
United Nations World Tourism Organisation (2008). Empowering Women through Tourism Retrieved April 26, 2012 from http://www.forimmediaterelease.net/pm/1285.html on 20.05.2008>
United Nations World Tourism Organisation (2011). International Tourism: First Results of 2011 Confirm Consolidation of Growth Retrieved May 4, 2012 at: http://media.unwto.org/en/press-release/2011-05-11/international-tourism-first-results-2011-confirm-consolidation-growth
Ward, T. (2009). Hotel Investment: Room to Keep on Building Africa Investor November/December, 78 Williams, J. (2005). Measuring Gender and Women’s Empowerment Using Confirmatory Factor Analysis Working
Paper IBS Institute of Behavioural Science University of Colorado, Boulder. World Family Summit (2009). Istanbul Declaration ‘Families in Balance’ A Global Mobilization towards the
Achievement of the MDG 3: Achieving Gender Equality and Empowering Women 4-7 Dec 2009 Retrieved May 8, 2012 from http://www.worldfamilyorganization.org/archive/news/2009/Istanbul%20Declaration.pdf
STUDENT DETERMINANTS OF ACADEMIC ACHIEVEMENT AND PROGRAM COMPLETION INTENTION
Brian Soule
Department of Recreation, Park, and Tourism Management The Pennsylvania State University
801 Ford Building University Park, PA, 16802, USA
James A. Busser* William F. Harrah College of Hotel Administration
University of Nevada, Las Vegas 4505 Maryland Parkway
Las Vegas, NV, 89154, USA [email protected]
Cynthia Carruthers
College of Education University of Nevada, Las Vegas
4505 Maryland Parkway Las Vegas, NV, 89154, USA [email protected]
ABSTRACT
The purpose of this study was to investigate the factors that contribute to the retention and academic
success of students in a Hospitality PGA Golf Management program. One hundred and seventeen students completed an on-line survey that measured student academic self-efficacy and program value, socializers’ perception of student self-efficacy and program value, intention to complete the program and grades. Regression analyses revealed several significant findings: 1) students’ task value predicted their intention to complete the program, 2) students’ self-efficacy regarding academic achievement was a strong predictor of students’ self-reported grades, and 3) students’ parents’ beliefs regarding their self-efficacy was the most important predictor of students’ grades; and students’ perception of their peers’ beliefs regarding their self-efficacy was second most important. Keywords: academic achievement, expectancies, intention, socializers task value
Development and evaluation of an eLearning course presenting a regional destination. The case of “Ticino Switzerland Travel Specialist”.
Names of authors: Nadzeya Kalbaska*
Olena Sorokolit Lorenzo Cantoni
Affiliations:
webatelier.net Faculty of Communication Sciences
Università della Svizzera italiana Via G. Buffi 13 Lugano
6900 Switzerland
E-mail addresses: [email protected]
[email protected] [email protected]
Abstract:
This paper introduces an eLearning course offered by a Swiss regional Destination Management Organization, and presents the process of its development and evaluation. The development of the platform has been done based on the ADDIE model, which stands for Analyze- Design- Develop- Implement- Evaluate, where each word represents a step in the implementation procedure. The evaluation of the platform was designed in two steps: a usability testing of 8 users (who were asked to speak aloud their thoughts about the training platform); and a survey of users who have followed the course. The evaluation survey of travel agents who have subscribed to “Ticino Switzerland Travel Specialist” course (about 70 respondents) has been built according to D. Kirkpatrick evaluation model of a learning activity. Keywords: eTourism; eLearning; DMO, usability, instructional design
Introduction The competitiveness of tourism destinations depends largely on how information needs of stakeholders
(being final consumers or intermediaries) can be satisfied through ICT-based infrastructures and services (Buhalis & Law 2008). In this process, the quality of online communication in terms of usability (content, navigation, transactions, as well as overall usability) has become a fundamental issue (Inversini & Cantoni, 2009). Careful design and usability evaluation practices are crucial not only for general Business to Client (B2C) websites, but also for Business to Business (B2B) sites and online tourism educational resources (Salmon et.al (2008).
From 2006 onward, Destination Management Organizations (DMOs) have started to offer full online learning experience (eLearning courses), which provide travel agents and distributors with the knowledge and skills to better promote and sell tourism destinations and its attractions (UNWTO, 2008). DMO eLearning courses are online training activities offered by DMOs at national, regional, or local level to travel agents and tour operators involved in selling the country (or region, city) as a tourist destination. Examples include the Botswana Tourism Training Course, Switzerland Travel Academy, or the Aussie Specialist Program (Cantoni et al, 2009). Courses cover the destination itself, its hospitality and tourism offers, tips on how to better sell it; furthermore, most also award an ad hoc certificate upon completion of a final test. In 2011, 69 national DMOs worldwide provided eLearning platforms for travel agents, almost double the number available in 2009 (Kalbaska, 2012), which shows clear interest in exploiting the opportunities presented by eLearning to provide agents with a structured and comprehensive view of what a destination can offer.
Despite the growing interest from the industry, however, little academic research has been done on the subject. Little is therefore known in academic literature about the status of eLearning courses created by DMOs for travel agents. The objective of this paper is to address one course, offered by a Swiss regional DMO – Ticino Turismo and present the process of its development and evaluation. The methodology chosen for the development phase is the ADDIE model (AskERIC, 1999), which stands for Analyze- Design- Develop- Implement- Evaluate, where each word represents a step in the implementation procedure.
The evaluation of the platform was designed in two steps: a usability testing of users of eight travel agents who have attended full online training experience, whereas speaking aloud their thoughts/feelings (Nielsen & Mack, 1994). In this process content quality, navigation quality, transaction quality and overall usability of the eLearning platform were measured. The second evaluation step undertaken was an evaluation survey of travel agents who have followed the course. About 70 respondents have answered online survey. The survey was built according to D. Kirkpatrick (1994) evaluation model of a learning activity, measuring reaction, knowledge, transfer and impact.
The structure of the paper is as follows: the case study is introduced, followed by the methodology of the development of the online training program, presenting then the results of the usability analysis and the evaluation survey.
1. The Case: Ticino Switzerland Travel Specialist eLearning Platform Ticino Turismo is a Destination Management Organization (DMO) of the Ticino region in Switzerland.
Its main responsibilities are marketing and promotion of the region using offline and online media. In order to acquire and strengthen the online B2B communication with national and international travel professionals, enhance training activities and deliver up-to-date, clear and catchy brand image of Ticino as a destination, the opportunity for the creation of an eLearning platform has emerged.
The project “Ticino Switzerland Travel Specialist eLearning Platform” has been integrated into the trade corner section of the corporate website, which provides tour operators, travel agents and wholesales with important information and current news updates about Ticino enabling the effective design and planning of trips to the region. Additionally, in the Trade Corner the travel professionals can find the link to the Ticino eLearning platform – an educational program, which offers the opportunity for trade partners to discover cultural and natural attractions and peculiarities of the Canton Ticino.
The project “Ticino Switzerland Travel Specialist” eLearning Platform is based on the collaboration with the webatelier.net, research lab of the Università della Svizzera italiana (University of Lugano, Switzerland), whose expertise in eLearning was used in order to create an eLearning platform for personalized education of travel agents. The project started in November 2010, with the planned length of one year.
The Ticino eLearning course is currently exclusively available online on the official website of DMO Ticino Turismo in the Trade corner section at the next web address: www.ticino.ch/e-learning
2. Development of an eLearning course In order to create an effective eLearning course, reliable and tested academic practices and
methodologies were used. In particular, a process moving from the analysis up to the evaluation has been
adopted. This process has been named ADDIE (AskERIC, 1999), which stands for Analyze- Design- Develop- Implement- Evaluate, where each word represents a phase in the model and a step in the implementation procedure. Thus, the five stages of this model were adapted and devised according to the needs and requirements of the eLearning project. Two basic characteristics of this model are:
o designing starts with the analysis, as a crucial element of course design in the eLearning environment;
o designing is cyclical, which means that when the course development is over, the designers start over again based on the evaluation and the desired improvements learnt from the experience they just had.
2.1. Analyze
The analysis of the needs and the definition of educational and business goals of the eLearning platform were defined through two steps:
o instructional and content analysis through the “benchmarking study” of similar courses provided by different DMOs worldwide;
o interviews with DMO representatives (Ticino Turismo) on their motivation of having an eLearning course and its possible integration into trade and marketing activities.
The examination of the results attained from the interviews and benchmarking research enabled the
outline of the main instructive goals of the “Ticino Switzerland Travel Specialist” course. Main educational goal of “Ticino Switzerland Travel Specialist eLearning platform” has been defined as to train internationally operating travel professionals, travel agents and tour operators to sell Ticino as a destination and to provide them with “Ticino Switzerland Travel Specialist” (TSTS) certificate. Additionally, it was expected that in the long-term the running of the course would also expand the B2B relations and enhance the Ticino sales forces worldwide, would provide the trade corner with extra channel to influence the travel market and would raise the international publicity of the canton Ticino.
2.2. Design Instructional strategy and didactic materials of the eLearning platform were designed through:
o Information architecture; o Instructional design.
Within the Design phase the structure of the training, the content materials, the instructive templates, the interaction elements, and the course functionalities were defined. Information architecture enabled formation of the concrete steps of successful passage of the course, as well helped to allocate possible interaction and activities within the platform. Instructional design clarified the structure of the modules, their functionalities and possible interaction of the user within each module.
At the end of the Design phase, online training course was structured into 5 training modules: “Discover Ticino”, “Selling tips and testimonials”, “Culture and events”, “Excursions and nature”, “Rivers and lakes”. All course materials were developed in English. Time needed to complete all studying and testing activities is about 90 minutes. In order to get a certificate, participants need to go through all training materials (read slides, watch videos and play interactive animations) and pass the final exam. “Intermediate” and “final” tests sections are related to the educational evaluation activities of the course. “Intermediate” test enables examination of the existing knowledge of the participant or fill a knowledge gap about Switzerland and Ticino. Then, “final” test is the direct way to attain the certificate. The final quiz is presented in a form of well known “Who wants to be a Millionaire” game and consists of 10 questions. The participant gets maximum of 3 attempts to pass this exam. Once the “final” test is passed the user can download and print out the certificate from the home page of the course.
2.3. Develop In case of Ticino Turismo eLearning platform, Moodle 2.0 has been chosen as the Learning
Management System (Inversini et al., 2006). Moodle 2.0 layout has been aligned with online corporate style of Ticino Turismo by using CSS and PHP customization. The first outcome of the Development phase turned out to be a technical implementation of the “Alpha version” of the eLearning platform. It was launched by the end of May 2011 and was provided to the focus group and the group of volunteers who participated in the usability testing of the developed course. This explains the nested structure of instructional design: within the development phase implementation has been performed via the delivery of the prototype of the online course to a sample of travel agents (user testing), in order to evaluate it from a usability perspective, and to refine both Design and Development. The results of usability tests (presented in the Evaluation section) made an important contribution to the improvements of the “Alpha version” and by September 2011, after all upgrades of the
platform, the “Beta version” of the eLearning course was set up and released under the next web address: http://www.ticino.ch/e-learning.
2.4. Implement
The implementation of the eLearning platform happened in the form of the delivery of the “Beta version” of the course to travel agents. The course itself has been extensively advertised and promoted though professional social networks, direct email campaign to travel professionals and bloggers as well as through the backlinking campaign. The purpose of the promotional campaign was not only to encourage internationally operating travel agents and tour operators to participate in the online course, but also to make them successfully get through the final test and to attain a “Ticino Switzerland Travel Specialist” (TSTS) certificate.
The 10-weeks promotional campaign was accomplished by December 21, 2011. By then, a total of 199 travel agents professionals had created an account on the platform and 77 of them have been converted to the certified Ticino Switzerland Travel Specialists. The qualified agents and operators originated from 28 different countries, most of them from India (32), the U.S. (6), Germany (4) and Switzerland (4).
2.5. Evaluate The evaluation stage of the platform development happened at two stages – with the usability testing of
8 travel agents of the “Alpha version” of the platform, as well as of the evaluation survey of around 70 travel agents of the “Beta version” of the platform. Both stages are explicitly discussed below. The results of the evaluation phase enabled the developers to detect shortage of the platform and let them to provide the final upgrades and improvements to Version 1.0 of the “Ticino Switzerland Travel Specialist” eLearning course. 2.5.1. Usability Evaluations Theoretical framework
The usability of eLearning systems is crucially important (Triacca et al., 2004; Ardito et al., 2004) as an effective eLearning system should include sophisticated and advanced functions, which yet should hide their complexity, providing an easy and flexible interaction suited to catch learners’ interest. One of the most used techniques is a “Think Aloud” usability method, which allows users to identify main usability problems. For the “Think Aloud” method users are asked to verbalize their thoughts and comment on their actions while they handle the application (Harms & Schweibenz, 2007). This “allows a very direct understanding of what parts of the dialogue cause the most problems” (Nielsen & Mack, 1994). During the test users are observed by the test conductor as well as the whole testing session is recorded, in order to be able to analyze again both the computer screen and the face of the tester.
The goal of the usability testing of “Ticino Switzerland Travel Specialist eLearning Platform” was to evaluate the platform from travel agent’s point of view and examine if users could get the certificate by studying the course materials and passing the final exam. Usability analysis was conducted with 8 users, originating from Switzerland (German part), Egypt, Poland, Belarus, Serbia (2), Armenia and Montenegro. The participants were within 25 - 35 years old; 3 of them were male and 5 female. 4 users out of 8 had never been to the Ticino region. Each usability session lasted 1-2 hours during which participants needed to go through the whole platform (Alpha version), study the course materials and pass the final exam. During the usability test user interaction with the platform was observed, recorded with the video camera as well as notes were taken. Interviews prior and after the usability test were done. Usability evaluation results
Based on the observation and interviews with participants, the usability findings (both positive and negative) were arranged in 4 categories (Kalbaska et al, 2012): General impression of travel agents; Educational issues; Communication issues; Technical issues.
General impression. The overall participants’ satisfaction of the platform was rather encouraging. Users described overall studying experience as exciting, interesting and not boring. Interviews with the participants showed their positive attitude of using eLearning platforms in tourism and hospitality industry for the training purposes.
Education issues. Most findings and comments were related to the structure and content of the didactic materials within the course, interactivity and the duration of the course and testing activities. Participants agreed that there is a lot of information presented in a structured and thoughtful way. Moreover, users, who have been living in Ticino for some time, found new, useful and curious data. As positive elements, participants highlighted usages of the interactive animation, images and videos within the course materials. Interactive animation was perceived as a great advantage of this course over the similar ones. Regarding the evaluation and testing activities, questions were perceived being rather hard, as they required users to go back to the course materials and to be more focused on the details presented in the training texts. Nevertheless, users perceive it to
be a positive fact, as “students” need to pay attention to the details. As the negative side, some of the participants noticed that some parts of the course lasted too long comparing to the others. Also, the educational value of certain parts of the course, like “Intermediate test” or some videos, was not clear to the participants.
Communication issues. Findings are related to B2B aspect of the platform, e.g., if the platform provides travel agents with enough valuable business information, which can be used in order to sell Ticino. Mainly, participants found very useful selling tips and insights, as well as the links and brochures provided for the in-depth information about certain topics. As a main shortage of the platform, participants pointed out that on the training platform there was no information about actual prices of tourism packages.
Technical issues. Findings are based on the usability issues related to the technology. The interaction with the platform had been described as “smooth and predictable”, but still several usability problems were detected. Usability problems were mainly related to the navigation and quality of studying. For instance participants noticed some missing navigational links, pointed out ambiguous links and explained the difficulties they had while trying to find the course on “Ticino Turismo” website. Regarding the quality of the studying materials, participants perceived videos as being of a “good quality”, except the videos in “Selling tips and testimonials” module.
Based on those usability findings, the improvements on the Alpha version of the platform have been done and the “Beta version” of the platform has been launched.
2.5.2. Evaluation Survey Theoretical framework
The main concern that the developers of the eLearning platform had is the course satisfactory and whether it is an appropriate and helpful training activity for travel agents and tour operators. To give the answers on the emerged questions an evaluation survey of the travel agents was introduced. It consisted of two different questionnaires, which aimed to discover the attitude of the travel and tourism professionals towards the Ticino eLearning course and reveal their satisfaction level with the proposed training program were introduced. Two groups of possible survey participants were defined – those who passed the final exam and acquired the certificate, namely Ticino Switzerland Travel Specialists (TSTS), and those who only subscribed, maybe participated in the final exam, but never passed it. The principal objective of the second questionnaire was to reveal the point why those participants did not go ahead and did not pass the final exam of the training.
Regarding the questionnaire design, the Kirkpatrick’s evaluation model (1994) was used as a background to outline the questions of the survey. The model, which has been extensively applied in the eLearning research, suggests that every teaching/learning experience can be evaluated at four levels:
- the reaction to the course on the side of learners: are they comfortable/happy with the content? what is their overall level of satisfaction? what were the main drivers for them to start this learning experience?
- their actual knowledge: how much and what did they learn within the course? - how much of the learned information could be transferred to the everyday professional life of travel
agents attending the course: are they able to apply the knowledge they have got to their working activities? - the global impact of the offered training on their actual activities: has the learning/training had a
positive effect on the concerned business? The last level has been taken into consideration in the current research as a general indicator by asking
the question: “Have you already sold Ticino as a destination to a customer as a result of taking an online course?”. However, it was not possible to tackle the issue of return on investment for the travel agents (in terms of their time spent learning vs. the additional revenue generated), nor the DMO (such as the cost of the eLearning offering vs. the additional bookings resulting from it).
Reaction level’s questions intended to measure the satisfactory level of the participants with the Ticino eLearning course. In this way, the questions about the general impression with the training, the quality of the course material (text, video, pictures), as well as about the range of topics covered, length of training and the final quiz performance were asked.
Knowledge level’s questions aimed to explore what participants have learned from the training. Therefore, the responders were expected to answer the questions whether they changed their opinions or beliefs about Ticino and whether they increase or not their knowledge about this destination thanks to the Ticino eLearning course.
Behavior/transfer level’s questions focused on whether the knowledge gained is being applied to the travel agent’s job. Consequently, the question about participants’ confidence about selling the destination of Ticino to the clients and whether the participants recommend this course to their colleagues were set in the survey.
And finally, Impact level’s questions aimed to explore whether the course has led travel professionals to the selling of the Ticino destination to their clients.
Evaluation survey results Demographics
72 travel agents out of 298 - those who have subscribed to the course, have answered the survey. Out of them 39 are travel agents who have started the course and finished it successfully and 33 are travel agents who didn’t finish the course.
The participants originated from 28 different countries with the next distribution: 20 travel agents out of 72 respondents were from India; 5 from Switzerland and the UK accordingly; 4 from Germany, the U.S and Spain; 3 from Pakistan; by 2 participants were from Italy and the Netherlands, and only by 1 participants were from Australia, Austria, Bangladesh, Croatia, Hungary, Sri Lanka, Uganda and Venezuela, etc. The most active participants were from India due to the fact that this nation formed the largest country-specific group during the promotional campaign and revealed a particular interest in the Ticino region.
The question “Have you already been to Ticino?” disclosed 76% of travel agents that were not acquainted with Ticino, while 23 had already visited this canton.
The sources that brought the most number of the participants to the course were the LinkedIn professional network – 27 %; the directed invitation from Ticino Tourism brought 18 % of participants; emailing campaign – 14 %; navigating Ticino Turismo official website – 10% and the Internet search brought 12% of participants. 17 respondents (26.3%) specified other sources that lead them to the participation in the course, among which face to face meetings with the representatives of Ticino Turismo, Outbound Travel Roadshow (OTR) in India, Swisstours – an Indian travel agency, Travel magazine and Xing Social Network were indicated.
Respondents indicated the next reasons to participate in the eLearning course (multiple answers were possible):
to learn more about Ticino 32 participants (86.5%) to serve the clients 28 (75.7%) to sell more and earn more 17 (45.9%) to enrich my curriculum 16 (43.2%) to win a competition 9 (24.3%) to display the “Ticino Switzerland Travel Specialist” certificate in my office
4 (10.8%)
other 2 (5.4%) Table 1. Motivation of travel agents to follow Ticino Switzerland Travel Specialist eLearning course
While the group of travel agents who have started the course, but didn’t complete it (33 profiles were
analyzed) stated the following reasons not to finish the course: Too long 8 participants (29.6%) I needed more assistance from Ticino Tourism 4 (14.8%) I already knew everything about Ticino 3 (11.1%) Too much textual information 3 (11.1%) Information was not useful to me 0 (0.0%) Too boring 0 (0.0%) I faced technical problems (please specify) 11 (40.7%) Table 2. Travel agents’ reasons for not finishing Ticino Switzerland Travel Specialist eLearning course
The majority of participants – 11 (40.7%), picked the option “I faced technical problems”. However, in
the comments most respondents stressed that the main reason why they did not complete the course was the lack of time. Moreover, several travel agents expressed their willingness to come back to the course in the nearest future, underlining the importance of the course for their jobs.
The subsequent set of the results, framed by four levels of the Kirkpatrick’s model, get the broader image of travel professionals’ reaction and attitude to the eLearning training and analyses the responses of travel agents who have started and successfully finished the eLearning course (N - 39 profiles). Reaction
Following are the results that characterize the first level of Kirkpatrick’s model, namely, Reaction level, which demonstrates how positively the participants evaluate the course itself. Thus, the question “What is your general impression about this course?” revealed 21 participants (53.3%) that had extremely positive impression, 16 (42.1%) – positive and only 1 person (2,6%) with negative impression about the course. None of the respondents defined the training as extremely negative. 1 participant has skipped the question and further participation in the survey.
The quality of the instructional materials of the eLearning course was evaluated as extremely satisfactory by 20 participants (52.6%), as satisfactory – 18 (47.4%), and none of them as unsatisfactory or extremely unsatisfactory.
The range of topics covered in the course selected as excellent –23 participants (60.5%), as good – 13 (34.2%), fair –2 participants (5.3%) and none of respondents found it poor. One of the participants who defined the course to be fair left the comment specifying that the course is missing an important topic, namely “The restaurants of the Ticino region and their costs”.
34 participants (91.9%) agreed that the length of the course was adequate, 3 (8.1%) specified it to be as too short. 36 participants (97.3%) indicated that had not encountered any technical problems within the course. Only 1 participant (2,7%) had difficulties with downloading course materials and certificate. 35 participants (94.6%) liked the form in which the final quiz was presented (it was designed on the base of the interactive game “Who wants to be a Millionaire?”) and 2 travel agents (5.4%) did not like it. Knowledge
The subsequent results determine the increase in knowledge of the travel professionals thanks to the course, which corresponds to the Learning level of the Kirkpatrick’s evaluation model: most of the participants – 21 (56.8%) changed significantly their opinions and believes regarding Ticino and only 2 (5.4%) pointed that their opinions remained the same after the participation in the course. Moreover 28 participants (75.7%) significantly improved their knowledge about Ticino. Only 1 respondent (2.7%) indicated that his knowledge increased slightly. Transfer
Following are the outcomes of the answers to the questions created in accordance with the Transfer level of the above stated model: most of the participants – 23 (62.2%) have significantly increased their confidence and 12 participants (32.4%) – as somewhat when selling the destination of Ticino to their clients. 2 respondents (5.4%) indicated their confidence as being slightly improved. Furthermore, the positive attitude towards the course can be detected from the results whether the participants would recommend the course to their friends and colleagues. 28 travel agents (77.8%) have already recommended the course to the colleagues and 7 respondents (19,4%) are planning to do it in the near future. Only 1 participant (2.8%) disagreed to provide any recommendations. Impact
Regarding the last level of the Kirkpatrick’s model, namely the Impact level, only one questions was asked, which revealed 8 travel agents (21.6%) that have already sold the destination of Ticino thanks to the eLearning course.
Concluding the results of the evaluation questionnaire of travel agents who have followed and successfully finished the course, it bears mentioning that travel professionals highly evaluate the “Ticino Switzerland Travel Specialist” eLearning course and they are convinced that the course significantly increased their knowledge about the destination Ticino. Also the examination of the results demonstrates that the knowledge and skill gained are of high relevance and being applied to the travel professionals’ environment enabling trade partners of Ticino Tourism Board to pick the right and effective strategies when selling Ticino to their clients.
While looking at travel agent who started the course but didn’t complete it, it is important to underline two main reasons why the travel professionals didn’t finish the course, namely, the lack of time and the length of the course. Both these issues are interrelated in terms of time and its constraints, which recently cause the major concern to almost all business professionals worldwide. Nevertheless, many travel agents and tour operators stated that the course was of great importance to their occupations and intended to complete it in the nearest future.
Discussions and Conclusion Participants of the usability testing gave positive comments and feedback about the platform. They
appreciated the idea of having such a learning resource, as it improves their skills and knowledge about Ticino region. All usability findings can be divided into 4 categories: general impression, educational, communicational, and technical findings. Those findings suggest that the key elements of a usable eLearning course are: the structure and content of the didactic materials, quality of the content (images, videos, maps), interactivity, and duration of the course, well designed testing activities and clear navigational paths. Moreover, the content should be adapted to B2B communication: it should be accurate, specific and unknown to broad audience; it should contain tips and insights for “selling” the destination and resources with more detailed information (e.g. websites, brochures, etc.).
The evaluation survey findings are the next: travel professionals highly evaluate the “Ticino Switzerland Travel Specialist” eLearning course and they are convinced that the course significantly increased their knowledge about the destination Ticino. Also the investigation of the results demonstrates that the
knowledge and skill gained are of high relevance and being applied to the travel professionals’ environment enabling travel agents and tour operators to pick the right and effective strategies when selling Ticino to their clients.
Based on the discovered findings the main updates and improvements of the platform should be run to ease and increase the eLearning experience of the travel professionals.
From a theoretical point of view, this research has contributed to the literature on eLearning, eTourism and usability by exploring its relevance in a tourism industry context. This is a valuable academic contribution, as it gives one of the first insights into the evaluation of eLearning courses created specifically for travel agents, and tests Kirkpatrick’s model of evaluation in a new training context.
From a practical viewpoint, these findings suggest that DMOs may need to work even more closely with travel agents than before, as their destinations are still being strongly promoted by such agencies. DMOs need to find their way to the customers – travel agents – through specialization and training.
In the short term, online training can play an important part in enriching the trade of a tourism destination website and is an additional channel through which to influence the market as well as to support travel professionals in their sales activities. Moreover, considering the high appreciation and expressed need for these courses, DMOs should take into consideration the broader promotion and expansion of this kind of training. In the long term, eLearning platforms for travel agents may add value to the destination’s innovative communication concept as well as strengthening awareness of it among trade partners and, through them, potential tourists.
References Ardito, C., De Marsico, M., Lanzilotti, R., Levialdi, S., Roselli, T., Rossano, V. & Tersigni, M. (2004).
Usability of E-Learning Tools. In Proc. of International Conference on Advanced Visual Interface in Gallipoli, Italy. New York: ACM Press: 80-84.
AskERIC (1999). An AskERIC Write-A-Lesson Plan Guide, available online at www.askeric.org
Buhalis, D., & Law, R. (2008). Progress in information technology and tourism management: 20 years on and 10 years after the Internet – the state of eTourism research. Tourism Management, 29(4), 609-623.
Cantoni, L., Kalbaska, N., & Inversini, A. (2009). eLearning in tourism and hospitality: A map. Journal of Hospitality, Leisure, Sport & Tourism Education, 8(2), 148-156.
Harms, I. & Schweibenz, W. (2007). Usability Engineering Methods for the Web Results From a Usability Study. In: Knorz, Gerhard & Kuhlen, Rainer (Hg.): Proceedings des 7. Internationalen Symposiums für Informationswissenschaft (ISI 2000), Darmstadt. Konstanz: UVK Verlagsgesellschaft mbH: 17 – 30. AskERIC (1999). An AskERIC Write-A-Lesson Plan Guide, available online at www.askeric.org
Inversini, A., Botturi,L., & Triacca, L. (2006). Evaluating LMS Usability for Enhanced eLearning Experience. Published in the proceedings of EDMEDIA 2006, Orlando, USA: 595-601.
Inversini, A., Cantoni, L. (2009). Cultural Destination Usability: The Case of Visit Bath. In W. Höpken, U. Gretzel & R. Law (Eds.), Information and Communication Technologies in Tourism. Proceedings of the International Conference in Amsterdam, The Netherlands, Springer, Wien - New York: 319-331.
Kalbaska, N. (2012). Travel agents and destination management organizations: eLearning as a strategy to train tourism trade partners. Information Technology & Tourism, 13(1), 1-12.
Kalbaska, N., Jovic, A., Cantoni, L. (2012). Usability evaluation of an eLearning course presenting a
regional destination. The case of “Ticino Switzerland Travel Specialist”. e-Review of Tourism Research (eRTR) Special issue - ENTER 2012 Idea Exchange Papers. 10 (2): 31-34. Available at: http://ertr.tamu.edu/.
Kirkpatrick, D. (1994). Evaluating Training Programs: The Four Levels. San Francisco: Berrett-
Koehler. Nielsen, J. & Mack, L. (1994). Usability inspection methods. New York: J. Wiley & Sons.
Salmon, G., Jones, S. & Armellini, A. (2008). Building institutional capability in e-learning.
ALT-J Research in Learning Technology. 16 (2): 95–110. Triacca, L., Bolchini, D., Botturi, L. & Inversini, A. (2004). MiLE: Systematic Usability Evaluation for
E-learning Web Applications. In L. Cantoni & C. McLoughlin (Eds.), Proceedings of World Conference on Educational Multimedia, Hypermedia and Telecommunications: Chesapeake, VA: AACE: 4398-4405.
UNWTO. (2008). Handbook on E-marketing for Tourism Destination. Madrid: World Tourism Organization & European Travel Commission.
Expectations Created: A Review of Graduate Management Training Programmes from
International Hotels’ Corporate Websites
Fang Wang* Oxford School of Hospitality Management, Oxford Brookes University
Headington Campus, Gipsy Lane, Oxford, UK, OX3 0BP E-mail: [email protected]
and Maureen Brookes
Principal Lecturer Marketing, Oxford School of Hospitality Management Oxford Brookes University
E-mail: [email protected]
Abstract
Graduate Management Training (GMT) programmes have gained substantial popularity and been extensively executed in large international hotel groups as one of the main paths for cultivating future managers. Whilst there are potential benefits of these programmes, research suggests that there is a disparity of the perceptions and expectations of the programmes between graduates and the organisations. There is therefore a need to evaluate GMT programmes from organisational and graduates’ perspective. This short paper reports on the first stage of a study that seeks to evaluate GMT programmes in the international hotel industry, specifically through the investigation of a sample of international hotels’ GMT programmes presented via their corporate websites. Key words: graduate management training programme, corporate website
Introduction
As knowledge has become a more important organisational resource, university graduates have been employed to raise organisations’ intellectual capital (Brown, Hesketh & Williams, 2004). Graduate management training (GMT) programmes have therefore been specifically designed and developed (Hayman & Lorman, 2004) to attract high calibre graduates across a wide range of industrial sectors, including the international hotel industry. A clear benefit of GMT programmes to organisations is succession planning and the steady development of a management talent pool. For graduates, the prestigious training with the aim to be developed into a management position is considered advantageous. However, graduates frequently perceive the GMT programme as a stepping stone (Kandola et al, 2001) and leave the programme early, impacting negatively on the organisations’ objectives of the GMT programmes. In order to ensure that both parties can benefit from the programmes, it is therefore necessary to understand what organisations are offering in the GMT programmes and what graduates expect from the GMT programmes based on the offer.
This paper therefore reports preliminary findings of a study that seeks to compare and identify what expectations have been created to GMT programmes from international hotels’ corporate websites, and how this might affect graduates’ expectations and perceptions of the GMT programmes. It begins with a brief review of the literature to identify the current approaches to, and issues faced by GMT programmes in the industry. The design and findings of the study are next presented prior to drawing preliminary conclusions and recommendation for industrial practice and future research.
GMT Programmes in International Hotel Groups
Within the international hotel industry, academics and business leaders have long acknowledged the significance of a competent workforce and have considered the workforce as potentially the most valuable asset of their organisations (Choi & Dickson, 2010). In order to attract and develop a competent workforce, GMT programmes have gained substantial popularity and have been extensively executed among international hotel groups (Feiertag, 1998). According to the latest Hospitality Graduate Survey (H-G-R) survey (2012), 31% of respondents from the hotel industry considered GMT programmes to be the most appropriate entry point for graduates, and graduates and hotel schools considered they were prepared for these programmes upon finishing their academic study. Imbedded with long-term objectives, hotel organisations aim to develop a talented management team for the future and reinforce organisational growth through the programmes (Bedingfield,
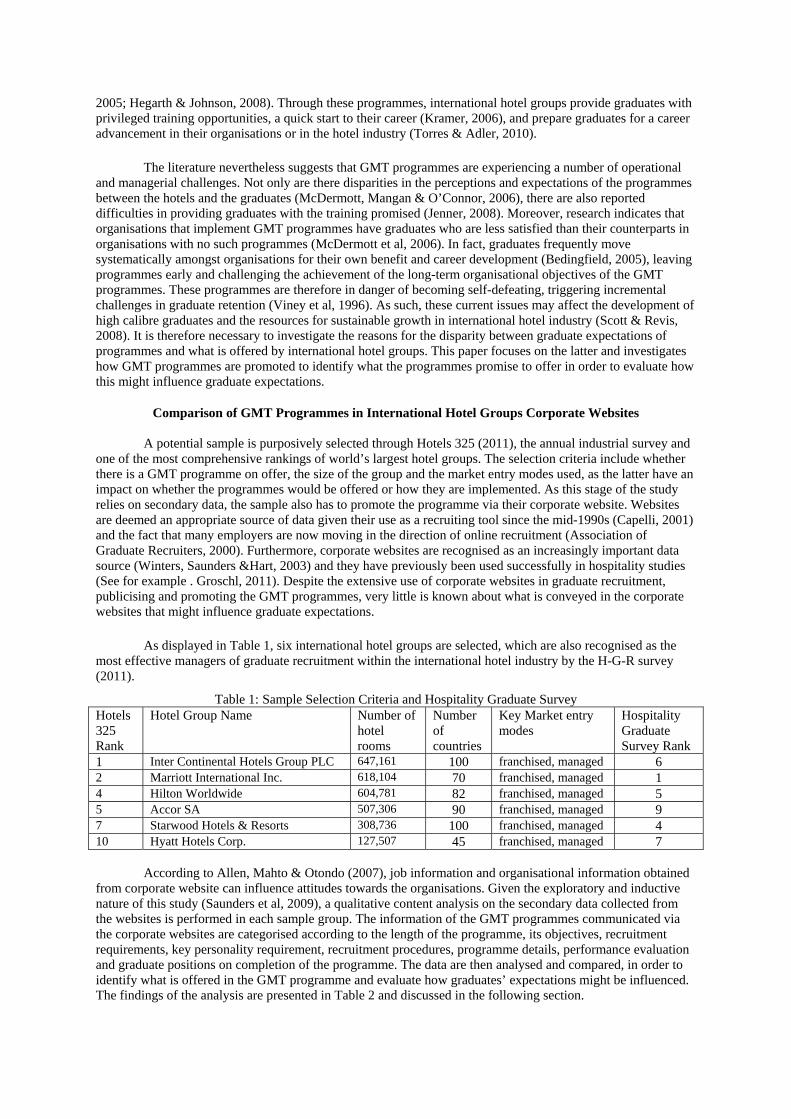
2005; Hegarth & Johnson, 2008). Through these programmes, international hotel groups provide graduates with privileged training opportunities, a quick start to their career (Kramer, 2006), and prepare graduates for a career advancement in their organisations or in the hotel industry (Torres & Adler, 2010).
The literature nevertheless suggests that GMT programmes are experiencing a number of operational and managerial challenges. Not only are there disparities in the perceptions and expectations of the programmes between the hotels and the graduates (McDermott, Mangan & O’Connor, 2006), there are also reported difficulties in providing graduates with the training promised (Jenner, 2008). Moreover, research indicates that organisations that implement GMT programmes have graduates who are less satisfied than their counterparts in organisations with no such programmes (McDermott et al, 2006). In fact, graduates frequently move systematically amongst organisations for their own benefit and career development (Bedingfield, 2005), leaving programmes early and challenging the achievement of the long-term organisational objectives of the GMT programmes. These programmes are therefore in danger of becoming self-defeating, triggering incremental challenges in graduate retention (Viney et al, 1996). As such, these current issues may affect the development of high calibre graduates and the resources for sustainable growth in international hotel industry (Scott & Revis, 2008). It is therefore necessary to investigate the reasons for the disparity between graduate expectations of programmes and what is offered by international hotel groups. This paper focuses on the latter and investigates how GMT programmes are promoted to identify what the programmes promise to offer in order to evaluate how this might influence graduate expectations.
Comparison of GMT Programmes in International Hotel Groups Corporate Websites
A potential sample is purposively selected through Hotels 325 (2011), the annual industrial survey and one of the most comprehensive rankings of world’s largest hotel groups. The selection criteria include whether there is a GMT programme on offer, the size of the group and the market entry modes used, as the latter have an impact on whether the programmes would be offered or how they are implemented. As this stage of the study relies on secondary data, the sample also has to promote the programme via their corporate website. Websites are deemed an appropriate source of data given their use as a recruiting tool since the mid-1990s (Capelli, 2001) and the fact that many employers are now moving in the direction of online recruitment (Association of Graduate Recruiters, 2000). Furthermore, corporate websites are recognised as an increasingly important data source (Winters, Saunders &Hart, 2003) and they have previously been used successfully in hospitality studies (See for example . Groschl, 2011). Despite the extensive use of corporate websites in graduate recruitment, publicising and promoting the GMT programmes, very little is known about what is conveyed in the corporate websites that might influence graduate expectations.
As displayed in Table 1, six international hotel groups are selected, which are also recognised as the most effective managers of graduate recruitment within the international hotel industry by the H-G-R survey (2011).
Table 1: Sample Selection Criteria and Hospitality Graduate Survey Hotels 325 Rank
Hotel Group Name Number of hotel rooms
Number of countries
Key Market entry modes
Hospitality Graduate Survey Rank
1 Inter Continental Hotels Group PLC 647,161 100 franchised, managed 6 2 Marriott International Inc. 618,104 70 franchised, managed 1 4 Hilton Worldwide 604,781 82 franchised, managed 5 5 Accor SA 507,306 90 franchised, managed 9 7 Starwood Hotels & Resorts 308,736 100 franchised, managed 4 10 Hyatt Hotels Corp. 127,507 45 franchised, managed 7
According to Allen, Mahto & Otondo (2007), job information and organisational information obtained from corporate website can influence attitudes towards the organisations. Given the exploratory and inductive nature of this study (Saunders et al, 2009), a qualitative content analysis on the secondary data collected from the websites is performed in each sample group. The information of the GMT programmes communicated via the corporate websites are categorised according to the length of the programme, its objectives, recruitment requirements, key personality requirement, recruitment procedures, programme details, performance evaluation and graduate positions on completion of the programme. The data are then analysed and compared, in order to identify what is offered in the GMT programme and evaluate how graduates’ expectations might be influenced. The findings of the analysis are presented in Table 2 and discussed in the following section.
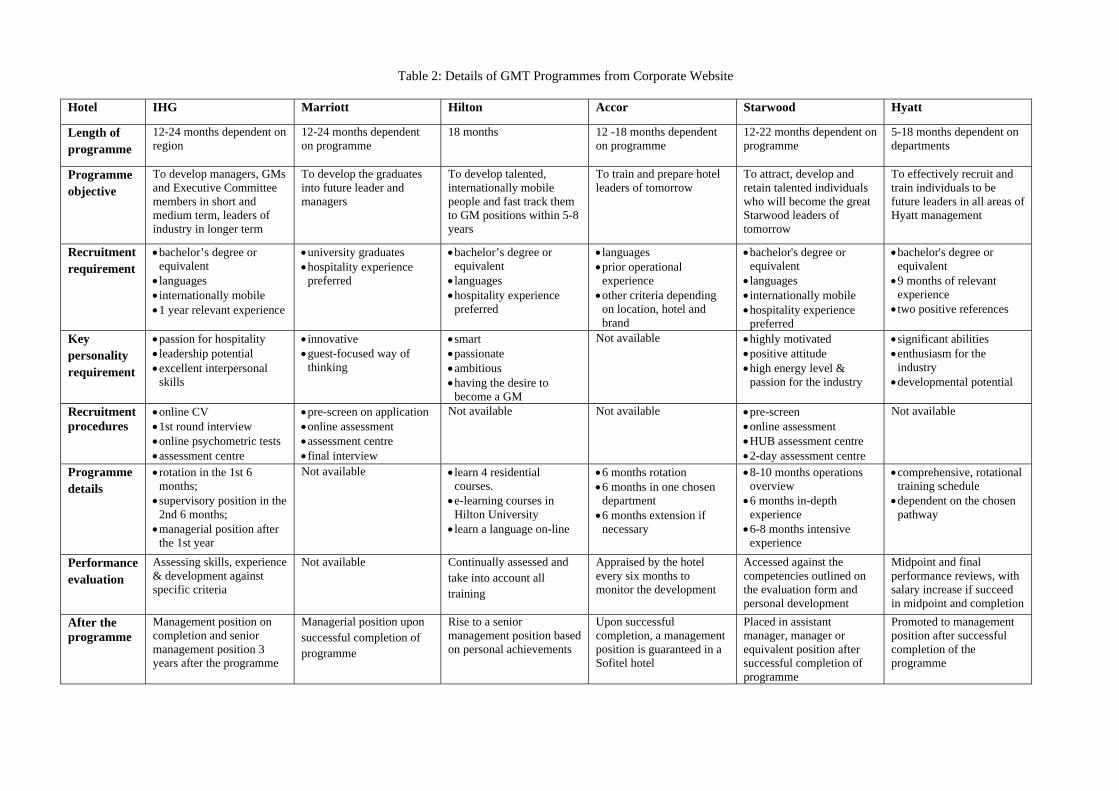
Table 2: Details of GMT Programmes from Corporate Website
Hotel IHG Marriott Hilton Accor Starwood Hyatt
Length of programme
12-24 months dependent on region
12-24 months dependent on programme
18 months 12 -18 months dependent on programme
12-22 months dependent on programme
5-18 months dependent on departments
Programme objective
To develop managers, GMs and Executive Committee members in short and medium term, leaders of industry in longer term
To develop the graduates into future leader and managers
To develop talented, internationally mobile people and fast track them to GM positions within 5-8 years
To train and prepare hotel leaders of tomorrow
To attract, develop and retain talented individuals who will become the great Starwood leaders of tomorrow
To effectively recruit and train individuals to be future leaders in all areas of Hyatt management
Recruitment requirement
bachelor’s degree or equivalent languages internationally mobile 1 year relevant experience
university graduates hospitality experience
preferred
bachelor’s degree or equivalent languages hospitality experience
preferred
languages prior operational
experience other criteria depending
on location, hotel and brand
bachelor's degree or equivalent languages internationally mobile hospitality experience
preferred
bachelor's degree or equivalent 9 months of relevant
experience two positive references
Key personality requirement
passion for hospitality leadership potential excellent interpersonal
skills
innovative guest-focused way of
thinking
smart passionate ambitious having the desire to
become a GM
Not available highly motivated positive attitude high energy level &
passion for the industry
significant abilities enthusiasm for the
industry developmental potential
Recruitment procedures
online CV 1st round interview online psychometric tests assessment centre
pre-screen on application online assessment assessment centre final interview
Not available Not available pre-screen online assessment HUB assessment centre 2-day assessment centre
Not available
Programme details
rotation in the 1st 6 months; supervisory position in the
2nd 6 months; managerial position after
the 1st year
Not available learn 4 residential courses. e-learning courses in
Hilton University learn a language on-line
6 months rotation 6 months in one chosen
department 6 months extension if
necessary
8-10 months operations overview 6 months in-depth
experience 6-8 months intensive
experience
comprehensive, rotational training schedule dependent on the chosen
pathway
Performance evaluation
Assessing skills, experience & development against specific criteria
Not available Continually assessed and take into account all training
Appraised by the hotel every six months to monitor the development
Accessed against the competencies outlined on the evaluation form and personal development
Midpoint and final performance reviews, with salary increase if succeed in midpoint and completion
After the programme
Management position on completion and senior management position 3 years after the programme
Managerial position upon successful completion of programme
Rise to a senior management position based on personal achievements
Upon successful completion, a management position is guaranteed in a Sofitel hotel
Placed in assistant manager, manager or equivalent position after successful completion of programme
Promoted to management position after successful completion of the programme
Findings and Discussions
As Table 2 shows, the length of the programmes are wide ranging, varying from 5 months to 24 months and varying across the geographical regions in which they are offered. Across the sample, the broad objectives are to develop and prepare the future leaders of their hotel groups, except IHG, which has clearly defined short, medium and long term objectives for the company and the hotel industry. However, clear objectives for graduates throughout the timescale of the various lengths of the programmes are not mentioned for the rest of the sample. With the exception of Hilton, which only runs the General Manager Programme, all other hotel groups provide different pathways, covering various operational and functional departments in hotels. While this makes the programmes flexible to meet graduates’ preferences, it is not clear how each pathway meets the same broad aim of the programmes. These findings therefore suggest that there is a need for some hotel groups to identify clearer short term or goals at different stages of the programmes and in different pathways in order to create clearer expectations for graduates.
Regarding the recruitment requirements, 5 out of 6 programmes require at least an undergraduate degree. There are 3 programmes that require and 3 programmes that prefer prior industry experience. English and one other language are required by 3 programmes and 2 programmes ask for international mobility. Although the personality requirements vary from programme to programme, most websites indicate they require graduates to be passionate about the hotel industry. However, none of the programmes mention the detailed knowledge and skills required prior entering the programme, therefore the graduates are unclear about organisations’ expectations of them, which consequently may result in the disparity of expectations between the two parties. The recruitment processes presented from 3 of the programmes all include different steps from pre-screening, online assessment, assessment centre and interviews arranged at different stages of the recruitment. These 3 programmes therefore appear to have highly competitive recruitment processes. While a competitive process ensures that organisations attract a high calibre graduate, it also could raise graduates’ expectations of the programme and their career future on completion of the programmes. Moreover, none of the recruitment processes mention the pre-assessment of graduates’ knowledge and skills, which in fact shapes what individual graduate need to develop through the programme. This in turn suggests the need for a more personalised approach in the programmes in order to meet the requirements of individual graduates.
Nevertheless, the data suggests that existing programme content fails to respond to this need. The programme content varies across different pathways and different hotel groups. It is recognised that GMT programmes include rotation in different operational departments and a particular focus on the chosen pathway. The programmes prioritise training and development for the future management team. However, only IHG and Hyatt mention the key training aspects in different pathways, while the rest are vague in training details except some general description such as ‘to know all elements of the hotel’s activities’ and that they ‘are given the opportunity to develop their skills in various departments’. Moreover, existent programmes fail to discuss the knowledge and skills that graduates could expect to develop from the programme. Therefore, the graduates are not clearly informed what they are expected to develop through the programme, which may lead to the disparity in the expectations of training outcomes.
In relation to developmental objectives, 5 out of 6 programmes mention evaluation of the programmes. However, none of them explicitly explain how graduates are evaluated and at what stages of the programme. Nor is there any evaluation criteria identified. As such, graduates entering the programme would not have clear expectations of their required performance at different stages. Furthermore, all programmes promise a managerial role in the organisation upon successful completion of the programme, and some also make reference to further managerial responsibilities at a later stage. Graduates would therefore expect to be fully developed to take on these roles competently and expect these roles to be offered within the promised timeframe of the programme. However, there may be instances where graduates are not developed sufficiently within the promised time frame to take on these roles and thus the reality of their situations would fall somewhat short of their expectations. Alternatively, some graduates may be pushed into taking on these management roles prior to their programme officially finishing. Whilst this might suit some graduates, others might expect to be fully trained through the different rotations before accepting a managerial role.
Conclusion
The preliminary study reveals that GMT programmes present to graduates the image of a well-structured programme focusing on training with a prospect of personal growth and career development. However, three key issues are identified which could serve to create confused or unrealistic expectations as vague programme objectives, a lack of personalisation of the programmes in line with graduates needs and unclear evaluation methods and criteria.
Whilst graduates would expect full training in the different pathways and to be fully developed to take on a managerial role at the end of the programme, given the length of the programmes and the flexible pathways, it would appear that there is a need for more clearly articulated goals for the graduates at different stages and within the different pathways. Furthermore, there appears to be a need to more clearly articulate what knowledge and skills are expected of graduates on entering the programmes, what is need to be developed during the programmes, and how the graduates will be evaluated against the objectives of the programmes and their performance. In this way, graduates would have more realistic
expectations of the programmes. Failure to create realistic expectations and deliver against these at a more personalised level creates challenges in graduate retention and thus on the long term goals of hotel organisations to retain high calibre staff to manage their hotels. International hotel groups which do not currently identify their recruitment processes may wish to do so, to demonstrate that their programmes are also competitive in order to attract high calibre graduates.
While this study sheds some light on how graduates’ expectations might be created based on the GMT programmes advertised from the corporate websites, it is nonetheless based on secondary data of only a small sample of international hotel groups. Further primary research on GMT programmes, their content and their evaluations processes is required. Semi-structured interviews with senior HR professionals from international hotel groups will investigate the organisational expectations and the implementation of the programmes. In addition further research that investigates how graduates expectations are formed and what these are before starting a GMT programmes is also warranted. Semi-structured interview with graduates participating in GMT programmes regarding their expectations and experience in the programmes would facilitate the investigation from the graduates’ perspective. In this way the differences between graduates and organisational expectations can be fully determined. Given the importance of talent retention to the international hotel industry, it is important that GMT programmes serve both graduates’ and organisational goals.
References
Allen, D., Mahto, R., & Otondo, R. (2007). Web-based recruitment: Effects of information, organisational brand, and attitudes toward a website on applicant attraction, Journal of Applied Psychology, 92( 6): 1696-1708.
Association of Graduate Recruiters (2000). Going to Work on the Web: Web-Based Graduate Recruitment, AGR Briefing No. 11, July, Warwick: Association of Graduate Recruiters.
Bedingfield, C. (2005). Transforming the ROI of your Graduate Scheme, Industrial and Commercial Training, 37(4): 199-203.
Brown, P., Hesketh, A. & Williams, S. (2004). The Mismanagement of Talent: Employability and Jobs in the Knowledge Economy. Oxford: Oxford University Press.
Cappelli, P. (2001). Making the most of online recruiting, Harvard Business Review, 79(3): 139-146.
Choi, Y. & Dickson, D. R. (2010). A case study into the benefits of management training programs: impacts on hotel employee turnover and satisfaction level, Journal of Human Resources in Hospitality & Tourism, 9(1): 103-116.
Feiertag, H. (1998), College students can be bright prospects for prospecting, Hotel & Motel Management, 213(11): 20.
Groschl, S. (2011). Diversity management strategies of global hotel groups-A corporate website based exploration, International Journal of Contemporary Hospitality Management, 23(2): 224-240.
Hegarth, C. and Johnston, J. (2008). Graduate Training: Evidence from FUSION Projects in Ireland, Education+Training, 50(5): 391-405.
Hayman, K. & Lorman, A. (2004). Graduate Training Schemes have Demonstrably Accelerated Promotion Patterns, Career Development International, 9(2): 123-141.
H-G-R (2012). Hospitality Graduate Survey 2012, Part1-3. http://www.4hoteliers.com/4hots_search.php?srchfor=hospitality+graduates+survey [Accessed the 1st of May 2012, 10:30]
HOTELS 325 (2011). Special Report. http://ebookbrowse.com/2011-hotels-325-pdf-d165035994 [Accessed on the 5th of Feb 2012, 12:35]
Jenner, S. (2008). Graduate development, discursive resources and the employment relationship at BAE systems, Education+Training, 50(5): 423-438.
Kandola, R., Wood, R., Dholakia, B. & Keane, C. (2001). The Graduate Recruitment Manual, Gower, Aldershot.
Kramer, A. (2006). Why Management Training is Important, Lodging Hospitality, 62 (2), 28.
McDermott. E., Mangan,J. & O’Conner. M. (2006). Graduate development programmes and satisfaction levels, Journal of European Industrial Training, 30(6): 456-471.
Saunders, M., Levis, P. and Thornhill, A. (2009). Research Methods for Business Students. (5th ed.). Harlow: Financial Times Prentice Hall.
Scott, B. & Revis, S (2008), Talent management in hospitality: graduate career success and Strategies, International Journal of Contemporary Hospitality Management, 20(7): 781-791
Torres, E. N & Alder, H. (2010). Hospitality management graduate perceptions of management development practice. International CHRIE Conference-Referred Track, Paper 24. http://scholarworks.umass.edu/refereed/CHRIE_2010/Friday/24/ [Accessed on 2nd of May 2012, 15:20]
Viney, C., Adamson, S. & Doherty, N. (1996). Paradoxes of Fast-Track Career Management, Personnel Review, 17(4):177-86.
Winter, S., Saunders, C. & Hart, P. (2003). Electronic window-dressing: impression management on websites, European Journal of Information Systems, 12(4): 18-23.
Perceptions of the importance of numeracy as an employability skill by hospitality students and employers: a comparison of United Kingdom and Hong Kong
Anne Conneally
Sheffield Hallam University Sheffield
United Kingdom [email protected]
David Egan Sheffield Hallam University
Sheffield United Kingdom
ABSTRACT
This paper reports on the preliminary findings comparing the views of English and Hong Kong hospitality students, regards the expectations and value of numeracy skills in hospitality management courses. The methodology utilised, involves a quantitative approach. Findings illustrate that hospitality students do not appear to place a high value on numeracy as a skill desired by employers. Initial findings of a separate survey of academics in Hospitality Management at Sheffield Business School would suggest that hospitality management degrees may have watered down the level and amount of quantitative material taught in response to students' being viewed as consumers. The strength of these perceptions may well influence students' engagement with material which is purposefully designed to enhance their employability skills.
Key Words: Hospitality, employability, numeracy skills, UK, Hong Kong
INTRODUCTION
The British hospitality being the fifth largest industry and directly employing more than 2.4m people with contributions of over 34b in gross tax revenues (BHA, 2010) is pivotal towards employment generation. For the majority of these hospitality workers along with graduate students, maintaining a set of key skills and developing these to their best ability could be deemed the norm when consideration is given to establishing and enjoying a successful career. Gould (1979) notes that individuals should possess sufficient skills to fulfill their goals and in particular, the pursuit of education or improving one's qualifications has been considered as an essential strategy (Porter et al., 1975: Sofer, 1970). What happens though, when it may be perceived that the very institute in which students' rely on in order for these skills to be fulfilled and developed, is in actual fact strategically depriving them of one of the essential skills which is, according to many reports (eg IALS, 1990; OECD, 2001; Crouch et al, 1999) a fundamental skill for life?
MacInnes (2009) states that English students are side-lining quantitative and mathematical content within degree courses because students and staff lack the requisite ability. A recent article (the Times Telegraph, 2012) highlights the fact that many 3rd level institutions are marginalizing the mathematical content of courses amid fears English students are incapable of the most basic sums. And although researchers comment on the necessity of numeracy as an essential skill, outside of full maths degrees, the Royal Society of Arts (RSA, 2012) noted that some universities failed to advertise the level of maths needed to comfortably study particular subjects for fear of hindering applications. The very nature of employability, though with "no singular definition" (Hillage and Pollard, 1998, p.1) highlight the necessity, inclusion and dedication towards advancing students' numeracy skills, specifically and essentially students from business courses. With the concept of employability being central to the current strategic direction of the Department for Education and Employment it has without doubt challenging times ahead as Sir Mike Rake, chairman of UK Commission for Employment and Skills (UKCES), claimed that: employability skills are a major issue for business and the UK economy. Taking this view into consideration this paper will compare the perceptions of English and Hong Kong hospitality students regarding their expectations and value given to one of the facets associated with
employability, this being numeracy skills. The paper following on from discussion, will propose recommendations towards the future of numeracy skill within the curriculum.
LITERATURE REVIEW
With the changing nature of the hospitality industry and the very essence of the service sector i.e. requiring more human capital than natural capital an individual's investment into a set of transferable skills is essential in order to remain employable in today's competitive environment. The White Paper 'The Future of Higher Education' asserts the government's desire to widen participation in higher education to 50% of those aged 18-30. This recognises the importance of increasing the number of highly-educated individuals seeking
work in the graduate labour market. The concept of employability has been recognised throughout UK Higher Education curricula in fulfilling this desire. This is currently being addressed through the following ways: embedding employability through the whole curriculum; embedding employability in the core curriculum; incorporating employability-related modules within the curriculum; Work-based or work related learning within or parallel with the curriculum. (Knight and York, 2004)
As far back as 1979, employability has been referred to and included both hard and soft skills. Soft skills, according to Boyatzis (1982) and Stevens and Campion (1994) can be categorised into leadership skills, communication skills, management skills and cognitive skills. Hard skills on the other hand acknowledge areas such as technological skills, numeracy skill and language skills. Universities have been placing more emphasis on employability skills and amongst these employability skills numeracy is always included. Moreover various surveys of employers highlight the importance of numeracy skills (IOD, 2008) and (Archer and Davidson, 2008). A survey conducted by the Institute of Directors (2008) ranked numeracy as the sixth most important out of a list of 28 skills. While an additional survey by CBI (2008) members found that 39% of employers expressed concern about employees numeracy skills and 21% of employers say that numeracy skills are only 'occasionally' or 'never' demonstrated by graduates. The QAA benchmarks for Hospitality like many others include numeracy within the transferable skills. Studies on what hospitality employers want such as Littlejohn, 2004, Nield, 2011) again include numeracy as a transferable skill. For the purpose of this paper the approach towards skill development from a Hong Kong perspective will be considered.
HONG KONG AND ATTITUDES TOWARDS SKILLSET In Hong Kong, the hotel industry continued to grow at an extraordinary rate in the 1980's while much of Europe fought to survive through a recession. According to Mullins and Davis (1991) from a Hong Kong perspective, there was no recognition that the hotel industry is a challenging industry that requires its employees to acquire a greater level of knowledge skills in order to provide the necessary level of service. More significantly a study by the Hotel, Catering ad Tourism Discipline Steering Team (HKTA, 1998, cited by Chan and Coleman, 2004) found that employers did not regard education as a significant factor in hiring staff. This however contradicts an earlier study (Redding, 1986) which suggests that Chinese people in Hong Kong are willing to spend evenings taking classes in order to enrich their work competencies. More recently Chan and Coleman (2004) suggest that the economic recession in 1998 have led employers in Hong Kong towards understanding the need for formal training and skill development. With reference to their ranking of numeracy skill competency, according to the RSA report (2012), students in Hong Kong are amongst the highest performing in the world, ranking fourth in the most recent PISA results (2010) while all students study mathematics until entering university or the workplace. A study by the Association for Retailers and Tourism Services in 1998 where most of the respondents agree that training was essential for front line staff and middle management. Coupled with this the nature of the Hong Kong workforce is well characterised by the high mobility of the workers, with high numbers of the labour pool constantly on the move and thus the seeking out of better career opportunities. It would appear that the perception and approach towards employability and skill set in Hong Kong's student labour pool, mirrors that of The National Institute of Adult Continuing Education (NIACE) which views employability as a social construct and stresses that to see it as only an individual issue is to miss important aspects of the concept. They believe employability is a responsibility shared by public bodies i.e HE's, the individual themselves and businesses as a place of work.
METHODOLOGY
The initial approach adopted was very much action research. The subjects were the first year students following the Events, Food, Hospitality and Tourism Management programme (EFHTM) at Sheffield Business School. For background: as part of the Faculties policy of embedding the development of employability skills within a particular module, the new Professional & Academic Development module which is core for all students on the EFHT programme was allocated an additional 50% more hours of seminars. The emphasis of the module was rebalanced to reflect this with an increased emphasis on employability skills, the aim being to complement the academic skills with appropriate employability skills, thus the essay & report writing which was built into the programme was to be complemented by seminars on writing business letters, business emails, letters of application and CV's.
The survey point was in the first lecture on the Professional and Academic Skills module which occoured the first Monday of the teaching term, it was also given out in the lecture with minimal instructions other than to explain what generic skills were to try and avoid influencing the answers. The students were asked to complete the questionnaire and it was collected in before the lecture proceeded. Thus we had a captured audience and nearly the whole population of students were surveyed, the sample was 96% of the expected number of students. The same cohort of students were surveyed a year later in their second year in a similar situation in a core module, they were asked essentially the same questions with one question being changed to indicate how they felt particular skills had been developed. It should be noted that a convenience sampling was in effect used i.e. a lecture in a core module, this time the sample was a smaller proportion of the population 70%. This questionnaire was also given in class to a sample of Hospitality students in their final year, again using a convenience sampling, a class convenient to the researchers, due to the nature of the final year it is not possible to get the whole population together, thus the choice was based on trying to get the maximum sample by an in class questionnaire. The same questionnaire was used in the same way in the following year for the first year students.
Sheffield Hallam University delivers the final year of its EFHTM degree programme (with the exception of food) with a partner college in Hong Kong, although the experience of the students is different up to the point they start the final year, the opportunity was use to see if Hong Kong students have the same or different perspectives on employability skills. The sampling again was a convenience sample the questionnaire being given in classroom situation, with no guidance to minimise any possible influence. The sample comprised over 90% of the population, the questionnaire was exactly the same as the one used in the UK for second and final year students.
Thus at the end of the research process we had questionnaires for two first year cohorts; questionnaires for the same cohort in their first and second years, and a sample of hospitality students in their final year, plus a sample of Hong Kong students. In addition some focus groups were held with a sample of final year students to try and explore in depth what skills they felt had been developed and which required more development.
As already noted as the research was undertaken for purposes of action research the research instrument and designed as tool for teaching as well as research, the decision to ask the students to identify the 3 most important skills limits the level of statistical analysis possible so even though we have big samples in some cases over 400 only descriptive statistics are reported here.
RESULTS AND FINDINGS
When the UK students were asked which skills they thought they had improved the most (see Table 1 below) during their studies some interesting correlations begin to emerge. Skills which the students felt they had improved the least tended to reflect what skills they thought employers least valued (see Appendix 1) e.g. numeracy and IT skills whereas teamwork they felt they had developed and was highly valued, as displayed in their results (see Appendix 1) by employers. The other skills that are comparable such as oral business communication show a similar ranking whereas written business communication has improved although being lowly ranked as a desirable skill by employers. Of note is that there is very little difference between the two cohorts (Table 1 below) of students other than team working and presentation skills which the second years feel they have developed more this probably reflects the additional skill classes they had undertaken in Professional & Academic Development in their first year compared to the year 4.
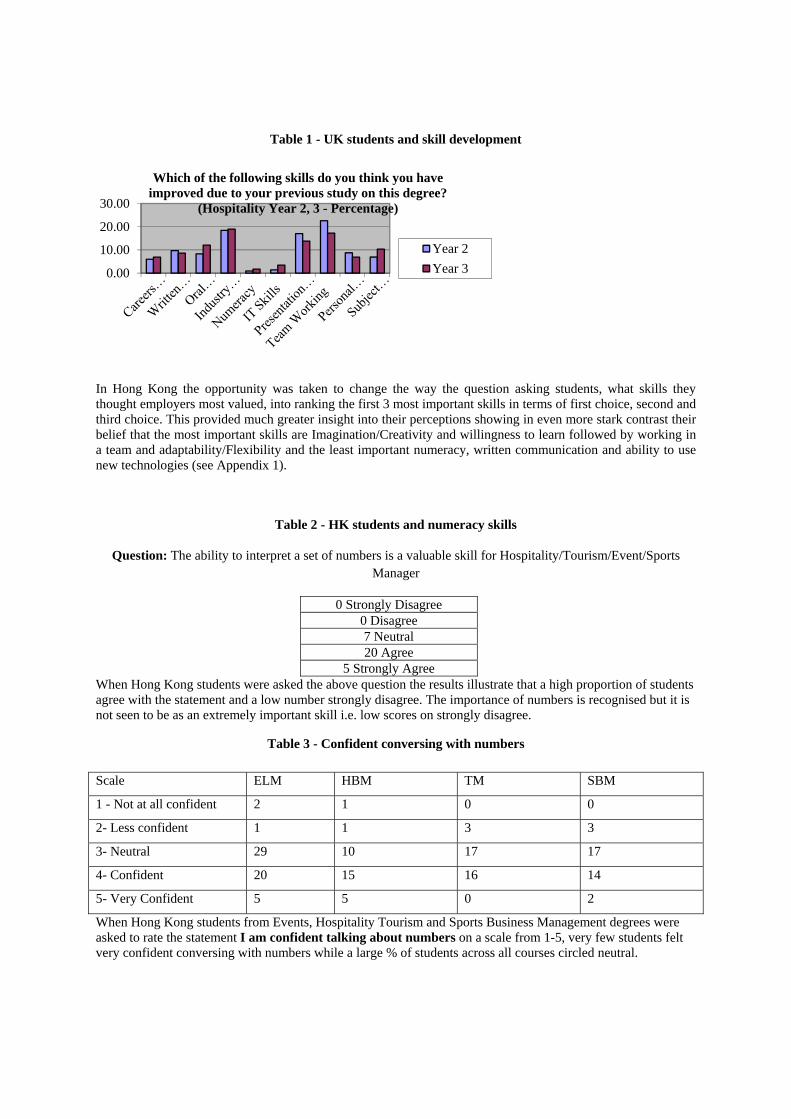
Table 1 - UK students and skill development
In Hong Kong the opportunity was taken to change the way the question asking students, what skills they thought employers most valued, into ranking the first 3 most important skills in terms of first choice, second and third choice. This provided much greater insight into their perceptions showing in even more stark contrast their belief that the most important skills are Imagination/Creativity and willingness to learn followed by working in a team and adaptability/Flexibility and the least important numeracy, written communication and ability to use new technologies (see Appendix 1).
Table 2 - HK students and numeracy skills
Question: The ability to interpret a set of numbers is a valuable skill for Hospitality/Tourism/Event/Sports Manager
0 Strongly Disagree 0 Disagree 7 Neutral 20 Agree
5 Strongly Agree When Hong Kong students were asked the above question the results illustrate that a high proportion of students agree with the statement and a low number strongly disagree. The importance of numbers is recognised but it is not seen to be as an extremely important skill i.e. low scores on strongly disagree.
Table 3 - Confident conversing with numbers
Scale ELM HBM TM SBM
1 - Not at all confident 2 1 0 0
2- Less confident 1 1 3 3
3- Neutral 29 10 17 17
4- Confident 20 15 16 14
5- Very Confident 5 5 0 2
When Hong Kong students from Events, Hospitality Tourism and Sports Business Management degrees were asked to rate the statement I am confident talking about numbers on a scale from 1-5, very few students felt very confident conversing with numbers while a large % of students across all courses circled neutral.
0.00
10.00
20.00
30.00
Which of the following skills do you think you have improved due to your previous study on this degree?
(Hospitality Year 2, 3 - Percentage)
Year 2
Year 3
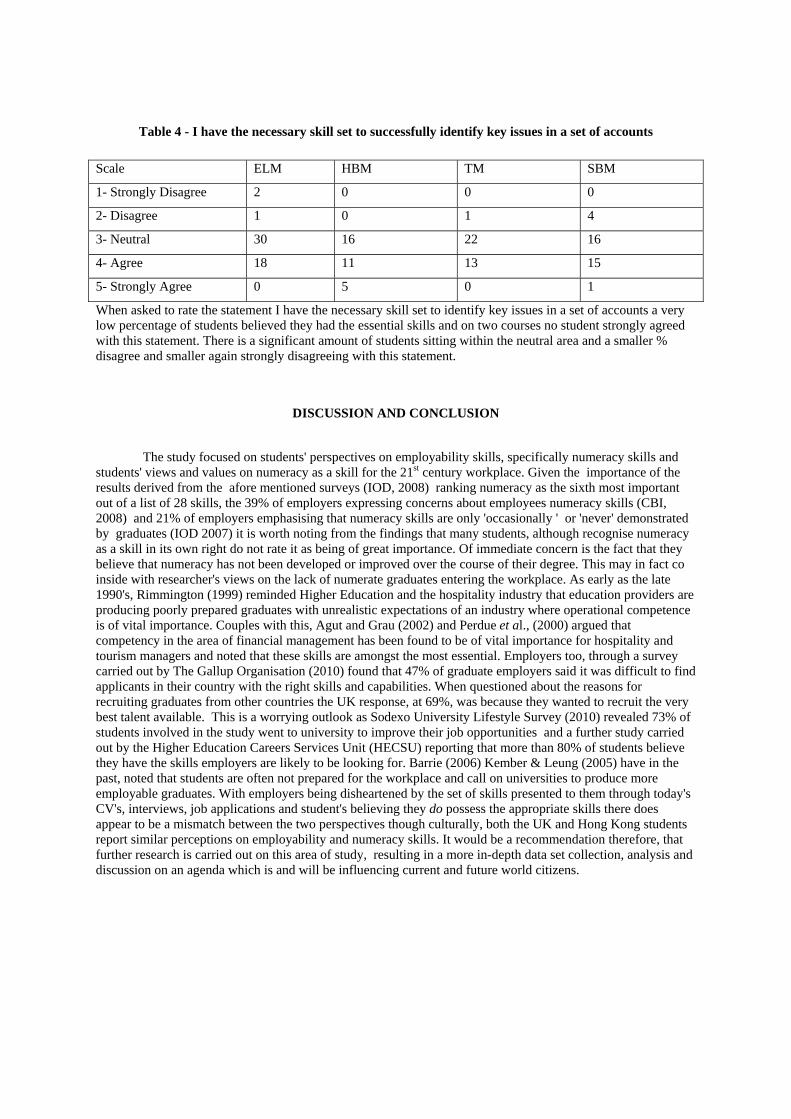
Table 4 - I have the necessary skill set to successfully identify key issues in a set of accounts
Scale ELM HBM TM SBM
1- Strongly Disagree 2 0 0 0
2- Disagree 1 0 1 4
3- Neutral 30 16 22 16
4- Agree 18 11 13 15
5- Strongly Agree 0 5 0 1
When asked to rate the statement I have the necessary skill set to identify key issues in a set of accounts a very low percentage of students believed they had the essential skills and on two courses no student strongly agreed with this statement. There is a significant amount of students sitting within the neutral area and a smaller % disagree and smaller again strongly disagreeing with this statement.
DISCUSSION AND CONCLUSION
The study focused on students' perspectives on employability skills, specifically numeracy skills and students' views and values on numeracy as a skill for the 21st century workplace. Given the importance of the results derived from the afore mentioned surveys (IOD, 2008) ranking numeracy as the sixth most important out of a list of 28 skills, the 39% of employers expressing concerns about employees numeracy skills (CBI, 2008) and 21% of employers emphasising that numeracy skills are only 'occasionally ' or 'never' demonstrated by graduates (IOD 2007) it is worth noting from the findings that many students, although recognise numeracy as a skill in its own right do not rate it as being of great importance. Of immediate concern is the fact that they believe that numeracy has not been developed or improved over the course of their degree. This may in fact co inside with researcher's views on the lack of numerate graduates entering the workplace. As early as the late 1990's, Rimmington (1999) reminded Higher Education and the hospitality industry that education providers are producing poorly prepared graduates with unrealistic expectations of an industry where operational competence is of vital importance. Couples with this, Agut and Grau (2002) and Perdue et al., (2000) argued that competency in the area of financial management has been found to be of vital importance for hospitality and tourism managers and noted that these skills are amongst the most essential. Employers too, through a survey carried out by The Gallup Organisation (2010) found that 47% of graduate employers said it was difficult to find applicants in their country with the right skills and capabilities. When questioned about the reasons for recruiting graduates from other countries the UK response, at 69%, was because they wanted to recruit the very best talent available. This is a worrying outlook as Sodexo University Lifestyle Survey (2010) revealed 73% of students involved in the study went to university to improve their job opportunities and a further study carried out by the Higher Education Careers Services Unit (HECSU) reporting that more than 80% of students believe they have the skills employers are likely to be looking for. Barrie (2006) Kember & Leung (2005) have in the past, noted that students are often not prepared for the workplace and call on universities to produce more employable graduates. With employers being disheartened by the set of skills presented to them through today's CV's, interviews, job applications and student's believing they do possess the appropriate skills there does appear to be a mismatch between the two perspectives though culturally, both the UK and Hong Kong students report similar perceptions on employability and numeracy skills. It would be a recommendation therefore, that further research is carried out on this area of study, resulting in a more in-depth data set collection, analysis and discussion on an agenda which is and will be influencing current and future world citizens.
REFERENCES
Agut, S. and Grau, R. (2002). Managerial competency needs and training requests: the case of the Spanish tourist industry. Human Resource Development Quarterly,13(1): 31-51
Archer, W. & Davison, J. (2008). Graduate Employability: What do Employers think and want? London: The Council for Industry and Higher Education.
BHA, (2010). Creating jobs in Britain - A Hospitality Economy Proposition, London, British Hospitality Association. Boyatzis, R.E . (1982). The Competent Manager. New York: Wiley. CBI, (2008). Taking Stock: CBI Education and Skills Survey. London: Conference of British Industry. Chan, B., Coleman, M., (2004). Skills and competencies needed for the Hong Kong Industry: The Perspective of the Hotel Human Resource Manager. Journal of Human Resources in Hospitality and Tourism, 3(1). Crouch, C. Finegold, D. & Sako, M. (1999). Are skills the answer? The political economy of skill creation in advanced industrial countries. Oxford, Oxford University Press. Gould, S. (1979). Characteristics of career planners in upwardly mobile occupations, Academy of Management Journal, 22(3): 539-50. Hillage, J. & Pollard, E. (1998). Employability: Developing a Framework for Policy Analysis. London: DfEE. IOD, (2008). Institute of Directors Skills Briefing: Graduates employability skills. London Institute of Directors. Kember, D. & Leung, D.Y.P. (2005). The Influence of the Teaching and Learning Environment on the Development of Generic Capabilities needed for a Knowledge-based Society. Learning Environments Research, 8, 245-266.
Littlejohn, D. (2004). Developing Graduate Managers for Hospitality and Tourism. International Journal of Contemporary Hospitality Management, 408-414. MacInnes, J. (2009). Proposals to support and improve the teaching of quantitative research methods at Undergraduate level in the UK. Edinburgh: University of Edinburgh.
Mullins, L. and Davies, I. (1991). What makes for an effective hotel manager? International Journal of Contemporary Management, 3(1): 22-25. Nield, K. (2011). The Employability of Leisure and Hospitality Graduates. EuroChrie 29th Annual Conference: 433-442. Dubrovnik:R.I.T. OECD, (2001). Knowledge and skills for Life: First results from PISA 2000. Paris, OECD. Paton, G, (2012). University Maths 'too difficult' for British students. The Telegraph, 10th February. Porter, L.W., Lawler, E.E. III and Hackman, J.R. (1975). Developmental processes: Individuals developing careers and organizations developing individuals, Behaviour in Organizations. McGraw-Hill. New York: NY. Redding, S.G. (1986). Developing Managers without Management Development: the overseas Chinese solution. Management, Education and Development, 17(3): 271-81. RSA, (2012). Solving the maths problem: international perspectives on mathematics education, London, February.
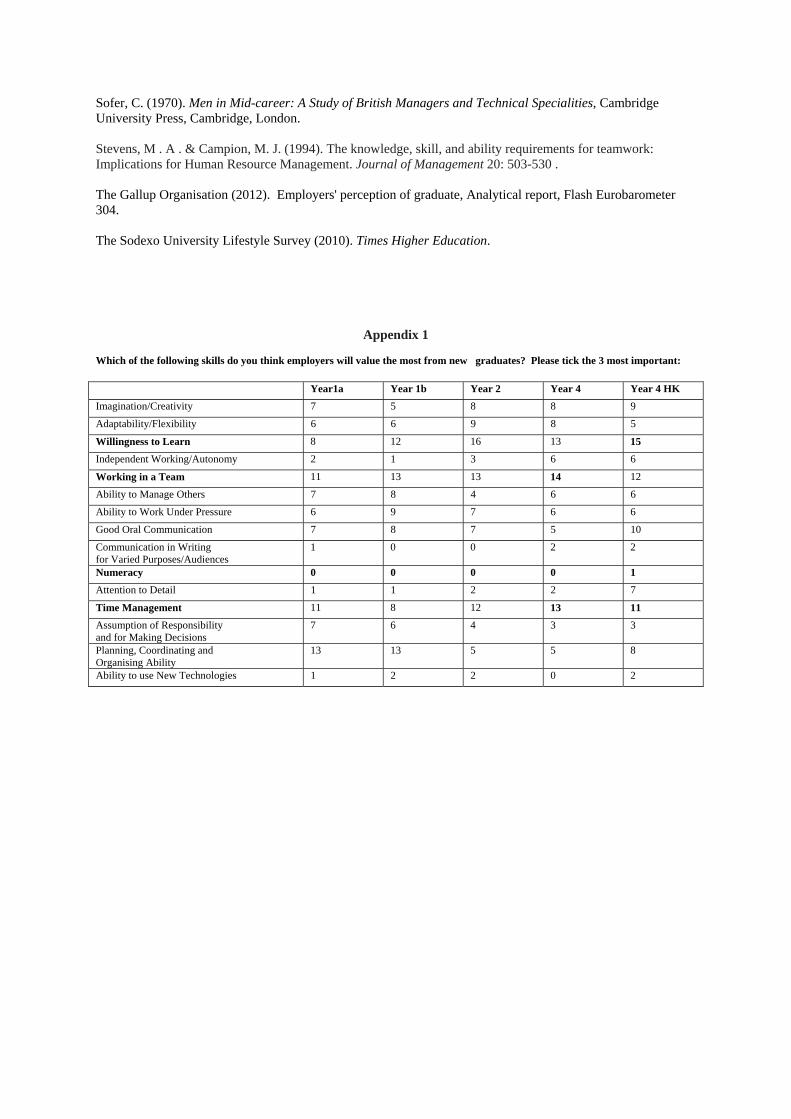
Sofer, C. (1970). Men in Mid-career: A Study of British Managers and Technical Specialities, Cambridge University Press, Cambridge, London. Stevens, M . A . & Campion, M. J. (1994). The knowledge, skill, and ability requirements for teamwork: Implications for Human Resource Management. Journal of Management 20: 503-530 . The Gallup Organisation (2012). Employers' perception of graduate, Analytical report, Flash Eurobarometer 304. The Sodexo University Lifestyle Survey (2010). Times Higher Education.
Appendix 1 Which of the following skills do you think employers will value the most from new graduates? Please tick the 3 most important:
Year1a Year 1b Year 2 Year 4 Year 4 HK
Imagination/Creativity 7 5 8 8 9
Adaptability/Flexibility 6 6 9 8 5
Willingness to Learn 8 12 16 13 15
Independent Working/Autonomy 2 1 3 6 6
Working in a Team 11 13 13 14 12
Ability to Manage Others 7 8 4 6 6
Ability to Work Under Pressure 6 9 7 6 6
Good Oral Communication 7 8 7 5 10
Communication in Writing for Varied Purposes/Audiences
1 0 0 2 2
Numeracy 0 0 0 0 1
Attention to Detail 1 1 2 2 7
Time Management 11 8 12 13 11
Assumption of Responsibility and for Making Decisions
7 6 4 3 3
Planning, Coordinating and Organising Ability
13 13 5 5 8
Ability to use New Technologies 1 2 2 0 2
Exploring the impact of executive functions on the study progress of Hospitality students
Nije Bijvank, M.1
Woelders, L. 2
Tonnaer, G. H. *1
Verweij, C. F. 1
*Corresponding author 1Hospitality Business School
Saxion University of Applied Sciences
The Netherlands 2 Centre for Brain & Learning, LEARN! Institute
VU university, Amsterdam
Abstract
Recent insights from neuroscience studies show that brain regions where Executive Functions (EF) are located, are still developing throughout adolescence. These EF are responsible for regulation of learning processes. Adolescent students who enter higher education are still developing as well. The current study was performed to gain insight in the relation between EF and study progress at the Hospitality Business School. Preliminary results show that EF positively relate to study progress: the more Attention, Self‐control and Self‐monitoring, time spend on study and the less Procrastination the more study credits first year students obtain. The findings provide a starting point to enhance the quality of support for students. Interventions focusing on supporting and stimulating the development of students´ EF can foster stronger study performance and might even evoke excellence in students.
Key words: Hospitality, adolescence, executive functions, study progress
INTRODUCTION
Nowadays, teachers struggle with students’ motivation to learn and their disappointing academic achievements (HBO-raad, 2011). Lecturers expect students to take responsibility, be motivated, be good planners, and have a pro-active attitude. These expectations of students are in line with the social constructivism that has been the foundation of education since the twentieth century. Within this constructivist perspective students are expected to regulate their own learning processes. The Hospitality Business School (HBS) of Saxion University of Applied Sciences explicitly expects their students to be ‘the director of their own learning processes’. However, in practice it turns out that students often behave in a complete opposite way. That is, they regularly hand in papers too late, are more interested in their peers than in the teachers, have troubles with decision-making and so on. Recent insights from neuroscience studies about the developmental phase of adolescents provide a good starting point to explain this discrepancy. By drawing on recent neuroscience research, the current paper tries to identify the impact of potential risk- and protective factors on study progress. More specifically, this paper provides insight into Executive Functions (EF) of students and the relation of these EF with students’ study progress.
THEORETICAL BACKGROUND
Students who start their 4 year curriculum at the Hospitality Business School are in the developmental phase called adolescence. Adolescence is a period in which a lot of changes take place, such as increased hormonal secretions and physical growth. In this period adolescents form a sense of identity, have to adjust to new cognitive and socio-emotional challenges at school, and to changes in their emotional and social relations with their parents and peers (Erikson, 1982; Steinberg & Morris, 2001).
Furthermore, neurobiological changes in the brain take place during adolescence (Spear, 2000). In contradiction to earlier assumptions that the brains’ plasticity is limited to childhood, recent neurological studies show that certain brain regions continue to develop throughout adolescence and even into adulthood (Amodio & Frith, 2006; Blakemore & Frith, 2005; Steinberg, 2008; Togan, Thompson & Sowell, 2006; Spear, 2000). It has become evident that especially brain regions responsible for regulation of the learning process (e.g. planning) are still developing during adolescence (Blakemore & Frith, 2005; Zimmerman, 2000). The so called ‘Executive Functions´ (EF) are located in these brain regions. EF refer to the cognitive abilities that are needed to control and coordinate our thoughts and behaviour (Van der Elst et al., 2011) and to make complex ‘well considered’ decisions. The ability to regulate one’s own learning process appears to be an important skill for educational performance (Zimmerman, 2000; 2001; Alexander & Winne, 2006; Hein & Singer, 2008). It has been suggested that measures of EF may even allow for a better prediction of study performance than more general cognitive indices do (such as IQ; Best, Miller, & Jones, 2009). Some even argue that the aims of education for adolescents might include strengthening EF (Blakemore, 2010; Hinton, Miyamoto & Della-Chiesa, 2008). However, until now, little is known about the relation between EF in adolescence and study progress in higher education. These insights from neuropsychology imply that the brains of students who enter the HBS programme are still developing as well. Therefore, the first year students form an interesting group to study the relation between EF and study progress. This group has made the transition from a structured environment (high school) to an educational environment with more freedom. This new educational environment appeals to the EF more than in students’ previous education; expectations that teachers have concerning taking responsibility, planning and to have a pro-active attitude are higher, and a higher level of independency is required. International research on student transitions to higher education highlights the importance of a successful transition period; those who have difficulties with the transition may perform poorly and/or disengage from their study (Lowe & Cook, 2003). A lot of students are facing difficulties in this transition, especially because among these adolescents the EF are still developing. An educational environment that supports the developments of these EF might be fruitful for these students (Blakemore, 2010; Melzer 2007).
CURRENT STUDY
The Hospitality Business School (HBS) of Saxion University of Applied Sciences intensively cooperates with the Centre for Brain & Learning, (VU University Amsterdam) in a multidisciplinary project ‘Hospitality, Brains & Learning’. HBS is an educational academy at Saxion University of Applied Sciences and has more than 2200 hospitality students. The Centre for Brain & Learning is an interfaculty research institute at the VU University in Amsterdam and is working on the promotion and application of (neuropsychological) knowledge in education. With this cooperation the project aims to improve the match between the educational environment of the Hospitality Business School and the needs of hospitality students. Therefore, within the project several studies are performed. This paper discusses the first study.
The current study aims to gain insight in EF that fundamental researchers found to develop during adolescence, and insight in students´ time spending pattern. In addition, this study investigates the relation of these EF with study progress. The findings are explored with a practical view to enhance the quality of support for students during their first year. This focus also emerged from a general perception amongst HBS staff which experience first year students; there is a lack of engagement, poor attendance and study results are often disappointing.
METHOD
The questionnaire used for this study consisted of three constructs of EF: a) attention, b) self-control and self-monitoring (AEFI, Van der Elst et al., 2011) and c) procrastination (ADOGS, Bembenutty & Karabenick, 1998). Attention refers to the ability to hold your attention, and self-control and self-monitoring relate to being able to regulate one’s own behaviour. Both measurements were rated on a 5 point Likert scale (AEFI, Van der Elst et al., 2011).
In the ADOGS measurements students had to choose between an immediately available option (e.g., go to a favourite concert the day before an exam) in favour of a delayed alternative (e.g., study now to get a good grade later) in order to secure temporarily distant academic rewards, goals, and intentions (ADOGS, Bembenutty & Karabenick, 1998; Zhang, Karabenick, Maruno, & Lauermann, 2011).
In addition, time spend on study, time spend on part-time jobs and time spend on leisure time activities was measured, as well as control variables such as gender, age, and prior education (various high school levels). Additionally, individual study progress was linked to the above mentioned factors. Study progress was measured by the amount of study credits students had obtained at the end of their first year at the Hospitality Business School.
First-year students of the Hospitality Business School (HBS) at Saxion University of Applied Sciences were approached in class by their study career counsellor, seated individually, and most students finished the questionnaire in 30 minutes.
The analysis consisted of bivariate Pearson’s Productmomentcorrelations. Furthermore, groups were
created along the control variables to see whether different effects of the EF on study progress occurred.
RESULTS
A total of 301 first-year students in the age of 16-22 participated in this study. Preliminary results show significant differences between students in study progress‐related factors and identify several predictors for students’ study progress.
Attention appears to be significantly related to the amount of study credits (r = .20, p < .01). Students’ age also plays a role in this relationship; 17-year and 18-year old students obtain more study credits when they have a high level of Attention (age17: r = .32; p < .05, age18: r = .33; p < .05).No differences were found for gender and previous education.
There is also a significant relation between Self-control and Self‐monitoring and the amount of obtained
study credits (r = .16, p < .05). The better students are able to hold their attention and control their thoughts and behaviour, the more study credits they obtain. While female students do not have a higher level of Self-control and Self‐monitoring than male students, results show that a high level does influence their study progress: female students obtain more study credits (r = .25; p < .05). Especially for 17 year old students we found that a high level of Self-control and Self‐monitoring is related to better study results (r = .37; p < .05). No differences were found for prior education.
Furthermore, a high level of Procrastination contributes negatively to study progress (r = .14, p < 05).
The more students procrastinate their study duties, the less study credits they obtain. More specifically, this relationship appears to be especially true for female students; (r = .20; p < .05). In addition, it appears that 17-year old students the level of procrastination is important; the more 17-year old students choose study related activities (academic delay of gratification, so no procrastination), the more study credits they obtain (r = .38; p < .05).
Almost 85% of first year Hospitality students have a part time job next to their study. On average, they spend 1.5 day per week on this. It appears that time spend on study is related to study progress. Students who
spend more hours (in their own time) on study related factors, obtain more study credits (r = .22: p < .05). Results further show that when students spend more time on their part-time job, they obtain less study credits (r = -.16; p < .05).
CONCLUSION
In sum, the more Attention, Self‐control and Self‐monitoring, time spend on study and the less Procrastination the more study credits first year students obtain. These conclusions support the expectation that EF positively relate to study progress. Identifying the impact of EF on study progress helps us not only to identify students at risk, but also to identify (potentially) excellent students. The observed individual differences in EF suggest that these functions are still developing during adolescence. Individual differences further show that relatively young students with stronger developed EF than their same age peer students benefit from it in terms of study progress. Together, these findings show that it is important to investigate the level of the executive functions among first year students and their impact on study progress.
IMPLICATIONS AND FURTHER RESEARCH
The importance to study adolescents’ brain development in relation to education and to study the implications of differences in this relation is highlighted by many researchers (Ansari & Coch, 2006; Blakemore & Frith, 2005; Blakemore, 2010; Hein & Singer, 2008; Richter, 2006). These insights can help us in identifying students that are of risk as well as potential excellent students and find ways to support the (brain) development of adolescent students. Therefore, in developing educational programmes and in teaching we should pay attention to factors that are especially important in adolescence and hence influence learning and studysuccess.
Interventions focusing on practicing or training EF might be promising to make learning at this stage of our students´ lives more rewarding and effective, by supporting the development of EF and also study progress. Supporting and stimulating EF among adolescents can foster stronger study performance and might even evoke excellence in students.
Since we know that procrastination negatively affects study progress, an example intervention could be that students, who tend to procrastinate their study duties, should be warned about this behaviour at the beginning of their studies.
Another example is to include abilities in the educational programme that are controlled by the parts of the brain that change during adolescence and hence influence study progress. These interventions could contribute to students´ self-regulating abilities, such as being able to Self-control and Self-monitor.
Furthermore, teachers must be educated on the changes occurring in the students’ brain during adolescence, more specifically about the influence EF has on study progress. What should a teacher do when he realises students in their class have a low level of Attention of Self-control and Self-monitoring? This study shows that obtaining more knowledge about the effects and about what to do about EF in development are vital in creating an educational environment that supports adolescents in their growth.
Based on the results of this first study several follow up studies are planned. Respondents of this first
study will be followed during their study career in a Student Follow System. Study results as well as executive functions will be measured again throughout their study career to have longitudinal measurements of students’ EF and their educational performance. Furthermore, all new students that enter the Hospitality Programme at HBS are included in this system as well.
References Alexander, P. A., & Winne, P. H. (Eds.). (2006). Handbook of educational psychology (Second edition). Mahwah, NJ: Lawrence Erlbaum Associates and Division 15 of the American Psychology Association Amodio, D. M., & Frith, C. D . (2005). Meeting of minds: the medial frontal cortex and social cognition. Nature Reviews Neuroscience, 7, 268-277. Ansari, D., & Coch, D. (2006). Bridges over troubled waters: education and cognitive
neuroscience. Trends in Cognitive Sciences, 10(4), 146-151 Bembenutty, H. & Karabenick, S. A. (1998). Academic Delay of Gratification. Learning and Individual Differences, 10(4), 329-346. Best, J. R., Miller, P. H., & Jones, L. L. (2009). Executive functions after age 5: Changes and correlates. Developmental Review, 29, 180-200. Blakemore, S-J., & Frith, U. (2005). The learning brain: lessons for education. Oxford, UK: Blackwell Publishing. Blakemore, S-J. (2010). The developing social brain: implications for education. Neuron. 65(6), 744- 747. Choudhury, S., Blakemore, S-J, &Charman, T. (2006). Social cognitive development during adolescence. Social Cognitive and Affective Neuroscience, 1, 165-174 Erikson, E. H. (1982). The life cycle completed. New York: Norton. Hein, G., & Singer, T. (2008). Understanding others: empathy and cognitive perspective
taking in the human brain. Inaugural Herzliya Symposium on Personality and Social Psychology: prosocial Motives, Emotions, and Behavior, Herzliya, Israel.
HBO-raad (2011). Kwaliteit als opdracht. Den Haag. Hinton,C., Miyamoto K.,& Della-Chiesa, B. (2008). Brain research, learning and emotions:
implications for education research, policy and practice. European Journal of Education, 43, 78-103. Lowe, H., & Cook, A. (2003). Mind the gap, are students prepared for higher education? Journal of Further and Higher Education, 27(1), 53–76. Meltzer, L., Salle Pollica, S. & Barzillia, M. (2007). Executive functions in the classroom: Embedding strategy instructions into daily teaching practices. In: L. Meltzer (ed.). Executive functions in Education (pp. 165- 193). New York: The Guilford Press. Richter, L. M. (2006). Studying Adolescence. Science,312, 1902 - 1905 Spear, P. (2000). The adolescent brain and age-related behavioral manifestations,
Neuroscience and Biobehavioral Reviews, 24, 417–463. Steinberg, L. (2008). A social neuroscience perspective on adolescent risktaking.
Developmental Review, 28(1), 78-106 Steinberg, L. & Morris, A. S. (2001). Adolescent development. Annual review of Psychology, 52, 83-110. Togan, A. W., Thompson, P. M. & Sowell, E. R. (2006). Mapping brain maturation. Trends In Neurosciences, 29, 148-159. Van der Elst, W., Ouwehand, C., Werf, G. van der, Kuyper, H., Lee, N. & Jolles, J. (2011). The Amsterdam Executive Function Inventory (AEFI): psychometric properties and demographically-corrected normative data for adolescents aged between 15 and 18 years. Journal of Clinical and Experimental Neuropsychology, 33(1), 1-12. Zhang, L., Karabenick, S. A., Maruno, S., & Lauermann, F. (2011). Academic delay of gratification and children’s study time allocation as a function ofproximity to consequential academic goals. Learning and Instruction, 21(1), 77-94. Zimmerman, B. J. (2000). Attaining Self-Regulation: a social cognitive perspective. In
Boekaerts, M., Pintrich, P., & Zeodmer, M. (Eds.), Handbook of self-regulation. San Diego, Cal. USA: Academic Press.
Zimmerman, B. J. (2001). Theories of self-regulated learning and academic achievement: An overview and analysis. In B. J. Zimmerman & D. H. Schunk (Eds.), Self-
regulated learning and academic achievement: Theoretical perspectives (pp. 1-37). Mahwah, NJ: Lawrence Erlbaum Associates.
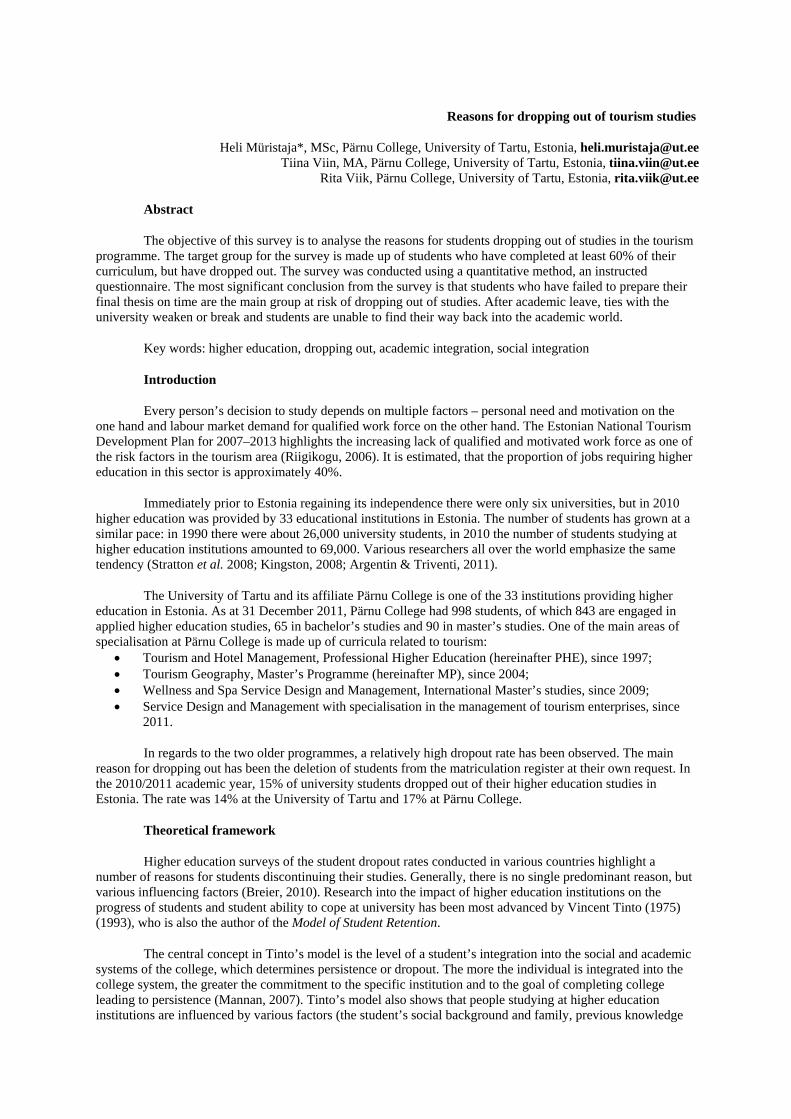
Reasons for dropping out of tourism studies
Heli Müristaja*, MSc, Pärnu College, University of Tartu, Estonia, [email protected] Tiina Viin, MA, Pärnu College, University of Tartu, Estonia, [email protected]
Rita Viik, Pärnu College, University of Tartu, Estonia, [email protected]
Abstract
The objective of this survey is to analyse the reasons for students dropping out of studies in the tourism programme. The target group for the survey is made up of students who have completed at least 60% of their curriculum, but have dropped out. The survey was conducted using a quantitative method, an instructed questionnaire. The most significant conclusion from the survey is that students who have failed to prepare their final thesis on time are the main group at risk of dropping out of studies. After academic leave, ties with the university weaken or break and students are unable to find their way back into the academic world.
Key words: higher education, dropping out, academic integration, social integration
Introduction
Every person’s decision to study depends on multiple factors – personal need and motivation on the one hand and labour market demand for qualified work force on the other hand. The Estonian National Tourism Development Plan for 2007–2013 highlights the increasing lack of qualified and motivated work force as one of the risk factors in the tourism area (Riigikogu, 2006). It is estimated, that the proportion of jobs requiring higher education in this sector is approximately 40%.
Immediately prior to Estonia regaining its independence there were only six universities, but in 2010 higher education was provided by 33 educational institutions in Estonia. The number of students has grown at a similar pace: in 1990 there were about 26,000 university students, in 2010 the number of students studying at higher education institutions amounted to 69,000. Various researchers all over the world emphasize the same tendency (Stratton et al. 2008; Kingston, 2008; Argentin & Triventi, 2011).
The University of Tartu and its affiliate Pärnu College is one of the 33 institutions providing higher education in Estonia. As at 31 December 2011, Pärnu College had 998 students, of which 843 are engaged in applied higher education studies, 65 in bachelor’s studies and 90 in master’s studies. One of the main areas of specialisation at Pärnu College is made up of curricula related to tourism:
Tourism and Hotel Management, Professional Higher Education (hereinafter PHE), since 1997; Tourism Geography, Master’s Programme (hereinafter MP), since 2004; Wellness and Spa Service Design and Management, International Master’s studies, since 2009; Service Design and Management with specialisation in the management of tourism enterprises, since
2011.
In regards to the two older programmes, a relatively high dropout rate has been observed. The main reason for dropping out has been the deletion of students from the matriculation register at their own request. In the 2010/2011 academic year, 15% of university students dropped out of their higher education studies in Estonia. The rate was 14% at the University of Tartu and 17% at Pärnu College.
Theoretical framework
Higher education surveys of the student dropout rates conducted in various countries highlight a number of reasons for students discontinuing their studies. Generally, there is no single predominant reason, but various influencing factors (Breier, 2010). Research into the impact of higher education institutions on the progress of students and student ability to cope at university has been most advanced by Vincent Tinto (1975) (1993), who is also the author of the Model of Student Retention.
The central concept in Tinto’s model is the level of a student’s integration into the social and academic systems of the college, which determines persistence or dropout. The more the individual is integrated into the college system, the greater the commitment to the specific institution and to the goal of completing college leading to persistence (Mannan, 2007). Tinto’s model also shows that people studying at higher education institutions are influenced by various factors (the student’s social background and family, previous knowledge
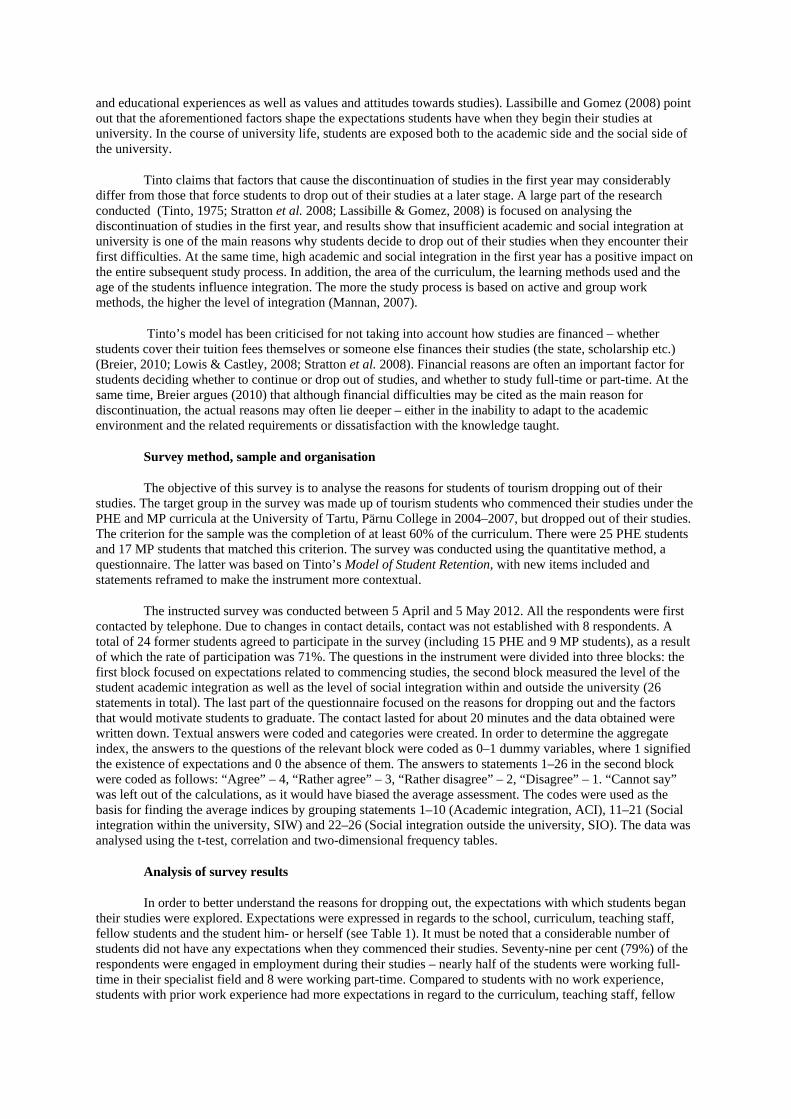
and educational experiences as well as values and attitudes towards studies). Lassibille and Gomez (2008) point out that the aforementioned factors shape the expectations students have when they begin their studies at university. In the course of university life, students are exposed both to the academic side and the social side of the university.
Tinto claims that factors that cause the discontinuation of studies in the first year may considerably differ from those that force students to drop out of their studies at a later stage. A large part of the research conducted (Tinto, 1975; Stratton et al. 2008; Lassibille & Gomez, 2008) is focused on analysing the discontinuation of studies in the first year, and results show that insufficient academic and social integration at university is one of the main reasons why students decide to drop out of their studies when they encounter their first difficulties. At the same time, high academic and social integration in the first year has a positive impact on the entire subsequent study process. In addition, the area of the curriculum, the learning methods used and the age of the students influence integration. The more the study process is based on active and group work methods, the higher the level of integration (Mannan, 2007).
Tinto’s model has been criticised for not taking into account how studies are financed – whether students cover their tuition fees themselves or someone else finances their studies (the state, scholarship etc.) (Breier, 2010; Lowis & Castley, 2008; Stratton et al. 2008). Financial reasons are often an important factor for students deciding whether to continue or drop out of studies, and whether to study full-time or part-time. At the same time, Breier argues (2010) that although financial difficulties may be cited as the main reason for discontinuation, the actual reasons may often lie deeper – either in the inability to adapt to the academic environment and the related requirements or dissatisfaction with the knowledge taught.
Survey method, sample and organisation
The objective of this survey is to analyse the reasons for students of tourism dropping out of their studies. The target group in the survey was made up of tourism students who commenced their studies under the PHE and MP curricula at the University of Tartu, Pärnu College in 2004–2007, but dropped out of their studies. The criterion for the sample was the completion of at least 60% of the curriculum. There were 25 PHE students and 17 MP students that matched this criterion. The survey was conducted using the quantitative method, a questionnaire. The latter was based on Tinto’s Model of Student Retention, with new items included and statements reframed to make the instrument more contextual.
The instructed survey was conducted between 5 April and 5 May 2012. All the respondents were first contacted by telephone. Due to changes in contact details, contact was not established with 8 respondents. A total of 24 former students agreed to participate in the survey (including 15 PHE and 9 MP students), as a result of which the rate of participation was 71%. The questions in the instrument were divided into three blocks: the first block focused on expectations related to commencing studies, the second block measured the level of the student academic integration as well as the level of social integration within and outside the university (26 statements in total). The last part of the questionnaire focused on the reasons for dropping out and the factors that would motivate students to graduate. The contact lasted for about 20 minutes and the data obtained were written down. Textual answers were coded and categories were created. In order to determine the aggregate index, the answers to the questions of the relevant block were coded as 0–1 dummy variables, where 1 signified the existence of expectations and 0 the absence of them. The answers to statements 1–26 in the second block were coded as follows: “Agree” – 4, “Rather agree” – 3, “Rather disagree” – 2, “Disagree” – 1. “Cannot say” was left out of the calculations, as it would have biased the average assessment. The codes were used as the basis for finding the average indices by grouping statements 1–10 (Academic integration, ACI), 11–21 (Social integration within the university, SIW) and 22–26 (Social integration outside the university, SIO). The data was analysed using the t-test, correlation and two-dimensional frequency tables.
Analysis of survey results
In order to better understand the reasons for dropping out, the expectations with which students began their studies were explored. Expectations were expressed in regards to the school, curriculum, teaching staff, fellow students and the student him- or herself (see Table 1). It must be noted that a considerable number of students did not have any expectations when they commenced their studies. Seventy-nine per cent (79%) of the respondents were engaged in employment during their studies – nearly half of the students were working full-time in their specialist field and 8 were working part-time. Compared to students with no work experience, students with prior work experience had more expectations in regard to the curriculum, teaching staff, fellow
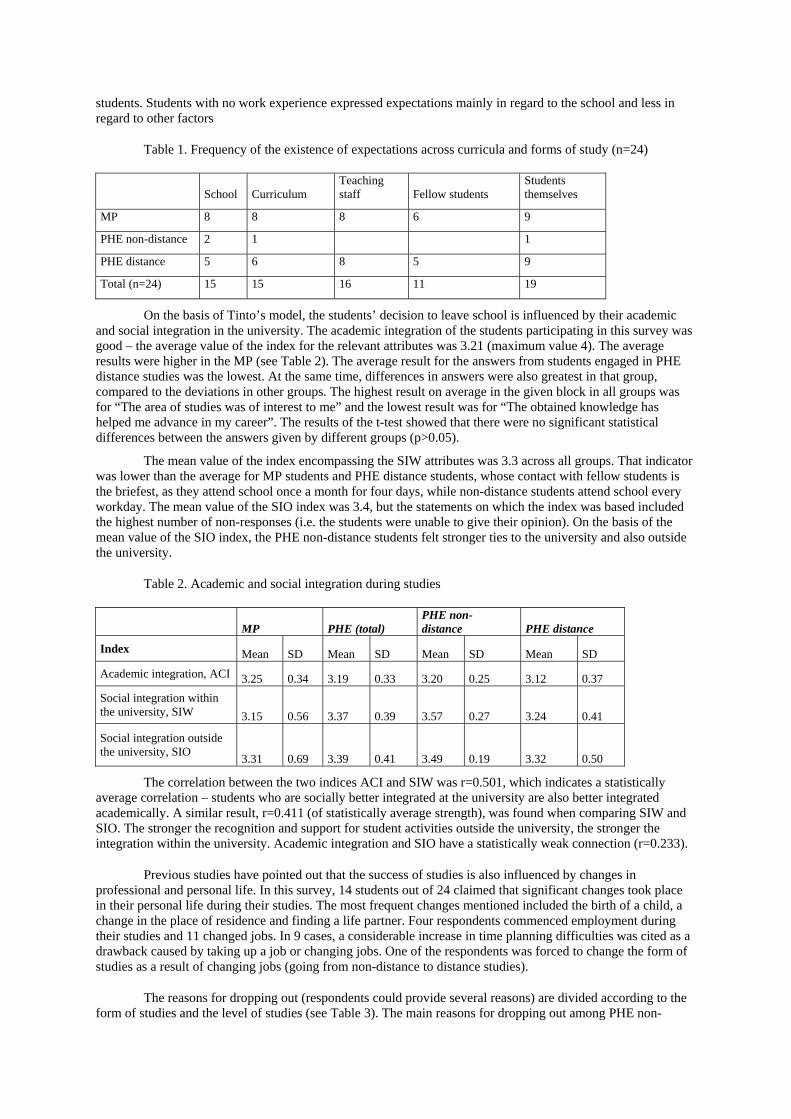
students. Students with no work experience expressed expectations mainly in regard to the school and less in regard to other factors
Table 1. Frequency of the existence of expectations across curricula and forms of study (n=24)
School Curriculum Teaching staff Fellow students
Students themselves
MP 8 8 8 6 9
PHE non-distance 2 1 1
PHE distance 5 6 8 5 9
Total (n=24) 15 15 16 11 19
On the basis of Tinto’s model, the students’ decision to leave school is influenced by their academic and social integration in the university. The academic integration of the students participating in this survey was good – the average value of the index for the relevant attributes was 3.21 (maximum value 4). The average results were higher in the MP (see Table 2). The average result for the answers from students engaged in PHE distance studies was the lowest. At the same time, differences in answers were also greatest in that group, compared to the deviations in other groups. The highest result on average in the given block in all groups was for “The area of studies was of interest to me” and the lowest result was for “The obtained knowledge has helped me advance in my career”. The results of the t-test showed that there were no significant statistical differences between the answers given by different groups (p>0.05).
The mean value of the index encompassing the SIW attributes was 3.3 across all groups. That indicator was lower than the average for MP students and PHE distance students, whose contact with fellow students is the briefest, as they attend school once a month for four days, while non-distance students attend school every workday. The mean value of the SIO index was 3.4, but the statements on which the index was based included the highest number of non-responses (i.e. the students were unable to give their opinion). On the basis of the mean value of the SIO index, the PHE non-distance students felt stronger ties to the university and also outside the university.
Table 2. Academic and social integration during studies
MP PHE (total)
PHE non-distance PHE distance
Index Mean SD Mean SD Mean SD Mean SD
Academic integration, ACI 3.25 0.34 3.19 0.33 3.20 0.25 3.12 0.37
Social integration within the university, SIW 3.15 0.56 3.37 0.39 3.57 0.27 3.24 0.41
Social integration outside the university, SIO
3.31 0.69 3.39 0.41 3.49 0.19 3.32 0.50
The correlation between the two indices ACI and SIW was r=0.501, which indicates a statistically average correlation – students who are socially better integrated at the university are also better integrated academically. A similar result, r=0.411 (of statistically average strength), was found when comparing SIW and SIO. The stronger the recognition and support for student activities outside the university, the stronger the integration within the university. Academic integration and SIO have a statistically weak connection (r=0.233).
Previous studies have pointed out that the success of studies is also influenced by changes in professional and personal life. In this survey, 14 students out of 24 claimed that significant changes took place in their personal life during their studies. The most frequent changes mentioned included the birth of a child, a change in the place of residence and finding a life partner. Four respondents commenced employment during their studies and 11 changed jobs. In 9 cases, a considerable increase in time planning difficulties was cited as a drawback caused by taking up a job or changing jobs. One of the respondents was forced to change the form of studies as a result of changing jobs (going from non-distance to distance studies).
The reasons for dropping out (respondents could provide several reasons) are divided according to the form of studies and the level of studies (see Table 3). The main reasons for dropping out among PHE non-
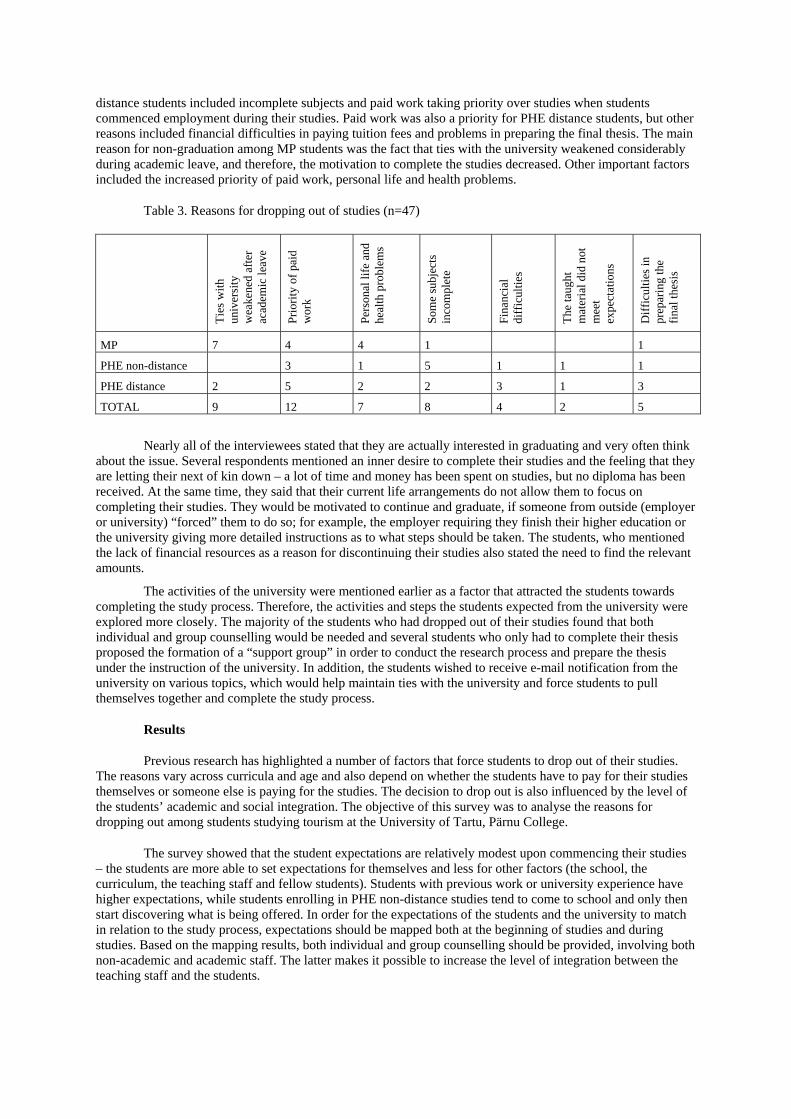
distance students included incomplete subjects and paid work taking priority over studies when students commenced employment during their studies. Paid work was also a priority for PHE distance students, but other reasons included financial difficulties in paying tuition fees and problems in preparing the final thesis. The main reason for non-graduation among MP students was the fact that ties with the university weakened considerably during academic leave, and therefore, the motivation to complete the studies decreased. Other important factors included the increased priority of paid work, personal life and health problems.
Table 3. Reasons for dropping out of studies (n=47)
Tie
s w
ith
univ
ersi
ty
wea
kene
d af
ter
acad
emic
leav
e
Pri
orit
y of
pai
d w
ork
Per
sona
l lif
e an
d he
alth
pro
blem
s
Som
e su
bjec
ts
inco
mpl
ete
Fin
anci
al
diff
icul
ties
The
taug
ht
mat
eria
l did
not
m
eet
expe
ctat
ions
Dif
ficu
lties
in
prep
arin
g th
e fi
nal t
hesi
s
MP 7 4 4 1 1
PHE non-distance 3 1 5 1 1 1
PHE distance 2 5 2 2 3 1 3
TOTAL 9 12 7 8 4 2 5
Nearly all of the interviewees stated that they are actually interested in graduating and very often think about the issue. Several respondents mentioned an inner desire to complete their studies and the feeling that they are letting their next of kin down – a lot of time and money has been spent on studies, but no diploma has been received. At the same time, they said that their current life arrangements do not allow them to focus on completing their studies. They would be motivated to continue and graduate, if someone from outside (employer or university) “forced” them to do so; for example, the employer requiring they finish their higher education or the university giving more detailed instructions as to what steps should be taken. The students, who mentioned the lack of financial resources as a reason for discontinuing their studies also stated the need to find the relevant amounts.
The activities of the university were mentioned earlier as a factor that attracted the students towards completing the study process. Therefore, the activities and steps the students expected from the university were explored more closely. The majority of the students who had dropped out of their studies found that both individual and group counselling would be needed and several students who only had to complete their thesis proposed the formation of a “support group” in order to conduct the research process and prepare the thesis under the instruction of the university. In addition, the students wished to receive e-mail notification from the university on various topics, which would help maintain ties with the university and force students to pull themselves together and complete the study process.
Results
Previous research has highlighted a number of factors that force students to drop out of their studies. The reasons vary across curricula and age and also depend on whether the students have to pay for their studies themselves or someone else is paying for the studies. The decision to drop out is also influenced by the level of the students’ academic and social integration. The objective of this survey was to analyse the reasons for dropping out among students studying tourism at the University of Tartu, Pärnu College.
The survey showed that the student expectations are relatively modest upon commencing their studies – the students are more able to set expectations for themselves and less for other factors (the school, the curriculum, the teaching staff and fellow students). Students with previous work or university experience have higher expectations, while students enrolling in PHE non-distance studies tend to come to school and only then start discovering what is being offered. In order for the expectations of the students and the university to match in relation to the study process, expectations should be mapped both at the beginning of studies and during studies. Based on the mapping results, both individual and group counselling should be provided, involving both non-academic and academic staff. The latter makes it possible to increase the level of integration between the teaching staff and the students.
The survey results indicated that the level of academic and social integration among the students was high during studies, but at the same time, the students claimed that after academic leave their ties with the university had broken, which means that the integration was relatively superficial. If the students only have to do the final thesis in order to complete their curriculum, they do not know who to turn to because their integration with the academic staff is only based on ties established within their course group. Extra-course communication is considered unacceptable and non-academic staff are not always able to help if the matter concerns the content of their studies.
In order to complete their studies, students do not only need intrinsic motivation, but also extrinsic push and pull factors; for example, the employer’s recognition upon graduation, or finishing the higher education as a prerequisite to employment. The latter is not often required in the tourism sector and there are many jobs with lower requirements, where the knowledge and skills obtained in higher education are not necessary. Pull factors include the university taking the initiative to contact students who have dropped out of their studies and to provide them with personal counselling, if necessary. The participants in the survey would also like to continue receiving information about the study process after discontinuing their relationship with the university and to have an overview of how their fellow students are doing (when the final thesis has to be submitted, who defended their thesis successfully etc.). The distribution of such information is rather passive, but the formation of support groups for preparing the final thesis was also discussed – the university would help get the students back on track with their research and, if necessary, provide a schedule on the basis of which the students would be able to defend their thesis on time.
This survey had its limitations. In order to adequately assess why students decide to drop out of their studies, they should be surveyed immediately after they have made the decision – memories and feelings fade over time and several of the statements are not actual reasons, but only a reflection of what they would have liked to see as the reasons. Furthermore, students who graduate should be surveyed in parallel. A comparison of the two groups would make it possible to determine similarities and differences. This survey involved students who had completed more than 60% of their curriculum, but students who drop out of their studies earlier – in the first or second academic year – should also be surveyed.
It can be concluded on the basis of this survey that the main risk group in the discontinuation of studies is made up of students who failed to prepare their final thesis on time – they drop out of their studies because they do not manage to finish their thesis in the nominal period and their ties with the university weaken or break after academic leave and they can no longer find their way back to the academic world.
References
Argentin, G., & Triventi, M. (2011). Social inequality in higher education and labour market in a period of institutional reforms: Italy, 1992-2007. Higher Education, 61(3), 309-323.
Breier, M. (2010). From "financial consideration" to "poverty": towards a reconceptualisation of the role of finances in higher education student drop out. Higher Education(60), 657-670.
Kingston, E. (2008). Emotional competence and drop-out rates in higher education. Education & Training, 50(2), 128-139.
Lassibille, G., & Gomez, N. (2008). Why do higher education students drop out? Evidence from Spain. Education Economics, 16(1), 89-105.
Lowis, M., & Castley, A. (2008). Factors affecting student progression and achievement: prediction and intervention. A teo-year study. Innovations in Education and Teaching International, 45(4), 333-343.
Mannan, M. A. (2007). Student attrition and academic and social integration: Application of Tinto's model at the University of New Guinea. Higher Education(53), 147-165.
Riigikogu. (2006, November 22). Eesti riikliku turismiarengukava aastateks 2007–2013 kinnitamine. Retrieved May 25, 2012, from Riigi Teataja: https://www.riigiteataja.ee/akt/12755212
Stratton, L. S., O'Toole, D. M., & Wetzel, J. N. (2008). A multinomial logic model of college stopout and dropout behaviour. Economics of Education Review(27), 319-331.
Tinto, V. (1975). Dropout of Higher Education: A Theoretical Synthesis of Recent Research. Review of Educational Research, 45(1), 89-125.
Tinto, V. (1993). Leaving College: Rethinking the Causes and Cures of Student Attrition (2nd ed.). Chicago: University Of Chicago Press.
ASSESSING THE COMPETENCIES NEEDED BY HOSPITALITY MANAGEMENT GRADUATES IN INDIA
Li-Ting (Grace) Yang, Ph.D.*
Charles G. Partlow, Ph.D. School of Hotel, Restaurant and Tourism Management
University of South Carolina, Columbia, SC 29208, U.S.A. [email protected]
Jaisree Anand, Ph.D.
Vimal Shukla Hospitality Studies
Auro University, Gujarat, India
ABSTRACT This study was designed to assess the importance of generic and technical managerial competencies needed by hospitality management graduates in India from the perspectives of industry practitioners and educators. This study used a questionnaire to survey industry professionals and educators in India. Results of this research identified six dimensions of generic managerial competencies and seven dimensions of technical managerial competencies. The difference between industry professional and educator perceptions of the importance of managerial competencies were further identified. The respondents also determined whether the managerial competencies should be addressed in educational programs or industry training. Results of this study would help higher education programs to develop curricula that better prepare graduates for positions within the industry. Moreover, the hospitality industry would be better prepared to develop training programs to further enhance the professional development of its workforce in India. Key Words: Generic managerial competencies, Technical managerial competencies, Hospitality management graduates
INTRODUCTION
As hospitality management education in India continues to grow and develop as an academic discipline, concerns remain regarding many aspects of program quality; primary among them is the preparation of graduates for careers in the industry (Chand, 2008; Jauhari, 2006). Hotel Valuation Services (HVS) (2012) estimated that approximately 102,348 new hotel rooms will be added into the Indian hotel market by 2016. Along with the rapid expansion of the hospitality industry, the industry is expected to confront a potential demand of 60,000 – 70,000 skilled employees in the next two to three years (Janve, 2011). Whereas the number of hospitality management programs and hospitality graduates continuously increase, Janve (2011) reported that hospitality management graduates from many educational programs in India lack the necessary skill sets and that many hotels must provide in-house training programs to better prepare recent graduates. Thus, a research study that examines the relative importance of competencies needed by hospitality graduates from both industry professionals and educators perspectives would allow educational institutes to develop curricula that better prepare graduates for positions within the industry. Moreover, the hospitality industry, through an understanding of competencies needed by hospitality graduates, would be better prepared to develop training programs to further enhance the professional development of its workforce. Purpose of Study
The purpose of this research is to assess the importance of competencies needed by hospitality management graduates from the perspectives of industry practitioners and educators. Results of the study will have implications for hospitality education regarding curriculum development and for the hospitality industry regarding development of training programs. Results of this study will provide educators and practitioners with the information they need to help improve the quality of the workforce within the hospitality industry in India. The objectives of the study are to:
1) Assess the relative importance of managerial competencies needed by hospitality graduates from the perspectives of both industry practitioners and educators;
2) Determine the difference between industry practitioner and educator perceptions of the importance of managerial competencies;
3) Identify which competencies should be addressed by hospitality educational programs and which ones should be provided by industry training programs;
4) Provide recommendations for curriculum development in hospitality management programs.
LITERATURE REVIEW The review of literature starts with the definition of competencies and proceeds to descriptions of what
hospitality education and industry training encompasses. Finally, the literature associated with managerial competencies analyses in the hospitality and tourism industry is reviewed.
Roles of Hospitality Education and Industry Training
Knight and Yorke (2003) identified four major directions of higher education: (1) gaining a qualification for a specific job; (2) preparing for a job; (3) developing life skills and learning how to think; and (4) growing as an individual with personal intellectual growth and lifelong learning. They further emphasized the importance of higher education in providing graduates with the understandings, skills, and personal attributes necessary to perform adequately in a graduate-level job. Millar et al. (2010) pointed out that four-year hospitality programs at the university level focus on preparing students for management positions in the hospitality industry, while two-year hospitality programs at the community college/technical school level focus on teaching students hands-on skills necessary to begin working in entry-level positions in the hospitality industry.
Ford and Kraiger (1995) defined the role of industry training as two-fold: (1) reduce or eliminate
present deficits in knowledge, skills, and attitudes to improve job performance; and (2) develop new competencies which will enhance job content innovation, employability, and career development. Thus, while education prepares students to begin their careers in an industry, industry training provides immediate and direct assistance for graduates to fit into the work environment, improve knowledge and skills to meet the company’s standards, and advance their careers within the industry.
Competencies and Competency Assessment in Hospitality Management
Brophy and Kiely (2002) defined competencies as consisting of skills, abilities, knowledge, behavior, and attitudes. The foundation of acquiring any competency is related to an individual’s traits and characteristics (U.S. Department of Education, 2002). Although each individual has different characteristics and may learn differently, students can learn skills, abilities, and knowledge in school and take them into the work place (Millar, Mao & Moreo, 2010).
Since the 1980s, numerous studies have focused on assessment of the competencies needed by
hospitality graduates from industry professionals, educators, and students’ perspectives. Tas (1988) surveyed hotel managers to identify their perspectives on the competencies needed by hospitality management graduates. He found that hotel managers rated problem solving, communication skills, human relations with customers and employees, and professional appearance as most important. In the 1990s, researchers found that hospitality managers rated competencies related to leadership, communications, problem solving, and human resources management as being most important for hospitality management graduates (Ashley et al., 1995; Baum, 1990; Hsu & Gregory, 1995; Okeiyi, Finley, & Postel, 1994; Siu, 1998; Su, Miller, & Shanklin, 1997). Still more studies in the 2000s found that hospitality managers specified that the most important competencies for hospitality graduates to possess include leadership, economics, financial management, information technology, interpersonal communications, customer relationship management, strategic management, cultural diversity, and self-management (Chung-Herrera, Enz, & Laukau, 2003; Kay & Russette, 2000; Kriegl, 2000; Nelson & Dopson, 2001; Tesone & Ricci, 2006). A preponderance of the research shows that competency needs have changed over time with the changes of the market, customers, technology, and workforce. Thus, in order to equip graduates with adequate and up-to-date competencies, educators and industry professionals need to continuously explore the competency needs for hospitality graduates and communicate with one another (Millar et al., 2010).
Generic and Technical Managerial Competency Assessment
Kanungo and Misra (1992) were among the first to suggest a framework for classifying managerial competencies that would improve the sufficiency of traditional competency structure. They identified two categories of managerial competencies: (1) generic managerial competencies, which include capability of self-management in job development, attitudes, motivation, personal characteristics and personality traits; and (2) technical managerial competencies, which refer to the knowledge and skills enabling managers to effectively perform in specific areas of management such as finance and accounting, marketing, customer service management, and quality management.
Agut, et al. (2003) used the generic and technical managerial competency structure to assess
competency needs and training demands for hospitality managers in Spain. They interviewed and surveyed 80 Spanish hospitality managers. Generic managerial competencies were tested using 22 items within three
dimensions, namely job performance efficiency, self-control and social relationships, and proactive behavior. Results of the generic managerial competency needs analysis indicated a high need in self-control and social relationships and job performance efficiency. Technical managerial competencies were tested using 15 items in specific areas of management. Results of the technical managerial competency needs analysis showed that the highest needs were in economic-financial management and computing. When comparing the present training needs and the future training demands, the results showed that managers request present and future training in economic-financial management and foreign language competencies.
Horng et al. (2011) employed a managerial competency analysis to determine competencies needed by
top managers in Taiwan. They interviewed and surveyed 25 hotel top managers to investigate the importance of 58 generic managerial competencies and 49 technical managerial competencies. Results of the generic managerial competencies analysis indicated that the five most important competency dimensions were leadership, crisis management, problem-solving, communication, and personal relationships. Results of the technical managerial competencies analysis showed that the five most important competency dimensions were financial management, business and marketing, field management, human resources, and information technology. They also reported that cultural difference, environmental changes, and change over time with the industry environment were considered as influential components of the competency needs. These findings were consistent with those of Boyatzis (1982, 2008, 2009), Le Deist and Winterton (2005), and Spencer & Spencer (1993), who pointed out that countries with different cultures emphasize certain aspects for analyzing managerial competencies. Overall, Horng et al. (2011) found that hospitality practitioners considered generic competencies more important than technical competencies. This finding confirms the conclusions by Knight and Yorke (2002), who reported that industry practitioners believe that generic competencies are important for individuals to cope with industry and market changes and succeed in the industry.
METHODOLOGY A preliminary questionnaire was developed based on previous research on managerial competencies of
hospitality management professionals, one by Agut, et al. (2003) and the other by Horng, et al. (2011). The questionnaire consisted of three sections: 32 generic managerial competencies, 36 technical managerial competencies, and demographic information. An open-end question was included in each competency group to ask respondents to specify any competency item they believe to be important but not included in the survey. Respondents were also asked to indicate whether each competency should be addressed in hospitality education programs, industry training, or a combination of both. A group of hospitality educators in India reviewed the questionnaire and made recommendations for changes. The final version of the questionnaire was distributed to hospitality educators and industry professionals in India by direct mail, email and in person at several industry and academic conferences.
Data analyses involving several procedures were conducted by using SPSS 19. Principal component
factor analyses and Multivariate Analysis of Variance (MANOVA) were used to identify the number of dimensions (factors) and understand the associations between different demographics of respondents in generic and technical managerial competencies.
PRELIMINARY RESULTS Profile of Respondents The survey questionnaire was administered in the spring of 2012. Approximately 1,270 copies of questionnaires were distributed, while 517 industry professionals and hospitality educators replied to the survey. Among 517 respondents, 482 respondents completed the survey and were included in the study. The valid response rate was 37.95%.
Among the 482 respondents, the majority were male (67.2%), aged 20-39 (81.5%), with a 4-year university degree (37.8%). Around 81% of the respondents had majored in hospitality and tourism management. Approximately 68.5% were hospitality managers and 31.5% were hospitality educators.
Generic and Technical Managerial Competencies
The principal component factor analyses were conducted on 32 generic managerial competencies and 36 technical managerial competencies. The Kaiser-Meyer-Olkin (KMO) measure of sampling adequacy (0.936) indicated that the factor analysis was considered highly appropriate. The significance of Bartlette’s test of Sphericity was less than 0.005. Therefore, there was a correlation among variables. The 32 generic managerial competencies produced six factors, namely “Leadership”, “Self-management”, “Human Relationship and Legal Aspects”, “Crisis Management and Stress Management”, “Dedication to Career” and “Adaptability and Professional Ethics”. The 36 technical managerial competencies produced seven factors, namely “Financial
Management”, “Globalization and Culture”, “Health, Hygiene and Sustainability”, “Operations and Strategic Planning”, “Customer Service and Training”, “Marketing Strategy and Revenue Management”, and “Creativeness and Innovation”. Reliability for each of the factors was assessed by Cronbach’s alpha, which ranged from 0.80 to 0.87. The measurement of managerial competencies had an acceptable internal consistency.
The relationship between the dimensions of managerial competencies and the respondents’
demographic variables were tested using MANOVA. The post hoc test was used to investigate the differences among the groups of demographic variables.
The preliminary results of the study indicate: 1) Industry professionals and hospitality educators perceived the importance of competencies
significantly different. 2) Over 50% of the respondents agreed that the identified generic and technical managerial
competencies should be addressed by both hospitality education programs and industry training. The results of follow-up analyses were further discussed in detail.
CONCLUSION AND IMPLICATIONS
The purpose of the study is to assess the importance of generic and technical managerial competencies needed by hospitality graduates in India. Results of this study show that industry managers and educators perceived the importance of generic and technical managerial competencies significantly different. It indicates that industry professionals and hospitality educators need to communicate with each other more constantly and work closely to prepare students with necessary and up-to-date managerial competencies. When comparing the results of this research to the study by Jauhari (2006), the results are somewhat similar to his identified competencies. This study, however, provides more specific competency items, especially with regard to generic managerial competencies. As the industry is continually changing, the results of this study should give the industry and higher education in India an up-to-date outlook of the managerial competency requirements.
This research also found that the majority of industry professionals and educators indicated the
identified managerial competencies should be addressed by both educational programs and industry training. That is, both industry professionals and educators should have a better understanding of sharing the responsibility for preparing hospitality graduates. While higher education prepares students with graduate employability, the hospitality industry provides direct and immediate training and support to help graduates success in the industry. The recommendations for the industry and higher education were discussed in detail. Limitations and Future Research
This study has several limitations. Since the survey only gathered quantitative data, the researchers were unable to explore the respondents’ thoughts and opinions of the managerial competencies. Second, the survey was self-administered; therefore, the respondents may not have been familiar with each competency and ranked competencies according to their own best guess. Third, the survey was designed in English; therefore, the respondents may not have the same level of English command and would misinterpret some competencies. Fourth, this research focused on merely the hospitality management education and the hospitality industry in India. It doesn’t intend to make a comparison of the managerial competencies needed by Indian hospitality graduates with those by other countries’ graduates. Fifth, the impact of national culture on managerial competencies has been recognized in this research; however, the cultural impact on managerial competencies was not included in this particular study.
Future research is recommended that uses this managerial competency model to interview industry
professionals and educators to gain in-depth information on competency needs. A qualitative study of the cultural impact on managerial competencies is suggested. Moreover, future research should be conducted to better understand the roles of industry training and higher education programs in preparing hospitality graduates to enter the industry. This will help the hospitality industry and higher education to have a better understanding of how to work together to improve the quality of the hospitality workforce in India.
REFERENCES Agut, S., Grau, R., & Peiro, J.M. (2003). Competency needs among managers from Spanish hotel and
restaurants and their training demands. International Journal of Hospitality Management, 22, 281-295. Ashley, R.A., Bach, S.A., Chesser, J. W., Ellis, E.T., Ford, R.C., Lebruto, S. M., Milman, A., Pizam, A., & Quain,
W. J. (1995). A customer-based approach to hospitality education. Cornell Hotel and Restaurant Administration Quarterly, 36(4), 74-79.
Baum, T. (1990). Competencies for hotel management: Industry expectations of education. International Journal of contemporary Hospitality Management, 2(4), 13-16.
Boyatzis, R.E. (1982). The Competent Manager: A Model for Effective Performance, Wiley, New York, NY. Boyatzis, R.E. (2008). Competencies in the twenty-first century. Journal of Management Development, 27 (1),
5-12. Boyatzis, R.E. (2009). Competencies as a behavioral approach to emotional intelligence. Journal Management
Development, 28 (9), 749-770. Brophy, M., & Kiely, T. (2002). Competencies: A new sector. Journal of European Industrial Training, 26 (2),
124-145. Chand, M. (2008). Managers’ perception of hotel management curricula in India: An exploratory study. Journal
of Tourism, 60(2), 99-116. Chung-Herrera, B.G., Enz, C.A., & Laukau, M.J. (2003). Grooming future hospitality leaders: A competencies
model. Cornell Hotel and Restaurant Administrati9on Quarterly, 44(3), 17-25. Ford, J.K., & Kraiger, K. (1995). The implications of cognitive constructs and principles to the instructional
systems model of training: Implications for needs assessment, design, and transfer. In Cooper, C.L., Robertson, I.T. (Eds.), International Review of Industrial and Organizational Psychology. Wiley & Sons, Chichester.
Horng, J.S., Hsu, H., Liu, C.H., Lin, L., & Tsai, C.Y. (2011). Competency analysis of top managers in the Taiwanese hotel industry. International Journal of Hospitality Management, 30 (4), 1044-1054.
Hotel Valuation Service (HVS) (2012). Indian Hotel Industry Survey, 2010-2011, Retrieved from: http://www.hvs.com/Content/3216.pdf
Hsu, J. F., & Gregory, S.R. (1995). Developing future hotel managers in Taiwan: From an industry viewpoint. International Journal of Hospitality Management, 14(3/4), 261-269.
Janve, R.S. (2011). Shortage of management grads dogs hotel industry. Retrieved from: http://www.mydigitalfc.com/print/93562?utm_source=hospitalitynet&utm_medium=newsletter
Jauhari, V. (2006). Competencies for a career in the hospitality industry: An Indian perspective. International Journal of Contemporary Hospitality Management, 18(2), 123-134.
Kanungo, R. N., & Misra, S. (1992). Managerial resourcefulness: A reconceptualization of management skills. Human Relations. 45(12), 1311-1332.
Kay, C., & Russette, J. (2000). Hospitality management competencies: Identifying managers’ essential skills. Cornell Hotel and Restaurant Administration Quarterly, 41(2), 52-63.
Knight, P.T. & Yorke, M. (2002). Employability through the curriculum. Tertiary Education and management, 8, 261-276.
Knight, P.T. & Yorke, M. (2003). Employability and good learning in higher education. Teaching in Higher Education, 8 (1), 3-16.
Kriegl, U. (2000). International hospitality management: Identifying important skills and effective training. Cornell Hotel and Restaurant Administration Quarterly, 41(2), 64-71.
Le Deist, F. D., & Winterton, J. (2005). What is competence? Human Resource Development International, 8(1), 27-46.
Millar, M., Mao, Z., & Moreo, P. (2010). Hospitality and tourism educator vs. the industry: A competency assessment. Journal of Hospitality and Tourism Education, 22(2), 38-50.
Nelson, A. A., & Dopson, L. (2001). Future of hotel education: Required skills and knowledge for graduates of U.S. hospitality programs beyond the year 2000- part one. Journal of Hospitality and Tourism Education, 13(5), 58-67.
Okeiyi, E., Finley, D., & Postel, R. T. (1994). Food and beverage management competencies: Educator, industry and student perspectives. Hospitality and Tourism Educator, 6(4), 37-40.
Siu, V. (1998). Management by competencies: A study on the managerial competencies of hotel middle managers in Hong Kong. International Journal of Hospitality Management, 17(3), 253-273.
Spencer, L.M. Jr. & Spencer, S.M. (1993). Competence at Work: Models for Superior Performance, Wiley, New York, NY.
Su, A.Y., Miller, J., & Shanklin, C. (1997). Perceptions of industry professionals and program administrators about accreditation curriculum standards, for hospitality programs. Journal of Hospitality and Tourism Education, 9(4), 36-40.
Tas, R. (1988). Teaching future managers. Cornell Hotel and Restaurant Administration Quarterly, 29(2), 41-43.
Tesone, D.V., & Ricci, P. (2006). Toward a definition of entry-level job competencies: Hospitality manager perspectives. International Journal of Hospitality and Tourism Administration, 7(4), 71-86.
U. S. Department of Education, National Center for Education Statistics (2002). Defining and Assessing Learning: Exploring Competency-Bases Initiatives. Washington, D.C.
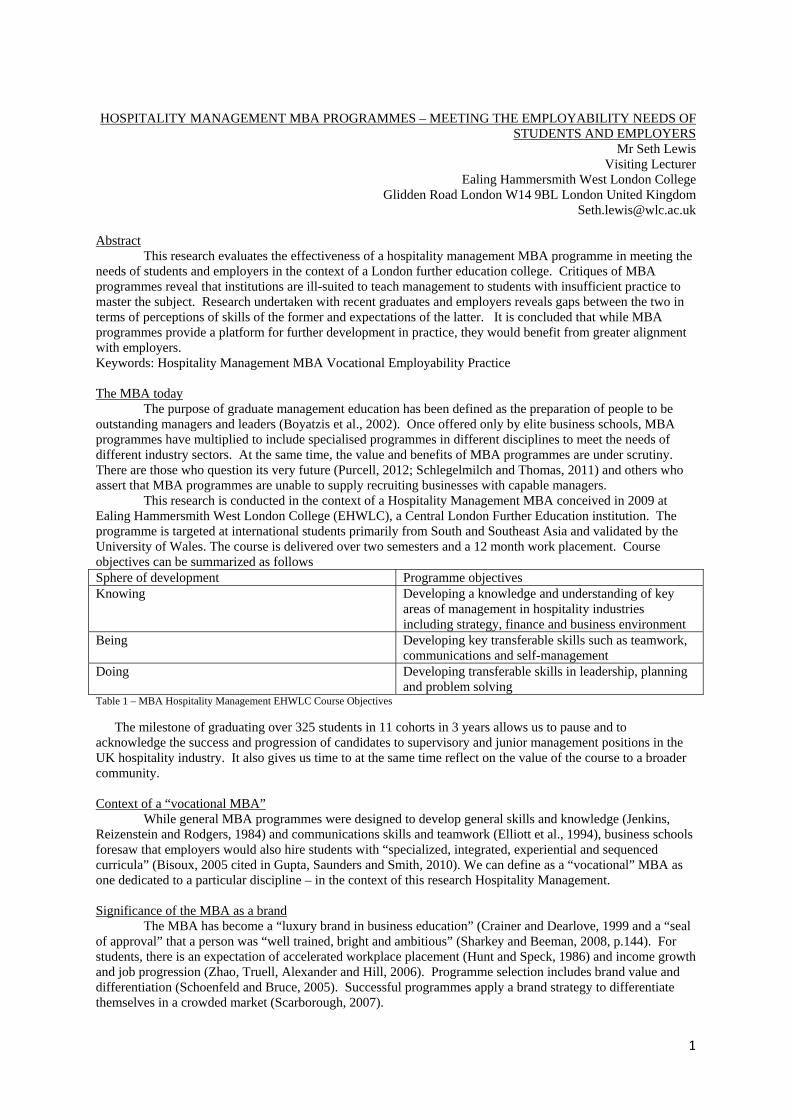
1
HOSPITALITY MANAGEMENT MBA PROGRAMMES – MEETING THE EMPLOYABILITY NEEDS OF
STUDENTS AND EMPLOYERS Mr Seth Lewis
Visiting Lecturer Ealing Hammersmith West London College
Glidden Road London W14 9BL London United Kingdom [email protected]
Abstract This research evaluates the effectiveness of a hospitality management MBA programme in meeting the
needs of students and employers in the context of a London further education college. Critiques of MBA programmes reveal that institutions are ill-suited to teach management to students with insufficient practice to master the subject. Research undertaken with recent graduates and employers reveals gaps between the two in terms of perceptions of skills of the former and expectations of the latter. It is concluded that while MBA programmes provide a platform for further development in practice, they would benefit from greater alignment with employers.
Keywords: Hospitality Management MBA Vocational Employability Practice
The MBA today The purpose of graduate management education has been defined as the preparation of people to be
outstanding managers and leaders (Boyatzis et al., 2002). Once offered only by elite business schools, MBA programmes have multiplied to include specialised programmes in different disciplines to meet the needs of different industry sectors. At the same time, the value and benefits of MBA programmes are under scrutiny. There are those who question its very future (Purcell, 2012; Schlegelmilch and Thomas, 2011) and others who assert that MBA programmes are unable to supply recruiting businesses with capable managers.
This research is conducted in the context of a Hospitality Management MBA conceived in 2009 at Ealing Hammersmith West London College (EHWLC), a Central London Further Education institution. The programme is targeted at international students primarily from South and Southeast Asia and validated by the University of Wales. The course is delivered over two semesters and a 12 month work placement. Course objectives can be summarized as follows Sphere of development Programme objectives Knowing Developing a knowledge and understanding of key
areas of management in hospitality industries including strategy, finance and business environment
Being Developing key transferable skills such as teamwork, communications and self-management
Doing Developing transferable skills in leadership, planning and problem solving
Table 1 – MBA Hospitality Management EHWLC Course Objectives
The milestone of graduating over 325 students in 11 cohorts in 3 years allows us to pause and to acknowledge the success and progression of candidates to supervisory and junior management positions in the UK hospitality industry. It also gives us time to at the same time reflect on the value of the course to a broader community.
Context of a “vocational MBA”
While general MBA programmes were designed to develop general skills and knowledge (Jenkins, Reizenstein and Rodgers, 1984) and communications skills and teamwork (Elliott et al., 1994), business schools foresaw that employers would also hire students with “specialized, integrated, experiential and sequenced curricula” (Bisoux, 2005 cited in Gupta, Saunders and Smith, 2010). We can define as a “vocational” MBA as one dedicated to a particular discipline – in the context of this research Hospitality Management.
Significance of the MBA as a brand
The MBA has become a “luxury brand in business education” (Crainer and Dearlove, 1999 and a “seal of approval” that a person was “well trained, bright and ambitious” (Sharkey and Beeman, 2008, p.144). For students, there is an expectation of accelerated workplace placement (Hunt and Speck, 1986) and income growth and job progression (Zhao, Truell, Alexander and Hill, 2006). Programme selection includes brand value and differentiation (Schoenfeld and Bruce, 2005). Successful programmes apply a brand strategy to differentiate themselves in a crowded market (Scarborough, 2007).
2
Values and purposes of an MBA
The overriding aim of MBA programmes is to develop better managers (Baruch, 2009). More practical perspectives on what an MBA should provide can be seen in a framework of “knowing” “doing” and “being” (Datar, Garvin and Cullen, 2010). Without application, knowledge is of little value, and without “being skills”, ethical and professional action is difficult. A competencies model has been established by Rubin and Dierdorff (2006) – these include managing the following: decision making processes; human capital; strategy and innovation; task management; administration and control and logistics and technology. Challenges to the MBA construct
Various authors have questioned the value, relevance or effectiveness of MBA programs and curricula (Jain and Stopford, 2011; Martin, Heppard and Green, 2011; Boyatzis and Saatcioglu, 2007; Bennis and O’Toole, 2005; Gabriel, 2005; Grey, 2004; Kretovics, 1999; Mintzberg, 2005; Navarro, 2008; Pfeffer and Fong, 2002; Porter and McKibbin, 1998; ). In the most basic terms, these critiques put into question whether MBA programmes teach the right people the right things at the right time the right way and whether they meet the needs of employers.
The most fundamental challenge is on the very notion of management itself. Boyatzis (1995) sees management as an unnatural act but one for which managers can be prepared in the classroom. Mintzberg (2005, p. 1) sees management as “a practice that has to blend a good deal of craft (experience) with a certain amount of art (insight) and some science (analysis)” , as a set of fundamentally soft skills rooted in “experience, wisdom and judgement” (Mintzberg, 2005, p. 267). With this perspective, Mintzberg’s (2005) view is that most MBA programmes serve students who want to leap ahead of their peers but who lack the maturity or experience of real life workplace situations which is where management happens and really is learned.
In a dramatically changing environment, it is perceived that MBA programmes have gaps in areas such as business ethics, culture, effective teamwork, writing (Millhauser and Rahschulte, 2010)
Measuring the effectiveness of graduate education
Various attempts have been made to measure the effectiveness of MBA programmes. Media surveys reflect earnings of graduates from well-known branded programmes. A number of outcome surveys have been conducted (Winter et al., 1981; Mentkowski et al., 2000; Pascarella and Terenzini, 1991; Banta, 1993). The most frustrating of these - Porter and McKibbin’s (1988) study suggests that MBA courses were not meeting the needs and expectations of employers. Graduate education and the hospitality industry
There is an unresolved debate in hospitality education between the vocational and the academic (Connolly and McGing, 2006). Research is divided between the traditional hand-on development path in the industry (Fuller, 1983; Baum, 1989) which favoured leadership and motivation skills and a view that modern hospitality managers would require a wider range of business skills (Kaplan, 1982; Goodman and Spragues, 1991) and even an MBA (Swanljung, 1981). Research methods
This research was conducted using both secondary and primary research. Questionnaires were distributed electronically to a pragmatic sample of 50 recent MBA graduates, 6 employers, and 5 tutors. Questions were designed to establish how far graduates felt they had progressed in the areas of “knowing” – having an understanding of their firm’s objectives, business environment, and mastery of finance; “being” – communication, self-management and teamwork skills; and “doing” – leading people, problem solving, managing change and marketing. Similar questions were asked of employers and tutors to establish how far the MBA would take them as they entered full-time practice. We hypothesize that students think that they are better equipped than they are, tutors feel that students can always do better, and employers have higher expectations for employees thatn
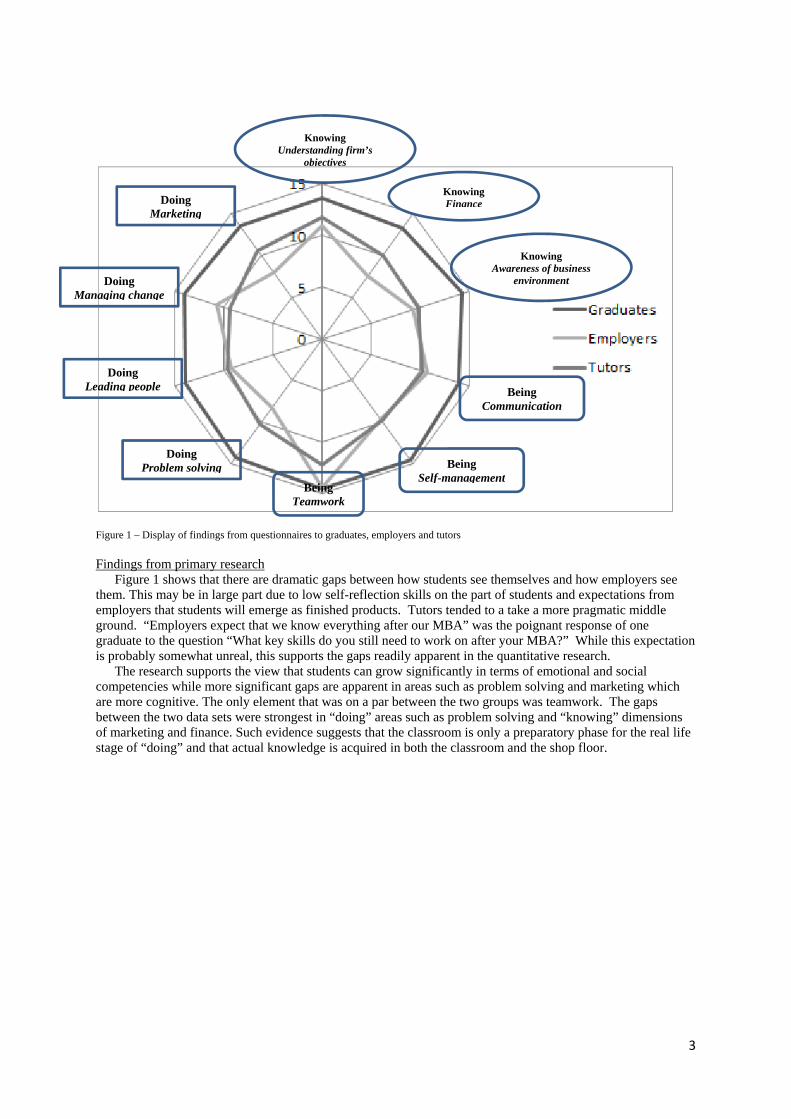
3
Figure 1 – Display of findings from questionnaires to graduates, employers and tutors
Findings from primary research Figure 1 shows that there are dramatic gaps between how students see themselves and how employers see
them. This may be in large part due to low self-reflection skills on the part of students and expectations from employers that students will emerge as finished products. Tutors tended to a take a more pragmatic middle ground. “Employers expect that we know everything after our MBA” was the poignant response of one graduate to the question “What key skills do you still need to work on after your MBA?” While this expectation is probably somewhat unreal, this supports the gaps readily apparent in the quantitative research.
The research supports the view that students can grow significantly in terms of emotional and social competencies while more significant gaps are apparent in areas such as problem solving and marketing which are more cognitive. The only element that was on a par between the two groups was teamwork. The gaps between the two data sets were strongest in “doing” areas such as problem solving and “knowing” dimensions of marketing and finance. Such evidence suggests that the classroom is only a preparatory phase for the real life stage of “doing” and that actual knowledge is acquired in both the classroom and the shop floor.
Doing Marketing
Doing Managing change
Doing Leading people
Doing Problem solving
Being Teamwork
Being Self-management
Being Communication
Knowing Understanding firm’s
objectives
Knowing Awareness of business
environment
Knowing Finance
4
Conclusions
With the controversy around the purpose, value and even survival of the MBA today (Martin, 2002; Purcell, 2012), one is forced to question whether commercially or pedagogically our path is current and correct. The evidence from the current research supports the tendency that MBA programmes are commercial enterprises, now appealing to a wide range of markets which create a foundation for but do not fully develop young managers for the challenges they will face in practice.
Mintzberg’s (2005) view that management cannot be taught purely as a science is supported here. Hospitality management is an area that requires both “soft” and “hard” skills. This research suggests that students’ development in a first instance lies in softer skills – communication, team work, self- management – important workplace leadership qualities, while the harder skills – problem solving, making decisions around finance, marketing, people will emerge later on as they are put into practice.
The programme in question has no doubt considered the cultural background of students and created a setting where international students can begin to develop critical skills in both the classroom and the workplace. Most graduates are now working at supervisory and junior management level in a range of branded businesses or working towards setting up their own businesses in the UK or their home countries. In this case, the MBA helps to serve the hospitality industry and a broader stakeholder base towards a better world. It has served to support the development of Higher Education learning in the college, meet commercial outcomes and set the stage for the validation of additional specialised MBA programmes.
The views of this research are from a pragmatic sample. With further input from employers – whose needs evolve continuously - the outputs of the programme with future cohorts can evolve significantly.
Mintzberg (2005) also believes that students may come out with MBA degrees but lack the necessary experience gained in practice. This research hypothesizes in support of Mintzberg (2005) that the skills that employers and tutors feel are less developed in graduates will increase significantly as they gain experience in the workplace were we to revisit the same students and the same employers in the future.
All employees enter the workplace with a range of classroom knowledge and practical skills acquired in the workplace. Employers seeing the MBA as a “badge of quality” or a “halo effect” make assumptions that students will emerge from graduate management programmes with a range of being – knowing – doing competences. The reality is that they will like any new employee have some element of a blank slate about them. The likelihood is that their skills will develop more quickly with the MBA as a foundation. Recommendations for academic practice
Short and medium term steps to help bridge the gap between the perceptions of students, employers and tutors would include:
o To address areas of “knowing” and “doing”, one could foresee a more integrated working relationship with
a few key employer partners. In practical terms this would mean more frequent visits by tutors into the work placement environment and the creation of a “work placement” module with a formal assessment.
o The application in certain modules – notably strategy and operations management, of learning diaries where students would record how key concepts are applied to their workplace. Taking a view that “what gets measured gets done”, this kind of exercise would need to be assessed.
o While we would not want a specialised hospitality management programme to solely serve one type of enterprise, there will be value in aligning marketing and strategy case and problem solving tasks to those issues facing managers today. Greater use of recent or “live” case studies can be promoted.
Recommendations for future research
There is limited research with graduates on how much they have learned on an MBA programme is actually used in real life – in one year, in two years, in five years. If there is limited research on the output of MBA programmes, there is equally little research on how MBA programmes might support the development of future hospitality managers. This lack of evidence would engage the researcher to ask the following questions
o How do MBA graduates and their employers see the evolution of their skills and the impact of their MBA qualifications after 1 year, 2 years, and 5 years in the workplace?
o What modules do MBA graduates find most relevant to their workplace in 1 year, 2 years, and 5 years? o How do MBA graduates continue to develop and refresh management competencies over time? Do they do so
at the same rate, in different ways from non-MBA graduates? o How do hotel General Managers who have pursued MBA degrees view the impact of a post-graduate
qualification on the industry today? o What support and value do MBA graduates derive from degree provider alumni networks?
5
List of references Barron, P. (2008). Education and Talent Management: Implications for the Hospitality Industry. International
Journal of Contemporary Hospitality Management, 20(7) 730-742. doi:10.1108/095961110810897583 Baruch, Y. (2009). To MBA or Not to MBA. Career Development International, 14(4) 388-406.
doi:10.1108/136204030910979862 Blass, E. and Weight, P. (2005).The MBA is Dead – Part 1: God Save the MBA! On the Horizon, 13(4) 229-
240. doi: 10.1108/10748120510627358 Bledsoe, M. and Oatsvall, R. (2009). Graduates: Perceptions of MBA Value. American Journal of Business
Education, 2(2) 1-6. Retrieved from Clute. Boyatzis, R.E. and Saatcioglu, A. (2007). A 20-year View of Trying to Develop Emotional, Social and
Cognitive Intelligence Competencies in Graduate Management Education. Journal of Management Development, 27(1) 92-108. doi:10.1108/02621710810840785
Connolly, P. and McGing, G. (2006). Graduate Education and Hospitality management in Ireland. International Journal of Contemporary Hospitality Management, 18(1) 50-59. doi: 10.1108/095961110610641975
Brookes, M. and Becket, M. (2010). Internationalising Hospitality Management Degree Programmes. International Journal of Contemporary Hotel Management, 23(2) 241-260. Retrieved from Emerald.
Datar, S.M., Cullen, P.G. and Garvin, D.A. (2010). Rethinking the MBA: Business Education at a Crossroads [Kindle version] Boston: Harvard Business Press.
Gupta, P., Saunders, P. and Smith, J. (2010). Traditional Master of Business Administration (MBA) Versus the MBA with Specialisation: A Disconnection between What Business Schools Offer and What Employers Seek. Journal of Education for Business, 82(6) 307-312. doi:10.3200/JOEB.82.6.307-312
Hinds, T., Falgoust, D., Thomas, Jr., K. and Budden, M. (2010). Examining the Perceptions of Brand Images Regarding Competing MBA Programmes. American Journal of Business Education, 3(12) 7-18. Retrieved from Clute
Jain, S. and Stopford, J. (2011) Revamping MBA Programmes for Global Competitiveness Business Horizons54 345-53.doi:10.1016/j.bushor2011.03.001
Kelan, E. and Jones, R. (2009). Reinventing the MBA as a Rite of Passage for a Boundaryless Era. Career Development International, 14(6) 547-569. doi:10.1108/13620430910997295
Kretovics, M. (1999). Assessing the MBA What do our students learn? Journal of Management Development 18(2) 125-136. doi:10.1108/EUM0000000004550
Martin, J., Heppard, K. and Green, S. (2011) Taking international business educations to new heights: Fundamental questions for educators and students Business Horizon 54:355-363. doi:10.1016/j.bushor2011.03.001
Martin, T. (2002, March 9). To MBA or not to MBA The Guardian. Retrieved from UK NewsStand Mintzberg, H. (2005). Managers not MBAs: A Hard Look at the Soft Practice of Managing and Management
Development [Kindle version] San Francisco: Berrett-Koehler. Purcell, J. (2012, April 16). Rip Up the Existing MBA and start Afresh. Financial Times. Retrieved from UK
NewsStand. Rubin, R. and Dierdorff, E. (2009) How Relevant is the MBA? Assessing the Alignment of Required Curricula
and Required Managerial Competencies Academy of Management Learning & Education 8(2) pp. 208-224 Retrieved from Clute
Schlegelmilch, B. and Thomas, H. (2011). The MBA in 2020: Will There Still Be One? Journal of Management Development, 30(5) 474-482 doi:10.1108/02621711111132984
Sharkey, T. and Beeman, D. (2008). On the Edge of Hypercompetition in Education: the case of the MBA On the Horizon 16(3) 143-151. doi:10.1108/10748120810901440
EXPERIENTIAL LEARNING THEORY (ELT) PERSPECTIVE:
THE CASE OF GAP YEAR TRAVEL RESEARCH
Novie Johan
School of Hospitality and Tourism Management, University of Surrey Guildford, Surrey GU2 7XH, United Kingdom
Abstract
While Gap Year Travel (GYT) is a popular concept, limited research has been done in the area especially those pertaining its learning potential. Using the Experiential Learning Theory (ELT) by Kolb (1984), this study examines the experience of the young people who just recently completed their trips. This study involves two in-depth interviews with each of the 25 young gappers of age 17-30 years; the data was then processed by using thematic analysis technique. The findings of this study clearly suggest that the four stages of ELT (Concrete Experience, Reflective Observation, Abstract Conceptualization and Active Experimentation) are highly applicable in the case of gap year travel research, although its applications vary by individual and experience.
Key Words: Experiential Learning, Gap Year Travel, Young Gappers, In-depth Interviews, Thematic Analysis Technique.
1
The Impact of Summer Study Abroad on Students’ Venturesomeness: An Examination Using Plog’s Psychographic Personality Types
Makarand Mody
Purdue University West Lafayette, Indiana
Susan Gordon Purdue University
West Lafayette, Indiana [email protected]
Howard Adler, Ed.D Professor
Purdue University West Lafayette, Indiana [email protected]
Xinran Lehto, PhD Professor
Purdue University West Lafayette, Indiana
Abstract
The purpose of this research is to examine the impact of the intercultural and personal development benefits acquired during a short-term study abroad program on a specific psychographic trait, students’ future travel behavior, as measured by Plog’s notion of venturesomeness. Additionally, the moderating impact of cultural distance on this relationship will be analyzed. Students participating in a short-term study abroad program (eight weeks or less) at a large Midwestern University will be surveyed prior to their departure and again upon completion of the program. It is expected that the intercultural and personal development benefits acquired during the study abroad experience will have a significant mediational effect on student venturesomeness; and these relationships are expected to be stronger under conditions of higher cultural distance. Preliminary results from the pre-study abroad survey are presented. Key Words: study abroad, travel behavior, cultural benefits, personal development benefits
Introduction The proliferation of study abroad programs in American universities has been well documented; a phenomenon fuelled by the exponential growth of short-term, culture-based learning programs. According to a 2011 Open Doors Report by the Institute of International Education (2011a), 270,604 US students studied abroad in 2009/10, a 3.9% increase over the prior year, with Europe being the most popular study abroad location (54%), followed by Latin America (15%), Asia (12%), Africa (6%), Oceania (5%), and the Middle East (2%). The short-term program (summer or eight weeks or less) was the most popular with students (56.6%), while 39.4% participated in a mid-length program (1 or 2 quarters or 1 semester), and 3.9% spend an academic or calendar year abroad (long-term program) (Institute of International Education, 2011a). This significant growth of the short-term offering has been attributed to a variety of academic, social, college policy and economic reasons (Dwyer & Peters, 2004). They not only appeal to a wider student base, but also require relatively little prior linguistic and cultural preparation, thereby representing “the fasted growing sector in the field” (Szekely, 1997, as cited in Engle & Engle, 2003, p. 3) with nearly two decades of steady growth (Fischer, 2010). While short-term programs have been criticized for a lack of academic rigor, there is a general consensus that they provide significant intercultural and personal development benefits, particularly to first-time students. However, much of the evidence is anecdotal, and there has been little quantifiable research on the skills and traits that students develop as a result of these programs and how these apply to life today (Rundstrom-Williams, 2005). Additionally, McLeod and Wainwright (2009) call “for rigorous scientific assessment of study abroad programs, with the focus being on how study abroad experiences affect psychological constructs, as opposed to looking solely at study abroad related outcomes” (p. 66).
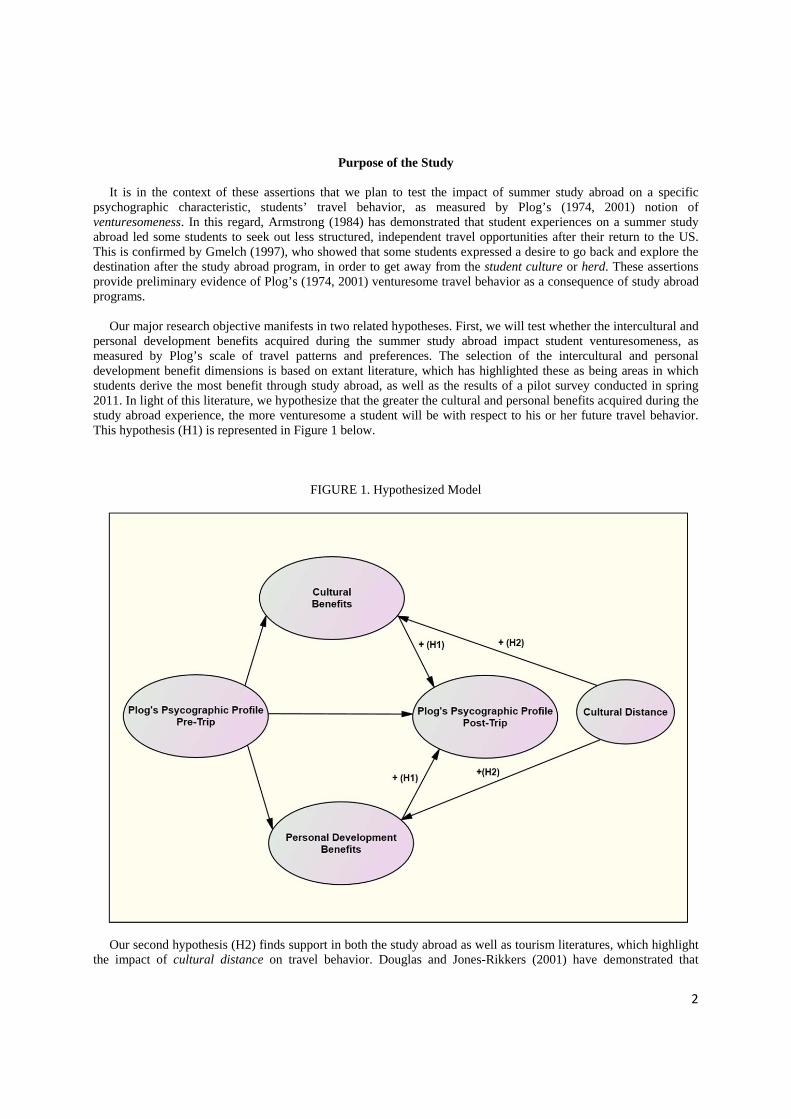
2
Purpose of the Study
It is in the context of these assertions that we plan to test the impact of summer study abroad on a specific psychographic characteristic, students’ travel behavior, as measured by Plog’s (1974, 2001) notion of venturesomeness. In this regard, Armstrong (1984) has demonstrated that student experiences on a summer study abroad led some students to seek out less structured, independent travel opportunities after their return to the US. This is confirmed by Gmelch (1997), who showed that some students expressed a desire to go back and explore the destination after the study abroad program, in order to get away from the student culture or herd. These assertions provide preliminary evidence of Plog’s (1974, 2001) venturesome travel behavior as a consequence of study abroad programs. Our major research objective manifests in two related hypotheses. First, we will test whether the intercultural and personal development benefits acquired during the summer study abroad impact student venturesomeness, as measured by Plog’s scale of travel patterns and preferences. The selection of the intercultural and personal development benefit dimensions is based on extant literature, which has highlighted these as being areas in which students derive the most benefit through study abroad, as well as the results of a pilot survey conducted in spring 2011. In light of this literature, we hypothesize that the greater the cultural and personal benefits acquired during the study abroad experience, the more venturesome a student will be with respect to his or her future travel behavior. This hypothesis (H1) is represented in Figure 1 below.
FIGURE 1. Hypothesized Model
Our second hypothesis (H2) finds support in both the study abroad as well as tourism literatures, which highlight the impact of cultural distance on travel behavior. Douglas and Jones-Rikkers (2001) have demonstrated that
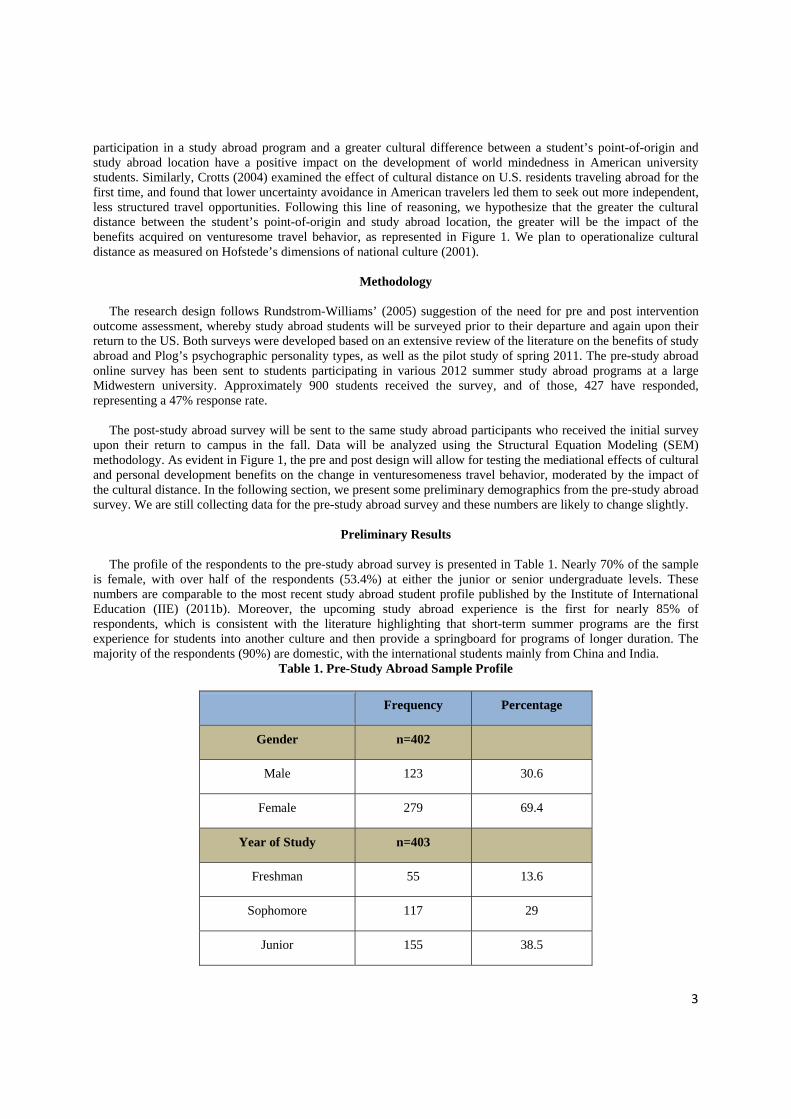
3
participation in a study abroad program and a greater cultural difference between a student’s point-of-origin and study abroad location have a positive impact on the development of world mindedness in American university students. Similarly, Crotts (2004) examined the effect of cultural distance on U.S. residents traveling abroad for the first time, and found that lower uncertainty avoidance in American travelers led them to seek out more independent, less structured travel opportunities. Following this line of reasoning, we hypothesize that the greater the cultural distance between the student’s point-of-origin and study abroad location, the greater will be the impact of the benefits acquired on venturesome travel behavior, as represented in Figure 1. We plan to operationalize cultural distance as measured on Hofstede’s dimensions of national culture (2001).
Methodology
The research design follows Rundstrom-Williams’ (2005) suggestion of the need for pre and post intervention outcome assessment, whereby study abroad students will be surveyed prior to their departure and again upon their return to the US. Both surveys were developed based on an extensive review of the literature on the benefits of study abroad and Plog’s psychographic personality types, as well as the pilot study of spring 2011. The pre-study abroad online survey has been sent to students participating in various 2012 summer study abroad programs at a large Midwestern university. Approximately 900 students received the survey, and of those, 427 have responded, representing a 47% response rate. The post-study abroad survey will be sent to the same study abroad participants who received the initial survey upon their return to campus in the fall. Data will be analyzed using the Structural Equation Modeling (SEM) methodology. As evident in Figure 1, the pre and post design will allow for testing the mediational effects of cultural and personal development benefits on the change in venturesomeness travel behavior, moderated by the impact of the cultural distance. In the following section, we present some preliminary demographics from the pre-study abroad survey. We are still collecting data for the pre-study abroad survey and these numbers are likely to change slightly.
Preliminary Results
The profile of the respondents to the pre-study abroad survey is presented in Table 1. Nearly 70% of the sample is female, with over half of the respondents (53.4%) at either the junior or senior undergraduate levels. These numbers are comparable to the most recent study abroad student profile published by the Institute of International Education (IIE) (2011b). Moreover, the upcoming study abroad experience is the first for nearly 85% of respondents, which is consistent with the literature highlighting that short-term summer programs are the first experience for students into another culture and then provide a springboard for programs of longer duration. The majority of the respondents (90%) are domestic, with the international students mainly from China and India.
Table 1. Pre-Study Abroad Sample Profile
Frequency Percentage
Gender n=402
Male 123 30.6
Female 279 69.4
Year of Study n=403
Freshman 55 13.6
Sophomore 117 29
Junior 155 38.5
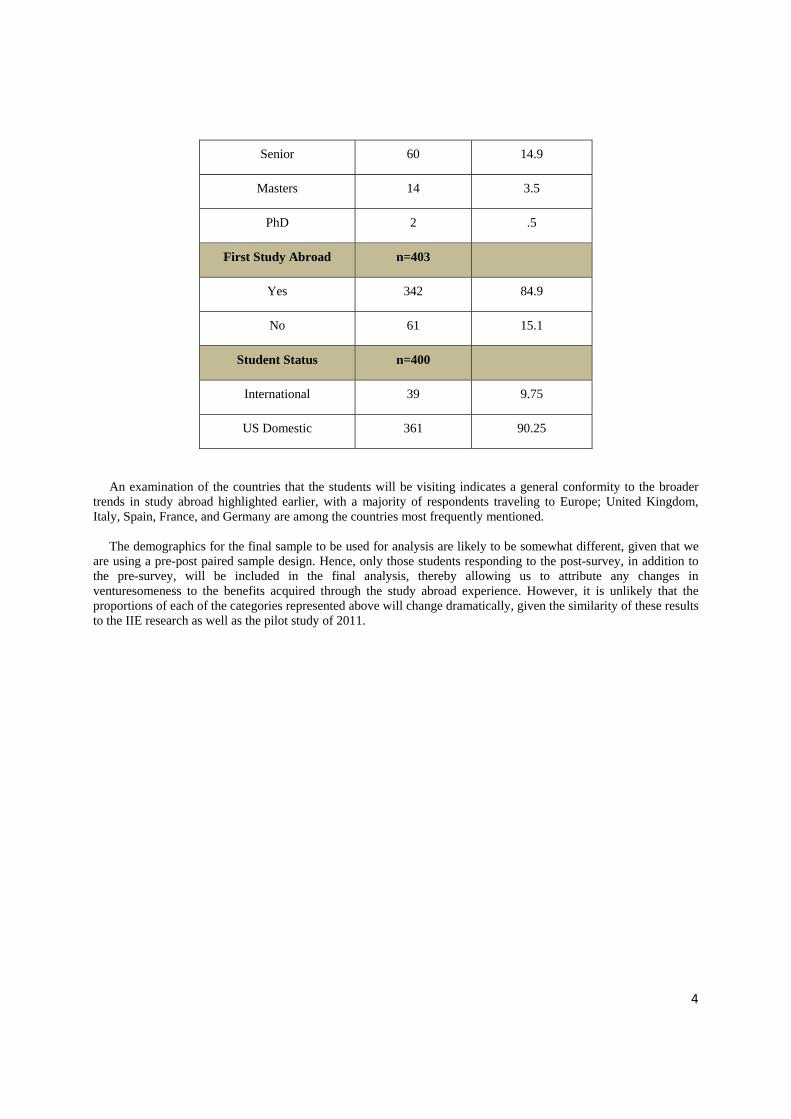
4
Senior 60 14.9
Masters 14 3.5
PhD 2 .5
First Study Abroad n=403
Yes 342 84.9
No 61 15.1
Student Status n=400
International 39 9.75
US Domestic 361 90.25
An examination of the countries that the students will be visiting indicates a general conformity to the broader trends in study abroad highlighted earlier, with a majority of respondents traveling to Europe; United Kingdom, Italy, Spain, France, and Germany are among the countries most frequently mentioned. The demographics for the final sample to be used for analysis are likely to be somewhat different, given that we are using a pre-post paired sample design. Hence, only those students responding to the post-survey, in addition to the pre-survey, will be included in the final analysis, thereby allowing us to attribute any changes in venturesomeness to the benefits acquired through the study abroad experience. However, it is unlikely that the proportions of each of the categories represented above will change dramatically, given the similarity of these results to the IIE research as well as the pilot study of 2011.
5
References Armstrong, G. (1984). Life after Study Abroad: A Survey of Undergraduate Academic and
Career Choices. The Modern Language Journal, 68(1), 1-6. Crotts, J. C. (2004). The Effect of Cultural Distance on Overseas Travel Behaviors. Journal of
Travel Research, 43, 83-88. Douglas, C., & Jones-Rikkers, C.G. (2001). Study Abroad Programs and American Student
Worldmindedness. Journal of Teaching in International Business, 13(1), 55-63. Dwyer, M., & Peters, C. (2004). The Benefits of Study Abroad. Transitions Abroad Magazine.
Engle, J., & Engle, L. (2003). Study Abroad Levels: Toward a Classification of Program Types. Frontiers: The
Interdisciplinary Journal of Study Abroad, 9(1), 1-20. Fischer, K. (2010, November 15). Students Pull Back on Short-Term Study Abroad, Forcing Colleges to Adapt. The Chronicle of Higher Education. Gmelch, G. (1997). Crossing cultures: Student travel and personal development. International
Journal of Intercultural Relations, 21(4), 475-490. Hofstede, G.H. (2001). Culture's Consequences: Comparing Values, Behaviors, Institutions,
and Organizations Across Nations (2nd ed.). Thousand Oaks, CA: Sage Publications Inc. Institute of International Education. (2011a, November 14). Open Doors 2011 Fast Facts.
Retrieved from http://www.iie.org/Research-and-Publications/Open-Doors/Data/Fast-Facts.
Institute of International Education. (2011b). US Study Abroad: Student Profile. Retrieved from http://www.iie.org/Research-and-Publications/OpenDoors/Data/US-Study-Abroad/Student-Profile/2000-10
McLeod, M., & Wainwright, P. (2009). Researching the Study Abroad Experience. Journal of Studies in International Education, 13(1), 66-71.
Plog, S.C. (1974). Why destination areas rise and fall in popularity. Cornell Hotel and Restaurant Quarterly, 14 (4), 55–58. Plog, S.C. (2001). Why destination areas rise and fall in popularity: An update of a Cornell
Quarterly Classic. Cornell Hotel and Restaurant Quarterly, 42(3), 13–24. Rundstrom-Williams, T. (2005). Exploring the Impact of Study Abroad on Students’ Intercultural Communication Skills: Adaptability and Sensitivity. Journal of Studies in International Education, 9(5), 356-371.
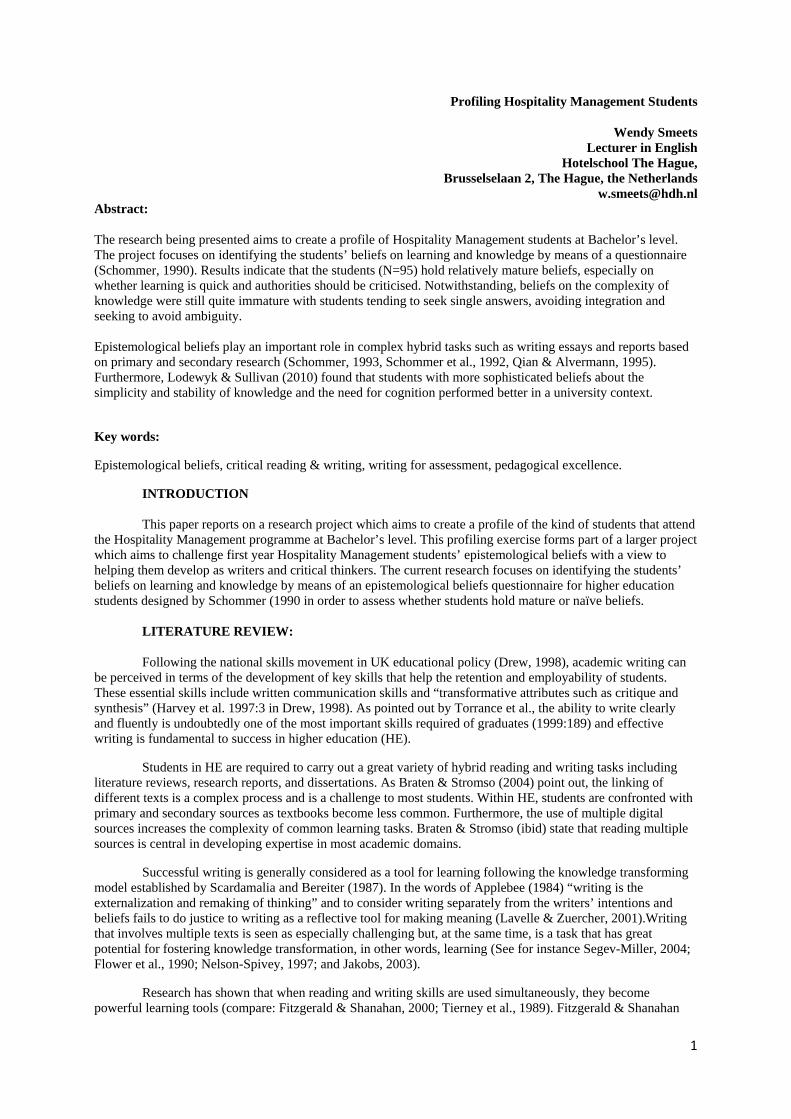
1
Profiling Hospitality Management Students
Wendy Smeets Lecturer in English
Hotelschool The Hague, Brusselselaan 2, The Hague, the Netherlands
[email protected] Abstract:
The research being presented aims to create a profile of Hospitality Management students at Bachelor’s level. The project focuses on identifying the students’ beliefs on learning and knowledge by means of a questionnaire (Schommer, 1990). Results indicate that the students (N=95) hold relatively mature beliefs, especially on whether learning is quick and authorities should be criticised. Notwithstanding, beliefs on the complexity of knowledge were still quite immature with students tending to seek single answers, avoiding integration and seeking to avoid ambiguity. Epistemological beliefs play an important role in complex hybrid tasks such as writing essays and reports based on primary and secondary research (Schommer, 1993, Schommer et al., 1992, Qian & Alvermann, 1995). Furthermore, Lodewyk & Sullivan (2010) found that students with more sophisticated beliefs about the simplicity and stability of knowledge and the need for cognition performed better in a university context.
Key words:
Epistemological beliefs, critical reading & writing, writing for assessment, pedagogical excellence.
INTRODUCTION
This paper reports on a research project which aims to create a profile of the kind of students that attend the Hospitality Management programme at Bachelor’s level. This profiling exercise forms part of a larger project which aims to challenge first year Hospitality Management students’ epistemological beliefs with a view to helping them develop as writers and critical thinkers. The current research focuses on identifying the students’ beliefs on learning and knowledge by means of an epistemological beliefs questionnaire for higher education students designed by Schommer (1990 in order to assess whether students hold mature or naïve beliefs.
LITERATURE REVIEW:
Following the national skills movement in UK educational policy (Drew, 1998), academic writing can be perceived in terms of the development of key skills that help the retention and employability of students. These essential skills include written communication skills and “transformative attributes such as critique and synthesis” (Harvey et al. 1997:3 in Drew, 1998). As pointed out by Torrance et al., the ability to write clearly and fluently is undoubtedly one of the most important skills required of graduates (1999:189) and effective writing is fundamental to success in higher education (HE).
Students in HE are required to carry out a great variety of hybrid reading and writing tasks including literature reviews, research reports, and dissertations. As Braten & Stromso (2004) point out, the linking of different texts is a complex process and is a challenge to most students. Within HE, students are confronted with primary and secondary sources as textbooks become less common. Furthermore, the use of multiple digital sources increases the complexity of common learning tasks. Braten & Stromso (ibid) state that reading multiple sources is central in developing expertise in most academic domains.
Successful writing is generally considered as a tool for learning following the knowledge transforming model established by Scardamalia and Bereiter (1987). In the words of Applebee (1984) “writing is the externalization and remaking of thinking” and to consider writing separately from the writers’ intentions and beliefs fails to do justice to writing as a reflective tool for making meaning (Lavelle & Zuercher, 2001).Writing that involves multiple texts is seen as especially challenging but, at the same time, is a task that has great potential for fostering knowledge transformation, in other words, learning (See for instance Segev-Miller, 2004; Flower et al., 1990; Nelson-Spivey, 1997; and Jakobs, 2003).
Research has shown that when reading and writing skills are used simultaneously, they become powerful learning tools (compare: Fitzgerald & Shanahan, 2000; Tierney et al., 1989). Fitzgerald & Shanahan
2
(2000:43) state that “reading and writing encourage different enough cognitive operations that they offer alternative perspectives that can give rise to new learning or appreciation”. Nelson-Spivey (1997) similarly describes discourse synthesis as both comprehending and composing as the writer uses cues from more than one text to construct meaning for the text being written.
Epistemological beliefs are beliefs a person has, often implicitly, on knowledge and learning (Hofer & Pintrich, 1997; Schommer et al., 1992) such as whether learning is quick, if knowledge is certain, and whether the source of knowledge lies with authorities. These beliefs are thought to form part of a student’s system of metacognition and are, therefore, believed to have an impact on academic performance, reading comprehension, comprehension monitoring, interpretation of information and persistence in the face of a difficult task amongst others (Schommer 1990, 1992 & 1993; Qian & Alvermann, 1995). Lodewyk (2007) found that belief in simple knowledge had an impact on students’ approaches to ill-structured tasks, whereas Braten et al (2008) found an impact of beliefs on the approach of tasks using multiple versus single texts.
Lodewyk & Sullivan (2010) found that students with more sophisticated beliefs about the simplicity and stability of knowledge and the need for cognition performed better in a university context. Trautwein & Ludtke (2006) confirmed the impact of belief in certainty of knowledge on school achievement and choice of subject area at college. Schommer’s 1990 study found that epistemological beliefs had an impact on reading comprehension, evaluation of sources and confidence. Further studies have confirmed links to text processing and comprehension (Kardash & Howell, 2000; Schommer, Crouse & Rhodes, 1992; Schommer & Walker, 1995; Schommer-Aikins & Easter, 2004; Schraw et al., 2002; Schraw & Bruning, 1996) generally indicating that naive epistemological beliefs are related to poorer text comprehension and text processing. Furthermore, beliefs in omniscient authority and concepts of fixed ability to learn were found to be negatively related to learning outcome (Bendixen & Hartley, 2003).
Ryan (1984a) and Schommer (1990, 1993a, 1993b) found that epistemological beliefs had an impact on text comprehension. Personal epistemology is, furthermore, thought to play a more important role when students are working on complex tasks such as writing from multiple sources (Bendixen (2010), Hartley & Bendixen, 2001; Spiro et al., 1996; Qian & Alvermann, 1995). This was confirmed by Stahl et al. (1996) who found that sophisticated epistemological beliefs are required to understand multiple sources. This finding was reiterated by Braten & Stromso’s 2004 and 2006 research results which indicated that readers with naive epistemological beliefs had more difficulty building a deep understanding of multiple sources.
Epistemological beliefs have also been linked to student writing. Ryan (1984a, 1984b) found that students with relativistic (sophisticated) beliefs wrote texts with better internal coherence. Similarly, Schommer et al. (1992) found that belief in simple-complex knowledge relates to highly interrelated texts with students who believe in complex knowledge obtaining better study results. Qian & Alvermann (1995) suggest that beliefs about knowledge also relate to the type of conclusion students draw with students who believe in certain knowledge being more likely to draw absolute conclusions based on tentative information.
The above suggests that beliefs on knowledge and knowing are often an obstacle in achieving success in Higher Education not the least because most assessments are in the form of writing based on multiple sources. As such, it is essential that students’ epistemological beliefs are targeted in academic skills instruction.
AIM AND OBJECTIVES:
Objectives:
The outcome of the profiling exercise will be used to determine whether the students hold mature or immature beliefs. This information will then be taken into consideration while designing an adequate study support programme with a view to facilitating the transition to more mature epistemological beliefs. One of the objectives is to develop and deliver an intervention that teaches referencing skills to challenge students’ beliefs on authoritative and certain knowledge (following Hendricks & Quinn, 2000). This should allow our students to work more effectively on tasks involving multiple texts to achieve deeper understanding and produce written products with better referencing practices thus better equipping them for writing for assessment.
METHODOLOGY:
The aim of the current project was to assess whether first year Hospitality Management students hold mature or immature beliefs with regard to knowledge and learning.
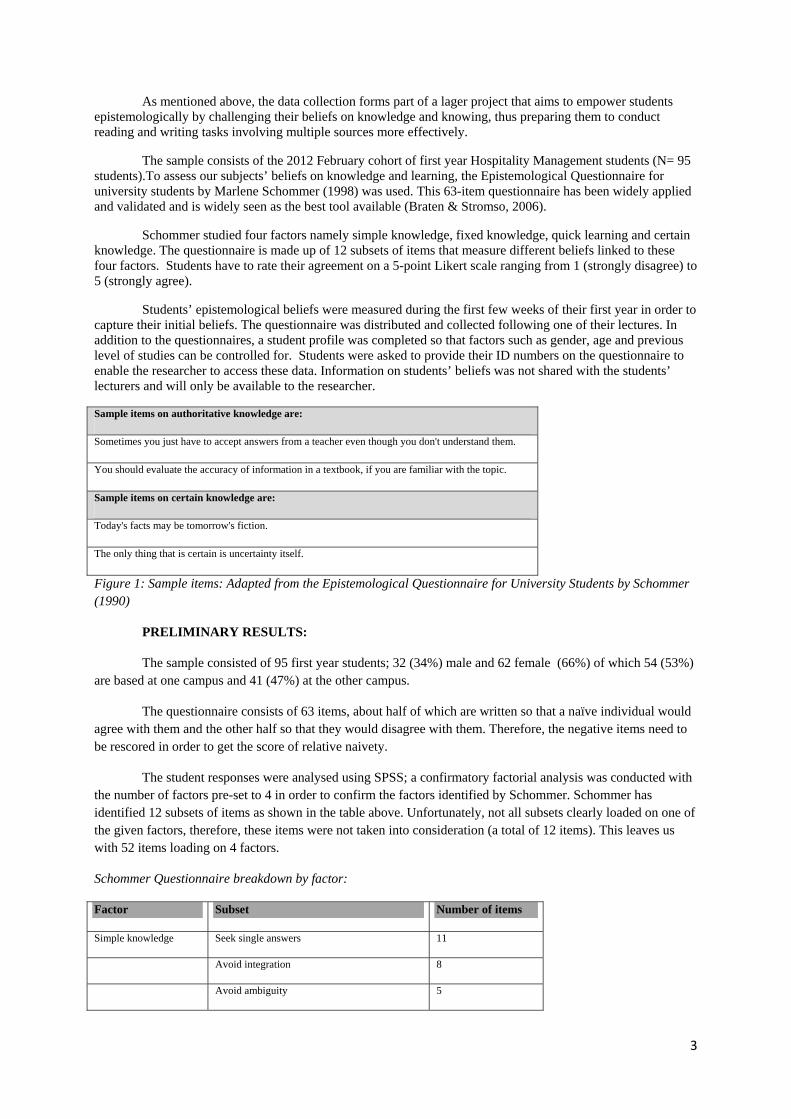
3
As mentioned above, the data collection forms part of a lager project that aims to empower students epistemologically by challenging their beliefs on knowledge and knowing, thus preparing them to conduct reading and writing tasks involving multiple sources more effectively.
The sample consists of the 2012 February cohort of first year Hospitality Management students (N= 95 students).To assess our subjects’ beliefs on knowledge and learning, the Epistemological Questionnaire for university students by Marlene Schommer (1998) was used. This 63-item questionnaire has been widely applied and validated and is widely seen as the best tool available (Braten & Stromso, 2006).
Schommer studied four factors namely simple knowledge, fixed knowledge, quick learning and certain knowledge. The questionnaire is made up of 12 subsets of items that measure different beliefs linked to these four factors. Students have to rate their agreement on a 5-point Likert scale ranging from 1 (strongly disagree) to 5 (strongly agree).
Students’ epistemological beliefs were measured during the first few weeks of their first year in order to capture their initial beliefs. The questionnaire was distributed and collected following one of their lectures. In addition to the questionnaires, a student profile was completed so that factors such as gender, age and previous level of studies can be controlled for. Students were asked to provide their ID numbers on the questionnaire to enable the researcher to access these data. Information on students’ beliefs was not shared with the students’ lecturers and will only be available to the researcher.
Sample items on authoritative knowledge are:
Sometimes you just have to accept answers from a teacher even though you don't understand them.
You should evaluate the accuracy of information in a textbook, if you are familiar with the topic.
Sample items on certain knowledge are:
Today's facts may be tomorrow's fiction.
The only thing that is certain is uncertainty itself.
Figure 1: Sample items: Adapted from the Epistemological Questionnaire for University Students by Schommer (1990)
PRELIMINARY RESULTS:
The sample consisted of 95 first year students; 32 (34%) male and 62 female (66%) of which 54 (53%) are based at one campus and 41 (47%) at the other campus.
The questionnaire consists of 63 items, about half of which are written so that a naïve individual would agree with them and the other half so that they would disagree with them. Therefore, the negative items need to be rescored in order to get the score of relative naivety.
The student responses were analysed using SPSS; a confirmatory factorial analysis was conducted with the number of factors pre-set to 4 in order to confirm the factors identified by Schommer. Schommer has identified 12 subsets of items as shown in the table above. Unfortunately, not all subsets clearly loaded on one of the given factors, therefore, these items were not taken into consideration (a total of 12 items). This leaves us with 52 items loading on 4 factors.
Schommer Questionnaire breakdown by factor:
Factor Subset Number of items
Simple knowledge Seek single answers 11
Avoid integration 8
Avoid ambiguity 5
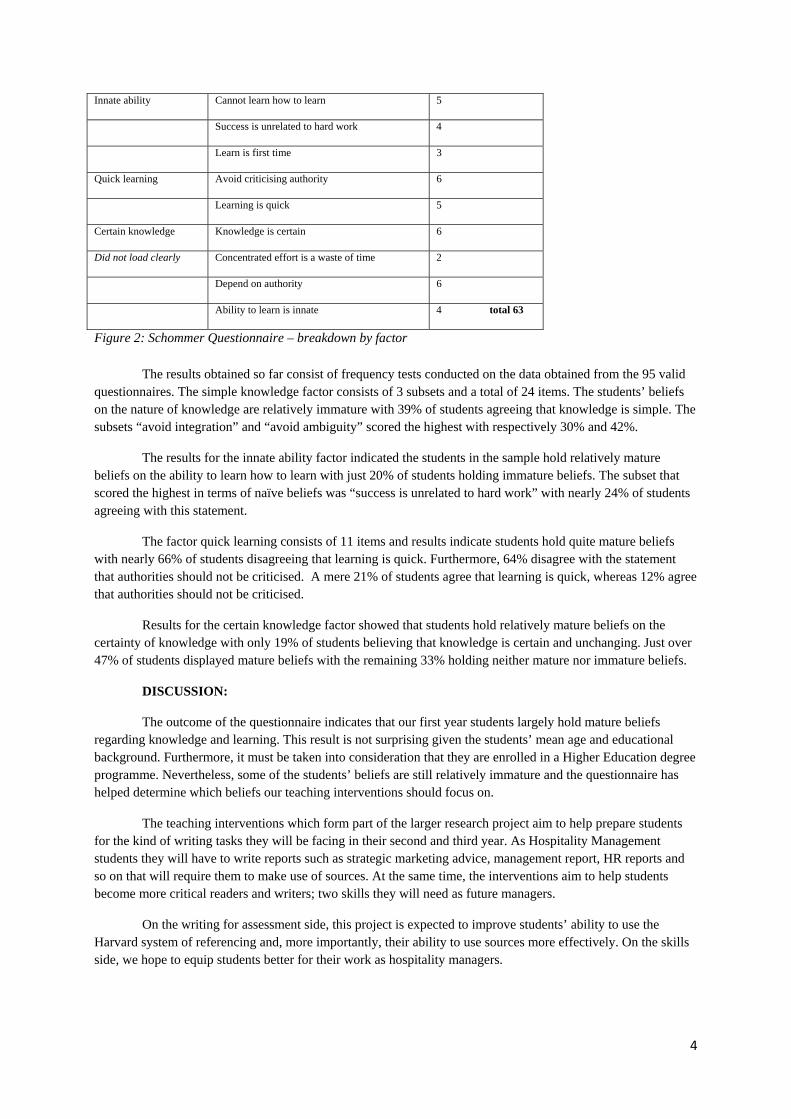
4
Innate ability Cannot learn how to learn 5
Success is unrelated to hard work 4
Learn is first time 3
Quick learning Avoid criticising authority 6
Learning is quick 5
Certain knowledge Knowledge is certain 6
Did not load clearly Concentrated effort is a waste of time 2
Depend on authority 6
Ability to learn is innate 4 total 63
Figure 2: Schommer Questionnaire – breakdown by factor
The results obtained so far consist of frequency tests conducted on the data obtained from the 95 valid questionnaires. The simple knowledge factor consists of 3 subsets and a total of 24 items. The students’ beliefs on the nature of knowledge are relatively immature with 39% of students agreeing that knowledge is simple. The subsets “avoid integration” and “avoid ambiguity” scored the highest with respectively 30% and 42%.
The results for the innate ability factor indicated the students in the sample hold relatively mature beliefs on the ability to learn how to learn with just 20% of students holding immature beliefs. The subset that scored the highest in terms of naïve beliefs was “success is unrelated to hard work” with nearly 24% of students agreeing with this statement.
The factor quick learning consists of 11 items and results indicate students hold quite mature beliefs with nearly 66% of students disagreeing that learning is quick. Furthermore, 64% disagree with the statement that authorities should not be criticised. A mere 21% of students agree that learning is quick, whereas 12% agree that authorities should not be criticised.
Results for the certain knowledge factor showed that students hold relatively mature beliefs on the certainty of knowledge with only 19% of students believing that knowledge is certain and unchanging. Just over 47% of students displayed mature beliefs with the remaining 33% holding neither mature nor immature beliefs.
DISCUSSION:
The outcome of the questionnaire indicates that our first year students largely hold mature beliefs regarding knowledge and learning. This result is not surprising given the students’ mean age and educational background. Furthermore, it must be taken into consideration that they are enrolled in a Higher Education degree programme. Nevertheless, some of the students’ beliefs are still relatively immature and the questionnaire has helped determine which beliefs our teaching interventions should focus on.
The teaching interventions which form part of the larger research project aim to help prepare students for the kind of writing tasks they will be facing in their second and third year. As Hospitality Management students they will have to write reports such as strategic marketing advice, management report, HR reports and so on that will require them to make use of sources. At the same time, the interventions aim to help students become more critical readers and writers; two skills they will need as future managers.
On the writing for assessment side, this project is expected to improve students’ ability to use the Harvard system of referencing and, more importantly, their ability to use sources more effectively. On the skills side, we hope to equip students better for their work as hospitality managers.
5
REFERENCES:
Applebee, A.N. (1984) Writing and reasoning. Review of educational research, 54, 577-596.
Bendixen, L.D. & Hartley, K. (2003) Successful learning with hypermedia: the role of epistemological beliefs and metacognitive awareness. Journal of Educational Computing Research, 28, 15-30.
Bendixen, L.D. & Feucht F.C. (2010) Personal epistemology in the classroom: what does research and theory tell us and where do we need to go next? In Personal Epistemology in the Classroom: Theory, research and implactions for practice (2010) Bendixen, L.D. (Ed,) Cambridge: Cambridge University Press, pp. 555-586
Braten, I. & Stromso, H.I. (2004) Epistemological beliefs and the reading of multiple sources. Paper presented at the EARLI SIG meeting on Comprehension of Text and Graphics: Basic and Applied Issues Valencia, Spain September 9-11, 2004.
Drew, S. (1998) Seda Special 6 Key Skills in Higher Education: background and rationale.
Fitzgerald, J. & Shanahan, T. (2000). Reading and writing relations and their development. Educational Psychologist 35(1). 39-50.
Flower, L. et al (1990) Reading to write: exploring a cognitive and social process. New York : Oxford University Press.
Hartley, K. & Bendixen, L.D. (2001) Educational research in the internet age: examining the role of individual characteristics. Educational Researcher, 30, 22-26 (in Braten & Stromso, 2004).
Harvey, L., Moon, S., Geall, V with Bower, R. (1997) Graduates’ work: organisational change and students’ attributes. Birmingham, Centre for Research into Quality.
Hofer, B.K. & P.R. Pintrich (1997) The Development of Epistemological Theories: Beliefs About Knowledge and Their Relation to Learning. Review of Educational Research 67:1. 88-140.
Jakobs, E.-M. (2003). Reproductive writing-writing from sources. Journal of Pragmatics 35. 893-906.
Kardash, C-A. M. & R.J. Scholes (1996) Effects of Preexisting Beliefs, Epistemological Beliefs, and Need for Cognition on Interpretation of Controversial Issues. Journal of Educational Psychology 88:2, 260-271.
Lavelle, E. & Zuercher, N. (2001) The writing approaches of university students. Higher Education, 42, 373-391.
Lodwyk,K & Sullivan, P. (2010) Beliefs about Knowledge, Ability, and Cognition in University Physical Education Students PHENex Journal vol. 2, no. 2, 1-21
Lodewyk, K. R. (2007). Relations among epistemological beliefs, academic achievement, and task performance in secondary school students. Educational Psychology, 27(3), 307-327.
Nelson-Spivey, N. (1997)The constructivist Metaphor: reading, writing, and the making of meaning. San Diego : Academic Press
Ryan, M.P. (1984a). Monitoring text comprehension: Individual differences in epistemological standards. Journal of Educational Psychology, 76:2, 248-258.
Ryan, M.P. (1984b) Conceptions of Prose Coherence: Individual Differences in Epistemological Standards. Journal of Educational Psychology, 76:6, 1226-1238.
Segev-Miller, R. (2004) Writing from sources: the effect of explicit instruction on college students’ processes and products. L1-Educational Studies in Language and Literature 4. 5-33.
Schommer, M. (1990). Effects of beliefs about the nature of knowledge on comprehension. Journal of Educational Psychology, 82(3). 498-504.
Schommer, M. (1993a) Epistemological development and academic performance among secondary students. Journal of Educational Psychology 85:3, 406-411.
6
Schommer, M. (1993b) Comparisons of beliefs about the nature of knowledge and learning among postsecondary students. Research in Higher Education 34:3, 355-370.
Schommer, M.; Crouse, A. & N. Rhodes (1992) Epistemological beliefs and mathematical text comprehension: Believing it is simple does not make it so. Journal of Educational Psychology 84:4. 435-443.
Schommer, M. & K. Walker (1997) Epistemological Beliefs and Valuing School: Considerations for College Admissions and Retention. Research in Higher Education 38:2. 173-186.
Schommer-Aikins, M. & Easter, M. (2004) Epistemological beliefs' contributions to study strategies of Asian Americans and European Americans. Journal of Educational Psychology, Vol 100(4), Nov 2008, 920-929
Schraw, G. & L.D. Bendixen, & M.E. Dunkle (2002) Development and validation of the Epistemological Belief Inventory (EBI) in Hofer, B.K. & Pintrich, P.R. (Eds.) The Psychology of Beliefs About Knowledge and Knowing. Mahwah, NJ: Lawrence Erlbaum Associates, Inc.
Schraw, G. & Bruning, R. (1996). Readers’ implicit models of reading Reading Research Quarterly, 31(3). 290-305.
Spiro, R.J.; Feltovich, P.L. & Coulson, R.L. (1996) Two epistemic world-views: prefigurative schemas and learning in complex domains. Applied Cognitive Psychology, 10, s51-s61.
Qian, G. & D. Alvermann (1995) Role of epistemological beliefs and learned helplessness in secondary school students’ learning science concepts from test. Journal of Educational Psychology, 87:2, 282-292.
Tierney, Soter, O’Flahavan, & McGinely (1989) The effect of reading and writing upon thinking critically. Reading Research Quarterly, 24. 134-173.
Torrance. M., Thomas, G.V., Robin, E.J. (1999) Individual differences in the writing behaviour of undergraduate students British Journal of Educational Psychology, 69, 189-199.
The importance of Hospitality concept within the teaching methods of Vocational College for Catering
and Tourism Maribor
Nataša Artič, MSc Head of Business-to-business Education Center
Vocational College for Catering and Tourism Maribor Zagrebška cesta 18, 2000 Maribor
Helena Cvikl, MSc Professor and Director of Vocational College for Catering and Tourism Maribor
University of Primorska- Faculty for Tourism Studies - Turistica Obala 11 a, 6320 Portorož
Abstract The concept of combining theoretical and practical knowledge is deeply integrated in the educational system of the Vocational College for Catering and Tourism Maribor. The aim of the research was to see, how the education system on the College has implemented the concept of hospitality as personal characteristics, qualities and skills into the teaching methods and how it has been successful in teaching about the concept. The example of school´s practical approach towards teaching about the premises of hospitality is yearly event of “Ambassador of Hospitality”. The purpose of the event is to promote between catering and tourism students the importance of hospitality. The results of the research has shown that more than 50% of students from the pattern change the perception of the “hospitality” since they entered the College and that during the study period they acquired hospitality characteristics, qualities and skills. There is still more to be researched within the topic of “hospitality concept” especially with qualitative research methods. Hospitality premises within educational system The entrance of hospitality into the educational system is relatively young and is positioned in 60´of past century and was consequential (Airey and Tribe, 2000) to the needs of the hospitality industry and professional bodies at this time that were in need for professional hospitality management since the massive tourism destinations across Europe at this time were in decrease. In contrary in tourism field of study the implementation to the higher educational study was easier, since derivation “tourism study” form other existing fields of research (Morrison, 2002) such as sociology, economics, geography and psychology. The absence of scientific approach in hospitality was seen for decades, since there has been from the beginning a lack of approach towards the unification in the definition of hospitality, hospitality industry and hospitality studies. According to Brotherton (1999, p. 168) the “hospitality” was approximately thirty years later defined “as contemporaneous human exchange, which voluntarily entered into, and designed to enhance the mutual well being of the parties concerned through the provision of accommodation, and/or food and/or drink.” Brotherton with Wood (2000) defined the “hospitality industry” as “comprised of commercial organizations that specialize in providing accommodation and/or drink and/or food, through a voluntary human exchange, which is contemporaneous in nature and undertaken to enhance the mutual well being of the parties’ concerned (Brotherton and Wood, 2000, p. 143). The same authors at the same time tried to define the “hospitality management” but they stayed with the label of “hospitality management being only a linguistic label used to describe programs of study, stiles of research and so on prevalent in higher education.” (Morrison, 2002, p. 4). Morrison (2002, p. 4) is labeling the presented approach as disputable, since it is narrowing the scope of hospitality “as being benign force directed at the satisfaction of well-being in its many guises, deflecting research focus from aspects form social exclusion, marginality and control, but it offers coherent parameters within them one can conduct research. Now days all three definitions are not any more synonymous, but clearly diferentiated (O’Gorman, 2007, p. 2). There is a terminological difference between English word “hospitality” and its Slovenian translation “gostoljubje”. Slovenian version is focused on perception of hospitality as personal characteristics, qualities and skills of the people working in hospitality industry and not as bright and complex as hospitality industry overall. For the needs of this article both definitions have been used. The theory, how to state educational parameters, is no longer being questioned (as Morrison, 2002, p. 5). The higher educational system within the hospitality industry has to provide students with theoretical and practical
knowledge form the field of hospitality industry (Moletsane, 2011). In recent years higher educational system giving more importance on development of personal characteristics, qualities and skills of people working in the catering and tourism business. Work integrated knowledge (WIL) is therefore acknowledgeable aspect of student learning process and defined as “learning through experience rather than through books or formal study” (Mothana, 2000). Both parameters of higher education hospitality a curriculum is widely recognized by both academic and industry sectors (Moletsane, 2011, p. 2). Educating for Hospitality at Vocational College for Catering and Tourism Maribor The concept of combining both parameters (theoretical and practical) of education of students is deeply integrated in the educational system of Vocational College for Catering and Tourism Maribor. Besides national and international coordination of students WIL, we are constantly trying to achieve professional excellence. The same goal is stated in the mission of Vocational College for Catering and Tourism Maribor and is pointed out as constant encouragement towards creative and innovative relation between school and its business environment. The creativity is being showed in events, organized for contacting businesses and students, Career Centre for our Alumni members and other events, aimed to present the professional excellence that school is trying to achieve. One way to show what students have achieved and motivate them to continue the same pattern is our ambition to take part in national and international competitions. The effort has been given in this certain area, and our students are today winners of 11 golden medals on international competitions and numerous silver and bronze ones. Participation on the competitions is seen as special engagement for professional and school life and one of the ways of schools strategy for enhancing the hospitality concept to students One way to motivate students to gain experience “through experience, rather than books” and consequentially achieve professional excellence nationally and internationally is the event “Ambassador of hospitality” that aims to reward students, who, beside excellent grades, are achieving good results in hospitality industry competitions. Ambassador of Hospitality at Vocational College for catering and Tourism Maribor The schools strategy in the field of hospitality goes in the direction of promotion of practical experience among students that is being vital for understanding the professional concept of hospitality. School has therefore implicated the yearly event Ambassador of Hospitality. The central moment of the event is ceremonially given title of “Ambassador of Hospitality” to a student that was beforehand nominated for it. What counts for being nominated are not only grades with subjects, but especially students set of support practical experiences, international awards and individual enthusiasm for reaching constant excellence in the profession of Catering and Tourism. The title is presented at the same time as honorably given, but also as further obligation for a student to be professional behavior. The whole procedure of nomination is defined by the procedural manual of the commission of professors of the Vocational College for Catering and Tourism Maribor. The nominee is a student who is nominated for a title by at least two lecturers. The criteria for nomination are international success of student, excellent grades in school and enthusiasm of individual student, shown during the lectures. The lecturers are members of The Commission for Ambassador. The Commission for Ambassador is in session three times per year and makes the final list of nominees for the last session. There is a ballot for each nominee according to the predefined and stated criteria. Each student is given certain sum of points, if two students reach the same number of points, the one with higher international success is winning. The title is given to a student on a formal event that is taking place in the city hall in the city centre and has every year different emphasis (history of the city, culinary experience in Maribor…). The event is traditionally performed and has publicity of paper and visual media and professional magazines. Materials and methods The data has been collected within quantitative research method with a method of electronic questionnaire. The collection of data was held between 24th February and 1st of March. For creation of e-questionnaire we used free Google Docs programme. Jennings (2010) is stating the main advantages of electronic way of collecting the data such as simplicity of collecting and analyzing the data, minimal costs of survey conduction and ability of fast data analyzing. Among the main disadvantages of e-collecting the data the same author is pointing out the threat of missing the targeted respondent (because the wrong email address) or automatical direction of the email into the »spam«. Author is concluding by stating that e-surveys are gaining popularity and importance within tourism researchers because of their advantages.
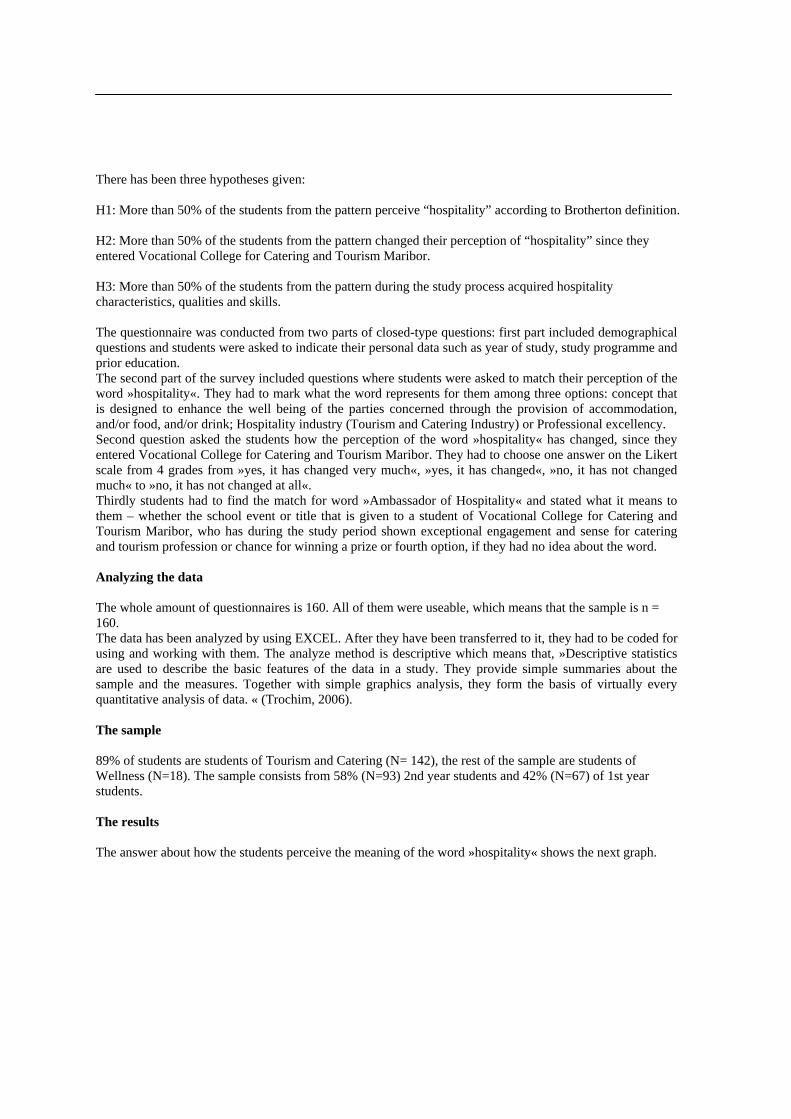
There has been three hypotheses given: H1: More than 50% of the students from the pattern perceive “hospitality” according to Brotherton definition. H2: More than 50% of the students from the pattern changed their perception of “hospitality” since they entered Vocational College for Catering and Tourism Maribor. H3: More than 50% of the students from the pattern during the study process acquired hospitality characteristics, qualities and skills. The questionnaire was conducted from two parts of closed-type questions: first part included demographical questions and students were asked to indicate their personal data such as year of study, study programme and prior education. The second part of the survey included questions where students were asked to match their perception of the word »hospitality«. They had to mark what the word represents for them among three options: concept that is designed to enhance the well being of the parties concerned through the provision of accommodation, and/or food, and/or drink; Hospitality industry (Tourism and Catering Industry) or Professional excellency. Second question asked the students how the perception of the word »hospitality« has changed, since they entered Vocational College for Catering and Tourism Maribor. They had to choose one answer on the Likert scale from 4 grades from »yes, it has changed very much«, »yes, it has changed«, »no, it has not changed much« to »no, it has not changed at all«. Thirdly students had to find the match for word »Ambassador of Hospitality« and stated what it means to them – whether the school event or title that is given to a student of Vocational College for Catering and Tourism Maribor, who has during the study period shown exceptional engagement and sense for catering and tourism profession or chance for winning a prize or fourth option, if they had no idea about the word. Analyzing the data The whole amount of questionnaires is 160. All of them were useable, which means that the sample is n = 160. The data has been analyzed by using EXCEL. After they have been transferred to it, they had to be coded for using and working with them. The analyze method is descriptive which means that, »Descriptive statistics are used to describe the basic features of the data in a study. They provide simple summaries about the sample and the measures. Together with simple graphics analysis, they form the basis of virtually every quantitative analysis of data. « (Trochim, 2006). The sample 89% of students are students of Tourism and Catering (N= 142), the rest of the sample are students of Wellness (N=18). The sample consists from 58% (N=93) 2nd year students and 42% (N=67) of 1st year students. The results The answer about how the students perceive the meaning of the word »hospitality« shows the next graph.
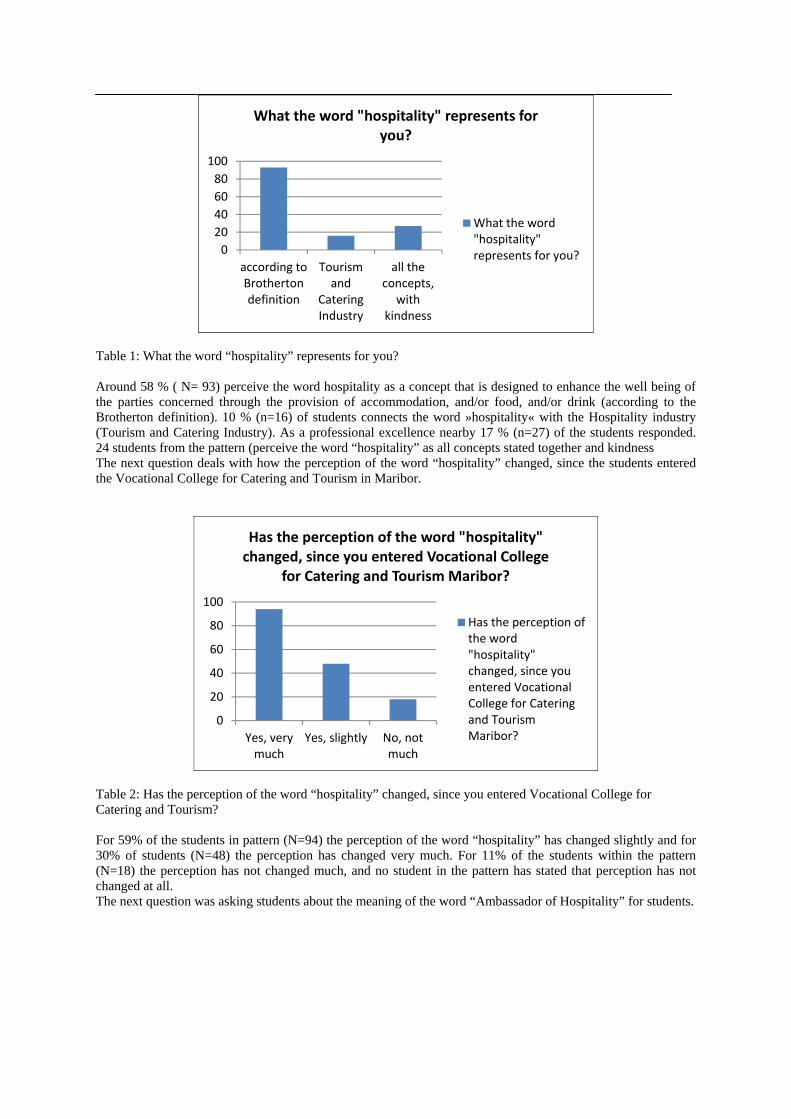
Table 1: What the word “hospitality” represents for you? Around 58 % ( N= 93) perceive the word hospitality as a concept that is designed to enhance the well being of the parties concerned through the provision of accommodation, and/or food, and/or drink (according to the Brotherton definition). 10 % (n=16) of students connects the word »hospitality« with the Hospitality industry (Tourism and Catering Industry). As a professional excellence nearby 17 % (n=27) of the students responded. 24 students from the pattern (perceive the word “hospitality” as all concepts stated together and kindness The next question deals with how the perception of the word “hospitality” changed, since the students entered the Vocational College for Catering and Tourism in Maribor.
Table 2: Has the perception of the word “hospitality” changed, since you entered Vocational College for Catering and Tourism? For 59% of the students in pattern (N=94) the perception of the word “hospitality” has changed slightly and for 30% of students (N=48) the perception has changed very much. For 11% of the students within the pattern (N=18) the perception has not changed much, and no student in the pattern has stated that perception has not changed at all. The next question was asking students about the meaning of the word “Ambassador of Hospitality” for students.
0
20
40
60
80
100
according toBrothertondefinition
Tourismand
CateringIndustry
all theconcepts,
withkindness
What the word "hospitality" represents for you?
What the word"hospitality"represents for you?
0
20
40
60
80
100
Yes, verymuch
Yes, slightly No, notmuch
Has the perception of the word "hospitality" changed, since you entered Vocational College
for Catering and Tourism Maribor?
Has the perception ofthe word"hospitality"changed, since youentered VocationalCollege for Cateringand TourismMaribor?
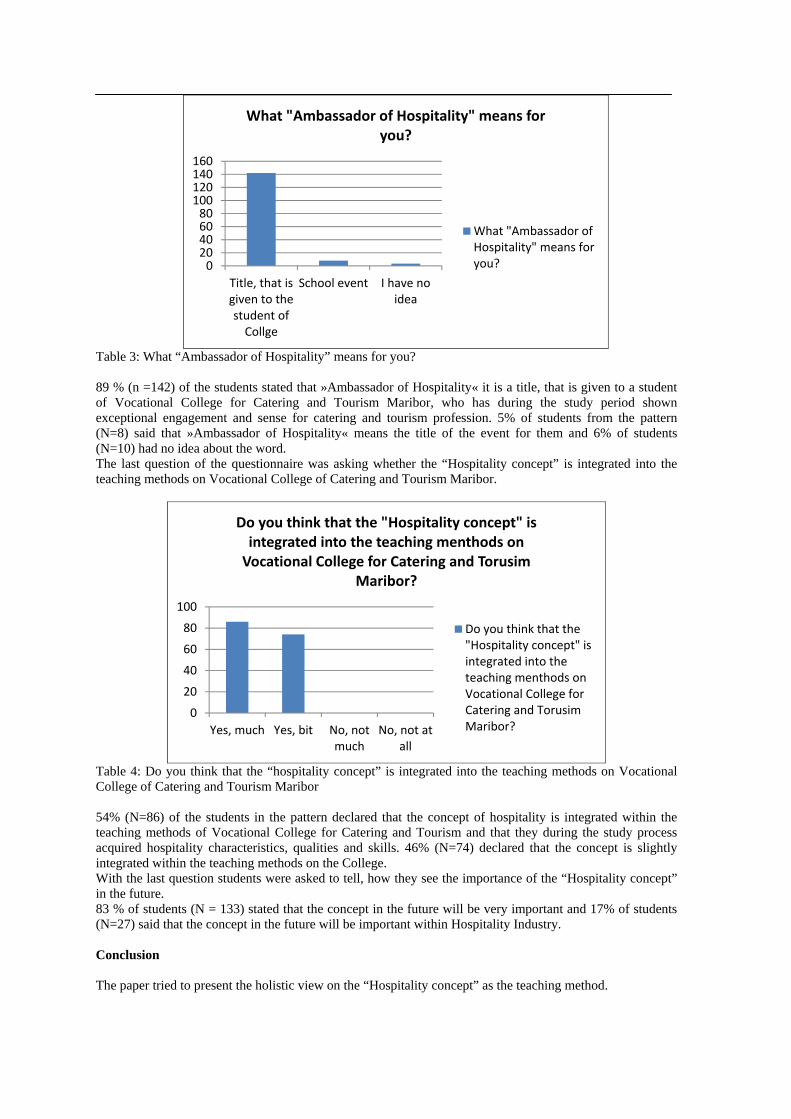
Table 3: What “Ambassador of Hospitality” means for you? 89 % (n =142) of the students stated that »Ambassador of Hospitality« it is a title, that is given to a student of Vocational College for Catering and Tourism Maribor, who has during the study period shown exceptional engagement and sense for catering and tourism profession. 5% of students from the pattern (N=8) said that »Ambassador of Hospitality« means the title of the event for them and 6% of students (N=10) had no idea about the word. The last question of the questionnaire was asking whether the “Hospitality concept” is integrated into the teaching methods on Vocational College of Catering and Tourism Maribor.
Table 4: Do you think that the “hospitality concept” is integrated into the teaching methods on Vocational College of Catering and Tourism Maribor 54% (N=86) of the students in the pattern declared that the concept of hospitality is integrated within the teaching methods of Vocational College for Catering and Tourism and that they during the study process acquired hospitality characteristics, qualities and skills. 46% (N=74) declared that the concept is slightly integrated within the teaching methods on the College. With the last question students were asked to tell, how they see the importance of the “Hospitality concept” in the future. 83 % of students (N = 133) stated that the concept in the future will be very important and 17% of students (N=27) said that the concept in the future will be important within Hospitality Industry. Conclusion
The paper tried to present the holistic view on the “Hospitality concept” as the teaching method.
020406080100120140160
Title, that isgiven to thestudent ofCollge
School event I have noidea
What "Ambassador of Hospitality" means for you?
What "Ambassador ofHospitality" means foryou?
0
20
40
60
80
100
Yes, much Yes, bit No, notmuch
No, not atall
Do you think that the "Hospitality concept" is integrated into the teaching menthods on Vocational College for Catering and Torusim
Maribor?
Do you think that the"Hospitality concept" isintegrated into theteaching menthods onVocational College forCatering and TorusimMaribor?
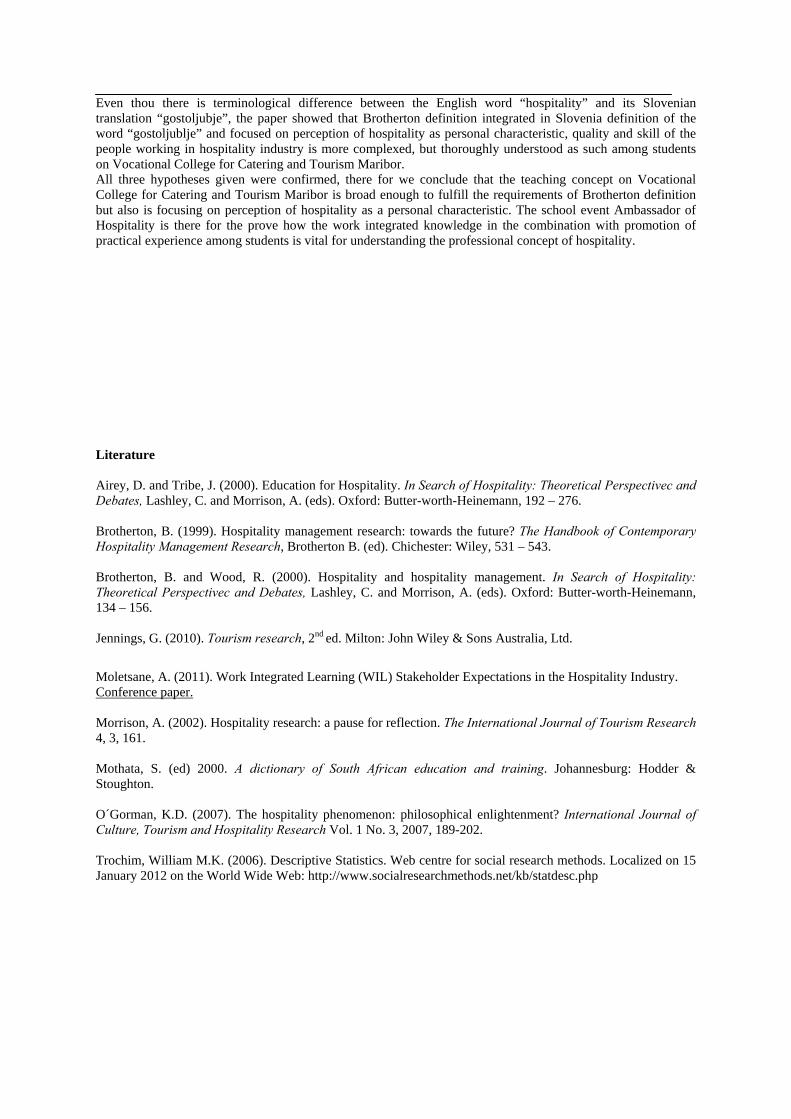
Even thou there is terminological difference between the English word “hospitality” and its Slovenian translation “gostoljubje”, the paper showed that Brotherton definition integrated in Slovenia definition of the word “gostoljublje” and focused on perception of hospitality as personal characteristic, quality and skill of the people working in hospitality industry is more complexed, but thoroughly understood as such among students on Vocational College for Catering and Tourism Maribor. All three hypotheses given were confirmed, there for we conclude that the teaching concept on Vocational College for Catering and Tourism Maribor is broad enough to fulfill the requirements of Brotherton definition but also is focusing on perception of hospitality as a personal characteristic. The school event Ambassador of Hospitality is there for the prove how the work integrated knowledge in the combination with promotion of practical experience among students is vital for understanding the professional concept of hospitality. Literature Airey, D. and Tribe, J. (2000). Education for Hospitality. In Search of Hospitality: Theoretical Perspectivec and Debates, Lashley, C. and Morrison, A. (eds). Oxford: Butter-worth-Heinemann, 192 – 276. Brotherton, B. (1999). Hospitality management research: towards the future? The Handbook of Contemporary Hospitality Management Research, Brotherton B. (ed). Chichester: Wiley, 531 – 543. Brotherton, B. and Wood, R. (2000). Hospitality and hospitality management. In Search of Hospitality: Theoretical Perspectivec and Debates, Lashley, C. and Morrison, A. (eds). Oxford: Butter-worth-Heinemann, 134 – 156. Jennings, G. (2010). Tourism research, 2nd ed. Milton: John Wiley & Sons Australia, Ltd.
Moletsane, A. (2011). Work Integrated Learning (WIL) Stakeholder Expectations in the Hospitality Industry. Conference paper. Morrison, A. (2002). Hospitality research: a pause for reflection. The International Journal of Tourism Research 4, 3, 161. Mothata, S. (ed) 2000. A dictionary of South African education and training. Johannesburg: Hodder & Stoughton. O´Gorman, K.D. (2007). The hospitality phenomenon: philosophical enlightenment? International Journal of Culture, Tourism and Hospitality Research Vol. 1 No. 3, 2007, 189-202. Trochim, William M.K. (2006). Descriptive Statistics. Web centre for social research methods. Localized on 15 January 2012 on the World Wide Web: http://www.socialresearchmethods.net/kb/statdesc.php
A Scholarship of Teaching and Learning Project in Hospitality and Tourism: Perceptions of Place through the Photo Voices of Students
Cynthia S. Deale, Ph.D. Associate Professor
East Carolina University/Hospitality Management Greenville, North Carolina, USA
Abstract
Photographs, taken by researchers or by participants themselves have been used to inform social science researchers in a number of ways. However, literature on the use of visual methods as a teaching tool is limited. This scholarship of teaching and learning case study describes a class project that involved students’ own photo reflections of hospitality and tourism in the community. The case study provides background information on the use of photos in research and teaching, summarizes the methods used in the project, the results obtained, and student reflections of the process to provide further information about how photos can be used in hospitality and tourism education. Key words: photography, photo voice, Photovoice, student project
Assessing Intercultural Sensitivity of Students and Academic Programs in Hospitality
Larisa Buhin Loncar, Ph.D.* American College of Management and Technology
Dubrovnik, Croatia [email protected]
Lucija Marinov
American College of Management and Technology Dubrovnik, Croatia
Abstract
This study examines attitudes of hospitality and tourism students toward cultural diversity and explores the extent to which students feel their academic environment explores cultural differences effectively. At the core of hospitality and tourism lies contact between two people from different cultures. Cultural diversity has the potential to make the world of hospitality better. Hospitality and tourism depend on customer satisfaction to ensure a continued customer base. Achieving desired levels of customer satisfaction is predicated upon accurately understanding our customers’ needs and preferences. Allport’s (1954) contact theory proposes basic conditions under which the contact between members of different groups is more likely to be positive and to promote intercultural understanding. The contact between two groups of culturally different groups has to be in a cooperative, rather than competitive context and the two groups have to enjoy equal status (Allport). Brewer and Miller (1988) refined these conditions further in saying that the contact should be personalized rather than generalized, a condition that is difficult to achieve in the hospitality context where the contact is by nature of short duration and personal connections cannot be developed. Pettigrew (1998) also proposes that building friendships among people of different cultures will reduce prejudice. Contact theory further states that the absence of these desirable conditions may increase prejudice and create negative feelings toward culturally different individuals. This result is antagonistic to goals of hospitality. We examine hospitality students' beginning attitudes toward diversity to get a sense of what their learning needs may be in the context of acquiring the awareness, knowledge and skills (Sue et al., 1992) necessary for effective work in the increasingly more diverse world of global hospitality and tourism. Furthermore, we propose that students entering the job market should be interculturally sensitive and able to communicate effectively in a multicultural setting. Hospitality and tourism academic programs should facilitate students’ acquisition of knowledge, tolerance, and respect of other cultures. Thus we also examine students’ perceptions of the level of success with which topics of cultural differences are addressed in their academic program. 122 undergraduate students in Croatia were surveyed using the Intercultural Sensitivity Questionnaire (Chen & Starosta, 2000) and the modified version of the Diversity Mission Evaluation Questionnaire (Ducker & Tori, 2009). The average participant age was 21.65; 48% of the sample was female and 52% was male. There were no statistical differences between male and female participants on either measure. Potential differences in age were not performed because of uneven distribution of the sample across four years of study. Students scored high on the Intercultural Sensitivity measure (mean = 3.99 out of 5.00, SD = 0.38). Students also expressed that their academic program deals with issues of cultural differences successfully (mean = 3.89 out of 5.00, SD = 0.58). We conclude that undergraduate students evaluate themselves to be interculturally sensitive and that they recognize the value of academic preparation for intercultural interactions. Academic programs should ensure that cultural differences are addressed in a consistent and constructive way throughout students’ training.
Key Words: attitudes, cultural diversity, intercultural sensitivity, hospitality, academic preparation.
Comparing oranges with apples? Looking for academic and practitioners interests on sustainability in hospitality
Elena Cavagnaro, PhD *
Professor in service studies Stenden University of Applied Sciences
Academy of International Hospitality Research Rengerslaan 8
8917 DD Leeuwarden [email protected]
Ernst Jonker
Senior lecturer and member of the RU in service studies Stenden University of Applied Sciences
Rengerslaan 8 8917 DD Leeuwarden
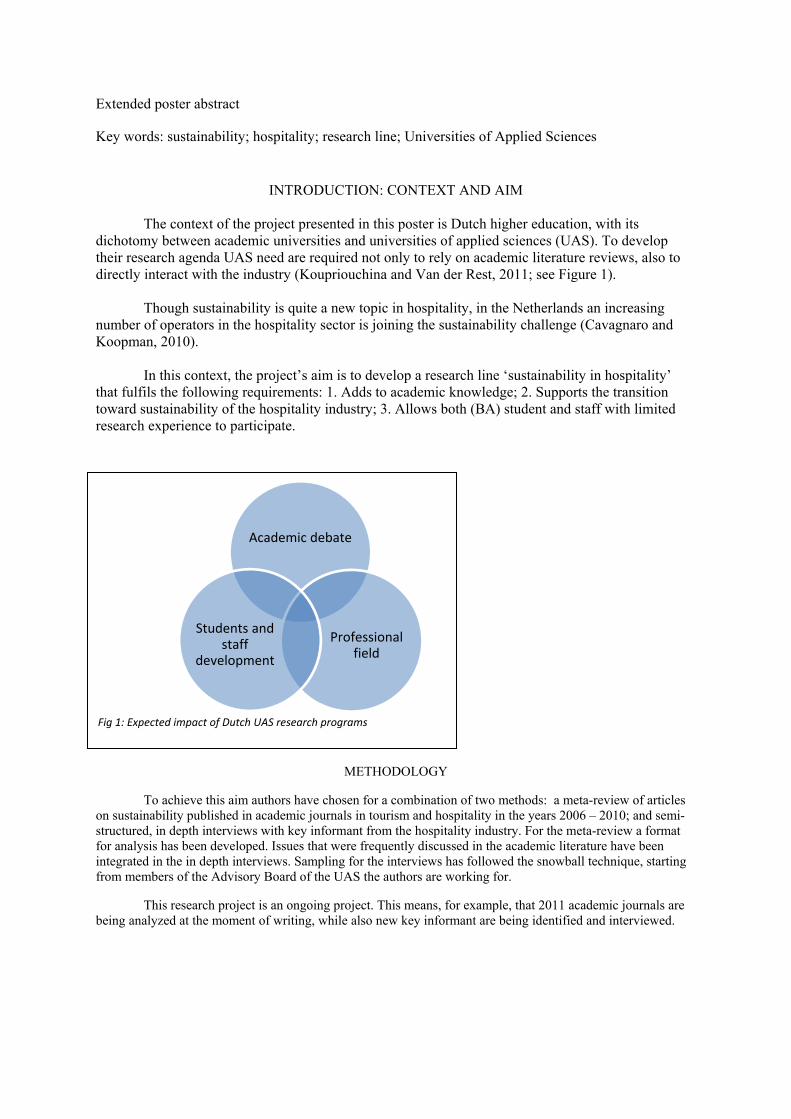
Extended poster abstract
Key words: sustainability; hospitality; research line; Universities of Applied Sciences
INTRODUCTION: CONTEXT AND AIM
The context of the project presented in this poster is Dutch higher education, with its
dichotomy between academic universities and universities of applied sciences (UAS). To develop their research agenda UAS need are required not only to rely on academic literature reviews, also to directly interact with the industry (Koupriouchina and Van der Rest, 2011; see Figure 1).
Though sustainability is quite a new topic in hospitality, in the Netherlands an increasing
number of operators in the hospitality sector is joining the sustainability challenge (Cavagnaro and Koopman, 2010).
In this context, the project’s aim is to develop a research line ‘sustainability in hospitality’ that fulfils the following requirements: 1. Adds to academic knowledge; 2. Supports the transition toward sustainability of the hospitality industry; 3. Allows both (BA) student and staff with limited research experience to participate.
METHODOLOGY
To achieve this aim authors have chosen for a combination of two methods: a meta-review of articles on sustainability published in academic journals in tourism and hospitality in the years 2006 – 2010; and semi-structured, in depth interviews with key informant from the hospitality industry. For the meta-review a format for analysis has been developed. Issues that were frequently discussed in the academic literature have been integrated in the in depth interviews. Sampling for the interviews has followed the snowball technique, starting from members of the Advisory Board of the UAS the authors are working for.
This research project is an ongoing project. This means, for example, that 2011 academic journals are being analyzed at the moment of writing, while also new key informant are being identified and interviewed.
Fig 1: Expected impact of Dutch UAS research programs
Academic debate
Professional field
Students and staff
development
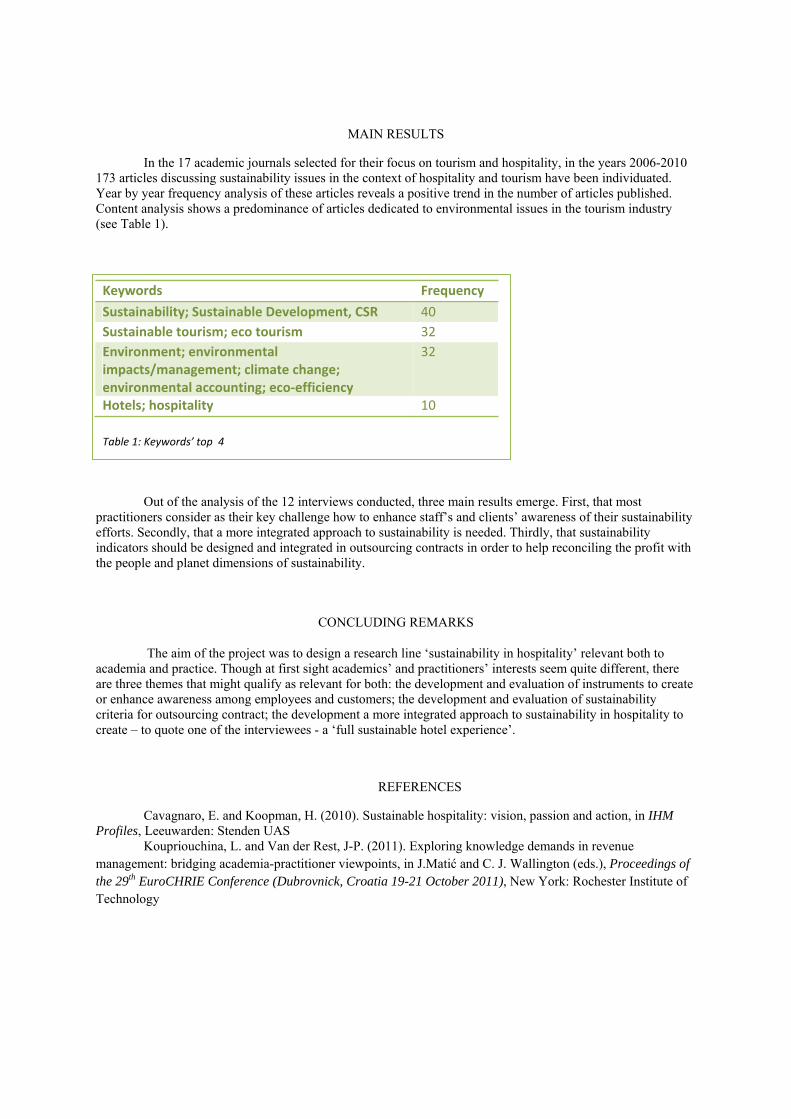
MAIN RESULTS
In the 17 academic journals selected for their focus on tourism and hospitality, in the years 2006-2010 173 articles discussing sustainability issues in the context of hospitality and tourism have been individuated. Year by year frequency analysis of these articles reveals a positive trend in the number of articles published. Content analysis shows a predominance of articles dedicated to environmental issues in the tourism industry (see Table 1).
Out of the analysis of the 12 interviews conducted, three main results emerge. First, that most practitioners consider as their key challenge how to enhance staff’s and clients’ awareness of their sustainability efforts. Secondly, that a more integrated approach to sustainability is needed. Thirdly, that sustainability indicators should be designed and integrated in outsourcing contracts in order to help reconciling the profit with the people and planet dimensions of sustainability.
CONCLUDING REMARKS
The aim of the project was to design a research line ‘sustainability in hospitality’ relevant both to academia and practice. Though at first sight academics’ and practitioners’ interests seem quite different, there are three themes that might qualify as relevant for both: the development and evaluation of instruments to create or enhance awareness among employees and customers; the development and evaluation of sustainability criteria for outsourcing contract; the development a more integrated approach to sustainability in hospitality to create – to quote one of the interviewees - a ‘full sustainable hotel experience’.
REFERENCES
Cavagnaro, E. and Koopman, H. (2010). Sustainable hospitality: vision, passion and action, in IHM Profiles, Leeuwarden: Stenden UAS
Koupriouchina, L. and Van der Rest, J-P. (2011). Exploring knowledge demands in revenue management: bridging academia-practitioner viewpoints, in J.Matić and C. J. Wallington (eds.), Proceedings of the 29th EuroCHRIE Conference (Dubrovnick, Croatia 19-21 October 2011), New York: Rochester Institute of Technology
Keywords Frequency
Sustainability; Sustainable Development, CSR 40
Sustainable tourism; eco tourism 32
Environment; environmental impacts/management; climate change; environmental accounting; eco‐efficiency
32
Hotels; hospitality 10
Table 1: Keywords’ top 4
Students Get Involved in Hotel Recycling Efforts
Dr. Betsy Stringam, Associate Professor New Mexico State University, Las Cruces, NM, 88011 USA
In recent years the hotel industry has focused on sustainability, or “green” practices (Bobbett, 2010;
Enz and Siguaw, 1999; Graci & Dodds, 2008; and Harmer, 2011). One area in particular is the recycling of guest bathroom amenities. Many hotels discard partially used guestroom amenities every day (Goodman, 2000). Discarding partially used bathroom amenities generates waste (Burger, 2007). These amenities would be welcome at many local homeless shelters.
However the hotel industry is fragmented and diverse in their management, ownership and attitude
towards green practices (Graci & Dodds, 2008). As a result many hotels do not employ green practices. Most small hotels do not have the resources to coordinate recycling of guest bath amenities (Radwan, Jones, & Minoli, 2012). Recognizing this fact, a student organization in a School of Hotel, Restaurant and Tourism Management at a university decided that coordinating these efforts would provide a needed resource to a local charity, as well as help to conserve the worlds’ resources. In the process, students learn compassion and sustainability together through one project.
A committee of students from our Student Hotel, Restaurant and Tourism Management Association are
spearheading a local initiative to collect partially used guest room amenities and deliver them to a local homeless shelter. While the project has some oversight from a faculty member, the labor, organization and ongoing efforts are the function of the student committee. This has resulted in students learning leadership in addition to charity and sustainability.
The project is presented as a case study and will outline the process, and logistics. Key points will
include: factors of success, key stakeholders, obstacles and difficulties to be overcome, and leadership skills of needed for sustainable projects. Recommendations for starting a similar project at other universities will be offered. The case will outline model/processes that could be developed to amplify a single project to a generalized waste management approach.
Key Words: hotel, recycle, student, green, amenity, shelter
REFERENCES: Bobbett, Edward James, (2010). An Investigation of sustainable environmental practices and consumer attitudes
& behaviors toward hotel bathroom amenities. UNLV Theses/Dissertations/ Professional Papers/Capstones. Paper 431. http://digitalcommons.library.unlv.edu/ thesesdissertations/431.
Burger, R. (2007, January 23). Hotels from coast to coast reduce waste to preserve our planet. Retrieved 2 March 2012 from http://www.hotel-online.com/News/PR2007_1st/Jan07_greenSPA.html.
Enz, C. & J. Siguaw (1999). Best hotel environmental practices. Cornell Hotel and Restaurant Quarterly, 40(5), 72-77.
Goodman, A. (2000), Implementing sustainability in service operations in Scandic hotels. Interfaces, 30(3), 202–214.
Graci, S., & R. Dodds (2008). Why go green? The business case for environmental commitment in the Canadian hotel industry. Anatolia: An International Journal of Tourism and Hospitality Research. 19(2), 251-270.
Harmer, J. (2011). The red way to be green, Caterer & Hotelkeeper, 201(4700), 26-28. Radwan, H., Jones, E. & D. Minoli (2012). Solid waste management in small hotels: a comparison of green and
non-green small hotels in Wales. Journal of Sustainable Tourism, 20(4), 533-550.
GAME-THEORETIC OPTIMIZATION IN CONJOINT PRICING
Bjorn Arenoe* Hotelschool The Hague
International University of Hospitality Management The Hague, NL
and
Jean-Pierre van der Rest Hotelschool The Hague
International University of Hospitality Management The Hague, NL
Abstract
Conjoint analysis is a statistical technique to examine how people make value trade-offs. When it is used to study optimal pricing strategies, it is assumed that competitor reaction is fixed. This assumption is unrealistic. A conjoint study can only be useful for strategic decision-making, if it acknowledges the dynamic process of competition. This paper builds on Smallwood (1991) who proposed conjoint analysis in price optimization. It aims to explore a new method by which optimal strategies in conjoint studies can be found under a competitor maximising assumption. It develops a game-theoretic model of the competitive environment which incorporates conjoint utilities. The model optimizes one continuous attribute. The simulation results in optimal room rate prices for all hotels in the market.
Keywords: Revenue Management, Pricing, Conjoint Analysis, Equilibrium, Discrete Choice Model
Introduction
The concept of market equilibrium is arguably one of the most central concepts in price theory (Bridel, 2001). It represents the notion that competitor prices in a given market necessarily converge to some steady state where the resulting prices are, in some sense, “optimal”. This optimality is generally defined as being such that firms have no economic incentive to change prices from equilibrium levels as that would decrease the profits. Through time, however, the concept of market equilibrium has also received academic criticism. For example, Edgeworth (1881) casted doubts about the stability and convergence of equilibria. Von Hayek (1937, pp. 43-44) even stated ‘We shall not get further here […] the only justification for this is the supposed existence of a tendency toward equilibrium […] ceases to be an exercise in pure logic’. In other words, whilst theoretically appealing, the mode of motion and state of an equilibrium are actually quite hard to verify empirically. The stock market, for example, the most archetypical of all markets, can hardly be considered to be in equilibrium. Or, as the application of game theory has showed, whilst is it possible to theorize numerous different market equilibria, they can be all be mirrored by an equally rich array of behavioural patterns actually observed in markets. In fact, by explicitly recognising the wide range of behaviour predicted by theory and actually observed, many economists have concluded that the equilibrium problem (e.g. plausibility, existence, uniqueness, stability) is indeterminate (Vives, 1999). Therefore, a general observation across different types of markets has led many to believe that the concept of market equilibrium has only limited validity as a real-world phenomenon but instead should be considered more as a normative theory (Fog, 1994). That is, it should be considered as a general theory for how markets should behave in order to be efficient. An interesting question then is whether equilibrium theory, viewed from the perspective of game theory, has something to offer to decision-makers on a practical micro-level, for example revenue managers in the hospitality sector.
This paper explores the potential benefits of applying game theory together with conjoint analysis to the
practical pricing decision of revenue managers in the hospitality industry. First of all, a basic game theoretical equilibrium model is introduced. Then a mathematical model is developed to describe the process of strategic pricing between hotels in a closed market. A key element in this model is that each revenue manager’s profit is driven by his market share which, in turn, is defined as a function of both the manager’s own price setting as well as his competitor’s. Furthermore, it is assumed that hotels also compete on other attributes than price, such as quality, location, service, etc. It is also assumed that hotels with a good performance on these product and service attributes (from a guest perspective) create a certain degree of customer value which justifies a higher price level (compared to competing hotels with a lower performance). In this way, market prices might be markedly different from each other and still be considered to be in an equilibrium state. To incorporate such complex attribute trade-off behavior by hotel guests, the market share in the model is further operationalized through a discrete choice model, the parameters of which are to be measured by use of choice-based conjoint analysis.
Integrating conjoint analysis with game-theoretic equilibrium principles has received scant attention in the literature. This paper is an extension of the work by Choi and DeSarbo (1993) who develop a general framework in the context of competing producers of car-tires. The current paper is different in a number of ways. Firstly, it utilizes a choice-based conjoint approach instead of a traditional full profile conjoint approach which not only brings the model up to date with modern standards in conjoint analysis practice but more importantly enables the use of a so-called “none-option” in the conjoint model in order to model any (exogenous) aggregate competitive effects not covered by the endogenous players. The paper will show that this is a crucial step towards the empirical validation of the model. Secondly, the current paper focuses on price as the only (continuous) variable that can be influenced by the decision makers and treats the other (discrete) attributes as fixed. This is in contrast to the approach by Choi and DeSarbo (1994) where all the attributes (continuous and discrete) are to be optimized. The simplification is acceptable as in practice price is the main variable of interest to the revenue manager. Furthermore, by focusing on price as the only continuous independent variable the paper can simplify the estimation procedure and also eliminate the somewhat troubling possibility of the existence of multiple equilibria. The current paper aims at providing the theoretical derivation of the model as a precursor to empirically verifying its validity.
A Basic Game Theoretical Equilibrium Model
Game theory, an active field of mathematics studying the strategic interaction of rational decision makers, provides a general framework for studying managerial decision making in the face of market equilibria. Central concepts in game theory are Players (strategic decision makers), Payoffs (the benefits the decision makers strive to acquire) and Strategies (the planned sequences of activities to acquire these payoffs). Variations on these three variables yield a huge variation of game typologies, suited to model all different kinds of real-world phenomena. Arguably the best known example of these is the Prisoner’s Dilemma where two Players (prisoners A and B accused of jointly committing a crime and being interrogated by the secret police) strive to obtain either one of two conflicting Payoffs (High Sentence vs. Low Sentence) by using either a cooperative (stay silent) or non-cooperative (confess), one-round-off-play Strategy. This is described in figure 1. Figure 1: Prisoner’s Dilemma
Prisoner B stays silent (coop.)
Prisoner B confesses (non-coop)
Prisoner A stays silent (coop.) Each serves 1 month A 1 year in jail, B goes free Prisoner A confesses (non-coop.)
A goes free, B 1 year in jail Each serves 3 months
As for many strategic games the Prisoner’s Dilemma can explain a great deal about what actually
constitutes a “good” decision in such a situation, namely that in this case it is actually wisest not to cooperate. As
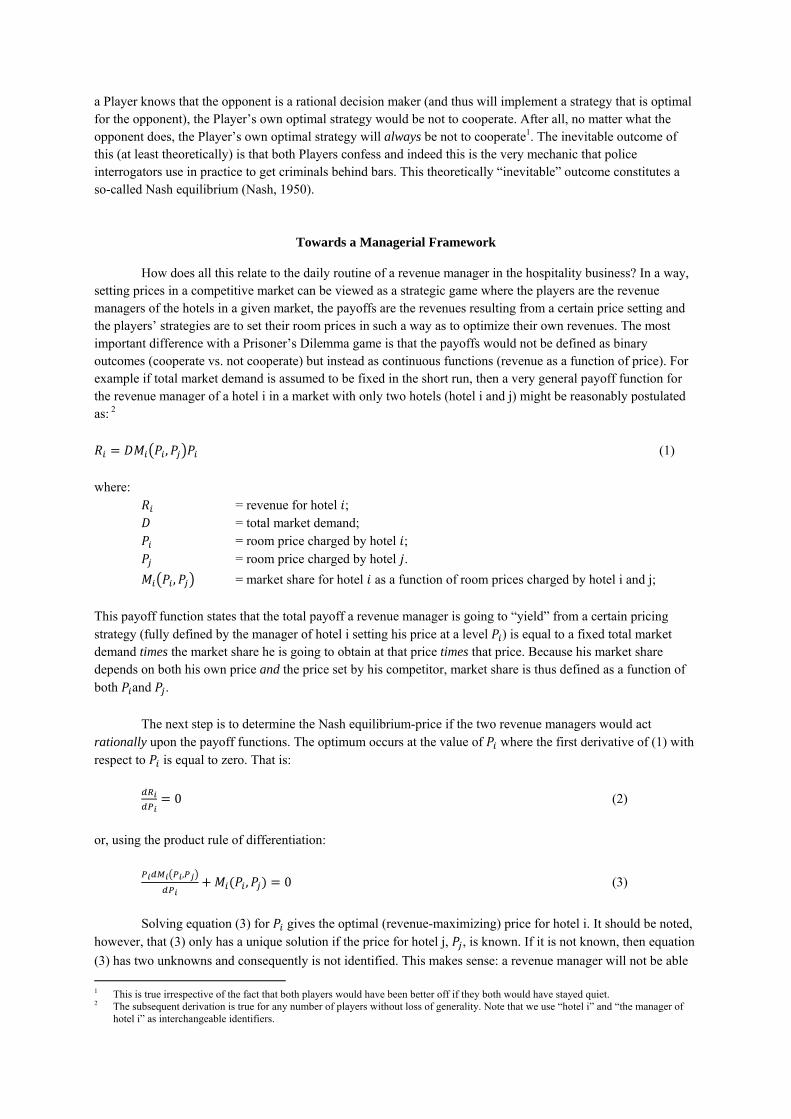
a Player knows that the opponent is a rational decision maker (and thus will implement a strategy that is optimal for the opponent), the Player’s own optimal strategy would be not to cooperate. After all, no matter what the opponent does, the Player’s own optimal strategy will always be not to cooperate1. The inevitable outcome of this (at least theoretically) is that both Players confess and indeed this is the very mechanic that police interrogators use in practice to get criminals behind bars. This theoretically “inevitable” outcome constitutes a so-called Nash equilibrium (Nash, 1950).
Towards a Managerial Framework
How does all this relate to the daily routine of a revenue manager in the hospitality business? In a way, setting prices in a competitive market can be viewed as a strategic game where the players are the revenue managers of the hotels in a given market, the payoffs are the revenues resulting from a certain price setting and the players’ strategies are to set their room prices in such a way as to optimize their own revenues. The most important difference with a Prisoner’s Dilemma game is that the payoffs would not be defined as binary outcomes (cooperate vs. not cooperate) but instead as continuous functions (revenue as a function of price). For example if total market demand is assumed to be fixed in the short run, then a very general payoff function for the revenue manager of a hotel i in a market with only two hotels (hotel i and j) might be reasonably postulated as: 2
, (1)
where: = revenue for hotel ; = total market demand; = room price charged by hotel ; = room price charged by hotel .
, = market share for hotel as a function of room prices charged by hotel i and j;
This payoff function states that the total payoff a revenue manager is going to “yield” from a certain pricing strategy (fully defined by the manager of hotel i setting his price at a level ) is equal to a fixed total market demand times the market share he is going to obtain at that price times that price. Because his market share depends on both his own price and the price set by his competitor, market share is thus defined as a function of both and .
The next step is to determine the Nash equilibrium-price if the two revenue managers would act
rationally upon the payoff functions. The optimum occurs at the value of where the first derivative of (1) with respect to is equal to zero. That is:
0 (2)
or, using the product rule of differentiation:
,
, 0 (3)
Solving equation (3) for gives the optimal (revenue-maximizing) price for hotel i. It should be noted,
however, that (3) only has a unique solution if the price for hotel j, , is known. If it is not known, then equation
(3) has two unknowns and consequently is not identified. This makes sense: a revenue manager will not be able
1 This is true irrespective of the fact that both players would have been better off if they both would have stayed quiet. 2 The subsequent derivation is true for any number of players without loss of generality. Note that we use “hotel i” and “the manager of
hotel i” as interchangeable identifiers.
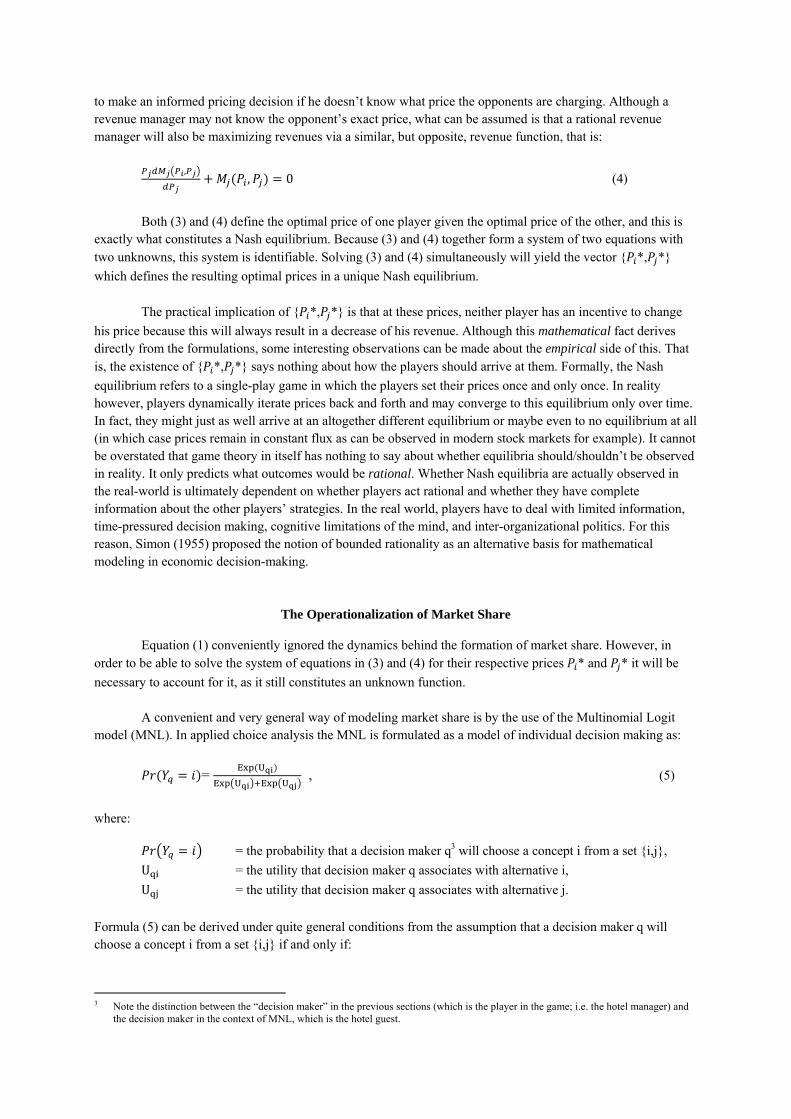
to make an informed pricing decision if he doesn’t know what price the opponents are charging. Although a revenue manager may not know the opponent’s exact price, what can be assumed is that a rational revenue manager will also be maximizing revenues via a similar, but opposite, revenue function, that is:
,
, 0 (4)
Both (3) and (4) define the optimal price of one player given the optimal price of the other, and this is
exactly what constitutes a Nash equilibrium. Because (3) and (4) together form a system of two equations with two unknowns, this system is identifiable. Solving (3) and (4) simultaneously will yield the vector { *, *}
which defines the resulting optimal prices in a unique Nash equilibrium.
The practical implication of { *, *} is that at these prices, neither player has an incentive to change
his price because this will always result in a decrease of his revenue. Although this mathematical fact derives directly from the formulations, some interesting observations can be made about the empirical side of this. That is, the existence of { *, *} says nothing about how the players should arrive at them. Formally, the Nash
equilibrium refers to a single-play game in which the players set their prices once and only once. In reality however, players dynamically iterate prices back and forth and may converge to this equilibrium only over time. In fact, they might just as well arrive at an altogether different equilibrium or maybe even to no equilibrium at all (in which case prices remain in constant flux as can be observed in modern stock markets for example). It cannot be overstated that game theory in itself has nothing to say about whether equilibria should/shouldn’t be observed in reality. It only predicts what outcomes would be rational. Whether Nash equilibria are actually observed in the real-world is ultimately dependent on whether players act rational and whether they have complete information about the other players’ strategies. In the real world, players have to deal with limited information, time-pressured decision making, cognitive limitations of the mind, and inter-organizational politics. For this reason, Simon (1955) proposed the notion of bounded rationality as an alternative basis for mathematical modeling in economic decision-making.
The Operationalization of Market Share
Equation (1) conveniently ignored the dynamics behind the formation of market share. However, in order to be able to solve the system of equations in (3) and (4) for their respective prices * and * it will be
necessary to account for it, as it still constitutes an unknown function.
A convenient and very general way of modeling market share is by the use of the Multinomial Logit model (MNL). In applied choice analysis the MNL is formulated as a model of individual decision making as:
= , (5)
where:
= the probability that a decision maker q3 will choose a concept i from a set {i,j},
U = the utility that decision maker q associates with alternative i,
U = the utility that decision maker q associates with alternative j.
Formula (5) can be derived under quite general conditions from the assumption that a decision maker q will choose a concept i from a set {i,j} if and only if:
3 Note the distinction between the “decision maker” in the previous sections (which is the player in the game; i.e. the hotel manager) and
the decision maker in the context of MNL, which is the hotel guest.
Ɛε U εƐ (6)
Here, “utility” has the conventional economic interpretation of the amount off well-being that a consumer q derives from the consumption of a good i. The MNL model in (5) is derived from (6) under the basic axioms of
rational choice theory and the additional assumption that the errors {Ɛε ,Ɛε } are distributed as i.i.d. Extreme
Value Type 1 (See McFadden (1974) and Louviere, Hensher and Swait (2001) for a full derivation of equation (5)).
Under homogenous market conditions the market share of a product can be viewed as the probability that a “representative” consumer chooses that product from the set of available products. If this assumption is
reasonable, then might be replaced by and thus (5) becomes:
= , (7)
At this point the utility in (7) is no longer defined as the well-being provided to an individual consumer, but instead as that to an “average” consumer in the market. In practice, revenue managers can use statistical
techniques to estimate and from a set of representative behavioral data, such as choice-based conjoint
analysis which will be discussed in the next section. Note that the dynamics of (7) are intuitively plausible: market share for a product increases when it becomes more desirable or when a competitors’ product becomes less desirable, and vice versa. Furthermore, market share is constrained to lie within the <0, 1> interval. It can thus be argued that (7) provides a practically very acceptable model of customer choice within a competitive context.
Up until now the behavioral model is similar to that in Choi and Desarbo (1993). However, an important advancement can be made by adding a so-called “no-choice option” to the model. As can be seen from the formulation in (7) the model is fairly restricted in the sense that the decision maker is forced to make a choice between the available options without the possibility to choose no product at all. However, it is quite reasonable to expect that a consumer might want to defer the choice if neither of the options available are good enough. In line with (6) it could be assumed that a certain option is only good enough for choosing if its utility exceeds a certain utility threshold, that is if and only if:
Ɛε N εƐ , (8)
where N is the threshold utility for choice by decision maker q in a given market (also called the “no-choice
utility”). The no-choice option might reflect the decision to never buy a product at all or, alternatively, the decision to postpone a choice to some future point in time when product availability might change and the prospect of obtaining a desirable product might improve. In the latter case, the no-choice option reflects a sort of aggregate measure of competitive offerings which exists outside the current choice occasion.
The inclusion of a no-choice option in a game-theoretic framework of discrete choice models is not only relevant from a behavioral perspective. It is a crucial step towards enabling the empirical validation of such a model. If two hotels play out a pricing game without a no-choice utility, every guest would be forced to make a choice between the two hotels no matter how high prices actually beget. The optimal prices { *, *} would
then be found by solving (3) and (4), enabling supra-normal profits as both hotels would only have to worry that guests change to the other player and not that they will leave the market altogether. Whilst this may be a reasonable assumption in a few oligopolistic commodity markets (e.g. gasoline) it is unrealistic for hospitality markets with their immensely fragmented structure where it is unlikely that the full set of options available to the decision maker can be included in any choice model, no matter how well defined. The amount of monopoly power in hospitality markets, however, is much greater than a superficial analysis of market structure might imply. This is so in part because of very strong product differentiation and in some fields cartel-like restrictions on entry (Scherer and Ross, 1990). Nevertheless, the inclusion of a no-choice utility is necessary in order to
realistically model the price formation process in hospitality markets. By their very nature, hospitality markets have an almost unlimited number of choice alternatives available (e.g. venues, locations, substitutes, postponement) which cannot be included as individual players in a game.4
Using conjoint analysis to measure the utility contribution of hotel attributes
Having defined a general structure for the competition between the players’ propositions and with the no-choice alternative, the product-level utilities are now to be specified. This can be done using an additive utility model (Fishbein, 1967) as follows:
∑ , (9) A total of K attributes are postulated by the revenue manager as being relevant to the formation of product utility
within a certain product market. A particular offering i is then described by an attribute vector { }, each being
weighted by a vector of parameters { }. This vector of taste parameters should be considered a market average
of the taste parameters of the individual customers therein. For all practical purposes { } can be estimated using such market research techniques as (choice-based) conjoint analysis (for stated choice data) or discrete choice analysis (for revealed choice data).
In neoclassical price theory, K is equal to 1. That is, price is the only attribute. And, if no other attributes would be defined, this would be the endpoint of the model derivation as functions (3) and (4) could be derived with only the prices of the players as the remaining unknowns. This would open up the possibility to determine equilibrium prices given some value for the total market demand. However, it will be much more interesting if other terms are added to the utility function. With regard to the hospitality industry, for example, one could easily include quality aspects such as room square footage, friendliness of staff, distance to the airport, quality of food in the hotel restaurant, classiness of the interior in the hotel, tidiness and cleanliness of the hotel, and so forth, as additional attributes. The possibility of adding quality attributes to the hotel utility function is not only interesting from the point of view of model realism. More importantly, it offers a fascinating perspective on the formation of equilibrium prices. If (9) would contain only price as an attribute then in the Nash equilibrium the prices of the competing hotels would be exactly equal ( = ). After all, (1), (7) and (8) are
indistinguishable for the two players except for the indexes. In other words, there is nothing that sets one hotel apart from the other if price would be their only distinguishing characteristic.
Conjoint analysis offers a very natural way of measuring the weight that consumers attach to different
attributes associated with a certain product or service and it can be used to fill in all the { }. This then completes the model formulation and leaves the model to be estimated. In order for (3) and (4) to be estimated one can revert to standard one-dimensional optimization methods for simultaneous equations. The idea is to iteratively optimize the price of one player given the previously optimized prices of the other players, until all prices converge. Because of the model structure this process is guaranteed to converge to the (single) global optimum. The resulting prices constitute the Nash equilibrium. Note that for most practical applications the complexity of (3) and (4), especially with a large number of players, prohibits the use of analytical gradient methods. Estimated (finite-difference) gradients, however, might still be used, as can direct search methods. Moreover, objections against direct search methods (i.e. their inefficiency with large numbers of parameters) are not of much concern here as there are only as many parameters as there are players (i.e. their prices) and they are all continuous.
4 Because of the choice of conjoint method (i.e. traditional full profile rating/ranking) Choi and deSarbo (1994) are unable to estimate a
no-choice utility. For this, choice-based conjoint analysis or any other discrete choice analysis procedure is needed.
Discussion and Implications
This paper aims at describing a game-theoretical framework for the study of optimal price setting in a competitive context by hotel revenue managers. The approach taken was to formulate the problem as a mathematical game where the players optimize their individual revenue functions through their price setting. The individual revenue functions for all the players are linked through their market share functions, where each player’s market share is a function of all the player’s prices and their additional product attributes. Choice-Based Conjoint analysis is suggested as a means of measuring the relative weights that should be assigned to price versus all the other attributes and to be able to handle the inclusion of a none-option. In this way, the proposed approach can be applied relatively straightforward in practice. For example, through a conjoint experiment, it will be possible to establish a number of (homogenous) market segments. Each of these segments will yield its own utility parameters which can be put in the model to generate different market segment equilibria (i.e. an equilibrium for each market segment). When these segment equilibria are considered as a whole, a revenue manager will know his range of feasible and sustainable prices in relation to the prices that competitors have set.
A very important aspect of the model is that the use of a conjoint model for the market share function acknowledges the fact that customer value is typically determined by more attributes than price alone. This is in contrast to neo-classical approaches, which are of rather limited value for setting prices in daily practice, where price is the only distinguishing characteristic between product offers. Instead, using an additive utility function that captures all the important attributes (product quality, service levels etc as well as price) provides a more realistic description of the competitive landscape. It also allows for the possibility that a market can be in an equilibrium state while prices of the players actually differ from one another. This is can perhaps be expected in a market where three-star hotels are charge lower prices than neighboring four-star hotels in order to survive.
The most important contribution to the work by Choi and DeSarbo (1993) is the use of Choice-Based Conjoint Analysis compared to their traditional conjoint approach. Firstly, Choice-Based Conjoint is the modern standard in conjoint analysis and thus this paper can be seen as an update to their work. Secondly, Choice-Based Conjoint (in contrast to traditional conjoint) allows for the inclusion of a so-called “none-option” that can be used to model the tendency of people to defer or postpone their purchase if none of the available alternatives surpasses a certain utility threshold. This is not only important from a behavioral perspective (if consumers really defer or postpone choices with unacceptable alternatives then the predicted prices and revenues using a traditional conjoint approach would be upwardly biased) but also from an empirical perspective in the sense that certain markets, and especially hospitality, are characterized by huge numbers of players which cannot be modeled separately. In this way, the paper greatly enhances the possibilities of applying equilibrium theory to day-to-day pricing problems in practice. It allows the aggregate effect of omitted players to be captured using the none-option which makes practical validation of any game theoretical model much more straightforward.
An important reservation remains the validity of “market equilibrium” as a theoretical concept as there is no academic consensus on whether and when it actually exists. With the current model the task of empirical validation, however, may have become one step nearer.
References
Bridel, P. (2001). The Foundations of Price Theory. London: Pickering & Chatto. Choi, S.C. and DeSarbo, W.S. (1993). Game Theoretic Derivations of Competitive Strategies in Conjoint
Analysis, Marketing Letters, 4(4), pp.337-348. Edgeworth, F.Y. (1881). Mathematical Physics. London: Paul Kegan. Edgeworth, F.Y. (1925). The Pure Theory of Monopoly. In: Edgeworth, F.Y., (ed.) Papers Relating to Political
Economy. London: MacMillan, pp. 111-142.
Fishbein, M. (1967). Attitude and the prediction of behaviour: a behavioural theory approach to the relation between beliefs about an object and the attitude towards the object. Readings in attitude theory and measurement. New York: John Wiley & Sons.
Fog, B. (1994). Pricing in Theory and Practice. Copenhagen: Handelsøhjskolens Forlag. Louviere, J.L, Hensher, D.A. and Swait, J.D. (2000). Stated Choice Methods: Analysis and Application,
Cambridge: Cambridge University Press. McFadden, D. (1974). Conditional logit analysis of qualitative choice behaviour. In: Zarembka, P. (ed.),
Frontiers in Econometrics, New York: Academic Press, pp. 105-42 Nash, J.F. (1950). Equilibrium Points in N-Person Games. Proceedings of the National Academy of Sciences
USA, 36(1), pp. 48-49. Simon, H.E. (1957). Models of Man -social and rational. New York: Wiley, pp. 196-279. Smallwood, R.D. (1991). Using Conjoint Analysis in Price Optimization, Sawtooth Software Conference
Proceedings, October, 157-162. von Hayek, F.A. (1937). Economics and Knowledge. Economica, 4(13), pp. 33-53. von Hayek, F.A. (1948). Individualism and Economic Order. Chicago: University of Chicago Press.
Tourism, Cultural Heritage and Revenue Management
Kate Varini, Senior Lecturer Oxford Brookes University
Rafael Matos-Wasem, Professor Institute for Tourism, HES-SO Valais, Sierre
Martine Ferry, Visiting Professor Institute Paul Bocuse, Lyon. martine
Abstract This conceptual paper will explore the application of revenue management to cultural tourism attractions in a way that would encourage socially responsible behaviour by leveraging a local or national reward system to offer more favourable conditions to visit a popular tourist attraction. This might include lower prices as well as unique occasions to see a tourist attraction. Tourist attractions may form clubs where members have the chance to demonstrate their responsiveness to offers. The example of this paper will be the Louvre in Paris where maximizing profits by raising prices or lowering the price would raise issues as making the attraction too expensive for many or attracting too many visitors. Key words: Responsible revenue management, tourism heritage attractions
Revenue management aims to maximise revenue using price differentiation considering willingness to
pay and purchase behaviour. However, when applying these principles to tourism heritage sites, a conflict may arise. In the case prices are raised, a portion of the population will not be able to afford access. Lowering prices might generate too large an influx of visitors causing collateral damage such as wear and tear, littering, crowding etc., ultimately resulting in a low quality tourist experience. Ownership of heritage sites is often linked to a national, regional or even local trust type enterprise. The costly maintenance of an historic asset is often only partially covered by profits from visitor revenues. In this case, the heritage site has to receive subsidies from lottery funds or from local and national taxes. Prices to access tourist attractions are often fixed and some parameters are unpredictable (how long will people stay, when will they arrive, which day of the week will be busiest, will people book in advance, when will they book?). National ownership of the heritage attraction raises a strong argument for not implementing differential pricing. However, by not implementing differential pricing, opportunities may be lost e.g. to lower cost subsidies from government and/or to raise benefits for local and national communities. Revenue management tactics could be utilised more creatively to overcome barriers to implementing differential pricing and to extract more from tourism heritage sites i.e. community engagement, responsible behaviour, increased levels of volunteerism, greater contribution to education and higher profits.
People can be nudged into making better choices through careful design of the environments in which
choices are made. Without choice architecture, people demonstrate the behaviour of habit. The three elements to consider when attempting changing habitual behaviour are default options, feedback and human error. (i) Default options are those that are presented as part of the product; a short volunteering stint could be presented to people, as a default option when booking a “special experience” while visiting the orang-utan park in Borneo (i.e. you would need to unselect it to proceed without that option). Default options are sticky as they have a very good chance of being selected (Sustein & Thaler, 2009), however care needs to be taken to ensure options are clear. (ii) People respond to feedback; for instance, light bulbs that glow darker shades of red as at home, which use higher levels of energy, help to reduce energy use in peak periods by 40 per cent. Hence there is a need to consider how to help people make the right choices when visiting a national heritage site (Sustein & Thaler, 2009). (iii) The third element of good choice architecture is expecting error; Google reminds users when they forget an attachment (when the word attachment is in the text of an email and an attachment is not included, it would prompt the user); The Save More Tomorrow program, that helps employees set aside future pay increases for retirement, is based on the same principle of expecting error. People make errors of judgment when deciding about a current action but can demonstrate more self-control when deciding about future events (Sustein & Thaler, 2009). Hence a program whereby social responsibility contributes to a future benefit may have a greater chance of success e.g. recent retirees may volunteer their time to provide basic care to someone
more elderly and infirm than themselves. This would allow to accumulate time for their own future care needs e.g. accompany the elderly person to a doctor’s appointment, check on them regularly, spend time visiting them to provide companionship, do their shopping or similar. Leading to increase the quality of care the elderly receive and perhaps decrease the financial burden imposed by such services (Oesch & Guldimann, 2008). The aim of this kind of venture is to reduce social costs and develop solidarity. One project of this kind is being set up in the Swiss town of St. Gall where it is hoped it will be a useful tool to combat loneliness, with volunteers introducing certain “small village” type social interaction to towns and city (Thoele, 2012). The next section will focus on how these ideas might be applied to a highly popular national art gallery. A discussion will follow on how revenue management could be applied with the specific goal of promoting social responsible behaviour in combination with the provision of a unique experience.
Art gallery’s that are creative have seen their attendance climb, despite the global recession. Big museums have taken advantage of their great collections while offering good value for money. Museums have made great strides in recent years as have built up audiences. They have got better at putting on exhibitions and marketing them and building up excitement. Art venues have become increasingly popular because museums have changed the way they view themselves. Previously they resembled academic institutions that begrudgingly opened to the public as part of a state funding deal, where the art historians saw themselves as having a proprietorial, guard-like job title with an inherently anti-public access ethos. More recently a new direction has emerged, turning museums into a visitor attraction or even a light, bright family-friendly venue (Pes & Sharpe, 2011). A poll launched by the Art Newspaper stated that nearly 8.9 million people visited the Louvre in Paris in 2011. In second place was the New York's Metropolitan Museum of Art followed by the British Museum, the National Gallery and the Tate Modern (Gomertz, 2011). The Louvre has topped the annual list since it began in 2007 notably because it is home to Leonardo da Vinci's Mona Lisa. However, the experience of seeing the Mona Lisa can be stressful as there is usually a crowd in front of the smallish painting, with noise and jostling making it hard to fully appreciate the work of art. The carrying capacity of the room where the painting is housed does not allow a rich visitor experience when it’s overcrowded; which it is most of the time. 35% of visitors’ are children/teenagers or older than 60, 57% are first time attendees (Ministère de la Culture et de la Communication, 2011). Solutions have to be implemented at the very least to optimise the customer experience. A temporary exhibition of Leonardo da Vinci paintings (one of the world’s most popular artists) was held in the National Gallery in London from November 2011 to February 2012. Despite the fact that the price of a ticket was fixed at £16, advance purchase tickets sold out rapidly leaving potential customers with little chance to get to see the exhibition. 500 tickets were available each day for a 30 minute slot to access the exhibition with large numbers of other people. Tickets for this exhibition were selling on eBay (.com/. co.uk) for over £200. We should not forget that the Mona Lisa is perhaps the most famous painting in the world. The strangeness of the portrait and the mysterious identity of the sitter have presented enduring inspiration to both writers and artists. Clearly the demand to see Leonardo’s work is very high; hence the potential to implement revenue management strategies, to optimise profit may also improve the quality of the tourist experience.
Revenue management implies frequent adjustments in the price of a product in response to certain
market factors, such as demand or competition (Oxford Dictionaries, 2011) also known as selling “the right inventory unit to the right customer at the right time for the right price” (Kimes, 2002). Revenue management also includes optimisation aspects related to distribution and customer-centric approaches involving social media. Revenue management can be deployed effective as long as cultural institutions have a relatively fixed capacity, a perishable inventory, segmentable markets, an advance reservations mechanism, and low marginal and high fixed costs. (Berman, 2005; Harewood, 2006; Kimes, 2002). Without revenue management, and in the presence of these conditions and peaky demand, profit erosion frequently occurs i.e. profit from good times is used to cover fixed costs in periods of weak demand. Revenue management tactics include therefore variable pricing and duration control. To capture maximum revenue opportunity, products are made widely available for a variety of segments in low demand periods and availability is restricted in high demand periods (Harewood, 2006). The control of inventory and prices relies on an accurate demand forecast, developed from plentiful, accurate and relevant data (Poelt, 2011). An understanding of customer purchase behaviour drives effective segmentation linked to customer profitability (Wade and Eagles, 2010). Analytic tools enable the analysis of online consumer behaviour through different sources such as travel agent Global Distribution System (GDS) reports. Grouping customers by purchase occasion and their price sensitivity helps optimise the unconstrained demand forecasts, product development and inventory allocation (El Gayar et al., 2011; Petrick, 2005; Tranter, Stuart-Hill and Parker, 2009). Constrained demand considers the number of customers served, thus the customers who could not be served due to full capacity and those who changed their mind (because of a long wait, a challenging website, or strict booking conditions) and did not want to be served are not considered. Adding this “frustrated” demand to realised demand allows access to unconstrained or total demand (Thompson, 2005). Only using constrained demand in the forecast is considered to be a poor strategy (Ratliff et al., 2008)
resulting in wrong yield tactics being applied. Accurately forecasting of unconstrained demand supports the mitigation of risk and uncertainty (Shim et al. 1994, in Steed and Gu, 2008). Deployed appropriately, forecasting can support the cultural institution to dynamically adapt to varying market conditions and ameliorate performance (Fildes and Beard, 1992; Wacker and Lummus, 2002). As well as enabling the timely control of inventory and price, the demand forecast permits efficient scheduling of operational staff, well in advance, precise purchasing of goods and, finally, the ability to calculate future profitability and cash flow more exactly (Hayes and Miller, 2011). Inventory is controlled by assigning and changing the number of the products available (Hayes and Miller, 2011), using a predetermined price ladder. The main purpose is to set limits on the number of reservations accepted for each segment (Harewood, 2006). The characteristics of products (i.e. does my visit include a viewing of the Mona Lisa, how many people will be in the room with me) have to be identified (Hayes and Miller, 2011). Inventory management requires developing a range of products that each appeal to specific market segments (El Gayar et al., 2011; Harewood, 2006). Hence it is crucial to know which product attributes attract which segment (Guadix, 2011; Hayes and Miller, 2011). Customers should be encouraged to book early and pay in advance, to improve cash flow and no-shows, as overbooking is an aspect of inventory control (Hadjinicola and Panayi, 1997; Hayes and Miller, 2009; Tranter, Stuart-Hill and Parker, 2009). Overbooking is defined as being when the number of reservations is higher than the number of products available (Hayes and Miller, 2011:227). Reservations are a key aspect in the overbooking process (Mastroeni and Naldi, 2011). Overbooking can be deliberate or happen accidentally, when inventory controls are not implemented proactively and/or unexpected events occur (Hayes and Miller, 2011) e.g. damaged products which cannot be sold, staff errors, inventory availability errors due to reservation system errors, visitors overstaying. Every sale generates costs (marketing, opportunity, transaction, production, finance); the aim is to find the right balance between the potential demand and the tickets which are actually sold, in order to maximise the net profit (Hadjinicola and Panayi, 1997; Liberman and Yechiali, 1978). Assigning variable prices during different demand periods (restricting availability of cheaper products) is known as price differentiation or discrimination (Phillips, 2005). The aim is to attract and retain the most profitable customers through the different approaches used in industries with different levels of price elasticity (Clemons et al., 2002). Prices are also influenced by the customers’ acceptance, competitor acceptance and the logistical difficulty of implementing price changes (Metters and Vargas, 1999).
A lower price could be proposed if a visitor is willing to offer some time to the museum or the
exhibition he/she wishes to visit. This time could also be saved in a new revenue management tool called “cultural time bank”, which could link revenue management with cultural heritage issues. Some insight may be gained from mechanisms that already exist. Residents in Totness (UK) use local pounds printed and traded locally to promote links between local businesses. The local currency keeps money circulating within the town's local economy, reducing trade miles and strengthens community relations and links with local producers. The people who choose to use the currency make a conscious commitment and take personal responsibility for the health and well-being of their community by laying the foundation of a thriving local economy. Plenty of other examples exist world-wide referring to people exchanging goods and services for a system of credits e.g. LETS (local exchange trading system). This is not bartering but an exchange of goods and services for LETS "points" which can be used to buy from any other member. Thus, a parallel economy is created (Sharp, 2008). Another example of alternative approaches to commerce is “Time Dollars” which seek to rebuild the core economy, rooted in family, extended family, neighbours and civil society purged of the elements of subordination, discrimination and exploitation that characterized the functioning of that economy in the past. This new “cultural time bank” can be linked with the success of time ecology issues. There are signs that the analysis of time is beginning to have consequences in space, for example in the urban environment. One symbolic example is the case of “Time Offices”. The role of such establishments, of which there are some in Italy, is to better reconcile the life rhythms of citizens which are increasingly individual and out of phase with the operation of public services (Matos-Wasem, 2004).
CONCLUSION Revenue management tactics could shape responsible tourist behaviour through encouraging the
creation of “cultural time banks”. It is envisaged that these be utilised to encourage socially responsible behaviour through a system of points or a tourism currency. The objective might be to leverage a local or national reward system to possibly offer unique tourist experiences or lower prices in exchange for behaviour that binds people more closely together. Tourist attractions may form clubs where members have the chance to demonstrate their responsiveness to such offers through action that draws diverse advantages. A time bank could e.g. allow those involved in volunteering to help the Louvre to receive some in kind unique advantage, for example dedicated time slots to visit the normally overcrowded gallery (before or after it opens to the public), multilevel priority- or fast-track queues, special events or specialized guided tours. To avoid social justice and equity conflicts which lead to lower customer satisfaction levels among the other visitors, all potential visitors
should be given the opportunity to volunteer for something, and earn a variety of benefits based on time on task. Credits could also be transferred from other programs that partner with the Louvre for example transportation and commerce around the Louvre whose services the Louvre depends on. It could even be envisaged to extend the benefits of this system to persons volunteering in other social areas to incentivize, stimulate these kinds of altruistic activities. A partnership could be envisaged with a care home for the elderly; spend time with an elderly person in exchange for credits to access a unique visit to the Louvre (or other heritage attraction). Other non-heritage attractions may also come on-board in order to meet obligations to contribute to the social fabric of society. Remaining in the area of cultural tourism, a time bank system could stimulate and decisively favour skills-based (or not) volunteering in the field of heritage protection and enhancement (maintenance of gardens, security, hospitality, painting and decorating, sanitation) but care would need to be taken to not create unfair competition for existing enterprises. In the same way as tourism timeshare properties have rules and regulations, several issues must be considered regarding the time allocation system. For example, would there be interest payable on time donated? Would tax need to be paid on benefits? Who does the time accumulated belong to; can it be sold on, given away, bequeathed? The ratio of hours to return for the range of experiences needs to be calculated. What should a person having contributed 10 hours of their time to manning a desk/picking up litter/ helping direct visitors be eligible for? Possibly a 5 minute-long 1:1 session with the Mona Lisa, while no other visitors present? Care needs to be taken to ensure paid work is not replaced with volunteers to avoid possible tension due to perceptions that profits are being maximizing in an unethical way. Hence the volunteering should possibly at first aim to provide over and above services that would not normally be affordable for the gallery or associated businesses such as services that enhance quality of visit or quality of life experiences in general. A points system could be developed (as it already exists in time-share businesses) to allow the exchange of hours, points, time dollars (U.S.), time credit (U.K.) or whatever other time-based currencies at other spatial levels. This could be compared to the loyalty points of miles offered by airline companies. It may be possible to get donations of points from other institutions thus enabling the time bank to enhance the offer. The Louvre would increase its profit both in the financial sense as well as referring to the “gain” or “advantage” drawn from the tourist experience itself. Responsible revenue management practices should be developed to use the demand for national heritage attractions as a lever to promoting socially responsible behaviour and social equity. Publicly owned attractions such as the Louvre should seek to maximize the tangible and intangible benefits by collaborating on the development of a “cultural time bank” or “cultural service exchange” device to function potentially at different levels: regional, national and international. To this end, an international network of cultural institutions would have to be created. Technological tools offer the opportunity to build diverse products, for example, smart phone applications could provide the tourist with real time information to enhance their visit experience and perhaps to provide options with regards to social activities related to accessing a more unique visitor experience. Coupled with revenue management techniques this should lead to a more satisfactory visit; with a reduction in, for example, over-usage and queues. Revenue management techniques and smartphone applications should be a part of a global management tools. The major input for tourism practitioners is the link with the tourists, the public and the private bodies in charge. Further steps will include the cooperation between tourism attractions to offer the best tourist experience ever within a destination. The authors of this paper hope to raise interest in this concept and will conduct further research in the area.
REFERENCES
Berman, B. (2005) “Applying Revenue management Pricing to Your Service Business”. Business Horizons, Vol. 48, No. 2, pp.169-179. Clemons, E.K., Hitt, L.M., Gu, B., Tatcher, M.E., Weber, B.W. (2002) “Impacts of e-Commerce and Enhanced Information on Final Services: A Quantitative Analysis of Transparency, Differential Pricing, and Disintermediation”. Journal of Financial Services Research, Vol. 22, No. 1-2, pp.73-90. El Gayar, N.F., Saleh, M., Atiya, A., El-Shishiny, H., Zakhary, A. A.Y. F., Habib, H.A.A.M. (2011) “An Integrated Framework for Advanced Hotel Revenue Management”. International Journal of Contemporary Hospitality Management, Vol. 23, No. 1, pp.84-98. Fildes, R., Beard, C. (1992) “Forecasting Systems for Production and Inventory Control”. International Journal of Operations and Production Management, Vol. 12, No. 5, pp.4-27. Gomertz, W. (2011) Louvre in Paris tops most visited art venue poll. Online at http://www.bbc.co.uk/news/entertainment-arts-17472587. Accessed May 7th, 2012. Guadix, J. (2011) “Practical Pricing for the Car Park Industry”. In: Yeoman, I., McMahon-Beattie, U. (eds.). Revenue Management – A Practical Pricing Perspective. Basingstoke: Palgrave Macmillan, pp. 234-245. Hadjinicola, G.C., Panayi, C. (1997) “The Overbooking Problem in Hotels with Multiple Tour-Operators”. International Journal of Operations & Production Management, Vol. 17, No. 9, pp. 874-885. Harewood, S.I. (2006) “Managing a Hotel’s Perishable Inventory Using Bid Prices”. International Journal of Operations & Production Management, Vol. 26, No. 10, pp. 1008-1122.
Hayes, D.K., Miller, A.A. (2011) Revenue Management for the Hospitality Industry. New Jersey: John Wiley & Sons, Inc. Kimes, S.E. (2002) “Perceived Fairness of Revenue management”. Cornell Hotel and Restaurant Administration Quarterly, Vol. 43, No. 1, pp. 21-30. Liberman, V., Yechiali, U. (1978) “On the Hotel Overbooking Problem – an Inventory System with Stochastic Cancellations”. Management Science, Vol. 24, No. 11, pp. 1117-1126. Matos-Wasem, R. (2004) “Can Slow Tourism Bring New Life to Alpine Regions”. In: Weiermair, K. and Mathies C. (eds.) (2004) The Tourism and Leisure Industry: Shaping the Future, New York, The Haworth Hospitality Press, pp. 93-103. Mastroeni, L., Naldi, M. (2011) “Pricing of Spectrum Reservation under Overbooking”. Electronic Commerce Research and Applications, Vol. 10, No. 5, pp. 565-575. Matthew, A., MacLaren, A., O’Gorman K., White C. (2012) “Priority queues: Where social justice and equity collide”, Tourism Management, 33, pp. 875-884. Metters, R., Vargas V. (1999) “Revenue management for the Nonprofit Sector”. Journal of Service Research, Vol. 1, No. 3, pp. 215–226. Oesch, T., Guldimann, J. (2008) Zeitgutschriften für die Begleitung, Betreuung und/oder Pflege älterer Menschen. Büro für Arbeits- und Sozialpolitische Studein Bass AG BSV. Online at http://www.bsv.admin.ch/themen/gesellschaft/00074/02391/index.html?lang=de . Accessed on June 3rd, 2012. Ministère de la Culture et de la Communication, Secrétariat général (2011) Musées : Chiffres Clés. http://www2.culture.gouv.fr/culture/deps/chiffres-cles2011/03-musees-2011.pdf Accessed on July 23rd, 2012. Oronsky, C.R., Chathoth, P.K. (2007) “An Exploratory Study Examining Information Technology Adoption and Implementation in Full-Service Restaurant Firms”. Hospitality Management, Vol. 26, No. 4, pp. 941-956. Oxford Dictionaries. (2011) Revenue management. Online at http://oxforddictionaries.com/definition/yield%2Bmanagement?q=yield+management. Accessed on 9th January, 2012. Pes, J. & Sharpe, E. (2011) “Attendance survey 2011: Brazil’s exhibition boom puts Rio on top”. Museums, Issue 234, April 2012. Online at: http://www.theartnewspaper.com/articles/Attendance%20survey%202011:%20Brazil%E2%80%99s%20exhibition%20boom%20puts%20Rio%20on%20top/26097. Accessed on May 7th, 2012. Petrick, J.F. (2005) “Segmenting Cruise Passengers with Price Sensitivity”. Tourism Management, Vol. 26, No. 5, pp. 753-762. Phillips, R.L. (2005) Pricing and Revenue Optimization. Stanford: Stanford Business Books. Poelt, S. (2011) “Practical Pricing and the Airline Industry”. In: Yeoman, I., McMahon-Beattie, U. (eds.). Revenue Management – A Practicle Pricing Approach. Basingstoke: Palgrave Macmillan. Ratliff, R.M., Venkateshwara Rao B., Narayan, C.P., Yellepeddi, K. (2008) “A Multi-Flight Recapture Heuristic for Estimating Unconstrained Demand from Airline Bookings“. Journal of Revenue and Pricing Management, Vol. 7, No. 2, pp. 153–171. Sharp R. (2008) “They don't just shop local in Totness - they have their very own currency”. Online at http://www.independent.co.uk/news/uk/this-britain/they-dont-just-shop-local-in-totnes--they-have-their-very-own-currency-818586.html. Accessed on June 2nd, 2012. Steed, E., Gu, Z. (2008) “Hotel Management Company Forecasting and Budgeting Practices: a Survey-Based Analysis”. International Journal of Contemporary Hospitality Management, Vol. 21, No. 6, pp. 676-697. Sustein C., Thaler, R. (2009) Nudge: Improving Decisions about Health, Wealth, and Happiness. Yale University Press. Thoele, A. (2012) “Economiser du temps pour vieillir tranquille”. Online at http://www.swissinfo.ch/fre/societe/Economiser_du_temps_pour_vieillir_tranquille.html?cid=32220566. Accessed on June 3rd, 2012. Thompson, G.M. (2005) “Using Information on Unconstrained Student Demand to Improve University Course Schedules”. Journal of Operations Management, Vol. 23, No. 2, pp. 197-208. Tranter, K., Staurt-Hill, T., Parker, H. (2008) An Introduction to Revenue Management for the Hospitality Industry – Principles and Practices for the Real World. New Jersey: Pearson Education Inc. Vinod, B. (2006) “Advances in Inventory Control”. Journal of Revenue and Pricing Management, Vol. 4, No. 4, pp. 367-415. Wacker, J.G., Lummus, R.R. (2002) “Sales Forecasting for Strategic Resource Planning”. International Journal of Operations and Production Management, Vol. 22, No. 9, pp. 1014-1031. Wade, D.J., Eagles, F.J. (2010) “The Use of Importance-Performance Analysis and Market Segmentation for Tourism Management in Parks and Protected Areas: An Application to Tanzania’s National Parks”. Journal of Ecotourism, Vol. 2, No. 3, pp. 196-212.
HUMAN-COMPUTER INTERACTION BETWEEN THE FORECASTING SUPPORT SYSTEM AND THE REVENUE MANAGER
Larissa Koupriouchina, B.Sc, M.A., M.Sc.*
Hotelschool The Hague Brusselselaan 2, 2587 AH, The Hague, NL
Email: [email protected]
Jean-Pierre van der Rest, Ph.D. Hotelschool The Hague
Brusselselaan 2, 2587 AH, The Hague, NL Email: [email protected]
and
Mark Dechesne, Ph.D.
Leiden University – Campus The Hague Koningin Julianaplein 10, 2595 AA, The Hague, NL
Email: [email protected]
Abstract
This study explores the differences in forecasting error between human judgment and a revenue management system. Whilst the study confirms findings in the literature that computers are superior in forecasting, it also finds that a revenue manager can outperform computers in specific segments. The paper concludes with suggestions for further academic research. Key Words: Revenue Management (RM), Forecasting, Forecasting Support System (FSS)
In hotel RM forecasting is a key factor to hotel success. FSS have been introduced to support these predictions. Academic work on forecasting reveals conflicting evidence comparing human judgment and statistical computer models. For the airline industry Zeni (2003) found limited evidence that, even when complex automated solutions are used, human analyst interference brings additional value. Other research outcomes suggest that a combination of judgmental and statistical methods should be employed (Bunn and Wright, 1991; Flores, Olson and Wolfe, 1992; Goodwin, 1996; Goodwin, 2000; Jorgensen, 2007; Franses, 2008). However, it has yet to be proven whether a computer is actually more accurate than a revenue manager. Here, we examine whether there is a difference in forecasting accuracy between a FSS and a revenue manager. Data were collected from an upscale international hotel in the Netherlands. The hotel makes use of a commercially available FSS. The following were provided: Computer and human estimates regarding occupancy for groups (>10 individuals) and non-groups (here: ‘transient’) for the period from January 2011 until May 2012.
Data were analyzed in a 2(Predictor: Human vs. Computer) x 2(Business: Group vs. Transient) x
3(Type of Business: Segment 1 vs. 2 vs. 3) within-subjects x 17 (Time: Month1 to Month 17) x 7 (Day: Day 1 to Day 7) between-subjects Analysis of Variance (ANOVA). Primary analysis focused on a significant interaction between Predictor and Business, F(1, 295)=6.88, p<.01, suggesting that accuracy of forecast by human and computer differed depending on Business. Means for this interaction are displayed in Table 1.
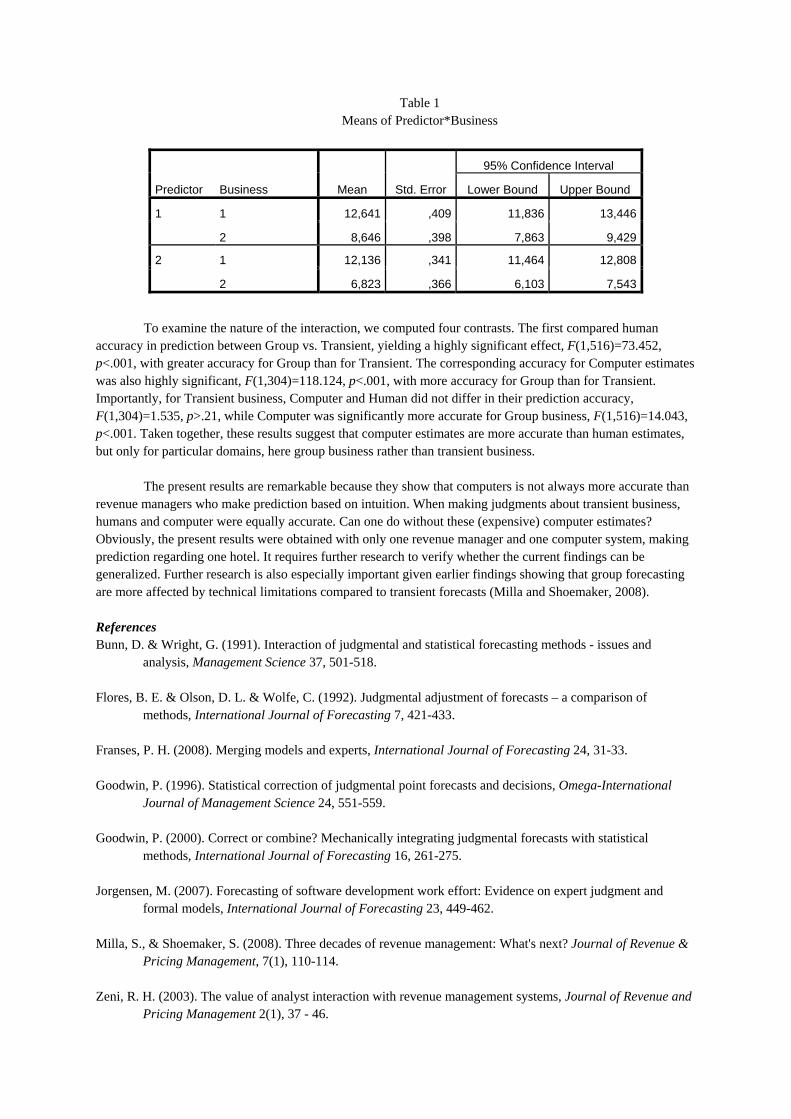
Table 1 Means of Predictor*Business
Predictor Business Mean Std. Error
95% Confidence Interval
Lower Bound Upper Bound
1 1 12,641 ,409 11,836 13,446
2 8,646 ,398 7,863 9,429
2 1 12,136 ,341 11,464 12,808
2 6,823 ,366 6,103 7,543
To examine the nature of the interaction, we computed four contrasts. The first compared human
accuracy in prediction between Group vs. Transient, yielding a highly significant effect, F(1,516)=73.452, p<.001, with greater accuracy for Group than for Transient. The corresponding accuracy for Computer estimates was also highly significant, F(1,304)=118.124, p<.001, with more accuracy for Group than for Transient. Importantly, for Transient business, Computer and Human did not differ in their prediction accuracy, F(1,304)=1.535, p>.21, while Computer was significantly more accurate for Group business, F(1,516)=14.043, p<.001. Taken together, these results suggest that computer estimates are more accurate than human estimates, but only for particular domains, here group business rather than transient business.
The present results are remarkable because they show that computers is not always more accurate than
revenue managers who make prediction based on intuition. When making judgments about transient business, humans and computer were equally accurate. Can one do without these (expensive) computer estimates? Obviously, the present results were obtained with only one revenue manager and one computer system, making prediction regarding one hotel. It requires further research to verify whether the current findings can be generalized. Further research is also especially important given earlier findings showing that group forecasting are more affected by technical limitations compared to transient forecasts (Milla and Shoemaker, 2008). References Bunn, D. & Wright, G. (1991). Interaction of judgmental and statistical forecasting methods - issues and
analysis, Management Science 37, 501-518. Flores, B. E. & Olson, D. L. & Wolfe, C. (1992). Judgmental adjustment of forecasts – a comparison of
methods, International Journal of Forecasting 7, 421-433. Franses, P. H. (2008). Merging models and experts, International Journal of Forecasting 24, 31-33. Goodwin, P. (1996). Statistical correction of judgmental point forecasts and decisions, Omega-International
Journal of Management Science 24, 551-559. Goodwin, P. (2000). Correct or combine? Mechanically integrating judgmental forecasts with statistical
methods, International Journal of Forecasting 16, 261-275. Jorgensen, M. (2007). Forecasting of software development work effort: Evidence on expert judgment and
formal models, International Journal of Forecasting 23, 449-462. Milla, S., & Shoemaker, S. (2008). Three decades of revenue management: What's next? Journal of Revenue &
Pricing Management, 7(1), 110-114. Zeni, R. H. (2003). The value of analyst interaction with revenue management systems, Journal of Revenue and
Pricing Management 2(1), 37 - 46.
Who’s in charge now? The Decision Autonomy of Hotel General Managers
Demian Hodari*
Ecole hôtelière de Lausanne Route de Cojonnex 18
1000 Lausanne 25 Switzerland
Will Hobden
Ecole hôtelière de Lausanne Route de Cojonnex 18
1000 Lausanne 25 Switzerland
Abstract
Hotel general managers are the executives with most responsibility for the operating and financial performance of their hotels. Developments in hotel governance structures arising from the growth of hotel management contracts have called into question the level of decision autonomy for some general managers however. The shift from owner-operated model to one where properties are owned by one entity and contracted to management means that some general managers report to only the hotel’s owner and may thus have significant decision-making autonomy, especially since many owners are not hotel specialists but rather real estate investors. At the same time general managers of chain-managed hotels must not only report to the property owners, but also to the hotel management company’s corporate executives and must therefore follow corporate-wide standard operating procedures while also meeting corporate objectives. Previous research has found that GMs have more experience and training in operations, marketing and human resources than in finance and strategy.
This study hypothesized that general managers of independent hotels would have significantly higher levels of autonomy than their colleagues overseeing chain-managed properties. A second hypothesis postulated that general managers, regardless of which type of hotel they directed, would have more autonomy in marketing, human resources and operations than in finance and strategy.
This data for this study was collected through a questionnaire answered by 117 general managers of upscale and luxury hotels from both chain and independently-operated hotels in Europe. Paired two sample t-tests were conducted in order to identify any statistically significant differences. The study found that general managers have significantly less autonomy in the area of finance and a relatively high level in marketing as compared to the other areas. It also confirmed that general managers of independent hotels have significantly more decision autonomy than those operating chain-managed hotels in the areas of operations, marketing and human resources, but surprisingly not in finance and strategy. The paper provides implications for management and suggestions for future research.
Keywords: Hotel General Manager, Decision Autonomy
An Examination of Franchisee Business Start Up through an Entrepreneurial Lens
Maureen Brookes* Oxford School of Hospitality Management
Oxford Brookes University, UK [email protected]
&
Levent Altinay
Oxford School of Hospitality Management Oxford Brookes University, UK
Ruth Yeung
Institute for Tourism Studies, Macau
Abstract (120 words) This paper seeks to contribute to a long standing debate as to whether franchisees are entrepreneurs. Specifically, it adopts a process perspective of entrepreneurship to examine the processes employed by franchisees to identify and exploit opportunities in their business start up. Using a qualitative mixed sector study of Macau, the paper reveals that franchisees exhibit different degrees of entrepreneurship in relation to their proactivity, risk taking propensity and autonomy and dependent on the type of franchise agreement and the franchisees’ long term goals. In addition is identifies the role of social networks in opportunity identification, particularly when franchisees lack prior industrial experience.
Keywords: Franchising, entrepreneurship, opportunity identification, opportunity exploitation
HOSPITALITY FOR A BETTER WORLD: IS THE HOSPITALITY INDUSTRY MITIGATING ITS ENVIRONMENTAL IMPACTS? AN EMPIRICAL STUDY ON THE HOTELIERS’ PERCEPTIONS
OF ONLINE SELF-AUDIT TOOLS AND THE BARRIERS AND MOTIVATORS TO INVEST IN GREEN AND ENERGY EFFICIENT TECHNOLOGIES
Willy Legrand* International University of Applied Sciences Bad Honnef – Bonn
Muelheimerstrasse 38 Bad Honnef 53604, Germany
Email: [email protected]
Cornelius Kirsche International University of Applied Sciences Bad Honnef – Bonn
Muelheimerstrasse 38 Bad Honnef 53604, Germany
Email: [email protected]
Philip Sloan International University of Applied Sciences Bad Honnef – Bonn
Muelheimerstrasse 38 Bad Honnef 53604, Germany
Email: [email protected]
and
Claudia Simons-Kaufmann International University of Applied Sciences Bad Honnef – Bonn
Muelheimerstrasse 38 Bad Honnef 53604, Germany
Email: [email protected]
Abstract
The hospitality industry emits substantial carbon dioxide from the use of energy in operations. A cross-sectional research among 4000 hotel general managers was conducted assessing the barriers and motivators to sustainability investments and the use of online self-audit tools resulting in an 8,8% response rate. Although government sponsored incentives have been widely established, the lack of financial means and pressure on profitability remain the key barriers for sustainability investments. On the other hand, the cost reduction potential from mitigating environmental impacts accounts for the greatest motivator. In the light of continuous energy cost increases, improving energy efficiency has become the ultimate goal for hoteliers in regards to sustainability investments and a key issue in using online self-audit tools.
Key Words: environmental impacts, online audits, barriers, motivators.
INTRODUCTION
The tourism industry at large is estimated to be responsible for 5% of the world’s carbon dioxide (CO2) gas emissions (UNEP, 2011). The hotel sector represents 20% of the tourism industry’s emissions – in other words 1% of all CO2 gas emissions (UNEP, 2011). The hospitality industry is also known for its intense use of water and production of solid as well as liquid waste (Sloan et al., 2009). Some hospitality industry leaders and managers with foresight understood that it makes business sense to turn around the operations and look at ways to: (1) implement energy efficient (EE) technologies within the operations and (2) increase the use of renewable energy (RE). Almost two decades ago, research demonstrated that there were however significant barriers for hoteliers to invest in sustainability measures such as high capital costs and a lack of knowledge in environmental issues (Post and Altman, 1994). In a research undertaken by Sloan, Legrand and Chen a decade ago, German hoteliers showed reservations concerning improved profitability resulting from the implementation of environmental management systems, indicating that the perceived high investment linked to mitigating environmental impacts acts as a barrier (2004). Now with constant interest in environmental issues and with multiple incentive programmes in place the question can be asked, have the barriers and motivators to undertake investments in mitigating the environmental impacts changed? If so, what then needs to be done to put words into actions?
BARRIERS AND MOTIVATORS TO INVEST IN SUSTAINABILITY
Post and Altman classified the barriers preventing environmental adoption as (1) industrial and (2)
organisational barriers (1994). The (1) industrial dimension is influenced by the activities a business carries out and the organizational dimension refers to the business itself. Capital costs, competition, regulatory constraints and the lack of information and technical knowledge can be found as being the major barriers to sustainability advancements in the industrial dimension (Murillo-Luna et al., 2007). Post and Altman stated that (2) internal constraints and organizational barriers to the adaptation to green ideas do exist (1994). In fact, employee attitudes, insufficient management leadership, lack of communication and the issue of behavioural patterns resulting from past practice seem to be important corporate barriers to environmental strategy making (Murillo-Luna et al., 2007). One major barrier to the implementation of sustainability is the “general lack of knowledge in relation to environmental issues and strategies, compounded by a perceived lack of information and support particularly found in small and medium enterprises” (Hillary, 2000: 1). Regarding economic and financial aspects, Nidumolu, Prahalad and Rangaswami argued that modern executives believe that they must decide between social and environmental benefits to sustainability and the costs of implementation (2009). It is important to stipulate that “fewer hotel businesses recognize the financial benefits associated with the implementation of environmental initiatives” (Graci and Dodds, 2008: 256). Indeed, the notion that “sustainability is expensive” is deeply anchored in society and has become a widespread fallacy. However, an analysis of 30 major companies clearly showed that sustainability brings organizational and technological innovations with clear long-term cost benefits and additional revenue generation (Nidumolu et al., 2009). In addition to financial aspects, time invested as well as the management skills required to implement a sustainability strategy also greatly contribute to the resistance felt by hoteliers. Finally, the lack of interest in the topic of sustainability coupled with the missing business relevance are further barriers identified in various researches (Hobson & Essex, 2001; Sloan et al., 2004). As a summary, the overall lack of knowledge in relation to long-term financial profitability and the missing responsibility towards environmental reporting and strategies are the main obstacles for not implementing sustainability (Doody, 2009). However, “market forces have seemingly evolved to a point where sustainable and socially responsible business practices either break even or prove profitable” (Sneirson, 2009: 1022).
While the general perception is that financial constraints resulting from investing in sustainability are one of the greatest barriers, the possible long-term cost savings as well as the incentives offered to companies investing in green technologies are perceived as strong motivators in three independent studies (Sloan et al., 2004; Bohdanowicz, 2005; Miller an Washington, 2009). Companies also embrace sustainability trying to make use of a potential image improvement (Lubin and Esty, 2010). Image enhancement is yet another motivator as identified in a study by Hahn and Scheermesser (2006). A hotel implementing sustainability can also benefit from an improved competitive position when entering a market niche of environmental-friendly
products and services (Graci and Dodds, 2008). Corporate decision to move towards sustainable or responsible management may equally be motivated by ethical motives or institutional pressures or simply by a ‘feel-good factor’ (Bansal and Roth, 2000; Hahn and Scheermesser, 2006). Since, overall positive work satisfaction and enhanced employee moral were short-term benefits encountered in companies implementing a sustainability strategy; those components are also considered to be motivators (Bansal and Roth, 2000).
SELF-AUDIT & CONSULTATION ONLINE TOOLS
The development of information technology (IT) contributes towards 2% of global CO2 emissions
through the development, manufacturing, shipping and lifetime usage of the equipment (Boccaletti et al., 2008). However, the use of IT can equally and heavily contribute to overall reduction in CO2 emissions (Ertel, 2009). Beside the general advantages such as increased efficiency in all processes in hotels (e.g. reservation, check-in/out, housekeeping and maintenance management scheduling), the hospitality industry can greatly benefit from the use of online content on the long road to sustainability. On that bumpy path are some self-help online tools supporting hoteliers in auditing their operations and leading to informed decision making. One of the most recent online tools is the Hotel Energy Solution (HES) online toolkit. The HES toolkit is the result of a partnership between the United Nations World Tourism Organization (UNWTO), the United Nations Environment Programme (UNEP), the International Hotel and Restaurant Association (IH&RA), the French Agence de l'Environnement et de la Maîtrise de l'Énergie (Environment and Energy Management Agency or ADEME) and the European Renewable Energy Council (EREC). HES helps small and medium-sized hoteliers to measure, analyze and reduce energy consumption and CO2 emissions in their operations (HES, 2011). The basic concepts behind HES and other online tools are for hotels to enter specific details including: occupancy rate, energy usage, energy costs, resources used for maintaining the buildings, and efforts already undertaken to improve sustainability to name but a few. The online tools evaluate energy efficiency and respective carbon footprint created by the hotel(s). In addition, tips and recommendations for investment with estimated returns on investment are presented, helping the managers and owners of hotel properties to achieve a higher level of energy efficiency. Online self reporting software also serves as an industry benchmarking tool.
STUDY AIMS
The study aims are threefold: (1) to contrast the motivators, barriers and strategies to investments in
green technologies identified in the literature to those collected by primary research in order to forward the body of knowledge on the subject (2) to analyse the perceptions of hoteliers towards online self-help tools and (3) to formulate a set of recommendations on the potential of online self-help tools as a guiding mechanism for improvement towards mitigating environmental impacts.
METHODOLOGY
The study conducted email surveys to gather the necessary data while structured questionnaires were
used as the instrument of assessing the opinions of hotel managers in regard to barriers, motivators and strategies in investing in green technologies as well as the potential for online self-help tools that mitigate environmental impacts. This current study is the sequel of a prior exploratory study.
Questionnaire Development
Regarding questionnaire development, a two-stage approach entailing qualitative and quantitative research techniques was implemented. Several personal interviews were first conducted with experts, including 5 general managers in the region of Bonn, Germany. Those hoteliers also participated in pilot-testing for the HES online toolkit and were deemed to be aware of current issues regarding self-help online tools. The goal of expert interviews was mainly to solicit general opinions pertaining to the structure, length, wording and content of the questionnaire.
The questionnaire encompasses five sections all in line with the objectives of this study. Following a text summarizing the aim of the research and the importance of the hotelier’s contribution to this study, the first
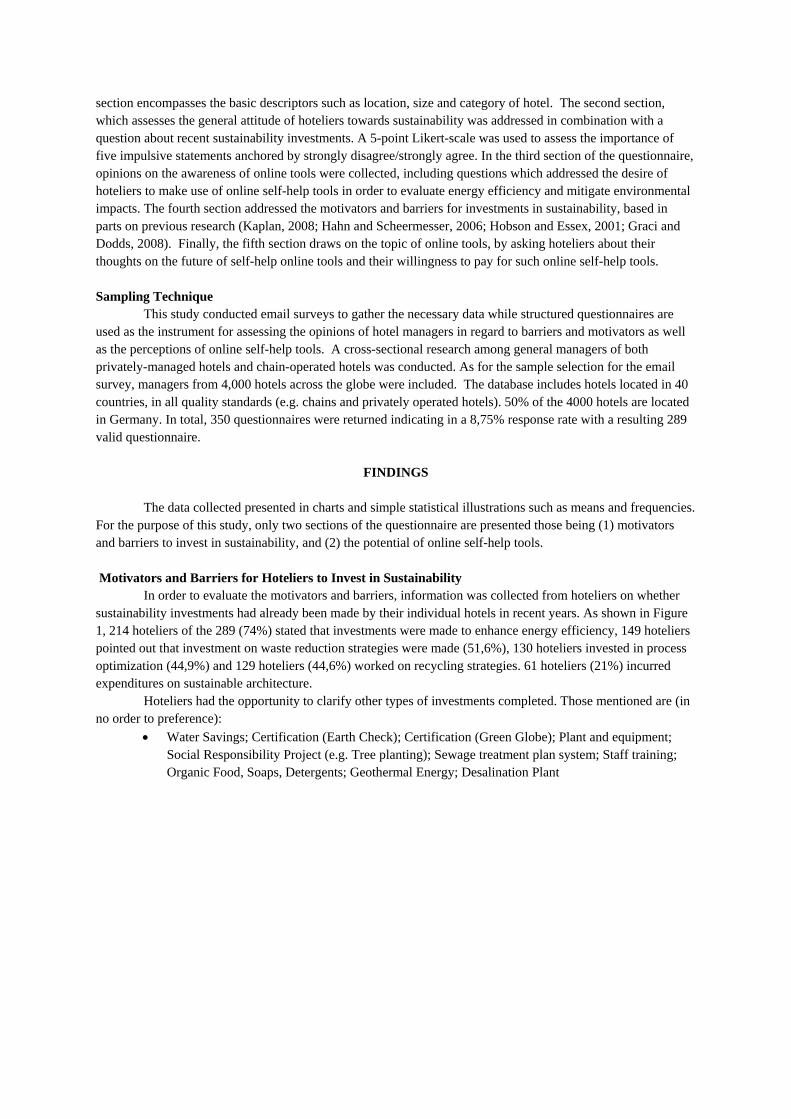
section encompasses the basic descriptors such as location, size and category of hotel. The second section, which assesses the general attitude of hoteliers towards sustainability was addressed in combination with a question about recent sustainability investments. A 5-point Likert-scale was used to assess the importance of five impulsive statements anchored by strongly disagree/strongly agree. In the third section of the questionnaire, opinions on the awareness of online tools were collected, including questions which addressed the desire of hoteliers to make use of online self-help tools in order to evaluate energy efficiency and mitigate environmental impacts. The fourth section addressed the motivators and barriers for investments in sustainability, based in parts on previous research (Kaplan, 2008; Hahn and Scheermesser, 2006; Hobson and Essex, 2001; Graci and Dodds, 2008). Finally, the fifth section draws on the topic of online tools, by asking hoteliers about their thoughts on the future of self-help online tools and their willingness to pay for such online self-help tools.
Sampling Technique
This study conducted email surveys to gather the necessary data while structured questionnaires are used as the instrument for assessing the opinions of hotel managers in regard to barriers and motivators as well as the perceptions of online self-help tools. A cross-sectional research among general managers of both privately-managed hotels and chain-operated hotels was conducted. As for the sample selection for the email survey, managers from 4,000 hotels across the globe were included. The database includes hotels located in 40 countries, in all quality standards (e.g. chains and privately operated hotels). 50% of the 4000 hotels are located in Germany. In total, 350 questionnaires were returned indicating in a 8,75% response rate with a resulting 289 valid questionnaire.
FINDINGS
The data collected presented in charts and simple statistical illustrations such as means and frequencies.
For the purpose of this study, only two sections of the questionnaire are presented those being (1) motivators and barriers to invest in sustainability, and (2) the potential of online self-help tools.
Motivators and Barriers for Hoteliers to Invest in Sustainability
In order to evaluate the motivators and barriers, information was collected from hoteliers on whether sustainability investments had already been made by their individual hotels in recent years. As shown in Figure 1, 214 hoteliers of the 289 (74%) stated that investments were made to enhance energy efficiency, 149 hoteliers pointed out that investment on waste reduction strategies were made (51,6%), 130 hoteliers invested in process optimization (44,9%) and 129 hoteliers (44,6%) worked on recycling strategies. 61 hoteliers (21%) incurred expenditures on sustainable architecture.
Hoteliers had the opportunity to clarify other types of investments completed. Those mentioned are (in no order to preference):
Water Savings; Certification (Earth Check); Certification (Green Globe); Plant and equipment; Social Responsibility Project (e.g. Tree planting); Sewage treatment plan system; Staff training; Organic Food, Soaps, Detergents; Geothermal Energy; Desalination Plant
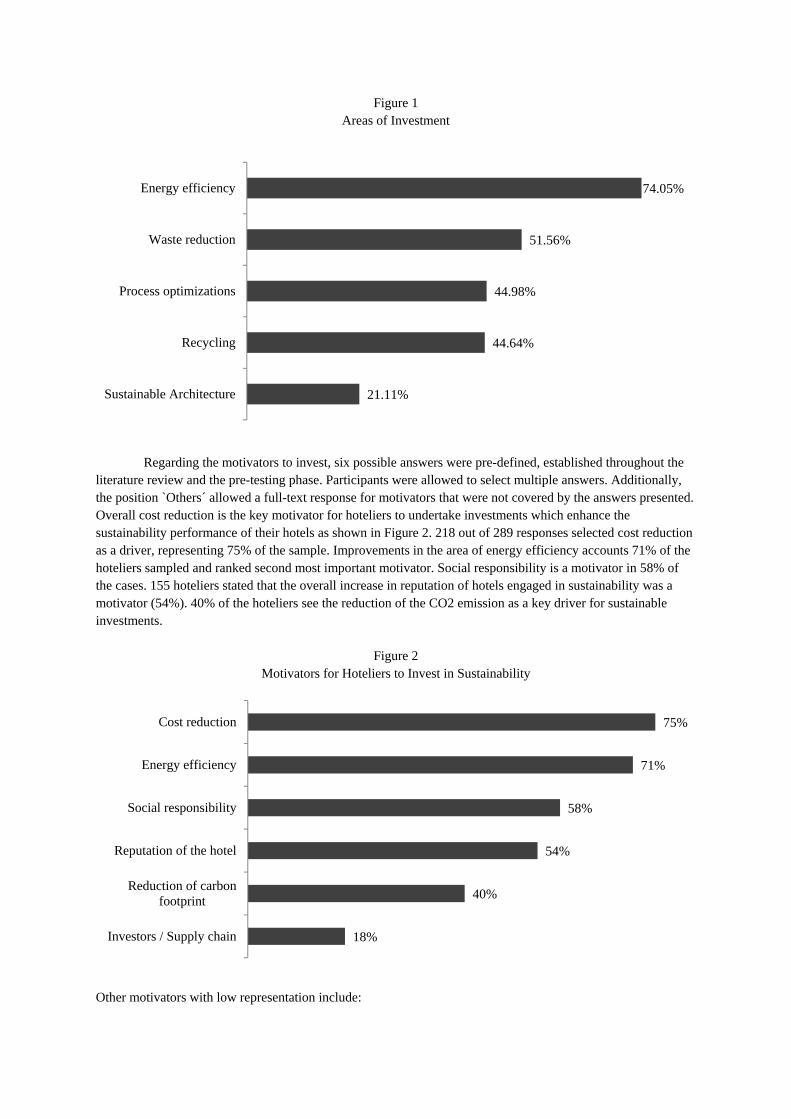
Figure 1 Areas of Investment
Regarding the motivators to invest, six possible answers were pre-defined, established throughout the
literature review and the pre-testing phase. Participants were allowed to select multiple answers. Additionally, the position `Others´ allowed a full-text response for motivators that were not covered by the answers presented. Overall cost reduction is the key motivator for hoteliers to undertake investments which enhance the sustainability performance of their hotels as shown in Figure 2. 218 out of 289 responses selected cost reduction as a driver, representing 75% of the sample. Improvements in the area of energy efficiency accounts 71% of the hoteliers sampled and ranked second most important motivator. Social responsibility is a motivator in 58% of the cases. 155 hoteliers stated that the overall increase in reputation of hotels engaged in sustainability was a motivator (54%). 40% of the hoteliers see the reduction of the CO2 emission as a key driver for sustainable investments.
Figure 2
Motivators for Hoteliers to Invest in Sustainability
Other motivators with low representation include:
21.11%
44.64%
44.98%
51.56%
74.05%
Sustainable Architecture
Recycling
Process optimizations
Waste reduction
Energy efficiency
18%
40%
54%
58%
71%
75%
Investors / Supply chain
Reduction of carbonfootprint
Reputation of the hotel
Social responsibility
Energy efficiency
Cost reduction
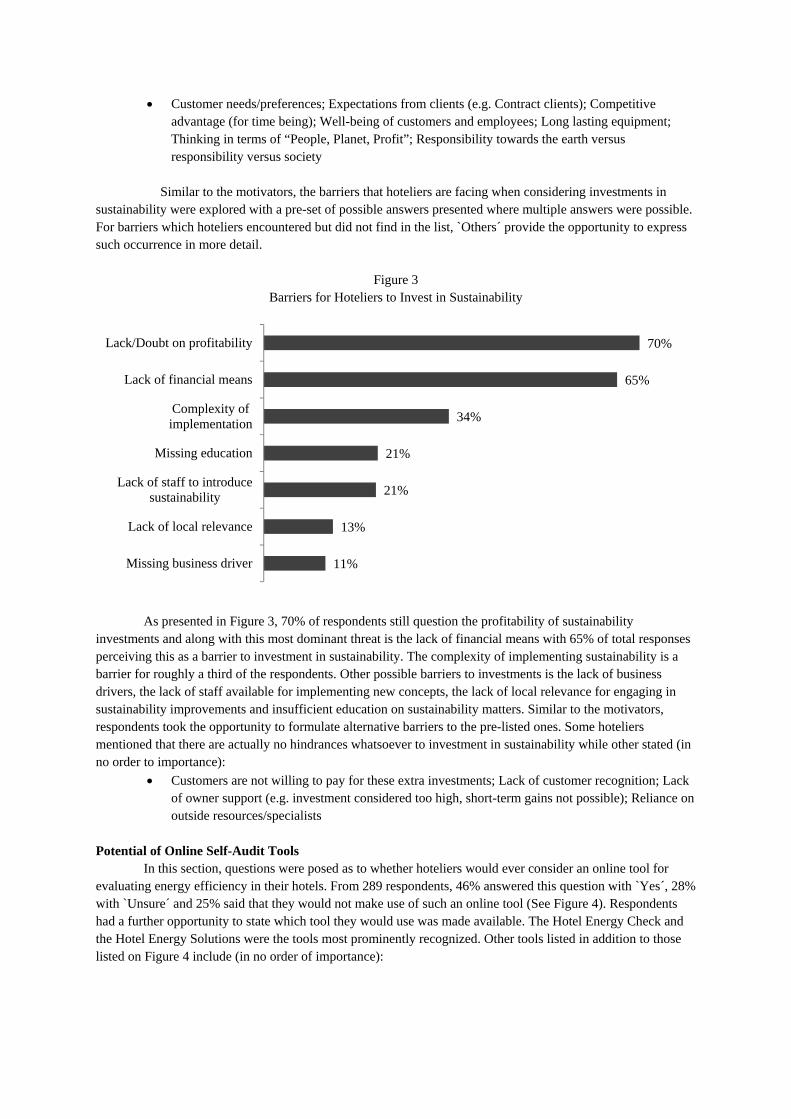
Customer needs/preferences; Expectations from clients (e.g. Contract clients); Competitive advantage (for time being); Well-being of customers and employees; Long lasting equipment; Thinking in terms of “People, Planet, Profit”; Responsibility towards the earth versus responsibility versus society
Similar to the motivators, the barriers that hoteliers are facing when considering investments in
sustainability were explored with a pre-set of possible answers presented where multiple answers were possible. For barriers which hoteliers encountered but did not find in the list, `Others´ provide the opportunity to express such occurrence in more detail.
Figure 3 Barriers for Hoteliers to Invest in Sustainability
As presented in Figure 3, 70% of respondents still question the profitability of sustainability
investments and along with this most dominant threat is the lack of financial means with 65% of total responses perceiving this as a barrier to investment in sustainability. The complexity of implementing sustainability is a barrier for roughly a third of the respondents. Other possible barriers to investments is the lack of business drivers, the lack of staff available for implementing new concepts, the lack of local relevance for engaging in sustainability improvements and insufficient education on sustainability matters. Similar to the motivators, respondents took the opportunity to formulate alternative barriers to the pre-listed ones. Some hoteliers mentioned that there are actually no hindrances whatsoever to investment in sustainability while other stated (in no order to importance):
Customers are not willing to pay for these extra investments; Lack of customer recognition; Lack of owner support (e.g. investment considered too high, short-term gains not possible); Reliance on outside resources/specialists
Potential of Online Self-Audit Tools
In this section, questions were posed as to whether hoteliers would ever consider an online tool for evaluating energy efficiency in their hotels. From 289 respondents, 46% answered this question with `Yes´, 28% with `Unsure´ and 25% said that they would not make use of such an online tool (See Figure 4). Respondents had a further opportunity to state which tool they would use was made available. The Hotel Energy Check and the Hotel Energy Solutions were the tools most prominently recognized. Other tools listed in addition to those listed on Figure 4 include (in no order of importance):
11%
13%
21%
21%
34%
65%
70%
Missing business driver
Lack of local relevance
Lack of staff to introducesustainability
Missing education
Complexity ofimplementation
Lack of financial means
Lack/Doubt on profitability
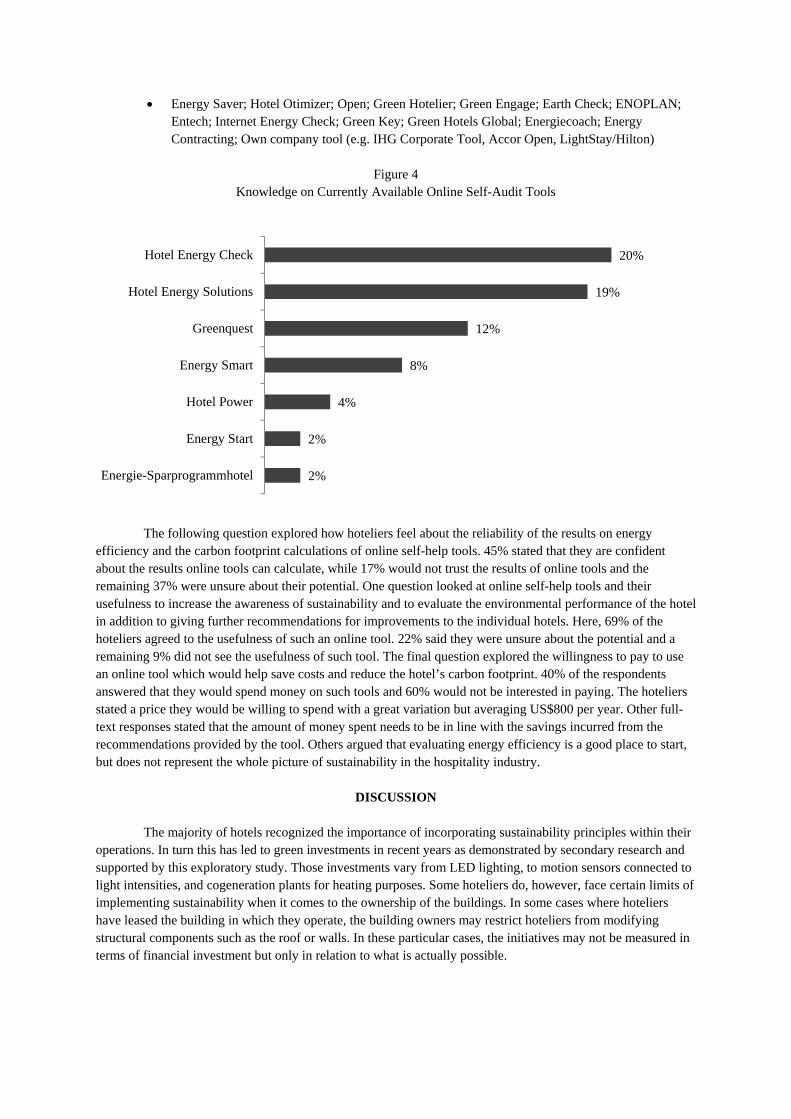
Energy Saver; Hotel Otimizer; Open; Green Hotelier; Green Engage; Earth Check; ENOPLAN; Entech; Internet Energy Check; Green Key; Green Hotels Global; Energiecoach; Energy Contracting; Own company tool (e.g. IHG Corporate Tool, Accor Open, LightStay/Hilton)
Figure 4
Knowledge on Currently Available Online Self-Audit Tools
The following question explored how hoteliers feel about the reliability of the results on energy
efficiency and the carbon footprint calculations of online self-help tools. 45% stated that they are confident about the results online tools can calculate, while 17% would not trust the results of online tools and the remaining 37% were unsure about their potential. One question looked at online self-help tools and their usefulness to increase the awareness of sustainability and to evaluate the environmental performance of the hotel in addition to giving further recommendations for improvements to the individual hotels. Here, 69% of the hoteliers agreed to the usefulness of such an online tool. 22% said they were unsure about the potential and a remaining 9% did not see the usefulness of such tool. The final question explored the willingness to pay to use an online tool which would help save costs and reduce the hotel’s carbon footprint. 40% of the respondents answered that they would spend money on such tools and 60% would not be interested in paying. The hoteliers stated a price they would be willing to spend with a great variation but averaging US$800 per year. Other full-text responses stated that the amount of money spent needs to be in line with the savings incurred from the recommendations provided by the tool. Others argued that evaluating energy efficiency is a good place to start, but does not represent the whole picture of sustainability in the hospitality industry.
DISCUSSION
The majority of hotels recognized the importance of incorporating sustainability principles within their
operations. In turn this has led to green investments in recent years as demonstrated by secondary research and supported by this exploratory study. Those investments vary from LED lighting, to motion sensors connected to light intensities, and cogeneration plants for heating purposes. Some hoteliers do, however, face certain limits of implementing sustainability when it comes to the ownership of the buildings. In some cases where hoteliers have leased the building in which they operate, the building owners may restrict hoteliers from modifying structural components such as the roof or walls. In these particular cases, the initiatives may not be measured in terms of financial investment but only in relation to what is actually possible.
2%
2%
4%
8%
12%
19%
20%
Energie-Sparprogrammhotel
Energy Start
Hotel Power
Energy Smart
Greenquest
Hotel Energy Solutions
Hotel Energy Check
On Motivators Key drivers for sustainability investments are lowering overall costs and conversely, hoteliers perceive
the cost issues as one of the main barriers to investment. Hoteliers seem to be in a typical causality dilemma whereby money must be invested in order to save money. A number of research studies have listed potential motivators and barriers hoteliers have when investing in sustainability. Issues of environmental protection, reducing expenditures and improving image were identified as key motivators. This exploratory study shows that the potential for cost savings and the improvement of energy efficiency are the primary motivators. The increased energy costs for hoteliers over the past decade may explain the increased importance of the ‘energy efficiency’ factor” as a motivator for investment. The enhanced reputation of hotels undertaking sustainability initiatives plays a major role in motivating hoteliers. With increased public scrutiny, it does not come as a surprise that positive activities are rewarded with peer and consumer recognition.
On Barriers
The literature identifies the lack of interest, initial financial cost, lack of information and support and the overall complexity of implementation (Hobson and Essex, 2001; Dybdahl and Eggert, 2010) as being the most predominant barriers to implementing sustainable management systems. A clear majority of respondents stating that the lack of financial means is a predominant barrier to investments in sustainability is in line to previous studies undertaken on the subject. The barrier is even bigger when coupled with the hoteliers’ uncertainty on the profitability potential of sustainability investments in the long-term. There seems to be a need for clearer information on the return on investment of each option linked to sustainability so that hoteliers can make informed decisions. It was found that hoteliers would be willing to make use of online self-help tools to evaluate their hotel’s energy efficiency.
On Self-Audit Online Tools
There is a real scarcity of information in regards to the value and use of online self-help tools in particular relating to the hospitality sector. Hoteliers that already had experience with online self-help tools were all members of a hotel chain that had internal evaluation programs. The opinion about such tools varies strongly among the hoteliers. 46% would consider using an online tool and 28% are rather unsure if they would do so. This is a clear indicator that online tools have a potential to help in mitigating environmental impacts via measurement and recommendations but there is a definite need for information and education on both the technicalities and possibilities offered by those online tools. 17% of the hoteliers believe that an online tool does not have the potential to calculate sophisticated results. As experienced in the pre-testing phase, hoteliers found it difficult to judge an online tool which they have never used before and which aims to support hoteliers in a complex area of operations such as energy efficiency. Nearly three quarters of the respondents stated that online self-help tools would raise the overall awareness of the topic of sustainability. Since the online tool completes the work of ‘consultants’, a majority of hoteliers would be willing to pay for an online tool capable of undertaking an energy audit and benchmarking possibilities coupled with giving a set of recommendations and a return on investment calculation. This shows that, to a certain extent, hoteliers are willing to invest in order to be given better guidance in their decisions making for sustainability investments. With the launch of the free-of-charge Hotel Energy Solutions eTool kit in 2011, the hospitality industry may establish itself at the forefront in mitigating its 1% share of the global CO2 emissions
RECOMMENDATIONS, LIMITATIONS AND FUTURE RESEARCH
The potential for the hospitality industry to become more environmentally friendly is enormous. From
waste reduction programmes to water saving techniques, from energy efficient technologies to employee training, much resides in the hands of the managers during daily operations. However, for larger investments such as building technologies, green technologies and refurbishment, barriers and motivators play an important role in the final investment decisions. While a few hoteliers may have the luxury of intrinsic motivation towards sustainability, for the larger share of hoteliers, implementing sustainability is driven by profit margins. Many have realised that combining environmental stewardship and business strategy is a driver for economic value. As demonstrated in this exploratory study, with energy prices on the rise, there is automatically a strong
incentive for sustainability advancements in the context of reducing the overall energy usage. In order for hoteliers to make informed decisions about investing in energy efficiency technologies and potentially renewable energy sources, a clear understanding of the current energy usage is necessary. This is where free-of-charge self-help online tools such as the HES can help hoteliers. By entering current data on energy usage and basic data about the hotel property and service, the tool performs a series of calculations leading to a relatively clear benchmarked picture and energy performance of the building. One design concept of such tool is to bypass consultants and their fees in the first phase of analysis since this can be completed by the hotelier or chief engineer at property. Since the majority of respondents could not name any online evaluation tool currently operating, there is a clear need for information and education. Local, regional or national hotel associations should embark on information campaigns directed at hoteliers on energy consumption and the use of similar online evaluation tools. Since the majority of respondents have trust in the power of such tools, there needs to be a system of assistance in place, in form of online videos for example. The authors recommend developing a tool which goes beyond energy efficiency and carbon footprints to include more environmental factors and the social dimensions of sustainability. Improved benchmarking across hotel categories and geographical locations is also a feature needed, thus, enabling hoteliers to learn from each other and share knowledge, experience and ideas.
LIMITATIONS
This research is exploratory in its nature and holds a certain number of limitations. The selection of the
sample has a major influence on the potential for generalizing results. In non-probability samples, the general application is regarded as unreliable since not every member of the target population had an equal chance of being selected. The content of the questionnaire was mainly influenced by the literature review with some sources published a decade ago. In the field of sustainability, barriers and motivators may change rapidly depending on the economic and or political situation within a country. Questions relating to the online self-help tool are difficult to analysis since some hoteliers were just not aware of the existence of online self-help tools. Most of the questions on online self-help tools are limited to energy efficiency and carbon footprint calculations. Therefore, the focus is only on just a few aspects of sustainability and not on a wide range of topics which could have included waste reduction and water consumption.
FUTURE RESEARCH
In a first stage, future research should assess the effect online self-help tools have on barriers and
motivators for hoteliers in implementing sustainability at their hotels. In a second stage, research could evaluate what effect online tools really have on the actual investment decisions and the knock-on effect of those investments in terms of savings, reputation, image and so on.
REFERENCES
Bansal, P., & Roth, K.(2000). Why Companies Go Green: A Model of Ecological Responsiveness. Academy of
Management Journal, 43(4): 717-736. Boccaletti, G., Löffler, M., and Oppenheim, J.M. (2008). How IT can cut carbon emissions.
http://www.mckinseyquarterly.com/How_IT_can_cut_carbon_emissions_2221. [Accessed the 24th of May 2012, 09:45]
Doody, H. (2009). What are the Barriers to Implementing Environmental Practices in the Irish Hospitality Industry? Shannon College of Hotel Management. Http://www.shannoncollege.com/wp-content/uploads/2009/12/THRIC-2010-Full-Paper-H.-Doody.pdf. [Accessed the 22nd of February 2012, 20:22]
Dybdahl, A. & Eggert, A. (2010). Survey of Sustainable Efforts of Businesses in Wisconsin. https://mywebspace.wisc.edu/tleggert/ Sustainability%20Website/council/survey/2010_Survey_large_business_report%20High%20quality.11.1.10.pdf. [Accessed the 24th of May 2012, 09:55]
Ertel, S. (2009). WWF Studies Find Information Technology Significantly Reduces Climate Impacts, Costs Of Doing Business. http://www.worldwildlife.org/who/media/press/2009/WWFPresitem11941.html. [Accessed the 24th of May 2012, 09:47]
Graci, S., & Dodds, R. (2008). Why Go Green? The Business Case for Environmental Commitment in the Canadian Hotel Industry. Anatolia: An International Journal of Tourism & Hospitality Research, 19(2): 251-270.
Hahn, T., & Scheermesser, M. (2006). Approaches to corporate sustainability among German companies. Corporate Social Responsibility & Environmental Management, 13(3): 150-165.
HES (2011). Supports the adoption of energy efficiency and renewable energy technologies. http://hes.e-benchmarking.org/. [Accessed the 24th of May 2012, 09:50]
Hillary, R. (ed.) (2000). Small and medium sized enterprises and the environment. Greenleaf: Sheffield,. Hobson, K., & Essex, S. (2001). Sustainable Tourism: A View from Accommodation Businesses. Service
Industries Journal, 21(4): 133-146. Kaplan, A. (2008). Greening in the Unites States Hotel Sector: An exploratory examination. UNLV
Theses/Dissertations/Professional Papers/Capstones. Paper 609. Lubin, D. A., & Esty, D. C. (2010). The sustainability imperative. Harvard Business Review, 88(5): 42-50. Miller, R. K., & Washington, K. (2009). Green & Sustainable Hospitality (Chapter 6). In Miller, R.K. and
Washington, K. (Eds.), Hotels & Resorts (pp. 156-160). Loganville: Richard K Miller & Associates. Murillo-Luna, J. L., Garcés-Ayerbe, C., & Rivera-Torres, P. (2007). What Prevents Firms from Advancing in
their Environmental Strategy? International Advances in Economic Research, 13(1): 35-46. Nidumolu, R., Prahalad, C.K. & Rangaswami, M.R. (2009). Why Sustainability Is Now the Key Driver of
Innovation. Harvard Business Review, September. Post, J.E. & Altman, B.W. 1994. Managing the Environmental Change Process: Barriers and Opportunities.
Journal of Organizational Change Management, 7 (4): 67-83. Sloan, P., Legrand, W. & Chen, J. S. (2004). Factors influencing German hoteliers’ attitudes toward
environmental management. Advances in Hospitality and Leisure, 1: 179-188. Sloan, P., Legrand, W. & Chen, J.S. (2009). Sustainability in the Hospitality Industry: Principles of Sustainable
Operations. Butterworth-Heinemann: Oxford. Sneirson, J. F. (2009). Green Is Good: Sustainability, Profitability, and a New Paradigm for Corporate
Governance. 2009. http://www.uiowa.edu/~ilr/issues/ILR_94-3_Sneirson.pdf. [Accessed the 22nd of February 2012, 20:18]
Stohl, A. (2008). The travel-related carbon dioxide emissions of atmospheric researchers. Atmospheric Chemistry and Physics, 8: 6499-6504.
UNEP (2011). Tourism: Investing in energy and resource efficiency. Http://www.unep.org/greeneconomy/Portals/88/documents/ger/GER_11_Tourism.pdf. [Accessed the 23rd of May 2012, 13:18]
CARBON FOOTPRINT MITIGATION THROUGH ENERGY SMART HOTEL BENCHMARKING: A COMPARATIVE ANALYSIS OF SELF-ADMINISTERED ENERGY AUDIT
ONLINE TOOLS FOR HOTELS
Willy Legrand* International University of Applied Sciences Bad Honnef – Bonn
Muelheimerstrasse 38 Bad Honnef 53604, Germany
e-mail: [email protected]
Sabine Allhoff International University of Applied Sciences Bad Honnef – Bonn
Muelheimerstrasse 38 Bad Honnef 53604, Germany
e-mail: [email protected]
Philip Sloan International University of Applied Sciences Bad Honnef – Bonn
Muelheimerstrasse 38 Bad Honnef 53604, Germany
e-mail: [email protected]
and
Claudia Simons-Kaufmann International University of Applied Sciences Bad Honnef – Bonn
Muelheimerstrasse 38 Bad Honnef 53604, Germany
e-mail: [email protected]
Abstract Increased energy costs over the past decade have been a driver for hotels to limit or reduce their energy
usage. Free of charge online self-administered energy audit (FOSEA) tools enable hoteliers to assess current energy use as well carbon footprint value and benchmark the data against similar enterprises. The current research investigated 7 FOSEA tools with the aim to compare the tools in regard to their ease of functionality. The functionality of each tool was subsequently tested by performing a value benefit analysis (VBA) supported by an analytical hierarchy process (AHP) weighing the importance of the different functionality criteria. The FOSEA Hotel Energy Solution has the highest overall Target Value while the Energie-Sparprogramm reaches the highest Utility Value.
Key Words: carbon footprint mitigation, benchmarking, online self-audit tools
INTRODUCTION In 2006, the European Union (EU) has set itself the ambitious 20 2020 goal which translates into
reducing greenhouse gases by 20% by year 2020 compared to the 1990 levels (Commission of the European Communities, 2006). According to the Commission of the European Communities, the 20 2020 goal can and should be achieved through measures in energy efficiencies (EE) and an increased use of renewable energy (RE) in the EU’s final energy mix to 20% by 2020 (Commission of the European Communities, 2006). In the light of continuous energy cost increases, improving energy efficiency has become the ultimate goal for many hoteliers in regards to sustainability investments. In a recent research by Sloan, Legrand, Kirsche and Simons-Kaufmann (2011) more than 70% of the surveyed German hoteliers believe that online tools are useful in raising awareness and that those tools have a potential to encourage hotels to improve their energy efficiency. One of the most recent initiatives is the Hotel Energy Solutions (HES) with the aim to help small and medium sized hotels to enhance energy efficiency within their operations and increase the use of renewable energies. The basic application of HES and other “free of charge online self-administered energy audit” (FOSEA) tools enable the users to assess current energy use as well carbon footprint value and benchmark the data against similar enterprises. Most FOSEA tools also provide consultancy by recommending energy efficiency and renewable energy investment options.
HOTELS AND CARBON EMISSIONS
While issues surrounding the management of waste produced or water consumed in hotels are
important features of any environmental management programme, carbon dioxide (CO2) emissions have taken the central stage in the mitigation of environmental impacts (Sloan et al., 2009). The necessity of reducing CO2 emissions “has come to occupy a prominent position in the responsible-business agendas of most multinationals operating in different segments of the global economy” (Zientara and Bohdanowicz, 2010). Reasons for the increased interest in CO2 emissions are many including the media frenzy over global warming but also the prospect of having to pay carbon taxes. National and regional governments have implemented or are considering various forms of ecological taxes. The heavy industry in the European Union are faced with a cap on the amount of carbon dioxide and nitrous oxide that can be emitted since 2005 (European Commission, 2010). One of the most recent development is the tax passed by the Australian government in late 2011 setting the price of roughly AUD$23 per ton of carbon tax set to take effect in summer 2012 and increase gradually until 2015 (carbontax.net.au, n.d.). It is projected that CO2 emissions will thus be cut by an “annual 160 million tons by 2020 while generating $15.5 billion a year by 2015” (WorldWatch Institute, 2012: 30). In the service industry, the recent partnership formed to develop Carbon Footprint Standards between the International Tourism Partnership (ITP), the World Travel & Tourism Council (WTTC) and large international hotel players is a clear imitative aimed to make carbon measurement in hospitality possible (ITP, n.d.).
The basic framework of carbon footprint management is geared towards calculating total carbon emissions in a given setting in order to describe the amount of greenhouse gases produced in relation to certain activities, thus, helping to analyze an entity’s level of energy efficiency (Minoli, 2010). It is important to realize that due to a resource intense utilization of energy, water, and consumables in hotel facilities, the environmental footprint of hotels is typically larger than those of buildings of similar size (Rada, 1996). This is partly explained by the fact that hospitality operations are made up of a diversity of small operations from restaurants and banqueting to housekeeping and spas. Each of those operations accounts for a rather small share of environmental pollution in terms of energy and water consumption, food, waste and other resources but it is the whole which is greater than the sum of its parts (Aristotle). According to estimations an average hotel releases between 160 and 200 kilograms (kg) of CO2 per square metre of room floor area per year (Hotel Energy Solutions, 2011). Kilograms of CO2 per guest per night are averaging anywhere between 8 kg CO2 (Becken and Patterson, 2006) to 11 kg CO2 (Schegg and Amstutz, 2004), 18 kg CO2 (Schächtele and Hertle, 2007) and 29 kg CO2 and up to 34 kg CO2 in upscale hotels (U.S. EPA, 2005). The emissions stemming on a guest’ diet are not included in the above-mentioned figures. However, it is estimated that a non-vegetarian diet results in 8 kg CO2 equivalent per person per day without including the emissions for food preparation (Kim and Neff, 2009). And these emissions represent only the output without any consideration for the embodied energy of hotel buildings. In other words the focus is on the emissions as a consequence of hotel operations.
With this in mind, numerous hoteliers’ restructured business practices towards sustainability, not yet based on a life-cycle approach, but with an increasing understanding of long-term business prospects and profitability of managing the outputs.
FREE OF CHARGE ONLINE SELF-ADMINISTERED ENERGY AUDIT (FOSEA) The use of information technology can greatly contribute to overall reduction in environmental impacts
of hoteliers. Self-help online tools support hoteliers in auditing their operations and lead to informed decision making. The basic concepts behind FOSEA tools, beside being free of charge for the user, are for hotels to enter specific data into the online tool (e.g. occupancy rate, energy usage, energy costs, resources used in maintaining the buildings, efforts already undertaken to improve sustainability) and the tools consequently evaluate energy efficiency and the respective carbon footprint created by the hotel(s). In addition, tips and recommendations for investment with estimated returns on investment are presented, helping the managers and owners of hotel properties achieve a higher level of energy efficiency. Online self reporting software also serves as an industry benchmarking tool. There are a plethora of FOSEA available to hoteliers to measure, benchmark and conduct self-audits of their property and operations. Amongst the most prominent FOSEA available to hoteliers and with a particular focus on energy management are Hotel Energy Solutions, Energie-Sparprogramm, Hotel Power, Hotel Energy Check, Energy Start, GreenQuest and Energy Smart (Allhoff et al. 2011).
Defining Auditing and Self-Auditing
These FOSEA tools are set to be a simple and helpful entry to so-called green- or eco-audit. The International Chamber of Commerce defines environmental auditing as
“a management tool comprising systematic, documented, periodic and objective evaluation of how well environmental organization, management and equipment are performing with the aim of helping to safeguard the environment by: (i) facilitating management control of environmental practices; (ii) assessing compliance with company policies, which would include regulatory requirements” (cited in Hoggart, 2001:3)
The definition contains the two most important elements found in an environmental audit; it is a tool (1) supporting an organization’s management of its environmental practices, goals and the fulfillment of those goals, while (2) the overall aim of the audit is to protect the environment.
A self conducted or self-administered audit, (abbreviated as “self audit”), can be described as “a system for obtaining and verifying audit evidence, objectively examining the evidence against audit criteria, and incorporating the audit findings into business planning, for the purpose of continuous improvement” (Karapetrovic and Willborn, 1984:27-28). The most distinctive feature of a self audit is that the person or unit usually performing the process that is to be evaluated, undertakes the audit. Furthermore, the evaluation is conducted at the location where the audited process is usually performed.
Benefits and Costs of Auditing & Self-Auditing
An environmental audit provides the organization with a clear understanding of their current environmental efficiency and evaluates to what extent their set goals are met (Environment Australia, 1999). It shows areas with room for improvement and provides a baseline from which other environmental management tools can be used (Environment Australia, 1999). Environmental audits can also support an organization by avoiding legal persecution and the cost of penalties resulting from offenses against environmental legislation (Emery & Watson, 2003). Additionally, a formal audit enables the company to publish their environmental performance, demonstrating their environmental efforts which can lead to an increased image of the company (Emery & Watson, 2003). Hoggart (2001) stated that customers could be influenced by the environmental effort the company takes upon itself and may patronize the company more often. The most apparent disadvantage of environmental auditing is found in the costs, time and effort needed to conduct the audits (Hoggart, 2001). An external auditing is undertaken by an independent authorized (Strich, 1996).
Environmental self audits are less costly and more accurate then audits performed by regulators (Pfaff and Sanchirico, 2004). Self audits carry the following benefits for the companies: increased awareness of the environmental impact of the operation, operational activities requiring permits can be detected, waste minimization possibilities are found, leading to possible cost savings, efficiency and productivity can be enhanced, employee morale can be increased and public image improved (New Hampshire Department of Environmental Services, 2004). Energy Auditing
Energy audits are essential for corporation to make informed decisions on the management of energy (Brettar, 1987). Shirley and Turner point out that “the purpose of energy auditing is to record information on energy consumption, translate into a useful form and interpret subsequent data.” (cited in Brettar, 1987:111). According to Russel, an energy audit “identifies energy consumption that is in excess of what is needed to adequately serve a facility” (2010:71). Doty and Turner (2009) point out that an energy audit can lead to the
development of a program for improvements of operating procedures or equipment which could lead to energy cost reductions.
In the hospitality industry, one of the important energy consumers is the customer using the services. Although a hotel may want to decrease energy costs, ways for energy reductions have to be found which do not affect the guests and the resulting perception of the delivered service product. In order not to endanger the guest’s satisfaction, passive methods for reducing the energy consumption have to be recommended so as to combine the hotel’s pursuit for cost reductions with the guest’s service expectations (Borkovic et al., 2008).
Software Quality and Functionality
According to the ISO 91261 standard, software quality can be defined as “the totality of features and characteristics of a software product that bear on its ability to satisfy stated or implied needs” (International Standard, 1991:2). This definition underlines that the term software quality describes a multi-causal concept (Hoffmann, 2008). Therefore there is not one single criterion that can be directly linked to software quality. The term rather includes many criteria where some of them even contradict each other (Hoffmann, 2008). However, the fundamental criteria for the evaluation of software quality are: functionality, reliability, efficiency, usability, portability, modifiability, testability and transparency (Hoffmann, 2008). The criteria functionality, reliability, efficiency and usability are directly visible to the users and user’s perception of a software quality. Therefore these criteria are the one’s which directly affect the purchase decision of the potential customer and determine the short term success of a software product. The criteria transparency, portability, testability and transparency depict the inner values of a software product. These criteria are not visible from the outside; hence only customers who have a deep insight into the development process can evaluate them. The focus of the research is the evaluation of functionality, as a critical user-based criterion. The ISO 9126 standard defines functionality as “a set of attributes that bear on the existence of a set of functions and their specified properties. The functions are those that satisfy stated or implied needs” (International Standard, 1991:2). According to Hoffmann, functionality describes to which extent the software fulfills its attributive functional range (Hoffmann, 2008). Rasmussen, Goldy and Solli (2002) discuss that one can very rarely find a software product which will be able to fulfill the expected functionality aspects to the fullest, because most software is programmed for many different users. However, in some cases the fulfillment of one functionality aspect can compensate for the lack of other aspects depending on how important the different aspects are to the user (Rasmussen & Goldy & Solli, 2002).
AIM
Considering the combined increased interest in energy management by hoteliers with the importance of
energy auditing in hospitality as well as the costs incurred in external auditing versus the availability of FOSEA to hotelier, this research identified the most prominent FOSEA tools and compared each tool’s ease of functionality. In other words, the aim is to investigate how well those FOSEA tools fulfill the purpose they were designed for (ISO 9126, Hoffmann, 2008).
METHODOLOGY
In total, seven FOSEA tools were included in the analysis (Hotel Energy Solutions, Energie-
Sparprogramm, Hotel Power, Hotel Energy Check, Energy Star, GreenQuest and Energy Smart). Those FOSEA were chosen from their prominent position in the market (Kirsche et al. in 2011). A hierarchy illustrating the functionally items was created including the following 6 criteria: (1) Carbon Footprint Calculation, (2) Recommendations, (3) Current State Analysis, (4) Display Possibilities, (5) Benchmarking and (6) Comparability to targets. The functionality of each tool was subsequently tested by performing a value benefit analysis (VBA). The VBA is a method supporting a decision-making process in order to generate a systematic preparation for the selection between complex action alternatives (Hoffmeister, 2007). The VBA analyses complex action alternatives with the goal of arranging those alternatives according to the preferences of the decision maker regarding a multi-dimensional system of objectives (Hoffmeister, 2007). In contrast to the cost-benefit analysis, which evaluates the efficiency of a project, the goal of the VBA is to assess the effectiveness, thus the total contribution to the given goals (Weber, 2005). In order to support the VBA, the analytical hierarchy process (AHP) weighing the importance of the different functionality criteria was consequently used. The AHP describes an analytical technique decomposing complex systems of objectives into single objectives through its hierarchical design and enabling process-oriented usage (Lüttgers, 2004). A hierarchy can be considered complete if each element of one hierarchy level is in direct relation to the element on the next higher level and all decision relevant goals, criteria and action alternatives as well as their relations among each other are displayed. The VBA and the AHP were performed using primary data collected from two interview partners in the hospitality industry. Those two interview partners are general managers representing a chain hotel, and
independently operated hotel. The rationale in choosing one independent and one chain hotel reside in the desire to investigate whether representatives of chain or independent hotels weigh the importance of functionality differently due to their different business operations. Participants were also asked to rank the functionality sub-characteristics according to the perceived importance. Value Benefit Analysis (VBA)
A set of criteria are weighted according to their relative importance by allocating a number (the weight) to those criteria. Commonly 100 points are distributed onto the entire set of criteria, thus representing the importance of each individual criterion in relation to the other criteria. After the weighting is established, one must determine the degree to which the criteria are actually fulfilled. This is labeled as ‘physical target yields’ and often a scale ranging from 1, representing the lowest degree of fulfillment of the goal, to 10, representing the highest degree of fulfillment of the goal, is applied (Hoffmeister, 2007). Once the target yield are transformed into the degree of goal fulfillment (hence on the scale of 1 to 10), it is possible to determine a partial utility value. This partial utility value arises from the multiplication of the respective weight of the criterion and its degree of fulfillment of the goal. The final utility value originates from the aggregation of all partial utility values. Consequently, a hierarchy illustrating the functionally items was created based on the literature review and included the 6 criteria mentioned above. Coding the Criteria
Once the 6 criteria of functionality have been established, a system of coding measurement pertaining to the extent in which the FOSEA tools fulfill those ‘functionality criteria’ was created(Liggesmeyer, 2009). As such, each FOSEA tools were coded according to whether it offered (or not) any (or all) of the 6 functionality criteria.
APPLICATION OF METHODOLOGY & FINDINGS Target Yield Matrix:
The extent each tool fulfills the functionality criteria is assessed by each hoteliers and depicted in the target yield matrix. For example, it was found that the Hotel Energy Solutions (HES) tool calculates 4 various carbon footprint values (e.g. one value for Total Carbon Footprint, one value for Carbon Footprint Per Overnight Stay, one value for Carbon Footprint per Guestroom and one value for Carbon Footprint per Square Meter, thus 4 different values), so a coding value of ‘4’ would be entered in the Target Yield Matrix. Target Value Matrix:
An ordinal rating was then applied in the Target Value Matrix using a scale from 1 to 7. A one (‘1’) to seven (‘7’) ordinal scale was chosen to reflect the ranking of the criteria because seven FOSEA tools were to be ranked and the target yield matrix included answer possibilities which could not be transformed into an interval scale. The tool with the highest target yield value concerning one criterion received a seven on the scale and the tool which achieved the lowest target yield value received a one on the scale. In case two or more tools achieved the same target yield value, both tools received the same scale value. For example, only one FOSEA tool displayed more Carbon Footprint value than the HES tool. Indeed the Energy Star tool calculates 8 different Carbon Footprint value, while the HES calculates 4 and the Energie-Sparprogramm tool calculates 2 Carbon Footprint values. In the Target Value Matrix, the energy Star tool would obtain a ‘7’, the HES tool a ‘6’ and the Energie-Sparprogramm a ‘5’ and so on. Utility Value Matrix:
The partial utility values of each tool were calculated in the Utility Value Matrix by multiplying the weighting values with the target values (Weighting of values is discussed in the following section titled Analytical Hierarchy Process). The sum of the partial utility values accounts for the total utility value of the tools. For example, regarding the criteria Carbon Footprint, the HES tool ranked ‘6’ in the Target Value Matrix. The Weighting for the Carbon Footprint is 6,32. Multiplying both values and we obtain a Utility Value of 37,92. All criteria follow the same calculation and the sum is calculated. In the case of HES, a total Utility Value of 422,33. The sum is then compare with the sum of all other FOSEA tool and a final ranking is established. Analytical Hierarchy Process (AHP)
The Analytical Hierarchy Process allows for dividing complex systems of objectives into their single components and representing those components in a hierarchical structure (Lüttgers, 2004). Since the goal here is to assess the functionality of different FOSEA tools, the criteria level incorporates the six functionality criteria; 1. Carbon Footprint 2. Recommendations, 3. Current State Analysis, 4. Display Possibilities, 5. Benchmarking and 6. Comparability to targets and also the five sub-criteria of the Current State Analysis. The
application of the AHP (as a support to the VBA) onto a precise problem is executed using 3 steps being (1) depiction o the hierarchy, (2) execution of the paired comparisons and (3) calculation of the weighting factors (Ahlert, 2003). Decision Problem Hierarchy
The use of AHP allows creating justifiable weightings. One of the first step is to establish a hierarchy of the decision problem. Once the hierarchy is established, single criterion need to be evaluated. For this process all elements of one hierarchy level are evaluated by the decision maker (hotelier) in relation to one element of the next higher level. This is executed in paired comparisons with the help of a predetermined scale. Saaty recommends the deployment of an interval scale with nine levels (Ahlert, 2003; Saaty, 1990) which was chosen for this research. The scale at one extreme depicts a ‘9: extremely more important than’ to the other extreme with a ‘1/9 extremely less important than’ and with a middle value of ‘1: as equally important as’. Paired Comparison Matrix
A matrix was developed contrasting respectively two functionality criteria (e.g. Carbon Footprint versus Current State Analysis)The respondents could choose which criterion he/she evaluates as more important and could express his evaluation on the scale. For example, one hotelier ranked the ‘Carbon Footprint’ as being extremely more important than ‘Current State Analysis’ thus giving it a 1/9 in the scale. Evaluation Matrix
Subsequent to these paired comparison matrix, the scale ratings were transformed into an evaluation matrix with calculated sums for each column. For example, when the ‘Carbon Footprint’ was ranked 1/9 or extremely less important than ‘Current State Analysis’, the value 1/9 was entered in the Evaluation Matrix and the sum of each column for the 6 criteria were calculated. Normalization Matrix
The calculated sums in the Evaluation were consequently normalized by bringing the sums to a value of ‘1’. To do so, each individual value was divided by the sum of that column. Once all individual value has been normalized, the sum of the column is 1. Subsequently, the total of each row was calculated. Weighting Matrix
The row totals were then divided by the number of criteria, which are the 6 criteria and displayed in the weighting matrix. Those weightings values were then transformed into percentages, reflecting the weighting of the importance of the respective criteria. The calculated percentages following the AHP methods are then used for the VBA and can be found in the Target Yield Matrix as well as the Target Value Matrix. Weighting of the functionality criteria
The final results of the AHP (see Table 1. Percentages and Weight Ranking of Functionality Criteria) demonstrate that the two hotel managers evaluated the importance of the different functionality criteria of all of the seven online tools tested very differently.
Table 1 Percentages and Weight Ranking of Functionality Criteria
Functionality Criteria Chain
Hotelier %
Ranking Independent
Hotelier %
Ranking
Carbon Footprint 2.24 6 6.32 4 Current State Analysis 9.46 5 24.15 2 Display Possibilities 27.89 2 2.55 6 Recommendations 17.86 3 15.16 3 Benchmarking 11.40 4 46.03 1 Comparability to Goals 31.15 1 5.79 5
The chain hotelier valued the comparability of the performance data to goals as the most important criteria, with 31.15% and the display possibilities as the second most important criteria with 27.89%. The calculation of the carbon footprint, with only 2.24 % ranks last. The independent hotelier valued the benchmarking of the performance data to industry standards as the most important criterion, with 46.03%, and the current state analysis as the second most important criterion with 24.15%. The least important criterion is the display possibilities with only 2.55%. The different evaluation of the criteria naturally leads to a different
ranking of those criteria. The only criteria which received the same rank and a similar percentage from both respondents, is the provision of recommendations of improvement measures. Although the AHP does not investigate the differences in the weighting, reasons are derived from conversations with the two respondents. As such, the chain hotelier values the possibilities for graphical representation of data and results because it enables the user to gain quicker insights into the current energy performance of a property. On the other hand, the independent hotelier regards the benchmark function of a FOSEA tool as essential as a way to gain insight into its position comparison with other hotels. This may give the independent hotelier insights to further improvement in regards to energy management. Utility values
The results from the VBA show that none of the tools was able to fulfill every criterion. Even the tools which received the highest target values, the Energie-Sparprogramm tool and the HES tool, or the highest utility values, the Energie-Sparprogramm and the GreenQuest tool (see Table 3: Target Value and Ranking of the FOSEA Tools), did only fulfill four to five of the six functionality criteria (see Table 2: Unfulfilled Functionality Criteria).
Table 2
Unfulfilled Functionality Criteria
FOSEA Tools Chain Hotelier Independent Hotelier
Energie-Sparprogramm Comparability to goals, Recommendations
Comparability to goals, Recommendations
Hotel Energy Solutions Comparability to goals Comparability to goals GreenQuest Recommendations, Benchmarking Recommendations
Table 3: Target Value and Ranking of the FOSEA Tools, demonstrates the distribution of target values of each tool by the chain and independent hotelier and the corresponding ranking. The ranking of the different tools shows that generally both respondents ranked the tools similarly. Both respondents ranked the HES first and the Energie-Sparprogramm first or second. Additionally, both respondents ranked the hotel power tool last. Although the general rankings of the target values coincide with each other, the absolute values differ. The differences are explained in the difference in the evaluation of the functionality criteria. In order to limit or reduce the different interpretation of the functionality criteria, both participants were provided with the same information and explanations of the single criteria. However, the possibility of a different understanding between two respondents cannot be excluded.
Table 3 Target Value and Ranking of FOSEA Tools
FOSEA Tool Chain Hotelier Target Value
Chain Hotelier Ranking
Independent Hotelier Target
Value
Independent Hotelier Ranking
Hotel Energy Solutions 60 1 55 1 Energie-Sparprogramm 59 2 55 1 Energy Star 57 3 52 2 Energy Smart 49 4 47 3 GreenQuest 45 5 52 2 Hotel Energy Check 45 5 57 3 Hotel power 39 6 39 4
Table 4: Utility Value and Ranking of the FOSEA Tools, displays the utility values and the corresponding ranks the tools received from the two respondents. The final result from the VBA shows that the tool fulfilling the functionality criteria the most is the Energie-Sparprogramm tool, followed by the GreenQuest at the second rank and the hotel energy check tool, placing third. Both the chain and the independent hotelier have ranked the tools similarly.
Table 4 Utility Value and Ranking of the FOSEA Tools
FOSEA Tools
Chain Hotelier Utility Value
% Chain
Hoteliers Ranking
Independent Hotelier Utility
Value %
Independent Hotelier Ranking
Hotel Energy Solutions
510.95 15.04 4 422.33 13.78 4
Energie-Sparprogramm
560.73 16.51 1 570.08 18.60 1
Hotel power 408.69 12.03 7 416.54 13.59 5 Hotel Energy Check 524.03 15.43 3 451.56 14.73 3 Energy Star 425.12 12.52 6 320.49 10.46 7 GreenQuest 532.45 15.68 2 513.07 16.74 2 Energy Smart 434.59 12.79 5 370.50 12.10 6
Finally, Table 5: Target Value Ranking Compared with Utility Value Ranking, compares the Target Value ranks with the final Utility Value ranks. Especially noteworthy is the influence of the weighting on the Hotel Energy Solutions tool. The FOSEA Hotel Energy Solutions tool was continuously ranked first in the Target Value ranking thus fulfilling the functionality criteria to the highest degree. However, this ranking changed with the inclusion of the weightings as shown in the Utility Value ranking of the tool. At this stage the Energie-Sparprogram is currently the FOSEA tool with the highest performance.
Table 5 Target Value Ranking Compared with Utility Value Ranking
FOSEA Tools Chain Hotelier Target Value
Chain Hotelier Utility Value
Independent Hotelier Target
Value
Independent Hotelier Utility
Value Hotel Energy Solutions 1 4 1 4 Energie-Sparprogramm 2 1 1 1 Hotel power 6 7 4 5 Hotel Energy Check 5 3 3 3 Energy Star 3 6 2 7 GreenQuest 5 2 2 2 Energy Smart 4 5 3 6
CONCLUSION & LIMITATIONS
The analysis showed that all 7 examined FOSEA tools still need to improve their functionality. However, it was possible to establish a ranking of the 7 tools in their current state. The German-based FOSEA Energie-Sparprogramm fulfils the functionality criteria at best following the analysis.
Using AHP it was possible to indicate that managers of a chain and an independent hotel evaluate the criteria differently. The foundation of the different perception may be rooted in the affiliation, or non-affiliation to a hotel chain, or purely personal opinions and likings of different FOSEA. Both respondents, while using the 7 FOSEA tools during the study agree that FOSEA tools can support hotels in implementing energy management measures by providing with a low-cost energy audit or energy usage picture.
The contrast between the target value rankings and the utility value rankings demonstrates the notable influence of the inclusion of weightings of the importance of the single criteria for the user on the final results of the VBA. This is a clear indicator to the initiators and developers of those tools to consider the importance weighting of the evaluation criteria in order to improve their tools.
One of the limitations is the internationality of the FOSEA tools used in the study. The two participants, based in Germany, had to adjust the data input to allow for data processing and presentation of results, For example, the Singapore-based Energy Smart Tool requires four star hotels to include a pool which is not the case for a German-based 4 star property. However, the German hoteliers had to falsely indicate the inclusion of a pool in that FOSEA tool to continue with the data analysis. However, since the goal in the study is to focus on the functionality of the tool (rather than on precise results from data input), the validity of the analysis remains.
Another limitation is the focus of some FOSEA tools. The Hotel Energy Solutions is developed with Small and Medium-sized independent hoteliers in mind rather than large chain-based properties.
Finally, the sample size of two hoteliers affects the possibilities to generalize to a population. While both hoteliers had to invest a large amount of time in working with 7 different tools, inputting and processing data and receiving results (on energy-related issues), the study can only be considered exploratory in its nature.
However, the value of the research lays in (1) the use of a sound methodology of data analysis (2) the potential to duplicate the research into a larger-scale project and (3) the guidance for hoteliers in wanting to use the best FOSEA tools to mitigate energy issues at their properties.
FUTURE RESEARCH
Further research should be conducted using AHP in order to support or reject the indication that the affiliation of the hotel influences the weighting of the functionality criteria. If further research would support this indication, the initiators and developers of those online tools should include this finding into their tools and should specify their tools for affiliated or independent hotel users. This potential adaption to the specific user profile could potentially encourage more hotels to use such tools. Additionally, it is recommended that the future development of FOSEA tools focus on independent hotels since a variety of chain-sponsored tools already exists for chain-properties (e.g. IHG Green Engage, Accor OPEN).
Regarding the currently available tools, it is recommended that the functionality of the currently available tools shall be extended to the six criteria developed in this study. Although functionality is not the only software quality criterion the developers of the tools have to focus on, it still is of great importance.
Finally, it is recommended that further research should be performed answering the questions “What are the long term effects of energy audit tools on hotel users?” and “What criteria should be included into the tools in the opinion of the user, in order to encourage usage?”
REFERENCES Ahlert, M. (2003). Einsatz des Analytic Hierarchy Process im Relationship Marketing: Eine Analyse
strategischer Optionen bei Dienstleistungsunternehmen. Wiesbaden: Betriebswirtschaftlicher Verlag Dr. Th. Gabler/GWV Fachverlage GmbH
Allhoff, S., Simons-Kaufamnn, C., Legrand, W. & Sloan, p. (2011). Comparative analysis f self-administered energy audit tools for hotels. Bachelor Thesis. Bad Honnef: International University of Applied Sciences Bad Honnef–Bonn.
Becken, S. & Patterson, M. (2006). Measuring national carbon dioxide emissions from tourism as a key step towards achieving sustainable tourism, Journal of Sustainable Tourism, 14: 323–338,
Borkovic, Z. H., Kulisic, B., & Zidar, M. (2008). Energy Audit- Method for energy conservation in hotels. Tourism and Hospitality Management, 14(2): 349-358.
Brettar, T. (1988). Konzeption einer betrieblichen Energiewirtschaft. Frankfurt am Main: Verlag Peter Lang GmbH
Canadian Architect (n.d.). Measures of sustainability. Http://www.canadianarchitect.com/asf/perspectives_sustainibility/measures_of_sustainablity/measures_of_sustainablity_embodied.htm. [Accessed the 22nd of February 2012, 23:45]
carbontax.net.au (n.d.). What is the carbon tax? Http://www.carbontax.net.au/category/what-is-the-carbon-tax/ [Accessed the 22nd of February 2012, 23:02]
Commission of the European Communities (2006.) Action Plan for Energy Efficiency: Realising the Potential. {SEC(2006)1173} {SEC(2006)1174} {SEC(2006)1175}. Http://eur-lex.europa.eu/LexUriServ/LexUriServ.do?uri=COM:2006:0545:FIN:EN:PDF. [Accessed the 25th of May 2012, 11:35]
Doty, S., & Turner, W.C. (2009). Energy Management Handbook. Lilburn: The Fairmont Press. Emery, A.R.T., & Watson, M. (2003). Eco-auditing and environmental liability: an international perspective.
Managerial Auditing Journal, 18(8). Environment Australia. (1999). Profiting from Environmental Improvement in Business.
Http://www.environment.gov.au/archive/settlements/industry/corporate/eecp/publications/pubs/profitingds.pdf. [Accessed the 16th of May, 2011, 12:38]
European Commission (2010). Emissions Trading System (EU ETS). Http://ec.europa.eu/clima/policies/ets/index_en.htm. [Accessed the 22nd of February 2012, 22:35]
Greenspec (n.d.). Embodied energy. Http://www.greenspec.co.uk/embodied-energy.php. [Accessed the 23rd of May 2012, 11:50]
Hoffmeister, W. (2007). Investitionsrechnung und Nutzwertanalyse: Eine entscheidungsorientierte Darstellung mit vielen Beispielen und Übungen. Berlin: Berliner Wissenschaftsverlag
Hoggart, C. (2001). Environmental Auditing for the Non-Specialist. Oxford: Chandos Publishing. Hotel Energy Solution (2011). Analysis on energy use by European hotels: online survey and desk research.
Hotel Energy Solutions project publications. International Standard (1991). Information technology –Software product evaluation- Quality characteristics and
guidelines for their use. Http://tmancini.di.uniroma1.it/teaching/courses/2007-2008/prosw/materiale/I/S.I.4%20-%20Lo%20standard%20ISO%209126%20sulle%20qualita%27%20del%20software,%201991%20-%20ProSW.pdf. [Accessed the 03rd of July 2011, 22:27]
ITP (n.d.). Major international hotel companies demonstrate leadership through new initiative to standardise the industry’s carbon measures. Http://www.tourismpartnership.org/media-centre/23-major-international-hotel-companies-demonstrate-leadership-through-new-initiative-to-standardise-the-industrys-carbon-measures. [Accessed the 23rd of May 2012, 13:32]
Karapetrovic, S., & Willborn, W. (1984). Self-audit of Process Performance. International Journal of Quality & Reliability Management, 19(1): 24-45.
Kim, B. & Neff, R. (2009). Measurement and communication of greenhouse gas emissions from U.S. food consumption via carbon calculators. Ecological Economics, doi:10.1016/j.ecolecon.2009.08.017.
Kirsche, C., Simons-Kaufmann, C., Legrand, W. & Sloan, P. (2011). Barriers and Motivators of German Hoteliers to invest in sustainability and the potential for an online self-help tool. Bachelor Thesis. Bad Honnef: International University of Applied Science Bad Honnef-Bonn.
Liggesmeyer, P. (2009). Software-Qualität: Testen, Analysieren, und Verifizieren von Software. Heidelberg: Spektrum Akademischer Verlag
Lüttgers, H. (2004). Online Marktforschung: Eine Positionsbestimmung im Methodenkanon der Marktforschung unter Einsatz eines Analytic Hierarchy Process (webAHP). Wiesbaden: Deutscher Universitäts-Verlag/GWV Fachverlage GmbH
Minoli, D. (2010). Designing green networks with reduced carbon footprints. Journal of Telecommunications Management, 3(1): 15-35.
New Hampshire Department of Environmental Services. (2004). The Small Business Guide to Environmental Awareness: A Simplified Approach to Environmental Compliance. Http://des.nh.gov/organization/commissioner/pip/forms/ard/documents/ard-04.3.pdf. [Accessed the 6th of June 2011, 12:45]
Pfaff, A. & Sanchirico, C.W. (2004). Big field, small potatoes: An empirical assessment of EPA's self-audit policy, Journal of Policy Analysis and Management, 23(3): 415-432.
Rada, J. (1996). Designing and building eco-efficient hotels. Green Hotelier Magazine, 4: 10-11. Rasmussen, N., Goldy, P.S., & Solli, P.O. (2002). Financial Business Intelligence: Trends, Technology,
Software Selection, and Implementation. New York: John Wiley and Sons, Inc. Rueckert, R.W., Walker, O.C, & Roering, K.J. (1985). The organization of marketing activities: A contingency
theory of structure and performance. Journal of Marketing, 49: 13-25. Russel, C. (2010). Managing Energy from the Top Down: Connecting Industrial Energy Efficiency to Business
Performance. Lilburn: Fairmont Press, Inc. Saaty,T. (1990). The analytic hierarchy process: planning, priority setting, resource allocation. Pittsburgh:
RWS Publ. Sloan, P., Legrand, W. & Chen, J.S. (2009). Sustainability in the Hospitality Industry: Principles of Sustainable
Operations. Butterworth-Heinemann: Oxford. Sloan, P., Legrand, W., Kirsche, C. and Simons-Kaufmann, C. (2011). Barriers and Motivators of German
Hoteliers to invest in sustainability and the potential for an online self-help tool. Bachelor Thesis, Bonn: International University of Applied Sciences Bad Honnef · Bonn.
Schächtele, K. & Hertle, H. (2007). Die CO2 Bilanz des Bürgers: Recherche für ein internetbasiertes Tool zur Erstellung persönlicher CO2 Bilanzen, Endbericht im Auftrag des Umweltbundesamtes, Förderkennzeichen 206 42 110, Institut für Energie- und Umweltforschung Heidelberg GmbH Http://www.umweltdaten.de/publikationen/fpdf-l/3327.pdf. [Accessed the 22nd of February 2012, 23:02]
Schegg, R. & Amstutz, M. (2004). Energiekennzahlen für die Schweizer Hotellerie: ein Forschungsprojekt des Bundesamtes für Energie, Http://www.hotelpower.ch/ver francaise/pdf/hotelpowerenergiekennzahlen.pdf. [Accessed the 22nd of February 2012, 23:08]
Simons-Kaufmann, C., Legrand, W.U.S. EPA (2005). CHP in the Hotel and Casino Market Sectors. Energy and Environmental Analysis, Inc. Http://www.epa.gov/chp/documents/hotel_casino_analysis.pdf. [Accessed the 22nd of February 2012, 23:35]
Strich, D. (1996). Auditierung als Controllinginstrument für Geschäftsprozesse. Frankfurt am Main: Peter Lang Europäischer Verlag der Wissenschaften.

Weber, J. (2005). Die Nutzwertanalyse zu Beurteilung von Entscheidungsalternativen im öffentlichen Sektor. Norderstedt: GRIN Verlag
WorldWatch Institute (2012). State of the world 2012: Moving toward sustainable prosperity. Washington: Island Press.
Zientara, P. & Bohdanowicz, P. (2010). The hospitality sector (Chapter 5). In Jafar, J. and Liping, A. C. (Eds.), Bridging Tourism Theory and Practice (pp. 91-111). Oxford: Emerald Group Publishing Limited.
“Hospitality tomorrow”: A case for design driven innovation in hospitality research
Xander D. Lub Saxion University of Applied Sciences
Deventer, the Netherlands [email protected]
Laura Niño Caceres
Thought Refinery Amsterdam, the Netherlands
René Rijnders Dutch Board of Hotel & Catering Industry
Zoetermeer, the Netherlands [email protected]
Abstract
This practitioner-scholar collaborative study explores the use of design thinking as an alternative
innovation method for hospitality businesses. Design Driven Innovation methods were used to drive a large-scale project defining future scenarios for the Dutch hospitality industry. The Design Driven Innovation approach, including the different unique methodologies and its value for the project are discussed. Findings suggest that this approach allows users to make sense of today’s complex societal trends in relation to their own organization. We conclude that design thinking fits well with the nature of hospitality business and presents a better alternative over more traditional innovation methodologies. This paper is the first to evaluate the application of design driven innovation in hospitality business, and as such contributes to the body of knowledge on hospitality innovation. Key words: future scenarios, design driven innovation, design thinking, hospitality business
Introduction
The hospitality industry is a significant and distinctive economic force in the service economies of most Western nations and growing fast in the developing world (Olsen et al., 2008). But the world in which the hospitality industry operates changes faster and faster. Moreover, the hospitality field is fragmented in a number of ways: it contains a number of industries (foodservice, lodging, MICE and others), it has varying degrees of products or services, complexity of the field, a range of ownership structures in each industry and differences in demand, supply and technology relationships across the hospitality industry (Enz, 2010, Olsen et al., 2008). In trying to understand and adapt to this dynamic environment, entrepreneurs and policy makers alike are increasingly turning to innovation and forecasting tools (see e.g. Olsen, et al. 2000; Go, et al., 2007). Innovation is an important source of economic growth and competitive advantage (Porter & Ketels, 2003), and research into innovation has generated a field of study in its own right. To date, however, most studies have focused on the manufacturing industry (Prajogo, 2006) and some researchers have hypothesized that applying product development theory to the service sector could prove problematic (Gallouj, 2002; Sipe & Testa, 2009). One reason that it may be problematic is that the conventional wisdom on innovation theory, and strategic thinking, is based on an idea of linear progression from research to development (Mintzberg, Ahlstrand & Lampel, 2008; Kyffin & Gardien, 2009), very similar to the linear process of producing goods. Furthermore, even in production environments where these innovation processes are ususally implemented, the success rate for bringing new innovation ideas to market has been dramatically low. Nussbaum (2005a) suggested that “the brutal truth was that up to 96% of all new projects fail to meet the targets for return on investment (p.72)”. In this paper, we therefore propose a new approach to hospitality innovation research. This new approach is called Design Driven Innovation, a method developed by Verganti (2008) and applied by (amongst others) Philips Design to develop innovative concepts and products. Based on recent contributions of design scholars and an extensive case study on a project in the Dutch hospitality industry named “Hospitality tomorrow”, we will present an alternative method to develop innovative concepts in the hospitality industry. We will argue that insights from design research combined with a more qualitative design driven approach to the data could provide an alternative approach to more classical types of innovation research, and that such an approach is by
nature more suited to service concepts in the hospitality industry. We will offer a detailed description of the different unique methodologies as well as a selection of some findings from the case study. As this study was a joint effort between academics and practitioners, we will also reflect on the opportunities for hospitality entrepreneurs. We encourage other scholars and industry professionals to provide feedback on the proposed approach and methods.
Innovation Research
This paper focuses on innovation within business organizations and the broader hospitality environment as perceived by hospitality policy makers. As markets become more dynamic, interest in innovation, its processes and impacts has grown dramatically. Businesses need to innovate in response to changing customer demands and lifestyles and capitalize on opportunities offered by technology, changing market places, structures and dynamics in society (Baregheh, Rowley & Sambrook, 2009). Organizational innovations can be performed on products, operations, processes, services and people. The concept of innovation has been around for a long time, and although the term innovation was not used extensively, Schumpeter’s (1934) concept of “creative destruction” can be considered one of the earliest references to the concept of innovation. He suggests that entrepreneurial activity involves the carrying out of new combinations, the “creative destruction” of an existing equilibrium within a particular industry (Schumpeter, 1934). Innovation may involve a wide range of types of change depending on the organization’s requirements, resources, capabilities and strategies. Moreover, innovation is of interest to researchers and practitioners from a range of business and research disciplines (Baregheh, et al., 2009), which has created a wide array of definitions and approaches. Studies in operations management, entrepreneurship, R&D, IT, marketing, strategy, HRM and product design are all likely to propose definitions for innovation that reflect the dominant paradigm of the discipline they operate in, which has not lead to greater clarity about the concept of innovation (Harrington & Ottenbacher, 2011).
Although many definitions exist, Baregheh et al. (2009) have, based on a meta-analysis of the innovation literature, made an attempt to develop a multidisciplinary definition of innovation. They define innovation as a “multi-stage process whereby organizations transform ideas into new/improved products, service or processes, in order to advance, compete and differentiate themselves successfully in the marketplace” (Baregheh, et al., 2009: 1334).
Only a small number of studies examine innovation in the hospitality industry and these few studies comment on the vague and inconsistent conceptualizations of what innovation is and how it is operationalized in the services sector. Some case studies examined specific innovations to extract common steps in the innovation process (Jones, 1996). Another study of the hotel sector looked for factors that determine the success of new service development (Ottenbacher & Gnoth, 2005). Most recently, authors have called for a more comprehensive approach to studying innovation and submitted a research agenda for exploring innovation orientation (Siguaw, Simpson, & Enz, 2006).
We propose that the limited number of studies reflects two issues that may cause the lack of transfer from the broader innovation literature to the hospitality context. Firstly, the linear process orientation, as reflected in the above definition by Baregheh et al. (2009), does not translate well to the hospitality exchange, in which the hospitable experience is created in the interaction between employee and guest, rather than through an organizational process. Secondly, in most of the innovation literature the organization is the central focus of research. A typical, and perhaps somewhat unique, aspect of the hospitality industry however is (or should be) that the guest’s unique needs and experiences are central in providing intangible experiences rather than products. Verganti’s (2009) design driven innovation theory, which is discussed in the next section, is relevant for the hospitality sector as it centers on designing immersing and meaningful experiences. Hospitality aims to create experiences built upon triggering of the senses, conviviality and the enjoyment of eating and traveling, which are propositions that need to spark and deliver emotions, and Verganti’s approach would thus be well suited.
Given the dynamic environment and the limited number of studies on innovation in the hospitality industry, the need for research on the innovation process in hospitality and the potential to contribute to the industry are substantial (Harrington & Ottenbacher, 2011). Harrington & Ottenbacher (2011) particularly suggest a research focus on techniques that can enhance knowledge sharing, knowledge development, and innovation creation given the structural challenges of the hospitality field. In the next section we introduce design thinking, an approach that may provide an answer to this call.
Design thinking
Designing products and services is essential to business success and creating a competitive advantage. However, design thinking -approaching managerial problems as designers approach design problems- can have important advantages for organizations, a prospect that has begun to gain recognition in both the practitioner and research literature (Dunne & Martin, 2006). Although popular publications such as Business Week regularly publish design best practices and comment on the relevance of design for managers (see e.g. Nussbaum, 2005a; 2005b), the idea of applying design approaches to management is new and relatively undeveloped (Dunne & Martin, 2006). At the same time, today’s dynamic societies also evidence the fact that current economic and social models need to be revised. Managers are struggling to cope with constant change and uncertainty (Lester, Piore & Malek, 1998) and scandals such as the Enron case and the current credit crunch are demonstrating that traditional management logic is failing to capture the complexity of our societies.
Design thinking is an approach that closely studies people in context as intrinsic part of any new product or service innovation activity. It also rethinks the whole system to deliver market and enterprise value. Design is one of the disciplines that encompasses multidisciplinary collaboration (Fraser 2009). Over the course of history, science has however applied reductionist approaches creating silos of knowledge. For instance, cells are attributed to biology, atoms to physics and molecules to chemistry. This approach only allows us to select from predetermined alternatives based on specific expertise or experience. Deductive and inductive logic are the logic of what should be or what is (Dunne & Martin, 2006). Recently people have however come to understand that the physical world cannot be explained in terms of its parts. To address its complexity it is important to understand its different components as one system, and further more to define how they relate, if we want to create integral solutions (Jenkins 2008). Design thinking involves “designers” solving problems through collaborative integrative thinking using what Hoffman (1999) calls abductive logic, the logic of what might be (Dunne & Martin, 2006). Design thinking expresses the underlying structure and focus of inquiry that creates products or buildings (Rowe, 1991). It is defined as a discipline that connects people’s needs with what is technologically feasible, and viable from a strategy point of view in order to create costumer value (Brown, 2008). To summarize, Design thinking is an integrative approach that uses the people as a starting point. It integrates human needs, aspirations, contexts, technology interfaces and additional stakeholders along a timeline. It is future oriented since it uses aspirations and current enablers for ideation of solutions. It is innovative, in the sense that it does not use the competition as a benchmarking principle. Service Design Thinking specializes in new ways of delivering services, which many times involves rethinking business models (Brown, 2008; Kyffin & Gardien, 2009; Lunenfeld, 2003).
Within Design thinking, there is a specific stream of research called Design Driven Innovation. Verganti (2009) presents in his book Design Driven Innovation a series of case studies of companies such as Apple, Bang & Olufsen and Artemis where design has a central role in innovation. In these companies, the design process involves a deep understanding of social meaning and values to define opportunities for business innovation. This is a unique aspect of Design Driven Innovation, which sets it apart from the broader design thinking literature; instead of starting from customer needs, Verganti proposes companies carry out innovation from a deep understanding of societal changes and values. These will define meaning and value to companies. “People do not buy products but meaning. People use things for profound emotional, psychological and societal reasons as well as utilitarian ones. …Firms should therefore look beyond features, functions and performance and understand the real meaning users give to things.” (Verganti, 2009:4)
This quest for meaning begins by tapping into a group of interpreters. These are professionals directly involved in the investigation or creation of social meaning and usually come from the cultural production arena, such as artists, architects, anthropologists, marketing and media to mention a few (Verganti, 2009). The importance of culture and change in societies is undeniable: “Culture supplies us with knowledge we do not know we know, that operates invisibly to shape our understanding of the world” (McCracken 2009:49). Its implication for business is evident: “The history of disruptive innovations tells us that incumbent institutions will be replaced with ones whose business models are appropriate to the new technologies and markets.” (Johnson, Christensen & Kagermann, 2008:64).
When it comes to the process, design driven innovation is also quite different from traditional innovation approaches. Traditional approaches tend to follow a funnel model whereby many different ideas are gradually reduced until eventually a small number of the most feasible concepts are left (Chesbrough, 2003). This process is guided by the introduction of go/no go milestones and a clear goal of a profitable business case early on in the process. Rather, a design driven approach is purposefully non-linear and business priorities are usually introduced into the process much later to allow ideas to divert from conventional paths and to allow for different inputs to blend in non-structured ways (Kyffin & Gardien, 2009).
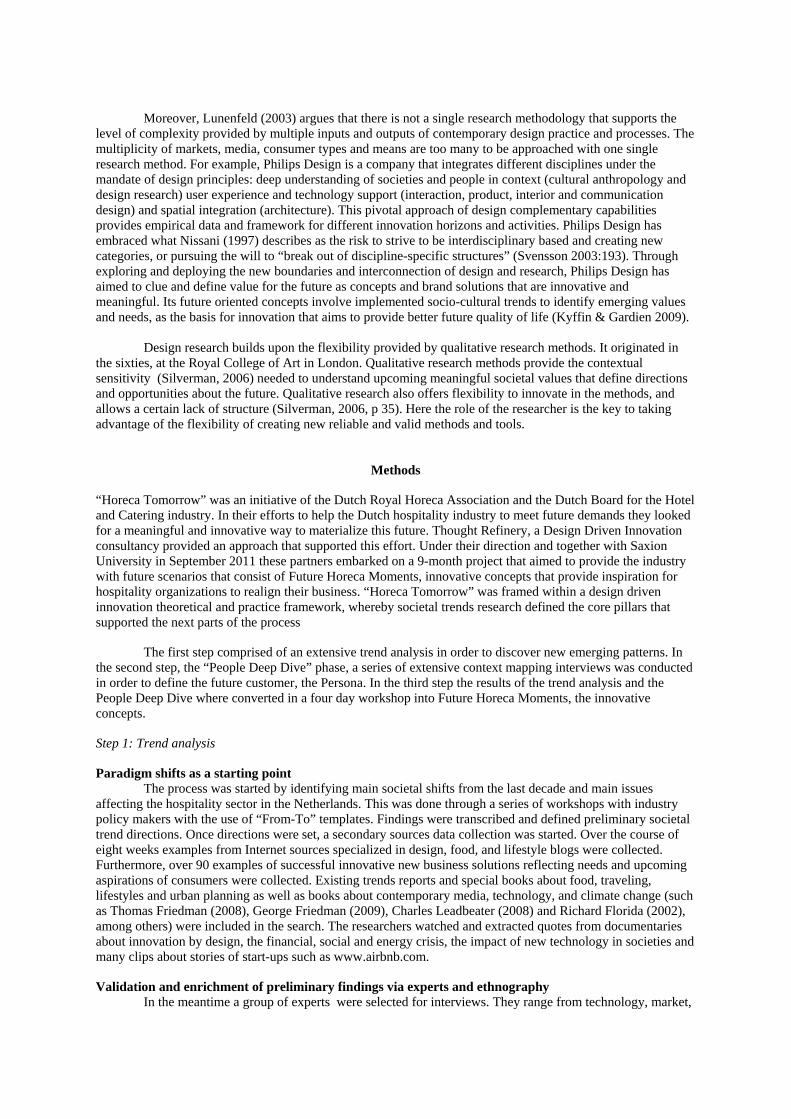
Moreover, Lunenfeld (2003) argues that there is not a single research methodology that supports the
level of complexity provided by multiple inputs and outputs of contemporary design practice and processes. The multiplicity of markets, media, consumer types and means are too many to be approached with one single research method. For example, Philips Design is a company that integrates different disciplines under the mandate of design principles: deep understanding of societies and people in context (cultural anthropology and design research) user experience and technology support (interaction, product, interior and communication design) and spatial integration (architecture). This pivotal approach of design complementary capabilities provides empirical data and framework for different innovation horizons and activities. Philips Design has embraced what Nissani (1997) describes as the risk to strive to be interdisciplinary based and creating new categories, or pursuing the will to “break out of discipline-specific structures” (Svensson 2003:193). Through exploring and deploying the new boundaries and interconnection of design and research, Philips Design has aimed to clue and define value for the future as concepts and brand solutions that are innovative and meaningful. Its future oriented concepts involve implemented socio-cultural trends to identify emerging values and needs, as the basis for innovation that aims to provide better future quality of life (Kyffin & Gardien 2009).
Design research builds upon the flexibility provided by qualitative research methods. It originated in the sixties, at the Royal College of Art in London. Qualitative research methods provide the contextual sensitivity (Silverman, 2006) needed to understand upcoming meaningful societal values that define directions and opportunities about the future. Qualitative research also offers flexibility to innovate in the methods, and allows a certain lack of structure (Silverman, 2006, p 35). Here the role of the researcher is the key to taking advantage of the flexibility of creating new reliable and valid methods and tools.
Methods
“Horeca Tomorrow” was an initiative of the Dutch Royal Horeca Association and the Dutch Board for the Hotel and Catering industry. In their efforts to help the Dutch hospitality industry to meet future demands they looked for a meaningful and innovative way to materialize this future. Thought Refinery, a Design Driven Innovation consultancy provided an approach that supported this effort. Under their direction and together with Saxion University in September 2011 these partners embarked on a 9-month project that aimed to provide the industry with future scenarios that consist of Future Horeca Moments, innovative concepts that provide inspiration for hospitality organizations to realign their business. “Horeca Tomorrow” was framed within a design driven innovation theoretical and practice framework, whereby societal trends research defined the core pillars that supported the next parts of the process
The first step comprised of an extensive trend analysis in order to discover new emerging patterns. In the second step, the “People Deep Dive” phase, a series of extensive context mapping interviews was conducted in order to define the future customer, the Persona. In the third step the results of the trend analysis and the People Deep Dive where converted in a four day workshop into Future Horeca Moments, the innovative concepts.
Step 1: Trend analysis
Paradigm shifts as a starting point The process was started by identifying main societal shifts from the last decade and main issues affecting the hospitality sector in the Netherlands. This was done through a series of workshops with industry policy makers with the use of “From-To” templates. Findings were transcribed and defined preliminary societal trend directions. Once directions were set, a secondary sources data collection was started. Over the course of eight weeks examples from Internet sources specialized in design, food, and lifestyle blogs were collected. Furthermore, over 90 examples of successful innovative new business solutions reflecting needs and upcoming aspirations of consumers were collected. Existing trends reports and special books about food, traveling, lifestyles and urban planning as well as books about contemporary media, technology, and climate change (such as Thomas Friedman (2008), George Friedman (2009), Charles Leadbeater (2008) and Richard Florida (2002), among others) were included in the search. The researchers watched and extracted quotes from documentaries about innovation by design, the financial, social and energy crisis, the impact of new technology in societies and many clips about stories of start-ups such as www.airbnb.com.
Validation and enrichment of preliminary findings via experts and ethnography In the meantime a group of experts were selected for interviews. They range from technology, market,
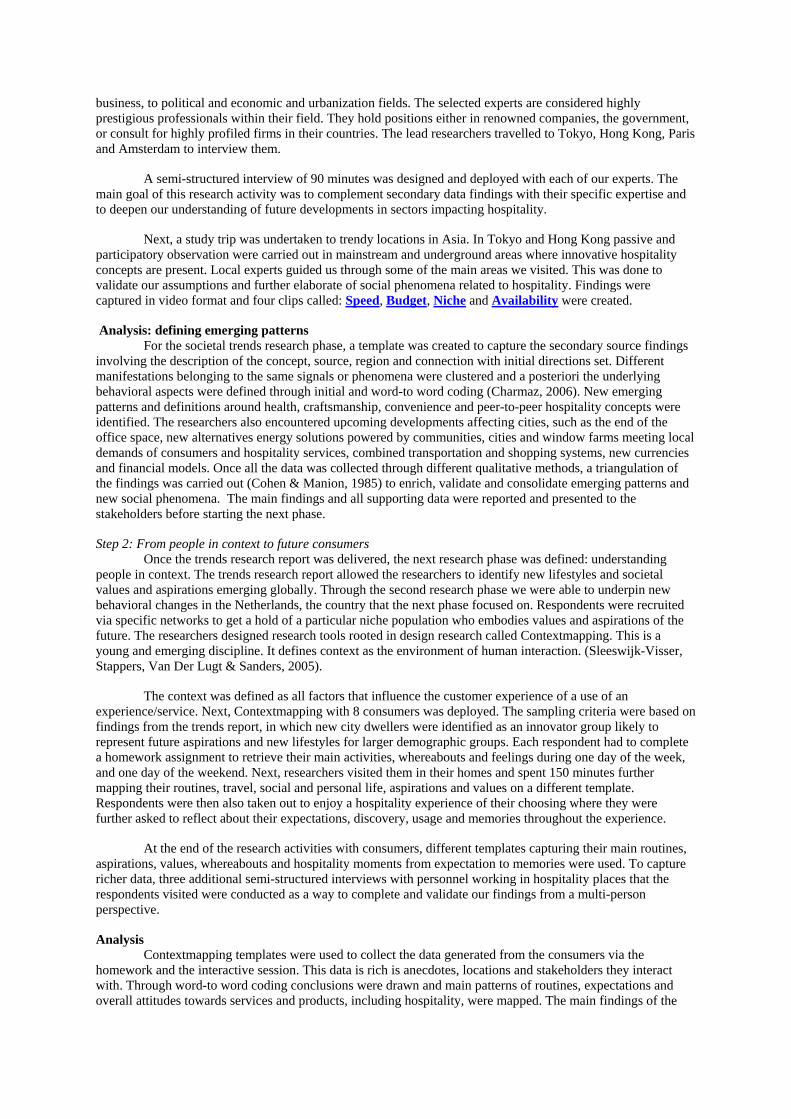
business, to political and economic and urbanization fields. The selected experts are considered highly prestigious professionals within their field. They hold positions either in renowned companies, the government, or consult for highly profiled firms in their countries. The lead researchers travelled to Tokyo, Hong Kong, Paris and Amsterdam to interview them.
A semi-structured interview of 90 minutes was designed and deployed with each of our experts. The main goal of this research activity was to complement secondary data findings with their specific expertise and to deepen our understanding of future developments in sectors impacting hospitality.
Next, a study trip was undertaken to trendy locations in Asia. In Tokyo and Hong Kong passive and participatory observation were carried out in mainstream and underground areas where innovative hospitality concepts are present. Local experts guided us through some of the main areas we visited. This was done to validate our assumptions and further elaborate of social phenomena related to hospitality. Findings were captured in video format and four clips called: Speed, Budget, Niche and Availability were created.
Analysis: defining emerging patterns For the societal trends research phase, a template was created to capture the secondary source findings involving the description of the concept, source, region and connection with initial directions set. Different manifestations belonging to the same signals or phenomena were clustered and a posteriori the underlying behavioral aspects were defined through initial and word-to word coding (Charmaz, 2006). New emerging patterns and definitions around health, craftsmanship, convenience and peer-to-peer hospitality concepts were identified. The researchers also encountered upcoming developments affecting cities, such as the end of the office space, new alternatives energy solutions powered by communities, cities and window farms meeting local demands of consumers and hospitality services, combined transportation and shopping systems, new currencies and financial models. Once all the data was collected through different qualitative methods, a triangulation of the findings was carried out (Cohen & Manion, 1985) to enrich, validate and consolidate emerging patterns and new social phenomena. The main findings and all supporting data were reported and presented to the stakeholders before starting the next phase.
Step 2: From people in context to future consumers Once the trends research report was delivered, the next research phase was defined: understanding
people in context. The trends research report allowed the researchers to identify new lifestyles and societal values and aspirations emerging globally. Through the second research phase we were able to underpin new behavioral changes in the Netherlands, the country that the next phase focused on. Respondents were recruited via specific networks to get a hold of a particular niche population who embodies values and aspirations of the future. The researchers designed research tools rooted in design research called Contextmapping. This is a young and emerging discipline. It defines context as the environment of human interaction. (Sleeswijk-Visser, Stappers, Van Der Lugt & Sanders, 2005).
The context was defined as all factors that influence the customer experience of a use of an experience/service. Next, Contextmapping with 8 consumers was deployed. The sampling criteria were based on findings from the trends report, in which new city dwellers were identified as an innovator group likely to represent future aspirations and new lifestyles for larger demographic groups. Each respondent had to complete a homework assignment to retrieve their main activities, whereabouts and feelings during one day of the week, and one day of the weekend. Next, researchers visited them in their homes and spent 150 minutes further mapping their routines, travel, social and personal life, aspirations and values on a different template. Respondents were then also taken out to enjoy a hospitality experience of their choosing where they were further asked to reflect about their expectations, discovery, usage and memories throughout the experience.
At the end of the research activities with consumers, different templates capturing their main routines, aspirations, values, whereabouts and hospitality moments from expectation to memories were used. To capture richer data, three additional semi-structured interviews with personnel working in hospitality places that the respondents visited were conducted as a way to complete and validate our findings from a multi-person perspective.
Analysis Contextmapping templates were used to collect the data generated from the consumers via the
homework and the interactive session. This data is rich is anecdotes, locations and stakeholders they interact with. Through word-to word coding conclusions were drawn and main patterns of routines, expectations and overall attitudes towards services and products, including hospitality, were mapped. The main findings of the
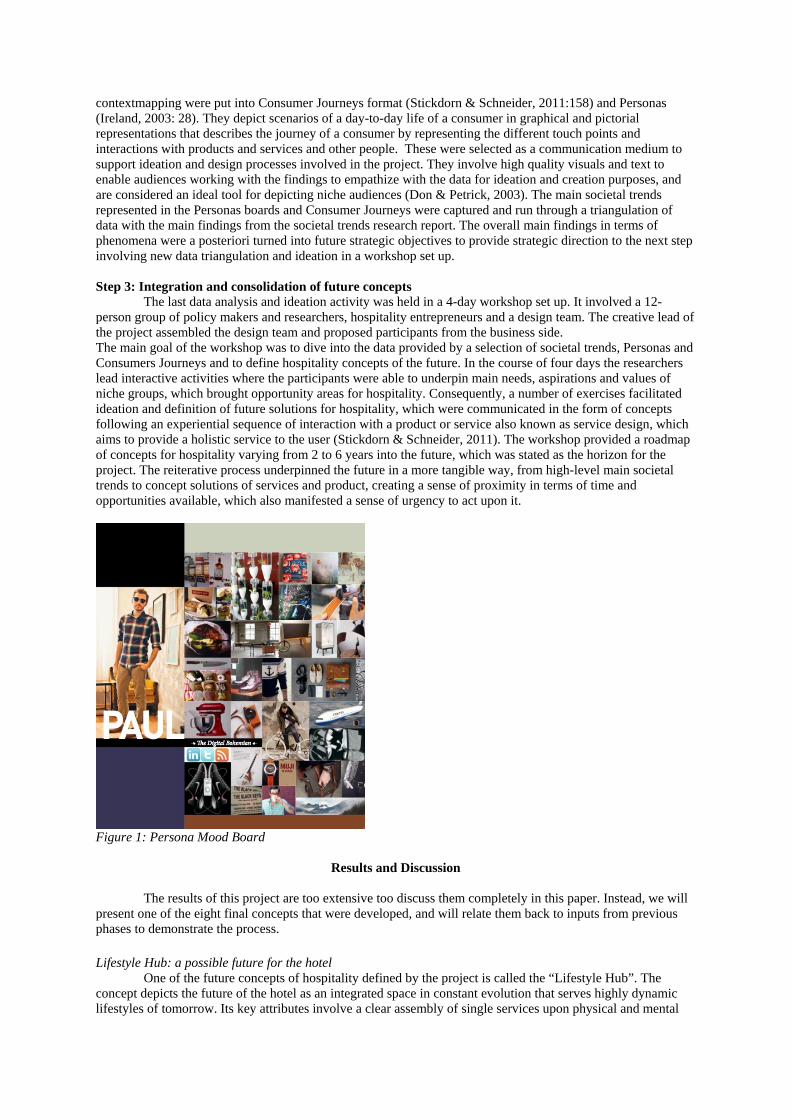
contextmapping were put into Consumer Journeys format (Stickdorn & Schneider, 2011:158) and Personas (Ireland, 2003: 28). They depict scenarios of a day-to-day life of a consumer in graphical and pictorial representations that describes the journey of a consumer by representing the different touch points and interactions with products and services and other people. These were selected as a communication medium to support ideation and design processes involved in the project. They involve high quality visuals and text to enable audiences working with the findings to empathize with the data for ideation and creation purposes, and are considered an ideal tool for depicting niche audiences (Don & Petrick, 2003). The main societal trends represented in the Personas boards and Consumer Journeys were captured and run through a triangulation of data with the main findings from the societal trends research report. The overall main findings in terms of phenomena were a posteriori turned into future strategic objectives to provide strategic direction to the next step involving new data triangulation and ideation in a workshop set up. Step 3: Integration and consolidation of future concepts
The last data analysis and ideation activity was held in a 4-day workshop set up. It involved a 12-person group of policy makers and researchers, hospitality entrepreneurs and a design team. The creative lead of the project assembled the design team and proposed participants from the business side. The main goal of the workshop was to dive into the data provided by a selection of societal trends, Personas and Consumers Journeys and to define hospitality concepts of the future. In the course of four days the researchers lead interactive activities where the participants were able to underpin main needs, aspirations and values of niche groups, which brought opportunity areas for hospitality. Consequently, a number of exercises facilitated ideation and definition of future solutions for hospitality, which were communicated in the form of concepts following an experiential sequence of interaction with a product or service also known as service design, which aims to provide a holistic service to the user (Stickdorn & Schneider, 2011). The workshop provided a roadmap of concepts for hospitality varying from 2 to 6 years into the future, which was stated as the horizon for the project. The reiterative process underpinned the future in a more tangible way, from high-level main societal trends to concept solutions of services and product, creating a sense of proximity in terms of time and opportunities available, which also manifested a sense of urgency to act upon it.
Figure 1: Persona Mood Board
Results and Discussion
The results of this project are too extensive too discuss them completely in this paper. Instead, we will present one of the eight final concepts that were developed, and will relate them back to inputs from previous phases to demonstrate the process.
Lifestyle Hub: a possible future for the hotel One of the future concepts of hospitality defined by the project is called the “Lifestyle Hub”. The concept depicts the future of the hotel as an integrated space in constant evolution that serves highly dynamic lifestyles of tomorrow. Its key attributes involve a clear assembly of single services upon physical and mental
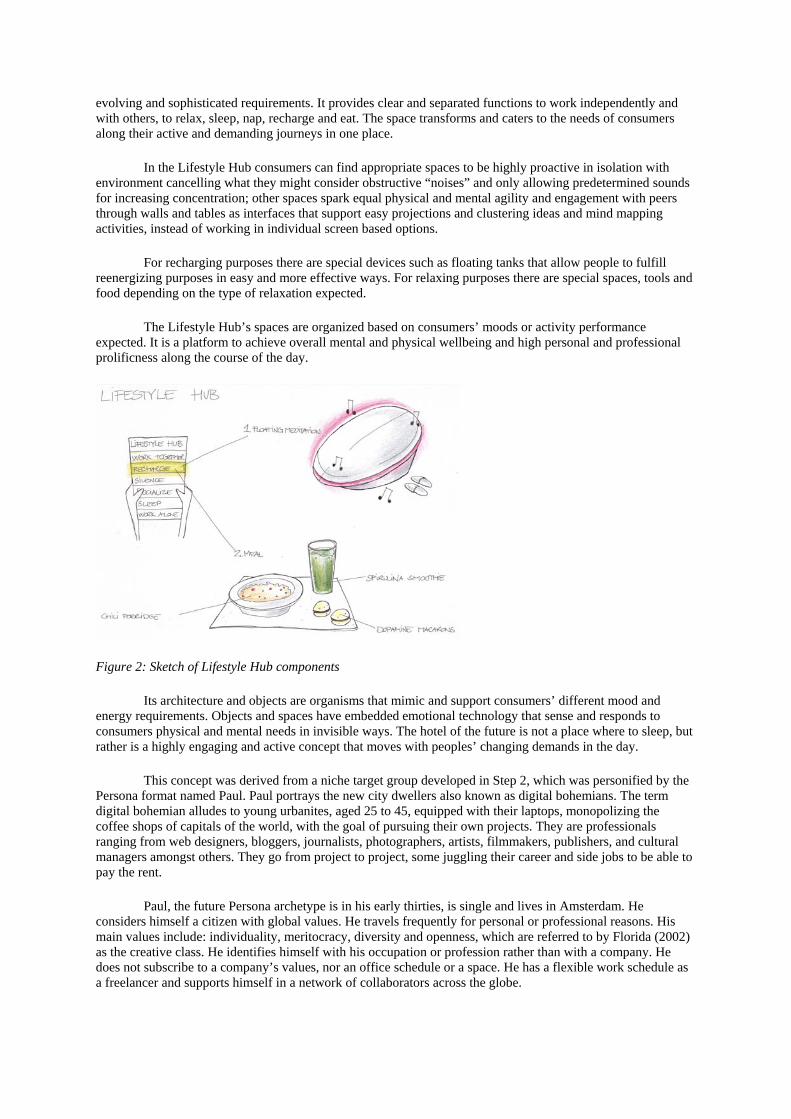
evolving and sophisticated requirements. It provides clear and separated functions to work independently and with others, to relax, sleep, nap, recharge and eat. The space transforms and caters to the needs of consumers along their active and demanding journeys in one place.
In the Lifestyle Hub consumers can find appropriate spaces to be highly proactive in isolation with environment cancelling what they might consider obstructive “noises” and only allowing predetermined sounds for increasing concentration; other spaces spark equal physical and mental agility and engagement with peers through walls and tables as interfaces that support easy projections and clustering ideas and mind mapping activities, instead of working in individual screen based options.
For recharging purposes there are special devices such as floating tanks that allow people to fulfill reenergizing purposes in easy and more effective ways. For relaxing purposes there are special spaces, tools and food depending on the type of relaxation expected.
The Lifestyle Hub’s spaces are organized based on consumers’ moods or activity performance expected. It is a platform to achieve overall mental and physical wellbeing and high personal and professional prolificness along the course of the day.
Figure 2: Sketch of Lifestyle Hub components
Its architecture and objects are organisms that mimic and support consumers’ different mood and energy requirements. Objects and spaces have embedded emotional technology that sense and responds to consumers physical and mental needs in invisible ways. The hotel of the future is not a place where to sleep, but rather is a highly engaging and active concept that moves with peoples’ changing demands in the day.
This concept was derived from a niche target group developed in Step 2, which was personified by the Persona format named Paul. Paul portrays the new city dwellers also known as digital bohemians. The term digital bohemian alludes to young urbanites, aged 25 to 45, equipped with their laptops, monopolizing the coffee shops of capitals of the world, with the goal of pursuing their own projects. They are professionals ranging from web designers, bloggers, journalists, photographers, artists, filmmakers, publishers, and cultural managers amongst others. They go from project to project, some juggling their career and side jobs to be able to pay the rent.
Paul, the future Persona archetype is in his early thirties, is single and lives in Amsterdam. He considers himself a citizen with global values. He travels frequently for personal or professional reasons. His main values include: individuality, meritocracy, diversity and openness, which are referred to by Florida (2002) as the creative class. He identifies himself with his occupation or profession rather than with a company. He does not subscribe to a company’s values, nor an office schedule or a space. He has a flexible work schedule as a freelancer and supports himself in a network of collaborators across the globe.
Paul, describes himself: “For me every day is different. I am looking for permanent surprise and constant amusement. I thrive for change and new experiences and prolificness. I want to be inspiring and inspired by others. I live as if everyday was my last one. Since I travel and move so much sometimes I wonder where is home.” He strives for healthy lifestyles provided through indulging in good quality food moments provided by locally produced ingredients and reflected craftsmanship in products and services.
Paul depicts highly contemporary values such as the pursuit of self-development rather than economic opportunities, a peer-to-peer support and collaboration, with borderless entrepreneurship and creativity provided through new technologies and networks. New working, socializing and mobility patterns of digital bohemians underpin the need for spaces to act as a lifestyle pillar, providing physical and emotional structures offered in the past by companies, colleagues and traditional family models. “We are postponing marriage. Our family structures are morphing. The kind of communities we need to support us are changing, as we replace a small number of strong-tie relationships with a much greater number of weak-tie relationships” (Florida, 2002: XIV). The digital bohemians are “neo-gypsies”, nomadic citizens who enjoy the fullest the flexibility and mobility of their professional choices, who want to maximize their time and carry out diverse activities having a silent support that accommodates and mimics their versatility and adaptability. All of these depictions were triangulated with findings from Step 1 and support broader societal trends.
Paul or the digital bohemians have become an economic engine and differentiator of cities. Therefore understanding their dynamic lifestyles and serving their needs is crucial for the hospitality sector. Florida believes that cities need a “people climate” even more than a business one. This means enabling creativity “across the board” by building communities that attract creative people rather than only high-tech companies (Florida, 2002:283).
Through a series of future customer value propositions that we called Future Horeca Moments we provoke and propose possible solutions for the hospitality sector. We cannot guarantee that these concepts will materialize in the future; we are simply providing a vision through concepts that we believe meet the expectations and demands of tomorrow’s consumers. The concepts address current “threats” affecting the sector such as for example informal hospitality concepts (bed and breakfast and retail) offering a new outlook and opportunities for hospitality businesses.
Limitations and directions for future research This study has a number of limitations. First of all, we have a simple constraint of space in this paper to
provide more than one example of the concepts found through the research. The broader range of concepts and personas will however be communicated to entrepreneurs in a nation-wide communication campaign after the summer. Second, the design driven approach itself is so different from more traditional approaches that it can be challenging preconceptions for positivistic researchers not accustomed to design research principles in approaching the world around them. This is a method that has to be learned over time and that needs to be supported by researchers well versed in design methodologies. This also generates a third limitation: because design research does not follow a linear approach and uses different principles for interpreting the data, it may be more difficult to communicate the process through which results are generated. In this study, industry representatives as well as hospitality researchers were brought into the process to “anchor” the findings in two ways; firstly by providing hospitality context and secondly by streamlining the communication for hospitality entrepreneurs. Lastly, as this project sets out to generate future scenarios, we can at this time not validate the findings. This will need to be done in follow-up studies. Because this study was the first to use a Design thinking approach in a hospitality setting, we do invite other scholars to incorporate design thinking into their research, in order to build a more rigorous body of knowledge on design thinking in the hospitality industry. In particular, Design Driven Innovation research for different hospitality sectors, as well as research studying different types of organizations such as SME or multinational companies would benefit our increased understanding of innovation in the hospitality industry in general and the effectiveness of Design Driven Innovation approaches in the industry specifically. Theoretical and practical implications
This study answers to Harrington & Ottenbacher’s (2011) call for more research focus on techniques that can enhance knowledge sharing, knowledge development, and innovation creation given the structural challenges of the hospitality field. Design Driven Innovation was until recently exclusively reserved for high-tech and design companies, but turns out to be well suited to respond to this call. In this study we have explored if design principles apply to the hospitality industry. We conclude that the principles are well suited for the hospitality industry for three reasons:
1. The multi-disciplinary approach of Design thinking and its non-linear process fits well with the multi-faceted reality of a hospitality experience in which guest experiences are always a result of the interaction of the guest with the representative of the hospitality organization and the guest’s interaction with the physical location where hospitality is provided, be it a hotel, a restaurant, meeting spaces, etc.
2. The people-oriented view of Design thinking is closely connected the people-oriented approach of the hospitality industry. Design Driven Innovation defines meaningful propositions to a market that heavily relies on creating memories and emotional experiences.
3. The use of a wide range of research methods including trends research, ethnographic research, expert interviews and customer journeys generated a great deal of information. Whilst the process of collating this into Future Scenarios and concepts may have been an arduous process, it allows for many insights at both macro and micro levels that will appeal to the wide range of different types of organizations found in the hospitality industry. The Personas, Future Strategic Objectives and the developed “Future Horeca Moments” concepts are appealing as they incorporate future projections in such a way that many types of organizations will be able to find elements that will help them prepare for this future.
Conclusion
This practitioner-scholar collaborative study explored the use of design thinking as an alternative innovation method for hospitality businesses. Design Driven Innovation methods were used to drive a large-scale project defining future scenarios for the Dutch hospitality industry. The Design Driven Innovation approach, including the different unique methodologies and its value for the project were discussed. Findings suggest that this approach allows users to make sense of today’s complex societal trends in relation to their own organization. We conclude that Design thinking fits well with the nature of hospitality business and presents an alternative over more traditional innovation methodologies. The combination of a multidisciplinary team dedicated for the assignment and a wide array of (qualitative) methods has led to rich data and in turn to lively depictions of trends in formats that translate to business concepts that entrepreneurs should be able to understand and adapt easily. This paper is the first to evaluate the application of design driven innovation, and as such contributes to the body of knowledge on hospitality innovation. References Baregheh, A., Rowley, J. & Sambrook, S. (2009). Towards a multidisciplinary definition of innovation.
Management Decision, 47(8), 1323-1339. Brown, T. (2008). Design Thinking. Harvard Business Review. June 2008, 85-92. Charmaz, K. (2006). Coding in grounded theory and practice. In Charmaz, K. (Ed.). Constructing grounded
theory: A practical guide through qualitative analysis (pp 42-46). Los Angeles, CA: Sage Publications. Chesbrough, H.W. (2003). Open innovation- the new imperative for creating and profiting from technology.
Boston, MA: Harvard Business School Press. Cohen, L. & Manion, L. (1985). Research methods in education. London, UK: Croom Helm. Don, A. & Petrick, J. (2003). User Requirements. In B. Laurel (Ed.), Design Research: Methods and
Perspectives (pp. 70-81). Cambridge, MA: MIT Press. Dunne, D. & Martin, R. (2006). Design Thinking and How It Will Change Management Education: An
Interview and Discussion. Academy of Management Learning & Education, 5(4), 512-523. Enz, C.A. & Canina, L. (2010). Competitive pricing in European hotels, Advances in Hospitality and Leisure, 6: 3-25. Florida, R. (2002). The Rise of the Creative Class. New York, NY: Basic Books. Fraser, H. M.A. (2009). Designing Business: New Models for Success. Design Management Review, 20: 56–65 Friedman, T. (2008). Hot, Flat and Crowded. New York, NY: Picador. Friedman, G. (2010). The Next 100 Years. New York, NY: Anchor Books. Gallouj, F. (2002). Innovation in services and the attendant old and new myths. Journal of Socio-Economics, 31,
137-154. Go, F., Breukel, A. & Daverschot, R. (2007). Horeca 2015 “Toekomstige vaardigheden [Hospitality 2015
Future Skills]. Woerden, NL: Koninklijke Horeca Nederland/Horeca Branche Instituut,. Harrington, R.J. & Ottenbacher, M.C. (2011). Strategic management: An analysis of its representation and focus
in recent hospitality research International Journal of Contemporary Hospitality Management, 23(4), 439 – 462.
Hoffman, M. (1995). Problems with Pierce’s concept of abduction. Foundations of Science, 4(3), 271-305. Ireland,C. (2003). Qualitive Matters, from Boring to Brilliant. In B. Laurel (Ed.), Design Research: Methods
and Perspectives (pp. 23-29 ). Cambridge, MA: MIT Press.
Jenkins, J. (2008). Creating the Right Environment for Design. Design Management Review, 19(3), 16–22. Jones, P. (1996). Managing hospitality innovation. Cornell Hotel and Restaurant Administration Quarterly,
37(5), 86-96. Johnson, M., Christensen, C.M. & Kagermann, H. (2008). Reinventing your Business Model. Harvard Business
Review HBR’s Must-Reads on Strategy, 57-66. Kyffin, S., & Gardien, P. (2009). Navigating the innovation matrix: An approach to design-led innovation.
International Journal of Design, 3(1), 57-69. Leadbeater, C. (2008). We think: Mass Innovation, Not Mass Production. London, UK: Profile Books. Lester, R.K., Piore, M.J. & Malik, K.M. (1998). Interpretative management: What General Managers can learn
from Design, Harvard Business Review, 76(2): 86-96. Lunenfeld, P., (2003). The Design Cluster. In B. Laurel (Ed.), Design Research: Methods and
Perspectives (pp 10-15). Cambridge, MA: MIT Press. McCracken, G. (2009). Chief Culture Officer. New York, NY: Basic Books. Mintzberg, H., Ahlstrand, B. & Lampel, J. (2008). Strategy Safari. A guided tour through the wilds of strategic
management. New York: The Free Press. Nissani, M. (1997). Ten Cheers for Interdisciplinarity: The Case for Interdisciplinary Knowledge and Research, The Social Science Journal, 34 (2), 201-216 Nussbaum, B. (2005a). Get Creative. Business Week, August 1. Nussbaum, B. (2005b). Getting schooled in innovation. Business Week, January 3. Olsen, M.D., West, J.J. & Tse, E. C-Y. (2008). Strategic Management in the Hospitality Industry 3rd Edition,
Upper Saddle River, NJ: Pearson Education. Olsen, M.D., Zhao, J.L., Sharma, A. & Choi, J.G. (2000). Leading hospitality into the age of excellence,
expansion, competition and vision in the multinational hotel industry (white paper). Paris, FR: International Hotel & Restaurant Association.
Ottenbacher, M.C. & Gnoth, J. (2005). How to develop successful hospitality innovation. Cornell Hotel and Restaurant Administration Quarterly, 46 (2), 205-222.
Porter, M.E. & Ketels, C.H.M. (2003). Competitiveness: Moving to the next stage. Strategic Management Journal, 24, 415-431.
Prajogo, D. I. (2006). The relationship between innovation and business performance – a comparative study between manufacturing and service firms. Journal of Knowledge and Process Management, 13, 218-225.
Rowe, G. P. (1991). Design Thinking. Cambridge, MA: MIT Press. Schumpeter, J.A. (1934). The theory of Economic Development. Cambridge, MA: Harvard University Press. Siguaw J.A., Simpson, P.M., & Enz, C.A. (2006). Conceptualizing innovation orientation: a framework for
study and integration of innovation research. Journal of Product Innovation Management, 23, 556-574. Sleeswijk-Visser, F., Stappers, P.J., Van Der Lugt, R. & Sanders, E.B-N. (2005). Contextmapping: experiences
from practice. CoDesign: International Journal of CoCreation in Design and the Arts, 1(2), 119-149. Stickdorn, M., Schneider, J. (2011). This is Service Design Thinking: Basics, Tools Cases, Amsterdam, NL:
Biss Publishers. Silverman, D. (2006). Interpreting Qualitative Data, London, UK: Saga Publications. Sipe, L.J. & Testa, M. (2009). What is Innovation in the Hospitality and Tourism Marketplace? A Suggested
Research Framework and Outputs Typology. International CHRIE Conference-Refereed Track. Paper 22. (July 31, 2009). Retrieved from: http://scholarworks.umass.edu/refereed/Sessions/Friday/22.
Svensson, P. (2003). Interdisciplinary Design Research. In B. Laurel (Ed.), Design Research: Methods and Perspectives (pp. 193-200). Cambridge, MA: MIT Press.
Verganti, R. (2008). Design, Meanings and Radical Innovation: A Metamodel and a Research Agenda. Journal of Product Innovation Management, 25, 436-456.
Verganti, R. (2009). Design Driven Innovation, Changing the Rules of Innovation by Radically Innovating What Things Mean, Watertown, MA: Harvard Business School Publishing.
NEW VENTURE ENTRY MODE AND COMPETITIVE DYNAMICS: AN INVESTIGATION OF LONG-TERM HOTEL PERFORMANCE
Cathy A. Enz*, Ph.D. Professor of Strategy
Cornell University [email protected]
Linda Canina, Ph.D.
Associate Professor of Finance Cornell University [email protected]
ABSTRACT
The strategic management literature tends to focus on rivalry across firms, neglecting the benefits that may arise from having competitive rivals. Recent work has suggested that the strategic choices a firm makes could have positive performance spillover for competitors (Andersson & Loof, 2011; Eriksson, 2011; Kosova & Lafontaine, 2010). Indeed hotels may benefit from the efforts of others in their competitive clusters (Canina, Enz, & Harrison, 2005). This longitudinal study investigates the role of new hotel entry mode and local competitive conditions on the performance of entering hotels over the first eight years of their operation. Comparing the performance outcomes over time of new hotel ventures that enter with different governance models reveals that franchise hotels that are company operated yield the highest levels of performance followed by franchised and then unaffiliated enterprises. However, the competitive conditions in a local market also play a critical role in enhancing or diminishing performance. New entrants entering markets with existing high levels of brand penetration have lower performance, as do new entrants who were most different in their competitive position than other hotels in the market. Overall, hotels were able to secure higher performance in homogeneous markets in which they were more similar to existing hotels. These findings suggest that positive spillover may be available to new hotels that are like others in the market, a finding that challenges the conventional wisdom in strategy that competitive advantage accrues to those who offer unique differences. A series of controls were used to rule out the effects of location, hotel segment, and region, along with market demand and hotel size and age. The practical implications of this study for new venture entry mode and market location criteria are offered with specific suggestions for owners interested in hotel development.
NEW VENTURE ENTRY MODE AND COMPETITIVE DYNAMICS: AN INVESTIGATION OF LONG-TERM HOTEL PERFORMANCE
In the pursuit of opportunity, new businesses often engage in the use of collaborative interorganizational relationships (IORs) (Powell et al, 1996; Teece et al, 1997; Jarillo, 1988). Through partnerships, entrepreneurial ventures can often access resources and capabilities that they do not control, but deem necessary. In service firms, business format franchising is a popular form of entrepreneurship that involves cooperation among different types of entrepreneurs (Baucus, Baucus, and Human, 1996) in which know-how is acquired or shared and informed by local market expertise. In many services the co-creation of value through partnerships leads to competitive advantage (Vargo and Lusch, 2004). Others have argued that the ability to find and join forces with complementary partners is a key element of competitiveness (Sarkar, Echambadi, Cavusgil, and Aulakh, 2001). Indeed, Dyer and Singh (1998) argue that a firm’s partnership network may be the basis for competitive advantage. Franchise partners for example can offer valuable market information and specific operational practices that help a new venture to capture opportunities and achieve financial performance quickly. What is less clear is whether new ventures over time benefit from their IORs, and particularly those partnerships that are embodied in formal and long-term contracts, such as a franchisee relationship. Further, little attention is given to comparing the long-term performance of new ventures that operate with different organizational forms. In this study we explore the performance outcomes of new entrants that have either a franchisor company-operated, franchisee operated, or independent operator governance model for market entry.
The strategic management literature tends to focus on the value of partnerships in the context of rivalry across firms, often assuming that IORs will deliver competitive advantage through information sharing, legitimation, and organizational learning. In a franchise context, the franchisor delivers standardized processes that assure consistent quality, and the franchisee provides local customer information and brings capital to the contractual relationship. Because of this interdependence both franchisor and franchisee must rely on each other. We would expect that given the operational and strategic support provided in a franchising model, new ventures who enter with brand affiliation will be higher performers than those who do not operate with IORs. Therefore:
Hypothesis 1: New entrants who enter using a brand will have higher levels of performance overtime than those ventures that enter without a brand affiliation. When comparing the governance structures of company operated versus franchise owned, a body of
existing literature has argued that corporate units are best at incremental improvements in homogeneous markets, while franchise operators are more likely to innovate and adapt to local conditions (Sorenson and Sorensen, 2001). Independent entrepreneurs are even more likely to benefit when conditions call for unique and localized products in which strong brands and efficient operational procedures are less valuable. The argument from this literature is that if different markets are similar (e.g., homogeneous) than franchise operators can gain benefit from their multi-market locations. By extension we argue that all new ventures will benefit when a specific market is strategically homogeneous, meaning that the dispersion of strategy types across competitors in the local market is low. In strategically homogeneous local markets, we argue that both independent entrepreneurs and branded new ventures benefit because all competitors are the beneficiaries of relevant knowledge transfer. In markets that have similar segmented operators learning proves to be valuable for all competitors. For independent new entrants co-location in close proximity to brands allows consumers to evaluate their offerings without leaving an area. Consequently, geographic areas with both independent and branded hotels offer choices that are attractive to consumers. In this study we not only explore the entry mode, but the degree to which the strategic homogeneity or concentration of like competitors enhances new entry operating performance. We offer the following hypothesis taking into consideration the level of concentration of strategy types in the local market.
Hypothesis 2: Performance for all new entrants will be greater in markets that are strategically homogeneous (concentrated). As suggested in hypothesis 2, in a complex competitive landscape it is possible that a new entrant who
has chosen to “go it alone” without partners may tap into locational advantages such as strategic homogeneity by operating in close proximity to competitors who have established IORs, however being different from competitors may also have advantages. The literature suggests that the being different from the competition can also have positive performance outcomes (Canina, et al., 2005). For example, new entrants that locate close to competitors that have a strategic orientation of high differentiation may reap performance benefits. In addition,
the magnitude of the difference in strategic orientation from competitors is likely to amplify the positive benefits for these firms. In particular, it has been argued that firms will reap the greatest benefits when they are farthest in strategic distance within a local market of more highly differentiated firms. In this case, being different amplifies the positive benefits for firms with a low-cost strategic orientation. For example, if a firm is pursuing a low-cost strategic orientation, then a greater distance between that strategic orientation and the average strategic orientation in the local market means that the cluster is characterized by a higher average level of differentiation. Assume, for instance, two economy hotels, each in different local markets we will call A and B. Local market A is made up primarily of higher-end hotels, and local market B contains primarily middle- or lower-end hotels. The economy firm in local market A should have higher performance than the firm in local market B because local market A contains more highly differentiated firms and is therefore more attractive to consumers. Furthermore, we argue that the benefit is even greater for the economy hotel in local market A because the strategic distance between the dominant local market orientation and that of the low-end hotel is greater than it is in local market B. Based on previous research on the positive impact of strategic distance we argue as follows:
Hypothesis 3: New entrants who are strategically distinct will have higher levels of performance.
Recent work has suggested that the strategic choices a firm makes could have positive performance spillover for competitors (Andersson & Loof, 2011; Kosova & Lafontaine, 2010). Indeed the co-evolution of various markets may reveal that when a market is already populated with a large percentage of brands the opportunities may be lower for solo entrepreneurs because of the popularity of IORs in these saturated markets. Further, the strategic distance a given hotel is from the cluster may be revenue diminishing for some firms, as previous research would suggest (Canina et al., 2005). Being different amplifies the uniqueness of a firm, but may pose risks in the early years of new venture operation, especially if new entrants are entering markets that are already dominated by branded competitors. Two additional hypotheses are offered to explore these issues:
Hypothesis 4: New entrants who enter markets that are already saturated with brands will have lower levels of performance.
METHODOLOGY
The data for new hotels was obtained from Smith Travel Research (STR), an independent research organization, through strict and exclusive confidentiality arrangements. STR has one of the most comprehensive databases available for tracking lodging performance. The data consist of monthly hotel-level room revenue and rooms sold for each property. In addition, STR supplied categorical variables that describe some of the characteristics of each firm. These data included (1) the number of rooms in a hotel, (2) the Metropolitan Statistical Area (MSA) in which the hotel was located, (3) the more narrowly defined market tract in which the hotel was located, (4) the location type of the hotel, which could be urban, suburban, airport, interstate, resort and small metropolitan towns, (5) the regional location of the property, New England, Middle Atlantic, South Atlantic, East North Central, East South Central, West North Central, West South Central, Mountain, and Pacific and (6) the product/service quality segment category of the hotel. The sample consists of 6,534 hotels that entered the U.S. market over the 2000-2010 time periods. The data provider, STR, identifies the location of a hotel by both MSA and tract. Tracts are defined as a subset of an MSA defined by counties and/or zip codes in the United States. For example, the Boston MSA is divided into 10 tracts. A total of 550 tracts currently exist in the United States. Tracts provide a more refined geographic unit for studying competitive markets than MSAs since they better reflect the realistic options available to a consumer who desires to visit a particular location. Further, the tract is the smallest location grouping available for the dataset used in this study. In the discussion to follow we will refer to tracts as “local markets” or simply “markets” for consistency with our hypothesized relationships. Other researchers have argued for the use of this market definition to capture fine-grained variation in market characteristics and locational spillover (Canina, et. al., 2005; Kosova, Lafontaine, and Perriogt, Forthcoming).
Since the data sample consists of property level data by year for the 2000-2010 period, modeling in these setting calls for some complex specifications given autocorrelation often appears in times-series data and both homoscedasticity and uncorrelated errors across the cross-sectional units
(the properties) are strong assumptions. If we assume that the errors, i,t , in the model are not correlated cross-sectionally, across hotel properties i, and not correlated across time, t, then we could simply pool the IT observations , assuming there are a total of I properties sampled and a total of T years per property and estimate the coefficients by ordinary least squares. Since that is not a reasonable assumption, we estimated the following equation using feasible generalized least squares (FGLS), in a fixed effects model, in order to allow for the possibility of cross-sectional heteroscedasticity, cross-sectional correlation and autocorrelation, and, assuming fixed effects parameter heterogeneity across time.1 Note that i denotes the focal property, j refers to property i’s local market and t, the year.
, Revenue per available room (RevPAR) is considered to be one of the most important
performance measures in the lodging industry and served as the dependent variable in this study (Chung & Kalnins, 2001; Ismail, Dalbor, & Mills, 2002). This performance measure is calculated by taking the annual revenue generated by rooms sales and dividing that by the annual number of rooms available for sale for each property,i for each year, t (Enz, Canina, & Walsh, 2001).
Entry mode for the new hotels was characterized as either chain affiliated or independently
operated (without a brand). The assignment of a new hotel to one of these entry modes was based on information provided by the hotels and classified in the hotel census database of STR. Branded hotels were distinguished further by their operating form as either operated by the brand company or franchised. Entry mode was represented using two indicator variables since there are three alternatives: chain affiliated and operated by the brand company (chain operated set equal to 1 if true, 0 otherwise); chain affiliated operated by the franchisee (franchisee operated set equal to 1 if true, 0 otherwise); and independent, that is, non-branded (captured by the intercept).
Since it has been suggested that the strategic choices a firm makes could have positive
performance spillover for competitors and that hotels may benefit from the efforts of others in their local market it is important to include characteristics of the local market. We included chain penetration, the percentage of new entrants, competitive strategic homogeneity, strategic distance and market demand as characteristics of the local market and the hotel in relation to the local market.
Chung and Kalnins (2001) found increased room revenues for hotels in rural areas with a high percentage of chain hotels in their markets. These findings may indicate that chains draw consumers to rural areas, perhaps through their advertising and brand recognition. Similarly, Ingram (1996) discovered that hotels were more likely to survive if they were associated with a brand. Consequently, we analyzed the impact of chain market penetration in the local market. Chain Penetration is defined as the number of chain hotel rooms in the focal hotel’s market divided by the total number of rooms in the market, by year. The percentage of new entrants was included as a proxy for the life-cycle of the local market. Hotels in older, well established markets may perform better on average due to familiarity and reputation. The percentage of new entrants (New Entrants) is defined as the number of new hotel rooms in the focal hotel’s market divided by the total number of rooms in the market, by year.
Co-location allows consumers to evaluate offerings without leaving an area. Consequently, geographic
areas with competing services are more attractive to consumers. Benefits may accrue from variety or homogeneity (Marshall, 1920: 273). To measure Strategic Homogeneity or the level of concentration of strategy types in a given local market we tallied the number of hotels in each product-quality category then divided each tally by the total number of hotels in the local market. We squared each of these proportions and then summed them. High values suggest that the local market is concentrated with respect to strategic orientation; low values suggest that the local market is strategically dispersed.
To measure Strategic Distance, we examined the distance between a firm’s strategic
orientation and the central tendency of the strategic orientations of other firms in the local market. The central tendency was determined by assigning each strategy type a number from 1 (“economy/budget”) 1 For a detailed description of this methodology see Greene, Econometric Analysis, pp 444-485.
to 4 (“luxury”). We then calculated the average strategic type in the local market. The distance score was the firm’s own value minus the local market’s central tendency.
Market demand, age and size are control variables included in this study because they can
have a significant impact on firm performance. Since demand conditions vary across hotel properties, the occupancy percentage of the market was included to control for local demand (Market Demand). It takes time for a hotel to capture its fair market share, where the amount of time varies depending on the type of hotel as well as its location. For example, many consultants assume that it takes about three years for a new property to gain its fair share of the market when forecasting occupancy of a new hotel. Typically the relationship between age and performance is nonlinear. That is performance increases at a decreasing rate, as a result age was computed as the log of age, Age. Size was also included because it is an important characteristic of the hotel and was measured as the number of rooms.
The highly segmented lodging industry uses industry classifications to identify individual
hotels as luxury, upscale, midscale, and economy/budget. Appropriate testing of the model requires including a series of dummy variables to capture market segments. The four market segments were included as 3 indicator variables, economy/budget, midscale and upscale. The luxury segment is included in the intercept. Controls for geographical regions and location type were also included as controls in the form of indicator variables.
RESULTS
Table 1 provides the results for three regression models using feasible generalized least squares (FGLS), in a fixed effects model. For ease of interpretation the regression analyses were run for the full sample and then separately for brand and unaffiliated (independent) hotels, rather than include interaction terms. The results for the overall sample support the first hypothesis and show that the RevPAR performance for company operated brand hotels and franchisee operated new entrants was $9.02 and $4.73 greater than that of new independent hotels, respectively. These results are both economically and statistically significant. The second regression analysis that examples only branded hotels shows that the RevPAR performance for company operated new entrants was $4.98 greater than that of franchisee operated new entrants. These results imply that not only are there benefits to entering new markets with brand affiliated properties, but that properties that choose the company to manage their new venture fair better than franchisee managed hotels. The difference in the magnitude of the coefficients in the brand only regression model shows that company managed brands perform better than franchise managed brands.2
The second hypothesis that strategic homogeneity or concentration would yield higher new entrant performance was supported. However, when examining branded and independent hotels separately only branded new entrants benefitted from highly concentrated markets. As table 1 shows, the coefficient on strategic homogeneity is 0.79, 0.74 and -0.14, for the full, brand, and independent samples respectively. While past research and the third hypothesis argued that performance for all new entrants would be greater when the new hotel was strategically distant from their competitors, the results of this longitudinal study yielded the opposite result. It is interesting to see that being strategically similar versus distant from the central tendency of hotels in a given market explained higher levels of performance for both brand and independent hotels. These coefficients were statistically significant.
Lower levels of performance were found for new entrants who entered markets in which brands had high levels of saturation, in support of hypothesis 4. The coefficient on brand penetration is significantly negative for each of the three samples. This finding suggests that as the percentage of branded hotels increases in the market the RevPAR performance of all hotels decreases. It is worthy to note that the coefficient on brand penetration is more negative for the sample of independent hotels than it is for the brand hotels.
2 Note that we are not suggesting that the differences in the coefficients are statistically different but rather simply commenting on the economic significance of the differences.
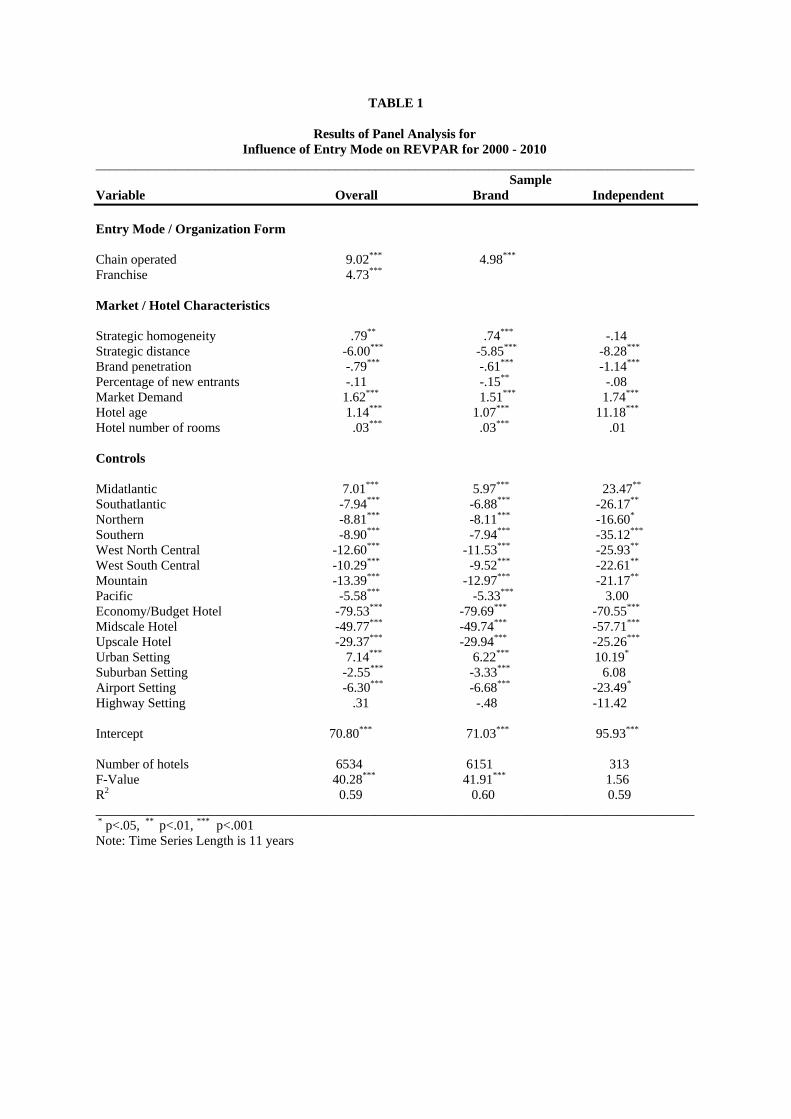
TABLE 1
Results of Panel Analysis for Influence of Entry Mode on REVPAR for 2000 - 2010
__________________________________________________________________________________________
Sample Variable Overall Brand Independent Entry Mode / Organization Form Chain operated 9.02*** 4.98*** Franchise 4.73*** Market / Hotel Characteristics Strategic homogeneity .79** .74*** -.14 Strategic distance -6.00*** -5.85*** -8.28*** Brand penetration -.79*** -.61*** -1.14*** Percentage of new entrants -.11 -.15** -.08
Market Demand 1.62*** 1.51*** 1.74*** Hotel age 1.14*** 1.07*** 11.18*** Hotel number of rooms .03*** .03*** .01 Controls Midatlantic 7.01*** 5.97*** 23.47** Southatlantic -7.94*** -6.88*** -26.17** Northern -8.81*** -8.11*** -16.60* Southern -8.90*** -7.94*** -35.12*** West North Central -12.60*** -11.53*** -25.93** West South Central -10.29*** -9.52*** -22.61** Mountain -13.39*** -12.97*** -21.17** Pacific -5.58*** -5.33*** 3.00 Economy/Budget Hotel -79.53*** -79.69*** -70.55***
Midscale Hotel -49.77*** -49.74*** -57.71***
Upscale Hotel -29.37*** -29.94*** -25.26***
Urban Setting 7.14*** 6.22*** 10.19* Suburban Setting -2.55*** -3.33*** 6.08 Airport Setting -6.30*** -6.68*** -23.49* Highway Setting .31 -.48 -11.42 Intercept 70.80*** 71.03*** 95.93***
Number of hotels 6534 6151 313 F-Value 40.28*** 41.91*** 1.56 R2 0.59 0.60 0.59 __________________________________________________________________________________________
* p<.05, ** p<.01, *** p<.001 Note: Time Series Length is 11 years
Other findings worthy of mention was the significant negative coefficient on the percentage of new entrants but only for the regression model with branded hotels. This finding suggests that when several new branded hotels enter a market that performance for all of these hotels is lower. As expected the log transformation of age is positive and significant. For the independent hotel entrants the coefficient is 11.18 while for the brand sample it is 1.07. This is interpreted as follows: there is a $0.1118 increase in RevPAR for a 1% increase in age for an independent hotel; and a $0.0107 increase for a 1% increase in age of a branded property. This difference may be due to the notion that a chain hotel enters the market with a reputation and access to skills whereas an independent property gains reputation and skills through experience and over time. Similarly as expected market demand has a positive impact on performance. As the demand in a local market increases relative to the supply all properties benefit. The results show that both the brand and independent properties gain similarly. Lastly, size has a small significant impact for branded hotels and an insignificant impact on performance for independents.
CONCLUSIONS
Franchising in the hotel business is a critical form of collaboration. In this study we sought to understand the success of new hotels in a market based on whether they entered with a brand affiliation or as independent operators. One of the contributions of the current study was its longitudinal methodology, in which we examined over 6,000 hotels that entered the United States markets over an eleven year time frame. The results suggest that branded hotels are able to obtain higher performance. By investigating both company-operated and franchise hotels we were further able to understand how different cooperative enterprises work. Given that new ventures that are company operated yielded higher levels of performance than did franchised firms might indicate that these enterprises operate to a clearer set of brand standards, or are more effective in taking advantage of brand knowledge. It would suggest that franchised hotels may wish to enter in markets that also contain company-operated units to reduce risk and enhance their own performance. However, brand saturated markets appear to be unfavorable for all new entrants. Future research should more fully investigate the pattern of operating mode to determine when franchise managed firms should be fast followers of company operated new ventures, and when heavily branded markets become detrimental.
Another critical focus of the current study was the role of market characteristics in shaping the long-term performance of new entrants. It was logical to find that for branded hotels, new ventures that entered markets with high concentrations of strategically similar hotels fared better in the long-run. Their success may be due to the clear identity of a given market, while independent hotels were not successful when they entered markets with these characteristics. New ventures that go it alone may be more successful in markets where they are not overwhelmed with similar hotels. The finding that strategic distance from the typical hotel did not yield positive performance is puzzling given the extensive literature on the value of unique competitive advantage. While it is often argued that a firm is more successful when it is different from others in the marketplace, the nature of the difference may warrant further exploration. It is possible that hotels with the same strategic orientation, say luxury hotels that also create unique value propositions will fare better than hotels that are low-cost operators in a market with a concentration of luxury hotels. Additional exploration on the linkage between concentrated market segments and strategic distance of a given hotel may help operators to understand and refine their value propositions.
REFERENCES
Andersson M., Lööf H. 2011. Agglomeration and productivity: evidence from firm-level data The Annals of Regional Science, Vol. 46, No. 3, 601-620. Baucus, D.A., Baucus, M.S., Human, S.E., 1996. Consensus in franchise organizations: A cooperative arrangement among entrepreneurs, Journal of Business Venturing, Vol.11, Issue 5, 359-378. Canina L., Enz C.A., Harrison J. 2005.Agglomeration Effects and Strategic Orientations: Evidence from the U.S. Lodging Industry ,The Academy of Management Journal, Vol. 48, No. 4, 565-581 Chung, W., Kalnins, A. 2001. Agglomeration effects and performance: A test of the Texas lodging industry. Strategic Management Journal, 22: 969–988. Dyer, J., Singh H. 1998. The Relational View: Cooperative Strategy and Sources of Interorganizational Competitive Advantage, The Academy of Management Review, Vol. 23, No. 4, 660-679 Enz, C.A., Canina L., Walsh K. 2001. Hotel-industry averages: An inaccurate tool for measuring performance, The Cornell Hotel and Restaurant Administration Quarterly, Vol.42, Issue 6, 22-32. Greene, W. H. 2000. Econometric analysis (4th ed.). Upper Saddle River, NJ: Prentice-Hall. Ingram, P. 1996. Organizational form as a solution to the problem of credible commitment: The evolution of naming strategies among U.S. hotel chains. Strategic Management Journal, 17(special issue): 85–98. Ismail, J. A., Dalbor, M. C., & Mills, J. E. 2002. Using RevPar to analyze lodging-segment variability. Cornell Hotel and Restaurant Administration Quarterly, 43(6): 73–80. Jarillo, C. J., 1988. On strategic networks, Strategic Management Journal, Vol. 9 No. 1, 31-41. Kalnins, A., Chung, W. 2004. Resource-seeking agglomeration: A study of market entry in the lodging industry. Strategic Management Journal, 25: 689–699. Kosova R., Lafontaine F. 2010.Survival and Growth in Retail and Service Industries: Evidence from Franchised Chains, The Journal of Industrial Economics, Vol. 58, No. 3, 542-578 Kosová, R., Lafontaine, F., Perrigot, R. forthcoming, Organizational Form and Performance: Evidence from the Hotel Industry. Marshall, A. 1920. Principles of economics (8th ed.). London: Macmillan. Powell, W.W., Koput, K.W. et al. 1996. Interorganizational collaboration and the locus of innovation: networks of learning in biotechnology, Administrative Science Quarterly, Vol. 41 No. 1, 116-45. Ring, P.S., Van de Ven, A.H., 1994. Developmental processes of cooperative interorganizational relationships, Academy of Management Review, Vol. 19 No. 1, 90-118. Sarkar, M.B., Echambadi R., Cavusgil, S., Aulakh, P. 2001. The influence of complementarity, compatibility, and relationship capital on alliance performance. Journal of the Academy of Marketing Science, Vol. 29, Issue: 4, 358 -373 Teece, D.J., Pisano, G., Shuen, A. 1997. Dynamic capabilities and strategic management, Strategic Management Journal, Vol. 18 No. 7, pp. 509-33. Vargo, S.L., Lusch, R.F. 2004. Evolving to a New Dominant Logic for Marketing, Journal of Marketing, Vol. 68, No. 1, 1-17.
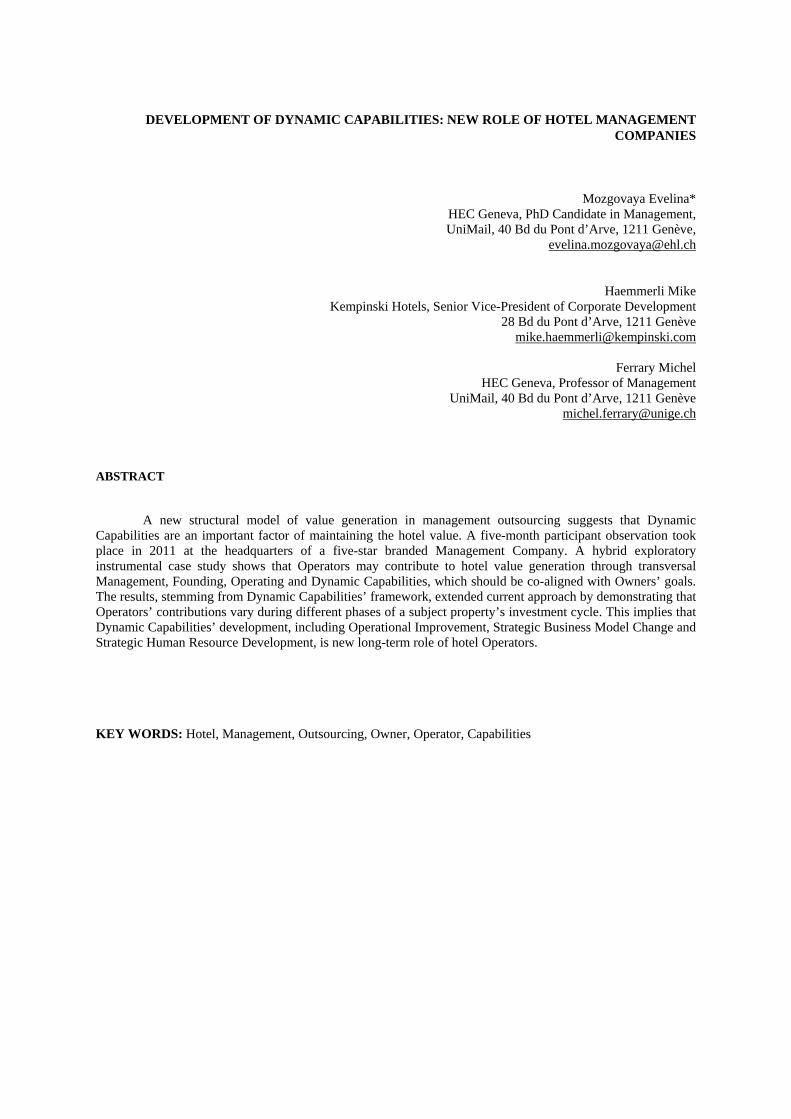
DEVELOPMENT OF DYNAMIC CAPABILITIES: NEW ROLE OF HOTEL MANAGEMENT COMPANIES
Mozgovaya Evelina* HEC Geneva, PhD Candidate in Management, UniMail, 40 Bd du Pont d’Arve, 1211 Genève,
Haemmerli Mike
Kempinski Hotels, Senior Vice-President of Corporate Development 28 Bd du Pont d’Arve, 1211 Genève
Ferrary Michel HEC Geneva, Professor of Management
UniMail, 40 Bd du Pont d’Arve, 1211 Genève [email protected]
ABSTRACT
A new structural model of value generation in management outsourcing suggests that Dynamic Capabilities are an important factor of maintaining the hotel value. A five-month participant observation took place in 2011 at the headquarters of a five-star branded Management Company. A hybrid exploratory instrumental case study shows that Operators may contribute to hotel value generation through transversal Management, Founding, Operating and Dynamic Capabilities, which should be co-aligned with Owners’ goals. The results, stemming from Dynamic Capabilities’ framework, extended current approach by demonstrating that Operators’ contributions vary during different phases of a subject property’s investment cycle. This implies that Dynamic Capabilities’ development, including Operational Improvement, Strategic Business Model Change and Strategic Human Resource Development, is new long-term role of hotel Operators.
KEY WORDS: Hotel, Management, Outsourcing, Owner, Operator, Capabilities
In hotel property investment, management activity plays a fundamental role in the creation of value (Knowles, 1996; Enz, 2010; Olsen, West, & Ching Yick Tse, 2008). First, it is related to sustained generation of net operating income. Second, as some affiliation programs may generate significant part of turnover, they can strongly influence a project’s financial feasibility. Finally, affiliation fees may represent from 1% to 10% of gross revenues (Denton, Raleigh, & Singh, 2009, p. 193) in case the hotel’s management is outsourced. Hotel Owners have a choice among different tactical options, reinforcing the property management and reducing respective risks. The most prevalent forms are self-operation without affiliation, leases, franchises, referral system, and management agreements. They can be deployed individually or in combination, depending on the physical property, Owner’s and Operator’s profiles.
Outsourced management services are provided against a fee in many activity sectors, such as wealth and investment management, off-shore activity, property development, commercial real estate. To meet the demand for expertise in hotel property management, outsourced hotel management has firmly established by early 1990s (Denton, Raleigh, & Singh, 2009). In this case, the property ownership and management are separated. The Owner/Investor provides physical and financial resources, taking an overall passive stance towards management activities, and the operator runs the daily business. Despite region, segment and individual deal specificities, these key principles apply internationally (Goddard & Standish-Wilkinson, 2002; Panvisavas & Taylor, 2006; Bader & Lababedi, 2007; Beals & Denton, 2007). Hotel management outsourcing represents an opportunity for Owners to focus on their core competencies in real estate investment. It also allows operator to focus on fee-based business models, which has radically increased the level of professionalism in hospitality worldwide over the past decades (Denton, Raleigh, & Singh, 2009). Nowadays, only a part of hotel properties is operated by their Owners, and fee-based business represents an increasing share in the activity portfolio of hotel operators (Eyster & DeRoos, 2009). For instance, Annual Reports of Marriott, Starwood and Hyatt show that management agreements represented from 44 to 55% of their room portfolios by 31st December 2011.
According to traditional conceptual approach, the hotel management companies generate hotel property value for an Owner/Investor through operational management (Rushmore, 2002; Denton, Raleigh, & Singh, 2009). Rushmore (2002) points out that it is expressed in supervision, expertise, verifiable past performance, established methods and practices. Several definitions of a management contract showcase this approach. First, a management contract is “an agreement between a hotel management company and a hotel property owner whereby the management company takes on the responsibility of managing the hotel and its facilities” (Rushmore, 2002, p. 361). According to another approach (Wilson, 1999, p. 43), it is “a detailed contract containing the rights and obligations of the hotel owner and the rights and obligations of the operating management company hired to manage the hotel”. It is also defined as “a written agreement between the owner and the operator of a full-service or a select-service hotel by which the owner employs the operator to assume full responsibility for operating and managing the property” (Eyster & DeRoos, 2009, p. 5).
However, the number of indirect investment vehicles and other ownership structures in need of management expertise has been growing since the 1990s. Hotel real estate is integrating with other financial asset classes. Ongoing technological changes and the growing complexity of hospitality business may be challenging the historical place of hotel operators. In this changing context, a general research question is asked: how do management companies contribute to value generation of a firm? The research object of this study is the nature of the operator’s contribution to hotel property investment. The purpose is to refine understanding of the management company’s role in hotel value generation, building a grounded theory of management outsourcing from a single case study. An Owner/Investor’s perspective is selected, because subject hotels are managed on his behalf. As physical property features are important intermediary variables, influencing the management form, the study is carried out on the example of brands focused on 5-star properties. The Management Agreements are among the most widespread contractual relationship forms in the 5-star hotel sector (Schlup, 2003). In this segment, operational expertise, innovative hospitality services and high property standards are crucial factors for providing consistent guest experience and for delivering sustained financial performances for the Owners. It takes a comprehensive hotel management approach to ensure external and internal resource-strategy fit continuously in these conditions. Rarely may the 5-star hotel properties be successfully franchised and managed either by an independent operator or an Owner due to the insufficiency of franchise-like detailed and permanent operating procedures to face this challenge. A specific research question is asked: how do branded Management Companies contribute to five-star hotel value generation from the Owner’s perspective?
CONCEPTUAL CONTEXT Sustaining performance levels over time is a crucial issue in increasingly globalized and turbulent markets. On one hand, from a static perspective, Resource-Based View of a Firm is a theoretical framework, viewing a firm as a bundle of resources and competencies that can be at the origin of competitive advantage, if they are valuable, rare, inimitable and non-substitutable (Barney, Wright, & Ketchen, 2001). On another hand, the growing speed of economic evolution creates a new management task: enhancing strategic qualities of a firm that sustain performance in dynamic perspective.
How do firms generate value over time? Currently emerging literature on strategic management suggests Dynamic Capabilities as answer to this challenge, extending the resource-based view (Helfat & Peteraf, 2003; Wang & Ahmed, 2007). They refer to the “ability to achieve new forms of competitive advantage” (Teece, Pisano, & Shuen, 1997, p. 515) and they are defined as “the firm's ability to integrate, build, and reconfigure internal and external competences to address rapidly changing environments, … thus reflect an organization's ability to achieve new and innovative forms of competitive advantage given path dependencies and market positions ” (Teece, Pisano, & Shuen, 1997, p. 516). Within this suggested framework, “competencies that define a firm's fundamental business as core” are referred to as core competencies. Then, «organizational routines/competences” describe the activities allowing the integration of firm-specific assets and resources across products and external partnerships (Teece, Pisano, & Shuen, 1997, p. 516).
According to the Resource-Based and Dynamic Capabilities framework, outsourcing can become a way for a firm to complete scarce resources under its ownership by the ones under external control (Wang & Ahmed, 2007; Barney, Wright, & Ketchen, 2001). The resource-based approach allows highlighting how outsourcing of such activities as IT, property maintenance, distribution or branding, may contribute to value (Barthélemy & Quélin, 2006). However, this approach ignores the management outsourcing, despite at least three reasons for its consideration. Firstly, according to the Dynamic Resource-Based View, the firm’s strategic competencies are bound to the lifecycle of its capabilities and resources, which affects overall market positions, and the management plays a key role in their evolution (Helfat & Peteraf, 2003; Teece, Pisano, & Shuen, 1997). In terms of process, it involves several functions (Figure 1). They all have to be fulfilled within any organization, but their features vary across business sectors and development stages. Each of overall functions represents a definite type of management work (Drucker, 1986, p. 80), embodied in organizational design. Division of managerial work, specialization and isolation of specific management work, as well as cooperation and combination of various management work types influence the volume and complexity growth of management activity (Drucker, 1986, p. 278). Therefore, managerial activity is strategic to sustained value generation from the dynamic capabilities perspective. Secondly, recent management research shows that workforce differentiation is key success factor of strategy implementation (Huselid & Becker, 2011; Becker & Huselid, 2006; Morris, Snell, & Lepak, 2005). Thus, workforce differentiation can be applied to managers, as they represent strategic human capital. Finally, the management outsourcing in hotel industry can showcase how sector-specific management companies can generate value for a firm’s owners. Figure 1 – Generic Management Functions Management Functions Description
1.a – Objectives : Setting Objectives Definition of the objectives in terms of future state of a business
1.b – Objectives : Strategy Development Definition of what has to be done to ways to reach the objectives
2.a – Organizing : Work Planification Definition of tasks, activities and jobs assigned to staff members
2.b – Organizing - Work Design Definition of staff work functions; staff selection for doing a job
3.a – Motivation and Communication : Motivation
Specifically directed influence on an employee oriented at effective and efficient work to reach the objectives set
3.b – Motivation and Communication : Coordination
Effort consolidation among staff members, including objective and expected result communication
4.a – Measurement : Work Appraisal Performance assessment and analysis, including benchmark setting, appraisals and performance interpretation
4.a – Measurement : Work Control Matching results against objectives and benchmarks
5.a – Feedback and Development Update and correction of business objectives, , including result communication, managers and staff development
Source: adapted from Drucker (1986), p. 275
METHODOLOGY
This paper uses a single case study to understand how outsourced management contributes to value generation in the context of hotel sector. Overall qualitative methodology based on hybrid exploration uses an instrumental case study as research design, consistent with hotel management research (Brotherton, 1999, p. 115). It allows working with broad categories, contextualizing observations and drawing upon multiple data sources (Yin, 2003). The case selection was based on judgmental sampling, focused on “membership” of a specific group (Brotherton, 1999, p. 120). Data collection involved participant and secondary documentary data observation, which gave an opportunity for triangulation, reinforcing internal validity of the study. Participant observation took place from 06.2011 to 11.2011 in the Corporate Development Department in the Headquarters of Kempinski Hotels AG, international branded 5-star hotel Management Company. Current management contracts, departmental presentations, and corporate development documents were observed in order to collect the data. The researcher shared experience described by corporate-level managers or observed it in a specific practical situation, such as: management contract negotiation; elaboration of a corporate presentation for hotel owners and investors; before-and-after takeover analysis of an independent hotel property located in a European gateway city. The data was completed by industry-specific literature, such as management contract studies, providing generalized evidence from the practice (Denton, Raleigh, & Singh, 2009; Rushmore, 2002; Schlup, 2003; Wilson, 1999; Eyster & DeRoos, 2009). Corporate development materials of selected international branded 5* hotel management companies, were studied to reach data saturation (Fairmont, Four Seasons, Orient Express, Raffles, K, Hyatt, IHG, Starwood, Marriott, Penninsula, Shangri-La, Jumeriah, Aman).
In order to deepen the understanding of the management company’s roles in hotel value generation and build a grounded theory of management outsourcing, theoretical premises and collected data were brought together. Data analysis started from the first data collection. It was performed through going back and forth from the empirical observations to initial theoretical knowledge, using the flexible framework of an instrumental case study design. The material was examined, organized and interpreted. Throughout simultaneous data collection and analysis, the researcher actively interacted with the Senior Vice-President of Corporate Development and other senior executives that could orient the research questions, guide data collection and participate in interpretation, which is consistent with nature of the study object. Triangulation approach in data collection (participant and documentary observation), extensive activity period in the research field, repeat interviews with managers to verify the common understanding of terms and emergent themes are validation strategies deployed.
Themes and categories emerged progressively. According to the direct field observations and secondary data the unit of analysis is a departmental task, found to be the base of specific activities. It was determined during early stages of research process in order to retain flexibility of the case-based research design and fully benefit from contextualization. Departmental tasks were analytically grouped into activities. Then, activities were grouped into competencies of management companies. Though the tasks and activities would differ depending on a strategic positioning of an operator and would vary depending on provisions of a specific contract, several stable categories have emerged. The findings include an overview of Management Company’s capabilities (I) and their co-alignment pattern with Owner’s goals (II).
CASE STUDY RESULTS I: CAPABILITIES OF HOTEL MANAGEMENT COMPANIES Capability classification principle is necessary to understand the ways in which hotel companies
generate value in current market conditions. After multiple classification trials (department, function, activity, region, task object, manager, content, structure, process), an approach based on hotel investment horizon is selected. It is the most appropriate to understand the role hotel management companies play in value generation, given the nature of hotel property investment. It can be a common denominator for three hotel management outsourcing parties (subject hotel property, Owner, Management Company), as it outlines a more or less restrictive time frame for hotel asset management actions.
As a result, this study identifies four major groups of hotel investment horizon-based capabilities that a Management Company may provide: Founding, Operating, Dynamic, as well as transversal Management Capabilities. Each of these groups may foster respective capability development at a subject property and helps an Operator reaching a specific set of objectives. According to our findings, there is a subset of specific competencies, the quality and consistency of which determines respective capability strength. In turn, competencies are formed from activities, frequently cross-functional ones. Finally, an activity can be decomposed in numerous variants of tasks, depending on such factors, as allocated resources or organizational design. Sequencing of tasks into the workflow or routines is out of this article’s scope.
Founding Capabilities: Portfolio Development In terms of hotel property investment horizon, Portfolio Development Capabilities contribute to the
hotel value creation. They apply to new properties or business units entering the portfolio. Founding capabilities are based on such competencies as business model design, technical services, pre-opening and short-term property takeover, including such competencies as budgeting and planning of advertising, promotion and marketing. Legally, they may be reflected in Technical Services, Pre-Opening Agreements within a management contract or included as specific provisions in Management Agreements. Respective competencies are strategic for independent and brand operators alike. However, depending on a subject property’s profile, some of these competencies will have varying relevance. For instance, a short-term property takeover competency is more valuable for Owners-in-Foreclosure, while an advisor’s role in hotel development requires competencies in business model design and it is more valuable in long-term projects. Often taking the form of advice to Owners, these competencies are required from the start of a hotel project up to one year of operations, depending on a project (a new build, a takeover of an existing property, a conversion…) and on the development process. From the structural perspective, founding capabilities are primarily driven by such functional activities as Corporate Development, Technical Services, and Pre-Opening.
Operating Capabilities: Core and Distinctive In terms of hotel property investment horizon, Operating Capabilities add to the value of the hotel
business. From structural perspective, operating capabilities are driven such functional activities as Housekeeping, Food and Beverage, Sales and Marketing and other operational areas. Legally, they are reflected in the Management Agreement only or within a global document set of a management contract.
Core Operating Capability adds to the hotel’s value through operational efficiency. It is composed of a
standard set of core operating competencies expected from a management company in a given market, ensuring basic operational efficiency (such as implementation of operational systems, procedures and controls, employee selection, management supervision). These competencies foster the operational capability of a property, so that Management Companies can ensure effective and efficient operations continuously and at any moment. They are vital during the stabilization period before the property reaches its full commercial potential under management of a given company. Depending on target market and on property’s profile, this period may last from one to five years, taking into account possible renovations and commercial turnaround periods.
Distinctive Operating Capability also add the hotel value, but mostly contribute to a hotel’s competitive advantage through such competencies as Trademark, Brand Affiliation, Centralized reservations, Loyalty Programs, Centralized personnel and recruiting, Centralized accounting and purchasing with group discounts, National and regional sales offices, and so forth. They represent key additional competencies above the market’s standard level. These competencies allow differentiating the offer, depending on strategic positioning on specific markets. These competencies sustain the fee base of a management company throughout the market variations and over longer periods of time, from five to ten years. They may have much earlier impact during takeovers.
Dynamic Capabilities According to our study findings, we define dynamic capabilities as evolutionary qualities of a firm,
focused on sustaining its competitive advantage across markets, services and over time. Thus, Dynamic Capabilities maintain the hotel value over time, across markets and product variations. Difficult to show legally, respective Dynamic Competencies are Operational Improvement, Strategic Business Model Development, and Strategic Human Resource Development. Existing assets, resources, competencies, operational routines currently under control of a Management Company are their objects. Strategic Human Resource Development is the basis for operational improvement and strategic business model change competencies, and thus represents the key dynamic management competency. These competencies integrated with management activity functions represent dynamic management activity and provide sustained character to business and resource-strategy fit.
From a structural perspective, dynamic capabilities are primarily driven by Strategic Human Resource Development. It is a key dynamic management competency, focused on managers and performed by the Management Company. It contributes to overall Dynamic Capabilities of a subject firm, as it facilitates Operational improvement and Strategic Business Model Development in turn. Operational Improvement is focused on the optimization of a firm’s operational effectiveness which means reaching business objectives with resources and competencies available in the best way. Strategic Business Model Change Competencies modify
the objectives, respective resources and a firm’s competencies, so that the expected result could be reached with adequate means. They include functional due diligence, business auditing, Asset Management advice, change management, and so forth.
Management Companies can develop Dynamic Capabilities by drawing upon their organizational knowledge management systems, timely support and renewal for executive and operational teams. Traditionally, operators establish regional or country offices in addition to the Headquarters to provide centralized corporate services. The Management Companies have access to a large pool of managers due to their large scale of operations. Thus, they ensure management quality consistency through ongoing recruitment, training and promotion of executives, participation in task force across properties under management, sharing organizational knowledge, managerial work methods and corporate culture. Local lower-position management and employees also become a specialized workforce and talent pool potentially retainable and available to subject properties under management, despite hotel-specific problems of high turnover related to unqualified jobs. In addition, the branded Management Companies may use their pool of managers across all the properties under contract to support other hotels in terms of specific expertise, problem-solving and complex task supervision. Finally, IT-empowered knowledge management and sharing systems, regular executives meeting across properties and joint operational improvement initiatives mutually reinforce the management system’s strength.
CASE STUDY RESULTS II: CAPABILITY AND GOAL CO-ALIGNEMENT WITH OWNERS Transversal Management Capabilities
Transversal Management Capabilities of operators focus on the co-alignment of the Owner’s and Management Company’s objectives. They ensure internal and external consistency of actions and results across hotel investment cycles. Underlying competencies are aimed at performing such respective management functions as Setting Objectives, Strategy Development, Work Planning, Work Design, Motivation, Coordination, Work Appraisal, Work Control, and Feedback, as suggested in current literature (Drucker, 1986). A full set of operational management functions is ensured by the Management Company. However, the Owner is included in Objective Setting, Strategy Development and Planning management functions thought budget approvals and in Control function through financial performance reviews, which facilitates the interest alignment during the management contract negotiation and administration.
The Management Outsourcing through a Management Contract is characterized by a complex organizational form, involving the Owner, the Management Company’s Headquarters and on-site General Management team appointed by the Management Company. Appointment of the General Manager and Executive Team representing an integrated management system provided by the Management Company is its primary expression. The General Manager performs key management functions on-site and guarantees that the key inter-organizational processes of decision-making, communication, supervision and conflict-solving are mutually coherent and consistent with overall resource-strategy fit. The Executive Team also appointed with direct involvement of the Management Company reinforces this effect and increases the potential of value generation through the management outsourcing. They play a strategic role in the value generation during hotel management outsourcing through continuous integration of the strategic and operational perspective on the value creation, thus ensuring strategy-resource contingency fit.
An integrated management system is a crucial factor for a long-term success of 5-star hotel properties. The volume, complexity and specialization of managerial work reach very high levels at these properties due to the necessity to manage multi-outlet properties to the highest level of quality, expected by the target customers of this category of hotels. For instance, planning must be coordinated with the Owner and Investors. Operations have to be coordinated across outlets and with external suppliers. Tasks effectively carried out by employees from various departments have to be synchronized in order deliver a brand promise.
Capabilities and Goals of Management Companies According to the current approach, Management Companies may have three basic strategic objectives
(Eyster & DeRoos, 2009), while branded and independent operators reach these objectives differently: to perceive management fees, to enhance the market share and build a sustained base for fees perception and to maintain the market penetration levels.
Second-tier, independent management companies, such as Crescent Hotels & Resorts, Hostmark Hospitality Group and Xotels Group, are specialized in property management only, focused on governance activity, financial, sales and marketing management. They manage from 4 to 8 hotels at least without providing a brand or distribution system. It is considered that their distinctive feature is flexibility in contractual term negotiation and niche focus. Independent operators may position themselves strategically as managers for a specific brand, for a specific region or for a specific property type. They are frequently founded by starting entrepreneurs or senior executives leaving the brand operators (Eyster & DeRoos, 2009). Any management company may find itself in a position of a temporary care-taker of a hotel, if the property is in ownership transition. However, some independent operators may specialize on these situations or some branded company may make this move as a favor to an Owner of some of their properties (Eyster & DeRoos, 2009).
Brand operators, such as Kempinski, Fairmont, Four Seasons, Orient Express, Raffles, K, Hyatt, IHG, Starwood, Marriott, Penninsula, Shangri-La, Jumeriah or Aman, are first-tier management companies proposing comprehensive property management competencies, a brand and global distribution systems, accompanied by other centralized services. Sometimes, their contracts are referred to as “manchises” or franchise-and-management agreements (Denton, Raleigh, & Singh, 2009, p. 174). They manage 50 and more properties to reach scale effects (Eyster & DeRoos, 2009). As easy hotel attributes identification is important to customers, a branded management company may choose a single brand or multi-branding (Olsen, West, & Ching Yick Tse, 2008) in addition to other factors of its strategic positioning. Generally, the brand hotel operators enhance their company’s value by generating the highest fee levels for their services and by strengthening their reputation.
Capabilities of management companies depend on several factors, such as hotel management expertise of corporate/regional staff and their coordination; coordination among the development, technical and pre-opening assistance; span of control (number of properties each staff supervises); geographical distance between the support staff and subject hotel; chief executives’ profile; management information system (Eyster & DeRoos, 2009). In practical conditions of scarce resources, a management company will not develop an entire set of possible capabilities set without a reason. It should choose strategic proprieties and time them to market. From previous results, we can conclude that different types of capabilities require different timeframes to unfold and to impact the value generation at a property level taken over by a management company. Thus, we suggest that Management Companies may have four basic strategic objectives, according to the hotel investment horizon, which modifies and expands current approach (Eyster & DeRoos, 2009):
1. Start perceiving management fees in very short term (up to one year of operation), 2. Enhance the market share in short to mid-term (from one up to five years of operation), 3. Build a sustained base for fees perception (from five up to ten years of operation) 4. And, finally, maintain the market penetration levels (from ten to twenty years of operation and more).
Capability and Goal Co-Alignment between Hotel Owners and Management Companies
Nowadays, hotel property investment can be direct or indirect, and take quoted or non-quoted form (Hoesli & MacGregor, 2000). An Owner is defined as “the legal entity that hold title to the real property known as the hotel or, more generally, it is the firm/entity/person that makes decisions about the real property” (Eyster & DeRoos, 2009). Typical hotel owners and investors are mostly diversified investors, property real estate investment trusts, private equity funds, sovereign funds, high net-worth individuals and hotel operators. Fundamentally, investment horizon, scale, financial structure, ways of achieving the objectives and property portfolio management skills impact the goals of hotel investment management.
Eyster and DeRoos (2009) identify two Owners’ profiles in order to match them with long-term goals of hotel operators: Cash Flow Maximizer, aiming “to keep the property as long-term investment for future cash flow and to harvest equity via partial sale or refinancing” and Appreciation Maximizer aiming to “maximize the value and sell the property as quickly as possible”, through resale, in some cases accompanied by selective capital expenditures. However, the owners became more sophisticated, scale of deals grew from a single property to an international portfolio level. Ongoing technological evolution, globalized competition for capital and integration of real estate with other investment classes are putting pressure on hotel asset performance, as hotel property is integrating with investment assets. Hotel asset management companies providing advice to owners and investors have emerged. The structure of the ownership has evolved with establishment of vehicles focused on indirect investment and financial holding. Consequently, sustained revenue levels are more frequently required and need for strategic flexibility has emerged for owners and operators both.
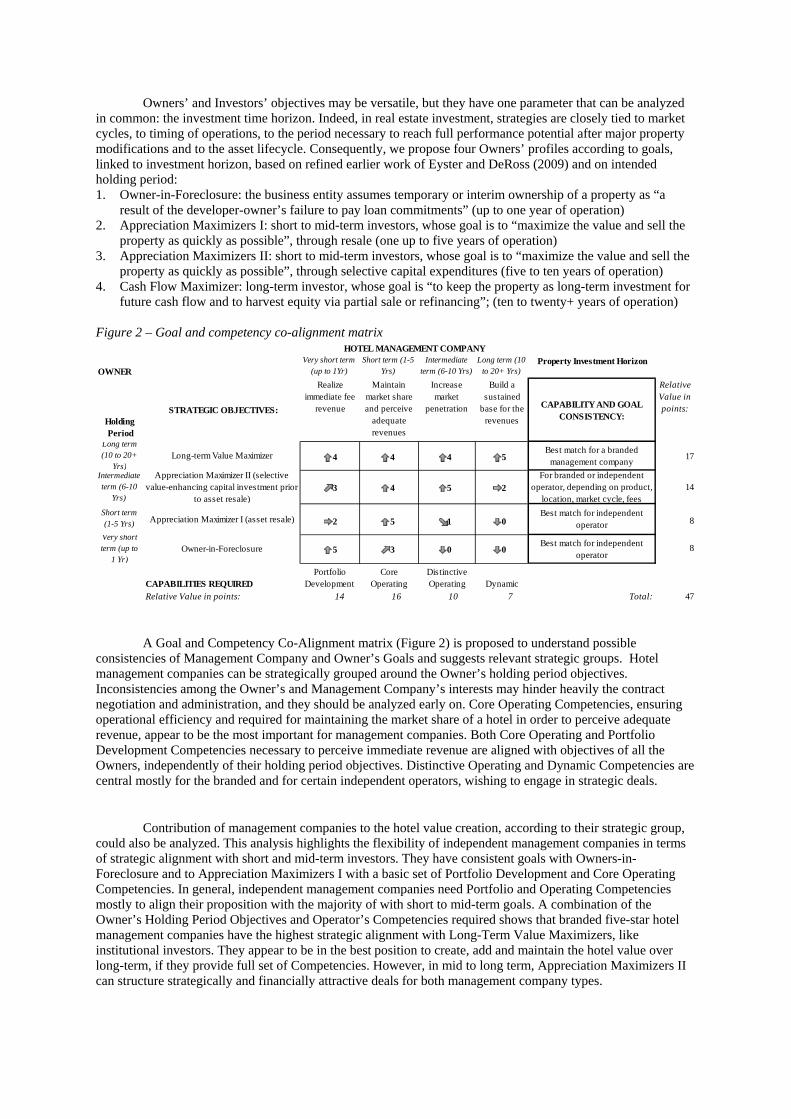
Owners’ and Investors’ objectives may be versatile, but they have one parameter that can be analyzed in common: the investment time horizon. Indeed, in real estate investment, strategies are closely tied to market cycles, to timing of operations, to the period necessary to reach full performance potential after major property modifications and to the asset lifecycle. Consequently, we propose four Owners’ profiles according to goals, linked to investment horizon, based on refined earlier work of Eyster and DeRoss (2009) and on intended holding period: 1. Owner-in-Foreclosure: the business entity assumes temporary or interim ownership of a property as “a
result of the developer-owner’s failure to pay loan commitments” (up to one year of operation) 2. Appreciation Maximizers I: short to mid-term investors, whose goal is to “maximize the value and sell the
property as quickly as possible”, through resale (one up to five years of operation) 3. Appreciation Maximizers II: short to mid-term investors, whose goal is to “maximize the value and sell the
property as quickly as possible”, through selective capital expenditures (five to ten years of operation) 4. Cash Flow Maximizer: long-term investor, whose goal is “to keep the property as long-term investment for
future cash flow and to harvest equity via partial sale or refinancing”; (ten to twenty+ years of operation) Figure 2 – Goal and competency co-alignment matrix
A Goal and Competency Co-Alignment matrix (Figure 2) is proposed to understand possible consistencies of Management Company and Owner’s Goals and suggests relevant strategic groups. Hotel management companies can be strategically grouped around the Owner’s holding period objectives. Inconsistencies among the Owner’s and Management Company’s interests may hinder heavily the contract negotiation and administration, and they should be analyzed early on. Core Operating Competencies, ensuring operational efficiency and required for maintaining the market share of a hotel in order to perceive adequate revenue, appear to be the most important for management companies. Both Core Operating and Portfolio Development Competencies necessary to perceive immediate revenue are aligned with objectives of all the Owners, independently of their holding period objectives. Distinctive Operating and Dynamic Competencies are central mostly for the branded and for certain independent operators, wishing to engage in strategic deals.
Contribution of management companies to the hotel value creation, according to their strategic group, could also be analyzed. This analysis highlights the flexibility of independent management companies in terms of strategic alignment with short and mid-term investors. They have consistent goals with Owners-in-Foreclosure and to Appreciation Maximizers I with a basic set of Portfolio Development and Core Operating Competencies. In general, independent management companies need Portfolio and Operating Competencies mostly to align their proposition with the majority of with short to mid-term goals. A combination of the Owner’s Holding Period Objectives and Operator’s Competencies required shows that branded five-star hotel management companies have the highest strategic alignment with Long-Term Value Maximizers, like institutional investors. They appear to be in the best position to create, add and maintain the hotel value over long-term, if they provide full set of Competencies. However, in mid to long term, Appreciation Maximizers II can structure strategically and financially attractive deals for both management company types.
OWNERProperty Investment Horizon
Holding Period
STRATEGIC OBJECTIVES:CAPABILITY AND GOAL
CONSISTENCY:
Relative Value in points:
4 4 4 5 17
3 4 5 2 14
2 5 1 0 8
5 3 0 0 8
CAPABILITIES REQUIREDRelative Value in points: 14 16 10 7 Total: 47
Portfolio Development
Core Operating
Distinctive Operating Dynamic
Short term (1-5 Yrs) Appreciation Maximizer I (asset resale)
Best match for independent operator
Very short term (up to
1 Yr)Owner-in-Foreclosure
Best match for independent operator
Long term (10 to 20+
Yrs)Long-term Value Maximizer
Best match for a branded management company
Intermediate term (6-10
Yrs)
Appreciation Maximizer II (selective value-enhancing capital investment prior
to asset resale)
For branded or independent operator, depending on product,
location, market cycle, fees
Realize immediate fee
revenue
Maintain market share and perceive
adequate revenues
Increase market
penetration
Build a sustained
base for the revenues
HOTEL MANAGEMENT COMPANYVery short term
(up to 1Yr)Short term (1-5
Yrs)Intermediate
term (6-10 Yrs)Long term (10
to 20+ Yrs)
DISCUSSION This study shows that management activity of a firm can be successfully outsourced, when an operator
provides management services to a firm’s owner against a fee at a firm’s premises. In hotel management outsourcing, the value is generated through the operator’s contribution of an integrated management system, as well as Founding, Operating and Dynamic Capabilities, based on respective underlying groups of competencies. Founding Capabilities ensure hotel development before the Operating Capabilities unfold. Then, a firm’s competencies and overarching capabilities need to progress over time, across markets and products, to sustain value generation, which is the focus of Dynamic Capabilities. We highlight transversal Management Capabilities that are particularly important for ensuring internal and external resource-strategy fit with the Owner. In case of management outsourcing, the General Manager and the Executive Team are physical expressions of the integrated management system provided by the Management Company. Management Outsourcing generates convergence of the Owner’s and Operator’s competencies and resources over time, expressed in decision-making and other underlying management competencies. Specific underlying competencies and stakeholders’ contributions are determined by a management contract and take organizational form during contract administration.
The study has common points and differences with previous findings on the contribution of management companies to value generation. The results converge with the idea the management is strategic activity (Enz, 2010; Eyster & DeRoos, 2009) and that supervision, expertise, verifiable past performance, established methods and practices (Rushmore, 2002) qualify Operating and Management Capabilities of an operator. Understanding of underlying core/distinctive operating competencies is also convergent with previous studies. The difference is in separation between activities with impact on operations in short-to-mid-term from those that have an influence in mid-to-long-term. However, there are three findings in this work that differ from previous studies. Firstly, this article brings forward Founding Capabilities that influence heavily further operational results of a subject property, though they were historically provided by the Owner. Secondly, this work puts forward transversal Management Capabilities that are strategic in case of management outsourcing and specifically in five-star hotel sector. Finally, this work highlights a new role of operators: development of Dynamic Capabilities, sustaining competitive advantages of subject properties through Operational Improvement, Strategic Business Model Change and Strategic Human Resource Development.
Presence and strength of a specific capability can be an indicator of possible alignment of a Management Company and Owner’s interests within a management contract. Depending on a hotel property profile, certain underlying competencies will be more strategic than others, and they will reinforce the relative capability. We suggest that a Management Company is able to generate greater value than an individual Manager, hired by an Owner at a five-star property with intended long-term holding period by providing: 1. Integrated hotel management system, represented by the General Manager and Executive Team on site and
explicitly involving the Owner in strategic processes; 2. Professional advice on hotel and mixed-use property development, business model, design, and other
Founding Competencies, which often is a determining factor for further performance levels; 3. Daily property management by an organization, specialized in the field and capable of providing immediate
operational support and eventually a brand; 4. Dynamic Capabilities’ development, driven by the facilitated access by a Management Company to their
source factors (including corporate revenue management systems; property audits; vast direct sources of market information; large network of suppliers; contact with guests from various segments across hotel property portfolio; organizational knowledge management; shared corporate culture, and most importantly, a pool of Strategic Human Resources and their Development programs).
These results have both theoretical and practical implications. From an broader theoretical perspective, this work proposes a first sketch of a grounded theory on management outsourcing, which should be validated, extended and refined through multiple case studies and be a subject of another in-depth discussion. From practical perspective, there are four implications. Firstly, the contribution of a hotel Management Company to value generation can be systematically defined by its four groups of capabilities and underlying competencies. Secondly, operators focused on Owners with considerable property-specific objectives should develop Dynamic Capabilities, as they will allow maintaining the hotel value in long term. Thirdly, as Management and Dynamic Capabilities impact heavily the value generation of a subject hotel property over time, the findings call for these capabilities’ assessment during the management contract negotiation and hotel valuation. Finally, this study shows that reaching a strategic alignment between Management Companies and Owners is not always feasible due to inconsistencies of their objectives and capabilities, which implies that not every deal is worth chasing.
CONCLUSION The results of this study suggest that the Management Company’s capabilities may have strong effects
on the value generation potential at a subject hotel property, which can make the management outsourcing economically more attractive than opting for individual managers. The findings suggest four key categories of capabilities based on property investment cycle, through which hotel Management Companies generate value at subject properties on the Owners’ behalf under management contract. The Operator, Owner and General Manager with the Executive Team contribute to transversal Management Competencies that ensure continuous internal and external resource-strategy fit. Founding Capabilities create value, focusing on deals and assets entering the portfolio. Operating Capabilities add value, qualifying the potential in terms of daily business. Dynamic Capabilities maintain value: they are evolutionary qualities, focused on sustaining the competitive advantage across markets, services and over time. Individual managers do not have full access to sources of these capabilities. These results imply that property investment cycle-based capabilities may enrich understanding of strategic goal co-alignment between Owners and Operators in management outsourcing and that the assessment of Dynamic Capabilities may enhance the quality of subject hotel property valuation.
Bibliography
Bader, E., & Lababedi, A. (2007). Hotel Management Contracts in Europe. Journal of Retail and Leisure Property, 6, 171 – 179.
Barney, J., Wright, M., & Ketchen, D. J. (2001). The resource-based view of the firm: Ten years after 1991. Journal of Management, 625–641.
Barthélemy, J., & Quélin, B. (2006). Complexity of Outsourcing Contracts and Ex Post Transaction Costs: An Empirical Investigation. Journal of Management Studies, 43:8, 0022-2380.
Beals, P., & Denton, G. (2007). The current balance of power in North American hotel management contracts. Journal of Retail & Leisure Property, Vol .4, No.2, pp.129–145.
Becker, B. E., & Huselid, M. A. (2006). Strategic Human Resources Management: Where Do We Go From Here. Journal of Management, 32: 898.
Brotherton, B. (1999). Contemporary Hospitality Management Research. West Sussex: John Wiley & Sons Ltd. Denton, G., Raleigh, L. E., & Singh, A. J. (2009). Hotel Asset Management: Principles and Practices. Lansing:
American Hotel & Lodging Educational Institute. Drucker, P. (1986). Management: Tasks, Responsibilities, Practices. New York: Truman Talley Books. Enz, C. (2010). Hospitality Strategic Management: Concepts and Cases. New Jersey: Wiley. Eyster, J., & DeRoos, J. A. (2009). The Negociation and Administration of Hotel Management Contracts. New
York: Pearson. Goddard, P., & Standish-Wilkinson, G. (2002). Hotel management contract trends in the Middle East. Journal
of Leisure and Property, Vol. 2, No. 1, p. 66–80. Helfat, C., & Peteraf, M. (2003). THE DYNAMIC RESOURCE-BASED VIEW: Capability Lifecycles.
Strategic Management Journal, 24: 997–1010. Hoesli, M., & MacGregor, B. (2000). Property Investment: Principles and practice of portfolio management.
Essex: Pearson Educational Limited. Huselid, M. A., & Becker, B. E. (2011). Bridging Micro and Macro Domains: Workforce Differentiation and
Strategic Human Resource Management. Journal of Management, 421-428. Knowles, T. (1996). Corporate Strategy for Hospitality. Essex: Longman. Morris, S., Snell, S., & Lepak, D. (2005). An Architectural Approach to Managing Knowledge Stocks and
Flows: Implications for Reinventing the HR Function. CAHRS Working Paper Series, p. 1-39. Olsen, M. D., West, J. J., & Ching Yick Tse, E. (2008). Strategic Management in the hospitality industry. Upper
Saddle River: Pearson. Panvisavas, V., & Taylor, J. (2006). The use of management contracts by international hotel firms in Thailand.
International Journal of Contemporary Hospitality , 231–245. Rushmore, S. (2002). Hotel Investment Handbook. New York: HVS. Schlup, R. (2003). Hotel management agreements: Balancing the interests of owners and operators. Journal of
Retail & Leisure Property, 331–342. Teece, D. J., Pisano, G., & Shuen, A. (1997). Dynamic Capabilities and Strategic Management. Strategic
Management Journal, 509-533. Wang, C. L., & Ahmed, P. K. (2007). Dynamic capabilities: a review and research. The International Journal of
Management Reviews, 9(1): 31-51. Wilson, R. (1999). Hotel Management Contracts: Breach, Termination and Damages. Journal of Hospitality
Financial Management, Vol. 7: Iss. 1, Article 5. Yin, R. (2003). Case Study Research: Design and Methods. New York: Sage Publications Inc.
1
The Hotel as the Holiday / Stay Destination: Trends and Innovations:
Dr. Detta M. Melia
Ms. Gereva Hackett
School of Hospitality Management and Tourism College of Arts and Tourism
Dublin Institute of Technology Cathal Brugha Street
Dublin 1. Ireland
Abstract
This paper analyses trends in the international hotel industry and provides insights into the trends that are most likely to influence future business success. Trends, such as, design, social and lifestyle changes, the eco-hotel, the historically significant hotel, the sports hotel, the health spa, the quirky hotel, the boutique hotel and the fashionable hotel which are differentiating the traditional hotel product are discussed. This paper is based on primary and secondary research providing a comprehensive snapshot of trends in the sector. Primary research was carried out through an in-depth study and NET-Ography analysis of hotels worldwide. These hotels are now focusing on differentiating themselves to such an extent that the hotel is the tourist attraction and is an integral part of the stay. Indeed, it has been suggested that a hotel that has achieved individuality would almost certainly be difficult to replicate. This paper provides insights into the implications of these trends for operators and educators of hotel businesses nationally and internationally and considers the need for the provision of a unique means of diversification from the traditional hotel product of food and accommodation to a consideration of adding value by providing facilities and products making it the focus of the holiday / stay destination.
Key Words: Trends, Tourism, Hotel Industry, Individuality, Differentiation, Lifestyle, Key Success Factors
© Dr. Detta M. Melia and Ms Gereva Hackett
2
The Hotel as the Holiday / Stay Destination: Trends and Innovations:
Introduction
One of the major attractions of travel has always been the exposure to the various components that makes up the accommodation and provides the entertainment. Food, beverage, accommodation, leisure centres, spas and architecture are all elements of what is broadly called the ‘hotel’. The hotel industry has become increasingly over supplied with large monopolies of hotel brands which sell consistency across their properties and which are considered to be the traditional provision of a hotel. This paper examines hotel development in all its guises evaluating trends and innovations. Hotel development has changed over the last number of years and includes such concepts back-to-nature hotels and life-style hotels: the new hotel trend.
The hotel industry is subject to numerous trends and these trends have an impact on business success or decline. A trend is defined as ‘a line of general direction of movement, a prevailing tendency of inclination, a style or preference, a line of development, or the general movement over time of statistically detectable change’ (Google Thesaurus, 2011). Whereas, a fad is considered to be a temporary popular notion, artistic activity, fashion or food that is usually followed by a large group of people for a short time (Google Thesaurus, 2011).
This paper analyses trends in the international hotel industry and provides insights into the trends that are most likely to influence future business success. Trends, such as, design, social and lifestyle changes, the eco-hotel, the historically significant hotel, the sports hotel, the health spa, the quirky hotel, the boutique hotel and the fashionable hotel which are differentiating the traditional hotel product are discussed. This paper is based on primary and secondary research providing a comprehensive snapshot of trends in the sector. Primary research was carried out through an in-depth study and content analysis of a number of hotel concepts worldwide. Literature Review According to Robinot and Gainnelloni (2010) the tourism industry has considerable economic weight and should grow steadily as forecasts predict at least 1.6 billion arrivals for 2020 (UNWTO, 2007). However, Dumas, et al., (2002) and Robinot and Gainnelloni (2010) suggest that the future of the hotel industry will be shaped by a number of forces, including the ability to attract investment to meet growing capital needs, the use of state of the art information technologies, mainly the internet as a distribution channel and marketing based on the accurate identification and analysis of customers needs and expectations through the use of adapted Customer Relationship Management (CRM) techniques. Hotel success has been contributed to a number of key factors such as the quality of the infrastructure and products of the hotel, the location of the property, the staff that provide the services in the hotel and the high rate of customer care and satisfaction that the establishment provides (Melia, 2010). However, there has been a shift to a greater interest in fine art, culture, eco tourism and the transient nature of the modern traveller as customers are beginning to shift their perceptions on what they expect because they want an experience and not just a bed for the night. (Freund de Klumbis, 2005; Van Hartesvelt, 2006; Lim and Endean, 2009). Indeed, Freund de Klumbis (2005) suggests that the modern hotel not only offers a place to sleep, but also provides an escapist experience through its design, sense of spectacle and amenities. Hotel guests expect more than comfort and convenience and increasingly want to be surprised (positively) and seek properties that are noticeably different in look and feel (Anhar, 2011). Traditionally, the boutique hotel was considered the hotel that provided that differentiation with the Chambers Dictionary (2003) defining a boutique hotel as a small hotel with intimate and individualistic atmosphere and style. Aggett (2007) and Kim and Endean (2009) suggest that design, uniqueness and personalised service typify boutique hotels. However, trends have indicated that increasingly the larger hotels and chain hotels are considering individuality and style as key success factors that will differentiate their product (PricewaterhouseCoopers, 2006). These hotels are now focusing on differentiating themselves to such an extent that the hotel is the tourist attraction (Van Hartesvelt, 2006) and is an integral part of the stay (Freund de Klumbis, 2007; McIntosh and Siggs, 2005). The ability to develop and launch successful new services in the market place is not only critical for survival but also creates a competitive advantage for the organisation (Ottenbacher and Harrington, 2010). Indeed, Lim and Endean (2009) suggest that a hotel that has achieved individuality would almost certainly be difficult to replicate. This is supported by Olsen and Connolly (2000) who suggest that hotels would have to continuously reinvent themselves in order to compete and Freud de Klumbis (2007) who also suggests individuality, niche products and staying closer to customer / market needs amongst other things are essential ingredients in the current market place. The hotel of the future is a pristine zero-g toroid hovering in orbit, it is an undersea complex of glass walls facing azure depths, and it is a high-tech pod nestling in the Serengeti or a glamorous boutique hotel run by robots (Harris, 2011). Keating-Chisholm (2012) suggests that there are 10 top hotel technologies of the future
3
shaping the hotel industry and include, foldable pods, biometrics, robots, nanotechnology, 3-D holographic teleconferencing, room selection and personalisation, undersea resorts, floating hotels, space resorts and smart cards. Wolff (2012) supports this and has indicated that the hotel industry is slow to accept radical design and are reluctant to embrace innovation because of the risks but nevertheless design concepts have been drawn up for a space resort, an undersea resort, an airship and the worlds biggest cruise ship; the American world city ship. Wolff (2012) further stipulates that it would appear that consumers look for and want the leading edge technology but still want the personal service at a very high level and standard. Freund de Klumbis and Munsters (2005) stipulate that the modern hotel guest is searching for unique experiences, new challenges, and multi-entertainment in the form of action, emotion, entertainment and aesthetic adventure. The customer of tomorrow is changing and is……. Better educated, well travelled both physically and electronically (Freund De Klumbis and Munsters, 2005; Domingo, 2012), is increasingly growing in sophistication (Failte Ireland, 2008; HBC, 2007), and want to experience excellence at all levels of service, which can be readily recognised as good value for money (Melia and Robinson, 2010). The consumer of tomorrow is also value conscious (Domingo, 2012), is time poor and make choices on the basis of services that support them in their busy lifestyles (Armistead and Kiely, 2003), is more environmentally aware and health conscious (Melia, 2011) and demand the total experience package (Domingo, 2012). Indeed, scarcely a week goes by without the announcement of another ‘unique’ playhouse for jaded millionaires, with operators striving to meet the needs of tomorrow’s consumer but behind the scenes in hotels frequented by the rest of us a quieter revolution is taking place. This paper investigates this revolution and reviews the major players / trend setters. While the hotel has always been associated with doing business, hotels are considered to be big business as vacation destinations and offer the ultimate hotel experience (Freund de Klumbis, 2005). Because of this attention is now being given to the development of chains and concepts providing this ultimate experience (Freund de Klumbis, 2005; Olsen and Connolly, 2000; PriceWaterhouseCooper 2006). Methodology / Approach Since an analysis of all the hotels in the world was not possible, the methodology used for this paper began with some exploratory research in the form of a literature review. Following this an in-depth study and elements of NET-Ography (Getz 2012) analysis was carried out on a small number of properties worldwide with a particular emphasis on firstly scanning for properties that were providing distinctively different products and concepts to meet the needs of niche markets based on the literature review. Through the content analysis process trends were identified that were perceived to be distinctively different. Samples of these properties were then analysed in-depth. Findings and Discussion This section of the paper presents the findings of the in-depth study and content analysis of trends and innovations in a number of hotels worldwide and analyses the trends of the ecotourist hotel, the culture / art / historic hotel, the back-to-nature hotel, the fashion hotel, the sports hotel, the lifestyle hotel, the cutting edge and technological hotel, the entertainment hotel and the wellness / wellbeing hotel. The Ecotourist Hotel A number of hotels have identified a niche in the market and are offering the eco friendly hotel concept by assuring its customers that it is providing a sustainable responsible product and is actively perusing energy saving practices, providing organic food, is supporting local businesses and is saving water and contributing to reducing carbon footprints. The buildings are architecturally designed to blend into their environments. These properties actively embrace social responsibility. Such properties include Morgan’s Rock Hacienda and Ecolodge, Maryland Seaside Hotel (China). Ecohotel Abu Dhabi, Eco Hotel Spa in La Gacilly – Brittany. Table 1 provides additional examples. Consumers’ are attracted to hotels that are eco-friendly, however, they are not prepared to accept a lesser service or poorer quality product, they expect something different and the ecotourist hotel can provide this differentiation. The Culture / Art / Historic Hotel The culture / art / historic hotel provide a unique holiday experience for the consumer. Some of these properties feature art as the key feature of their properties while others are located within exceptionally different buildings such as old palaces, refurbished castles, convents, churches, farm houses, industrial monuments and ancient
4
ruins. These properties provide modern facilities and state of the art technology within an historic / cultural context. Some examples include Melia Boutique Hotels, Sol Melia, Camille Oostwegel Holdings, Hotel Cezanne, The G Hotel Galway (Tracey), Propeller Island City Lodge Berlin (Lars Stroschen). Indeed, Freund de Klumbis and Munsters (2005) suggest that there is a growing interest in local, regional and national history and culture in hotels and historic hotels are responding to this trend by providing back to the roots and regional gastronomy trends with the supplement of fast food by the rebirth of the slow food revolution. This growing interest in art, culture and history is at the origin of the demand for hotels offering an historic ambience. This niche wants to discover, experience and broaden their knowledge of art and history during their leisure time. They prefer small-scale accommodation with high experience value, quality products, personal service and regional gastronomy. Some examples of properties providing this experience are presented in table 1. The Back-to-Nature Hotel The get back-to-nature experience for the nomadic tourist with properties that meet the needs of this niche market has become a popular trend. This trend offers a mixed variety of accommodations from budget to ultra modern properties that provide unique and different experiences. These can be anything from tent villages, to igloos to lodges in out of the way and scenic destinations and provide vacation destinations in their own right. Properties that represent the back-to-nature hotel trend are presented in table 1. The Designer / Fashion Hotel According to Freund de Klumbis (2007) design or fashion hotels subscribe to the view that design / fashion hotels are a measure of living and are considered to be hotels of individuality and attract a certain type of customer. Niche markets tend to be avid travellers, individuals working in the media, advertising fashion and entertainment industries. A number of these hotels would cater to customers who are seeking an intimate but luxurious offering. Fashion designers / brand names such as Fendi and Versace Hotel in Australia are names that are identified with hotel design for the fashion conscious traveller. In addition, Freund de Klumbis and Munsters (2005) suggest that design is a measure of living and not a temporary trend driving operators’ to embrace a contemporary approach to styling and equipping hotels and has become one of the key elements in the evolution of the hotel product. The designer / fashion hotel trend has many links with the lifestyle hotel trend discussed separately. Brands associated with the designer / fashion trend are presented in table 1. The Lifestyle Hotel As society changes so does the consumer who are becoming more creative, educated, well travelled, demanding, with increased expectations (Melia, 2011) and regard travel a part of their lifestyle. They seek very different experiences from the traditional hotel offering. According to Freund de Klumbis (2005) image, entertainment, uniqueness and the hip factor are much more important than the 5 star traditional hotel. A hotel that reflects this lifestyle and meets the needs of this consumer is chosen over the traditional hotel. While the lifestyles are far reaching the hotels offerings need to be sufficiently different to attract the ‘lifestyle consumer’. The lifestyle hotel must deliver quality in terms of the design but must also provide an experience that is appreciated by those seeking a lifestyle experience. Some examples of hotels catering to the lifestyle consumer are presented in table 1. A number of these hotels also meet the needs of the design / fashion hotel trend and the wellness hotel trend. The Cutting Edge and Technological Hotel According to Altman (2005) consumers are seeking accessible style and technology in their destination hotels. A combination of high design and high technology appears to be the trend that is presenting itself in terms of a cutting edge / technological hotel concept. Hotels are taking advantage of IT platforms that integrate everything from reservations and entertainment to utilities, staff allocation, surveillance and video conferencing to enhance the customer experience. Hotel 1000 in Seattle was one of the first hotels to deploy a converged network to link TV, cable, phone and heating systems. In addition, the hotel provides video-on-demand in high definition, infrared sensors, VolP Touchscreen phones and internet capabilities linking to airlines for check in. The hotel is wired for integrated systems and can adapt to changing trends very easily, for example, the integration of customers own smartphones with the hotel’s converged networks according to Marratt (2012). BUHall 5050 provide guests with iphones at check-in which guide guests to and grant them access to their room, they come pre-loaded with ‘virtual concierge’ apps (Harris 2011). Indeed, Price (2007) suggests that guests want full access to their digital life incorporated into their hotel life and that the focus of the Mandarin Oriental is to provide this in terms of back-of-house operations, its data centre and the quality of the network that will serve the hotel. Wireless web everywhere is expected by the technological segment. Saenz (2011) commenting on the Yotel in New York suggests that the hotel is packed with futuristic amenities and that it may influence hotels to make the transition from niche boutique to trend setting icons. Starwood Hotels and Resorts worldwide have introduced the W brand to meet this trend and Le Meridien has introduced the Art and Tech Concept in a
5
number of their hotels across three continents. Some examples of other hotels that have embraced the cutting edge and technological trend are presented in Table 1. The Entertainment Hotel Entertainment villages and hotels have developed over the years and were the first to introduce the hotel as a destination experience in itself. Now a number of hotels worldwide have developed the trend and include Disneyland Paris, The Venetian Las Vegas, Loews Hotels in the US and Canada with theme parks and hotels providing entertainment, The House of Blues in Chicago with a recording studio, bars and theatre facilities, Disney World Resorts, Morgan’s in New York, Royalton (NY) and The Delano in Miami all providing something new to the urban resort market, The St Martins Lane and Sanderson Hotels with local appeal and signature restaurants within the properties provides entertainment to both local and tourist business segments. Indoor water parks providing entertainment at hotels are a growing trend that is spreading throughout the US and Canada and include such hotels as Great Wolf Lodge, Wisconsin, Bloomington, Minnesota, Mount Olympus Water and Theme Park, Wisconsin. Table 1 presents additional examples. The Wellness / Wellbeing Hotel / Sports Hotel Wellness and wellbeing have become important segments of the tourism industry according to Konu (2010). A definition provided by Failte Ireland (2011) is a property where the main purpose of the business is to offer a full service wellness, treatment, spa or sports facility and that the property is the holiday destination. Other concepts associated with wellness and wellbeing in terms of tourism includes health tourism, sports and healthcare tourism. Wellness, sports and heath care products are usually associated with luxury properties and five-star hotels. However, operators have identified a niche in the market for wellness, sports and health tourism and have realised that they do not have to be connected to a five star hotel to be successful. Wellness, sports and health care have also been associated with lifestyle and consumers want to access products that provide this lifestyle as part of their holiday / vacation. This segment will make decisions to spend quality time in destinations’ / resorts’ that will provide this aspect of a product. This trend provides a wide range of facilities including those of spas, heath centre, treatment centre, outdoor pursuits, gyms, meditating, yoga, sauna, treatment therapies and so on. It is a wide ranging area, however, for the purposes of this trend the focus is on the wellness and sports hotel. This is a growing trend despite the global recession. Some examples of wellness and health care properties are presented in table 1. The hotel that attracts the sports enthusiast or a complete sports concept for the active tourist offering sports theme / concept and trends are also presented in Table 1. The Hotel of the Future?? The designers of the hotels of tomorrow have come up with some unique and different concepts for hotels. The question may be asked is will these hotels be built and if they are built; are they futuristic enough to attract the customer of tomorrow? Some of these hotels include the Death Star Lunar Hotel Complex / Hotel Crescent (Lunar inspired project being built in the Azerbaijani Capital: 135 metres high, 35 stories and 382 rooms), The Poseidon Undersea Resort (being developed on a private Island in Fiji, 5,000 acre lagoon and 550 sq feet of underwater suites), Waterworld (Songjiang, China, 400 bedroom resort with unique sporting facilities), Voyager V1 (at the development stage in Abu Dhabi), Hotel Pods (Foldable pods constructed on Stilts; at the design stage?), Hydropolis (Underwater Resort and Hotel, Jumeira Beach in Dubai), The Lunart Hotel (Schedule to be built on the moon and to be competed by 2050), The Aperion Hotel (still in the design phase, a high-tech futuristic hotel with a jungle theme to be built in Dubai), The Aerocraft (Hybrid airship with a casino, restaurants and stateroom that can accommodate 250 ‘passengers’), and the inflatable Space Hotel (anticipated completion in 2015, positioned 515 metres above the earth). Conclusions This paper provides insights into the current trends of hotel businesses and concepts nationally and internationally and considers the need for the provision of a unique means of diversification from the traditional hotel product of food and accommodation to a consideration of adding value by providing facilities and products that make the hotel the focus of the holiday / stay destination. Differentiation was an advantage in the 90’s and 2000; however, it is now a basic requirement. It has been suggested in this paper that hotels would have to continuously reinvent themselves in order to compete and that individuality, niche products and staying closer to customer / market needs amongst other things are essential ingredients for the future market place. Differentiated hotel products such as the ecotourist hotel, the culture / art / historic hotel, the back-to-nature hotel, the designer / fashion hotel, the lifestyle hotel, the cutting edge and technological hotel, the entertainment hotel, and the wellness / wellbeing / sports hotel have all being evaluated as trends and concepts emerging in order to guarantee the hotel is the holiday / stay destination. Some trends for the hotel of the future have also been addressed presenting uniquely different concepts with the question being asked ‘are they futuristic enough to attract the consumer of tomorrow?
6
Tomorrow’s consumers are more sophisticated, educated and travel experienced, older and more affluent, more physically and mentally active, more self-aware in an increasingly stressful world, seek value learning and self-improvement, look for more innovation in destinations and activities, seek holidays that have a low impact on the physical and cultural environments, increasingly look for better value for money, and are looking for ‘more’ than the traditional hotel product. This paper highlights those hotels that are reacting to these needs and trends. It is apparent from the research that distinctively different products are now being offered by hotels all over the world. This research paper provides insights into how the management and operation of hotel businesses will need to develop in order to meet the needs of the consumer of tomorrow. Hotel operators need to provide for this consumer. Recommendations for hotel managers and operators and educators are provided in the following sections. Recommendations for Hotel Managers / Operators The trends will impact on hotel operations into the future and these trends have implications for the management and operator of hotel businesses nationally and internationally. Hotel businesses will need to provide customer experiences that suits individual / market segment needs. In addition, hotels will need to provide branded hotel experiences, quality products and services that are differentiated from other hotel offerings. Hotels will not be able to provide formatted consistency that has been the trend of the multiples and chains around the world. Hotel properties that are unable to significantly differentiate their product will need to develop strategic alliances with businesses who can provide that differentiation, for example, hotels with a reputation for good accommodation and food may join a strategic alliance with a wellness centre to provide the differentiation and a package that will attract consumers to their destination. This could potentially involve a strategic alliance with a medical centre for the specialism that consumers seeking a wellness holiday need. It will be necessary for staff to be experts in the concept / value creation expertise / product knowledge expertise relevant to the concept and target market that the hotel is pursuing in its differentiation strategy. This will mean identifying and recruiting staff with specialist training in the non-traditional hotel management or operations skills. Expertise in sports management, lifestyle development, environmental science, event and entertainment management, arts, culture, fashion and history, wellness, treatments, sports and medical will be requirements. There will be a need for respect for the health / wellbeing / needs of the individual consumer provided in a non-traditional way in the traditional hotel concept. Operators and managers will need to employ staff that are aptly qualified with unique and different experiences and expertise over and above the traditional hotel management expertise Staff at all levels in the organisation will need to be service minded, creative and motivated. The research has highlighted that tomorrow’s consumers are more sophisticated, educated and travel experienced, older and more affluent, more physically and mentally active, more self-aware in an increasingly stressful world, seek value learning and self-improvement, look for more innovation in destinations and activities, seek holidays that have a low impact on the physical and cultural environments, increasingly look for better value for money, and are looking for ‘more’ than the traditional hotel product. Staff will need to be able to provide ‘the total experience’ package. Hotel employees will need to be highly trained to be able to meet the needs of this consumer. Recruitment and selection strategies need to be developed to take cognisance of this consumer. It will be necessary for all staff at all levels to be IT proficient and capable in order to manage the differentiation and provide seamless service through this capability. In addition, operators will need to provide a highly integrated information capability using IT. Hotel operators will need to provide a product that meets the consumer of tomorrow who is value conscious; therefore, operators need to embrace the concept of ‘value pricing’. In addition, the consumer of tomorrow expects a high and wide variety and assortment of product offerings as part of the hotel package; operators need to be adaptive in providing this product. Recommendations for Educators The traditional hotel management programmes will need to be developed to address the trends identified in this research. Educators will have to re-evaluate their programmes and while embracing the traditional offerings of management and finance, they will need to provide more creative choices and developments in curricula. Colleges will need to offer niche streams to students who wish to follow a career in hotel management but with an expertise as identified above. The traditional programmes with front office, food and beverage, rooms
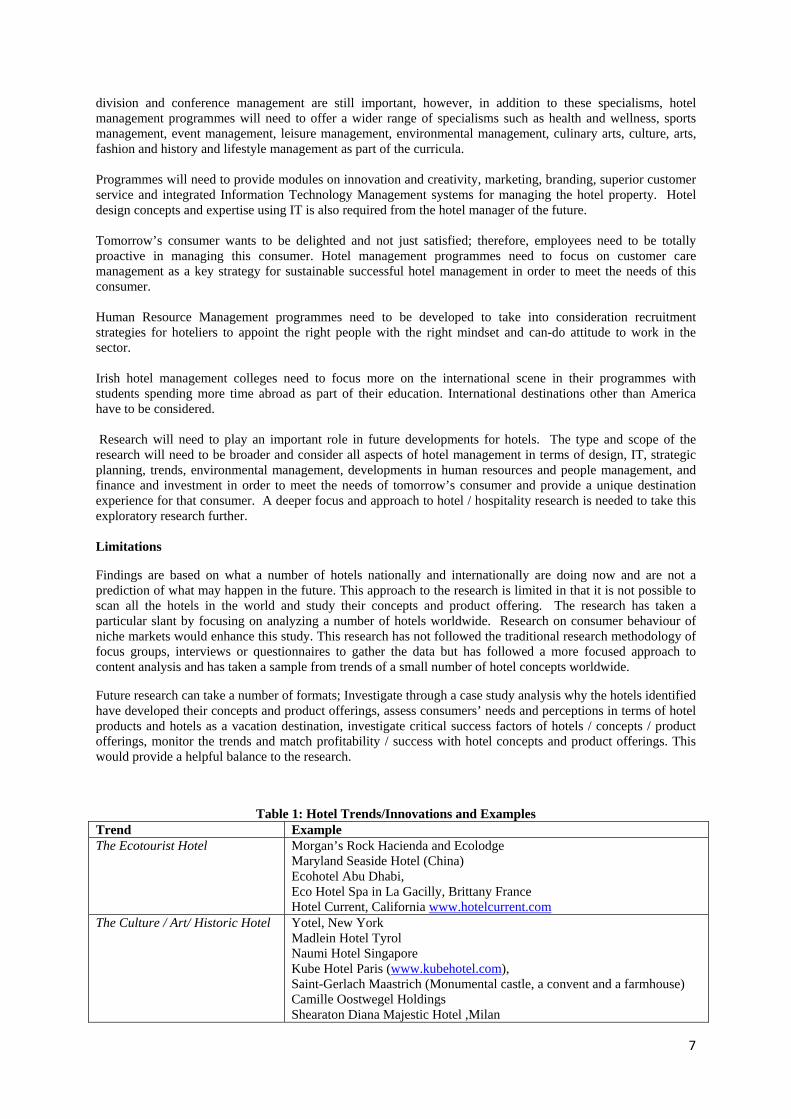
7
division and conference management are still important, however, in addition to these specialisms, hotel management programmes will need to offer a wider range of specialisms such as health and wellness, sports management, event management, leisure management, environmental management, culinary arts, culture, arts, fashion and history and lifestyle management as part of the curricula. Programmes will need to provide modules on innovation and creativity, marketing, branding, superior customer service and integrated Information Technology Management systems for managing the hotel property. Hotel design concepts and expertise using IT is also required from the hotel manager of the future. Tomorrow’s consumer wants to be delighted and not just satisfied; therefore, employees need to be totally proactive in managing this consumer. Hotel management programmes need to focus on customer care management as a key strategy for sustainable successful hotel management in order to meet the needs of this consumer. Human Resource Management programmes need to be developed to take into consideration recruitment strategies for hoteliers to appoint the right people with the right mindset and can-do attitude to work in the sector. Irish hotel management colleges need to focus more on the international scene in their programmes with students spending more time abroad as part of their education. International destinations other than America have to be considered. Research will need to play an important role in future developments for hotels. The type and scope of the research will need to be broader and consider all aspects of hotel management in terms of design, IT, strategic planning, trends, environmental management, developments in human resources and people management, and finance and investment in order to meet the needs of tomorrow’s consumer and provide a unique destination experience for that consumer. A deeper focus and approach to hotel / hospitality research is needed to take this exploratory research further. Limitations
Findings are based on what a number of hotels nationally and internationally are doing now and are not a prediction of what may happen in the future. This approach to the research is limited in that it is not possible to scan all the hotels in the world and study their concepts and product offering. The research has taken a particular slant by focusing on analyzing a number of hotels worldwide. Research on consumer behaviour of niche markets would enhance this study. This research has not followed the traditional research methodology of focus groups, interviews or questionnaires to gather the data but has followed a more focused approach to content analysis and has taken a sample from trends of a small number of hotel concepts worldwide.
Future research can take a number of formats; Investigate through a case study analysis why the hotels identified have developed their concepts and product offerings, assess consumers’ needs and perceptions in terms of hotel products and hotels as a vacation destination, investigate critical success factors of hotels / concepts / product offerings, monitor the trends and match profitability / success with hotel concepts and product offerings. This would provide a helpful balance to the research.
Table 1: Hotel Trends/Innovations and Examples Trend Example The Ecotourist Hotel
Morgan’s Rock Hacienda and Ecolodge Maryland Seaside Hotel (China) Ecohotel Abu Dhabi, Eco Hotel Spa in La Gacilly, Brittany France Hotel Current, California www.hotelcurrent.com
The Culture / Art/ Historic Hotel
Yotel, New York Madlein Hotel Tyrol Naumi Hotel Singapore Kube Hotel Paris (www.kubehotel.com), Saint-Gerlach Maastrich (Monumental castle, a convent and a farmhouse) Camille Oostwegel Holdings Shearaton Diana Majestic Hotel ,Milan
8
Fairmont Railway Hotels, Canada Old Hall Hotel (Home of Mary Queen of Scots) England
The Back to Nature Hotel
Esprit Nature unlitaupre France Nomad lodge (www.lacabaneenklair.com) Outpost Safari Lodge, Kruger National Park SA) Suite Tents (Origins Lodge Saharian Camp Atta Desert) Singita Pamushana Lodge Igloo Lodges (Engelberg, Gstaad, Zermatt, Switzerland) Iglu Dorf Igloo Hotels, Switzerland Cliente Resort and Spa Back to Nature Lake House Cabins, Lake Monroe, Fairfax US Crescent Moon Cabins, Dominica, Caribbean Desert Nomad House, Tucson, Arizona Verana Boutique Hotel, Jungle of Yelapa, Mexico Juvet Landskapshotell, Norway Tree Hotel Harads, Sweden 360 Leti, India Monastero, Pantelleria, Italy Museumotel, Raon-L’Etape, France Rolling Huts, Methow Valley, California Poustinia Hermitages, Tipperary, Ireland Hotel Palafitte, Switzerland
The Designer / Fashion Hotel
Design Hotels Inc The Small Hotel Company Emaar Properties Dubai – Armani Brands Sorat Hotels Villa Laetitia Casa Casuarina in Miami Hotel Missoni, Edinburgh Bulgari Hotel, Milan Bulgari Hotel, Bali Lacroix Hotel Bellechasse and Hotel du Petit Moulin, Paris Diana Von Frustenberg Claridges London, Elie Saab Hotel at the Tiger Woods Residential Club, Dubai Karl Largerfeld SchossHotel, Grunewald, Berlin W Hotels by Starwood Philip Tracey G Hotel Galway, Ireland Plazzo Versace Australia and Dubai Maritime Hotel New York The Clarance Hotel, Dublin, Ireland (U2)
The Lifestyle Hotel
Lebensart Global Network AG W and M Hotels Sorat Hotels Melia Boutique Hotels Whitelaw and Pelican in Miami Hotel Current, California www.hotelcurrent.com Petirocco in Brighton, HIP Hotels Myhotel Bloomsbury London, Cosmopolitan Clubs City Club Hotel NY MinoHotel and Domine Hotel in Spain. Relais et Chateaux Group SRS World Hotels Burg Arab in Dubai
The Cutting Edge and Technological Hotel
Yotel, New York Madlein Hotel Tyrol Naumi Hotel Singapore Kube Hotel Paris (www.kubehotel.com)
9
Starwood Hotel and Resorts W Brand Le Meridien Hotel Q, Berlin www.q-berlin.de
The Entertainment Hotel
Disneyland Paris The Venetian Hotel and Casino Las Vegas The Paris Hotel and Casino Las Vegas Loews Hotels in the US and Canada The House of Blues in Chicago Disney World Resorts Morgan’s in New York Royalton (NY) The Delano in Miami The St Martins Lane Sanderson Hotels The Park, Chennai, India The Durimah Group Dubai (wave, dessert….) Great Wolf Lodge, Wisconsin Bloomington, Minnesota Mount Olympus Water and Theme Park, Wisconsin. Six Flags great Escape Lodge, Lake George NY. Holiday Inn Fort Rapids Indoor Water Park and Resort Columbus, Ohio
The Wellness / Wellbeing Hotel / Sports Hotel
Monart Destination Spa, Wexford Ireland The Park Hotel in Kenmare, Ireland Hotel Gabriel Paris.(www.hotel-gabriel-paris.com) Nordic Light Hotel Stockholm (www.nordichotels.se) The Farrari Maranello Village Hotel and Residence (www.hotelmaranellovillage.com) Sky Hotel in Aspin the Cubes in Austria and Switzerland (www.cube-hotels.com) Hard Rock Hotels Fortina Spa Resort , Malta www.fortinasparesort.com Lilianfells Blue Mountain Resort and Spa Australia www.lilianfels.com.au Les Sources De Caudalie, France www.sources-caidalie.com Carton House, Ireland www.cartonhouse.com Longevity Resort Portugal www.longevitywellnessresort.com Natur-Med Thermal Springs and Health Resort, Turkey www.natur-med.com Wellness- Hotels and resorts International GmbH, Dusseldorf
References:
Aggett, M. (2007). What has influenced growth in the UK’s Boutique Hotels? International Journal of Contemporary Hospitality Management. Vol. 19 No: 2, pp 169-177
Altman, D. (2005). Hotel Design that Hones a New Cutting Edge. The New York Times. NY.
Anhar, L. (2011). The definition of Boutique Hotels. HVS International. www.hospitalitynet.org Accessed March 2012.
Armistead, C., and Kiely, J., (2003). Creating Strategies for Managing Evolving Customer Service. Managing Service Quality. Vol 13. No 2, pp 164-170.
Domingo, R. T., (2012). Get to Know the Customer of the Future Now.
Lim, W.M., and Endean, M., (2009) Elucidating the Aesthetic and Operational Characteristics of UK boutique Hotels. International Journal of Contemporary Hospitality Management. Vol. 21 No: 1, pp 38-51
Chambers Dictionary (2003) Chambers Dictionary, 7th Ed, Chambers Hse, Edinburgh Scotland.
Failte Ireland (2010). Tourism Matters: Research Update. Failte Ireland, Dublin.
10
Freund De Klumpis, F. (2005) Seeking the Ultimate Hotel Experience. Research Paper. ESCADE Escuela University de Turisimo Barcelona.
Freund De Klumpis, F., and Munsters, D., (2005). Developments in the Hotel Industry: Design Meets Historic Properties. International Cultural Tourism. Elsenvier Butterworth Heinmann.
Harris, M. (2011). Hotels of the Future. Engineering and Technology Magazine. Vol 6 No 7
Getz, D., (2012) Finding and Sustaining Competitive advantages in Event Tourism. International Conference on Tourism and Events: Opportunities, Impacts and Change. University of Ulster, Belfast June
Keating Chishoim, C (2012). Beyond 2005: Top Technologies that will redefine the hotels of the future. Hhtp://hotels.about.com/od/hiphotels/tp/future-hotels.htm. Accessed 12/3/2012
Konu, H. (2010) Indentifying Potential Wellbeing Tourism Segments in Finland. Tourism review. Vol 65 No 2 pp 41-51.
McIntosh, A. J., and Siggs, A. (2005). An Exploration of the Experiential Nature of Boutique Accommodation. Journal of Travel Research. Vol. 22, August, pp 7-81.
Melia, D., (2011). Performance Management and Measurement: A Hospitality Industry Context. LAP Lambert Academic Publ. Germany.
Melia, D., (2011) Trends in the Food and Beverage Sector of the Hospitality Industry. Research Paper Delivered to the EuroCHRIE Conference, Dubrovnik Croatia.
Melia D, and Robinson L., (2010). Towards Performance Measurement in Hotels: An Incremental Approach. In Gorham, G and Mottier Z., (Eds) Contemporary Issues in Irish and Global Hospitality. DIT. Dublin
Olsen. M., and Connolly, D. (2002) Experienced Based Travel. Cornell Hotel and Restaurant Administration Quarterly.
Ottenbacher M.C. and Harrington R.J. (2010). Strategies for achieving success for innovative versus incremental new services. Journal of Services Marketing. Vol 24. No. 1 pp 3-15.
Price, N. (2007) quoted in Future Technology Prediction will keep your Hotel Guests Happy. Caterer and Hotelkeeper. April.
PricewaterhouseCoopers, (2006). The Secret of Lifestyle Hotels’ Popularity is Simple: They are in tune with the needs of the new, complex consumer. Hospitality Direction. European Edition. PwC
PricewaterhouseCoopers, (2006).Standing out in the Crowd. 4th Ed Lifestyle Hotel Survey. Hospitality Directions. European Edition. No 14 pp 1-12. PwC
Robinot, E., and Giannelloni, J,L. (2010). Do hotels green attributes contribute to Customer Satisfaction? Journal of Services Marketing. Vol. 24. No. 2 pp157-169.
Saenz, A. (2011). Take a 3D Tour of the Hotel of the Future. http://singularityhub.com. Accessed 12/03/2012.
UNWTO (2007). Tourism Highlights 2007. Available at http://unwto.org/facts
Van Hartesvelt, M., (2006). Building a Better Boutique Hotel. Lodgings Hospitality. Vol. 62, No. 14, pp. 32 – 44.
Wolff, H., J. (2004) Quoted in Hotels of the Future. Forbes.com. Accessed 12/03/2012.
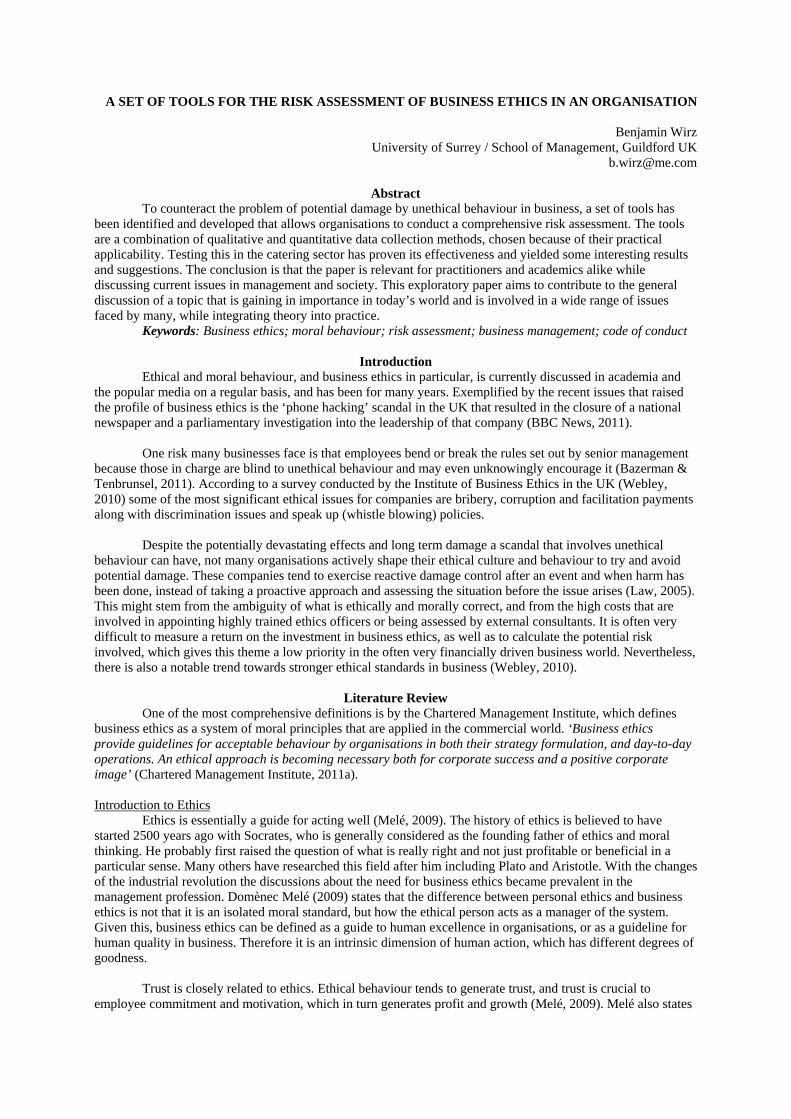
A SET OF TOOLS FOR THE RISK ASSESSMENT OF BUSINESS ETHICS IN AN ORGANISATION
Benjamin Wirz University of Surrey / School of Management, Guildford UK
Abstract To counteract the problem of potential damage by unethical behaviour in business, a set of tools has
been identified and developed that allows organisations to conduct a comprehensive risk assessment. The tools are a combination of qualitative and quantitative data collection methods, chosen because of their practical applicability. Testing this in the catering sector has proven its effectiveness and yielded some interesting results and suggestions. The conclusion is that the paper is relevant for practitioners and academics alike while discussing current issues in management and society. This exploratory paper aims to contribute to the general discussion of a topic that is gaining in importance in today’s world and is involved in a wide range of issues faced by many, while integrating theory into practice.
Keywords: Business ethics; moral behaviour; risk assessment; business management; code of conduct
Introduction Ethical and moral behaviour, and business ethics in particular, is currently discussed in academia and
the popular media on a regular basis, and has been for many years. Exemplified by the recent issues that raised the profile of business ethics is the ‘phone hacking’ scandal in the UK that resulted in the closure of a national newspaper and a parliamentary investigation into the leadership of that company (BBC News, 2011).
One risk many businesses face is that employees bend or break the rules set out by senior management
because those in charge are blind to unethical behaviour and may even unknowingly encourage it (Bazerman & Tenbrunsel, 2011). According to a survey conducted by the Institute of Business Ethics in the UK (Webley, 2010) some of the most significant ethical issues for companies are bribery, corruption and facilitation payments along with discrimination issues and speak up (whistle blowing) policies.
Despite the potentially devastating effects and long term damage a scandal that involves unethical
behaviour can have, not many organisations actively shape their ethical culture and behaviour to try and avoid potential damage. These companies tend to exercise reactive damage control after an event and when harm has been done, instead of taking a proactive approach and assessing the situation before the issue arises (Law, 2005). This might stem from the ambiguity of what is ethically and morally correct, and from the high costs that are involved in appointing highly trained ethics officers or being assessed by external consultants. It is often very difficult to measure a return on the investment in business ethics, as well as to calculate the potential risk involved, which gives this theme a low priority in the often very financially driven business world. Nevertheless, there is also a notable trend towards stronger ethical standards in business (Webley, 2010).
Literature Review
One of the most comprehensive definitions is by the Chartered Management Institute, which defines business ethics as a system of moral principles that are applied in the commercial world. ‘Business ethics provide guidelines for acceptable behaviour by organisations in both their strategy formulation, and day-to-day operations. An ethical approach is becoming necessary both for corporate success and a positive corporate image’ (Chartered Management Institute, 2011a).
Introduction to Ethics
Ethics is essentially a guide for acting well (Melé, 2009). The history of ethics is believed to have started 2500 years ago with Socrates, who is generally considered as the founding father of ethics and moral thinking. He probably first raised the question of what is really right and not just profitable or beneficial in a particular sense. Many others have researched this field after him including Plato and Aristotle. With the changes of the industrial revolution the discussions about the need for business ethics became prevalent in the management profession. Domènec Melé (2009) states that the difference between personal ethics and business ethics is not that it is an isolated moral standard, but how the ethical person acts as a manager of the system. Given this, business ethics can be defined as a guide to human excellence in organisations, or as a guideline for human quality in business. Therefore it is an intrinsic dimension of human action, which has different degrees of goodness.
Trust is closely related to ethics. Ethical behaviour tends to generate trust, and trust is crucial to
employee commitment and motivation, which in turn generates profit and growth (Melé, 2009). Melé also states
that among the many reasons why corporations engage in business ethics is to build a corporate reputation. This in turn attracts employees to jobs and enhances stakeholder relationships who both value trust and ethical behaviour. Creating an environment of trust is also vital in dealing with unethical behaviour because people will feel more confident in tackling issues as they arise (Gregory, 2010).
Ethical theories in business have been widely discussed in academia and tend to converge on one
essential point: their emphasis on concern for others over self-interest (Jones, Felps & Bigley, 2007; Arnold, Audi & Zwolinski, 2010). But there are also doubts regarding the idea that comprises the search for a ‘master principle’ that is valid to any and all sorts of moral problems (Arnold, Audi & Zwolinski, 2010). A reason for this is that the complexity of our moral thoughts and beliefs has a long tradition that originates in many different religions and moral strands.
Introduction to ethical risk assessments
Risk assessments help address a variety of hazardous exposures for people, the environment or businesses (Abt et al, 2010). However, they have often become too complex which has led to many assessments being unable to produce timely data that can be used to influence decision-making. A very simple ethical test for a business decision developed by the Institute of Business Ethics (2011a) asks three questions:
Transparency - Do I mind others knowing what I have decided? Effect - Whom does my decision affect or hurt? Fairness - Would my decision be considered fair by those affected?
There is a range of voluntary guidelines available for business ethics (Institute of Business Ethics,
2011b). These frameworks rely heavily on policies, codes of conduct and the subjective fairness for all stakeholders. What’s missing is a comprehensive risk assessment that, in addition to written policies and procedures, also measures the moral understanding and ethical behaviour of managers and employees. This is especially important to assess situations that are difficult to predict and therefore cannot be regulated in policies and codes of conduct.
Methodology
The research philosophy adopted in this work is one of pragmatism that is commonly used if the research objective does not suggest unambiguously the adoption of a positivist or interpretive philosophy (Saunders, 2009). The nature of research in this paper demands a combination of different methods. Much of the existing research in this field concentrates on either the psychological processes of moral and ethical decision-making and trying to classify certain behaviours (Forsyth, 1980; Kujala, Lämsä & Penttilä, 2011), or the assessment of existing policies and codes of conduct, and their effectiveness (GoodCorporation, 2010; Institute of Business Ethics, 2011a). Nothing addresses a combination of both and this is the gap this exploratory paper aims to address. Leadership styles, employees’ understanding, organisational cultures, and the moral background are different in every business. To understand and gain an overall view of ethical behaviour in an organisation, all these variables need to be combined and evaluated in conjunction with each other.
Data Collection
Three main tools have been identified to assess the ethical risk of the company: Qualitative face-to-face interviews, quantitative management dilemmas and the quantitative ethical positioning questionnaires as displayed in Figure 2 of the appendix. The first two methods will be interview administered and the last one self administered to make sure they are kept anonymous.
Qualitative face-to-face interviews
The qualitative face-to-face interviews will be conducted with a range of senior managers. Participants will be asked for their opinion about a number of ethical themes that affect the organisation. Existing structures, their effectiveness and possible improvements are of particular interest here.
The general topics of the semi-structured interviews are: ‘Individual ethics with the organisation’,
‘Managerial Ethics’, ‘Organisational Ethics’ and ‘Societal Business Ethics’. These themes have been identified in the current academic literature as the main focus points (Melé, 2009; Griseri, 2010; Webley, 2010; Bazerman & Tenbrunsel, 2011; Law, 2005). The questions for each topic are whether there are any procedures and policies in place to manage this, and the interviewee’s opinion regarding the point in general and the policies that are in place if any. These interviews aim to evaluate the following points:
That fair policies exist and that these are accessible by everybody in the company. That these policies are implemented and effective. That employees agree the system is fair and working.
The qualitative data collection aims to give insights into the structure of the organisation together with
its policies, codes of conduct and their effectiveness. It has the potential to show patterns of opinion and existing problems.
Management Dilemmas
Towards the end of the interview, a set of management dilemmas will be discussed. This type of questioning is very structured and can therefore be considered as part of the quantitative data collection. A number of morally questionable problems will be presented to the participants while asking what he would do in that position. The situations are from different ethical themes to be able to analyse specific risk areas that need to be addressed. It is important to see if managers make similar decisions when compared to each other. Strong differences could lead to conflicts within the management team. Together with the interview that leads to an understanding of the company’s policies and codes of conduct, and the participant’s views and opinions, the management dilemmas result in a personal view of the manager’s moral opinions.
The situations are adopted from a research method developed by Kujala, Lämsä & Penttilä (2010)
called ‘The Multidimensional Ethical Scale’, and are adjusted to leave the decisions open and not leading. The first dilemma explains a situation in which a client asks to receive an additional payment for a sizeable order, and wants the extra money to be paid to a different bank account abroad. This situation requires the decision maker to ponder over the benefits for the company, and compare them to the risk of being involved in extortion and irregular payments. The second problem presents the situation where due to financial problems the dismissal of an older employee with only little time left until retirement is considered. The dilemma is to decide if it is worth finding more difficult cost savings in order to be able to keep the employee until retirement, or is the welfare of the company more important than a single employee? The third situation deals with the problem of efficiency improvement involving a system that is planned and tested with a large partner company disregarding the needs and possibilities of smaller organisations. It shows the problem managers face when actions yield mutual benefits for some partners but have negative consequences for others. The fourth problem emphasises power dynamics. It focuses on the triangle of customer and competitor relationship and explains the blurring boundaries of company roles. ‘In (this) situation, a manager faces the problem of accepting the power to make a decision in the case of incompatible interests’ (Kujala et al, 2010: p195).
Quantitative questionnaires
The ethical positioning questionnaire (EPQ) has been chosen to analyse the moral ideology of participants. One significant advantage of this method is that results can be compared to previous research that indicates a mean standard, to which the company analysed can be plotted against. EPQ has been used by many academics over the years (Barnett, Bass & Brown, 1994; Davis, Andersen & Curtis, 2001), was originally developed by Forsyth (1980) and is proven to yield reliable and accurate results. It is designed to measure the ethical ideology or perspective of individuals based on their idealism and relativism.
Figure 1: Taxonomy of ethical ideologies devised from questionnaire scores, adopted from Barett, Bass & Brown (1994)
High Relativism Low Relativism High Idealism
Situationist Rejects application of universal moral principles. Believes that moral acts should have positive consequences for all persons affected by an action or decision.
Absolutist Approves actions that result in positive consequences for all individuals. Also believes that actions should conform to absolute moral principles.
Low Idealism
Subjectivist Rejects moral rules, and believes that moral decisions are subjective, individualistic judgments. Believes that negative consequences do not necessarily make an action immoral.
Exceptionist Accepts moral rules in principle, but willing to violate moral rules in order to circumvent negative consequences. An action is not condemned automatically because the action involves negative outcomes for some.
Ethical ideology is believed to strongly influence moral reasoning about issues. Barnett, Bass & Brown
(1994) explain that the amount to which an individual rejects general moral rules or beliefs is called ‘relativism’. Highly relativistic persons do not believe in moral fundamentals. They think that the goodness of an action changes upon the specific circumstances involved. On the other hand, non-relativists rely on universal ethical beliefs or laws when assessing the morals of an action. Idealism explains individual positions concerning the consequences of an act, and how the results affect the wellbeing of others. Barnett, Bass & Brown (1994) argue
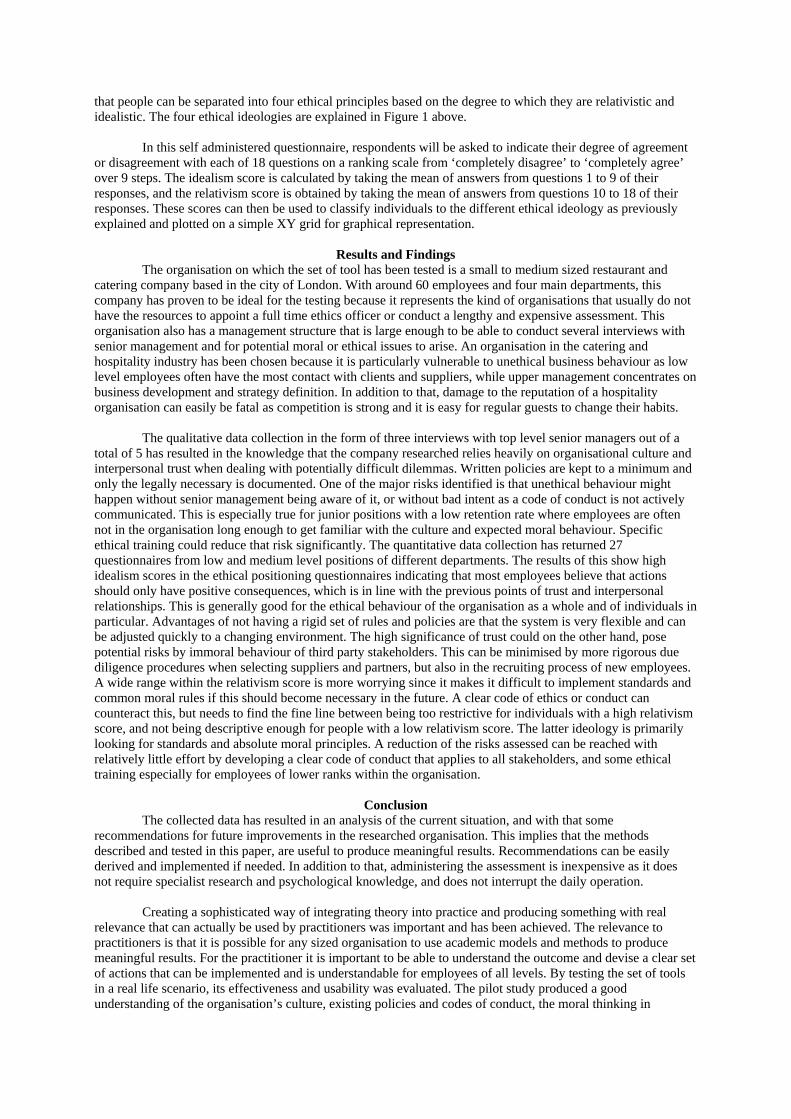
that people can be separated into four ethical principles based on the degree to which they are relativistic and idealistic. The four ethical ideologies are explained in Figure 1 above.
In this self administered questionnaire, respondents will be asked to indicate their degree of agreement
or disagreement with each of 18 questions on a ranking scale from ‘completely disagree’ to ‘completely agree’ over 9 steps. The idealism score is calculated by taking the mean of answers from questions 1 to 9 of their responses, and the relativism score is obtained by taking the mean of answers from questions 10 to 18 of their responses. These scores can then be used to classify individuals to the different ethical ideology as previously explained and plotted on a simple XY grid for graphical representation.
Results and Findings
The organisation on which the set of tool has been tested is a small to medium sized restaurant and catering company based in the city of London. With around 60 employees and four main departments, this company has proven to be ideal for the testing because it represents the kind of organisations that usually do not have the resources to appoint a full time ethics officer or conduct a lengthy and expensive assessment. This organisation also has a management structure that is large enough to be able to conduct several interviews with senior management and for potential moral or ethical issues to arise. An organisation in the catering and hospitality industry has been chosen because it is particularly vulnerable to unethical business behaviour as low level employees often have the most contact with clients and suppliers, while upper management concentrates on business development and strategy definition. In addition to that, damage to the reputation of a hospitality organisation can easily be fatal as competition is strong and it is easy for regular guests to change their habits.
The qualitative data collection in the form of three interviews with top level senior managers out of a
total of 5 has resulted in the knowledge that the company researched relies heavily on organisational culture and interpersonal trust when dealing with potentially difficult dilemmas. Written policies are kept to a minimum and only the legally necessary is documented. One of the major risks identified is that unethical behaviour might happen without senior management being aware of it, or without bad intent as a code of conduct is not actively communicated. This is especially true for junior positions with a low retention rate where employees are often not in the organisation long enough to get familiar with the culture and expected moral behaviour. Specific ethical training could reduce that risk significantly. The quantitative data collection has returned 27 questionnaires from low and medium level positions of different departments. The results of this show high idealism scores in the ethical positioning questionnaires indicating that most employees believe that actions should only have positive consequences, which is in line with the previous points of trust and interpersonal relationships. This is generally good for the ethical behaviour of the organisation as a whole and of individuals in particular. Advantages of not having a rigid set of rules and policies are that the system is very flexible and can be adjusted quickly to a changing environment. The high significance of trust could on the other hand, pose potential risks by immoral behaviour of third party stakeholders. This can be minimised by more rigorous due diligence procedures when selecting suppliers and partners, but also in the recruiting process of new employees. A wide range within the relativism score is more worrying since it makes it difficult to implement standards and common moral rules if this should become necessary in the future. A clear code of ethics or conduct can counteract this, but needs to find the fine line between being too restrictive for individuals with a high relativism score, and not being descriptive enough for people with a low relativism score. The latter ideology is primarily looking for standards and absolute moral principles. A reduction of the risks assessed can be reached with relatively little effort by developing a clear code of conduct that applies to all stakeholders, and some ethical training especially for employees of lower ranks within the organisation.
Conclusion
The collected data has resulted in an analysis of the current situation, and with that some recommendations for future improvements in the researched organisation. This implies that the methods described and tested in this paper, are useful to produce meaningful results. Recommendations can be easily derived and implemented if needed. In addition to that, administering the assessment is inexpensive as it does not require specialist research and psychological knowledge, and does not interrupt the daily operation.
Creating a sophisticated way of integrating theory into practice and producing something with real
relevance that can actually be used by practitioners was important and has been achieved. The relevance to practitioners is that it is possible for any sized organisation to use academic models and methods to produce meaningful results. For the practitioner it is important to be able to understand the outcome and devise a clear set of actions that can be implemented and is understandable for employees of all levels. By testing the set of tools in a real life scenario, its effectiveness and usability was evaluated. The pilot study produced a good understanding of the organisation’s culture, existing policies and codes of conduct, the moral thinking in
decision making when faced with a dilemma in the senior management team and an indication of the predominant ideology in moral thinking of its employees. This led to an analysis of the strengths and weaknesses of the organisation’s business ethics. More importantly it resulted in valuable recommendations that can be implemented for the benefit of future growth.
The notion of action research, where the research output results ‘from involvement with members of an
organisation over a matter of genuine concern to them’ (Bryman, 2007: p428) is very powerful. This is especially important for practitioners, and suggests it should provide a means of empowering participants. The assessment presented in this paper not only aims to provide suggestions for improvements, but also makes the people involved in the process aware of ethical and moral behaviour.
Many difficulties the economy and society face today may not have arisen if ethically and morally
correct behaviour were regarded as important issues that need to be discussed and taught at a broad range of educational institutes. It is imperative that individuals understand the background of ethics and the technicalities involved in order to make educated moral judgements of behaviour and deal with issues that are often far too important to just rely on a ‘gut feeling’. By investing in an inexpensive and easy to administer set of tools to assess moral and ethical understanding in an organisation, companies not only have the ability to avoid potentially damaging situations, but they can provide their employees with a new and fresh understanding of these important issues.
References
Abt, E., Rodricks, J.V., Levy, J.I. et al. (2010) 'Science and Decisions: Advancing Risk Assessment', Risk Analysis: An International Journal, 30 (7), pp. 1028-1036.
Arnold, D.G., Audi, R. and Zwolinski, M. (2010) 'Recent Work in Ethical Theory and Its Implications for Business Ethics', Business Ethics Quarterly, 20 (4), pp. 559-581.
Barnett, T., Bass, K. and Brown, G. (1994) 'Ethical Ideology and Ethical Judgment Regarding Ethical Issues in Business', Journal of Business Ethics, 13 (6), pp. 469-480.
Bazerman, M.H. & Tenbrunsel, A.E. (2011) 'Ethical Breakdowns', Harvard business review, 89 (4), pp. 58-65. BBC News (2011), Phone hacking scandal. Available at: http://www.bbc.co.uk/news/uk-14045952 (Accessed:
17.07.2011). Bryman, A. (2007) Business research methods. 2nd edn. Oxford: Oxford University Press. Chartered Management Institute (2011a), ManagementDirect - Ethics in Business. Available at:
www.managers.org.uk (Accessed: 17.07.2011). Davis, M.A., Andersen, M.G. and Curtis, M.B. (2001) 'Measuring Ethical Ideology in Business Ethics: A
Critical Analysis of the Ethics Position Questionnaire', Journal of Business Ethics, 32 (1), pp. 35-53. Forsyth, D.R. (1980) 'A taxonomy of ethical ideologies', Journal of personality and social psychology, 39 (1),
pp. 175-184. GoodCorporation (2010), The Good Corporation Standard. Available at: www.goodcorporation.com (Accessed:
17.07.2011). Gregory, P. (2010) 'Ethical leadership', Training Journal, pp. 44-47. Griseri, P. (2010) Business ethics and corporate social responsibility. 1st edn. Andover : South-Western
Cengage Learning. Institute of Business Ethics (2011a), Simple Ethical Tests for a Business Decision. Available at: www.ibe.org.uk
(Accessed: 05.07.2011). Institute of Business Ethics (2011b), Guidance, Tools and Standards. Available at: www.ibe.org.uk (Accessed:
17.07.2011). Jones, T.M., Felps, W. and Bigley, G.A. (2007) 'Ethical Theory and Stakeholder-Related Decisions: the Role of
Stakeholder Culture', Academy of Management Review, 32 (1), pp. 137-155. Kujala, J., Lämsä, A. and Penttilä, K. (2011) 'Managers' Moral Decision-Making Patterns Over Time: A
Multidimensional Approach', Journal of Business Ethics, 100 (2), pp. 191-207. Law, S. (2005) 'Ethical codes require reality checks', Professional Manager, 14 (4), pp. 22-24. Melé, D. (2009) Business ethics in action: seeking human excellence in organizations. Basingstoke: Palgrave
Macmillan. Saunders, M. (2009) Research methods for business students. 5th edn. Harlow: Financial Times Prentice Hall. Webley, S. 2010, Corporate Ethics Policies and Programmes: UK and Continental Europe Survey 2010,
Institute of Business Ethics, London.
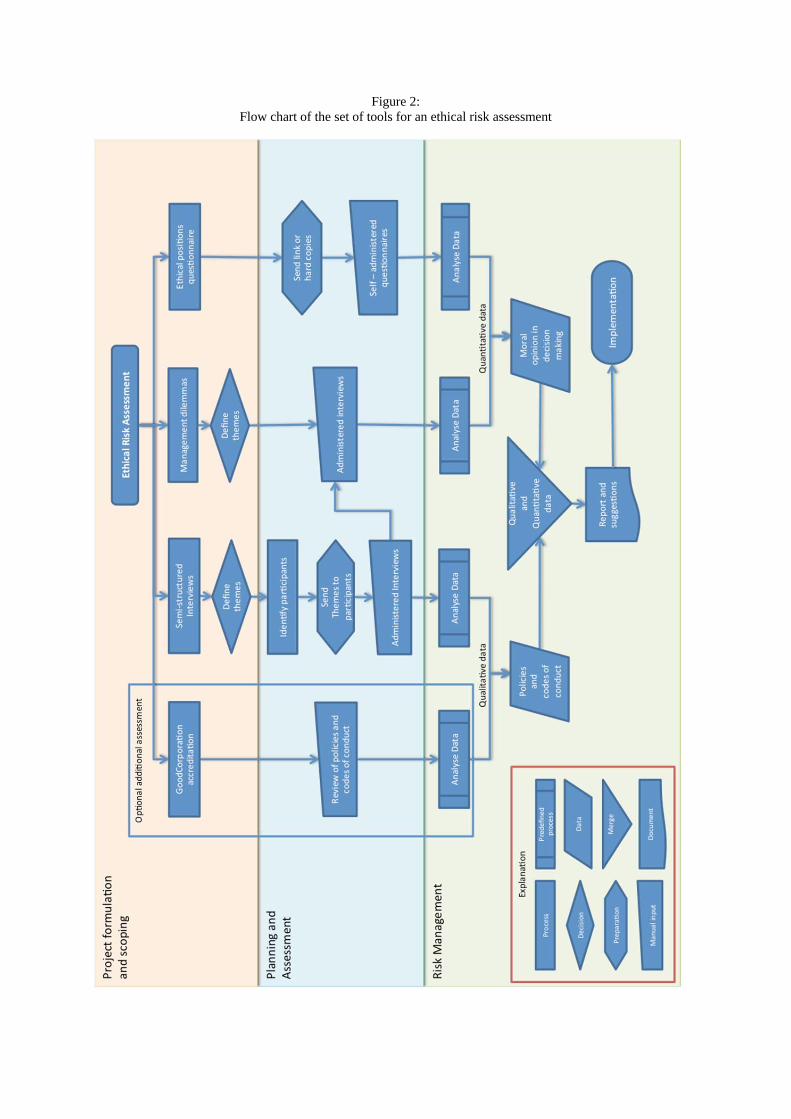
Figure 2: Flow chart of the set of tools for an ethical risk assessment
International Hotel Expansion in India: Opportunities and Challenges
*Maryam Khan, Ph.D. Howard University
Washington, DC, USA Email: [email protected]
ABSTRACT
The main objective of this study is to analyze the international hotel expansion in India’s growing economy. Due to increased international and domestic travel, there is a demand for additional hotel rooms in India. Findings show that there are many opportunities for international hotel brands venturing into Indian hotel market, but there are several challenges that need to be addressed. These include business, political, social, regulatory, environmental, infrastructure and security issues. In order to be competitive, many foreign brands have to form joint ventures, internationalize, and localize their product and services. In addition, hotel expansion in India has created a unique business model for growth and development. Key Words: Internalization, India hotel industry, international hotel brands, hotel expansion
INTRODUCTION
India is regarded as the biggest democracy in the world with a population reaching 1.2 billion (GEO HIVE, 2012). The Indian economy is expected to grow between 7.7% and 7.9% in 2012-2013 (IBEF, 2012). It is already recognized as the fourth largest economic power in the world, after the USA, China, and Germany. In Asia it is the second highest economic power next to China. In terms of purchasing power, India is ranked the third largest in the world (Ramakrishnan, 2011). This economic growth has given impetus to international and domestic tourism, which in turn has created a demand for tourism and hospitality services.
GROWTH OF TOURISM and HOSPITALITY INDUSTRY
The Indian tourism and hospitality industry is considered the largest service sector in the country, and
adds around 6.23% to the national GDP and 8.78% of the total employment (IBEF, 2011). According to WTO (World Travel Organization) forecast, India will receive about 25 million tourists by 2015 (Hosts India, 2011). With its cultural and environmental diversity India has a potential to become an important destination with a demand growing at 15% annually (Prashanth, 2009). As a major destination, India has the world’s highest mountains, miles of coastline, tropical forests and wildlife, dessert safari, backwater lagoons, ancient and historical sites, forts and palaces, adventure tourism, medical tourism, and of course the Taj Mahal. Indian tourism sector is experiencing resilient growth in both domestic and international markets. Economic growth along with information technology enabled services, rising stock indices, and a growing out-sourcing industry, has created a large young middle class that is driving the domestic tourism market. Foreign investment, venture capitalist, medical tourism, high quality hotels, and a well-planned government promotional effort are attracting foreign tourists. A $23 billion U.S. software service sector located in many metro cities creates opportunities for business travelers. Because of the “Incredible India” promotion, there has been an 8.7% increase in the number of International tourist visits from 2010 to 2011. A new “tourist visa on arrival” for selected countries is another promotion to lure foreign travelers. The country’s medical tourism share in the international medical tourism is expected to reach 3% by the end of 2013, and the number of medical tourists visiting India is anticipated to grow over 19% by 2013 (IBEF, 2011). This growth in tourism sector has resulted in an impetus to the Indian hotel industry (Howe, 2011).
India currently has over 200,000 hotel rooms and is facing a shortage of over 100,000 rooms. It is
projected that the Indian hotel inventory will increase by more than 114,000 rooms in the next three years, and over $10 billion will be invested in the hotel sector over the next five years (CNBC-TV18, 2011; Iyer, 2011; Hosts India, 2011). Therefore, it is not surprising that this growing economy, is allowing the Indian hotel market to prosper as international hotel brands, for example, Marriott, Hilton, Starwood, Hyatt, Four Seasons, Radisson, and Intercontinental, continue to expand in major Indian cities (Howe, 2011; Anonymous, 2007). Most of these multinational companies were at one time primarily American, but now do business around the world. Few examples of international hotel expansion in India are: Marriott Hotel International plans to increase its strength in India from 14 hotels and 3200 rooms to 100 hotels and 15000 rooms by 2015 (Ramakrishnan, 2011); Starwood Hotels and Resorts currently operate 33 hotels and plan to open 20 new hotels across all its brands by 2015 (Verma, 2012). With the debut of the W and Starwood brands, Starwood will have eight of its flagship hotels in India. While Hilton and Hilton Garden Inn have already been launched, the company is planning to introduce its luxury brands Waldorf Astoria and Conrad, besides its mid-level brands Doubletree and Hampton Inn. Hilton Worldwide is planning to add 50 hotels in the next five years and is also investing in technology and infrastructure for managing hotels and people (Howe, 2011; Meenakshi, 2011).
REASONS FOR INTERNATIONAL HOTEL EXPANSION
Last few decades has seen a tremendous expansion of hospitality companies overseas, both restaurant
franchises and hotel brands. The demand for hospitality product and services to a large extent depends on international tourists and international business. The hospitality industry is international and major hospitality companies work at a global level. These multinational companies in lodging include American (Hilton, Hyatt, and Marriott), French (Accor ), Swiss (Movenpick), and Chinese (Mandarin Oriental) to name a few. And, restaurant industry includes brands, for example, McDonald’s, Pizza-Hut, Domino Pizza, and Burger King.
Internalization has been a major expansion strategy for many international firms including hotel
companies. Theories on the internalization of firms are largely based on Western multinational firms, starting from the “product life cycle” theory (Vernon, 1966) to the OLI (ownership, location, and internalize) of “eclectric paradigm” theory (Dunning, 1988). Internationalization theory is an extension of “product life cycle” theory with an emphasis on the most cost-efficient approach. Some argue that it add value to a firm if the firm
has a competitive advantage with its intangible assets, such as brand, know-how, and managerial skills (Lee, 2007). The reasons for internalization or global expansion include, growth and profits, the desire to diversify, risks and saturation of domestic markets, cost efficiencies in labor and production, taxes and tariffs, opportunities in emerging markets, and extension of products and services. Overtime, developed markets saturate, and look to expand. One way is to diversify in other less saturated or emerging markets and maintain growth. Also, companies might invest in other markets to decrease exposure to one market. Especially in times of economic recession, it makes good business sense to target multiple markets. But, there are challenges and issues that multinational companies have to address before doing business in an emerging economy, for example, India. These issues can be business, legal, political, social, regulatory, environment, security, and lack of infrastructure problems. The international hotel expansion in India will be discussed in relation to the opportunities and challenges faced by multinational hotel companies.
OPPORTUNITIES FOR INTERNATIONAL HOTEL COMPANIES
For international hotel companies, venturing into the Indian hotel market, there are several
opportunities. Firstly, there is a big shortage of branded hotel rooms in India, especially compared to other international cities (Howe, 2011). In addition, India is an emerging economy, with a growing young middle class, increased buying power, increased demand for hospitality services, and a population that craves for Western products and services. The international hotel brands, such as, Marriott International and Hilton Worldwide already have an advantage of their proven brand ownership and resource superiority. It is easier for foreign companies to do business in India because the Indian government is very supportive, provides incentives, tax breaks, and has an open sky policy. Another advantage is the prevalence of the English language in the business environment of major Indian cities. Though from time to time there are reports of political or other unrests, India’s political climate is stable compared to other countries in the region. Currently, with the Indian rupee at its lowest against foreign currency, it provides a good value for both for the investors and travelers. Compared to Western countries, labor and production costs are relatively low. Also, there is no shortage of a young educated labor force, which is comparatively cheap, though highly unorganized. Hotels in India can hire more staff members per guests compared to their Western counterparts. Both Hilton and Marriott, for example, are investing in technology and infrastructure to manage hotels and people (Howe, 2011; Meenakshi, 2011; ETN, 2009).). Marriott has introduced the “voyager” program in which employees are asked to take rigorous two-year training at their top group properties before graduating as assistant managers. This program has been so successful that Marriott is introducing it in other Asian properties (Ramakrishnan, 2011).
CHALLENGES FOR INTERNATIONAL HOTEL COMPANIES
In spite of the above mentioned advantages, there are other business, legal, political, social, regulatory,
environmental, security, and lack of infrastructure problems that international companies have to address before setting up shop in India. Economically, due to globalization and international trade conditions, individual nation’s monetary balances have changed considerably. Even though Indian rupee is at its lowest compared to US dollar, currency fluctuations can be a major concern for international companies. Legal issues that can act as a deterrent are local laws and legal restrictions. Regulations pertaining to signage, construction, zoning, and lighting can adversely affect a brand expansion. The terms and conditions of documentations and legal rights and obligations must be thoroughly judged. Getting visas, securing multiple licenses, poor infrastructure, bureaucracy, logistics, and lack of an efficient supply chain can also pose challenge. Certain socio-cultural barriers can be customer preferences, food habits, and language. Customer preferences in India are very different from other places. A product that works globally cannot be introduced without localizing it. Indian customer might not be able to distinguish between a Courtyard by Marriott compared to Marriott Fairfield Inn. Even though English is a prevalent language in most major cities, language acculturation plays an important role in effective communication, developing training programs, and in providing operational details. Many Indians do not eat beef or pork products due to religious restrictions. This might restrict use of certain food products, which may be popular in Western countries. Even though politically India is stable compared to other Asian countries, there is always a potential for the political climate to change drastically. In fact, in the first half of year 2009-10, the Indian hotel industry not only felt the impacts of global financial crisis, but also the effects of Bombay attacks. Getting and retaining qualified workers can be problematic. Managing labor includes increasing payroll and compensation, and high levels of attrition to other service and retail industry (Howe, 2011; Thadani and Inshita, 2011). With the advancement of technology, educational methods, and email facilitating training, international brands are able to implement management and employee oriented programs. Other socio-cultural and environmental challenges can be weather, pollution, odor, traffic, health concerns, and safety.
But the biggest challenge for foreign hotels is business related, such as, market entry mode, the proprietorship, competition, and the need to localize products to suit domestic market. Many international hotel brands like Marriott, Hilton, and Intercontinental have picked up stakes in joint ventures with Indian developers. Previously, all international hotels had 70% international visitors and 30% local, but now due to a global economic slowdown, the ratio has reversed with 30% international and 70% local visitors. Therefore, it is not surprising that Marriott International has formed a joint venture with local SAMHI Hotels to launch Fairfield by Marriott, a new hotel prototype specifically designed for the Indian business traveler. This new prototype will have larger rooms, serve three meals a day, and offer free internet. Marriott is also offering vegetarian menu in its hotel restaurants. Hilton is also planning a management contract route. It is planning a five year joint contract with India’s builder DLF to build several Hilton Garden Inn properties. Intercontinental Hotel Group signed a joint venture with Duet India Hotel Group to develop 19 Holiday-Inn Express hotels around India (Howe, 2011; Ramakrishnan, 2011; Meenakshi, 2011; Hospitalitynet, 2011).
The Indian hotel industry with brands like Taj hotels, Oberoi group, Leela Ventures, and ITC are already well established and can give tough competition to foreign investors. In fact Indian hotels occupy the top four spots when it comes to the best hotels in Asia. There was a warning that with expansion of foreign brands, Indian hotels might lose its foothold in the market, and foreign hotel brands might gain a stronghold as it has in other Asian and Caribbean countries. But Indian brands in spite of foreign investments have held their own. The interesting point to be noted is that while the international hotel brands are trying to localize and internalize their products and services to cater to the Indian market, the Indian hotels have used foreign investments and foreign general managers when necessary to keep par with the international companies. But unlike other Asian or Caribbean countries, where the international hotels have completely dominated the hotel ownership and all top level positions, local Indian hotel brands like Taj, ITC, and Oberoi are independent as before. In every significant market (Bombay, Delhi, Madras, or Bangalore for example) the top hotel is Indian owned and Indian managed. Its shares are quoted on the Indian stock exchange, its’ fortunes are determined by Indian shareholders, and it displays the Indian brand on its properties. The quality of service and price rates of these hotels is comparable to international brands. The resilience of Indian hotel industry in spite of international brand entry has created a new model for growth and development unlike the other Asian countries (Sanghvi, 2010). This is a unique business model where both the local and international brands are trying to internalize their products and services, while attempting to appeal to the local and as well as international demand.
SUMMARY AND IMPLICATIONS
Given the expansion of the Indian hotel industry, this study attempted to analyze the growth potential and challenges faced by international hotel brands. It was evident that in order to be successful, these hotel companies had to work in partnership, localize and internalize their brand, and position their products and services to the growing Indian market. Since hospitality and tourism product is non-culture specific, it is relatively easy to internationalize. International companies are allowing managers to make cultural adjustments in food and beverage, décor, and type of service. Internalization of both the local and international brands has created a new business model that is quite different from the earlier models prevalent in other Asian countries. Tremendous growth is predicted in the Indian hotel industry and this creates a great opportunity for international hotel brands. However, there is a need to understand the opportunities and the challenges before any company contemplates doing business in this rapidly growing market. In addition, while planning future expansions, these international companies need to maintain their quality, consistency, affordability, and hotel brands that are already proven successful elsewhere.
REFERENCES
Annonymous, (Ebscohost, 2007). Hotels plan Asian Expansion. Business Travel News, Vol. 24(18). Indian Brand Equity Foundation (IBEF) (2012). Indian Economy Overview. (Retrieved April 30, 2012).
http://www.ibef.org/india-at-a-glance/India-diverse-democratic-dynamic/indian-economy-overview.aspx
IBEF (2011). Tourism and hospitality. India Brand Equity Foundation. (Retrieved January 17, 2012). http://www.ibef.org/artdispview.aspx?art_id=30388&cat_id=120&in=74
CNBC-TV18 (2011). Hotel industry aims $10bn investment in India over 5 years. (Retrieved January 17, 2012). http://www.moneycontrol.com/news/cnbc-tv18-comments/hotel-industry-aims-3610bn-investmentindia-over-5-years_534573.html
Dunning, John H. (1988). The Eclectic Paradigm of International Production: A Restatement and Some Possible Extensions. Journal of International Business Studies, Vol. 19, No. 1 (Spring, 1988), pp. 1-31
ETN (2009). Marriott to open seven hotels in India this year. (Retrieved January 17, 2012). http://www.eturbonews.com/7270/marriott-open-seven-hotels-india-year.
GEO HIVE (2012). Global Statistics / Population Statistics. (Retrieved January 10, 2012) http://www.geohive.com/
Hospitalitynet (2011). Marriott joins with SAMHI hotels to launch Fairfield by Marriott in India. (Retrieved February 10, 2012). http://www.hospitalitynet.org/news/4050913.html.
Hosts India (2011). The growing Indian hospitality industry. (Retrieved January 17, 2012). http://www.hostsindia.in/index.php?option=com_content&task=view&id=18&Itemid=32
Howe, M. (2011). Wealth of opportunity. Hotel Management, 226(8). Iyer, K. R (2011). Indian Hotel industry reports robust growth in 2011. (Retrieved January 10, 2012).
http://smehorizon.sulekha.com/indian-hotel-industry-reports-robust-growth-in-2011_sme-viewsitem_6695
Lee, Seoki, (2007). Internationalization of US multinational hotel companies: expansion to Asia versus Europe. International Journal of Hospitality Management, 27, pp. 657-664.
Meenakshi, V. (2011). Hilton Worldwide to set up 50 hotels in India in five years. (Retrieved January 30, 2012). http://economictimes.indiatimes.com/news/news-by-industry/services/hotels-/-restaurants/hotel-chain-hilton-worldwide-to-set-up-50-hotels-in-india-in-five-years/articleshow/9606385.cms.
Prashanth, B. (2009). Hotel industry in India witnesses tremendous boom. ET Bureau. (Retrieved January 17, 2012). http://articles.economictimes.indiatimes.com/2009-08-6/news/27649953_1_hospitality-hotel-industry-star-business-hotels
Ramakrishnan S. (2011). Marriott International is focusing more on India. (Retrieved January 17, 2012). http://www.groundreport.com/Business/Marriott-International-is-focusing more-on-India/2941563
Thadani, M and Inshita W. (2011). Indian hotel industry survey 2009-10. (Retrieved January 17, 2012). http://www.4hoteliers.com/4hots_nshw.php?mwi=8159
Verma, M. (2012). Starwood Hotels to launch 20 new hotels in India. (Retrieved February 10, 2012). http://economictimes.indiatimes.com/news/news-by-industry/services/hotels-/-restaurants/starwood-hotels-to-launch-20-new-hotels-in-india/art
Vernon, R. (1966). International investment and international trade in the product life cycle. Quarterly Journal of Economics, 80(2), 90-207.
Sanghvi, V. (2010). India’s hotel industry rocks! Hindustan Times. (Retrieved on January 18, 2012). http://www.hindustantimes.com/storypage/print/570317.aspx
1
Does Customer Loyalty Translate into Long Term Profitability within the Hotel Industry? Investigating the impact of Net Promoters on Firm Performance
Dr. Betsy Stringam*, Associate Professor,
New Mexico State University, Las Cruces, NM, 88011 USA, [email protected].
Dr. John Gerdes, Associate Professor,
University of South Carolina, Columbia, SC 29208 USA, [email protected].
Dr. Basak Denizci Guillet, Assistant Professor,
Hong Kong Polytechnic University, TST East, Kowloon, Hong Kong, [email protected]
Abstract: Recent research outside hotel industry has found that Net Promoters Score (NPS) is highly correlated to firm growth. The NPS value relates to the ratio of promoters vs. detractors of the organization, the intuition being that the greater the percentage of promoters, the more successful the firm. This study uses guest responses to the question “Would you recommend this hotel?” to investigate if NPS predicts hotel firm performance.
Keywords: Net Promoter, NPS, Profitability, Hotel, Loyalty, Performance
INTRODUCTION
The linkage between loyalty and customer satisfaction has been examined across many industries (Reichheld & Sasser, 1990; Reichheld, 2003). Various components of loyalty have been found to be highly correlated with company growth (Sivadas & Baker-Prewitt, 2000; Smith & Wright, 2004). One guest satisfaction question in particular was most closely related to company growth and profitability, namely: “How likely is it that you would recommend company X to a friend or colleague” (Reichheld, 2003, p. 50). The Net Promoters Score (NPS) compares the number of customers likely to recommend against those that are less likely to recommend. Reichheld (2003) found a strong correlation between NPS values and a company’s average growth over a three year period.
Since Reichheld’s research did not include hotels or hotel companies, this suggests two questions.
Would the results of Reichheld's study apply to the hotel industry? Can the rate of guest referrals or a traveler’s propensity to recommend a hotel actually predict the growth rate of the hotel company? There is very little empirical research examining the Net Promoter concept with hotels or hotel products. This research seeks to apply Reichheld’s model to the hotel industry and examine to what extent NPS theory predicts growth within the hotel industry. This relationship is examined across hotel market brand and hotel segments.
LITERATURE REVIEW
Research has long examined hotel loyalty. Pingitore, Selden and Walker (2010) determined customer satisfaction directly bears on repeat purchases and the likelihood of making recommendations. Mason, Tideswell and Roberts (2006) found seven factors to be a part of loyalty, namely: return visits, recommendation of the hotel to a friend, the value or cost, service quality, special deals, special treatment and an ongoing relationship between the hotel and guest. Bowen and Shoemaker (1998) found that loyal business guests in a luxury hotel were less price sensitive, and spent more on food and beverage purchases. Shankar, Smith and Rangaswamy (2003) found increased loyalty with guests who purchase hotel rooms online. Barsky and Nash (2002) found that emotions that drive hotel guest loyalty differ between hotel segments and price points.
While repurchase intentions may not always match repurchasing behaviors, researchers have long used
it as a measure of loyalty (Brown, Barry, Dacin, & Gunst, 2005; Chen & Gursoy, 2001; Keiningham, Cooil, Aksoy, Andreassen, & Weiner, 2007; McCall, Voorhees, & Calantone, 2010; Mechinda, Serirat, & Gulid, 2009; Oppermann, 2000; Reichheld, 2003). In contrast, Reichheld (2003) posits that an alternate measure, recommend intention is the best metric at predicting both future repeat purchases and the likelihood of recommendation.
Mason, Tideswell and Roberts (2006) reported the propensity of the hotel guest to recommend the
hotel to be the primary factor in hotel loyalty. Getty and Thompson (1994) stated that the propensity of students to recommend a hotel was more closely related to their perceptions of the quality of the property than an
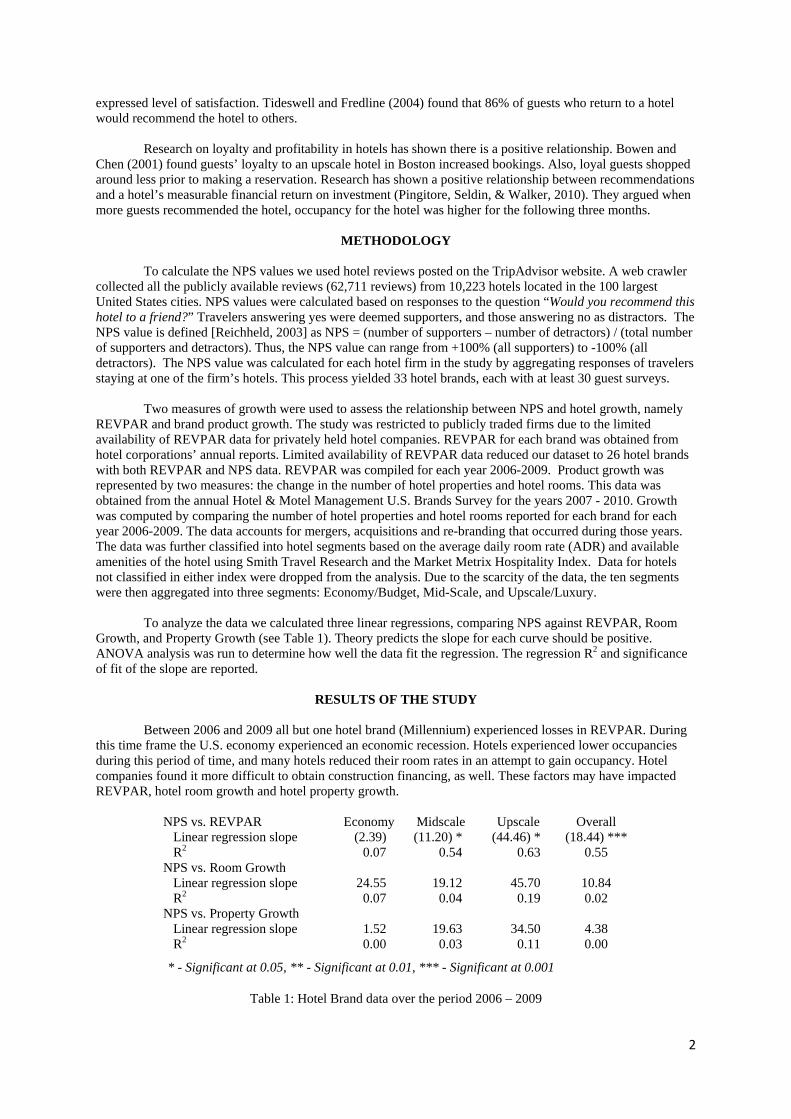
2
expressed level of satisfaction. Tideswell and Fredline (2004) found that 86% of guests who return to a hotel would recommend the hotel to others.
Research on loyalty and profitability in hotels has shown there is a positive relationship. Bowen and
Chen (2001) found guests’ loyalty to an upscale hotel in Boston increased bookings. Also, loyal guests shopped around less prior to making a reservation. Research has shown a positive relationship between recommendations and a hotel’s measurable financial return on investment (Pingitore, Seldin, & Walker, 2010). They argued when more guests recommended the hotel, occupancy for the hotel was higher for the following three months.
METHODOLOGY
To calculate the NPS values we used hotel reviews posted on the TripAdvisor website. A web crawler
collected all the publicly available reviews (62,711 reviews) from 10,223 hotels located in the 100 largest United States cities. NPS values were calculated based on responses to the question “Would you recommend this hotel to a friend?” Travelers answering yes were deemed supporters, and those answering no as distractors. The NPS value is defined [Reichheld, 2003] as NPS = (number of supporters – number of detractors) / (total number of supporters and detractors). Thus, the NPS value can range from +100% (all supporters) to -100% (all detractors). The NPS value was calculated for each hotel firm in the study by aggregating responses of travelers staying at one of the firm’s hotels. This process yielded 33 hotel brands, each with at least 30 guest surveys.
Two measures of growth were used to assess the relationship between NPS and hotel growth, namely
REVPAR and brand product growth. The study was restricted to publicly traded firms due to the limited availability of REVPAR data for privately held hotel companies. REVPAR for each brand was obtained from hotel corporations’ annual reports. Limited availability of REVPAR data reduced our dataset to 26 hotel brands with both REVPAR and NPS data. REVPAR was compiled for each year 2006-2009. Product growth was represented by two measures: the change in the number of hotel properties and hotel rooms. This data was obtained from the annual Hotel & Motel Management U.S. Brands Survey for the years 2007 - 2010. Growth was computed by comparing the number of hotel properties and hotel rooms reported for each brand for each year 2006-2009. The data accounts for mergers, acquisitions and re-branding that occurred during those years. The data was further classified into hotel segments based on the average daily room rate (ADR) and available amenities of the hotel using Smith Travel Research and the Market Metrix Hospitality Index. Data for hotels not classified in either index were dropped from the analysis. Due to the scarcity of the data, the ten segments were then aggregated into three segments: Economy/Budget, Mid-Scale, and Upscale/Luxury.
To analyze the data we calculated three linear regressions, comparing NPS against REVPAR, Room
Growth, and Property Growth (see Table 1). Theory predicts the slope for each curve should be positive. ANOVA analysis was run to determine how well the data fit the regression. The regression R2 and significance of fit of the slope are reported.
RESULTS OF THE STUDY
Between 2006 and 2009 all but one hotel brand (Millennium) experienced losses in REVPAR. During
this time frame the U.S. economy experienced an economic recession. Hotels experienced lower occupancies during this period of time, and many hotels reduced their room rates in an attempt to gain occupancy. Hotel companies found it more difficult to obtain construction financing, as well. These factors may have impacted REVPAR, hotel room growth and hotel property growth.
NPS vs. REVPAR Economy Midscale Upscale Overall Linear regression slope (2.39) (11.20) * (44.46) * (18.44) *** R2 0.07 0.54 0.63 0.55 NPS vs. Room Growth Linear regression slope 24.55 19.12 45.70 10.84 R2 0.07 0.04 0.19 0.02 NPS vs. Property Growth Linear regression slope 1.52 19.63 34.50 4.38 R2 0.00 0.03 0.11 0.00
* - Significant at 0.05, ** - Significant at 0.01, *** - Significant at 0.001
Table 1: Hotel Brand data over the period 2006 – 2009
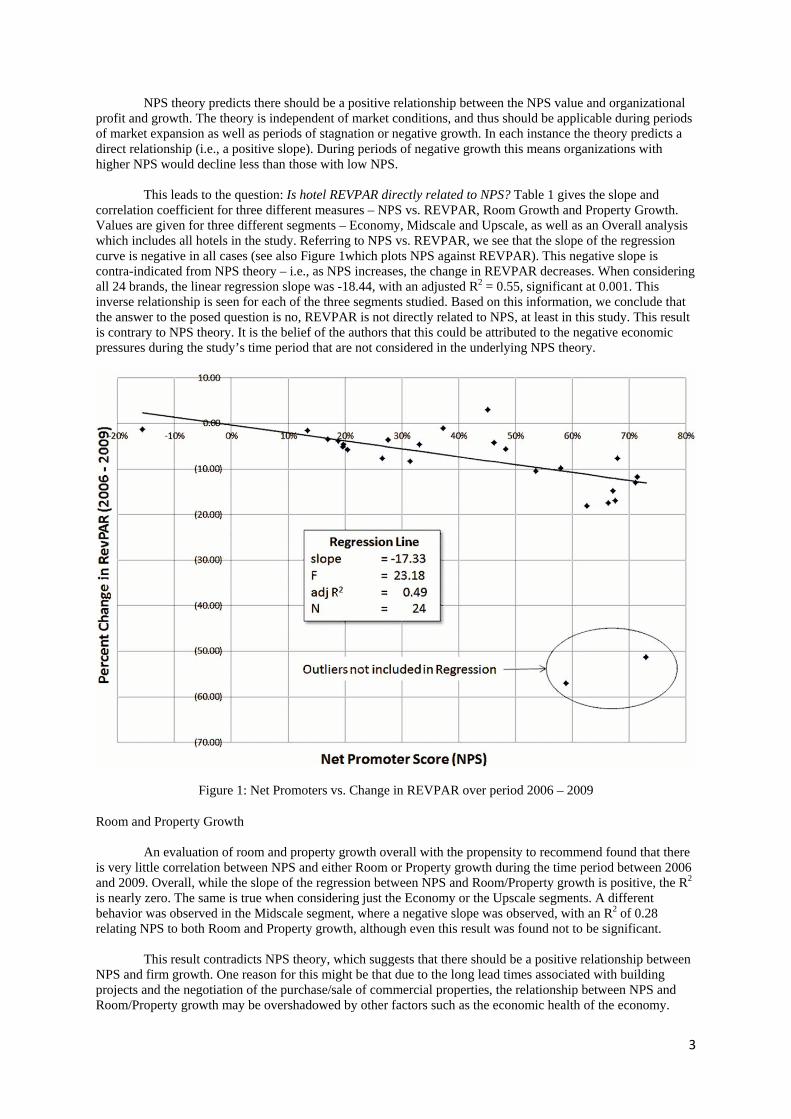
3
NPS theory predicts there should be a positive relationship between the NPS value and organizational profit and growth. The theory is independent of market conditions, and thus should be applicable during periods of market expansion as well as periods of stagnation or negative growth. In each instance the theory predicts a direct relationship (i.e., a positive slope). During periods of negative growth this means organizations with higher NPS would decline less than those with low NPS.
This leads to the question: Is hotel REVPAR directly related to NPS? Table 1 gives the slope and
correlation coefficient for three different measures – NPS vs. REVPAR, Room Growth and Property Growth. Values are given for three different segments – Economy, Midscale and Upscale, as well as an Overall analysis which includes all hotels in the study. Referring to NPS vs. REVPAR, we see that the slope of the regression curve is negative in all cases (see also Figure 1which plots NPS against REVPAR). This negative slope is contra-indicated from NPS theory – i.e., as NPS increases, the change in REVPAR decreases. When considering all 24 brands, the linear regression slope was -18.44, with an adjusted R2 = 0.55, significant at 0.001. This inverse relationship is seen for each of the three segments studied. Based on this information, we conclude that the answer to the posed question is no, REVPAR is not directly related to NPS, at least in this study. This result is contrary to NPS theory. It is the belief of the authors that this could be attributed to the negative economic pressures during the study’s time period that are not considered in the underlying NPS theory.
Figure 1: Net Promoters vs. Change in REVPAR over period 2006 – 2009
Room and Property Growth
An evaluation of room and property growth overall with the propensity to recommend found that there is very little correlation between NPS and either Room or Property growth during the time period between 2006 and 2009. Overall, while the slope of the regression between NPS and Room/Property growth is positive, the R2 is nearly zero. The same is true when considering just the Economy or the Upscale segments. A different behavior was observed in the Midscale segment, where a negative slope was observed, with an R2 of 0.28 relating NPS to both Room and Property growth, although even this result was found not to be significant.
This result contradicts NPS theory, which suggests that there should be a positive relationship between
NPS and firm growth. One reason for this might be that due to the long lead times associated with building projects and the negotiation of the purchase/sale of commercial properties, the relationship between NPS and Room/Property growth may be overshadowed by other factors such as the economic health of the economy.
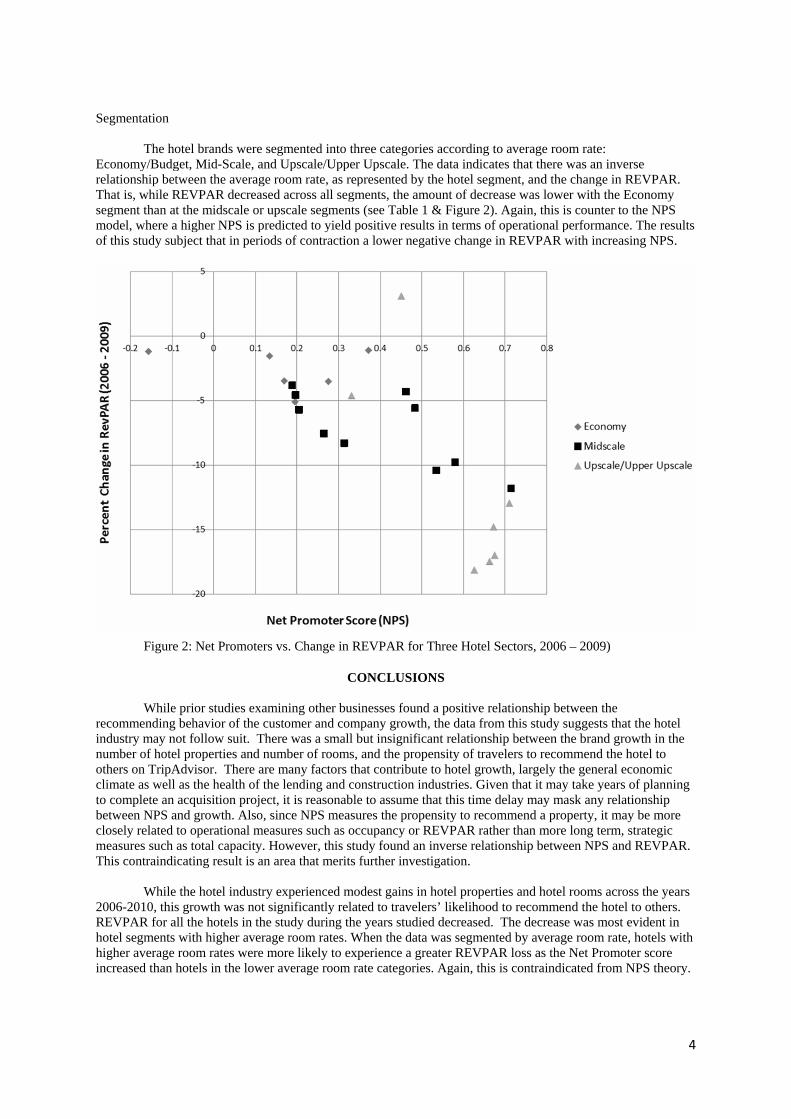
4
Segmentation
The hotel brands were segmented into three categories according to average room rate: Economy/Budget, Mid-Scale, and Upscale/Upper Upscale. The data indicates that there was an inverse relationship between the average room rate, as represented by the hotel segment, and the change in REVPAR. That is, while REVPAR decreased across all segments, the amount of decrease was lower with the Economy segment than at the midscale or upscale segments (see Table 1 & Figure 2). Again, this is counter to the NPS model, where a higher NPS is predicted to yield positive results in terms of operational performance. The results of this study subject that in periods of contraction a lower negative change in REVPAR with increasing NPS.
Figure 2: Net Promoters vs. Change in REVPAR for Three Hotel Sectors, 2006 – 2009)
CONCLUSIONS
While prior studies examining other businesses found a positive relationship between the recommending behavior of the customer and company growth, the data from this study suggests that the hotel industry may not follow suit. There was a small but insignificant relationship between the brand growth in the number of hotel properties and number of rooms, and the propensity of travelers to recommend the hotel to others on TripAdvisor. There are many factors that contribute to hotel growth, largely the general economic climate as well as the health of the lending and construction industries. Given that it may take years of planning to complete an acquisition project, it is reasonable to assume that this time delay may mask any relationship between NPS and growth. Also, since NPS measures the propensity to recommend a property, it may be more closely related to operational measures such as occupancy or REVPAR rather than more long term, strategic measures such as total capacity. However, this study found an inverse relationship between NPS and REVPAR. This contraindicating result is an area that merits further investigation.
While the hotel industry experienced modest gains in hotel properties and hotel rooms across the years
2006-2010, this growth was not significantly related to travelers’ likelihood to recommend the hotel to others. REVPAR for all the hotels in the study during the years studied decreased. The decrease was most evident in hotel segments with higher average room rates. When the data was segmented by average room rate, hotels with higher average room rates were more likely to experience a greater REVPAR loss as the Net Promoter score increased than hotels in the lower average room rate categories. Again, this is contraindicated from NPS theory.
5
It is important to note that this study examined recommending behavior of travelers and hotel growth across an economic recession and contraction throughout the hospitality industry. It is possible that a similar study conducted during years of economic growth would yield significantly different results.
LIMITATIONS
The data used in the study was obtained through a single distributor or channel and may not be
representative of hotel guests as a whole. The study examined travelers’ recommend intention. Intentions do not always reflect actual consumer behavior.
This study examined the recommending behavior across hotel brands, and not for individual hotels.
While the theory of a hotel brand is that the product and service are similar, in reality this is not always true. It is likely that travelers are more likely to recommend some hotels within a brand, and not others.
Many factors contribute to the growth of a company. This study examined only one factor’s
relationship to economic growth, and does not suggest that this factor alone creates economic growth. Furthermore this study was conducted using data during a time period in which the hotel industry experienced an economic downturn, and faced increased difficulties in financing for new or expanded product. The researchers recommend that the study be conducted again in the future during years of economic growth for the hotel industry.
REFERENCES
Barsky, J., & Nash, L. (2002). Evoking emotion: Affective keys to hotel loyalty. Cornell Hotel and Restaurant
Administration Quarterly, 43(1), 39-46. Bowen, J., & Chen, S. L. (2001). The relationship between customer loyalty and customer satisfaction.
International Journal of Contemporary Hospitality Management, 13(5), 213-217. Bowen, J., & Shoemaker, S. (1998). Loyalty: A Strategic Commitment. Cornell Hotel and Restaurant
Administration Quarterly, 39(1), 12-25. Brown, T., Barry, T., Dacin, P., & Gunst, R. (2005). Spreading the word: Investigating antecedents of
consumers' positive word of mouth intentions and behaviors in a retailing context. Journal of the Academy of Marketing Science, 33(2), 123-138.
Chen, J., & Gursoy, D. (2001). An investigation of tourists' destination loyalty and preferences. International Journal of Contemporary Hospitality Management, 13(2), 79-85.
Getty, J. M., & Thompson, K. N. (1994). The Relationship between Quality, Satisfaction and Recommending Behavior in Lodging Decisions. Journal of Hospitality & Leisure Marketing, 2(3), 3-22.
Keiningham, T., Cooil, B., Aksoy, L., Andreassen, T., & Weiner, J. (2007). The Value of different customer satisfaction and loyalty metrics in predicting customer retention, recommendation, and share of wallet. Managing Quality Service, 17(4), 361-384.
Mason, D., Tideswell, C., & Roberts, E. (2006). Guest Perceptions of Hotel Loyalty. Journal of Hospitality & Tourism Research, 30(2), 191-206.
McCall, M., & Voorhees, C. (2010). The drivers of loyalty program success. The Cornell Hospitality Quarterly, 51(1), 35-52.
McCall, M., Voorhees, C., & Calantone, R. (2010). Building Customer Loyalty. Cornell University, School of Hotel Administration. Ithaca: Cornell Hospitality Report.
Mechinda, P., Serirat, S., & Gulid, N. (2009). An examination of tourists' attitudinal and behavioral loyalty. Journal of Vacation Marketing, 15(2), 129-148.
Oppermann, M. (2000). Tourism Destination Loyalty. Travel Research, 39(1), 78-84. Pingitore, G., Seldin, D., & Walker, A. (2010). Making Customer Satisfaction Pay: Connecting Survey Data to
Financial Outcomes in the Hotel Industry. The School of Hotel Administration, Cornell University. Ithaca, NY: The Center for Hospitality Research.
Reichheld, F. (2003). The One Number You Need to Grow. Harvard Business Review, 81(12), 46-54. Reichheld, F., & Sasser, W. (1990, September-October). Zero defections: quality comes to service. Harvard
Business Review, 68(5), 105-111. Shankar, V., Smith, A., & Rangaswamy, A. (2003). Customer satisfaction and loyalty in online and offline
environments. International Journal of Research in Marketing, 20(2), 153-175. Sivadas, E., & Baker-Prewitt, J. (2000). An examination of the relationship between service quality, customer
satisfaction, and store loyalty. International Journal of Retail & Distribution Management, 28(2), 73-82.

6
Smith, R., & Wright, W. (2004). Determinants of customer loyalty and financial performance. Journal of Management Accounting Research, 16(1), 183-205.
Tideswell, F., & Fredline, E. (2004). Developing and rewarding loyalty to hotels: The guest's perspective. Journal of Hospitality & Tourism Research, 28(2), 186-208.
AN EXPLORATION OF THE RELATIONSHIPS BETWEEN SERVICE QUALITY, SUSTAINABLE COMPETITIVE ADVANTAGE AND FIRM PERFORMANCE.
Stuart Feigenbaum Hotelschool The Hague
The Hague, The Netherlands [email protected]
ABSTRACT
Over the last two decades, we have evolved from an industrialized economy to an economy that is knowledge based, and service oriented, with over half the adult population in the United States engaged in the delivery of service. Concurrently, with the transition from manufacturing to service, American management has been striving to achieve total quality solutions, convinced that quality is the key to success. The influential authors of the quality movement have attempted to utilize the same techniques effective in manufacturing to the delivery of service. By all indications, these attempts have failed, as service quality has remained mediocre since common measurements were developed. It might be a simple leap of faith to think that increased service quality should improve firm performance; therefore this paper has been written to explore the relationships that may exist between the constructs of service quality, sustainable competitive advantage and firm performance.
Key Words: Service Quality, Firm Performance, Sustainable Competitive Advantage, Customer Service Index
INTRODUCTION
Leaders of every “for profit” organization have one prime directive: to create or increase economic value1. To accomplish this task, executives of the firm create corporate strategy specifically identifying the business they are in, and how they chose to create such value. The field of strategy, in its broadest context identifies the direction, intensity, and objectives of this process, These decisions will form the basis of bundles of products and services called competitive methods, which are intended to create a competitive advantage over other firms in their market category. It is these competitive methods that have the biggest impact on the creation of value for the firm(Olsen, West, & Tse, 2008).
Parallel to this line of thought, the seminal literature in Service Quality posits that an increase in the levels of service quality will increase both revenue and firm profitability (Anderson, Fornell, & Lehmann, 1994; Bolton & Drew, 1991; George, Kelly, & Marshall, 1986; C. W. L. Hart, Heskett, & Sasser, 1990; J. L. Heskett, Sasser Jr, & Schlesinger, 1997). Since hotels create their value through the provision of services, it would be a logical assumption that through an increase in service quality the hotel would achieve higher economic value. However, according to the American Customer Satisfaction Index, the average ranking of customer satisfaction in the hotel industry is 76.8, less than one percentage point higher than the baseline score of 75.1 in 1994.
If: Hotels are part of a “for profit” business, and their core business can be identified as a “service,” and service quality has a direct relationship to profitability, how is it possible for service ratings to be consistently rated mediocre, and have not changed in 18 years?
This paper, through a theoretical framework, explores the relationships that exist between service quality and firm performance and attempts to identify the multiple variables that create the gaps between the planned and actual results of service quality. Through this framework a series of hypothesizes are created to help explain these gaps, and better understand management decisions that are creating the current levels of service quality. This paper further helps clarify the current levels of understanding, and provide future direction for research toward an improvement in hotel service quality.
SERVICE QUALITY AND FIRM PERFORMANCE
The definition and measurement of service have been characterized as intangible and to some extent, indefinable. When service occurs, it occurs at the “moment of truth”. This moment of truth is the time service can be viewed, experienced and measured. “The metaphor of the moment of truth is a powerful idea for helping people in service businesses shift their points of view and think about the customers’ experience. SAS president Jan Carlzon’s one-liner, ‘We have 50,000 moments of truth out there every day,’ really hits home” (Albrecht & Zemke, 1985).
Service has many meanings in many contexts, and is a difficult construct to define(Lovelock, 1983). The distinction between products and services is difficult. In fact, in most instances, there is a continuum from product to service, whereby the consumer receives some portion of a product and/or service with most transactions. Products such as commodities would be the purest form of product, with little if any service included in the transaction, while at the other extreme might be consulting, where the value is created through the intangible deliverable of knowledge, and the service is generally the solution to a problem.
In its simplest form, service is work done by one person (or a group of people) for the benefit of another (or others). Through the multitude of definitions of service available, one common theme exists that services are intangible, and are delivered simultaneously with the consumption. According to Fitzsimmons, “A service is a time-perishable, intangible experience performed for a customer acting in the role of co-producer.”(2005)
The first issue to address would be the actual measurement of service quality. If something cannot be defined, how then can it be measured? In their efforts to create a service quality measurement system, Parasuramen, Zeithaml and Berry state that service quality is the difference between the consumers’ expectation and the perception of the services received (Parasuraman, Zeithaml, & Berry, 1985, 1988). Therefore, SQ=P-E, where SQ is service quality, P is the consumer’s perception of the received service, and E is the expectation of
1 Some may argue the relative merits of Shareholder versus Stakeholder value. While it is agreed that stakeholder
value is also paramount to the organization, for the purposes of this paper, it is deemed that economic value is a prerequisite for all stakeholders.
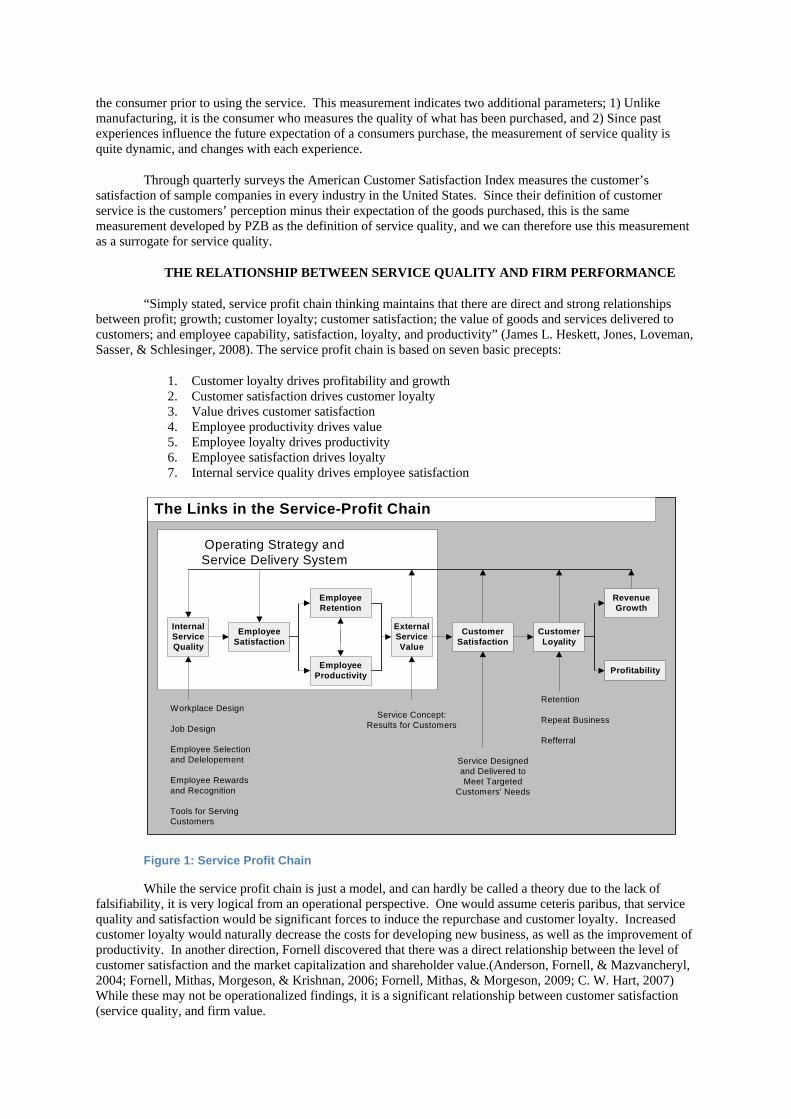
the consumer prior to using the service. This measurement indicates two additional parameters; 1) Unlike manufacturing, it is the consumer who measures the quality of what has been purchased, and 2) Since past experiences influence the future expectation of a consumers purchase, the measurement of service quality is quite dynamic, and changes with each experience.
Through quarterly surveys the American Customer Satisfaction Index measures the customer’s satisfaction of sample companies in every industry in the United States. Since their definition of customer service is the customers’ perception minus their expectation of the goods purchased, this is the same measurement developed by PZB as the definition of service quality, and we can therefore use this measurement as a surrogate for service quality.
THE RELATIONSHIP BETWEEN SERVICE QUALITY AND FIRM PERFORMANCE
“Simply stated, service profit chain thinking maintains that there are direct and strong relationships between profit; growth; customer loyalty; customer satisfaction; the value of goods and services delivered to customers; and employee capability, satisfaction, loyalty, and productivity” (James L. Heskett, Jones, Loveman, Sasser, & Schlesinger, 2008). The service profit chain is based on seven basic precepts:
1. Customer loyalty drives profitability and growth 2. Customer satisfaction drives customer loyalty 3. Value drives customer satisfaction 4. Employee productivity drives value 5. Employee loyalty drives productivity 6. Employee satisfaction drives loyalty 7. Internal service quality drives employee satisfaction
Figure 1: Service Profit Chain
While the service profit chain is just a model, and can hardly be called a theory due to the lack of falsifiability, it is very logical from an operational perspective. One would assume ceteris paribus, that service quality and satisfaction would be significant forces to induce the repurchase and customer loyalty. Increased customer loyalty would naturally decrease the costs for developing new business, as well as the improvement of productivity. In another direction, Fornell discovered that there was a direct relationship between the level of customer satisfaction and the market capitalization and shareholder value.(Anderson, Fornell, & Mazvancheryl, 2004; Fornell, Mithas, Morgeson, & Krishnan, 2006; Fornell, Mithas, & Morgeson, 2009; C. W. Hart, 2007) While these may not be operationalized findings, it is a significant relationship between customer satisfaction (service quality, and firm value.
InternalServiceQuality
RevenueGrowth
CustomerLoyality
CustomerSatisfaction
ExternalServiceValue
EmployeeProductivity
Profitability
EmployeeSatisfaction
EmployeeRetention
The Links in the Service-Profit Chain
Operating Strategy andService Delivery System
Workplace Design
Job Design
Employee Selectionand Delelopement
Employee Rewardsand Recognition
Tools for ServingCustomers
Service Concept:Results for Customers
Retention
Repeat Business
Refferral
Service Designedand Delivered toMeet Targeted
Customers' Needs
SERVICE QUALITY AS A SUSTAINABLE COMPETITIVE ADVANTAGE
It is most difficult to present a concept that is not easily defined, difficult to measure, and totally intangible, inseparable, and heterogeneous (Olsen et al., 2008; Parasuraman et al., 1985); and present this concept as the foundation for a sustainable competitive advantage. Yet the sustainability of service quality depend upon the complexities previously identified. In their exploration of the future of value creation, Prahalad and Ramaswamy indicate that the “system of company-centric value creation” is no longer valid in the 21st century; but will be replaced by a system of “co-creation of unique value with the customer.”(Prahalad & Ramaswamy, 2004, p. 4) Understanding the premise that value is co-created is the core of the service delivery concept. The complexity of the process and the premise of co-creation might lead us to better understand service as part of a resource based view, i.e. a unique process, set of skills and culture in co-creating the experience with the customer. Barney identifies four components necessary to be a part of a sustainable competitive advantage: It must be Valuable, rare among the firm’s competition, inimitable, and no equivalent substitute for this unique resource (Barney, 1991).
Service is certainly valuable. Currently representing approximately 80 percent of the gross domestic product of the United States, services are the major source of revenue for the country. The question of services creating value is not as much the issue as the relationship between the perceived quality of the service and the additional value that may be created. Rare among the firm’s competition; using the measurements maintained by ACSI, service quality is rare in almost any sector, particularly the Hotel industry. Inimitability is the factor yet to be proven. In theoretical terms, the delivery of quality service is complex, requiring the recruitment, selection, training and retention of excellent employees. The systems employed to deliver the service are complex, and rely to a great extent on the interaction between the individual service provider and the customer. Since service is known to be heterogeneous, the consistency of the service is dependent to a great extent on the individuals involved, and to a culture of service maintained within the organization. The possibility for a substitute for this unique resource may be available at some levels of service, i.e. through automation, and changing generational preferences, self-service is becoming increasingly popular. Since the service is self driven, the perception of the service delivered will always equal the expectation. While certain amounts of automation are expected, there are increasing needs for human interaction, that will become even more valuable in creating the service experience.
NEED FOR FURTHER RESEARCH
This paper was meant to explore the relationship between service quality, sustainable competitive advantage and firm performance. While still incomplete in the review of literature, no substantive information has been discovered to falsify the model of the service profit chain. The relationships between the 7 constructs of the model should be verified and validated.
The majority of service quality literature is published in the field of marketing. Completely understanding the relationship that exists between the firm and the customer and potential customer this taxonomy is understood, however the delivery of service quality is better suited to operations research. Since many business schools are still under the impression that the civilized world is still focused on manufacturing, most operational literature is still geared toward products, manufacturing, and inventory control. Recently more journals focused on service management have appeared. This author recognizes the need to better review the existing body of knowledge on the subject of service management.
Finally, on sustainable competitive advantage. Studying the existing nature of competitive advantage within the hotel industry, suffice it to say it is not very innovative in the development of new ideas. Developing strategy is mainly focused on the competitive environment, and on marketing to achieve a greater share of the existing markets. Most competitive methods developed are quite tangible and easily replicated (heavenly bed, loyalty programs, employee training, and ecologically friendly image, i.e. throw your towel on the floor if you want it replaced). Creating an intangible competitive advantage would ensure a longer life cycle simple due to the competitive environment. By adding the complexity of service systems, human resource management systems, and service culture, the concept of service quality would be almost impossible to copy.
REFERENCES
Albrecht, K., & Zemke, R. (1985). Service America! : doing business in the new economy. Homewood, Ill.: Dow Jones-Irwin.
Anderson, E. W., Fornell, C., & Lehmann, D. R. (1994). Customer Satisfaction, Market Share, and Profitability: Findings from Sweden. Journal of Marketing, 58(3), 53-66.
Anderson, E. W., Fornell, C., & Mazvancheryl, S., K. . (2004). Customer Satisfaction and Shareholder Value. Journal of Marketing, 68(4), 172.
Barney, J. (1991). Firm Resources and Sustained Competitive Advantage. Journal of Management, 17(1), 99-99.
Bolton, R. N., & Drew, J. H. (1991). A Multistage Model of Customers' Assessments of Service Quality and Value. The Journal of Consumer Research, 17(4), 375-384.
Fitzsimmons, J. A., & Fitzsimmons, M. J. (2005). Service management : operations, strategy, and information technology (Fifth ed.). Boston: McGraw-Hill Education.
Fornell, C., Mithas, S., Morgeson, F., V. III, & Krishnan, M. S. (2006). Customer Satisfaction and Stock Prices: High Returns, Low Risk. Journal of Marketing, 70(1), 3.
Fornell, C., Mithas, S., & Morgeson, F. V. (2009). Commentary—The Economic and Statistical Significance of Stock Returns on Customer Satisfaction. Marketing Science, 28(5), 820-825. doi: 10.1287/mksc.1090.0505
George, W. R., Kelly, J. P., & Marshall, C. E. (1986). The Selling of Services: A Comprehensive Model. The Journal of Personal Selling & Sales Management, 6(2), 29.
Hart, C. W. (2007). Beating the Market with Customer Satisfaction. Harvard Business Review, 85(3), 30.
Hart, C. W. L., Heskett, J. L., & Sasser, W. E., Jr. (1990). The Profitable Art of Service Recovery. Harvard Business Review, 68(4), 148.
Heskett, J. L., Jones, T. O., Loveman, G. W., Sasser, Jr., & Schlesinger, L. A. (2008). Putting the Service-Profit Chain to Work. Harvard Business Review, 86(7/8), 118-129.
Heskett, J. L., Sasser Jr, W. E., & Schlesinger, L. A. (1997). The service profit chain: how leading companies link profit and growth to loyalty, satisfaction, and value. New York, NY The Free Press.
Lovelock, C. H. (1983). Classifying Services to Gain Strategic Marketing Insights. Journal of Marketing (pre-1986), 47(000003), 9.
Olsen, M. D., West, J. J., & Tse, E. C.-Y. (2008). Strategic Management in the Hospitality Industry (Vol. Third): Pearson Prentice Hall.
Parasuraman, A., Zeithaml, V. A., & Berry, L. L. (1985). A Conceptual Model of Service Quality and Its Implications for Future Research. Journal of Marketing, 49(4), 41-50.
Parasuraman, A., Zeithaml, V. A., & Berry, L. L. (1988). Servqual: A Multiple-Item Scale For Measuring Consumer Perc. Journal of Retailing, 64(1), 12.
Prahalad, C. K., & Ramaswamy, V. (2004). The future of competition co-creating unique value with customers. Boston, Mass: Harvard Business School Pub.
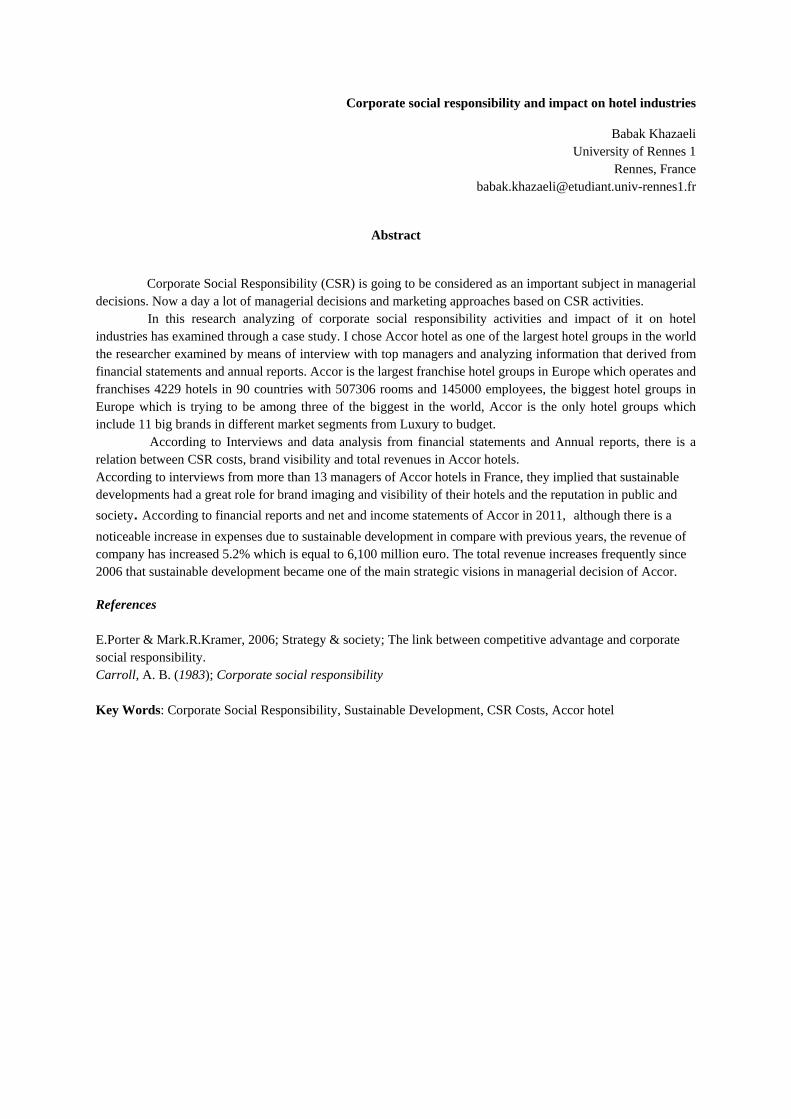
Corporate social responsibility and impact on hotel industries
Babak Khazaeli University of Rennes 1
Rennes, France [email protected]
Abstract
Corporate Social Responsibility (CSR) is going to be considered as an important subject in managerial
decisions. Now a day a lot of managerial decisions and marketing approaches based on CSR activities. In this research analyzing of corporate social responsibility activities and impact of it on hotel industries has examined through a case study. I chose Accor hotel as one of the largest hotel groups in the world the researcher examined by means of interview with top managers and analyzing information that derived from financial statements and annual reports. Accor is the largest franchise hotel groups in Europe which operates and franchises 4229 hotels in 90 countries with 507306 rooms and 145000 employees, the biggest hotel groups in Europe which is trying to be among three of the biggest in the world, Accor is the only hotel groups which include 11 big brands in different market segments from Luxury to budget.
According to Interviews and data analysis from financial statements and Annual reports, there is a relation between CSR costs, brand visibility and total revenues in Accor hotels. According to interviews from more than 13 managers of Accor hotels in France, they implied that sustainable developments had a great role for brand imaging and visibility of their hotels and the reputation in public and
society. According to financial reports and net and income statements of Accor in 2011, although there is a
noticeable increase in expenses due to sustainable development in compare with previous years, the revenue of company has increased 5.2% which is equal to 6,100 million euro. The total revenue increases frequently since 2006 that sustainable development became one of the main strategic visions in managerial decision of Accor. References E.Porter & Mark.R.Kramer, 2006; Strategy & society; The link between competitive advantage and corporate social responsibility. Carroll, A. B. (1983); Corporate social responsibility Key Words: Corporate Social Responsibility, Sustainable Development, CSR Costs, Accor hotel
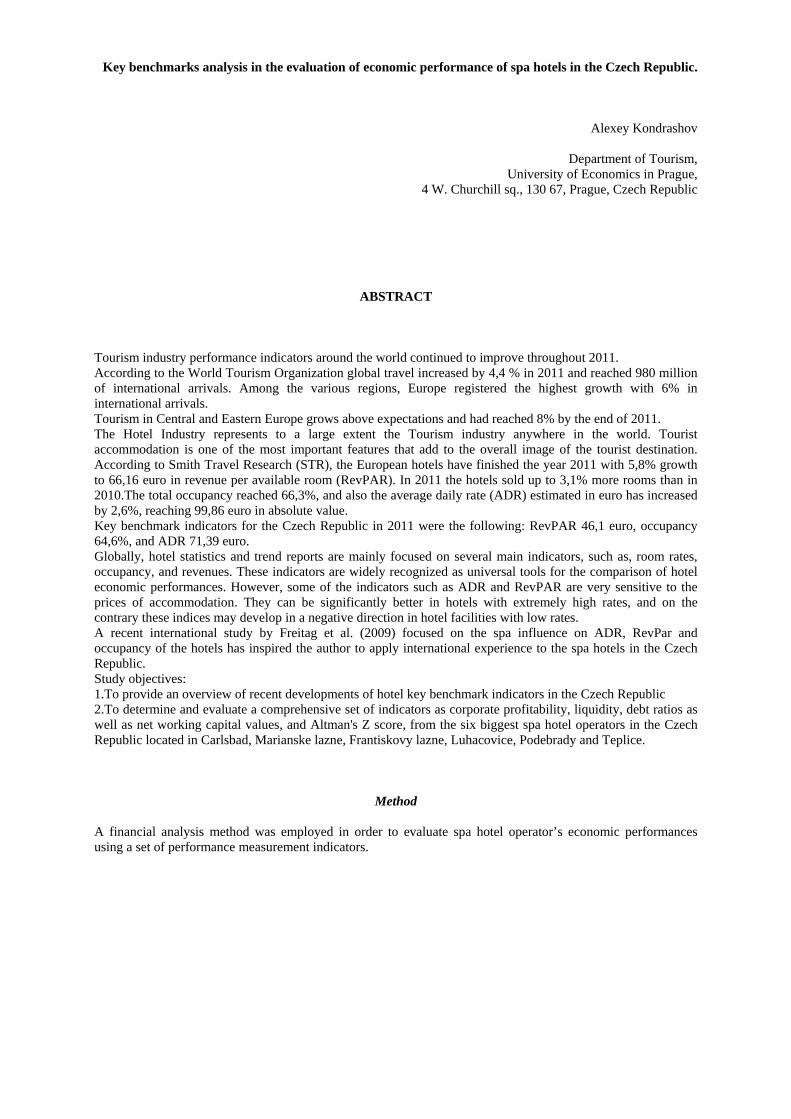
Key benchmarks analysis in the evaluation of economic performance of spa hotels in the Czech Republic.
Alexey Kondrashov
Department of Tourism, University of Economics in Prague,
4 W. Churchill sq., 130 67, Prague, Czech Republic
ABSTRACT
Tourism industry performance indicators around the world continued to improve throughout 2011. According to the World Tourism Organization global travel increased by 4,4 % in 2011 and reached 980 million of international arrivals. Among the various regions, Europe registered the highest growth with 6% in international arrivals. Tourism in Central and Eastern Europe grows above expectations and had reached 8% by the end of 2011. The Hotel Industry represents to a large extent the Tourism industry anywhere in the world. Tourist accommodation is one of the most important features that add to the overall image of the tourist destination. According to Smith Travel Research (STR), the European hotels have finished the year 2011 with 5,8% growth to 66,16 euro in revenue per available room (RevPAR). In 2011 the hotels sold up to 3,1% more rooms than in 2010.The total occupancy reached 66,3%, and also the average daily rate (ADR) estimated in euro has increased by 2,6%, reaching 99,86 euro in absolute value. Key benchmark indicators for the Czech Republic in 2011 were the following: RevPAR 46,1 euro, occupancy 64,6%, and ADR 71,39 euro. Globally, hotel statistics and trend reports are mainly focused on several main indicators, such as, room rates, occupancy, and revenues. These indicators are widely recognized as universal tools for the comparison of hotel economic performances. However, some of the indicators such as ADR and RevPAR are very sensitive to the prices of accommodation. They can be significantly better in hotels with extremely high rates, and on the contrary these indices may develop in a negative direction in hotel facilities with low rates. A recent international study by Freitag et al. (2009) focused on the spa influence on ADR, RevPar and occupancy of the hotels has inspired the author to apply international experience to the spa hotels in the Czech Republic. Study objectives: 1.To provide an overview of recent developments of hotel key benchmark indicators in the Czech Republic 2.To determine and evaluate a comprehensive set of indicators as corporate profitability, liquidity, debt ratios as well as net working capital values, and Altman's Z score, from the six biggest spa hotel operators in the Czech Republic located in Carlsbad, Marianske lazne, Frantiskovy lazne, Luhacovice, Podebrady and Teplice.
Method
A financial analysis method was employed in order to evaluate spa hotel operator’s economic performances using a set of performance measurement indicators.
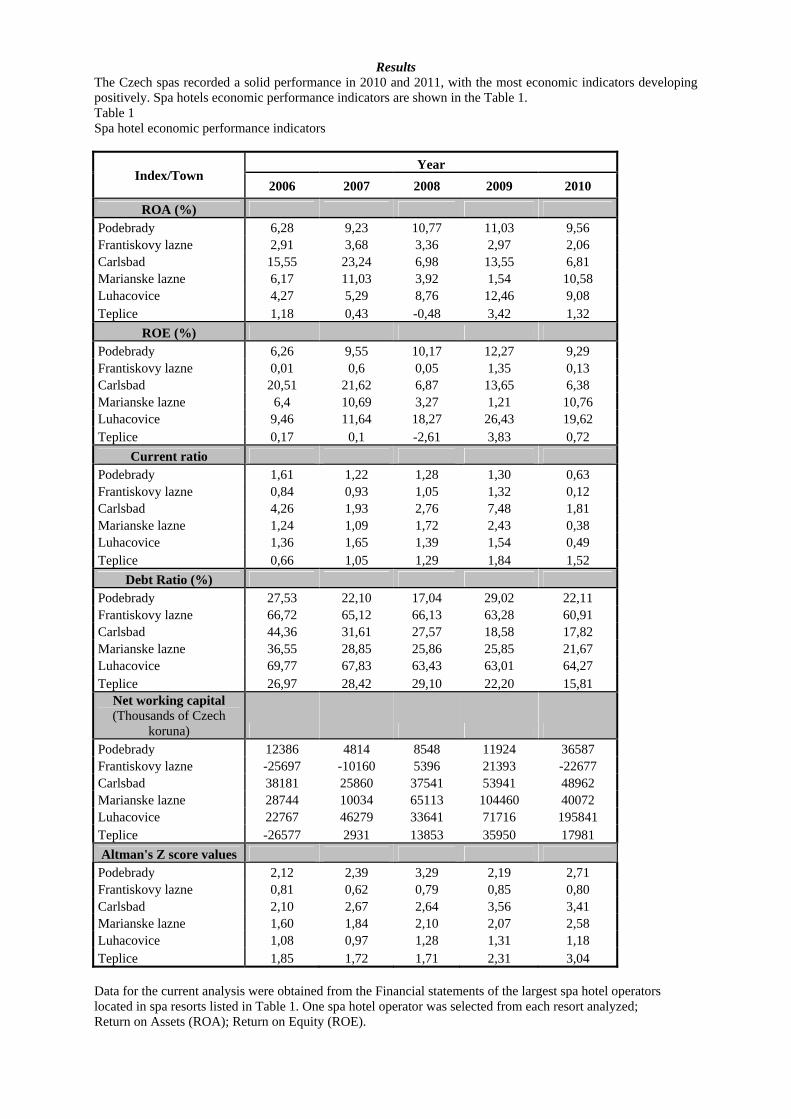
Results The Czech spas recorded a solid performance in 2010 and 2011, with the most economic indicators developing positively. Spa hotels economic performance indicators are shown in the Table 1. Table 1 Spa hotel economic performance indicators
Index/Town Year
2006 2007 2008 2009 2010
ROA (%) Podebrady 6,28 9,23 10,77 11,03 9,56 Frantiskovy lazne 2,91 3,68 3,36 2,97 2,06 Carlsbad 15,55 23,24 6,98 13,55 6,81 Marianske lazne 6,17 11,03 3,92 1,54 10,58 Luhacovice 4,27 5,29 8,76 12,46 9,08 Teplice 1,18 0,43 -0,48 3,42 1,32
ROE (%) Podebrady 6,26 9,55 10,17 12,27 9,29 Frantiskovy lazne 0,01 0,6 0,05 1,35 0,13 Carlsbad 20,51 21,62 6,87 13,65 6,38 Marianske lazne 6,4 10,69 3,27 1,21 10,76 Luhacovice 9,46 11,64 18,27 26,43 19,62 Teplice 0,17 0,1 -2,61 3,83 0,72
Current ratio Podebrady 1,61 1,22 1,28 1,30 0,63 Frantiskovy lazne 0,84 0,93 1,05 1,32 0,12 Carlsbad 4,26 1,93 2,76 7,48 1,81 Marianske lazne 1,24 1,09 1,72 2,43 0,38 Luhacovice 1,36 1,65 1,39 1,54 0,49 Teplice 0,66 1,05 1,29 1,84 1,52
Debt Ratio (%) Podebrady 27,53 22,10 17,04 29,02 22,11 Frantiskovy lazne 66,72 65,12 66,13 63,28 60,91 Carlsbad 44,36 31,61 27,57 18,58 17,82 Marianske lazne 36,55 28,85 25,86 25,85 21,67 Luhacovice 69,77 67,83 63,43 63,01 64,27 Teplice 26,97 28,42 29,10 22,20 15,81
Net working capital (Thousands of Czech
koruna) Podebrady 12386 4814 8548 11924 36587 Frantiskovy lazne -25697 -10160 5396 21393 -22677 Carlsbad 38181 25860 37541 53941 48962 Marianske lazne 28744 10034 65113 104460 40072 Luhacovice 22767 46279 33641 71716 195841 Teplice -26577 2931 13853 35950 17981
Altman's Z score values Podebrady 2,12 2,39 3,29 2,19 2,71 Frantiskovy lazne 0,81 0,62 0,79 0,85 0,80 Carlsbad 2,10 2,67 2,64 3,56 3,41 Marianske lazne 1,60 1,84 2,10 2,07 2,58 Luhacovice 1,08 0,97 1,28 1,31 1,18 Teplice 1,85 1,72 1,71 2,31 3,04
Data for the current analysis were obtained from the Financial statements of the largest spa hotel operators located in spa resorts listed in Table 1. One spa hotel operator was selected from each resort analyzed; Return on Assets (ROA); Return on Equity (ROE).
The use of financial analysis indices allows one to analyze the hotel key benchmark indicators (RevPAR, ADR, occupancy) impact on company profitability developments and reveals possible relationships. For the first time, a complex approach to the economic performance of spa hotels in the Czech Republic was employed. This allows one to create a reliable picture of the company’s economic situation. Key words: spa hotels, RevPAR, ADR, profitability ratios, Altman’s Z score, occupancy, financial analysis References UNWTO World Tourism Barometer Vol. 10, March 2012 URL: http://unwto.org/en STR Global: Europe results for 2011 Freitag, J., J. Grimes, D. Hodari, T. Jaeger, M. Tabacchi, and L. Zhou. 2009. Spa influence on ADR, RevPAR, and occupancy. Global Spa Summit, Interlaken, Switzerland. Agnes DeFranco & Thomas Lattin. Hospitality financial management. John Wiley & Sons, ISBN 9780471692164, 2007. STR Global Country Report: the Czech Republic
Shanghai Residents’ Perceived Social and Economic Impacts of the World Expo 2010: Insights from a Longitudinal Study
Xiang (Robert) Li*
School of Hotel, Restaurant, and Tourism Management University of South Carolina
Columbia, South Carolina, 29208 [email protected]
Cathy H.C. Hsu
School of Hotel and Tourism Management The Hong Kong Polytechnic University
TST E., Kowloon, Hong Kong [email protected]
and
Laura Lawton
Department of Tourism, Leisure, Hotel and Sport Management, Griffith Business School
Griffith University, Gold Coast Campus QLD 4222, Australia
Abstract
This study, by using a 3-wave survey design, tracked local residents’ attitude toward the World Expo 2010. The results showed that Shanghai residents’ attitude did fluctuate substantially during the 3 stages they perceived the social and economic impacts of Expo quite positively at the beginning; these favorable ratings declined significantly at the end of the event, but then resumed to the initial level (or close to it) after six months. Further, across the board, they considered the Expo more beneficial to the community than to their own life.
Key Words: resident attitude; World Expo; mega event; longitudinal study
DESTINATION MANAGEMENT ORGANIZATIONS - QUEST FOR PRESENT AND FUTURE SUSTAINABLE DEVELOPMENT, A CROSS-COUNTRY ANALYSIS Author(s): Katarzyna Klimek, Phd University of Applied Sciences of Western Switzerland Address: University of Applied Sciences, Institute of Tourism, Technopôle 3, 3965 Sierre, Switzerland E-mail: [email protected]
Abstract
Tourism is considered as a driver of economic growth and one of the leading service industries in many countries. Tourism activities in the Alps, for example, generate today some EUR 50 billion in annual turnover and provide 10-12% of jobs (BAK Basel, 2011). Furthermore, competition between tourism destinations on national, regional and local levels continues to intensify due to the pressure of globalization. Hence, Destination Management Organizations (DMOs) have to constantly reevaluate and re-engineer existing tourism offers and to reposition themselves in a highly competitive tourism market. At the same time tourism development pressures destination areas through increased resource consumption, waste generation and land fragmentation while policy measures to promote more sustainable tourism are progressing only slowly due to local resistance. Therefore, destinations are one of the most difficult entities to manage because of diverse, often conflicting interests of different stakeholder groups (Sutterr&Leisen, 1999; Carmin, et. al 2003). Consequently, finding the right balance between the economic development of tourism destinations, the conservation of their resources and the well-being of the local population has become a challenging task for many DMOs (Notarstefano, 2008).
The aim of this paper is to present the results of exploratory research conducted in seven European countries among 72 managers of Destination Management Organizations (DMOs) in 2011. The research objective was to evaluate the DMOs’ efforts and their role in the set-up and implementation of sustainable tourism principles in the management of tourist destinations. The research was based on the “bottom-up” approach referring to the idea of building “grounded theory” from Glaser/Strauss (1998).
Key words: destination management organization (DMO), sustainable tourism development and challenges, long-term competitiveness, new demand of XXI century.
Introduction
Competition among tourism destinations worldwide continues to intensify. Globalization with its associated tendencies towards integration of services and concentration of capital has put pressures on tourism destinations to better position their tourist offers in a highly competitive market either by cost leadership or product differentiation (Baker, Cameron, 2008; UNWTO, 2009;2010). In response to these developments integrated destination management and sustainable use of tourism resources has become a subject of growing importance especially for many mature European tourist destinations.
Furthermore, many tourist destinations are facing environmental problems (e.g. global climate change, lack of snow, natural hazards ) which on the one hand are partially caused by excessive tourism development (i.e. pollution, excessive soil, energy and water consumption) and on the other hand strongly influence tourist flow (Bigano, Hamilton &Tol, 2006; Burki, 2003; Hall 2006).
Moreover, tourists are becoming more demanding, price and quality oriented customers, seeking new experiences especially in unpolluted and “green” destinations (Brace, 2007; Holden, 2008; Holleran, 2008).
In this context DMOs can be considered “as a mirror of the organizational aspects of tourism destinations” which should constantly re-engineer and adapt their tourist offer to changing market conditions (Beritelli, Reinhold, 2009: 137).
The aim of this paper is to present the results of exploratory research done in 2011 in 6 Alpine countries (i.e. CH, A, D, I, F, SLO) and in Poland in order to evaluate and to compare the efforts of 72 DMOs. The research objective was to evaluate DMOs’ efforts concerning sustainable management of tourism destination by means of a quantitative and qualitative analysis.
Sustainable development of tourism destinations - challenges for Destination Management Organizations (DMOs) (Literature review and research questions)
As most tourists activities take place in destinations, these entities constitute the most important element of the tourism system and compose the essential unity of tourism research (Bieger, 1998; Buhalis, 2000; Pike 2004; Wang & Pizam, 2011). Traditionally, destinations should be considered as an amalgam of direct and indirect tourism amenities (e.g. accommodation, catering, public & private transport and roads, visitor information, recreation facilities, etc.) and a wide range of natural and cultural tourist attractions (e.g. landscape, monuments, atmosphere) offered to a tourist during his/her stay in a chosen place (Davidson & Maitland, 1997; Hall, 2008; Leiper 1995; UNWTO 2007). However, for economic and marketing sciences, a tourist destination is more than a distinctive, geographical area (Bieger, Beritelli & Leasser 2009; Bornhorst, Ritchie & Sheehan, 2010; Magas, 2010).
Very often tourists perceive a destination as a whole so this area is often not only considered as a “tourist place” but becomes a “tourist product” . Hence, a tourist destination can be defined as “a collection of experiences gained by travelers” and should be perceived as a system of products and services which suppliers are ready to deliver and tourists are willing to consume (Gunn, 1972: 11; Keller, 2000; Manete &Minghetti, 2006).
Development of tourism destinations is associated with constant growth of tourism demand in global tourism markets. By the year 2020 the number of international tourist arrivals is expected to exceed 1.5 billion (which means an average annual increase of 4.2% in the number of tourists) with related revenues of 1 trillion dollars US (Dwyer, et al., 2008; UNWTO 2011).
Since resources are finite, the competitiveness especially of many mature and nature-based destinations, e.g., the Alps is becoming increasingly connected to the maintenance of their natural assets and sustainability (Abegg, et al. 2007; Agrawala, 2007; Bramwell et al. 1996; Bartaletti, 2002; Bourdeau, 2006; CIPRA, 2011; Hardy, & Beeton 2001; Johnsen, Umbach-Daniel, & Schnell, 2003; Ritchie 2003). With regard to the environment, it could seriously condition and even limit the long-term growth of travel. Thus, environmental and sustainable technologies and enduring management approaches are becoming increasingly preferred, not only to reduce the negative impacts of tourism development, e.g., carbon emissions, air and water pollution, waste production, deforestation, agricultural abandonment, but also as strategic investments for resource conservation (Amadeus 2008; Conseil de l'Union Européenne, 1996; Gössling, 2002; Roussat, Dujeta, & Méhua, 2009).
Healey and Ilbery (1990) classified natural tourism resources into four main groups: “ubiquities” which exist everywhere; “commonalities” which are similar and available in many tourist areas; “rarities” which occur in very few destinations and “uniquities” which arise only in one place. As rare and unique resources are the key assets to destinations’ attractiveness, DMOs should harmonize development of destinations with coherent use of these assets especially to differentiate and to attract visitors to the place (Buhalis, 2000; Klimek, et al. 2012; Lui, 2003, Matos-Wasem, 2005).
The DMO concept has been widely viewed and described in the literature. It refers to a coalition of many organizations and interests working together towards a mutual goals (Bieger, 1997, Elbe, Hallen, &Axelsson, 2008; Sheehan, Ritchie &Hudson, 2007; UNWTO, 2007;). The main role of a DMO consists in fulfilling marketing, promotional and sales tasks, as well as coordinating long-term destination planning and management since the consumer perceives and buys a destination as one integrated product (Bieger & Müller, 1998;Bieger, Beritelli & Leasser 2009; Pearce, 1992; van Harssel, 2005). However, from the point of view of sustainability, the role of a DMO is more complex. It requires finding the right balance between competing and challenging environmental, social and economic goals such as:
– preserving natural resources and minimizing negative impact on tourism to conserve a destination’s richness for future generations, (Buhalis, 2000; Bonardi, Ludovici, & Furlani 2006; Fennel, 2008; Honey, 1999;)
– increasing destination appeal and reputation as sustainable and “environment-friendly”, (Crounch 2007; Osmankovic, Kenjic & Zranic, 2010; Wight, 1998; Wray, et al. 2010).
– maximizing tourism’s economic contributions to local populations (Crouch, Ritchie, 1999; Ritchie, 2003; Simpson, 2008; Tosun, Timothy, 2003)
– fulfilling the needs of visitors and shifting their interest to products focused on sustainable resource consumption (Budeanu, 2007; Leire & Thidell, 2004; Lohmann, 2004; Miller, 2003; Paul, et. al. 2002; Sharpley 2006).
– increasing the well-being of local populations and public and private stakeholders (Aas, Ladkin, & Fletcher, 2005; Bornhorst, et al. 2010;) As stated by Briassoulis (2002); Byard, Cardenas, & Dregalla (2009) and other authors throughout the
literature, stakeholders and local populations must be involved in any successful sustainable tourism development plan to handle multiple perceived issues of destinations and must be reflective of community interests and opinions. Byard (2007) distinguished four main groups which should be involved in sustainable destination development. They are: the present host community, i.e., residents, entrepreneurs, local authorities, the future host community, present and future visitors. This distinction of different interest groups is related to the definition of sustainable tourism development which refers to fulfilling the needs of present tourists and host regions while protecting and enhancing opportunities for future generations (UNWTO, WTTC, & Earth Council 1996).
Otherwise, in many destinations the decision-making process is top-down, i.e. “leaders” decide, which often may result in communication breakdown and lead to conflicts (Ioannides, 1995; Beriteli, Leasser, 2011). On the other hand, DMO financial resources are highly dependent on various groups of public and private stakeholders (Beritelli, 2011). This fact can often cause pressure and lobbying by different groups of interest that influence DMOs’ functioning1. Thus DMOs, should stay independent and play an important role in leadership and advocacy for the whole destination (Ritchie, 1993; Byrd, Gustke 2004).
Wray, et al. (2010) enumerated the most important features of successful and sustainable destination management. Effective DMO should have:
- long-term vision of destination development - clear designation of responsibilities and appropriate operational structures - transparent and responsible decision-making engaging local groups of interests
Another challenging task for contemporary DMOs concern the changing nature of tourism consumers. In fact, an increasing number of “21st century visitors” (especially coming from well developed countries) are showing their willingness to go back to nature, and eco- and nature-based holidays are becoming trendy (Page, Dowling, 2002; Forster, et al. 2011). This shift from mass-tourism based on the formula of the 3 “S’s” (Sea,
1 The extreme example of bad cooperation between public and private stakeholders which led to the dissolution of a DMO was the case of
the regional DMO in Val d’Anniviers (Switzerland), which broke down in 2010 and was divided into several small local entities.
Sand, Sun) to sustainable and responsible tourism based on the 3 E’s (Entertainment, Excitement, and Education) is linked with the fashionable “green” life style and growing awareness of ecological problems (Dwyer, et al. 2008; Kester, 1999; UNTWO, 2002). Moreover, according to Chitra (2007) the majority of green consumers are willing to pay more for green products and send out a positive signal to an eco-friendly marketing mix.
A good example of this demand change, is the emergence in Alpine regions of a new form of tourism called “4-L tourism” (Landscape, Leisure, Learning and Limit) (Franch, et al. 2008). “4-L tourists” can be characterized by their high level of respect for natural attractions, their recognition of the importance of the local culture and traditions, their interest in learning about the unique features of the destination and their awareness of the limits of resources.
Otherwise, more and more visitors are becoming experienced and empowered consumers capable of
comparing the value of the tourist offer via easy internet access (Laesser, et. al 2007) . Due to the abundance of information, tourists are better informed, but also more individualistic and more unpredictable (Gretzel, Fesenmaier, & O’Larey, 2006). Lack of loyalty, increasing demand for individualized holidays (often in the form of dynamic packaging) and having new experiences seem to be the most important features of contemporary tourist demand (Ritchie& Hudson, 2009).
It should be added that internet is present in each stage of tourist consumption. In the phase of planning
it serves to find “the best deal”, during a holiday to stay connected and in the phase of post-consumption to share travel experiences e.g. through social media, websites, weblogs and storytelling (Lohmann, 2004; Mossberg, et al. 2010). The need to share experiences has become so strong, that modern travelers have become important players in creating a virtual network of recommendations for tourism destinations (Carter, 2007). As a result, DMOs as purveyors of information about destinations are increasingly required to reengineer their activities around the use of different web solutions. (Buhalis, Zoge, 2007; Clarke, et al. 2009)
Taking into consideration all the challenging tasks stated in the literature which contemporary DMOs are facing, the aim of the empirical research was focused on finding answers to the following questions:
1. What kind of stakeholders are involved in sustainable tourism development in the six alpine countries and in Poland?
2. Are DMOs a positive vectors for the implementation of marketing policy and sustainable development strategy?
3. Does sustainability have a real impact on a destination’s performance? 4. What are and will be the most important success factors for Alpine DMOs in comparison with Polish
tourism organizations until 2020? Are they linked with sustainable development?
Methodology and data
This research uses the “bottom-up” approach based on the idea of building “grounded theory” from Glaser (1998). This method offers clear advantages in enabling the researcher to build theory from the actions, words and behavior of the people under study.
The literature review and discussions with practitioners from tourism destinations in Switzerland and in
Poland have been the basis for the development of the overall study design and more specifically the research instruments which have been created, tested and validated.
The research methodology of the study was based mostly on quantitative research (using questionnaire surveys) in six countries situated in the Alpine Arc (Switzerland, Germany, Austria, France, Italy, Slovenia) and in Poland. The research was carried out between 15 May and 15 September 2011.
The sample selection was intentional. Initially a list of 272 national, regional and local DMOs and destination managers in the Alpine Arc and in Poland was drawn up. Afterwards, an on-line questionnaire entitled “The role of DMOs in (sustainable) management of tourism destinations” was created. The
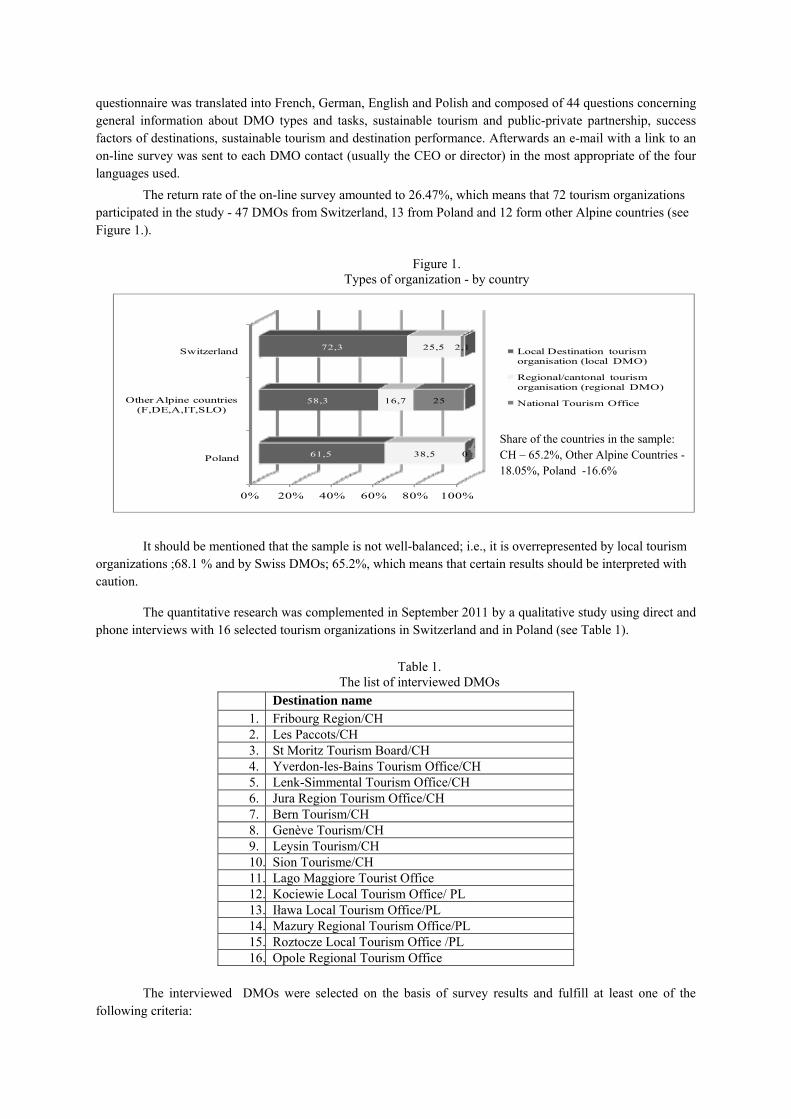
questionnaire was translated into French, German, English and Polish and composed of 44 questions concerning general information about DMO types and tasks, sustainable tourism and public-private partnership, success factors of destinations, sustainable tourism and destination performance. Afterwards an e-mail with a link to an on-line survey was sent to each DMO contact (usually the CEO or director) in the most appropriate of the four languages used.
The return rate of the on-line survey amounted to 26.47%, which means that 72 tourism organizations participated in the study - 47 DMOs from Switzerland, 13 from Poland and 12 form other Alpine countries (see Figure 1.).
Figure 1. Types of organization - by country
0% 20% 40% 60% 80% 100%
Poland
Other Alpine countries (F,DE,A,IT,SLO)
Switzerland
61,5
58,3
72,3
38,5
16,7
25,5
0
25
2,1 Local Destination tourism organisation (local DMO)
Regional/cantonal tourism organisation (regional DMO)
National Tourism Office
It should be mentioned that the sample is not well-balanced; i.e., it is overrepresented by local tourism organizations ;68.1 % and by Swiss DMOs; 65.2%, which means that certain results should be interpreted with caution.
The quantitative research was complemented in September 2011 by a qualitative study using direct and phone interviews with 16 selected tourism organizations in Switzerland and in Poland (see Table 1).
Table 1.
The list of interviewed DMOs Destination name
1. Fribourg Region/CH 2. Les Paccots/CH 3. St Moritz Tourism Board/CH 4. Yverdon-les-Bains Tourism Office/CH 5. Lenk-Simmental Tourism Office/CH 6. Jura Region Tourism Office/CH 7. Bern Tourism/CH 8. Genève Tourism/CH 9. Leysin Tourism/CH 10. Sion Tourisme/CH 11. Lago Maggiore Tourist Office 12. Kociewie Local Tourism Office/ PL 13. Iława Local Tourism Office/PL 14. Mazury Regional Tourism Office/PL 15. Roztocze Local Tourism Office /PL 16. Opole Regional Tourism Office
The interviewed DMOs were selected on the basis of survey results and fulfill at least one of the following criteria:
Share of the countries in the sample: CH – 65.2%, Other Alpine Countries - 18.05%, Poland -16.6%
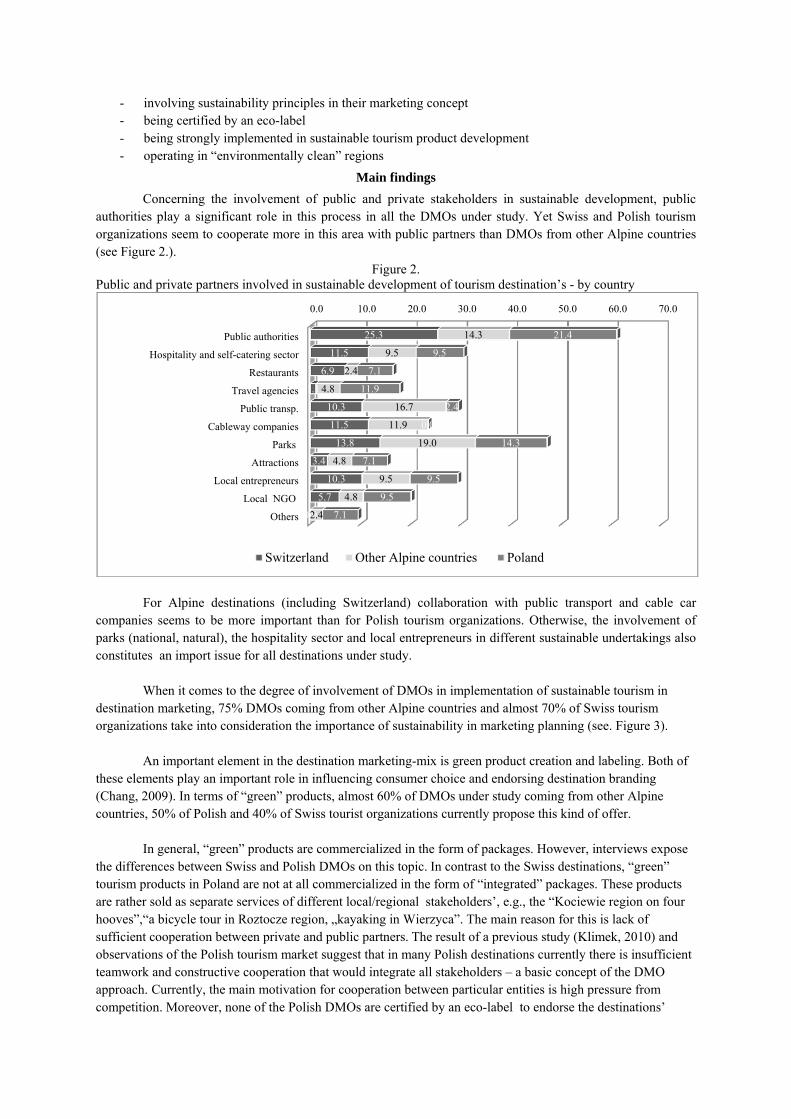
- involving sustainability principles in their marketing concept - being certified by an eco-label - being strongly implemented in sustainable tourism product development - operating in “environmentally clean” regions
Main findings
Concerning the involvement of public and private stakeholders in sustainable development, public authorities play a significant role in this process in all the DMOs under study. Yet Swiss and Polish tourism organizations seem to cooperate more in this area with public partners than DMOs from other Alpine countries (see Figure 2.).
Figure 2. Public and private partners involved in sustainable development of tourism destination’s - by country
For Alpine destinations (including Switzerland) collaboration with public transport and cable car
companies seems to be more important than for Polish tourism organizations. Otherwise, the involvement of parks (national, natural), the hospitality sector and local entrepreneurs in different sustainable undertakings also constitutes an import issue for all destinations under study.
When it comes to the degree of involvement of DMOs in implementation of sustainable tourism in
destination marketing, 75% DMOs coming from other Alpine countries and almost 70% of Swiss tourism organizations take into consideration the importance of sustainability in marketing planning (see. Figure 3).
An important element in the destination marketing-mix is green product creation and labeling. Both of
these elements play an important role in influencing consumer choice and endorsing destination branding (Chang, 2009). In terms of “green” products, almost 60% of DMOs under study coming from other Alpine countries, 50% of Polish and 40% of Swiss tourist organizations currently propose this kind of offer.
In general, “green” products are commercialized in the form of packages. However, interviews expose
the differences between Swiss and Polish DMOs on this topic. In contrast to the Swiss destinations, “green” tourism products in Poland are not at all commercialized in the form of “integrated” packages. These products are rather sold as separate services of different local/regional stakeholders’, e.g., the “Kociewie region on four hooves”,“a bicycle tour in Roztocze region, „kayaking in Wierzyca”. The main reason for this is lack of sufficient cooperation between private and public partners. The result of a previous study (Klimek, 2010) and observations of the Polish tourism market suggest that in many Polish destinations currently there is insufficient teamwork and constructive cooperation that would integrate all stakeholders – a basic concept of the DMO approach. Currently, the main motivation for cooperation between particular entities is high pressure from competition. Moreover, none of the Polish DMOs are certified by an eco-label to endorse the destinations’
0.0 10.0 20.0 30.0 40.0 50.0 60.0 70.0
Public authorities
Hospitality and self-catering sector
Restaurants
Travel agencies
Public transp.
Cableway companies
Parks
Attractions
Local entrepreneurs
Local NGO
Others
25.3
11.5
6.9
1.1
10.3
11.5
13.8
3.4
10.3
5.7
0.0
14.3
9.5
2.4
4.8
16.7
11.9
19.0
4.8
9.5
4.8
2.4
21.4
9.5
7.1
11.9
2.4
0.0
14.3
7.1
9.5
9.5
7.1
Switzerland Other Alpine countries Poland
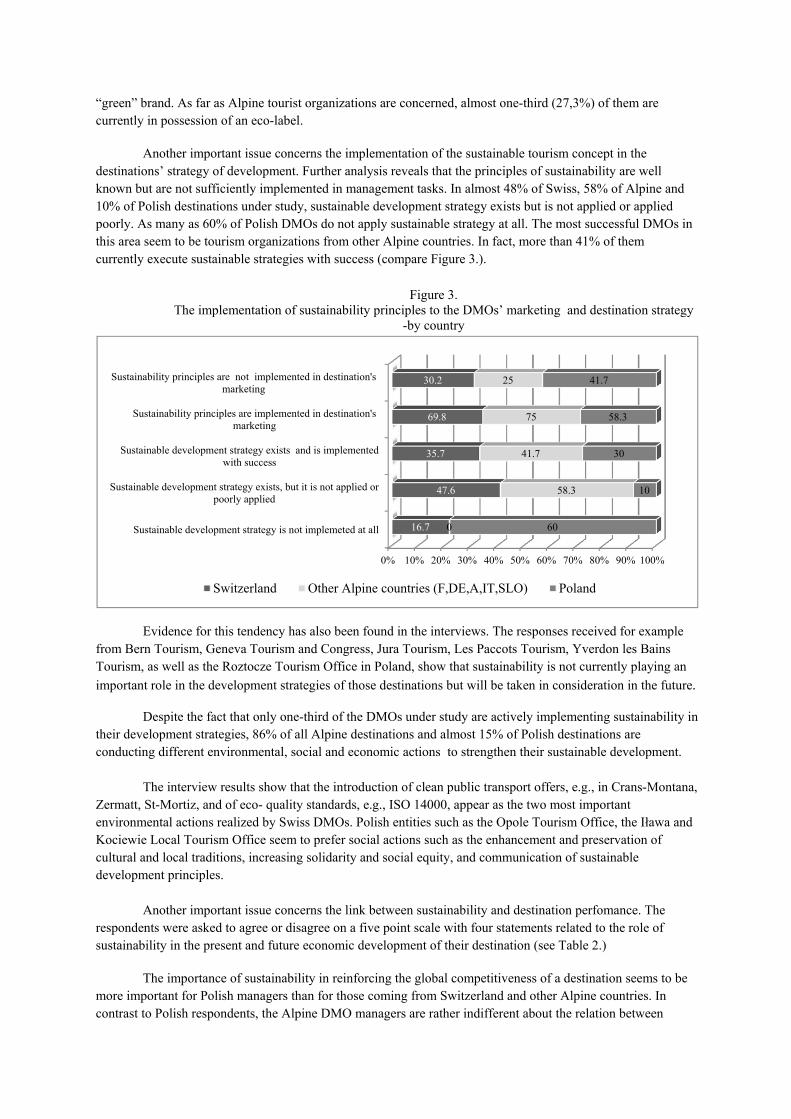
“green” brand. As far as Alpine tourist organizations are concerned, almost one-third (27,3%) of them are currently in possession of an eco-label.
Another important issue concerns the implementation of the sustainable tourism concept in the
destinations’ strategy of development. Further analysis reveals that the principles of sustainability are well known but are not sufficiently implemented in management tasks. In almost 48% of Swiss, 58% of Alpine and 10% of Polish destinations under study, sustainable development strategy exists but is not applied or applied poorly. As many as 60% of Polish DMOs do not apply sustainable strategy at all. The most successful DMOs in this area seem to be tourism organizations from other Alpine countries. In fact, more than 41% of them currently execute sustainable strategies with success (compare Figure 3.).
Figure 3.
The implementation of sustainability principles to the DMOs’ marketing and destination strategy -by country
Evidence for this tendency has also been found in the interviews. The responses received for example from Bern Tourism, Geneva Tourism and Congress, Jura Tourism, Les Paccots Tourism, Yverdon les Bains Tourism, as well as the Roztocze Tourism Office in Poland, show that sustainability is not currently playing an
important role in the development strategies of those destinations but will be taken in consideration in the future.
Despite the fact that only one-third of the DMOs under study are actively implementing sustainability in their development strategies, 86% of all Alpine destinations and almost 15% of Polish destinations are conducting different environmental, social and economic actions
to strengthen their sustainable development.
The interview results show that the introduction of clean public transport offers, e.g., in Crans-Montana,
Zermatt, St-Mortiz, and of eco- quality standards, e.g., ISO 14000, appear as the two most important environmental actions realized by Swiss DMOs. Polish entities such as the Opole Tourism Office, the Iława and Kociewie Local Tourism Office seem to prefer social actions such as the enhancement and preservation of cultural and local traditions, increasing solidarity and social equity, and communication of sustainable development principles.
Another important issue concerns the link between sustainability and destination perfomance. The
respondents were asked to agree or disagree on a five point scale with four statements related to the role of sustainability in the present and future economic development of their destination (see Table 2.)
The importance of sustainability in reinforcing the global competitiveness of a destination seems to be
more important for Polish managers than for those coming from Switzerland and other Alpine countries. In contrast to Polish respondents, the Alpine DMO managers are rather indifferent about the relation between
0% 10% 20% 30% 40% 50% 60% 70% 80% 90% 100%
Sustainable development strategy is not implemeted at all
Sustainable development strategy exists, but it is not applied orpoorly applied
Sustainable development strategy exists and is implementedwith success
Sustainability principles are implemented in destination'smarketing
Sustainability principles are not implemented in destination'smarketing
16.7
47.6
35.7
69.8
30.2
0
58.3
41.7
75
25
60
10
30
58.3
41.7
Switzerland Other Alpine countries (F,DE,A,IT,SLO) Poland
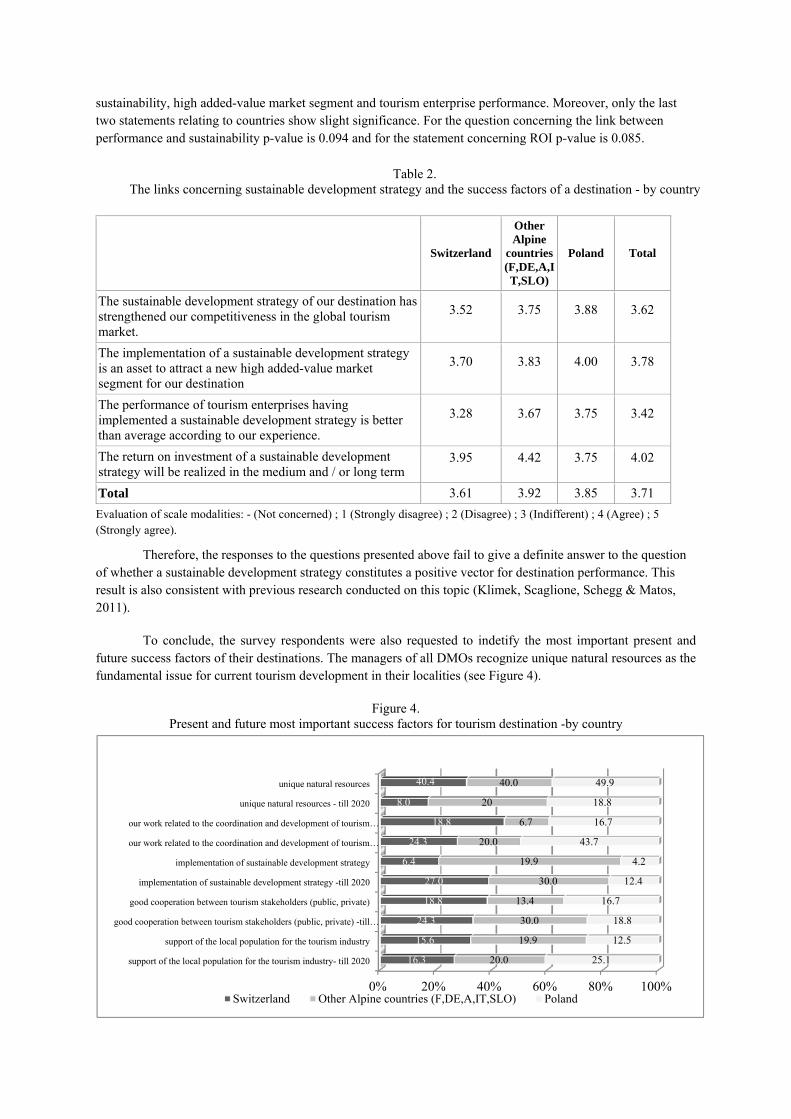
sustainability, high added-value market segment and tourism enterprise performance. Moreover, only the last two statements relating to countries show slight significance. For the question concerning the link between performance and sustainability p-value is 0.094 and for the statement concerning ROI p-value is 0.085.
Table 2. The links concerning sustainable development strategy and the success factors of a destination - by country
Switzerland
Other Alpine
countries (F,DE,A,IT,SLO)
Poland Total
The sustainable development strategy of our destination has strengthened our competitiveness in the global tourism market.
3.52 3.75 3.88 3.62
The implementation of a sustainable development strategy is an asset to attract a new high added-value market segment for our destination
3.70 3.83 4.00 3.78
The performance of tourism enterprises having implemented a sustainable development strategy is better than average according to our experience.
3.28 3.67 3.75 3.42
The return on investment of a sustainable development strategy will be realized in the medium and / or long term
3.95 4.42 3.75 4.02
Total 3.61 3.92 3.85 3.71
Evaluation of scale modalities: - (Not concerned) ; 1 (Strongly disagree) ; 2 (Disagree) ; 3 (Indifferent) ; 4 (Agree) ; 5 (Strongly agree).
Therefore, the responses to the questions presented above fail to give a definite answer to the question of whether a sustainable development strategy constitutes a positive vector for destination performance. This result is also consistent with previous research conducted on this topic (Klimek, Scaglione, Schegg & Matos, 2011).
To conclude, the survey respondents were also requested to indetify the most important present and
future success factors of their destinations. The managers of all DMOs recognize unique natural resources as the fundamental issue for current tourism development in their localities (see Figure 4).
Figure 4.
Present and future most important success factors for tourism destination -by country
0% 20% 40% 60% 80% 100%
support of the local population for the tourism industry- till 2020
support of the local population for the tourism industry
good cooperation between tourism stakeholders (public, private) -till…
good cooperation between tourism stakeholders (public, private)
implementation of sustainable development strategy -till 2020
implementation of sustainable development strategy
our work related to the coordination and development of tourism…
our work related to the coordination and development of tourism…
unique natural resources - till 2020
unique natural resources
16.3
15.6
24.3
18.8
27.0
6.4
24.3
18.8
8.0
40.4
20.0
19.9
30.0
13.4
30.0
19.9
20.0
6.7
20
40.0
25.1
12.5
18.8
16.7
12.4
4.2
43.7
16.7
18.8
49.9
Switzerland Other Alpine countries (F,DE,A,IT,SLO) Poland
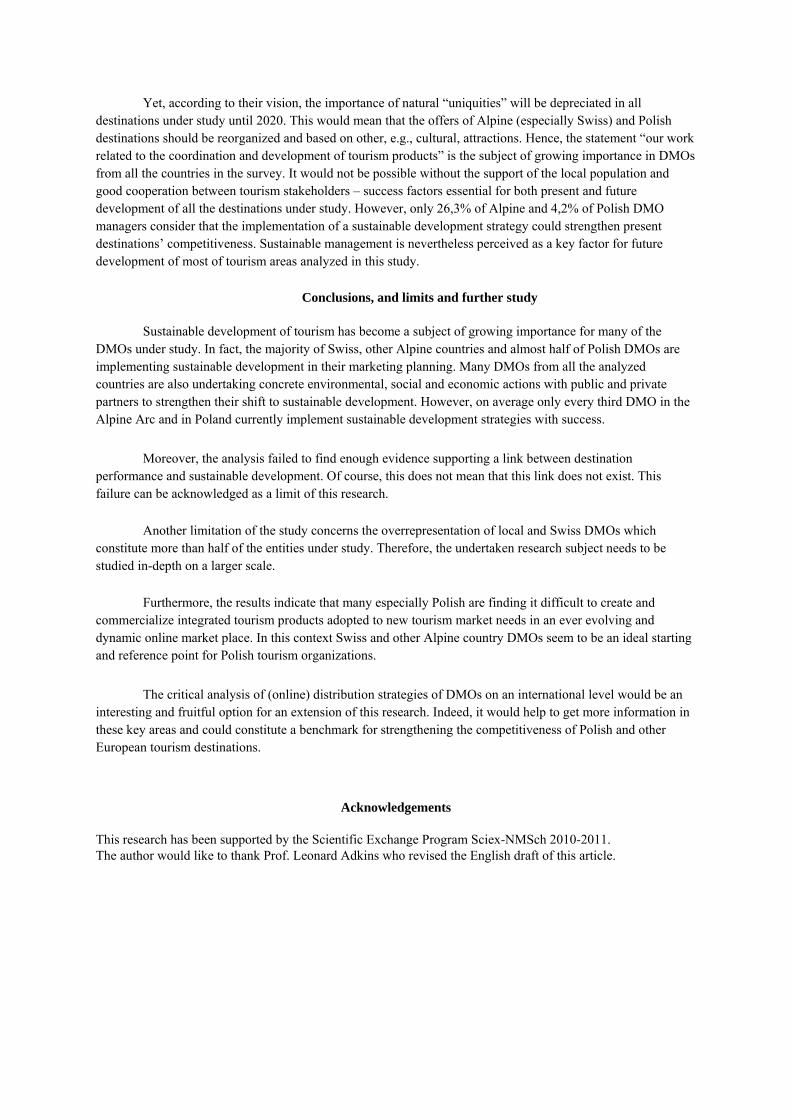
Yet, according to their vision, the importance of natural “uniquities” will be depreciated in all destinations under study until 2020. This would mean that the offers of Alpine (especially Swiss) and Polish destinations should be reorganized and based on other, e.g., cultural, attractions. Hence, the statement “our work related to the coordination and development of tourism products” is the subject of growing importance in DMOs from all the countries in the survey. It would not be possible without the support of the local population and good cooperation between tourism stakeholders – success factors essential for both present and future development of all the destinations under study. However, only 26,3% of Alpine and 4,2% of Polish DMO managers consider that the implementation of a sustainable development strategy could strengthen present destinations’ competitiveness. Sustainable management is nevertheless perceived as a key factor for future development of most of tourism areas analyzed in this study.
Conclusions, and limits and further study
Sustainable development of tourism has become a subject of growing importance for many of the DMOs under study. In fact, the majority of Swiss, other Alpine countries and almost half of Polish DMOs are implementing sustainable development in their marketing planning. Many DMOs from all the analyzed countries are also undertaking concrete environmental, social and economic actions with public and private partners to strengthen their shift to sustainable development. However, on average only every third DMO in the Alpine Arc and in Poland currently implement sustainable development strategies with success.
Moreover, the analysis failed to find enough evidence supporting a link between destination
performance and sustainable development. Of course, this does not mean that this link does not exist. This failure can be acknowledged as a limit of this research.
Another limitation of the study concerns the overrepresentation of local and Swiss DMOs which
constitute more than half of the entities under study. Therefore, the undertaken research subject needs to be studied in-depth on a larger scale.
Furthermore, the results indicate that many especially Polish are finding it difficult to create and
commercialize integrated tourism products adopted to new tourism market needs in an ever evolving and dynamic online market place. In this context Swiss and other Alpine country DMOs seem to be an ideal starting and reference point for Polish tourism organizations.
The critical analysis of (online) distribution strategies of DMOs on an international level would be an interesting and fruitful option for an extension of this research. Indeed, it would help to get more information in these key areas and could constitute a benchmark for strengthening the competitiveness of Polish and other European tourism destinations.
Acknowledgements This research has been supported by the Scientific Exchange Program Sciex-NMSch 2010-2011. The author would like to thank Prof. Leonard Adkins who revised the English draft of this article.
References:
Aas, C., Ladkin, A., & Fletcher, J. (2005). Stakeholder collaboration and heritage management. Annals of Tourism Research, 32 (1), 28-48.
Abegg, B., Agrawala, S., Crick, F., & de Montfalcon, A. (2007). Climate Change Impacts and Adoptions in Winter Tourism. In S. Agrawala (Ed.), Climate Change in the European Alps: Adaptiong Winter Tourism and Natural Hazards Management (pp. 25-60). Paris: OECD.
Amadeus (2008). Future Traveller Tribes. Report for the Travel Industry. Developed by Henley Centre Headlight Vision in partnership with Amadeus. www.amadeus.com/travellertribes.
Agrawala, S. (2007). Climate Change in the European Alps: Adapting Winter Tourism and Natural Hazards Management. Paris: OECD.
BAK Basel. (2011). Benchmarking du tourisme –Le secteur suisse du tourisme en comparaison internationale. Basel.
Baker, M. J., Cameron E. (2008). Critical Success Factors in Destination Marketing. Tourism and Hospitality Research (8), 79-97.
Bartaletti, F. (2002). Turismo e montagna: un’analisi regionale. Rapporto 2002. Milano: Touring Club Italiano.
Beritelli, P. (2011). Cooperation among prominent actors in a tourist destination. Annals of Tourism Research, 38(2), 607-629.
Beritelli, P., Leasser C. (2011). Power dimensions and influence reputation in tourist destinations: Empirical evidence from a network of actors and stakeholders, Tourism Management, 32, 1299-1309.
Beritelli, P., Reinhold S. (2009). Explaining decision for change in destination. The garbage can model in action. In Managing Change in Tourism137-152. Berlin: ESV.
Berrittella, M., A., Bigano, Roson, R. & Tol, R. S. J. (2006). A general equilibrium analysis of climate change impacts on tourism. Tourism Management, 27(5), 913-924.
Bieger, T. (1997). Management von destinationen und tourismusorganizationen. München/Wien: Oldenburg, Dritte Auflage.
Bieger, T. (1998). Reengineering Destination Marketing Organisations - The Case of Switzerland. Tourism Review, 53/3, 4-17.
Bieger, T., Beritelli, P., Leasser C. (2009). Size matters! Increasing DMO effectiveness and extending tourism destination boundaries. Tourism Review 57/3, 309-327.
Bieger T., Müller H. (1998). Neue Strukturen im Schweizer Tourismus – das Konzept. In.T. Bieger., Ch. Leasser, Neue Strukturen im Schweizer Tourismus –Der Weg der Schweiz. Bern.
Bigano A., Hamilton, J. M., Tol, R.S.J. (2006). The impact of Climate on Holiday Destination Choice. Climatic Change, 76 (3-4), 389-406.
Bonardi, L., Ludovici, A. A., & Furlani, R. (2006). Alps and Tourism: Finding the balance point. Milan.
Bornhorst, T., Ritchie J.R., Sheehan, L. (2010). Determinants of tourism success DMOs& destinations: An empirical examination of stakeholders’ perspectives. Tourism Management, 31, 572-589.
Brace, M. (2007). The lapse of luxury. Ecos, 136, 14-17.
Bramwell, W., Henry, I., Jackson, G., P., Richards, A. G., & van dem Straiten, J.(1996). Sustainable Tourism Management: Principles and Practice. Tilburg University Press, Tilburg.
Briassoulis, H. (2002). Sustainable tourism and the question of the commons. Annals of Tourism Research, 29 (4), 1065-1085.
Buhalis, D. (2000). Marketing the competitive destination of the future. Tourism Management (21), 97-116.
Buhalis, D., Zoge, M., (2007). The Strategic Impact of the Internet on the Tourism Industry, In Sigala, M., Mich, L., Murphy, J. (Eds.), ENTER 2007 Proceedings (pp. 481-492), Wien: Springer-Verlag.
Burki, R. (2003). Climate Change – Impact on the Tourism Industry in Mountain Areas, 1st International Conference on Climate Change and Tourism, Dejrba.
Bourdeau, Ph. (2006). Acht Fragen zur Zukunft des Alpentourismus / Huit questions à l’avenir du tourisme alpin. In: Psenner, R. and Lackner, R. (Hg.): Die Alpen im Jahr 2020.
In the light of some evidence drawn from the French market, the Alps may be considered as a “post-tourism” testing field, and proposed as an ideal "proximity" destination for neighboring regions. Innsbruck: CIPRA.
Budeanu, A. (2007). Sustainable tourist behaviour – a discussion of opportunities for change. International Journal of Consumer Studies Volume 31, Issue 5, pages 499–508, September 2007
Byrd, E.T. (2007). Stakeholders in Sustainable Tourism Development and their Roles: Applying Stakeholder Theory to Sustainable Tourism Development. Tourism Review, 62, No. 2, 6-13.
Byrd, E. T., Cardenas, D. A., & Dregalla, S. (2009). Stakeholders' perceptions of tourism and the natural environment. eTourism Review, 7 (2), 39-51.
Byrd, E. T. , Gustke, L. D. (2004). Identifying tourism stakeholder groups based on support for sustainable tourism development and participation in tourism activities. In Pineda, F. D. and Brebbia, C. A. (Eds), Sustainable tourism: The sustainable world. (pp. 97-108). WIT Press: London.
Carmin, J., Darnall, N. & Mil-Homens, J. (2003). Stakeholder involvement in the design of U.S. voluntary environmental programs: Does sponsorship matter? Policy Studies Journal, 31(4), 527-543.
Carter, R. (2007). Main Themes and Challenges Facing Destinations, In Sigala, M., Mich, L., Murphy, J. (Eds.), ENTER 2007 Proceedings (pp. 481-492), Wien: Springer-Verlag.
CIPRA. (2011). Le tourisme face au changement climatique. Schaan: CIPRA.
Clarke, A., Raffay, A., Beritelli, P., & Wittmer, A. (2009). Supporting Mobility: Evaluating mobile technology advances in tourism. Tourism Analysis(4), 425-441.
Conseil de l'Union Européenne. (1996). Council Decision of 26 February 1996 concerning the conclusion of the Convention on the protection of the Alps (Alpine Convention). http://eurlex.europa.eu/smartapi/cgi/sga_doc?smartapi!celexplus!prod!DocNumber&lg=fr&type_doc=Decision&an_doc=1996&nu_doc=191
Crounch, G. I. (2007). Modelling Destination Competitiveness. A Survey and Analysis of the Impact of Competitiveness Attributes. Gold Coast, Australia: CRS for Sustainable Tourism Pty Ltd.
Crouch, G. I. , Ritchie. J. R. B. (1999). Tourism, Competitiveness, and Societal Prosperity, Journal of Business Research, 44 (3), 137-152.
Chang, T. (2009). Sustainability as Differentiation Tool in Destination Branding. Preceedings of 3rd International Conference on Destination Branding and Marketing, Macao, 121-130.
Chitra, K. (2007). In Search of the Green Consumers: A Perceptual Study. Journal of Services Research, 7(1), 173-191.
Davidson, R., Maitland, R. (1997). Tourism destinations. London : Hodder&Stoughton.
Dwyer, L., Edwards, D., Mistilis, N., Roman, C., Scott, N., & Cooper, C. (2008). Megatrends underpinning tourism to 2020. Analysis of key drivers for change. Gold Coast, Queensland: Sustainable Tourism Cooperative Research Centre.
Elbe, J., Hallen, L., Axelsson. (2009). The Destination-management Organisation and the Integrative Destination-marketing Process. International Journal of Tourism Research, 11, 283-296.
Fennel, D. (2008). Ecotourism. Third Edition. Oxon: Routledge.
Forster, S., Gruber, S., Roffle, A., Göpfert R. (2011). Le tourisme –tout naturellement ! De l’idée au produit touristique intégrant la nature et la culture, en passant par l’analyse de marché. Wergenstein: ZHAW Fachstelle Tourismus und Nachhaltige Entwicklung.
Franch, M., Martini, U., Buffa, F., & Parisi G. (2008). 4L tourism (landscape, leisure, learning and limit): responding to new motivations and expectations of tourists to improve the competitiveness of Alpine destinations in a sustainable way. Tourism Review, 63, 4-14.
Glaser, B.G. (1998). Doing Grounded Theory - Issues and Discussions. Sociology Press.
Gössling, S. (2002), Global Environmental Consequences of Tourism. Global Enviromental Change, Part A, 12 (4), 283-302.
Gretzel, U., Fesenmaier, D. R., & O'Leary, J. T. (2006). The transformation of consumer behaviour. In D. Buhalis & C. D. Costa (Eds.), Tourism business frontiers : consumers, products and industry (pp. 9-18). Oxford: Elsevier Butterworth-Heinemann.
Gunn, C. (1972). Vacationspace, Austin: Bureau of Business Research, University of Texas.
Hall, C.M. (2008). Tourism planning: policies, processes and relationships. Pearson Prentice Hall.
Hardy, A.L. & Beeton, R. J. S. (2001). Sustainable tourism or maintainable tourism: Managing resources for more than average outcomes. Journal of Sustainable Tourism, 9(3), 168-192.
Healey, M.J., Ilbery, B.W. (1990). Location and Change: Perspectives on Economic Geography. New York: Oxford University Press.
Holden, A. (2008). Environment and Tourism. Oxon: Routledge Taylor & Francis Group.
Holleran, J. N. (2008). Sustainability in Tourism Destinations: Exploring the Boundaries of Eco-Efficiency and Green Communications. Journal of Hospitality & Leisure Marketing, 17(3-4), 373-394.
Honey, M. (1999) Ecotourism and Sustainable Development: Who Owns Paradise? Washington, DC: Island Press.
Ioannides, D. (1995). A flawed implementation of sustainable tourism; the experience of Akamas, Cyprus. Tourism Management 16(8), 583-592.
Johnsen, J., Umbach-Daniel, A., & Schnell, K. D. (2003). Monitoring system for sustainable tourism in Swiss Alpine Regions. Tool for regions to act on their own initiative. Paper presented at the 43th Congress of the European Regional Science Asociation.
Keller, P. (2000). Destination marketing: strategic area of inquiry. In M. Manete & M.Careto (Eds.), From Destination to destination Marketing and Management. Designing and Repositioning Tourism Products. Venice: Ca’Foscarina University, CISET Series, pp. 29-44.
Kester, J. (1999). Tourism 2020 Vision and sustainable development links between the sustainable development of tourism and regional/spatial planning. Paper presented at the links between the sustainable development of tourism and regional/spacial planning, Palma de Majorca (Spain).
Klimek, K. (2010). Tourism as a factor of socio-economic development of Switzerland. Conclusions for Poland. Cracow: PTE.
Klimek, K., Scaglione, M. Schegg, R. & Matos. R. (2012). Marketing and Sustainable Tourism in Alpine Destinations. In InternationalTourism Researchand Concepts: New Challenges for Tourism Promotion. (pp. 155-167). Berlin: Erich Schmid Verlag.
Laesser, Ch., Bieger, T., Beritelli, P. (2007). The impact of the internet on information sourcing portfolios: Insights from a mature market. Journal of Travel and Tourism Marketing 22, 1, 63-80.
Leiper, N. (1995). Tourism Management. Melbourne: RMIT Press.
Leire, C., Thidell, Å. (2004). Consumer Perceptions, Understanding and Use of Product Related Environmental Information. Nordic Council of Ministers, Copenhagen.
Liu, Z. Sustainable tourism development: a critique. Journal of Sustainable Tourism, 11 (6), 459-475.
Lohmann, M. (2004). New Demand Factors in Tourism. European Tourism Forum, Budapest.
Magas, D. (2010). Why the Destination Management Organization?. Tourism and Hospitality Management, Conference Proceedings, pp. 1041-1047.
Manete, M., Minghetti, V. (2006). Destination management organizations and actors. In D. Buhalis & C. D. Costa (Eds.), Tourism business frontiers : consumers, products and industry (pp. 228-237). Oxford: Elsevier Butterworth-Heinemann.
Matos-Wasem, R. (2005). Le bon air des Alpes dans le tourisme d'aujourd'hui et de demain : un capital symbolique à mettre en valeur et à préserver. Ruvue de géographie alpine, 93(Grenoble), 97-113.
Miller, G. (2003). Consumerism in sustainable tourism: a survey of UK consumers. Journal of Sustainable Tourism, 11, 17–39.
Mossberg, L. Therkelsen, A., Huijbens, E. H., Björk P., Olsson A. K. (2010). Storytelling and Destination Development. Nordic Oslo: Nordic Innovation Centre.
Notarstefano, C. (2008). European sustainable tourism: context, concepts and guidelines for action. Int. Journal of Sustainable Economy, Vol. 1, No. 1, 44-59.
Osmankovic, J., Kenjic, V., Zranic, R., (2010). Destinantion managment : Consensus for Competitiveness, Tourism and Hospitality Management, Conference Proceedings, 513-525.
Page, S. J., & Dowling, R. K. (2002). Ecotourism. Harlow, England: Pearson Education Limited.
Paul, F., Eagles, J., Mc Cool, S., D., Hayne Ch. (2002). Sustainable Tourism in Protected Areas: Guidelines for Planning and Management. Cambridge: IUCN.
Pearce, D.G. (1992). Tourism organisations. London: Longman.
Pike, S. (2004). Destination Marketing Organisations. London: Elsevier.
Ritchie, J. R. B. (1993). Crafting a Destination Vision, Tourism Management 14 (5) 379-38.
Ritchie, J. R. B. (2003). The competitive destination. A sustainable tourism perspective. Oxon: CABI Publishing.
Ritchie, J. R. B., & Crouch, G. I. (2000). The competitive destination: A sustainable perspective. Tourism Management, 21(SI), 1–7.
Ritchie, J. R. B., Hudson S. (2009). Understanding and Meeting the Challenges of Consumer/Tourist Experience Research. International Journal of Tourism Research 11, 111–126.
Roussat, N., Dujeta, C., & Méhua, J. (2009). Choosing a sustainable demolition waste management strategy using multicriteria decision analysis. Waste Management, 29, 12-20.
Sautter, E.T., Leisen B. (1999). Managing stakeholders: A tourism planning model. Annals of Tourism Research, 26 (2), 312-328.
Sharpley, R. (2006). Ecotourism: A Consumption Perspective. Journal of Ecotourism (5) , 7-22.
Sheehan, L., Ritchie, J. R. B., Hudson S. (2007). The destination promotion triad: understanding asymmetric stakeholder interdependencies among the city, hotels and DMO. Journal of Travel Research 46: 64-74.
Simpson, M. C. (2008). Community Benefit Tourism Initiatives—A conceptual oxymoron? Tourism Management 29 (2008) 1–18.
Tosun, C., Timothy, D. J. (2003). Arguments for community participation in the tourism development process. Journal of Tourism Studies, 14(2), 2–14.
UNTWO. (2002). Tourism 2020.Vision Global Forecasts and Profiles of Market Segments. Madrid: UNTWO.
UNWTO. (2007). A Practical Guide to Tourism Destination Management. Madrid 2007.
UNWTO. (2009). Global Financial and Economic Crisis: What are the Implication for World Tourism. Madrid.
UNWTO. (2010). International tourism on track for a rebound after an exceptionally challenging 2009, Press Release, Madrid.
UNWTO, (2011).Tourism highlights, Edition 2011, Madrid.
UNWTO, WTTC, & Earth Council. (1996). Agenda 21 for the Travel and Tourism Industry. Towards Environmentally Sustainable Development. Madrid.
van Harssel, J. (2005). Glossary - Destination Management Organization. In R. Harrill, Fundamentals of Destination Management and Marketing. Educational Institute American Hotel & Lodging Association, Michigan.
Wang, Y., Pizam, A. (2011). Destination Marketing and Management. Oxfordshire: Cabi.
Wight, A. (1998). Tools for sustainability analysis in planning and managing tourism and recreation in the destination. In C.M. Hall and A.A. Lew (eds) Sustainable Tourism: A Geographical Perspective (pp. 75–91). Harlow: Longmsan.
Wray, M., Dredge, D., Cox, C., Buultjens, J., Hollick, M., Lee, D., Pearlman, M., Lacroix, C. (2010). Sustainable regional tourism destinations. Best practice for management, development and marketing, CRS for Sustainable Tourism, Queensland.
HOW ORGANIZATION OF HOTEL INDUSTRY AFFECTS THE TOURIST DESTINATION POSITIONING – AN EXAMPLE OF ISTRIA TOURIST DESTINATION
Nadia Pavia1, Tamara Floricic2.
1Faculty of Tourism and Hospitality Management Opatija, Primorska 41, 51410 Opatija,
2Juraj Dobrila University of Pula, Department of Economics and Tourism, Preradoviceva 1, 52100 Pula, [email protected]
Istria as Croatian tourist region searches its progress and economic growth in carefully planned tourism development. Tourism industry is fighting its way out from "low class - mass tourism" image with implementation of strategic master plans of development. Istria is divided in tourist clusters that create new selective offer and service quality for international market.
Istrian hotel companies base their offer on three basic accommodation structures: hotels, camping sites and resorts and aim to reach better quality by repositioning these facilities in tourist destination. This paper is focused on the question how diversity of accommodation mix and its categorization impact destination organization and positioning. Guidelines for tourism development of each cluster in Istria given by Master Plan, present a goal that private and public sector synergistically should aim to reach. Obtained results of research indicate inadequate accommodation mix and poor compatibility with planned cluster strategies.
The methods that are used in scientific research that brought indicative results are: mathematical and statistical methods, methods of analysis, synthesis, induction and deduction. Historical method presented the authors current knowledge which led to new insights.
Keywords: categorization, hotel companies, tourist destination, image, master plan
ISTRIAN TOURIST DESTINATIONS IN SEARCH OF NEW MARKET POSITIONING
Croatia, as a Mediterranean country has all the prerequisites to grow into a developed tourist country and become an integral and functional part of European tourism economy. In order to distance themselves from the heritage and image of mass tourism, tourist destinations in Istria and Croatia are aiming at new market positioning which can be achieved by restructuring the offer of accommodation facilities and creating a total destination product.
As a result of mass tourism and seasonal concentration of tourists within two or three months, all tourism service potentials, including basic and complementary, main potentials and infrastructure suffer great and short-lasting surges of tourists. The standard form of mass tourism as it was practiced on the coasts of Istria (Rabac, Pula, Rovinj, Poreč, Umag, Novigrad) was uniform. Hotels and resorts did not only look alike, but the services they offered to tourists were very similar as well. Elements such as food, beaches and sport activities offered to tourists in the vicinity of hotels, entertainment, animation and music were very similar. An explanation can be sought in the fact that large hotels dominated the entire tourism offer of Istria destination and as destination monopolist didn't invest in development of selective offer nor niche marketing. .
Since Istria and Croatia have entered the contemporary international tourism market, there is a need to diversify the offer and image of destinations. The identity of destinations means that every town, every village, region and tourist destination has to discover unique features of the area and select those features that they can adapt to the needs of foreign visitors. A further step includes finding a means to communicate with the visitors. This will lead to diversified offer among destinations, as their micro cultures differ.
By developing additional contents and facilities in the destination with a quality that matches main accommodation facilities, the tourist offer would be enriched and dependence of tourism on limited seasonal parameters “sun & sea” reduced. In order to promote a destination successfully on the market, the complementary destination offer, either in the form of museums, national parks and historical sites, or a new, strategically planned offer, must be consistent with the destination in terms of quality and basic features. Thus, the destination and hotel company have to work in synergy to develop a particular type of tourism product. For
instance, a destination with possibility of golf and cycling valorisation should develop a hotel product oriented towards demand of that sector. Construction and use of space for new facilities and attractions in the destination must be in accordance with physical plans and locations (Berc Radišić B., (2009) Marketing turističkog proizvoda destinacije, Faculty of Tourism and Hospitality Management Opatija). The ability of a destination to accommodate tourists with respect to existing infrastructure and resources should also be taken into consideration. For the development of the hotel company to be in accordance with the development of the destination, it is necessary that all stakeholders, business and private entities influence the quality of a destination through their effort and activity (Magaš D., (2008) Destinacijski menadžment – Modeli i tehnike, Faculty of Tourism and Hospitality Management Opatija).
A necessary prerequisite for increased utilisation of accommodation capacity, longer season and greater demand and tourist consumption, is the enhancement of quality of accommodation facilities on all levels (Čavlek N., Bartoluci M., Pribežac D., Kesar O., (2011:167) Turizam – Ekonomske osnove i organizacijski sustav, Zagreb ). The target market for a particular product and means of presenting the same must be defined when designing a hotel product. The answer lies in comprehensive market research of the demand and motivation of tourist movements as well as in the segmentation of the target market. Depending on demand trends on emitting markets, accommodation offer is created, accommodation facilities are renovated and international tourist brands are implemented. At the same time, compliance with the development of the particular destination is of great importance. Creating new hotel facilities in the destination by renovating existing abandoned buildings in the coastal or any other attractive area offers a possibility of valorisation without actual construction work. The restructuring of facilities or their reconstruction lead to optimum valorisation of the tourist area and first-class location. For instance, smaller buildings and villas can be turned into "boutique" hotels that are dominant in a particular market segment.
As was already stated above, Istrian hotel offer is mainly characterised by uniform offer focused on the primary resource of summer tourism, the "sun and sea". Particular hotel houses are an exception. The "Master plan of tourism development in Istria" has entered the final preparatory stage and is about to be implemented. The plan defines destinations in Istria as clusters, tourist regions – entities where the main role is played by the link between private and public sector. The plan predicts a whole range of significant investments in both sectors. The plan focuses on qualitative harmonisation of tourist and urban contents in order to achieve identity and cluster valorisation, i.e. valorisation of micro-destinations. This leads to a tourist destination branding that increase competitiveness on international tourist market (Križman Pavlović D. (2008:108), Marketing turističke destinacije, Pula ) The plan predicts an implementation of the market concept that relies on promotion of the destination by defining the umbrella brand and common image of the tourist board and hotel company. According to this plan, Istria is subdivided into eight clusters. Each cluster is developing its own identity and a mix of destination and accommodation offer.
Positioning strategies are following (Master Plan of Tourism (2004 -2012) Istria, Final Document, (2003:50), THR in association with Horwath Consulting Zagreb, Zagreb):
Umag: Active, sport holidays and shortbreaks, related to healthy way of life- Novigrad: Fisherman village with tranquil way of life
Poreč: Concentration of active experiences with a rich cultural heritage Vrsar –Funtana: Nature experience including traditional fishing activities with a touch of art Rovinj: Romantic town in a dreamy Mediterranean surrounding Pula: Culture, history and beaches… The place for your meetings, Medulin: Preserved seaside for
active and nature based family holidays Rabac – Labin: Blend of nature and heritage, artist's paradise. Where the hills meet the sea Centralna Istra: Preserved traditional way of life, to enjoy Istrian culture, gastronomy and nature
Hotel industry in Croatia and Istria recognize importance of accommodation facilities development for selective market segments. Legislation allows organization of accommodation structures with special standard labels that offer special distinctive services. Special hotel standards are: business, for meetings, congress, club, casino, holiday, seaside vacation, family, small & friendly, for retirees, health & fitness, spa, wellness, diving club, motel, ski and hotel for people with disabilities (Čavlek N., Bartoluci M., Pribežac D., Kesar O., (2011:164) Turizam – Ekonomske osnove i organizacijski sustav, Zagreb )
The research carried out in this paper shall answer the question as to how organised accommodation
mix impacts the positioning of the destination, i.e. whether the same is successfully implemented in Istria as a tourist destination.
FEATURES AND STRUCTURE OF HOTEL OFFER IN ISTRIA TOURIST DESTINATIONS
A discrepancy in the development of hotel offer and the development of a destination results in
construction of inadequate facilities in the destination. An example is the development of 4 or 5 stars hotel product in a destination with uniform, mass offer and low prices. Customers that stay in 4 or 5 stars hotels are also looking for a high-class destination offer, which includes a wide range of quality contents, shopping sections – for buying luxurious clothes - excursions and activities. It is very often that guests staying in 5 or 4 stars hotels and arriving in luxurious yachts – cruisers cannot find an adequate offer in the destination, i.e. an offer that will answer their needs. Such customers are not willing to accept anything that is below their status. This is a case of incompatibility of hotel offer with the destination offer. The same can be said for the opposite situation, as guests staying in 2 or 3 stars hotels are not likely to spend money in restaurants, go on excursions and participate in any activity that will require additional funds.
Accommodation capacities such as camping sites and households present another type of accommodation offer. Their offer must also correspond to the quality and category of hotel offer. In the destination, guests interact and communicate with each other, actively and passively. Research has shown that guest with higher status and income want to associate only with guests of similar status. This can be achieved by organising or constructing closed resorts in tourist destinations. However, this form of organisation is not feasible in Croatia and Istria due to Maritime Public domain and concessions on the Maritime domain.
Camping sites which generate the greatest turnover in particular destinations, and which are involved in the structure of available accommodation capacity, follow the trend of raising the quality of service by complying with standards of quality in design and aesthetic features and by introducing international camping brands. Valorisation of campsite offer should take into account factors such as the carrying capacity of destinations and infrastructure load during peak summer periods as these threaten the valorisation of the destination potential.
In order to assess the market position of Istrian hotel companies, the system of values that is offered to
tourists in the destination should be analysed first. The existing destination offer and hotel offer in Istria did not have a clearly defined strategy of providing guests with greater value. This is a result of uncoordinated development of the overall tourism product in the destination based on the natural attraction of coastal areas and the exploitation of cultural and historical resources at a low level. Market competitiveness can be analysed from several positions including the aspect of valorisation of values for effort, which is just an extension of the value for money variable. In this case, not only money, but inconvenience and uncertainty as determinants of tourism effort are analysed (Master Plan of Tourism (2004 -2012) Istria, Final Document, (2003:15), THR in association with Horwath Consulting Zagreb, Zagreb)
A destination is competitive if it offers guests greater value for less effort than do competitors. Tourists
come to a destination to experience the values and gain experience such as taking a tour of cultural heritage, learning and relaxation, and have positive feelings that are associated with a sense of safety, diversity, uniqueness of contribution. Quality of services rendered is the basis of value perception.
From customer’s point of view, effort presents everything the customer is asked to do. This refers to the price category with questionable adequateness, accuracy and questionable ways and places of payment. The second category is the uncertainty related to unfamiliarity with places to be visited or lack of guarantee of quality, pollution and unclear tariffs and finally, inconvenience. They relate to every problem associated with the holiday, such as transport infrastructure deficiencies, polluted environment, urban mismatches, noise, odours, poor quality of facilities and equipment. On the other hand, market position can be viewed through the category of hotel companies, i.e. total mean rate that indicates the quality of accommodation facilities. In the following sections of this paper, the rating of Istria hotel companies will be calculated by using a mathematical method of calculating the average value and market competitiveness of hotel companies.
Istria, as the leading Croatian tourist brand is developing strategies for designing hotel offer in accordance with the requirements of dynamic customer demand. When developing competitiveness of its hotel product, Istria hotel houses as main holders of tourist offer, create an accommodation offer through accommodation facilities, hotels, resorts, tourist apartments and camping sites as a separate category.
Table 1 shows tangible indicators of tourist turnover in Istria and Croatia:
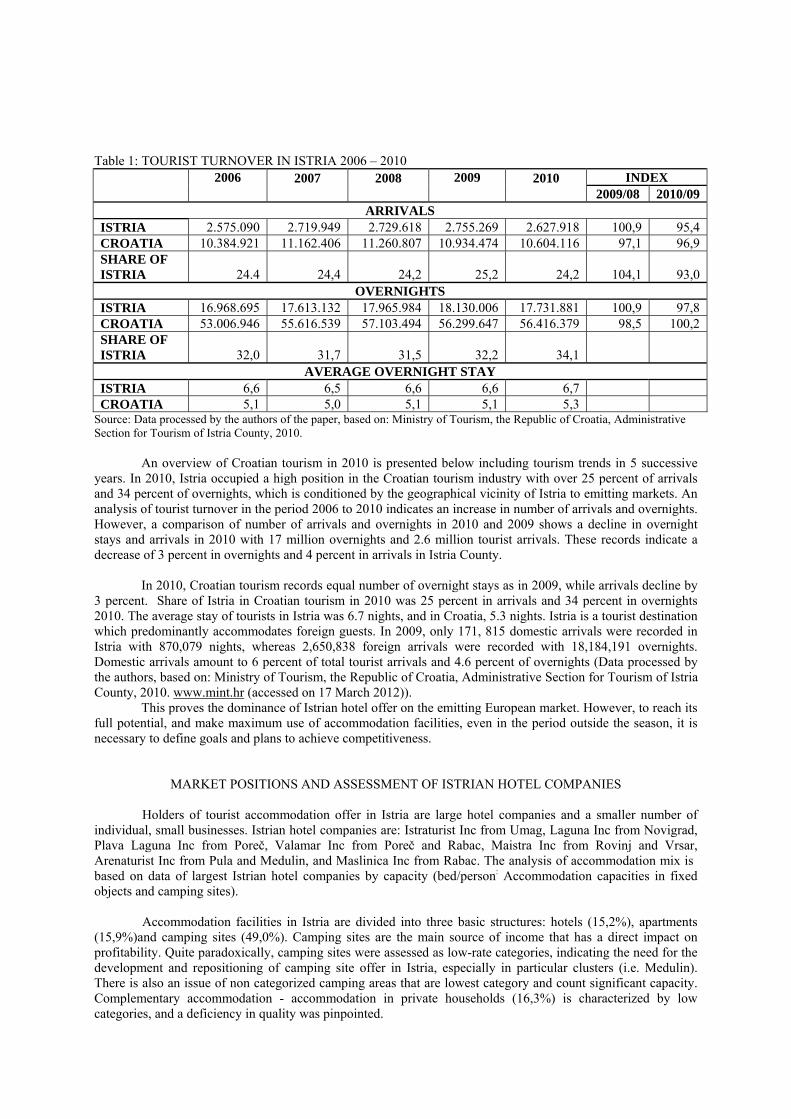
Table 1: TOURIST TURNOVER IN ISTRIA 2006 – 2010
2006 2007
2008
2009 2010
INDEX
2009/08 2010/09 ARRIVALS
ISTRIA 2.575.090 2.719.949 2.729.618 2.755.269 2.627.918 100,9 95,4 CROATIA 10.384.921 11.162.406 11.260.807 10.934.474 10.604.116 97,1 96,9 SHARE OF ISTRIA 24.4 24,4 24,2 25,2 24,2 104,1 93,0
OVERNIGHTS ISTRIA 16.968.695 17.613.132 17.965.984 18.130.006 17.731.881 100,9 97,8 CROATIA 53.006.946 55.616.539 57.103.494 56.299.647 56.416.379 98,5 100,2 SHARE OF ISTRIA 32,0 31,7 31,5 32,2 34,1
AVERAGE OVERNIGHT STAY ISTRIA 6,6 6,5 6,6 6,6 6,7 CROATIA 5,1 5,0 5,1 5,1 5,3
Source: Data processed by the authors of the paper, based on: Ministry of Tourism, the Republic of Croatia, Administrative Section for Tourism of Istria County, 2010.
An overview of Croatian tourism in 2010 is presented below including tourism trends in 5 successive years. In 2010, Istria occupied a high position in the Croatian tourism industry with over 25 percent of arrivals and 34 percent of overnights, which is conditioned by the geographical vicinity of Istria to emitting markets. An analysis of tourist turnover in the period 2006 to 2010 indicates an increase in number of arrivals and overnights. However, a comparison of number of arrivals and overnights in 2010 and 2009 shows a decline in overnight stays and arrivals in 2010 with 17 million overnights and 2.6 million tourist arrivals. These records indicate a decrease of 3 percent in overnights and 4 percent in arrivals in Istria County.
In 2010, Croatian tourism records equal number of overnight stays as in 2009, while arrivals decline by
3 percent. Share of Istria in Croatian tourism in 2010 was 25 percent in arrivals and 34 percent in overnights 2010. The average stay of tourists in Istria was 6.7 nights, and in Croatia, 5.3 nights. Istria is a tourist destination which predominantly accommodates foreign guests. In 2009, only 171, 815 domestic arrivals were recorded in Istria with 870,079 nights, whereas 2,650,838 foreign arrivals were recorded with 18,184,191 overnights. Domestic arrivals amount to 6 percent of total tourist arrivals and 4.6 percent of overnights (Data processed by the authors, based on: Ministry of Tourism, the Republic of Croatia, Administrative Section for Tourism of Istria County, 2010. www.mint.hr (accessed on 17 March 2012)).
This proves the dominance of Istrian hotel offer on the emitting European market. However, to reach its full potential, and make maximum use of accommodation facilities, even in the period outside the season, it is necessary to define goals and plans to achieve competitiveness.
MARKET POSITIONS AND ASSESSMENT OF ISTRIAN HOTEL COMPANIES
Holders of tourist accommodation offer in Istria are large hotel companies and a smaller number of individual, small businesses. Istrian hotel companies are: Istraturist Inc from Umag, Laguna Inc from Novigrad, Plava Laguna Inc from Poreč, Valamar Inc from Poreč and Rabac, Maistra Inc from Rovinj and Vrsar, Arenaturist Inc from Pula and Medulin, and Maslinica Inc from Rabac. The analysis of accommodation mix is based on data of largest Istrian hotel companies by capacity (bed/person: Accommodation capacities in fixed objects and camping sites).
Accommodation facilities in Istria are divided into three basic structures: hotels (15,2%), apartments
(15,9%)and camping sites (49,0%). Camping sites are the main source of income that has a direct impact on profitability. Quite paradoxically, camping sites were assessed as low-rate categories, indicating the need for the development and repositioning of camping site offer in Istria, especially in particular clusters (i.e. Medulin). There is also an issue of non categorized camping areas that are lowest category and count significant capacity. Complementary accommodation - accommodation in private households (16,3%) is characterized by low categories, and a deficiency in quality was pinpointed.
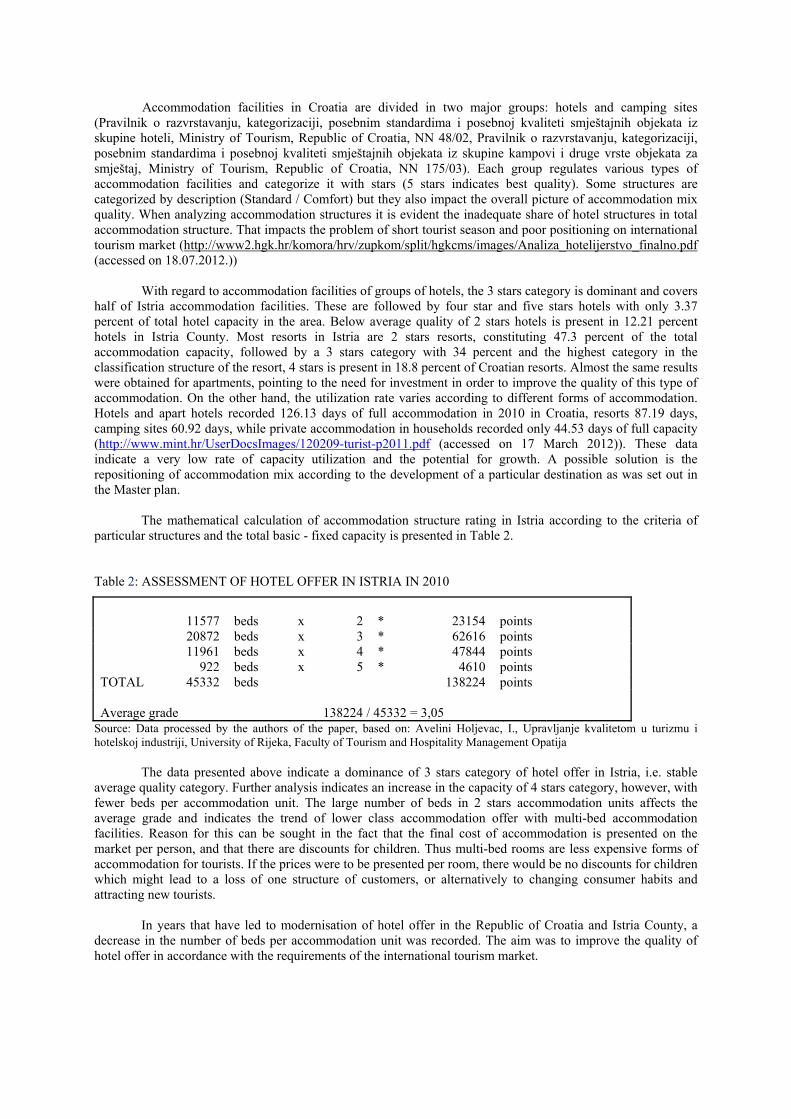
Accommodation facilities in Croatia are divided in two major groups: hotels and camping sites
(Pravilnik o razvrstavanju, kategorizaciji, posebnim standardima i posebnoj kvaliteti smještajnih objekata iz skupine hoteli, Ministry of Tourism, Republic of Croatia, NN 48/02, Pravilnik o razvrstavanju, kategorizaciji, posebnim standardima i posebnoj kvaliteti smještajnih objekata iz skupine kampovi i druge vrste objekata za smještaj, Ministry of Tourism, Republic of Croatia, NN 175/03). Each group regulates various types of accommodation facilities and categorize it with stars (5 stars indicates best quality). Some structures are categorized by description (Standard / Comfort) but they also impact the overall picture of accommodation mix quality. When analyzing accommodation structures it is evident the inadequate share of hotel structures in total accommodation structure. That impacts the problem of short tourist season and poor positioning on international tourism market (http://www2.hgk.hr/komora/hrv/zupkom/split/hgkcms/images/Analiza_hotelijerstvo_finalno.pdf (accessed on 18.07.2012.))
With regard to accommodation facilities of groups of hotels, the 3 stars category is dominant and covers half of Istria accommodation facilities. These are followed by four star and five stars hotels with only 3.37 percent of total hotel capacity in the area. Below average quality of 2 stars hotels is present in 12.21 percent hotels in Istria County. Most resorts in Istria are 2 stars resorts, constituting 47.3 percent of the total accommodation capacity, followed by a 3 stars category with 34 percent and the highest category in the classification structure of the resort, 4 stars is present in 18.8 percent of Croatian resorts. Almost the same results were obtained for apartments, pointing to the need for investment in order to improve the quality of this type of accommodation. On the other hand, the utilization rate varies according to different forms of accommodation. Hotels and apart hotels recorded 126.13 days of full accommodation in 2010 in Croatia, resorts 87.19 days, camping sites 60.92 days, while private accommodation in households recorded only 44.53 days of full capacity (http://www.mint.hr/UserDocsImages/120209-turist-p2011.pdf (accessed on 17 March 2012)). These data indicate a very low rate of capacity utilization and the potential for growth. A possible solution is the repositioning of accommodation mix according to the development of a particular destination as was set out in the Master plan.
The mathematical calculation of accommodation structure rating in Istria according to the criteria of particular structures and the total basic - fixed capacity is presented in Table 2. Table 2: ASSESSMENT OF HOTEL OFFER IN ISTRIA IN 2010
11577 beds x 2 * 23154 points 20872 beds x 3 * 62616 points 11961 beds x 4 * 47844 points 922 beds x 5 * 4610 points TOTAL 45332 beds 138224 points
Average grade 138224 / 45332 = 3,05
Source: Data processed by the authors of the paper, based on: Avelini Holjevac, I., Upravljanje kvalitetom u turizmu i hotelskoj industriji, University of Rijeka, Faculty of Tourism and Hospitality Management Opatija
The data presented above indicate a dominance of 3 stars category of hotel offer in Istria, i.e. stable average quality category. Further analysis indicates an increase in the capacity of 4 stars category, however, with fewer beds per accommodation unit. The large number of beds in 2 stars accommodation units affects the average grade and indicates the trend of lower class accommodation offer with multi-bed accommodation facilities. Reason for this can be sought in the fact that the final cost of accommodation is presented on the market per person, and that there are discounts for children. Thus multi-bed rooms are less expensive forms of accommodation for tourists. If the prices were to be presented per room, there would be no discounts for children which might lead to a loss of one structure of customers, or alternatively to changing consumer habits and attracting new tourists.
In years that have led to modernisation of hotel offer in the Republic of Croatia and Istria County, a
decrease in the number of beds per accommodation unit was recorded. The aim was to improve the quality of hotel offer in accordance with the requirements of the international tourism market.
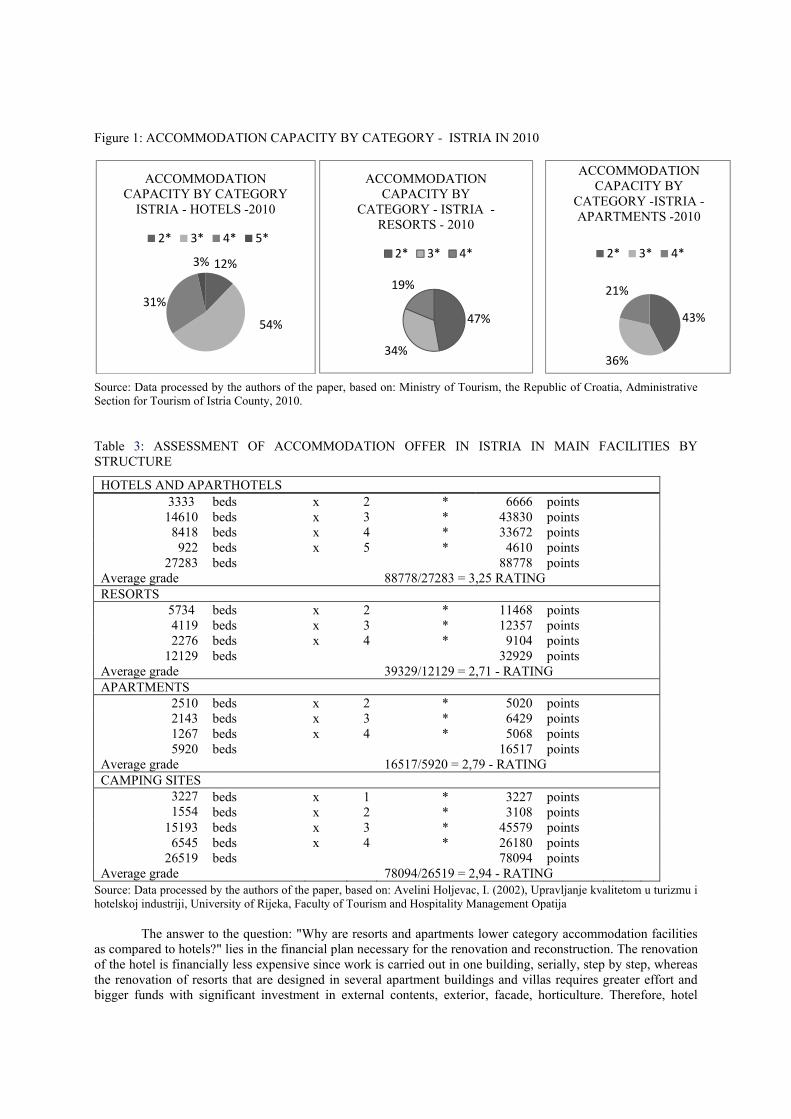
Figure 1: ACCOMMODATION CAPACITY BY CATEGORY - ISTRIA IN 2010
Source: Data processed by the authors of the paper, based on: Ministry of Tourism, the Republic of Croatia, Administrative Section for Tourism of Istria County, 2010. Table 3: ASSESSMENT OF ACCOMMODATION OFFER IN ISTRIA IN MAIN FACILITIES BY STRUCTURE
HOTELS AND APARTHOTELS 3333 beds x 2 * 6666 points
14610 beds x 3 * 43830 points 8418 beds x 4 * 33672 points 922 beds x 5 * 4610 points
27283 beds 88778 points Average grade 88778/27283 = 3,25 RATING RESORTS
5734 beds x 2 * 11468 points 4119 beds x 3 * 12357 points 2276 beds x 4 * 9104 points
12129 beds 32929 points Average grade 39329/12129 = 2,71 - RATING APARTMENTS
2510 beds x 2 * 5020 points 2143 beds x 3 * 6429 points 1267 beds x 4 * 5068 points 5920 beds 16517 points
Average grade 16517/5920 = 2,79 - RATING CAMPING SITES
3227 1554
beds beds
x x
1 2
* *
3227 3108
points points
15193 beds x 3 * 45579 points 6545 beds
beds x 4 * 26180 points
26519 78094 points Average grade 78094/26519 = 2,94 - RATING
Source: Data processed by the authors of the paper, based on: Avelini Holjevac, I. (2002), Upravljanje kvalitetom u turizmu i hotelskoj industriji, University of Rijeka, Faculty of Tourism and Hospitality Management Opatija
The answer to the question: "Why are resorts and apartments lower category accommodation facilities
as compared to hotels?" lies in the financial plan necessary for the renovation and reconstruction. The renovation of the hotel is financially less expensive since work is carried out in one building, serially, step by step, whereas the renovation of resorts that are designed in several apartment buildings and villas requires greater effort and bigger funds with significant investment in external contents, exterior, facade, horticulture. Therefore, hotel
12%
54%
31%
3%
ACCOMMODATION CAPACITY BY CATEGORY
ISTRIA - HOTELS -2010
2* 3* 4* 5*
47%
34%
19%
ACCOMMODATION CAPACITY BY
CATEGORY - ISTRIA -RESORTS - 2010
2* 3* 4*
43%
36%
21%
ACCOMMODATION CAPACITY BY
CATEGORY -ISTRIA -APARTMENTS -2010
2* 3* 4*
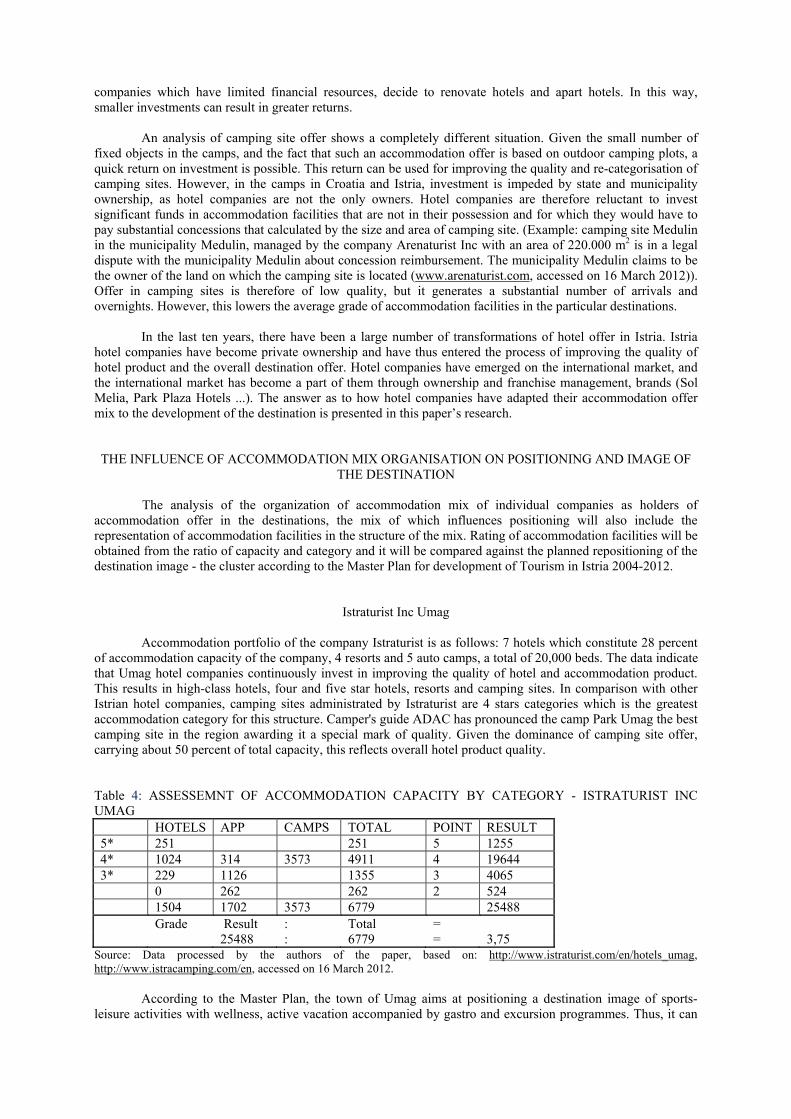
companies which have limited financial resources, decide to renovate hotels and apart hotels. In this way, smaller investments can result in greater returns.
An analysis of camping site offer shows a completely different situation. Given the small number of fixed objects in the camps, and the fact that such an accommodation offer is based on outdoor camping plots, a quick return on investment is possible. This return can be used for improving the quality and re-categorisation of camping sites. However, in the camps in Croatia and Istria, investment is impeded by state and municipality ownership, as hotel companies are not the only owners. Hotel companies are therefore reluctant to invest significant funds in accommodation facilities that are not in their possession and for which they would have to pay substantial concessions that calculated by the size and area of camping site. (Example: camping site Medulin in the municipality Medulin, managed by the company Arenaturist Inc with an area of 220.000 m2 is in a legal dispute with the municipality Medulin about concession reimbursement. The municipality Medulin claims to be the owner of the land on which the camping site is located (www.arenaturist.com, accessed on 16 March 2012)). Offer in camping sites is therefore of low quality, but it generates a substantial number of arrivals and overnights. However, this lowers the average grade of accommodation facilities in the particular destinations.
In the last ten years, there have been a large number of transformations of hotel offer in Istria. Istria hotel companies have become private ownership and have thus entered the process of improving the quality of hotel product and the overall destination offer. Hotel companies have emerged on the international market, and the international market has become a part of them through ownership and franchise management, brands (Sol Melia, Park Plaza Hotels ...). The answer as to how hotel companies have adapted their accommodation offer mix to the development of the destination is presented in this paper’s research.
THE INFLUENCE OF ACCOMMODATION MIX ORGANISATION ON POSITIONING AND IMAGE OF
THE DESTINATION
The analysis of the organization of accommodation mix of individual companies as holders of accommodation offer in the destinations, the mix of which influences positioning will also include the representation of accommodation facilities in the structure of the mix. Rating of accommodation facilities will be obtained from the ratio of capacity and category and it will be compared against the planned repositioning of the destination image - the cluster according to the Master Plan for development of Tourism in Istria 2004-2012.
Istraturist Inc Umag Accommodation portfolio of the company Istraturist is as follows: 7 hotels which constitute 28 percent
of accommodation capacity of the company, 4 resorts and 5 auto camps, a total of 20,000 beds. The data indicate that Umag hotel companies continuously invest in improving the quality of hotel and accommodation product. This results in high-class hotels, four and five star hotels, resorts and camping sites. In comparison with other Istrian hotel companies, camping sites administrated by Istraturist are 4 stars categories which is the greatest accommodation category for this structure. Camper's guide ADAC has pronounced the camp Park Umag the best camping site in the region awarding it a special mark of quality. Given the dominance of camping site offer, carrying about 50 percent of total capacity, this reflects overall hotel product quality. Table 4: ASSESSEMNT OF ACCOMMODATION CAPACITY BY CATEGORY - ISTRATURIST INC UMAG HOTELS APP CAMPS TOTAL POINT RESULT 5* 251 251 5 1255 4* 1024 314 3573 4911 4 19644 3* 229 1126 1355 3 4065 0 262 262 2 524 1504 1702 3573 6779 25488 Grade Result : Total = 25488 : 6779 = 3,75
Source: Data processed by the authors of the paper, based on: http://www.istraturist.com/en/hotels_umag, http://www.istracamping.com/en, accessed on 16 March 2012.
According to the Master Plan, the town of Umag aims at positioning a destination image of sports-leisure activities with wellness, active vacation accompanied by gastro and excursion programmes. Thus, it can
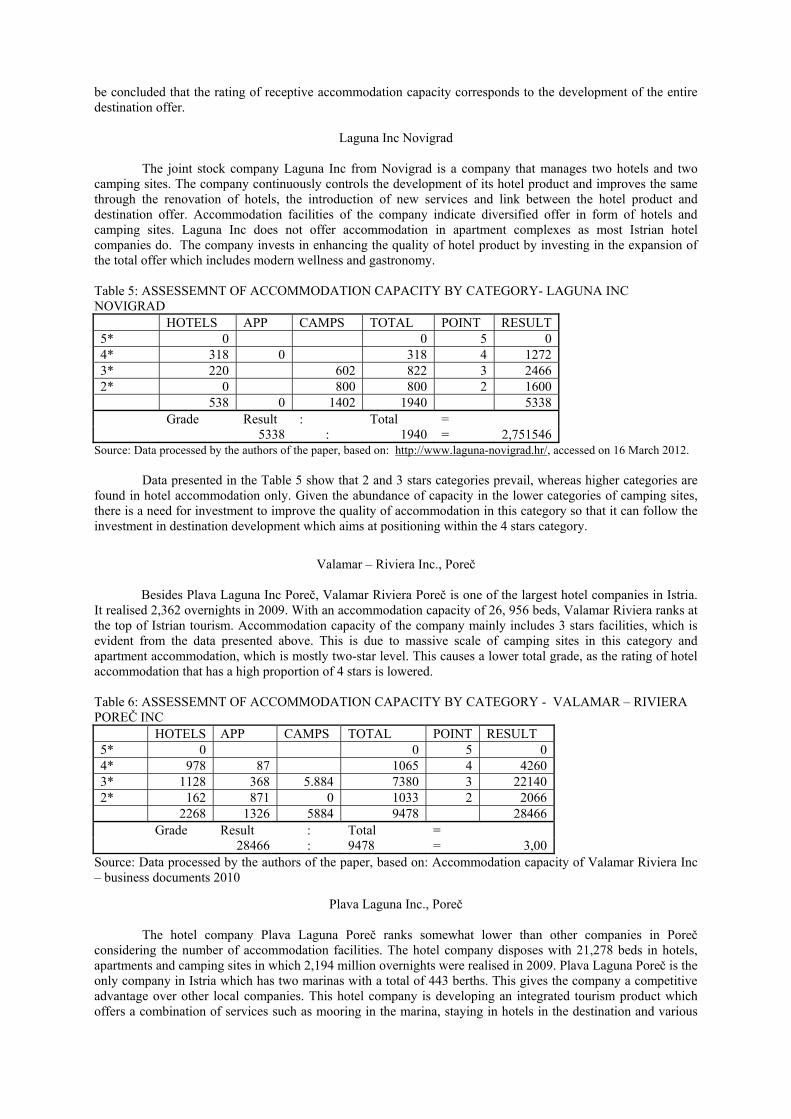
be concluded that the rating of receptive accommodation capacity corresponds to the development of the entire destination offer.
Laguna Inc Novigrad
The joint stock company Laguna Inc from Novigrad is a company that manages two hotels and two
camping sites. The company continuously controls the development of its hotel product and improves the same through the renovation of hotels, the introduction of new services and link between the hotel product and destination offer. Accommodation facilities of the company indicate diversified offer in form of hotels and camping sites. Laguna Inc does not offer accommodation in apartment complexes as most Istrian hotel companies do. The company invests in enhancing the quality of hotel product by investing in the expansion of the total offer which includes modern wellness and gastronomy.
Table 5: ASSESSEMNT OF ACCOMMODATION CAPACITY BY CATEGORY- LAGUNA INC NOVIGRAD HOTELS APP CAMPS TOTAL POINT RESULT5* 0 0 5 04* 318 0 318 4 12723* 220 602 822 3 24662* 0 800 800 2 1600 538 0 1402 1940 5338 Grade Result : Total = 5338 : 1940 = 2,751546
Source: Data processed by the authors of the paper, based on: http://www.laguna-novigrad.hr/, accessed on 16 March 2012.
Data presented in the Table 5 show that 2 and 3 stars categories prevail, whereas higher categories are found in hotel accommodation only. Given the abundance of capacity in the lower categories of camping sites, there is a need for investment to improve the quality of accommodation in this category so that it can follow the investment in destination development which aims at positioning within the 4 stars category.
Valamar – Riviera Inc., Poreč
Besides Plava Laguna Inc Poreč, Valamar Riviera Poreč is one of the largest hotel companies in Istria. It realised 2,362 overnights in 2009. With an accommodation capacity of 26, 956 beds, Valamar Riviera ranks at the top of Istrian tourism. Accommodation capacity of the company mainly includes 3 stars facilities, which is evident from the data presented above. This is due to massive scale of camping sites in this category and apartment accommodation, which is mostly two-star level. This causes a lower total grade, as the rating of hotel accommodation that has a high proportion of 4 stars is lowered.
Table 6: ASSESSEMNT OF ACCOMMODATION CAPACITY BY CATEGORY - VALAMAR – RIVIERA POREČ INC HOTELS APP CAMPS TOTAL POINT RESULT 5* 0 0 5 04* 978 87 1065 4 42603* 1128 368 5.884 7380 3 221402* 162 871 0 1033 2 2066 2268 1326 5884 9478 28466 Grade Result : Total = 28466 : 9478 = 3,00
Source: Data processed by the authors of the paper, based on: Accommodation capacity of Valamar Riviera Inc – business documents 2010
Plava Laguna Inc., Poreč
The hotel company Plava Laguna Poreč ranks somewhat lower than other companies in Poreč considering the number of accommodation facilities. The hotel company disposes with 21,278 beds in hotels, apartments and camping sites in which 2,194 million overnights were realised in 2009. Plava Laguna Poreč is the only company in Istria which has two marinas with a total of 443 berths. This gives the company a competitive advantage over other local companies. This hotel company is developing an integrated tourism product which offers a combination of services such as mooring in the marina, staying in hotels in the destination and various
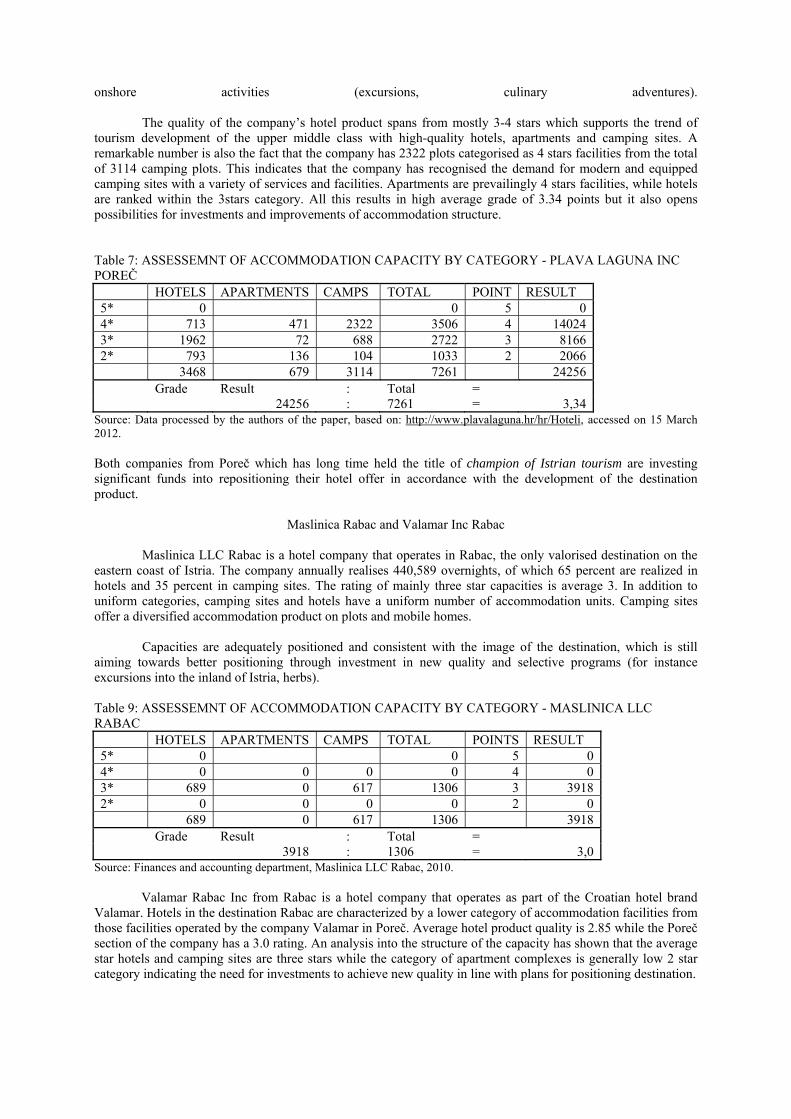
onshore activities (excursions, culinary adventures).
The quality of the company’s hotel product spans from mostly 3-4 stars which supports the trend of tourism development of the upper middle class with high-quality hotels, apartments and camping sites. A remarkable number is also the fact that the company has 2322 plots categorised as 4 stars facilities from the total of 3114 camping plots. This indicates that the company has recognised the demand for modern and equipped camping sites with a variety of services and facilities. Apartments are prevailingly 4 stars facilities, while hotels are ranked within the 3stars category. All this results in high average grade of 3.34 points but it also opens possibilities for investments and improvements of accommodation structure. Table 7: ASSESSEMNT OF ACCOMMODATION CAPACITY BY CATEGORY - PLAVA LAGUNA INC POREČ HOTELS APARTMENTS CAMPS TOTAL POINT RESULT 5* 0 0 5 0 4* 713 471 2322 3506 4 14024 3* 1962 72 688 2722 3 8166 2* 793 136 104 1033 2 2066 3468 679 3114 7261 24256 Grade Result : Total = 24256 : 7261 = 3,34
Source: Data processed by the authors of the paper, based on: http://www.plavalaguna.hr/hr/Hoteli, accessed on 15 March 2012. Both companies from Poreč which has long time held the title of champion of Istrian tourism are investing significant funds into repositioning their hotel offer in accordance with the development of the destination product.
Maslinica Rabac and Valamar Inc Rabac
Maslinica LLC Rabac is a hotel company that operates in Rabac, the only valorised destination on the eastern coast of Istria. The company annually realises 440,589 overnights, of which 65 percent are realized in hotels and 35 percent in camping sites. The rating of mainly three star capacities is average 3. In addition to uniform categories, camping sites and hotels have a uniform number of accommodation units. Camping sites offer a diversified accommodation product on plots and mobile homes.
Capacities are adequately positioned and consistent with the image of the destination, which is still
aiming towards better positioning through investment in new quality and selective programs (for instance excursions into the inland of Istria, herbs). Table 9: ASSESSEMNT OF ACCOMMODATION CAPACITY BY CATEGORY - MASLINICA LLC RABAC HOTELS APARTMENTS CAMPS TOTAL POINTS RESULT 5* 0 0 5 0 4* 0 0 0 0 4 0 3* 689 0 617 1306 3 3918 2* 0 0 0 0 2 0 689 0 617 1306 3918 Grade Result : Total = 3918 : 1306 = 3,0
Source: Finances and accounting department, Maslinica LLC Rabac, 2010.
Valamar Rabac Inc from Rabac is a hotel company that operates as part of the Croatian hotel brand Valamar. Hotels in the destination Rabac are characterized by a lower category of accommodation facilities from those facilities operated by the company Valamar in Poreč. Average hotel product quality is 2.85 while the Poreč section of the company has a 3.0 rating. An analysis into the structure of the capacity has shown that the average star hotels and camping sites are three stars while the category of apartment complexes is generally low 2 star category indicating the need for investments to achieve new quality in line with plans for positioning destination.
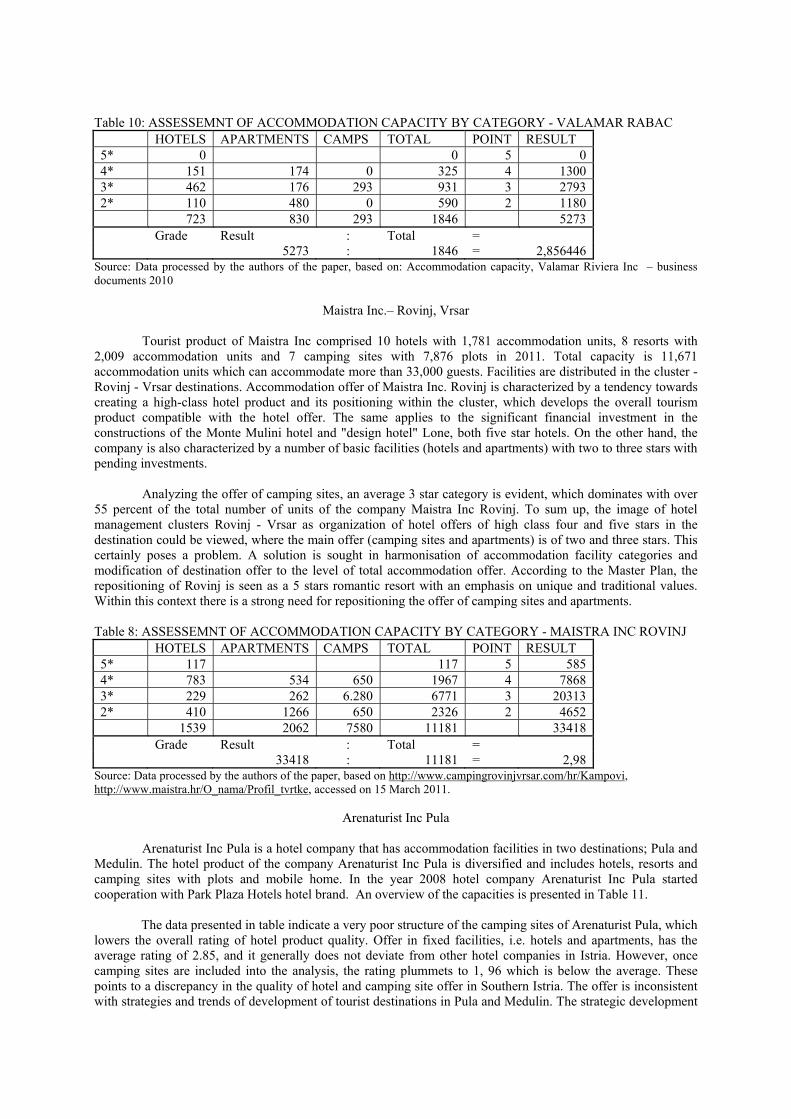
Table 10: ASSESSEMNT OF ACCOMMODATION CAPACITY BY CATEGORY - VALAMAR RABAC HOTELS APARTMENTS CAMPS TOTAL POINT RESULT 5* 0 0 5 0 4* 151 174 0 325 4 1300 3* 462 176 293 931 3 2793 2* 110 480 0 590 2 1180 723 830 293 1846 5273 Grade Result : Total = 5273 : 1846 = 2,856446
Source: Data processed by the authors of the paper, based on: Accommodation capacity, Valamar Riviera Inc – business documents 2010
Maistra Inc.– Rovinj, Vrsar
Tourist product of Maistra Inc comprised 10 hotels with 1,781 accommodation units, 8 resorts with 2,009 accommodation units and 7 camping sites with 7,876 plots in 2011. Total capacity is 11,671 accommodation units which can accommodate more than 33,000 guests. Facilities are distributed in the cluster - Rovinj - Vrsar destinations. Accommodation offer of Maistra Inc. Rovinj is characterized by a tendency towards creating a high-class hotel product and its positioning within the cluster, which develops the overall tourism product compatible with the hotel offer. The same applies to the significant financial investment in the constructions of the Monte Mulini hotel and "design hotel" Lone, both five star hotels. On the other hand, the company is also characterized by a number of basic facilities (hotels and apartments) with two to three stars with pending investments.
Analyzing the offer of camping sites, an average 3 star category is evident, which dominates with over
55 percent of the total number of units of the company Maistra Inc Rovinj. To sum up, the image of hotel management clusters Rovinj - Vrsar as organization of hotel offers of high class four and five stars in the destination could be viewed, where the main offer (camping sites and apartments) is of two and three stars. This certainly poses a problem. A solution is sought in harmonisation of accommodation facility categories and modification of destination offer to the level of total accommodation offer. According to the Master Plan, the repositioning of Rovinj is seen as a 5 stars romantic resort with an emphasis on unique and traditional values. Within this context there is a strong need for repositioning the offer of camping sites and apartments. Table 8: ASSESSEMNT OF ACCOMMODATION CAPACITY BY CATEGORY - MAISTRA INC ROVINJ HOTELS APARTMENTS CAMPS TOTAL POINT RESULT 5* 117 117 5 585 4* 783 534 650 1967 4 7868 3* 229 262 6.280 6771 3 20313 2* 410 1266 650 2326 2 4652 1539 2062 7580 11181 33418 Grade Result : Total = 33418 : 11181 = 2,98
Source: Data processed by the authors of the paper, based on http://www.campingrovinjvrsar.com/hr/Kampovi, http://www.maistra.hr/O_nama/Profil_tvrtke, accessed on 15 March 2011.
Arenaturist Inc Pula Arenaturist Inc Pula is a hotel company that has accommodation facilities in two destinations; Pula and Medulin. The hotel product of the company Arenaturist Inc Pula is diversified and includes hotels, resorts and camping sites with plots and mobile home. In the year 2008 hotel company Arenaturist Inc Pula started cooperation with Park Plaza Hotels hotel brand. An overview of the capacities is presented in Table 11.
The data presented in table indicate a very poor structure of the camping sites of Arenaturist Pula, which lowers the overall rating of hotel product quality. Offer in fixed facilities, i.e. hotels and apartments, has the average rating of 2.85, and it generally does not deviate from other hotel companies in Istria. However, once camping sites are included into the analysis, the rating plummets to 1, 96 which is below the average. These points to a discrepancy in the quality of hotel and camping site offer in Southern Istria. The offer is inconsistent with strategies and trends of development of tourist destinations in Pula and Medulin. The strategic development
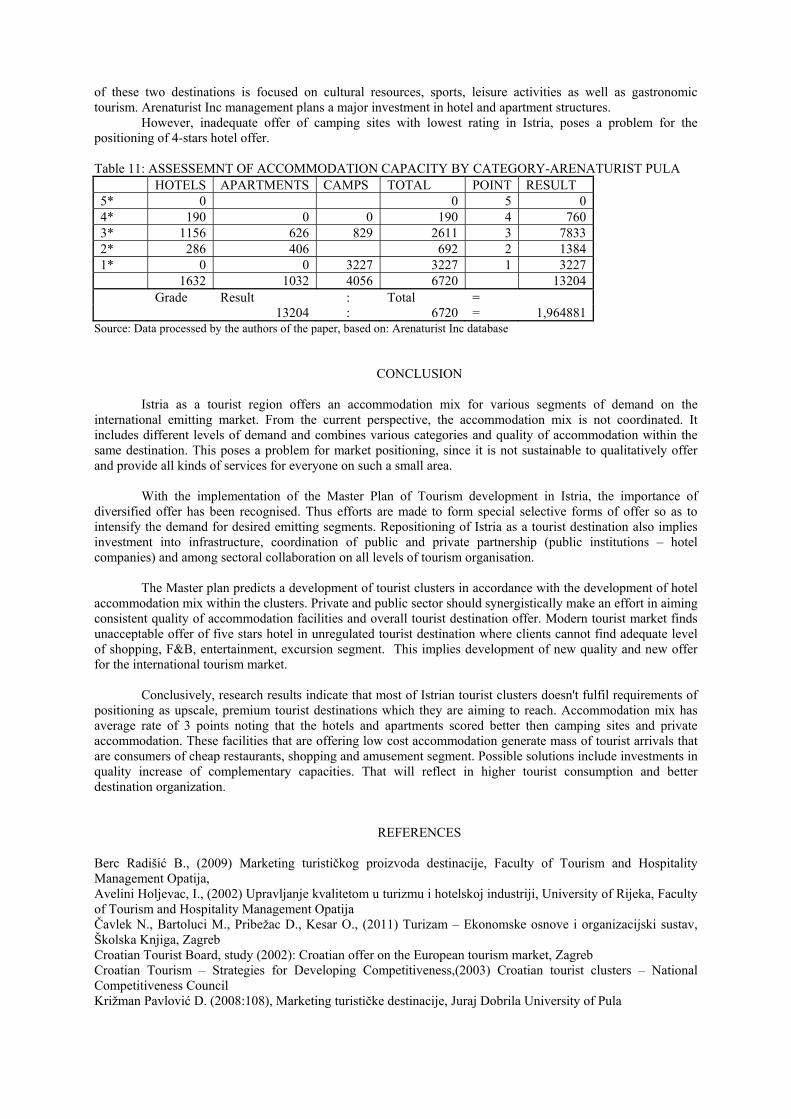
of these two destinations is focused on cultural resources, sports, leisure activities as well as gastronomic tourism. Arenaturist Inc management plans a major investment in hotel and apartment structures.
However, inadequate offer of camping sites with lowest rating in Istria, poses a problem for the positioning of 4-stars hotel offer.
Table 11: ASSESSEMNT OF ACCOMMODATION CAPACITY BY CATEGORY-ARENATURIST PULA HOTELS APARTMENTS CAMPS TOTAL POINT RESULT 5* 0 0 5 0 4* 190 0 0 190 4 760 3* 1156 626 829 2611 3 7833 2* 286 406 692 2 1384 1* 0 0 3227 3227 1 3227 1632 1032 4056 6720 13204 Grade Result : Total = 13204 : 6720 = 1,964881
Source: Data processed by the authors of the paper, based on: Arenaturist Inc database
CONCLUSION Istria as a tourist region offers an accommodation mix for various segments of demand on the
international emitting market. From the current perspective, the accommodation mix is not coordinated. It includes different levels of demand and combines various categories and quality of accommodation within the same destination. This poses a problem for market positioning, since it is not sustainable to qualitatively offer and provide all kinds of services for everyone on such a small area.
With the implementation of the Master Plan of Tourism development in Istria, the importance of
diversified offer has been recognised. Thus efforts are made to form special selective forms of offer so as to intensify the demand for desired emitting segments. Repositioning of Istria as a tourist destination also implies investment into infrastructure, coordination of public and private partnership (public institutions – hotel companies) and among sectoral collaboration on all levels of tourism organisation.
The Master plan predicts a development of tourist clusters in accordance with the development of hotel
accommodation mix within the clusters. Private and public sector should synergistically make an effort in aiming consistent quality of accommodation facilities and overall tourist destination offer. Modern tourist market finds unacceptable offer of five stars hotel in unregulated tourist destination where clients cannot find adequate level of shopping, F&B, entertainment, excursion segment. This implies development of new quality and new offer for the international tourism market.
Conclusively, research results indicate that most of Istrian tourist clusters doesn't fulfil requirements of
positioning as upscale, premium tourist destinations which they are aiming to reach. Accommodation mix has average rate of 3 points noting that the hotels and apartments scored better then camping sites and private accommodation. These facilities that are offering low cost accommodation generate mass of tourist arrivals that are consumers of cheap restaurants, shopping and amusement segment. Possible solutions include investments in quality increase of complementary capacities. That will reflect in higher tourist consumption and better destination organization.
REFERENCES
Berc Radišić B., (2009) Marketing turističkog proizvoda destinacije, Faculty of Tourism and Hospitality Management Opatija, Avelini Holjevac, I., (2002) Upravljanje kvalitetom u turizmu i hotelskoj industriji, University of Rijeka, Faculty of Tourism and Hospitality Management Opatija Čavlek N., Bartoluci M., Pribežac D., Kesar O., (2011) Turizam – Ekonomske osnove i organizacijski sustav, Školska Knjiga, Zagreb Croatian Tourist Board, study (2002): Croatian offer on the European tourism market, Zagreb Croatian Tourism – Strategies for Developing Competitiveness,(2003) Croatian tourist clusters – National Competitiveness Council Križman Pavlović D. (2008:108), Marketing turističke destinacije, Juraj Dobrila University of Pula
Magaš D., (2008) Destinacijski menadžment – Modeli i tehnike, Faculty of Tourism and Hospitality Management Opatija Pravilnik o razvrstavanju, kategorizaciji, posebnim standardima i posebnoj kvaliteti smještajnih objekata iz skupine hoteli, Ministry of Tourism, Republic of Croatia, NN 48/02 Pravilnik o razvrstavanju, kategorizaciji, posebnim standardima i posebnoj kvaliteti smještajnih objekata iz skupine kampovi i druge vrste objekata za smještaj, Ministry of Tourism, Republic of Croatia, NN 175/03 Master Plan of Tourism – Istria, 2004.-2012., (2003) THR Barcelona, Horwath Consulting, Zagreb Hotel companies business documents: Maistra Inc., Arenaturist Inc, Maslinica Inc, Valamar Inc. http://www.istra-istria.hr/masterplan/ [Accessed the 16th March 2012. 23:30] http://www2.hgk.hr/komora/hrv/zupkom/split/hgkcms/images/Analiza_hotelijerstvo_finalno.pdf, [Accessed the 18th July 2012. 16:00] http://www.iztzg.hr/ [Accessed the 22nd February 2012. 18:30] http://www.htz.hr [Accessed the 22nd February 2012. 18:30] http://www.mint.hr [Accessed the 17th March 2012. 00:30] http:// www.mint.hr [Accessed the 15th January 2012. 17:00] http:// www.arenaturist.hr [Accessed the 16th March 2012. 23:00] http:// www.istraturist.hr [Accessed the 16th March 2012. 23:30] http://www.laguna-novigrad.hr [Accessed the 16th March 2012. 21:00] http://www.plavalaguna.hr/hr/Hoteli [Accessed the 15th March 2012. 19:00] http://www.campingrovinjvrsar.com/hr/Kampovi [Accessed the 15th March 2012. 11:30] http://www.maistra.hr/O_nama/Profil_tvrtke [Accessed the 15th March 2012. 11:00]
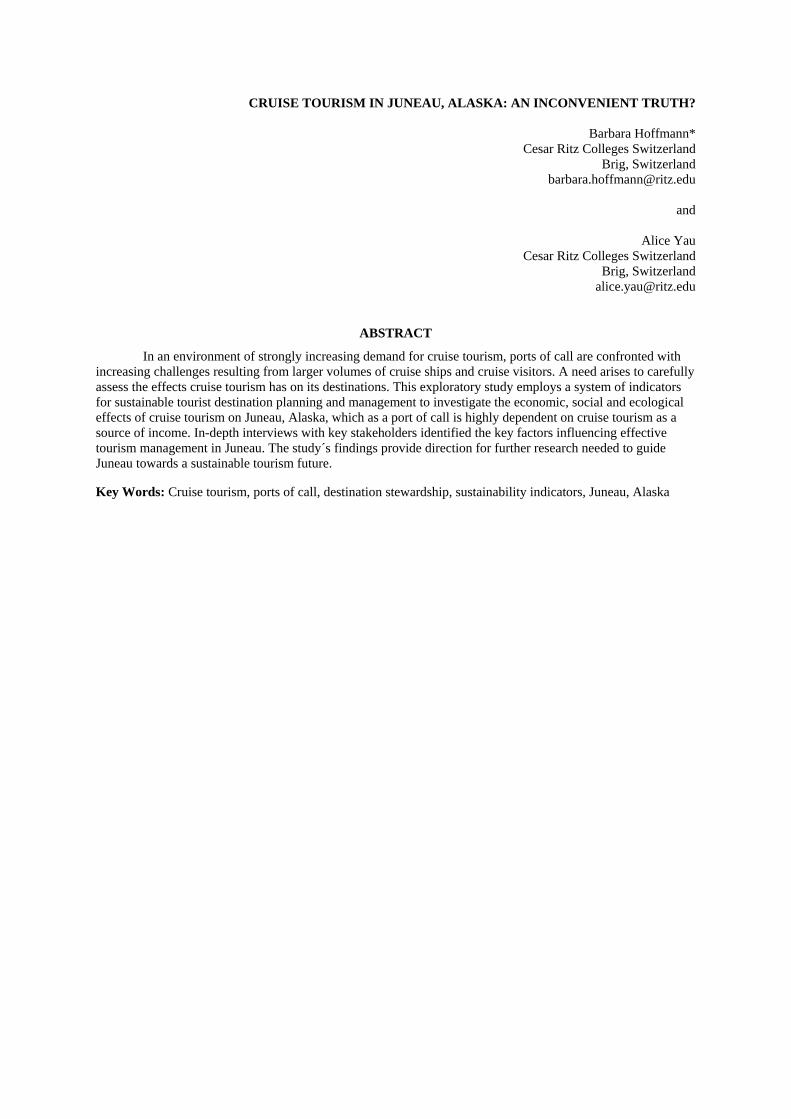
CRUISE TOURISM IN JUNEAU, ALASKA: AN INCONVENIENT TRUTH?
Barbara Hoffmann* Cesar Ritz Colleges Switzerland
Brig, Switzerland [email protected]
and
Alice Yau
Cesar Ritz Colleges Switzerland Brig, Switzerland
ABSTRACT
In an environment of strongly increasing demand for cruise tourism, ports of call are confronted with increasing challenges resulting from larger volumes of cruise ships and cruise visitors. A need arises to carefully assess the effects cruise tourism has on its destinations. This exploratory study employs a system of indicators for sustainable tourist destination planning and management to investigate the economic, social and ecological effects of cruise tourism on Juneau, Alaska, which as a port of call is highly dependent on cruise tourism as a source of income. In-depth interviews with key stakeholders identified the key factors influencing effective tourism management in Juneau. The study´s findings provide direction for further research needed to guide Juneau towards a sustainable tourism future.
Key Words: Cruise tourism, ports of call, destination stewardship, sustainability indicators, Juneau, Alaska
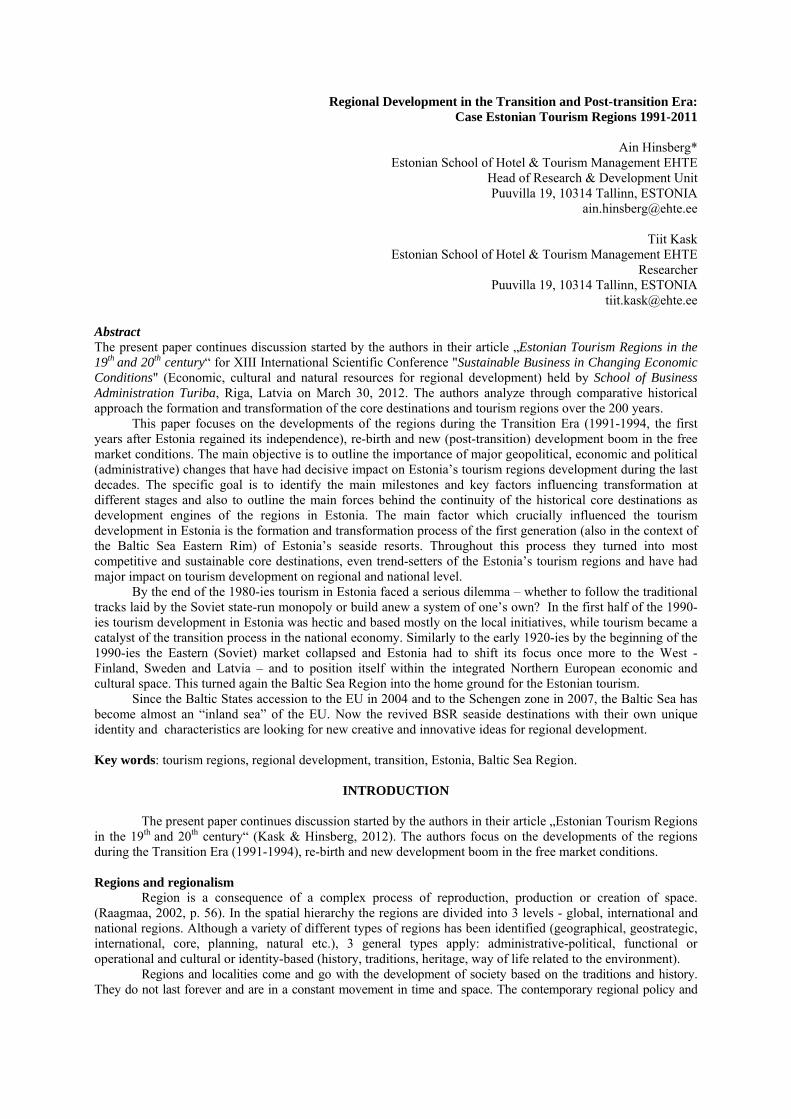
Regional Development in the Transition and Post-transition Era: Case Estonian Tourism Regions 1991-2011
Ain Hinsberg*
Estonian School of Hotel & Tourism Management EHTE Head of Research & Development Unit Puuvilla 19, 10314 Tallinn, ESTONIA
Tiit Kask Estonian School of Hotel & Tourism Management EHTE
Researcher Puuvilla 19, 10314 Tallinn, ESTONIA
[email protected] Abstract The present paper continues discussion started by the authors in their article „Estonian Tourism Regions in the 19th and 20th century“ for XIII International Scientific Conference "Sustainable Business in Changing Economic Conditions" (Economic, cultural and natural resources for regional development) held by School of Business Administration Turiba, Riga, Latvia on March 30, 2012. The authors analyze through comparative historical approach the formation and transformation of the core destinations and tourism regions over the 200 years.
This paper focuses on the developments of the regions during the Transition Era (1991-1994, the first years after Estonia regained its independence), re-birth and new (post-transition) development boom in the free market conditions. The main objective is to outline the importance of major geopolitical, economic and political (administrative) changes that have had decisive impact on Estonia’s tourism regions development during the last decades. The specific goal is to identify the main milestones and key factors influencing transformation at different stages and also to outline the main forces behind the continuity of the historical core destinations as development engines of the regions in Estonia. The main factor which crucially influenced the tourism development in Estonia is the formation and transformation process of the first generation (also in the context of the Baltic Sea Eastern Rim) of Estonia’s seaside resorts. Throughout this process they turned into most competitive and sustainable core destinations, even trend-setters of the Estonia’s tourism regions and have had major impact on tourism development on regional and national level.
By the end of the 1980-ies tourism in Estonia faced a serious dilemma – whether to follow the traditional tracks laid by the Soviet state-run monopoly or build anew a system of one’s own? In the first half of the 1990-ies tourism development in Estonia was hectic and based mostly on the local initiatives, while tourism became a catalyst of the transition process in the national economy. Similarly to the early 1920-ies by the beginning of the 1990-ies the Eastern (Soviet) market collapsed and Estonia had to shift its focus once more to the West - Finland, Sweden and Latvia – and to position itself within the integrated Northern European economic and cultural space. This turned again the Baltic Sea Region into the home ground for the Estonian tourism.
Since the Baltic States accession to the EU in 2004 and to the Schengen zone in 2007, the Baltic Sea has become almost an “inland sea” of the EU. Now the revived BSR seaside destinations with their own unique identity and characteristics are looking for new creative and innovative ideas for regional development.
Key words: tourism regions, regional development, transition, Estonia, Baltic Sea Region.
INTRODUCTION
The present paper continues discussion started by the authors in their article „Estonian Tourism Regions in the 19th and 20th century“ (Kask & Hinsberg, 2012). The authors focus on the developments of the regions during the Transition Era (1991-1994), re-birth and new development boom in the free market conditions.
Regions and regionalism
Region is a consequence of a complex process of reproduction, production or creation of space. (Raagmaa, 2002, p. 56). In the spatial hierarchy the regions are divided into 3 levels - global, international and national regions. Although a variety of different types of regions has been identified (geographical, geostrategic, international, core, planning, natural etc.), 3 general types apply: administrative-political, functional or operational and cultural or identity-based (history, traditions, heritage, way of life related to the environment).
Regions and localities come and go with the development of society based on the traditions and history. They do not last forever and are in a constant movement in time and space. The contemporary regional policy and
regional science application cause constant re-thinking, re-defining, re-orientation and therefore also re-birth of the regions and principles of regionalism.
The genesis and development of regions can be viewed based on the significant historical breakpoints, which have generated new spatial meanings, social practices – geopolitical and economic situations – or a story of inception and development of more complex bundles (Jauhiainen, 2000, p.19) as a result of historical upheavals. Pivotal events in history (in most cases wars) as historical breakpoints, which decided, who reigned in Estonia (or was regarded as the ruler) have on several occasions turned around the geopolitical and economic orientation of Estonia by mostly switching between the East and the West.
After Estonia re-gained its indepence the geopolitical practice has been based on the common identity (reliance on continuity of statehood, language, culture and ethnic characteristics). Estonia has been depicted without exception as a part of Europe in historical, cultural, geographic and economic sense. (Berg, 2002, p.179)
At the same time Estonia places itself most of all in the Northern Europe (not Central or Eastern) and tries to join the family of Nordic countries in order to leave behind the image of a Baltic country. In 1999 The President1 of Estonia Toomas Henrik Ilves stated 2 that “It is time that we recognize that we are dealing with three very different countries in the Baltic area, with completely different affinities. There is no Baltic identity with a common culture, language group, religious traditions.” Instead he argued that there was a need for a paradigm shift “in the mental geography of the Nordic region” that would be inclusive of Estonia (Hall et al. 2009, p. 245-246). In 2011 Lithuania’s prime minister Andrius Kubilius declared in a meeting in Tallinn: “In strategies that we are developing for the next twenty years emphasize that it is important for the Baltic States to become more harmonized and catch up with Scandinavian countries. Integration with Nordic countries is an important objective.” (Myhre, 2012).
Being a member of EU, NATO (and also Schengen and EURozone) it is very important to monitor the geopolitical position, related practices and image of Estonia in the multi-cultural society in constant development (Berg, 2002). What is and will be the geopolitical identity and position of the multi-cultural Estonia ? Are we the so-called connector – a bridge between the West and Russia, a state on the great divide between the civilizations (on the Eastern border of the Huntington’s Western civilization in Europe)3, a new NATO border state – Estonia as the strategic contact zone between Russia and NATO filling the strategic gap east of the Baltic Sea? Or based on Dominique Moϊs’ (2010) geopolitics of emotions we will try to overcome our fears and humiliations and invest in good will and into the concept of balance built on the independence and active policy of neutrality and good neighborly relationships with the surrounding states ? The latter is of utmost importance in the context of competitive and sustainable tourism development.
This paper deals with the context of international and national regionalism in Estonian tourism. As far as the internatinal dimension is concerned, Estonia belongs to the Baltic Sea Region (BSR), which from the tourism point of view is the most important international regional dimension - our common playground – historical (meaning traditional) region – economic and cultural space.
According to Martinsone4 (as cited in Hall et al., 2009, p. 246) the word „Baltic“ might have different meanings in the region – the sea, the three Baltic States, the eastern coast of the sea and so on, but for the rest of the world there is only the Baltic Sea Region associated with the Baltic Sea and nations surrounded.
Both BSR and Estonian tourism regions are in their essence the mix of operational and cultural and indentity regions based on the Baltic Sea – the most powerful element of their entity and identity influencing their way of life and living environment.
National region is defined in the context of the present paper based on the administrative, public policy or analytical purposes as an integral part of the national territory defined by internal cohesiveness or common features. Terms of reference for Estonia’s domestic regional policy, its strategic goals and implementation of tactics and practices was generated during the transition period (1991-94). The first document as the basis for regional policy was the Regional Policy Concept approved by the Government of the Republic in 1994.
HISTORICAL RETROSPECT
The 18-20th century history in Estonia including tourism development can be divided into periods between different wars, which shifted Estonia’s oritentation towards the East or West. (See Fig. 1.) Because of
1 Then Foreign Minister 2 “Estonia as a Nordic Country” – speech to the Swedish Institute for International Affairs in December, 1999. (Hall et al., 2009) 3 Huntington declared in his article "The Collision of Civilizations?", that "the main splits and conflicts in the human society are cultural in their nature“ and "the future battlefields will be the breaking lines between civilizations" (Journal "Foreign Affairs" in 1993, translated into Estonian in 1995 in the journal "Akadeemia"). 4 Coordinator of Project Balticness for the Council of Baltic Sea States (CBSS).
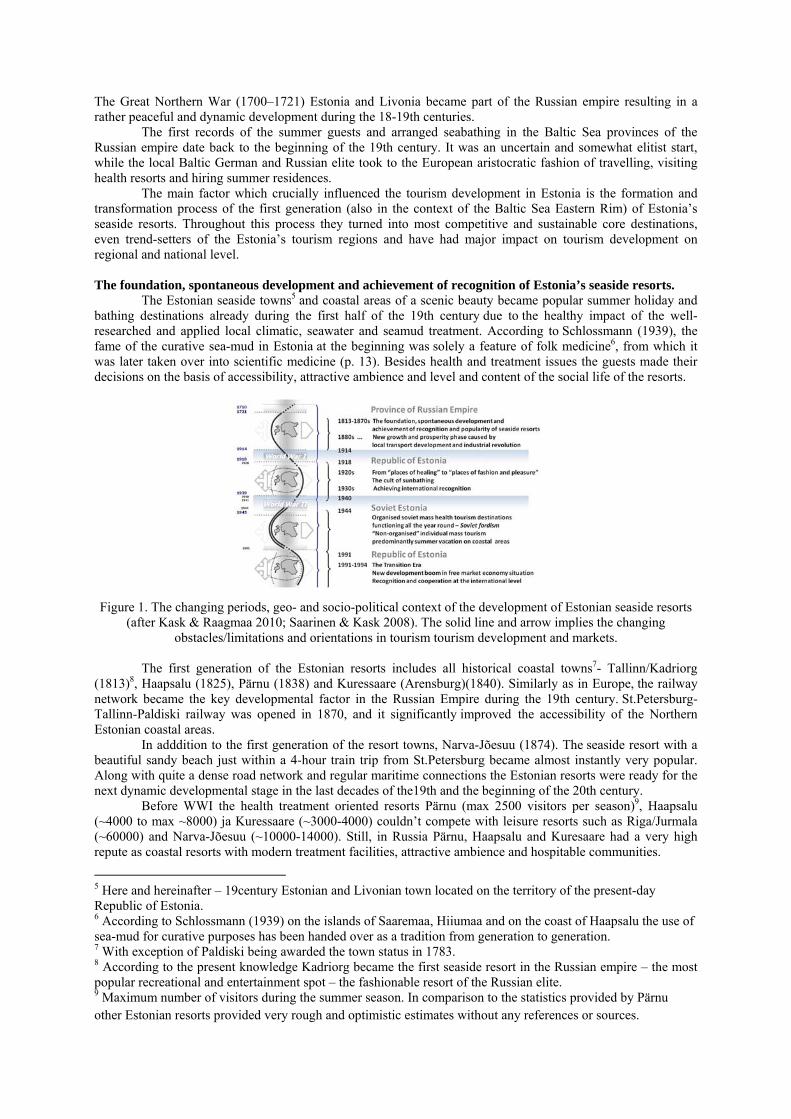
The Great Northern War (1700–1721) Estonia and Livonia became part of the Russian empire resulting in a rather peaceful and dynamic development during the 18-19th centuries.
The first records of the summer guests and arranged seabathing in the Baltic Sea provinces of the Russian empire date back to the beginning of the 19th century. It was an uncertain and somewhat elitist start, while the local Baltic German and Russian elite took to the European aristocratic fashion of travelling, visiting health resorts and hiring summer residences.
The main factor which crucially influenced the tourism development in Estonia is the formation and transformation process of the first generation (also in the context of the Baltic Sea Eastern Rim) of Estonia’s seaside resorts. Throughout this process they turned into most competitive and sustainable core destinations, even trend-setters of the Estonia’s tourism regions and have had major impact on tourism development on regional and national level.
The foundation, spontaneous development and achievement of recognition of Estonia’s seaside resorts.
The Estonian seaside towns5 and coastal areas of a scenic beauty became popular summer holiday and bathing destinations already during the first half of the 19th century due to the healthy impact of the well-researched and applied local climatic, seawater and seamud treatment. According to Schlossmann (1939), the fame of the curative sea-mud in Estonia at the beginning was solely a feature of folk medicine6, from which it was later taken over into scientific medicine (p. 13). Besides health and treatment issues the guests made their decisions on the basis of accessibility, attractive ambience and level and content of the social life of the resorts.
Figure 1. The changing periods, geo- and socio-political context of the development of Estonian seaside resorts
(after Kask & Raagmaa 2010; Saarinen & Kask 2008). The solid line and arrow implies the changing obstacles/limitations and orientations in tourism tourism development and markets.
The first generation of the Estonian resorts includes all historical coastal towns7- Tallinn/Kadriorg
(1813)8, Haapsalu (1825), Pärnu (1838) and Kuressaare (Arensburg)(1840). Similarly as in Europe, the railway network became the key developmental factor in the Russian Empire during the 19th century. St.Petersburg-Tallinn-Paldiski railway was opened in 1870, and it significantly improved the accessibility of the Northern Estonian coastal areas.
In adddition to the first generation of the resort towns, Narva-Jõesuu (1874). The seaside resort with a beautiful sandy beach just within a 4-hour train trip from St.Petersburg became almost instantly very popular. Along with quite a dense road network and regular maritime connections the Estonian resorts were ready for the next dynamic developmental stage in the last decades of the19th and the beginning of the 20th century.
Before WWI the health treatment oriented resorts Pärnu (max 2500 visitors per season)9, Haapsalu (~4000 to max ~8000) ja Kuressaare (~3000-4000) couldn’t compete with leisure resorts such as Riga/Jurmala (~60000) and Narva-Jõesuu (~10000-14000). Still, in Russia Pärnu, Haapsalu and Kuresaare had a very high repute as coastal resorts with modern treatment facilities, attractive ambience and hospitable communities.
5 Here and hereinafter – 19century Estonian and Livonian town located on the territory of the present-day Republic of Estonia. 6 According to Schlossmann (1939) on the islands of Saaremaa, Hiiumaa and on the coast of Haapsalu the use of sea-mud for curative purposes has been handed over as a tradition from generation to generation. 7 With exception of Paldiski being awarded the town status in 1783. 8 According to the present knowledge Kadriorg became the first seaside resort in the Russian empire – the most popular recreational and entertainment spot – the fashionable resort of the Russian elite. 9 Maximum number of visitors during the summer season. In comparison to the statistics provided by Pärnu other Estonian resorts provided very rough and optimistic estimates without any references or sources.
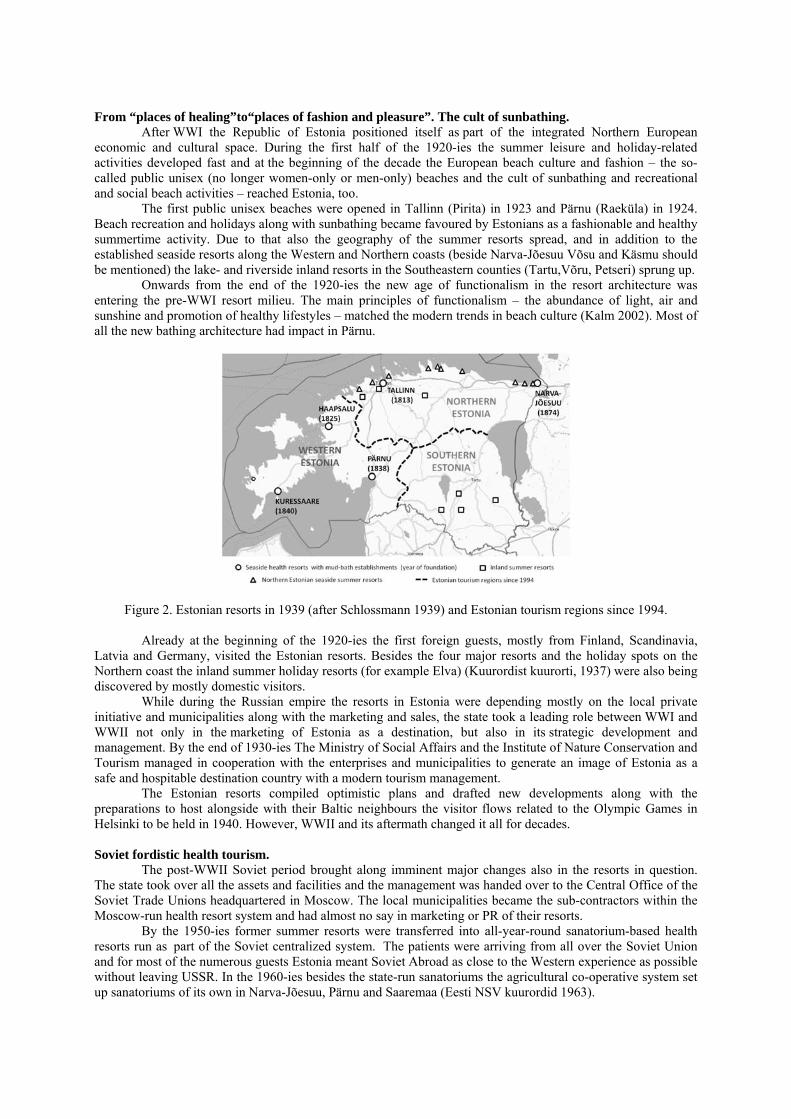
From “places of healing”to“places of fashion and pleasure”. The cult of sunbathing.
After WWI the Republic of Estonia positioned itself as part of the integrated Northern European economic and cultural space. During the first half of the 1920-ies the summer leisure and holiday-related activities developed fast and at the beginning of the decade the European beach culture and fashion – the so-called public unisex (no longer women-only or men-only) beaches and the cult of sunbathing and recreational and social beach activities – reached Estonia, too.
The first public unisex beaches were opened in Tallinn (Pirita) in 1923 and Pärnu (Raeküla) in 1924. Beach recreation and holidays along with sunbathing became favoured by Estonians as a fashionable and healthy summertime activity. Due to that also the geography of the summer resorts spread, and in addition to the established seaside resorts along the Western and Northern coasts (beside Narva-Jõesuu Võsu and Käsmu should be mentioned) the lake- and riverside inland resorts in the Southeastern counties (Tartu,Võru, Petseri) sprung up.
Onwards from the end of the 1920-ies the new age of functionalism in the resort architecture was entering the pre-WWI resort milieu. The main principles of functionalism – the abundance of light, air and sunshine and promotion of healthy lifestyles – matched the modern trends in beach culture (Kalm 2002). Most of all the new bathing architecture had impact in Pärnu.
Figure 2. Estonian resorts in 1939 (after Schlossmann 1939) and Estonian tourism regions since 1994. Already at the beginning of the 1920-ies the first foreign guests, mostly from Finland, Scandinavia,
Latvia and Germany, visited the Estonian resorts. Besides the four major resorts and the holiday spots on the Northern coast the inland summer holiday resorts (for example Elva) (Kuurordist kuurorti, 1937) were also being discovered by mostly domestic visitors.
While during the Russian empire the resorts in Estonia were depending mostly on the local private initiative and municipalities along with the marketing and sales, the state took a leading role between WWI and WWII not only in the marketing of Estonia as a destination, but also in its strategic development and management. By the end of 1930-ies The Ministry of Social Affairs and the Institute of Nature Conservation and Tourism managed in cooperation with the enterprises and municipalities to generate an image of Estonia as a safe and hospitable destination country with a modern tourism management.
The Estonian resorts compiled optimistic plans and drafted new developments along with the preparations to host alongside with their Baltic neighbours the visitor flows related to the Olympic Games in Helsinki to be held in 1940. However, WWII and its aftermath changed it all for decades.
Soviet fordistic health tourism.
The post-WWII Soviet period brought along imminent major changes also in the resorts in question. The state took over all the assets and facilities and the management was handed over to the Central Office of the Soviet Trade Unions headquartered in Moscow. The local municipalities became the sub-contractors within the Moscow-run health resort system and had almost no say in marketing or PR of their resorts.
By the 1950-ies former summer resorts were transferred into all-year-round sanatorium-based health resorts run as part of the Soviet centralized system. The patients were arriving from all over the Soviet Union and for most of the numerous guests Estonia meant Soviet Abroad as close to the Western experience as possible without leaving USSR. In the 1960-ies besides the state-run sanatoriums the agricultural co-operative system set up sanatoriums of its own in Narva-Jõesuu, Pärnu and Saaremaa (Eesti NSV kuurordid 1963).
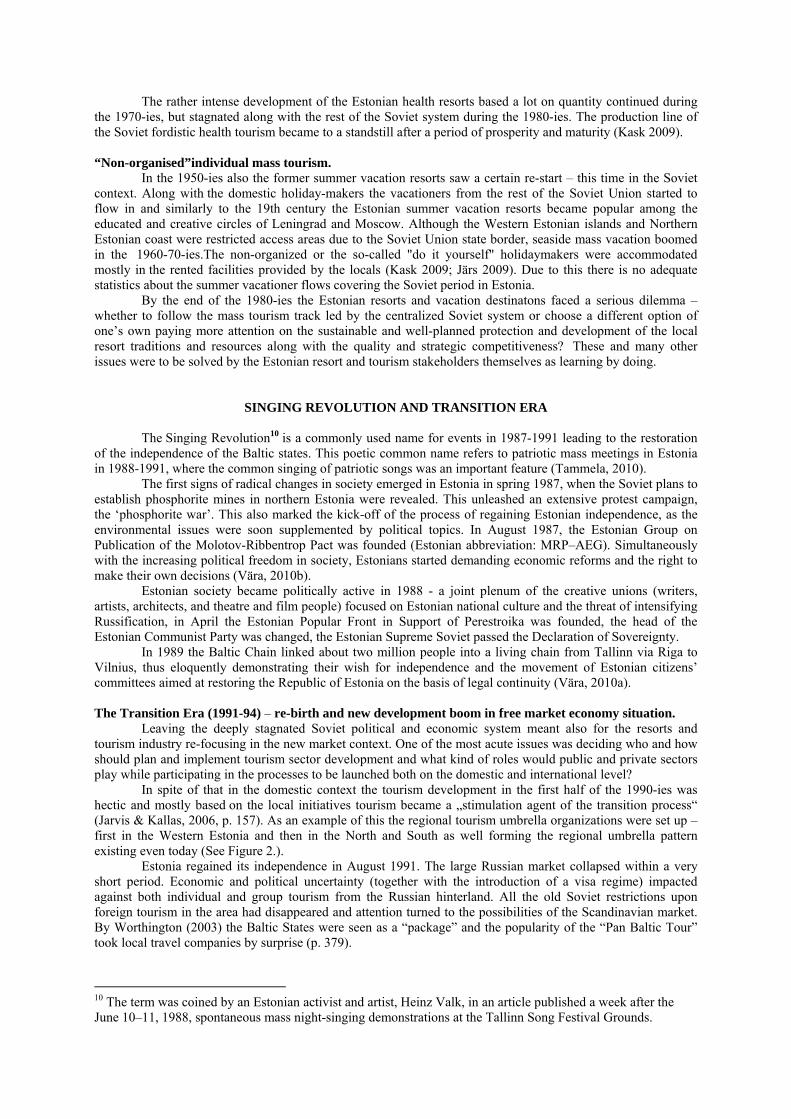
The rather intense development of the Estonian health resorts based a lot on quantity continued during the 1970-ies, but stagnated along with the rest of the Soviet system during the 1980-ies. The production line of the Soviet fordistic health tourism became to a standstill after a period of prosperity and maturity (Kask 2009).
“Non-organised”individual mass tourism.
In the 1950-ies also the former summer vacation resorts saw a certain re-start – this time in the Soviet context. Along with the domestic holiday-makers the vacationers from the rest of the Soviet Union started to flow in and similarly to the 19th century the Estonian summer vacation resorts became popular among the educated and creative circles of Leningrad and Moscow. Although the Western Estonian islands and Northern Estonian coast were restricted access areas due to the Soviet Union state border, seaside mass vacation boomed in the 1960-70-ies.The non-organized or the so-called "do it yourself" holidaymakers were accommodated mostly in the rented facilities provided by the locals (Kask 2009; Järs 2009). Due to this there is no adequate statistics about the summer vacationer flows covering the Soviet period in Estonia.
By the end of the 1980-ies the Estonian resorts and vacation destinatons faced a serious dilemma – whether to follow the mass tourism track led by the centralized Soviet system or choose a different option of one’s own paying more attention on the sustainable and well-planned protection and development of the local resort traditions and resources along with the quality and strategic competitiveness? These and many other issues were to be solved by the Estonian resort and tourism stakeholders themselves as learning by doing.
SINGING REVOLUTION AND TRANSITION ERA
The Singing Revolution10 is a commonly used name for events in 1987-1991 leading to the restoration of the independence of the Baltic states. This poetic common name refers to patriotic mass meetings in Estonia in 1988-1991, where the common singing of patriotic songs was an important feature (Tammela, 2010).
The first signs of radical changes in society emerged in Estonia in spring 1987, when the Soviet plans to establish phosphorite mines in northern Estonia were revealed. This unleashed an extensive protest campaign, the ‘phosphorite war’. This also marked the kick-off of the process of regaining Estonian independence, as the environmental issues were soon supplemented by political topics. In August 1987, the Estonian Group on Publication of the Molotov-Ribbentrop Pact was founded (Estonian abbreviation: MRP–AEG). Simultaneously with the increasing political freedom in society, Estonians started demanding economic reforms and the right to make their own decisions (Vära, 2010b).
Estonian society became politically active in 1988 - a joint plenum of the creative unions (writers, artists, architects, and theatre and film people) focused on Estonian national culture and the threat of intensifying Russification, in April the Estonian Popular Front in Support of Perestroika was founded, the head of the Estonian Communist Party was changed, the Estonian Supreme Soviet passed the Declaration of Sovereignty.
In 1989 the Baltic Chain linked about two million people into a living chain from Tallinn via Riga to Vilnius, thus eloquently demonstrating their wish for independence and the movement of Estonian citizens’ committees aimed at restoring the Republic of Estonia on the basis of legal continuity (Vära, 2010a).
The Transition Era (1991-94) – re-birth and new development boom in free market economy situation.
Leaving the deeply stagnated Soviet political and economic system meant also for the resorts and tourism industry re-focusing in the new market context. One of the most acute issues was deciding who and how should plan and implement tourism sector development and what kind of roles would public and private sectors play while participating in the processes to be launched both on the domestic and international level?
In spite of that in the domestic context the tourism development in the first half of the 1990-ies was hectic and mostly based on the local initiatives tourism became a „stimulation agent of the transition process“ (Jarvis & Kallas, 2006, p. 157). As an example of this the regional tourism umbrella organizations were set up – first in the Western Estonia and then in the North and South as well forming the regional umbrella pattern existing even today (See Figure 2.).
Estonia regained its independence in August 1991. The large Russian market collapsed within a very short period. Economic and political uncertainty (together with the introduction of a visa regime) impacted against both individual and group tourism from the Russian hinterland. All the old Soviet restrictions upon foreign tourism in the area had disappeared and attention turned to the possibilities of the Scandinavian market. By Worthington (2003) the Baltic States were seen as a “package” and the popularity of the “Pan Baltic Tour” took local travel companies by surprise (p. 379).
10 The term was coined by an Estonian activist and artist, Heinz Valk, in an article published a week after the June 10–11, 1988, spontaneous mass night-singing demonstrations at the Tallinn Song Festival Grounds.
The specific goal is to identify the main milestones and key factors influencing transformation at different stages and also to outline the main forces behind the continuity of the historical core destinations as development engines of the regions in Estonia. During the 1990–ies the national tourism policy was implemented by the National Tourism Board11 (NTB) - initially under the ministries of culture and trade. Strange as it sounds, during the very first years of re-independence, the national-level tourism umbrella was not set up and run by the state, but the travel companies. The Association of Estonian Travel Agents (ETFL) was founded already in 1990 - before Estonia regained independence and since there was no formal state-level tourism organization until 1993, ETFL acted as one.
In 1992 the government approved the main directions of tourism development (among other issues declaring tourism an economic priority in the export context), which was followed in 1993 by the NTB being moved under the Ministry of Economic Affairs. The main task of the NTB was to enhance the development of incoming and domestic tourism, participate in the formulation of the tourism policy and development planning, promoting Estonian tourism abroad, develop tourism information system and analyze tourism development.
During the period of transition the dominant feature in the state-run organizing, coordinating and funding of tourism was Tallinn/NTB-centered approach, which was also mirrored in marketing Estonia as a destination. The central structures had no relevant awareness of what was going on in the counties and developing and coordinating tourism in the counties depended mostly on the initiative of the county administrations, local municipalities and community. Unfortunately NTB failed to act as a state-level and nation-wide coordinator of the tourism between the regions, counties, municipalities and other related stakeholder organizations during the fast development processes of transition. The Tallinn-based tourism stakeholders underestimated the local initiative and took a very sceptic approach towards cooperation with them. The capacity of the Board to run the implementation of the tourism was also hindered by constant political debates regarding its status, mission and funding in the Government and Parliament.
Beside being obliged to compensate for the state-level short-handedness in tourism system, the radical changes in the status and activities of country administrations and local municipalities created the preconditions for rapid development of recreation and tourism on the regional and local level. In this situation and under these conditions the Western Estonia took a flying start and had an advantage even before that in comparison with other regions due to the fact of having traditional seaside resorts of Haapsalu, Kuressaare and Pärnu.
The long-term experience and traditions in hospitality and hospitability of local community and entrepreneural mindset of the local people setting up SME-s to meet the opportunities provided by the arrival of the market economy gave a fresh re-start to these destinations. As the administrative centres of the counties in these resorts also were the core destionations or destination cores of the counties as tourism destinations.
Pärnu and Lääne counties focused their tourism development – both system- and organization-wise on their county centres as hubs – the resorts of Pärnu and Haapsalu. On the islands the approach was more based on dealing with a county as an integrated destination involving a network of locations, sites, sights and providers.
The county-level umbrella organizations - Association “Haapsalu Turism” (Lääne county, founded 1991), The Union of Recreation Firms of Saaremaa (Saare county, founded 1993), NGO “Hiiumaa Turism” (Hiiu county) and Pärnu Tourism Development Centre (PTDC, Pärnu county, founded 1992) - founded in 1993 the first regional tourism umbrella in the re-independent Estonia - Estonian Tourism West Coast Division. The main activities of the division were marketing (integrated regional image and message in the media and at the fairs) and development and training projects. The first public presentation of the division took place at the national travel fair TOUREST´93 in Tallinn in September 1993.
Association Keep the Estonian Sea Tidy became a key strategic cooperation partner for the division as beside coordinating the development of maritime tourism and guest harbours the association also represented Foundation for Environmental Education (FEE12) and European Blue Flag in Estonia.
The regional initiative in Western Estonia boosted the development of similar stakeholder networks and umbrella organizations in other regions as well and this in turn provided a foundation for the systematic cooperation with the NTB.
Parallel to the development of cooperation between the capital and the counties and the related tourism information system the contacts and cooperation between the counties developed as well, which in turn provided an opportunity for establishing a cooperation body representing all 3 regional tourism umbrella organizations – the West (counties of Pärnu, Saare, Lääne and Hiiu), South (counties of Tartu, Valga, Võru, Põlva, Viljandi and Jõgeva) and North (counties of Harju, Järva, Ida-Viru, Lääne-Viru and Rapla). For the first time Estonia was presented by the NTB consisting of three regions in 1994 in the Via Baltica News 2 (1994).
11 The State Tourist Board founded in 1993 (later Enterprise Estonia Tourism Agency and Enterprise Estonia Estonian Tourist Board) used to be a member of the Baltic Sea Tourism Commission and UN World Tourism Organization and is a member of the European Travel Commission since 1998. 12 Since 2000 Foundation for Environmental Education (Fee) is a non-government, non-profit organisation promoting sustainable development through environmental education. http://www.fee-international.org.
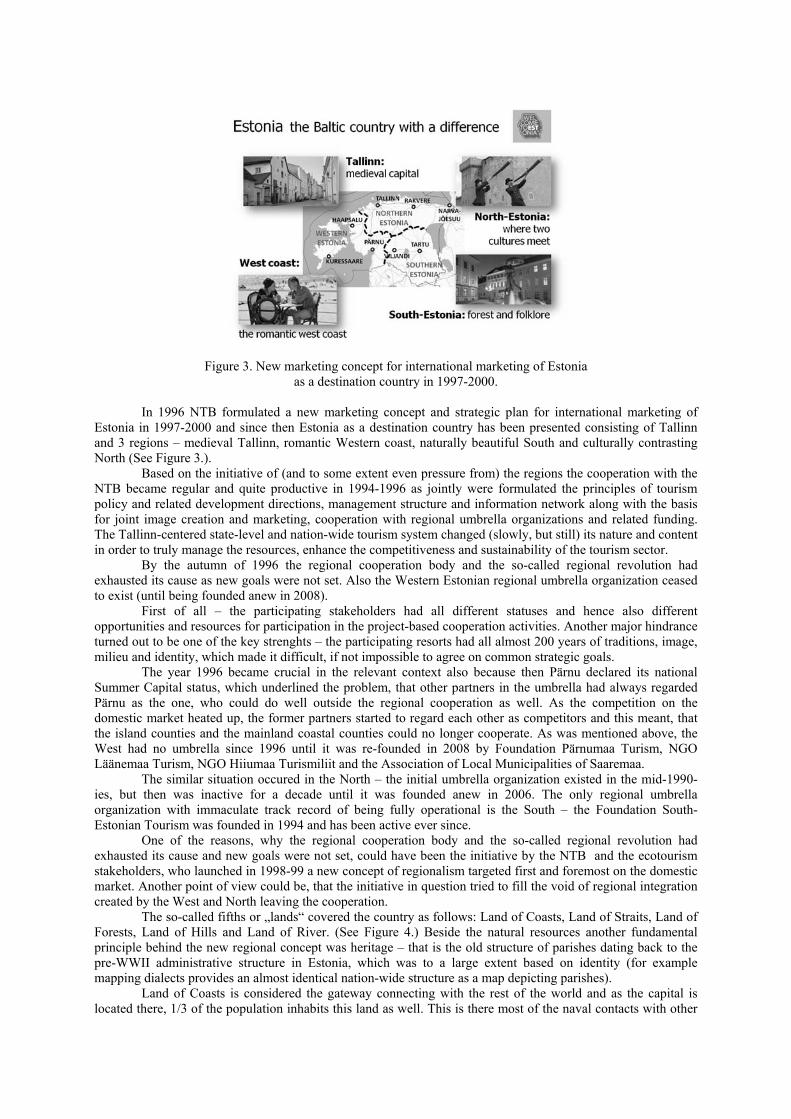
Figure 3. New marketing concept for international marketing of Estonia as a destination country in 1997-2000.
In 1996 NTB formulated a new marketing concept and strategic plan for international marketing of
Estonia in 1997-2000 and since then Estonia as a destination country has been presented consisting of Tallinn and 3 regions – medieval Tallinn, romantic Western coast, naturally beautiful South and culturally contrasting North (See Figure 3.).
Based on the initiative of (and to some extent even pressure from) the regions the cooperation with the NTB became regular and quite productive in 1994-1996 as jointly were formulated the principles of tourism policy and related development directions, management structure and information network along with the basis for joint image creation and marketing, cooperation with regional umbrella organizations and related funding. The Tallinn-centered state-level and nation-wide tourism system changed (slowly, but still) its nature and content in order to truly manage the resources, enhance the competitiveness and sustainability of the tourism sector.
By the autumn of 1996 the regional cooperation body and the so-called regional revolution had exhausted its cause as new goals were not set. Also the Western Estonian regional umbrella organization ceased to exist (until being founded anew in 2008).
First of all – the participating stakeholders had all different statuses and hence also different opportunities and resources for participation in the project-based cooperation activities. Another major hindrance turned out to be one of the key strenghts – the participating resorts had all almost 200 years of traditions, image, milieu and identity, which made it difficult, if not impossible to agree on common strategic goals.
The year 1996 became crucial in the relevant context also because then Pärnu declared its national Summer Capital status, which underlined the problem, that other partners in the umbrella had always regarded Pärnu as the one, who could do well outside the regional cooperation as well. As the competition on the domestic market heated up, the former partners started to regard each other as competitors and this meant, that the island counties and the mainland coastal counties could no longer cooperate. As was mentioned above, the West had no umbrella since 1996 until it was re-founded in 2008 by Foundation Pärnumaa Turism, NGO Läänemaa Turism, NGO Hiiumaa Turismiliit and the Association of Local Municipalities of Saaremaa.
The similar situation occured in the North – the initial umbrella organization existed in the mid-1990-ies, but then was inactive for a decade until it was founded anew in 2006. The only regional umbrella organization with immaculate track record of being fully operational is the South – the Foundation South-Estonian Tourism was founded in 1994 and has been active ever since.
One of the reasons, why the regional cooperation body and the so-called regional revolution had exhausted its cause and new goals were not set, could have been the initiative by the NTB and the ecotourism stakeholders, who launched in 1998-99 a new concept of regionalism targeted first and foremost on the domestic market. Another point of view could be, that the initiative in question tried to fill the void of regional integration created by the West and North leaving the cooperation.
The so-called fifths or „lands“ covered the country as follows: Land of Coasts, Land of Straits, Land of Forests, Land of Hills and Land of River. (See Figure 4.) Beside the natural resources another fundamental principle behind the new regional concept was heritage – that is the old structure of parishes dating back to the pre-WWII administrative structure in Estonia, which was to a large extent based on identity (for example mapping dialects provides an almost identical nation-wide structure as a map depicting parishes).
Land of Coasts is considered the gateway connecting with the rest of the world and as the capital is located there, 1/3 of the population inhabits this land as well. This is there most of the naval contacts with other
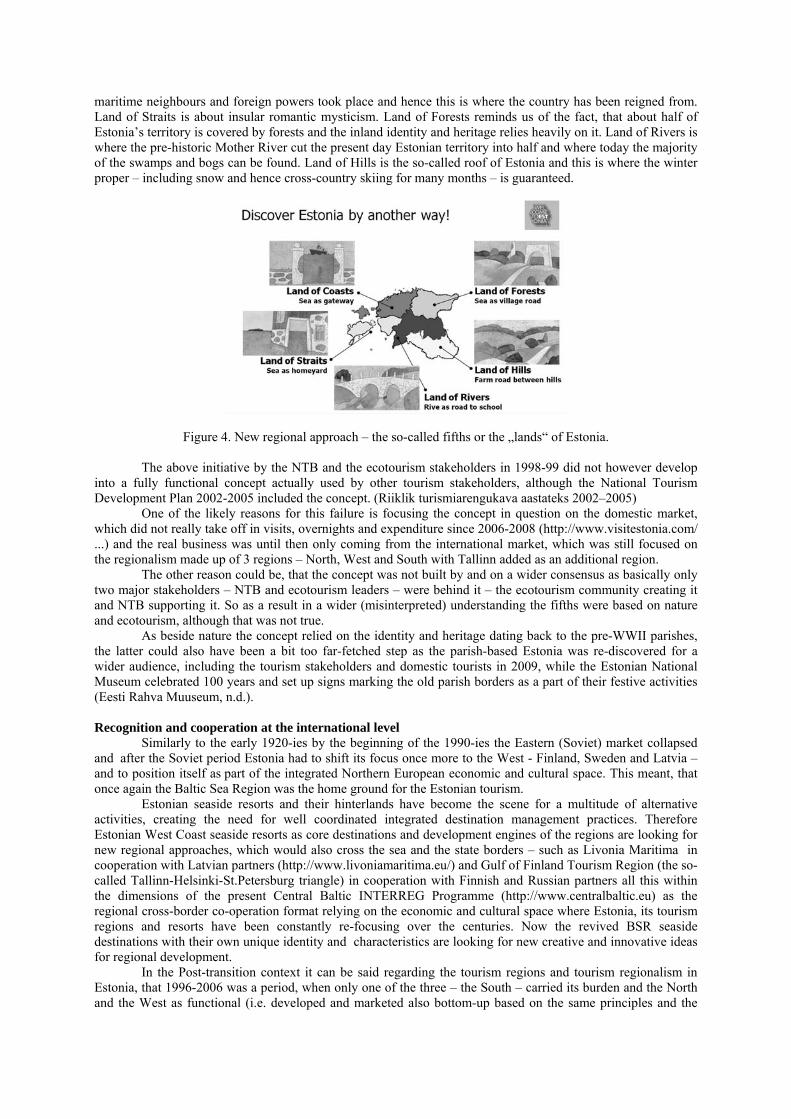
maritime neighbours and foreign powers took place and hence this is where the country has been reigned from. Land of Straits is about insular romantic mysticism. Land of Forests reminds us of the fact, that about half of Estonia’s territory is covered by forests and the inland identity and heritage relies heavily on it. Land of Rivers is where the pre-historic Mother River cut the present day Estonian territory into half and where today the majority of the swamps and bogs can be found. Land of Hills is the so-called roof of Estonia and this is where the winter proper – including snow and hence cross-country skiing for many months – is guaranteed.
Figure 4. New regional approach – the so-called fifths or the „lands“ of Estonia. The above initiative by the NTB and the ecotourism stakeholders in 1998-99 did not however develop
into a fully functional concept actually used by other tourism stakeholders, although the National Tourism Development Plan 2002-2005 included the concept. (Riiklik turismiarengukava aastateks 2002–2005)
One of the likely reasons for this failure is focusing the concept in question on the domestic market, which did not really take off in visits, overnights and expenditure since 2006-2008 (http://www.visitestonia.com/ ...) and the real business was until then only coming from the international market, which was still focused on the regionalism made up of 3 regions – North, West and South with Tallinn added as an additional region.
The other reason could be, that the concept was not built by and on a wider consensus as basically only two major stakeholders – NTB and ecotourism leaders – were behind it – the ecotourism community creating it and NTB supporting it. So as a result in a wider (misinterpreted) understanding the fifths were based on nature and ecotourism, although that was not true.
As beside nature the concept relied on the identity and heritage dating back to the pre-WWII parishes, the latter could also have been a bit too far-fetched step as the parish-based Estonia was re-discovered for a wider audience, including the tourism stakeholders and domestic tourists in 2009, while the Estonian National Museum celebrated 100 years and set up signs marking the old parish borders as a part of their festive activities (Eesti Rahva Muuseum, n.d.).
Recognition and cooperation at the international level
Similarly to the early 1920-ies by the beginning of the 1990-ies the Eastern (Soviet) market collapsed and after the Soviet period Estonia had to shift its focus once more to the West - Finland, Sweden and Latvia – and to position itself as part of the integrated Northern European economic and cultural space. This meant, that once again the Baltic Sea Region was the home ground for the Estonian tourism.
Estonian seaside resorts and their hinterlands have become the scene for a multitude of alternative activities, creating the need for well coordinated integrated destination management practices. Therefore Estonian West Coast seaside resorts as core destinations and development engines of the regions are looking for new regional approaches, which would also cross the sea and the state borders – such as Livonia Maritima in cooperation with Latvian partners (http://www.livoniamaritima.eu/) and Gulf of Finland Tourism Region (the so-called Tallinn-Helsinki-St.Petersburg triangle) in cooperation with Finnish and Russian partners all this within the dimensions of the present Central Baltic INTERREG Programme (http://www.centralbaltic.eu) as the regional cross-border co-operation format relying on the economic and cultural space where Estonia, its tourism regions and resorts have been constantly re-focusing over the centuries. Now the revived BSR seaside destinations with their own unique identity and characteristics are looking for new creative and innovative ideas for regional development.
In the Post-transition context it can be said regarding the tourism regions and tourism regionalism in Estonia, that 1996-2006 was a period, when only one of the three – the South – carried its burden and the North and the West as functional (i.e. developed and marketed also bottom-up based on the same principles and the
same stakeholders, who introduced the key principles of Estonian tourism regionalism and handed it over to the state during the mid-1990-ies) regions did not exist. Mostly this happened due to the fact, that state-level funding supporting the actual development and marketing of the regions by the regions was not implemented and the stronger members of the regions – f.e. traditional resorts such as Pärnu, Kuressaare and Haapsalu – found it easier to manage – meaning apply and implement funding supporting the actual development and marketing the on their own for their own good.
2006-2008 saw a renaissance of the tourism regionalism in Estonia – the North set up its umbrella organization once more in 2006 and the West in 2008. The main reason behind these developments lies in the understanding, that the counties and municipalities as destinations have a limited capacity regarding resources for development and marketing and the resources to be used had become available thanks to the EU Structural Funds, where larger partnerships and applications were expected. Also, it had become obvious, that once more the state is not paying attention to the need for non-Tallinn-based tourism development in order to pursue balanced regional development also in tourism and in order to meet this challenge it was clear, that the counties and municipalities as destinations – even the strongest ones - have a limited capacity of influencing the decisions and policies in question.
Still, the overall understanding, that there are 3 tourism regions in Estonia – the South, the North and the West – has never left the attention of the tourism community in Estonia since the mid-1990-ies even in sometimes the state-level authorities or even the EU donors seem to have second thoughts about it.
CONCLUSIONS The 200 years or so in question can be divided into 4 main periods, which represent the re-occuring
pattern of re-focusing towards either East or West in the Baltic provinces related to the Russian empire during the 19-20th centuries. All the related geopolitical factors, national and local policies have had a major impact on the development process and sustainability of Estonian tourism.
The main factor influencing the tourism development in Estonia is the formation and transformation process of the first generation (also in the context of the Baltic Sea Eastern Rim) of Estonia’s seaside resorts. Throughout this process they turned into the most competitive and sustainable core destinations, even trend-setters of Estonia’s tourism regions, and have had major impact on the tourism development on a regional level.
Resorts – local community, seasonal visitors and the relations between the two groups – have been in a constant change. The long-term sustainability of the resort development relies heavily on how well the local community is able to use the local resources - economic, cultural and social assets while being flexible in adapting to the changes. Therefore, creative local governance and deep-rooted hospitality practices can be considered as important factors in securing sustainability, which carries the message of the high-value historic milieu due to the harmonious and well-balanced co-existence of traditions and modern tourism trends.
The three Western Estonian historical resort towns – Pärnu, Haapsalu and Kuressaare - became the core destinations within the counties in question based on tourism resources, knowhow and local governance. The long-term and deep-rooted hospitality tradition provided a clear competitive edge during the transition period, which meant more loyal visitors at the historical seaside resorts. Image, sense and spirit of tourism destinations created by resort heritage are the keystones of utmost importance for solid regional symbolic capital and/as one of the basic quarantees of a long-term competitiveness.
By the end of the 1980-ies tourism in Estonia faced a serious dilemma – whether to follow the traditional tracks laid by the Soviet state-run monopoly or build anew a system of one’s own? In the first half of the 1990-ies tourism development in Estonia was hectic and based mostly on the local initiatives, while tourism became a catalyst of the transition process in the national economy. Estonia had to shift its focus once more to the West - Finland, Sweden and Latvia – and to position itself within the integrated Northern European economic and cultural space turning again the Baltic Sea Region into the home ground for the Estonian tourism.
After the Baltic States regained their independence in 1991, and, especially, since their accession to the EU in 2004 and to the Schengen zone at the end of 2007, the Baltic Sea has become almost an “inland sea” of the EU. In this situation the “new” BSR seaside destinations with their own unique identity and characteristics are looking for new creative and innovative ideas. Estonian seaside resorts and their hinterlands have become the scene for a multitude of alternative activities, creating the need for well coordinated integrated destination management practices. Therefore, Estonian West Coast seaside resorts as core destinations and development engines of the regions are looking for new regional approaches crossing also the sea and the state borders.
REFERENCES
Berg, E. (Ed.) (2002). Eesti tähendused, piirid ja kontekstid. Tartu: Tartu Ülikooli Kirjastus.
Eesti NSV kuurordid.(1963). Compiled by Vanker, H.; Veinpalu, E. and Vernik, L. Tallinn: Eesti Riiklik Kirjastus. pp 74-122.
Eesti Rahva Muuseum. History. Retrieved from http://www.erm.ee/en/about-us/history. Estonian Tourism West Coast Division. (1993). Brochure: West Coast Today. Hall, M. C., Müller D. K., Saarinen, J. (2009) Nordic Tourism. Issues and Cases. Channel View Publications http://www.centralbaltic.eu. http://www.hiiumaa.ee/wefriends/index.php?idc=104 http://www.livoniamaritima.eu http://www.visitestonia.com/en/additional-navigation/press-room/eas-views-on-tourism/estonian-tourism-
statistics. Jarvis, J. and Kallas, P. (2006). Estonia – switching Unions: Impacts on EU membership on tourism
development. In Hall, D., Smith, M. and Marciszweska, B. (eds.).Tourism in the New Europe: the Challenges and Opportunities of EU Enlargement. Wallingford: CABI, pp 154-169.
Jauhiainen, J.S. 2000. Kontekstuaalne lähenemine inimgeograafias. Jauhiainen, J.S. & Kulu, H. (eds.) Inimesed, ühiskonnad ja ruumid. Publicationes Instituti Geographici Universitatis Tartuensis 87, 11_20. Tartu.
Järs, A. (2009). Suvituselu ja rannakultuur nõukogude ajal. In Reis [nõukogude] läände. Kuurortlinn Pärnu 1940-88. Journey to the [Soviet] West. Resort town of Pärnu during 1940-88. Compiled by Kask, T., Vunk, A. Pärnu: Pärnu Linnvalitsus, pp 109-119.
Kalm, M. (2002). Eesti 20.sajandi arhitektuur [Estonian 20th century architecture]. 2nd edition. Tallinn: Sild, pp 158-170.
Kask, T. (2009).Pärnu kuurort 1940-1955. Nõukoguliku kuurordi kujunemisaastad. Pärnu kuurort 1956-1988. Nõukoguliku kuurordi õitseng, küpsus ja stagnatsioon. In Reis [nõukogude] läände. Kuurortlinn Pärnu 1940-88. Journey to the [Soviet] West. Resort town of Pärnu during 1940-88. Compiled by Kask, T., Vunk, A. Pärnu: Pärnu Linnvalitsus, pp 39-59; 89-107.
Kask, T. & Hinsberg, A. (2012). Estonian Tourism Regions in the 19th and 20th century. XIII International Scientific Conferenc held by School of Business Administration Turiba, Riga, Latvia on March 30, 2012.
Kask, T. & Raagmaa, G. (2010). The spirit of place of West Estonian resorts. Norsk Geografisk Tidsskrift – Norwegian Journal of Geography. Vol. 64, pp 162-171.
Kuurordist kuurorti. (1937). Magazine „Maret“, July, Tartu: Maret, pp 206. Moϊsi, D. (2010). Emotsioonide geopoliitika. Kuidas hirm, alandus ja lootus muudavad maailma. Eesti
Päevalehe AS. Myhre, A. (2012). Lithuania’s best future lies in a Nordic union. Retrieved from http://vilnews.com/? p=11258 Raagmaa, G. (2002) Regional Identity in Regional Development and Planning. European Planning Studies, Vol.
10, No. 1, 2002. 55-76 Riiklik turismiarengukava aastateks 2002–2005. Retrieved from https://www.riigiteataja.ee/akt/215064 Saarinen, J. & Kask, T. (2008). Transforming tourism spaces in changing socio-political contexts: The case of
Pärnu, Estonia, as a tourist destination. Tourism Geographies, 10(4), pp 452-473. Schlossmann, K.(1939). Estonian curative-sea-muds and seaside health resorts. London: Boreas Publishing Co.,
Ltd., pp 5-42. Tammela, H. (2010). The Singing Revolution. Retrieved from http://www.estonica.org/en/The_Singing_
Revolution/. Via Baltica News 2 (1994), brochure, Tallinn: Via Baltica News Limited. Worthington, B. 2003. Change in an Estonian resort: Contrasting development contexts. Annals of Tourism
Research 30:2, 369_385. Vära, E. (2010a). Breakthrough years. Retrieved from http://www.estonica.org/en/History/1985-1991_
Restoration_of_independence. Vära, E. (2010b). The first changes. Retrieved from http://www.estonica.org/en/History/1985-1991_Restoration
_ of_independence.
SUSTAINABILITY VALUES AND TOURISTS’ DESTINATION CHOICES
E. Sirakaya-Turk, PhD Professor and Associate Dean
for Graduate Studies and Research College of Hospitality, Retail and Sport Management
University of South Carolina E-mail: [email protected]
Seyhmus Baloglu, Ph.D., CHE Professor & Assistant Dean
Beam Hall 363 Mail Code: 6013
Phone: 702-895-3932 [email protected]
Abstract
This paper examines the role sustainability values of potential tourists play in destination selection decisions. Data were collected from a panel of 1002 potential US and Canadian travelers. According to the model tested, destination choices consisted of three main parts: 1) preference for sustainable destination, 2) preference for a sustainable hospitality industry, and 3) culturally responsible trip preparation. Factor scores were obtained to be used later in multivariate regression analyses to examine the effect of sustainability values on destination choices and preferences for hotels. The findings suggest that sustainability values and environmental behaviors seem to determine choices for sustainable travel. Acknowledgements: We are grateful to The Harrah’s Research Center at the University of Nevada at Las Vegas for funding this research. Key Words: Sustainable tourism, values, destination choices.
TRANSFORMATIONAL HOSPITALITY AND TOURISM: THE HEALTH AND WELLNESS SECTORS
Melanie Smith (PhD), Associate Professor, Tourism Department, College of Commerce, Catering and
Tourism, Budapest Business School, 9-11 Alkotmány Utca, 1054 Budapest, Hungary,
Email: [email protected]
Abstract This paper focuses on the role that tourism and hospitality relating to health and wellness can play in the transformation of individuals’ lives and ultimately, the creation of a better world. The researcher draws on research undertaken for the Global Spa Summit in 2011 to demonstrate the growth of wellness and medical tourism, including spas and wellness hotels. The role of travel in enhancing quality of life is illustrated using earlier research from 2008 comparing data from 11 countries. Finally, ongoing research on holistic retreats (started in 2005) is used to discuss the ways in which guests can enhance physical, mental and spiritual health, whilst making a positive contribution to local environments and communities. Keywords: Health, wellness, tourism, hospitality, transformation, quality of life
INTRODUCTION
This paper focuses on the exponential growth of the health and wellness sectors, and the impact that this has had on the hospitality and tourism industries. The theory draws on the work of authors such as Cohen and Bodeker (2008), Bushell and Sheldon (2009), Erfurt-Cooper and Cooper (2009), Smith and Puczkó (2009), and Connell (2011) who have documented the development of spas, wellness and spa hotels and resorts, holistic retreats, and medical centres. This paper takes their work further, focusing on the existing and potential contribution of health and wellness to creating a better world. This will build on the author’s recent work on the relationship between wellness and transformational tourism (Smith, 2012). This work posited the notion that engaging in wellness activities can make life more meaningful, even joyful. It uses the term ’health’ as defined by the WHO (1984), which is much broader than just medical treatments for the physical body and curing illnesses. Instead, it embraces mental health, emotional and psychological stability, wellbeing, happiness, and a connection to oneself, community and the environment. The term ’wellness’ is even more focused on proactive lifestyle changes which can improve quality of life for the self and others. This includes contributing to the main domains of quality of life as outlined by numerous authors, such as physical, emotional, psychological, existential, spiritual, social, cultural and environmental.
The response of the hospitality and tourism industries to health and wellness trends is examined in
depth, drawing on research undertaken by the author for the Global Spa Summit (2011) about the role of spas in wellness tourism and medical tourism. The paper will also use research undertaken in Hungary and ten other countries in 2008 (Puczkó & Smith, 2010) about the role of tourism in Quality of Life and the relationship between travel and happiness. Reference will also be made to past and ongoing research about the role of holistic retreats in life-enhancement with their increasing focus on self-development, stress management, life coaching, and body-mind-spirit balance (Kelly & Smith, 2009; Smith, 2012). The same is true of many wellness and spa resorts and hotels. In addition to transforming the lives of individuals, it will be argued that many such programmes and activities also contribute to the creation of a better world. This can happen through the enhancement of physical and mental wellbeing, improving work-life balance and productivity, helping to develop social skills, encouraging creativity, and increasing awareness of environmental and ethical concerns.
THE NEED FOR TRANSFORMATION
Recent years have proved to be especially turbulent for the majority of societies, with a series of
economic recessions, political turmoil, environmental catastrophes and social dissatisfaction. Many people seem to feel a certain degree of anomie, which manifests itself in depression and stress. The spiritual author Paolo Coelho (2011, p.1) stated in one of his recent books that:
The world has never been as divided as it is now, with religious wars, genocides, a lack of respect for the planet, economic crises, depression, poverty, with everyone wanting instant solutions to at least some of the world’s problems or their own. And things only look bleaker as we head into the future.
However, philosophers, spiritualists, astrologers and even scientists have been anticipating the dawning
of a new age in 2012, the so-called Age of Aquarius. It seems that the world is at a turning point where human beings need to acknowledge the consequences of their actions and to take greater responsibility for their lives, fellow human beings and the planet. Transformation is about changing the way people live and act, their responses to things, to fight against systems which are seen as unethical or unjust. As stated by Yogi Bajan (2000, p.24) who heralded this new age in a series of lectures and books:
Each action we take must be considered ecologically and globally because each person does affect, directly or indirectly, vast networks of people and other living beings and places. In the Aquarian Age we will enjoy union with all humankind, elitism will break down and a sense of connection between all men and women will be experienced. There will also be a need for responsibility, both individually and collectively to create the environment that truly reflects our ideals. Whether or not such a vision will be achieved in the long term remains to be seen, but in the short term,
human beings have little option but to make the changes necessary to their lifestyles and behaviour in order to preserve ecological, economic and social structures.
Although transformation is partly about fighting political battles, finding ways to withstand recession, preventing further environmental degradation and contributing to social harmony, it is also about individual well-being and a sense of self. Steiner and Reisinger (2006a) discuss the notion that existential authenticity is about one’s essential nature and being true to oneself, including identity, individuality, meaning-making, happiness, but also anxiety (e.g. mortality, depression, despair, bereavement, divorce, hurt). Steiner and Reisinger (2006a) suggest that courage is needed to face the reality of existence. It will later be argued that certain forms of wellness tourism do just that through a process of personal development and transformation. For example, certain experiences of being in a holistic retreat can make lives more meaningful, even joyful (Glouberman, 2002). Without a strong and healthy sense of self, one’s political, economic or social role tends to become diminished. The role of personal wellness, happiness and perceived quality of life therefore play an important role.
THE ELEMENTS INTEGRAL TO POSITIVE TRANSFORMATION: HAPPINESS, WELLNESS AND QUALITY OF LIFE
The terminology used to express the range of human perceptions and emotions is fairly complex,
especially when it comes to measuring them in both objective and subjective terms (e.g. quality of life). The aim of this short section is to untangle some of this terminology, not definitively, but at least for the purposes of this paper and the research contained therein. The first term to be considered is health, for which the definition of the World Health Organisation is considered to be the most appropriate:
The extent to which an individual or a group is able to realize aspirations and satisfy needs, and to change or cope with the environment. Health is a resource for everyday life, not the objective of living; it is a positive concept, emphasizing social and personal resources as well as physical capabilities.
(WHO, 1984)
It is important to note the holistic nature of this definition, meaning that there is a recognition of social, personal and environmental dimensions as well as physical ones. The growing popularity of the term ’wellness’ is also considered, as it tends to focus on transforming habits in order to foster a longer, healthier life. Myers, Sweeney and Witmer (2000:online) define wellness as being “a way of life oriented toward optimal health and well-being in which the body, mind, and spirit are integrated by the individual to live more fully within the human and natural community”. This definition suggests that wellness goes beyond health and includes ’wellbeing’ too. The New Economics Foundation (NEF, 2004:online) define wellbeing as follows:
Wellbeing is more than just happiness. As well as feeling satisfied and happy, wellbeing means developing as a person, being fulfilled, and making a contribution to the community.
This definition takes the discussion beyond the realm of the individual through self-development and
personal fulfilment towards a sense of social responsibility, essential for the support of communities and societies. The National Wellness Institute (2007:online) defines wellness as “an active process through which people become aware of, and make choices towards, a more successful existence”. They advocate a positive and optimistic outlook and a holistic and balanced approach to life. Their six-dimensional model focuses on the physical, spiritual, intellectual, emotional, social and occupational aspects of life. Wellness clearly recognises the important connection of body, mind and spirit, an ancient concept in most Asian and Eastern cultures, but relatively neglected in Western societies. Spirituality can be something of an elusive concept in increasingly secular societies, but may be defined as a state of transcendence, greater connection to oneself, others and the universe, and a quest for meaning (e.g. Elkins et al., 1988; Woods Smith, 1994).
It seems that happiness is something of a ‘subset’ of wellbeing. Happiness is thought to be a measurable phenomenon with international indices being developed to weight and compare its significance in different countries. A World Values Survey (2003) in the New Scientist published data about the supposed happiest people in the world, concluding that material circumstances had little to do with happiness. Topping the happiness league tables are often those countries which are considered to be economically ’under-developed’. Happiness seems to be about creating a fulfiling and meaningful life through the right conditions, e.g. love, attachment, engagement, flow (Haidt, 2006).
The other main term referred to in this paper is ’quality of life’. It is generally agreed within quality of life literature that the following three domains are the most important for quality of life: health, standard of living and wellbeing (e.g. Campbell, Converse & Rodgers, 1976; Flanagan, 1978; Krupinski, 1980; Cummins et al., 1994; Cummins,1997). Rahman et al. (2005) suggested that the following domains were the most important: health, work and productivity, material wellbeing, feeling part of one’s local community, personal safety, quality of environment, emotional wellbeing, and relationship with family and friends. Puczkó and Smith (2012) also add spiritual wellbeing and social and cultural wellbeing to this list.
THE ROLE OF TRAVEL IN WELLBEING
There has been a recent growth in the number of ’staycations’ where people enjoy time in their home
surroundings or environs instead of travelling further afield. This can lead to a greater appreciation of their local area, but does not have the effect of taking them away from difficult contexts or problems. Although it may seem logical that travel would be one of the first activities to be cut during a recession, the still growing numbers of backpackers and budget travellers suggests that travel is not dependent on a high income. It can form part of one’s fundamental quality of life, as discussed later in the research. Political turmoil (riots, violence or terrorism) may restrict where people go, as may environmental disasters, but wanderlust can even increase as dissatisfaction with one’s home environment grows. It is often helpful to know that there is a world elsewhere which is different or better than home. This may not transform whole lives but it can transform ways of thinking and improve wellbeing.
Travel can arguably contribute to all aspects of health if it induces a state of relaxation, rest and recuperation. For example, this was the traditional function of seaside holidays for workers from industrial cities. More niche forms of tourism such as cultural tourism tend to provide intellectual stimulation and opportunities for social and cross-cultural exchange which can increase mental and emotional wellbeing. Some trips have a primary focus on health, for example, going to medical spas in Central and Eastern Europe or having surgery as part of medical tourism abroad.
Travel tends to make people happy before, during and immediately after their trips. For example, the anticipation of trips and post-trip satisfaction can prolong the experience (Neal et al, 1999). If it is done regularly enough, tourism can increase wellbeing. People may even develop a greater sense of environmental or social responsibility through contact with local destinations and their communities. Self-development of an intellectual cultural or spiritual nature can also increase happiness or satisfaction levels in the longer term.
Travel no doubt creates positive feelings and emotions on many levels (however temporary) but travelling is mainly the premise of wealthy, western nations, therefore international levels of happiness or wellbeing cannot easily be measured in research (except for the impacts of tourism on destination communities). Having said this, there are some forms of domestic tourism or leisure which can be considered, even in relatively poor or developing coluntries. This might include VFR (visiting friends and relatives) or state subsidised health tourism (e.g. in Central and Eastern Europe).
THE CONTRIBUTION OF TOURISM TO QUALITY OF LIFE
The Hungarian National Tourism Development Strategy in 2007 stated the following objective: ‘Tourism should contribute to the improvement of the quality of life of citizens as well as tourists’. In 2008 the author and a fellow researcher (both resident in Hungary) undertook government-supported international research on the relationship between tourism and quality of life (QoL). Two basic research hypotheses were formulated:
Tourism has some links to general QoL
Tourism influences QoL
The researchers selected Meeberg’s (1993:37) definition: “Quality of life is a feeling of overall life satisfaction, as determined by the mentally alert individual whose life is being evaluated” based on which the working Tourism-specific Quality of Life Model (TQoL) definition could be formulated:
Quality of life is a feeling of overall life satisfaction, as determined by the mentally alert individual whose life is being evaluated. In the formulation of the individual’s opinion, which is fundamentally based on subjective factors, tourism can play a role.
The researchers used Rahman et al.’s (2005) general QoL domains as a starting point, which were then adapted to suit tourism-related research. Five subseqent domains of TQoL were developed. These were:
1. Attitudes towards Travelling (ATA) (e.g. the ways in which tourism influences wellbeing and satisfaction)
2. Motivations of the Visitor (MV) (e.g. whether different kinds of trip affected happiness, satisfaction and wellbeing)
3. Qualities of the Trip (QT) (e.g. how far wellbeing is influenced by the length of journey, distance and type of destination)
4. Characteristics of the Destination (CD) (e.g. availability and quality of services)
5. Impacts of Tourism (IT) (e.g. environmental impacts, impacts on local communities)
The so-called ‘Budapest Model’ which was developed (see Puczkó & Smith, 2010 for further details) incorporates the qualities of both objective and subjective indicators, as most researchers agree that both are important for measuring quality of life. These have been used in various models, for example the Scandinavian model which considers objective or quantifiable measures like standard of living and living conditions, and the American model which examines subjective indicators that are rooted in psychology. The purpose of developing a model was to give planners, policy makers and destination managers a tool to help identify the complex nature of tourism and its relationships to QoL.
The research was firstly piloted in Hungary in three tourism destinations. This was then refined following an international testing phase in a further ten countries (Brazil, Czech Republic, Finland, Holland, Malaysia, Portugal, Russia, Slovakia, South Africa, UK). International researchers were recruited to assist with this. Two research methods were applied: focus groups and field surveys. 50 residents and 50 visitors were interviewed in each chosen tourism destination in the given country. They were primarily asked about their views of the five domains of TQoL as identified above (ATA, MV, QT, CD and IT). A total of 960 questionnaires were completed and tabulated, then processed in SPSS. The research used two standard questionnaires, one for the visitors and one for the residents. 80% of the questions in the two questionnaires were the same, therefore this created a database that was comparable (using a 1-7 Likert scale). The researchers applied a random sampling approach with attempts to achieve a sample that as closely represented the age distribution of the settlements as possible.
The international data showed that the majority of tourists and residents believed that tourism increases their quality of life (the exceptions being one town in Hungary and another in the Netherlands). Elsewhere, data indicates that the existence of tourism improves the QoL of local communities even more than that of visitors. This may be because tourism can create permanent positive changes in a destination, whereas holidays usually only induce temporary changes in tourists. However, this can vary from town to town and from community to community, so it could be misleading to make too many generalisations about this. In the domain Attitudes towards Travelling (ATA) the figures tended to be higher for local residents than for tourists. This is also surprising, as it is usually assumed that tourists are happier on holiday than when they are not! However, it may mean that anticipation is even more enjoyable than reality or that the destination failed to meet their expectations.
The findings confirmed that when the general public refers to material goods they think of standard of living or welfare, but when immaterial goods are mentioned they think of happiness or QoL (it should be noted that respondents had problems differentiating terminology and found it harder to define QoL than Standard of Living). Overall, if we look at the role of travelling in happy living, according to the research approximately 20-25% of both visitors and local citizens rated tourism as a factor of happiness. However, it is significant to note that travel was not usually mentioned by respondents as being an important element of happiness or quality of life unless it was suggested to them. Unsurprisingly, family, love and health were deemed more important. Interestingly, tourists thought that happier people were more likely to travel, and not that travelling makes someone happy. It also seemed to be the act of travel rather than particular trips which has an influence on peoples’ quality of life. It was clear that tourism has an important relationship to all of the domains of quality of life as outlined by Rahman et al. (2005), but some seem to be more relevant than others, for example, health, work and productivity, and emotional wellbeing. This is also true of wellness tourism, where the focus is often on stress-management, work-life balance and self-development (Puczkó & Smith, 2012).
THE RESPONSE OF THE HOSPITALITY AND TOURISM SECTORS TO THE GROWTH OF HEALTH AND WELLNESS
In recent years the health and wellness tourism sector has grown exponentially (Bushell & Sheldon,
2009; Erfurt-Cooper & Cooper, 2009; Smith & Puczkó, 2009). This includes visits to spas, thermal baths, wellness hotels, clinics for surgery and medical procedures, and spiritual or holistic retreats. We might differentiate between health, wellness and medical tourism, with health tourism generally being seen as an umbrella term for wellness tourism and medical tourism (Smith & Puczkó, 2009), although health tourism is used by many governments as being synonymous with medical tourism. Medical tourism has traditionally focused on the physical body and curative procedures (e.g. operations, surgery, rehabilitation), whereas wellness tourism focuses more on preventative, lifestyle-based approaches to health, with an emphasis on the mental, psychological, emotional and spiritual.
The researcher was involved in a research project for the Global Spa Summit in February and March
2011 which partly aimed to re-define wellness tourism and medical tourism, as well as to provide an overview of worldwide developments. More specifically, the project focused on the role of spas in wellness tourism and medical tourism. The methodology was as follows:
• In-depth case study research on 12 representative countries. This included data collection from official
(e.g. government, tourist office and spa industry) websites, including statistics about the nature of the sectors and the numbers and profiles of wellness and medical tourists.
• Web-based survey of spa industry leaders around the world (sample size 206). The majority were from North America, Europe and the Asia-Pacific region and mainly included day spas, resort or hotel spas and spa consultancy companies. Questions were asked about definitions, characteristics of tourists, and the role of spas in medical and wellness tourism.
• 40 interviews with leading “thinkers” and stakeholders around the world who are working in (or studying) the medical tourism and wellness tourism markets. Questions were mainly asked about the role of spas in wellness and medical tourism and how they viewed the present and future situation.
The results were extensive (see GSS, 2011), so only a few key points are mentioned here. 88% of survey respondents considered wellness tourism to be important compared to 52% for medical tourism. This is interesting, as many countries view medical tourism as being more desirable or lucrative, but the research also shows that wellness tourism generates a significantly higher income on average (($106 Bn compared to $60 Bn).One of the key findings and recommendations was that mental, psychological and emotional wellness needs to become more of a focus in spas, and not just the physical body and curative treatments. For example, 45% of respondents thought that wellness tourists are interested in meditation, spiritual and mind-body programmes. Such programmes are being developed in some German and Austrian spas and wellness hotels (e.g. with the concepts of ‘selfness’ and ‘mindness’), as well as in some wellness hotels and retreats in Australia, New Zealand, the UK and Canada. Basically, the phenomenon is more common in English and German-speaking countries, whereas developing countries often focus more on surgical medical tourism because of their relative price advantage. However, in the future, this could change. About 85% of respondents stated that they plan to
make investments to pursue wellness tourism opportunities, while only 54% plan to make investments related to medical tourism opportunities. A focus on the environment in the form of sustainability, greenness or eco-friendliness is also growing. The promotion of longevity and active aging are also a key focus now and even more in the future.
In hospitality, there has been an exponential growth in recent years in the number of spa and wellness hotels which have been developed worldwide. Although it was common in many hotels to include a swimming pool, fitness centre, jacuzzi and maybe massage, never before has there been such a proliferation of treatments and activities pertaining to wellness. These can include not only a vastly extended choice of massage, body and beauty treatments, but also saunas and steam rooms (of varying sophistication), mind-body-spirit activities like yoga or meditation, and healthy menus in restaurants. Business incentive trips are also increasingly being offered in spa hotels as part of occupational wellness packages, which may include stress management, work-life balance or life-coaching, as well as leisure and recreation opportunities.
In addition to hotels being developed, there has also been a growth in other accommodation options for
potential wellness tourists, for example, retreats. . Retreats Online (2006) describe a retreat as a place for quiet reflection and rejuvenation, an opportunity to regain good health, and/or it can mean a time for spiritual reassessment and renewal, either alone, in silence, or in a group. In 2005, the researcher undertook a research project with a fellow researcher (see Smith & Kelly, 2006; Kelly & Smith, 2009) which collected data on 500 retreat centres across the world using search engines and search words such as ’holistic’, ’wellness’, ’yoga’, ’meditation’ and ’spiritual’ retreat. Information was collected on activities offered, prices, location and facilities. An e-questionnaire was also sent to a sample of 10% of the operators, of which 40 were usable. This provided more detailed information about the philosophy behind the retreats and the motivations of guests. The research showed that typical activities include yoga, meditation, massage, psychological workshops (e.g. life-coaching, dream analysis), sports, and creative expression through arts, crafts, dance, drama or singing.
The location of holistic retreats is only important in terms of the type of landscape rather than specific countries or regions. For example, most retreats tend to be in quiet, beautiful locations such as a small village, by the sea or a lake, near a forest or wood. A return to the simplicity and restorative power of nature is a recurrent motif in both holistic and wellness tourism. As stated by Kaur Kler (2009) environmental psychology explains tourists’ preferences for nature and restorative environments which can improve mental wellbeing, increase alertness, and reduce stress.
Many people visit holistic retreat centres with the aim of healing their life or seeking greater meaning. Holistic implies that they deal with the whole person and the integration of body, mind and spirit as well as other domains. The guests may have had enough of the ’rat race’ and are burnt out. They may hope that they can improve the quality of their life, including work and productivity, relationships with friends and family, and emotional wellbeing. Maybe their material wellbeing has been adversely affected by economic recession and they have lost jobs, money or status. This may lead to a crisis of identity or confidence and may require a turn towards inner values or a greater appreciation of nature. The average age for most forms of wellness tourism, including retreat centres, tends to be about 45 (Smith & Puczkó, 2009) effectively mid-life, assuming people live long enough. However, Skyros (2012) (one of the first holistic retreat companies founded in 1979) state that 70% of their retreat guests are aged 30-60.
After analysing the activities of 500 holistic retreats, Kelly & Smith (2009) concluded that holistic retreats attempt to create a balance between escapism and relaxation, as well as providing an active journey into greater self-awareness, as the main focus is on ’the self’. The main motivations cited by tourists (according to the distributed operator survey) were relaxation, enhancement of health, de-stressing, but also the group experience and self-development. This implies the desire for personal and social transformation.
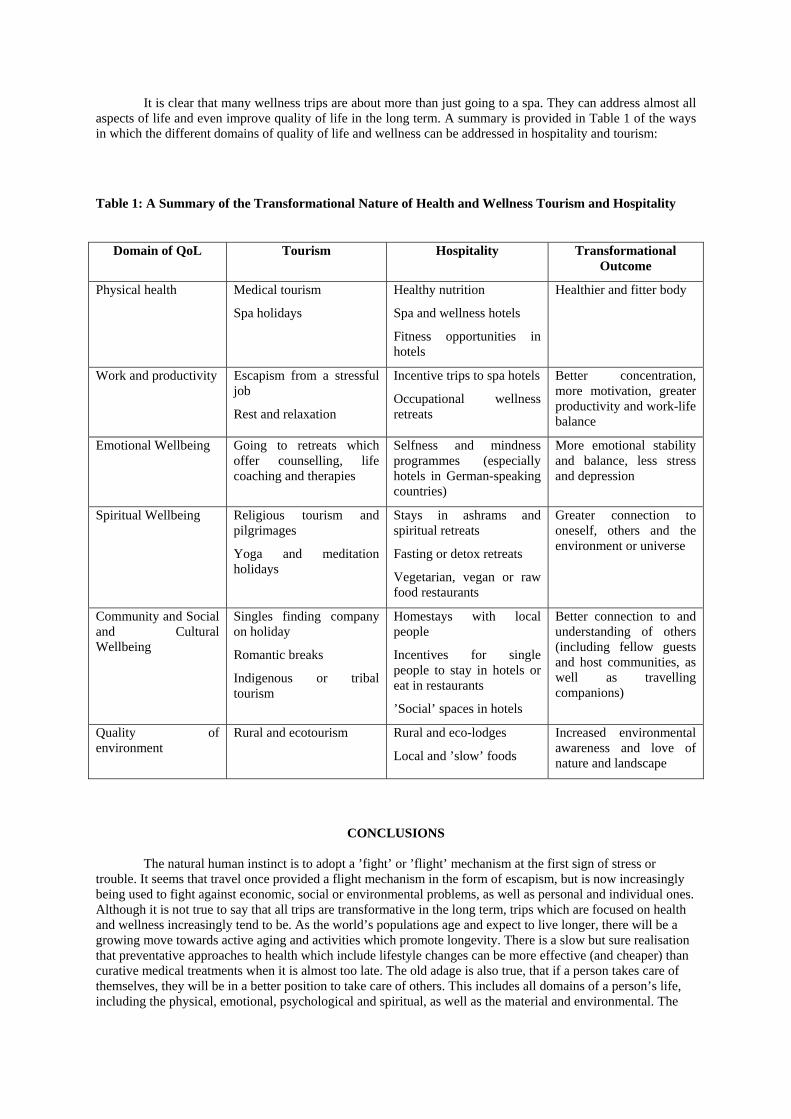
It is clear that many wellness trips are about more than just going to a spa. They can address almost all aspects of life and even improve quality of life in the long term. A summary is provided in Table 1 of the ways in which the different domains of quality of life and wellness can be addressed in hospitality and tourism:
Table 1: A Summary of the Transformational Nature of Health and Wellness Tourism and Hospitality
Domain of QoL Tourism Hospitality Transformational Outcome
Physical health
Medical tourism
Spa holidays
Healthy nutrition
Spa and wellness hotels
Fitness opportunities in hotels
Healthier and fitter body
Work and productivity Escapism from a stressful job
Rest and relaxation
Incentive trips to spa hotels
Occupational wellness retreats
Better concentration, more motivation, greater productivity and work-life balance
Emotional Wellbeing
Going to retreats which offer counselling, life coaching and therapies
Selfness and mindness programmes (especially hotels in German-speaking countries)
More emotional stability and balance, less stress and depression
Spiritual Wellbeing Religious tourism and pilgrimages
Yoga and meditation holidays
Stays in ashrams and spiritual retreats
Fasting or detox retreats
Vegetarian, vegan or raw food restaurants
Greater connection to oneself, others and the environment or universe
Community and Social and Cultural Wellbeing
Singles finding company on holiday
Romantic breaks
Indigenous or tribal tourism
Homestays with local people
Incentives for single people to stay in hotels or eat in restaurants
’Social’ spaces in hotels
Better connection to and understanding of others (including fellow guests and host communities, as well as travelling companions)
Quality of environment
Rural and ecotourism Rural and eco-lodges
Local and ’slow’ foods
Increased environmental awareness and love of nature and landscape
CONCLUSIONS
The natural human instinct is to adopt a ’fight’ or ’flight’ mechanism at the first sign of stress or trouble. It seems that travel once provided a flight mechanism in the form of escapism, but is now increasingly being used to fight against economic, social or environmental problems, as well as personal and individual ones. Although it is not true to say that all trips are transformative in the long term, trips which are focused on health and wellness increasingly tend to be. As the world’s populations age and expect to live longer, there will be a growing move towards active aging and activities which promote longevity. There is a slow but sure realisation that preventative approaches to health which include lifestyle changes can be more effective (and cheaper) than curative medical treatments when it is almost too late. The old adage is also true, that if a person takes care of themselves, they will be in a better position to take care of others. This includes all domains of a person’s life, including the physical, emotional, psychological and spiritual, as well as the material and environmental. The
true meaning of hospitality is very much about taking care of others, regardless of their origins, and successful tourism relies on harmonious relations between fellow tourists as well as destination communities. Improving all of a person’s relationships, including with their own selves, can surely lead the way to creating a better world.
REFERENCES Bushell, R. & Sheldon, P. J. (2009). Wellness and tourism: mind, body, spirit, place. New York:
Cognizant. Coelho, P. (2011). Aleph. London: HarperCollins. Cohen, M. and Bodeker, G. (2008). (eds) Understanding the global spa industry: Spa management.
Oxford: Butterworth Heinemann. Connell, J. (2011). Medical Tourism. Wallingford: CABI International Cummins, R.A. (1997).The comprehensive quality of life scale – adult (ComQol-A5), (5th ed.). Deakin
University, Melbourne: School of Psychology. Cummins, R.A., Mccabe, M. P., Romeo, Y. & Gullone, E. (1994). The comprehensive quality of
lifescale (ComQol): Instrument development and psychometric evaluation on college staff and students. Educational and Psychological Measurement, 54(2), 372-382.
Elkins, D. N., Hedstrom, L. J., Hughes, L. L., Leaf, J. A., & Saunders, C. (1988). Toward a humanistic phenomenological spirituality. Journal of Humanistic Psychology, 28(4), 5-18.
Erfurt-Cooper, P. & Cooper, M. (2009). Health and wellness tourism: spas and hot springs. Bristol: Channel View.
Global Spa Summit (GSS) (2011). Wellness Tourism and Medical Tourism: Where do Spas Fit? New York: GSS.
Glouberman, D. (2002).The Joy of Burnout. London: Hodder and Stoughton. Haidt, J. (2006). The Happiness Hypothesis. London: Arrow Books. Kaur Kler, B. (2009). Tourism and Restoration. In J.Tribe (Ed.), Philosophical Issues in Tourism (pp. 117-134).
Bristol: Channel View. Kelly, C. & Smith, M. K. (2009). Holistic tourism: integrating body, mind and spirit. In R. Bushell & P.J.
Sheldon (2009) (Eds), Wellness and tourism: mind, body, spirit, place (pp. 69-83). New York: Cognizant.
Krupinski, J. (1980). Health and quality of life. Social Science and Medicine, 14A, 203-211. Meeberg, G.A. (1993). Quality of life: a concept analysis. Journal of Advanced Nursing. 18(1), 32-38. Myers, J. E., Sweeney, T. J. & Witmer, M. (2000). A holistic model of wellness. Retrieved from
http://www.mindgarden.com/products/wells.htm. National Wellness Institute (2007) http://www.nationalwellness.org. Neal, D.J., Sirgy, M.J. & Uysal, M. (1999). The role of satisfaction with leisure travel/tourism services
and experience in satisfaction with leisure life and overall life. Journal of Business Research, 44, 153-163.
New Economics Foundation (NEF) (2004). Retrieved from http://www.wellbeingmanifesto.net/uk_manifesto.pdf.
Puczkó, L. & Smith, M. K. (2010) ‘Tourism-Specific Quality of Life Index: The Budapest Model’, in M. Budruk & R. Philips (Eds), Quality-of-Life Community Indicators for Parks, Recreation and Tourism Management (pp. 163-184). Social Indicators Research Series 43, Dordrecht: Springer.
Puczkó, L. & Smith, M. K. (2012 - forthcoming). An Analysis of TQoL Domains from the Demand Side. In M. Uysal, R. R. Perdue & J. M. Sirgy (Eds), Handbook of Tourism and Quality-of-Life (QOL) Research: The Missing Link. Dordrecht: Springer.
Rahman, T., Mittelhammer, R.C. & Wandschneider, P. (2005). Measuring the quality of life across countries. A sensitivity analysis of well-being indices. Research paper No. 2005/06 in World Institue for Development Economics Research (WIDER) established by United Nations University (UNU).
Retreats Online (2006). Retrieved from www.retreatsonline.com. Skyros (2012). Who goes to Skyros? Retrieved from http://www.skyros.com. Smith, M. K. & Kelly, C. (2006). Holistic tourism: journeys of the self?, Journal of Tourism Recreation
Research. 31(1), 15-24. Smith, M. K. & Puczkó, L. (2009). Health and wellness tourism. Oxford: Butterworth Heinemann. Smith, M. K. (2012 – forthcoming). Transforming Quality of Life Through Wellness Tourism. In
Y. Reisinger (Ed.), Transformational Tourism. London: Routledge. Steiner, C. J & Reisinger, Y. (2006a). Understanding Existential Authenticity, Annals of Tourism
Research, 33(2), 299-318. Steiner, C. J & Reisinger, Y. (2006b). Ringing the Fourfold: A Philosophical Framework for Thinking

about Wellness Tourism, Tourism Recreation Research, 31(1), 5-14. Woods Smith, D. (1994). Theory of Sprituality. Retrieved from
http://www.housesofhealing.com/source/Spirarticle94.pdf. World Health Organisation (1984). Health Promotion: A Discussion Document. Copenhagen: WHO. World Values Survey (2003). In Bond, M. (2003) The Pursuit of Happiness. New Scientist, 179, 40-
43. Yogi Bajan (2000).The Self-Sensory System of the Aquarian Age. In S. Datta (2003) Open your
Heart with Kundalini Yoga (p.24), London: Thorsons.
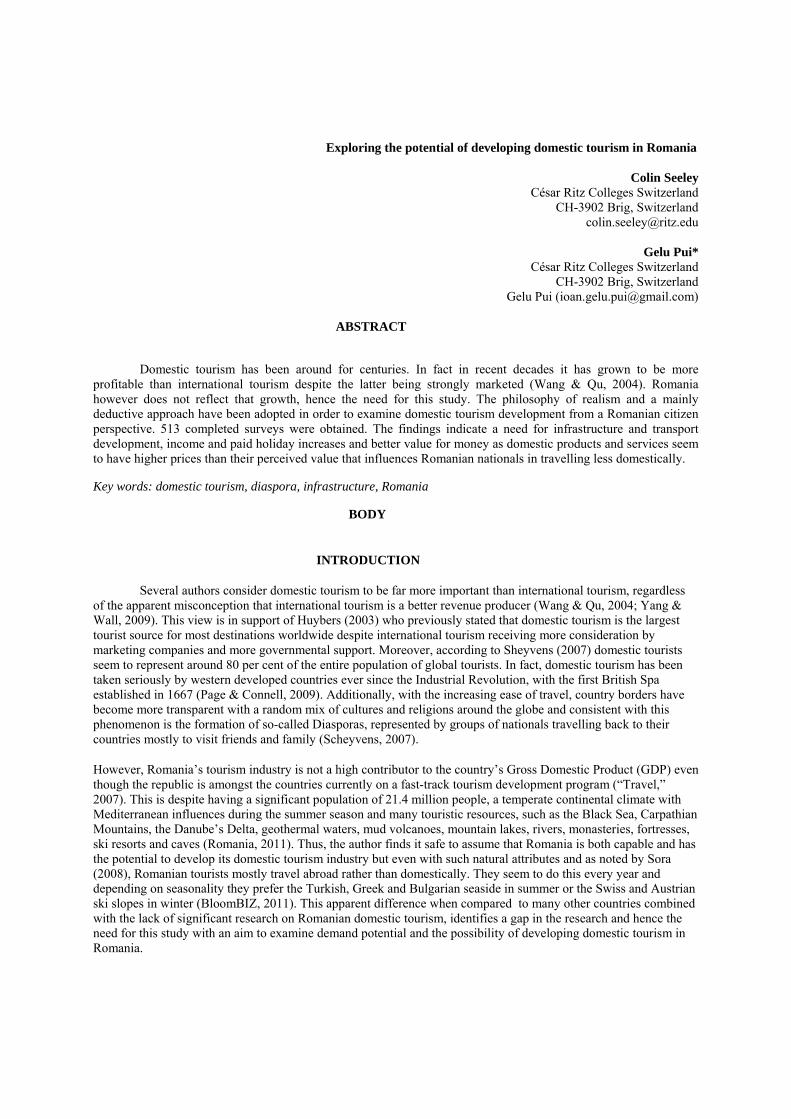
Exploring the potential of developing domestic tourism in Romania
Colin Seeley César Ritz Colleges Switzerland
CH-3902 Brig, Switzerland [email protected]
Gelu Pui*
César Ritz Colleges Switzerland CH-3902 Brig, Switzerland
Gelu Pui ([email protected])
ABSTRACT
Domestic tourism has been around for centuries. In fact in recent decades it has grown to be more profitable than international tourism despite the latter being strongly marketed (Wang & Qu, 2004). Romania however does not reflect that growth, hence the need for this study. The philosophy of realism and a mainly deductive approach have been adopted in order to examine domestic tourism development from a Romanian citizen perspective. 513 completed surveys were obtained. The findings indicate a need for infrastructure and transport development, income and paid holiday increases and better value for money as domestic products and services seem to have higher prices than their perceived value that influences Romanian nationals in travelling less domestically.
Key words: domestic tourism, diaspora, infrastructure, Romania
BODY
INTRODUCTION
Several authors consider domestic tourism to be far more important than international tourism, regardless of the apparent misconception that international tourism is a better revenue producer (Wang & Qu, 2004; Yang & Wall, 2009). This view is in support of Huybers (2003) who previously stated that domestic tourism is the largest tourist source for most destinations worldwide despite international tourism receiving more consideration by marketing companies and more governmental support. Moreover, according to Sheyvens (2007) domestic tourists seem to represent around 80 per cent of the entire population of global tourists. In fact, domestic tourism has been taken seriously by western developed countries ever since the Industrial Revolution, with the first British Spa established in 1667 (Page & Connell, 2009). Additionally, with the increasing ease of travel, country borders have become more transparent with a random mix of cultures and religions around the globe and consistent with this phenomenon is the formation of so-called Diasporas, represented by groups of nationals travelling back to their countries mostly to visit friends and family (Scheyvens, 2007).
However, Romania’s tourism industry is not a high contributor to the country’s Gross Domestic Product (GDP) even though the republic is amongst the countries currently on a fast-track tourism development program (“Travel,” 2007). This is despite having a significant population of 21.4 million people, a temperate continental climate with Mediterranean influences during the summer season and many touristic resources, such as the Black Sea, Carpathian Mountains, the Danube’s Delta, geothermal waters, mud volcanoes, mountain lakes, rivers, monasteries, fortresses, ski resorts and caves (Romania, 2011). Thus, the author finds it safe to assume that Romania is both capable and has the potential to develop its domestic tourism industry but even with such natural attributes and as noted by Sora (2008), Romanian tourists mostly travel abroad rather than domestically. They seem to do this every year and depending on seasonality they prefer the Turkish, Greek and Bulgarian seaside in summer or the Swiss and Austrian ski slopes in winter (BloomBIZ, 2011). This apparent difference when compared to many other countries combined with the lack of significant research on Romanian domestic tourism, identifies a gap in the research and hence the need for this study with an aim to examine demand potential and the possibility of developing domestic tourism in Romania.
LITERATURE REVIEW
In this chapter the author reviews relevant literature on the development of domestic tourism. Firstly, the term domestic tourism will be both discussed and defined together with consideration of diaspora. Then, attention will be given to the demand aspect together with the power of choice, authenticity and socio-economic impacts of domestic tourism development. In the next section, outcomes of domestic tourism will be exemplified in China, Italy and Australia and then comparisons are made to Romanian tourism.
Domestic Tourism – Definitions and Diaspora
Several authors consider domestic tourism to be far more important than international tourism, regardless of the apparent misconception that international tourism is a better revenue producer (Wang & Qu, 2004; Yang & Wall, 2009). This view is in support of Huybers (2003) who previously stated that domestic tourism is the largest tourist source for most destinations worldwide despite international tourism receiving more consideration by marketing companies or more governmental support. Scheyvens (2007) also agrees and quotes Boniface and Cooper (1994) in stating that domestic tourism actually accounts for 80 per cent of the global tourism stream, showing great potential in outstripping international tourism as much as 10 times with recent development having been seen mostly in third world countries whose economy is on an expansion curve. Yang and Wall (2009) concur and add that the sector of domestic tourism has become more and more popular, while taking the time to reflect back on authenticity, in terms of culture and behaviour.
According to Leiper (1979), a domestic tourist is someone who travels inside his or her country borders. A few decades later, domestic tourism is referred to by Page and Connell (2009) as a touristic branch representing national citizens travelling for hospitality purposes within the boundaries of their own nation. This is somewhat similar to Leiper (1979), however Page and Connell (2009) describe it to be a process statistically used in identifying the role of national tourism within the economy of any given country, to promote regional development and to achieve long term social goals such as cultural minority integration within society. Moreover, they add that most of the factors influencing domestic tourism development are actually unable to be controlled by the industry. They assert that there are important elements that drive domestic tourism development and are categorized into economic, social and cultural, political, technological, environmental and leisure and tourism trends. They then surmise that such factors result in better forecasting and scenario planning that in turn offers a better understanding of future domestic tourism trends (Page & Connell, 2009). Nevertheless, as quoted by Hall and Page (2006), the World Tourism Organisation (WTO) (1983) describes the exact traits of a domestic tourist as:
“Any person, regardless of nationality, resident in a country and who travels to a place in the same country for no more than one year and whose main purpose of visit is other than following an occupation remunerated from within the place visited” (p.79).
A complication that arises when considering domestic tourism is diaspora. According to the Oxford Advanced Learner’s Dictionary of Current English (7th ed.) (2005), the term diaspora is defined as “the movement of people from any nation or group away from their own country” (p.421). Scheyvens (2007) is of the view that domestic tourism has a substantial cost-effective role in a country’s economy because it is not as vulnerable to change as international tourism is. She adds that a significant amount of domestic tourism is actually represented by diaspora members who return home to visit friends and relatives (VFR) while bringing in foreign capital that contributes to local development and citizens’ wellbeing. This is most encountered in third world and currently developing countries where many residents choose to leave their families in order to work abroad and receive better pay (Scheyvens, 2007). She then states that current emerging nations, such as China and India, heavily invest in drawing back diaspora tourists to their countries in the hope of increasing economic and employment benefits. Furthermore, as cited by Scheyvens (2007), Ghimire (2001) points out that in contrast, very few governments have made even limited attempts to encourage such investments for domestic tourism purposes and this is probably as a result of the fact that domestic tourism has steadily developed for hundreds of years in some countries while in others mass domestic tourism is just at its beginning. Accordingly, many such tourists are actually expatriates that live and work abroad while returning home occasionally for purposes such as VFR or pilgrimages. In other words, citizens of any given country that work or live abroad and return home for short-term holidays are referred to as “diaspora” (p.309) and represent a sub-division of domestic tourism (Scheyvens, 2007).
Domestic Tourism Demand
Page and Connell (2009) cite Pierce (2005) as saying that domestic tourism demand is extremely hard to understand, let alone to determine and classify. One main reason for this is that the majority of statistics are inaccurate when it comes to the true size and volume of domestic travel. Moreover, they assert that official bodies such as the World Tourism Organization (WTO) and others do not seem to consider visiting friends and relatives as domestic tourism. Thus, having an accurate estimate of the real size of domestic travel becomes inexact, which represents a gap and a challenge for researchers who aim to obtain accurate data. Similarly, it impacts the real demand that cannot then be fully identified and explored. Nevertheless, Hall and Page (2006) quote Mathieson and Wall (1982) to explain domestic tourism demand as being “the total number of persons who domestically travel, or wish to travel, to use tourist facilities and services at places away from their places of work and residence” (p.68). On the same note, the authors refer to Pierce (1995) who points out that domestic tourism demand is ultimately a result of the interrelation between a person’s need, want or desire to travel and whether or not they are able to do it. However, Page and Connell (2009) make reference to another study by Hay and Rogers (2001) which identifies different features that drive domestic tourism. These comprise key aspects of domestic growth and consist of economic, social and cultural, political, technological, leisure and tourism and environmental drivers. Since any tourism sector tries to comprehend the pattern for how demand changes with time, such drivers are used in scenario planning and forecasting as they deal with uncertainty and prediction. Three drivers will be considered in particular, namely the power of choice, authenticity and socio-economic impacts.
Organizations in charge of regional touristic development need to be aware of the choices tourists make and the perceptions they have of a destination (Huybers, 2003). Such insight helps destination developers identify key present markets such as ecommerce customers, in order to reposition themselves (Louvieris, Driver & Perry, 2003). Huybers (2003) quotes Lancaster (1971) in regard to consumer choice modelling theory and Papatheodorou (2001) regarding tourism destination choice frameworks. Moreover, Papatheodorou and Bennett (2004) emphasize a choice framework in which global transport alliances have diversified the access consumers have to different markets. Accordingly, communication and gathering the right information beforehand is vital in order to make the right choice. Huang (2010) agrees and adds that certain policy changes can be performed by a country’s government in regards to travel agencies in order to develop a behaviour based “government-firm relationship” (p.152) that creates a win-win situation for both parties. However, Huybers (2003) determined beforehand that domestic tourist decision-making processes depend on a comparison between the qualities of opposing goods and services and the choice and options they provide their users. In addition, the author acknowledges research of choice model applications in tourism to have been previously undertaken, including Morley (1995) and Huybers and Bennett (2000). Accordingly, he identified the tourist choice process to be directly influenced by features such as a destination’s crowdedness, environmental condition, travel time required and the spending level per capita.
Yang and Wall (2009) cite Cole (2007) as stating that the concept of authenticity is “a Western cultural notion often associated with the past versus modernity” (p.7). He then goes on to acknowledge Cannell (1973) as asserting that actually the tourist is the one playing the main part in a destination’s quest for authenticity and not the service provided as this will be tailored according to the needs and wants of the customer. A large number of tourists typically persist in looking for untouched and original or simple and uncontaminated destinations (Yang & Wall, 2009) and do so in order to satisfy their need for quest and exploration of the unknown. To meet this expectation and get their business, service suppliers and destination developers often resort to unorthodox practices such as providing false authenticity. This may work occasionally but most of the times tourists realize the cover up and outsmart suppliers when they least expect them to. Such actions can definitely result in negative future business for local developers and in harming the destination’s future by downgrading the term authenticity and considerably reducing its perceived value by tourists (Yang and Wall, 2009).
Similar to Pierce (1995) and Huybers (2003) in previously mentioned arguments, further researchers have shown that domestic tourists spend far less money at home than they would do if they were to travel abroad for international tourism purposes (Wang & Qu, 2004). This means that a tourism business relying solely on domestic markets is harder to manage because it provides less revenue than it would if it were to target inbound tourists as well. Wu, Zhu and Xu (2000) agree, and add that governments must develop their national economy and maintain it at a level that permits an increase in personal income and leisure time per capita. Such progress is required in order to drive and maintain sustainable domestic tourism development. Additionally, Salaman, Shukur and von Bergmann (2007) identified the consumer price index to have an even greater impact on domestic tourism demand. The Oxford
Advanced Learner’s Dictionary of Current English (7th ed.) (2005), defines the consumer price index (CPI) as “a list of the prices of some ordinary goods and services which shows how much these prices change each month” (p.328). Thus, spending power does not only depend on income but on price as well. Sheykhi (2009) and Xu (1999) concur that mass domestic tourism has enormous socio-economic benefits both at a local and nationwide level. The authors suggest that not only does it create more jobs, but it enhances infrastructure, transportation and raises income, ultimately leading to personal well-being. Furthermore, domestic tourism enhances social benefits and supports bringing communities together, helping them integrate much easier despite the varieties and differences in culture, heritage, behaviour and historical background. In fact, these issues represent points of interest that foster domestic travel and tourism (Sheykhi, 2009; Xu, 1999). On a final note under this section, Scheyvens (2007) cites the World Tourism Organisation (2000) in Sofield (2003) as emphasizing that more than 50 poor countries worldwide rely on tourism as a top three contributor to their economic growth.
International Domestic Tourism Outcomes
This section outlines domestic tourism outcomes, with specific examples from China, Italy and Australia. These are relevant because these countries either have a combination of cultural, historical or economic similarities with Romania and Romanian tourism or are a benchmark to be aimed for. For instance, China had a similar communist background, Italy has a very similar cultural Roman background just like Romania and Australia has accurate domestic tourism data which makes it an excellent reference point.
China
According to the China National Tourism Administration (CNTA), cited by Wang and Qu (2004), 784 million tourists travelled domestically in 2002 spending a total of 43.6 billion US dollars, while in 2009 there have been 1.7 billion Chinese travelling domestically spending 100 billion US dollars (“Travel,” 2010). To support such movement of people, the Government of China has, in recent years, set in place a much-diversified infrastructure which relies mostly on public transport systems that confer the Government a monopoly (Wang, 2010). Wu, Zhu and Xu (2000) state that there are three main economic and political reasons behind the recent growth of Chinese domestic tourism demand, namely, earnings growth per capita, expansion of holiday entitlement and a more severe regulation of the economy. Wang (2010) agrees and adds more reasons to the list. He cites both Zang (2004) and Weng (2007) to point out that besides an increase in income and extension of leave policy, a highly positive influence on domestic demand is actually the rapid development of transportation infrastructure. Besides, a controlled regulation of the economy and transportation still confers the government a monopoly and secure profits (Wang, 2010). In conclusion, it has been identified that in order to support Chinese domestic tourism growth, income increase has a short-term influence, transportation has a long-term influence and leave policy has a constant influence (Wu, Zhu & Xu, 2000; Wang & Qu, 2004; Wang, 2010). Thus, the author concludes infrastructure, income and leave policy appear to be the key reference points of Chinese domestic tourism.
Italy
Domestic tourism in Italy is the largest sector of all tourism activities the country operates. In 2006 55.7 per cent of all arrivals have been recorded domestically and 57.2 per cent of overnight stays have also been of domestic origin (“Travel,” 2008). Hence, the dominance of domestic tourism coming in support of Manente (2000) who stated that Italy’s efficiency in terms of domestic tourism relies on the existing potential for enhanced consumer behaviour and higher regional touristic performance. Additionally, the author affirmed that adding value to tourism related goods while together fostering employment, would balance financial situations between different regions to compensate the national budget allocations. Previously, Costa, Manente and Minghetti (1996) identified that domestic tourists prefer lodging in low to mid-level hotels rather than luxurious properties. In addition, domestic tourists have been found to spend their money on restaurants, bars and hotels as well as on secondary services that include fun and leisure activities (Manente, 2000). However, one main interest they all have is to consume locally produced food especially pasta, pizza, cheeses (mozzarella) and meat (prosciutto) (Manente, 2000). Furthermore, domestic tourism in Italy relies heavily on agriculture and meat products that have been found to be mostly of domestic production (Costa et al., 1996). Consequently, domestic product consumption has been recorded over the limits during summer seasons, which coincides with an increase in the amount of domestic tourist travel between the months of June and September (“Travel,” 2008). Therefore, local products and adding value are the two most important reference points in the case of Italian domestic tourism.
Australia
Throughout the 1990’s, domestic tourism in Australia had a constant growth of 2 per cent per year, starting at 279 million nights in 1993, which represented more than 75 per cent of the total visitor nights (Hamal, 1996). Since then however, Tourism Australia (2010) points out that domestic overnight stays have never been that high again and have actually declined to 259.3 million in 2010. Moreover, the growth rate for the next decade has been in fact revised down to 0.3 per cent which means that domestic tourism is not expected to grow significantly until 2020 when it will reach only 267 million overnight stays (TRA, 2010). Huybers (2003) suggests that destination leaders and developers need to take into account more variables than usual in order to develop a successful positioning and growth strategy. Such variables have a direct impact upon tourist’s choice making process and imply the degree of crowdedness at the destination, what type of environment it is situated in and how much they are willing to spend, compared with income and prices. Accordingly, the author discovered through completion of 400 questionnaires and one focus group in Melbourne, that Melbourne residents prefer to travel domestically only for short holidays because they get less value for money than overseas (Huybers, 2003). On top of this, the Tourism Research board of Australia adds that another reason for overseas travel is the strength of their national currency (TRA, 2010). The Australian dollar, they say, has increased outbound tourism considerably and decreased domestic tourism to a historical low in 2009. As a matter of fact only domestic business tourism and VFR have remained uninfluenced and actually increased by 7.2 per cent in 2010. However, this increase has been over-shadowed by a 2 per cent decrease in leisure travel (TRA, 2010). Hence, the author considers the strength of the national currency to be the main reference point impacting Australian domestic tourism.
Romanian Domestic Tourism
Because of its geographical positioning, Romania has two main touristic components: the natural one due to varied landscapes, climate settings and geothermal waters, and the historical one due to an array of civilizations who inhabited Romanian territory over time such as Thracians, Greeks, Dacians, Geto-Dacians and Romans (Romania, 2011). Therefore large ranges of touristic services are available, including but not limited to seaside, mountain, hot springs visits, cultural tourism, business tourism, hunting or angling (“Travel,” 2007). Due to its eventful past, the country now has a wide variety of historical, architectural and archaeological art monuments as well as or regions which encompass more than 12 nationalities, cultures and religions living together without any violence for the past 50 years i.e. Dobrogea and the Banat region.
However, the total number of domestic overnight stays in recent years has never exceeded 30 per cent of the total population. For instance, in 2007 there were 5.4 million overnight stays, in 2008 5.7 million and in 2009 the numbers dropped to 4.9 million due to the global recession (NIS, 2010). Regarding accommodation preferences, 103,457 of the overnight stays of 2009 have been registered in five star locations, 674,993 in four stars, 1,596,471 in three stars, 1,930,561 in two stars and 424,119 in one star locations. Hence, the majority of Romanian domestic tourists prefer two and three star locations rather than luxurious four or five star ones. In 2009, 756,749 domestic overnight stays were registered on the seaside, 617,015 in hot spring resorts and spas, 749,879 in various mountain resorts, 54,591 in the Danube Delta and 1,904,263 in Bucharest and other county capitals such as Timișoara, Cluj, Constanța, Brașov, Sibiu, Iași, Galați, Craiova, Ploiești or Brăila (NIS, 2010). Thus, the majority of Romanian domestic tourists are more actively engaging in business or city type tourism rather than exploring the alternatives given by the country’s geographical position in terms of the Carpathian Mountains, Danube River and Delta, Transylvania, hot springs or monasteries. It therefore seems reasonable to consider that by applying key reference points from Chinese, Italian and Australian domestic tourism to Romanian domestic tourism would have a very positive impact on growth.
METHODOLOGY The author of this study adopted a survey strategy for gathering primary data using a mainly deductive
approach with realism philosophy thus enabling the use of questionnaires that provide data available for generalisation if proper sampling is done (Saunders et al., 2009; Zikmund, 2000). Nevertheless, several survey questions will be open-ended questions to allow for the causal understanding of events through “understanding people’s words” (p.134) (Cavana, Delahaye & Serakah, 2001). According to Creswell (2009), Saunders et al. (2009) and Zikmund (2000), researchers base their work on a 95 per cent accuracy of their data and as stated by Saunders et al. (2009), for a 5 per cent margin of error, a population of 10,000,000 or above required a minimum sample size of 384. As the target population for this paper is the population of Romania and exceeded 10,000,000, a sample size of
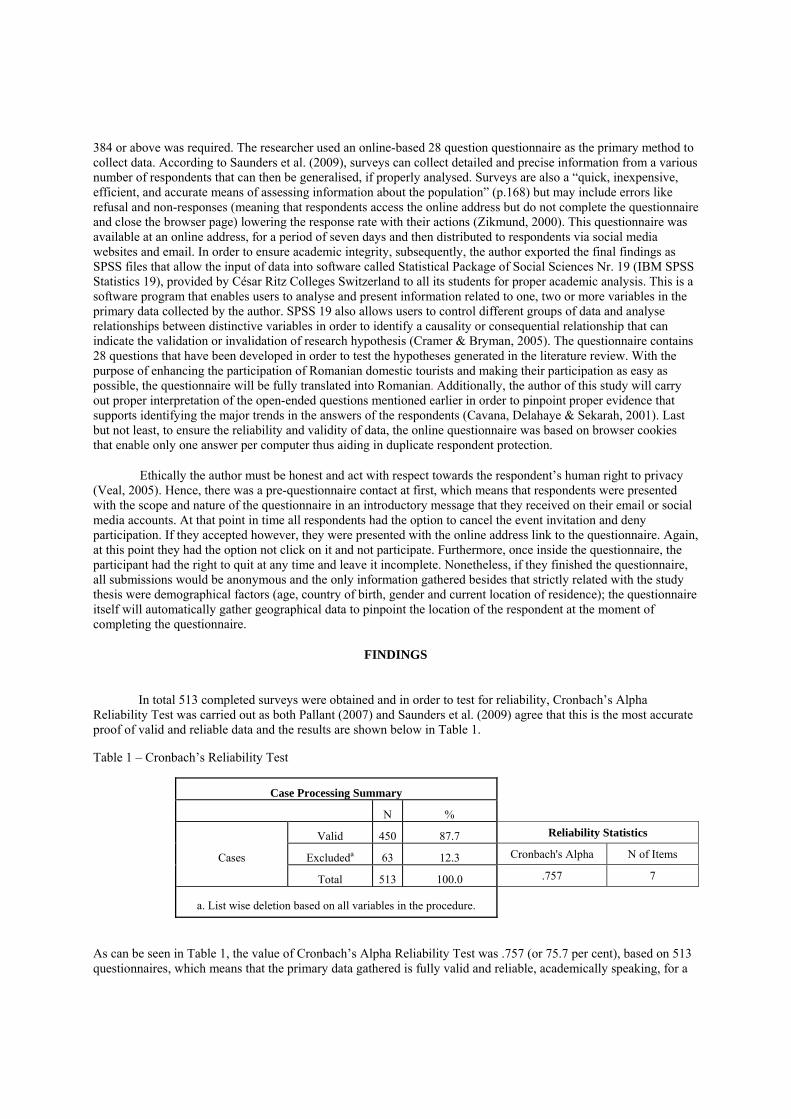
384 or above was required. The researcher used an online-based 28 question questionnaire as the primary method to collect data. According to Saunders et al. (2009), surveys can collect detailed and precise information from a various number of respondents that can then be generalised, if properly analysed. Surveys are also a “quick, inexpensive, efficient, and accurate means of assessing information about the population” (p.168) but may include errors like refusal and non-responses (meaning that respondents access the online address but do not complete the questionnaire and close the browser page) lowering the response rate with their actions (Zikmund, 2000). This questionnaire was available at an online address, for a period of seven days and then distributed to respondents via social media websites and email. In order to ensure academic integrity, subsequently, the author exported the final findings as SPSS files that allow the input of data into software called Statistical Package of Social Sciences Nr. 19 (IBM SPSS Statistics 19), provided by César Ritz Colleges Switzerland to all its students for proper academic analysis. This is a software program that enables users to analyse and present information related to one, two or more variables in the primary data collected by the author. SPSS 19 also allows users to control different groups of data and analyse relationships between distinctive variables in order to identify a causality or consequential relationship that can indicate the validation or invalidation of research hypothesis (Cramer & Bryman, 2005). The questionnaire contains 28 questions that have been developed in order to test the hypotheses generated in the literature review. With the purpose of enhancing the participation of Romanian domestic tourists and making their participation as easy as possible, the questionnaire will be fully translated into Romanian. Additionally, the author of this study will carry out proper interpretation of the open-ended questions mentioned earlier in order to pinpoint proper evidence that supports identifying the major trends in the answers of the respondents (Cavana, Delahaye & Sekarah, 2001). Last but not least, to ensure the reliability and validity of data, the online questionnaire was based on browser cookies that enable only one answer per computer thus aiding in duplicate respondent protection.
Ethically the author must be honest and act with respect towards the respondent’s human right to privacy (Veal, 2005). Hence, there was a pre-questionnaire contact at first, which means that respondents were presented with the scope and nature of the questionnaire in an introductory message that they received on their email or social media accounts. At that point in time all respondents had the option to cancel the event invitation and deny participation. If they accepted however, they were presented with the online address link to the questionnaire. Again, at this point they had the option not click on it and not participate. Furthermore, once inside the questionnaire, the participant had the right to quit at any time and leave it incomplete. Nonetheless, if they finished the questionnaire, all submissions would be anonymous and the only information gathered besides that strictly related with the study thesis were demographical factors (age, country of birth, gender and current location of residence); the questionnaire itself will automatically gather geographical data to pinpoint the location of the respondent at the moment of completing the questionnaire.
FINDINGS
In total 513 completed surveys were obtained and in order to test for reliability, Cronbach’s Alpha Reliability Test was carried out as both Pallant (2007) and Saunders et al. (2009) agree that this is the most accurate proof of valid and reliable data and the results are shown below in Table 1.
Table 1 – Cronbach’s Reliability Test
Case Processing Summary
N %
Cases
Valid 450 87.7 Reliability Statistics
Excludeda 63 12.3 Cronbach's Alpha N of Items
Total 513 100.0 .757 7
a. List wise deletion based on all variables in the procedure.
As can be seen in Table 1, the value of Cronbach’s Alpha Reliability Test was .757 (or 75.7 per cent), based on 513 questionnaires, which means that the primary data gathered is fully valid and reliable, academically speaking, for a
proper analysis as it exceeds .700 (or 70.0 per cent). Moreover the number of valid completed questionnaires exceeds the 384 required to achieve a 95 per cent accuracy rate as per Saunders et al. (2009). Furthermore, the following Table 2 illustrates the place of origin of the participants adding credibility to their suitability for inclusion in this study.
Table 2 – Participant Cities of Origin
The following area of the paper encompasses the outcomes of the online survey incorporating both quantitative and qualitative findings. Consequently, these are compared and contrasted with domestic tourism concepts, ideas and facts outlined in the Literature Review. The author has divided the findings into the broad categories covered by the survey and secondary research, question by question results from SPSS are available on request from the author.
Favourite destinations, travel purposes and duration
Survey participants were asked to answer no more than three questions regarding their favourite travel destinations (one for the summer season, one for the winter season and one in general). As a clear trend, just like the author expected, the majority of choices for summer were abroad, either to neighbouring countries such as Bulgaria and Hungary or to Mediterranean countries such as Greece and Croatia. During the winter season however the preferences were rather surprising and included mostly domestic destinations. Locations abroad were limited to Austria, Switzerland and Germany for skiing. This might be easily explained by the fact that participants spend the wintertime with their families at home for Christmas and New Year’s Eve. However, this is just an assumption that must be tested before considered valid. Regarding the overall favourite destination, almost all respondents chose foreign touristic locations, the answers varying from European countries such as Hungary, Germany, France, Spain, Portugal, Austria, Denmark and England, to North, Central and South American countries like Mexico, Canada, Brazil, the USA and Argentina.
Most participants said that they travel domestically for 2 up to 10 days but not more and do so for leisure or VFR purposes. Only 19.8 per cent seem to travel for business. The first part of these findings is in line with Chapter II: Literature Review where the author identified domestic travel to be shorter than a few years ago (Scheyvens, 2007). Not only Australia is witnessing this phenomenon but also Italy (Manente, 2000). However, respondents rated their business travel preference unexpectedly low compared with leisure and VFR. It seems that the size of the Romanian diaspora that travels home for VFR purposes is greater than expected. Therefore it is apparent that even if domestically speaking, respondents travel for leisure and VFR purposes they do so overseas in larger quantities especially during the summer season and therefore the Romanian domestic tourism sector loses a substantiate demand size in favour of overseas destinations.
Travel motivators and means of travel
When travelling domestically the majority of respondents do so by using both car and train. Very few use buses (13 per cent), 8 per cent use airplane and only 0.6 per cent travel by motorcycle. This infers the need for infrastructure development and transport improvement. The author was inspired to choose this question by the effort that Chinese authorities have been making for the past couple of decades to improve their infrastructure and transportation (Wang & Qu, 2004). As a result, China benefited from a domestic spending by its tourists of over 100 billion US dollars in 2010 (“Travel”, 2010). The questions regarding travel motivators turned out to be a real success because more than 490 participants answered them. In each case more than 60 per cent of respondents considered paid holiday increase, income increase, transportation development and infrastructure improvement, likely and very likely to foster their domestic travel plans. Infrastructure improvement and transportation development ranked the highest, with a likely and very likely scale over 80 per cent. These findings are in line with what has been presented in the Literature Review to be motivating other countries’ domestic tourists. China has been discussed above while in Australia the value of the Australian Dollar dictates whether Australians travel domestically or overseas (Huybers, 2003; TRA, 2010). It is evident that most Romanian domestic tourists travel by car and that an improvement in infrastructure and transportation development is clearly required if the industry wishes to remain in the business and be profitable.
Preferred accommodation and local development
Romanian domestic tourists, just like Italian domestic tourists seem very compassionate towards local community development and also rate the consumption of local F&B products as being very important. Domestic tourism in Italy relies heavily on domestic product consumption such as pizza, different pastas, mozzarella or prosciutto (Costa et al., 1996; Manente, 2000). When travelling domestically, survey respondents confirmed the measurements from the National Institute of Statistics by rating 3 star facilities as their preferred accommodation, followed by 2, 4, 1 and 5 stars. This is also in line with Italian tourists and their accommodation preferences (Manente, 2000). It appears that regardless of their accommodation preferences Romanian domestic tourists still consider local development and product consumption very important when travelling domestically.
Authenticity and over crowding
Almost 90 per cent of respondents consider domestic locations to be authentic and at the same time, the same 90 per cent perceive the same domestic locations to be over-crowded during peak seasons. Thus, it appears that Romanian domestic tourism is authentic enough not to be considered an issue as according to Yang and Wall (2009). Therefore, demand is high resulting in over-crowded but uncontaminated destinations. However, this other issue might be resolved by infrastructure investments and transportation improvements which were both very highly rated by respondents in regards to their domestic travel plans.
Prices and currency exchange
In regard to domestic tourism prices in Romania and the value of the natural currency the results indicate that this is an area of concern for Romanian tourism. On the one hand, according to the majority of the respondents, tourism related prices are much higher than the value they offer and significantly influence Romanian nationals in travelling less or going abroad. On the other hand the RON is not a strong currency and when exchanged loses even more value. So the primary research findings are once again in line with the Literature Review where it was noted that price increases and currency devaluation constrain tourists from travelling. In Australia, the strength of the Australian dollar has increased outbound tourism and decreased domestic (TRA, 2010), meaning that a weak currency such as the RON should benefit domestic tourism. But it seems that the RON is so weak that instead of benefiting domestic tourism it actually reduces it because as respondents said, holiday savings become harder and harder.
CONCLUSIONS
Based on the findings of this paper the following recommendations are put forward for consideration. To start with, the author would like to refer to the Romanian tourism industry. The majority of respondents consider
domestic tourism services and products to be over-priced for the quality they offer. Therefore, almost all respondents rated foreign locations as their favourite touristic destinations because of the value for money they offer. Accordingly, the author recommends the industry to reassess the quality of their products and services or to drop prices in order to regain the domestic demand that has been lost to other overseas industries. The author would then like to address the Romanian Ministry of Tourism with a few recommendations. First of all the author would encourage the Ministry of Tourism as a governmental body to liaise with the Ministry of Transportation and together create and implement a plan to develop the country’s infrastructure starting with the most used areas, both motorways and railways. Secondly, the author believes that as a governmental body, the Ministry of Tourism might wish to liaise with the Ministry of Labour in order to grant Romanian citizens not only a raise in salaries but also an increase in paid holidays. Thirdly, the author wishes to recommend that they partner with other governmental agencies for regional development, the purpose being to encourage regional government spending in order to attract more domestic tourists because according to this study’s primary data, domestic tourists are willing to spend more regionally in support of local economic development.
Finally it is highly recommended that a similar survey be conducted on a regular basis every second year. To facilitate data accuracy and decrease the margin of error, the author recommends the creation of paper questionnaires and their distribution in all touristic accommodation premises across the country.
REFERENCES
BloomBIZ. (2011). Romanii pleaca in vacanta o data pe an. Afla destinatiile favorite. Retrieved March 3rd 2011, from http://www.bloombiz.ro/turism/romanii-pleaca-in-vacanta-o-data-pe-an.-afla-destinatiile-favorite_1487375.
Cavana, R.Y., Delahaye, B.L. & Sekarah, U. (2001). Applied Business Research: Qualitative and Quantitative Methods. Singapore: Markono Print Media Pte Ltd.
Costa, P., Manente, & Minghetti, V. (1996). Tourism Demand Segmentation and Consumption Behaviour. An Economic Analysis. Tourism Review 51(51): 53-62.
Cramer, D. & Bryman, A. (2005). Quantitative Data Analysis with SPSS. A guide for social scientists. UK: TJ International Ltd, Padstow, Cornwall.
Creswell, J.W. (2009). Research Design Qualitative, Quantitative and Mixed Methods Approaches. (3rd ed.). UK: Sage Publications Ltd., London.
Hall, M.C. & Page, S.J. (2006). The Geography of Tourism and Recreation. (3rd ed.). Great Britain: Bell & Bain Ltd., Glasgow.
Hamal, K. (1996). Modelling domestic holiday tourism demand in Australia: problems and solutions. Paper presented at the Asia Pacific Tourism Association ’96 Conference, Townsville, Australia. Retrieved January 31 2011, from http://www.ret.gov.au/tourism/Documents/tra/Snapshots%20and%20Factsheets/96.11%20Modelling%20Domestic
Hornby, A.S. (2005). Oxford Advanced Learner’s Dictionary of Current English. (7th ed.). UK: Oxford University Press.
Huang, S. (2010). Toward a behavioural theory of government-firm relationship behaviour: thick description of the dynamics of government’s role in shaping China’s domestic, inbound and outbound tourism industry. Tourism Marketing Performance Metrics and Usefulness Auditing of Destination Websites Advances in Culture, Tourism and Hospitality Research 4: 149-163.
Huybers, T. (2003). Domestic tourism destination choices – a choice modelling analysis. International Journal of Tourism Research 5: 445-459.
Leiper, N. (1979). The Framework Of Tourism. Towards a Definition of Tourism, Tourist and the Tourist Industry. Annals of Tourism Research. Retrieved April 22nd 2011, from http://www.hospitality.ucf.edu/faculty/raywang/documents/HFT7715/Defining%20and%20describing%20tourism/The%20framework%20of%20tourism.pdf.
Louvieris, P., Driver, J. & Perry, J.P. (2003). Managing customer behaviour dynamics in the multi-channel e-business environment: Enhancing customer relationship capital in the global hotel industry. Journal of Vacation Marketing 9(2): 164-173.
Manente, M. (2000). Tourism consumption and interregional economic impacts in Italy. International Journal of Contemporary Hospitality Management 12(7): 417-423.
NIS (National Institute of Statistics). (2010). Romanian Tourism Statistical Abstract. Retrieved April 14th 2011, from http://www.insse.ro/cms/files%5Cpublicatii%5Cbreviar%20turism_2010.pdf.
Papatheodorou, A. & Bennett, M. (2004). Practice papers. Editorial. Tourism and hospitality research 5(1): 64. Retrieved April 22nd 2011, from http://www.palgrave-journals.com/thr/journal/v5/n1/pdf/6040005a.pdf.
Page, S. & Connell, J. (2009). Tourism: A Modern Synthesis. (3rd ed.). London: Thomson Learning. Pallant, J. (2007). SPSS Survival Manual. England: Open University Press, Berkshire. Romania. (2011). In Encyclopaedia Britannica. Retrieved March 5th 2011, from
http://www.britannica.com/EBchecked/topic/508461/Romania. Salaman, A., Shukur, G., & von Bergmann M. (2007). Comparison of econometric modelling of demand for
domestic and international tourism: Swedish data. Current Issues in Tourism 10(4): 323-342. Saunders, M., Lewis, P. & Thornhill, A. (2009). Research methods for business students. (4th ed.). UK: Pearson
Education Limited, Essex. Scheyvens, R. (2007). Poor cousins no more: valuing the development potential of domestic and diaspora tourism.
Progress in Development Studies 7(4): 307-325. Sheykhi, M. (2009). Domestic tourism in Iran. An International Multidisciplinary Journal of Tourism 4(1): 109-123. Sora, I. (2008). Turism local: un strain vine, sapte romani pleaca. Retrieved March 3rd, 2011, from
http://www.financiarul.com/articol_12579/turism-local-un-strain-vine-sapte-romani-pleaca.html. TRA (Tourism Research Australia). (2010). Forecast 2010 Issue 2. Retrieved April 25th 2011, from Tourism
Australia official website at: http://www.tourism.australia.com/en-au/research/3928.aspx. Travel and Tourism – China. (2010). Retrieved April 25th 2011, from
http://academic.mintel.com/sinatra/oxygen_academic/search_results/show&/display/id=483139/display/id=505561?select_section=483139.
Travel and Tourism – Italy. (2008). Retrieved April 25th 2011, from http://academic.mintel.com/sinatra/oxygen_academic/search_results/show&/display/id=294925/display/id=337765/display/id=294925.
Travel and Tourism – Romania. (2007). Retrieved March 5th 2011, from http://academic.mintel.com/sinatra/oxygen_academic/search_results/show&/display/id=237160/display/id=262892?select_section=237160.
Veal, A.J. (2005). Business Research Methods. A Managerial Approach. (2nd ed.). New South Wales: Pearson Education Australia.
Wang, S., & Qu H. (2004). A comparison study of Chinese domestic tourism: China vs the USA. International Journal of Contemporary Hospitality Management, 16(2): 108-115.
Wang, Z. (2010). Factors that Influence the Growth of Chinese Domestic Tourism Arrivals (1985-2007) – An Empirical Research Based on the VAR Model. Asia Pacific Journal of Tourism Research 15(4): 450-460.
Wu, B., Zhu, H. & Xu, X. (2000). Trends in China’s domestic tourism development at the turn of the century. International Journal of Contemporary Hospitality Management 12(5): 296-299.
Yang, L., & Wall, G. (2009). The Quest for Authenticity: Domestic Tourists’ Perspectives. Current Issues in Tourism 12(3): 235-254.
Xu, G. (1999). Socio-economic impacts of domestic tourism in China: case studies in Guilin, Suzhou and Beidaihe. Tourism Geographies 1(2): 204-218.
Zikmund, W.G. (2000). Business Research Methods. (6th ed.). USA: Harcourt College Publishers, Orlando, FL.
Is there a Future / Career for Tourist Guides?
Dr. Detta M. Melia Ms. Josephine Rice
School of Hospitality Management and Tourism
College of Arts and Tourism Dublin Institute of Technology
Cathal Brugha Street Dublin 1.
Ireland [email protected]
Abstract
Tourist guides are the essential interface between a tourism destination and its visitors, and are very much responsible for the overall impression and satisfaction offered by a destination. However, despite the prominent role that tourist guides play in the system of tourism, fairly scant scientific attention has been paid to them to date. Tourist Guides create a link between the visitor and the host country. Yet, of the small amount of literature devoted to them, very few studies have asked tourist guides their views and opinions, and have built up a profile of the tourist guide. This paper is an attempt to redress the balance.
Primary research for this paper was carried out with a focus on the Tourist Guides of Dublin, Ireland as this destination contains the largest number of tourist guides on the island of Ireland. Some of the study’s findings are surprising. Many of the conditions of the job, characterised universally in the existing literature as negative, actually suit Dublin tourist guides. A large majority of both tourist guides and tour operators are optimistic for the future of the tourist guiding industry in the city. Is there a future/career for professional tourist guides in the industry? The answer is yes, although, at the moment, that future is seasonal and part-time.
Key Words: Tourist Guides; Tourism, Career, Seasonal, Part-Time, Tour Operators
Future Career for Tour Guides
INTRODUCTION Tourist guides are the essential interface between a tourism destination and its visitors, according to Ap & Wong (2001), who go on to state that guides are very much responsible for the overall impression and satisfaction offered by a destination. Their views are echoed by Zhang & Chow (2004) who maintain that ‘Tour (sic) guides are the front line staff who provide the ‘moment of truth’ for tourists, and can make or break their trip’ (p.81). However, Scherle and Kung (2010) point out that despite the prominent role that tourist guides play in the system of tourism, fairly scant scientific attention has been paid to them to date. Tourist Guides create a link between the visitor and the host country. Yet, of the small amount of literature devoted to them, very few studies have asked tourist guides their views and opinions, and have built up a profile of the tourist guide. This paper is an attempt to redress the balance.
The study arose as a result, in part, of a report prepared for the Irish Tourist Industry Confederation (ITIC) which stated that the job of the tourist guide is ‘unattractive to many due to its seasonality, unsocial hours, relatively low pay and frequently very demanding working conditions and tourists’ (ITIC, 2008:28). Comments made by an outgoing President of the Association of Approved Tourist Guides of Ireland (AATGI), Ms. Georgina Boylan, at the association’s annual general meeting to the effect that there was a perception that tourist guides were aging and that there was a difficulty in retaining newly qualified guides within the industry (AATGI, AGM minutes 2009 (unpublished)), further prompted the need to study the tourist guide industry. The aim of this paper is to investigate the claims made by Ms. Boylan and made in the ITIC study of 2008 in order to understand the impact these might have on tourist guide careers and to answer the research question: Is there a future/career for professional tourist guides in the tourism industry?
The objectives of the research were as follows:
To establish the age range; educational attainments; availability of work; and remuneration of professional tourist guides.
To ascertain the views of tourist guides on a range of issues such as: pay; status; seasonality; self-employment; and career path.
To explore and evaluate a variety of potential threats and challenges to the future of tourist guides including threats posed to the industry by unqualified guides and from new Information Technologies.
To ascertain the views of tour operators in relation to: the employment of tourist guides; the profile of tourist guides; and the future of tourist guiding in Ireland.
LITERATURE REVIEW
The research presented in this paper focuses on the literature on the tourism industry in Ireland and examines the role of the tourist guide as part of the tourism product.
Tourism is an essential contributor to the economic well being of Ireland. However, this decade has seen a mix of fortunes for the tourism industry in Ireland. After a prolonged period of uninterrupted growth from the 1980’s, the impact of the SARS virus, the aftermath of the 9/11 terrorist attacks on the U.S., and the subsequent Iraq war, all caused a stalling of growth in the period 2001 to 2003 (Tourism Policy Review Group, 2003). This was followed by a steady increase, year on year of visitor numbers from 6.2 million visitors in 2003 to just 7.7 million in 2007. This growth was matched by an increase in total foreign exchange earnings from €3.6 billion in 2000 to a high of €4.9 billion in 2007 (Fáilte Ireland, 2009). According to the Irish Tourism Industry Confederation (ITIC), the main driver of the growth in demand up to 2007 was primarily economic prosperity in source markets, coupled with supply side factors such as the expansion of the range of attractive holidays on offer, new routes and cheaper airfares, and aggressive marketing (ITIC, 2010). Following 6.2 million visitors in 2000, there was a decrease in 2001 and it took until 2004 to surpass the 2000 figure. There was steady growth until a high in 2007 and a decline in numbers since then (Failte Ireland 2004; 2005; 2006; 2007; 2008; 2009a).
Just as visitor numbers have fallen back since 2007, so also have foreign exchange earnings, totalling €4.8 billion in 2008 and €3.9 billion in 2009 and a provisional 3.4 billion in 2010 (Fáilte Ireland, 2011). The worldwide economic recession has caused a slump in international travel, resulting in almost 1.2 million fewer foreign visitors to Ireland in 2009 than in 2007, and a further drop of 690,000 in 2010 (Fáilte Ireland, 2011). However, preliminary figures for the first six months of 2011 indicate an increase on the same period of 2010. Quarter (Q) 1 (January to March) figures show an increase of 8.6%, while Q2 (April to June) show a 15.6% increase on the same periods in 2010 respectively (Central Statistics Office, 2011a). The 2010 visitor numbers
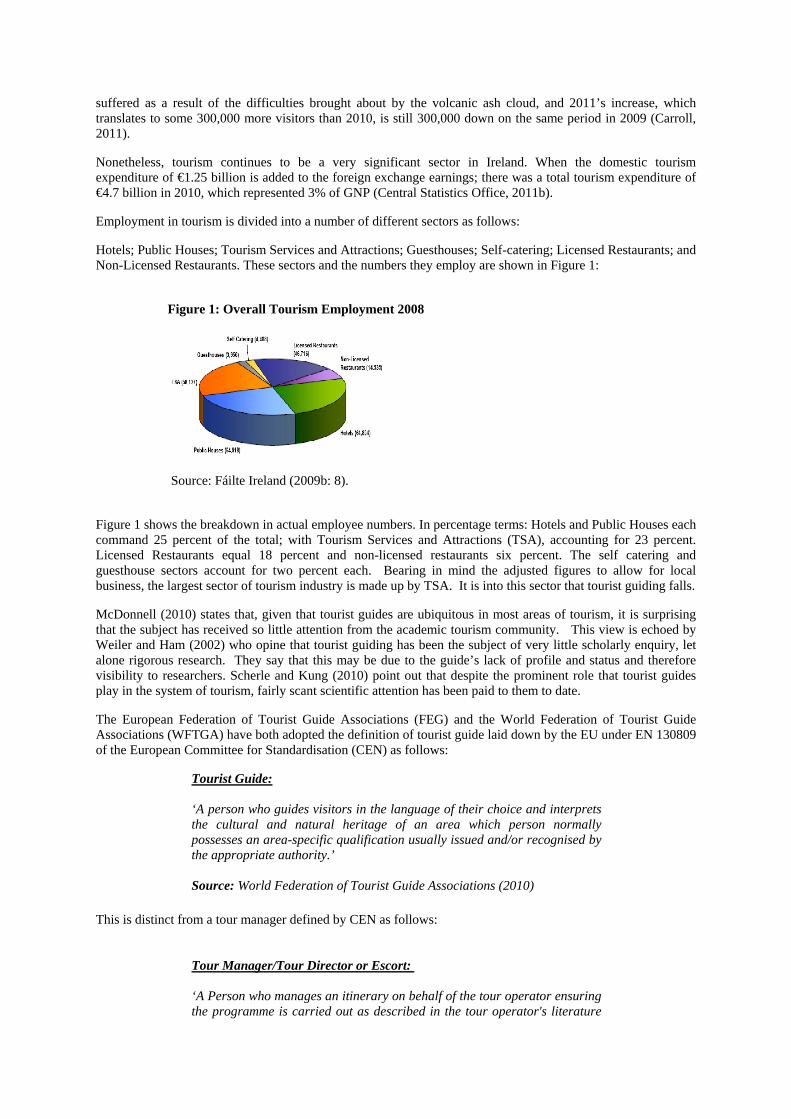
suffered as a result of the difficulties brought about by the volcanic ash cloud, and 2011’s increase, which translates to some 300,000 more visitors than 2010, is still 300,000 down on the same period in 2009 (Carroll, 2011).
Nonetheless, tourism continues to be a very significant sector in Ireland. When the domestic tourism expenditure of €1.25 billion is added to the foreign exchange earnings; there was a total tourism expenditure of €4.7 billion in 2010, which represented 3% of GNP (Central Statistics Office, 2011b).
Employment in tourism is divided into a number of different sectors as follows:
Hotels; Public Houses; Tourism Services and Attractions; Guesthouses; Self-catering; Licensed Restaurants; and Non-Licensed Restaurants. These sectors and the numbers they employ are shown in Figure 1:
Figure 1: Overall Tourism Employment 2008
Source: Fáilte Ireland (2009b: 8).
Figure 1 shows the breakdown in actual employee numbers. In percentage terms: Hotels and Public Houses each command 25 percent of the total; with Tourism Services and Attractions (TSA), accounting for 23 percent. Licensed Restaurants equal 18 percent and non-licensed restaurants six percent. The self catering and guesthouse sectors account for two percent each. Bearing in mind the adjusted figures to allow for local business, the largest sector of tourism industry is made up by TSA. It is into this sector that tourist guiding falls.
McDonnell (2010) states that, given that tourist guides are ubiquitous in most areas of tourism, it is surprising that the subject has received so little attention from the academic tourism community. This view is echoed by Weiler and Ham (2002) who opine that tourist guiding has been the subject of very little scholarly enquiry, let alone rigorous research. They say that this may be due to the guide’s lack of profile and status and therefore visibility to researchers. Scherle and Kung (2010) point out that despite the prominent role that tourist guides play in the system of tourism, fairly scant scientific attention has been paid to them to date.
The European Federation of Tourist Guide Associations (FEG) and the World Federation of Tourist Guide Associations (WFTGA) have both adopted the definition of tourist guide laid down by the EU under EN 130809 of the European Committee for Standardisation (CEN) as follows:
Tourist Guide: ‘A person who guides visitors in the language of their choice and interprets the cultural and natural heritage of an area which person normally possesses an area-specific qualification usually issued and/or recognised by the appropriate authority.’ Source: World Federation of Tourist Guide Associations (2010)
This is distinct from a tour manager defined by CEN as follows: Tour Manager/Tour Director or Escort: ‘A Person who manages an itinerary on behalf of the tour operator ensuring the programme is carried out as described in the tour operator's literature
and sold to the traveller/consumer and who gives local practical information.’
‘Note: Tour managers may or may not be tourist guides as well. They are not trained or licensed to work in specific areas unless they have the proper requirements or legal right, depending on the region.’
Source: World Federation of Tourist Guide Associations (2010)
The EU uses the designation ‘tourist guide’ as opposed to ‘tour guide’ to underline the differences between tour manager, defined above, who does not need special qualifications, and tourist guide, who is required to be licensed or recognised by the appropriate authority, in Ireland’s case, Fáilte Ireland.
A seminal work by Cohen (1985) classifies the modern tourist guide as having its origins as either a pathfinder or mentor. The Pathfinder is one who finds a path through an unfamiliar environment for travellers, the latter, more of a personal tutor or spiritual advisor. Both these roles, Cohen argues, have now developed in leadership and mediatory roles. Under the leadership role, the guide must give direction to the tour, must control the group, and is responsible for the social component which involves tension management within the group, serving as an integrating force, maintaining morale and providing animation. The mediatory role sees the guide as a ‘middleman between his party and the local population’; he interposes himself between the party and the environment and thus makes it non-threatening to his party. Communication is one of the guide’s principal roles under the mediatory sphere, influencing his group by the objects of interest he selects to point out and the information and interpretation he provides (Cohen, 1985).
Building on Cohen’s (1985) analysis, Pond (1993) identifies five roles for the guide: leader; educator; Public Relations representative; host; and conduit. Pond also differentiates between types of guides. Mancini (2001) adopts a similar type of classification. Both classifications are set out in table 1 below:
Table 1: Types of Tourist Guides
Pond (1993) Mancini (2001) Urban guide Government Guide e.g. in The White House Driver-Guides (illegal in some areas)
Business or Industry Guides (for private industrial facilities)
Adventure Guide / Interpreter
Dept. of State Escorts (for Official Foreign Visitors
Docents/Volunteer Guides
City Guides – on coaches or on foot; for groups or individuals On-site guides conducting tours in a specific building e.g. St. Peter’s in Rome
Specialised guides e.g. for white water rafting Guides employed by large companies e.g. Greyline Guides who work for cruise lines or ground operators such as DMCs or Incentive Houses
Bearing in mind Cohen’s (1985) framework and the variety of roles identified by Pond (1993) and Mancini (2001), researchers have some observations to make about tourist guides. Ap and Wong (2001) suggest that tourist guides are the essential interface between the host destination and its visitors. In fact they are front-line employees who are very much responsible for the overall impression and satisfaction with the tour services offered by a destination. Scherle and Kung (2010) state that tour guides play a crucial role in the tourism system and that according to their professional self image, tour guides operate between cultures like almost no other professional group in tourism. Hence in the course of their professional activities they naturally play the role of intercultural mediators.
A discordant note, however, is sounded by Reisinger and Steiner (2006), who espouse Authentic Tourism and suggest:
First, the suggestion that tour guides enhance tourist experiences seems to assume that tourists are not capable of interpreting the alien worlds they visit or will have a less rich or incorrect experience if someone does not explain what they are experiencing. Second, the mere existence of tour guides assumes that the meaning of tourist experience can and should be constructed outside the experience rather than emerge from within it (p .485).
While Authentic Tourism has a following, there seems to be no research to suggest that it has impacted on the job prospects of tourist guides.
According to Pond (1993) qualifications and educational standards for guiding vary substantially throughout the world. She states that some guides are educated to university degree standard, especially in Europe, while others have no qualifications whatsoever.
McDonnell (2010) concurs, when he says that the training requirement can vary from one that is tightly regulated, for example in Cyprus, where the Cypriot tourism organisation controls tourist guides, and where one must be a Cypriot national in order to qualify as a guide, to Australia, where anyone can set up as a tourist guide without any qualifications. McDonnell goes on to say that an accreditation system has recently been introduced based solely on guides’ on-the-job experience, but is not mandatory.
Ap and Wong, (2001) and Zhang and Chow, (2004) state that tourist guides in Hong Kong also do not require any formal training. However, both papers recommend the introduction of a licensing system based on attending and successfully passing a training course.
ITIC (2008) states that: ‘the job is unattractive to many due to its seasonality, unsocial hours, relatively low pay and frequently very demanding working conditions and tourists’ (p.28). Pond (1993) concurs by stating that guides are most likely to work freelance with few job benefits and for meagre wages. She also mentions the issue of seasonality, saying that the seasonal and part-time nature of the work in most regions imposes limitations on the amount of work and income available through guiding.
Many of these issues are also highlighted by Weiler & Ham (2002) who state that tourist guiding is a low-status profession, which is characterised by low pay, poor working conditions, casual employment conditions and seasonality. Ap and Wong (2001), albeit writing about guides in Hong Kong, maintain that their work is often of a seasonal, freelance and part-time nature thus resulting in their visibility, stature and income being low. They add that, due to the self-employed nature of the job, guides lack the resources to further their profession’s own collective self interests. Widtfeldt Meged (2010) expands on the point that guides are essentially freelancers and self-employed.
Unqualified guides and a lack of a defined career path are further challenges identified by Weiler & Ham (2002) who point out that in many countries, qualifications are not required, that those with qualifications are not remunerated in any special way, and that there is no career path, so over time good guides may move on to some other occupation. McDonnell (2001) suggests that it is somewhat strange that tourist guides, who may have the greatest impact of all on the satisfaction of an international tourist, are virtually the only elements of the tourism industry in Australia which are not regulated. Ap and Wong (2001) echo this challenge of non-regulation when they state that ‘unhealthy tour operator practices such as use of unqualified tour guides…pose a threat to the sustainability of the profession and industry’ (p. 556).1 They also mention the lack of a career path. Zhang and Chow (2004) recommend that all tourist guides in Hong Kong be regulated and licensed in order to upgrade professional service standards.
1 It should be noted that tourist guiding in Ireland is not regulated. Therefore, while the state runs
training courses and approves qualified guides, it does not require that all guides be qualified. It is
not illegal in Dublin, as it is in Rome, for example, to guide without any qualification.
Pond (1993) mentions the threat of driver-guides, that is, one person doing the job of both the driver and the guide. She says that this practice is illegal in some areas.
Another challenge to tourist guides is the development of Information Technologies (IT) for tourism. Baum (2007) points out that the role of the tourist guide is changing or diminishing in part, by being superseded by flexible, electronic alternatives at tourism sites, allowing choice of language and giving visitors different perspectives on events and on the site itself. Not only can information be obtained in specific sites but also ‘on the move’. Dublin Tourism announced in September 2010 that ‘Dublin is the world’s first city to provide a pointing technology-enabled Smartphone application (app), which allows users to point their mobile phone at a building or object in the real world and retrieve information about it’ (Dublin Tourism, 2010). The phrase used by Mary Hanafin, the Minister for Tourism, Culture and Sport, was that the app ‘delivers Dublin in the palm of your hand’ (Dublin Tourism, 2010).
METHODOLOGY Primary research was carried out with a focus on the Tourist Guides of Dublin, Ireland as this destination contains the largest number of tourist guides on the island of Ireland. An on-line questionnaire was chosen as it had the ability to reach a large number of respondents in an effective and efficient manner. The questionnaires were sent to all tourist guides registered on the AATGI and Failte Ireland databases. A total of 191were sent, and the number of responses received was 86, representing a 45% response rate.
Following on from the questionnaire survey a number of in-depth interviews were carried out. These interviews were conducted with tourist guide employers, Tour Operators, and Tourist Guide Agency Owners. A total of seven in-depth interviews were carried out, five were tour operators, one both a tourist operator and a tourist guide agent and one a tourist guide who acted as a broker in passing on tours to other tourist guides. These respondents were chosen to provide as broad a representation of the industry as possible. Between them, they cater for the following types of tourism businesses: incentive, leisure, business, free independent travellers, cruise and conferencing for a variety of markets, particularly, the US, the UK, France, Germany and Italy.
RESULTS AND DISCUSSION This section presents an overview of the main findings from the two phases of the research and then goes on to discuss the themes that emerged from the analysis of the results.
Overview of the Survey Questionnaire Findings The survey was emailed to a database of 191 respondents and the number of responses received was 86, representing a 45% response rate. Of the respondents 89.5% were working as tourist guides, the remaining 10.5% indicated that they were no longer working in the industry.
A profile of a ‘typical’ tourist guide is presented. She is female (the ratio is 3:1 female to male responses); aged fifty or over (76% of respondents are in this category); has been guiding more than ten years (51%); earned €10,000 or less in 2010 (63%); and guiding is her primary occupation (73%). She works predominately in the Dublin region (as opposed to nationally) (60%); has a 50/50 chance of having retired from a previous career; typically works for four or more employers (55%); mainly works from April to October (these months scored 51% or over in the survey); and is educated to a Bachelor degree level or higher (71%).
Traditionally, perhaps because of the part-time and seasonal nature of the job, the profession has been dominated by females. For perhaps the same reasons, tourist guiding appeals to an older age group and the salary scale would not be sufficient for many younger people who are trying to make a living. The salary scale is, perhaps, somewhat surprising with only 20% earning €20,000 or over, given that 73% said that guiding was their primary occupation. When that 73% were asked if they supplemented their income by any other paid employment, 72% of them stated that they did not. This would seem to suggest that they must have some other form of income, e.g. a pension, or a partner with an income, as it would be very difficult to live on €10,000 or less per annum. There was no pattern to the occupations of the 28% who said that they did supplement their incomes, but working for a tour operator; teaching/tour guide training; and paid charity work were mentioned twice.
All respondents were asked if they had retired from a previous career, 50% indicated that they had. There was a variety of previous occupations mentioned, however, once again, teaching was the top answer with a score of 29%, and working for Aer Lingus scored 14%. Perhaps, some of the skills used to teach are easily transferable to guiding, also, many Aer Lingus jobs require people skills, a pre-requisite for tourist guiding.
The fact that 55% of the respondents work for four or more employers is an indication of the freelance nature of the job. A guide must pay his/her own tax as a self-employed person and provide his/her own insurance. This may be one of the reasons that 82% of the respondents are members of AATGI, who provides insurance cover as part of membership.
When asked the question ‘Do you get enough guiding work? 59% of respondents said that they did, while 35% said that they did not. However, when a similar set of statements was made to the effect that ‘there is/is not enough guiding work’, 57% disagreed that there was enough work, while 56% agreed that there was not enough work. This set of results seems to suggest that, while a majority of individual guides feel that they personally get enough guiding work, there is not enough guiding work in general.
Tourist guides like the challenge of, and the variety in, their job, both of which is understandable. Given the precarious nature of a freelance career, it is, perhaps, more surprising that 84% of guides like being their own boss, and 64% disagreed that they would prefer to be employed by one employer. 67% of the respondents disagreed that guiding was well paid, with 59% agreeing it was badly paid.
Interestingly, given that the hours worked by guides are often seen as unsocial, 55% indicated that working early mornings or late nights was not a problem for them, and a corresponding 59% disagreed that it was a problem. Seasonality, another often mentioned issue for the tourism industry, does not pose a problem for a small majority of respondents, 53% agreed that they liked working fewer hours in the wintertime, and a corresponding 55% disagreed that they disliked the seasonality of guiding. Unqualified guides are perceived as a threat to their livelihood by 59% of respondents, while 55% disagreed that unqualified guides were not a threat.
Forty- three percent of respondents agree that the job of a tourist guide is prestigious, while 43% disagree that it is not prestigious. More than 30% neither agree nor disagree with both statements, indicating that there is no clear cut majority one way or the other. The other issue that did not provide a consensus was the question of whether there is a career path for guides as they become more experienced. 44% disagreed that there was a career path, while 34% neither agreed nor disagreed. 50%, however, agreed that there was no career path, this time 25% neither agreed nor disagreed.
When respondents were asked the open-ended question, ‘What would you change about the job of a tourist guide? the most popular response was that guides should be regulated by the State and that only licensed guides would be legally able to guide. Qualified tourist guides are trained and approved by a State body. The second most popular change that respondents would like to see is the introduction of on-going training and on-going assessment of tourist guides. Other issues raised were: increased pay; a higher standard of professional training i.e. to University standard; that the season be longer; that cancellation fees be payable; and that all itineraries would be feasible. The issue of driver-guiding being made illegal was only mentioned by two respondents, perhaps indicating that this issue is largely invisible to guides, given that the driver-guiding is conducted within a coach and, where the tourists are brought to visitor attractions, the driver-guide is either perceived as an unqualified guide, or, if he/she is wearing a badge, as a qualified guide and not seen as a threat.
69% of tourist guides believe that there are challenges and threats to the future of the professional tourist guiding industry. Non-regulation of the guiding industry was seen as the greatest threat, as this was mentioned twenty-three times in an open-ended question, and so, clearly, this is a pressing issue for respondents. App and iPod technology was the next most common answer, while the availability of free walking tours; cost cutting by tour operators; and the recession were all identified as a challenge or threat to the industry.
Forty-three percent of respondents did not perceive that technology would replace guide services in tourist sites visited by them; 17% did not know and 39% indicated that they had seen this happen. It would appear that, among respondents, the perception of technological replacement seems greater than the reality. Respondents were asked about optimism for the future of tourist guiding in Dublin, and, in spite of the threats and challenges mentioned, two thirds, 67%, declared them to be optimistic; 20% didn’t know; while only 12% were not optimistic. This would seem to be a ringing endorsement for the future of tourist guiding in the city. Overview of the In-depth Interview Findings
Seven tour operators or tour brokers were chosen for this phase of the research. Companies were chosen which represented a broad a spectrum of tourist businesses, which employ tourist guides. The findings revealed that,
on some issues, there was a great deal of consensus, but on others, there was a range of views among employers. The main themes to emerge from the in-depth interview findings are discussed in the following section.
The number of tourist guides employed by the interviewees varied greatly from six or seven a week to as many as forty on an individual day. Interviewees agreed that the season runs from April to October, albeit with peaks at various times for different markets, particularly May and June for the French market. In general, though, there was a policy among interviewees to employ qualified (badged) guides whenever possible, recognising that there was a lack of availability of suitably qualified language guides at different times of the season.
When presented with the questionnaire finding that 76% of respondents were aged 50 or older, the interviewees generally agreed with the finding. Two agreed that English speaking guides had such a profile, but that language guides tended to be younger. When asked if this older profile impacted upon their business, five indicated it had no negative impact, in fact two felt that it was positive, that clients and tourists often equated age with experience. The other two interviewees indicated that the age profile did impact on their business, particularly in the provision of more active tours. The difficulty in keeping younger guides in the industry was mentioned by some of the interviewees, who said that they understood why younger guides left the industry; because of seasonality it was almost impossible to make a living solely out of guiding. Clearly the age profile did present problems for a number of the interviewees; however, they recognise that the situation is unlikely to change if the pattern of seasonality remains as it is now.
The findings of the questionnaire had shown that 59% of respondents agreed that tourist guiding was badly paid. The interviewees were asked to comment. Five of the seven felt that guiding rates were relatively fair, albeit that there had not been an increase in three or four years, and they pointed out that, from the beginning of 2010, value added tax (VAT) at 13.5% had been added to guiding fees, making the employment of tourist guides a more expensive proposition for employers.
There were, however, two dissenting opinions who agreed with the tourist guides about pay. Not surprisingly, one of these was a tourist guide herself, the other, was the owner of the tourist guiding agency and a tour operator. While he agreed that tourist guiding was badly paid, he stated that the price of excursion tickets for tours was very low in Ireland, as much as 50% lower than prices in mainland Europe, and, as a result, the rate of pay for the guide would also remain low. It would appear that on the issue of pay rates there is a fundamental difference between guides and their employers. The recession has meant that profit margins have been cut across the board and many tourism businesses are struggling to remain viable. On the other hand, tourist guides working for some companies, who have passed on the VAT, have had a de facto reduction in their guiding rate.
The issue of unqualified guides was important for respondents to the questionnaire. However, employers, while understanding how guides would feel threatened by unqualified guides, identified other threats and challenges which they believed were more pressing. The threat of driver-guiding was highlighted by two of the interviewees, who stated that there would be much more work for tourist guides in the city of Dublin, should this practice be outlawed, as it is in several European countries. Two of the other interviewees also mentioned this issue, seeing it as a threat to the safety of all.
Other threats identified by the interviewees included the threat of training too many English speaking guides, while still having a scarcity of language guides at certain times and the fear that as older guides were retiring, that they were not being replaced. These threats seem to be contradictory, but were articulated by different interviewees, working in different tourism markets, and so reflect their individual beliefs.
The threat of technology replacing tourist guides was discounted by all of the interviewees. Some felt that the introduction of technology could enhance some visitor attractions, or could provide information such as tour times, which would improve business, especially for the free independent traveller (FIT) market. All felt that the personal touch and human contact provided by a tourist guide could not be replaced by technology.
Six of the seven interviewees were very positive that there was a future for professional tourist guides in Dublin. Only one, stated that there was possibly a future for a fewer number of guides, if they wanted to make a living out of it. A number of interviewees indicated that too many English speaking guides were being trained.
Interviewees were then asked what changes among tourist guides they would like to see to facilitate their (the interviewee’s) business. Tour operators would like to see guides being more flexible and pro-active; having a greater understanding of the business; and keeping current with information. Knowing what employers require would help tourist guides to remain as employable as possible, thus maximising their career prospects. The
employers concluded by expressing very positive views about the contribution that tourist guides make to their businesses.
It is clear that the findings of this research make a significant contribution to the knowledge in the field of tourist guiding. The results of this research, the first of its kind in Ireland and limited internationally, support and extend existing knowledge, as well as making a number of unique contributions to the understanding of tourist guiding in Ireland.
Fáilte Ireland (2011) outlines how the recession has affected tourist numbers to Ireland negatively over the last four years. This has affected every facet of the tourism business, not least, tourist guides. This is an issue that was mentioned by both respondents to the questionnaire and by interviewees, yet was not high on the list of threats to the future of tourist guiding.
The primary research findings of this study in relation to the nature of the job of tourist guide do not concur with much of the literature. This research found that:
Tourist guides liked working fewer hours in the wintertime, so seasonality is not an issue for them. A majority of the guides indicated that unsocial working hours did not present a problem for them. An overwhelming 97% said that they liked the challenge of their jobs. 83% liked being their own boss as a freelance. On the issue of status, there was no definitive finding from the respondents, with the 40% agreeing that
the job was prestigious and a further 35% neither agreeing nor disagreeing.
The literature characterises the job as unattractive due to:
Seasonality (ITIC, 2008; Pond, 1993;Weiler & Ham, 2002; Ap &Wong, 2001) Low pay (ITIC, 2008; Pond, 1993;Weiler & Ham, 2002; Ap &Wong, 2001) Demanding conditions (ITIC, 2008;Weiler & Ham, 2002) Freelance nature (Pond, 1993; Ap &Wong, 2001) Unsocial working hours (ITIC, 2008) Casual employment (Weiler & Ham, 2002) Part-time nature (Ap & Wong, 2001) Low status (Weiler & Ham, 2002)
The findings of this research from tourist guide responses agreed with claims of low pay, but most of the employers did not. However, as can be seen above, all of the other negative factors identified by the literature are refuted by this study. Tourist guides enjoy the seasonality; the challenge; the part-time nature of the job; and being freelance. These conditions suit the people who are working in the industry.
Reflecting the work of McDonald (2001); Ap and Wong (2001); Weiler and Ham (2002) and Zhang and Chow (2004) all of whom highlighted the threat to professional tourist guiding from unqualified guides and non-regulation of the industry, the findings of the questionnaire established that this was the greatest change desired by tourist guides in Dublin. The employers (and a few guides), however, saw a greater threat in the practice of driver-guiding, which was only mentioned in the literature by Pond (1993).
Ap and Wong (2001) and Weiler and Ham (2002) described the lack of a career path in tourist guiding, and 50% of respondents agreed that there was no career path for tourist guides to follow as they become more experienced, a less than overwhelming response.
Finally, there was little or no evidence to support Baum (2007) that the role of the tourist guide was being diminished or superseded by technology at tourism sites. Certainly there was a perception among some guides that guiding services were being replaced, but little concrete evidence to support this. Employers had no experience at all of this practice and felt that tourist guides would never be replaced by technology.
RECOMMENDATIONS
Arising from this research, it is clear that a major issue for tourist guides is the lack of regulation of the industry, and, as a result of non-regulation, the number of unqualified guides working within it. Regulation would guarantee a minimum standard of guiding within the industry and an increase in employment for qualified guides. However, this issue is political. In order to change the status quo, there would have to be a political will to do so. Issues of enforcement would be of paramount importance, in the event of a legislative change. It
would have to be agreed what state agency would be charged with enforcement and what sanctions would be applied to those who guided without a licence. The tourism industry has suffered in the recession, as seen by the huge drop in tourist numbers visiting the country. There could well be a fear from some tourism industry quarters that regulation of the tourist guide sector could be a disincentive to tourism, given that an obligation to use a qualified guide would add to the cost of a tour in these price conscious days. In addition, tourist guides’ lack of visibility, and lack of resources to further their profession’s own collective interests, means that they do not have the political strength to put the issue on the political agenda.
Another issue is the up-grading of the tourist guiding qualification to University standard. At the moment, given the evidence from the research that tourist guiding in Dublin is not a full-time, year-round career, it is very difficult to make the argument that the investment of the time and resources necessary would be justified. Nonetheless, if the industry wishes to be taken seriously, then these issues must be addressed in time.
Legislation to ban the practice of driver-guiding, on health and safety grounds, would seem to be easier to achieve, although this issue has been on the agenda of tourist guide representative bodies, particularly AATGI, for decades. Again, there are sections of the tourism industry who would oppose a legislative change, on the grounds of cost. However, if tourist guides can make this issue about safety, not employment for themselves, then there is a good chance, given the political will, that this change can be achieved. It is a recommendation of this study that driver-guiding should be made illegal.
The issue of on-going training and assessment of guides emerged from the research. This would ensure that tourist guides remain up-to-date with information and that guiding skills remain sharp, which in turn, would result in an improved product for the visitor. This study recommends that such on-going training and assessment be introduced, even if Fáilte Ireland, the body presently tasked with the training of guides, is under financial strain due to cuts in public spending.
Finally, there is a further issue which can be addressed to improve the sustainability of the career of professional tourist guide. The ‘over-training’ of English speaking tourist guides should be addressed immediately. This study recommends that any future training courses should respond to shortages of specific language guides, and try to cater to the emerging so called BRIC nations of Brazil; Russia; India and China, and not produce yet more English speaking guides who may well have real difficulty finding work, remaining in the industry and building a viable career.
The image of the tourist guide from the literature is of someone who is badly paid; who suffers from low status; who works unsocial hours; has poor employment conditions, particularly in relation to being self-employed; whose work is usually part-time; and who must cope with seasonality and a lack of a career path. All of these factors are portrayed as negatives. This research has indicated that Dublin tourist guides would like to be paid better and they are unlikely to be living solely off guiding income. However, there are many more positives than negatives to emerge from the study. From the research, the Dublin tourist guide is someone:
Who likes working as a freelance; Who enjoys working fewer hours in the winter; Who does not mind working early mornings and late nights; Who is not overly concerned with the status, or lack thereof, of guiding, Is not overly concerned with whether guiding has a career path; Who is optimistic about the future of the tourist guiding industry.
In short, the job suits the majority of the people working in the industry. This is a major finding and contributes to the existing knowledge in the field of tourist guiding.
However, anyone, who wished to work full-time in the industry and not supplement their income with other paid employment, either inside or outside of the industry, would find it very difficult to make a year-round living.
While this research was extensive and has achieved the aims and objectives it set out to do, nonetheless, there are gaps. A future study should be undertaken to quantify the attrition rate, if any, from training courses, run over the last decade. The reasons for this attrition rate should be explored and the recruitment policies for the training course modified to reflect the reality of the career, i.e. seasonal and part-time, particularly, if it is found that scarce resources are being used to train tourist guides (albeit that participants pay some of the cost of the course) who have an expectation of a full-time career, and which expectation is not met on completion of the course, when the newly qualified tourist guide goes out into the industry to try and secure employment.
This research concentrated on Dublin tourist guides, however many guides work nationally in Ireland, with Dublin as just a part of their work. A nationwide study should be undertaken to gain an overall view of the state of guiding in the country as a whole. Issues that should be addressed include:
Do national guides make more money than city guides? Is the job more sustainable year round? Are there threats and challenges that are unique to national guides? Does the fact that many nation tourist guides work also as tour mangers in the course of their jobs
have any bearing on the sustainability of the job? How does the issue of driving-guiding impact on the future of the industry?
These issues could be addressed in one large study or could be broken down into a series of studies.
It is clear that the findings of this research make a significant contribution to the knowledge in the field of tourist guiding, as well as making a number of unique contributions to the understanding of that industry in Ireland. The research question ‘Is there a future/career for professional tourist guides in Dublin’ can now be answered. Yes, there is a future/career for professional tourist guides in Dublin, but that career, at the moment, is seasonal and part-time.
REFERENCES:
Ap, J. & Wong, K. K. F. (2001) Case Study on tour guiding: professionalism, issues and problems. Tourism Management, 22, pp 551 -63.
Baum, T. (2007) Human resources in tourism: Still waiting for change. Tourism Management. 28, pp. 1383-99.
Carroll, S. (2011) Number of Visitors to Ireland up 15% on last year, The Irish Times, 24th August, p.4.
Central Statistics Office, (2011a) Overseas Travel, Quarter 2 2011 http://www.cso.ie/releasespublications/documents/tourism_travel/2011/overseastravel_q22011.pdf (accessed 24/08/2011) Central Statistics Office, (2011b) National Income and Expenditure Annual Results for 2010 http://www.cso.ie/releasespublications/documents/economy/current/nie.pdf (accessed 28/08/2011) Cohen, E (1985) The Tourist Guide: The origin, structure and dynamics of a role. Annals of Tourism Research, 12, pp 5-29.
Dublin Tourism (2010), Press Release 01/09/2010 – Dublin Tourism Announces Worlds First for Dublin. http://trade.visitdublin.com/detail.asp?storyID=768&id=50&cat=4 (accessed 30/08/2011)
Dublin Tourism (2011), Press Release 11/03/2011 – Visit Dublin App available for free download. http://trade.visitdublin.com/detail.asp?storyID=774&id=50&cat=4 (accessed 30/08/2011)
Fáilte Ireland (2004; 2005; 2006; 2007; 2008; 2009a) Tourism Facts http://www.failteireland.ie/Research-Statistics/Tourism-Facts (accessed 15/10/2010)
Fáilte Ireland (2009b) Tourism Employment and Training Survey 2008, http://www.failteireland.ie/Research-Statistics/Surveys-and-Reports/Training-and-Employment-Survey (accessed 16/10/2010)
Fáilte Ireland (2011) Tourism Facts 2010 –Preliminary Version 3.0 www.failteireland.ie/FailteCorp/media/FailteIreland/documents/Research%20and%20Statistics/Tourism%20Facts/Tourism_Facts_2010.p (accessed 26/08/2011) ITIC, (2008) Review of Ireland’s Coach Tourism Sector & Future Recruitment Challenges www.itic.ie (accessed 16/10/2010)
ITIC, (2010) A Changed World for Irish Tourism – facing up to the challenge of recovery. Executive Summary, www.itic.ie (accessed 14/10/2010)
Mancini, M. (2001) Conducting Tours, Albany, NY: Delmar/Thomson Learning,
McDonnell, I. (2010) The Role of the tour guide in transferring cultural understanding. Working Paper No. 3, School of Leisure, Sport and Tourism, University of Technology Sydney. http://www.business.uts.edu.au/lst/downloads/WP03_McDonnell.pdf (accessed 10/10/2010)
Pond, K.L. (1993) The Professional Guide: Dynamics of tour guiding. New York: Van Nostrand Reinhold
Reisinger, Y. & Steiner, C. (2006) Reconceptualising Interpretation: The Role of Tour Guides in Authentic Tourism. Current Issues in Tourism. 9 (6), pp. 481-98
Scherle, N. & Kung H. (2010) Cosmopolitans of the 21st Century? Conceptualising tour guides as intercultural mediators in Hallin, A. & Soli, R. (eds.), First International Research Forum on Guided Tours – Proceedings, Gothenburg, 23 – 25 April 2009, Gothenburg Research Institute, pp. 6-22.
Tourism Policy Review Group (2003) New Horizons for Irish Tourism: An Agenda for Action. Government Publications (2003) http://www.dast.gov.ie/pdfs/tourism_review_report.pdf
WFTGA (2010) http://www.wftga.org/page.asp?id=15 ( accessed 15/10/2010).
Weiler, B. & Ham, S. (2002) ‘Perspectives and thoughts on tour guiding’ in Lockwood, A. & Medlik, S. (eds) Tourism and Hospitality in the 21st Century, Oxford: Butterworth – Henmann, pp.255 – 264.
Widtfeldt Meged, J. (2010) Guides’ Intercultural Strategies in an Interaction Perspective in Hallin, A. & Soli, R. (eds), First International Research Forum on Guided Tours – Proceedings, Gothenburg, 23 – 25 April 2009, Gothenburg Research Institute, pp.70-90.
Zhang, H.Q. & Chow, I. (2004) Application of importance-performance model in tour guides’ performance: evidence from mainland Chinese outbound visitors in Hong Kong, Tourism Management, 25, pp.81 – 91.
© Ms Josephine Rice and Dr. Detta Melia
An analysis of the concept of ‘adventure’ in Adventure Tourism. Case study: Guided ski mountaineering in the European Alps
Christine Barnes
Swiss Hotel Management School Route de Belvedere
Leysin, 1854 Switzerland
Abstract This case study of British clients hiring British mountain guides to go ski mountaineering in the French Alps uses interviews to investigate whether adventure can be experienced in this tourism context and explores the level of adventure achieved. It was found that all the clients did experience a subjective form of ‘adventure’ but that the desire for ‘peak adventure’ varied amongst clients with some expecting this but others preferring less challenge and a lower level of adventure. It is recommended that the guide or guiding company assess how much clients want to be challenged in the mountains before deciding on the itinerary and that more quantitative research is carried out into client perceptions and expectations when undertaking ‘adventure tourism’. Key words: adventure tourism, guided ski mountaineering
INTRODUCTION
Adventure Tourism has been growing annually in the new millennium, and is one of the fastest growing
segments of the travel industry (Lala and Bhat, 2008). It appeals to a growing proportion of population “who are seeking self-fulfilment and excitement through participating in physically and mentally stimulating experiences” (Swarbrooke et al, 2003, p.3) yet the term is ambiguous, there is no accepted definition of the term ‘adventure tourism.’ The term “adventure” is generally associated with some element of risk (Ewart, 1994) and a large segment of adventure tourism involves mountaineering activities, however Pomfret (2005) discusses the lack of research into mountaineers in an adventure tourism context; those people who use a guiding company, often lack experience and may be hiring equipment, and suggests further study into this under researched field. Buckley (2006) also points out the lack of research into adventure tourism “whereas other sectors of the tourist industry have been extensively analysed” (Buckley, 2006, p.1). This research investigates and analyses the concept of ‘adventure’ and how this acts as a motivational factor for people who participate in ski mountaineering, focussing on the tourism aspect. Authors such as Varley (2006), Ewart (1994), Price (1978) and Beedie and Hudson (2003) have raised questions about the term ‘adventure tourism’ in that if something is planned, as essentially any tourist activity must be, then there is no uncertainty of outcome and hence no adventure. This research explores the extent to which clients of a mountain guide are giving up these elements of autonomy and decision-making and whether the reduced risk and uncertainty of a guided trip reduce or remove the adventure aspect. An important theory analysing adventure is the ‘Adventure Experience Paradigm’ (Priest, 1999), whereby the experience of ‘peak adventure’ or ‘flow’ is attained by matching the challenges of the adventure activity with the skills and competences of the participant. This achievement of peak adventure or peak experience and the feelings it evokes is cited as a strong motivational factor for participants of risk sports. Priest (1999) raises the role of perceptions in both assessing the risks and one’s own competences in outdoor sports and points to the role of the facilitator in outdoor education whose task is to try to work on matching skills and risks, pointing out that more research is needed in this area. This research aims to explore the usefulness of the Adventure Experience Paradigm to guided ski mountaineering and to modify the model as appropriate.
Ski mountaineering has increased in popularity over the past two decades due to improved equipment and as a result of the increased popularity of downhill skiing (Sherrington, 2008). It involves touring in remote mountainous terrain, often across glaciers and ascending both snow and rock so inherent in this sport are all the risks associated with mountaineering; glacier, crevasse and serac dangers; rock fall and avalanches (Evans, 2006). The growth in popularity, the widespread use of mountain guides and guiding companies and the risky nature of the sport means ski mountaineering provides a valid case study for research into the ‘adventure’ aspect of adventure tourism. The British Mountain Guide Association is a member of the International Federation of Mountain Guide Associations, an international organisation that lays down strict requirements and qualifying examinations which means that British mountain guides possess the highest qualification in the world for leading people in the mountains, skiing, climbing or mountaineering (IFMGA, 2011). This research aims to explore the experiences and perceptions of both the mountain guides and their clients when participating in adventure tourism – in this case ski mountaineering. Pomfret (2005) discusses the “pull factors” that motivate participants of adventure sports to visit certain locations and these are evident in Chamonix, a French Alpine town which has vast areas of beautiful natural environment but in addition has recreational pull factors; touring routes, detailed guidebooks, cable cars to minimize the effort to attain the required altitude and snow conditions and the provision of mountain refuges for overnight accommodation. Chamonix is the centre for ski mountaineering in the Alps and historically an important tourist destination for British mountaineers (Collister, 2011). British tourists, and British mountain guides in the Chamonix area are used in this case study, mainly due to the language and culture familiarity of the researcher but also because the predominance of British tourists in this area.
LITERATURE REVIEW How much of an ‘adventure’?
Traditional definitions of adventure are based on the interplay of risk and competence where physical risk is identified as an essential characteristic (Ewart, 1989; Ewart & Hollinghurst, 1989; Martin & Priest, 1986). Varley (2006) points to adventure as being a way of escaping the mundane aspects of everyday life and argues that this ‘true adventure’ involves coping with risk and uncertainty, facing the possibility of injury or even death. He refers to Csikszentmihali (2000) Martin & Priest (1986) and Mortlock (1984) that there seems to be more opportunity for personal development where there is reflection as a result of surviving a misadventure when an individual’s competences have managed to cope successfully with the risks in the face of uncertainty and this fits in with the key elements of adventure. He claims that this is absent with commodified adventure and points to
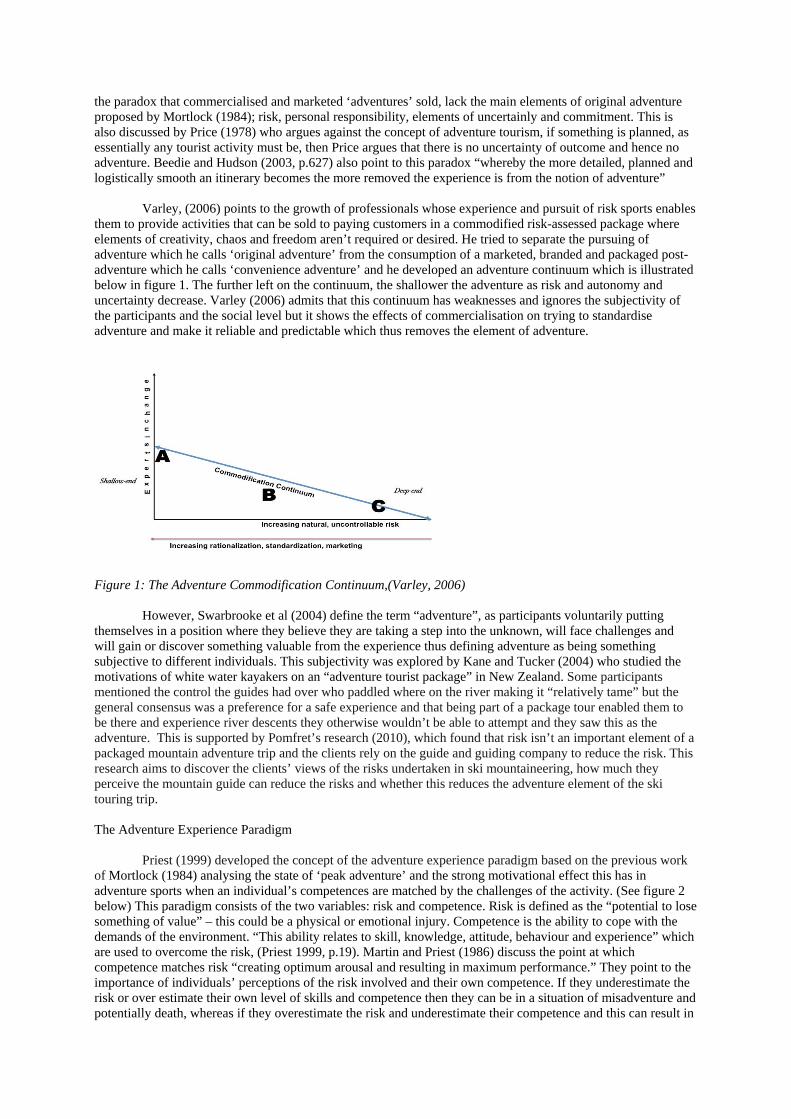
the paradox that commercialised and marketed ‘adventures’ sold, lack the main elements of original adventure proposed by Mortlock (1984); risk, personal responsibility, elements of uncertainly and commitment. This is also discussed by Price (1978) who argues against the concept of adventure tourism, if something is planned, as essentially any tourist activity must be, then Price argues that there is no uncertainty of outcome and hence no adventure. Beedie and Hudson (2003, p.627) also point to this paradox “whereby the more detailed, planned and logistically smooth an itinerary becomes the more removed the experience is from the notion of adventure”
Varley, (2006) points to the growth of professionals whose experience and pursuit of risk sports enables them to provide activities that can be sold to paying customers in a commodified risk-assessed package where elements of creativity, chaos and freedom aren’t required or desired. He tried to separate the pursuing of adventure which he calls ‘original adventure’ from the consumption of a marketed, branded and packaged post-adventure which he calls ‘convenience adventure’ and he developed an adventure continuum which is illustrated below in figure 1. The further left on the continuum, the shallower the adventure as risk and autonomy and uncertainty decrease. Varley (2006) admits that this continuum has weaknesses and ignores the subjectivity of the participants and the social level but it shows the effects of commercialisation on trying to standardise adventure and make it reliable and predictable which thus removes the element of adventure.
Figure 1: The Adventure Commodification Continuum,(Varley, 2006)
However, Swarbrooke et al (2004) define the term “adventure”, as participants voluntarily putting themselves in a position where they believe they are taking a step into the unknown, will face challenges and will gain or discover something valuable from the experience thus defining adventure as being something subjective to different individuals. This subjectivity was explored by Kane and Tucker (2004) who studied the motivations of white water kayakers on an “adventure tourist package” in New Zealand. Some participants mentioned the control the guides had over who paddled where on the river making it “relatively tame” but the general consensus was a preference for a safe experience and that being part of a package tour enabled them to be there and experience river descents they otherwise wouldn’t be able to attempt and they saw this as the adventure. This is supported by Pomfret’s research (2010), which found that risk isn’t an important element of a packaged mountain adventure trip and the clients rely on the guide and guiding company to reduce the risk. This research aims to discover the clients’ views of the risks undertaken in ski mountaineering, how much they perceive the mountain guide can reduce the risks and whether this reduces the adventure element of the ski touring trip.
The Adventure Experience Paradigm
Priest (1999) developed the concept of the adventure experience paradigm based on the previous work of Mortlock (1984) analysing the state of ‘peak adventure’ and the strong motivational effect this has in adventure sports when an individual’s competences are matched by the challenges of the activity. (See figure 2 below) This paradigm consists of the two variables: risk and competence. Risk is defined as the “potential to lose something of value” – this could be a physical or emotional injury. Competence is the ability to cope with the demands of the environment. “This ability relates to skill, knowledge, attitude, behaviour and experience” which are used to overcome the risk, (Priest 1999, p.19). Martin and Priest (1986) discuss the point at which competence matches risk “creating optimum arousal and resulting in maximum performance.” They point to the importance of individuals’ perceptions of the risk involved and their own competence. If they underestimate the risk or over estimate their own level of skills and competence then they can be in a situation of misadventure and potentially death, whereas if they overestimate the risk and underestimate their competence and this can result in
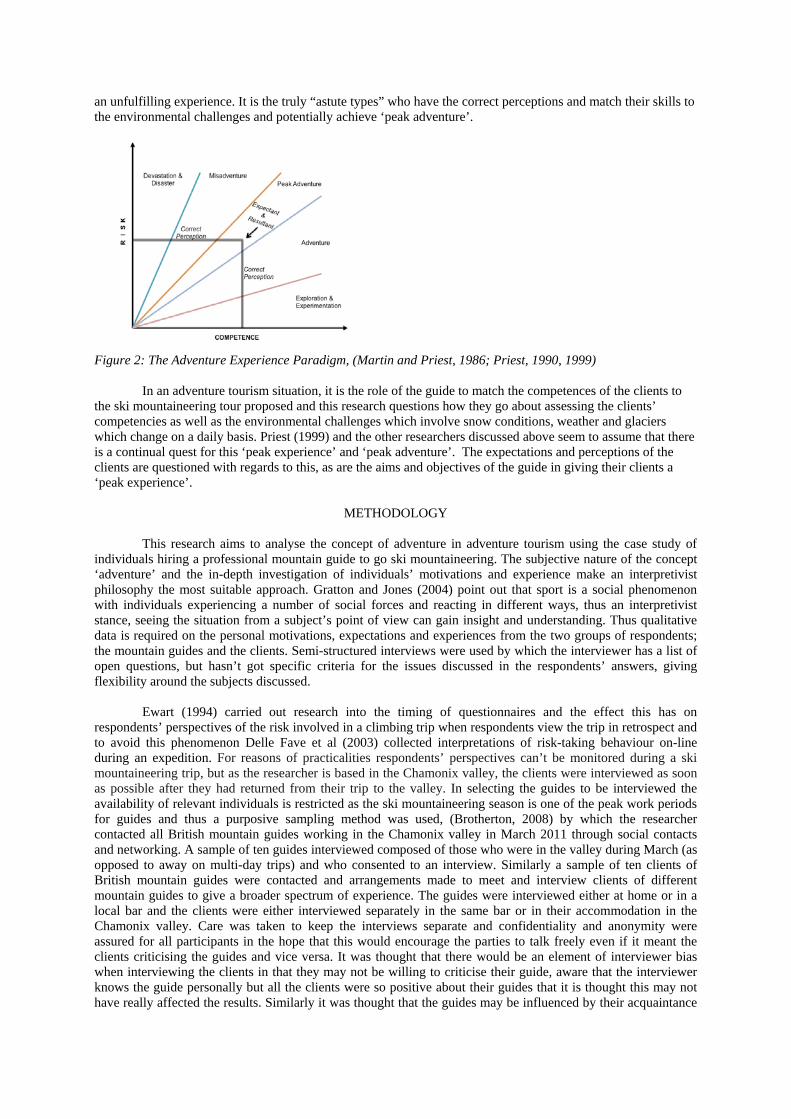
an unfulfilling experience. It is the truly “astute types” who have the correct perceptions and match their skills to the environmental challenges and potentially achieve ‘peak adventure’.
Figure 2: The Adventure Experience Paradigm, (Martin and Priest, 1986; Priest, 1990, 1999)
In an adventure tourism situation, it is the role of the guide to match the competences of the clients to the ski mountaineering tour proposed and this research questions how they go about assessing the clients’ competencies as well as the environmental challenges which involve snow conditions, weather and glaciers which change on a daily basis. Priest (1999) and the other researchers discussed above seem to assume that there is a continual quest for this ‘peak experience’ and ‘peak adventure’. The expectations and perceptions of the clients are questioned with regards to this, as are the aims and objectives of the guide in giving their clients a ‘peak experience’.
METHODOLOGY
This research aims to analyse the concept of adventure in adventure tourism using the case study of individuals hiring a professional mountain guide to go ski mountaineering. The subjective nature of the concept ‘adventure’ and the in-depth investigation of individuals’ motivations and experience make an interpretivist philosophy the most suitable approach. Gratton and Jones (2004) point out that sport is a social phenomenon with individuals experiencing a number of social forces and reacting in different ways, thus an interpretivist stance, seeing the situation from a subject’s point of view can gain insight and understanding. Thus qualitative data is required on the personal motivations, expectations and experiences from the two groups of respondents; the mountain guides and the clients. Semi-structured interviews were used by which the interviewer has a list of open questions, but hasn’t got specific criteria for the issues discussed in the respondents’ answers, giving flexibility around the subjects discussed.
Ewart (1994) carried out research into the timing of questionnaires and the effect this has on respondents’ perspectives of the risk involved in a climbing trip when respondents view the trip in retrospect and to avoid this phenomenon Delle Fave et al (2003) collected interpretations of risk-taking behaviour on-line during an expedition. For reasons of practicalities respondents’ perspectives can’t be monitored during a ski mountaineering trip, but as the researcher is based in the Chamonix valley, the clients were interviewed as soon as possible after they had returned from their trip to the valley. In selecting the guides to be interviewed the availability of relevant individuals is restricted as the ski mountaineering season is one of the peak work periods for guides and thus a purposive sampling method was used, (Brotherton, 2008) by which the researcher contacted all British mountain guides working in the Chamonix valley in March 2011 through social contacts and networking. A sample of ten guides interviewed composed of those who were in the valley during March (as opposed to away on multi-day trips) and who consented to an interview. Similarly a sample of ten clients of British mountain guides were contacted and arrangements made to meet and interview clients of different mountain guides to give a broader spectrum of experience. The guides were interviewed either at home or in a local bar and the clients were either interviewed separately in the same bar or in their accommodation in the Chamonix valley. Care was taken to keep the interviews separate and confidentiality and anonymity were assured for all participants in the hope that this would encourage the parties to talk freely even if it meant the clients criticising the guides and vice versa. It was thought that there would be an element of interviewer bias when interviewing the clients in that they may not be willing to criticise their guide, aware that the interviewer knows the guide personally but all the clients were so positive about their guides that it is thought this may not have really affected the results. Similarly it was thought that the guides may be influenced by their acquaintance
with the interviewer but the consistency of the guide responses in the majority of the questions seemed to indicate that the interviewer didn’t affect the results. Once the interviews had been carried out, the data from each question was collated and there was focus and comparison on how different individuals responded to each question. Patterns and connections both between and within categories were identified and compared to the models and theories analysing the concept of adventure (Taylor-Powell and Renner, 2003).
FINDINGS
This research into the adventure aspect of ski mountaineering with a mountain guide uses Mortlock’s (1984) main elements of original adventure; risk, personal responsibility, uncertainty and commitment, and both clients and guides were questioned about the role of the guide in removing these elements and whether this also removed the adventure element of ski mountaineering for clients.
Decision-making, autonomy and control
When the guides were asked how much control the client had over the itinerary and decisions in the mountains there were some minor differences in their responses, but all stated that the most input the clients had in terms of decision-making was in the planning of the itinerary. Clients sometimes wanted to do a specific route or the guide may give them options that they thought suitable but in all cases the guide had the final say in the route undertaken. When asked about decision-making whilst out in the mountains there was unanimity on there being little or no input from clients. The guide may give an option of a shorter or longer day, or when to have lunch but any decisions on safety were totally in the guide’s control. When the clients were questioned about the input they have on the decision-making on the trip they agreed with the guides in that whilst they may have input into the itinerary and minor options on the trip, all important decisions are made by the guide and many of the clients pointed to the superior knowledge and expertise of the mountain guides compared to themselves. A couple of clients mentioned that the decision-making aspect was the reason they hired a mountain guide and one client stated:
“I am a busy executive at work, making decisions all day every day. I hire a mountain guide to make all the decisions on my holiday so I can relax and enjoy the mountains.”
The above research and analysis confirms that when hiring a mountain guide a client is giving up most
of the decision-making, autonomy and personal responsibility which according to Price (1978); Beedie and Hudson (2003); Varley (2006) and Mortlock (1984) is removing some important elements of the concept of adventure.
Risk and Uncertainty
The guides were asked to assess how they reduced the risk and uncertainty for their clients in the mountains. All the guides pointed to the fact that they couldn’t remove objective dangers such as rock fall, serac (ice cliff) fall but they could reduce other risks quite substantially by good route-finding and decision-making, especially as far as glacier travel and avalanches are concerned, using their knowledge and experience. However they also spoke of the uncertainty when guiding in new areas, some trips are less planned and controlled than others and the changing mountain and weather conditions always contributed to the risk and uncertainty. One guide who had been guiding for over 30 years in the European Alps commented:
“The problem with guiding in the Alps is that the objective dangers are constantly changing all the time as glaciers and seracs move and crevasses and snow conditions change over the season and between seasons.”
When the clients were asked how much they thought a guide reduced the risks of their being in the
mountains, they were unanimous in judging this to be substantial, indicating a lot of confidence in the guide’s ability to reduce risk, perhaps more so than the guide’s own perception. This agrees with the research by Pomfret (2010) that clients relied on the guide to reduce the risks in the mountains; however, a couple of the clients did acknowledge that risks still existed:
“They probably halve the risks because of their experience and expertise” “People still get killed in the mountains with a mountain guide, but they do reduce the risks”
The above comments and quotes from both mountain guides and clients illustrate the risky nature of ski mountaineering and the uncertainty faced in the mountains even when guided by a professional, and although risk and uncertainty are reduced, they are no means removed and thus there is still quite a strong element of ‘adventure’ for the clients.
To what level can clients experience ‘adventure’?
Guides were asked if they thought their clients had an adventure whilst ski mountaineering with them in the mountains and they were unanimous that yes, their clients did have an adventure. The justification for this varied a lot as guides considered the uncertainty that exists in mountain trips, the novelty factor of doing something for the first time, and the different perspectives of clients compared to their own, illustrating the subjective view of the concept of adventure. These different factors are reflected in the quotes below:
“Yes, definitely, they go to places they’ve never been and do things they’ve never done before and generally push themselves” “Yes they are doing something new, even wearing crampons can be an adventure for clients, staying in a mountain refuge is an adventure for an average British skier, it’s a different perspective to the guide’s.” “Yes but it’s a carefully managed environment, their perception is that it’s more of an adventure than it actually is.”
The clients were asked if they thought they had an adventure when ski mountaineering with a mountain
guide and again they was unanimous in responding that yes, they did have an adventure. There was only one client that raised the fact that there wasn’t always an adventure due to being in a group of people of varying competences which is a situation discussed in the following section. The term ‘adventure’ is subjective and the results show that even on a guided trip with more control and less risk, clients can still experience adventure. These findings are similar to those Kane and Tucker (2004) whereby clients were pleased to go places they otherwise wouldn’t have been and didn’t dwell on the packaged nature of the trip and also agrees with Swarbrooke’s (2004) definition of adventure as being subjective to the individual. The Adventure Experience Paradigm
The Adventure Experience Paradigm (Priest, 1999) was applied to guided ski mountaineering trips and the guides in this research were questioned on how they judge their clients’ competences in order to match them to the challenge of the mountain trip. Clients were then asked to what degree they expect or want to be challenged when ski mountaineering with a mountain guide. All the guides interviewed agreed that when they had repeat clients, many of whom returned year after year, then the situation was a lot simpler as they knew their clients, their skills and limitations and could match the route and itinerary to these. Many claimed to have built up a rapport and relationship with their regular clients, and they knew their capabilities in the mountains. However, a lot of the guides’ work in the winter and spring season is running trips doing the ‘Haute Route’ a ski-tour from Chamonix to Zermatt which uses mountain refuges and takes five to six days, (Cliff, 1993) or similar multi-day trips. This generally involves a group of clients put together either by the clients themselves, by the guide or by a guiding agency, and the guide would rarely have met or skied with these clients before. When taking clients for the first time on the Haute Route all of the guides stated that they interview the clients to find out how much off-piste skiing and mountaineering they had done previously, whether they had worn crampons, used a rope etc. However, all of the guides also stated that they don’t take much notice of this verbal assessment and none of them would embark on a multi-day trip without incorporating a ‘training day’ before the group set off. In this training day the guides will check the clients’ skills and equipment and if necessary change the itinerary and in a couple of cases guides said they have asked clients to leave the trip as they aren’t up to the required standard in ski and mountaineering skills. This confirms that guides can and do assess clients, ensuring that they have a minimum level of competence to complete the ski trip they have planned and this indicates they are trying to match competences and challenges as shown by the Adventure Experience Paradigm.
However, within a ski mountaineering trip there are variations in speed of ascent, descent and
itineraries such as additional peaks climbed, and with a group of clients matching each individual’s competences and skills to one overall challenge of the trip is difficult or impossible. The guides interviewed pointed out that there is usually a large range of ability in a commercial group, which makes their job very difficult. Various guides put forward strategies to try to overcome this, such as distributing the load carried by the group so the weaker members carried less, the guide staying at the back with the weaker skiers, but most stated there was no real solution and for reasons of safety the group has to go at the pace of the slowest and the route taken must be
at the technical level of the weakest. This could often mean that for some members the challenges of the trip were below the level of their skills and fitness, they may experience ‘adventure’ rather than ‘peak adventure’ but also may only experience ‘mere experimentation or exploration’ in figure 2 above (Priest, 1999). This shows that guides do attempt to match clients’ competences to the challenges, a task which is made easier if the guide has had previous experience with the clients. However this application of the Adventure Experience Paradigm is more realistic in a situation where a guide has one client or a small number of clients of the same level of competence compared to a group of clients of mixed ability. The level of challenge
Having established that in a group situation some members may not be challenged, the different individual preferences for being challenged were explored. In a situation where they have one client or clients of similar ability, guides were asked how much they pushed their clients so they are ‘challenged’ in the mountains. The guides were divided, with some believing clients like to be pushed and some pointing out that it depends on the individual:
“I like to stretch the clients, it makes them happier to explore boundaries and it’s often the hardest thing they’ve ever done.” “It depends on the individual, some need to achieve and want to excel but many are happy with a good mellow day out” Within a couple, often the male is over-confident and wants pushing whilst the female is under-confident and doesn’t.”
The belief that in fact some people want to be pushed and some don’t want to be pushed in the mountains is supported by the results of the interviews with clients. Seven of the ten clients interviewed stated that when ski mountaineering with a mountain guide they were challenged technically, physically and mentally and that they liked being challenged: “I like getting pushed”
“I like to be challenged, otherwise why hire a mountain guide?” “I am challenged when I’m in the mountains with a guide, and I enjoy this in retrospect!”
However some of the clients didn’t want to be challenged:
“I just want to get through the day happily, I use a guide to reduce the worry and anxiety” “I don’t want to be pushed”
It seems that people have different perceptions and expectations about being challenged and although
the majority of this small sample claim to like being pushed, there are some clients who, although may be competent in skiing and have reasonable mountaineering skills, are happier not being pushed, According to the theory of Priest (1999) they are in the zone of “mere experimentation or exploration”, and according to Csikszentmihalyi (1975, p.18) “boredom is the result”. However contrary to this theory and in contrast to the clients whose perceptions are that one hires a mountain guide to be pushed and challenged, some people don’t need their skills and competences matched by challenges, they don’t want nor need to be pushed. Misadventure
None of the guides interviewed referred to injuries or death of a client, which would put the situation in the “death and disaster” section of the Adventure Experience Paradigm however some referred to a level of “misadventure” due to changing weather and snow conditions. The guides who described trips that didn’t go as planned were probed further and asked about the attitude of the clients afterwards. They all stated they had never had any negative feedback after a trip had become more challenging than expected:
“The clients suffered on the trip but once they have got down, had a cup of tea they appreciated the experience and afterwards claimed to have enjoyed it.” “Generally when the conditions get tough and it’s long hard day the clients are grateful to you for getting them through the day, I’ve never known any resentment”
Varley (2006) claims that in commodified adventure there is an absence of the personal development
aspect of reflection having surviving a misadventure, and indeed when on a guided trip when a dangerous
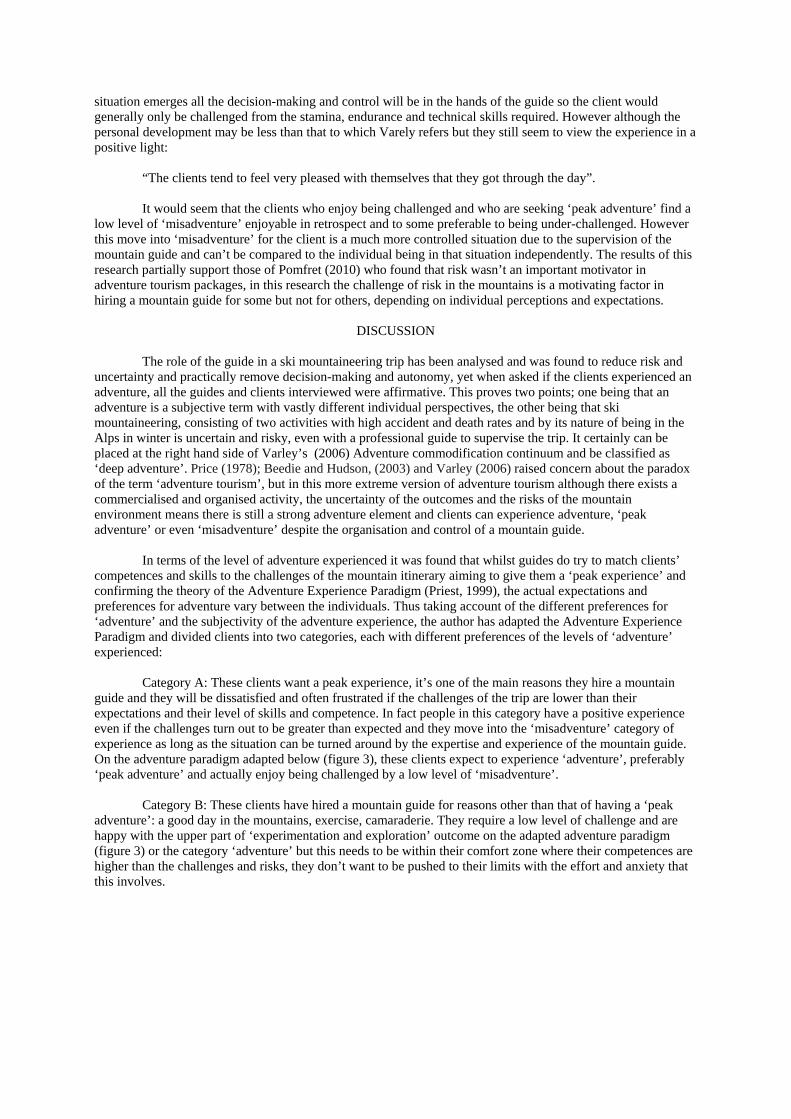
situation emerges all the decision-making and control will be in the hands of the guide so the client would generally only be challenged from the stamina, endurance and technical skills required. However although the personal development may be less than that to which Varely refers but they still seem to view the experience in a positive light:
“The clients tend to feel very pleased with themselves that they got through the day”.
It would seem that the clients who enjoy being challenged and who are seeking ‘peak adventure’ find a low level of ‘misadventure’ enjoyable in retrospect and to some preferable to being under-challenged. However this move into ‘misadventure’ for the client is a much more controlled situation due to the supervision of the mountain guide and can’t be compared to the individual being in that situation independently. The results of this research partially support those of Pomfret (2010) who found that risk wasn’t an important motivator in adventure tourism packages, in this research the challenge of risk in the mountains is a motivating factor in hiring a mountain guide for some but not for others, depending on individual perceptions and expectations.
DISCUSSION
The role of the guide in a ski mountaineering trip has been analysed and was found to reduce risk and uncertainty and practically remove decision-making and autonomy, yet when asked if the clients experienced an adventure, all the guides and clients interviewed were affirmative. This proves two points; one being that an adventure is a subjective term with vastly different individual perspectives, the other being that ski mountaineering, consisting of two activities with high accident and death rates and by its nature of being in the Alps in winter is uncertain and risky, even with a professional guide to supervise the trip. It certainly can be placed at the right hand side of Varley’s (2006) Adventure commodification continuum and be classified as ‘deep adventure’. Price (1978); Beedie and Hudson, (2003) and Varley (2006) raised concern about the paradox of the term ‘adventure tourism’, but in this more extreme version of adventure tourism although there exists a commercialised and organised activity, the uncertainty of the outcomes and the risks of the mountain environment means there is still a strong adventure element and clients can experience adventure, ‘peak adventure’ or even ‘misadventure’ despite the organisation and control of a mountain guide.
In terms of the level of adventure experienced it was found that whilst guides do try to match clients’ competences and skills to the challenges of the mountain itinerary aiming to give them a ‘peak experience’ and confirming the theory of the Adventure Experience Paradigm (Priest, 1999), the actual expectations and preferences for adventure vary between the individuals. Thus taking account of the different preferences for ‘adventure’ and the subjectivity of the adventure experience, the author has adapted the Adventure Experience Paradigm and divided clients into two categories, each with different preferences of the levels of ‘adventure’ experienced:
Category A: These clients want a peak experience, it’s one of the main reasons they hire a mountain guide and they will be dissatisfied and often frustrated if the challenges of the trip are lower than their expectations and their level of skills and competence. In fact people in this category have a positive experience even if the challenges turn out to be greater than expected and they move into the ‘misadventure’ category of experience as long as the situation can be turned around by the expertise and experience of the mountain guide. On the adventure paradigm adapted below (figure 3), these clients expect to experience ‘adventure’, preferably ‘peak adventure’ and actually enjoy being challenged by a low level of ‘misadventure’.
Category B: These clients have hired a mountain guide for reasons other than that of having a ‘peak adventure’: a good day in the mountains, exercise, camaraderie. They require a low level of challenge and are happy with the upper part of ‘experimentation and exploration’ outcome on the adapted adventure paradigm (figure 3) or the category ‘adventure’ but this needs to be within their comfort zone where their competences are higher than the challenges and risks, they don’t want to be pushed to their limits with the effort and anxiety that this involves.
Figure 3: A modification of ‘The Adventure Experience Paradigm’ (Martin and Priest, 1986; Priest, 1990, 1999)
RECOMMENDATIONS
To make use of the modified Adventure Experience Paradigm the guide needs to find out the preferences and expectations with regards to the level of challenge for a client, along with assessing their physical competence before researching a suitable itinerary so that the clients can have their ideal subjective ‘adventure’ experience. Assessing individuals’ expectations, preferences and skills can be difficult with new clients compared to regular clients and also the difficulty arises in a group situation where the clients vary in both their level of skills and their ‘adventure’ aspirations. In these cases the guide has no alternative but to set the level low which could be at the exploration and experimentation category for some of the clients and the guide has a potential problem. If, on the training day a guide anticipates that a client or clients are going to be frustrated and highly dissatisfied with the level of the trip then it is recommended that, to be fair to the clients, this is communicated to the them so they can lower their expectations, or if a viable option they could leave the trip and try to find something more suited to their level.
Otherwise when guiding a group of clients of mixed ability it is recommended that the guide
emphasises the positive aspects of ski mountaineering that exist apart from adventure and referred to by the respondents in this research; the scenic views, visiting new places, exercising outdoors etc. In addition, if appropriate the more competent members of the group could be taught more skills in terms of rope work, cramponing skills and mountain safety and ski tips, and this could compensate for their perceived low level of adventure and increase their customer satisfaction. This is supported by the research by Pomfret (2010) who found that an important motivation for individuals on packaged mountaineering trips is the experience in the mountains and the learning of skills. In any trip in the mountains there are going to be risks and uncertainties and these need to be pointed out, which will give an element of adventure to all members of the trip whatever their level of competence. Ultimately whilst the guide makes every effort to give the members of a mixed group a satisfying experience, the economic reality is that the group are sharing the cost of the guide between up to six members and can’t expect the ideal matching of competence, challenge and resulting desired level of adventure that can be given to clients hiring the mountain guide on a one-to-one basis. Most clients would realise this and perhaps have lower expectations of the trip and thus experience customer satisfaction even if their adventure experience isn’t ideal.
IMPLICATIONS FOR FUTURE RESEARCH
Whilst satisfied with the results of the research, the author can identify some weaknesses in this, mainly in terms of representativeness and reliability. The sample of ten guides is a reasonable sample of approximately forty British mountain guides who run ski mountaineering courses in the Alps, and the consistency amongst most of their responses indicates the reliability of the results. However the sample of ten clients is a very small proportion of the hundreds of British clients hiring a guide to ski mountaineer (although no exact numbers are available) and a much larger sample is needed for greater reliability. Quantitative research needs to be carried out on the main elements of adventure; risk, personal responsibility, uncertainty and physical challenge and respondents across a range of ‘adventure’ activities could be asked to rate the importance of these to their own subjective adventure experience, thus adding to the debate of whether a tourist activity can be an adventure and expanding on the concept of ‘adventure’ from the point of view of the adventure tourist. In terms of the level of
adventure, the concept of the Adventure Experience Paradigm could be used with the development of a questionnaire, whereby clients rate their individual desire or expectation for these elements in an adventure ‘package’. In this case of ski mountaineering it would mean clients could thus be categorised into groups for which courses could be tailored with different aims, challenges and itineraries enabling guides and guiding companies to group together clients with similar objectives and achieve a higher level of customer satisfaction.
REFERENCES Beedie, P., & Hudson, S. (2003) Emergence of mountain-based adventure tourism. Annals of Tourism Research, 30(3), pp. 625–643. Brotherton, B. (2008) Researching Hospitality and Tourism : A student guide. London, Sage. Buckley,R. (2006) Adventure Tourism. Wallingford, CABI. Collister, R. (2011) Ski-mountaineering: an introduction. [Internet]. Available from: <htttp://www.travel-quest.co.uk/editorial/ski-mountaineering> [accessed 17th February 2011]. Cliffe, P. (1993) Haute Route Chamonix-Zermatt: Guide for Skiers and Mountain Walkers. London. Menasha Ridge Press. Csikszentmihali, M. (1975) Beyond Boredom and Anxiety. Sam Francisco, CA, Jossey-Bass. Delle Fave, A., Bassi, M., & Massimini, F. (2003). Quality of experience and risk perception in high-altitude rock climbing. Journal of Applied Sport Psychology, 15, pp. 82–98. Dickson, T. (2004) Telemark skiing participation in Australia: An exploratory study. Journal of sport tourism, 9(2), pp. 159 -169. Evans, D. (2006) Ski Mountaineering [Internet]. London. Available from: http://www.ukclimbing.com/articles [Accessed: 16th February 2011]. Ewert, A. (1985). Why people climb: the relationship of participant motives and experience level to mountaineering. Journal of Leisure Research, 17(3), pp. 241–250. Ewert, A. (1989). Outdoor adventure pursuits: foundations, models and theories. Scotsdale, AZ. Publishing Horizons. Ewart, A. W. (1994) Playing the edge: Motivation and risk taking in high altitude wilderness like environment. Environment and Behavior 26(3), pp 82-98. Ewert, A., & Hollenhorst, S. (1989). Testing the adventure model: empirical support for a model of risk recreation participation. Journal of Leisure Research, 21(2), pp. 124–139. International Federation of Mountain Guides Association (IFMGA). (2011) [Internet] Available at: <http://www.ivbv.info/en/> [Accessed 17th March 2011]. Kane, M. J. & Tucker, H. (2004) Adventure Tourism: The freedom to play with reality. Leisure Studies, 4(3) pp. 217-236. Lala, M.F. and Bhat, A.M. (2008) The prospects of developing Kashmir as an Adventure Tourism Destination. South Asian Journal of Tourism and Heritage, 1(1) pp.613-616. Martin, P., & Priest, S. (1986). Understanding the adventure experience. Journal of Adventure Education, 3(1), pp. 18–21. Mortlock, C. (1994) The Adventure Alternative. Milnthorpe, Cicerone Press. Pomfret G. (2005) Mountaineering adventure tourists. Tourism Management, 27 (11) pp. 113 -123. Price,T.(1978)AdventurebyNumbers.InTheGamesClimbersPlay,K.Wilson,ed.,pp.646–651.London:Diadem.Priest, S. (1999) The adventure experience paradigm. In Miles, J. C., & Priest, S. (Eds.), Adventure programming. Venture Publishing, Inc. Sherrington, I. (2008) Ski-mountaineering Adventure. [Internet] Available at: <http://www.scotoutdoors.com> [Accessed 18th February 2011]. Swarbrooke, J. Beard, C. Leckie, S. & Pomfret, G. (2003) Adventure Tourism The new frontier. Oxford, Butterworth-Heinman. Taylor-Powell, E. and Renner, M. (2003) Analyzing Quantitative Data. Wisconsin, University of Wisconsin. UIAGM (2011) [Internet] Available at: < http://www.IVBV.com >[Accessed 13th February 2011. Varley, P. (2006) Confecting Adventure and Playing with Meaning: The Adventure Commodification Continuum. Journal of Sport & Tourism, 11(2), pp.173-194.
Medical Tourism as a Means of Competitive Advantage: The case of Turkey
Mehmet Ergul San Francisco State University
Colin Johnson San Francisco State University
Ali Sukru Cetinkaya Selcuk University
David S. Martin, Ph.D Auburn University
Abstract: Advances in the emerging trend of medical tourism are currently being seen globally and potential impacts are widely discussed in the literature. Countries offering healthcare services with high quality and comparative costs could gain competitive advantages in today’s global healthcare market. Strategically located at the crossroads of Europe and Asia, having top quality healthcare facilities and well-trained doctors, operating world class wellness tourism accommodations and with its world famous hospitality, Turkey could serve as a future global hub for Medical Tourism. This study emphasizes the importance of medical tourism for Turkey through the presentation of a business model for stakeholders.
Keywords: Medical Tourism, Turkey, Health Tourism
SUSTAINABLE TOURISM DEVELOPMENT – FACTORS FOR LOCAL RESIDENTS’ ATTITUDE TOWARDS TOURISM AND TOURISTS (the case of Bulgaria)
Maria Vodenska, Prof., DrSc
Tourism Department, Sofia University 15, Tsar Osvoboditel Blvd. Sofia 1000, Bulgaria
Abstract. It is already widely accepted that local residents play an important role for sustainable tourism development. All tourism projects in a destination should be in compliance with local residents’ perceptions. This brings forth the necessity of their analysis and constant monitoring. The paper aims at revealing the main factors influencing local residents’ attitude towards tourism development and tourists in Bulgaria. Two groups of factors are investigated: external (not pertaining to the population), and internal. The main findings and relationships revealed as a result of the analysis of the above factors show that: 1) external factors are very important for shaping residents’ attitude towards tourism development and tourists; 2) the importance of the internal factors varies considerably from factor to factor. Key words: tourism impacts, local population, internal and external factors, monitoring, sustainable tourism development
INTRODUCTION
In the period of transition to market economy tourism is a fast developing industry in Bulgaria, attracting huge investments and providing job opportunities. The demand driven development led to a dramatic change in the product type and structure, based on extensive utilization of natural and cultural resources, which resulted in visible impacts on the environment and on local communities.
20 years after the UN Conference on Environment and Development in Rio de Janeiro the issue of
sustainable tourism development as part of the overall sustainable development is being discussed in numerous academic and practical oriented publications (Action…, 2007). There is no doubt about the need for the management of tourist activities and their impacts that would incorporate and combine the basic principles of sustainable development.
The three main criteria that follow global criteria for sustainable tourism development are:
Increase of social and economic benefits for local community and reduction of negative effects; Increase of benefits for cultural heritage and reduction of negative effects; Increase of environmental benefits and reduction of negative effects.
The importance of tourism impacts increased significantly lately in the context of tourism policy and tourism planning and of the widespread sustainable tourism development concept. The equity of economic, social and ecologic tourism aspects is stressed upon. The satisfaction of public needs should be placed in conformity with the limited resources as well as with the equality of present and future generations’ rights. Of key importance for the implementation of sustainable tourism principles and criteria is the welfare of local community, their perception, evaluation and attitude towards tourism development, tourists and the changes incurred by them as well as the informed knowledge of the factors influencing them. And if we can accept that the main points of sustainable development and its indispensability are quite clear, the implementation of this concept in practice turned out to be a difficult task which could not find its solution in many destinations including Bulgaria.
LITERATURE REVIEW
As a result of the increasing numbers of tourists worldwide, more and more evident become the negative economic, ecologic and social tourism impacts. Any contemporary international literature review shows that this subject-matter is at the core of numerous scientific publications - Beskulides (2007), Burns (2008), Holden (2007), Kollick (2008), Mowforth (2007), Sharpley (2007), Stynes (2008), Vodenska (2006), Woodruff (2004), etc. A special emphasis on local residents’ perception of tourism can be found also in many earlier publications - Allen et al. (1988, 1993), Ap (1990, 1992), Ap and Crompton (1993), Johnson et al.
(1994), Lankford (1994), Lea, Kemp and Willets (1994), Long, Perdue and Allen (1990), Madrigal (1995), Mansfeld (1992), Mathieson and Wall (1982), McCool and Martin (1994), Mok et al. (1991), Pearce, Mascardo and Ross (1991), Perdue, Long and Allen (1990), Robertson and Crotts (1992), Ross (1991, 1992). In most of them a special attention to the factors for residents’ attitude towards tourism is given and some general factors are outlined. Unfortunately with some exceptions this issue has not yet been discussed in detail in Bulgarian academic publications (Vodenska, 2001, 2006), hence the author’s interest in the current issue.
RESEARCH METHODOLOGY
Local population’s attitude towards tourism and tourists and its factors are investigated through a field survey in 15 Bulgarian municipalities. The main aim of this survey is to reveal residents’ attitude towards various positive and negative tourism impacts. A written standard anonymous questionnaire is used. It was developed after a detailed and in-depth study of questionnaires published in international scientific sources while bearing in mind Bulgarian population’s characteristics and specifics.
Municipalities were chosen in a way as to include both territories with a well developed tourism
industry and a steady tourist flow and municipalities at the start of their tourism development. At the same time they represented the four main tourism types in Bulgaria – seaside, mountain, spa and cultural tourism.
One and the same questionnaire is used for respondents employed in the tourist industry and for the rest
of the local population. Two sample types are used – a single stage areal sample and a simple random (stochastic) sample. The scale types used are: ordinal (rank) scale, Lickert 5-stage scale, nominal scale, interval scale, the scale of Gutmann. Interviewed are 4 397 representatives of the local population. The study covered representatives of all age groups over 16 years - people with varying educational background, field of activity and impact of tourism on their income. The tourism employed are about 16.7% of the respondents, but tourism turned out to influence directly or indirectly the income of 38% of them. Interviewed are also key stakeholders in the municipalities - mayors and officials of local administrations, representatives of local and regional tourism associations and other NGOs, tourism entrepreneurs and local people actively involved in tourism issues. The survey is conducted using the personal interview method by students in the "Tourism" program of Sofia University. Information from surveys is processed with the help of SPSS. For the purpose of the analysis traditional tourism research methods (quantitative and qualitative assessment, structural analysis, etc.) were applied. The analysis of the relationships between respondents’ answers and their relevant factors was based on the correlation coefficients between the assessments of positive and negative tourism impacts and the chosen indicators of the factors under study. Limitations to the present research is to be expected (but not proven) in two directions: first, the wish of local residents to display a more favourable tourism development in their area, and second, the novelty of the topic survey and the insufficiency of informed knowledge for many of the respondents.
For better comprehension and systematization in the present research two main groups of factors have been outlined:
Internal factors, related to the destination’s population characteristics, and External factors, related to the destination’s actual tourism state and development
As major internal factors the main socio-demographic and economic characteristics of the local
population are examined: age, gender, educational and professional structure, length of residence in the municipality, employment or family member employment in the tourist industry, contacts with tourists.
As major external conditions and factors of the tourist destination state and the degree of tourism
development in it are taken: Level of the destination’s tourism development; The stage of the destination’s tourism development life cycle; The prevailing tourism type in the destination
DISCUSSION OF RESULTS
EXTERNAL FACTORS Level of tourism development For all types of communities defined by their level of tourism development, the highest ratings of positive attitude were observed for the general attitude towards tourism (correlation coefficient 0.93), tourism social impacts (0.87) and tourism management (0.72). The most negative attitude was observed towards tourism economic effects (0.91), with the exception of the least developed municipalities – in them the expectations for better economic conditions created by tourism development are too high which is reflected in their attitude (0.42). In general the following conclusions can be drawn:
The level of tourism development is not a considerable factor for the general attitude of the local population towards tourists and tourism – the correlation coefficients with very few exceptions, have medium and low values;
Main indicators characterizing tourism development level of municipalities and exerting a substantial
influence on residents’ attitude are: the absolute number of beds, the density of beds and overnights, the ratio between local visitors and tourists in catering facilities, the ratio between tourists in peak period (maximum number of beds) and locals, the tourist function and the tourism intensity indicators, the existence of limitations for locals for the use of tourist facilities, share of local employees in tourism, the number of new jobs in tourism and the share of permanent jobs in tourism.
With the increase of the level of tourism development more strongly perceived are both the positive
and the negative tourism impacts;
There is a clearly outlined influence of the level of tourism development primarily on the attitude towards negative tourism impacts.
Regardless of the level of tourism development in all municipalities the highest ratings were received
by the general attitude towards tourism and tourists and tourism positive social impacts, while the lowest were received by the economic impacts.
Prevailing type of tourism In general the values for positive residents’ attitude are better balanced and more evenly distributed across the various subgroups of municipalities than the negative one. The most positive attitude towards tourists and tourism is observed in municipalities with predominant spa tourism. Negative residents’ attitude is more differentiated. The highest coefficient for negative impacts (0.84) is recorded in seaside communities, and the lowest (0.45) - in municipalities with predominantly cultural tourism. It can be concluded that:
The predominant type of tourism plays a substantial role in the formation of local residents’ attitude towards tourists and tourism;
The most important characteristic of the tourism type having a major impact on local residents’ attitude
is the seasonality of the predominant type of tourism (year-round or seasonal) - excessive concentration of tourists and tourist activities in a relatively short period of time leads to significant spatial and temporal concentration of various tourism impacts (especially negative) in municipalities with prevailing seaside and mountain tourism. In year-round tourism types - cultural and spa, no such great polarization of the impact assessments is observed.
Stage in the destination’s tourism development life cycle
The necessity of taking into account the territorial differences in the studied municipalities brought about their grouping on the basis of the life cycle stage of tourism development in each one of them. This grouping was done implementing Butler’s model (1980) of tourism development evolution. This was carried out with the help of Cooper’s matrix (1997) presenting tentative parameters characteristic for destination development at every separate stage. On the basis of this matrix the municipalities under study formed 5 groups at various life cycle stage of tourism development and the residents’ attitude towards tourism was analysed in each corresponding group. Summarizing the results obtained, the following conclusions can be drawn:
The life cycle stage of tourism development in the studied municipalities as a whole has a certain influence on the population’s attitude towards tourists and tourism;
Respondents’ attitude towards tourists and tourism in the municipalities under study are generally consistent with their tourism development – the earlier the stage, the more positive the attitude;
The least correspondence with the life cycle stage of tourism development is observed in the attitude towards the economic tourism impacts;
With the advancement of tourism development in the municipalities, better perceived are both the
positive and the negative tourism impacts;
The life cycle stage of tourism development is the best indicator for the degree of perception by the local population of the negative but not of the positive tourism impacts.
INTERNAL FACTORS
The questionnaire developed for the study of local population’s attitude towards tourists and tourism in the 15 municipalities included some questions characterizing respondents regarding their gender, age, educational and occupational structure, length of residence in the municipality, employment of the respondent or of a family member in tourism. As a result of the correlation analysis of these characteristics with the respondents’ attitude towards tourism and tourists the following important conclusions can be drawn:
The most important role in differentiating respondents' attitude is played by their level of employment in tourism (0.91), followed by their professional structure (0.78); Tourism employed (both directly or indirectly) respondents are more positive about tourism than any other group in the host community.
Respondents' attitude is least influenced by their gender (0.32), followed by the duration of residence in the municipality (0.41); Residents born in the destination are more positive about tourism than newcomers.
Close contacts with tourists is not associated with manifestation of only positive or only negative attitude towards tourism
Educational and age structure as well as the employment of a family member in tourism occupy an intermediate position in terms of their impact on the differentiation of respondents’ attitude towards tourists and tourism (0.56); Older people tend to be less positive towards tourism.
The positive respondents’ attitude is influenced by some 4 to 5 (out of 7) socio-demographic characteristics
or factors, which is quite few. This indicates the relatively large differences in the perception of positive tourism impacts and is the cause of diversity and contrast in their assessments by locals.
The negative attitude of respondents is influenced by a much smaller number of socio-demographic
(internal) factors than the positive one - 2 to 3 factors. This indicates a more unanimous understanding and perception of negative tourism impacts by local residents compared to positive ones.
CONCLUSION
The conducted survey revealed the important role of local residents’ opinion for the general and the detailed perception of tourism impacts at a local level. It was found out that both internal and external factors (external factors being more significant) are of importance in forming and differentiating local residents’ attitude towards tourism and tourists. The analysis of the results obtained led to the formulation of the following general conclusions: The main factors and their role for local residents’ attitude towards tourists and tourism are established. It is confirmed that in Bulgaria the factors for local residents’ attitude towards tourists and tourism are the
same as those revealed and discussed in international academic publications. The results obtained can serve as an initial baseline of Bulgarians’ attitude towards tourism and tourists
against which the occurring changes can be measured and long term trends can be outlined. This will be of great importance for future tourism policy and future sustainable tourism development in the country.
One of the implications of the research results concerning the tourist industry is the necessity of studying the local residents’ opinion about any future tourist projects and of creating all-year round job opportunities for the local people. Future more detailed research should be targeted at studying factors for negative residents’ attitude towards tourism and tourists and at factors in various types of tourism destinations. Another research field is the forecast of residents’ attitude in new tourism projects and prevention of any negative tourism impacts. The major objective of such studies can be stated as the continuous monitoring of residents’ perceptions of tourism and their attitude towards it.
REFERENCES Action for More Sustainable European Tourism (2007) Report of the Tourism Sustainability Group. http://ec.europa.eu/enterprise/tourism/docs/tsg/tsg_final_report_en.pdf Allen L.R. et al. (1988) The Impact of Tourism Development on Residents’ Perceptions of Community Life, Journal of Travel Research, 27 (1) Allen A.R. et al. (1993) Rural Residents’ Attitudes Towards Recreation and Tourism Development, Journal of Travel Research, 31(4) Ap J. (1990) Residents’ Perception Research on the Social Impacts of Tourism, Annals of Tourism Research, 17 Ap J.(1992) Residents’ Perceptions on Tourism Impacts, Annals of Tourism Research, Vol. 19 Ap J., J.L.Crompton (1993) Residents’ Strategies for Responding to Tourism Impacts, Journal of Travel Research, 31(3) Beskulides, A. (2007) Tourism and Social Change. Journal of Travel Research, No 5 Burns, P.M. ( 2008) Economic Impact of Tourism. Journal of Travel Research, No 2 Butler R.W. (1980) The Concept of a Tourist Area Cycle of Evolution: Implications for Management of Resources, Canadian Geographer, 24 Cooper Ch. (1997) The Contribution of Life Cycle Analysis and Strategic Planning to Sustainable Tourism. Tourism, Development and Growth. Routledge Holden, A. (2007) Environment and Tourism. London, Routledge Johnson J.D. et al. (1994) Residents’ Perceptions of Tourism Development, Annals of Tourism Research, 21 Kollick, P. (2008) Tourism Impacts, Planning and Management. Butterworth-Heinemann Lankford S. (1994) Attitudes and Perceptions Towards Tourism and Rural Regional Development, Journal of Travel Research, 32(3) Lea S., S.Kemp and K.Willets (1994) Residents’ Concepts of Tourism, Annals of Tourism Research, 21 Long P., R.Perdue, L.Allen (1990) Rural Resident Tourism Perceptions and Attitudes by Community Level of Tourism, Journal of Travel Research, 28(3) Madrigal R. (1995) Residents’ Perceptions and the Role of Government, Annals of Tourism Research, 22 Mansfeld Y. (1992) Group-Differntiated Perceptions of Social Impacts Related to Tourism Development, Professional Geographer, 44 Mathieson, A. and Wall, G. (1982) Tourism: Economic, Physical and Social Impacts. Longman, London McCool S.F., S.R.Martin (1994) Community Attachment and Attitudes Toward Tourism Development, Journal of Travel Research,32(3) Mok C. et al. (1991) Residents’ Attitudes Towards Tourism in Hong Kong, International Journal of Hospitality Management, 10 Mowforth, M. (2007) Economic Impact of Tourism. Journal of Travel Research, No 4 Pearce Ph., G. Mascardo, G. Ross (1991) Tourism Impact and Community Perception: An Equity-Social Representational Perspective, Australian Psychologist, 26 Perdue R., P. Long and L. Allen (1990) Residents’ Support for Tourism Development, Annals of Tourism Research, 17 Robertson C., J.C.Crotts (1992) Information Effects on Residents’ Perception of Tourism Development, Visions of Leisure and Business, 11 Ross G.F. (1991) Community Impacts of Tourism Among Older and Long-Term Residents, Australian Journal of Aging, 10 Ross G.F. (1992) Resident Perceptions of the Impact of Tourism on an Australian City, Journal of Travel Research, 30 (3) Sharpley, R. (2007) Tourism, Tourists and Society. Elm, Huntingdon Stynes, D.J. (2008) Economic Impacts of Tourism. Michigan State University Vodenska, M. (2001) Physical, Economic and Social Tourism Impacts, SU, Sofia (in Bulg.) Vodenska, M. (2006) Tourism and Society. Avangard Prima, Sofia (in Bulg.) Woodruff, S. (2004) Impacts of Recreation and Tourism on the Local Economy. Prentice Hall
REDEFINING COMMUNITY-BASED TOURISM
Emmanuel Barreto Senior Consultant, Tourism Strategy
Eurofin Hospitality 4, rue Etraz
1002 Lausanne [email protected]
ABSTRACT
The current community-based tourism model follows a reactive approach by considering communities as an adjustment variable to the hospitality value-chain. Hitherto, this pattern enabled rapid growth in hotel investment while the long-term impact on local communities reveals negligible regarding social and environmental sustainability. The short-termism of hospitality operators has proved a key factor in the failure of tourism led developmental goals.
A paradigm shift is eminent. Hoteliers need to adopt, from the beginning of the process, a proactive approach with communities. In order to do so, the H2O methodology redefines community as the contributors, implementers and beneficiaries of the sustainable tourism. This new approach has recently been applied in the Maldives resulting to a blueprint with detailed actions in eight key common interest areas to build, in practice, a long-term productive relationship.
Keywords: tourism, hospitality, sustainability, community, development, environment.
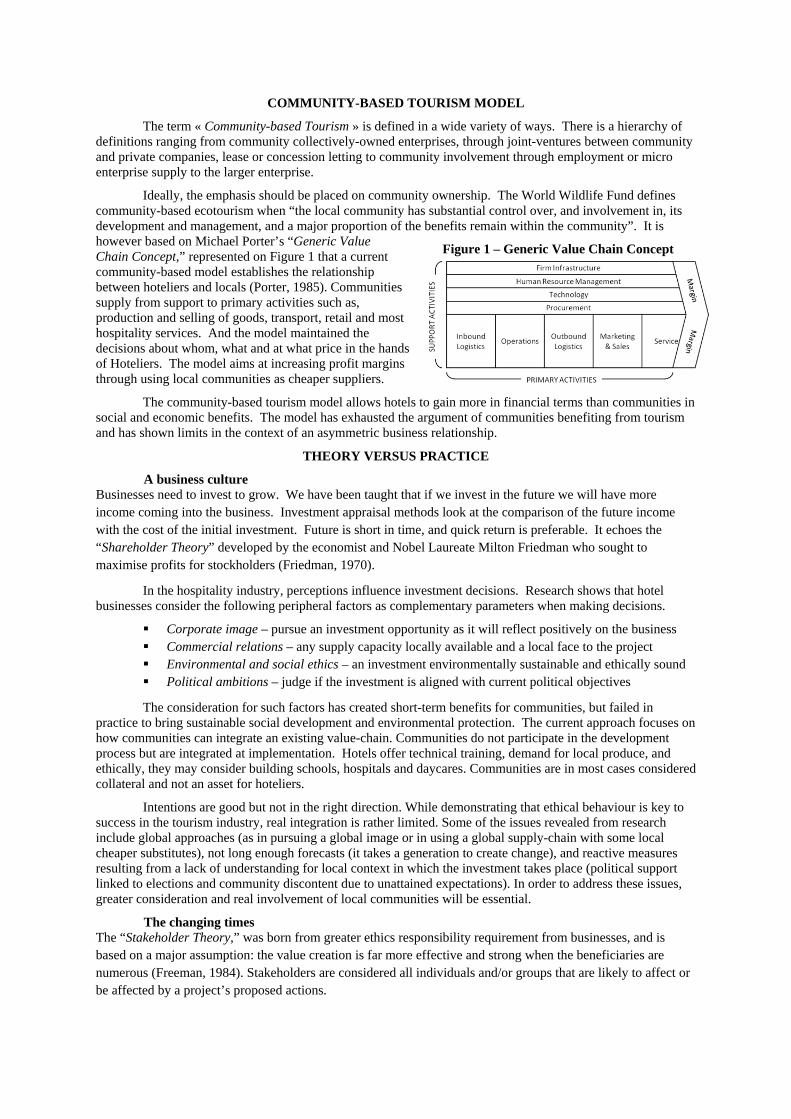
COMMUNITY-BASED TOURISM MODEL
The term « Community-based Tourism » is defined in a wide variety of ways. There is a hierarchy of definitions ranging from community collectively-owned enterprises, through joint-ventures between community and private companies, lease or concession letting to community involvement through employment or micro enterprise supply to the larger enterprise.
Ideally, the emphasis should be placed on community ownership. The World Wildlife Fund defines community-based ecotourism when “the local community has substantial control over, and involvement in, its development and management, and a major proportion of the benefits remain within the community”. It is however based on Michael Porter’s “Generic Value Chain Concept,” represented on Figure 1 that a current community-based model establishes the relationship between hoteliers and locals (Porter, 1985). Communities supply from support to primary activities such as, production and selling of goods, transport, retail and most hospitality services. And the model maintained the decisions about whom, what and at what price in the hands of Hoteliers. The model aims at increasing profit margins through using local communities as cheaper suppliers.
The community-based tourism model allows hotels to gain more in financial terms than communities in social and economic benefits. The model has exhausted the argument of communities benefiting from tourism and has shown limits in the context of an asymmetric business relationship.
THEORY VERSUS PRACTICE
A business culture Businesses need to invest to grow. We have been taught that if we invest in the future we will have more income coming into the business. Investment appraisal methods look at the comparison of the future income with the cost of the initial investment. Future is short in time, and quick return is preferable. It echoes the “Shareholder Theory” developed by the economist and Nobel Laureate Milton Friedman who sought to maximise profits for stockholders (Friedman, 1970).
In the hospitality industry, perceptions influence investment decisions. Research shows that hotel businesses consider the following peripheral factors as complementary parameters when making decisions.
Corporate image – pursue an investment opportunity as it will reflect positively on the business Commercial relations – any supply capacity locally available and a local face to the project Environmental and social ethics – an investment environmentally sustainable and ethically sound Political ambitions – judge if the investment is aligned with current political objectives
The consideration for such factors has created short-term benefits for communities, but failed in practice to bring sustainable social development and environmental protection. The current approach focuses on how communities can integrate an existing value-chain. Communities do not participate in the development process but are integrated at implementation. Hotels offer technical training, demand for local produce, and ethically, they may consider building schools, hospitals and daycares. Communities are in most cases considered collateral and not an asset for hoteliers.
Intentions are good but not in the right direction. While demonstrating that ethical behaviour is key to success in the tourism industry, real integration is rather limited. Some of the issues revealed from research include global approaches (as in pursuing a global image or in using a global supply-chain with some local cheaper substitutes), not long enough forecasts (it takes a generation to create change), and reactive measures resulting from a lack of understanding for local context in which the investment takes place (political support linked to elections and community discontent due to unattained expectations). In order to address these issues, greater consideration and real involvement of local communities will be essential.
The changing times The “Stakeholder Theory,” was born from greater ethics responsibility requirement from businesses, and is based on a major assumption: the value creation is far more effective and strong when the beneficiaries are numerous (Freeman, 1984). Stakeholders are considered all individuals and/or groups that are likely to affect or be affected by a project’s proposed actions.
Figure 1 – Generic Value Chain Concept
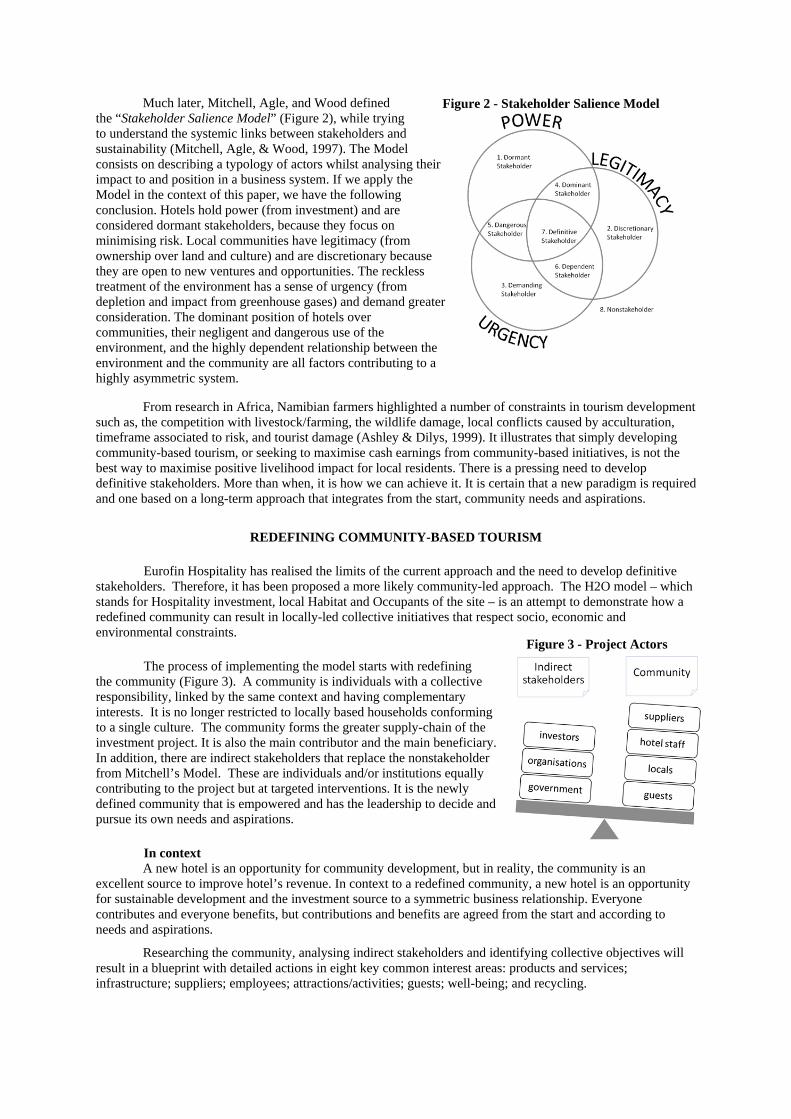
Much later, Mitchell, Agle, and Wood defined the “Stakeholder Salience Model” (Figure 2), while trying to understand the systemic links between stakeholders and sustainability (Mitchell, Agle, & Wood, 1997). The Model consists on describing a typology of actors whilst analysing their impact to and position in a business system. If we apply the Model in the context of this paper, we have the following conclusion. Hotels hold power (from investment) and are considered dormant stakeholders, because they focus on minimising risk. Local communities have legitimacy (from ownership over land and culture) and are discretionary because they are open to new ventures and opportunities. The reckless treatment of the environment has a sense of urgency (from depletion and impact from greenhouse gases) and demand greater consideration. The dominant position of hotels over communities, their negligent and dangerous use of the environment, and the highly dependent relationship between the environment and the community are all factors contributing to a highly asymmetric system.
From research in Africa, Namibian farmers highlighted a number of constraints in tourism development such as, the competition with livestock/farming, the wildlife damage, local conflicts caused by acculturation, timeframe associated to risk, and tourist damage (Ashley & Dilys, 1999). It illustrates that simply developing community-based tourism, or seeking to maximise cash earnings from community-based initiatives, is not the best way to maximise positive livelihood impact for local residents. There is a pressing need to develop definitive stakeholders. More than when, it is how we can achieve it. It is certain that a new paradigm is required and one based on a long-term approach that integrates from the start, community needs and aspirations.
REDEFINING COMMUNITY-BASED TOURISM
Eurofin Hospitality has realised the limits of the current approach and the need to develop definitive stakeholders. Therefore, it has been proposed a more likely community-led approach. The H2O model – which stands for Hospitality investment, local Habitat and Occupants of the site – is an attempt to demonstrate how a redefined community can result in locally-led collective initiatives that respect socio, economic and environmental constraints.
The process of implementing the model starts with redefining the community (Figure 3). A community is individuals with a collective responsibility, linked by the same context and having complementary interests. It is no longer restricted to locally based households conforming to a single culture. The community forms the greater supply-chain of the investment project. It is also the main contributor and the main beneficiary. In addition, there are indirect stakeholders that replace the nonstakeholder from Mitchell’s Model. These are individuals and/or institutions equally contributing to the project but at targeted interventions. It is the newly defined community that is empowered and has the leadership to decide and pursue its own needs and aspirations.
In context A new hotel is an opportunity for community development, but in reality, the community is an
excellent source to improve hotel’s revenue. In context to a redefined community, a new hotel is an opportunity for sustainable development and the investment source to a symmetric business relationship. Everyone contributes and everyone benefits, but contributions and benefits are agreed from the start and according to needs and aspirations.
Researching the community, analysing indirect stakeholders and identifying collective objectives will result in a blueprint with detailed actions in eight key common interest areas: products and services; infrastructure; suppliers; employees; attractions/activities; guests; well-being; and recycling.
Figure 3 - Project Actors
Figure 2 - Stakeholder Salience Model
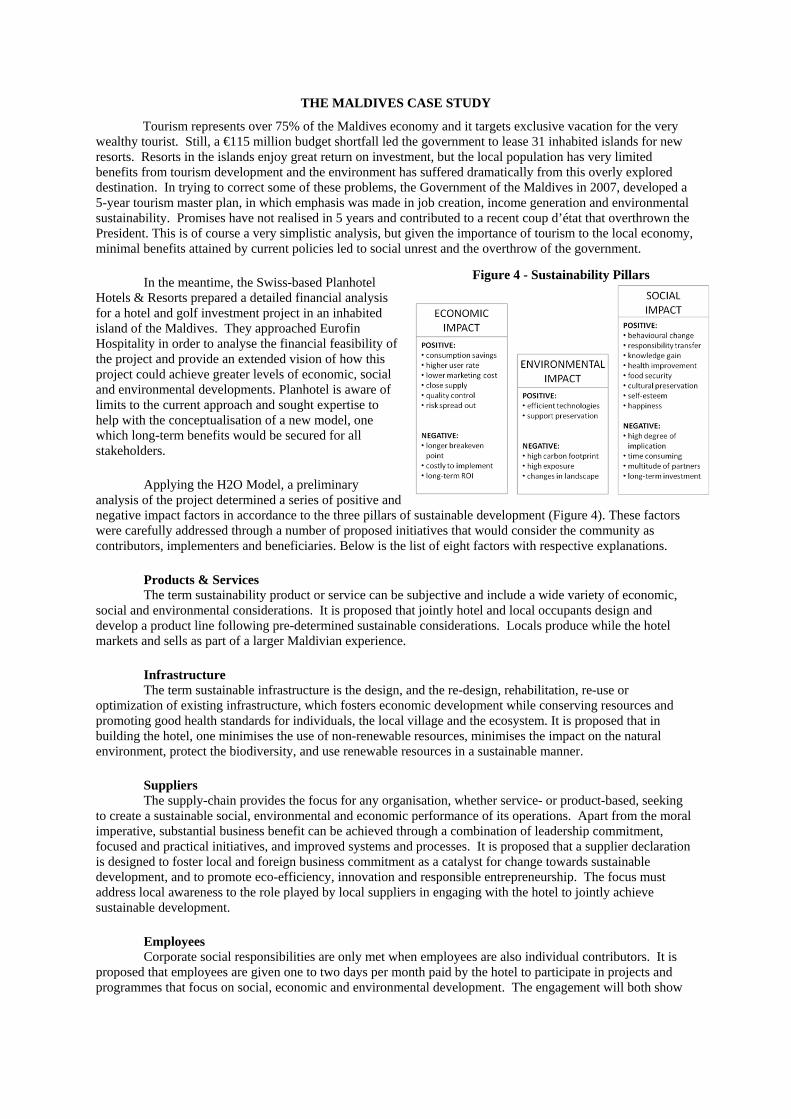
THE MALDIVES CASE STUDY
Tourism represents over 75% of the Maldives economy and it targets exclusive vacation for the very wealthy tourist. Still, a €115 million budget shortfall led the government to lease 31 inhabited islands for new resorts. Resorts in the islands enjoy great return on investment, but the local population has very limited benefits from tourism development and the environment has suffered dramatically from this overly explored destination. In trying to correct some of these problems, the Government of the Maldives in 2007, developed a 5-year tourism master plan, in which emphasis was made in job creation, income generation and environmental sustainability. Promises have not realised in 5 years and contributed to a recent coup d’état that overthrown the President. This is of course a very simplistic analysis, but given the importance of tourism to the local economy, minimal benefits attained by current policies led to social unrest and the overthrow of the government.
In the meantime, the Swiss-based Planhotel Hotels & Resorts prepared a detailed financial analysis for a hotel and golf investment project in an inhabited island of the Maldives. They approached Eurofin Hospitality in order to analyse the financial feasibility of the project and provide an extended vision of how this project could achieve greater levels of economic, social and environmental developments. Planhotel is aware of limits to the current approach and sought expertise to help with the conceptualisation of a new model, one which long-term benefits would be secured for all stakeholders.
Applying the H2O Model, a preliminary analysis of the project determined a series of positive and negative impact factors in accordance to the three pillars of sustainable development (Figure 4). These factors were carefully addressed through a number of proposed initiatives that would consider the community as contributors, implementers and beneficiaries. Below is the list of eight factors with respective explanations.
Products & Services The term sustainability product or service can be subjective and include a wide variety of economic,
social and environmental considerations. It is proposed that jointly hotel and local occupants design and develop a product line following pre-determined sustainable considerations. Locals produce while the hotel markets and sells as part of a larger Maldivian experience.
Infrastructure The term sustainable infrastructure is the design, and the re-design, rehabilitation, re-use or
optimization of existing infrastructure, which fosters economic development while conserving resources and promoting good health standards for individuals, the local village and the ecosystem. It is proposed that in building the hotel, one minimises the use of non-renewable resources, minimises the impact on the natural environment, protect the biodiversity, and use renewable resources in a sustainable manner.
Suppliers The supply-chain provides the focus for any organisation, whether service- or product-based, seeking
to create a sustainable social, environmental and economic performance of its operations. Apart from the moral imperative, substantial business benefit can be achieved through a combination of leadership commitment, focused and practical initiatives, and improved systems and processes. It is proposed that a supplier declaration is designed to foster local and foreign business commitment as a catalyst for change towards sustainable development, and to promote eco-efficiency, innovation and responsible entrepreneurship. The focus must address local awareness to the role played by local suppliers in engaging with the hotel to jointly achieve sustainable development.
Employees Corporate social responsibilities are only met when employees are also individual contributors. It is
proposed that employees are given one to two days per month paid by the hotel to participate in projects and programmes that focus on social, economic and environmental development. The engagement will both show
Figure 4 - Sustainability Pillars
the hotel commitment as well as to provide new perspectives for employees through empowering individual and collective actions.
Guests The hotel commitment to sustainable development can only be fulfilled if guests are integrated into the
process. There are many commonly used techniques to save water and energy, such as reusing towels and lighting controlled by room cards. It is proposed a more immersive experience for guests by allowing a deeper participation into local life and habitat, being passively or actively. Guests must understand the current situation and that the hotel is trying to achieve in its commitment to sustainable development. Guests must be allowed to contribute individually to social and environmental programmes initiated and managed by the hotel. Guests must be introduced to responsible consumption behaviour and recycling.
Well-being Locals are an integral part of the environment. They have an acquired behaviour established by culture
and influenced by lobby groups. The behavioural analysis and identification of those leading health hazards and safety issues can have strong influential weight and change should be pursued in a partnership format. It is proposed that the hotel provides equipment and skills enhancement opportunities in exchange for local engagement.
Recycling Water, energy and waste are certainly the most important impact areas for sustainable development.
The idea is to combine producing, using and discharging techniques. It is proposed that the production is based on reuse and that the hotel and local villagers are engaged in a partnership to fulfil a policy of 0 to landfill. Therefore recycling of what comes natural and what is released from routine practices produce the required water and energy to run the hotel and the golf.
In order to verify a profitable return on investment, the methodology assess the hotel as well as surrounding needs, analyse and equate the most appropriate technology to produce renewable energy and treat water and sewage, identifies capacity building requirements at the local level, and singles out institutional partners to complement the project efforts with specialised knowledge and funds. The project in the Maldives is a case study seeking sustainable solutions at a profitable rate, and should be applicable across the entire tourism industry.
CONCLUSION
Beyond bringing any new parameter, the H2O model innovates in the way communities are defined. It focuses on looking first at local needs and aspirations to shape the investment project in relation to seeking betterment of inhabitants and environmental preservation, in exchange for sustainable use of local labour and culture as well as the local tourism landscape.
Being an isolated environment, the Maldives presents a perfect testing ground for the model. The implementation of H2O in a small inhabited island allows for a better understanding of the framework (material aspects) and possible interactions among various contributing stakeholders (human aspect), as well as to evaluate objectives against success considering that the context is free of exogenous factors. Ideally, the new sustainable habitat-hotel-occupants model could be implemented at a profitable rate across the tourism industry.
REFERENCES
Ashley, C., & Dilys, R. (1999). Enhancing Community Involvement in Wildlife Tourism: Issues and challenges. London: IIED. Freeman, R. E. (1984). Strategic Management - A Stakeholder Approach. Boston: Pitman-Balinger. Friedman, M. (1970). The social Responsability of Business to Increase its Profits. New York: The New York Times Magazines. Mitchell, R. K., Agle, B. R., & Wood, D. J. (1997). Toward a theory of shareholder identification and salience defining the principle of who and what really counts. Academic of Management Review , 853-886. Porter, M. (1985). Competitive Advantage. New York: Free Press. UNWTO. (2010). Manual on Tourism and Poverty Alleviation: Practical Steps for Destinations. Madrid: World Tourism Organization and Netherlands Development Organization. WFF. (2001). Guidelines for community-based ecotourism development. Gland: WFF International.
Making Space Hospitable: Understanding the complexities of reusing the historic built environment for hospitality
Dr Ian Elsmore * Senior Lecturer
Service Sector Management Sheffield Business School
Sheffield Hallam University Howard Street
Sheffield S1 1WB
Tanya Rountree Senior Lecturer
Property Management and Development School of Architecture, Design and Built Environment
Nottingham Trent University Burton Street
Nottingham NG2 4BU
Key Words: Actor-network Theory, Hospitality, Built Environment, Brewery, Hotels.
Abstract: Hospitality as an industry can be seen as a way of revitalising and rejuvenating post-industrial urban landscapes (Mc Neill, 2008, Bell, 2005) with the provision of hospitality outlets in character buildings often regarded as the ‘lightest touch’ option. This paper offers actor-network theory (Law, 1999, Latour, 1993) as an alternative perspective that can help understand the multifaceted relationship between hospitality and the built environment by providing an in depth analysis of the way that the various actors involved in the process interact. This is illustrated through an actor-network analysis of the conversion of a historic brewery into a hotel exposing the complex configuration of heterogeneous elements that comprise the successful development.
THE CITY HOSPITALITY EXPERIENCE MODEL – SHAPING A HOSPITABLE CITY Authors:
Monique van Prooijen-Lander, Drs.* Professor of Marketing & Strategy and Research Fellow City Hospitality& City Marketing
Hotelschool The Hague/ City Hospitality & City Marketing Brusselselaan 2, 2587 AH, The Hague, Netherlands
Karoline W. Wiegerink, Dr. Professor and Chair of City Hospitality & City Marketing
Hotelschool The Hague/ City Hospitality & City Marketing Brusselselaan 2, 2587 AH, The Hague, Netherlands
ABSTRACT This paper briefly introduces the City Hospitality Experience Model, a model which aims to identify
the complexity of relationships within an urban hospitality context in order to facilitate City Hospitality and Marketing policy development.
Key Words City Hospitality, Experiences, Target groups, Guests, Hosts, Stakeholders
BODY Introduction The aim of this paper is to introduce the City Hospitality Experience Model developed by the Research
Centre of Hotelschool The Hague. The focus is twofold: Firstly, to clarify how the model relates to the concepts of hospitality and experience. Secondly, to explain the model’s application as a City Marketing tool for identifying the relationships between the City and its target groups, focusing on the quality of the hospitality context.
City Marketing Cities are making use of concepts and tools of the marketing philosophy in order to distinguish
themselves in the broad market of cities and to gain a sustainable advantage (Braun, 2008). A definition of City Marketing is provided by Hospers (2008) who states that ‘City Marketing is a long term process and/or policy, containing different consistent activities aiming to retain and attract certain target groups connected to the city’. In their urge to distinguish themselves from competition, cities add City Hospitality to their Marketing. They want their visitors, as well as local residents and companies, to feel welcome in the city.
Focus of City Hospitality In order to obtain a clearer understanding of the concept of City Hospitality there are several
dimensions that can be explored (Lashley et al., 2007). The private dimension: hospitality within your house with your own guests. Making
your guests feeling comfortable without exchange of money. The social dimension: hospitable behavior within a culture. How welcoming is a
community towards strangers? The commercial dimension: hospitality within the hospitality industry where people
are hospitable, making people feel comfortable for business purposes. A value-adding activity.
City Hospitality relates more to the last two dimensions. The social dimension gauges how hospitable the community is within the city. Some cities seem to exhibit, by nature, more hospitable behavior than others. The commercial dimension is concerned with building/shaping a city into a more hospitable environment for its people – workers, residents alike. They feel more at ease which in turn will bring more revenue to the city. The city as such is not part of the hospitality industry.
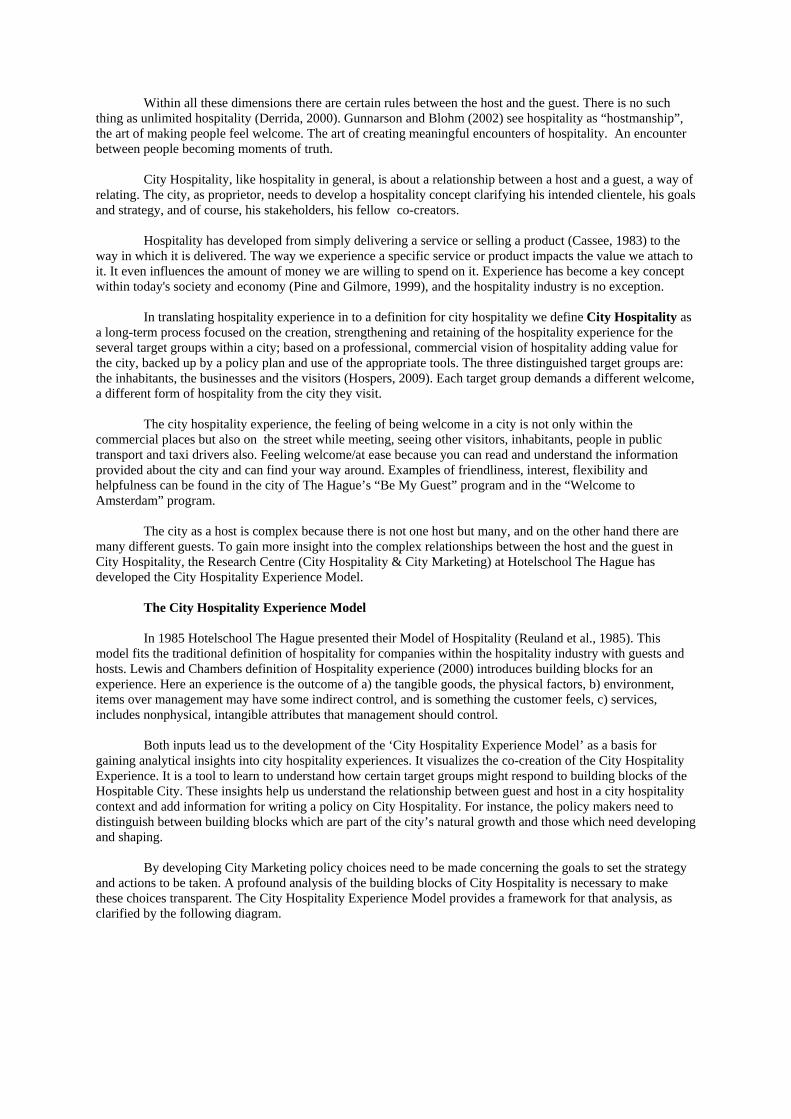
Within all these dimensions there are certain rules between the host and the guest. There is no such thing as unlimited hospitality (Derrida, 2000). Gunnarson and Blohm (2002) see hospitality as “hostmanship”, the art of making people feel welcome. The art of creating meaningful encounters of hospitality. An encounter between people becoming moments of truth.
City Hospitality, like hospitality in general, is about a relationship between a host and a guest, a way of
relating. The city, as proprietor, needs to develop a hospitality concept clarifying his intended clientele, his goals and strategy, and of course, his stakeholders, his fellow co-creators.
Hospitality has developed from simply delivering a service or selling a product (Cassee, 1983) to the
way in which it is delivered. The way we experience a specific service or product impacts the value we attach to it. It even influences the amount of money we are willing to spend on it. Experience has become a key concept within today's society and economy (Pine and Gilmore, 1999), and the hospitality industry is no exception.
In translating hospitality experience in to a definition for city hospitality we define City Hospitality as
a long-term process focused on the creation, strengthening and retaining of the hospitality experience for the several target groups within a city; based on a professional, commercial vision of hospitality adding value for the city, backed up by a policy plan and use of the appropriate tools. The three distinguished target groups are: the inhabitants, the businesses and the visitors (Hospers, 2009). Each target group demands a different welcome, a different form of hospitality from the city they visit.
The city hospitality experience, the feeling of being welcome in a city is not only within the
commercial places but also on the street while meeting, seeing other visitors, inhabitants, people in public transport and taxi drivers also. Feeling welcome/at ease because you can read and understand the information provided about the city and can find your way around. Examples of friendliness, interest, flexibility and helpfulness can be found in the city of The Hague’s “Be My Guest” program and in the “Welcome to Amsterdam” program.
The city as a host is complex because there is not one host but many, and on the other hand there are
many different guests. To gain more insight into the complex relationships between the host and the guest in City Hospitality, the Research Centre (City Hospitality & City Marketing) at Hotelschool The Hague has developed the City Hospitality Experience Model.
The City Hospitality Experience Model In 1985 Hotelschool The Hague presented their Model of Hospitality (Reuland et al., 1985). This
model fits the traditional definition of hospitality for companies within the hospitality industry with guests and hosts. Lewis and Chambers definition of Hospitality experience (2000) introduces building blocks for an experience. Here an experience is the outcome of a) the tangible goods, the physical factors, b) environment, items over management may have some indirect control, and is something the customer feels, c) services, includes nonphysical, intangible attributes that management should control.
Both inputs lead us to the development of the ‘City Hospitality Experience Model’ as a basis for
gaining analytical insights into city hospitality experiences. It visualizes the co-creation of the City Hospitality Experience. It is a tool to learn to understand how certain target groups might respond to building blocks of the Hospitable City. These insights help us understand the relationship between guest and host in a city hospitality context and add information for writing a policy on City Hospitality. For instance, the policy makers need to distinguish between building blocks which are part of the city’s natural growth and those which need developing and shaping.
By developing City Marketing policy choices need to be made concerning the goals to set the strategy
and actions to be taken. A profound analysis of the building blocks of City Hospitality is necessary to make these choices transparent. The City Hospitality Experience Model provides a framework for that analysis, as clarified by the following diagram.
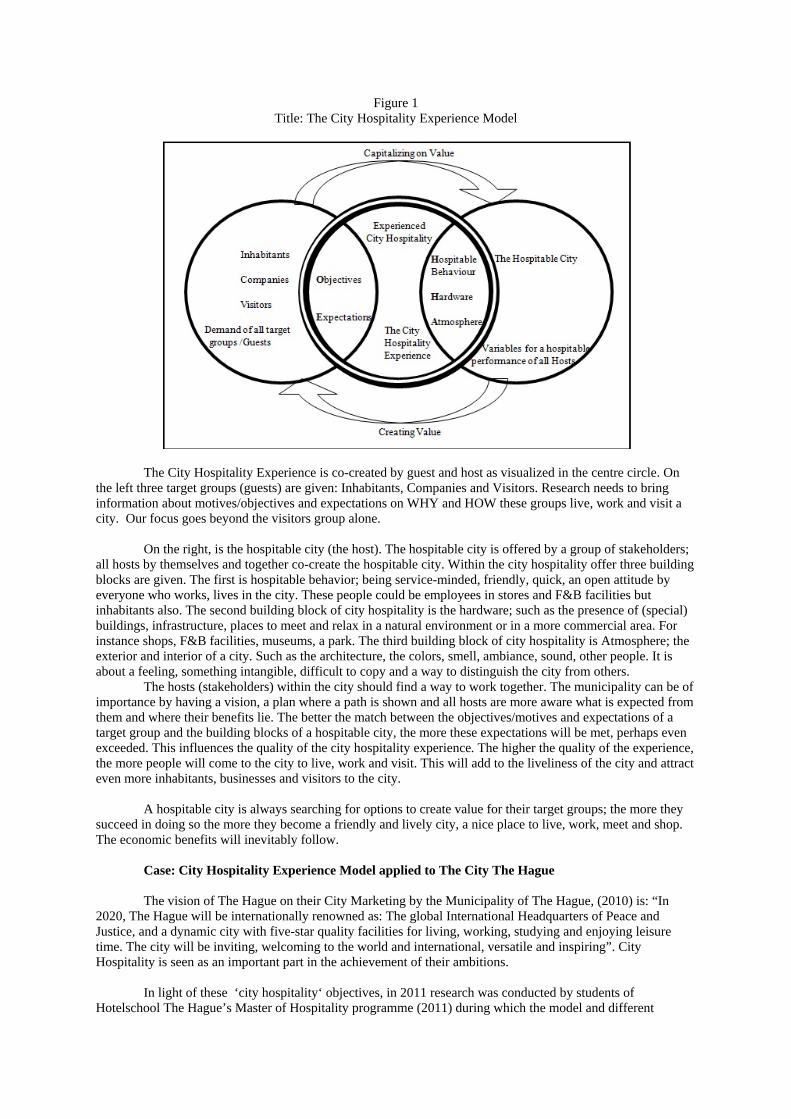
Figure 1 Title: The City Hospitality Experience Model
The City Hospitality Experience is co-created by guest and host as visualized in the centre circle. On
the left three target groups (guests) are given: Inhabitants, Companies and Visitors. Research needs to bring information about motives/objectives and expectations on WHY and HOW these groups live, work and visit a city. Our focus goes beyond the visitors group alone.
On the right, is the hospitable city (the host). The hospitable city is offered by a group of stakeholders;
all hosts by themselves and together co-create the hospitable city. Within the city hospitality offer three building blocks are given. The first is hospitable behavior; being service-minded, friendly, quick, an open attitude by everyone who works, lives in the city. These people could be employees in stores and F&B facilities but inhabitants also. The second building block of city hospitality is the hardware; such as the presence of (special) buildings, infrastructure, places to meet and relax in a natural environment or in a more commercial area. For instance shops, F&B facilities, museums, a park. The third building block of city hospitality is Atmosphere; the exterior and interior of a city. Such as the architecture, the colors, smell, ambiance, sound, other people. It is about a feeling, something intangible, difficult to copy and a way to distinguish the city from others.
The hosts (stakeholders) within the city should find a way to work together. The municipality can be of importance by having a vision, a plan where a path is shown and all hosts are more aware what is expected from them and where their benefits lie. The better the match between the objectives/motives and expectations of a target group and the building blocks of a hospitable city, the more these expectations will be met, perhaps even exceeded. This influences the quality of the city hospitality experience. The higher the quality of the experience, the more people will come to the city to live, work and visit. This will add to the liveliness of the city and attract even more inhabitants, businesses and visitors to the city.
A hospitable city is always searching for options to create value for their target groups; the more they
succeed in doing so the more they become a friendly and lively city, a nice place to live, work, meet and shop. The economic benefits will inevitably follow.
Case: City Hospitality Experience Model applied to The City The Hague The vision of The Hague on their City Marketing by the Municipality of The Hague, (2010) is: “In
2020, The Hague will be internationally renowned as: The global International Headquarters of Peace and Justice, and a dynamic city with five-star quality facilities for living, working, studying and enjoying leisure time. The city will be inviting, welcoming to the world and international, versatile and inspiring”. City Hospitality is seen as an important part in the achievement of their ambitions.
In light of these ‘city hospitality‘ objectives, in 2011 research was conducted by students of
Hotelschool The Hague’s Master of Hospitality programme (2011) during which the model and different
variables were used. Part of the research focused on residents of The Hague by means of online surveys and personal interviews. The application of the City Hospitality Experience Model as a research framework turned out to be very useful. Further research is necessary to gain more knowledge on relationships in the model; for instance, to determine how different target groups respond to the three building blocks.
During the research period 244 questionnaires were gathered, reinforced by qualitative information obtained through interviews with residents and experts on City Hospitality. Evidently, the population distributions regarding age, gender and profession for this research were almost identical to surveys previously conducted by The Hague municipality.
Referring to Figure 1, the 5-star quality experience of The Hague can be positioned in the centre circle,
where guests and host meet. The residents of The Hague are clearly a target market for whom a hospitable experience can be created. According to the results, The Hague residents are friendly, helpful and speak English well – which obviously helps the many expats living in The Hague. This aspect belongs to the building block Hospitable Behavior. In the evening and nights the inhabitants feel less safe due to crime. This is part of the Atmosphere building block. The response by the city was to work together with the police to ensure people feel safer. Looking within the building block hardware for places to relax and entertain, The Hague has the beach and many green areas for relaxation and leisure. A lack is mentioned for entertainment as for youngsters and students there are not enough clubs and discos open late. Places to take children are also limited. The survey respondents rated positively the selection of shops in The Hague. Conversely, apparently there is a demand for more international restaurants and extended opening times of shops. Bars and restaurants are perceived to close relatively too early, especially for theatre and cinema visitors and there are not enough terraces in the summer. Prices are high and tend to cater for Expats rather than local people. Also, there are insufficient “hangout” places for youths. Furthermore, the professional attitude of retail staff is considered poor and alternatives for the local supermarket chains are desired.
Atmosphere and ambiance score high. The vast majority of inhabitants in The Hague are happy to live
in the city. Only a small percentage of inhabitants rated their happiness in The Hague negatively and stated in the qualitative part of the survey that they would leave the city. Generally, the inhabitants are proud to live in The Hague. The City Hospitality Experience as such scores high.
Though the study is limited to The Hague residents, it clearly shows the wide variety of stakeholders
on the city side to co-create the city hospitality experience for the inhabitants. All parties involved should be aware they make the city together. It is the co-creation of the stakeholders in the city and then the co-creation between the city and the inhabitants. The inhabitants should also become aware of their role in being a hospitable city. For other target markets they are part of the hospitality complex.
Conclusion In the process towards an analytical approach of City Hospitality within the City Marketing domain the
City Hospitality Experience Model identifies the relationships between guest (target markets) and host (stakeholders of the city). Clearly more research needs to be done per target group to obtain a more complete picture of their motives/objectives and expectations in relation to the three building blocks and their importance. In view of the complexity of all the relationships, further research is also needed among stakeholders as well. Indeed, in order to improve the overall City Hospitality Experience the relevance of the stakeholders per target group needs to be identified and with which stakeholders (greater) cooperation is required within the different projects. And by way of extension, the abovementioned research involving The Hague residents seems to confirm the effectiveness of the City Hospitality Experience Model as a tool for developing the much needed City Hospitality policies.
REFERENCES
Braun, Erik. (2008, October). Hoe steden effectief gebruik kunnen maken van citymarketing, Erasmus School of Economics
Cassee, E.Th. & Reuland. R.J.(Eds). (1983). The management of hospitality, Pergamon Press, Oxford. Derrida, J. & Dufourmantelle, A,. (2000). Of Hospitality, Translated by Rachel Bowlby, Stanford University Press,
Stanford California.
Gunnarson Jan & Olle Blohm,. (2002). Hostmanship, De Kunst mensen het gevoel te geven dat ze welkom zijn, Dialogos Forlag AB
Hospers, G.-J..(2009). Citymarketing in perspectief, IVIO Wereldschool, Lelystad Lashley, C., Lynch, P. & Morrison, A. (2007). Hospitality: A Social Lense, Oxford: Elsevier Lewis & Chambers. (2000). Marketing Leadership in Hospitality, Foundations and Practices, 3rd edition, John Wiley &
sons, inc Municipality of The Hague. (2010). The Hague City Marketing Vision 2011-2015 Pine, J. & Gilmore, J. (1999). The Experience Economy: Work Is Theater & Every Business a Stage. Boston, Harvard
Business School Press.
Reuland, R, Choudry, J, Fagel, A..(1985). Research in the field of hospitality, Int. J. Hospitality Management Vol. No4 Students of the Master of Science in Hospitality Management program. (2011, May). Making the difference with City
Hospitality, Class 2010-2011
CULTURAL ROUTES IN TURKEY; EVLIYA ÇELEBI WAY
Canan BASTEMUR, (Ph D) Lecturer
KASTAMONU UNIVERSITY CIDE RIFAT ILGAZ VOCATIONAL HIGH SCHOOL – HEAD OF TOURISM AND TOURISM MANAGEMENT
KASTAMONU-TURKEY
CULTURAL ROUTES IN TURKEY; EVLIYA ÇELEBI WAY
Turkey is a country with geographical structure, climate variety; historical remains belong to different eras and its nature that contributes tourism variety. This variety provides that different special interest activities have been done like hiking, scuba diving, paragliding, parasailing, wreck tourism, bird watching etc. besides culture tourism. Culture tourism is one of major tourism activities in Turkey. In recent years tourist expectation has changed. Tourists would like to unite cultural tourism and other special interest tourism activities together.
The Cultural Routes program of the Council of Europe was set up 1984 and 1987 following a resolution of the Parliamentary Assembly of the Council of Europe to unite special tourism activities and cultural tourism. The first cultural route in Turkey was created in 1999 known as Lycian Way. While the number of European Cultural Routes has reached 29 up today, 12 cultural routes in Turkey has been marked till now. These routes are Lycian Way, St. Paul Trail, Abraham’s Path, Independence Trail, Kackar Mountains Path, Kure Mountains Path, Sultan’s Trail, Evliya Çelebi Way, Phyrgian way, Hittite Trail, Yenice Forest Trail and Carian Trail.
Evliya Çelebi way is one of the most important culture routes in Turkey because of his contributions of Turkish history. Evliya Çelebi was an Ottoman Turkish gentleman adventurer who travelled far and wide for over 40 years. Often he travelled on official business, but also for pleasure. His observations on everyday life in the 17th century are a unique record of his times. Among his many accomplishments, Evliya was a scholar, raconteur, dervish, musican, and linguist. He dubbed himself ‘World Traveller and Boon Companion to Mankind’ and wore a ring inscribed ‘The World Traveller Evliya’. He aimed to describe everything he saw on his journeys, and left a record of his wanderings in 10 large volumes, the Seyahatname, or book of travels.
The Way is Turkey’s first equestrian route, and also a trail for walkers and bikers. It follows the early stages of Evliya’s journey to Mecca in 1671, when he at last found the opportunity to undertake the pilgrimage. The Evliya Çelebi Way crosses some of the most spectacular and varied landscapes in Turkey, visiting villages far off the beaten track, as well as passing through, or close to, towns and cities of great historical importance in this region. It follows rivers and goat paths, tractor- and forestry tracks, and Roman and Ottoman paved roads. The equestrian route is around 650km long, and takes about 25 days to complete.
Culture Routes in Turkey has been becoming popular in recent years as distinct from Europe. So, the culture routes are important for Turkish tourism. Evliya Çelebi Way is important because of being the first and one equestrian route in Turkey. There are many special tourism interest activities on the way.
KEY WORDS: Special interest tourism, European Cultural Routes, Turkish Cultural Routes
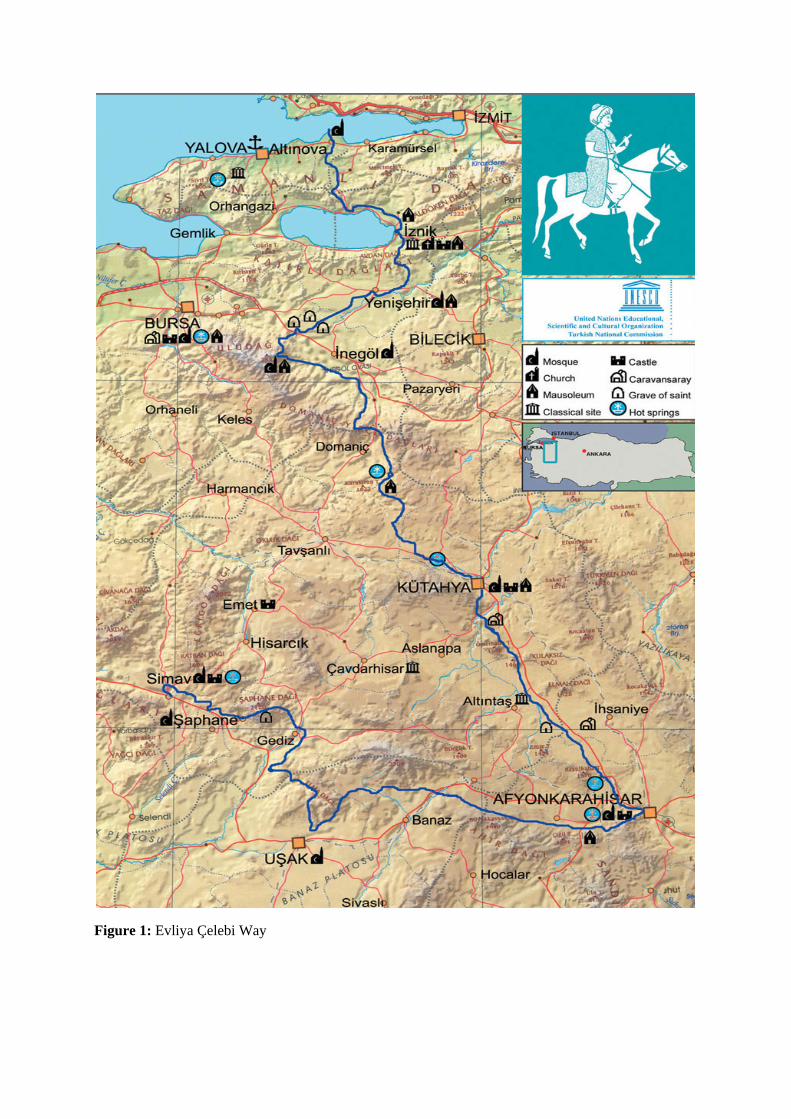
Figure 1: Evliya Çelebi Way

REFERENCES
Bastemur, C., 2009, “the Tourism Potential of Lycian Way and its Environs”, Ankara-Turkey
Clow, K., Finkel, C., 2011, “Evliya Çelebi Way”, Upcountry Turkey Ltd.
Culture Routes, 2012, “Cultural Routes in Turkey”, http://cultureroutesinturkey.com/c/
Europe Council, 2012, “Impact of European Cultural Routes on SMEs’ innovation and competitiveness”
Importance of Special Activities Tourism Development as Perspective Synergy of Incentive Travel
and Experience Economy in Lithuania
Nida Kaladytė Lecturer
Vilnius kolegija/ University of Applied Sciences Vilnius, Lithuania
e-mail: [email protected]
Skirmantė Vaitkutė Graduate, Master Degree in International Tourism Management
Vilnius State University Vilnius, Lithuania
e-mail: [email protected]
Abstract
Lithuania might be still considered an affordable incentive destination among the nearest neighboring countries. Though, preferences for exclusive activities that guarantee distinct experiences are dominating nowadays. Would perfection of special activities tourism in Lithuania improve the demand on incentive travel arrangements while proceeding regional development?
Outcomes and conclusions of the analyzed topic represent evident potential for incentive travel growth and increase in range of various activities. To attract incentive tours from abroad, Lithuania has to create an image of friendly, attractive and unique destination, by systematically using the most effective contemporary marketing tools and carefully distributing financial and human resources.
Under reasonable supervision of aero-tourism development and promotional support from governmental level there is an evident perspective for special activities tourism development in Lithuania. Aero-tourism as attractive niche occupation, included in incentive travel programmes, might improve attractiveness of the destination. Aero-tourism is a relatively new market niche in the special activities tourism industry. Since there is no standard definition for the concept at this time, the professionals loosely define the concept as getting passengers from a local airport to surrounding areas of interest. While it is unlikely that aero-tourism will dominate the rural tourism market, it has the potential to play a supporting role. And, like other rural tourism niches, such as nature- based tourism, heritage tourism, and farm vacations, aero-tourism needs to be further developed and marketed to the travelling public.
Key words: experience economy, incentive travel, aero-tourism, niche tourism, feasibility study.
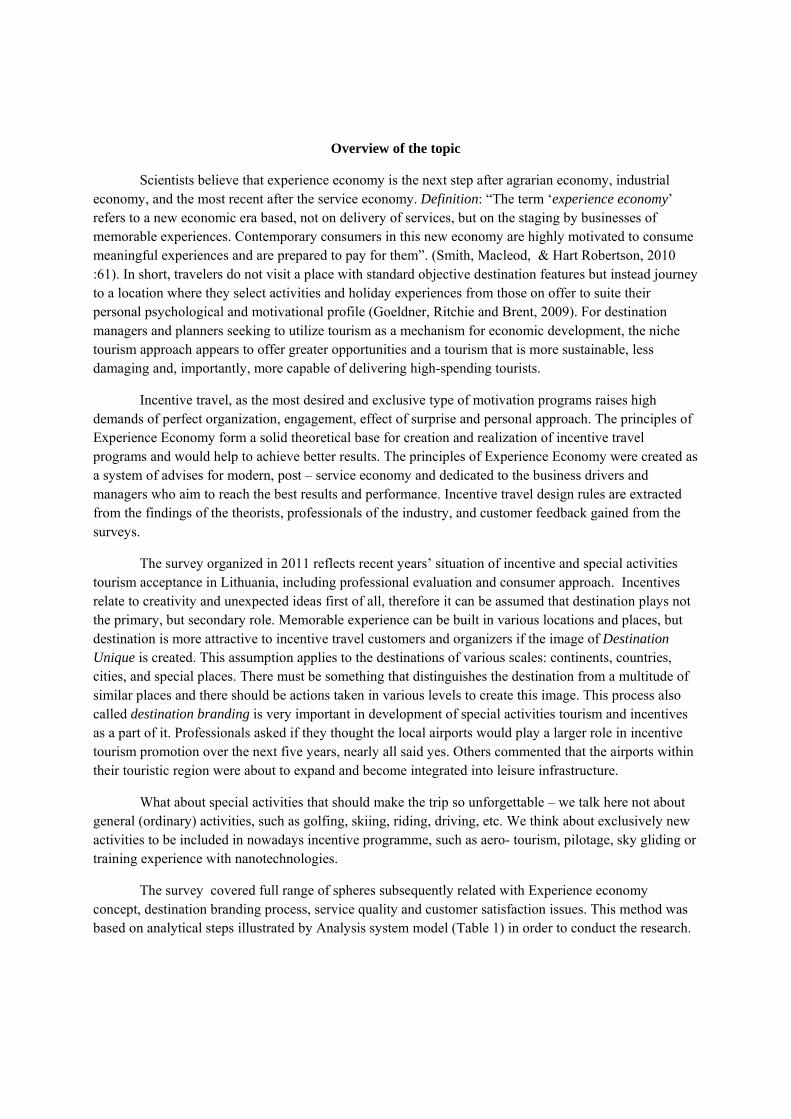
Overview of the topic
Scientists believe that experience economy is the next step after agrarian economy, industrial economy, and the most recent after the service economy. Definition: “The term ‘experience economy’ refers to a new economic era based, not on delivery of services, but on the staging by businesses of memorable experiences. Contemporary consumers in this new economy are highly motivated to consume meaningful experiences and are prepared to pay for them”. (Smith, Macleod, & Hart Robertson, 2010 :61). In short, travelers do not visit a place with standard objective destination features but instead journey to a location where they select activities and holiday experiences from those on offer to suite their personal psychological and motivational profile (Goeldner, Ritchie and Brent, 2009). For destination managers and planners seeking to utilize tourism as a mechanism for economic development, the niche tourism approach appears to offer greater opportunities and a tourism that is more sustainable, less damaging and, importantly, more capable of delivering high-spending tourists.
Incentive travel, as the most desired and exclusive type of motivation programs raises high demands of perfect organization, engagement, effect of surprise and personal approach. The principles of Experience Economy form a solid theoretical base for creation and realization of incentive travel programs and would help to achieve better results. The principles of Experience Economy were created as a system of advises for modern, post – service economy and dedicated to the business drivers and managers who aim to reach the best results and performance. Incentive travel design rules are extracted from the findings of the theorists, professionals of the industry, and customer feedback gained from the surveys.
The survey organized in 2011 reflects recent years’ situation of incentive and special activities tourism acceptance in Lithuania, including professional evaluation and consumer approach. Incentives relate to creativity and unexpected ideas first of all, therefore it can be assumed that destination plays not the primary, but secondary role. Memorable experience can be built in various locations and places, but destination is more attractive to incentive travel customers and organizers if the image of Destination Unique is created. This assumption applies to the destinations of various scales: continents, countries, cities, and special places. There must be something that distinguishes the destination from a multitude of similar places and there should be actions taken in various levels to create this image. This process also called destination branding is very important in development of special activities tourism and incentives as a part of it. Professionals asked if they thought the local airports would play a larger role in incentive tourism promotion over the next five years, nearly all said yes. Others commented that the airports within their touristic region were about to expand and become integrated into leisure infrastructure.
What about special activities that should make the trip so unforgettable – we talk here not about general (ordinary) activities, such as golfing, skiing, riding, driving, etc. We think about exclusively new activities to be included in nowadays incentive programme, such as aero- tourism, pilotage, sky gliding or training experience with nanotechnologies.
The survey covered full range of spheres subsequently related with Experience economy concept, destination branding process, service quality and customer satisfaction issues. This method was based on analytical steps illustrated by Analysis system model (Table 1) in order to conduct the research.
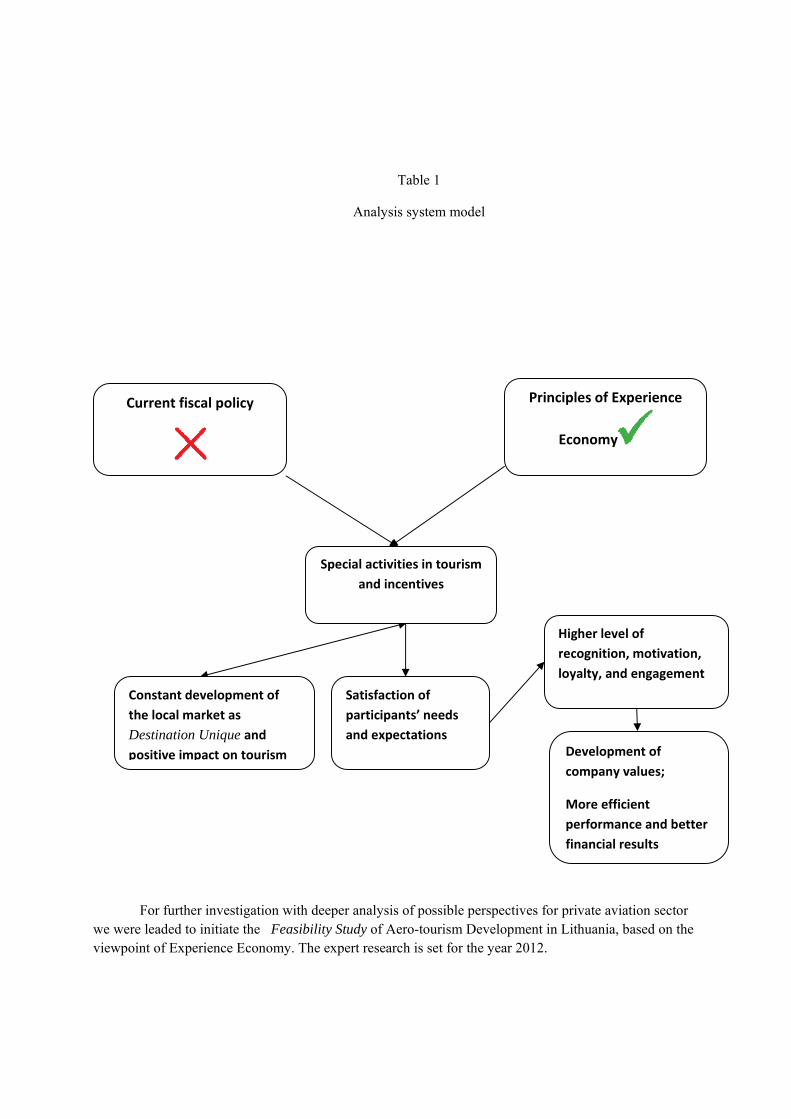
Table 1
Analysis system model
For further investigation with deeper analysis of possible perspectives for private aviation sector we were leaded to initiate the Feasibility Study of Aero-tourism Development in Lithuania, based on the viewpoint of Experience Economy. The expert research is set for the year 2012.
Satisfaction of
participants’ needs
and expectations
Higher level of
recognition, motivation,
loyalty, and engagement
Development of
company values;
More efficient
performance and better
financial results
Principles of Experience
Economy
Special activities in tourism
and incentives
Constant development of
the local market as
Destination Unique and
positive impact on tourism
Current fiscal policy
References
“Aviacijos Pasaulis” (Aviation World), monthly journal, No. 201-202. 2011;
Bitner, M. J., Booms, B. H. & Stanfield Tetreault, M. 1990. The Service Encounter: Diagnosing Favorable and Unfavorable Incidents. Journal of Marketing, vol. 54, pp. 71-84;
Boswijk, A., Thijssen, T. & Peelen E. 2007, A New Perspective on the Experience Economy. Meaningful Experiences. www.experience-economy.com;
Havlena, W., J., & Holbrook, M., B. 1986. The Varieties of Consumption Experience: Comparing Two Typologies of Emotion in Customer Behavior. Journal of Customer Research, pp. 394 -404;
Goeldner, C., Ritchie, R. and Brent, J.R. (2009). Tourism: principles, practices, philosophies. John Wiley & Sons, Inc, Hoboken, New Jersey;
Novelli, M. (2005). Niche Tourism. ELSEVIER, Oxford, UK;
Pine, B. J. & Gilmore J., H. 1999. The Experience Economy. Harvard Business School Press. Boston, USA
Smith, M., Macleod, N. & Hart Robertson, M. 2010. Key Concepts in Tourist Studies, SAGE.;
http://lt.wikipedia.org/wiki/S%C4%85ra%C5%A1as:Lietuvos_oro_uostai_ir_aerodromai. [ Accessed the 19th of January 2012, 14:45] http://www.aerodream.lt/lt/. [ Accessed the 17th of May 2012, 20:24].
Related Documents