PhD Thesis Intrinsic Differences of the Airway Epithelium in Childhood Allergic Asthma Paul Timothy Stevens B.Sc. (Hons) This thesis is presented for the Degree of Doctor of Philosophy at the University of Western Australia, School of Paediatrics and Child Health 2009

Welcome message from author
This document is posted to help you gain knowledge. Please leave a comment to let me know what you think about it! Share it to your friends and learn new things together.
Transcript

PhD Thesis
Intrinsic Differences of the Airway Epithelium in Childhood Allergic
Asthma
Paul Timothy Stevens B.Sc. (Hons)
This thesis is presented for the Degree of Doctor of Philosophy at the University of
Western Australia, School of Paediatrics and Child Health
2009

Stevens 2009
ii
______________________________________________________________________
Declaration
DECLARATION FOR THESES CONTAINING PUBLISHED WORK AND/OR WORK PREPARED FOR PUBLICATION
This thesis contains published work and/or work prepared for publication, some of which has been co-authored. The bibliographical details of the work and where it appears in the thesis are outlined below.
Signed ___________________
Paul Stevens
Date: 29/9/2009

Stevens 2009
iii
______________________________________________________________________
Abstract
Asthma affects millions of people worldwide and places a substantial burden on the
healthcare system. Despite advances in our understanding of disease mechanisms and
the role of respiratory viruses in asthma exacerbations, there is little known regarding
the role of the epithelium in commonly observed structural changes in the airway wall.
The epithelium of the airways provides an essential protective barrier between the
environment and underlying structures and is responsible for the secretion of diverse
compounds. Since it is likely that dysregulated epithelial characteristics and function in
childhood asthma are critical determinants of disease progression in adults, it is
pertinent to investigate the cellular mechanisms involved in paediatric asthma.
However, full comprehension of paediatric respiratory diseases and the childhood
antecedents of adult respiratory disease are currently hampered by the difficulty in
obtaining relevant target organ tissue and most of the data to date have been generated
from studies involving adults or commercially derived cell lines. This laboratory has
successfully developed methodologies of obtaining and studying samples of paediatric
primary airway epithelial cells (pAECs) and has identified significant biochemical and
functional differences between healthy non-atopic (pAECHNA) and atopic asthmatic
(pAECAA) airway cells, which have assisted in the identification of potential
mechanisms responsible for abnormal epithelial function.

Stevens 2009
iv
______________________________________________________________________
This project continues on from these findings and aimed to test the specific hypothesis
that the dysregulated reparative function of pAECs contributes to the epithelial damage
and airway remodelling witnessed in the asthmatic airways. Utilising a mechanical
wound repair model, this investigation showed that pAECHNA were capable of fully
repairing within 7 days, compared to only 50% wound closure in pAECAA after 10 days.
Investigation into potential causative mechanisms identified the plasmin activation
system (PAS) and more specifically plasminogen activator inhibitor-1 (PAI-1) due to its
regulatory role of epithelial cell adhesion, migration and proliferation. To this end, PAI-
1 gene expression and protein activity were measured in healthy, non atopic (HNA) and
atopic asthmatic (AA) airway epithelium as was its role in mediating pAEC
proliferation and repair. Results generated indicated that baseline expression of PAI-1
was significantly elevated in pAECAA (68 fold) and was mirrored by elevated protein
production and activity, in asthmatic cell lysates, but plasma levels were similar in each
group. In addition, PAI-1 expression was found to correlate with pAEC proliferation in
both cohorts. Silencing the PAI-1 gene significantly reduced the rate of proliferation in
HNA and AA cells. Mechanical wounding of epithelial monolayers was found to induce
PAI-1 expression in both cohorts whilst silencing PAI-1 gene expression delayed
wound repair of pAECHNA with minimal effect seen on pAECAA. Collectively, these
data showed that PAI-1 is significantly up-regulated in pAECAA and despite playing a
functional role in normal proliferation and repair, fails to stimulate repair in asthmatic
epithelium.

Stevens 2009
v
______________________________________________________________________
In conjunction with other cell types, AECs, are involved in modulating extracellular
matrix (ECM) synthesis and thus have been implicated in the remodelling process.
Therefore, due to their essential role in airway remodelling, this study sought to
characterise matrix metalloproteinases (MMPs) and tissue inhibitors of MMPs (TIMP)
in pAECs. Results generated here showed that MMP-2 (7.4 down fold) and MMP-9 (7.7
down fold) gene expression as well as protein levels and activity were significantly
lower in pAECAA. In addition, MMP-7, but not MMP-14 gene expression was found to
be markedly lower in pAECAA. Levels of TIMP-1 and -2 were also lower, albeit to a
lesser extent. This imbalance was specific to the local airway mucosa and not the
circulation, since plasma MMP and TIMP activity were not different between the two
cohorts. Collectively, these data provides evidence that there is dysregulation in the
mechanisms that monitor the turnover of ECM in childhood mild asthma and identifies
the reduced MMP/TIMP ratio as an important potential contributor to airway wall
thickening, subepithelial fibrosis and persistent airway obstruction that occurs in the
more severe disease.
Since acute exacerbations of asthma are responsible for the majority of morbidity of the
disease and that viral infections play a significant role in triggering these exacerbations,
the final set of experiments sought to characterise repair responses of pAEC to exposure
to rhinovirus (RV). Results suggest that pAECAA were more susceptible to the effects of
RV exposure than pAECHNA. The exposure to RV was found to induce both
inflammatory and apoptotic responses in pAEC regardless of phenotype and that

Stevens 2009
vi
______________________________________________________________________
pAECAA exposed to RV had a markedly reduced capacity to both proliferative and
repair than pAECHNA. Exposure of pAECs with RV resulted in elevated PAI-1 mRNA
expression and reduced MMP-9 release in both pAECAA and pAECHNA samples.
Collectively, the data presented indicate that RV exposure induces a pronounced anti-
proliferative and retardative repair effect in pAECAA and that the presence of virus may
have a role in the PAI-1 and MMP expression witnessed in these cells.
In conclusion, this investigation has further characterised the essential role the airway
epithelium plays in childhood asthma by demonstrating for the first time that pAECs
from asthmatic children lack the ability to successfully repair mechanically induced
wounds. This investigation also showed that PAI-1 is elevated in pAECAA and has a
functional role in the pAEC proliferative and regenerative processes. It was
demonstrated that MMP-2 and MMP-9 activities and the MMP-9/TIMP-1 as well as
MMP2/TIMP2 ratios were significantly reduced in pAECAA thereby providing
additional evidence that there is a dysregulation in the mechanisms that monitor the
turnover of the ECM in childhood asthma. Furthermore, this study has shown for the
first time that pAECs from untreated mild atopic-asthmatic children are more sensitive
to the pathogenic effects of RV than healthy control cells and that RV exposure delays
cellular proliferation and repair. Ultimately, these findings support the hypothesis
postulated and provide evidence that indeed the dysregulated epithelial functional
characteristics seen in childhood mild asthma may be a critical determinant of disease
progression in adults.

Stevens 2009
vii
______________________________________________________________________
Table of Contents
Declaration ........................................................................................................................ii
Abstract ............................................................................................................................iii
Table of Contents ............................................................................................................vii
List of Figures .................................................................................................................xx
List of Tables ...............................................................................................................xxiv
List of Abbreviations ...................................................................................................xxvi
Publications arising from this project .........................................................................xxxii
Presentations arising from this project.......................................................................xxxiii
Publications associated with his project.....................................................................xxxvi
Presentations associated with this project .................................................................xxxvii
Awards .......................................................................................................................xxxix
Acknowledgements .........................................................................................................xli

Stevens 2009
viii
______________________________________________________________________
Chapter 1: Literature Review........................................................................................1
1.1 The respiratory mucosa ......................................................................................1
1.2 Asthma................................................................................................................4
1.2.1 Asthma progression into adulthood ............................................................5
1.2.2 Burden of asthma and related deaths ..........................................................7
1.2.3 Atopy and risk factors for asthma ...............................................................8
1.2.4 Respiratory infections as triggers of asthma .............................................12
1.3 Role of airway epithelium in asthma................................................................13
1.3.1 Lipid and peptide mediators......................................................................13
1.3.2 Catabolic enzymes/inhibitors ....................................................................14
1.3.3 Cytokines ..................................................................................................15
1.3.3.1 IL-8 ...................................................................................................15
1.3.3.2 IL-6 ...................................................................................................16
1.3.3.3 IL-1 ...................................................................................................16
1.3.4 Chemokines..............................................................................................17
1.3.4.1 Regulated upon activation, normal T-cell expressed, and secreted
(RANTES) ..........................................................................................................17
1.3.5 Reactive oxygen species ...........................................................................18
1.3.5.1 Nitric oxide .......................................................................................18
1.3.6 Growth factors...........................................................................................19
1.3.6.2 Transforming growth factor β...........................................................20
1.3.7 Adhesion molecules ..................................................................................21

Stevens 2009
ix
______________________________________________________________________
1.3.7.1 Intercellular adhesion molecule-1.....................................................22
1.3.7.2 Integrins ............................................................................................22
1.3.7.3 Selectins ............................................................................................23
1.3.7.4 Cadherins ..........................................................................................23
1.3.8 Immunoregulation.....................................................................................24
1.4 Epithelial damage and repair ............................................................................26
1.5 Airway remodelling..........................................................................................28
1.5.1 Alterations in mucus-secreting structures .................................................29
1.5.2 Increase in smooth muscle mass ...............................................................30
1.5.3 Increased vascularity.................................................................................31
1.5.4 Matrix abnormalities .................................................................................32
1.5.5 Thickening of the airway wall...................................................................33
1.5.5.1 Plasminogen activator inhibitor-1.....................................................33
1.5.5.2 Matrix metalloproteinases.................................................................35
1.6 Viral infections and asthma ..........................................................................37
1.6.1 Rhinoviruses..............................................................................................38
1.7 Summary and Thesis Aims...............................................................................40
Chapter 2: General Materials and Methods...............................................................43
2.1 General materials ..................................................................................................43
2.2 Equipment .............................................................................................................47
2.2.1 Balances ....................................................................................................47
2.2.2 Centrifuges ................................................................................................47

Stevens 2009
x
______________________________________________________________________
2.2.3 Digital camera ...........................................................................................47
2.2.4 Electrophoresis..........................................................................................48
2.2.5 Gel-Doc System ........................................................................................48
2.2.6 Glassware ..................................................................................................48
2.2.7 Heating devices .........................................................................................49
2.2.8 Incubators..................................................................................................49
2.2.9 Laminar flow cabinets...............................................................................49
2.2.10 Microscope................................................................................................50
2.2.11 pH meter....................................................................................................50
2.2.12 Pipettes ......................................................................................................50
2.2.13 Plate reader................................................................................................51
2.2.14 Real Time Quantitative PCR (RT-qPCR) .................................................51
2.2.15 Stirrer, shakers and rockers .......................................................................51
2.2.16 Tissue culture plasticware.........................................................................52
2.2.17 Water baths ...............................................................................................52
2.3 General buffers and solutions................................................................................53
2.3.1 Multipurpose ..................................................................................................53
2.3.1.1 Double deionised water (ddH2O)......................................................53
2.3.1.2 Phosphate Buffered Saline (PBS) .....................................................53
2.3.1.3 Tris Buffered Saline (TBS)...............................................................54
2.3.1.4 Tris-Hydrochloric Acid (HCl; 1.5 M) ..............................................54
2.3.1.5 Tris- Hydrochloric Acid (HCl; 0.5 M) .............................................54

Stevens 2009
xi
______________________________________________________________________
2.3.1.6 Hydrochloric Acid (HCl; 0.1 M) ......................................................55
2.3.1.7 Hydrochloric Acid (HCl; 10 mM) ....................................................55
2.3.1.8 Hydrochloric Acid (HCl; 4 mM) ......................................................55
2.3.1.9 Dithiothreitol (DTT) solution (100 mM)..........................................55
2.3.1.10 Dithiothreitol (DTT) solution (1 mM)..............................................56
2.3.1.11 Diethylpycrocarbonate (DEPC) H2O................................................56
2.3.1.12 Ethanol (95%)...................................................................................56
2.3.1.13 Ethanol (70%)...................................................................................56
2.3.2 Cell culture .....................................................................................................57
2.3.2.1 Bovine pituitary extract (BPE) .........................................................57
2.3.2.2 Epidermal growth factor (EGF)........................................................57
2.3.2.3 Epinephrine (1 mg/ml)......................................................................57
2.3.2.4 Hydrocortisone (3.6 mg/ml) .............................................................58
2.3.2.5 Insulin (2 mg/ml) ..............................................................................58
2.3.2.6 Retinoic acid (1 µg/ml).....................................................................58
2.3.2.7 Ultroser-G .........................................................................................59
2.3.2.8 Transferrin (5 mg/ml) .......................................................................59
2.3.2.9 Tri-iodothyronine stock (6.5 µg/ml) .................................................59
2.3.2.10 BSA stock solution (1 mg/ml) ..........................................................60
2.3.2.11 Penicillin (50 mg/ml) .......................................................................60
2.3.2.12 Gentamicin (50 mg/ml).....................................................................60
2.3.2.13 Streptomycin (50 mg/ml)..................................................................61

Stevens 2009
xii
______________________________________________________________________
2.3.2.14 Nystatin (50 mg/ml)..........................................................................61
2.3.2.15 Fungizone (25 mg/ml) ......................................................................61
2.3.2.16 Primary cell culture medium.............................................................62
2.3.2.17 A549 cell line culture medium .........................................................62
2.3.2.18 16HBE14o- cell line culture medium ...............................................63
2.3.2.19 Cell culture coating buffer ................................................................63
2.3.2.20 Cell freezing solution........................................................................63
2.3.2.21 Neutral Buffered Formalin (NBF) ....................................................64
2.3.3 Assays and associated buffers........................................................................64
2.3.3.1 Cell lysis buffer for protein extraction..............................................64
2.3.3.2 Time resolved fluorometry (TRF) block buffer................................64
2.3.3.3 Time resolved fluorometry (TRF) coating buffer.............................65
2.3.3.4 Time resolved fluorometry (TRF) wash buffer ................................65
2.4 General methods ...................................................................................................66
2.4.1 Ethics approval..........................................................................................66
2.4.2 Cell types...................................................................................................66
2.4.2.1 Primary airway epithelial cells .........................................................66
2.4.2.2 16HBE14o- cell line .........................................................................67
2.4.2.3 A549 cell line....................................................................................67
2.4.3 Primary airway epithelial cell isolation.....................................................68
2.4.4 Primary airway epithelial cell subculture..................................................69
2.4.5 Cell line culture .........................................................................................69

Stevens 2009
xiii
______________________________________________________________________
2.4.6 Culture media collection ...........................................................................71
2.4.7 Cytospin Preparation.................................................................................71
2.4.8 Plasma isolation ........................................................................................71
2.4.9 Total cellular protein extraction ................................................................72
2.4.10 Total cellular protein quantitation.............................................................72
2.4.11 Reverse Transcriptase-Polymerase Chain Reaction (RT-PCR) and Real
Time quantitative Polymerase Chain Reaction (RT-qPCR) ...................................73
2.4.12 Proliferation Assay....................................................................................74
2.4.13 Time Resolved Fluorometry (TRF) ..........................................................75
2.4.14 Statistics ....................................................................................................76
Chapter 3: Dysregulated Repair in Asthma: The Role of Plasminogen Activator
Inhibitor- 1.....................................................................................................................77
3.1 Introduction ......................................................................................................77
3.2 Materials ...........................................................................................................80
3.3 Methods ............................................................................................................81
3.3.1 Patients and sample collection ..................................................................81
3.3.2 Cell subculture and media collection ........................................................81
3.3.3 Cellular quiescence ...................................................................................82
3.3.4 Monolayer wounding ................................................................................82
3.3.5 Reverse Transcriptase-Polymerase Chain Reaction and Quantitative ......84
Polymerase Chain Reaction ....................................................................................84
3.3.6 Protein extraction and quantitation ...........................................................84

Stevens 2009
xiv
______________________________________________________________________
3.3.7 PAI-1 activity assay ..................................................................................84
3.3.8 siRNA gene knockdown ...........................................................................85
3.3.9 Proliferation Assay with PAI-1 Knockdown ............................................86
3.3.10 Statistics ....................................................................................................86
3.4 Results ..............................................................................................................87
3.4.1 Comparison of pAECAA and pAECHNA wound repair ability ...................87
3.4.2 PAI-1 expression by pAECs .....................................................................87
3.4.3 Cellular pAEC and plasma PAI-1 protein activity....................................88
3.4.4 PAI-1 expression in proliferating pAEC...................................................88
3.4.5 PAI-1 siRNA knockdown .........................................................................89
3.4.6 Effect of PAI-1 mRNA knockdown on pAEC proliferation.....................89
3.4.7 PAI-1 mRNA expression and protein activity following wounding.........90
3.4.8 PAI-1 protein expression after wounding .................................................90
3.4.9 PAI-1 mRNA silencing delays wound closure .........................................91
3.5 Discussion ........................................................................................................92
3.6 Conclusion........................................................................................................99
Chapter 4: Airway Epithelial Matrix Metalloproteinases and Tissue Inhibitors in
Asthma .........................................................................................................................100
4.1 Introduction ....................................................................................................100
4.2 Materials ........................................................................................................103
4.3 Buffers and Solutions ....................................................................................105
4.3.1 0.1% Bromophenol blue stock solution ..................................................105
Stevens 2009
xv
______________________________________________________________________
4.3.2 TBS saponin solution ..............................................................................105
4.3.3 Sudan black B quenching solution (0.5%)..............................................105
4.3.4 Blocking buffer .......................................................................................106
4.3.5 Neutral buffered formalin (NBF) ............................................................106
4.3.6 Sodium dodecyl sulfate solution (10%) ..................................................106
4.3.7 Gelatin solution (1%) ..............................................................................107
4.3.8 Stacking gel (3.9%).................................................................................107
4.3.9 Separating zymography gel (7.5%).........................................................107
4.3.10 Separating reverse zymography gel (12%) .............................................108
4.3.11 Separating reverse zymography gel (15%) .............................................108
4.3.12 Zymography sample buffer .....................................................................108
4.3.13 Zymography running buffer....................................................................109
4.3.14 Zymography renaturing buffer................................................................109
4.3.15 Zymography developing buffer ..............................................................109
4.3.16 Zymography stain....................................................................................110
4.3.17 Zymography destain solution..................................................................110
4.4 Methods...............................................................................................................111
4.4.1 Patients and sample collection ................................................................111
4.4.2 Cell subculture and media collection ......................................................111
4.4.3 Protein extraction and quantitation .........................................................112
4.4.4 Reverse Transcriptase-Polymerase Chain Reaction and Quantitative
Polymerase Chain Reaction ..................................................................................112
Stevens 2009
xvi
______________________________________________________________________
4.4.5 Immunocytochemistry ............................................................................112
4.4.6 Zymography ............................................................................................113
4.4.6.1 Gelatin Zymography........................................................................113
4.4.6.2 Reverse Zymography......................................................................114
4.4.7 IL-13 Assay............................................................................................115
4.5 Results .................................................................................................................117
4.5.1 MMP and TIMP mRNA expression .......................................................117
4.5.2 MMP and TIMP protein production .......................................................117
4.5.3 MMP-2 and MMP-9 Activity in pAEC lysates.......................................118
4.5.4 MMP-2 and MMP-9 Activity in AA and HNA culture medium............118
4.5.5 IL-13 production by pAECHNA and pAECAA..........................................119
4.5.6 MMP-2 and MMP-9 Activity in Plasma from AA and HNA children...119
4.5.7 TIMP Activity in pAEC lysates ..............................................................120
4.5.8 TIMP Activity in AA and HNA culture medium....................................121
4.5.9 TIMP Activity in Plasma from AA and HNA children ..........................121
4.5.10 MMP to TIMP Ratio are lower in pAECAA ............................................121
4.6 Discussion ...........................................................................................................123
4.7 Conclusion ..........................................................................................................130
Chapter 5: Characterisation of RV Exposure and the Effects on PAI-1 and MMP
Expression....................................................................................................................131
5.1 Introduction ....................................................................................................131
5.2 Materials .........................................................................................................135

Stevens 2009
xvii
______________________________________________________________________
5.3 Buffers and solutions......................................................................................136
5.3.1 Crystal violet solution (0.1%) .................................................................136
5.3.2 Formaldehyde/ethanol PBS solution (5%)..............................................136
5.3.3 Skim milk blocking solution (3%) ..........................................................136
5.4 Methods ..........................................................................................................137
5.4.1 Patients and sample collection ................................................................137
5.4.2 Cell culture and media collection............................................................137
5.4.3 Ultra violet (UV) light inactivation or rhinoviral activity.......................138
5.4.4 Rhinoviral concentrations .......................................................................138
5.4.5 Cytotoxicity assay ...................................................................................139
5.4.6 Apoptosis Assay......................................................................................139
5.4.7 Cytokine Assays......................................................................................141
5.4.7.1 ELISA .............................................................................................141
5.4.7.2 Time resolved fluorometry .............................................................141
5.4.8 Cell proliferation experiments..............................................................142
5.4.9 Monolayer wounding and repair experiments .....................................142
5.4.10 Measurement mRNA expression post exposure..................................143
5.4.11 Measurement MMP activity post RV exposure ..................................143
5.4.12 Statistics...............................................................................................144
5.5 Results ............................................................................................................145
5.5.1 Effect of UV-inactivated rhinovirus........................................................145
5.5.2 Effect of rhinoviral exposure on cell viability ........................................145

Stevens 2009
xviii
______________________________________________________________________
5.5.2.1 pAECHNA exposure to RV14 ...........................................................146
5.5.2.2 pAECAA exposure to RV14 .............................................................146
5.5.2.3 pAECHNA exposure to RV1b ...........................................................147
5.5.2.4 pAECAA exposure to RV1b .............................................................147
5.5.3 Rhinoviral induction of apoptosis ...........................................................148
5.5.3.1 Apoptotic effect of RV14 ...............................................................148
5.5.3.2 Apoptotic effect of RV1b ...............................................................149
5.5.4 Cytokine releases following rhinoviral exposure....................................150
5.5.4.1 IL-1β release with RV14 exposure. ................................................150
5.5.4.2 IL-1β release with RV1b exposure. ................................................151
5.5.4.3 IL-6 release with RV14 exposure. ..................................................151
5.5.4.4 IL-6 release with RV1b exposure. ..................................................152
5.5.4.5 IL-8 release with RV14 exposure. ..................................................153
5.5.4.6 IL-8 release with RV1b exposure. ..................................................154
5.5.4.7 TGFβ-1 release with RV14 exposure. ............................................155
5.5.4.8 TGFβ-1 release with RV1b exposure. ............................................155
5.5.5 Rate of pAEC proliferation following rhinoviral exposure ....................156
5.5.6 Ability for successful wound repair following rhinoviral exposure .......157
5.5.7 PAI-1 expression following rhinoviral exposure .........................................158
5.5.7.1 PAI-1 expression with RV14 exposure.................................................158
5.5.7.2 PAI-1 expression with RV1b exposure.................................................159
5.5.8 MMP expression following rhinoviral exposure..........................................159
Stevens 2009
xix
______________________________________________________________________
5.5.8.1 MMP expression with RV14 exposure .................................................160
5.5.8.2 MMP expression with RV1b exposure .................................................160
5.6 Discussion ......................................................................................................162
5.7 Conclusion......................................................................................................170
Chapter 6: General Discussion and Future Directions............................................171
References ....................................................................................................................186
Appendix ......................................................................................................................251
A: Ethics....................................................................................................................251
B: Asthma Questionnaire ..........................................................................................253

Stevens 2009
xx
______________________________________________________________________
List of Figures
Chapter One: Literature Review
Figure 1.1 Airway histology
Figure 1.2 Airway epithelium
Figure 1.3 Asthmatic airways
Figure 1.4 Asthma remodelling
Figure 1.5 Mechanisms of virus-induced asthma
Chapter Two: General Materials and Methods
Figure 2.1 Polymerase Chain Reaction
Chapter Three: Dysregulated Repair in Asthma: The Role of
Plasminogen Activator Inhibitor- 1
Figure 3.1 The plasmin activation system
Figure 3.2 Monolayer wound devices
Figure 3.3 Wound repair time and successfully knockdown
Figure 3.4 Wounding devices and PAI-1 expression
Figure 3.5 siRNA and transfection reagent optimisation

Stevens 2009
xxi
______________________________________________________________________
Figure 3.6 Wound repair comparisons
Figure 3.7 PAI-1 gene expression and protein activity
Figure 3.8 PAI-1 expression during proliferation
Figure 3.9 PAI-1 siRNA knockdown
Figure 3.10 PAI-1 knockdown effect on proliferation
Figure 3.11 PAI-1 mRNA expression after wounding
Figure 3.12 PAI-1 protein expression after wounding
Figure 3.13 PAI-1 knockdown and wound repair
Chapter Four: Airway Epithelial Matrix Metalloproteinases and
Tissue Inhibitors in Asthma
Figure 4.1 MMP and TIMP mRNA production
Figure 4.2 Immunohistochemical staining of cells for MMP-2 and MMP-9
Figure 4.3 MMP activity in cell lysates
Figure 4.4 MMP activity in culture medium
Figure 4.5 IL-13 assay of pAEC culture medium
Figure 4.6 MMP activity in plasma
Figure 4.7 TIMP activity in cell lysates
Figure 4.8 TIMP activity in culture medium
Figure 4.9 TIMP activity in plasma
Figure 4.10 Ratio of MMP to TIMPs in cell lysates

Stevens 2009
xxii
______________________________________________________________________
Chapter Five: Characterisation of RV Exposure and the Effects on
PAI-1 and MMP Expression
Figure 5.1 Cytotoxic effects of UV-inactivated RV
Figure 5.2 Dose-dependent cytotoxic effects of RV14 on pAECHNA viability
Figure 5.3 Dose-dependent cytotoxic effects of RV14 on pAECAA viability
Figure 5.4 Dose-dependent cytotoxic effects of RV1b on pAECHNA viability
Figure 5.5 Dose-dependent cytotoxic effects of RV1b on pAECAA viability
Figure 5.6 Apoptotic effect of RV14
Figure 5.7 Apoptotic effect of RV1b
Figure 5.8 IL-1β release with RV14 exposure
Figure 5.9 IL-1β release with RV1b exposure
Figure 5.10 IL-6 release with RV14 exposure
Figure 5.11 IL-6 release with RV1b exposure
Figure 5.12 IL-8 release with RV14 exposure
Figure 5.13 IL-8 release with RV1b exposure
Figure 5.14 TGFβ-1 release with RV14 exposure
Figure 5.15 TGFβ-1 release with Rv1b exposure
Figure 5.16 Effects of RV exposure on pAEC proliferative capacity
Figure 5.17 Wound closure ability of pAEC with RV exposure
Figure 5.18 Effect of RV14 exposure on PAI-1 expression
Figure 5.19 Effect of RV1b exposure on PAI-1 expression
Figure 5.20 Effect of RV14 exposure on MMP expression

Stevens 2009
xxiii
______________________________________________________________________
Figure 5.21 Effect of RV1b exposure on MMP expression

Stevens 2009
xxiv
______________________________________________________________________
List of Tables
Chapter One: Literature Review
Table 1.1 Matrix metalloproteinase nomenclature, specificity and source
Chapter Two: General Materials and Methods
Table 2.1 Complete patient demographics
Table 2.2 Radioallergosorbent testing
Table 2.3 Primer sequences
Chapter Three: Dysregulated Repair in Asthma: The Role of
Plasminogen Activator Inhibitor- 1
Table 3.1 Chapter Three patient demographics
Chapter Four: Airway Epithelial Matrix Metalloproteinases and
Tissue Inhibitors in Asthma
Table 4.1 Chapter Four patient demographics

Stevens 2009
xxv
______________________________________________________________________
Chapter Five: Characterisation of RV Exposure and the Effects on
PAI-1 and MMP Expression
Table 5.1 Chapter Five patient demographics
Table 5.2 RV titres and concentrations

Stevens 2009
xxvi
______________________________________________________________________
List of Abbreviations
°C degrees Celsius
AA atopic asthmatic
AEC airway epithelial cell
APC antigen-presenting cell
APS ammonium persulphate
ASM airway smooth muscle
ATS American Thoracic Society
BAL bronchoalveolar lavage
BCA bicinchoninic acid
BEBM bronchial epithelial basal medium
BSA bovine serum albumin
BV blood vessel
CaCl2 calcium chloride
CD cluster of differentiation
cDNA complementary deoxyribonucleic acid
cm2 centimetres squared
CO2 carbon dioxide
COPD chronic obstructive pulmonary disease
CSF colony stimulating factor

Stevens 2009
xxvii
______________________________________________________________________
CVA cough-variant asthma
ddH20 double deionised water
DEPC diethylpycrocarbonate
DMSO dimethyl sulfoxide
DNA deoxyribonucleic acid
dNTP deoxyribonucleotide triphosphate
ECM extracellular matrix
EDTA thylenediamine tetraacetic acid
EGF epidermal growth factor
EGFR epidermal growth factor receptor
EIA exercise-induced asthma
EMEM earls modified essential media
FBS foetal bovine serum
FEV1 forced expiratory volume
g grams
g gravitational force
G-CSF granulocyte-colony stimulating factor
GM-CSF granulocyte monocyte colony stimulating factor
HCL hydrochloric acid
HNA healthy non-atopic
ICAM Intracellular adhesion molecule
Ig immunoglobulin

Stevens 2009
xxviii
______________________________________________________________________
IL interleukin
IL-1RI Interleukin-1 receptor
IL-1RN interleukin-1 receptor antagonist
INF interferon
iNOS inducible nitric oxide synthase
ISAAC International Study of Asthma and Allergies in Childhood
KCl potassium chloride
KH2PO4 potassium dihydrogen orthophosphate
L litre
LB longitudinal bundles
LDL low density lipoprotein
MAPK mitogen-activated protein kinase
M-CSF macrophage colony-stimulating factor
MgCl2 magnesium chloride
MHC major histocompatibility complex
min minutes
ml millilitre
MMP matrix metalloproteinase
mRNA messenger ribonucleic acid
MT membrane-type
MW molecular weigh
Na2CO3 sodium carbonate

Stevens 2009
xxix
______________________________________________________________________
NaCl sodium chloride
NaH2PO4 Sodium dihydrogen orthophosphate
NaHCO3 sodium hydrogen carbonate
NaN3 sodium azide
NaOH sodium hydroxide
NATA National Association of Testing Authorities
NEP neutral metalloendopeptidase
nm nanometre
nmol nanomoles
NO nitric oxide
NOS nitric oxide synthase
pAEC paediatric airway epithelial cells
pAECAA atopic asthmatic paediatric airway epithelial cells
pAECHA healthy atopic paediatric airway epithelial cells
pAECHNA healthy non-atopic paediatric airway epithelial cells
PAI plasminogen activator inhibitor
PAS plasmin activation system
PBS phosphate buffered saline
pg picogram
pH - log [H+]
PIV parainfluenza virus
RANTES regulated upon activation, normal T-cell expressed, and secreted

Stevens 2009
xxx
______________________________________________________________________
RAST radioallergosorbent test
RNA ribonucleic acid
RPMI Roswell Park Memorial Institute
RSV respiratory syncytial virus
RT room temperature
RT-qPCR reverse transcriptase-polymerase chain reaction
RV rhinovirus
SD standard deviation
SE standard error
SDS sodium dodecyl sulfate
siRNA small interfering ribonucleic acid
ssDNA single stranded deoxyribonucleic acid
TBS tris buffered saline
TCID50 50% tissue culture infective dose
TEMED tetramethylethylenediamine
TGF transforming growth factor
Th1 T Helper cells (Type 1)
Th2 T Helper cells (Type 2)
TIMP tissue inhibitor of matrix metalloproteinase
TNF tumour necrosis factor
t-PA tissue plasminogen activator
u-PA urokinase plasminogen activator

Stevens 2009
xxxi
______________________________________________________________________
u-PAR urokinase plasminogen activator receptor
UV ultra violet
v/v volume per volume
w/v weight per volume
μg microgram
μl microliter
μM micromolar

Stevens 2009
xxxii
______________________________________________________________________
Publications arising from this project
Stevens, P.T., Kicic, A., Sutanto, E.N., Knight, D.A., & Stick, S.M. 2008, ‘The Role of
Plasminogen Activator Inhibitor-1 in Epithelial Proliferation and Repair in Childhood
Asthma’, Clinical and Experimental Allergy, 38, 1901-10.

Stevens 2009
xxxiii
______________________________________________________________________
Presentations arising from this project
International - Conference Papers
Stevens, P.T., Kicic, A., Knight, D.A., Sutanto, E.N. & Stick S.M. (2006) Bronchial
epithelial expression of Plasminogen Activator inhibitor (PAI)-1 in childhood asthma.
Proceedings of the American Thoracic Society, 3:A31.
Stevens, P.T., Kicic, A., Knight, D.A. & Stick S.M. (2007) Matrix metalloproteinase
activity in asthmatic bronchial epithelial cells. Am J Respir Crit Care Med, 175:A835.
Stevens, P.T., Kicic, A. & Stick S.M. (2008) Reduced Paediatric Airway Epithelial Cell
Proliferation and Repair with Rhinovirus Infection. Am J Respir Crit Care Med.
177:A972.
National – Invited Speaker
Stevens, P.T., Kicic, A. & Stick S.M. (2006) Increased expression of plasminogen
activator inhibitor (PAI)-1 in the bronchial epithelium of asthmatic children. The
Thoracic Society of Australia and New Zealand Annual Scientific Meeting, Canberra,
Australian Capital Territory, Australia. Respirology, 11: Supp. A10.

Stevens 2009
xxxiv
______________________________________________________________________
Stevens, P.T., Kicic, A. & Stick S.M. (2008) Rhinoviral Exposure Reduces Airway
Epithelial Cell Proliferation and Repair in Childhood Asthma. The Thoracic Society of
Australia and New Zealand Annual Scientific Meeting. Melbourne, Victoria, Australia.
Respirology.
Local – Invited Papers
Stevens, P.T., Kicic, A., Knight, D.A., Sutanto, E.N. & Stick S.M. (2006) Differential
gene expression in the bronchial epithelium from asthmatic children. The Thoracic
Society of Australia and New Zealand, Western Australia Annual Scientific Meeting.
Perth, Western Australia, Australia. (Oral Presentation).
Local – Conference Papers
Stevens, P.T., Kicic, A. & Stick S.M. (2005) PAI-1 expression in childhood asthma.
Respiratory Medicine Annual Meeting, Perth, Western Australia, Australia. (Young
Investigator Award).
Stevens, P.T., Kicic, A., Knight, D.A., Sutanto, E.N. & Stick S.M. (2006) Bronchial
epithelial gene expression and childhood asthma. Research and Advances Scientific
Meeting, Perth, Western Australia, Australia. (Best Oral Presentation Award).

Stevens 2009
xxxv
______________________________________________________________________
Stevens, P.T., Kicic, A. & Stick S.M. (2007) Reduced matrix metalloproteinase activity
in bronchial epithelial cells from asthmatic children. Research and Advances Scientific
Meeting, Perth, Western Australia, Australia. (Oral Presentation).
Stevens, P.T., Kicic, A. & Stick S.M. (2007) Effects of rhinoviral infection on airway
epithelial function. Respiratory Medicine Annual Meeting, Perth, Western Australia,
Australia. (Young Investigator Award).

Stevens 2009
xxxvi
______________________________________________________________________
Publications associated with his project
Kicic, A., Sutanto, E.N., Stevens, P.T., Knight, D.A. & Stick, S.M. (2006) Intrinsic
biochemical and functional differences in bronchial epithelial cells of children with
asthma. Am J Respir Crit Care Med, 174, 1110-8.
McNamara, P.S., Kicic, A., Sutanto, E.N., Stevens, P.T. & Stick, S.M. (2008)
Comparison of two different techniques for obtaining bronchial epithelial cells from
children. European Respiratory Journal, 32, 763-8.
.

Stevens 2009
xxxvii
______________________________________________________________________
Presentations associated with this project
International - Conference Papers
Kicic, A., Sutanto, E.N., Stevens, P.T., Knight, D.A. & Stick S.M. (2006) Aberrant
fibronectin production in asthmatic epithelium: a key factor in dysregulated repair.
Proceedings of the American Thoracic Society, 3:A424.
National - Conference Papers
Kicic, A., Sutanto, E.N., Stevens, P.T., Knight, D.A. & Stick S.M. (2006) Dysregulated
repair in asthmatic epithelium due to anomalous fibronectin (FN) production. The
Thoracic Society of Australia and New Zealand Annual Scientific Meeting. Canberra,
Australian Capital Territory, Australia. Respirology, 11: Supp. A40.
Lang, C., Kicic, A., Sutanto, E.N., Stevens, P.T., Stick, S.M., Rufin, R. & Zalewski, P.
(2007) Zinc transporter (ZIP7 & 14) expression decreases in airway epithelial cells
isolated from asthmatic children. The Thoracic Society of Australia and New Zealand
Annual Scientific Meeting. Auckland, New Zealand. Respirology, 12: Supp. A35.

Stevens 2009
xxxviii
______________________________________________________________________
Local – Conference Papers
Kicic, A., Sutanto, E.N., Stevens, P.T., Knight, D.A. & Stick S.M. (2006) Aberrant
production of fibronectin by asthmatic epithelium results in dysregulated repair.
Research and Advances Scientific Meeting, Perth, Western Australia, Australia.

Stevens 2009
xxxix
______________________________________________________________________
Awards
Australian Postgraduate Award (APA)
A three year scholarship during my PhD candidature. Awarded by the University of
Western Australia, Perth, Western Australia, Australia, 2005.
Asthma Foundation Stipend
A single year stipend awarded during the third year of my PhD candidature. Awarded
by the Asthma Foundation of Western Australia, Perth, Western Australia, Australia,
2008.
New Investigator Awards (NIA)
The new investigator award of $500 conference travel reimbursement. Awarded at the
Respiratory Medicine Annual Meeting, Perth, Western Australia, Australia, 2005.
The investigator award of $500 conference travel reimbursement. Awarded at the
Respiratory Medicine Annual Meeting, Perth, Western Australia, Australia, 2007.
Best Oral Presentation
The best oral presentation award of $500 conference travel reimbursement. Research
and Advances Scientific Meeting, Perth, Western Australia, Australia, 2006.

Stevens 2009
xl
______________________________________________________________________
Travel Award
An international travel award of $500. To the annual scientific meeting of the American
Thoracic Society. 2007.
A conference travel award of $2500. From the Asthma Foundation of Western
Australia. 2007.

Stevens 2009
xli
______________________________________________________________________
Acknowledgements
I wish to thank my supervisor, Professor Stephen Stick, for his guidance and support.
and continuous flow of innovative ideas that have helped mould this project into a
unique addition to the scientific community.
A special thankyou to my supervisor Dr Anthony Kicic. Without his continued support I
could have not completed this thesis. With his vast knowledge and wisdom, Anthony
took me under his wing and provided continual advice to ensure I was always headed in
the right direction. He was there to pick me up when I was down and I am truly thankful
for his support of the past few years.
I wish to thank the members of the Respiratory Medicine team and the members of the
CCRF Laboratory who have come and gone over the years. A special thankyou to Dr
Erika Sutanto for her guidance and advice.

Stevens 2009
1
______________________________________________________________________
Chapter 1: Literature Review
1.1 The respiratory mucosa
The respiratory mucosa lines the conducting portion of the respiratory system and
consists of an epithelium and an underlying layer of loose connective tissue (Figure
1.1). The airway epithelium forms a physical barrier that protects underlying structures
from inhaled particles and molecules (Breeze and Wheeldon, 1977). The epithelium
also serves as an immunological barrier and expresses major histocompatibility
complex (MHC) class I and II molecules (Sertl et al., 1986, McWilliam et al., 1995).
Other important innate immune and homeostatic mechanisms include synchronised
ciliary beating, mucous secretion and ion transport (Welsh, 1987, Wanner et al., 1996).
There are 8 epithelial cells types recognised in the human airways, they can be
classified into 3 categories based on structural, biochemical and functional properties:
basal, ciliated and secretory (Spina, 1998).
The pseudostratified columnar ciliated epithelial cells comprise over 50% of all
epithelial cells (Spina, 1998) (Figure 1.2A). These cells may contain up to 200 cilia
per/cell (Breeze and Wheeldon, 1977, Gail and Lenfant, 1983) that measure 6µm to 3.6

Goblet Cells Ciliated Epithelial Cells
Fibroblasts
MucusGlands
Serous Gland Gland Duct
BV
Figure 1.1 Airway histology. Cross-section of a bronchial airway illustrating the
layer of fibroblast beneath the basal cells. Mucus glands, serous glands, gland ducts
and blood vessels (BV) are located in the area under the fibroblasts.
Adapted from Caceci, T. 2007.

Figure 1.2 Airway epithelium. (A) Typical respiratory epithelium consisting of
pseudostratified, ciliated, columnar epithelium with goblet cells on top of a bed of
basal stem cells. (B) Scanning electron micrograph of the bronchial airways
consisting of ciliated columnar epithelium with non-ciliated Goblet cells (G).
Adapted from (A) Caceci, T. 2007 and (B) Ross et al, 1995.
Goblet Cells Ciliated Epithelial Cells
Basal Cells
A
B
GG
GG
GG
GG
GG
GG

Stevens 2009
2
______________________________________________________________________
µm in length (Serafini and Michaelson, 1977). The primary role of these cells is the
directional transport of mucus from the lung to the throat (Harkema and Hotchkiss,
1991). Additionally, these cells are thought to play a role in the modulation of local
airway inflammation by the secretion of cytokines and granulocyte/macrophage colony
stimulating factor (Smith et al., 1990). Ciliated epithelial cells can arise from either
basal or secretory cells and were previously believed to be terminally differentiated
(Ayers and Jeffery, 1988).
Mucus cells or goblet cells represent approximately 20 – 30 % of the epithelial cells in
the proximal airways and are only occasionally seen in the bronchioles (Rhodin, 1966,
McDowell et al., 1978); Figure 1.2B). These cells may be able to differentiate into
ciliated epithelial cells and have the capacity to self-renew (Evans and Plopper, 1988).
Serous cells are similar to mucus cells in morphology but contain an electron-dense
cytoplasm and have been identified in the bronchioles of human subjects (Rogers et al.,
1993).
Although there may be some contribution from circulating progenitor cells, most
evidence supports the concept that progenitor cells (basal cells) distributed throughout
the airway epithelium are the source of the new epithelial cells, and that these cells have
the potential to differentiate to all of the cell types of the normal epithelium (Kim et al.,
2005, Rawlins and Hogan, 2006). These cells are abundant though out the epithelium,
although numbers decrease with airway size (Jeffery and Reid, 1975, Monkhouse and

Stevens 2009
3
______________________________________________________________________
Whimster, 1976). Basal cells play a role in the attachment of more superficial cells to
the basement membrane (Evans et al., 1989), this is due to basal cells being the only
cell firmly attached to the basement membrane (Evans and Plopper, 1988, Evans et al.,
1990, Harkema and Hotchkiss, 1991).
Clara cells are non-ciliated secretory cells found in both bronchial and bronchiolar
airways (Widdicombe and Pack, 1982, Plopper, 1983). The cells contain electron-dense
granules, thought to produce surfactant (Cutz and Conen, 1971, Thurlbeck and
Horsfield, 1980) as well as synthesizing proteins (Ebert et al., 1976, Widdicombe and
Pack, 1982) and lipids (Widdicombe and Pack, 1982). Recently, Hong et al provided
evidence for an important role of Clara cells as progenitor cells for both ciliated and
mucus–secreting cells (Hong et al., 2001).

Stevens 2009
4
______________________________________________________________________
1.2 Asthma
Asthma is a disease characterised by recurrent attacks of breathlessness and wheezing,
which vary in severity and frequency from person to person (World Health
Organisation, 2009). The word “asthma”, which literally means panting, was first
employed by Greek physicians of antiquity such as Hippocrates. In the second century
AD, Aretaus of Cappadocia gave the first description of asthma: “the symptoms of its
approach are heaviness of the chest; sluggish to one’s accustomed work, and to every
other exertion; difficulty of breathing in running on a steep road”, and acknowledged
the disease as potentially fatal (Smit and Lukacs, 2006). Henry Hyde Salter first
published On Asthma: Its Pathology and Treatment in 1860 where he differentiated
asthma from other causes of breathlessness as ‘paroxysmal dyspnoea of a peculiar
character with intervals of healthy respiration between attacks’. Following this
publication, 6 years later he described many of the characteristic features of asthma
based on his analysis of 150 unpublished cases (Salter 1866a, 1866b). These included
hyper-responsiveness to cold air, exercise and the ability of certain chemical or
mechanical irritants, particular kinds of air, and certain foods or wine to provoke
attacks. Sir William Osler confirmed these findings by describing various factors that
could exacerbate asthma; allergens, air pollutants, infections, exercise, weather, food
and emotions (Olser, 1892).

Stevens 2009
5
______________________________________________________________________
The past 30 years has witnessed a remarkable increase in our knowledge of the
physiopathology of asthma. Asthma is now accepted as a chronic inflammatory disorder
of the airways. Atopic asthma is an inflammatory process driven by the type 2 T helper
cells (Th2) with Interleukin-4 (IL-4) Interleukin-5 (IL-5) and Interleukin-13 (IL-13)
playing major roles. This inflammation is thought to be partly responsible for the
narrowing of the airways and other feature seen in asthma, however, chronic
inflammation is thought to cause tissue damage and structural changes to the airways in
asthmatics. These structural changes are collectively referred to as airway remodelling
(Figure 1.3).
1.2.1 Asthma progression into adulthood
Asthma can be broadly categorised depending a number of variables including; the time
of onset in a person’s life, the time of day symptoms persist, location of a person when
symptoms present and specific characteristics of the disease.
Childhood onset asthma develops during childhood and tends to demonstrate
pronounced variability over time and with treatment. This from of asthma is often
termed ‘extrinsic’ and is commonly associated with the presence of rhinitis and eczema.
Adult onset asthma starts in adult life and tends to be more persistent with many
exacerbations. In contrast to childhood asthma, there are often few known precipitants

A
B C
Figure 1.3 Asthmatic airways. (A)
Representation of respiratory airways in the
healthy (left) and asthmatic lung (right). Airways are characterised by airway
wall thickening resulting in narrowing of the lumen and marked increase in
resistance to airflow. (B) Histological slide of a healthy small
airway. (C)
Histological slide of an asthmatic airway illustrating the reduction in lumen size.
A. Adapted from Jeffery, PK. 2001

Stevens 2009
6
______________________________________________________________________
other than respiratory tract infections. This form of asthma is often termed ‘intrinsic’
and has a reduced association with atopy.
The term “growing out of” asthma has been used to describe symptomatic children who
improve during their teens. In previous longitudinal studies, it has been reported that
between 40% and 75% of children with asthma with have complete resolution of
symptoms by adulthood (Zeiger et al., 1999, Vonk et al., 2004, Taylor et al., 2005, de
Marco et al., 2006) and that the relapse of asthmatic symptoms, after a period of
remission, have been reported to vary between 12% to 35% (Sears et al., 2003, Vonk et
al., 2004, Taylor et al., 2005). The outlook or prognosis of childhood asthma is
dependent a number of risk factors: Children with episodic asthma (wheezing only with
infections) have an excellent chance of complete resolution of symptoms in adult life,
conversely, of those with persistent and severe asthma only 21% become free of asthma
symptoms with the onset of adulthood (Phelan et al., 2002, Robertson, 2002). In
addition to severity, duration of the disease has also been found to be associated with
progression into adulthood (Zeiger et al., 1999). Atopy has not been shown to be a risk
factor for progression of asthma into adulthood with regard to lung function (Van
Schayck et al., 1991) but it has been demonstrated to be associated with relapse of
asthma after remission (Taylor et al., 2005).

Stevens 2009
7
______________________________________________________________________
1.2.2 Burden of asthma and related deaths
Asthma is the most common chronic medical illness of childhood with a prevalence of
3-7% (Taylor and Newacheck, 1992, Weitzman et al., 1992). Among child patients
there is a considerable variation in the burden of asthmatic symptoms and is often
categorised based on the presentation of symptoms. Mild asthma is typically
characterised as symptomatic episodes that occur less than once per month, where the
symptoms to not interfere with daytime activity or sleep (Rees and Kanabar 2000).
Moderate asthma is defined as having symptoms that may be present for several days a
week and attacks occur more than once a month, but less than once a week. Severe
asthma is a less common condition characterised by the presence of troublesome
symptoms most days, frequent nocturnal attacks, disruption of daily activities such as
school attendance and participation in most outdoor activities (Rees and Kanabar 2000).
The level of symptoms is strongly associated with a decreased quality of life
(Warschburger et al., 2003, Merikallio et al., 2005). From a survey of 2159 children
aged 11-15 years there was an overall decreased quality of life with the presence of
asthmatic symptoms (Merikallio et al., 2005) and recently it has been reported that an
anxiety or depressive disorder is highly associated with the presence of more severe
asthma symptoms (Richardson et al., 2006). In addition to the burden on patients,
asthma often requires treatments, hospitalisation and emergency department visits
placing increasing burden on the healthcare system and social cost (Kenny et al., 2005,
Simonella et al., 2006, Watson et al., 2007). In the 2000–01 financial year, health

Stevens 2009
8
______________________________________________________________________
expenditure on asthma was $693 million. This was 1.4% of total health expenditure in
that year (AIHW, 2005).
Thankfully, deaths from asthma are a relatively rare occurrence. The mortality rate of
asthma has a direct relationship with age, indicating increasing age as a risk factor for
asthma death (Sidebotham and Roche, 2003). Although asthma mortality increases with
disease severity, appropriate diagnosis and management of severe asthma can reduce the
risk of dying from asthma (Sidebotham and Roche, 2003). Lack of prescription of
inhaled steroids (Guite et al., 1999), along with inadequate follow-up, absence of a
written management plan and the prescription of drugs contraindicated in asthma (Burr
et al., 1999), are associated with an increased risk of mortality.
1.2.3 Atopy and risk factors for asthma
There have been innumerable epidemiological studies that have investigated
associations with asthma. For example, a family history increases the chances of a
person developing asthma by the age of 50 years by 10 fold if there is a first-degree
relative with asthma (Rees and Kanadbar 2000). The single strongest risk factor for the
development of asthma is the presence of atopy. Atopy, a genetic predisposition toward
the development of immediate hypersensitivity reactions against common
environmental antigens is characterised by raised IgE levels and underlies allergic

Stevens 2009
9
______________________________________________________________________
conditions such as asthma, rhinoconjunctivitis and eczema. Atopic individuals have a 20
fold increased risk of developing asthma when compared to healthy non-atopic
individuals (Rees and Kanadbar 2000). Sensitisation to allergens usually starts at the
mucosal or dermal surfaces of the innate immune system where the allergen is taken up
by Antigen-Presenting Cells (APC) including dendritic cell and Langerhans cells. The
allergen is then processed and peptides are selectively presented to naive T cells in local
lymphoid tissue. The T cells then multiply and differentiate in to Th2 cells. This process
leads to the stimulation of cytokines such as IL-3, IL-4, IL-5 and IL-13 which stimulate
Immunoglobulin E (IgE) production, and increase the number of eosinophils, mast cells
and basophils.
Allergen-induced cross-linking of specific IgE bound to the surface of mast cells
through high affinity receptor is, responsible for the immediate symptoms of the acute
allergic response. The binding of allergen to IgE results in the release of numerous
granule-associated preformed mediators, which along with the release of a variety of
chemokines and cytokines, aids in the recruitment and activation of secondary effectors
such as eosinophils and the aspects of late phase reaction. In genetically-susceptible
individuals, the presence of environmental allergens causes a bias toward the Th2 arm
of the immune response and a reduced Th1 response, which is stimulated by the
exposure of bacterial and viral antigens and produce Interferon-γ (INF- γ) and IL-2.
Additionally, distinctive advances in hygiene in the Western World has lead to a
reduction to the exposure of bacterial and viral pathogens during childhood. The result

Stevens 2009
10
______________________________________________________________________
has been the insufficient stimulation of Th1 cells, which in turn cannot counterbalance
the expansion of Th2 cells and results in a predisposition to allergy. This observation
has been termed the “Hygiene Hypothesis” (Strachan, 1989).
Dust mites have been recognised as an independent risk factor for asthma (Platts-Mills
and Chapman, 1987, Lau et al., 2000, Barbato et al., 2006) and have received a great
deal of attention over the past 20 years. Dust mites live in bedding, carpets, upholstery
and other textiles in homes, where they feed on shed skin, fungi, bacteria, organic
detritus and various human excretions and secretions (Colloff and Stewart, 1997). Air
pollution is thought to play a major role in the increasing incidence of asthma (Richards,
1990, Molfino et al., 1992, Maynard, 1993, Devalia et al., 1994). Sulphur Dioxide is a
water-soluble gas commonly emitted into ambient air by coal-fired power plants and
refineries that has been shown to adversely effect both upper and lower respiratory
tracts and found especially hazardous by asthmatics (Koenig et al., 1980, Koenig et al.,
1981), Ozone is an air pollutant that has been linked to airway inflammation (Koren,
1995, Koren and Bromberg, 1995, Koren, 1997), neutrophilic inflammation (Basha et
al., 1994, Scannell et al., 1996, Balmes et al., 1997), increased bronchoconstriction
(Jorres et al., 1996, Kehrl et al., 1999) and enhancement of late-phase response
(Bascom et al., 1990, Peden et al., 1995). Finally, Particulate Matter (PM), which are
tiny particles of solid or liquid suspended in a gas, have been associated with increased
disease severity in asthma (Pope, 1989, Pope, 1991, Hoek et al., 1998).
Stevens 2009
11
______________________________________________________________________
Food allergies tend to cause eczema and gastrointestinal symptoms more than asthma
but numerous cases have been associated with asthmatic symptoms (Oehling and Baena
Cagnani, 1980, Onorato et al., 1986, Novembre et al., 1988, Bock and Atkins, 1990,
Woods et al., 2002). Drugs are also known to trigger asthma with two main groups
being β-blocking agents, that that have been shown to induce bronchoconstriction when
given to asthmatic patients (Anderson et al., 1979), and prostaglandin synthetase
inhibitors, which have been known to provoke severe narrowing of the airways in
asthmatic adults (Carnovali and Ohnmeiss, 1981).
Climatic conditions such as cold air, air pressure and humidity associated with
thunderstorms are also risk factors in asthma (Santic et al., 2002). Thunderstorms attract
grass pollen into the cloud base, thereby enhancing the chance that pollen rupture. Also
these conditions can increase the concentration of fungal and pollen spores at ground
level. Psychological factors, such as stress, anxiety, sadness, suggestion and emotion, on
there own do not produce asthma in subjects without underlying susceptibility (Lehrer
et al., 2002), but in the laboratory, emotional factors and expectation have been shown
to influence the bronchoconstrictor responses to various stimuli (Ritz et al., 2000).

Stevens 2009
12
______________________________________________________________________
1.2.4 Respiratory infections as triggers of asthma
The most common trigger of asthma exacerbations is the presence of a viral respiratory
infection; viral infections of the respiratory tract have been associated the induction of
acute asthma exacerbations in 80-85% children (Johnston et al., 1995, Freymuth et al.,
1999, Rakes et al., 1999, Chauhan et al., 2003) and 75-80% of adults (Wark et al.,
2002, Grissell et al., 2005). The specific pathogens that are most often responsible are
respiratory syncytial virus (RSV), rhinoviruses (RV), parainfluenza viruses (PIVs) and
metapneumovirus and influenza viruses (Heymann et al., 2004, Jartti et al., 2004).
Stevens 2009
13
______________________________________________________________________
1.3 Role of airway epithelium in asthma
As previously discussed, the muco-ciliated columnar epithelial cells, along with
intracellular adhesion complexes, provide an impermeable physical barrier to the
environment (Sparrow et al., 1995, Churg, 1996). Through extensive research the
epithelium has emerged as a prominent component of airway function, and a general
consensus has been reached that the epithelium is essential in the regulation on many
airway functions (Holgate, 1998b, Holgate et al., 2000, Knight, 2001). The epithelium
is responsible for the production and secretion of an enormously diverse number of
compounds either spontaneously or following stimulation. These compounds are
essential for maintaining optimal airway function and the altered secretion by the
epithelium has been associated with the development of asthma.
1.3.1 Lipid and peptide mediators
Cyclooxygenase, lipooxygenase and monoxygenase are three enzymes responsible for
the production of a variety of compounds from arachidonic acid (Holtzman, 1992).
Airway epithelial cells (AECs) possess the ability to convert arachidonic acid to a
variety of biological active products that can effect and control airway function and
inflammation. Endothelins are also secreted by epithelial cells and act as potent
constrictors of both vascular and airway smooth muscles (Uchida et al., 1988). Three

Stevens 2009
14
______________________________________________________________________
closely related peptide have been described (Sakurai et al., 1992), that have been termed
endothelins 1, 2 and 3. Bronchoalveolar lavage (BAL) fluid from asthmatic patients has
revealed elevated levels of both endothelin 1 and 3 (Mattoli et al., 1991b). The healing
and repair of the epithelium involves initial migration of epithelial cells, and subsequent
proliferation. Endothelin-1 has been demonstrated to potentially lead to inhibition of
this process (Dosanjh and Zuraw, 2003). This is of significance as repair of the
bronchial epithelium is essential in maintaining the protection the epithelium provides
the airway’s underlying structures from foreign agents.
1.3.2 Catabolic enzymes/inhibitors
The epithelium can reduce the effects of mediators on airway smooth muscle, glands,
nerves and vessels by actively degrading them. Neutral metalloendopeptidase (NEP) is
one of the best described examples of the epithelium’s degradative capacity. One of
NEPs major responsibilities is the breakdown of kinins (tachykinins and bradykinin),
These compounds are potent bronchoconstrictor, vasoactive and pro-inflammatory
substances which play an essential role in the maintenance of the airways (Joos et al.,
2000). Deficiencies in NEP have been described in children (Muraki et al., 1998) and
adults (Tudoric et al., 2000) with asthma and are suggested to have a role in asthma
pathogenesis.

Stevens 2009
15
______________________________________________________________________
1.3.3 Cytokines
Cytokines have been demonstrated to possess a central role in the pathogenesis of the
inflammation observed in asthma (Kelley, 1990). Epithelial cells have been shown to
secrete IL-1, IL-6, IL-8 (Cromwell et al., 1992, Marini et al., 1992), IL-10, IL-11 and
Tissue Necrosis Factor (TNF)-α (Cromwell et al., 1992), though there is still some
debate as to which particular cytokines are secreted.
1.3.3.1 IL-8
Increased IL-8 synthesis has been observed in the bronchial epithelial cells of asthmatic
patients (Marini et al., 1992, Mattoli et al., 1992, Wang et al., 1994, Hollander et al.,
2007). IL-8 functions as a chemoattractant for neutrophils (Leonard and Yoshimura,
1990) and some T-lymphocytes (Larsen et al., 1989, Taub et al., 1996) and has the
potential to be chemotactic for eosinophils that have been exposed to Granulocyte-
macrophage colony-stimulating factor (GM-CSF) or IL-13 (Warringa et al., 1991).
Eosinophilic (Norzila et al., 2000, Chang et al., 2002) or a mixed eosinophil/neutrophil
(Norzila et al., 2000) airway inflammation is a common feature of asthma exacerbations
in children (Lovett et al., 2007).

Stevens 2009
16
______________________________________________________________________
1.3.3.2 IL-6
IL-6 levels have been demonstrated to be increased in BAL fluid from asthmatic
patients (Mattoli et al., 1991a), and increased mRNA expression and protein release has
been shown in bronchial biopsies from asthmatic adults (Marini et al., 1992, Mattoli et
al., 1992). IL-6 is a multifunctional cytokine and plays a central role as a differentiation
and growth factor of haematopoietic precursor cells, B cells, T cells, keratinocytes,
neuronal cells, osteoclasts, and endothelial cells (Bauer and Herrmann, 1991, Akira et
al., 1993) and is involved in the activation and proliferation of T-cells (Kishimoto,
1989). In addition to its role in mediating airway inflammation, the increased release of
IL-6 observed in asthma has been postulated to be part of a normal healing response in
the attempt to normalise airway function (Dicosmo et al., 1994, Polito & Proud, 1997).
1.3.3.3 IL-1
Genes of the IL-1 family encode three different peptides, IL-1α, IL-1β, and IL-1Ra,
respectively. IL-1 operates through the Interleukin-1 receptor (IL-1RI), and is involved
in airway inflammation in asthmatic subjects, whereas IL-1Ra appears to be a specific
competitive inhibitor of IL-1. All genes are on chromosome 2q12-21 (Copeland et al.,
1991, Nothwang et al., 1997) where genome wide searches have identified linkage for
asthma (C.S.G.A, 1997, Wjst et al., 1999). Mao and colleagues demonstrated that the

Stevens 2009
17
______________________________________________________________________
A2 allele of the interleukin-1 receptor antagonist (IL1RN; encoding IL-1Ra) is
associated with non-atopic asthma and that both atopic and non-atopic asthmatics with
the A2 allele had significantly lower serum IL-1Ra (Mao et al., 2000). These findings
suggest that dysregulation of IL-1β/IL-1Ra, probably due to interaction between
epithelium and immuno-competent cells in the airway, is important in asthma
inflammation. IL-1β
1.3.4 Chemokines
Chemotactic cytokines or chemokines are a class leukocyte chemoattractants secreted
by many immune and non-immune cells. They have been divided into four groups
based on their molecular structure and the position of the first two cysteine residues; the
CC and CXC (X= amino acid) and the less described C and CX3C families. So far,
28CC (CCL), 16 CXC (CXCL), 2C (CL) and 1 CX3C (CX3CL) chemokine ligands
have been identified (Smit and Lukacs, 2006).
1.3.4.1 Regulated upon activation, normal T-cell expressed, and secreted (RANTES)
RANTES (regulated on activation, normally T-cell expressed and secreted) or CCL5
production by unstimulated epithelial cells has been shown to be very low, however
following stimulation with IL-1, TNF-α and IFN-γ a marked increase in RANTES

Stevens 2009
18
______________________________________________________________________
production has been observed (Kwon et al., 1995, Stellato et al., 1995). Moreover,
elevated levels of this chemokine have been observed in the BAL fluid from allergic
asthmatics when compared to their healthy counterparts (Alam et al., 1996). Also,
following RANTES receptor knockout in mice, airway hyper-responsiveness was
significantly lower and inflammation was reduced (Schuh et al., 2002) thereby
providing further evidence for an important role of RANTES in asthma development
and progression.
1.3.5 Reactive oxygen species
1.3.5.1 Nitric oxide
Nitric Oxide (NO) synthesized by airway epithelium may be important in the regulation
of airway inflammation and reactivity (Gaston et al., 1994, Michel and Feron, 1997,
Watkins et al., 1997). Ricciardolo and colleagues concluded that bronchoconstriction,
after bradykinin inhalation, is greatly inhibited by the formation of NO in airways of
asthmatic patients and that NO could have a broncho-protective role in asthma
(Ricciardolo et al., 1996). The formation of NO occurs via the coenzyme nitric oxide
synthase (NOS), which exist in three isoforms, the constitutive (cNOS), neuronal
(nNOS) and the inducible (iNOS) form. It has been demonstrated that both the cNOS
and iNOS forms can be produced by AECs (Asano et al., 1994, Shaul et al., 1994, Lane

Stevens 2009
19
______________________________________________________________________
et al., 2004). It has been reported that following exposure to inflammatory cytokines
and oxidants there is increased expression of iNOS in the airway epithelium of
asthmatics, indicating a role in the pathogenesis of the condition (Watkins et al., 1997,
Folkerts et al., 2001). Adding to this, it has been reported that patients with asthma have
a marked increase in exhaled NO (Alving et al., 1993, Kharitonov et al., 1995).
1.3.6 Growth factors
Growth Factors are pleiotropic molecules produced ubiquitously, which modulate the
proliferation of a range of target cells and have a major role maintaining homoeostasis
within the airway epithelial environement and have been linked to asthma development
(Amishima et al., 1998, Puddicombe et al., 2000). Although it is important to note that
the activities of growth factors are not limited to cell proliferation, they also include
changes in migration, cell shape and cytoskeleton reorganisation. A clear definition of
growth factors from cytokines is still lacking. Many cytokines, either directly or
indirectly, modulate the growth of some cells. In this review, GM-CSF, granulocyte-
colony stimulating factor (G-CSF), colony stimulating factor (CSF) -1 and Macrophage
colony-stimulating factor (M-CSF) have been grouped as growth factors rather than
cytokines.
Stevens 2009
20
______________________________________________________________________
1.3.6.1 Epidermal growth factor
Epidermal growth factor (EGF) has been demonstrated to directly influence AECs
through the regulation of cell migration, proliferation and differentiation as well as
enhancing several phases of epithelial repair (Takeyama et al., 1999, Sweeney et al.,
2001). Investigations have reported an up-regulation of the epidermal growth factor
receptor (EGFR) in the airways of asthmatics suggesting a role of EGF in epithelial
proliferation and repair (Amishima et al., 1998, Puddicombe et al., 2000). Interestingly,
the expression of EGFR in vivo does not correlate with cell proliferation (Polosa et al.,
1999, Puddicombe et al., 2000), and it has been suggested that proliferation may be
related to increased expression of the cyclin-dependent-kinase inhibitor p21
(Puddicombe et al., 2003).
1.3.6.2 Transforming growth factor β
Transforming growth factor β (TGF-β) signal transduction is mediated through a
heteromeric complex of Type I and Type II transmembrane serine/threonine receptor
kinases (Attisano et al., 1993, Franzen et al., 1993). TGF-β is thought to play a major
role in maintaining homoeostasis in epithelial cells. It has been demonstrated to have
anti-proliferative and anti-apoptotic activity via negative regulation of EGF (Boland et
al., 1996, Wang et al., 1996). Howat and colleagues recently demonstrated that

Stevens 2009
21
______________________________________________________________________
conversion of latent to active TGF-β1 and TGF-β2 during in vitro epithelial wound
repair occurs quickly and that TGF-β1 accelerates epithelial repair. The findings suggest
that a faster repair can be advantageous, by preventing access of environmental agents
to the internal structures of the airways (Howat et al., 2002).
1.3.7 Adhesion molecules
Adhesion molecules play a central part in the interaction of leucocytes with physical
barriers such as the epithelium of the airways and have a central role in asthmatic
inflammation (Broide and Sriramarao, 2001, Wardlaw, 2001, Barthel et al., 2007). They
are directly involved in the transmigration of leucocytes across the respiratory epithelial
cell wall, which is essential for the accumulation of cells at the site of inflammation.
Unfortunately, the complete spectrum of molecules involved is yet to be elucidated.
There are four main families of adhesion molecules: the immunoglobulin superfamily,
the integrins, the selectins and the cadherins. A comprehensive explanation of the role
of adhesion molecules is beyond the scope of this review and therefore refer the reader
to an eminent review article specifically dealing with these topics (Springer, 1990).

Stevens 2009
22
______________________________________________________________________
1.3.7.1 Intercellular adhesion molecule-1
Immunoglobulin superfamily is characterised by the presence of immunoglobulin-like
domains in the extracellular portion of the molecule (Williams and Barclay, 1988).
Wegner et al first demonstrated the importance of Intercellular adhesion molecule-1
(ICAM-1) in the pathogenesis of asthma using a nonhuman primate and reported
increased expression in epithelial cells following antigen inhalation (Wegner et al.,
1990). Increased expression of ICAM-1 in the bronchial epithelium of asthmatic
subjects has been demonstrated (Manolitsas et al., 1994), as has the correlation of
increased expression with asthma severity (Vignola et al., 1993).
1.3.7.2 Integrins
Integrins are highly-disulphide linked, noncovanlently associated hetrodimers
consisting of α and β subunits. β1- integrins, α2β1, α3β1, and α6β1 are all expressed on
epithelial cells (Albelda, 1991, Manolitsas et al., 1994). The β1- integrins are thought to
be involved in anchorage to structural proteins of the basement membrane, such as
collagen, fibronectin and laminin. Over expression of integrins has been demonstrated
on the surface of peripheral blood eosinophils of asthmatic subjects (Bazan-Socha et al.,
2006). They have been suggested to have a role in the development of asthmatic
inflammation through the arrest of eosinophils on endothelium, migration through

Stevens 2009
23
______________________________________________________________________
endothelium and the underlying basement membrane, and traversing of bronchial
epithelium into the airway lumen (Broide and Sriramarao, 2001, Wardlaw, 2001,
Barthel et al., 2007).
1.3.7.3 Selectins
Selectins are characterised by a N-terminal lectin domain, an epidermal growth factor
(EGF) domain, and a series of complement-regulatory domains (Brandley et al., 1990,
Rosen, 1990, Springer and Lasky, 1991, Lasky, 1992, Bevilacqua and Nelson, 1993)
and have been demonstrated to play a role in leukocyte recruitment (Springer, 1995).
Studies have hypothesised a role of selectins in the inflammation observed in asthma.
Eosinophils and neutrophils from allergic-asthmatic subjects showed a 3-fold increase
in recruitment on P-selectin compared with that seen in healthy control subjects (Dang
et al., 2002), this was due to increased expression of P-selectin glycoprotein ligand-1
(PSGL-1) on these cells.
1.3.7.4 Cadherins
Cadherins are characterised as calcium-dependent cell-cell adhesion (Takeichi, 1991)
and structurally consist of single polypeptide chains. This family is involved in the
cellular architecture and is composed of cell-cell adhesion glycoproteins including E

Stevens 2009
24
______________________________________________________________________
(epithelial)-, N (nerve) - and P (placenta)-cadherin. Animal studies have suggested that
airway inflammation might decrease E-cadherin in the epithelium, and loss of E-
cadherin might play a role in the damage of the airway epithelium seen in patients with
asthma (Goto et al., 2000, Evans et al., 2002). Sputum sE-cadherin has been
demonstrated to correlate with decreases in forced expiratory volume (FEV1) and
duration of asthma (Masuyama et al., 2003). It was hypothesised from these findings
that the relationship between sputum sE-cadherin levels and asthma severity might
indicate persistent epithelial damage in symptomatic asthma.
1.3.8 Immunoregulation
Foreign antigens, including allergens or pathogens, that enter the body are taken up by
antigen-presenting cells (APC), which process the antigens and present peptides on the
major histocompatibility complex (MHC) class II molecules on their cell surface. The
T-helper lymphocytes are activated by interaction of the T-cell receptor (TCR) with the
peptide-MHC II complex on APC. Therefore, the class II MHC antigens function to
regulate the immune response by modulating the interaction between T-helper cells and
foreign antigenic determinants. AECs express MHC class II antigens throughout the
bronchial tree (Glanville et al., 1989), although healthy epithelium have relatively low
expression levels. However, increased expression has been reported in the airways of
asthmatic patients compared to healthy controls (Vignola et al., 1993, Vignola et al.,

Stevens 2009
25
______________________________________________________________________
1994). This supports the concept that the bronchial epithelium of asthmatics may act as
antigen presenting cells in their association with lymphocytes (Polito and Proud, 1997).
Kalb and colleagues reported the ability of AECs to stimulate the proliferation of CD4
and CD8 T-cells in mixed lymphocyte cultures, supporting a role of epithelial cells as
immune accessory cells (Kalb et al., 1991).

Stevens 2009
26
______________________________________________________________________
1.4 Epithelial damage and repair
The bronchial epithelium forms a highly regulated and almost impermeable barrier
through the formation of tight junctions (Sparrow et al., 1995, Churg, 1996). Epithelial
fragility or vulnerability in asthmatics has and continues to be a topic of much
investigation. Epithelial loss has been reported in adults with asthma (Jeffery et al.,
1989, Montefort et al., 1992, Montefort et al., 1993) but it has only been recently that
studies have demonstrated epithelial loss children with mild asthma (Barbato et al.,
2006). Epithelial loss or damage has been linked to hyper-responsiveness and
inflammation of the airways (Amin et al., 2000) and epithelial injury and loss have been
shown to trigger changes that may lead to airway remodelling changes (Purchelle et al.,
2006). Collectively, these data suggest that changes in the structure and function of the
epithelium may be induced by environmental exposure in genetically susceptible
subjects and represent primary pivotal events that occur early in the pathogenesis of
asthma. Conversely, loss of the epithelium may not represent true asthmatic pathology
as these observations may instead be an artefact of tissue sampling and handling (Fahy,
2001). Thus, the true functional role of the epithelium in asthmatic disease progression
remains to be elucidated.
A locally-enhanced chemotactic signal for and activity of neutrophils during asthma
exacerbations in paediatric asthma has been linked with epithelial damage (Yoshihara et

Stevens 2009
27
______________________________________________________________________
al., 2006). Epithelial impairment has been associated with pulmonary leukocyte
interaction (Bienkowska-Haba et al., 2006). Other explanations for epithelial loss have
involved studies investigating the role of desmosomes in epithelial shedding.
Attachment of columnar epithelial cells to the basal lamina has been demonstrated to be
weakened in asthmatics (Shebani et al., 2005) and recently it has been reported that the
relative length of columnar cell desmosomes was significantly reduced in asthmatics
(Shahana et al., 2006). Together, these data support the hypothesis that bronchial
epithelial cells in asthmatics are inherently fragile and more prone to damage or
shedding.
Epithelial loss and the subsequent exposure of underlying structures to foreign particles
may contribute to the oedema, bronchoconstriction and inflammation observed in
asthma. Therefore, it is essential that damage to the airway epithelium is successfully
repaired to prevent further complications. Much of the understanding of the
regeneration of airway epithelium in vivo after injury was gained from studies by
Keenan and colleagues in the early 1980’s (Keenan et al., 1982). The immediate
response to injury of the bronchial epithelium involves migration of epithelial cells
adjacent to the wound to form a temporary squamous barrier consisting of poorly
differentiated and highly spread cells often associated with inflammatory cells (Keenan
et al., 1982, Erjefalt et al., 1995). This transient repair is likely to provide some barrier
function, however the cells are unlikely to perform normal secretory functions discussed
above. A period of cell proliferation and differentiation follows until complete

Stevens 2009
28
______________________________________________________________________
restoration of normal epithelial function is achieved. Each of these stages of epithelial
repair, from the initial spreading of cells to differentiation, can be regulated by both
consititutive and structural factors and by inflammatory and environment factors.
There is now general consensus that the airway epithelium of asthmatics is abnormal,
although, it has not been clear whether the abnormalities are intrinsic in asthma or
secondary to factors that initiate or trigger inflammation. Recently it has been
demonstrated that there are significant intrinsic biochemical and functional differences
between healthy and asthmatic paediatric airway epithelial cells (Kicic et al., 2006) and
there is emerging evidence that the asthmatic epithelium responds inappropriately to
challenge and displays signs of dysregulated repair (Hackett and Knight, 2007).
1.5 Airway remodelling
As discussed above, the airway epithelium has a multifunctional role in airway
homeostasis. It is actively engaged in communicating with cells of the immune and
inflammatory systems and is responsible for secreting numerous “cytoprotective”
molecules to ensure optimal airway function. Functional abnormalities of the airway
epithelium or damage may result in dysregulation of the respiratory airways resulting in
airway remodelling.

Stevens 2009
29
______________________________________________________________________
Airway remodelling is a term that indicates changes in the composition, quantity and
organisation of the cellular and molecular components of the airway wall (Bai and
Knight, 2005). Other than epithelial damage, these include alterations in mucus-
secreting structures, increase in smooth muscle mass, increased vascularity, matrix
abnormalities and thickening of the airway wall (Figure 1.4).
1.5.1 Alterations in mucus-secreting structures
Mucus glands are distributed throughout the airways of asthmatic patients in the form of
goblet cells and are present in peripheral bronchioles where normally they are absent.
Dunnill et al first demonstrated that these cells are considerably enlarged in asthmatic
patients compared to healthy subjects (Dunnill et al., 1969). Hyperplasia of the mucus-
secreting goblet cells in the airways of asthmatics has been well documented, although
interestingly there has been no association between the degree of hyperplasia and
asthma severity (Ordonez et al., 2001, Groneberg et al., 2002). The mucin monomers
comprise a highly glycosylated linear peptide sequence, termed apomucin, which is
encoded by specific mucin genes. In asthmatic airways Mucin 2 and Mucin 5B become
significantly expressed by goblet cells compared to normal airway where Mucin 5B is
found at low levels and Mucin 2 is undetectable (Morcillo and Cortijo, 2006).

Figure 1.4 Asthma remodelling. (A-B) Normal airways from non-asthmatic
patients demonstrating intact epithelium and no remodelling changes. (C-E) Mild
to moderate asthmatic airways and (F-H) severe asthma airways characterised by
loss of the epithelium, thickening on the basement membrane, increased smooth
muscle mass and an increase in goblet cells.
C. Adapted from Jeffery, PK. 2001. D. Adapted form Hamid, Q. J, 2003. B and G. Adapted form Hamid, Q. J, 2003. F
Adapted from
Pepe, C et al, 2005. A and H. Adapted from
Bousquet, J et al, 2000;161:1720–1745.
AA BB
CC DD EE
GG HHFF

Stevens 2009
30
______________________________________________________________________
1.5.2 Increase in smooth muscle mass
Increases in airway smooth muscle (ASM) mass in asthma have been well documented
and demonstrated by many investigators. Smooth muscle hypertrophy, along with
accumulation of fibroblasts was thought to be indicative of severe asthma (Benayoun et
al., 2003). Conversely, Woodruff et al demonstrated that the volume of airway small
muscle was increased between 50-83% in biopsy samples from cases of moderately
severe asthma and that this was a result of hyperplasia and not hypertrophy. This
increase in size was also associated with no change in gene expression (Woodruff et al.,
2004). To better understand the mechanism involved with increased smooth muscle, a
number of groups are now investigating cultures of smooth muscle cells and
myofibroblasts obtained from asthmatic and non-asthmatic cases. Roth et al have
demonstrated that smooth muscles cells cultured from biopsies from patients with
asthma lacked a transcription factor (C/EBPα) that inhibits proliferation (Roth et al.,
2004) and recently Ramos-Barbon et al used adoptive transfer of CD4(+) T cells from
sensitized rats to induced an increase in proliferation and inhibition of apoptosis of
airway myocytes in naive recipients upon repeated antigen challenge This resulted in an
increase in ASM mass, demonstrating that CD4(+) T cells, which are central to chronic
airway inflammation, drive ASM remodelling in experimental asthma (Ramos-Barbon
et al., 2005). Five main mechanisms are thought to be responsible for the increase in
smooth muscle mass observed in asthma: 1. Hyperplasia; In situ increase in the number
of cells due to growth factors. 2. Hypertrophy; Increase in the size if cells due to

Stevens 2009
31
______________________________________________________________________
mechanical stress or growth factors. 3. Constitutional; more muscle to begin with, due
to genetic, prenatal or early life influences. 4. Apoptosis; Decreased rate resulting in
prolonged cell life. 5. Recruitment/Differentiation; Stem cells from circulation or
transformation of mesenchymal cells (Bai and Knight, 2005).
1.5.3 Increased vascularity
There is documented evidence for increased vascularity (angiogenesis) and vascular
remodelling in many inflammatory diseases, including asthma (Chetta et al., 2003,
Baluk et al., 2004). Li and Wilson report an increase in both the density and size in the
blood vessels of the airways asthmatics (Li and Wilson, 1997), whereas some reports
have suggested that there is an increase in the size and not the density of vessels in
asthma (Kuwano et al., 1993) or that an increase in blood vessel density is in proportion
to the increased thickness of the airway walls (Carroll et al., 1997). Hashimoto and
colleagues have demonstrated that patients with moderate asthma showed a greater
increase in vascularity than those with mild asthma. In addition, they reported that the
number of vessels in both the medium and small airways in patients with asthma was
significantly increased compared to those in patients with Chronic Obstructive
Pulmonary Disease (COPD) and control subjects, and the percentage of vascularity was
significantly increased in the medium airways in asthma patients but not the small
airways. The observed enhanced vascularity in the inner area of the medium airways,

Stevens 2009
32
______________________________________________________________________
but not in the small airways, was suggested to contribute to airflow limitation in asthma
patients (Hashimoto et al., 2005).
1.5.4 Matrix abnormalities
One of the earliest remodelling changes observed in asthmatics is the thickening of the
basement membrane (lamina reticularis) (Barbato et al., 2003, Payne et al., 2003). The
thickness of the lamina reticularis has been clearly demonstrated to correlate with
disease severity (Chetta et al., 1997) but a clear relation to disease duration has not been
forthcoming (Bai et al., 2000). The presence of an abnormal superficial elastin fibre
network in asthmatics has been well documented. With the use of electron microscopy,
Bousquet et al reported evidence of fragmented or even absent elastic (Bousquet et al.,
1996) suggesting an abnormal elastolytic process occurring in asthmatic patients.
Adding to this, Mauad et al reported that in fatal asthmatic cases there was a decrease
in elastin in the immediate subepithelial layer with increased but fragmented elastin at a
deeper submucosal level (Mauad et al., 1999). A submucosal network of elastic fibres
in a collagen and myofibroblast matrix form discrete longitudinal bundles (LB) in the
bronchial tree. The LB may affect airway function by altering the mechanical properties
of the airway wall or by changing the folding behaviour of the airway mucosa. In
asthmatics, these LB appear to be hypertrophied, as a result increasing the amount of
collagen and myofibroblast matrix deposition. Therefore, it appears that increased

Stevens 2009
33
______________________________________________________________________
elastolysis in asthmatic patients is part of a more complex process that may effect
airway function (Carroll et al., 2000).
1.5.5 Thickening of the airway wall
Thickening of the airway wall in asthma has been demonstrated to be directly related to
disease severity (Carroll et al., 1993, Kuwano et al., 1993) and the duration of asthma
(Bai et al., 2000). Regulation of airway wall thickness is controlled by the plasmin
activation system (PAS) and matrix metalloproteinases.
1.5.5.1 Plasminogen activator inhibitor-1
Plasminogen activator inhibitor (PAI)-1 is the major inhibitor of the PAS. The
activation of this system results in the conversion of proenzyme plasminogen into the
active serine protease plasmin. In turn, plasmin levels are tightly controlled by two
activators: tissue plasminogen activator (t-PA) and urokinase plasminogen activator (u-
PA) (Vassalli et al., 1991). Plasmin has the ability to degrade most protein components
of the ECM, either directly by removing glycoproteins (Montgomery et al., 1993) or
indirectly via the activation of matrix metalloproteinases (MMPs) (Werb et al., 1980,
Moscatelli and Rifkin, 1988, Matrisian, 1990, Kleiner and Stetler-Stevenson, 1993).
Plasmin also inhibits MMP inactivation by tissue inhibitors of metalloproteinase

Stevens 2009
34
______________________________________________________________________
(TIMP). Both PAI-1 and PAI-2 play an essential role in regulating plasmin production
via the inhibition of both forms of the plasminogen activators (Kruithof, 1988),
although PAI-2 exhibits an inhibitory action that is 20-100 fold less than PAI-1
(Kruithof et al., 1986). In addition to reducing the production of plasmin, it has been
reported that PAI-1 blocks the actions of MMPs (Cho et al., 2000).
Recent investigations have suggested that elevated PAI-1 expression levels may play a
role in the pathogenesis of airway remodelling in asthma (Cho et al., 2001, Buckova et
al., 2002, Oh et al., 2002). The role of PAI-1 in airway pathology has been investigated
by genetically manipulating the gene in mice. These data show that over expression of
PAI-1 results in airway ECM deposition and severe lung injury, whereas PAI-1
deficient mice are protected from fibrosis (Carmeliet et al., 1993a, Carmeliet et al.,
1993b, Barazzone et al., 1996, Eitzman et al., 1996, Oh et al., 2002). Despite the
advances in the understanding of the role of PAI-1 in asthma and airway remodelling,
there is a general lack of functional studies in humans or human tissue with the majority
of functional studies being performed in animals or commercial cell lines.
As discussed above, genetic and environmental factors appear to have a significant role
in the development of asthma (Holgate, 1998a), however acute exacerbations of the
disease are responsible for the majority of morbidity and burden of disease. Viral
infections play a significant role in the triggering of asthma exacerbations; Johnston and

Stevens 2009
35
______________________________________________________________________
colleagues reported the presence of viruses in 80 to 85% children with asthmatic
exacerbations. (Johnston et al., 1995).
1.5.5.2 Matrix metalloproteinases
Matrix metalloproteinases (MMPs), a family of zinc- and calcium-dependent enzymes,
are responsible for the degradation of extracellular matrix (ECM) (Woessner, 1991).
Several subclasses of MMPs have been identified based on their substrate specificity;
collagenases, gelatinases, stromelysins and membrane-type MMPs (MT-MMPs)
(Mautino et al., 1999). Table 1.1 summaries the major MMPs identified in each
subclass as well as their alternative nomenclature, substrate specificity and cell origin.
A variety of cells are responsible for the secretion of the zymogen forms of MMPs (pro-
MMPs) into the ECM and subsequent activation of pro-MMPs occurs via the removal
of a propeptide domain blocking access to the catalytic site. Proteases such as plasmin,
trypsin, plasminogen activators, elastase and other MMPs are responsible for MMP
activation.
Inhibition of MMP activity is regulated by α-2 macroglobulin and a family of specific
inhibitors named tissue inhibitors of MMPs (TIMPs). Inhibition of MMPs by TIMPs
occurs as a result of 1:1 stoichiometric binding to the catalytic site of the MMPs
resulting in reduced photolytic activity. Four structurally related members have been

Stevens 2009
36
______________________________________________________________________
identified in the TIMP family: TIMP-1, -2, -3 and -4. TIMP-1 and TIMP-2 are secreted
in soluble forms and can form a specific complex with pro-MMP-9 and pro-MMP-2,
respectively.
Many components of the ECM are degraded by MMP-9 and MMP-2 (Nagase and
Woessner, 1999). Pro-MMP-2 is recruited to the cell surface by interacting with TIMP-
2 bound to MMP-14 (MTI-MMP), and activated by a two stage process (Murphy et al.,
1999). In addition to the activation of MMP-2, MMP-14 possesses gelatinolytic activity
of its own (Imai et al., 1996). MMP-7 (Matrilysin) is the smallest of all the MMPs and
lacks the COOH-terminal hemopexin-like domain contained by all other MMPs
(Wilson and Matrisian 1998). Production of MMP-7 achieved primarily by mucosal
epithelia and is expressed constitutively by these cells. As well as MMP-7’s role in
innate defence and re-epithelialization, like the other members of the family, it has the
capacity to degrade a broad spectrum of substrates. However, the proteolytic role of
MMP-7 in asthma is not yet fully understood.
Elevated levels of MMP-9 have been detected in bronchoalveolar lavage fluid (BAL)
from corticosteroids-treated and -untreated adult asthmatics (Mautino et al., 1997) and
in severe adult asthma (Wenzel et al., 2003). Conversely, MMP-9 in BAL collected
from children with stable atopic asthma showed no significantly different from controls
(Doherty et al., 2005). The ratio of MMP-9 to TIMP-1 was reduced in the BAL from
children with stable atopic asthma (Doherty et al., 2005) and in the sputum from

Stevens 2009
37
______________________________________________________________________
asthmatic adults (Matsumoto et al., 2005). In support of these findings, Cataldo et al
reported increased TIMP mRNA expression in sputum cell pellets from mild asthmatics
in the absence of elevated MMP-9 (Cataldo et al., 2004). These data suggest that an
imbalance between the MMPs and their inhibitors may have a functional role in the
thickening of the basement membrane in asthmatics patients which my result in chronic
airflow obstruction.
Despite the advances in the understanding of airway remodelling, studies in paediatric
derived cells are needed to explore the pathophysiology of airway remodelling in early
life. However, bronchoscopy and endobronchial biopsy are not routine procedures in the
management of childhood asthma. Therefore, non-invasive methods, such as trans-
laryngeal, non- bronchoscopic brushings of the tracheal mucosa through an
endotracheal tube, may help in studying airway remodelling in a similar way.
1.6 Viral infections and asthma
Respiratory viruses enter and replicate in the epithelial cells lining the upper and lower
airways and the mechanism by which these viruses induce asthma exacerbation is
poorly understood. The airway epithelium is thought to provide an ideal site for viral
replication and mounts a subsequent innate antiviral response. An immune response is
generated both locally and systemically in order reduce further viral invasion. Neural

Stevens 2009
38
______________________________________________________________________
signals are generated in response to, or in an attempt to control or coordinate the
inflammation. Several of these elements are altered in asthmatic individuals, resulting in
induction of airway hyper-responsiveness and contributing to the development of
exacerbations consequent upon the infection. Studies investigating the aetiology of
asthma exacerbations in children have reported that RV, numerically, was the most
important virus type accounting for 66% of infections detected (Johnston et al., 1995,
Freymuth et al., 1999, Rakes et al., 1999, Chauhan et al., 2003).
1.6.1 Rhinoviruses
Rhinovirus (from the Greek rhin-, which means "nose") is a genus of the Picornaviridae
family of viruses. Rhinoviruses have single-stranded positive sense RNA genomes of
between 7.2 and 8.5kb in length. The viral particles themselves are not enveloped and
are icosahedral in structure. Rhinoviruses are composed of a capsid, which contains four
viral proteins VP1, VP2, VP3 and VP4 (Rossmann et al., 1985). There are 84 major
serotypes which gain entry to cells via the ICAM-1 and 12 minor serotypes that use the
low density lipoprotein (LDL) receptor for cell invasion. It has been demonstrated that
bronchial epithelial cells from asthmatic adults have reduced apoptosis and impaired
production of the cell cytokine IFN-β (Wark et al., 2005). Impaired IFN-β production
and cell apoptosis results in greater virus replication, eventually leading to cytotoxic cell
death with the release of inflammatory mediators and large numbers of intact viral

Stevens 2009
39
______________________________________________________________________
particles (Figure 1.5). In addition, the adaptive immune response in asthma patients is
associated with a T-helper (Th) type two cytokine profile (IL-4, IL-5 and IL-13),
whereas adequate antiviral immune responses require the Th1 cytokines such as IFN-γ
and IL-12. Th1 and Th2 immune responses demonstrate mutual inhibition; therefore,
within an airway with a pre-existing Th2 microenvironment there may be inhibition of
Th1 immune responses.
While genetic and environmental factors play a prominent role in the development of
asthma (Holgate, 1998a), it is acute exacerbations of the disease that result in a majority
of patient morbidity and discomfort, with the major triggers being environmental
stimuli such as pollutants, allergen and viruses. Viral infections play a significant role in
the triggering of asthma exacerbations and Johnston and colleagues have reported the
presence of viruses in 80 to 85% children with asthmatic exacerbations with RV being
the most common virus detected (Johnston et al., 1995). Furthermore, RV is frequently
found in the lower airways in infants with recurrent respiratory symptoms and the
majority of these RV positive infants also showed increased airway resistance
(Malmstrom et al., 2006).
Work using secondary human bronchial epithelial cell has demonstrated susceptibility
to infection by RV (Subauste et al., 1995) and that successful viral replication occurs
within these cells (Papadopoulos et al., 2000) resulting in a cytotoxic effect (Schroth et
al., 1999, Papadopoulos et al., 2000, Bossios et al., 2005). Despite the advances in the

Figure 1.5: Mechanisms of virus-induced asthma. In normal airways there is an adequate INF-β
response coupled with IFN-γ
and IL-
12 production in response to virus. In asthmatic airways the INF-β
response is compromised and there is a Th2 bias resulting in lower
IFN-γ
and IL-12 production.


Stevens 2009
40
______________________________________________________________________
understanding of the effects RV exposure to AECs, there is a lack of functional data
published using primary AECs, which is most likely due to the difficulties involved in
successfully obtaining and culturing primary cells. Furthermore, due to the specific
difficulty involved in obtaining paediatric AECs, the effects of RV exposure on cells
from children are not well characterised.
1.7 Summary and Thesis Aims
This review has endeavoured to a) highlight the complexity of asthma and the enormous
burden it has on the community and b) describe the essential role the bronchial
epithelium plays in this disease process. Many key advances in the understanding of the
mechanisms involved in airway remodelling, repair and normal function have been
discussed in detail and available data suggest that:
1. Normal and rapid re-epitheliasation of the airways is required to maintain the
integrity of its barrier function. There is emerging evidence that there are
significant biochemical and functional differences between healthy and
asthmatic airway cells that may impair successful re-epitheliasation. Despite the
advances in the understanding of airway epithelial regeneration, there is an
inadequacy of functional data from paediatric primary cells and mechanisms for
the abnormal epithelial function witnessed in asthmatic cells are yet to be
elucidated.

Stevens 2009
41
______________________________________________________________________
2. Functional and biochemical abnormalities of the airway epithelium may result in
dysregulation of the respiratory airways resulting in airway remodelling. In
conjunction with other cell types, AECs, are either directly or indirectly
involved in modulating ECM synthesis and thus have been implicated in the
remodelling process. However, despite advances in our understanding of ECM
regulation, little is known regarding the cellular and molecular mechanisms
underlying the remodelling processes witnessed in the asthmatic lung.
3. Acute exacerbations of asthma are responsible for the majority of morbidity and
burden of disease. Viral infections have been demonstrated to play a significant
role in the triggering of asthma exacerbations and have been detected in a
majority of children with asthmatic exacerbations. Furthermore, the airway
epithelium serves as the first line of defence during and infection and has been
reported to be inherently abnormal in asthmatic patients. Despite advances in
understanding the role respiratory viruses play in asthma, a significant amount
of data have been generated using commercial cell lines and data generated
using primary cells are limited. Furthermore, there has not been a systematic
examination of the epithelium in childhood due to difficulties sampling the
paediatric airway and obtaining healthy control tissue.
In order to address gaps in our understanding discussed above this project examines the
hypotheses that aberrant epithelial function is present in childhood and that dysregulated
repair is a critical factor in the airway remodelling that appears to be associated with

Stevens 2009
42
______________________________________________________________________
disease persistence into adulthood. Therefore, the hypotheses and aims of the
experiments described in this thesis were to:
1. Examine the hypothesis that paediatric epithelial repair is dysregulated in
asthma and that PAI-1 has a functional role in mediating this process. More
specifically, due to its role in cell adhesion, migration, repair and remodelling,
this study measured PAI-1 gene expression and proteins levels in asthmatic
airway epithelium and assessed its expression and functional role during pAEC
proliferation and wound repair.
2. Test the hypothesis that MMP expression is dysregulated in asthma
characterised by a reduced MMP to TIMP ratio that is consistent with a pro-
fibrotic balance. More specifically, this study assessed MMP-2, 7, 9 and 14 and
TIMP-1 and 2 gene expression in pAECAA and MMP-2 and 9 and TIMP-1 and 2
proteins levels in patient plasma, pAEC lysates and culture medium. In addition,
the MMP to TIMP ratios were determined for healthy and asthmatic epithelium.
3. Test the hypothesis that asthmatic airway epithelium is more sensitive to RV
exposure and that this has an inhibitory effect on epithelial proliferative and
regenerative processes. Specifically, this thesis measured the cellular, apoptotic
and cytokine responses of the airway epithelium to RV exposure, investigated its
role on pAEC proliferation and wound repair in vitro as well as its effect on
PAI-1 and MMP production.

Stevens 2009
43
______________________________________________________________________
Chapter 2: General Materials and Methods
2.1 General materials
All general reagents and chemicals used in this investigation are listed with their
supplier below. Specific materials are listed in their relevant chapters.
Material, Supplier, Supplier’s location (City/Town, State/County, Country).
0.22µM filter, PALL, East Hills, NY, USA.
10 x RT Buffer, Applied Biosystems, Foster City, CA, USA.
Acetic acid, BDH Laboratory Supplies, Poole, Dorset, England.
Assay buffer, Wallac, Turku, Western Finland, Finland.
Biotinylated anit-IL-13 antibody, R&D, Minneapolis, MN, USA.
Biotinylated anit-IL-6 antibody, R&D, Minneapolis, MN, USA.
Bovine hypothalamus acetone power, Sigma, St. Louis, MO, USA.
Bovine pituitary extract (BPE), Sigma, St. Louis, MO, USA.
Bovine serum albumin (BSA), Sigma, St. Louis, MO, USA.

Stevens 2009
44
______________________________________________________________________
Bronchial epithelium basal medium (BEBM), Cambrex Clonetics, Baltimore, MD,
USA.
Calcium Chloride (CaCl2), Sigma, St. Louis, MO, USA.
Collagen S (type I), Roche, Castle Hill, NSW, Australia.
Dexoyribonucleate triphosphates, Applied Biosystems, Foster City, CA, USA.
Dimethyl sulfoxide (DMSO), Sigma, St. Louis, MO, USA.
Disodium hydrogen phosphate (Na2HPO), BDH Lab. Supplies, Poole, Dorset, UK.
Dithiothreitol (DTT), Sigma, St. Louis, MO, USA.
Earls Minimal Essential Media (EMEM), Invitrogen, Melbourne, VIC, Australia.
Enhancement solution, DELFIA, PerkinElmer, Waltham, MA, USA.
Epinephrine hydrochloride, Sigma, St. Louis, MO, USA.
Ethanol, Analytical Sciences, Patumwan, Bangkok, Thailand.
Europium labelled Streptavidin, DELFIA, PerkinElmer, Waltham, MA, USA.
Fibronectin, Roche, Castle Hill, NSW, Australia.
Foetal calf serum (FCS), Sigma, St. Louis, MO, USA.
Fungizone, Sigma, St. Louis, MO, USA.
Gentamicin, Sigma, St. Louis, MO, USA.
Heparin sodium, Mayne Pharma, Mulgrave, VIC, Australia.
Hydrocortisone, Sigma, St. Louis, MO, USA.
Insulin, Sigma, St. Louis, MO, USA.
Isopropyl alcohol, Sigma, St. Louis, MO, USA.
L-glutamine, Invitrogen, Melbourne, VIC, Australia.

Stevens 2009
45
______________________________________________________________________
Magnesium Chloride (MgCl2) Sigma, St. Louis, MO, USA.
Maxisorp 96 well plates, NUNC, Roskilde, Region Sjælland, Denmark.
Methanol, Analytical Sciences, Patumwan, Bangkok, Thailand.
Monoclonal IL-6, R&D, Minneapolis, MN, USA.
Mr Frosty, Wessington Cryogenics, Houghton-le-Spring, Tyne & Wear, England.
MultiScribe, Applied Biosystems, Foster City, CA, USA.
Nystatin, Sigma, St. Louis, MO, USA.
Paraformaldehyde, Sigma, St. Louis, MO, USA.
Penicillin G, Invitrogen, Melbourne, VIC, Australia.
Potassium Chloride (KCl), Sigma, St. Louis, MO, USA.
Potassium dihydrogen phosphate (KH2PO4), BDH Lab. Supplies, Poole, Dorset, UK.
Protein Inhibitor Cocktail, Sigma, St. Louis, MO, USA.
Proteinase K, Sigma, St. Louis, MO, USA.
Random Hexamers, Applied Biosystems, Foster City, CA, USA.
Recombinant human epidermal growth factor (EGF), Sigma, St. Louis, MO, USA.
RNase Inhibitor, Applied Biosystems, Foster City, CA, USA.
RPMI-1640 media, Invitrogen, Melbourne, VIC, Australia.
Sodium Azide (NaN3), Sigma, St. Louis, MO, USA.
Sodium Carbonate (Na2CO3), Sigma, St. Louis, MO, USA.
Sodium Chloride (NaCl), Sigma, St. Louis, MO, USA.
Sodium Hydrogen Carbonate (NaHCO3), Sigma, St. Louis, MO, USA.
Sodium Hydroxide (NaOH), Sigma, St. Louis, MO, USA.

Stevens 2009
46
______________________________________________________________________
Streptomycin sulfate, Invitrogen, Melbourne, VIC, Australia.
SYBR®GREEN PCR Master Mix, Applied Biosystems, Foster City, CA, USA.
Trans retinoic acid, Sigma, St. Louis, MO, USA.
Transferrin powder, Sigma, St. Louis, MO, USA.
Triiodothyronine, Sigma, St. Louis, MO, USA.
Trypsin, Sigma, St. Louis, MO, USA.
Trypsin/Ethylenediaminetetraacetic acid (EDTA), Sigma, St. Louis, MO, USA.
Tween 20, ICN Biomedicals, Irvine, CA, USA.
Ultroser-G. Ciphergen, Cergy, Île-de-France, France.

Stevens 2009
47
______________________________________________________________________
2.2 Equipment
2.2.1 Balances
All analytical and biochemical reagents were measured using an Ohaus Explorer®
Balance (Derrimut, Vic, Australia).
2.2.2 Centrifuges
All centrifugation was performed using either an Eppendorf 5810R refrigerated Swing-
Bucket Rotor or a 5415D mini-centrifuge (Hamburg, Germany). Cytospin
centrifugation was performed using a Hettich centrifuge (Andreas Hettich GmbH & Co
KG, Tuttlingen, Baden-Württemberg, Germany).
2.2.3 Digital camera
A Nikon E4500 digital camera (Lidcombe, NSW, Australia) with a microscope eye
piece attachment was used for photography of cell cultures.

Stevens 2009
48
______________________________________________________________________
2.2.4 Electrophoresis
All electrophoresis equipment, including powerpacs, were obtained from Bio-Rad
Laboratories (Hercules, CA, USA).
2.2.5 Gel-Doc System
A Gel-Doc system (Bio-Rad Laboratories, Hercules, CA, USA) was used for
photography all RNA gels.
2.2.6 Glassware
All glassware was washed in detergent over-night, rinsed three times in tap water and
then deionised water. All equipment used for culture purposes was sterilised in an
Atherton autoclave.

Stevens 2009
49
______________________________________________________________________
2.2.7 Heating devices
Heating of samples or reagents to a temperatures above 37°C was achieved using a
Binder FED 53 oven (Tuttlingen, Baden-Württemberg, Germany) or a Sharp microwave
oven (Sharp, Blacktown, NSW, Australia).
2.2.8 Incubators
All established cell cultures were maintained in a NUAIRE incubator (Plymouth, MN,
USA) in an atmosphere of 5% CO2 / 95% air. Virally infected cultures were maintained
in a separate NUAIRE incubator under the same atmospheric conditions.
2.2.9 Laminar flow cabinets
All cell culture was performed in a National Association of Testing Authorities (NATA)
Certified Laminar Flow Cabinet from AES Environmental (Balcatta, WA, Australia).

Stevens 2009
50
______________________________________________________________________
2.2.10 Microscope
A Leica Microsystems inverted microscope (Wetzlar, Hesse, Germany) was used to
observe cellular morphology and cell viability. In addition, a Leica inverted fluorescent
microscope (Wetzlar, Hesse, Germany) was used to observe fluorescently stained
samples.
2.2.11 pH meter
A 3310 pH meter from Jenway (Gransmore Green Felsted Dunmow, Essex, England)
was used for all pH measurements. Calibration solutions were obtained from Scharlau
(Barcelona, Catalonia, Spain).
2.2.12 Pipettes
All volumes between 1 and 25 ml were measured using a Powerpette from Jencons
(Leighton Buzzard, Bedfordshire, England). Gilson micropipettes (Middleton, WI,
USA) were used to measure all volumes less than 1 ml. Finnpipette® (Thermo
Labsystems, Helsinki, Southern Finland, Finland) multi-channels were also used for
work involving 96 well plates.

Stevens 2009
51
______________________________________________________________________
2.2.13 Plate reader
All spectrophometric measurements between 400nm and 600nm were performed using
a Sunrise plate reader (Männedorf, Zürich, Switzerland). A Wallac Victor 2 Multi-label
Counter (PerkinElmer Life and Analytical Sciences Pty Ltd, Rowville, Melbourne VIC,
Australia) was used for fluorescence measurements.
2.2.14 Real Time Quantitative PCR (RT-qPCR)
Real time quantitative PCR (RT-qPCR) was performed on an ABI Prism® 7700
(Applied Biosystems, Foster City, CA, USA). Data analysis was performed using the
software program Sequence Detection System 1.9.
2.2.15 Stirrer, shakers and rockers
For the mixing or agitation of solutions a stirrer (Industrial equipment and control PTY.
LTD, Melbourne, Australia), shaker (Ratek, Boronia, Vic, Australia) or rocker (Stuart®,
Barloworld Scientific Laboratory Group, Rochester, NY USA) were used.

Stevens 2009
52
______________________________________________________________________
2.2.16 Tissue culture plasticware
All deposable plastic culture equipment was obtained from Sarstedt (Adelaide, SA,
Australia).
2.2.17 Water baths
When specified, certain samples and reagents were thawed or warmed using a
Thermoline Water Bath (Smithfield, NSW, Australia).

Stevens 2009
53
______________________________________________________________________
2.3 General buffers and solutions
Where appropriate, solutions were sterilised either by the passing though a 0.22 µM
filter or autoclaved for 20 minutes at 120°C at 15 pounds per square inch.
2.3.1 Multipurpose
2.3.1.1 Double deionised water (ddH2O)
ddH2O was prepared by passing distilled water through a Mill-Q water purification
system (Millipore, North Ryde, NSW, Australia).
2.3.1.2 Phosphate Buffered Saline (PBS)
A 10 x solution of PBS was initially prepared by dissolving 80 g of NaCl, 2 g of KCl,
14.4 g of NaH2PO4 and 2.4 g of KH2PO4 into 1000 ml of ddH2O. The solution was then
diluted 1 part into 9 parts ddH2O for use. For culture purpose PBS was autoclaved to
ensure solution sterility.

Stevens 2009
54
______________________________________________________________________
2.3.1.3 Tris Buffered Saline (TBS)
Initially, a 10 x solution of TBS was prepared by dissolving 80 g of NaCl, 2 g of KCl,
and 30 g of Tris Base into 1000 ml of ddH2O and the pH adjusted to 7.41. The solution
was diluted 1 part into 9 parts ddH2O for use. For culture use, TBS was autoclaved to
ensure solution sterility.
2.3.1.4 Tris-Hydrochloric Acid (HCl; 1.5 M)
To make 150 ml of a 1.5 M Tris-HCl solution, 27.23g of Tris-Base was dissolved to a
final volume of 150 ml of ddH2O. The pH was adjusted to 8.8 and stored at 4°C.
2.3.1.5 Tris- Hydrochloric Acid (HCl; 0.5 M)
To make 100 ml of a 0.5 M Tris-HCl solution, 6g of Tris-Base was dissolved and made
up to a final volume of 100 ml of ddH2O. The pH was adjusted to 6.8 and stored at 4°C.

Stevens 2009
55
______________________________________________________________________
2.3.1.6 Hydrochloric Acid (HCl; 0.1 M)
To make a 0.1 M HCl solution, 100 µl of 10 M HCl (purchased) was diluted in 9.9 ml
of ddH2O to a final volume of 10 ml and stored at room temperature (RT).
2.3.1.7 Hydrochloric Acid (HCl; 10 mM)
To make a 10 mM HCl solution, 10 µl of 10M HCl (purchased) was diluted in 9.99 ml
of ddH2O to a final volume of 10 ml and stored at RT.
2.3.1.8 Hydrochloric Acid (HCl; 4 mM)
To make a 4 mM HCl solution, 17 µl of 10M HCl was diluted in 50 ml of ddH2O and
stored at RT.
2.3.1.9 Dithiothreitol (DTT) solution (100 mM)
To make 100 ml of 100 mM DTT solution, 1.543g of DTT powder was dissolved and
made to a final volume of 100 ml with ddH2O and stored at 4°C.

Stevens 2009
56
______________________________________________________________________
2.3.1.10 Dithiothreitol (DTT) solution (1 mM)
To make 100 ml of 1 mM DTT solution, 15.43 mg of DTT powder was dissolved and
made to a final volume of 100 ml with ddH2O and stored at 4°C.
2.3.1.11 Diethylpycrocarbonate (DEPC) H2O
For experiments involving RNA, a 0.1% (w/v) solution of DEPC was made by adding 1
ml of DEPC to 999 ml of ddH2O. The solution was then autoclaved before use to ensure
sterility and stored at RT.
2.3.1.12 Ethanol (95%)
To make 1000 ml of 95% (v/v) of ethanol, 950 ml of absolute ethanol was added to 50
ml of ddH2O. The solution was stored at RT until required.
2.3.1.13 Ethanol (70%)
To make 1000 ml of 70% (v/v) of ethanol, 700 ml of absolute ethanol was added to 300
ml of ddH2O. The solution was stored at RT until required.

Stevens 2009
57
______________________________________________________________________
2.3.2 Cell culture
2.3.2.1 Bovine pituitary extract (BPE)
A 0.05 mg/ml stock of BPE was made by dissolving 10 g of BPE powder into 100 ml of
1 x PBS (refer to 2.3.1.2). The solution was centrifuged at 10000 g for 30 minutes, the
supernatant collected, re-centrifuged and filter sterilised before being stored at -80°C.
2.3.2.2 Epidermal growth factor (EGF)
A 25 µg/ml stock of EGF was made by dissolving 200 µg of EGF powder into 8 ml of 1
x PBS (refer to 2.3.1.2). The solution was then filter sterilised before being stored at -
20°C.
2.3.2.3 Epinephrine (1 mg/ml)
A 1 mg/ml stock of epinephrine was made by dissolving 50 mg of epinephrine powder
into a final volume of 50 ml of 10 mM HCl solution (refer to 2.3.1.7). The solution was
then filter sterilised before being stored at -20°C.

Stevens 2009
58
______________________________________________________________________
2.3.2.4 Hydrocortisone (3.6 mg/ml)
To make 3.6 mg/ml stock of hydrocortisone, 72 mg of hydrocortisone powder was
dissolved into a final volume of 20 ml of 95% ethanol (refer to 2.3.1.12). The solution
was filter sterilised before being stored at -20°C.
2.3.2.5 Insulin (2 mg/ml)
To make a 2 mg/ml stock of insulin, 100 mg of insulin powder was dissolved into 50 ml
of 4 mM HCl. The solution was then filter sterilised before being stored at -20°C.
2.3.2.6 Retinoic acid (1 µg/ml)
A 1 µg/ml stock of retinoic acid was made by dissolving 50 mg of retinoic acid powder
into 5 ml of Dimethyl sulfoxide (DMSO). The solution was filter sterilised before being
stored at -20°C.

Stevens 2009
59
______________________________________________________________________
2.3.2.7 Ultroser-G
To reconstitute the Ultroser-G serum supplement, using sterile conditions, 20 ml of
sterile ddH2O was added to the powder and dissolved with periodic agitation for 10
minutes at RT. The solution was then aliquoted and stored at 4°C.
2.3.2.8 Transferrin (5 mg/ml)
A 5 mg/ml stock of transferrin was made by dissolving 100 mg of transferrin powder
and 2 ml of BSA into 18 ml of 1 x PBS (refer to 2.3.1.2). The solution was filter
sterilised before being stored at -20°C.
2.3.2.9 Tri-iodothyronine stock (6.5 µg/ml)
A 6.5 µg/ml stock solution of tri-iodothyronine was made by dissolving 50 mg of tri-
iodothyronine powder into 1.54 ml of DMSO. The solution was filter sterilised before
being stored at -20°C.

Stevens 2009
60
______________________________________________________________________
2.3.2.10 BSA stock solution (1 mg/ml)
A 1 mg/ml stock solution of BSA was prepared by dissolving 100 mg of BSA powder
into 100 ml of 1 x PBS (refer to 2.3.1.2). The solution was filter sterilised before being
stored at -20°C.
2.3.2.11 Penicillin (50 mg/ml)
A 50 mg/ml penicillin stock solution was prepared by adding the appropriate volume
ddH2O to a vial of penicillin powder for a final concentration of 50 mg/ml. The solution
was filter sterilised and stored at 4°C.
2.3.2.12 Gentamicin (50 mg/ml)
A 50 mg/ml stock solution of gentamicin was prepared by adding the appropriate
volume ddH2O to a vial of gentamicin powder for a final concentration of 50 mg/ml.
The solution was filter sterilised and stored at -20°C.
Stevens 2009
61
______________________________________________________________________
2.3.2.13 Streptomycin (50 mg/ml)
A 50 mg/ml stock solution of streptomycin was prepared by adding the appropriate
volume ddH2O to a vial of streptomycin powder for a final concentration of 50 mg/ml.
The solution was filter sterilised and stored at -20°C.
2.3.2.14 Nystatin (50 mg/ml)
A 50 mg/ml stock solution of nystatin was prepared by adding the appropriate volume
ddH2O to a vial of nystatin powder for a final concentration of 50 mg/ml. The solution
was filter sterilised and stored at -20°C.
2.3.2.15 Fungizone (25 mg/ml)
A 25 mg/ml stock solution of fungizone was prepared by adding the appropriate volume
ddH2O to a vial of fungizone powder for a final concentration of 25 mg/ml. The
solution was filter sterilised and stored at -20°C.

Stevens 2009
62
______________________________________________________________________
2.3.2.16 Primary cell culture medium
Primary cells were maintained in a Bronchial Epithelial Basal Media (BEBM)
containing the following additives; bovine pituitary extract (0.025 µg/ml),
hydrocortisone (0.5 µg/ml), EGF (0.025 µg/ml), epinephrine (0.5 µg/ml), triiodthronine
(6.5 ng/ml), insulin (5 µg/ml), transferrin (0.01 ng/ml), retinoic acid (0.1 ng/ml),
gentamicin (0.05 µg/ml), penicillin (0.05 µg/ml), streptomycin (0.05 µg/ml), fungizone
(0.125 µg/ml) and Ultroser- G (2% v/v final). The components above were added to 500
ml of BEBM under sterile conditions and the final solution stored at 4°C.
2.3.2.17 A549 cell line culture medium
A549 cell lines were maintained in RPMI-1640 containing FCS (10% v/v final),
gentamicin (1% v/v final) and penicillin/streptomycin (1% v/v final). The components
above were added to 500 ml of RPMI-1640 under sterile conditions and the final
solution stored at 4°C.

Stevens 2009
63
______________________________________________________________________
2.3.2.18 16HBE14o- cell line culture medium
The 16HBE14o- cell lines were maintained in (EMEM containing FCS (10% v/v final)
and penicillin/streptomycin (1% v/v final). The components above were added to 500
ml of RPMI-1640 under sterile conditions and the final solution stored at 4°C.
2.3.2.19 Cell culture coating buffer
To make cell culture coating buffer, 1 mg of fibronectin was diluted in 10 ml of BEBM
at 37°C for 60 minutes to completely dissolve the powder. To this, 1 ml of collagen S
and 10 ml of BSA stock (refer to 2.3.2.10) were added and the volume made up to 100
ml with BEBM. The solution was filter sterilised before use and stored at 4°C in a dark
container.
2.3.2.20 Cell freezing solution
To make 1 ml of cell freezing solution, 250 µl of FCS and 50 µl of DMSO were added
to 700 µl of culture media in which the cells were grown (containing the appropriate
additives described in 2.3.2.17-18). This solution was only used for the freezing down
and storage of cell lines, as primary pAECs cannot be successfully frozen.

Stevens 2009
64
______________________________________________________________________
2.3.2.21 Neutral Buffered Formalin (NBF)
To make 1000 ml of neutral buffered formalin, 900 ml of ddH2O and 100 ml of
formalin were combined with 4 g of NaH2PO4 and 6.5 g of Na2HPO4. The solution was
stored at 4°C until required.
2.3.3 Assays and associated buffers
2.3.3.1 Cell lysis buffer for protein extraction
To make 100 ml of cell lysis buffer for protein extraction, 240 mg of Tris Base, 30 mg
of EDTA and 1 ml of 1 mM DTT (refer to 2.3.1.10) were added to 100 ml of ddH2O
and the pH adjusted to 7.4. The solution was stored at 4°C until required.
2.3.3.2 Time resolved fluorometry (TRF) block buffer
To make 2000 ml of block buffer for TRFs, 12.11 g of Tris, 18 g of NaCl and 0.5 g of
NaN3 were added to 1000 ml of ddH2O and the pH adjusted to 7.4. Ten grams of BSA
was then added before aliquoting and storage at -20°C.

Stevens 2009
65
______________________________________________________________________
2.3.3.3 Time resolved fluorometry (TRF) coating buffer
To make 1000 ml of coating buffer for TRF’s, 1.59 g of Na2CO3 and 2.93 g of NaHCO3
were added to 1000 ml of ddH2O. The solution was filter sterilised and stored at 4°C
until required.
2.3.3.4 Time resolved fluorometry (TRF) wash buffer
To make 2000 ml of 10x wash buffer for TRFs, 121.1 g of Tris, 180 g of NaCl and 5 g
of NaN3 were added to 1000 ml of ddH2O and the pH adjusted to 7.8. The solution was
diluted 1 part into 9 parts ddH2O and 100 µl of Tween 20 added per every 2000 ml
before use. The buffer was made fresh with each assay.

Stevens 2009
66
______________________________________________________________________
2.4 General methods
2.4.1 Ethics approval
The study was approved by the Princess Margaret Hospital for Children’s Human
Ethics Committee. Permission was granted for the recruitment of airway epithelial cells
from children attending theatre for elective surgeries at Princess Margaret Hospital for
Children (Perth, WA, Australia). Registration number: 1402/EP (refer to appendix A).
2.4.2 Cell types
Experiments conducted in this investigation were performed on primary-paediatric-
derived airway epithelial cells. Due to the precious nature of the primary cells, many of
the initial experimental optimisation was performed using cell lines and later confirmed
on primary cells.
2.4.2.1 Primary airway epithelial cells
Two cohorts of paediatric airway epithelial cells (pAEC) were used in the study; pAEC
from 24 children with mild atopic asthma (AA), who did not previously receive any
corticosteroid therapy (pAECAA), and pAEC from 27 healthy non-atopic (HNA)

Stevens 2009
67
______________________________________________________________________
children with no history of asthma (pAECHNA; Table 2.1). Samples were collected from
the 51 subjects investigated in this study, who were undergoing elective surgery for
non-respiratory conditions. Asthma was defined as physician diagnosed asthma with
documented wheeze in the prior 12 months and confirmed by positive responses to
relevant questions (refer to appendix B) on both the ISAAC (International Study of
Asthma and Allergies in Childhood) and American Thoracic Society questionnaires
(Ferris, 1978, Asher et al., 1995). Atopy was determined by a positive
radioallergosorbent test (RAST) to a panel of common allergens (Table 2.2), elevated
plasma IgE levels and a history of hay fever and/or eczema.
2.4.2.2 16HBE14o- cell line
An immortalized human bronchial epithelial cell line (16HBE14o-) was obtained from
Dr Dieter Gruenert (University of California San Francisco, USA) and maintained in a
specialised growth media (refer to 2.3.2.18) at 37C in an atmosphere of 5% CO2 / 95%
air.
2.4.2.3 A549 cell line
A human Caucasian lung carcinoma cell line (A549) was obtained from The Lung
Institute of Western Australia at Sir Charles Gardener Hospital (Perth, WA, Australia).

Stevens 2009
68
______________________________________________________________________
The cell line was maintained in a specialised growth media (refer to 2.3.2.17) and
cultured at 37C in an atmosphere of 5% CO2 / 95% air.
2.4.3 Primary airway epithelial cell isolation
Primary airway epithelial cells were isolated via trans-laryngeal, non- bronchoscopic
brushing of the tracheal mucosa through an endotracheal tube. This method was
established in the laboratory in which this investigation took place (Lane et al., 2005,
Kicic et al., 2006). Briefly, following a gentle brushing to detach cells from the airways,
the brush tip was removed and inserted into chilled media (RPMI-1640) containing 20%
(v/v) heat inactivated FCS. The collection tubes were vortexed to release the cells from
the cytology brush and centrifuged at 500 g for 5 minutes to pellet the cells. Cells were
subsequently washed and re-suspended in BEBM supplemented containing additives
(refer to 2.3.2.16). Cell viability and yield was determined by counting cells using a
haemocytometer with trypan blue exclusion. Macrophages were then removed from the
cell suspension by incubation with a 1:500 dilution of CD-68 antibody (DAKO,
Sydney, NSW, Australia) for 20 minutes in a humidified incubator (37˚C, 5% CO2 /
95% air). Afterwards, approximately one third of cells, suspended in BEBM containing
growth supplements, were seeded into a culture vessel (25cm2 growth surface area) that
was pre-coated with cell culture coating buffer (refer to 2.3.2.19) and maintained in a
WTC Binder incubator at 37C in an atmosphere of 5% CO2 / 95% air. The second third
of cells were initially pelleted, the supernatant aspirated and the pellet dissolved in 350

Stevens 2009
69
______________________________________________________________________
l of RLT buffer (QIAGEN, Hilden, Germany) containing 1% (v/v) 2-mercaptoethanol
(Sigma, St. Louis, MO, USA) for subsequent RNA extraction. Cytospin preparations
(refer to 2.4.6) were then made with the remaining cells.
2.4.4 Primary airway epithelial cell subculture
Established primary cultures were expanded over 2 passages for subsequent
experimentation. For expansion, cells were detached from flasks by incubating with
0.25% Trypsin/ 0.05% EDTA solution in sterile 1 x PBS (refer to 2.3.1.2) for 7 minutes
at 37C. The resulting cell suspension was centrifuged at 500 g for 7 minutes at 8°C and
re-suspended in appropriate culture medium. A total cell count and a viability stain were
performed on each sample. Cells were subsequently plated into new flasks pre-coated
with cell culture coating buffer (2.3.2.19) and incubated at 37C in an atmosphere of 5%
CO2 / 95% air in BEBM containing growth supplements as previously described (Kicic
et al., 2006).
2.4.5 Cell line culture
When not in active culture, cell lines were stored at -80C in cell freezing solution (refer
to 2.3.2.20). Cells were revived by initial thawing at 37°C, diluted in 10 ml of RPMI
and then centrifuged at 500 g for 7 minutes at 8°C to remove the DMSO. Cells were

Stevens 2009
70
______________________________________________________________________
counted using a haemocytometer, the viability assessed with trypan blue and seeded into
a culture vessel (75cm2 growth surface area) in 10 ml of appropriate culture media
containing additives (refer to 2.3.2.17-18). Culture flaks did not require pre-coating and
were maintained in a separate WTC Binder incubator at 37C in an atmosphere of 5%
CO2 / 95% air. For culture expansion, cells were detached from flasks by incubating
with 0.25% Trypsin/ 0.05% EDTA solution in sterile 1 x PBS (refer to 2.3.1.2) for 3
minutes at 37C. The resulting cell suspension was centrifuged at 500 g for 7 minutes at
8°C and re-suspended in appropriate culture medium. A total cell count and a viability
stain were performed on each sample. Cells were subsequently plated into new culture
flasks and incubated at 37C in an atmosphere of 5% CO2 / 95% air in appropriate
growth medium (refer to 2.3.2.17-18). For continued future use of cell lines, stocks of
each line were frozen-down and to at -80C and subsequently store in a liquid nitrogen
tank. Briefly, cells were detached from flasks with 0.25% Trypsin/ 0.05% EDTA
solution (incubation for 3 minutes at 37C), re-suspended in culture medium and
centrifuged for 7 minutes at 500 g. The resulting pellet was re-suspended in 1 ml of
freezing solution (refer to 2.3.2.20) and frozen in a “Mr Frosty” Cryo-freezing container
at -80C for 24 hours. This provides the critical -1°C/minute cooling rate required for
successful cell cryopreservation and recovery. The cells were then transfer to a liquid
nitrogen storage facility for long tern storage.

Stevens 2009
71
______________________________________________________________________
2.4.6 Culture media collection
Prior to the passage or harvesting of an established cell culture, the culture media in
which the cells were grown was collected, aliquoted and stored at -80C for subsequent
protein analysis.
2.4.7 Cytospin Preparation
To make cell cytospin preparations, 60-70 µl of a cell suspended containing at least
50,000 cells was added to each slide encased in a cytospin block and centrifuged for 20
minutes at 1500 rpm. The slides were allowed to air dry for 24 hours after which they
were fixed with 4% neutral buffered formalin (NBF, refer to 2.3.2.21) for 10 minutes at
RT. To remove excess NBF, the slides were washed three times in a bath of 1 x PBS
(refer to 2.3.1.2) for 10 minutes and allowed to air dry. The fixed preparations were
stored at -20°C until required.
2.4.8 Plasma isolation
In addition to airway epithelial cell collection, 10 ml of whole blood was collected from
each cohort participant, placed into heparin sodium, mixed and transported back to the
laboratory. The whole blood was then centrifuged for 10 minutes at 2000 g and plasma

Stevens 2009
72
______________________________________________________________________
collected. The plasma was then re-centrifuged for further 10 minutes at 2000 g and
stored in 1 ml aliquots at -80C until required.
2.4.9 Total cellular protein extraction
Cell pellets were initially placed on ice and re-suspended in 240 µl of cell lysis buffer
(refer to 2.3.3.1) Fifty microliters of Protease Inhibitor Cocktail was added to each
sample to prevent protein degradation. Cells were then subsequently lysed by
mechanical force at 4°C with a 27G needle and syringe.
2.4.10 Total cellular protein quantitation
Total protein concentration was determined with the micro-Bicinchoninic Acid (BCA)
Protein Assay Reagent Kit (Pierce, Rockford, IL, USA). This assay is based on the
reduction of Cu2+ to Cu1+ by protein in an alkaline medium with the highly sensitive and
selective colourimetric detection of the cuprous cation (Cu1+) by bicinchoninic acid.
Briefly, protein samples were diluted 1:5, 1:10 and 1:20 in 1 x PBS (refer to 2.3.1.2)
and the appropriate BSA protein standard constructed consisting of a concentration
range between 12.5 and 500 µg/ml. Forty microlitres of sample and standard dilutions
were added to wells of a 96 well plate. Secondary kit reagents were then combined in a
50:48:2 ratio and 200 µl of the mixture added to each well and incubated for 60 minutes

Stevens 2009
73
______________________________________________________________________
at 37°C and the absorbance of the wells read at 562nm. The absorbance of the standards
was plotted against their known concentrations and a standard curve generated. The
concentration of the sample was then determined from the standard curve incorporating
any dilution factor utilised.
2.4.11 Reverse Transcriptase-Polymerase Chain Reaction (RT-PCR) and Real
Time quantitative Polymerase Chain Reaction (RT-qPCR)
Primers from previously published sequences for the genes of interest (PAI-1, MMP-2,
MMP-7, MMP-9, MMP-14, TIMP-1, TIMP-2) and the house keeping gene (18s) were
obtained from GeneWorks (Adelaide, SA, Australia; Table 2.3). Gene expression was
analysed by two-step RT-PCR reactions (Figure 2.1). Briefly, total cellular RNA was
extracted from pAEC with RNeasy mini columns (QIAGEN, Hilden, Germany), a DNA
digest performed with RNase-Free DNase (QIAGEN, Hilden, Germany) to remove
unwanted DNA and the isolated RNA assessed for quality and quantity by
spectrophotometric absorbance at 260 and 280nm (Eppendorf BioPhotometer,
Hamburg, Germany). Reverse transcription was performed to convert 200 ng of RNA
into cDNA (Figure 2.1): 200 ng of RNA was added to a master mix containing 10 x RT
Buffer (2 µl), 5 mM MgCl2 (4.4 µl), 2 mM deoxyribonucleotide triphosphates (dNTPs)
(1.0 µl), Random Hexamers (1.0 µl), RNase Inhibitor (0.4 µl), and MultiScribe (0.5 µl)
and then made to a final volume of 20 µl with RNase free water. Samples were then
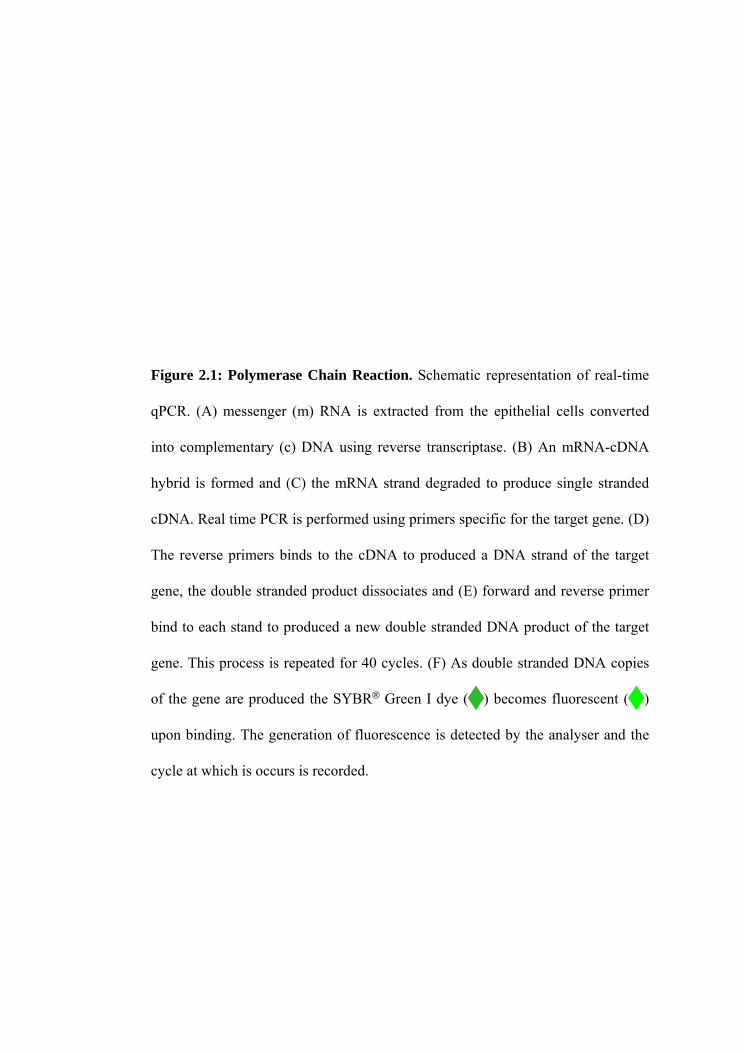
Figure 2.1: Polymerase Chain Reaction. Schematic representation of real-time
qPCR. (A) messenger (m) RNA is extracted from the epithelial cells converted
into complementary (c) DNA using reverse transcriptase. (B) An mRNA-cDNA
hybrid is formed and (C) the mRNA strand degraded to produce single stranded
cDNA. Real time PCR is performed using primers specific for the target gene. (D)
The reverse primers binds to the cDNA to produced a DNA strand of the target
gene, the double stranded product dissociates and (E) forward and reverse primer
bind to each stand to produced a new double stranded DNA product
of the target
gene. This process is repeated for 40 cycles. (F) As double stranded DNA copies
of the gene are produced the SYBR® Green I dye ( ) becomes fluorescent ( )
upon binding. The generation of fluorescence is detected by the analyser and the
cycle at which is occurs is recorded.

RNA
RNA – DNA hybrid
cDNA
Reverse transcriptase
Degrade RNA strand
DNA Primers and polymerase
A
B
C
D
E
F

Stevens 2009
74
______________________________________________________________________
placed in a PTC-100 Thermal Cycler (MJ Research, Boston, MA, USA) and run on a
standard reverse transcription program consisting of 30 cycles: 92°C for 30 seconds
followed by 3 minutes at 60°C. The RT-qPCR reactions contained cDNA (10 ng),
forward and reverse primers (0.3 µM), SYBR®GREEN PCR Master Mix (10 µl) and
RNase free water to make a final volume of 20 µl. RT-qPCR was performed on an AB-
770 analyser (Applied Biosystems, Foster City, CA, USA). Results were analysed as
previously described (Livak and Schmittgen, 2001) and gene expression of AA samples
expressed as a fold change compared to HNA samples.
2.4.12 Proliferation Assay
For the assessment of the rates of proliferation of pAECs, a CellTitre 96® Aqueous Non-
Radioactive Cell Proliferation Assay (Promega, Madison, WI, USA) was utilised. This
assay is a colourimetric method based on the conversion of a tetrazolium salt into a
coloured compound by dehydrogenase enzymes found only in metabolically active
cells. The assay was performed in accordance to the manufactures instructions and
measurements were recorded at 0, 24, 48, 72, 96, 120, 144 and 168 hours post seeding
to determine the number of viable cells in cell culture. The assay was validated by the
performance of cell counts at each time point post-seeding.

Stevens 2009
75
______________________________________________________________________
2.4.13 Time Resolved Fluorometry (TRF)
For the measurement of IL-6 and IL-13 production, a TRF detection system (DELFIA,
Wallac, Turku, Finland) based on that described by Taylor et al (Taylor et al., 2007)
was used in this investigation. Briefly, all wells of a 96 well plate were pre-coated with
50 µl of a mouse anti-human capture anybody diluted 1:5 in coating buffer (refer to
2.3.3.3) overnight at 4°C. The following day, the coating antibody was removed and
300 µl of block buffer (refer to 2.3.3.2) was added to wells and incubated for 1 hour at
RT. During this period, the sample supernatants were diluted (dilution range: 1:5 to
1:100) in assay buffer as were appropriate standards. The wells were then washed 3
times with 300 µl of TRF wash buffer (refer to 2.3.3.4) to remove any residual block
buffer and 50 µl of sample added to the wells, which were then incubated for 1 hour at
RT with gentle agitation. Plates were subsequently washed 5 times with 300 µl of TRF
wash buffer and a 1:3 dilution of biotinylated goat anti-mouse secondary antibody
added to each well and incubated for 1 hour at RT with gentle agitation. The plates were
washed 5 times with 300 µl of TRF wash buffer and 50 µl of a 1:500 dilution of
europium to the wells and incubated for 30 minutes at RT with gentle agitation. The
plates were washed a further 8 times with 300 µl of TRF wash buffer and 50 µl of
enhancement solution added to the well with a quick 5 minute incubation. The
absorbance of the wells was read on a Wallace Victor Multi-label Counter.

Stevens 2009
76
______________________________________________________________________
2.4.14 Statistics
Each experiment performed in this thesis was conducted between 3 and 8 times with at
least 2 replicates per experiment. A one-way ANOVA and Dunnett’s test were
performed on all multiple comparisons. All values presented are means ± SD or SE and
all p values less than 0.05 were considered to be significant.

Stevens 2009
77
______________________________________________________________________
Chapter 3: Dysregulated Repair in Asthma: The
Role of Plasminogen Activator Inhibitor- 1
3.1 Introduction
Asthma is a complex and multifactorial disease involving the interplay of many
molecules and different cell types and is associated with structural airway abnormalities
that include; subepithelial fibrosis (Roche et al., 1989), goblet cell hyperplasia (Dunnill
et al., 1969, Aikawa et al., 1992) changes to smooth muscle mass (Heard and Hossain,
1973, Joubert and Hamid, 2005), epithelial fragility (Jeffery et al., 1989, Montefort et
al., 1992, Montefort et al., 1993) and ECM deposition (Roche et al., 1989). Normal and
rapid re-epithelialization of the airways is required to maintain the integrity of its
immune barrier function. In addition, AECs, in conjunction with other cell types, are
either directly or indirectly involved in modulating ECM synthesis and thus have been
implicated in the remodelling process. However, despite advances in our understanding
of the inflammatory processes associated with asthma, paucity exists with regard to the
cellular and molecular mechanisms underlying the remodelling processes witnessed in
the asthmatic lung.

Stevens 2009
78
______________________________________________________________________
The PAS is known to regulate ECM deposition and inactivity of this system in asthma
may result in subepithelial fibrosis, excess ECM deposition and dysregulated airway
remodelling (Figure 3.1). The activation of this system results in the conversion of
proenzyme plasminogen into the active serine protease plasmin. Plasmin has the ability
to degrade most protein components of the ECM, either directly by removing
glycoproteins (Montgomery et al., 1993) or indirectly via the activation of matrix
metalloproteinases (MMPs) (Werb et al., 1980, Moscatelli and Rifkin, 1988, Matrisian,
1990, Kleiner and Stetler-Stevenson, 1993). It also inhibits MMP inactivation by tissue
inhibitors of metalloproteinase (TIMP). Plasmin levels are tightly controlled by two
activators: tissue plasminogen activator (t-PA) and urokinase plasminogen activator (u-
PA) (Vassalli et al., 1991) which in turn are regulated by plasminogen activator
inhibitors (PAI-1 & 2). Both PAI-1 and PAI-2 play essential roles in regulating plasmin
production via the inhibition of both forms of the plasminogen activators (Kruithof,
1988), although PAI-2 exhibits an inhibitory action 20-100 fold less than PAI-1
(Kruithof et al., 1986). In addition to reducing the production of plasmin, PAI-1 plays a
crucial role in blocking the actions of MMPs (Cho et al., 2000).
As well as its role in ECM deposition, PAI-1 has been hypothesised to be involved in
the regulation of cell adhesion (Planus et al., 1997, Wang et al., 2005), migration
(Planus et al., 1997, Waltz et al., 1997, Isogai et al., 2001, Providence and Higgins,
2004, Wang et al., 2005) and repair (Providence and Higgins, 2004, Wang et al., 2005)
in brain endothelial cells as well as keratinocytes, corneal and kidney epithelial cells.

Figure 3.1: The plasmin
activation system. The inhibition of pro-plasminogen
activator (PA), active PA and pro-matrix
metalloproteinase (MMP) by plasminogen
activator inhibitor (PAI)-1 results in degradation of the extracellular matrix (ECM) by
plasmin
and MMPs.

ActiveMMPs
ActivePA
Cell
Pro-PA
PAI
Plasminogen
Plasmin
Pro-MMPs
Extracellular Matrix
PAReceptor
ECM Degradation
(-)
(-) (-)
(+)
(+) (+)
(+)
(+)
(+)
(+)
TIMP
(-)
Stevens 2009
79
______________________________________________________________________
Several recent investigations have suggested that elevated PAI-1 expression levels may
play a role in the development of airway remodelling associated with asthma (Cho et
al., 2001, Buckova et al., 2002, Oh et al., 2002). However, these data have been largely
generated by studies involving murine models (Carmeliet et al., 1993a, Carmeliet et al.,
1993b, Barazzone et al., 1996, Eitzman et al., 1996, Oh et al., 2002) or adult tissue
(Cho et al., 2001, Buckova et al., 2002, Pampuch et al., 2006) and have not investigated
the role in pAEC. To this end, it has recently been shown that pAEC obtained from
asthmatic children are intrinsically different to non-asthmatic cells (Kicic et al., 2006).
This is pertinent since it is likely that asthma in adults originates in childhood.
This chapter hypothesised that in asthma, AECs display dysregulated wound repair and
that PAI-1 has an important role in mediating this process. Furthermore, in asthma,
dysregulated epithelial repair results in elevated PAI-1 expression. We therefore
assessed the effect of PAI-1 on epithelial cell proliferation and wound repair and
characterised PAI-1 gene and protein expression and the kinetics of wound closure
using AECs from healthy non-atopic and atopic asthmatic children. Although PAI-2
plays a role in the regulation of plasmin production (Kruithof, 1988) due to its
inhibitory action being 20-100 fold less than PAI-1 (Kruithof et al., 1986), this
investigation chose to focus on the most potent on the two inhibitors.

Stevens 2009
80
______________________________________________________________________
3.2 Materials
The general materials used in this part of the investigation and the suppliers are listed in
detail in Chapter 2.1: “General Materials.” Material specific to this section of the
investigation were; the PAI Activity Assay Kit which was purchased from Chemicon
International (Temecula, CA, USA), pre-designed siRNA that was ordered from
QIAGEN (Hilden, North Rhine-Westphalia, Germany) and the RNAi Human/Mouse
Starter Kit which was also purchased from QIAGEN (Hilden, North Rhine-Westphalia,
Germany).

Stevens 2009
81
______________________________________________________________________
3.3 Methods
3.3.1 Patients and sample collection
As described previously (refer to 2.4.2.1), two cohorts were used in this study, for this
section of the investigation, samples from 10 AA children, who did not previously
receive any corticosteroid therapy, and 13 HNA children were used (See Table 3.1).
Please refer to Chapter 2.4.1.1 and 2.4.2 for information on asthma/allergy diagnosis
and sample collection. In addition to pAEC collection, 10 ml of whole blood was
collected into heparin sodium, mixed, transported back to the laboratory and processed
to collect plasma.
3.3.2 Cell subculture and media collection
The methodology used for the culture of primary AEC and cell lines, and the collection
of culture medium has been described in full in Chapter 2.4.4 - 2.4.6.

Stevens 2009
82
______________________________________________________________________
3.3.3 Cellular quiescence
A phase of quiescence (no cellular growth) was noted as the cells achieved confluence.
This was confirmed by comparing the ability cells harvested at 80% and 100%
confluence to proliferate upon re-seeding. Cells harvested at less than 80% confluence
demonstrated a 6-24 hour quiescence phase before proliferating, whereas cells isolated
after reaching confluence demonstrated >72 hours of quiescence (data not shown). To
obtain cells that were considered to be in a state of quiescence, the cells were allowed to
reach 100% confluence with an additional 24 hours incubation period before cells were
collected.
3.3.4 Monolayer wounding
An in-house wounding device, based on that used by Vermeer et al (Vermeer et al.,
2003) was developed for the assessment of wound repair. The device produces a
consistent circular wound (width 1 mm; Figure 3.2A). Using time lapse photography at
12 hour intervals the degree of cellular migration into the wound was able to be
determined. For short-term wound repair experiments involving PAI-1 knockdown,
pAEC monolayers were wounded by scraping in a cross hatch design using a plastic
pipette tip (0.5mm wound width; Figure 3.2B). Preliminary experiments showed this
method to create a wound injury area that allowed for full wound repair by 72 hours

Figure 3.2: Monolayer wound devices. Two wounding devices were developed for this investigation. A circular wounding device (A)
produced an extremely consistent wound site for repair assessment. The cross-hatch device (B) wounded a greater surface area allowing
more accurate assessment of changes in gene expression.

A
B

Stevens 2009
83
______________________________________________________________________
whilst gene knockdown was fully active (Figure 3.3). This injury method was
determined optimal for the measurement of gene expression changes using qPCR, over
the previously described device (Figure 3.4). Epithelial cells were initially plated into
12-well culture plates and grown to confluence in their defined culture medium.
Culture surfaces were wounded as described above and washed 3 times in BEBM media
to remove detached cells. Fresh media containing supplements was added every 24
hours and cultures incubated at 37C in an atmosphere of 5% CO2 / 95% air until full
wound repair was achieved. Media supernatant samples were collected every 24 hours
for assessment of mediator production and time lapsed photography images were taken
every 24 hours in order to determine the degree of repair in to the wound site. In
addition, cells were harvested every 24 hours for the assessment of mRNA production
using subsequent RNA extraction and qPCR. Wound recovery was calculated by
manual tracing of the new wound edge at each time interval and comparing the wound
width to that of the originally created wound edge. Calculated values were then
expressed as a percentage of total wound recovery over the period to achieved full
repair, namely 100% wound repair. Gene knockdown of PAI-1 with siRNA was
performed as described above. For gene silencing experiments, harvested cell pellets
were analysed with qPCR confirm successful target gene silencing.

Figure 3.3: Wound repair time and successfully knockdown. (A) Health cells
were seeded in 12 well plates, grown to confluence and wounded. The cells were
able to successfully repair the cross-hatch wound sites within 72 hours of
wounding. (B) Cells were seeded in 12 well plates, grown to 85% confluence and
siRNA knockdown performed. Cells were harvested and RT-qPCR
performed to
assess knockdown of PAI-1. Knockdown of mRNA expression was demonstrated
to last up to 72 hours compared to untreated cells (Neg).
A
Neg 24 36 48 720
25
50
75
100
Time after knockdown (hours)
PA
I-1
Exp
ress
ion
(%
)
B0 Hours 72 Hours

Figure 3.4: Wounding devices and PAI-1 expression. Healthy cells were
seeded in 12 well plates, grown to confluence and wounded using the two
wounding devices. The cells were harvested and RT-qPCR
performed to measure
PAI-1 expression. The cross-hatch device wounded a greater percentage of cells
and produced the greatest change in PAI-1 mRNA expression change.
No Wounding CircleWound Device
Crosshatch
0
25
50
75
100
125
150
175
200
PA
I-1
Exp
ress
ion
(%
)

Stevens 2009
84
______________________________________________________________________
3.3.5 Reverse Transcriptase-Polymerase Chain Reaction and Quantitative
Polymerase Chain Reaction
Extraction and quantitation of RNA, as well as the methodology for RT-PCR are
described in detail in Chapter 2.4.11.
3.3.6 Protein extraction and quantitation
Extraction and quantitation of protein from AECs is described in full in Chapter 2.4.9-
2.4.10.
3.3.7 PAI-1 activity assay
Whole blood was centrifuged for 10 minutes at 2000g and plasma collected. The plasma
was then re-centrifuged for further 10 minutes at 2000g and stored in 1 ml aliquots at -
80C until required. PAI-1 activity in patient plasma and cell lysates was determined
using a PAI Activity Assay kit (Chemicon International, Temecula, CA, USA). This is a
colorimetric assay based on the inhibition of uPA by PAI with the absorbance, recorded
at 405nm, being inversely proportional to the PAI activity in the sample. The sensitivity

Figure 3.3: Wound repair time and successfully knockdown. (A) Health cells
were seeded in 12 well plates, grown to confluence and wounded. The cells were
able to successfully repair the cross-hatch wound sites within 72 hours of
wounding. (B) Cells were seeded in 12 well plates, grown to 85% confluence and
siRNA knockdown performed. Cells were harvested and RT-qPCR
performed to
assess knockdown of PAI-1. Knockdown of mRNA expression was demonstrated
to last up to 72 hours compared to untreated cells (Neg).
A
Neg 24 36 48 720
25
50
75
100
Time after knockdown (hours)
PA
I-1
Exp
ress
ion
(%
)
B0 Hours 72 Hours

Figure 3.4: Wounding devices and PAI-1 expression. Healthy cells were
seeded in 12 well plates, grown to confluence and wounded using the two
wounding devices. The cells were harvested and RT-qPCR
performed to measure
PAI-1 expression. The cross-hatch device wounded a greater percentage of cells
and produced the greatest change in PAI-1 mRNA expression change.
No Wounding CircleWound Device
Crosshatch
0
25
50
75
100
125
150
175
200
PA
I-1
Exp
ress
ion
(%
)

Stevens 2009
85
______________________________________________________________________
range of the assay was between 0.05-50 units of uPA activity and was performed
according to the manufacturer’s instructions.
3.3.8 siRNA gene knockdown
Gene silencing was performed using the RNAi Human/Mouse Starter Kit (QIAGEN,
Hilden, North Rhine-Westphalia, Germany). Pre-designed small interfering ribonucleic
acid (siRNA) complimentary to PAI-1 mRNA was utilized with the kit and the
procedure was performed in accordance to manufacturer’s instructions. Briefly, the ratio
of siRNA to transfection reagent required for optimal gene knockdown was determined
(Figure 3.5). The transfection reagent and siRNA were added to serum-free BEBM
containing growth supplements, vortexed and incubated for 10 minutes at room
temperature (RT) to allow the formation of the transfection complexes. Prior to
transfection, pAEC were grown to 80% confluence in BEBM containing growth
supplements and serum. Media was aspirated, cells washed in RPMI and BEBM added.
The transfection mixture was then added drop-wise to the cells and cultures incubated at
37C in an atmosphere of 5% CO2 / 95% air. siRNA targeted against the protein kinase
MAPK-1 was supplied in the RNAi Human/Mouse Starter Kit and was used as a
positive control since it is ubiquitously expressed in human cell lines. In addition,
scrambled sequences with no homology to mammalian genes were used to control for
non-specific gene knockdown effects.

Figure 3.5: siRNA and transfection reagent optimisation. Differing ratios of
siRNA
to transfection
reagent were trialed
to determine
the optimal ratio required
to allow maximal gene knockdown. Optimisation was performed on both (A)
Healthy cells. (B) Asthmatic cells.
Neg 0.6/3 0.6/6 0.6/9 0.3/3 0.3/6 0.3/90
25
50
75
100
PA
I-1
Exp
ress
ion
(%
)
A
Neg 0.6/3 0.6/6 0.6/9 0.3/3 0.3/6 0.3/90
25
50
75
100
siRNA to transfection reagent ratio (µl)
PA
I-1
Exp
ress
ion
(%
)
B

Stevens 2009
86
______________________________________________________________________
3.3.9 Proliferation Assay with PAI-1 Knockdown
Gene knockdown of PAI-1 with siRNA was performed, as described above, at 24 hours
prior to the start of the proliferation assay. Subsequent repeat siRNA knockdown was
performed at 48, 96 and 144 hours to ensure optimal PAI-1 knockdown. The
proliferation assay was performed as described in Chapter 2.4.12.
3.3.10 Statistics
All statistical analysis conducted in this chapter was performed as outlined in 2.4.14.
All values presented in this chapter are means ± SD and all p values less than 0.05 were
considered to be significant.

Stevens 2009
87
______________________________________________________________________
3.4 Results
3.4.1 Comparison of pAECAA and pAECHNA wound repair ability
The laboratory in which this investigation took place, has previously demonstrated that
pAEC obtained from asthmatic children are intrinsically different to non-asthmatic cells
in terms of cytokine release and proliferative capacity (Kicic et al., 2006). Continuing
this line of investigation, this chapter examined the ability of asthmatic pAECs to repair
mechanically induced wounds in monolayer culture. Wounds induced in pAECHNA were
generally fully closed within 7 days (Figure 3.6). In contrast, the ability of pAECAA to
repair the same size wound was severely compromised (Figure 3.6). Cell migration was
slower at all time points with approximately 50% repair being reached at 10 days.
3.4.2 PAI-1 expression by pAECs
PAI-1 has previously been demonstrated to be elevated in asthma, therefore PAI-1 gene
expression was measured in freshly isolated epithelial cells obtained from 8 AA and 8
HNA children using RT-PCR. Baseline expression of PAI-1 was negligible in pAECHNA
but expression was significantly increased by 68 ± 12 fold in pAECAA (p = 0.0012;
Figure 3.7A).

Figure 3.6: Wound repair comparisons. Wound repair comparison of pAECHNA
(●) and pAECAA
(○). Cells were seeded in 12 well plates, grown to confluence
and mechanically wounded. The degree of wound closure was asses every 12
hours. Wound sites were fully repaired by within 7 days in pAECHNA
. In contrast,
pAECAA
repair was severely compromised with cell migration slower at all time
points. Approximately 50% repair being reached at 10 days.
0 2 4 6 8 10 120
25
50
75
100
Days
Wou
nd
rep
air
(%)

Figure 3.7: PAI-1 gene expression and protein activity. (A) mRNA was
extracted from ex vivo pAECs, RT-qPCR
performed to assess PAI-1 expression,
and pAECAA
PAI-1 levels expressed as a fold change relative to pAECHNA
. PAI-1
mRNA expression was up-regulated 68 fold in asthmatic cells compared to
healthy controls. (B) PAI-1 protein activity was measured in healthy (HNA) and
asthmatic (AA) patient plasma and in pAEC
lysates. There was no difference in
PAI-1 activity in the plasma between AA and HNA subject. PAI-1 activity was
significant greater in the lysates
from pAECAA
compared to pAECHNA
.

A
pAECHNA pAECAA
0
20
40
60
80
100G
ene
Exp
ress
ion
(fol
d c
han
ge r
elat
ive
to H
NA
)
p = 0.0012
Plasma
AA
B
0
250
500
750
1000
1250
1500
PA
I-1
Act
ivit
y (n
g/m
l/10
6 cel
ls)
p = 0.2084
p < 0.0001
HNA
Cell Lysates
AAHNA

Stevens 2009
88
______________________________________________________________________
3.4.3 Cellular pAEC and plasma PAI-1 protein activity
The up-regulation of PAI-1 gene expression was mirrored by substantially elevated
protein production and activity. PAI-1 activity in lysates from pAECAA (1256 ± 20
ng/ml) was significantly higher than from cells collected from pAECHNA (448 ± 17
ng/ml, p < 0.0001; Figure 3.7B). However, there was no statistical difference in PAI-1
activity in plasma taken from the children at the time epithelial cells were obtained (p =
0.2084; Figure 3.7B).
3.4.4 PAI-1 expression in proliferating pAEC
To investigate whether PAI-1 is involved in epithelial cell proliferation, we first
compared PAI-1 mRNA expression between non-proliferating and proliferating-
subcultured cells (Figure 3.8). Non-proliferating cells were obtained from cultured
pAECs that were allowed to enter a state of quiescence. Results obtained showed that
following 2 passages, PAI-1 gene expression was further increased in both pAECAA
(550 ± 29 fold, p = 0.0042) and pAECHNA (561 ± 38 fold, p = 0.0016) compared to non-
proliferating cells. There was no statistical difference (p = 0.2364) in PAI-1 expression
between proliferating pAECHNA and pAECAA.

HNA AA HNA AA
0
100
200
300
400
500
600
700
800
p = 0.0016
p = 0.0042
p = 0.2364
Figure 3.8: PAI-1 expression during proliferation. PAI-1 mRNA
expression
was assessed using
RT-qPCR
analysis of in non-proliferating and
proliferating sub-cultured healthy (□) and asthmatic cells (■). PAI-1
expression was significantly increased in both pAECAA
(550
±
29 fold) and
pAECHNA
(561 ±38 fold) compared to non-proliferating cells. There was no
statistical difference in PAI-1 expression between proliferating pAECHNA
and pAECAA
.
Non-Proliferating Proliferating
Gen
e E
xpre
ssio
n(f
old
ch
ange
rel
ativ
e to
HN
A)

Stevens 2009
89
______________________________________________________________________
3.4.5 PAI-1 siRNA knockdown
To investigate the role of PAI-1 in cell proliferation and repair we utilized siRNA to
knockdown PAI-1 mRNA expression and subsequent protein production. A greater than
80% knockdown (p < 0.0001) of PAI-1 mRNA was achieved following siRNA
transfection in pAECHNA and pAECAA compared to untreated cells of the same
phenotype (Figure 3.9A). To confirm PAI-1 mRNA knockdown resulted in reduced
protein production, we measured PAI-1 activity in the culture medium of pAEC before
and following siRNA knockdown (Figure 3.9B). Following knockdown, protein activity
was significantly reduced by ≥ 50% and ≥ 65% at 48 and 72 hours respectively
3.4.6 Effect of PAI-1 mRNA knockdown on pAEC proliferation
It has previously demonstrated that the rates of proliferation between pAECAA and
pAECHNA differ (Kicic et al., 2006). This investigation has confirmed that pAECAA
proliferate at a faster rate than pAECHNA (Figure 3.10). Gene knockdown experiments
were performed using siRNA targeted against PAI-1 to assess its role in pAEC
proliferation. Gene knockdown of PAI-1 significantly reduced the rate of proliferation
in pAECHNA at all time points to a maximum of 36% after 6 days (p = 0.0013). Similar
results were seen following PAI-1 knockdown in pAECAA, where maximal inhibition of
43% was observed after 5 days (p = 0.0003; Figure 3.10).

Figure 3.9: PAI-1 siRNA
knockdown. (A) Knockdown of PAI-1 mRNA expression with siRNA. A greater than 80% knockdown (p <
0.0001) of PAI-1 mRNA was achieved following siRNA
transfection
in pAECHNA
and pAECAA
(B) PAI-1 protein activity in pAECHNA
with (light gray) and without (white) PAI-1 knockdown, and pAECAA with (black) and without (dark grey) PAI-1 knockdown. Protein
activity was significantly reduced in both cell phenotypes after
48 and 72 hours.
Neg C Pos C HNAsiRNA AAsiRNA
0
20
40
60
80
100
p < 0.0001
% P
AI-
1 m
RN
A E
xpre
ssio
n
Sample
A B
Time (Hours)
0
500
1000
24 48 72
1500
PA
I-1
Act
ivit
y (n
g/m
l/10
6 cel
ls)
*
*
*
*
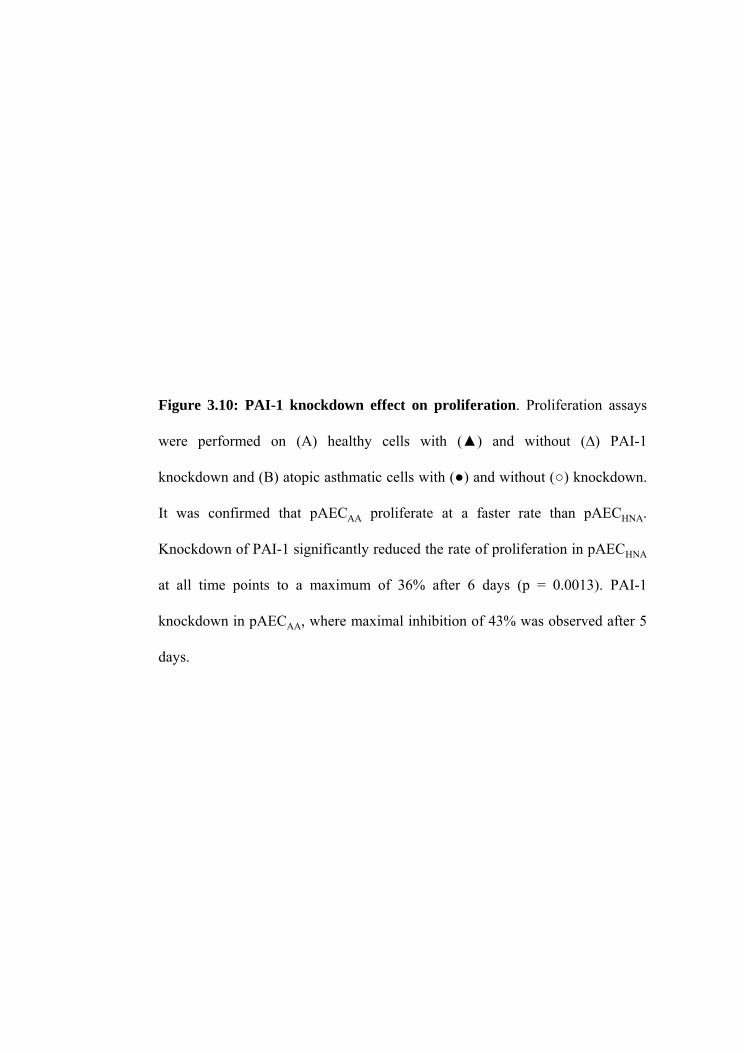
Figure 3.10: PAI-1 knockdown effect on proliferation. Proliferation assays
were performed on (A) healthy
cells with (▲) and without (∆) PAI-1
knockdown and (B) atopic asthmatic
cells with (●) and without (○) knockdown.
It was confirmed that pAECAA
proliferate at a faster rate than pAECHNA
.
Knockdown of PAI-1 significantly reduced the rate of proliferation in pAECHNA
at all time points to a maximum of 36% after 6 days (p = 0.0013). PAI-1
knockdown in pAECAA
, where maximal inhibition of 43% was observed after 5
days.

A
0.00
0.25
0.50
0.75
1.00
0 1 2 3 4 5 6
OD
@ 4
92n
m
B
0.00
0.25
0.50
0.75
1.00
0 1 2 3 4 5 6
Time (Days)
OD
@ 4
92n
m

Stevens 2009
90
______________________________________________________________________
3.4.7 PAI-1 mRNA expression and protein activity following wounding
To evaluate the role of PAI-1 in wound repair, we measured PAI-1 expression and
release following wounding of pAEC. As shown in Figure 3.11, basal expression of
PAI-1 was 68 fold greater in the pAECAA compared to their healthy counterparts.
However, wounding of pAECs resulted in production and release of PAI-1. When
pAECHNA were wounded, PAI-1 mRNA expression increased to a maximum of 2.6 fold
(over unwounded cells) after two days (p < 0.0001) with expression returning to
baseline after 8 days (Figure 3.11). However, although wounding in pAECAA resulted in
elevated PAI-1, mRNA expression levels were only increased to a maximum of 1.5 fold
(over unwounded pAECAA cells) after 2 days (p = 0.0040; Figure 3.11).
3.4.8 PAI-1 protein expression after wounding
When protein activity was assessed, PAI-1 activity was found to mimic mRNA
expression with significantly elevated activity measured, namely 662ng/ml (p = 0.0254)
and 1116ng/ml (p < 0.0001) after 2 days and 3 days respectively in the pAECHNA
(Figure 3.12). PAI-1 activity in pAECAA supernatants was also significantly elevated to
1755ng/ml (p < 0.0001) after 3 days though the elevation recorded at 2 days was not
considered significant (p = 0.0558; Figure 3.12). Measured PAI-1 protein activity was
approximately 3 fold greater (1300ng/ml) in the pAECAA when compared to pAECHNA

Days after woundingU 1 2 3 4 5 6 7 8 9 10 11
0
1
2
3
4
5
60
70
80
90
100
110
*
*G
ene
Exp
ress
ion
(fol
d c
han
ge r
elat
ive
to H
NA
)
Figure 3.11: PAI-1 mRNA expression after wounding. PAI-1 gene expression was measured following wounding of healthy (white) and
asthmatic cells (black). Gene expression was significantly (*) increased 2 days after wounding in both healthy and asthmatic cells.
Unwounded (U) levels in asthmatic cells were significantly (68 fold) greater than healthy cells. Gene expression between healthy and
asthmatic cells was significantly different at all time points.

Stevens 2009
91
______________________________________________________________________
(450ng/ml; p = 0.0002) 1 day post wounding. Significant differences between pAECHNA
and pAECAA PAI-1 activity were also observed after 2 (p = 0.0003) and 3 (p = 0.0012)
days post wounding.
3.4.9 PAI-1 mRNA silencing delays wound closure
To confirm that the increase in PAI-1 expression observed following wounding was
playing a functional role in epithelial repair, the wound experiments were repeated
following knockdown of PAI-1 expression. Untreated pAECHNA demonstrated almost
complete wound closure by 3 days (86% closure), whereas in siRNA treated cultures,
wound closure was markedly delayed (31% closure; Figure 3.13). Wound repair in
pAECAA was markedly slower than pAECHNA, with untreated cultures showing only
16% wound closure after 3 days and PAI-1 knockdown completely inhibiting wound
repair (2% closure; Figure 3.13).

Figure 3.12: PAI-1 protein expression after wounding. PAI-1 protein activity
following wounding of pAECHNA
(□) and pAECAA
(■). The elevation in protein
activity observed between day 1 and day 3 was significant in both cell
phenotypes. The PAI-1 levels of healthy and asthmatic cells were significantly
different at all time points (*)
A
1 2 30
500
1000
1500
2000
2500
Days after wounding
PA
I-1
Act
ivit
y (n
g/m
l106 c
ells
)
p < 0.0001
p < 0.0001
*
*
*
*
*
*

0 24 48 72
0
25
50
75
100
Time (hours)
Wou
nd
rep
air
(%)
Figure 3.13: PAI-1 knockdown and wound repair. Wound repair following
PAI-1 mRNA knockdown in pAECHNA
with (●) and without (○) PAI-1
knockdown and atopic asthmatic cells with (▲) and without (∆) knockdown.
After 72 hours the silenced pAECHNA
demonstrated minimal cell infiltration
whereas the control wounds displayed marked infiltration and near wound
closure. Wound repair was slower in the pAECAA
. The untreated pAECAA
only
achieved 16% wound closure after 72 hours and the silenced pAECAA
completely
inhibited wound repair at all time points.

Stevens 2009
92
______________________________________________________________________
3.5 Discussion
This chapter has demonstrated that pAECs from asthmatic children display an inherent
inability to repair mechanically induced wounds. It has also been shown that expression
and activity of PAI-1 was markedly greater in pAECs isolated from asthmatic children
compared to epithelial cells from healthy non-asthmatic controls and this elevation
appears confined to the epithelium since PAI-1 levels in the plasma obtained at the
same time as epithelial brushings were not different. It was also observed that PAI-1
expression was elevated in both normal and asthmatic cells during proliferation. In
addition, a significant elevation was observed following wounding in cells from both
cohorts, although total PAI-1 levels were greater in pAECAA. This chapter confirmed a
functional role of PAI-1 by showing that PAI-1 siRNA slowed epithelial cell
proliferation and delayed wound closure in vitro. Collectively, these data indicate that a)
PAI-1 release is a normal physiological response to epithelial injury and b) supports the
hypothesis that the inability to successfully repair damaged epithelium is responsible for
continued elevation of PAI-1 levels in asthma.
The continued exposure of the airways to foreign particles may contribute to the
development of the oedema, bronchoconstriction and inflammation commonly observed
in asthma. Therefore, it is essential that damaged or shed airway epithelium is
successfully repaired to prevent further complications. The immediate response to

Stevens 2009
93
______________________________________________________________________
injury involves migration of epithelial cells adjacent to the wound to form a temporary
barrier consisting of poorly differentiated and highly spread cells often associated with
inflammatory cells (Erjefalt et al., 1995). This transient repair is likely to provide some
barrier function, however the cells are unlikely to perform normal secretory functions. A
period of cell proliferation and differentiation follows until complete restoration of
normal epithelial function is achieved. It has been demonstrated in this chapter that
pAECs isolated from asthmatic children possess an inability to successfully repair
mechanically induced wound sites in comparison to healthy pAECs. The rates of
cellular repair reported in this chapter are slower than those previously reported (White
et al., 2005). However, it can be argued that a direct comparison between these two
studies may not be accurate. Firstly, the cohort subjects vary and thus one cannot
disregard the possibility that repair processes do differ between adult and paediatric
airway cells. Secondly, variations exist in the in vitro culture conditions, namely the
culture media and the coating buffers utilized. Furthermore, it has been reported
previously that pAEC obtained from asthmatic children are intrinsically different to
non-asthmatic cells (Kicic et al., 2006) in that primary cells derived from asthmatic
children proliferate faster than their healthy counterparts. However, despite the higher
proliferative capacity of the pAECAA, these cells lack the ability to successfully heal
mechanically induced wounds. Taken together, these data support the hypothesis that
asthmatic pAEC are inherently abnormal and this is the first investigation to
demonstrate dysregulated repair by pAECs from asthmatic children. The mechanisms
responsible the observed higher proliferative capacity of pAECAA and the associated

Stevens 2009
94
______________________________________________________________________
delayed wound repair are not forthcoming and require further investigation. In contrast
to the findings of this study, Ricciardolo and colleagues have reported epithelial
proliferation after two days post allergen challenge and have suggested this should
accelerate the restoration of the epithelium in asthma (Ricciardolo et al., 2003). As
optimal wound repair is dependent on the influx of cells into the wound area, future
experimentation is required to investigate the role of the leading edge of the wound site
in pAECAA. The investigation into the migration of pAECAA cells into the wound site
during the repair process is required to help elucidate why these cells are successfully
proliferating with minimal wound closure. Using the established culture and wound
repair model presented in this study, future comparison of adult AECs and pAECs
would also aid in determining if the observed intrinsic differences reported here are
limited to child derived cells.
The conversion of plasminogen to plasmin is tightly regulated by plasminogen
activators (uPA and tPA) (Vassalli et al., 1991) and their inhibitors (PAI-1 and PAI-2)
(Kruithof, 1988). Plasmin has been well characterised as being capable of degrading the
protein component of ECM, via the removal of glycoproteins (Montgomery et al., 1993)
and activation of MMPs (Werb et al., 1980, Moscatelli and Rifkin, 1988, Matrisian,
1990, Kleiner and Stetler-Stevenson, 1993). A consistent structural change observed in
the airways of patients with asthma is deposition of collagen and fibrin in the ECM
(Roche et al., 1989). Studies reporting decreased plasmin levels, via the knockout of
plasminogen (Swaisgood et al., 2000) or the over expression on PAI-1 (Eitzman et al.,

Stevens 2009
95
______________________________________________________________________
1996), also observed increased collagen content and fibrin accumulation. Conversely,
PAI-1 knockout is associated with protection from fibrin accumulation in the airways
and lungs (Carmeliet et al., 1993b, Barazzone et al., 1996, Eitzman et al., 1996). Based
on elevated PAI-1 levels in asthma (Tutluoglu et al., 2005), as well as reports of PAI-
1’s role in cell migration (Planus et al., 1997, Waltz et al., 1997, Isogai et al., 2001,
Providence and Higgins, 2004, Wang et al., 2005) and repair (Providence and Higgins,
2004, Wang et al., 2005), the expression and role of PAI-1 in pAEC repair were
investigated.
This study is the first to demonstrate up-regulation of the PAI-1 gene in asthmatic
epithelial cells. In addition, the relative contribution of airway epithelial cells as a
source of PAI-1 has been highlighted. This investigation reports an average PAI-1
protein level of 448.0 ± 17 per 1x10⁶ pAECHNA cells and 1256.0 ± 20.0 per 1x10⁶
pAECAA cells. Of the few studies that have investigated PAI-1 expression, Cho and
colleagues reported an increase in PAI-1 expression in stimulated mast cells using
microarray and Northern blots (171.5 ± 6.6 per 1x10⁶ human mast cells-1 cells and
140.8 ± 6.3 per 1x10⁶ primary cultured mast cells; (Cho et al., 2000). In addition, Chu
and colleagues demonstrated increased PAI-1 expression in human bronchial epithelial
cells following mechanical stimulation (Chu et al., 2006). There are conflicting reports
regarding asthma and plasma levels of PAI-1. Similar to the findings of this chapter,
Banach-Wawrzenczyk and colleagues showed that plasma levels of PAI-1 in adults with
mild asthma are similar to those of healthy controls (Banach-Wawrzenczyk et al.,
Stevens 2009
96
______________________________________________________________________
2000). In contrast, Tutluoglu and colleagues demonstrated significant increases in
plasma PAI-1 levels in subjects hospitalized with asthma attacks. They documented a
further increase in PAI-1 seven days post treatment (Tutluoglu et al., 2005). The
reasons for this are unknown, but may be related to asthma severity.
While there was no difference in plasma PAI-1 activity, this chapter demonstrated
increased PAI-1 activity in pAECAA lysates compared to pAECHNA, suggesting that
elevations in PAI-1 activity are specific to the airway epithelium. This finding is
consistent with Xiao and colleagues who demonstrated elevated PAI-1 levels in sputum
obtained from adult asthmatics (Xiao et al., 2005). Moreover, the increase in PAI-1
expression and activity was observed despite the absence of an exacerbation or clinical
symptoms of disease.
In the current study, expression of PAI-1 was increased by over 500 fold during serial
proliferation in both pAECAA and pAECHNA. In addition, gene silencing resulted in a
substantial decrease in proliferation of both pAECAA and pAECHNA cells supporting a
role for PAI-1 in epithelial cell replication. Despite its effects on proliferation, whether
PAI-1 plays a role in wound repair is controversial. For example, wound repair in skin
cells has been reported to be accelerated in the absence of PAI-1, but not plasmin (Chan
et al., 2001), implying that elevated plasmin (due to a lack of PAI-1), may aid in wound
closure. Supporting this further, deficiencies in plasmin have been shown to result in
defective wound repair in hepatic cells (Bezerra et al., 1999, Ng et al., 2001). However,

Stevens 2009
97
______________________________________________________________________
others have reported the up-regulation of PAI-1 in response to wounding of rat
keratinocytes (Providence et al., 2000). In support of this, in the current study, it has
demonstrated that a marked elevation in PAI-1 expression exist following wounding in
normal and asthmatic airway epithelial cells. Interestingly, while the percentage
elevation observed was greater in the pAECHNA, due to the higher baseline expression
of PAI-1 by asthmatic cells, the total PAI-1 levels were greater in these cells following
wounding. Taken together, these data suggest PAI-1 release is a normal response to
bronchial epithelial injury and occurs in both normal and asthmatic epithelium.
In wound repair experiments, this investigation showed that PAI-1 knockdown resulted
in a markedly reduced capacity for cell migration and as a consequence, delayed wound
closure in pAEC monolayers. These observations agree with those of Providence and
colleagues who reported that PAI-1-/- keratinocytes displayed a marked reduction in
wound closure and that the subsequent addition of active PAI-1 restored normal wound
repair (Brooks et al., 2000, Providence et al., 2000, Providence and Higgins, 2004). The
effect of gene silencing in pAECAA was more difficult to assess due to the already
reduced rate of repair observed in these cells. Previous work performed in keratinocytes
has established the association of PAI-1 expression and leading wound edges (Li et al.,
2000, Weckroth et al., 2001, Weckroth et al., 2004) and more recently, Marquerlot and
colleagues (Maquerlot et al., 2006) have shown in alveolar epithelial cells that the
availability of matrix-bound-PAI-1 is required for efficient healing. Moreover,
immediately after wounding, PAI-1 was shown to be dramatically increased in the

Stevens 2009
98
______________________________________________________________________
newly deposited matrix at the leading edge of wounds. Collectively, these results
propose a dual role for PAI-1 in epithelial cell wound healing, both as a soluble
inhibitor of proteolysis and also as a matrix-bound regulator of cell migration.

Stevens 2009
99
______________________________________________________________________
3.6 Conclusion
In conclusion, pAECs from asthmatic children lack the ability to successfully repair
mechanically induced wounds. PAI-1 mRNA expression and protein production are
elevated in pAECAA and in response to wounding and PAI-1 appears to play a
functional role in the pAEC proliferation and repair process in normal cells only, since
the elevated levels produced by asthmatic cells does not aid in effective epithelial repair.
These data suggest that PAI-1 release is a normal response to epithelial injury and that
an inability to successfully repair damaged epithelium results in elevated PAI-1
expression in asthma.

Stevens 2009
100
______________________________________________________________________
Chapter 4: Airway Epithelial Matrix
Metalloproteinases and Tissue Inhibitors in
Asthma
4.1 Introduction
Asthma is a complicated disease that is characterised by structural airway changes that
include including epithelial damage (Jeffery et al., 1989, Montefort et al., 1993, Jeffery
et al., 2000, Davies, 2001) and extracellular matrix (ECM) deposition (Roche et al.,
1989). The results generated in Chapter 3 demonstrated an increased inhibition of the
PAS (which regulates ECM deposition) in asthma, characterised by the elevated PAI-1
activity observed. Due to the proteolytic capacity of matrix metalloproteinases (MMPs),
attention was focused on their role in asthma pathogenesis and airway remodelling.
MMPs are a family of zinc and calcium-dependent enzymes that are involved in ECM
turnover (Woessner, 1991). Based on specificity to substrate, a number of MMP
subclasses have been identified, these include the collagenases, gelatinases,
stromelysins and membrane-type MMPs (MT-MMPs) (Mautino et al., 1999). The
activation of MMPs is performed by proteases such as plasmin, trypsin, plasminogen

Stevens 2009
101
______________________________________________________________________
activators, elastase and other MMPs. A family of specific inhibitors termed tissue
inhibitors of MMPs (TIMPs), as well as α-2 macroglobulin, are responsible for the
regulation of MMP activity. The TIMP family of inhibitors consists of four structurally
related members: TIMP-1, -2, -3 and -4 and it is TIMP-1 and TIMP-2 that are able to
form complexes with and inhibit pro-MMP-9 and pro-MMP-2, respectively. Many
components of the ECM are degraded by MMP-9 and MMP-2 (Nagase and Woessner,
1999). It has been reported that Pro-MMP-2 is activated by a two stage process
involving the recruitment to the cell surface by interacting with TIMP-2 bound to
MMP-14 (MTI-MMP) (Murphy et al., 1999), and that in addition to MMP-2 activation,
MMP-14 possesses its own gelatinolytic activity (Imai et al., 1996). The smallest
member of the MMP family is MMP-7, often referred to as matrilysin, is primarily
produced by the mucosal epithelia. It has been reported to play a role in innate defence
and re-epitheliasation and possesses the capacity to degrade a broad spectrum of
substrates, although the proteolytic role of MMP-7 in asthma is not yet fully understood.
Confounding factors such as disease severity, patient age, corticosteroid use and sample
location have lead to differing reports on the MMP levels in asthma. A reduced ratio of
MMP-9 to TIMP-1 has been reported in BAL samples from children with stable asthma
(Doherty et al., 2005), as well as sputum from asthmatic adults (Matsumoto et al.,
2005). Similarly, Cataldo et al reported increased TIMP mRNA expression in sputum
cell pellets from mild asthmatics in the absence of elevated MMP-9 (Cataldo et al.,

Stevens 2009
102
______________________________________________________________________
2004). These data suggest that an imbalance between MMPs and their inhibitors may
have a functional role in asthma progression and airway remodelling.
This investigation hypothesises that in mild childhood asthma, there is reduced MMP
expression in the airway epithelium with a resultant decrease in the MMP to TIMP
ratios. To address this, AEC’s were obtained from healthy non-atopic non-asthmatic
(HNA) and atopic asthmatic (AA) children. Quantitative PCR (qPCR) was used to
assess MMP and TIMP mRNA expression, whilst immunohistochemistry and gelatin
zymography were used to demonstrate MMP protein expression and activity. Reverse
zymography was used to assess TIMP production.

Stevens 2009
103
______________________________________________________________________
4.2 Materials
The general materials used in this part of the investigation and the suppliers are listed in
detail in Chapter 2.1: “General Materials.” Material specific to this section of the
investigation were:
Material, Supplier, Suppliers location (city, state, country)
30% Acrylamide/Bis solution, Bio-Rad Laboratories, Hercules, CA, USA.
Ammonium Persulfate, Bio-Rad Laboratories, Hercules, CA, USA.
Antibodies, R&D, Minneapolis, MN, USA.
Benchmark™ Pre-stained Protein Ladder, Bio-Rad Laboratories, Hercules, CA, USA.
Brij-35, Sigma, St. Louis, MO, USA.
Bromophenol Blue, Sigma, St. Louis, MO, USA.
Commassie Blue R-250, Bio-Rad Laboratories, Hercules, CA, USA.
Formalin, Sigma, St. Louis, MO, USA.
Gelatin, Sigma, St. Louis, MO, USA.
Glycine, Sigma, St. Louis, MO, USA.
NNN’N’- Tetramethylethylenediamine (TEMED), Sigma, St. Louis, MO, USA.
Saponins, Sigma, St. Louis, MO, USA.
Sodium dodecyl sulfate, Sigma, St. Louis, MO, USA.

Stevens 2009
104
______________________________________________________________________
Sudan Black B, Sigma, St. Louis, MO, USA.
Tris-EDTA, Sigma, St. Louis, MO, USA.
Triton X-100, Sigma, St. Louis, MO, USA.
Trizma acid, Sigma, St. Louis, MO, USA.
Trizma base, Sigma, St. Louis, MO, USA.

Stevens 2009
105
______________________________________________________________________
4.3 Buffers and Solutions
The general buffers and solutions used in this part of the investigation are described in
detail in Chapter 2.3: “General Buffers and Solutions.” Buffers and/or solutions specific
to this section of the investigation were:
4.3.1 0.1% Bromophenol blue stock solution
To make 100 ml of 0.1% Bromophenol Blue solution, 100 mg of Bromphenol powder
was dissolved in to 100 ml of ddH2O.
4.3.2 TBS saponin solution
To make 1000 ml of 1% saponin TBS solution, 10 g of saponin were dissolved into
1000 ml of pre-made TBS solution (refer to 2.3.1.3).
4.3.3 Sudan black B quenching solution (0.5%)
To make 50 ml of 0.5% Sudan Black B Quenching solution, 250 mg of Sudan Black B
was dissolved into 15 ml of ddH2O and 35 ml of ethanol.

Stevens 2009
106
______________________________________________________________________
4.3.4 Blocking buffer
To make 50 ml of blocking buffer, 2.5 g of BSA was dissolved in 25 ml of PBS. Fifty
microliters of Triton X-100 and 500 µl of 1% saponin solution were added and the
volume made up to 50 ml with PBS. The solution was stored at 4°C.
4.3.5 Neutral buffered formalin (NBF)
Neutral buffered formalin (NBF) was prepared by adding 100 ml of formalin (40%
aqueous solution of formaldehyde), 4 g of NaH2PO4 and 6.5 g of NaHPO4 into 900 ml
of ddH2O. The solution was stored at 4°C.
4.3.6 Sodium dodecyl sulfate solution (10%)
To make 100 ml of 10% sodium dodecyl sulfate (SDS) solution, 10 g of SDS was
dissolved into 100 ml of ddH2O. The solution was stored at RT.

Stevens 2009
107
______________________________________________________________________
4.3.7 Gelatin solution (1%)
To make 10 ml of 1% gelatin solution, 100 mg of gelatin was dissolved into 10 ml of
ddH2O with the use of a heating block. The solution was stored at 4°C for up to 2
weeks.
4.3.8 Stacking gel (3.9%)
To make a 3.9% stacking gel for zymography, 1.3 ml of 30% Acrylamide/Bis solution,
2.5 ml 0.5 M Tris-Cl, 100 µl of 10 % SDS, 50 µl of ammonium persulfate (APS) and 10
µl of TEMED were added to 6.0 ml of ddH2O.
4.3.9 Separating zymography gel (7.5%)
To make a 7.5% separating gel for zymography, 2.5 ml of 30% Acrylamide/Bis
solution, 2.5 ml 1.5 M Tris-Cl, 1.0 ml of 1% gelatin, 100 µl of 10% SDS, 50 µl of APS
and 5 µl of TEMED were added to 3.9 ml of ddH2O.

Stevens 2009
108
______________________________________________________________________
4.3.10 Separating reverse zymography gel (12%)
To make a 12% separating gel for reverse zymography, 4.0 ml of 30% Acrylamide/Bis
solution, 2.5 ml 1.5 M Tris-Cl, 1.0 ml of 1% gelatin, 1.0 ml of 16HBE14o- conditioned
culture media, 100 µl of 10% SDS, 50 µl of APS and 5 µl of TEMED were added to
1.35 ml of ddH2O.
4.3.11 Separating reverse zymography gel (15%)
To make a 15% separating gel for reverse zymography, 5.0 ml of 30% Acrylamide/Bis
solution, 2.5 ml 1.5 M Tris-Cl, 1.0 ml of 1% gelatin, 1.0 ml of 16HBE14o- culture
media, 100 µl of 10% SDS, 50 µl of APS and 5 µl of TEMED were added to 0.4 ml of
ddH2O.
4.3.12 Zymography sample buffer
A 5x non-reducing sample buffer was made by adding 2.0 ml of glycerol, 4.0 ml of 10%
SDS, 2.5 ml of 0.5M Tris-Cl, and 0.5 ml of 0.1% Bromo Phenol Blue to 1.0 ml of
ddH2O. Aliquots were made and stored at -20°C.

Stevens 2009
109
______________________________________________________________________
4.3.13 Zymography running buffer
To make 1000 ml of 10 x running buffer 30.3g of Tris Base, 144 g of glycine and 10 g
of SDS were added to 1000 ml of ddH2O and the pH adjusted to 8.3. The solution was
stored at 4°C.
4.3.14 Zymography renaturing buffer
A 10 x solution of renaturing buffer was made by combining 25 ml of Triton X-100
with 75 ml of ddH2O. A working concentration was achieved by diluting 1 part buffer
with 9 parts ddH2O. The solution was stored at 4°C.
4.3.15 Zymography developing buffer
A 10 x solution of developing buffer was made by diluting 117g of NaCl, 12.1g of Tris
Base, 63 g of Tris HCL, 7.4 g of CaCl2, and 2 ml of Brij-35 into 1000 ml of ddH2O. A
working concentration was achieved by diluting 1 part buffer with 9 parts ddH2O. The
solution was stored at 4°C

Stevens 2009
110
______________________________________________________________________
4.3.16 Zymography stain
To make 500 ml of 0.5% Coomassie Blue stain 2.5 g of Coomassie Blue powder was
dissolved into 250 ml methanol, 50 ml acetic acid and 250 ml ddH2O. The solution was
stored at RT.
4.3.17 Zymography destain solution
To make 500 ml destain solution, 250 ml methanol, 50 ml acetic acid and 250 ml
ddH2O were combined. The solution was stored at RT.

Stevens 2009
111
______________________________________________________________________
4.4 Methods
4.4.1 Patients and sample collection
As described in chapter 2.4.2.1, two cohorts were used in this study, for this section of
the investigation, samples from 10 AA children, who did not previously receive any
corticosteroid therapy, and 10 HNA children were used (See Table 4.1). Please refer to
Chapter 2.4.1.1 and 2.4.3 for information on asthma/allergy diagnosis and sample
collection. In addition to pAEC collection, 10 ml of whole blood was collected into
heparin sodium, mixed, transported back to the laboratory and processed to collect
plasma.
4.4.2 Cell subculture and media collection
The methodology used for the culture of primary AEC and cell lines, and the collection
of culture medium has been described in full in Chapter 2.4.4 - 2.4.6.

Stevens 2009
112
______________________________________________________________________
4.4.3 Protein extraction and quantitation
Extraction and quantitation of protein from AECs is described in full in Chapter 2.4.9-
2.4.10.
4.4.4 Reverse Transcriptase-Polymerase Chain Reaction and Quantitative
Polymerase Chain Reaction
Extraction and quantitation of RNA, as well as the methodology for RT-PCR are
described in detail in Chapter 2.4.11.
4.4.5 Immunocytochemistry
MMP protein expression was detected via fluorescent immunocytochemistry on neutral
buffered formalin fixed pAEC preparations. Briefly, cytospin preparations were
quenched 200 µl of 0.5% (w/v) Sudan Black B in 70 % ethanol for 20 minutes to reduce
auto-fluorescence. Slides were rehydrated with PBS before being flooded with 25 µg/ml
of proteinases K for 30 minutes at 37C. Parafilm was placed over the slides to prevent
drying. Slides were washed 3 times with PBS and blocked for 60 minutes at RT using
blocking buffer. The slides were incubated with MMP-2 (1:100) or MMP-9 (1:100)
mouse anti-human antibodies for 24 hours at 4C, washed and fluorescently labelled
Stevens 2009
113
______________________________________________________________________
with an anti-mouse FITC antibody (1:100) for 24 hours at 4C. Detection of
fluorescence was achieved with a Leica inverted fluorescent microscope (Wetzlar,
Germany).
4.4.6 Zymography
4.4.6.1 Gelatin Zymography
MMP-2 and MMP-9 activity in pAEC cell lysates, culture medium and plasma were
detected by gelatin zymography. The method was based on that of Kleiner and Stetler-
Stevenson (Kleiner and Stetler-Stevenson, 1994) and Riley et al (Riley et al., 1999)
with minor modifications. Briefly, 8% SDS-gels containing 1mg/ml of gelatin were
overlaid with a 3.9% stacking gel. Samples were then mixed 1:1 (vol/vol) with 5x non-
reducing sample buffer containing 20% (vol/vol) glycerol, 100mg/ml SDS, 100 mM
Tris-Cl pH 6.8, and 10 mg/ml Bromo Phenol Blue for 10 minutes at RT. An equal
amount of total protein or sample volume was then loaded and gels electrophoresed at
120V for approximately 40 minutes. Gels were then removed from the glass plates and
washed in deionised water (dH2O) for 5 minutes at RT before being washed three times
in renaturing buffer (2.5% (vol/vol) Triton X-100) with gentle agitation. After a 5
minutes wash in dH2O, gels were then incubated in developing buffer (200 mM NaCl,
50 mM Tris, 5 mM CaCl2, and 0.02% (vol/vol) Brij-35) for 30 minutes at RT and then

Stevens 2009
114
______________________________________________________________________
again in fresh developing buffer at 37C overnight. The following day, gels were
washed in dH2O and immersed in staining solution (0.5% (vol/vol) Coomassie Blue
R250 in 50% (vol/vol) methanol, 10% (vol/vol) acetic acid and 40% (vol/vol) dH2O) for
30 minutes then destained in dH2O for 30 minutes at RT to remove excess stain. Further
destaining was performed in destain solution (50% (vol/vol) methanol, 10% (vol/vol)
acetic acid and 40% (vol/vol) dH2O). Clear bands of gelatin degradation were then
visualized, photographed and sizes compared to an included protein ladder. MMP
activity was then semi-quantitated using Quality One densitometry software (BIORAD,
NSW, Australia).
4.4.6.2 Reverse Zymography
TIMP1 and TIMP2 activity was measured using reverse zymography. Reverse
zymography is an electrophoresis technique in which gelatin and MMPs are
incorporated directly into the acrylamide gels. Following staining, darker bands
representing TIMP activity appear on a lighter staining back ground. Briefly, 15% SDS
gels containing 1mg/ml of gelatin and 1 to 2 ml of conditioned culture medium from a
16HBE14o- cell line that was found to demonstrate MMP-2 and MMP-9 activity (data
not shown), were overlaid with a 3.9% stacking gels. Samples were then mixed 1:1
(vol/vol) with the 5x non-reducing sample buffer mentioned previously for 10 minutes
at RT. An equal amount of total protein or sample was then loaded and gels
Stevens 2009
115
______________________________________________________________________
electrophoresed at 120V for 40 to 90 minutes. Gels were then washed in dH2O for 5
minutes at RT before being washed three times in the re-naturing buffer with gentle
agitation. After washing in dH2O, gels were incubated in developing buffer as
mentioned above, washed again, immersed in staining solution for 30 minutes at RT
and finally destained in dH2O for a further 30 minutes to remove any excess stain.
Additional destaining was performed using the destain solution mentioned previously
until bands of TIMP activity were visible against a lighter background. Bands were then
visualized, photographed and sizes compared to a protein ladder standard and activity
determined using densitometry.
4.4.7 IL-13 Assay
IL-13 was measured from supernatants of pAEC cultures using an in-house time
resolved fluorometry detection system (DELFIA, Wallac, Turku, Finland) based on that
described by Taylor et al (Taylor et al., 2007). The methodology is described in detail
Chapter 2.4. Briefly, the DELFIA method was followed by using paired antibodies
(Pharmingen, Sydney, NSW, Australia) and the biotinylated secondary antibody was
detected using Europium–labeled streptavidin (Wallac) and fluorescence was quantified
using a fluorometer (Wallac VICTOR2; PerkinElmer Life Sciences, Boston, MA,
USA). Standard curves were generated using serial dilutions of recombinant human IL-

Stevens 2009
116
______________________________________________________________________
13 (Pharmingen) and were linear between 3 and 30,000pg/ml with a detection limit of 3
pg/ml and sample concentrations determined from triplicate values.

Stevens 2009
117
______________________________________________________________________
4.5 Results
4.5.1 MMP and TIMP mRNA expression
Overall the expression of pAEC specific MMPs were observed to be much lower in AA
children compared to pAEC from HNA children. Expression of MMP-9 was
significantly lower (7.7 fold) (p = 0.002) lower than controls whilst levels of MMP-2
(7.4 fold) (p = 0.004), MMP-14 (1.7 fold) (p = 0.0004) and MMP-7 (10.4 fold) (p =
0.0002) were also significantly lower (Figure 4.1). Gene expression of TIMP-1 and
TIMP-2 were also significantly down-regulated by 1.2 fold (p = 0.0228) and 1.8 fold (p
= 0.0005) respectively (Figure 4.1).
4.5.2 MMP and TIMP protein production
Due to the essential role the gelatinases play in ECM turn over, the focus of this
investigation became the activity of MMP-2 and MMP-9. Immunohistochemical
staining of cytospin preparations was used to demonstrate the presence of MMP protein
in pAEC. The staining observed in the pAECAA was visibly reduced in comparison to
pAECHNA. This observation indicates that protein expression of both MMP-2 and

Figure 4.1: MMP and TIMP mRNA production. The expression of MMPs
and
TIMPs
demonstrated down-regulation in pAECAA
in relation to pAECHNA
mRNA
expression; MMP-2: 7.4 down fold, MMP-9: 7.7 down fold, MMP14: 1.7 down
fold, MMP-7: 10.4 down fold, TIMP-1 1.2 down fold and TIMP-2: 1.8 down fold.
The * indicates statistical difference between HNA and AA.
TIMP-1 MMP-14 TIMP-2 MMP-2 MMP-9 MMP-7-12.5
-10.0
-7.5
-5.0
-2.5
0.0
Gen
e E
xpre
ssio
n (
fold
ch
ange
) ** *
**
*

Stevens 2009
118
______________________________________________________________________
MMP-9 were lower in cells from AA children and corroborated the initial gene
expression analysis (Figure 4.2).
4.5.3 MMP-2 and MMP-9 Activity in pAEC lysates
Due to the important proteolytic role of MMP-2 and MMP-9 in the turnover of the
basement membrane of the bronchial airways, gelatin zymography was performed to
assess the functional activity of these proteins in the cell lysates from ex vivo pAEC.
Lysates from both pAECHNA and pAECAA demonstrated 2 strong bands of gelatin
degradation, one at 92 kDa, correlating to MMP-9 activity and one at 72 kDa,
correlating to MMP-2 activity (Figure 4.3A). The gelatinases activity was much lower
in lysates from pAECAA indicated a reducing capacity to degrade gelatin at 72 and 92
kDa. Densitometry scans of band intensity (Figure 4.3B) indicated a significant
difference in MMP-9 (p = 0.047) and MMP-2 (p = 0.0236) production between
pAECHNA and pAECAA.
4.5.4 MMP-2 and MMP-9 Activity in AA and HNA culture medium
To assess the effect of cell proliferation and culture on pAEC release of MMP-2 and
MMP-9, gelatin zymography was performed using the medium in which pAECAA and
pAECHNA were sub-cultured. Two bands of gelatin degradation were observed at 92 and

Neg Cont HNA AA
MMP 2
MMP 9
Figure 4.2: Immunohistochemical
staining of cells for MMP-2 and MMP-9.
Fluorescent immunocytochemistry
was performed on
neutral buffered formalin fixed pAEC
preparations. Cytospins
were incubated with a 1:100 dilution of MMP-2 and MMP-9 mouse anti-
human antibody for 24 hours, washed and fluorescently labelled with an anti-mouse FITC antibody. The intensity of the staining for MMP
2 and MMP-9 was reduced in pAECAA
compared to healthy controls.

Figure 4.3: MMP activity in cell lysates. (A) Gelatin zymography of pAEC lysates. MMP-2 activity at 72 kDa
and MMP-9
activity at 92 kDa
were much lower in lysates from pAECAA
compared to pAECHNA
lysates indicated by a reduced capacity to
degrade gelatin. (B) Densitometry scan data of band intensity; MMP-2 (black) and MMP-9 (white). There was a significant
difference in MMP-2 (p = 0.0236) and MMP-9 (p = 0.0470) production between pAECHNA
and pAECAA
.
HNA AA
0
3500
7000
Inte
nsi
ty u
nit
AAHNA
MMP9
MMP2
p = 0.0470
p = 0.0236
A B

Stevens 2009
119
______________________________________________________________________
72 kDa corresponding to MMP-9 and MMP-2 respectively. There was no difference in
MMP-9 activity in culture media collected from pAECAA and pAECHNA (Figure 4.4A),
which was confirmed with densitometry scans of band intensity (p = 0.5818: Figure
4.4B). Conversely, MMP-2 activity was greater in the culture medium collected from
pAECAA compared to pAECHNA (Figure 4.4A) though densitometry scans indicated
only a trend toward significance (p = 0.0520; Figure 4.4B).
4.5.5 IL-13 production by pAECHNA and pAECAA
To account for the observed increase in MMP-2 secretion during proliferation by
pAECAA, IL-13 levels were measured in the same culture medium. IL-13 in a known
stimulator of MMP-2 production. Media from pAECHNA were found to produce 588.1 ±
43.3 pg/ml/106 cells of IL-13, compared to 635.3 ± 48.2 pg/ml/106 cells being produced
in the media from pAECAA (Figure 4.5). This was not significant different (p = 0.157)
and could not account for the increased MMP-2 activity seen in these cells.
4.5.6 MMP-2 and MMP-9 Activity in Plasma from AA and HNA children
Gelatin zymography was performed on plasma collected from AA and HNA subjects to
assess MMP-2 and MMP-9 functional activity and to determine whether the observed
reduction in MMP activity in AA subject, was limited to the local epithelial

Figure 4.4: MMP activity in culture medium. (A) Gelatin zymography of pAEC culture medium. There was no difference in MMP-9
activity in culture media collected from pAECAA
and pAECHNA
, conversely, pAECAA
demonstrated greater MMP-2 activity compared to
pAECHNA
. (B) Densitometry scan data of band intensity; MMP-2 (black) and MMP-9 (white). There was no significant difference in
MMP-9 (p = 0.5818) or MMP-2 (p = 0.0520) expression between the two phenotypes.
0
3500
7000
Inte
nsi
ty u
nit
HNA AA
MMP9
MMP2
HNA AAp = 0.0520
A B

Figure 4.5: IL-13 assay of pAEC culture medium. The culture medium from
pAECAA
demonstrated an IL-13 concentration of 635.3 ±
48.2 pg/ml whereas the
media from pAECHNA
had an IL-13 concentration of 588.1 ±
43.3 pg/ml. There was
no statistical difference between the two phenotypes (p = 0.1597).
HNA AA0
200
400
600
800
Subject Phenotype
IL-1
3 p
rod
uct
ion
(pg
/ml/
106
cell
s)

Stevens 2009
120
______________________________________________________________________
environment. Results obtained found that the MMP-2 and MMP-9 activities observed at
72 and 92 kDa in plasma from AA children were indistinguishable from those produced
by plasma from healthy control subjects (Figure 4.6A). This was confirmed from the
densitometry scans which revealed no significant difference in MMP-9 (p = 0.4195) and
MMP-2 (p = 0.5965) band intensity (Figure 4.6B).
4.5.7 TIMP Activity in pAEC lysates
Due to the important role of the MMP to TIMP ratio in the functional capacity of
MMPs, reverse gelatin zymography was performed to assess the TIMP expression in the
cell lysates from both pAECAA and pAECHNA. Two bands of darker staining occurring
at 21 and 28 kDa were seen in the AA and HNA samples correlating to TIMP-2 and
TIMP-1 respectively. TIMP activity appeared greater in the lysates from pAECHNA
(Figure 4.7A), though densitometry scans confirmed there was no significant difference
in either TIMP-1 (p = 0.0843) or TIMP-2 (p = 0.0985) activity between the two
phenotypes (Figure 4.7B).

Figure 4.6: MMP activity in plasma. (A) Gelatin zymography of patient plasma. MMP-2 and MMP-9 activity in plasma from AA
children were indistinguishable in intensity from those produced
by plasma from healthy control subjects. (B) Densitometry scan data of
band intensity; MMP-2 (black) and MMP-9 (white). Results confirmed that there was no significant difference in MMP-2 (p = 0.597) or
MMP-9 activity (p = 0.42).
HNA AA0
3500
7000
Inte
nsi
ty u
nit
MMP9
MMP2
HNA AA
A B

Figure 4.7: TIMP activity in cell lysates. (A) Reverse zymography
of pAEC
lysates. There was greater TIMP-1 activity at 28 kDa
and
TIMP-2 activity at 21 kDa
in the pAECHNA
lysates compared to pAECAA
. (B) Densitometry scan data of band intensity; TIMP-1 (white)
and TIMP-2 (black). Scans revealed that the observed difference in TIMP-1 (p = 0.084) and TIMP-2 (p = 0.098) activity was not
significant.
A B
TIMP1
TIMP2
HNA AA
HNA AA0
3500
7000
Inte
nsi
ty u
nit
p = 0.0843
p = 0.0985

Stevens 2009
121
______________________________________________________________________
4.5.8 TIMP Activity in AA and HNA culture medium
TIMP activity was measured in culture medium of sub-cultured pAEC to assess the
degree of secreted TIMP produced by pAEC. TIMP activity appeared marginally
greater in the pAECHNA samples compared pAECAA media (Figure 4.8A). Densitometry
indicated no significant change in TIMP-1 (p = 0.0878) or TIMP-2 (p = 0.0768) activity
(Figure 4.8B).
4.5.9 TIMP Activity in Plasma from AA and HNA children
Plasma TIMP activity was measured to determine whether differences were limited to
the pAEC local environment. Result revealed that there was no distinguishable
difference in TIMP activity between the two phenotypes (Figure 4.9A), which was
confirmed by densitometry; TIMP-1 (p = 0.1447) and TIMP-2 (p = 0.1291; Figure
4.9B).
4.5.10 MMP to TIMP Ratio are lower in pAECAA
The determined MMP-9 to TIMP-1 ration was significantly higher (p < 0.001) in the
pAECHNA lysates (1.05) than the calculated ratio from the pAECAA lysates (0.05; Figure
4.10). This was also the case for the MMP-2 to TIMP-2 ratio (p < 0.001) from

Figure 4.8: TIMP activity in culture medium. (A) Reverse zymography
of pAEC
culture medium. TIMP-1 and TIMP-2 activity
appeared marginally greater in the pAECHNA
culture medium in comparison to pAECAA. (B) Densitometry scan data of band intensity;
TIMP-1 (white) and TIMP-2 (black).
Results revealed the difference in TIMP-1 (p = 0.088) and TIMP-2 (p = 0.077) activity was not
significant.
A B
TIMP1
TIMP2
HNA AA
HNA AA0
3500
7000
Inte
nsi
ty u
nit
p = 0.0768
p = 0.0878

Figure 4.9: TIMP activity in plasma. (A) Reverse zymography
of patent plasma. There was no distinguishable difference in TIMP-1 or
TIMP-2 activity between pAECHNA
and pAECAA
. (B) Densitometry scan data of band intensity; TIMP-1 (white) and TIMP-2 (black).
Results confirmed the difference in TIMP-1 (p = 0.145) and TIMP-2 (p = 0.129) activity was not significant.
A B
TIMP1
TIMP2
HNA AA
HNA AA
0
3500
7000
Inte
nsi
ty u
nit
p > 0.05
p > 0.05

Figure 4.10: Ratio MMP to TIMP in cell lysates. The ratio of MMP-9 to TIMP-
1 and MMP-2 to TIMP-2 was calculated from pAECHNA
(□) and pAECAA
(■)
lysates density scan data. The MMP-9/TIMP-1 ratio was significantly higher (p <
0.001) in the pAECHNA
lysates than the pAECAA
lysates. The MMP-2/TIMP-2
ratio was also significantly higher in pAECHNA
lysates (p < 0.001)
in comparison
to pAECAA
lysates
0.0
0.5
1.0
1.5
Rat
io
MMP-9/TIMP-1 MMP-2/TIMP-2
p < 0.001 p < 0.001

Stevens 2009
122
______________________________________________________________________
pAECHNA lysates (1.24) which was elevated in comparison to that of pAECAA lysates
(0.03; Figure 4.10).

Stevens 2009
123
______________________________________________________________________
4.6 Discussion
In the present study it has been shown that MMP-2 and MMP-9 gene expression as well
as protein levels and activity are significantly lower in epithelial cells isolated from
asymptomatic asthmatic children compared with cells from healthy non-atopic children.
In addition, it has also demonstrated that expression of MMP-7, but not MMP-14, was
markedly lower in pAEC from AA children compared with HNA children. Levels of
TIMP-1 and -2 were also lower, albeit to a much lesser extent. This imbalance is present
in the local airway mucosa but not in the circulation since plasma MMP and TIMP
activity was not significantly different between the two groups. Collectively, these data
show that pAEC from AA children possess a reduced MMP/TIMP ratio compared with
cells from HNA children, and suggest that a pro-fibrotic environment may exist in
asthmatic airways resulting in ECM deposition.
Recent attention has focused on the contribution of MMPs, and their inhibitors, to the
pathogenesis of asthma. However, due to conflicting reports on both the expression and
activity of MMPs and TIMPs in asthmatic patients, the role of these proteins in airway
remodelling has remained until now speculative at best. Of the investigations that have
reported elevated MMP levels in asthma, a majority have been performed using adult
cohorts (Mautino et al., 1997, Wenzel et al., 2003). Others, still, have reported differing
MMP and TIMP levels in mild (Lemjabbar et al., 1999, Maisi et al., 2002, Mattos et al.,

Stevens 2009
124
______________________________________________________________________
2002, Wenzel et al., 2003, Cataldo et al., 2004) and severe (Belleguic et al., 2002,
Mattos et al., 2002, Wenzel et al., 2003) asthma or the presence of an attack (Lemjabbar
et al., 1999, Lee et al., 2001). However, there is very limited data regarding the role of
these proteins in childhood asthma (Doherty et al., 2005) and the role of the bronchial
epithelium in their synthesis and release (Hoshino et al., 1998).
The gelatinases, MMP-2 and MMP-9, are responsible for degrading many the
components of the ECM (Nagase and Woessner, 1999). In this study, it was have
demonstrated that MMP-2 and MMP-9 mRNA expression and proteolytic activity are
lower in pAECAA compared to pAECHNA. Other studies (Lemjabbar et al., 1999, Mattos
et al., 2002, Wenzel et al., 2003) comparing gelatinase levels based on asthma severity
have reported markedly lower levels in mild compared to severe asthma. Thus, it can be
speculated that in untreated mild asthma in the absence of exacerbation, gelatinase
activity is reduced resulting in decreased turnover of the ECM and a thickening of the
basement membrane. In contrast to cell lysates, there was no significant difference
observed in the plasma activity level of MMP-2 and MMP-9 between AA and HNA
children. This finding appears discordant to others who have reported elevated MMP-9
activity in the plasma of adults with acute severe asthma (Belleguic et al., 2002) and in
the serum of adult asthmatics (Bosse et al., 1999). This is likely to be due to the
characteristics of our cohort i.e., mild disease, children studied when well. An elevation
was observed in MMP-2 but not MMP-9 activity from supernatants of cultured
pAECAA. The reasons for this are unknown. The pro-Th2 cytokine IL-13 has been

Stevens 2009
125
______________________________________________________________________
shown to induce the expression of MMP-2 (Corry et al., 2002). However, no difference
was found in IL-13 levels between pAECAA and pAECHNA, suggesting that this is not the
reason underlying the increased levels of MMP-2 in our model.
Due to the reduction in MMP activity observed in pAECAA, it can be speculated that
TIMP levels may be elevated. TIMPs are the major inhibitors of MMPs in vivo where
they bind to the catalytic site of MMPs in a 1:1 stoichiometric ratio resulting in reduced
proteolytic activity. However, despite the observation that TIMP-1 and TIMP-2 mRNA
expression in pAECAA was slightly lower than that of pAECHNA, protein expression and
activity were not significantly different. Recent reports demonstrating that the MMP-9 /
TIMP-1 ratio is inversely correlated with airway wall thickness (Matsumoto et al.,
2005) as well as thickening of the basement membrane (Mahut et al., 2004), suggest
that MMP / TIMP ratio is critical to overall proteolytic burden. This study has
demonstrated a significant decrease in the MMP-9 / TIMP-1 ratio in the pAECAA
compared with pAECHNA. Our findings agree with those of Doherty et al who reported
an imbalance between MMP-9 and TIMP-1 in the BAL of children with stable asthma
(Doherty et al., 2005), and suggest that this imbalance may be associated with airway
wall thickening. In addition, this investigation extends on the findings of Doherty et al
to show an imbalance between the other major gelatinase MMP-2 and its inhibitor
TIMP-2, thereby suggesting that this imbalance may also be associated with airway wall
thickening in asthma. Furthermore, these findings are exclusively observed for airway
Stevens 2009
126
______________________________________________________________________
epithelial cells since other potential contributing cells such as macrophages are actively
excluded during the isolation process (refer to 2.4.3).
The mechanism responsible for the reduced MMP production by pAECAA in this
investigation was not determined. One plausible candidate may be TGFβ-1 which has
been implicated to have a role in the regulation of MMP production (Nuovo, 1997,
Huang et al., 2005) however, it’s the stimulatory effect appears to differ greatly between
different cell types (Kossakowska et al., 1999). Previously, it has been shown that that a
similar asthmatic cohort to the AECs cells used in this investigation demonstrated
reduced TGFβ-1 production (Kicic et al., 2006). Therefore, further investigation into the
effects of TGFβ-1 on MMP production in pAECs is warranted and may provide insight
into the mechanism (s) responsible for the reduced MMP activity observed in asthmatic
cells.
In addition to TGF-ß1, it has also been demonstrated that expression of the transcription
factor Snail is associated with an increase in promoter activity and expression of MMP-
9 in an epithelial cell line (Jorda et al., 2005). Other transcription factors including Pax-
6 and AP-2α have also been shown to interact thus controling the expression of MMP-9
in corneal epithelial cells (Sivak et al., 2004). Collectively, these findings suggest that
further investigation into transcription factors regulating MMP expression is warranted
and may aid in explaining the reduced MMP expression observed in pAECAA in this
investigation. Furthermore, investigation into the presence of polymorphisms in the

Stevens 2009
127
______________________________________________________________________
MMP-9 promoter region, such as a C-1562T substitution that increases the
transcriptional activity of MMP-9 (Santo et al., 2004), could aid in providing a potential
mechanism for reduced MMP expression in pAECAA.
The zymography techniques used in this investigation were based on previously
established methodologies (Kleiner and Stetler-Stevenson, 1994, Riley et al., 1999) and
proved sufficient for providing a semi-quantitative comparison between cellular
phenotypes. Quantitative techniques such as enzyme-linked immunospot assay have
become available for determining the frequencies of TIMP secreting cells in vitro.
These more advanced assays could provide a more definitive picture of the TIMP
release and activity in pAECs as these techniques would be able to measure free and
MMP-bound TIMP.
One aspect this specific investigation has been unable to assess has been the role of
atopy on MMP and TIMP activity. The cohorts utilised did not include either atopic
healthy or non-atopic asthmatic children. This could be significant since atopy has been
implicated with an increase in sub-epithelial basement membrane thickening (Barbato et
al., 2003, Barbato et al., 2006) although the atopic children in this study were not
“healthy” since they had bronchoscopies performed to diagnose the cause of respiratory
symptoms. A recent study from the same group has noted the similarity in biopsies from
atopic and non-atopic asthmatics (Turato et al., 2008) including basement membrane
thickening. Therefore, the contribution of atopy is yet to be determined. Future

Stevens 2009
128
______________________________________________________________________
investigations should include cohorts of healthy atopic and non-atopic asthmatic
children in order to measure MMP and TIMP expression and thus elucidate whether
there are effects of atopy on MMP/TMP activity that are independent of effects
associated with asthma.
Another aspect of this study not addressed is of the potential issue of age related effects
as the age range on the cohort (1.38-11.29 years). Due to the major logistical issues
involved in obtaining and working with primary paediatric cells, this investigation was
not able to obtain cells from children of a tighter age range or a large enough population
to stratify analyses by age. Despite this limitation, the cohorts utilized were sex matched
and the average age similar, and unlike functional work performed in cell lines or
animal models, it is believed that these results demonstrate a unique glimpse into the
local epithelial environment in asthmatic children with mild disease and may
demonstrate the precursors to a more severe or persistent condition .
The proteolytic role of MMP-7 in asthma is not yet fully understood, though it has the
ability to degrade a broad range of substrates including elastin, proteoglycans, type IV
collagen, fibronectin and other components found in the airway matrix (Wilson 1998).
Unlike most MMPs, MMP-7 is constitutively expressed by bronchial epithelial cells
(Dunsmore et al., 1998). Results here demonstrated that MMP-7 mRNA expression was
significantly down-regulated by 10.35 fold in pAECAA. In addition to its role in
proteolysis, MMP-7 has been hypothesised to have a functional role in the re-

Stevens 2009
129
______________________________________________________________________
epitheliasation and repair of the airways (Dunsmore et al., 1998). This investigation has
reported that pAECAA children possess an inherent inability to repair in comparison to
HNA cells (refer to 3.4.1). Therefore, it can be speculated that the observed decrease in
MMP-7 expression and protein production reported in this study could contribute to the
aberrant repair observed in pAECAA. However, confirmation of this awaits further
validation.
The membrane-type MMP contain transmembrane domains and are bound to the
surface of fibroblasts, macrophages, epithelial cells, osteoblasts and vascular smooth
muscle cells. Due to the ability of MMP-14 to degrade a range of ECM substrates (Imai
et al., 1996) and its role in the activation of pro-MMP-2 (Murphy et al., 1999), it was
decided to assess its expression by pAECAA children and healthy controls. Only a mild
down-regulation (1.7 fold) of MMP-14 gene expression was demonstrated in pAECAA
compared with pAECHNA. There have been very few studies investigating MMP-14
levels and asthma; Cataldo et al reported no increase in MMP-14 mRNA expression in
sputum cell pellets from mild adult asthmatics (Cataldo et al., 2004), whereas, Maisi et
al demonstrated elevated MMP-14 levels in the BAL and induced sputum of mild-
untreated-adult-asthmatics (Maisi et al., 2002). The role of MMP-14 in ECM regulation
in asthmatics remains unclear.

Stevens 2009
130
______________________________________________________________________
4.7 Conclusion
In conclusion, it has been demonstrated that MMP-2 and MMP-9 activities and the
MMP-9 / TIMP-1 as well as MMP2 / TIMP2 ratios are significantly reduced in
pAECAA. This study provides additional evidence that there is a dysregulation in the
mechanisms that control the turnover of the ECM in childhood asthma. Furthermore,
the reduced MMP to TIMP ratio observed in our studies that is present even in mild
asthma, could be an important contributor to the airway wall thickening and persistent
airway obstruction that occurs in more severe disease.

Stevens 2009
131
______________________________________________________________________
Chapter 5: Characterisation of RV Exposure and
the Effects on PAI-1 and MMP Expression
5.1 Introduction
It was previously demonstrated in Chapter 3 that asthmatic epithelial cells are inherently
abnormal characterised by an inability to successfully repair mechanically induced
wounds. Since PAI-1 was shown to be elevated in pAECAA it was hypothesised that
epithelial damage is responsible for elevated PAI-1 release in an attempt to re-epithelise
the airways and prevent exposure of the underlying structures to foreign agents.
Furthermore, it was observed in Chapter 4 that the asthmatic epithelium has reduced
production of MMPs and it was postulated that reduced MMP activity (coupled with
elevated PAI-1 expression), may result in defective ECM turnover and be responsible
for the observed increase in ECM thickness in asthmatic airways. Damage to, or loss of,
the airway epithelium is a common characteristic of childhood asthma (Barbato et al.,
2006) and may result in alterations to epithelial protein production. The direct cause of
epithelial damage is still under investigation, though it has been demonstrated that
respiratory viruses are able to successfully infect and replicate within AECs (Subauste
et al., 1995, Papadopoulos et al., 2000) with a resultant cytotoxic effect (Schroth et al.,

Stevens 2009
132
______________________________________________________________________
1999, Papadopoulos et al., 2000, Bossios et al., 2005) through cell lysis and death. Viral
infections have been demonstrated to play a significant role in the triggering of asthma
exacerbations and have been detected in 80 to 85% of children with asthmatic
exacerbations with RV being the most commonly detected (Johnston et al., 1995). A
recent study reported that the susceptibility of AECs to rhinoviral infection was
serotype dependent, where the greatest cytotoxic effects were observed after RV1b or
RV7 infection (Bossios et al., 2005). Infection of AECs with RV has also been
demonstrated to induce a pro-inflammatory cytokine response with elevations in IL-1β,
IL-6, IL-8, TNF-α and the chemokine RANTES being reported (Proud et al., 1994,
Subauste et al., 1995, Johnston et al., 1998, Papadopoulos et al., 2000). Recent work
also indicates that viral infections in asthmatic patients induce more lower respiratory
tract symptoms and a greater reduction in lung function than in non-asthmatic patients
(Corne et al., 2002). Supporting these observations, work by Wark and colleagues have
shown that asthmatic AECs have a deficient innate response to infection by RV (Wark
et al., 2005). They also reported that AECs isolated from asthmatic adults demonstrate
an early resistance to apoptosis following RV-16 infection, which is significant since an
apoptotic response in virally infected cells is one key protective mechanism at reducing
viral replication and subsequent viral release (Wark et al., 2005, Singhera et al., 2006).
Using in vitro culture systems, it has previously been demonstrated that AECs from
adults with asthma have an abnormal response to RV infection with a resultant increase
in viral replication and cell lysis when compared to healthy cells (Wark et al., 2005). In
addition, some recent work has focused on the effect of RV on AEC wound repair and

Stevens 2009
133
______________________________________________________________________
proliferation in vitro (Bossios et al., 2005) and reported delayed wound repair and
decreased proliferation in a AEC cell line infected with RV1b.
Despite advances in understanding the role RV plays in asthma, these data have been
largely generated using primary adult AECs or commercial cell lines. This investigation
hypothesises that dysregulated epithelial function originates in childhood asthma and is
a critical determinant of disease progression into adulthood. Furthermore, an inability to
successfully re-epithelialise the damaged epithelium in asthmatic airways, in the
presence of an RV infection, may be a key factor in the exacerbations in these patients.
The aim of this chapter was to test the hypothesis whether RV induced injury of pAECs
may be responsible for the elevated PAI-1 expression and reduced MMP-2 and MMP-9
activity in these cells. However, no studies to date have investigated the effects of RV
exposure on airway epithelium obtained from children. Therefore, this investigation
also sought to determine whether pAECs isolated from atopic asthmatic children were
more susceptible to infection by RV as compared to healthy non-atopic pAECs. In
addition, the role RV exposure has in pAEC proliferation and wound repair in vitro was
also determined.
To address this pAECs were obtained from 6 HNA and 6 AA children. Epithelial
monolayers were exposed to the major serotype RV14 and the minor serotype RV1b
and the effects of viral titre and exposure time were assessed. Culture medium was

Stevens 2009
134
______________________________________________________________________
measured for inflammatory cytokine release and the percentage of cells undergoing
apoptosis determined utilising specific assays. Cell proliferation and wound repair
experiments were used to investigate what role RV has upon these dysregulated
processes already seen in asthmatic pAECs. Finally, real time quantitative PCR and
gelatin zymography were also used to determine if RV infection results in elevated PAI-
1 and MMP expression.

Stevens 2009
135
______________________________________________________________________
5.2 Materials
General materials used in this part of the investigation and supplier details are listed in
detail in Chapter 2.1. Materials specific to this chapter included; crystal violet and
formaldehyde that were purchased from Sigma (St. Louis, MO, USA), single stranded
DNA Apoptosis ELISA kit from Millipore (Billerica, MA, USA), an IL-8 ELISA kit
from BD Biosciences (San Diego, CA, USA), a TGF-β1 ELISA kit and IL-1β ELISA
kit that was obtained from Invitrogen (Melbourne, VIC, Australia) and skim milk
powder (Bonland Daries, PTY LTD, VIC, Australia). Two strains of virus, the minor
serotype RV1b and major serotype RV14 were kindly provided by Dr Peter Wark (John
Hunter Hospital, Newcastle, New South Wales, Australia).

Stevens 2009
136
______________________________________________________________________
5.3 Buffers and solutions
The general buffers and solutions utilised are described in detail in Chapter 2.3. Buffers
and/or solutions specific to this Chapter of the thesis are listed in detail below.
5.3.1 Crystal violet solution (0.1%)
To make 100 ml of 0.1% (w/v) crystal violet solution, 100 mg of crystal violet powder
was dissolved into 100 ml of ddH20. The solution was stored at RT until required.
5.3.2 Formaldehyde/ethanol PBS solution (5%)
To make 1000 ml of 5% (v/v) formaldehyde/ethanol PBS solution, 50 ml of
formaldehyde and ethanol were added to 900 ml of pre-made PBS solution (refer to
2.3.1.2). The solution was stored at 4°C.
5.3.3 Skim milk blocking solution (3%)
To make 100 ml of 3% (w/v) skim milk blocking solution, 3g of skim milk powder was
dissolved in to 100 ml of ddH20. The solution was made fresh each time it was required.

Stevens 2009
137
______________________________________________________________________
5.4 Methods
5.4.1 Patients and sample collection
As described in Chapter 2.4.1.1, two cohorts were used in this study, for this part of the
investigation; samples were obtained from 6 AA children who did not previously
receive any corticosteroid therapy and 6 HNA children (See Table 5.1). Refer to
Chapter 2.4.2.1 and 2.4.3 for information on asthma/allergy diagnosis and sample
collection. In addition to pAEC collection, 10 ml of whole blood was collected into
heparin sodium, mixed, transported back to the laboratory and processed to collect
plasma.
5.4.2 Cell culture and media collection
The methodology used for culture of pAEC and cell lines, is described in full in Chapter
2.4.4 - 2.4.6.

Stevens 2009
138
______________________________________________________________________
5.4.3 Ultra violet (UV) light inactivation or rhinoviral activity
To confirm that the RV-mediated responses observed were a result of active virus, each
RV serotypes was UV inactivated. A 1000 µl vial of RV was placed < 10 cm from a UV
light source in a lamina flow hood. The vial in which the virus was placed was clear and
the lid removed to allow maximal penetration of the UV light. The virus was exposed
for at least 120 minutes and stored at -80°C until required. Following the inactivation of
both RV serotypes, cytotoxicity assays (refer to 5.4.5) were performed on pAECHNA
with the inactivated virus. Inactivated viral samples demonstrated no effect on cell
viability and were used as negative controls in each of the subsequent experiments
mentioned.
5.4.4 Rhinoviral concentrations
Viral titres of the RV serotypes were confirmed as 1.2 x 10⁸TCID50/ml for RV14 and
9.2 x 10⁷TCID50/ml for RV1b. Based on reported RV titres described in literature, a
maximal concentration of 100 viral particles per cell and a minimal concentration of 2
particles per cell were used in this study (Table 5.2). For all experiments downstream to
the cytotoxicity studies, viral titres of 0.8x10⁵TCID50/ml or 1.25x10⁵TCID50/ml were
used. These titres of virus were determined to successfully induce an inflammatory
response in the pAEC with limited cytotoxic effects.

Stevens 2009
139
______________________________________________________________________
5.4.5 Cytotoxicity assay
To determine the effects of RV14 and RV1b on pAEC viability, cells were seeded in 96
well plates and grown to 80-85% confluence in BEBM containing growth additives
(2.3.2.16). RV14 and RV1b were then added to the wells at a titre ranging from
1.25x10⁵ to 40x105TCID50/ml and cells exposed to virus for 2, 6, 12, 24, 48 and 72
hours. Following exposure, cell counts were performed and supernatants were collected
and stored at -80°C for subsequent cytokine assessment. The CellTitre 96® Aqueous Non-
Radioactive Cell Proliferation Assay was adapted to assess the number of metabolically
active cells post viral infection and was performed as previously described (Sherley et
al., 1995, Kicic et al., 2006).
5.4.6 Apoptosis Assay
To determine the percentage of cells that underwent apoptosis during RV exposure, a
single stranded DNA (ssDNA) Apoptosis ELISA kit was used. This procedure is based
on the selective denaturation of DNA in apoptotic cells by formamide, and detection of
denatured DNA with a specific monoclonal antibody for ssDNA. The assay was
performed in accordance to the manufacture’s instructions. Briefly, cells were seeded at
a density of 10,000 cells per well in a 96 well plate and cultured for 24 hours in BEGM
containing growth additives (2.3.2.16). Cells were then exposed to either RV14 or

Stevens 2009
140
______________________________________________________________________
RV1b at a two viral concentrations: 1.25x10⁵TCID50/ml and 40x105TCID50/ml for 6,
12, 24 or 48 hours. The plates were then centrifuged at 200g for 5 minutes and the
media removed and replaced with 200 µl of fixative and incubated at RT for 30
minutes. The fixative was removed from the cell monolayers and the plates dried in a
37°C incubator for 1-2 hours at to allow permanent attachment of cells to the plate.
Once fully dry, 50 µl of formamide solution was added to each well and incubated at
RT for 10 minutes. To denature the DNA in apoptotic cells, the plates were heated to
75°C for 10 minutes in an oven, cooled in a refrigerator for 5 minutes and the
formamide removed. Wells were then rinsed 3 times with 1 x PBS and blocked with
200 µl of 3% (w/v) skim milk solution for 1 hour at 37°C. The blocking solution was
removed and replaced with 100 µl of an antibody mixture to each well followed by a 30
minute incubation at RT. The plates were washed a further 3 times with 250 µl of wash
solution and 100 µl of supplied “ABTS” solution added to each well and incubated for
20 minutes at RT. The reaction was stopped by the addition of 100 µl stop solution and
the resulting absorbance read at 405nm.
Stevens 2009
141
______________________________________________________________________
5.4.7 Cytokine Assays
5.4.7.1 ELISA
To assess the cytokine response generated by pAEC exposure to RV, IL-1β, IL-8 and
TGF-β1 were measured in the culture medium in which pAECs were grown.
Commercially obtained Immunoassay kits were used to measure IL-1β, IL-8 and TGF-
β1. Briefly, each kit was a solid phase sandwich ELISA utilising monoclonal antibodies
specific for the target protein. Biotinylated secondary antibodies were used to detect the
immobilized capture antibodies and streptavidin-peroxidase used as the detection agent.
The assays are premised on the fact that the intensity of the coloured product is directly
proportional to the concentration of target protein present in the original specimen.
5.4.7.2 Time resolved fluorometry
IL-6 was measured using an in-house TRF detection system (DELFIA, Wallac, Turku,
Finland) based on that described by Taylor et al (Taylor et al., 2007). The methodology
is described in detail in Chapter 2.4.13.

Stevens 2009
142
______________________________________________________________________
5.4.8 Cell proliferation experiments
To investigate the effects of RV exposure on pAEC proliferation, cells were seeded into
96-well plates at a density of 5,000 cells/well and cultures incubated for 24 hours in
BEBM containing growth additives (2.3.2.16). RV14 and RV1b were added to the wells
at a concentration of 0.8x10⁵TCID50/ml and the CellTitre 96® Aqueous Non-Radioactive
Cell Proliferation Assay (Promega, Madison, WI, USA) performed at 24 hour intervals
for up to 6 days post RV exposure.
5.4.9 Monolayer wounding and repair experiments
As discussed in Chapter 3, an in-house wounding device was developed based on that
originally described by Vermeer et al (Vermeer et al., 2003). The device was developed
for the assessment of the wound repair capacity of pAEC in vitro (refer to 3.3.3). Cells
were seeded into 12-well culture plates and grown to confluence in BEBM containing
growth additives (refer to 2.3.2.16). RV14 and RV1b were added to the wells at a titre
of 0.8x10⁵TCID50/ml and incubated for 24 hours. Cell monolayers were then wounded,
washed to remove detached cells, fresh medium added and cultures assessed every 24
hours until full wound repair was achieved. Time lapsed photography images were
taken every 24 hours in order to determine the degree of repair in to the wound site

Stevens 2009
143
______________________________________________________________________
(refer to 3.3.4). Calculated values were then expressed as a percentage of total wound
recovery over the period to achieved full repair.
5.4.10 Measurement mRNA expression post exposure
To determine PAI-1, MMP-2 and MMP-9 mRNA expression by pAEC following RV
exposure, cells were seeded into 12-well culture plates and grown to confluence in
BEBM containing growth additives (2.3.2.16). RV14 and RV1b were added to the wells
at a titre of 1.25x10⁵TCID50/ml and incubated over a 72 hour period. Cells were
harvested, RNA extracted and qRT-PCR performed (refer to 2.4.11) using relevant
primers (Table 2.3). PAI-1, MMP-2 and MMP-9 mRNA expressions were then
expressed as a fold change relative to uninfected pAECHNA and pAECAA.
5.4.11 Measurement MMP activity post RV exposure
To measure MMP release by pAEC following RV exposure, cells were seeded into 12-
well culture plates and grown to confluence in BEBM containing growth additives
(2.3.2.16). RV14 and RV1b were added to the wells at a titre of 1.25x10⁵TCID50/ml and
incubated for 48 hours. Supernatants were then collected and gelatin zymography (refer
to 4.4.6) performed and MMP-2 and MMP-9 activity compared to that determined for
unexposed pAECHNA and pAECAA.

Stevens 2009
144
______________________________________________________________________
5.4.12 Statistics
All statistical analysis conducted in this chapter was performed as outlined in 2.4.14.
All values presented in this chapter are means ± SD and all p values less than 0.05 were
considered to be significant.

Stevens 2009
145
______________________________________________________________________
5.5 Results
5.5.1 Effect of UV-inactivated rhinovirus
To confirm that the RV-mediated responses observed in the pAECs were specific to the
active form of the virus, both RV serotypes were UV-inactivated to demonstrate a lack
of cell cytotoxicity. Results obtained showed that there was no statistical difference in
cell viability between unexposed cells and cells exposed with UV-inactivated virus
(Figure 5.1). Over the viral titre range investigated, UV-inactivated virus was observed
not to affect pAECs cell viability. Therefore it was concluded that the observed
cytotoxicity in subsequent exposed cultures was due to live RV.
5.5.2 Effect of rhinoviral exposure on cell viability
Since RV has been reported to have a cytotoxic effect on adult AECs and epithelial cell
lines, RV cytotoxicity assays were performed to determine the effect of RV14 and
RV1b exposure on pAECAA and pAECHNA viability. The assays were performed using a
range to viral titres and exposure times to assess both dose response and time course
effects.

Figure 5.1: Cytotoxic effects of UV inactivated RV.
pAECs
were seeded in 96 wells plates, grown to 80% confluence and exposed to
a range of UV inactivated RV titres (2.5 – 80x104TCID50
/ml). Cell viability was assessed via MTS assay following 48 hours of
exposure and compared to uninfected cells grown in culture media
only (Media). UV inactivated RV14 did not have any effect on (A)
pAECHNA
or (B) pAECAA
cell viability. UV inactivated RV1b did not have any effect on (C) pAECHNA
or (D) pAECAA
cell viability.

80 40 20 10 5 2.5Media0
25
50
75
100
125
80 40 20 10 5 2.5Media0
25
50
75
100
125
80 40 20 10 5 2.5Media0
25
50
75
100
125
Media 80 40 20 10 5 2.50
25
50
75
100
125
UV Inactivated Viral Titre (x104TCID50
/ml)
Cel
l Via
bil
ity
(%)
A B
C D
Cel
l Via
bil
ity
(%)

Stevens 2009
146
______________________________________________________________________
5.5.2.1 pAECHNA exposure to RV14
Results showed there was no statistical difference (p ≥ 0.05) in cell viability between
exposed control cells (100% viability) and pAECHNA exposed to RV14 regardless of
exposure time to the virus. Following 72 hours of RV14 exposure there was no decline
in cell viability. In addition, RV14 concentrations did not have any affect on cell
viability as there was no significant difference recorded in the cell viability when
comparing the cytotoxic effect at 1.25x10⁵TCID50/ml and 40x105TCID50/ml (p ≥ 0.05;
Figure 5.2A-F).
5.5.2.2 pAECAA exposure to RV14
Exposure of pAECAA to RV14 was observed to have both a time and dose dependent
effect on cell viability. When pAECAA were exposed to all RV14 viral titres for up to 12
hours, no significant change (p ≥ 0.05) in cell viability was observed (Figure 5.3A-C).
However, in contrast to pAECHNA, pAECAA demonstrated a significant susceptibility to
RV14 exposure at the higher viral titres after 24 (p = 0.0041), 48 (p < 0.0001) and 72 (p
< 0.0001) hours. A significant decline in cell viability was observed after 48 hours of
exposure to RV14 titres ≥ 5x10⁵TCID50/ml (p = 0.0044; Figure 5.3E). Following 72
hours of RV14 exposure there was a significant decline in cell viability at all viral titres
≥ 2.5x10⁵TCID50/ml (p = 0.0196; Figure 5.3F).
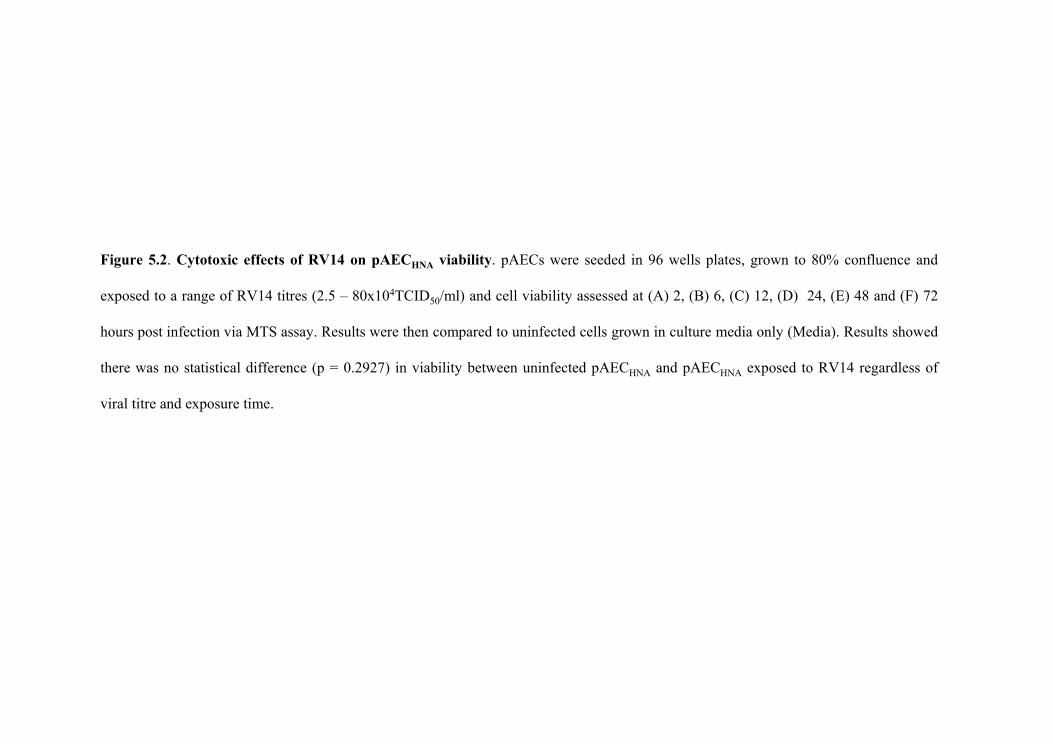
Figure 5.2.
Cytotoxic
effects of RV14 on pAECHNA
viability. pAECs
were seeded in 96 wells plates, grown to 80% confluence and
exposed to a range of RV14 titres (2.5 –
80x104TCID50
/ml)
and cell viability assessed at (A) 2, (B) 6, (C) 12, (D) 24, (E) 48 and (F) 72
hours post infection via MTS assay. Results were then compared to uninfected cells grown in culture media only (Media). Results showed
there was no statistical difference (p = 0.2927) in viability between uninfected pAECHNA
and pAECHNA
exposed to RV14 regardless of
viral titre and exposure time.
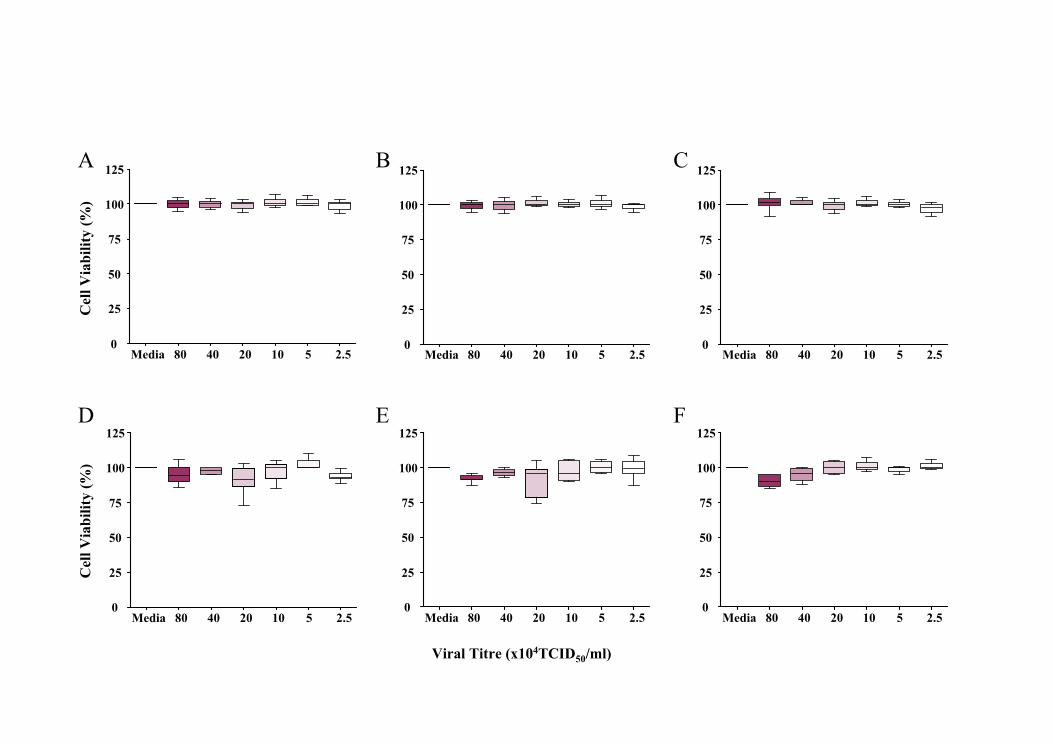
80 40 20 10 5 2.50
25
50
75
100
125
80 40 20 10 5 2.50
25
50
75
100
125
80 40 20 10 5 2.50
25
50
75
100
125
80 40 20 10 5 2.50
25
50
75
100
125
80 40 20 10 5 2.50
25
50
75
100
125
Media Media Media
Media Media Media 80 40 20 10 5 2.50
25
50
75
100
125
Cel
l Via
bil
ity
(%)
Viral Titre (x104TCID50
/ml)
A B C
D E F
Cel
l Via
bil
ity
(%)

Figure 5.3. Cytotoxic
effects of RV14 on pAECAA
viability. pAECs
were seeded in 96 wells plates, grown to 80% confluence and
exposed to a range of RV14 titres (2.5 –
80x104TCID50
/ml)
and cell viability assessed at (A) 2, (B) 6, (C) 12, (D) 24, (E) 48 and (F) 72
hours post infection via MTS assay. Results were then compared to uninfected cells grown in culture media only (Media). Results showed
that the exposure of pAECAA
to RV14 had both a dose and time-dependent effect on cell viability.
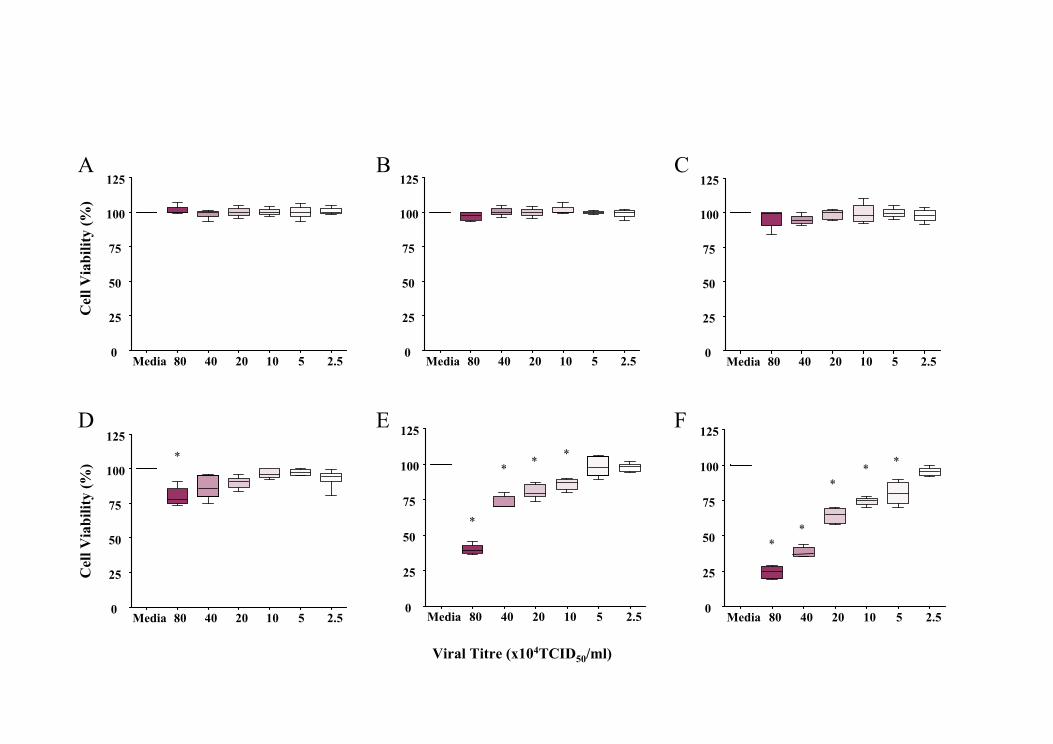
80 40 20 10 5 2.50
25
50
75
100
125
80 40 20 10 5 2.50
25
50
75
100
125
80 40 20 10 5 2.50
25
50
75
100
125
80 40 20 10 5 2.50
25
50
75
100
125
80 40 20 10 5 2.50
25
50
75
100
125
Media Media Media
Media Media Media 80 40 20 10 5 2.50
25
50
75
100
125
Cel
l Via
bil
ity
(%)
Viral Titre (x104TCID50
/ml)
A B C
D E F
Cel
l Via
bil
ity
(%)
*
*
**
*
**
**
*

Stevens 2009
147
______________________________________________________________________
5.5.2.3 pAECHNA exposure to RV1b
Exposure of pAECHNA to the RV1b serotype produced both a time and dose dependent
effect in regard to viability. There was no statistical difference in cellular viability
between unexposed cells and pAECHNA exposed to RV1b for ≤ 6 hours (p > 0.0575;
Figure 5.4A-B). RV1b titres ≥ 20x105TCID50/ml and 5x10⁵TCID50/ml significantly
decreased cell viability after 12 (p = 0.0237; Figure 5.4C) and 24 (p < 0.0001; Figure
5.4D) hours respectively. When pAECHNA were exposed for 48 (Figure 5.4E) and 72
(Figure 5.4F) hours there was a significant decline in pAEC viability with all viral titres
greater than 1.25x10⁵TCID50/ml (p < 0.0031).
5.5.2.4 pAECAA exposure to RV1b
Exposure of pAECAA to RV1b also were found to have both a time and dose dependent
effect on cell viability. There was no statistical difference in cell viability between
unexposed cells and pAECAA exposed with RV1b after 2 hours (p = 0.0879; Figure
5.5A). In contrast to pAECHNA, there was a significant decline in cell viability after only
6 hours of exposure to titres ≥ 20x105TCID50/ml (p = 0.0303; Figure 5.5B). This
susceptibility to RV1b exposure was elevated further using an RV1b titres ≥
2.5x10⁵TCID50/ml over 12 hours (p = 0.0480; Figure 5.5C). RV1b was observed to

Figure 5.4. Cytotoxic
effects of RV1b on pAECHNA
viability. pAECs
were seeded in 96 wells plates, grown to 80% confluence and
exposed to a range of RV1b titres (2.5 –
80x104TCID50
/ml)
and cell viability assessed at (A) 2, (B) 6, (C) 12, (D) 24, (E) 48 and (F) 72
hours post infection via MTS assay. Results were then compared to uninfected cells grown in culture media only (Media). Results
showed that the exposure of pAECHNA
to RV1b had both a dose and time-dependent effect on cell viability.

80 40 20 10 5 2.50
25
50
75
100
125
80 40 20 10 5 2.50
25
50
75
100
125
80 40 20 10 5 2.50
25
50
75
100
125
80 40 20 10 5 2.50
25
50
75
100
125
Cel
l Via
bil
ity
(%)
Viral Titre (x104TCID50
/ml)
A B C
D E F
*
80 40 20 10 5 2.50
25
50
75
100
125
Cel
l Via
bil
ity
(%)
*
*
**
*
*
*
**
Media Media Media
MediaMedia Media 80 40 20 10 5 2.50
25
50
75
100
125
**
*
*
*

Figure 5.5. Cytotoxic
effects of RV1b on pAECAA
viability. pAECs
were seeded in 96 wells plates, grown to 80% confluence and
exposed to a range of RV1b titres (2.5 –
80x104TCID50
/ml)
and cell viability assessed at (A) 2, (B) 6, (C) 12, (D) 24, (E) 48 and (F) 72
hours post infection via MTS assay. Results were then compared to uninfected cells grown in culture media only (Media). Results
showed that the exposure of pAECAA
to RV1b had both a dose and time-dependent effect on cell viability.

80 40 20 10 5 2.50
25
50
75
100
125
80 40 20 10 5 2.50
25
50
75
100
125
80 40 20 10 5 2.50
25
50
75
100
125
Cel
l Via
bil
ity
(%)
Viral Titre(x104TCID50
/ml)
A B C
D E F
Cel
l Via
bil
ity
(%)
**
80 40 20 10 5 2.50
25
50
75
100
125
**
* * *
80 40 20 10 5 2.50
25
50
75
100
125
*
** *
**
Media Media
Media
Media
Media Media 80 40 20 10 5 2.50
25
50
75
100
125
* **
**
*
**
**
* *

Stevens 2009
148
______________________________________________________________________
significantly affect pAECAA viability at all titres utilised when exposed for greater than
24 hours (p < 0.0481; Figure 5.5D-F).
5.5.3 Rhinoviral induction of apoptosis
Apoptotic responses in virally-exposed cells are a key protective mechanism against
viral replication and release and thus a ssDNA apoptosis ELISA was performed to
determine whether pAECs underwent apoptosis following RV exposure, and if so to
what extent.
5.5.3.1 Apoptotic effect of RV14
The induction of apoptosis by RV14 was found to be dependent on exposure time, viral
titre and pAEC phenotype. Results generated showed that RV14 did not stimulate either
pAECHNA or pAECAA to undergo apoptosis to any significant degree using the lowest
titre of 1.25x10⁵TCID50/ml even after 48 hours exposure (p = 0.0515; Figure 5.6A).
However, there was a significant elevation in apoptosis using the highest titre of
40x105TCID50/ml of RV14 at both 6 hours (p = 0.0368) exposure in pAECAA and 12
hours (p < 0.0265) in pAECHNA (Figure 5.6B). Maximal levels of apoptosis were
observed in pAECHNA after 48 hours (>700%, p < 0.0001) however, maximal apoptosis

U 6 12 24 48 U 6 12 24 480
200
400
600
800
0
200
400
600
800
p = 0.0304
p = 0.0003
* * *
**
*
*
Incr
ease
in A
pop
tosi
s (%
)
Exposure Time (hours)
A B
Figure 5.6. Apoptotic effect of RV14.
pAECHNA
(green) and pAECAA (grey) were grown to 80% confluence and exposed to two titres
of
RV14; (A) 2.5x10⁴TCID50
/ml and (B) 80x104TCID50
/ml. The cell viability was assessed at 6, 12, 24 and 48 hours post infection via MTS
assay. Results were then compared to unexposed cells (U) which were assigned an arbitrary value of 100%. An elevation in apoptosis in the
infected cells was expressed as a percentage increase over uninfected cells. RV14 induced apoptosis in a dose and time-dependent manner,
and had a greater effect on pAECHNA compared to pAECAA
.

Stevens 2009
149
______________________________________________________________________
in the pAECAA was significantly lower at both comparative time points (p = 0.0304 at
24 hrs; p = 0.0003 at 48 hrs; Figure 5.6B).
5.5.3.2 Apoptotic effect of RV1b
Apoptosis induction by RV1b was observed to be dependent on both exposure time and
viral titre although no statistical difference between pAECAA and pAECHNA cells was
observed. When exposed to a titre of 1.25x10⁵TCID50/ml of RV1b, pAECHNA
demonstrated significant elevation in apoptosis after 24 hours (p = 0.0201) with
maximal levels seen at 48 hours (277%) (p = 0.0194; Figure 5.7A). Similarly, pAECAA
demonstrated significant elevation in apoptosis after 12 hours (p = 0.0025) with the
greatest increase recorded after 48 hours at (371%, p = 0.0043; Figure 5.7A). When
using a titre of 40x105TCID50/ml of RV1b, a significant increase in apoptosis was
recorded in pAECHNA after 6 hours exposure (p = 0.0033) with an elevation of 727% at
48 hours (p = 0.0003; Figure 5.7B). Significant elevations in apoptosis were also
observed in the pAECAA after 6 hours (p = 0.0155) with maximal levels witnessed after
48 hours of exposure (605%, p = 0.0020).
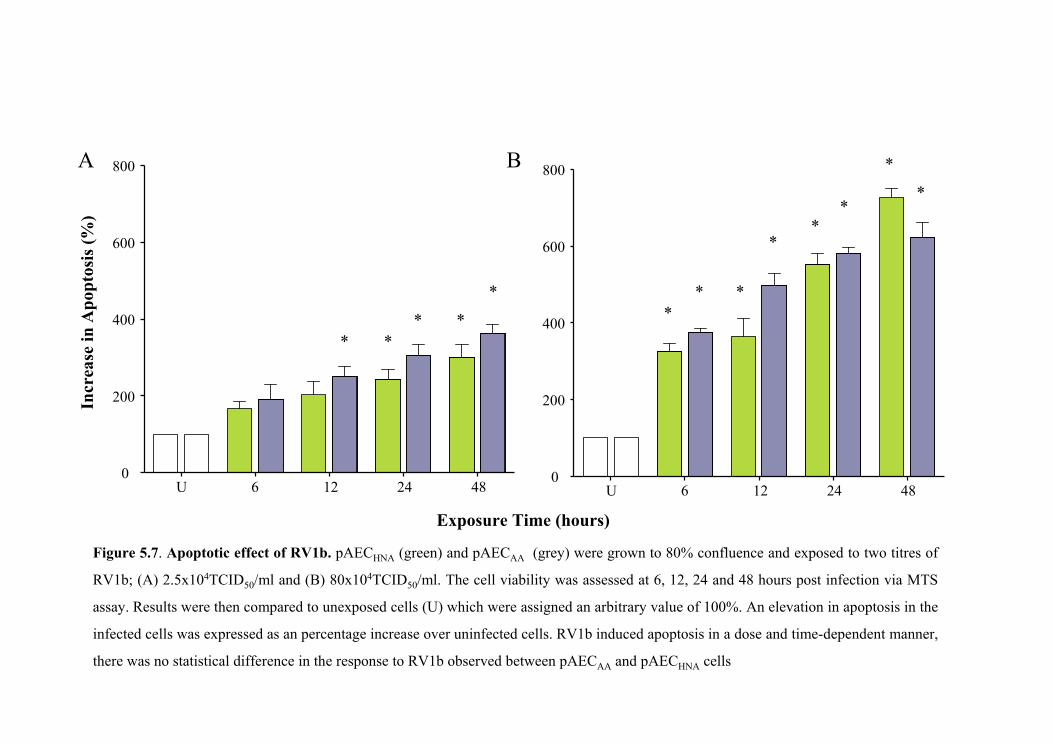
U 6 12 24 480
200
400
600
800
**
**
*
U 6 12 24 480
200
400
600
800
** *
**
*
*
*
Incr
ease
in A
pop
tosi
s (%
)
A B
Exposure Time (hours)
Figure 5.7. Apoptotic effect of RV1b.
pAECHNA
(green) and pAECAA
(grey) were grown to 80% confluence and exposed to two titres
of
RV1b; (A) 2.5x10⁴TCID50
/ml and (B) 80x104TCID50
/ml. The cell viability was assessed at 6, 12, 24 and 48 hours post infection via MTS
assay. Results were then compared to unexposed cells (U) which were assigned an arbitrary value of 100%. An elevation in apoptosis in the
infected cells was expressed as an percentage increase over uninfected cells. RV1b induced apoptosis in a dose and time-dependent manner,
there was no statistical difference in the response to RV1b observed between pAECAA
and pAECHNA
cells

Stevens 2009
150
______________________________________________________________________
5.5.4 Cytokine releases following rhinoviral exposure
Knowing that viruses are able to cause cellular injury, and that injury is often an
inflammatory process, protein levels of some pro-inflammatory and regulatory
cytokines were measured following RV infection. The inflammatory cytokines IL-1β,
IL-6, and IL-8 were measured in the culture supernatants taken from pAEC exposed to
RV as was TGF-β1 due to its essential role in cell growth and regulation.
5.5.4.1 IL-1β release with RV14 exposure.
Data obtained showed that RV14 exposure to both pAECHNA and pAECAA lacked the
capacity to generate a significant elevation in IL-1β. There was no statistical change in
IL-1β release in the media from pAECHNA following RV14 exposure even after 48
hours (p > 0.05; Figure 5.8A). IL-1β release from pAECAA was similar to that of their
healthy counterparts, where there were no significant difference in the inflammatory
protein level at all time points and concentrations measured except for a marginally
significant elevation at 48 hours using viral titres ≥ 20x105TCID50/ml (p = 0.0498;
Figure 5.8B).
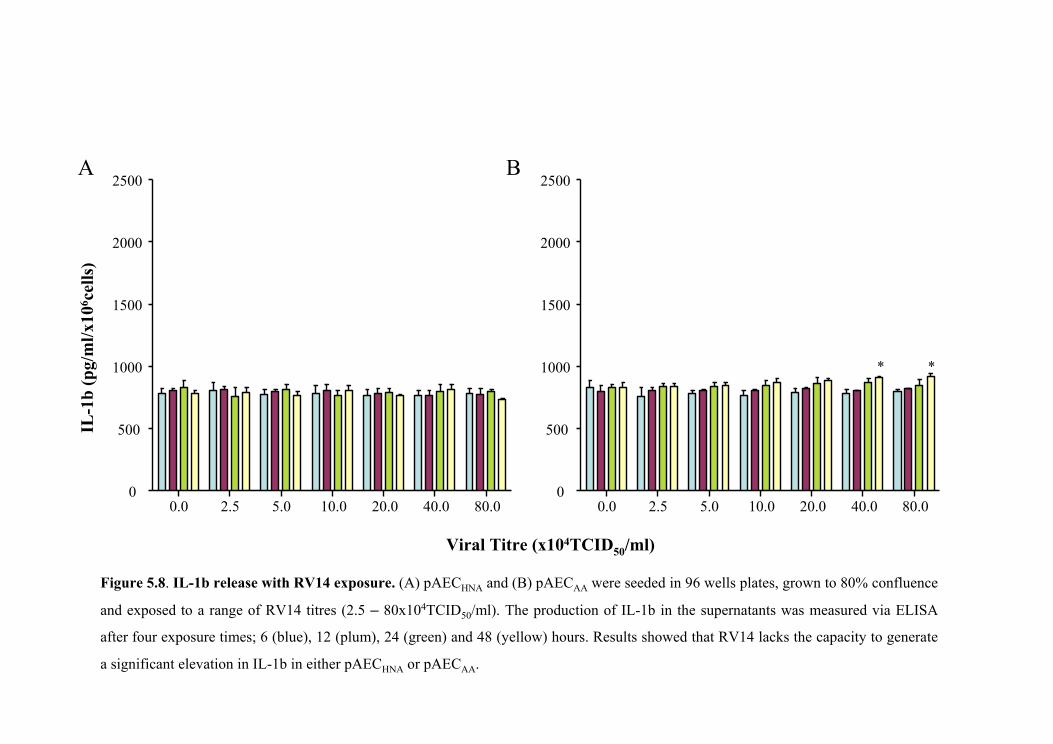
A B
IL-1
b (
pg/
ml/
x106 c
ells
)
Viral Titre (x104TCID50
/ml)
0.0 2.5 5.0 10.0 20.0 40.0 80.00
500
1000
1500
2000
2500
0.0 2.5 5.0 10.0 20.0 40.0 80.00
500
1000
1500
2000
2500
**
Figure 5.8.
IL-1b release with RV14 exposure. (A) pAECHNA
and (B) pAECAA
were seeded in 96 wells plates, grown to 80% confluence
and exposed to a range of RV14 titres (2.5 – 80x104TCID50
/ml). The production of IL-1b in the supernatants was measured via ELISA
after four exposure times; 6 (blue), 12 (plum), 24 (green) and 48 (yellow) hours. Results showed that RV14 lacks the capacity to generate
a significant elevation in IL-1b in either pAECHNA
or pAECAA
.

Stevens 2009
151
______________________________________________________________________
5.5.4.2 IL-1β release with RV1b exposure.
Data generated in this investigation showed that exposure of RV1b was able to elevate
IL-1β release by pAECAA but not pAECHNA and that the elevation was viral titre and
exposure time-dependent. Exposure of pAECHNA to RV1b did not produce any
significant elevation in IL-1β protein levels in culture media at any viral titres used or
length of viral exposure (p > 0.05; Figure 5.9A). In contrast, there was a significant
increase in IL-1β production in pAECAA following RV1b infection (Figure 5.9B), where
different protein levels were witnessed at all time points when using viral titres ≥
2.5x10⁵TCID50/ml (p < 0.0065). The greatest increase in protein release was observed
using the highest viral titres and the longest exposure times indicating that the elevation
in IL-1β in these cells was both dose and time-dependent.
5.5.4.3 IL-6 release with RV14 exposure.
Results also demonstrated that RV14 was able to induce elevated IL-6 release by
pAECs in both a time and dose dependent manner and that this elevation was not
specific to cell phenotype. Significant elevations in secreted IL-6 protein levels were
recorded in pAECHNA following RV14 infection (p < 0.001; Figure 5.10A) at all
exposure periods and viral titres assessed. The IL-6 response generated by pAECHNA
appeared to demonstrate a dose dependent association only when using a viral titre of
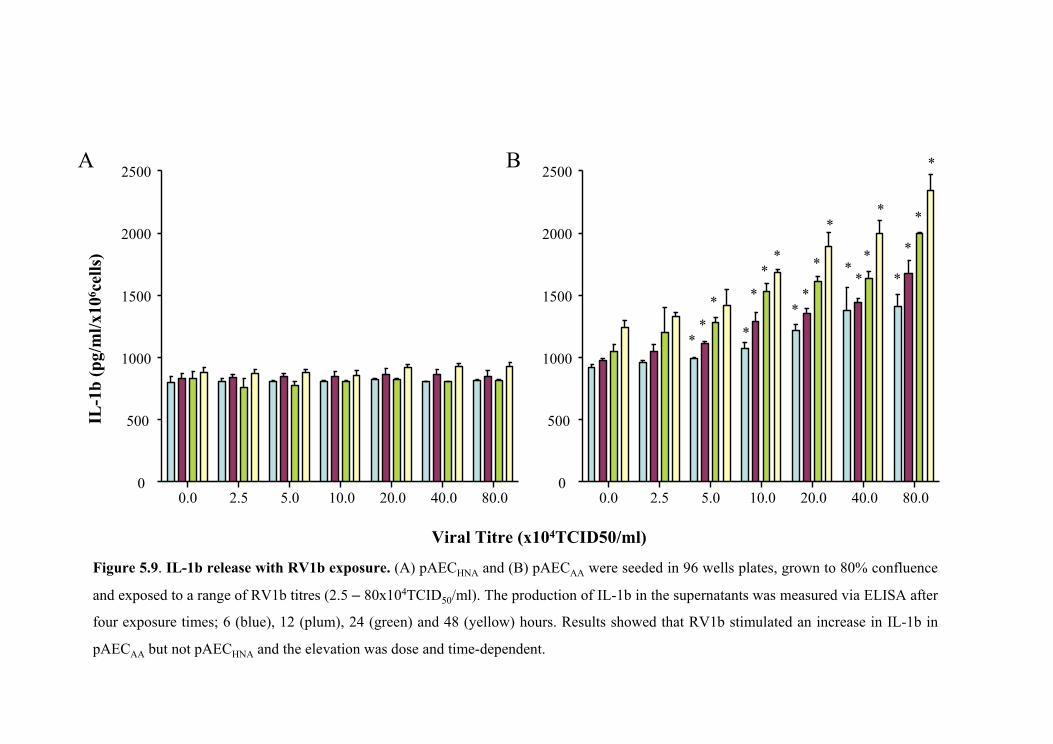
A B
Viral Titre (x104TCID50/ml)
0.0 2.5 5.0 10.0 20.0 40.0 80.00
500
1000
1500
2000
2500
0.0 2.5 5.0 10.0 20.0 40.0 80.00
500
1000
1500
2000
2500
**
*
*
*
**
**
*
*
**
*
*
*
*
*
*
Figure 5.9.
IL-1b release with RV1b exposure. (A) pAECHNA
and (B) pAECAA
were seeded in 96 wells plates, grown to 80% confluence
and exposed to a range of RV1b titres (2.5 – 80x104TCID50
/ml). The production of IL-1b in the supernatants was measured via ELISA after
four exposure times; 6 (blue), 12 (plum), 24 (green) and 48 (yellow) hours. Results showed that RV1b stimulated an increase in IL-1b in
pAECAA
but not pAECHNA
and the elevation was dose and time-dependent.
IL-1
b (
pg/
ml/
x106 c
ells
)

0.0 2.5 5.0 10.0 20.0 40.0 80.00
10000
20000
30000
40000
50000
60000
70000
0.0 2.5 5.0 10.0 20.0 40.0 80.00
10000
20000
30000
40000
50000
60000
70000
Viral Titre (x104TCID50
/ml)
A B
* * * ** * * * * * * * * * * * * * * *
*
*
* * * * * * * * * * * ***
* *
* **
*
*
*
*
Figure 5.10.
IL-6 release with RV14 exposure. (A) pAECHNA
and (B) pAECAA
were seeded in 96 wells plates, grown to 80% confluence
and exposed to a range of RV14 titres (2.5 – 80x104TCID50
/ml). The production of IL-6 in the supernatants was measured via TRF after
four exposure times; 6 (blue), 12 (plum), 24 (green) and 48 (mustard) hours. Results showed that RV14 stimulated an increase in IL-6 in
both pAECAA
and pAECHNA
and that the elevation was dose and time-dependent. There was no statistical difference between the two
phenotypes.
IL-6
(p
g/m
l/x1
06 cel
ls)

Stevens 2009
152
______________________________________________________________________
40x105TCID50/ml; similarly, a time-dependent trend was only observed when using a
viral titre of 40x105TCID50/ml. A similar trend was also observed following exposure of
pAECAA to RV14 (Figure 5.10B). IL-6 levels were significantly elevated at all exposure
periods and viral titres with the greatest levels recorded after 48 hours exposure with a
titre of 40x105TCID50/ml (p < 0.0001; Figure 5.10B). A clear dose and time-dependent
trend was also observed when viral titres ≥ 10x105TCID50/ml were used. There was no
significant difference in the IL-6 expression levels between the two cell phenotypes (p >
0.05).
5.5.4.4 IL-6 release with RV1b exposure.
In this study, RV1b was able to induce an IL-6 elevation in a time and dose dependent
manner and had a greater effect on pAECAA when compared to pAECHNA. Exposure of
pAECHNA to the RV1b serotype produced marked elevation in IL-6 levels at all viral
titres over 48 hours of exposure in a dose dependent manner (p < 0.0001; Figure
5.11A). Significant levels were also recorded using titres ≥ 10x105TCID50/ml after 24
hours of viral exposure, with the greatest elevation in IL-6 observed after 48 hours of
exposure using the maximal viral titre (p = 0.0009). The IL-6 response observed was
also observed to be time-dependent in pAECHNA. Exposure of pAECAA to RV1b
produced a greater trend in IL-6 expression to their healthy counterparts (Figure 5.11B).
Significant levels of IL-6 were detected using a viral titre ≥ 1.25x10⁵TCID50/ml in a

0.0 2.5 5.0 10.0 20.0 40.0 80.00
10000
20000
30000
40000
50000
60000
70000
0.0 2.5 5.0 10.0 20.0 40.0 80.00
10000
20000
30000
40000
50000
60000
70000
Viral Titre(x104TCID50
/ml)
A B
* * * *
*
*
**
* *
*
* *
*
*
*
* * **
** *
*
*
*
*
*
*
*
*
Figure 5.11.
IL-6 release with RV1b exposure. (A) pAECHNA
and (B) pAECAA
were seeded in 96 wells plates, grown to 80% confluence
and exposed to a range of RV1b titres (2.5 – 80x104TCID50
/ml). The production of IL-6 in the supernatants was measured via TRF after
four exposure times; 6 (blue), 12 (plum), 24 (green) and 48 (yellow) hours. Results showed that RV1b is able to induce an IL-6 elevation in
a dose and time-dependent manner and has a greater effect on pAECAA
compared to pAECHNA
.
IL-6
(p
g/m
l/x1
06 cel
ls)

Stevens 2009
153
______________________________________________________________________
dose dependent trend. A time-dependent pattern was also detected when comparing 6,
12 and 24 hours of exposure. Results also showed that IL-6 levels produced in pAECAA
was significantly greater compared to pAECHNA (p < 0.0001). In addition, RV1b was
able to generate a significantly greater IL-6 response when compared to exposure of the
same cell phenotype with RV14 (p = 0.0006).
5.5.4.5 IL-8 release with RV14 exposure.
Data produced showed that RV14 exposure of pAECs resulted in elevated IL-8 release
in a time and dose dependent manner. In addition, IL-8 elevation was greater in the
pAECAA compared to pAECHNA. Following RV14 exposure, there was significant
elevation in IL-8 protein release in the media from pAECHNA (p < 0.003; Figure 5.12A)
and protein levels were elevated at all exposure periods, at all viral titres used. The
greatest IL-8 level was observed after 48 hours of exposure with the highest viral titre,
though a dose dependent trend was only observed using a titre of 40x105TCID50/ml. A
clear time-dependent trend was observed at all viral titres in these cells. Similarly,
exposure of pAECAA to RV14 resulted in significantly elevated IL-8 levels at all
exposure periods and viral titres, with the greatest level recorded after 48 hours with a
titre of 40x105TCID50/ml (p < 0.0001; Figure 5.12B). The IL-8 response was observed
to be both dose and time-dependent in these cells. When IL-8 levels were compared

0.0 2.5 5.0 10.0 20.0 40.0 80.00
250000
500000
750000
0.0 2.5 5.0 10.0 20.0 40.0 80.00
250000
500000
750000
Viral Titre (x104TCID50
/ml)
A B
* * * ** * * *
* * * ** ** *
***
**
* * *
* * *
*
* * ** * *
* * ** * *
** *
*
*
***
Figure 5.12.
IL-8 release with RV14 exposure. (A) pAECHNA
and (B) pAECAA
were seeded in 96 wells plates, grown to 80% confluence
and exposed to a range of RV14 titres (2.5 – 80x104TCID50
/ml). The production of IL-8 in the supernatants was measured via ELISA after
four exposure times; 6 (blue), 12 (plum), 24 (green) and 48 (yellow) hours. Results showed that RV14 is able to induce an IL-8 elevation
in a dose and time-dependent manner and has a greater effect on pAECAA
compared to pAECHNA
.
IL-8
(p
g/m
l/x1
06 cel
ls)
*

Stevens 2009
154
______________________________________________________________________
between the two cell phenotypes it was evident that pAECAA produced significantly
greater amounts of protein at comparable time points and titres.
5.5.4.6 IL-8 release with RV1b exposure.
Data generated demonstrate that RV1b was able to generate elevated IL-8 release in
pAEC in a time and dose dependent manner and that RV1b had a greater effect on IL-8
production in pAECAA compared to pAECHNA. When pAECHNA were exposed to the
RV1b serotype, a significant elevation in IL-8 protein was observed at a viral titre of
40x105TCID50/ml at all time points (p < 0.0001; Figure 5.13A). Significant increases in
IL-8 levels were also recorded using viral titres ≥ 5x10⁵TCID50/ml with viral exposure
time of at least 24 hours, with the greatest elevation occurring after 48 hours using the
maximal viral titre (p = 0.0005). IL-8 release was also dose dependent when comparing
viral titres ≥ 10x105TCID50/ml and time-dependent when comparing 24 and 48 hours of
viral exposure in these cells. The exposure of pAECAA to RV1b produced a very similar
trend in IL-8 release (Figure 5.13B) with significant levels recorded using a viral titre of
40x105TCID50/ml at all time points. Significant elevations in IL-8 release were also
detected using a viral titre ≥ 2.5x10⁵TCID50/ml at all exposure periods. The IL-8
response was found to be both dose and time-dependent. IL-8 protein production using
a viral titre of 40x105TCID50/ml was significantly greater in the pAECAA than that
observed in the pAECHNA (p = 0.0006). In addition, RV1b was able to generate a

0.0 2.5 5.0 10.0 20.0 40.0 80.00
250000
500000
750000
0.0 2.5 5.0 10.0 20.0 40.0 80.00
250000
500000
750000A B
Viral Titre (x104TCID50
/ml)
* * * **
*
* ** *
*
*
** * * * *
**
*
*
*
*
*
*
*
*
*
Figure 5.13.
IL-8 release with RV1b exposure. (A) pAECHNA
and (B) pAECAA
were seeded in 96 wells plates, grown to 80% confluence
and exposed to a range of RV1b titres (2.5 – 80x104TCID50
/ml). The production of IL-8 in the supernatants was measured via ELISA after
four exposure times; 6 (blue), 12 (plum), 24 (green) and 48 (yellow) hours. Results showed that RV1b is able to induce an IL-8 elevation
in a dose and time-dependent manner and has a greater effect on pAECAA
compared to pAECHNA
.
IL-8
(p
g/m
l/x1
06 cel
ls)

Stevens 2009
155
______________________________________________________________________
significantly greater IL-8 response in comparison to exposure of the same cell
phenotype with RV14 (p = 0.0009).
5.5.4.7 TGFβ-1 release with RV14 exposure.
Results produced demonstrated that RV14 was able to induce TGFβ-1 release in
pAECAA but not pAECHNA and that this was dependent on viral exposure time but not
viral titre used. There was no statistical difference in TGFβ-1 release in pAECHNA
following exposure to RV14 at any exposure time or viral titre used (Figure 5.14A).
However, RV14 was able to produce a significant increase in TGFβ-1 protein release
from pAECAA with viral titres as low as 1.25x10⁵TCID50/ml following 24 hours of
exposure (p < 0.0024; Figure 5.14B). Compared to the other cytokines measured,
TGFβ-1 release appeared to be independent of viral titre, with TGFβ-1 levels recorded
using a viral titre of 1.25x10⁵TCID50/ml not statistically different from those observed
when using a titre of 40x105TCID50/ml (p = 0.2987). A time-dependent association was
also evident at all viral titres in pAECAA.
5.5.4.8 TGFβ-1 release with RV1b exposure.
Data generated showed that RV1b infection of pAECs resulted in exposure time-
dependent elevation in TGFβ-1. In addition, TGFβ-1 elevation was greater in the

A B
TG
Fβ-
1(p
g/m
l/x10
6 cel
ls)
Viral Titre (x104TCID50
/ml)
0.0 2.5 5.0 10.0 20.0 40.0 80.0 0.0 2.5 5.0 10.0 20.0 40.0 80.00
600
1200
1800
0
600
1200
1800
* * * * * * * ** * *
*
**
Figure 5.14.
TGFβ-1
release with RV14 exposure. (A) pAECHNA
and (B) pAECAA
were seeded in 96 wells plates, grown to 80%
confluence and exposed to a range of RV14 titres (2.5 – 80x104TCID50
/ml). The production of TGFβ
in the supernatants was measured via
ELISA after four exposure times; 6 (blue), 12 (plum), 24 (green)
and 48 (yellow) hours. Results showed that RV14 is able to generate a
TGFβ-1 elevation in pAECAA
but not pAECHNA
and the increase is dependent on viral exposure time but not vial dose.
Stevens 2009
156
______________________________________________________________________
pAECAA in comparison to pAECHNA. Following RV1b exposure, there was significant
elevation in TGFβ-1 protein release in the media from pAECHNA at all viral titres and
exposure periods (p < 0.003; Figure 5.15A). TGFβ-1 release appeared to be independent
of viral titre, though a strong association between TGFβ-1 release and viral exposure
period was observed. Similar results were obtained when pAECAA were exposed to
RV1b. TGFβ-1 levels were elevated at all time points and all viral titres and the
observed increase was dependent on viral exposure period but not on viral titre (p <
0.0002; Figure 5.15B). When the two cell phenotypes were compared, pAECAA
produced greater TGFβ-1 than pAECHNA (p = 0.0478). In addition, RV1b was able to
generate significantly greater TGFβ-1 in comparison to exposure of the same cell
phenotype with RV14 (p = 0.0012).
5.5.5 Rate of pAEC proliferation following rhinoviral exposure
Since infection with RV has been shown to alter the proliferative capacity of epithelial
cell lines, proliferation assays were then performed on virally-exposed pAEC. Results
obtained showed that infection of pAECHNA with RV1b significantly decreased the rate
of proliferation resulting in stagnation of cell replication after 7 days of culture (p =
0.0008; Figure 5.16A). Conversely, exposure to RV14 did not have a significant effect
on pAECHNA proliferation when compared to unexposed cells (p = 0.5857; Figure
5.16A). Asthmatic cells also demonstrated a significantly diminished capacity to

A B
Viral Titre (x104TCID50
/ml)
0.0 2.5 5.0 10.0 20.0 40.0 80.0 0.0 2.5 5.0 10.0 20.0 40.0 80.00
600
1200
1800
0
600
1200
1800
*
*
Figure 5.15.
TGFβ-1
release with RV1b exposure. (A) pAECHNA
and (B) pAECAA
were seeded in 96 wells plates, grown to 80%
confluence and exposed to a range of RV1b titres (2.5 – 80x104TCID50
/ml). The production of TGFβ
in the supernatants was measured via
ELISA after four exposure times; 6 (blue), 12 (plum), 24 (green)
and 48 (yellow) hours. Results showed that RV1b is able to generate a
TGFβ-1 elevation in both pAECAA
and pAECHNA
and the elevation is greater in the pAECAA
. The increase is dependent on viral exposure
time but not vial dose.
TG
Fβ-
1(p
g/m
l/x10
6 cel
ls)

Figure 5.16.
Effects of RV exposure on pAEC proliferative capacity. (A)
pAECHNA
and (B) pAECAA
were seeded at low density in a 96 well plate, cultured
for 24 hours and infected with 1.25x10⁴TCID50/ml of RV14 ▲
or RV1b ■. The
rate of proliferation was determined at 24 hour interval with the MTS assay and
compared to uninfected cells ●. Results showed that RV14 did not have any
significant effect on the proliferation rate of pAECHNA
, whereas
RV1b significantly
decreased pAECHNA
proliferation in comparison to uninfected cells. RV14 had a
significant effect on pAECAA
proliferation, as did RV1b, thought to a much greater
extent.

0 2 4 6 80
1
2
3
Cel
l p
roli
fera
tion
(49
2nm
)
0 2 4 6 80
1
2
3
Days post RV challenge
Cel
l p
roli
fera
tion
(49
2nm
)A
B
Stevens 2009
157
______________________________________________________________________
proliferate following RV1b infection with the percentage of metabolically active cells
present following 6 days of culture being significantly less than that original seeding
number (p < 0.0001; Figure 5.16B). RV14 was not found to have a significant effect on
pAECAA proliferation (p < 0.072; Figure 5.16B).
5.5.6 Ability for successful wound repair following rhinoviral exposure
With the observed reduction in cellular proliferation following viral exposure, pAEC
monolayers were then exposed to both RV serotypes and wounded to assess the effect
of viral exposure on the ability of pAECs to successfully repair mechanically induced
wounds. The results generated showed that unexposed pAECHNA achieved 100% repair
8 days post wounding (Figure 5.17A). However, infection with both RV14 and RV1b
significantly delayed successful wound repair to 11 (p <0.0011) and 15 (p = 0.0001)
days respectively (Figure 5.17A). Unexposed pAECAA were only able to achieve
approximately 60% repair 30 days post wounding (Figure 5.17B). Exposure of these
cells with RV14 significantly decreases the percentage of repair at 30 days post
wounding (52.5%; p = 0.0002) and RV1b severely prevented wound closure with only
45% repair seen after 30 days of culture (p < 0.0001; Figure 5.17B). These data
demonstrated that pAECAA had significantly longer repair time than pAECHNA and that
RV1b had a greater effect on wound closure than RV14.

Figure 5.17.
Wound closure ability of pAEC with RV exposure. (A) pAECHNA
and (B) pAECAA
were seeded 12 well plates, grown to 80% confluence and exposed
to 1.25x10⁴TCID50/ml of RV14 ▲
or RV1b ■. For 24 hours. The pAECs
were
wounded and the rate of wound closure monitored every 24 hours and compared to
uninfected cells ●. Results showed that both RV14 and RV1b significantly delayed
wound closure in pAECHNA
, thought RV1b had a greater effect. Similarly, RV14
and RV1b significantly delayed wound closure in pAECAA
and RV1b had the
greater effect. In addition, pAECAA
were more sensitive to the effects of RV
compared to pAECHNA
.

0 2 4 6 8 10 12 14 16 18 200
20
40
60
80
100
120W
oun
d C
losu
re (
%)
0 5 10 15 20 25 300
20
40
60
80
100
120
Days post wounding
Wou
nd
Clo
sure
(%
)A
B

Stevens 2009
158
______________________________________________________________________
5.5.7 PAI-1 expression following rhinoviral exposure
Knowing that RV infection is responsible for cellular death in pAECs and that PAI-1 is
typically released upon cellular injury, PAI-1 expression was then measured in both
pAECHNA and pAECAA following infection with 1.25x10⁵TCID50/ml of RV14 and
RV1b.
5.5.7.1 PAI-1 expression with RV14 exposure
Data generated in this chapter showed that exposure of pAECs with RV14 resulted in a
significant elevation in PAI-1 in both phenotypes, though levels were significantly
greater in pAECAA due to the elevated baseline levels of PAI-1. Exposure of pAECHNA
with RV14 resulted in significant PAI-1 up-regulation 48 (p = 0.0363) and 72 (p =
0.0465) hours post exposure compared to unexposed cells (Figure 5.18A). Similarly,
PAI-1 was significantly elevated in pAECAA at 48 (p = 0.0265) and 72 (p = 0.0392)
hours post exposure (Figure 5.18A). Unexposed pAECAA produced 68 fold more PAI-1
than pAECHNA. Following RV14 exposure, there was an observed 84 fold difference in
pAECAA PAI-1 expression level compared to pAECHNA after 24 hours (Figure 5.18B; p
< 0.0001). Significant differences were also recorded at both 48 (64 fold: p < 0.0001)
and 72 hours (77 fold: p < 0.0001).

Basal 24 48 720
100
200
300
PA
I-1G
ene
Exp
ress
ion
(%
incr
ease
)
Basal 24 48 720
1
2
3
90
120
150
180
Time after wounding (Hours)
* ** *
*
* * *
PA
I-1G
ene
Exp
ress
ion
F
old
ch
ange
rel
ativ
e to
18s
Figure 5.18: Effect of RV14 exposure on PAI-1 expression. pAECHNA
□
and
pAECAA
■
were seeded into 12-well culture plates, grown to 80% confluence and
exposed to 1.5x10⁴TCID50/ml of RV14 and incubated for 24, 48 or 72 hours. The
cells were then harvested, RNA extracted and quantitative real time PCR
performed. Results showed that exposure of pAECs
to RV14 resulted in (A) a
significant elevation in PAI-1 in both phenotypes, (B) though levels were
significantly greater in pAECAA
due to the elevated baseline levels of PAI-1.
A
B

Stevens 2009
159
______________________________________________________________________
5.5.7.2 PAI-1 expression with RV1b exposure
Exposure of pAECs with the RV1b serotype, resulted in a significant elevation in PAI-1
in both phenotypes with significantly greater levels being observed in pAECAA due to
the elevated baseline levels of PAI-1. Exposure of pAECHNA with RV1b resulted in
significant up-regulation in PAI-1 expression at 24 (p = 0.0257) 48 (p = 0.0101) and 72
(p = 0.0365) hours post exposure compared to unexposed cells (Figure 5.19A).
Similarly, PAI-1 was significantly elevated in pAECAA 24 (p = 0.0299) 48 (p = 0.068)
and 72 (p = 0.0344) hours post RV exposure (Figure 5.18A). As stated above,
unexposed pAECAA produced 68 fold more PAI-1 than pAECHNA. Following RV1b
exposure, there was a maximal 73 fold difference in pAECAA PAI-1 expression levels
compared to pAECHNA following 48 hours RV1b exposure (Figure 5.19B; p < 0.0001).
Significant differences were also recorded at both 24 (55 fold; p < 0.003) and 72 hours
(59 fold; p < 0.0042).
5.5.8 MMP expression following rhinoviral exposure
Results generated in this chapter illustrated that RV exposure of pAECs was responsible
for cellular death and altered cellular function. However, knowing that pAEC MMP
activity is reduced in asthma, the effects of RV exposure on MMP expression and

Figure 5.19: Effect of RV1b exposure on PAI-1 expression. pAECHNA
□
and
pAECAA
■
were seeded into 12-well culture plates, grown to 80% confluence and
exposed to 1.25x10⁴TCID50/ml of RV1b and incubated for 24, 48 or 72 hours. The
cells were then harvested, RNA extracted and quantitative real time PCR
performed. Results showed that exposure of pAECs
to RV1b resulted in (A) a
significant elevation in PAI-1 in both phenotypes, (B) though levels were
significantly greater in pAECAA
due to the elevated baseline levels of PAI-1.
PA
I-1G
ene
Exp
ress
ion
(%
incr
ease
)
Time after wounding (Hours)
PA
I-1G
ene
Exp
ress
ion
F
old
ch
ange
rel
ativ
e to
18s
)
*
*
**
Basal 24 48 720
100
200
300
Basal 24 48 720
1
2
3
90
120
150
180
**
* ** *
A
B

Stevens 2009
160
______________________________________________________________________
activity were subsequently investigated to determine if RV exposure in asthmatic
patients could be involved in the reduced MMP activity witnessed.
5.5.8.1 MMP expression with RV14 exposure
Exposure of pAECs with RV14 resulted in reduced MMP-9 expression and activity in
pAECAA only. In addition, RV14 had no effect on MMP-2 levels in either phenotype
(Figure 5.20). The pAECs used in this experiment had undergone two serial passages
before RV exposure; the basal levels of MMPs from unexposed pAECAA and pAECHNA
were very similar (Figure 5.20A). Exposure of pAECHNA with 1.25x10⁵TCID50/ml of
RV14 for 48 hours had no effect on MMP-2 or MMP-9 protein activity (Figure 5.20B)
or gene expression (Figure 5.20C). Similarly, in pAECAA there was no change in MMP-
2 activity or expression following RV14 exposure. It was also observed that there was
almost complete absence of MMP-9 protein (Figure 5.20B) activity in pAECAA and a 4
fold down regulation in MMP-9 gene expression (Figure 5.20C) following viral
exposure.
5.5.8.2 MMP expression with RV1b exposure
Exposure of pAECs with RV1b resulted in a reduction of MMP-2 in pAECAA, though
not in pAECHNA, and reduced MMP-9 levels in both cell phenotypes. Following

MMP 9
MMP 2
HNA AA HNA AA
A B
MMP-2 MMP-9 MMP-2 MMP-9-5
-4
-3
-2
-1
0
Gen
e E
xpre
ssio
n(f
old
ch
ange
rel
ativ
e to
un
infe
cted
)
C
Figure 5.20.
Effect of RV14 exposure on MMP expression. pAECHNA
and
pAECAA
were seeded into 12-well culture plates, grown to 80% confluence and
exposed to 2.5x10⁴TCID50/ml of RV14 and incubated for 48 hours. Supernatants
were collected and gelatine zymography
performed to assess MMP activity, also
the were harvested, RNA extracted and quantitative real time PCR
performed. (A)
Results were compared to uninfected cells. Infection of pAECs
with RV14 resulted
in (B) reduced MMP-9 activity and (C) expression in pAECAA
though not in
pAECHNA
. RV14 had no effect on MMP-2 levels in either phenotype

Stevens 2009
161
______________________________________________________________________
exposure to 1.25x10⁵TCID50/ml of RV1b for 48 hours, MMP-2 levels were observed to
be unchanged in pAECHNA, though a small decrease in MMP-9 activity and gene
expression (Figure 5.21.B) were recorded. Exposure of pAECAA to RV1b resulted in a
slight reduction in observed MMP-2 activity and a 0.6 fold down-regulation in gene
expression (Figure 5.21B & C). MMP-9 activity was also markedly reduced with RV1b
exposure with an almost complete absence of protein activity when measured with
zymography (Figure 5.21B) and a > 4 fold down-regulation in gene expression (Figure
5.21C).

3 4
MMP 9
MMP 2
1 2
-5
-4
-3
-2
-1
0
MMP-2 MMP-9 MMP-2 MMP-9
Gen
e E
xpre
ssio
n(f
old
ch
ange
rel
ativ
e to
un
infe
cted
)
A B
C
Figure 5.21.
Effect of RV1b exposure on MMP expression. pAECHNA
and
pAECAA
were seeded into 12-well culture plates, grown to 80% confluence and
exposed to 2.5x10⁴TCID50/ml of RV1b and incubated for 48 hours. Supernatants
were collected and gelatine zymography
performed to assess MMP activity, also
the were harvested, RNA extracted and quantitative real time PCR
performed.
(A)
Results were compared to uninfected cells. Infection of pAECs
with RV1b resulted
in resulted in (B) reductions in MMP-2 activity and (C) expression in pAECAA
,
though not pAECHNA
, and reduced MMP-9 levels in both cell phenotypes.

Stevens 2009
162
______________________________________________________________________
5.6 Discussion
This chapter has comprehensively characterised RV exposure of pAECs isolated from
both asthmatic and healthy children. The susceptibility of pAECAA to exposure by RV
was greater than pAECHNA. RV exposure induced both inflammatory and apoptotic
responses in pAEC regardless of phenotype and RV1b was the most virulent virus
serotype. It also was shown that pAECAA exposed to RV had a markedly reduced
capacity to both proliferate and repair than pAECHNA. Exposure of pAECs with RV
resulted in elevated PAI-1 mRNA expression and reduced MMP-9 release in both
pAECAA and pAECHNA samples. Collectively, these data support the hypothesis that RV
has the ability to initiate an apoptotic and inflammatory response in pAECs which
reduces the proliferative and regenerative capacity of the cells. RV exposure also alters
normal cellular function, specifically by elevating PAI-1 synthesis and reducing MMP-9
production.
Epithelial cells are of prime importance during viral infections as they serve as the host
cell for viral replication and initiate the innate and adaptive immune responses. It has
been demonstrated previously that AEC are susceptible to RV infections (Subauste et
al., 1995), which are able to successfully replicate (Papadopoulos et al., 2000) and
produce a cytotoxic effect (Schroth et al., 1999, Papadopoulos et al., 2000, Bossios et
al., 2005). Data also suggests that subjects with asthma are more susceptible to RV

Stevens 2009
163
______________________________________________________________________
infections than healthy individuals (Corne et al., 2002) and that asthmatic AECs have a
deficient innate response to infection with RV (Wark et al., 2005).
The results in this chapter indicate that AEC isolated from a paediatric cohort are
susceptible to two laboratory serotypes of RV and the cytotoxic effects generated are
dependent on viral serotype, viral dose and duration of viral exposure. In addition, for
the first time it has been reported that pAECAA are more sensitive to RV1b exposure
compared to pAECHNA, as characterised by the marked decrease in cell viability. RV1b
typically gains entry to the cell via the low density lipoprotein (LDL) receptor rather
than ICAM-1 and thus it has been suggested that the abnormal response to RV observed
in pAECAA is a result of altered intracellular signalling rather than any difference in
ICAM-1 expression (Johnston, 2007). In the current study, two viral serotypes of RV
were used: RV14 (major group) and RV1b (minor group). RV1b has been reported to be
the most pathogenic in bronchial epithelial cell lines (Bossios et al., 2005) and adult
derived airway epithelial cells (Wark et al. 2007). Wark and colleagues have also
compared these commonly used laboratory serotypes to clinical isolates and have
reported that RV1b most closely resembles the pathogenicity of community strains of
RV. In addition, they also suggest that laboratory strains, such as RV14 and RV16, may
underestimate the response of bronchial epithelium to viral infections (Wark et al. 2007)
This investigation reports a significant increase in the level of apoptosis in both
pAECHNA and pAECAA following exposure with RV1b and RV14. Interestingly,

Stevens 2009
164
______________________________________________________________________
pAECAA were observed to produce smaller apoptotic responses when exposed to RV14
compared to pAECHNA despite demonstrating a greater loss in cell viability. Apoptosis
is an essential process for the destruction of potentially harmful cells such as those
infected with virus. It has been reported that AECs isolated from asthmatic adults
demonstrate an early resistance to apoptosis following RV-16 infection and that
inhibition of apoptosis in normal cells resulted in enhanced virus release (Wark et al.,
2005). Together, the data generated in this chapter suggest that that pAECAA do possess
an inherent resistance to apoptosis that may lead to greater viral replication and release
and a resultant elevation in cell death.
Viruses initiate inflammatory responses from AECs by binding to specific receptors on
the cell surface, activating intracellular signalling pathways and generating oxidative
stress (Kaul et al., 2000, Kurt-Jones et al., 2000, Alexopoulou et al., 2001), resulting in
cytokine release. Analysis of culture medium in which both pAECHNA and pAECAA
were grown following RV exposure, showed a marked elevation in the production and
release of pro-inflammatory cytokines including IL-1β, IL-6 and IL-8 and the regulatory
cytokine TGF-β1. The elevation of these cytokines was greatest with exposure to the
RV1b serotype. In agreement with these findings, similar elevated cytokine responses
of IL-1β, IL-6, IL-8, TNF-α and TGF-β, have been reported in both epithelial cell lines
and adult lavage samples (Proud et al., 1994, Johnston et al., 1998, Papadopoulos et al.,
2000, de Kluijver et al., 2003, Dosanjh, 2006).

Stevens 2009
165
______________________________________________________________________
IL-1β is an important mediator of the inflammatory response, and is involved in a
variety of cellular activities, including cell proliferation, differentiation, and apoptosis
(Dinarello, 1996, Chung and Barnes, 1999). IL-6 can induce T cell activation, B cell
antibody production and B cell differentiation (Akira et al., 1990), whilst IL-8 acts as a
chemoattractant for neutrophils, acting as their activator (Baggiolini et al., 1989) and is
chemotactic for lymphocytes (Larsen et al., 1989). As well as being increased in
response to RV infection, IL-1β, IL-6 and IL-8 have all been demonstrated to be
elevated in asthma (Broide et al., 1992, Mattoli et al., 1992, Redington et al., 1997).
These mediators can induce the accumulation of inflammatory cells in the airways
resulting in the release of reactive oxygen species and elastase (Nicholson et al., 1993)
which subsequently has been shown to cause further epithelial damage (Nakajoh et al.,
2003).
TGFβ-1 performs many cellular functions, including the control of cell growth, cell
proliferation, cell differentiation and apoptosis (Massague, 1990, Blobe et al., 2000).
The production of TGFβ-1 by pAECs, post viral exposure, may be indicative of a
reparative mechanistic response to counter inflammation, or in the setting of persistent
asthma, could potentially lead to increased fibrosis and collagen deposition (Dosanjh,
2006). Interestingly, TGFβ-1 has been demonstrated to have a protective effect from
apoptosis in human adult airway epithelial cells (Undevia et al., 2004). Results
generated in this chapter have shown that TGFβ-1 was significantly increased in
pAECAA following RV exposure although apoptosis was elevated in these cells

Stevens 2009
166
______________________________________________________________________
following exposure to RV14. Collectively, these data suggest elevated TGFβ-1 does not
provide protection against apoptosis following RV exposure in pAECAA and
demonstrates the need for further investigation into the role TGFβ-1 during RV
infections.
In addition to being more susceptible to RV exposure, it was shown in this chapter that
pAECAA produced a greater inflammatory response. The reason for this elevated
response is unclear. However, it can be speculated that the increased susceptibility to
infection and the reduced capacity to undergo apoptosis of these cells is responsible for
the observed elevated responses. One possible reason for the observed increased
susceptibility to RV exposure in asthmatics could be due to the presence of a T-helper
(Th) type 2 response (presence of IL-4, IL-5 and IL-13) in asthma. An adequate
antiviral immune response requires a Th1 cytokine response (IFN-γ and IL-12), Th1 and
Th2 immune response demonstrate mutual inhibition of each other; therefore, in atopic
asthma the pre-existing Th2 microenvironment, antiviral immunity may be suppressed.
In support of this, a study involving the exposure of PBMCs isolated from asthmatic
patients to RV reported lower IFN-γ and IL-12 production with a lower IFN-γ/IL-4 ratio
(Papadopoulos et al., 2002). These finding support the hypothesis that a Th2 dominant
environment in asthma cay account for increase susceptibility to viral infection.
Asthma is associated with epithelial damage with leukocyte infiltration and increased
airway responsiveness (Laitinen et al., 1985, Beasley et al., 1989, Jeffery et al., 1989).

Stevens 2009
167
______________________________________________________________________
Evidence of epithelial loss or shedding has been demonstrated in bronchial biopsies
from asthmatic subjects (Montefort et al., 1993). Given that RV infections have been
demonstrated to play a significant role in triggering asthmatic exacerbations (Johnston
et al., 1995), this chapter sought to investigate the role of RV in epithelial proliferation
and wound repair. This is the first study to investigate the effect of RV on proliferation
and repair using primary AECs from asthmatic and non-asthmatic children. Bossios et
al reported that infection of a bronchial epithelial cell line (BEAS-2B) with RV1b
induced impairment on cell proliferation and self-repair following wounding (Bossios et
al., 2005). We have previously reported that immortalized bronchial epithelial cell lines
(16HBE14o-) and adult-derived primary bronchial epithelial cells (NHBE cells)
demonstrate significantly different biochemical profiles to pAEC during cell culture
(Kicic et al., 2006), emphasizing the importance of using primary cells for studying the
role of the epithelium in asthma.
Results generated in this chapter have also shown that although exposure of pAECHNA
with RV1b had a marked inhibitory effect on cell proliferation, exposure with RV14
had minimal effect. Similarly, when pAECAA were exposed with RV1b, cell
proliferation was markedly inhibited with only a marginal increase in the number of
metabolically active cells after 7 days of culture. These data suggest that RV1b is the
more virulent and potent RV strain and that even at low doses, has the ability to inhibit
cellular proliferation in both healthy and asthmatic AECs.

Stevens 2009
168
______________________________________________________________________
It was demonstrated in Chapter 3 that pAECs from asthmatic children have an inability
to repair compared to healthy cells. Therefore, using the wound repair model that was
developed, this chapter also sought to investigate the effects of RV exposure on pAEC
repair. The results generated confirmed previous observations that pAECAA lack the
capacity to successfully repair in comparison to healthy cells. After 30 days of cell
culture, a maximal repair percentage of 60% was achieved in pAECAA compared to
100% repair after 8 days in pAECHNA. RV14 significantly impeded the repair process in
pAECHNA, though a markedly greater inhibition was observed when exposed to RV1b.
A similar pattern was observed in pAECAA. RV1b demonstrated the greater inhibition of
repair in comparison to RV14. Based on these observations, it can be speculated that the
observed presence of rhinoviral infections in the vast majority of children admitted with
asthma exacerbations maybe due to loss or damage of the bronchial epithelium, and an
inability to successfully re-epithelialise the bronchial airways in the presence of the
virus.
Furthermore, this investigation has also demonstrated that PAI-1 was elevated in
asthmatic AECs (refer to 3.4.2) and that expression was elevated in response to cellular
wounding (3.4.8). Due to the presence of viral infections in 80%-85% of asthmatic
exacerbations (Johnston et al., 1995) and the significant effects RV has on cell viability,
this investigation has hypothesised that it may be the presence of virus that is
responsible for some of the cellular damage and therefore elevated PAI-1 expression
due to the need to re-epithelise the airways. PAI-1 expression was elevated in both

Stevens 2009
169
______________________________________________________________________
phenotypes following RV infection, though due to the 68-fold baseline up regulation in
pAECAA, the PAI-1 expression observed in these cells was significantly greater than
that of pAECHNA. Collectively, these data supports the role of RV infections in loss of
epithelial integrity in asthmatic airways and provides a potential causative agent for the
elevated PAI-1 expression observed in these cells.
This investigation has also demonstrated reduced MMP activity in pAECAA (refer to
Chapter 4) compared to healthy cells. In this chapter it was demonstrated that MMP-9
activity was significantly reduced following infection with RV in both phenotypes
though a greater down regulation was observed in pAECAA. Interestingly, the down
regulation in MMP-2 was not as pronounced as with MMP-9. The reason for this down
regulation in MMP protein production is unknown, though due to the presence of viral
infections in 80%-85% of asthmatic exacerbations (Johnston et al., 1995), a down
regulation in MMP production as a result of viral infection may account for the
characteristic thickening of the basement membrane in asthmatic airways.

Stevens 2009
170
______________________________________________________________________
5.7 Conclusion
Rhinoviral infections play a significant role in the triggering of asthma exacerbations.
This chapter has demonstrated that pAECs from untreated mild atopic-asthmatic
children are more sensitive to the pathogenic effects of RV than healthy control cells.
RV exposure induces inflammatory and apoptotic responses and delays cellular
proliferation and repair. Furthermore, exposure of pAECs with RV results in elevated
PAI-1 expression and reduced MMP-2 and 9 production.

Stevens 2009
171
______________________________________________________________________
Chapter 6: General Discussion and Future
Directions
Asthma is a complex and heterogeneous disorder in which genetics and the environment
play an interacting role. Childhood asthma is a major global health problem, which
exerts a substantial burden on families, the health care system and society as a whole.
The disease is characterised by variable degrees of chronic inflammation and structural
alterations in the airways collectively referred to as airway remodelling. The most
prominent abnormalities include epithelial denudation, goblet cell metaplasia,
subepithelial thickening, increased airway smooth muscle mass, bronchial gland
enlargement, angiogenesis, and alterations in extracellular matrix components,
involving large and small airways. These structural alterations have been hypothesised
to lead to the development of persistent airway hyper-responsiveness and fixed airway
obstruction. Therefore, the pathogenesis of airway remodelling and the implications of
therapeutic interventions that are designed to diminish airway remodelling remain
important areas of research. The successful repair of damaged and replacement of shed
epithelium is of prime importance in the airways as the epithelium provides an essential
protective barrier between the environment and underlying structures. A delay or
unsuccessful repair of the airway epithelium may lead to inflammation as a result of
exposure of the submucosa to foreign particles such as allergens, which in turn may lead

Stevens 2009
172
______________________________________________________________________
to structural alterations in the airways. Also, the epithelium plays an essential role in the
regulation of the underlying structures through the secretion of numerous regulatory
components. Therefore, dysregulated repair of the epithelium can have a pronounced
effect on airway function that may result in airway remodelling.
In addition to the structural abnormalities observed in asthma, an important focus of
preventative research must involve the investigation of triggering agents of asthma
exacerbations. Viral infections of the respiratory tract account for the majority of
asthmatic episodes in children and RV is recognized as the most common infectious
agent. The mechanism by which these infections cause exacerbations is poorly
understood and is under current investigation. It has been hypothesised that infection of
AECs by RV results in altered cellular function and ultimately cellular loss, which as
discussed above, can have pronounced effects of airway remodelling. Elucidation of the
effects of RV on airway epithelial cell function and its role in the remodelling process
may help provide new therapeutic targets and aid in the development of better asthmatic
treatments.
There is an increasing consensus that asthmatic epithelial cells are inherently abnormal.
Also, PAI-1 has been associated with asthma remodelling and proliferation and repair in
epithelial cell lines, therefore an objective of Chapter 3 was to compare the ability of
pAECHNA and pAECAA to successfully repair mechanically induced wounds. In
addition, Chapter 3 sought to investigate PAI-1 gene expression and proteins levels in
Stevens 2009
173
______________________________________________________________________
pAECAA compared to healthy cells and to assess the role PAI-1 plays in mediating
epithelial cell proliferation and wound repair in these cells.
Based on observations of routine cell culture and wound repair experiments we
hypothesised that asthmatic and non-asthmatic cultures repair wounds at different rates.
The repair time required to successfully close mechanical wound sites was compared
between pAECHNA and pAECAA and it was demonstrated that pAECHNA repair wounds
at a significant faster rate in comparison to pAECAA. This is the first investigation to
report a diminished capacity for repair in primary paediatric asthmatic epithelial cells.
As discussed, asthma is a complicated disease characterised by structural airway
changes that include ECM deposition (Roche et al., 1989). Previous findings by others
has shown that PAI-1 has a functional role regulating ECM turnover in the airways, the
increased thickness of the airways observed in asthmatic patients instigated the
investigation of PAI-1 levels in asthmatic epithelial cells. Using RT-qPCR and a PAI-1
protein activity assay, the data presented in this investigation demonstrate elevated PAI-
1 mRNA and protein levels in PAECAA compared to pAECHNA. This elevation appeared
to be confined to the airway epithelium microenvironment, since PAI-1 levels in the
plasma obtained at the same time as epithelial brushings were not elevated in AA
patients. Previous investigations have suggested PAI-1 to play a role in cellular
proliferation and regeneration and the successful re-epithelisation of the airways in
asthma is important for providing an essential protective barrier to underlying

Stevens 2009
174
______________________________________________________________________
structures. Thus, PAI-1 levels were compared between proliferating and quiescent cells,
and siRNA technology used to determine the effect of PAI-1 gene knockdown on the
rate of proliferation of pAECs. PAI-1 was elevated in both pAECHNA and pAECAA
during cell proliferation and a functional role of PAI-1 was confirmed by demonstrating
that PAI-1 siRNA significantly altered the rate of pAEC proliferation. PAI-1 levels
were measured following mechanical wound in pAEC monolayers and wound repair
experiments coupled with siRNA knockdown of PAI-1 mRNA production were used to
demonstrate the effect of reduced PAI-1 on wound closure ability. Results obtained in
this investigation found that the levels of PAI-1 were elevated upon mechanical
wounding and knockdown of PAI-1 expression significantly delayed wound closure.
Collectively, these data indicate that PAI-1 release is a normal physiological response to
epithelial injury and support the hypothesis that it is the inability to successfully repair
damaged epithelium that is responsible for continued elevation of PAI-1 levels in
asthma.
Due to the proteolytic nature of MMPs and the essential role they play in the regulation
of ECM turnover, the aim of the studies in Chapter 4 were to investigate MMP-2, 7, 9
and 14 and TIMP-1 and 2 gene expressions in pAECHNA and pAECAA and to compare
the functional activity of MMP-2 and 9 and TIMP-1 and 2 in the plasma, cells lysates
and cell culture medium from these two patient cohort phenotypes. In addition, the
MMP to TIMP ratios present in both pAECHNA and pAECAA samples were investigated
and compared. Using RT-qPCR, the mRNA expression levels of MMPs and TIMP were

Stevens 2009
175
______________________________________________________________________
assessed in pAEC. The expressions of MMP-2, 7, 9 and 14 and TIMP-1 and 2 were
significantly lower in pAECAA compared to pAECHNA. Since MMP-2 and MMP-9
(gelatinases) have an important proteolytic role in the turnover of the basement
membrane of the bronchial airways, we therefore performed gelatin zymography to
assess the functional activity of these proteins and their inhibitors (TIMP-1 and 2), in
pAEC cell lysates, patient plasma and pAEC culture media. Results obtained in this
investigation revealed that the activity of both gelatinases was significantly lower in
pAECAA cell lysates, and although TIMP-1 and 2 activity was lower in pAECAA lysates,
there was no significant difference. The inhibition of MMP-2 and 9 by TIMP-2 and 1
respectively, occurs as a result of 1:1 stoichiometric binding to the catalytic site of the
MMP. This results in reduced photolytic activity and therefore a reduction in the ratio of
MMP to TIMP (indicative of reduced proteolytic activity) may contribute to reduced
ECM turnover. This study successfully revealed that the MMP-9/TIMP-1 and MMP-
2/TIMP-2 ratios were significantly reduced in the lysates from pAECAA supporting the
hypothesis of reduced ECM degradation in the bronchial airways. The findings of this
investigation have demonstrated dysregulated epithelial cell repair in asthma and AEC
responses that are likely to contribute to the structural airway changes that constitute
remodelling. The most significant cause of airway damage is viral infection.
Rhinovirus is the most common virus detected during asthma exacerbations and is able
to infected human AECs. Therefore, the objective of Chapter 5 was to investigate
whether pAECAA were more susceptible to RV14 and RV1b exposure than pAECHNA

Stevens 2009
176
______________________________________________________________________
and to document the cellular responses generated following viral exposure. In addition,
the role RV exposure plays in pAEC proliferation and wound repair was assessed. Cell
monolayers were exposed to two serotypes of RV (RV14 and RV1b) and the cytotoxic
effects compared between pAECHNA and pAECAA. Results generated in this
investigation showed that pAECs were sensitive to RV exposure resulting in cellular
death. RV1b was the most virulent serotype and pAECAA were significantly more
sensitive to RV exposure than pAECHNA. Apoptosis is an essential process aimed at
reducing viral replication via the destruction of potentially harmful cells such as those
infected with virus. As such, a ssDNA apoptosis assay was used to assess whether
pAEC utilise this method of cellular destruction post RV exposure. Results generated
showed a significant increase in apoptosis in both phenotypes when exposed to both RV
serotypes. Furthermore, exposure of epithelium with RV may result in the elevated
secretion of numerous inflammatory and regulatory cytokines. Utilising ELISAs and
TRFs this investigation was able demonstrate a significant elevation in IL-1β, IL-6, IL-8
and TGF-β1 in the culture medium following viral exposure. RV1b was able to generate
the greatest cytokine response and the levels of cytokines were significantly higher in
the pAECAA in comparison to pAECHNA. The airway epithelium has an essential role in
the regulation of airway remodelling and unsuccessful re-epithelisation of the bronchial
airways in the presence a viral infection is hypothesised to play a significant role. In this
study, the proliferative and regenerative capacity of pAECs after viral exposure was
assessed using proliferation assays and wound closure experiments. Results generated,
successfully identified the negative effects RV exposure had on cellular proliferation,

Stevens 2009
177
______________________________________________________________________
namely that pAECs exposed to RV had significantly reduced proliferation rates. RV1b
was observed to have a much greater effect at inhibiting cell proliferation over RV14
and pAECAA were shown to be significantly more sensitive to the effects of RV than
pAECHNA. Wound closure experiments were used following RV exposure to assess the
effects of RV on pAEC repair. For the first time, this study has reported that the
presence of RV significantly reduces the ability of pAECs to successfully repair
mechanically induced wounds. RV1b was shown to have a greater effect on repair time
than RV14 and that the already dysregulated and prolonged repair seen in pAECAA was
further exacerbated following RV exposure.
In the investigation of wound repair, Chapter 3 demonstrated elevated PAI-1 in pAECAA
following mechanical wounding. Therefore, this investigation hypothesised that the
presence of RV may be responsible for a degree of the cellular damage observed in
asthma and that the observed elevation in PAI-1 expression was due to a need to re-
epithelise the airways. Results generated showed that PAI-1 expression was elevated
following RV exposure in both cellular phenotypes, furthermore, due to the average 68-
fold up regulation in pAECAA above baseline levels, the PAI-1 expression observed in
asthmatic cells was significantly greater than that of pAECHNA. The results generated in
this investigation support the role of RV infections as one potential cause of epithelial
damage that can result in elevated PAI-1 expression observed asthmatic cells. The
reduced MMP activity in pAECAA was an important finding of this investigation
(Chapter 4), therefore the role of RV exposure on pAECAA MMP activity was

Stevens 2009
178
______________________________________________________________________
investigated. Results generated illustrated that MMP-9 activity was significantly
reduced post RV exposure in both pAECHNA and pAECAA though a greater down
regulation was observed in the asthmatic cells.
This study hypothesised that the observed elevated release of PAI-1 from pAECAA is a
normal response to epithelial injury, and that it is an inability to successfully repair
damaged epithelium that is responsible for continued elevation of PAI-1 levels in
asthma. Future work needs to be aimed at investigating the reduced capacity of pAECAA
to successfully repair. These cells appear to be inherently abnormal as they lack the
ability to repair mechanically induced wounds in comparison to healthy cells. This
investigation has also hypothesised that the continued release in PAI-1 in vivo is an
attempt to successfully repair the epithelium and it can be further speculated that the
continued elevated PAI-1 level is not sufficient to successfully repair the asthmatic
epithelium. Urokinase-type plasminogen activator receptor (uPAR) binds the urokinase-
type plasminogen activator (uPA) to form a uPA-uPAR complex that facilitates a
proteolytic cascade on the cell surface. Through its interactions with integrins, this
complex initiates signalling events that can alter cell adhesion, migration and
proliferation (Ossowski and Aguirre-Ghiso, 2000, Carlin et al., 2005, Jo et al., 2005). A
reasonable hypothesis is that in the asthmatic epithelial environment, the elevated PAI-1
levels observed in this study may act to down-regulate the signal transduction pathways
mediated by uPA thereby altering cell migration and delaying epithelial wound healing
and thus perpetuating a process of dysregulated repair. The designing of cellular

Stevens 2009
179
______________________________________________________________________
migration experiments aimed at investigating the effects of PAI-1 on the uPA-uPAR
complex would provide valuable insight in the role PAI-1 plays in the control of cellular
migration. Expression PAI-1 gene has been demonstrated to be influenced by
transcription factors, such as early growth response gene-1, hypoxia-inducible factor-1α,
CCAAT/enhancer binding protein-α (Liao et al., 2007), Max, TFE3 and Smad proteins
(Grinberg and Kerppola, 2003). Future investigations into the regulatory effects of these
transcription factors on PAI-1 in pAECAA would provide valuable insight into the
mechanisms surrounding elevated expression in these cells.
A cell cycle defect may be responsible for the reduced repair observed in asthmatic
AEC’s, therefore the investigation into the dysregulation of proteins produced by
epithelial cells is required. The surrounding AECs of an injury site are stimulated to
produced and deposit ECM on the exposed basement membrane in the attempt to
promote the adhesion and migration of adjacent epithelial cells into the injury site
(Sottile et al., 1998). Therefore proteins of interest may include those associated with
the ECM. For example, fibronectin is one of the primary ECM proteins produced by
AECs (Sacco et al., 2004) and profoundly influences the survival, proliferation and
differentiation of these cells suggesting it is an important target in epithelial wound
repair. In addition, laminins are a major structural glycoprotein of the basement
membranes, they aid in the attachment and survival of epithelial cells and can also
promote the growth of epithelial cells. Laminin also plays an important role in both the
structural organization of basement membranes and in the anchorage of cells. Another

Stevens 2009
180
______________________________________________________________________
group of proteins of interest are the cytoskeletal proteins such as cytochalasin B which
blocks actin polymerization. These proteins may be a future focus in asthmatic cells as
they are known to inhibit cell migration and repair (Zahm et al., 1991). Growth factors
such as TGF-β modulate the composition of the provisional matrix over which the
epithelial cells migrate. Also inhibition of the EGF receptor (EGFR) tyrosine kinase
completely inhibits the re-epithelialization process. Deficiencies or functional defects in
these proteins may affect the epithelial repair process. The initial procedure for
investigation of protein involved in wound repair would be the characterisation of the
genetic expression by pAECAA in comparison to healthy cells. Identification of
deficiencies in ECM, cytoskeletal and growth factor proteins involved in would repair
could then be investigated with functional studies. To confirm the protein under
investigation has a functional role in AEC repair, gene knockdown in healthy cells
should result in delayed wound closure. Conversely, the addition of the target protein to
asthmatic cells should improve wound repair.
This investigation has demonstrated the significant reduction in MMP levels in asthma.
However, further work is required to elucidate the role MMPs have in the dysregulated
repair reported in this investigation. MMPs are known to be involved in epithelial
wound repair, especially in the remodelling of the provisional matrix onto which the
cells migrate, by degrading components of the ECM. During the re-epitheliasation of the
injured airway epithelium, MMP-9 is over-expressed in the migratory cells. MMP-9 has
been shown to play a key role in the migration of epithelial bronchial cells to repair a

Stevens 2009
181
______________________________________________________________________
wound (Buisson et al., 1996, Legrand et al., 1999). We have demonstrated a marked
reduction in MMP activity in the asthmatic cells, therefore, future experimentation into
the effect of MMP-9 knockdown and protein addition on wound repair is required. In
addition we have demonstrated a significant decrease in MMP-7 production in pAECAA,
MMP-7 is produced by intact, non-injured AECs where it functions in host defence by
activating the latent form of antimicrobial peptides, such as defensins (Lopez-Boado et
al., 2001). In models of airway injury, MMP-7 expression is up-regulated in migrating
epithelial cells (Dunsmore et al., 1998) and furthermore, MMP-7 mediates the shedding
of the ectodomain of E-cadherin required for epithelial repair (McGuire et al., 2003).
Subsequent investigation into the role of the observed decreased in MMP-7 in asthmatic
cells may provide insight in the dysregulated repair observed in these cells.
This study has demonstrated that the exposure of pAECAA to an infectious agent such as
RV has a significant effect on cellular proliferation and repair and this exposure has
been hypothesised to play a role in the airway remodelling that is observed in asthma.
The viruses used in this investigation are laboratory strains, therefore, in order to gain a
clearer understanding of the effects on RV on pAEC function in asthma patients,
clinical isolates of the community strains of RV would be advantageous. In addition to
viral strains, little is known of the early signalling events that occur within epithelial
cells after RV infection. The release of cytokines such as IL-8 occur rapidly and do not
require viral replication (Newcomb et al., 2005) whereas other genes are not induced
until several hours after infection and require viral replication (Spurrell et al., 2005). It

Stevens 2009
182
______________________________________________________________________
is known that both the phosphotidylinositol 3-kinase and mitogen activated protein
kinases pathways are involved in the induction of chemokines (Pazdrak et al., 2002,
Newcomb et al., 2005). Our understanding of the control of transcriptional and post-
transcriptional regulation of epithelial cytokine and chemokine production in response
to viral infection is limited. Therefore, the elucidation of these pathways could provide
new targets for therapeutic intervention in the treatment of asthma, and other chronic
airways diseases that are exacerbated by RV infection.
The epithelium of the airways is subject to exposure and infection by many other types
of viral agents. RSV infects approximately 70% of infants in the first year of life and
almost 100% by the age of 3 years (Ogra, 2004). RSV often does not cause complicated
infections of the upper respiratory tract, though in some cases can cause severe
bronchiolitis which is frequently associated with recurrent wheezing and asthma. It is
still unclear whether RSV constitutes a direct cause of asthma. Recent epidemiological
data has been presented supporting a role of RSV in asthma development (Sigurs et al.,
2000) though this appears to be in contradiction to a previously published study (Stein
et al., 1999). Therefore, it is of interest to investigate and compare the effects of RSV
on AEC proliferation and repair and determine whether the observations made in are
specific to RV or occur in the presence of other infections, including; influenza and
parainfluenza and bacterial infection such as Chlamydia pneumoniae and Mycoplasma
pneumoniae. C. pneumoniae cause respiratory infections (Blasi, 2004) and have been

Stevens 2009
183
______________________________________________________________________
implicated in the development and complication of asthma (von, 2002) and M.
pneumoniae has been detected in 50% of asthmatic patients (Martin et al., 2001).
From this investigation it has been demonstrated that epithelial cells from the airways of
asthmatic children have aberrant expression of genes and protein involved in airway
remodelling, as highlighted by Chapters 3 and 4. This investigation has also
demonstrated the important role of viral exposure, such as RV, plays in the remodelling
process and epithelial cell function. The respiratory epithelium is a three-dimensional
system and receives a constant supply of mechanical, electrical, structural, and chemical
signals in vivo. Therefore, the conventional single-cell-type culture that is commonly
used may not be the most suitable system to reflect the complex cell–cell and cell–
matrix interactions that occur. Co-cultures of airway epithelial cells and mesenchymal
fibroblast (Goto et al., 1999, Choe et al., 2003, Kojima et al., 2003) could be utilised to
investigate the interaction of these different cell types and their impact on PAI-1
production, regulation and subsequent cell proliferation and repair.
An additional approach aimed at gaining a better understanding of the repair process
may be to characterize the progenitor cells that contribute to wound healing in the
airway. The existence of putative airway stem cells has only been suggested relatively
recently through the use of rodent models in which progenitor cells are depleted through
either chemical or physical means (Borthwick et al., 2001, Hong et al., 2004).
Definitive identification and characterisation of these cells may aid in gaining a better

Stevens 2009
184
______________________________________________________________________
understanding of the defective repair process and developing future treatments (Hackett
et al., 2008).
This study collected airway brushings from atopic asthmatic and non-atopic healthy
individuals to demonstrate important and specific functional differences in the AECs
between the two phenotypes. Amin and colleagues (Amin et al., 2000), have reported
that reticular basement membrane thickening is significantly greater in atopic asthmatic
airway than in non-atopic asthmatics suggesting that atopy may hold a functional role in
airway remodelling. Conversely, a recent investigation has reported similar pathological
changes in biopsies from atopic and non-atopic mild asthmatics (Turato et al., 2008),
thereby supporting the hypothesis that intrinsic abnormalities exist in asthmatic AEC’s
independent of atopy status. With emerging data suggesting atopy as one potential
driving force behind airway remodelling, future investigations may need to include the
appropriate atopic and non-atopic healthy and asthmatic cohorts in order to re-evaluate
the role of the epithelium in asthma and determine whether observed abnormalities are
associated with asthma independent of atopic status.
In conclusion, this investigation has helped better characterise the essential role the
airway epithelium plays in childhood asthma by demonstrating for the first time that
pAECs from asthmatic children lack the ability to successfully repair mechanically
induced wounds. This investigation has also showed that PAI-1 is elevated in pAECAA
and has a functional role in the pAEC proliferative and regenerative processes. It has

Stevens 2009
185
______________________________________________________________________
been demonstrated that MMP-2 and MMP-9 activities and the MMP-9/TIMP-1 as well
as MMP2/TIMP2 ratios were significantly reduced in pAECAA thereby providing
additional evidence that there is a dysregulation in the mechanisms that regulate the
turnover of the ECM in childhood asthma. Furthermore, this study has shown for the
first time that pAECs from untreated mild atopic-asthmatic children are more sensitive
to the pathogenic effects of RV than healthy control cells and that RV exposure delays
cellular proliferation and repair.

Stevens 2009
186
______________________________________________________________________
References
AIHW (2005) Australian Centre for Asthma Monitoring. Canberra, AIHW.
Aikawa, T., Shimura, S., Sasaki, H., Ebina, M. & Takishima, T. (1992) Marked goblet
cell hyperplasia with mucus accumulation in the airways of patients who died of severe
acute asthma attack. Chest, 101, 916-21.
Akira, S., Hirano, T., Taga, T. & Kishimoto, T. (1990) Biology of multifunctional
cytokines: IL 6 and related molecules (IL 1 and TNF). Faseb J, 4, 2860-7.
Akira, S., Taga, T. & Kishimoto, T. (1993) Interleukin-6 in biology and medicine. Adv
Immunol, 54, 1-78.
Alam, R., York, J., Boyars, M., Stafford, S., Grant, J. A., Lee, J., Forsythe, P., Sim, T.
& Ida, N. (1996) Increased MCP-1, RANTES, and MIP-1alpha in bronchoalveolar
lavage fluid of allergic asthmatic patients. Am J Respir Crit Care Med, 153, 1398-404.
Albelda, S. M. (1991) Endothelial and epithelial cell adhesion molecules. Am J Respir
Cell Mol Biol, 4, 195-203.

Stevens 2009
187
______________________________________________________________________
Alexopoulou, L., Holt, A. C., Medzhitov, R. & Flavell, R. A. (2001) Recognition of
double-stranded RNA and activation of NF-kappaB by Toll-like receptor 3. Nature,
413, 732-8.
Alving, K., Weitzberg, E. & Lundberg, J. M. (1993) Increased amount of nitric oxide in
exhaled air of asthmatics. Eur Respir J, 6, 1368-70.
Amin, K., Ludviksdottir, D., Janson, C., Nettelbladt, O., Bjornsson, E., Roomans, G.
M., Boman, G., Seveus, L. & Venge, P. (2000) Inflammation and structural changes in
the airways of patients with atopic and nonatopic asthma. BHR Group. Am J Respir Crit
Care Med, 162, 2295-301.
Amishima, M., Munakata, M., Nasuhara, Y., Sato, A., Takahashi, T., Homma, Y. &
Kawakami, Y. (1998) Expression of epidermal growth factor and epidermal growth
factor receptor immunoreactivity in the asthmatic human airway. Am J Respir Crit Care
Med, 157, 1907-12.
Anderson, E. G., Calcraft, B., Jariwalla, A. G. & Al-Zaibak, M. (1979) Persistent
asthma after treatment with beta-blocking agents. Br J Dis Chest, 73, 407-8.

Stevens 2009
188
______________________________________________________________________
Asano, K., Chee, C. B., Gaston, B., Lilly, C. M., Gerard, C., Drazen, J. M. & Stamler, J.
S. (1994) Constitutive and inducible nitric oxide synthase gene expression, regulation,
and activity in human lung epithelial cells. Proc Natl Acad Sci U S A, 91, 10089-93.
Asher, M. I., Keil, U., Anderson, H. R., Beasley, R., Crane, J., Martinez, F., Mitchell, E.
A., Pearce, N., Sibbald, B., Stewart, A. W. & Et al. (1995) International Study of
Asthma and Allergies in Childhood (ISAAC): rationale and methods. Eur Respir J, 8,
483-91.
Attisano, L., Carcamo, J., Ventura, F., Weis, F. M., Massague, J. & Wrana, J. L. (1993)
Identification of human activin and TGF beta type I receptors that form heteromeric
kinase complexes with type II receptors. Cell, 75, 671-80.
Ayers, M. M. & Jeffery, P. K. (1988) Proliferation and differentiation in mammalian
airway epithelium. Eur Respir J, 1, 58-80.
Baggiolini, M., Walz, A. & Kunkel, S. L. (1989) Neutrophil-activating peptide-
1/interleukin 8, a novel cytokine that activates neutrophils. J Clin Invest, 84, 1045-9.
Bai, T. R., Cooper, J., Koelmeyer, T., Pare, P. D. & Weir, T. D. (2000) The effect of
age and duration of disease on airway structure in fatal asthma. Am J Respir Crit Care
Med, 162, 663-9.
Stevens 2009
189
______________________________________________________________________
Bai, T. R. & Knight, D. A. (2005) Structural changes in the airways in asthma:
observations and consequences. Clin Sci (Lond), 108, 463-77.
Balmes, J. R., Aris, R. M., Chen, L. L., Scannell, C., Tager, I. B., Finkbeiner, W.,
Christian, D., Kelly, T., Hearne, P. Q., Ferrando, R. & Welch, B. (1997) Effects of
ozone on normal and potentially sensitive human subjects. Part I: Airway inflammation
and responsiveness to ozone in normal and asthmatic subjects. Res Rep Health Eff Inst,
1-37; discussion 81-99.
Baluk, P., Lee, C. G., Link, H., Ator, E., Haskell, A., Elias, J. A. & Mcdonald, D. M.
(2004) Regulated angiogenesis and vascular regression in mice overexpressing vascular
endothelial growth factor in airways. Am J Pathol, 165, 1071-85.
Banach-Wawrzenczyk, E., Dziedziczko, A. & Rosc, D. (2000) Fibrinolysis system in
patients with bronchial asthma. Med Sci Monit, 6, 103-7.
Barazzone, C., Belin, D., Piguet, P. F., Vassalli, J. D. & Sappino, A. P. (1996)
Plasminogen activator inhibitor-1 in acute hyperoxic mouse lung injury. J Clin Invest,
98, 2666-73.

Stevens 2009
190
______________________________________________________________________
Barbato, A., Turato, G., Baraldo, S., Bazzan, E., Calabrese, F., Panizzolo, C., Zanin, M.
E., Zuin, R., Maestrelli, P., Fabbri, L. M. & Saetta, M. (2006) Epithelial damage and
angiogenesis in the airways of children with asthma. Am J Respir Crit Care Med, 174,
975-81.
Barbato, A., Turato, G., Baraldo, S., Bazzan, E., Calabrese, F., Tura, M., Zuin, R.,
Beghe, B., Maestrelli, P., Fabbri, L. M. & Saetta, M. (2003) Airway inflammation in
childhood asthma. Am J Respir Crit Care Med, 168, 798-803.
Barthel, S. R., Johansson, M. W., Mcnamee, D. M. & Mosher, D. F. (2007) Roles of
integrin activation in eosinophil function and the eosinophilic inflammation of asthma. J
Leukoc Biol.
Bascom, R., Naclerio, R. M., Fitzgerald, T. K., Kagey-Sobotka, A. & Proud, D. (1990)
Effect of ozone inhalation on the response to nasal challenge with antigen of allergic
subjects. Am Rev Respir Dis, 142, 594-601.
Basha, M. A., Gross, K. B., Gwizdala, C. J., Haidar, A. H. & Popovich, J., Jr. (1994)
Bronchoalveolar lavage neutrophilia in asthmatic and healthy volunteers after controlled
exposure to ozone and filtered purified air. Chest, 106, 1757-65.

Stevens 2009
191
______________________________________________________________________
Bauer, J. & Herrmann, F. (1991) Interleukin-6 in clinical medicine. Ann Hematol, 62,
203-10.
Bazan-Socha, S., Bukiej, A., Pulka, G., Marcinkiewicz, C. & Musial, J. (2006)
Increased expression of collagen receptors: alpha1beta1 and alpha2beta1 integrins on
blood eosinophils in bronchial asthma. Clin Exp Allergy, 36, 1184-91.
Beasley, R., Roche, W. R., Roberts, J. A. & Holgate, S. T. (1989) Cellular events in the
bronchi in mild asthma and after bronchial provocation. Am Rev Respir Dis, 139, 806-
17.
Belleguic, C., Corbel, M., Germain, N., Lena, H., Boichot, E., Delaval, P. H. &
Lagente, V. (2002) Increased release of matrix metalloproteinase-9 in the plasma of
acute severe asthmatic patients. Clin Exp Allergy, 32, 217-23.
Benayoun, L., Druilhe, A., Dombret, M. C., Aubier, M. & Pretolani, M. (2003) Airway
structural alterations selectively associated with severe asthma. Am J Respir Crit Care
Med, 167, 1360-8.
Bevilacqua, M. P. & Nelson, R. M. (1993) Selectins. J Clin Invest, 91, 379-87.

Stevens 2009
192
______________________________________________________________________
Bezerra, J. A., Bugge, T. H., Melin-Aldana, H., Sabla, G., Kombrinck, K. W., Witte, D.
P. & Degen, J. L. (1999) Plasminogen deficiency leads to impaired remodeling after a
toxic injury to the liver. Proc Natl Acad Sci U S A, 96, 15143-8.
Bienkowska-Haba, M., Liebhart, J. & Cembrzynska-Nowak, M. (2006) Nitric oxide
production by pulmonary leukocytes from induced sputum in patients with asthma and
its effect on epithelial cell viability. Arch Immunol Ther Exp (Warsz), 54, 201-7.
Blasi, F. (2004) Atypical pathogens and respiratory tract infections. Eur Respir J, 24,
171-81.
Blobe, G. C., Schiemann, W. P. & Lodish, H. F. (2000) Role of transforming growth
factor beta in human disease. N Engl J Med, 342, 1350-8.
Bock, S. A. & Atkins, F. M. (1990) Patterns of food hypersensitivity during sixteen
years of double-blind, placebo-controlled food challenges. J Pediatr, 117, 561-7.
Boland, S., Boisvieux-Ulrich, E., Houcine, O., Baeza-Squiban, A., Pouchelet, M.,
Schoevaert, D. & Marano, F. (1996) TGF beta 1 promotes actin cytoskeleton
reorganization and migratory phenotype in epithelial tracheal cells in primary culture. J
Cell Sci, 109 ( Pt 9), 2207-19.

Stevens 2009
193
______________________________________________________________________
Borthwick, D. W., Shahbazian, M., Krantz, Q. T., Dorin, J. R. & Randell, S. H. (2001)
Evidence for stem-cell niches in the tracheal epithelium. Am J Respir Cell Mol Biol, 24,
662-70.
Bosse, M., Chakir, J., Rouabhia, M., Boulet, L. P., Audette, M. & Laviolette, M. (1999)
Serum matrix metalloproteinase-9:Tissue inhibitor of metalloproteinase-1 ratio
correlates with steroid responsiveness in moderate to severe asthma. Am J Respir Crit
Care Med, 159, 596-602.
Bossios, A., Psarras, S., Gourgiotis, D., Skevaki, C. L., Constantopoulos, A. G., Saxoni-
Papageorgiou, P. & Papadopoulos, N. G. (2005) Rhinovirus infection induces
cytotoxicity and delays wound healing in bronchial epithelial cells. Respir Res, 6, 114.
Bousquet, J., Jeffery, P. K., Busse, W. W., Johnson, M. & Vignola, A. M. (2000)
Asthma. From bronchoconstriction to airways inflammation and remodeling. Am J
Respir Crit Care Med, 161, 1720-45.
Bousquet, J., Lacoste, J. Y., Chanez, P., Vic, P., Godard, P. & Michel, F. B. (1996)
Bronchial elastic fibers in normal subjects and asthmatic patients. Am J Respir Crit
Care Med, 153, 1648-54.

Stevens 2009
194
______________________________________________________________________
Brandley, B. K., Swiedler, S. J. & Robbins, P. W. (1990) Carbohydrate ligands of the
LEC cell adhesion molecules. Cell, 63, 861-3.
Breeze, R. G. & Wheeldon, E. B. (1977) The cells of the pulmonary airways. Am Rev
Respir Dis, 116, 705-77.
Broide, D. & Sriramarao, P. (2001) Eosinophil trafficking to sites of allergic
inflammation. Immunol Rev, 179, 163-72.
Broide, D. H., Lotz, M., Cuomo, A. J., Coburn, D. A., Federman, E. C. & Wasserman,
S. I. (1992) Cytokines in symptomatic asthma airways. J Allergy Clin Immunol, 89,
958-67.
Brooks, T. D., Slomp, J., Quax, P. H., De Bart, A. C., Spencer, M. T., Verheijen, J. H.
& Charlton, P. A. (2000) Antibodies to PAI-1 alter the invasive and migratory
properties of human tumour cells in vitro. Clin Exp Metastasis, 18, 445-53.
Buckova, D., Izakovicova Holla, L. & Vacha, J. (2002) Polymorphism 4G/5G in the
plasminogen activator inhibitor-1 (PAI-1) gene is associated with IgE-mediated allergic
diseases and asthma in the Czech population. Allergy, 57, 446-8.
Stevens 2009
195
______________________________________________________________________
Buisson, A. C., Zahm, J. M., Polette, M., Pierrot, D., Bellon, G., Puchelle, E.,
Birembaut, P. & Tournier, J. M. (1996) Gelatinase B is involved in the in vitro wound
repair of human respiratory epithelium. J Cell Physiol, 166, 413-26.
Burr, M. L., Davies, B. H., Hoare, A., Jones, A., Williamson, I. J., Holgate, S. K.,
Arthurs, R. & Hodges, I. G. (1999) A confidential inquiry into asthma deaths in Wales.
Thorax, 54, 985-9.
C.S.G.A (1997) A genome-wide search for asthma susceptibility loci in ethnically
diverse populations. The Collaborative Study on the Genetics of Asthma (CSGA). Nat
Genet, 15, 389-92.
Caceci, T. “ Respiratory Systems I: Mammals” Veterinary Histology (2007) Dept. of
Biomedical Sciences & Pathobiology, Virginia-Maryland Regional College of
Veterinary Medicine.
http://education.vetmed.vt.edu/Curriculum/VM8054/Labs/Lab25/lab25.htm
Carlin, S. M., Resink, T. J., Tamm, M. & Roth, M. (2005) Urokinase signal
transduction and its role in cell migration. Faseb J, 19, 195-202.

Stevens 2009
196
______________________________________________________________________
Carmeliet, P., Kieckens, L., Schoonjans, L., Ream, B., Van Nuffelen, A., Prendergast,
G., Cole, M., Bronson, R., Collen, D. & Mulligan, R. C. (1993a) Plasminogen activator
inhibitor-1 gene-deficient mice. I. Generation by homologous recombination and
characterization. J Clin Invest, 92, 2746-55.
Carmeliet, P., Stassen, J. M., Schoonjans, L., Ream, B., Van Den Oord, J. J., De Mol,
M., Mulligan, R. C. & Collen, D. (1993b) Plasminogen activator inhibitor-1 gene-
deficient mice. II. Effects on hemostasis, thrombosis, and thrombolysis. J Clin Invest,
92, 2756-60.
Carnovali, M. & Ohnmeiss, E. (1981) [Asthma caused by inhibitors of prostaglandin
synthesis]. Clin Ter, 99, 383-7.
Carroll, N., Elliot, J., Morton, A. & James, A. (1993) The structure of large and small
airways in nonfatal and fatal asthma. Am Rev Respir Dis, 147, 405-10.
Carroll, N. G., Cooke, C. & James, A. L. (1997) Bronchial blood vessel dimensions in
asthma. Am J Respir Crit Care Med, 155, 689-95.
Carroll, N. G., Perry, S., Karkhanis, A., Harji, S., Butt, J., James, A. L. & Green, F. H.
(2000) The airway longitudinal elastic fiber network and mucosal folding in patients
with asthma. Am J Respir Crit Care Med, 161, 244-8.

Stevens 2009
197
______________________________________________________________________
Cataldo, D. D., Gueders, M., Munaut, C., Rocks, N., Bartsch, P., Foidart, J. M., Noel,
A. & Louis, R. (2004) Matrix metalloproteinases and tissue inhibitors of matrix
metalloproteinases mRNA transcripts in the bronchial secretions of asthmatics. Lab
Invest, 84, 418-24.
Chan, J. C., Duszczyszyn, D. A., Castellino, F. J. & Ploplis, V. A. (2001) Accelerated
skin wound healing in plasminogen activator inhibitor-1-deficient mice. Am J Pathol,
159, 1681-8.
Chang, A. B., Harrhy, V. A., Simpson, J., Masters, I. B. & Gibson, P. G. (2002) Cough,
airway inflammation, and mild asthma exacerbation. Arch Dis Child, 86, 270-5.
Chauhan, A. J., Inskip, H. M., Linaker, C. H., Smith, S., Schreiber, J., Johnston, S. L. &
Holgate, S. T. (2003) Personal exposure to nitrogen dioxide (NO2) and the severity of
virus-induced asthma in children. Lancet, 361, 1939-44.
Chetta, A., Foresi, A., Del Donno, M., Bertorelli, G., Pesci, A. & Olivieri, D. (1997)
Airways remodeling is a distinctive feature of asthma and is related to severity of
disease. Chest, 111, 852-7.

Stevens 2009
198
______________________________________________________________________
Chetta, A., Zanini, A., Foresi, A., Del Donno, M., Castagnaro, A., D'ippolito, R.,
Baraldo, S., Testi, R., Saetta, M. & Olivieri, D. (2003) Vascular component of airway
remodeling in asthma is reduced by high dose of fluticasone. Am J Respir Crit Care
Med, 167, 751-7.
Cho, S. H., Hall, I. P., Wheatley, A., Dewar, J., Abraha, D., Del Mundo, J., Lee, H. &
Oh, C. K. (2001) Possible role of the 4G/5G polymorphism of the plasminogen
activator inhibitor 1 gene in the development of asthma. J Allergy Clin Immunol, 108,
212-4.
Cho, S. H., Tam, S. W., Demissie-Sanders, S., Filler, S. A. & Oh, C. K. (2000)
Production of plasminogen activator inhibitor-1 by human mast cells and its possible
role in asthma. J Immunol, 165, 3154-61.
Choe, M. M., Sporn, P. H. & Swartz, M. A. (2003) An in vitro airway wall model of
remodeling. Am J Physiol Lung Cell Mol Physiol, 285, L427-33.
Chu, E. K., Cheng, J., Foley, J. S., Mecham, B. H., Owen, C. A., Haley, K. J., Mariani,
T. J., Kohane, I. S., Tschumperlin, D. J. & Drazen, J. M. (2006) Induction of the
Plasminogen Activator System by Mechanical Stimulation of Human Bronchial
Epithelial Cells. Am J Respir Cell Mol Biol.

Stevens 2009
199
______________________________________________________________________
Chung, K. F. & Barnes, P. J. (1999) Cytokines in asthma. Thorax, 54, 825-57.
Churg, A. (1996) The uptake of mineral particles by pulmonary epithelial cells. Am J
Respir Crit Care Med, 154, 1124-40.
Colloff M. J. & Stewart G. A. (1997) House dust mites. In: Barnes P, Grunstein M, Leff
A, Woolcock A. (eds). Asthma. Vol. 2. Lippincott-Raven Press, New York. pp. 1089-
1103.
Copeland, N. G., Silan, C. M., Kingsley, D. M., Jenkins, N. A., Cannizzaro, L. A.,
Croce, C. M., Huebner, K. & Sims, J. E. (1991) Chromosomal location of murine and
human IL-1 receptor genes. Genomics, 9, 44-50.
Corne, J. M., Marshall, C., Smith, S., Schreiber, J., Sanderson, G., Holgate, S. T. &
Johnston, S. L. (2002) Frequency, severity, and duration of rhinovirus infections in
asthmatic and non-asthmatic individuals: a longitudinal cohort study. Lancet, 359, 831-
4.
Corry, D. B., Rishi, K., Kanellis, J., Kiss, A., Song Lz, L. Z., Xu, J., Feng, L., Werb, Z.
& Kheradmand, F. (2002) Decreased allergic lung inflammatory cell egression and
increased susceptibility to asphyxiation in MMP2-deficiency. Nat Immunol, 3, 347-53.

Stevens 2009
200
______________________________________________________________________
Cromwell, O., Hamid, Q., Corrigan, C. J., Barkans, J., Meng, Q., Collins, P. D. & Kay,
A. B. (1992) Expression and generation of interleukin-8, IL-6 and granulocyte-
macrophage colony-stimulating factor by bronchial epithelial cells and enhancement by
IL-1 beta and tumour necrosis factor-alpha. Immunology, 77, 330-7.
Cutz, E. & Conen, P. E. (1971) Ultrastructure and cytochemistry of Clara cells. Am J
Pathol, 62, 127-41.
Dang, B., Wiehler, S. & Patel, K. D. (2002) Increased PSGL-1 expression on
granulocytes from allergic-asthmatic subjects results in enhanced leukocyte recruitment
under flow conditions. J Leukoc Biol, 72, 702-10.
Davies, D. E. (2001) The bronchial epithelium: translating gene and environment
interactions in asthma. Curr Opin Allergy Clin Immunol, 1, 67-71.
De Kluijver, J., Grunberg, K., Pons, D., De Klerk, E. P., Dick, C. R., Sterk, P. J. &
Hiemstra, P. S. (2003) Interleukin-1beta and interleukin-1ra levels in nasal lavages
during experimental rhinovirus infection in asthmatic and non-asthmatic subjects. Clin
Exp Allergy, 33, 1415-8.

Stevens 2009
201
______________________________________________________________________
De Marco, R., Marcon, A., Jarvis, D., Accordini, S., Almar, E., Bugiani, M., Carolei,
A., Cazzoletti, L., Corsico, A., Gislason, D., Gulsvik, A., Jogi, R., Marinoni, A.,
Martinez-Moratalla, J., Pin, I. & Janson, C. (2006) Prognostic factors of asthma
severity: a 9-year international prospective cohort study. J Allergy Clin Immunol, 117,
1249-56.
Deloukas, P., Schuler, G. D., Gyapay, G., Beasley, E. M., Soderlund, C., Rodriguez-
Tome, P., Hui, L., Matise, T. C., McKusick, K. B., Beckmann, J. S., Bentolila, S.,
Bihoreau, M., Birren, B. B., Browne, J., Butler, A., Castle, A. B., Chiannilkulchai, N.,
Clee, C., Day, P. J., Dehejia, A., Dibling, T., Drouot, N., Duprat, S., Fizames, C., Fox,
S., Gelling, S., Green, L., Harrison, P., Hocking, R., Holloway, E., Hunt, S., Keil, S.,
Lijnzaad, P., Louis-Dit-Sully, C., Ma, J., Mendis, A., Miller, J., Morissette, J., Muselet,
D., Nusbaum, H. C., Peck, A., Rozen, S., Simon, D., Slonim, D. K., Staples, R., Stein,
L. D., Stewart, E. A., Suchard, M. A., Thangarajah, T., Vega-Czarny, N., Webber, C.,
Wu, X., Hudson, J., Auffray, C., Nomura, N., Sikela, J. M., Polymeropoulos, M. H.,
James, M. R., Lander, E. S., Hudson, T. J., Myers, R. M., Cox, D. R., Weissenbach, J.,
Boguski, M. S. & Bentley, D. R. (1998) 'A physical map of 30,000 human genes',
Science, vol. 282, no. 5389, pp. 744-6.
Devalia, J. L., Rusznak, C. & Davies, R. J. (1994) Air pollution in the 1990s--cause of
increased respiratory disease? Respir Med, 88, 241-4.

Stevens 2009
202
______________________________________________________________________
Dicosmo, B. F., Geba, G. P., Picarella, D., Elias, J. A., Rankin, J. A., Stripp, B. R.,
Whitsett, J. A. & Flavell, R. A. (1994) Airway epithelial cell expression of interleukin-6
in transgenic mice. Uncoupling of airway inflammation and bronchial hyperreactivity. J
Clin Invest, 94, 2028-35.
Dinarello, C. A. (1996) Biologic basis for interleukin-1 in disease. Blood, 87, 2095-147.
Doherty, G. M., Kamath, S. V., De Courcey, F., Christie, S. N., Chisakuta, A., Lyons, J.
D., Heaney, L. G., Ennis, M. & Shields, M. D. (2005) Children with stable asthma have
reduced airway matrix metalloproteinase-9 and matrix metalloproteinase-9/tissue
inhibitor of metalloproteinase-1 ratio. Clin Exp Allergy, 35, 1168-74.
Dosanjh, A. (2006) Transforming growth factor-beta expression induced by rhinovirus
infection in respiratory epithelial cells. Acta Biochim Biophys Sin (Shanghai), 38, 911-4.
Dosanjh, A. & Zuraw, B. (2003) Endothelin-1 (ET-1) decreases human bronchial
epithelial cell migration and proliferation: implications for airway remodeling in
asthma. J Asthma, 40, 883-6.
Dunnill, M. S., Massarella, G. R. & Anderson, J. A. (1969) A comparison of the
quantitative anatomy of the bronchi in normal subjects, in status asthmaticus, in chronic
bronchitis, and in emphysema. Thorax, 24, 176-9.

Stevens 2009
203
______________________________________________________________________
Dunsmore, S. E., Saarialho-Kere, U. K., Roby, J. D., Wilson, C. L., Matrisian, L. M.,
Welgus, H. G. & Parks, W. C. (1998) Matrilysin expression and function in airway
epithelium. J Clin Invest, 102, 1321-31.
Ebert, R. V., Kronenberg, R. S. & Terracio, M. J. (1976) Study of the surface secretion
of the bronchiole using radioautography. Am Rev Respir Dis, 114, 567-73.
Eitzman, D. T., Mccoy, R. D., Zheng, X., Fay, W. P., Shen, T., Ginsburg, D. & Simon,
R. H. (1996) Bleomycin-induced pulmonary fibrosis in transgenic mice that either lack
or overexpress the murine plasminogen activator inhibitor-1 gene. J Clin Invest, 97,
232-7.
Erjefalt, J. S., Erjefalt, I., Sundler, F. & Persson, C. G. (1995) In vivo restitution of
airway epithelium. Cell Tissue Res, 281, 305-16.
Evans, M. J., Cox, R. A., Shami, S. G. & Plopper, C. G. (1990) Junctional adhesion
mechanisms in airway basal cells. Am J Respir Cell Mol Biol, 3, 341-7.
Evans, M. J., Cox, R. A., Shami, S. G., Wilson, B. & Plopper, C. G. (1989) The role of
basal cells in attachment of columnar cells to the basal lamina of the trachea. Am J
Respir Cell Mol Biol, 1, 463-9.
Stevens 2009
204
______________________________________________________________________
Evans, M. J. & Plopper, C. G. (1988) The role of basal cells in adhesion of columnar
epithelium to airway basement membrane. Am Rev Respir Dis, 138, 481-3.
Evans, S. M., Blyth, D. I., Wong, T., Sanjar, S. & West, M. R. (2002) Decreased
distribution of lung epithelial junction proteins after intratracheal antigen or
lipopolysaccharide challenge: correlation with neutrophil influx and levels of BALF sE-
cadherin. Am J Respir Cell Mol Biol, 27, 446-54.
Fahy, J. (2001) Remodeling of the Airway Epithelium in Asthma. Am. J. Respir. Crit.
Care Med, 164, S46-S51.
Ferris, B. G. (1978) Epidemiology Standardization Project (American Thoracic
Society). Am Rev Respir Dis, 118, 1-120.
Folkerts, G., Kloek, J., Muijsers, R. B. & Nijkamp, F. P. (2001) Reactive nitrogen and
oxygen species in airway inflammation. Eur J Pharmacol, 429, 251-62.
Franzen, P., Ten Dijke, P., Ichijo, H., Yamashita, H., Schulz, P., Heldin, C. H. &
Miyazono, K. (1993) Cloning of a TGF beta type I receptor that forms a heteromeric
complex with the TGF beta type II receptor. Cell, 75, 681-92.
Freymuth, F., Vabret, A., Brouard, J., Toutain, F., Verdon, R., Petitjean, J., Gouarin, S.,
Duhamel, J. F. & Guillois, B. (1999) Detection of viral, Chlamydia pneumoniae and

Stevens 2009
205
______________________________________________________________________
Mycoplasma pneumoniae infections in exacerbations of asthma in children. J Clin
Virol, 13, 131-9.
Gail, D. B. & Lenfant, C. J. (1983) Cells of the lung: biology and clinical implications.
Am Rev Respir Dis, 127, 366-87.
Gaston, B., Drazen, J. M., Loscalzo, J. & Stamler, J. S. (1994) The biology of nitrogen
oxides in the airways. Am J Respir Crit Care Med, 149, 538-51.
Glanville, A. R., Tazelaar, H. D., Theodore, J., Imoto, E., Rouse, R. V., Baldwin, J. C.
& Robin, E. D. (1989) The distribution of MHC class I and II antigens on bronchial
epithelium. Am Rev Respir Dis, 139, 330-4.
Goto, Y., Noguchi, Y., Nomura, A., Sakamoto, T., Ishii, Y., Bitoh, S., Picton, C., Fujita,
Y., Watanabe, T., Hasegawa, S. & Uchida, Y. (1999) In vitro reconstitution of the
tracheal epithelium. Am J Respir Cell Mol Biol, 20, 312-8.
Goto, Y., Uchida, Y., Nomura, A., Sakamoto, T., Ishii, Y., Morishima, Y., Masuyama,
K. & Sekizawa, K. (2000) Dislocation of E-cadherin in the airway epithelium during an
antigen-induced asthmatic response. Am J Respir Cell Mol Biol, 23, 712-8.

Stevens 2009
206
______________________________________________________________________
Gringberg, A. V. & Kerppola, T. (2003) Both Max and TFE3 cooperate with Smad
proteins to bind the plasminogen activator inhibitor-1 promoter, but they have opposite
effects on transcriptional activity. J Biol Chem. 278, 11227-36.
Grissell, T. V., Powell, H., Shafren, D. R., Boyle, M. J., Hensley, M. J., Jones, P. D.,
Whitehead, B. F. & Gibson, P. G. (2005) Interleukin-10 gene expression in acute virus-
induced asthma. Am J Respir Crit Care Med, 172, 433-9.
Groneberg, D. A., Eynott, P. R., Lim, S., Oates, T., Wu, R., Carlstedt, I., Roberts, P.,
Mccann, B., Nicholson, A. G., Harrison, B. D. & Chung, K. F. (2002) Expression of
respiratory mucins in fatal status asthmaticus and mild asthma. Histopathology, 40, 367-
73.
Guite, H. F., Dundas, R. & Burney, P. G. (1999) Risk factors for death from asthma,
chronic obstructive pulmonary disease, and cardiovascular disease after a hospital
admission for asthma. Thorax, 54, 301-7.
Hackett, T. L. & Knight, D. A. (2007) The role of epithelial injury and repair in the
origins of asthma. Curr Opin Allergy Clin Immunol, 7, 63-8.

Stevens 2009
207
______________________________________________________________________
Hackett, T. L., Shaheen, F., Johnson, A., Wadsworth, S., Pechkovsky, D. V., Jacoby, D.
B., Kicic, A., Stick, S. M. & Knight, D. A. (2008) Characterization of side population
cells from human airway epithelium. Stem Cells, 26, 2576-85.
Hamid, Q. (2003) Gross pathology and histopathology of asthma. J Allergy Clin
Immunol, 111, 431-2.
Harkema, J. R. & Hotchkiss, J. A. (1991) In vivo effects of endotoxin on nasal epithelial
mucosubstances: quantitative histochemistry. Exp Lung Res, 17, 743-61.
Hashimoto, M., Tanaka, H. & Abe, S. (2005) Quantitative analysis of bronchial wall
vascularity in the medium and small airways of patients with asthma and COPD. Chest,
127, 965-72.
Heard, B. & Hossain, S. (1973) Hyperplasia of bronchial muscle in asthma. The Journal
of Pathology, 110, 319-331.
Heymann, P. W., Carper, H. T., Murphy, D. D., Platts-Mills, T. A., Patrie, J.,
Mclaughlin, A. P., Erwin, E. A., Shaker, M. S., Hellems, M., Peerzada, J., Hayden, F.
G., Hatley, T. K. & Chamberlain, R. (2004) Viral infections in relation to age, atopy,
and season of admission among children hospitalized for wheezing. J Allergy Clin
Immunol, 114, 239-47.

Stevens 2009
208
______________________________________________________________________
Hoek, G., Dockery, D. W., Pope, A., Neas, L., Roemer, W. & Brunekreef, B. (1998)
Association between PM10 and decrements in peak expiratory flow rates in children:
reanalysis of data from five panel studies. Eur Respir J, 11, 1307-11.
Holgate, S. T. (1998a) Asthma and allergy--disorders of civilization? Qjm, 91, 171-84.
Holgate, S. T. (1998b) The inflammation-repair cycle in asthma: the pivotal role of the
airway epithelium. Clin Exp Allergy, 28 Suppl 5, 97-103.
Holgate, S. T., Lackie, P., Wilson, S., Roche, W. & Davies, D. (2000) Bronchial
epithelium as a key regulator of airway allergen sensitization and remodeling in asthma.
Am J Respir Crit Care Med, 162, S113-7.
Hollander, C., Sitkauskiene, B., Sakalauskas, R., Westin, U. & Janciauskiene, S. M.
(2007) Serum and bronchial lavage fluid concentrations of IL-8, SLPI, sCD14 and
sICAM-1 in patients with COPD and asthma. Respir Med, 101, 1947-53.
Holtzman, M. J. (1992) Arachidonic acid metabolism in airway epithelial cells. Annu
Rev Physiol, 54, 303-29.
Stevens 2009
209
______________________________________________________________________
Hong, K. U., Reynolds, S. D., Giangreco, A., Hurley, C. M. & Stripp, B. R. (2001)
Clara cell secretory protein-expressing cells of the airway neuroepithelial body
microenvironment include a label-retaining subset and are critical for epithelial renewal
after progenitor cell depletion. Am J Respir Cell Mol Biol, 24, 671-81.
Hong, K. U., Reynolds, S. D., Watkins, S., Fuchs, E. & Stripp, B. R. (2004) Basal cells
are a multipotent progenitor capable of renewing the bronchial epithelium. Am J Pathol,
164, 577-88.
Hoshino, M., Nakamura, Y., Sim, J., Shimojo, J. & Isogai, S. (1998) Bronchial
subepithelial fibrosis and expression of matrix metalloproteinase-9 in asthmatic airway
inflammation. J Allergy Clin Immunol, 102, 783-8.
Howat, W. J., Holgate, S. T. & Lackie, P. M. (2002) TGF-beta isoform release and
activation during in vitro bronchial epithelial wound repair. Am J Physiol Lung Cell Mol
Physiol, 282, L115-23.
Huang, H. C., Liu, S. Y., Liang, Y., Liu, Y., Li, J. Z. & Wang, H. Y. (2005)
[Transforming growth factor-beta1 stimulates matrix metalloproteinase-9 production
through ERK activation pathway and upregulation of Ets-1 protein.]. Zhonghua Yi Xue
Za Zhi, 85, 328-31.

Stevens 2009
210
______________________________________________________________________
Hudson, T. J., Stein, L. D., Gerety, S. S., Ma, J., Castle, A. B., Silva, J., Slonim, D. K.,
Baptista, R., Kruglyak, L., Xu, S. H., Hu, X., Colbert, A. M., Rosenberg, C., Reeve-
Daly, M. P., Rozen, S., Hui, L., Wu, X., Vestergaard, C., Wilson, K. M., Bae, J. S.,
Maitra, S., Ganiatsas, S., Evans, C. A., DeAngelis, M. M., Ingalls, K. A., Nahf, R. W.,
Horton, L. T., Jr., Anderson, M. O., Collymore, A. J., Ye, W., Kouyoumjian, V.,
Zemsteva, I. S., Tam, J., Devine, R., Courtney, D. F., Renaud, M. T., Nguyen, H.,
O'Connor, T. J., Fizames, C., Faure, S., Gyapay, G., Dib, C., Morissette, J., Orlin, J. B.,
Birren, B. W., Goodman, N., Weissenbach, J., Hawkins, T. L., Foote, S., Page, D. C. &
Lander, E. S. (1995) 'An STS-based map of the human genome', Science, vol. 270, no.
5244, pp. 1945-54.
Imai, K., Ohuchi, E., Aoki, T., Nomura, H., Fujii, Y., Sato, H., Seiki, M. & Okada, Y.
(1996) Membrane-type matrix metalloproteinase 1 is a gelatinolytic enzyme and is
secreted in a complex with tissue inhibitor of metalloproteinases 2. Cancer Res, 56,
2707-10.
Isogai, C., Laug, W. E., Shimada, H., Declerck, P. J., Stins, M. F., Durden, D. L.,
Erdreich-Epstein, A. & Declerck, Y. A. (2001) Plasminogen activator inhibitor-1
promotes angiogenesis by stimulating endothelial cell migration toward fibronectin.
Cancer Res, 61, 5587-94.

Stevens 2009
211
______________________________________________________________________
Jartti, T., Lehtinen, P., Vuorinen, T., Osterback, R., Van Den Hoogen, B., Osterhaus, A.
D. & Ruuskanen, O. (2004) Respiratory picornaviruses and respiratory syncytial virus
as causative agents of acute expiratory wheezing in children. Emerg Infect Dis, 10,
1095-101.
Jeffery, P. K. (2001) Remodeling in asthma and chronic obstructive lung disease. Am J
Respir Crit Care Med, 164, S28-38.
Jeffery, P. K., Laitinen, A. & Venge, P. (2000) Biopsy markers of airway inflammation
and remodelling. Respir Med, 94 Suppl F, S9-15.
Jeffery, P. K. & Reid, L. (1975) New observations of rat airway epithelium: a
quantitative and electron microscopic study. J Anat, 120, 295-320.
Jeffery, P. K., Wardlaw, A. J., Nelson, F. C., Collins, J. V. & Kay, A. B. (1989)
Bronchial biopsies in asthma. An ultrastructural, quantitative study and correlation with
hyperreactivity. Am Rev Respir Dis, 140, 1745-53.
Jo, M., Thomas, K. S., Marozkina, N., Amin, T. J., Silva, C. M., Parsons, S. J. &
Gonias, S. L. (2005) Dynamic assembly of the urokinase-type plasminogen activator
signaling receptor complex determines the mitogenic activity of urokinase-type
plasminogen activator. J Biol Chem, 280, 17449-57.

Stevens 2009
212
______________________________________________________________________
Johnston, S. L. (2007) Innate immunity in the pathogenesis of virus-induced asthma
exacerbations. Proc Am Thorac Soc, 4, 267-70.
Johnston, S. L., Papi, A., Bates, P. J., Mastronarde, J. G., Monick, M. M. &
Hunninghake, G. W. (1998) Low grade rhinovirus infection induces a prolonged release
of IL-8 in pulmonary epithelium. J Immunol, 160, 6172-81.
Johnston, S. L., Pattemore, P. K., Sanderson, G., Smith, S., Lampe, F., Josephs, L.,
Symington, P., O'toole, S., Myint, S. H., Tyrrell, D. A. & Et al. (1995) Community
study of role of viral infections in exacerbations of asthma in 9-11 year old children.
Bmj, 310, 1225-9.
Joos, G. F., Germonpre, P. R. & Pauwels, R. A. (2000) Role of tachykinins in asthma.
Allergy, 55, 321-37.
Jordà, M,, Olmeda, D., Vinyals, A., Valero, E., Cubillo, E., Llorens, A., Cano, A.
& Fabra, A, (2005) Upregulation of MMP-9 in MDCK epithelial cell line in response to
expression of the Snail transcription factor. J Cell Sci, 118, 3371-85.
Jorres, R., Nowak, D. & Magnussen, H. (1996) The effect of ozone exposure on
allergen responsiveness in subjects with asthma or rhinitis. Am J Respir Crit Care Med,
153, 56-64.

Stevens 2009
213
______________________________________________________________________
Joubert, P. & Hamid, Q. (2005) Role of airway smooth muscle in airway remodeling. J
Allergy Clin Immunol, 116, 713-6.
Kalb, T. H., Chuang, M. T., Marom, Z. & Mayer, L. (1991) Evidence for accessory cell
function by class II MHC antigen-expressing airway epithelial cells. Am J Respir Cell
Mol Biol, 4, 320-9.
Kaul, P., Biagioli, M. C., Singh, I. & Turner, R. B. (2000) Rhinovirus-induced oxidative
stress and interleukin-8 elaboration involves p47-phox but is independent of attachment
to intercellular adhesion molecule-1 and viral replication. J Infect Dis, 181, 1885-90.
Keenan, K. P., Combs, J. W. & McDowell, E. M. (1982) Regeneration of hamster
tracheal epithelium after mechanical injury. I. Focal lesions: quantitative morphologic
study of cell proliferation.Virchows Arch B Cell Pathol Incl Mol Pathol, 41, 193-214.
Kehrl, H. R., Peden, D. B., Ball, B., Folinsbee, L. J. & Horstman, D. (1999) Increased
specific airway reactivity of persons with mild allergic asthma after 7.6 hours of
exposure to 0.16 ppm ozone. J Allergy Clin Immunol, 104, 1198-204.
Kelley, J. (1990) Cytokines of the lung. Am Rev Respir Dis, 141, 765-88.

Stevens 2009
214
______________________________________________________________________
Kenny, P., Lancsar, E., Hall, J., King, M. & Chaplin, M. (2005) The individual and
health sector costs of asthma: the first year of a longitudinal study in New South Wales.
Aust N Z J Public Health, 29, 429-35.
Kharitonov, S. A., O'connor, B. J., Evans, D. J. & Barnes, P. J. (1995) Allergen-induced
late asthmatic reactions are associated with elevation of exhaled nitric oxide. Am J
Respir Crit Care Med, 151, 1894-9.
Kicic, A., Sutanto, E. N., Stevens, P. T., Knight, D. A. & Stick, S. M. (2006) Intrinsic
biochemical and functional differences in bronchial epithelial cells of children with
asthma. Am J Respir Crit Care Med, 174, 1110-8.
Kim, C. F., Jackson, E. L., Woolfenden, A. E., Lawrence, S., Babar, I., Vogel, S.,
Crowley, D., Bronson, R. T. & Jacks, T. (2005) Identification of bronchioalveolar stem
cells in normal lung and lung cancer. Cell, 121, 823-35.
Kishimoto, T. (1989) The biology of interleukin-6. Blood, 74, 1-10.
Kleiner, D. E., Jr. & Stetler-Stevenson, W. G. (1993) Structural biochemistry and
activation of matrix metalloproteases. Curr Opin Cell Biol, 5, 891-7.
Kleiner, D. E. & Stetler-Stevenson, W. G. (1994) Quantitative zymography: detection
of picogram quantities of gelatinases. Anal Biochem, 218, 325-9.

Stevens 2009
215
______________________________________________________________________
Knight, D. (2001) Epithelium-fibroblast interactions in response to airway
inflammation. Immunol Cell Biol, 79, 160-4.
Koenig, J. Q., Pierson, W. E. & Frank, R. (1980) Acute effects of inhaled SO2 plus
NaCl droplet aerosol on pulmonary function in asthmatic adolescents. Environ Res, 22,
145-53.
Koenig, J. Q., Pierson, W. E., Horike, M. & Frank, R. (1981) Effects of SO2 plus NaCl
aerosol combined with moderate exercise on pulmonary function in asthmatic
adolescents. Environ Res, 25, 340-8.
Kojima, K., Bonassar, L. J., Roy, A. K., Mizuno, H., Cortiella, J. & Vacanti, C. A.
(2003) A composite tissue-engineered trachea using sheep nasal chondrocyte and
epithelial cells. Faseb J, 17, 823-8.
Koren, H. S. (1995) Associations between criteria air pollutants and asthma. Environ
Health Perspect, 103 Suppl 6, 235-42.
Koren, H. S. (1997) Environmental risk factors in atopic asthma. Int Arch Allergy
Immunol, 113, 65-8.
Koren, H. S. & Bromberg, P. A. (1995) Respiratory responses of asthmatics to ozone.
Int Arch Allergy Immunol, 107, 236-8.

Stevens 2009
216
______________________________________________________________________
Kossakowska, A. E., Edwards, D. R., Prusinkiewicz, C., Zhang, M. C., Guo, D.,
Urbanski, S. J., Grogan, T., Marquez, L. A. & Janowska-Wieczorek, A. (1999)
Interleukin-6 regulation of matrix metalloproteinase (MMP-2 and MMP-9) and tissue
inhibitor of metalloproteinase (TIMP-1) expression in malignant non-Hodgkin's
lymphomas. Blood, 94, 2080-9.
Kruithof, E. K. (1988) Plasminogen activator inhibitors--a review. Enzyme, 40, 113-21.
Kruithof, E. K., Vassalli, J. D., Schleuning, W. D., Mattaliano, R. J. & Bachmann, F.
(1986) Purification and characterization of a plasminogen activator inhibitor from the
histiocytic lymphoma cell line U-937. J Biol Chem, 261, 11207-13.
Kurt-Jones, E. A., Popova, L., Kwinn, L., Haynes, L. M., Jones, L. P., Tripp, R. A.,
Walsh, E. E., Freeman, M. W., Golenbock, D. T., Anderson, L. J. & Finberg, R. W.
(2000) Pattern recognition receptors TLR4 and CD14 mediate response to respiratory
syncytial virus. Nat Immunol, 1, 398-401.
Kuwano, K., Bosken, C. H., Pare, P. D., Bai, T. R., Wiggs, B. R. & Hogg, J. C. (1993)
Small airways dimensions in asthma and in chronic obstructive pulmonary disease. Am
Rev Respir Dis, 148, 1220-5.
Stevens 2009
217
______________________________________________________________________
Kwon, O. J., Jose, P. J., Robbins, R. A., Schall, T. J., Williams, T. J. & Barnes, P. J.
(1995) Glucocorticoid inhibition of RANTES expression in human lung epithelial cells.
Am J Respir Cell Mol Biol, 12, 488-96.
Laitinen, L. A., Heino, M., Laitinen, A., Kava, T. & Haahtela, T. (1985) Damage of the
airway epithelium and bronchial reactivity in patients with asthma. Am Rev Respir Dis,
131, 599-606.
Lane, C., Burgess, S., Kicic, A., Knight, D. & Stick, S. (2005) The use of non-
bronchoscopic brushings to study the paediatric airway. Respir Res, 6, 53.
Lane, C., Knight, D., Burgess, S., Franklin, P., Horak, F., Legg, J., Moeller, A. & Stick,
S. (2004) Epithelial inducible nitric oxide synthase activity is the major determinant of
nitric oxide concentration in exhaled breath. Thorax, 59, 757-60.
Larsen, C. G., Anderson, A. O., Appella, E., Oppenheim, J. J. & Matsushima, K. (1989)
The neutrophil-activating protein (NAP-1) is also chemotactic for T lymphocytes.
Science, 243, 1464-6.
Lasky, L. A. (1992) Selectins: interpreters of cell-specific carbohydrate information
during inflammation. Science, 258, 964-9.

Stevens 2009
218
______________________________________________________________________
Lau, S., Illi, S., Sommerfeld, C., Niggemann, B., Bergmann, R., Von Mutius, E. &
Wahn, U. (2000) Early exposure to house-dust mite and cat allergens and development
of childhood asthma: a cohort study. Multicentre Allergy Study Group. Lancet, 356,
1392-7.
Lee, Y. C., Lee, H. B., Rhee, Y. K. & Song, C. H. (2001) The involvement of matrix
metalloproteinase-9 in airway inflammation of patients with acute asthma. Clin Exp
Allergy, 31, 1623-30.
Legrand, C., Gilles, C., Zahm, J. M., Polette, M., Buisson, A. C., Kaplan, H.,
Birembaut, P. & Tournier, J. M. (1999) Airway epithelial cell migration dynamics.
MMP-9 role in cell-extracellular matrix remodeling. J Cell Biol, 146, 517-29.
Lehrer, P., Feldman, J., Giardino, N., Song, H. S. & Schmaling, K. (2002)
Psychological aspects of asthma. J Consult Clin Psychol, 70, 691-711.
Lemjabbar, H., Gosset, P., Lamblin, C., Tillie, I., Hartmann, D., Wallaert, B., Tonnel,
A. B. & Lafuma, C. (1999) Contribution of 92 kDa gelatinase/type IV collagenase in
bronchial inflammation during status asthmaticus. Am J Respir Crit Care Med, 159,
1298-307.

Stevens 2009
219
______________________________________________________________________
Leonard, E. J. & Yoshimura, T. (1990) Neutrophil attractant/activation protein-1 (NAP-
1 [interleukin-8]). Am J Respir Cell Mol Biol, 2, 479-86.
Li, F., Goncalves, J., Faughnan, K., Steiner, M. G., Pagan-Charry, I., Esposito, D., Chin,
B., Providence, K. M., Higgins, P. J. & Staiano-Coico, L. (2000) Targeted inhibition of
wound-induced PAI-1 expression alters migration and differentiation in human
epidermal keratinocytes. Exp Cell Res, 258, 245-53.
Li, X. & Wilson, J. W. (1997) Increased vascularity of the bronchial mucosa in mild
asthma. Am J Respir Crit Care Med, 156, 229-33.
Liao, H., Hyman, M. C., Lawrence, D. A. & Pinsky, D. J. (2007) Molecular regulation
of the PAI-1 gene by hypoxia: contributions of Egr-1, HIF-1α and C/EBP α. FASEB
J, 21, 935-49.
Livak, K. J. & Schmittgen, T. D. (2001) Analysis of relative gene expression data using
real-time quantitative PCR and the 2(-Delta Delta C(T)) Method. Methods, 25, 402-8.
Lopez-Boado, Y. S., Wilson, C. L. & Parks, W. C. (2001) Regulation of matrilysin
expression in airway epithelial cells by Pseudomonas aeruginosa flagellin. J Biol Chem,
276, 41417-23.

Stevens 2009
220
______________________________________________________________________
Lovett, C. J., Whitehead, B. F. & Gibson, P. G. (2007) Eosinophilic airway
inflammation and the prognosis of childhood asthma. Clin Exp Allergy, 37, 1594-601.
Mahut, B., Delclaux, C., Tillie-Leblond, I., Gosset, P., Delacourt, C., Zerah-Lancner, F.,
Harf, A. & De Blic, J. (2004) Both inflammation and remodeling influence nitric oxide
output in children with refractory asthma. J Allergy Clin Immunol, 113, 252-6.
Maisi, P., Prikk, K., Sepper, R., Pirila, E., Salo, T., Hietanen, J. & Sorsa, T. (2002)
Soluble membrane-type 1 matrix metalloproteinase (MT1-MMP) and gelatinase A
(MMP-2) in induced sputum and bronchoalveolar lavage fluid of human bronchial
asthma and bronchiectasis. Apmis, 110, 771-82.
Malmström, K., Pitkäranta, A., Carpen. O., Pelkonen, A., Malmberg, L. P., Turpeinen,
M., Kajosaari, M., Sarna, S., Lindahl, H., Haahtela, T. & Mäkelä, M. J. (2006) Human
rhinovirus in bronchial epithelium of infants with recurrent respiratory symptoms. J
Allergy Clin Immunol, 118, 591-6.
Manolitsas, N. D., Trigg, C. J., Mcaulay, A. E., Wang, J. H., Jordan, S. E., D'ardenne,
A. J. & Davies, R. J. (1994) The expression of intercellular adhesion molecule-1 and the
beta 1-integrins in asthma. Eur Respir J, 7, 1439-44.
Stevens 2009
221
______________________________________________________________________
Mao, X. Q., Kawai, M., Yamashita, T., Enomoto, T., Dake, Y., Sasaki, S., Kataoka, Y.,
Fukuzumi, T., Endo, K., Sano, H., Aoki, T., Kurimoto, F., Adra, C. N., Shirakawa, T. &
Hopkin, J. M. (2000) Imbalance production between interleukin-1beta (IL-1β) and IL-1
receptor antagonist (IL-1Ra) in bronchial asthma. Biochem Biophys Res Commun, 276,
607-12.
Maquerlot, F., Galiacy, S., Malo, M., Guignabert, C., Lawrence, D. A., D'ortho, M. P. &
Barlovatz-Meimon, G. (2006) Dual role for plasminogen activator inhibitor type 1 as
soluble and as matricellular regulator of epithelial alveolar cell wound healing. Am J
Pathol, 169, 1624-32.
Marini, M., Vittori, E., Hollemborg, J. & Mattoli, S. (1992) Expression of the potent
inflammatory cytokines, granulocyte-macrophage-colony-stimulating factor and
interleukin-6 and interleukin-8, in bronchial epithelial cells of patients with asthma. J
Allergy Clin Immunol, 89, 1001-9.
Martin, R. J., Kraft, M., Chu, H. W., Berns, E. A. & Cassell, G. H. (2001) A link
between chronic asthma and chronic infection. J Allergy Clin Immunol, 107, 595-601.
Massague, J. (1990) The transforming growth factor-beta family. Annu Rev Cell Biol, 6,
597-641.

Stevens 2009
222
______________________________________________________________________
Masuyama, K., Morishima, Y., Ishii, Y., Nomura, A., Sakamoto, T., Kimura, T.,
Mochizuki, M., Uchida, Y. & Sekizawa, K. (2003) Sputum E-cadherin and asthma
severity. J Allergy Clin Immunol, 112, 208-9.
Matrisian, L. M. (1990) Metalloproteinases and their inhibitors in matrix remodeling.
Trends Genet, 6, 121-5.
Matsumoto, H., Niimi, A., Takemura, M., Ueda, T., Minakuchi, M., Tabuena, R., Chin,
K., Mio, T., Ito, Y., Muro, S., Hirai, T., Morita, S., Fukuhara, S. & Mishima, M. (2005)
Relationship of airway wall thickening to an imbalance between matrix
metalloproteinase-9 and its inhibitor in asthma. Thorax, 60, 277-81.
Mattoli, S., Marini, M. & Fasoli, A. (1992) Expression of the potent inflammatory
cytokines, GM-CSF, IL6, and IL8, in bronchial epithelial cells of asthmatic patients.
Chest, 101, 27S-29S.
Mattoli, S., Mattoso, V. L., Soloperto, M., Allegra, L. & Fasoli, A. (1991a) Cellular and
biochemical characteristics of bronchoalveolar lavage fluid in symptomatic nonallergic
asthma. J Allergy Clin Immunol, 87, 794-802.

Stevens 2009
223
______________________________________________________________________
Mattoli, S., Soloperto, M., Marini, M. & Fasoli, A. (1991b) Levels of endothelin in the
bronchoalveolar lavage fluid of patients with symptomatic asthma and reversible
airflow obstruction. J Allergy Clin Immunol, 88, 376-84.
Mattos, W., Lim, S., Russell, R., Jatakanon, A., Chung, K. F. & Barnes, P. J. (2002)
Matrix metalloproteinase-9 expression in asthma: effect of asthma severity, allergen
challenge, and inhaled corticosteroids. Chest, 122, 1543-52.
Mauad, T., Xavier, A. C., Saldiva, P. H. & Dolhnikoff, M. (1999) Elastosis and
fragmentation of fibers of the elastic system in fatal asthma. Am J Respir Crit Care
Med, 160, 968-75.
Mautino, G., Capony, F., Bousquet, J. & Vignola, A. M. (1999) Balance in asthma
between matrix metalloproteinases and their inhibitors. J Allergy Clin Immunol, 104,
530-3.
Mautino, G., Oliver, N., Chanez, P., Bousquet, J. & Capony, F. (1997) Increased release
of matrix metalloproteinase-9 in bronchoalveolar lavage fluid and by alveolar
macrophages of asthmatics. Am J Respir Cell Mol Biol, 17, 583-91.
Maynard, R. L. (1993) Air pollution: should we be concerned about it? J R Soc Med, 86,
63-4.

Stevens 2009
224
______________________________________________________________________
Mcdowell, E. M., Barrett, L. A., Glavin, F., Harris, C. C. & Trump, B. F. (1978) The
respiratory epithelium. I. Human bronchus. J Natl Cancer Inst, 61, 539-49.
Mcguire, J. K., Li, Q. & Parks, W. C. (2003) Matrilysin (matrix metalloproteinase-7)
mediates E-cadherin ectodomain shedding in injured lung epithelium. Am J Pathol, 162,
1831-43.
Mcwilliam, A. S., Nelson, D. J. & Holt, P. G. (1995) The biology of airway dendritic
cells. Immunol Cell Biol, 73, 405-13.
Merikallio, V. J., Mustalahti, K., Remes, S. T., Valovirta, E. J. & Kaila, M. (2005)
Comparison of quality of life between asthmatic and healthy school children. Pediatr
Allergy Immunol, 16, 332-40.
Michel, T. & Feron, O. (1997) Nitric oxide synthases: which, where, how, and why? J
Clin Invest, 100, 2146-52.
Molfino, N. A., Slutsky, A. S. & Zamel, N. (1992) The effects of air pollution on
allergic bronchial responsiveness. Clin Exp Allergy, 22, 667-72.
Monkhouse, W. S. & Whimster, W. F. (1976) An account of the longitudinal mucosal
corrugations of the human tracheo-bronchial tree, with observations on those of some
animals. J Anat, 122, 681-95.

Stevens 2009
225
______________________________________________________________________
Montefort, S., Roberts, J. A., Beasley, R., Holgate, S. T. & Roche, W. R. (1992) The
site of disruption of the bronchial epithelium in asthmatic and non-asthmatic subjects.
Thorax, 47, 499-503.
Montefort, S., Roche, W. R. & Holgate, S. T. (1993) Bronchial epithelial shedding in
asthmatics and non-asthmatics. Respir Med, 87 Suppl B, 9-11.
Montgomery, A. M., De Clerck, Y. A., Langley, K. E., Reisfeld, R. A. & Mueller, B.
M. (1993) Melanoma-mediated dissolution of extracellular matrix: contribution of
urokinase-dependent and metalloproteinase-dependent proteolytic pathways. Cancer
Res, 53, 693-700.
Morcillo, E. J. & Cortijo, J. (2006) Mucus and MUC in asthma. Curr Opin Pulm Med,
12, 1-6.
Moscatelli, D. & Rifkin, D. B. (1988) Membrane and matrix localization of proteinases:
a common theme in tumor cell invasion and angiogenesis. Biochim Biophys Acta, 948,
67-85.
Muraki, K., Satoh, K., Okahata, H., Hirai, Y., Akiyama, M. & Nakata, Y. (1998)
Decreased serum neutral endopeptidase activity in children with bronchial asthma.
Hiroshima J Med Sci, 47, 167-8.

Stevens 2009
226
______________________________________________________________________
Murphy, G., Stanton, H., Cowell, S., Butler, G., Knauper, V., Atkinson, S. &
Gavrilovic, J. (1999) Mechanisms for pro matrix metalloproteinase activation. Apmis,
107, 38-44.
Nagase, H. & Woessner, J. F., Jr. (1999) Matrix metalloproteinases. J Biol Chem, 274,
21491-4.
Nakajoh, M., Fukushima, T., Suzuki, T., Yamaya, M., Nakayama, K., Sekizawa, K. &
Sasaki, H. (2003) Retinoic acid inhibits elastase-induced injury in human lung epithelial
cell lines. Am J Respir Cell Mol Biol, 28, 296-304.
Newcomb, D. C., Sajjan, U., Nanua, S., Jia, Y., Goldsmith, A. M., Bentley, J. K. &
Hershenson, M. B. (2005) Phosphatidylinositol 3-kinase is required for rhinovirus-
induced airway epithelial cell interleukin-8 expression. J Biol Chem, 280, 36952-61.
Ng, V. L., Sabla, G. E., Melin-Aldana, H., Kelley-Loughnane, N., Degen, J. L. &
Bezerra, J. A. (2001) Plasminogen deficiency results in poor clearance of non-fibrin
matrix and persistent activation of hepatic stellate cells after an acute injury. J Hepatol,
35, 781-9.
Nicholson, K. G., Kent, J. & Ireland, D. C. (1993) Respiratory viruses and
exacerbations of asthma in adults. BMJ, 307, 982-6.

Stevens 2009
227
______________________________________________________________________
Norzila, M. Z., Fakes, K., Henry, R. L., Simpson, J. & Gibson, P. G. (2000) Interleukin-
8 secretion and neutrophil recruitment accompanies induced sputum eosinophil
activation in children with acute asthma. Am J Respir Crit Care Med, 161, 769-74.
Nothwang, H. G., Strahm, B., Denich, D., Kubler, M., Schwabe, J., Gingrich, J. C.,
Jauch, A., Cox, A., Nicklin, M. J., Kurnit, D. M. & Hildebrandt, F. (1997) Molecular
cloning of the interleukin-1 gene cluster: construction of an integrated YAC/PAC contig
and a partial transcriptional map in the region of chromosome 2q13. Genomics, 41, 370-
8.
Novembre, E., De Martino, M. & Vierucci, A. (1988) Foods and respiratory allergy. J
Allergy Clin Immunol, 81, 1059-65.
Nuovo, G. J. (1997) In situ detection of PCR-amplified metalloproteinase cDNAs, their
inhibitors and human papillomavirus transcripts in cervical carcinoma cell lines. Int J
Cancer, 71, 1056-60.
Oehling, A. & Baena Cagnani, C. E. (1980) Food allergy and child asthma. Allergol
Immunopathol (Madr), 8, 7-14.
Ogra, P. L. (2004) Respiratory syncytial virus: the virus, the disease and the immune
response. Paediatr Respir Rev, 5 Suppl A, S119-26.

Stevens 2009
228
______________________________________________________________________
Oh, C. K., Ariue, B., Alban, R. F., Shaw, B. & Cho, S. H. (2002) PAI-1 promotes
extracellular matrix deposition in the airways of a murine asthma model. Biochem
Biophys Res Commun, 294, 1155-60.
Onorato, J., Merland, N., Terral, C., Michel, F. B. & Bousquet, J. (1986) Placebo-
controlled double-blind food challenge in asthma. J Allergy Clin Immunol, 78, 1139-46.
Ordonez, C. L., Khashayar, R., Wong, H. H., Ferrando, R., Wu, R., Hyde, D. M.,
Hotchkiss, J. A., Zhang, Y., Novikov, A., Dolganov, G. & Fahy, J. V. (2001) Mild and
moderate asthma is associated with airway goblet cell hyperplasia and abnormalities in
mucin gene expression. Am J Respir Crit Care Med, 163, 517-23.
Osler, W. (1892) The Principles and Practice of Medicine. D. Appleton, New York.
Pepe, C., Foley, S., Shannon, J., Lemiere, C., Olivenstein, R., Ernst, P., Ludwig, M. S.,
Martin, J. G. & Hamid, Q. (2005) Differences in airway remodeling between subjects
with severe and moderate asthma. J Allergy Clin Immunol, 116, 544-9.
Ossowski, L. & Aguirre-Ghiso, J. A. (2000) Urokinase receptor and integrin
partnership: coordination of signaling for cell adhesion, migration and growth. Curr
Opin Cell Biol, 12, 613-20.

Stevens 2009
229
______________________________________________________________________
Pampuch, A., Kowal, K., Bodzenta-Lukaszyk, A., Castelnuovo, A. D., Chyczewski, L.,
Donati, M. B. & Iacoviello, L. (2006) The -675 4G/5G plasminogen activator inhibitor-
1 promoter polymorphism in house dust mite-sensitive allergic asthma patients. Allergy,
61, 234-8.
Papadopoulos, N. G., Bates, P. J., Bardin, P. G., Papi, A., Leir, S. H., Fraenkel, D. J.,
Meyer, J., Lackie, P. M., Sanderson, G., Holgate, S. T. & Johnston, S. L. (2000)
Rhinoviruses infect the lower airways. J Infect Dis, 181, 1875-84.
Papadopoulos, N. G., Stanciu, L. A., Papi, A., Holgate, S. T. & Johnston, S. L. (2002) A
defective type 1 response to rhinovirus in atopic asthma. Thorax, 57, 328-32.
Payne, D. N., Rogers, A. V., Adelroth, E., Bandi, V., Guntupalli, K. K., Bush, A. &
Jeffery, P. K. (2003) Early thickening of the reticular basement membrane in children
with difficult asthma. Am J Respir Crit Care Med, 167, 78-82.
Pazdrak, K., Olszewska-Pazdrak, B., Liu, T., Takizawa, R., Brasier, A. R., Garofalo, R.
P. & Casola, A. (2002) MAPK activation is involved in posttranscriptional regulation of
RSV-induced RANTES gene expression. Am J Physiol Lung Cell Mol Physiol, 283,
L364-72.

Stevens 2009
230
______________________________________________________________________
Peden, D. B., Setzer, R. W., Jr. & Devlin, R. B. (1995) Ozone exposure has both a
priming effect on allergen-induced responses and an intrinsic inflammatory action in the
nasal airways of perennially allergic asthmatics. Am J Respir Crit Care Med, 151, 1336-
45.
Phelan, P. D., Robertson, C. F. & Olinsky, A. (2002) The Melbourne Asthma Study:
1964-1999. J Allergy Clin Immunol, 109, 189-94.
Planus, E., Barlovatz-Meimon, G., Rogers, R. A., Bonavaud, S., Ingber, D. E. & Wang,
N. (1997) Binding of urokinase to plasminogen activator inhibitor type-1 mediates cell
adhesion and spreading. J Cell Sci, 110 ( Pt 9), 1091-8.
Platts-Mills, T. A. & Chapman, M. D. (1987) Dust mites: immunology, allergic disease,
and environmental control. J Allergy Clin Immunol, 80, 755-75.
Plopper, C. G. (1983) Comparative morphologic features of bronchiolar epithelial cells.
The Clara cell. Am Rev Respir Dis, 128, S37-41.
Polito A. J. & Proud D. (1997) Epithelial cells: phenotype, substratum and mediator
production, p. 43. In BS Bochner, Cell adhesion molecules in allergic disease, Marcel
Dekker, New York.

Stevens 2009
231
______________________________________________________________________
Polosa, R., Prosperini, G., Leir, S. H., Holgate, S. T., Lackie, P. M. & Davies, D. E.
(1999) Expression of c-erbB receptors and ligands in human bronchial mucosa. Am J
Respir Cell Mol Biol, 20, 914-23.
Pope, C. A., 3rd (1989) Respiratory disease associated with community air pollution
and a steel mill, Utah Valley. Am J Public Health, 79, 623-8.
Pope, C. A., 3rd (1991) Respiratory hospital admissions associated with PM10 pollution
in Utah, Salt Lake, and Cache Valleys. Arch Environ Health, 46, 90-7.
Proud, D., Gwaltney, J. M., Jr., Hendley, J. O., Dinarello, C. A., Gillis, S. & Schleimer,
R. P. (1994) Increased levels of interleukin-1 are detected in nasal secretions of
volunteers during experimental rhinovirus colds. J Infect Dis, 169, 1007-13.
Providence, K. M. & Higgins, P. J. (2004) PAI-1 expression is required for epithelial
cell migration in two distinct phases of in vitro wound repair. J Cell Physiol, 200, 297-
308.
Providence, K. M., Kutz, S. M., Staiano-Coico, L. & Higgins, P. J. (2000) PAI-1 gene
expression is regionally induced in wounded epithelial cell monolayers and required for
injury repair. J Cell Physiol, 182, 269-80.

Stevens 2009
232
______________________________________________________________________
Puddicombe, S. M., Polosa, R., Richter, A., Krishna, M. T., Howarth, P. H., Holgate, S.
T. & Davies, D. E. (2000) Involvement of the epidermal growth factor receptor in
epithelial repair in asthma. Faseb J, 14, 1362-74.
Puddicombe, S. M., Torres-Lozano, C., Richter, A., Bucchieri, F., Lordan, J. L.,
Howarth, P. H., Vrugt, B., Albers, R., Djukanovic, R., Holgate, S. T., Wilson, S. J. &
Davies, D. E. (2003) Increased expression of p21(waf) cyclin-dependent kinase
inhibitor in asthmatic bronchial epithelium. Am J Respir Cell Mol Biol, 28, 61-8.
Rakes, G. P., Arruda, E., Ingram, J. M., Hoover, G. E., Zambrano, J. C., Hayden, F. G.,
Platts-Mills, T. A. & Heymann, P. W. (1999) Rhinovirus and respiratory syncytial virus
in wheezing children requiring emergency care. IgE and eosinophil analyses. Am J
Respir Crit Care Med, 159, 785-90.
Ramos-Barbon, D., Presley, J. F., Hamid, Q. A., Fixman, E. D. & Martin, J. G. (2005)
Antigen-specific CD4(+) T cells drive airway smooth muscle remodeling in
experimental asthma. J Clin Invest.
Rawlins, E. L. & Hogan, B. L. (2006) Epithelial stem cells of the lung: privileged few
or opportunities for many? Development, 133, 2455-65.

Stevens 2009
233
______________________________________________________________________
Redington, A. E., Madden, J., Frew, A. J., Djukanovic, R., Roche, W. R., Holgate, S. T.
& Howarth, P. H. (1997) Transforming growth factor-beta 1 in asthma. Measurement in
bronchoalveolar lavage fluid. Am J Respir Crit Care Med, 156, 642-7.
Rees, J. & Kanabar, D. (2000) ABC of Asthma. BMJ Publishing Group. London. 2000.
Ross M. H., Romrell L. J. & Kaye G. I. (1995) Histology: A Text and Atlas. 3rd ed.
Williams and Wilkins, Baltimore.
Rhodin, J. A. (1966) The ciliated cell. Ultrastructure and function of the human tracheal
mucosa. Am Rev Respir Dis, 93, Suppl:1-15.
Ricciardolo, F. L., Geppetti, P., Mistretta, A., Nadel, J. A., Sapienza, M. A., Bellofiore,
S. & Di Maria, G. U. (1996) Randomised double-blind placebo-controlled study of the
effect of inhibition of nitric oxide synthesis in bradykinin-induced asthma. Lancet, 348,
374-7.
Ricciardolo F. L., Di Stefano A., van Krieken J. H., Sont J. K., van Schadewijk
A., Rabe K. F., Donner C. F., Hiemstra P. S., Sterk P. J. & Mauad T. (2003).
Proliferation and inflammation in bronchial epithelium after allergen in atopic
asthmatics. Clin Exp Allergy, 33, 905-11.
Richards, W. (1990) Effects of air pollution on asthma. Ann Allergy, 65, 345-7.

Stevens 2009
234
______________________________________________________________________
Richardson, L. P., Lozano, P., Russo, J., Mccauley, E., Bush, T. & Katon, W. (2006)
Asthma symptom burden: relationship to asthma severity and anxiety and depression
symptoms. Pediatrics, 118, 1042-51.
Riley, S. C., Leask, R., Chard, T., Wathen, N. C., Calder, A. A. & Howe, D. C. (1999)
Secretion of matrix metalloproteinase-2, matrix metalloproteinase-9 and tissue inhibitor
of metalloproteinases into the intrauterine compartments during early pregnancy. Mol
Hum Reprod, 5, 376-81.
Ritz, T., Steptoe, A., Dewilde, S. & Costa, M. (2000) Emotions and stress increase
respiratory resistance in asthma. Psychosom Med, 62, 401-12.
Robertson, C. F. (2002) Long-term outcome of childhood asthma. Med J Aust, 177
Suppl, S42-4.
Roche, W. R., Beasley, R., Williams, J. H. & Holgate, S. T. (1989) Subepithelial
fibrosis in the bronchi of asthmatics. Lancet, 1, 520-4.
Rogers, A. V., Dewar, A., Corrin, B. & Jeffery, P. K. (1993) Identification of serous-
like cells in the surface epithelium of human bronchioles. Eur Respir J, 6, 498-504.
Rosen, S. D. (1990) The LEC-CAMs: an emerging family of cell-cell adhesion
receptors based upon carbohydrate recognition. Am J Respir Cell Mol Biol, 3, 397-402.

Stevens 2009
235
______________________________________________________________________
Rossmann, M. G., Arnold, E., Erickson, J. W., Frankenberger, E. A., Griffith, J. P.,
Hecht, H. J., Johnson, J. E., Kamer, G., Luo, M., Mosser, A. G. & Et al. (1985)
Structure of a human common cold virus and functional relationship to other
picornaviruses. Nature, 317, 145-53.
Roth, M., Johnson, P. R., Borger, P., Bihl, M. P., Rudiger, J. J., King, G. G., Ge, Q.,
Hostettler, K., Burgess, J. K., Black, J. L. & Tamm, M. (2004) Dysfunctional
interaction of C/EBPalpha and the glucocorticoid receptor in asthmatic bronchial
smooth-muscle cells. N Engl J Med, 351, 560-74.
Sacco, O., Silvestri, M., Sabatini, F., Sale, R., Defilippi, A. C. & Rossi, G. A. (2004)
Epithelial cells and fibroblasts: structural repair and remodelling in the airways.
Paediatr Respir Rev, 5 Suppl A, S35-40.
Sakurai, T., Yanagisawa, M. & Masaki, T. (1992) Molecular characterization of
endothelin receptors. Trends Pharmacol Sci, 13, 103-8.
Santos, M. C., Campos, M. I., Souza, A. P., Trevilatto, P. C. & Line, S. R. (2004)
Analysis of MMP-1 and MMP-9 promoter polymorphisms in early osseointegrated
implant failure. Int J Oral Maxillofac Implants, 19, 38-43.
Stevens 2009
236
______________________________________________________________________
Salter H. (1866a) An analysis of a hundred and fifty unpublished cases of asthma No 1.
The influence of sex and age in determining the liability to asthma. Lancet, 90–1.
Salter H. (1866b) An analysis of a hundred and fifty unpublished cases of asthma No 2.
On the immediate excitants of the asthmatic paroxysm. Lancet, 259–60.
Santic, Z., Santic, K., Kondza, D. & Bogut, S. (2002) The relationships between the
asthma and weather. Med Arh, 56, 155-7.
Scannell, C., Chen, L., Aris, R. M., Tager, I., Christian, D., Ferrando, R., Welch, B.,
Kelly, T. & Balmes, J. R. (1996) Greater ozone-induced inflammatory responses in
subjects with asthma. Am J Respir Crit Care Med, 154, 24-9.
Schroth, M. K., Grimm, E., Frindt, P., Galagan, D. M., Konno, S. I., Love, R. & Gern, J.
E. (1999) Rhinovirus replication causes RANTES production in primary bronchial
epithelial cells. Am J Respir Cell Mol Biol, 20, 1220-8.
Schuh, J. M., Blease, K. & Hogaboam, C. M. (2002) The role of CC chemokine
receptor 5 (CCR5) and RANTES/CCL5 during chronic fungal asthma in mice. Faseb J,
16, 228-30.

Stevens 2009
237
______________________________________________________________________
Sears, M. R., Greene, J. M., Willan, A. R., Wiecek, E. M., Taylor, D. R., Flannery, E.
M., Cowan, J. O., Herbison, G. P., Silva, P. A. & Poulton, R. (2003) A longitudinal,
population-based, cohort study of childhood asthma followed to adulthood. N Engl J
Med, 349, 1414-22.
Serafini, S. M. & Michaelson, E. D. (1977) Length and distribution of cilia in human
and canine airways. Bull Eur Physiopathol Respir, 13, 551-9.
Sertl, K., Takemura, T., Tschachler, E., Ferrans, V. J., Kaliner, M. A. & Shevach, E. M.
(1986) Dendritic cells with antigen-presenting capability reside in airway epithelium,
lung parenchyma, and visceral pleura. J Exp Med, 163, 436-51.
Shahana, S., Jaunmuktane, Z., Asplund, M. S. & Roomans, G. M. (2006) Ultrastructural
investigation of epithelial damage in asthmatic and non-asthmatic nasal polyps. Respir
Med, 100, 2018-28.
Shaul, P. W., North, A. J., Wu, L. C., Wells, L. B., Brannon, T. S., Lau, K. S., Michel,
T., Margraf, L. R. & Star, R. A. (1994) Endothelial nitric oxide synthase is expressed in
cultured human bronchiolar epithelium. J Clin Invest, 94, 2231-6.
Shebani, E., Shahana, S., Janson, C. & Roomans, G. M. (2005) Attachment of columnar
airway epithelial cells in asthma. Tissue Cell, 37, 145-52.

Stevens 2009
238
______________________________________________________________________
Sherley, J. L., Stadler, P. B. & Stadler, J. S. (1995) A quantitative method for the
analysis of mammalian cell proliferation in culture in terms of dividing and non-
dividing cells. Cell Prolif, 28, 137-44.
Sidebotham, H. J. & Roche, W. R. (2003) Asthma deaths; persistent and preventable
mortality. Histopathology, 43, 105-17.
Sigurs, N., Bjarnason, R., Sigurbergsson, F. & Kjellman, B. (2000) Respiratory
syncytial virus bronchiolitis in infancy is an important risk factor for asthma and allergy
at age 7. Am J Respir Crit Care Med, 161, 1501-7.
Simonella, L., Marks, G., Sanderson, K. & Andrews, G. (2006) Cost-effectiveness of
current and optimal treatment for adult asthma. Intern Med J, 36, 244-50.
Singhera, G. K., Chan, T. S., Cheng, J. Y., Vitalis, T. Z., Hamann, K. J. & Dorscheid,
D. R. (2006) Apoptosis of viral-infected airway epithelial cells limit viral production
and is altered by corticosteroid exposure. Respir Res, 7, 78.
Sivak, J. M., West-Mays, J. A., Yee, A., Williams, T., & Fini, M. E. (2004)
Transcription Factors Pax6 and AP-2 Interact To Coordinate Corneal Epithelial Repair
by Controlling Expression of Matrix Metalloproteinase Gelatinase B. Mol Cell Biol, 24,
245-57.

Stevens 2009
239
______________________________________________________________________
Smit, J. J. & Lukacs, N. W. (2006) A closer look at chemokines and their role in
asthmatic responses. Eur J Pharmacol.
Smith, S. M., Lee, D. K., Lacy, J. & Coleman, D. L. (1990) Rat tracheal epithelial cells
produce granulocyte/macrophage colony-stimulating factor. Am J Respir Cell Mol Biol,
2, 59-68.
Sottile, J., Hocking, D. C. & Swiatek, P. J. (1998) Fibronectin matrix assembly
enhances adhesion-dependent cell growth. J Cell Sci, 111 ( Pt 19), 2933-43.
Sparrow, M. P., Omari, T. I. & Mitchell, H. W. (1995) The epithelial barrier and airway
responsiveness. Can J Physiol Pharmacol, 73, 180-90.
Spina, D. (1998) Epithelium smooth muscle regulation and interactions. Am J Respir
Crit Care Med, 158, S141-5.
Springer, T. A. (1990) Adhesion receptors of the immune system. Nature, 346, 425-34.
Springer, T. A. (1995) Traffic signals on endothelium for lymphocyte recirculation and
leukocyte emigration. Annu Rev Physiol, 57, 827-72.
Springer, T. A. & Lasky, L. A. (1991) Cell adhesion. Sticky sugars for selectins.
Nature, 349, 196-7.

Stevens 2009
240
______________________________________________________________________
Spurrell, J. C., Wiehler, S., Zaheer, R. S., Sanders, S. P. & Proud, D. (2005) Human
airway epithelial cells produce IP-10 (CXCL10) in vitro and in vivo upon rhinovirus
infection. Am J Physiol Lung Cell Mol Physiol, 289, L85-95.
Stein, R. T., Sherrill, D., Morgan, W. J., Holberg, C. J., Halonen, M., Taussig, L. M.,
Wright, A. L. & Martinez, F. D. (1999) Respiratory syncytial virus in early life and risk
of wheeze and allergy by age 13 years. Lancet, 354, 541-5.
Stellato, C., Beck, L. A., Gorgone, G. A., Proud, D., Schall, T. J., Ono, S. J.,
Lichtenstein, L. M. & Schleimer, R. P. (1995) Expression of the chemokine RANTES
by a human bronchial epithelial cell line. Modulation by cytokines and glucocorticoids.
J Immunol, 155, 410-8.
Strachan, D. P. (1989) Hay fever, hygiene, and household size. Bmj, 299, 1259-60.
Subauste, M. C., Jacoby, D. B., Richards, S. M. & Proud, D. (1995) Infection of a
human respiratory epithelial cell line with rhinovirus. Induction of cytokine release and
modulation of susceptibility to infection by cytokine exposure. J Clin Invest, 96, 549-
57.

Stevens 2009
241
______________________________________________________________________
Swaisgood, C. M., French, E. L., Noga, C., Simon, R. H. & Ploplis, V. A. (2000) The
development of bleomycin-induced pulmonary fibrosis in mice deficient for
components of the fibrinolytic system. Am J Pathol, 157, 177-87.
Sweeney, C., Fambrough, D., Huard, C., Diamonti, A. J., Lander, E. S., Cantley, L. C.
& Carraway, K. L., 3rd (2001) Growth factor-specific signaling pathway stimulation
and gene expression mediated by ErbB receptors. J Biol Chem, 276, 22685-98.
Takeichi, M. (1991) Cadherin cell adhesion receptors as a morphogenetic regulator.
Science, 251, 1451-5.
Takeyama, K., Dabbagh, K., Lee, H. M., Agusti, C., Lausier, J. A., Ueki, I. F., Grattan,
K. M. & Nadel, J. A. (1999) Epidermal growth factor system regulates mucin
production in airways. Proc Natl Acad Sci U S A, 96, 3081-6.
Taub, D. D., Anver, M., Oppenheim, J. J., Longo, D. L. & Murphy, W. J. (1996) T
lymphocyte recruitment by interleukin-8 (IL-8). IL-8-induced degranulation of
neutrophils releases potent chemoattractants for human T lymphocytes both in vitro and
in vivo. J Clin Invest, 97, 1931-41.
Taylor, A. L., Hale, J., Hales, B. J., Dunstan, J. A., Thomas, W. R. & Prescott, S. L.
(2007) FOXP3 mRNA expression at 6 months of age is higher in infants who develop

Stevens 2009
242
______________________________________________________________________
atopic dermatitis, but is not affected by giving probiotics from birth. Pediatr Allergy
Immunol, 18, 10-9.
Taylor, D. R., Cowan, J. O., Greene, J. M., Willan, A. R. & Sears, M. R. (2005) Asthma
in remission: can relapse in early adulthood be predicted at 18 years of age? Chest, 127,
845-50.
Taylor, W. R. & Newacheck, P. W. (1992) Impact of childhood asthma on health.
Pediatrics, 90, 657-62.
Thurlbeck, A. & Horsfield, K. (1980) Branching angles in the bronchial tree related to
order of branching. Respir Physiol, 41, 173-81.
Tudoric, N., Zhang, M., Kljajic-Turkalj, M., Niehus, J., Cvoriscec, B., Jurgovsky, K. &
Kunkel, G. (2000) Allergen inhalation challenge induces decrease of serum neutral
endopeptidase (NEP) in asthmatics. Peptides, 21, 359-64.
Turato, G., Barbato, A., Baraldo, S., Zanin, M. E., Bazzan, E., Lokar-Oliani, K.,
Calabrese, F., Panizzolo, C., Snijders, D., Maestrelli, P., Zuin, R., Fabbri, L. M. &
Saetta, M. (2008) Nonatopic children with multitrigger wheezing have airway
pathology comparable to atopic asthma. Am J Respir Crit Care Med, 178, 476-82.

Stevens 2009
243
______________________________________________________________________
Tutluoglu, B., Gurel, C. B., Ozdas, S. B., Musellim, B., Erturan, S., Anakkaya, A. N.,
Kilinc, G. & Ulutin, T. (2005) Platelet function and fibrinolytic activity in patients with
bronchial asthma. Clin Appl Thromb Hemost, 11, 77-81.
Uchida, Y., Ninomiya, H., Saotome, M., Nomura, A., Ohtsuka, M., Yanagisawa, M.,
Goto, K., Masaki, T. & Hasegawa, S. (1988) Endothelin, a novel vasoconstrictor
peptide, as potent bronchoconstrictor. Eur J Pharmacol, 154, 227-8.
Undevia, N. S., Dorscheid, D, R., Marroquin, B. A., Gugliotta, W. L., Tse, R. & White
S. R. (2004) Smad and p38-MAPK signaling mediates apoptotic effects of transforming
growth factor-beta1 in human airway epithelial cells. Am J Physiol Lung Cell Mol
Physiol, 287, L515-24.
Van Schayck, C. P., Dompeling, E., Van Herwaarden, C. L., Wever, A. M. & Van
Weel, C. (1991) Interacting effects of atopy and bronchial hyperresponsiveness on the
annual decline in lung function and the exacerbation rate in asthma. Am Rev Respir Dis,
144, 1297-301.
Vassalli, J. D., Sappino, A. P. & Belin, D. (1991) The plasminogen activator/plasmin
system. J Clin Invest, 88, 1067-72.
Stevens 2009
244
______________________________________________________________________
Vermeer, P. D., Einwalter, L. A., Moninger, T. O., Rokhlina, T., Kern, J. A., Zabner, J.
& Welsh, M. J. (2003) Segregation of receptor and ligand regulates activation of
epithelial growth factor receptor. Nature, 422, 322-6.
Vignola, A. M., Campbell, A. M., Chanez, P., Bousquet, J., Paul-Lacoste, P., Michel, F.
B. & Godard, P. (1993) HLA-DR and ICAM-1 expression on bronchial epithelial cells
in asthma and chronic bronchitis. Am Rev Respir Dis, 148, 689-94.
Vignola, A. M., Chanez, P., Campbell, A. M., Pinel, A. M., Bousquet, J., Michel, F. B.
& Godard, P. (1994) Quantification and localization of HLA-DR and intercellular
adhesion molecule-1 (ICAM-1) molecules on bronchial epithelial cells of asthmatics
using confocal microscopy. Clin Exp Immunol, 96, 104-9.
Von, H. L. (2002) Role of persistent infection in the control and severity of asthma:
focus on Chlamydia pneumoniae. Eur Respir J, 19, 546-56.
Vonk, J. M., Postma, D. S., Boezen, H. M., Grol, M. H., Schouten, J. P., Koeter, G. H.
& Gerritsen, J. (2004) Childhood factors associated with asthma remission after 30 year
follow up. Thorax, 59, 925-9.

Stevens 2009
245
______________________________________________________________________
Waltz, D. A., Natkin, L. R., Fujita, R. M., Wei, Y. & Chapman, H. A. (1997) Plasmin
and plasminogen activator inhibitor type 1 promote cellular motility by regulating the
interaction between the urokinase receptor and vitronectin. J Clin Invest, 100, 58-67.
Wang, A., Yokosaki, Y., Ferrando, R., Balmes, J. & Sheppard, D. (1996) Differential
regulation of airway epithelial integrins by growth factors. Am J Respir Cell Mol Biol,
15, 664-72.
Wang, J. H., Trigg, C. J., Devalia, J. L., Jordan, S. & Davies, R. J. (1994) Effect of
inhaled beclomethasone dipropionate on expression of proinflammatory cytokines and
activated eosinophils in the bronchial epithelium of patients with mild asthma. J Allergy
Clin Immunol, 94, 1025-34.
Wang, Z., Sosne, G. & Kurpakus-Wheater, M. (2005) Plasminogen activator inhibitor-1
(PAI-1) stimulates human corneal epithelial cell adhesion and migration in vitro. Exp
Eye Res, 80, 1-8.
Wanner, A., Salathe, M. & O'riordan, T. G. (1996) Mucociliary clearance in the
airways. Am J Respir Crit Care Med, 154, 1868-902.
Wardlaw, A. J. (2001) Eosinophil trafficking in asthma. Clin Med, 1, 214-8.

Stevens 2009
246
______________________________________________________________________
Wark P. A., Grissell T. V., Davies B., Mimica J., Shafen D. A. & Gibson P. G. (2007)
Bronchial epithelial cell response to clinical rhinovirus isolates from asthmatics
compared to laboratory strains. Am. J Rspir Crit Care Med 175:A472.
Wark, P. A., Johnston, S. L., Bucchieri, F., Powell, R., Puddicombe, S., Laza-Stanca,
V., Holgate, S. T. & Davies, D. E. (2005) Asthmatic bronchial epithelial cells have a
deficient innate immune response to infection with rhinovirus. J Exp Med, 201, 937-47.
Wark, P. A., Johnston, S. L., Moric, I., Simpson, J. L., Hensley, M. J. & Gibson, P. G.
(2002) Neutrophil degranulation and cell lysis is associated with clinical severity in
virus-induced asthma. Eur Respir J, 19, 68-75.
Warringa, R. A., Koenderman, L., Kok, P. T., Kreukniet, J. & Bruijnzeel, P. L. (1991)
Modulation and induction of eosinophil chemotaxis by granulocyte-macrophage
colony-stimulating factor and interleukin-3. Blood, 77, 2694-700.
Warschburger, P., Landgraf, J. M., Petermann, F. & Freidel, K. (2003) Health-related
quality of life in children assessed by their parents: evaluation of the psychometric
properties of the CHQ-PF50 in two German clinical samples. Qual Life Res, 12, 291-
301.

Stevens 2009
247
______________________________________________________________________
Watkins, D. N., Peroni, D. J., Basclain, K. A., Garlepp, M. J. & Thompson, P. J. (1997)
Expression and activity of nitric oxide synthases in human airway epithelium. Am J
Respir Cell Mol Biol, 16, 629-39.
Watson, L., Turk, F. & Rabe, K. F. (2007) Burden of asthma in the hospital setting: an
Australian analysis. Int J Clin Pract, 61, 1884-8.
Weckroth, M., Vaheri, A., Myohanen, H., Tukiainen, E. & Siren, V. (2001) Differential
effects of acute and chronic wound fluids on urokinase-type plasminogen activator,
urokinase-type plasminogen activator receptor, and tissue-type plasminogen activator in
cultured human keratinocytes and fibroblasts. Wound Repair Regen, 9, 314-22.
Weckroth, M., Vaheri, A., Virolainen, S., Saarialho-Kere, U., Jahkola, T. & Siren, V.
(2004) Epithelial tissue-type plasminogen activator expression, unlike that of urokinase,
its receptor, and plasminogen activator inhibitor-1, is increased in chronic venous
ulcers. Br J Dermatol, 151, 1189-96.
Wegner, C. D., Gundel, R. H., Reilly, P., Haynes, N., Letts, L. G. & Rothlein, R. (1990)
Intercellular adhesion molecule-1 (ICAM-1) in the pathogenesis of asthma. Science,
247, 456-9.

Stevens 2009
248
______________________________________________________________________
Weitzman, M., Gortmaker, S. L., Sobol, A. M. & Perrin, J. M. (1992) Recent trends in
the prevalence and severity of childhood asthma. Jama, 268, 2673-7.
Welsh, M. J. (1987) Electrolyte transport by airway epithelia. Physiol Rev, 67, 1143-84.
Wenzel, S. E., Balzar, S., Cundall, M. & Chu, H. W. (2003) Subepithelial basement
membrane immunoreactivity for matrix metalloproteinase 9: association with asthma
severity, neutrophilic inflammation, and wound repair. J Allergy Clin Immunol, 111,
1345-52.
Werb, Z., Banda, M. J. & Jones, P. A. (1980) Degradation of connective tissue matrices
by macrophages. I. Proteolysis of elastin, glycoproteins, and collagen by proteinases
isolated from macrophages. J Exp Med, 152, 1340-57.
White, S. R., Tse, R. & Marroquin, B. A. (2005) Stress-activated protein kinases
mediate cell migration in human airway epithelial cells. Am J Respir Cell Mol Biol, 32,
301-10.
Widdicombe, J. G. & Pack, R. J. (1982) The Clara cell. Eur J Respir Dis, 63, 202-20.
Williams, A. F. & Barclay, A. N. (1988) The immunoglobulin superfamily--domains for
cell surface recognition. Annu Rev Immunol, 6, 381-405.

Stevens 2009
249
______________________________________________________________________
Wilson C. L. & Matrisian L. M. (1998) Matrilysin. In: Parks WC, Mecham RP, eds.
Matrix metalloproteinases. Academic Press, San Diego, pp. 149-184.
Wjst, M., Fischer, G., Immervoll, T., Jung, M., Saar, K., Rueschendorf, F., Reis, A.,
Ulbrecht, M., Gomolka, M., Weiss, E. H., Jaeger, L., Nickel, R., Richter, K., Kjellman,
N. I., Griese, M., Von Berg, A., Gappa, M., Riedel, F., Boehle, M., Van
Koningsbruggen, S., Schoberth, P., Szczepanski, R., Dorsch, W., Silbermann, M.,
Wichmann, H. E. & Et al. (1999) A genome-wide search for linkage to asthma. German
Asthma Genetics Group. Genomics, 58, 1-8.
Woessner, J. F., Jr. (1991) Matrix metalloproteinases and their inhibitors in connective
tissue remodeling. Faseb J, 5, 2145-54.
Woodruff, P. G., Dolganov, G. M., Ferrando, R. E., Donnelly, S., Hays, S. R., Solberg,
O. D., Carter, R., Wong, H. H., Cadbury, P. S. & Fahy, J. V. (2004) Hyperplasia of
smooth muscle in mild to moderate asthma without changes in cell size or gene
expression. Am J Respir Crit Care Med, 169, 1001-6.
Woods, R. K., Thien, F., Raven, J., Walters, E. H. & Abramson, M. (2002) Prevalence
of food allergies in young adults and their relationship to asthma, nasal allergies, and
eczema. Ann Allergy Asthma Immunol, 88, 183-9.

Stevens 2009
250
______________________________________________________________________
World Health Organisation (2009). Chronic respiratory diseases, Asthma: Definition.
http://www.who.int/respiratory/asthma/definition/en/
Xiao, W., Hsu, Y. P., Ishizaka, A., Kirikae, T. & Moss, R. B. (2005) Sputum
cathelicidin, urokinase plasminogen activation system components, and cytokines
discriminate cystic fibrosis, COPD, and asthma inflammation. Chest, 128, 2316-26.
Yoshihara, S., Yamada, Y., Abe, T., Linden, A. & Arisaka, O. (2006) Association of
epithelial damage and signs of neutrophil mobilization in the airways during acute
exacerbations of paediatric asthma. Clin Exp Immunol, 144, 212-6.
Zahm, J. M., Chevillard, M. & Puchelle, E. (1991) Wound repair of human surface
respiratory epithelium. Am J Respir Cell Mol Biol, 5, 242-8.
Zeiger, R. S., Dawson, C. & Weiss, S. (1999) Relationships between duration of asthma
and asthma severity among children in the Childhood Asthma Management Program
(CAMP). J Allergy Clin Immunol, 103, 376-87.

Stevens 2009
251
______________________________________________________________________
Appendix
A: Ethics

Stevens 2009
252
______________________________________________________________________

Stevens 2009
253
______________________________________________________________________
B: Asthma Questionnaire
QUESTIONNAIRE
A. WHEEZE & ASTHMA
1. Has your child ever had wheezing or whistling in the chest Yes at any time in the past? No
IF YOU HAVE ANSWERED “NO” PLEASE SKIP TO QUESTION 13
2. If yes what age was your child when you first heard wheeze?
3. Has you child had wheezing or whistling in the chest Yes in the last 12 months? No
4. If your child wheezed in the past but not in the last 12 months what age did the wheezing stop?
5. How many attacks of wheezing has you child had None in the last 12 months? 1 to 3
4 to 12
> 12

Stevens 2009
254
______________________________________________________________________
6. In the last 12 months, how often, on average, has your child’s sleep been disturbed due to wheezing?
Never woken with wheezing
Less than one night per week
One or more nights per week
7. In the last 12 months, has wheezing ever been severe enough to limit your child’s speech to only one or two words Yes
at a time between breaths? No
8. In the last 12 months, has your child’s chest sounded wheezy Yes during or after exercise? No
9. In the last 12 months, has your child had wheeze Yes not associated with a cold or chest infection? No
10. In the last 12 months, has your child ever had a dry cough at night, Yes apart from a cough associated with a cold or chest infection? No
11. How many attacks of wheezing did your child have 1 to 3 prior to the last 12 months? 4 to 12
> 12
12. Prior to the last 12 months, has your child had wheeze Yes

Stevens 2009
255
______________________________________________________________________
not associated with a cold or chest infection? No
13. Has your child ever had asthma? Yes No
14. Was this diagnosed by a doctor? Yes No
15. If yes what age was asthma first diagnosed?
16. If the asthma has stopped what age did it stop?
17. Has your child ever taken asthma medication? Yes Medication: _____________________________________ No
18. Has your child taken asthma medication in the last 3 months? Yes Medication: _____________________________________ No
19. Is you child currently on asthma medication? Yes Medication: No
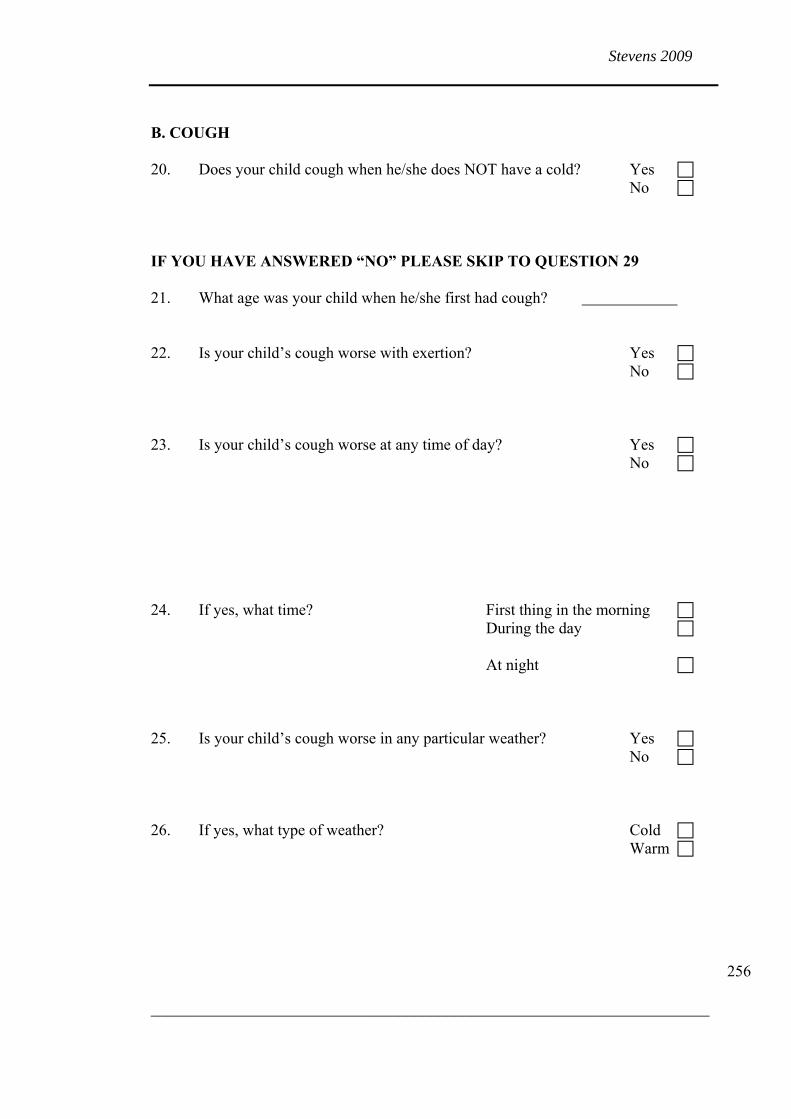
Stevens 2009
256
______________________________________________________________________
B. COUGH
20. Does your child cough when he/she does NOT have a cold? Yes No
IF YOU HAVE ANSWERED “NO” PLEASE SKIP TO QUESTION 29
21. What age was your child when he/she first had cough?
22. Is your child’s cough worse with exertion? Yes No
23. Is your child’s cough worse at any time of day? Yes No
24. If yes, what time? First thing in the morning During the day
At night
25. Is your child’s cough worse in any particular weather? Yes No
26. If yes, what type of weather? Cold Warm

Stevens 2009
257
______________________________________________________________________
27. Is this cough accompanied by a rattle? Always Sometimes
Never
28. Is this cough accompanied by phlegm? Always Sometimes
Never
29. Did your child have problems with cough WITHOUT Yes colds at any time in the past? No
30. If yes, what age was your child when he/she first had cough?
31. What age was your child when cough ceased to be a problem?
C. HAYFEVER
32. Has your child ever had a problem with sneezing, or a runny, Yes or blocked nose when he/she did not have a cold or the flu? No
33. In the past 12 months, has you child had a problem with sneezing, or a runny, or blocked nose when he/she did not Yes
have a cold or the flu? No

Stevens 2009
258
______________________________________________________________________
IF YOU HAVE ANSWERED “NO” PLEASE SKIP TO QUESTION 37
34. In the past 12 months, has this nose problem been accompanied by itchy-watery eyes? Yes
No
35. In which of the past 12 months did this nose problem occur? (please tick any which apply)
January February March April
May June July August
September October Nov Dec
36. In the past 12 months, how much did the nose problem interfere with your child’s daily activities? Not at all
A little
A moderate amount
A lot
37. Has your child ever had hayfever? Yes No
38. Was this diagnosed by a doctor? Yes No
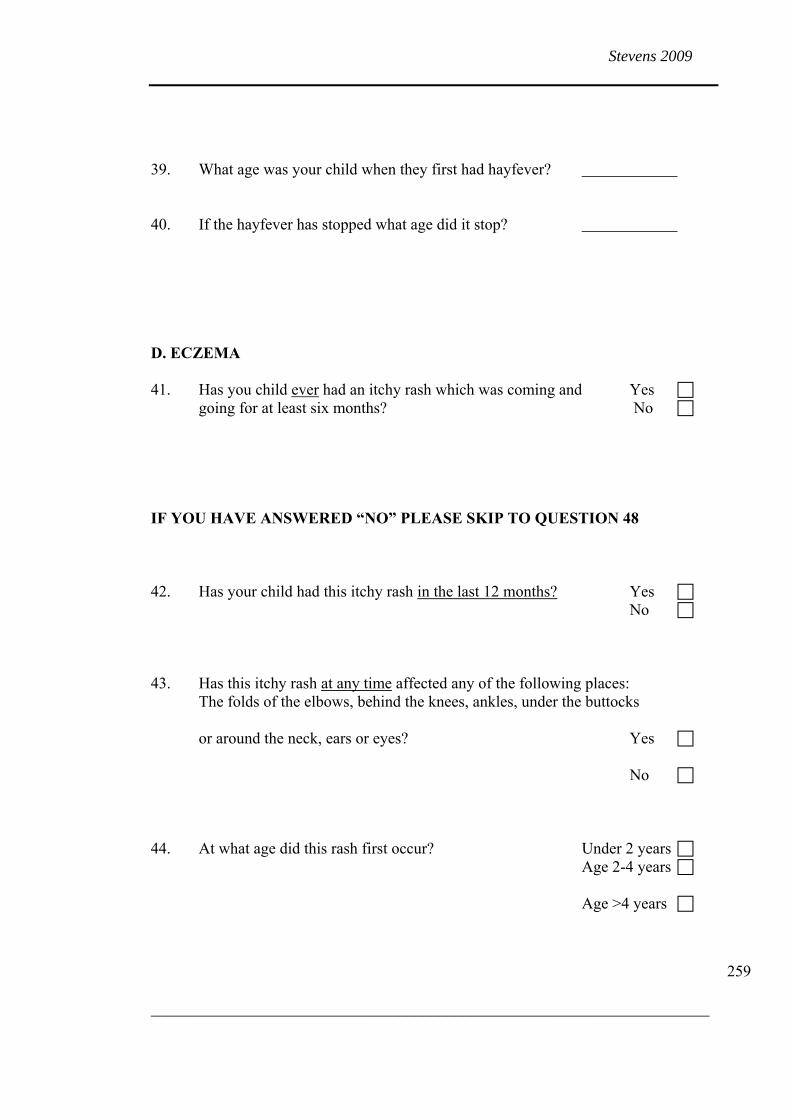
Stevens 2009
259
______________________________________________________________________
39. What age was your child when they first had hayfever?
40. If the hayfever has stopped what age did it stop?
D. ECZEMA
41. Has you child ever had an itchy rash which was coming and Yes going for at least six months? No
IF YOU HAVE ANSWERED “NO” PLEASE SKIP TO QUESTION 48
42. Has your child had this itchy rash in the last 12 months? Yes No
43. Has this itchy rash at any time affected any of the following places: The folds of the elbows, behind the knees, ankles, under the buttocks
or around the neck, ears or eyes? Yes
No
44. At what age did this rash first occur? Under 2 years Age 2-4 years
Age >4 years

Stevens 2009
260
______________________________________________________________________
45. If the rash has cleared, what age was your child when it cleared?
46. Has the rash cleared completely any time during the last 12 months? Yes No
47. In the last 12 months, how often , on average, has your child been kept awake by this itchy rash? Never woken
Less than one night per week
One or more nights per week
48. Has your child ever had eczema? Yes No
49. Was this diagnosed by a doctor? Yes No
E. FAMILY HISTORY
50. Family History: Hay fever Mother Father Sibling(s) Asthma Mother Father Sibling(s)
Eczema Mother Father Sibling(s)
51. If the mother has had asthma was this diagnosed by a doctor? Yes No
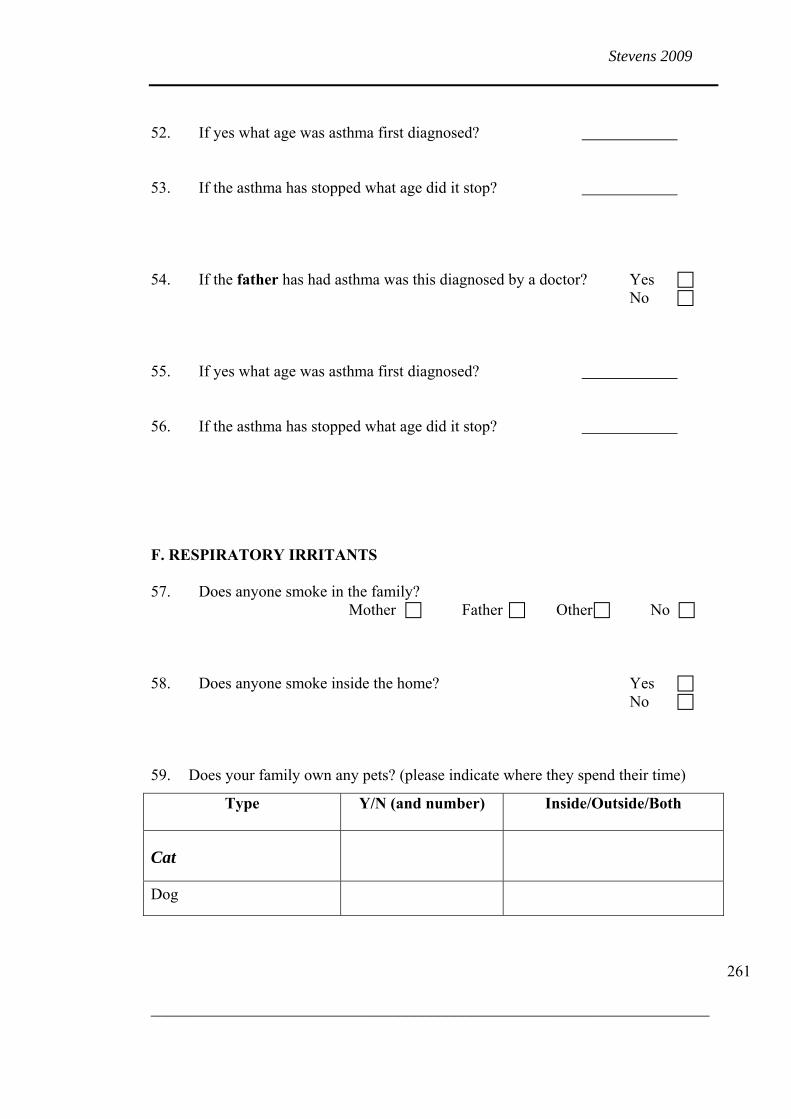
Stevens 2009
261
______________________________________________________________________
52. If yes what age was asthma first diagnosed?
53. If the asthma has stopped what age did it stop?
54. If the father has had asthma was this diagnosed by a doctor? Yes No
55. If yes what age was asthma first diagnosed?
56. If the asthma has stopped what age did it stop?
F. RESPIRATORY IRRITANTS
57. Does anyone smoke in the family? Mother Father Other No
58. Does anyone smoke inside the home? Yes No
59. Does your family own any pets? (please indicate where they spend their time)
Type Y/N (and number) Inside/Outside/Both
Cat
Dog

Stevens 2009
262
______________________________________________________________________
Bird
Rabbit
Guinea-pig
Other (please specify
Additional comments or information:
Related Documents

![Research Paper Deguelin Attenuates Allergic Airway ... · Research Paper Deguelin Attenuates Allergic Airway Inflammation via ... pathophysiology of asthma [4]. ... schematic diagram](https://static.cupdf.com/doc/110x72/5b396a827f8b9ab9068e82d4/research-paper-deguelin-attenuates-allergic-airway-research-paper-deguelin.jpg)