1 INCREASED LEVELS OF HYPOXIA-SENSITIVE PROTEINS IN ALLERGIC AIRWAY INFLAMMATION Ignacio Fajardo*° + , Linda Svensson # °, Anders Bucht #U and Gunnar Pejler* § *Swedish University of Agricultural Sciences, Department of Molecular Biosciences, The Biomedical Centre, Box 575, 751 23 Uppsala, Sweden # Department of Medical Countermeasures, FOI NBC Defence, SE-90182 Umeå, Sweden U Department of Respiratory Medicine and Allergy, University Hospital, Umeå, Sweden °Ignacio Fajardo and Linda Svensson contributed equally § Correspondence to: Gunnar Pejler, Swedish University of Agricultural Sciences, Department of Molecular Biosciences, The Biomedical Centre, Box 575, 751 23 Uppsala, Sweden. Tel: +46-18-4714090; Fax: +46-18-550762; E-mail: [email protected] + Present address: Dept of Molecular Biology and Biochemistry, Faculty of Sciences, University of Malaga, Campus de Teatinos s/n 29071 Malaga, Spain This work was funded by grants from the Swedish Medical Research Council, Vårdalstiftelsen, King Gustaf V's 80th anniversary Fund and the Swedish Ministry of Defence Running head: Proteomics of airway inflammation Descriptor number: 59 Word count: 3464 This article has an online data supplement, which is accessible from this issue's table of content online at www.atsjournals.org AJRCCM Articles in Press. Published on May 19, 2004 as doi:10.1164/rccm.200402-178OC Copyright (C) 2004 by the American Thoracic Society.

Welcome message from author
This document is posted to help you gain knowledge. Please leave a comment to let me know what you think about it! Share it to your friends and learn new things together.
Transcript
1
INCREASED LEVELS OF HYPOXIA-SENSITIVE PROTEINS IN ALLERGIC AIRWAY
INFLAMMATION
Ignacio Fajardo*°+, Linda Svensson#°, Anders Bucht#U and Gunnar Pejler*§
*Swedish University of Agricultural Sciences, Department of Molecular Biosciences, The
Biomedical Centre, Box 575, 751 23 Uppsala, Sweden
#Department of Medical Countermeasures, FOI NBC Defence, SE-90182 Umeå, Sweden
UDepartment of Respiratory Medicine and Allergy, University Hospital, Umeå, Sweden
°Ignacio Fajardo and Linda Svensson contributed equally
§Correspondence to: Gunnar Pejler, Swedish University of Agricultural Sciences,
Department of Molecular Biosciences, The Biomedical Centre, Box 575, 751 23 Uppsala,
Sweden. Tel: +46-18-4714090; Fax: +46-18-550762; E-mail: [email protected]
+Present address: Dept of Molecular Biology and Biochemistry, Faculty of Sciences,
University of Malaga, Campus de Teatinos s/n 29071 Malaga, Spain
This work was funded by grants from the Swedish Medical Research Council,
Vårdalstiftelsen, King Gustaf V's 80th anniversary Fund and the Swedish Ministry of
Defence
Running head: Proteomics of airway inflammation
Descriptor number: 59
Word count: 3464
This article has an online data supplement, which is accessible from this issue's table of
content online at www.atsjournals.org
AJRCCM Articles in Press. Published on May 19, 2004 as doi:10.1164/rccm.200402-178OC
Copyright (C) 2004 by the American Thoracic Society.
2
ABSTRACT (word count: 170)
In this study we investigated the alterations in protein levels that are induced by allergic
eosinophilic lung inflammation. Lung tissue eosinophilia and sequestration of inflammatory
cells in airspaces was provoked by systemic sensitization with ovalbumin followed by
repeated inhalation challenge with aerosolized ovalbumin. Proteome alterations in lung
tissue and bronchoalveolar lavage fluid, respectively, were examined by 2-dimensional gel
electrophoresis followed by identification of proteins by mass spectrometry. Several proteins
were markedly increased in inflamed tissue. In particular, several proteins that are known to
be associated with hypoxia were elevated, e.g. glycolytic enzymes, glucose-regulated protein
78 kDa, prolyl-4-hydroxylase, peroxiredoxin 1 and arginase. Out of the identified proteins,
Ym2 displayed the most clear increase, present at high levels in animals with lung
eosinophilia, while being undetectable in controls. Further, the levels of cathepsin S were
markedly increased in inflamed tissue. Taken together, this study identifies a number of
marker proteins associated with the pathogenesis of allergic lung inflammation and indicates
a link between allergic airway inflammation and induction of hypoxia-related gene products.
3
INTRODUCTION
Allergic asthma is a chronic inflammatory disease involving a multitude of cell types, e.g. T-
cells, neutrophils, eosinophils and mast cells. The typical clinical features of asthma include
airway inflammation, bronchial hyperresponsiveness and airwall thickening due to structural
remodeling of the airway epithelium leading to obstruction of airflow (1). Although great
efforts have been made to identify the pathogenesis of human allergic airway disease, the
underlying mechanisms for the development of severe symptoms remain poorly defined. It
is now established that hypersensitivity for environmental allergens is to a high degree
hereditary determined (2), and several genes that may be associated with allergic asthma
have been identified, e.g. the genes encoding IgE, IL-4, IL-5, IL-13, CD14, TNF-a (2) and
ADAM33 (3). The incidence and prevalence of asthma is subject to a dramatic increase in
certain parts of the world. Thus, in order to cope with these difficulties there is a great need
for identifying proper targets for management of this disease.
In this study we have investigated the changes in protein expression patterns that occur in
lung tissue and airspaces following allergen challenge. We used a mouse model for allergic
lung inflammation where airway hypersensitivity was induced by sensitization and challenge
with ovalbumin (OVA). This model is widely used as a model for human allergic airway
disease, since the pathology observed in the model shares many features with the human
disease, e.g. activation of T-helper 2 cells leading to expression of IL-4, IL-5, IL-13 and a
systemic IgE response, resulting in eosinophilic airway inflammation and airway
hyperreactivity. However, it should be emphasized that despite these similarities between
the OVA-induced airway inflammation and human allergic asthma, it is controversial
4
whether other asthma-associated symptoms such as plasma exudation and eosinophil
degranulation are present in the experimental animal models (4, 5).
In order to investigate the changes in protein patterns that is accompanying an airway
inflammation we utilized an approach based on proteomic screening of protein levels.
Samples from lung tissue and from bronchoalveolar lavage fluid (BALF) were separated by
2-dimensional (2-D) gel electrophoresis and protein spots that showed a marked difference
in intensity between sensitized & challenged versus control animals were identified by mass
spectrometry. Several proteins were identified for which there was a clear increase during
the allergen-induced airway inflammation. Interestingly, many of the proteins that were
increased are known to be associated with hypoxia and cell stress, indicating a link between
allergen-induced airway inflammation and increases of hypoxia-related gene products.
Furthermore, a dramatic increase was seen for Ym2, a protein of unknown function that has
previously been reported to be dependent on CD4+ T cells and IL-4 or IL-13 signaling for
expression (6).
5
CONDENSED METHODS (496 words; for additional details, see online data supplement)
Animals (9-13 weeks old female C57BL/6 mice) were sensitized intraperitoneally with 200
µl ovalbumin (OVA)/aluminium hydroxide gel (alum) (1:3) on days 0 and 14. On days 30,
33 and 35, mice were challenged in the lungs by inhalation of aerosolized OVA for 30 min
as previously described (7). Three different control groups were used: mice receiving either
no treatment, only OVA-aerosol challenge (as above), or sensitization as above without
subsequent challenge. Mice were killed after the last aerosol challenge and bronchoalveolar
lavage (BAL) was performed. The BAL fluid (BALF) was centrifuged and the supernatants
were collected for the 2-D electrophoresis analysis. The cells were resuspended and total
leukocytes were counted. For determination of BALF eosinophils, cytospin slides were
prepared and stained with May-Grünwald Giemsa. The percentage of eosinophils was
determined by differential counts of 300 cells per slide using standard morphological
criteria. For histologic assessment of lung tissue eosinophils, the lungs were inflated with
0.3 ml of TissueTek OCT, diluted 1:3 in phosphate buffered saline, prior to excision and the
left lobe was dissected and covered with TissueTek OCT before freezing in liquid petroleum
gas. Frozen tissue was thereafter serially sectioned and mounted on superfrost slides.
Eosinophils were stained using the phenol red assay as described by Ain et al (8). Duplicate
sections per animal were examined from each group of five mice.
One-ml aliquots of BALF supernatants corresponding to five different animals (five controls
or five sensitized & challenged animals) were pooled, concentrated and stored at –80°C.
Immediately after the BAL, lungs were frozen in liquid nitrogen and stored at –80°C. For
6
extraction of proteins, the entire lungs were homogenized at 4°C in 350 µl of lysis buffer (50
mM Tris/HCl (pH 7.4) containing 1% Triton-X-100, 0.1% SDS and 1 mM EDTA).
Homogenates were centrifuged and supernatants were recovered and stored at –80°C. Four
hundred µg (BALF samples) or 750 µg (lung extract samples) of protein were applied to
nonlinear pH 3–10 immobilized pH gradient strips. Isoelectric focusing was performed and
strips were then equilibrated at room temperature for 15 min in SDS-equilibration buffer and
for another 15 min with SDS-equilibration buffer supplemented with 2.5% (w/v)
iodoacetamide. After equilibration, strips were applied to 10% SDS-PAGE gels.
Electrophoresis was carried out at 2.5 W per gel during the first 30 min followed by 17 W
per gel until complete. Gels were stained using the colloidal Coomassie procedure (9) and
were stored at 4°C in 25% ammonium sulfate. For gel-image analysis, gels were scanned at
high resolution and the PDQuest software was used for detection of qualitative and
quantitative alterations in protein spots. Spots of interest were analyzed by mass
spectrometry using either a Reflex IV MALDI-ToF or an Ultraflex MALDI-ToF/ToF mass
spectrometer. Protein identification was achieved by peptide mass fingerprinting of the
spectral data. Digestion of proteins in the spots, mass spectrometry and peptide mass
fingerprinting searches were performed by the Proteomics Resource Center, Uppsala
University. Gelatin zymography assays were performed as previously described (10).
7
RESULTS
Characteristics of the allergic airway inflammation
C57BL/6 mice were sensitized by i.p. injections of 10 µg OVA absorbed to alum adjuvant
and were thereafter challenged repeatedly with an aerosol of 10 mg/ml OVA. Eighteen hours
after the last aerosol challenge, BAL was performed and lungs were isolated and frozen,
followed by counting and morphological analysis of cells in BALF and lung tissue. In
control mice, receiving no other treatment than OVA aerosol, the number of total recovered
leukocytes in BALF was less than 300,000, with a predominance of alveolar macrophages
(>95%) and only a few eosinophils (Figure 1). We have previously shown that the cellular
composition in BALF taken from the other two control groups (non treated or only
sensitized) is similar to the composition in controls that were only challenged (7). In
contrast, BALF from sensitized and OVA-challenged mice showed a 10-fold increase in
total number of leukocytes and was composed of up to 80% eosinophils.
For histologic assessment of infiltrating eosinophils into the lung tissue, serial sections were
made and stained with phenol red. In lung tissue sections from sensitized and OVA
challenged mice, infiltrating eosinophils were concentrated in the perivascular regions and a
smaller number was found in the interstitial compartment of the peripheral alveoli. In control
mice only few eosinophils could be detected in the lung tissue (Figure EI; online data
supplement).
8
Proteomic analysis
Proteins were extracted from lung tissues and were separated by 2-D gel electrophoresis.
Samples from three different control- (either non-treated, only sensitized or challenged only)
and sensitized & challenged animals, respectively, were analyzed. The three different
samples from each group of animals produced virtually identical protein patterns after 2-D-
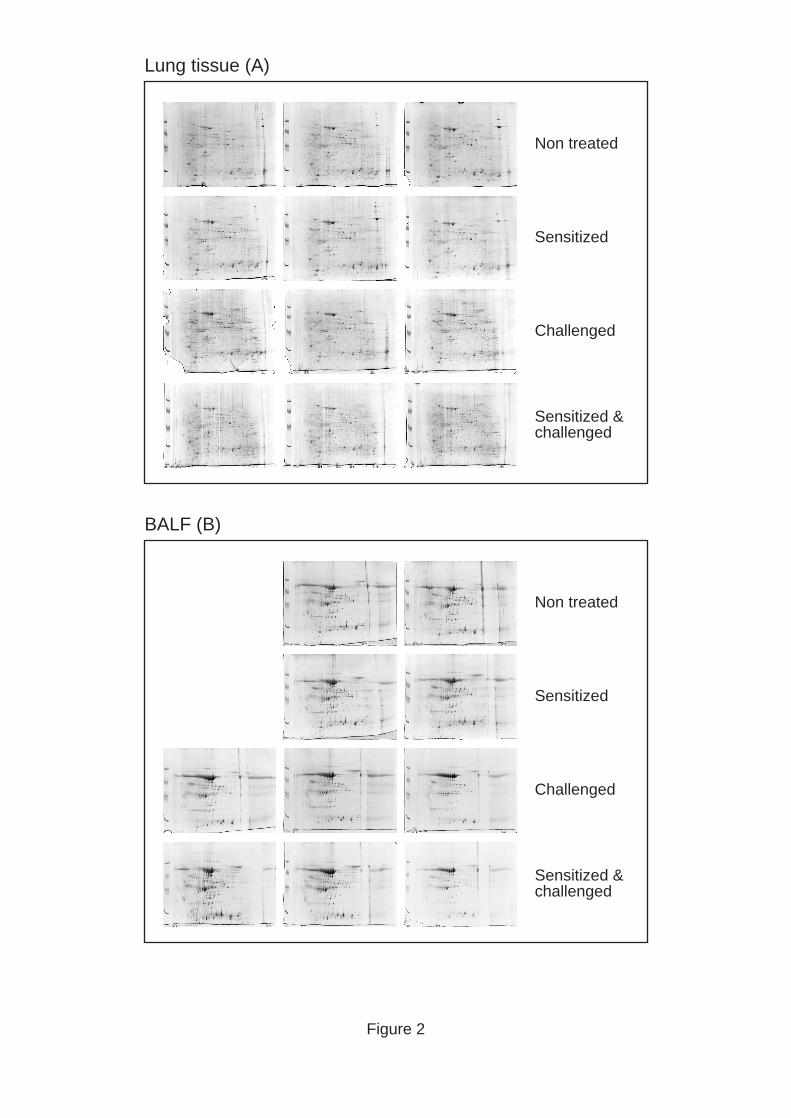
gel electrophoresis (Figure 2). Further, the protein patterns were essentially identical in
control animals that were either non-treated, only sensitized or only challenged (Figure 2).
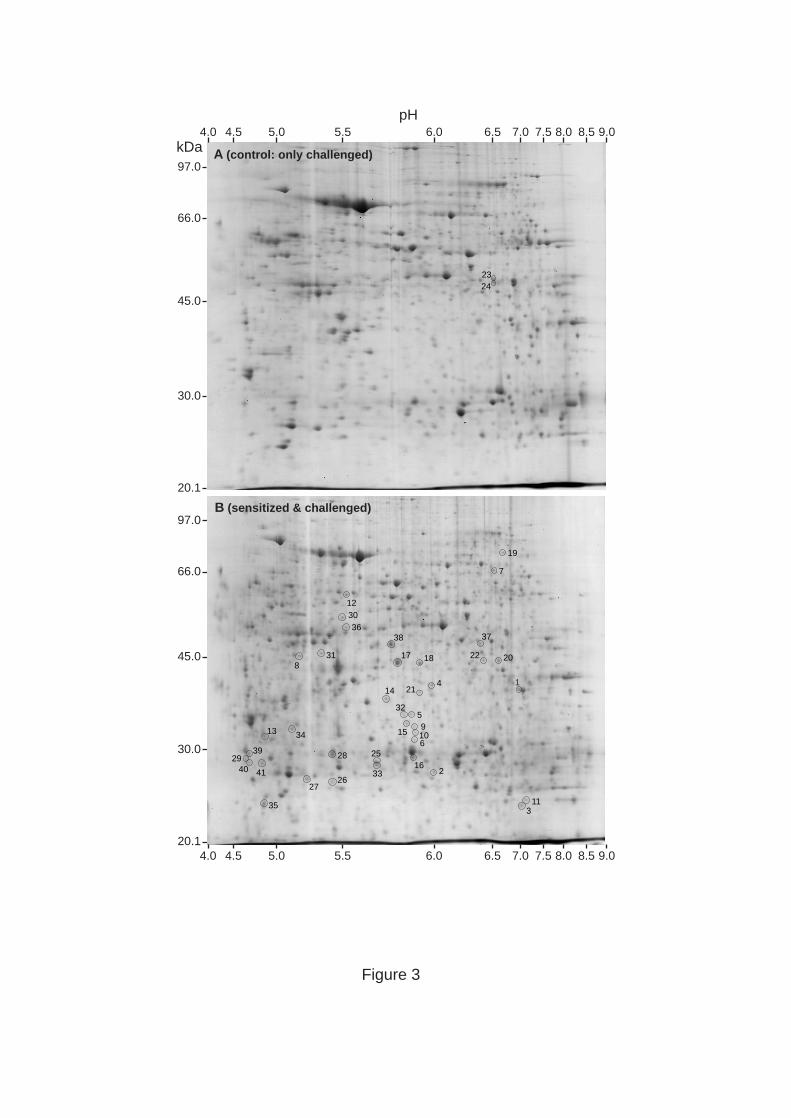
Representative enlarged gels are shown in Figure 3 (as control is shown a sample from a
mouse that had been challenged only). A number of protein spots exhibited a marked change
in intensity as a result of the induced lung inflammation, and were selected for identification
by mass spectrometry. In many cases, protein spots were clearly detectable in samples from
sensitized & challenged animals but were undetectable in samples from all three groups of
control animals (indicated by “+” in Table 1). In other cases, spots were detectable in
samples from both control- and sensitized & challenged animals, but showed a significantly
altered intensity (indicated by”·” for spots that are increased in inflamed tissue and “‚" for
spots that are decreased in inflamed tissue; the degree of increase/decrease when comparing
sensitized & challenged versus only challenged is indicated). In several cases, proteins were
identified by a fragment thereof, and in these cases it is thus possible that the allergic
conditions results in degradation of the respective protein rather than up-regulation of its
expression.
9
From Table 1 it is apparent that several of the proteins that were increased in inflammatory
lung tissue belong to the glycolytic pathway: aldolase, triose phosphate isomerase,
glyceraldehyde-3-phosphate dehydrogenase (GAPDH) and enolase. We also observed an
increase in the levels of transketolase, an enzyme that is involved in glucose metabolism,
although not being a part of the glycolytic pathway. There was also a clear increase in
proteins that are related to the metabolism of reactive oxygen species (ROS): selenium-
binding protein 1/2 and peroxiredoxin. Further, the b subunit of prolyl-4-hydroxylase, a
protein that is involved in collagen synthesis, was markedly elevated. Several of the spots
that were increased in intensity in inflamed tissue corresponded to the molecular chaperones,
glucose regulated protein 78 kDa (GRP78) and GRP58. We also detected increases in
fragments of intracellular structural proteins: tubulin, actin and myosin. A number of the
spots that were markedly increased in lung samples from sensitized & challenged animals
were identified as arginase, an enzyme for which up-regulated transcription has previously
been associated with allergic airway inflammation (11). Further, the mature form of
cathepsin S was detected in inflamed- but not control tissue. Out of the identified proteins,
Ym2 was most dramatically increased as a consequence of induced airway inflammation.
Ym2 was undetectable in control lung tissue while being one of the dominating proteins in
lungs taken from sensitized & challenged animals. We also noted an increase in the level of
various fragments of serum albumin in inflamed tissue.
Analysis of the BALFs revealed that the protein content was enhanced ~3-fold as a
consequence of airway inflammation. The increase in protein content of the BALF could be
due to either increased plasma extravasation into alveoli or be a result of protein secretion by
10
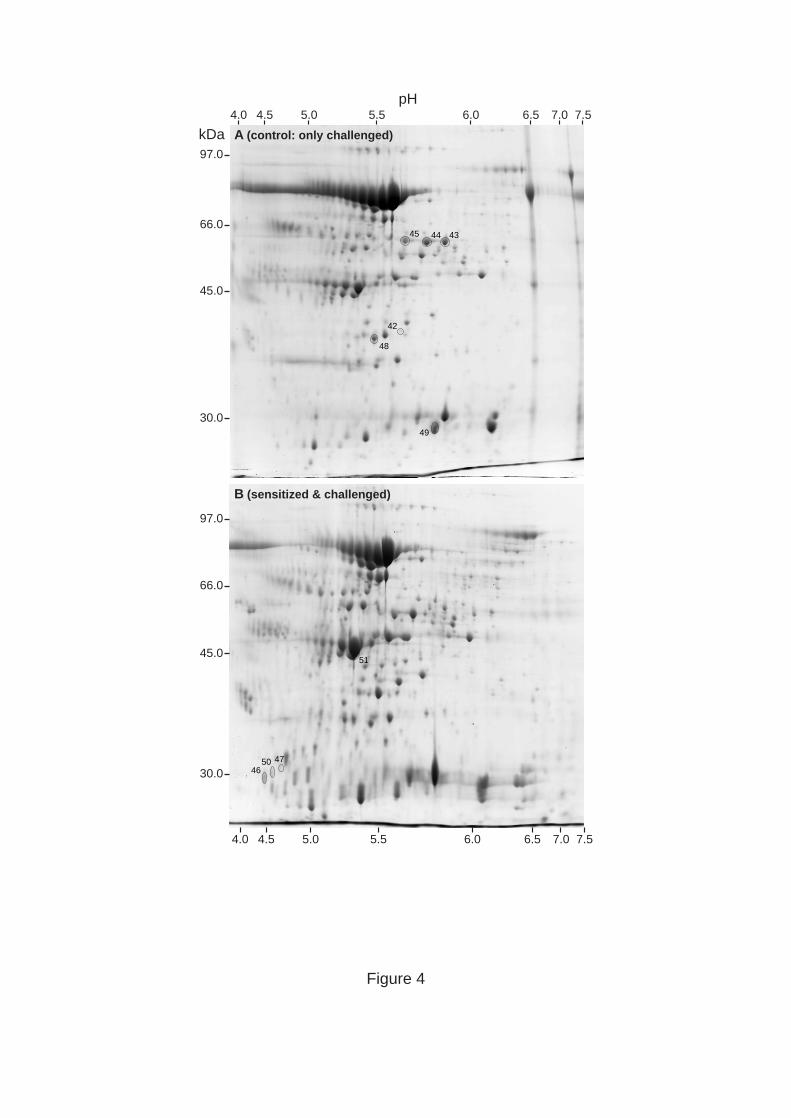
the cells that are recruited to the inflammatory site. The BALF were subjected to 2-D-gel
electrophoresis (Figure 4), followed by analysis as described for lung tissue samples. Two of
the protein spots that were increased in intensity in BALF from sensitized & challenged
animals corresponded to different fragments of serum albumin, indicating increased
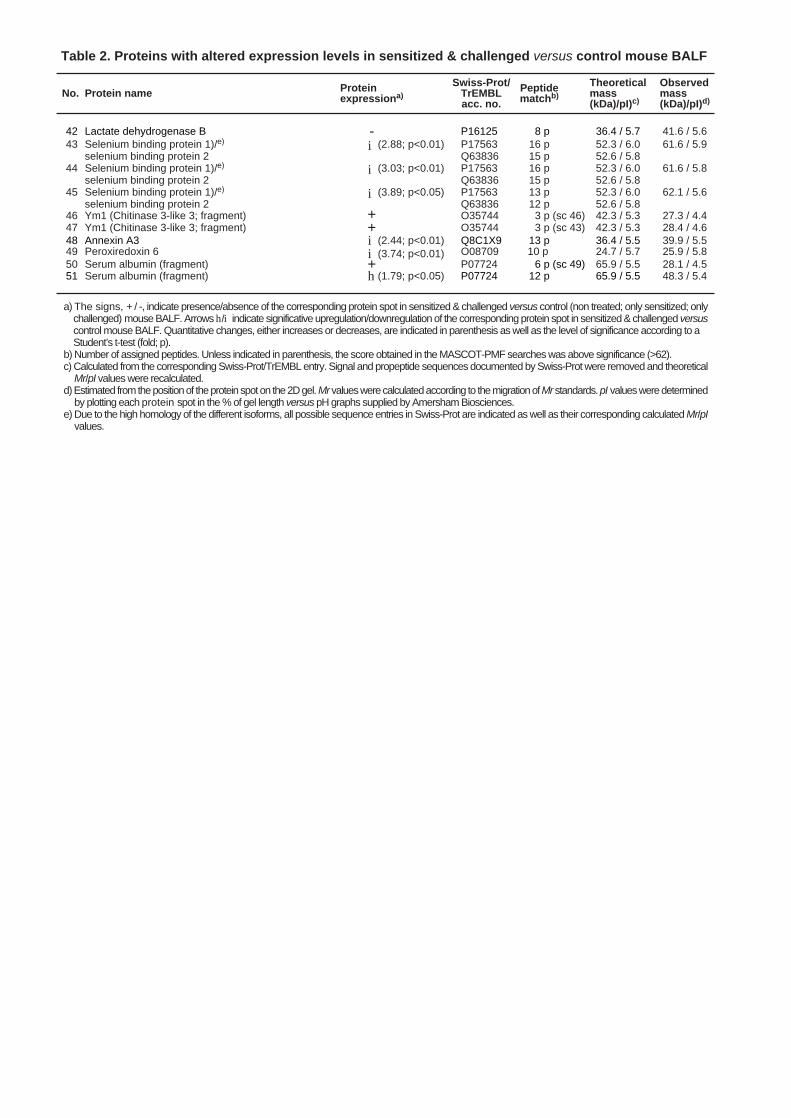
proteolytic degradation of extravasated plasma proteins (Table 2). Thus, to investigate if the
induction of airway inflammation was accompanied by enhanced levels of proteolytic
activity, BALF samples were analyzed by gelatin zymography. Indeed, the level of gelatin-
degrading proteases, in particular a protease with a molecular weight matching that of matrix
metalloprotease 2 (MMP-2), was considerably higher in inflammatory- than in control (only
challenged) BALF (Figure 5). Noteworthy, the observed increase in the levels of MMPs is
consistent with a previous report in which increases in both MMP-2 and MMP-9 were
observed during airway inflammation (12).
BALF from inflammatory conditions contained Ym1 (absent in controls), although the score
for identification of Ym1 was slightly below the threshold for significance. Further, reduced
levels of selenium binding protein 1/2, annexin A3 and peroxiredoxin 6 were observed in
BALF recovered from the sensitized & challenged mice as compared with controls (Table
2).
11
DISCUSSION
The present study was undertaken in order to identify alterations in the lung proteome that
are caused by hypersensitivity responses in airways. Using an unbiased approach based on
proteomic analysis we have identified a number of proteins that were markedly increased
during the airway inflammation. Interestingly, many of these proteins (see below) have
previously been linked to hypoxia, thus raising the possibility that the allergic lung
inflammation induced may be accompanied by induction of hypoxia-sensitive genes.
Hypoxia is known to induce large changes in gene expression (13) and these changes are
thought to be mainly regulated by hypoxia inducible factor 1 (HIF-1), which during hypoxia
is activated and binds to hypoxia-responsive elements in target genes (14-16). We may
therefore hypothesize that HIF-1 activation accompanies allergic lung inflammation,
although further studies will be required to establish a definitive connection between this
type of disease, hypoxia and HIF-1-mediated gene expression.
If there is a limited supply of oxygen, the cell is dependent on the glycolytic pathway for
anaerobic ATP production and, consequently, many of the glycolytic enzymes are up-
regulated during hypoxia (17-20). It is apparent from Table 1 that the levels of a number of
glycolytic enzymes are increased during the airway inflammation: enolase, aldolase, triose
phosphate isomerase and GAPDH. Indeed, HIF-binding sequences have previously been
identified in the genes for these enzymes (17-20), and it is thus possible that the increased
levels of these gene products is a result of HIF-1 activation that may accompany the
inflammatory reaction. We also observed that the allergic inflammation results in increases
12
in transketolase, an enzyme that previously has been suggested to be up-regulated by
hypoxia (21).
In inflamed lung tissue, we noted increased levels of the b-subunit of prolyl-4-hydroxylase,
an enzyme involved in collagen synthesis. Connective tissue remodeling is a typical feature
of asthma, a condition that often is associated with increased collagen synthesis resulting in
thickening and increased density of the subepithelial basement membrane (22). It is thus
possible that the deposit of interstitial collagen that occurs during allergic asthma may be
associated with an up-regulated expression of prolyl-4-hydroxylase. It is also of interest to
note that an induced expression of the a subunit of prolyl-4-hydroxylase (I) has been
described under hypoxic conditions (23).
If oxygen is scarce, electrons that are normally donated to the electron transport chain may
instead be donated directly to oxygen, forming ROS. In line with this notion, we identified
ROS-metabolizing proteins in inflamed lung tissue. One of the major enzymes involved in
the scavenging of ROS is glutathione peroxidase, a selenium-dependent enzyme. Possibly,
the changes in the levels of selenium binding protein 1/2, both in lung tissue and in BALF,
may thus be related to an altered ROS metabolism during the airway inflammation. Further,
peroxiredoxin 1, an enzyme that detoxifies hydrogen peroxides, was markedly increased in
inflammatory lung tissue. Notably, a link between peroxiredoxin and hypoxic conditions has
been suggested previously (24). Many of the identified protein spots that were increased in
intensity upon induction of airway inflammation corresponded to GRP78/58. GRP78/58 are
13
molecular chaperones that show up-regulations under different conditions associated with
stress, e.g. hypoxia (25, 26).
A marked increase in Ym2 was observed due to the allergic airway inflammation. The
biological function of this protein is unknown, although it has been suggested that Ym2 may
play a role in the airway wall thickening that is associated with the pathology of allergic
lung disease (6). Previous studies have shown that Ym1, a closely related protein, has
heparin-binding properties (27) but it is not certain whether binding to heparin or similar
glycosaminoglycans is relevant for its function in vivo. Ym1 is known to be expressed by
macrophages, in a T helper 2-dependent manner (28), and it has been shown that Ym1
displays a marked tendency to form crystals in tissues (27, 29). Induced expression of
Ym1/2 during allergic airway inflammation is also supported by a previous study (6).
Advanced glycosylation end product-specific receptor (RAGE) was markedly reduced in
inflammatory lung tissue. RAGE is a receptor for the glycated proteins that are formed at
high blood glucose levels (30). The reason for its decrease during airway inflammation is
not clear. However, we may hypothesize that an altered glucose metabolism affects plasma
protein glycation and that this, in turn, may affect the receptor for this group of proteins.
Further, it has recently been demonstrated that the expression of RAGE is influenced by
hypoxia (31). NO is currently widely accepted as a major marker for steroid sensitive
asthma. The production of NO from L-arginine is regulated by arginase and arginase has
recently gained a large interest in the context of airway disease, due to the finding that
arginase transcription is markedly up-regulated in mouse models for asthma (11). The
14
findings reported here thus provide further support for an induced expression of arginase
during allergic airway inflammation. Interestingly, arginase expression in macrophages has
been found to be up-regulated by hypoxia (32).
The increase in cathepsin S observed in allergen challenged animals may be related to the
actual immune response. Cathepsin S is a lysosomal cysteine protease that is involved in
antigen presentation (33). In fact, it has been shown that inhibition of cathepsin S results in
an impaired immune response to the specific allergen used in this study, i.e. OVA (34).
Several spots corresponding to fragments of actin proteins, tubulin beta-5 chain and non-
muscle heavy chain myosin were identified in allergen sensitized & challenged tissue. Using
a similar approach to ours, Houtman et al recently reported that actin and other cytoskeletal
proteins were up-regulated in nonallergic asthma (35). It thus appears that cytoskeletal
changes occur in both mouse models of IgE-mediated and nonatopic asthma, suggesting that
the type of sensitization of the immune system is not a major determinant for this effect.
Instead, it is more likely that the induction of these proteins indicates alterations in
endothelial barrier function or, alternatively, changes of cell morphology and motility
associated with smooth muscle contraction.
An important issue regards the cellular source of the proteins that are increased due to the
allergic lung inflammation. Clearly, some of the proteins identified, e.g. Ym2 and cathepsin
S, may arise from inflammatory cells infiltrating the lung tissue (e.g. eosinophils; see Fig EI,
online data supplement), whereas others, such as the glycolytic enzymes, may be derived
from resident cells. In the latter case, the protein expression pattern may have been
15
influenced by the inflammatory conditions. Another important aspect is the apparent lack of
identified spots for classical markers of allergic inflammation such as the cytokines, IL-5,
IL-4 and IL-13. Most likely however, the failure to detect such cytokines lies within the
limited sensitivity of the methodology employed, combined with low expression levels.
In summary, the present study identifies a number of marker proteins for allergic airway
inflammation. Some of the identified proteins, e.g. arginase and Ym2, have previously been
linked to this type of disease although the nature of their contribution to disease
development is not fully understood. In addition, we here identify several marker proteins
for which a link to allergic airway inflammation has, to our knowledge, not been recognized
previously. An important and obvious question is whether any of these marker proteins
could constitute potential drug targets. Probably, interfering with prolyl-4-hydroxylase or
cathepsin S could have beneficial effects by reducing collagen deposition and by interfering
with antigen presentation, respectively. However, it is clear that future work is required to
determine the contribution to the disease pathogenesis by each of the different proteins that
were increased in airway inflammation.

16
ACKNOWLEDGEMENTS
The mass spectrometry analyses were performed by the Proteomics Resource Center at
Uppsala University, sponsored by The Wallenberg Consortium North.
We thank Jens Forsberg (Proteomics Resource Center) for helpful discussions.
17
REFERENCES
1. Lemanske RF, Jr., Busse WW. 6. Asthma. J Allergy Clin Immunol
2003;111:S502-19.
2. Cookson WO. Asthma genetics. Chest 2002;121:7S-13S.
3. Van Eerdewegh P, Little RD, Dupuis J, Del Mastro RG, Falls K, Simon J, Torrey
D, Pandit S, McKenny J, Braunschweiger K, Walsh A, Liu Z, Hayward B, Folz C,
Manning SP, Bawa A, Saracino L, Thackston M, Benchekroun Y, Capparell N,
Wang M, Adair R, Feng Y, Dubois J, FitzGerald MG, Huang H, Gibson R, Allen
KM, Pedan A, Danzig MR, Umland SP, Egan RW, Cuss FM, Rorke S, Clough
JB, Holloway JW, Holgate ST, Keith TP. Association of the ADAM33 gene with
asthma and bronchial hyperresponsiveness. Nature 2002;418:426-30.
4. Gelfand EW. Pro: mice are a good model of human airway disease. Am J Respir
Crit Care Med 2002;166:5-6; discussion 7-8.
5. Persson CG. Con: mice are not a good model of human airway disease. Am J
Respir Crit Care Med 2002;166:6-7; discussion 8.
6. Webb DC, McKenzie AN, Foster PS. Expression of the Ym2 lectin-binding
protein is dependent on interleukin (IL)-4 and IL-13 signal transduction:
identification of a novel allergy-associated protein. J Biol Chem 2001;276:41969-
76.
7. Svensson L, Lilliehook B, Larsson R, Bucht A. gammadelta T cells contribute to
the systemic immunoglobulin E response and local B-cell reactivity in allergic
eosinophilic airway inflammation. Immunology 2003;108:98-108.
18
8. Ain R, Tash JS, Soares MJ. A simple method for the in situ detection of
eosinophils. J Immunol Methods 2002;260:273-8.
9. Neuhoff V, Arold N, Taube D, Ehrhardt W. Improved staining of proteins in
polyacrylamide gels including isoelectric focusing gels with clear background at
nanogram sensitivity using Coomassie Brilliant Blue G-250 and R-250.
Electrophoresis 1988;9:255-262.
10. Fajardo I, Quesada AR, Nunez de Castro I, Sanchez-Jimenez F, Medina MA. A
comparative study of the effects of genistein and 2-methoxyestradiol on the
proteolytic balance and tumour cell proliferation. Br J Cancer 1999;80:17-24.
11. Zimmermann N, King NE, Laporte J, Yang M, Mishra A, Pope SM, Muntel EE,
Witte DP, Pegg AA, Foster PS, Hamid Q, Rothenberg ME. Dissection of
experimental asthma with DNA microarray analysis identifies arginase in asthma
pathogenesis. J Clin Invest 2003;111:1863-74.
12. Kumagai K, Ohno I, Okada S, Ohkawara Y, Suzuki K, Shinya T, Nagase H, Iwata
K, Shirato K. Inhibition of matrix metalloproteinases prevents allergen-induced
airway inflammation in a murine model of asthma. J Immunol 1999;162:4212-9.
13. Bunn HF, Poyton RO. Oxygen sensing and molecular adaptation to hypoxia.
Physiol Rev 1996;76:839-85.
14. Semenza GL. HIF-1, O(2), and the 3 PHDs: how animal cells signal hypoxia to
the nucleus. Cell 2001;107:1-3.
15. Bruick RK. Oxygen sensing in the hypoxic response pathway: regulation of the
hypoxia-inducible transcription factor. Genes Dev 2003;17:2614-23.
19
16. Shih SC, Claffey KP. Hypoxia-mediated regulation of gene expression in
mammalian cells. Int J Exp Pathol 1998;79:347-57.
17. Semenza GL, Roth PH, Fang HM, Wang GL. Transcriptional regulation of genes
encoding glycolytic enzymes by hypoxia-inducible factor 1. J Biol Chem
1994;269:23757-63.
18. Roland I, Minet E, Ernest I, Pascal T, Michel G, Remacle J, Michiels C.
Identification of hypoxia-responsive messengers expressed in human
microvascular endothelial cells using differential display RT-PCR. Eur J Biochem
2000;267:3567-74.
19. Niitsu Y, Hori O, Yamaguchi A, Bando Y, Ozawa K, Tamatani M, Ogawa S,
Tohyama M. Exposure of cultured primary rat astrocytes to hypoxia results in
intracellular glucose depletion and induction of glycolytic enzymes. Brain Res
Mol Brain Res 1999;74:26-34.
20. Graven KK, Troxler RF, Kornfeld H, Panchenko MV, Farber HW. Regulation of
endothelial cell glyceraldehyde-3-phosphate dehydrogenase expression by
hypoxia. J Biol Chem 1994;269:24446-53.
21. Zanozdra MM, Khmelevs'kii Iu V. [Activity of enzymes of tricarboxylic and
pentose-phosphate cycles in dog brain with myocardial infarction]. Ukr Biokhim
Zh 1977;49:51-4.
22. Holgate ST, Davies DE, Lackie PM, Wilson SJ, Puddicombe SM, Lordan JL.
Epithelial-mesenchymal interactions in the pathogenesis of asthma. J Allergy Clin
Immunol 2000;105:193-204.
20
23. Takahashi Y, Takahashi S, Shiga Y, Yoshimi T, Miura T. Hypoxic induction of
prolyl 4-hydroxylase alpha (I) in cultured cells. J Biol Chem 2000;275:14139-46.
24. Nonn L, Berggren M, Powis G. Increased expression of mitochondrial
peroxiredoxin-3 (thioredoxin peroxidase-2) protects cancer cells against hypoxia
and drug-induced hydrogen peroxide-dependent apoptosis. Mol Cancer Res
2003;1:682-9.
25. Song MS, Park YK, Lee JH, Park K. Induction of glucose-regulated protein 78 by
chronic hypoxia in human gastric tumor cells through a protein kinase C-
epsilon/ERK/AP-1 signaling cascade. Cancer Res 2001;61:8322-30.
26. Lee AS. The glucose-regulated proteins: stress induction and clinical applications.
Trends Biochem Sci 2001;26:504-10.
27. Chang NC, Hung SI, Hwa KY, Kato I, Chen JE, Liu CH, Chang AC. A
macrophage protein, Ym1, transiently expressed during inflammation is a novel
mammalian lectin. J Biol Chem 2001;276:17497-506.
28. Nair MG, Cochrane DW, Allen JE. Macrophages in chronic type 2 inflammation
have a novel phenotype characterized by the abundant expression of Ym1 and
Fizz1 that can be partly replicated in vitro. Immunol Lett 2003;85:173-80.
29. Harbord M, Novelli M, Canas B, Power D, Davis C, Godovac-Zimmermann J,
Roes J, Segal AW. Ym1 is a neutrophil granule protein that crystallizes in
p47phox-deficient mice. J Biol Chem 2002;277:5468-75.
30. Wautier JL, Guillausseau PJ. Advanced glycation end products, their receptors
and diabetic angiopathy. Diabetes Metab 2001;27:535-42.
21
31. Ma L, Carter RJ, Morton AJ, Nicholson LF. RAGE is expressed in pyramidal
cells of the hippocampus following moderate hypoxic-ischemic brain injury in
rats. Brain Res 2003;966:167-74.
32. Louis CA, Reichner JS, Henry WL, Jr., Mastrofrancesco B, Gotoh T, Mori M,
Albina JE. Distinct arginase isoforms expressed in primary and transformed
macrophages: regulation by oxygen tension. Am J Physiol 1998;274:R775-82.
33. Riese RJ, Wolf PR, Bromme D, Natkin LR, Villadangos JA, Ploegh HL,
Chapman HA. Essential role for cathepsin S in MHC class II-associated invariant
chain processing and peptide loading. Immunity 1996;4:357-66.
34. Riese RJ, Mitchell RN, Villadangos JA, Shi GP, Palmer JT, Karp ER, De Sanctis
GT, Ploegh HL, Chapman HA. Cathepsin S activity regulates antigen presentation
and immunity. J Clin Invest 1998;101:2351-63.
35. Houtman R, Krijgsveld J, Kool M, Romijn EP, Redegeld FA, Nijkamp FP, Heck
AJ, Humphery-Smith I. Lung proteome alterations in a mouse model for
nonallergic asthma. Proteomics 2003;3:2008-18.
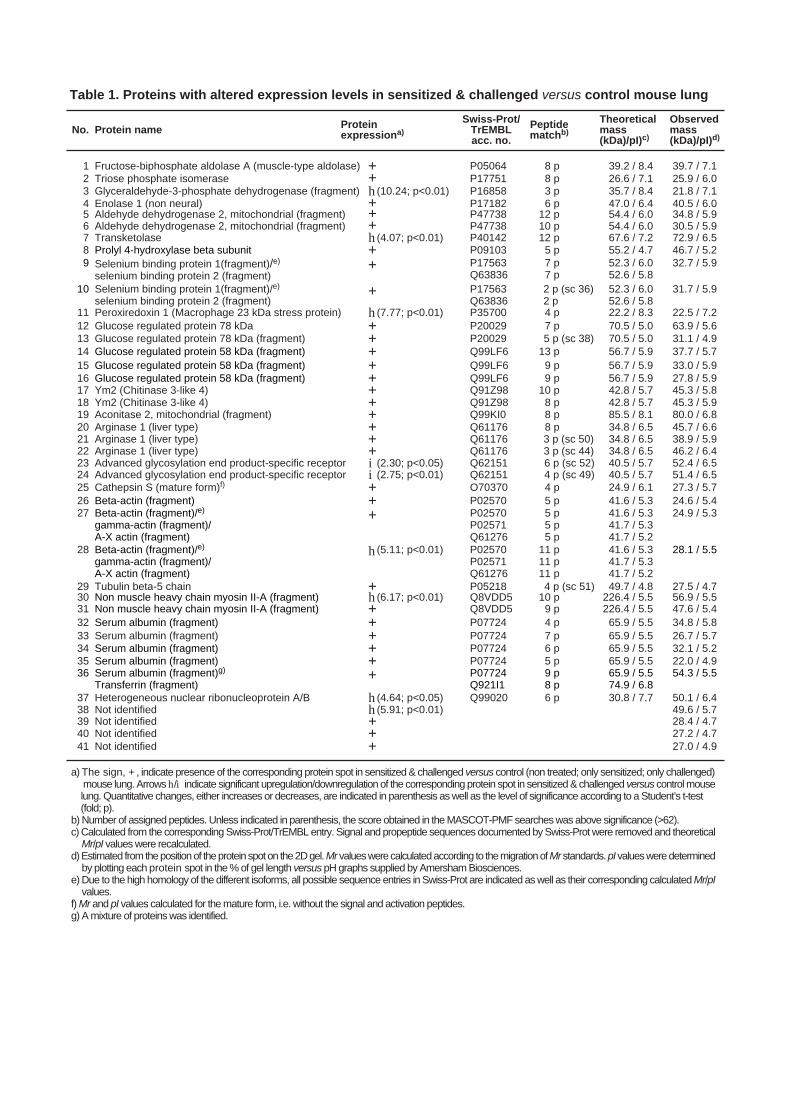
Table 1. Proteins with altered expression levels in sensitized & challenged versus control mouse lung
a) The sign, + , indicate presence of the corresponding protein spot in sensitized & challenged versus control (non treated; only sensitized; only challenged) mouse lung. Arrows h/i indicate significant upregulation/downregulation of the corresponding protein spot in sensitized & challenged versus control mouselung. Quantitative changes, either increases or decreases, are indicated in parenthesis as well as the level of significance according to a Student’s t-test(fold; p).
b) Number of assigned peptides. Unless indicated in parenthesis, the score obtained in the MASCOT-PMF searches was above significance (>62).c) Calculated from the corresponding Swiss-Prot/TrEMBL entry. Signal and propeptide sequences documented by Swiss-Prot were removed and theoretical
Mr/pI values were recalculated.d) Estimated from the position of the protein spot on the 2D gel. Mr values were calculated according to the migration of Mr standards. pI values were determined
by plotting each protein spot in the % of gel length versus pH graphs supplied by Amersham Biosciences.e) Due to the high homology of the different isoforms, all possible sequence entries in Swiss-Prot are indicated as well as their corresponding calculated Mr/pI
values.f) Mr and pI values calculated for the mature form, i.e. without the signal and activation peptides.g) A mixture of proteins was identified.
No. Protein name Proteinexpressiona)
Swiss-Prot/TrEMBLacc. no.
Theoreticalmass(kDa)/pI)c)
Observedmass(kDa)/pI)d)
Peptidematchb)
1 Fructose-biphosphate aldolase A (muscle-type aldolase) +2 Triose phosphate isomerase +3 Glyceraldehyde-3-phosphate dehydrogenase (fragment) (10.24; p<0.01)4 Enolase 1 (non neural) +5 Aldehyde dehydrogenase 2, mitochondrial (fragment) +6 Aldehyde dehydrogenase 2, mitochondrial (fragment) +7 Transketolase (4.07; p<0.01)8 Prolyl 4-hydroxylase beta subunit +9 Selenium binding protein 1(fragment)/e)
selenium binding protein 2 (fragment)+
10 2 p (sc 36)2 p
+Selenium binding protein 1(fragment)/e)
selenium binding protein 2 (fragment)11 Peroxiredoxin 1 (Macrophage 23 kDa stress protein) (7.77; p<0.01)12 Glucose regulated protein 78 kDa +13 Glucose regulated protein 78 kDa (fragment) 5 p (sc 38)+14 Glucose regulated protein 58 kDa (fragment) +15 Glucose regulated protein 58 kDa (fragment) +16 Glucose regulated protein 58 kDa (fragment) +17 Ym2 (Chitinase 3-like 4)18 Ym2 (Chitinase 3-like 4)
++
19 Aconitase 2, mitochondrial (fragment) +20 Arginase 1 (liver type)21 Arginase 1 (liver type) 3 p (sc 50)
++
22 Arginase 1 (liver type) 3 p (sc 44)+
24 4 p (sc 49)Advanced glycosylation end product-specific receptor23 6 p (sc 52)Advanced glycosylation end product-specific receptor (2.30; p<0.05)
(2.75; p<0.01)25 Cathepsin S (mature form)f) +26 Beta-actin (fragment)27 Beta-actin (fragment)/e)
gamma-actin (fragment)/A-X actin (fragment)
++
28 Beta-actin (fragment)/e)
gamma-actin (fragment)/A-X actin (fragment)
(5.11; p<0.01)
29 Tubulin beta-5 chain 4 p (sc 51)+30 Non muscle heavy chain myosin II-A (fragment)31 Non muscle heavy chain myosin II-A (fragment) +
(6.17; p<0.01)
32 Serum albumin (fragment) +33 Serum albumin (fragment) +34 Serum albumin (fragment)35 Serum albumin (fragment)
++
36 Serum albumin (fragment)g)
Transferrin (fragment)+
37 Heterogeneous nuclear ribonucleoprotein A/B
P05064P17751P16858P17182P47738P47738P40142P09103P17563Q63836P17563Q63836P35700P20029P20029Q99LF6Q99LF6Q99LF6Q91Z98Q91Z98Q99KI0Q61176Q61176Q61176
Q62151Q62151
O70370
P02570P02571Q61276
P02570
P02570P02571Q61276P05218Q8VDD5Q8VDD5P07724P07724P07724P07724P07724Q921I1Q99020
8 p8 p3 p6 p
12 p10 p12 p
5 p7 p7 p
4 p7 p
13 p9 p9 p
10 p8 p8 p8 p
4 p
5 p5 p5 p
5 p
11 p11 p11 p
10 p9 p4 p7 p6 p5 p9 p8 p6 p
39.2 / 8.426.6 / 7.135.7 / 8.447.0 / 6.454.4 / 6.054.4 / 6.067.6 / 7.255.2 / 4.752.3 / 6.052.6 / 5.852.3 / 6.052.6 / 5.822.2 / 8.370.5 / 5.070.5 / 5.056.7 / 5.956.7 / 5.956.7 / 5.942.8 / 5.742.8 / 5.785.5 / 8.134.8 / 6.534.8 / 6.534.8 / 6.5
40.5 / 5.740.5 / 5.7
24.9 / 6.1
41.6 / 5.341.7 / 5.341.7 / 5.2
41.6 / 5.3
41.6 / 5.341.7 / 5.341.7 / 5.249.7 / 4.8
226.4 / 5.5226.4 / 5.5
65.9 / 5.565.9 / 5.565.9 / 5.565.9 / 5.565.9 / 5.574.9 / 6.830.8 / 7.7(4.64; p<0.05)
38 Not identified (5.91; p<0.01)39 Not identified40 Not identified41 Not identified
+++
39.7 / 7.125.9 / 6.021.8 / 7.1
34.8 / 5.930.5 / 5.972.9 / 6.546.7 / 5.232.7 / 5.9
31.7 / 5.9
22.5 / 7.263.9 / 5.631.1 / 4.937.7 / 5.733.0 / 5.927.8 / 5.945.3 / 5.845.3 / 5.980.0 / 6.845.7 / 6.638.9 / 5.946.2 / 6.4
51.4 / 6.552.4 / 6.5
27.3 / 5.724.6 / 5.424.9 / 5.3
28.1 / 5.5
27.5 / 4.756.9 / 5.547.6 / 5.434.8 / 5.826.7 / 5.732.1 / 5.222.0 / 4.954.3 / 5.5
50.1 / 6.449.6 / 5.728.4 / 4.727.2 / 4.727.0 / 4.9
40.5 / 6.0h
h
h
ii
h
h
hh
41.6 / 5.6Lactate dehydrogenase B 36.4 / 5.761.6 / 5.9Selenium binding protein 1)/e)
selenium binding protein 252.3 / 6.052.6 / 5.8
61.6 / 5.8Selenium binding protein 1)/e)
selenium binding protein 252.3 / 6.052.6 / 5.8
62.1 / 5.652.3 / 6.052.6 / 5.8
Selenium binding protein 1)/e)
selenium binding protein 2Ym1 (Chitinase 3-like 3; fragment) 42.3 / 5.3 27.3 / 4.4Ym1 (Chitinase 3-like 3; fragment) 42.3 / 5.3 28.4 / 4.6
39.9 / 5.536.4 / 5.5Annexin A3
Serum albumin (fragment) 65.9 / 5.5 28.1 / 4.5Serum albumin (fragment) 65.9 / 5.5 48.3 / 5.4
8 p16 p15 p16 p15 p13 p12 p
3 p (sc 46)3 p (sc 43)
13 p
6 p (sc 49)12 p
4243
44
45
464748
5051
No. Protein name Proteinexpressiona)
Swiss-Prot/TrEMBLacc. no.
Theoreticalmass(kDa)/pI)c)
Observedmass(kDa)/pI)d)
Peptidematchb)
h
i
i
i
i
a) The signs, + / -, indicate presence/absence of the corresponding protein spot in sensitized & challenged versus control (non treated; only sensitized; onlychallenged) mouse BALF. Arrows h/i indicate significative upregulation/downregulation of the corresponding protein spot in sensitized & challenged versuscontrol mouse BALF. Quantitative changes, either increases or decreases, are indicated in parenthesis as well as the level of significance according to aStudent’s t-test (fold; p).
b) Number of assigned peptides. Unless indicated in parenthesis, the score obtained in the MASCOT-PMF searches was above significance (>62).c) Calculated from the corresponding Swiss-Prot/TrEMBL entry. Signal and propeptide sequences documented by Swiss-Prot were removed and theoretical
Mr/pI values were recalculated.d) Estimated from the position of the protein spot on the 2D gel. Mr values were calculated according to the migration of Mr standards. pI values were determined
by plotting each protein spot in the % of gel length versus pH graphs supplied by Amersham Biosciences.e) Due to the high homology of the different isoforms, all possible sequence entries in Swiss-Prot are indicated as well as their corresponding calculated Mr/pI
values.
-(2.88; p<0.01)
(3.03; p<0.01)
(3.89; p<0.05)
++
(2.44; p<0.01)
+(1.79; p<0.05)
Peroxiredoxin 6 24.7 / 5.7 25.9 / 5.8
P16125P17563Q63836P17563Q63836P17563Q63836O35744O35744Q8C1X9
P07724P07724
O08709 10 p49 i (3.74; p<0.01)
Table 2. Proteins with altered expression levels in sensitized & challenged versus control mouse BALF
22
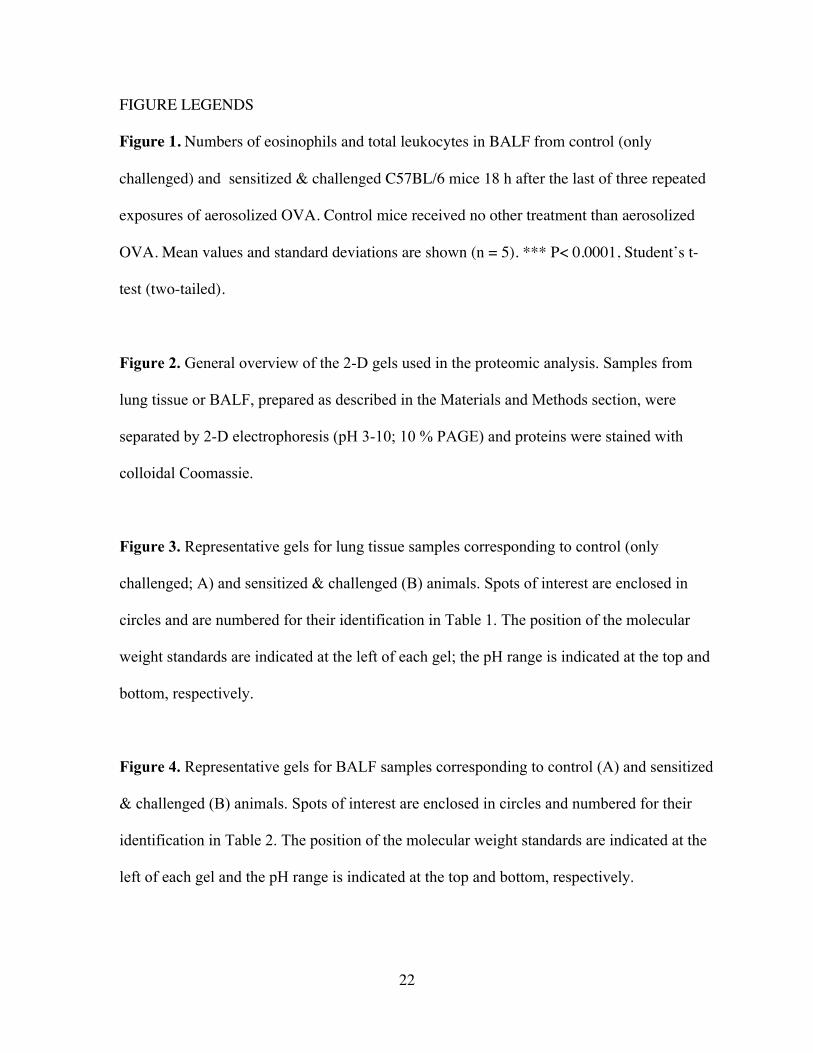
FIGURE LEGENDS
Figure 1. Numbers of eosinophils and total leukocytes in BALF from control (only
challenged) and sensitized & challenged C57BL/6 mice 18 h after the last of three repeated
exposures of aerosolized OVA. Control mice received no other treatment than aerosolized
OVA. Mean values and standard deviations are shown (n = 5). *** P< 0.0001, Student’s t-
test (two-tailed).
Figure 2. General overview of the 2-D gels used in the proteomic analysis. Samples from
lung tissue or BALF, prepared as described in the Materials and Methods section, were
separated by 2-D electrophoresis (pH 3-10; 10 % PAGE) and proteins were stained with
colloidal Coomassie.
Figure 3. Representative gels for lung tissue samples corresponding to control (only
challenged; A) and sensitized & challenged (B) animals. Spots of interest are enclosed in
circles and are numbered for their identification in Table 1. The position of the molecular
weight standards are indicated at the left of each gel; the pH range is indicated at the top and
bottom, respectively.
Figure 4. Representative gels for BALF samples corresponding to control (A) and sensitized
& challenged (B) animals. Spots of interest are enclosed in circles and numbered for their
identification in Table 2. The position of the molecular weight standards are indicated at the
left of each gel and the pH range is indicated at the top and bottom, respectively.
23
Figure 5. Gelatin zymography of BALF samples recovered from control- (only challenged;
lanes 1, 3, 5, 7) and sensitized & challenged (lanes 2, 4, 6, 8) animals. (A) Equal volumes
(30 µl) of BALF samples were loaded in each lane. (B) Samples were concentrated and
equal amounts of protein (12 µg) were loaded in each lane. A 10 µl sample of HT1080-
conditioned medium was also included as a source of proMMP-2 and proMMP-9.
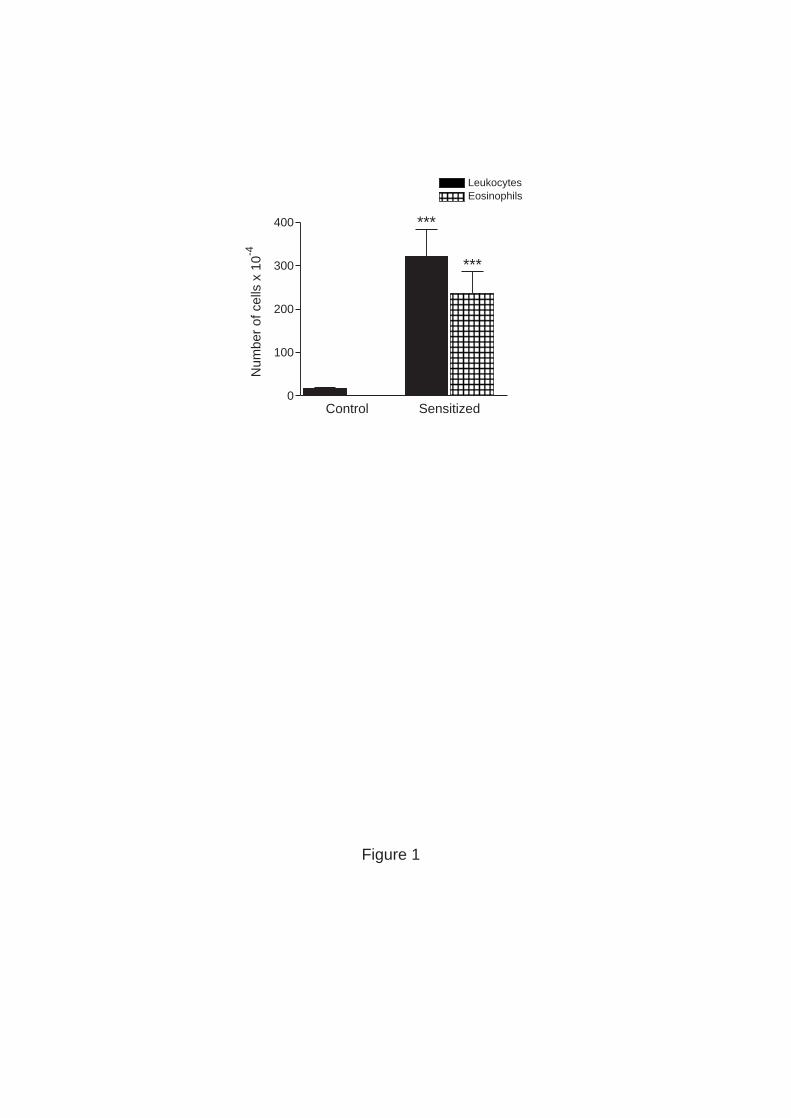
Figure 1
Control Sensitized0
100
200
300
400
Num
ber
of c
ells
x 1
0-4
LeukocytesEosinophils
***
***
Lung tissue (A)
Non treated
Sensitized &challenged
Sensitized
Challenged
BALF (B)
Non treated
Sensitized &challenged
Sensitized
Challenged
Figure 2
4.0 4.5 5.0 5.5 6.0 6.5 7.0 7.5 8.0 8.5 9.0
97.0
66.0
45.0
30.0
kDa A (control: only challenged)
2324
pH
20.1
4.0 4.5 5.0 5.5 6.0 6.5 7.0 7.5 8.0 8.5 9.0
97.0
66.0
45.0
30.0
20.1
B (sensitized & challenged)
7
19
12
38
17 18 2022
1421
325
15910
162
14
625
3326
27
34
35 113
3036
28
318
13
3929
40 41
37
Figure 3
pH4.0 4.5 5.0 5.5 6.0 6.5 7.0 7.5
97.0
66.0
45.0
30.0
kDa A (control: only challenged)
4445
48
49
43
42
4.0 4.5 5.0 5.5 6.0 6.5 7.0 7.5
97.0
66.0
45.0
30.0
B (sensitized & challenged)
475046
51
Figure 4
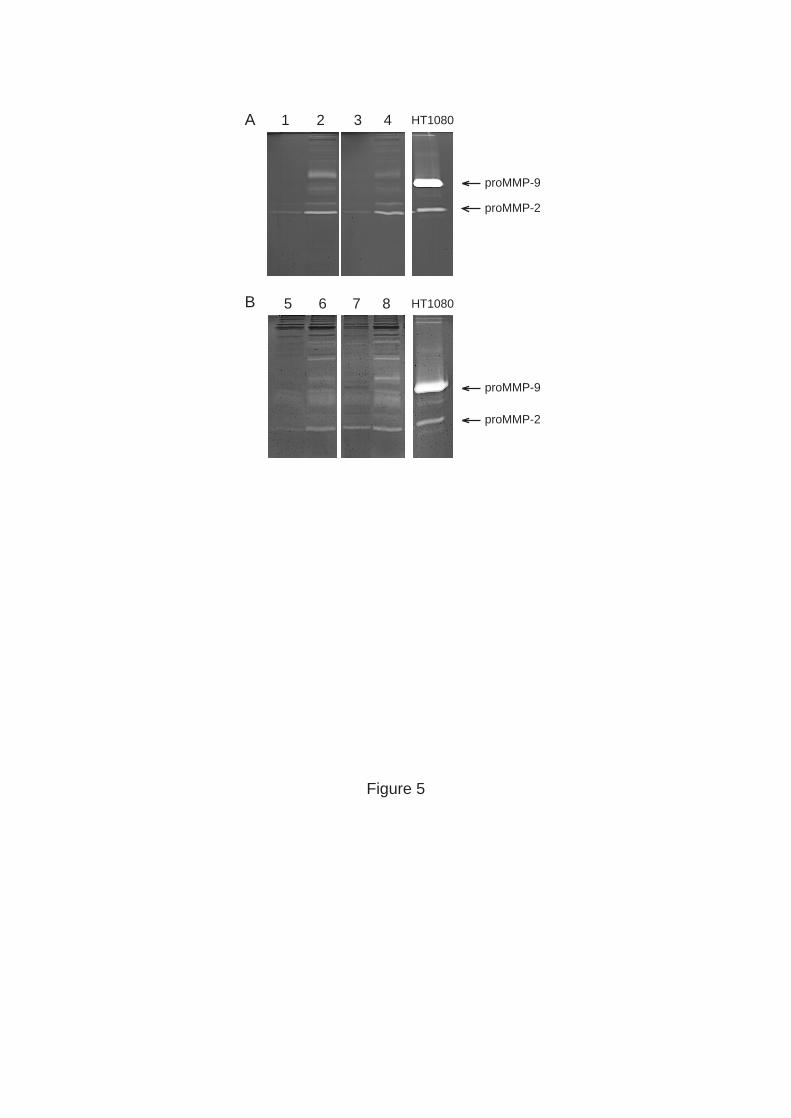
Figure 5
1 2 3 4
5 6 7
proMMP-9
proMMP-2
proMMP-9
proMMP-2
8 HT1080
HT1080A
B
1
ONLINE SUPPLEMENT
INCREASED LEVELS OF HYPOXIA-SENSITIVE PROTEINS IN ALLERGIC
AIRWAY INFLAMMATION
Ignacio Fajardo, Linda Svensson, Anders Bucht and Gunnar Pejler
2
METHODS
Animals
Nine to 13 weeks old female C57BL/6 mice, originally obtained from Jackson
Laboratories (Bar Harbor, ME), were bred in the animal facility at FOI (Swedish Defence
Research Agency, Umeå, Sweden). Animals were fed with standard chow and water ad
libitum. The study was approved by the Regional Animal Research Ethics Committee
according to national laws.
Sensitization and aerosol challenge
The procedure for sensitization and aerosol challenge was optimized in a previous study
(1). In brief, animals were sensitized intraperitoneally with 200 µl OVA/aluminium
hydroxide gel (alum) (1:3) on days 0 and 14. OVA (Chicken egg albumin grade V,
Sigma, St. Louis, MO) was dissolved in saline and mixed with alum to a concentration of
50 µg/ml by rotation at 4°C for 3 h. On days 30, 33 and 35, mice were challenged in the
lungs by inhalation of aerosolized OVA for 30 min using a nose-only Batelle exposure
chamber. Aerosols were generated by a compressed-air nebulizer (Collision 6-jet) at an
airflow of 7 L/min using a nebulizer concentration of 10 mg/ml OVA dissolved in
phosphate-buffered saline (PBS). Control mice received either no treatment, only OVA-
aerosol challenge on days 30, 33 and 35, or were sensitized as above without subsequent
challenge.
Analysis of eosinophils in BALF and lung tissue
3
Mice were killed by cervical dislocation 18 h after the last aerosol challenge and their
trachae were cannulated with polyethylene tubing. Bronchoalveolar lavage (BAL) was
performed using 1-ml aliquots of Hank’s balanced salt solution (HBSS; pH 7.4)
supplemented with 3 mM EDTA to a recovered volume of 4 ml. The BAL fluid (BALF)
was centrifuged (400 x g, 10 min, 4°C) and the supernatants were collected for the 2-D
electrophoresis analysis. The cells were resuspended in 0.4 ml PBS and total leukocytes
were counted using trypan blue exclusion in a Bürker chamber. For determination of
BALF eosinophils, duplicate cytospin (Cytospin 3, Shandon, Runcorn, UK) slides were
prepared (30,000 cells/sample) and stained with May-Grünwald Giemsa. The percentage
of eosinophils was determined by differential counts of 300 cells per slide using standard
morphological criteria. For histologic assessment of lung tissue eosinophils, the lungs
were inflated with 0.3 ml of TissueTek OCT (Sakura finetek, Netherlands), diluted 1:3 in
PBS, prior to excision and the left lobe was dissected and covered with TissueTek OCT
before freezing in liquid petroleum gas. Frozen tissue was thereafter serially sectioned (8
µm) and mounted on superfrost slides (Menzel-Gläser, Braunschweig, Germany).
Eosinophils were stained using the phenol red assay as described by Ain et al (2). In
short, lung sections were incubated with 56 µM (0.002%) phenol red
(Phenolsulfonephthalein sodium salt, Sigma, St Louis, MO) in HBSS for 2 h and washed
with HBSS before analysis. Duplicate sections per animal were examined from each
group of five mice and representative photographs of peripheral and central structures of
the lung were taken, using a fluorescence microscope (Leica GMR/Leica 200 camera,
Wetzlar, Germany) with triple-pass filter.
4
Sample preparation for proteomic analysis
One-ml aliquots of BALF supernatants (see above) corresponding to five different
animals (five controls or five sensitized & challenged animals) were pooled (total volume
5 ml) and concentrated at 4°C to a final volume of 100 µl by using Amicon Ultra-4
centrifugal filter devices (Millipore, Bedford, MA) following the instructions provided by
the manufacturer. Protein concentrations were quantified using the Bio-Rad protein assay
(Bio-Rad Laboratories, Hercules, CA) and samples were stored at –80°C. Immediately
after the performance of BAL, lungs were frozen in liquid nitrogen and stored at –80°C.
For extraction of proteins, the entire lungs were homogenized at 4°C in 350 µl of lysis
buffer (50 mM Tris/HCl (pH 7.4) containing 1% Triton-X-100, 0.1% SDS and 1 mM
EDTA) by using a Polytron PT 1200 homogenizer (Kinematica, Littau-Lucerne,
Switzerland). Homogenates were rotated for 10 min at 4°C and were subsequently
centrifuged at 12,000 x g for 10 min at 4°C. Supernatants were then recovered and were
immediately stored at –80°C, after saving aliquots for quantification of protein
concentrations.
2-D electrophoresis and gel-image analysis
All reagents and materials used for 2-D electrophoresis were of electrophoresis grade
purity and were provided by Amersham Biosciences (Uppsala, Sweden), Sigma or Merck
Eurolab (Darmstadt, Germany). Four hundred µg (BALF samples) or 750 µg (lung
extract samples) of protein in a maximum volume of 75 µl were mixed with 375 µl of a
1.2 x rehydration stock solution (9.6 M Urea, 2.4% 3-[(3-
cholamidopropyl)dimethylammonio]-1-propanesulfonate (CHAPS), 0.34% DTT, 0.6%
5
pH 3-10NL-IPG buffer (Amersham Biosciences), 0.0024% Bromophenol blue). Samples
were then applied to nonlinear pH 3–10 immobilized pH gradient strips (Immobiline
Drystrips pH 3-10NL; Amersham Biosciences), which were subsequently allowed to
rehydrate for 12 h at 30 V (20°C). Next, isoelectric focusing was performed at 20°C for
1h at 500 V followed by 1 h at 1000 V and 11 h at 8000 V, using a IPGPhor Isoelectric
Focusing System (Amersham Biosciences). Strips were then equilibrated at room
temperature for 15 min in SDS-equilibration buffer (50 mM Tris/HCl pH 8.8, 6 M Urea,
30% (v/v) glycerol, 2% (w/v) SDS and trace amount of Bromophenol blue) supplemented
with 1% (w/v) DTT and for another 15 min with SDS-equilibration buffer supplemented
with 2.5% (w/v) iodoacetamide. After equilibration, strips were applied to homogeneous
1mm-thick 25.5 x 20 cm 10% SDS-PAGE gels prepared according to the Laemmli
system. Molecular weight standards (Amersham Biosciences) were applied to a well
beside the strip. Electrophoresis was carried out at 2.5 W per gel during the first 30 min
followed by 17 W per gel until complete. Gels were stained using the colloidal
Coomassie procedure as described by Neuhoff et al(3) and were stored at 4°C in 25%
ammonium sulfate.
For gel-image analysis, gels were scanned at high resolution with an Epson Expression
1680 pro scanner and the PDQuest version 7.2 software (Bio-Rad; trial version) was used
for detection of qualitative and quantitative alterations in protein spots. Gel images were
normalized to the total grey intensity. Significant quantitative changes in protein spots
were determined according to a Student’s t-test.
6
Protein identification
Spots of interest were excised from the gels, washed twice with water and were in-gel
digested with porcine trypsin (Promega, Madison, WI) in essence as described by
Shevchenko et al. (4). The generated peptides were then concentrated and desalted using
either ZipTipµ-C18 or ZipPlateµ-C18 devices (Millipore) and analyzed by mass spectrometry
using either a Reflex IV MALDI-ToF mass spectrometer or an Ultraflex MALDI-
ToF/ToF mass spectrometer (both instruments from Bruker Daltonics, Billerica, MA).
Protein identification was achieved by peptide mass fingerprinting (PMF) of the spectral
data using the search program MASCOT at http://www.matrixscience.com. Digestion of
proteins in the spots, mass spectrometry and PMF searches were performed by the
Proteomics Resource Center, Uppsala University.
Gelatin zymography
Gelatin zymography assays were performed as previously described (5). Briefly, samples
were subjected to non-reducing SDS-PAGE (at 4°C) on gels containing 0.1% gelatin and
10% polyacrylamide. After the electrophoresis, gels were washed twice with 50 mM Tris-
HCl, pH 7.4, supplemented with 2% Triton X-100, and twice with 50 mM Tris-HCl, pH
7.4. Each wash was for 10 min with continuous shaking and was performed at room
temperature. After the washes, the gels were incubated overnight at 37°C, immersed in a
substrate buffer (50 mM Tris-HCl, pH 7.4, supplemented with 1% Triton X-100, 5 mM
CaCl2 and 0.02% Na3N). Next, the gels were stained with Coomassie brilliant blue R-
250. Concentration of BALF samples was performed at 4ºC by using YM-10 Microcon
centrifugal filter devices (Millipore) following the instructions provided by the
7
manufacturer. Conditioned medium from the human fibrosarcoma HT1080 cell line was
used as a control for the matrix metalloproteinases MMP-2 and MMP-9.
REFERENCES
E1. Svensson L, Lilliehook B, Larsson R, Bucht A. gammadelta T cells contribute to
the systemic immunoglobulin E response and local B-cell reactivity in allergic
eosinophilic airway inflammation. Immunology 2003;108:98-108.
E2. Ain R, Tash JS, Soares MJ. A simple method for the in situ detection of
eosinophils. J Immunol Methods 2002;260:273-8.
E3. Neuhoff V, Arold N, Taube D, Ehrhardt W. Improved staining of proteins in
polyacrylamide gels including isoelectric focusing gels with clear background at
nanogram sensitivity using Coomassie Brilliant Blue G-250 and R-250.
Electrophoresis 1988;9:255-262.
E4. Shevchenko A, Wilm M, Vorm O, Mann M. Mass spectrometric sequencing of
proteins silver-stained polyacrylamide gels. Anal Chem. 1996;68:850-858.
E5. Fajardo I, Quesada AR, Nunez de Castro I, Sanchez-Jimenez F, Medina MA. A
comparative study of the effects of genistein and 2-methoxyestradiol on the
proteolytic balance and tumour cell proliferation. Br J Cancer 1999;80:17-24.
FIGURE LEGEND
8
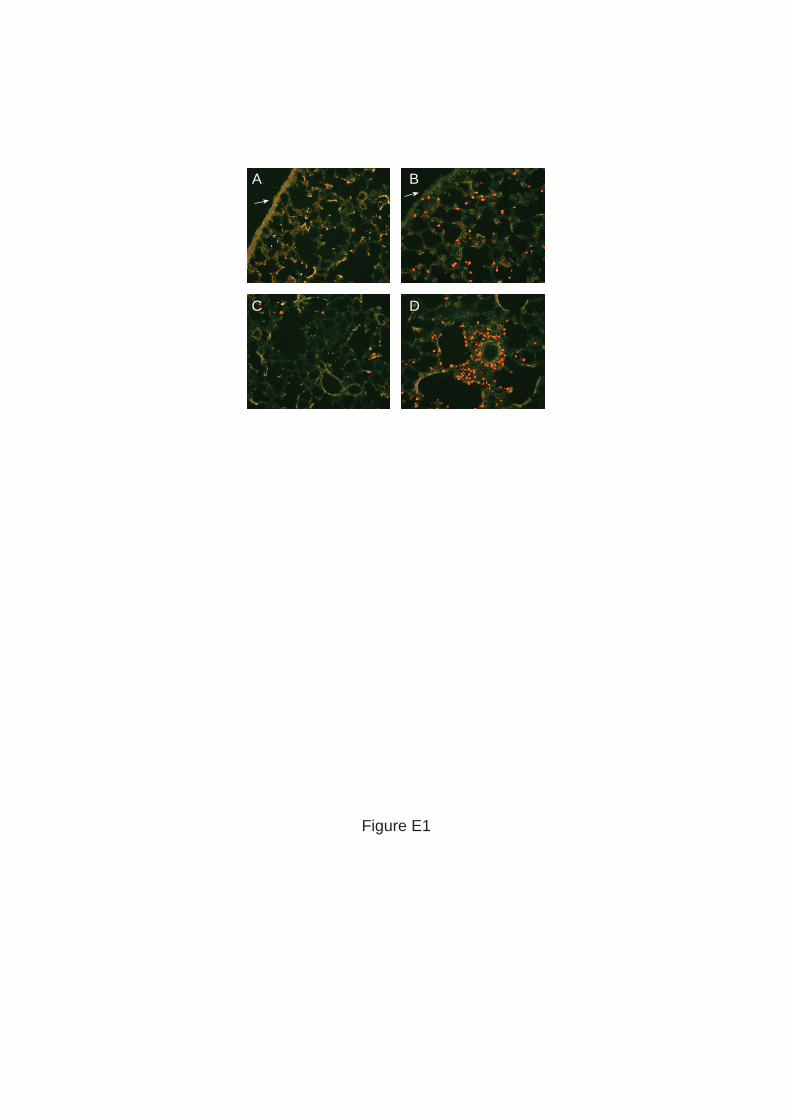
Figure E1. Histologic assessment of eosinophils in lung tissue from control (only
challenged) and sensitized & challenged C57BL/6 mice 18 h after the last of three
repeated exposures of aerosolized OVA, using phenol red staining method. Control mice
receiving no other treatment than aerosolized OVA showed only sparely scattered
eosinophils (red coloured) in the interstitial compartment of the peripheral alveoli, close
to the mesothelium of the pleura (arrow) (A), and in the perivascular tissue (C). In
sensitized and challenged mice the increased number of eosinophils was mainly observed
in perivascular tissue (D) and a small number was detected in peripheral alveoli (B).
Representative photographs from each group taken at 100 x magnification.
A B
DC
Figure E1
Related Documents