© Copyright 2012 Hewlett-Packard Development Company, L.P. The information contained herein is subject to change without notice. 1 HP Q4 FY12 Earnings Announcement November 20, 2012 http://www.hp.com/investor/home

Welcome message from author
This document is posted to help you gain knowledge. Please leave a comment to let me know what you think about it! Share it to your friends and learn new things together.
Transcript

© Copyright 2012 Hewlett-Packard Development Company, L.P. The information contained herein is subject to change without notice. 1
HP Q4 FY12 Earnings Announcement November 20, 2012
http://www.hp.com/investor/home

© Copyright 2012 Hewlett-Packard Development Company, L.P. The information contained herein is subject to change without notice. 2
Forward-looking statements This presentation contains forward-looking statements that involve risks, uncertainties and assumptions. If the risks or uncertainties ever materialize or the assumptions prove incorrect, the results of HP may differ materially from those expressed or implied by such forward-looking statements and assumptions. All statements other than statements of historical fact are statements that could be deemed forward-looking statements, including but not limited to any projections of revenue, margins, expenses, earnings, earnings per share, tax provisions, cash flows, benefit obligations, share repurchases, currency exchange rates or other financial items; any projections of the amount, timing or impact of cost savings or restructuring charges; any statements of the plans, strategies and objectives of management for future operations, including the execution of restructuring plans and any resulting cost savings or revenue or profitability improvements; any statements concerning the expected development, performance, market share or competitive performance relating to products or services; any statements regarding current or future macroeconomic trends or events and the impact of those trends and events on HP and its financial performance; any statements regarding pending investigations, claims or disputes; any statements of expectation or belief; and any statements of assumptions underlying any of the foregoing. Risks, uncertainties and assumptions include the impact of macroeconomic and geopolitical trends and events; the competitive pressures faced by HP’s businesses; the development and transition of new products and services and the enhancement of existing products and services to meet customer needs and respond to emerging technological trends; the execution and performance of contracts by HP and its suppliers, customers and partners; the protection of HP’s intellectual property assets, including intellectual property licensed from third parties; integration and other risks associated with business combination and investment transactions; the hiring and retention of key employees; assumptions related to pension and other post-retirement costs and retirement programs; the execution, timing and results of restructuring plans, including estimates and assumptions related to the cost and the anticipated benefits of implementing those plans; the resolution of pending investigations, claims and disputes; and other risks that are described in HP’s Annual Report on Form 10-K for the fiscal year ended October 31, 2011 and HP’s other filings with the Securities and Exchange Commission, including HP’s Quarterly Report on Form 10‟Q for the fiscal quarter ended July 31, 2012. As in prior periods, the financial information set forth in this release, including tax-related items, reflects estimates based on information available at this time. While HP believes these estimates to be meaningful, these amounts could differ materially from actual reported amounts in HP’s Form 10-K for the fiscal year ended October 31, 2012. In particular, determining HP’s actual tax balances and provisions as of October 31, 2012 requires extensive internal and external review of tax data (including consolidating and reviewing the tax provisions of numerous domestic and foreign entities), which is being completed in the ordinary course of preparing HP’s Form 10-K. HP assumes no obligation and does not intend to update these forward-looking statements.

© Copyright 2012 Hewlett-Packard Development Company, L.P. The information contained herein is subject to change without notice. 3
Use of non-GAAP financial information HP has included non-GAAP financial measures in this presentation to supplement HP’s consolidated condensed financial statements presented on a GAAP basis. Definitions of these non-GAAP financial measures and reconciliations of these non-GAAP financial measures to the most directly comparable GAAP financial measures are included elsewhere in this presentation.
HP’s management uses non-GAAP net revenue, non-GAAP operating expense, non-GAAP OI&E, non-GAAP operating profit, non-GAAP net earnings, non-GAAP diluted earnings per share, and HP’s non-GAAP tax rate to evaluate and forecast HP’s performance before gains, losses or other charges that are considered by HP’s management to be outside of HP’s core business segment operating results. Gross cash, net cash and free cash flow are liquidity measures that provide useful information to management about the amount of cash available for investment in HP’s businesses, funding strategic acquisitions, repurchasing stock and other purposes.
These non-GAAP financial measures may have limitations as analytical tools, and these measures should not be considered in isolation or as a substitute for analysis of HP’s results as reported under GAAP. Items such as impairment of goodwill and purchased intangible assets and amortization of purchased intangible assets, though not directly affecting HP’s cash position, represent the loss in value of intangible assets over time. The expense associated with this loss in value is not included in non-GAAP operating profit, non-GAAP net earnings, non-GAAP diluted earnings per share and HP’s non-GAAP tax rate and therefore does not reflect the full economic effect of the loss in value of those intangible assets. In addition, items such as restructuring charges that are excluded from non-GAAP operating expense, non-GAAP operating profit, non-GAAP net earnings, non-GAAP diluted earnings per share and HP’s non-GAAP tax rate can have a material impact on cash flows and earnings per share. HP may not be able to liquidate the long-term investments included in gross cash immediately, which may limit the usefulness of gross cash as a liquidity measure. In addition, free cash flow does not represent the total increase or decrease in the cash balance for the period. The non-GAAP financial information that we provide also may differ from the non-GAAP information provided by other companies.
We compensate for the limitations on our use of these non-GAAP financial measures by relying primarily on our GAAP financial statements and using non-GAAP financial measures only supplementally. We also provide robust and detailed reconciliations of each non-GAAP financial measure to the most directly comparable GAAP measure, and we encourage investors to review carefully those reconciliations.
We believe that providing these non-GAAP financial measures in addition to the related GAAP measures provides investors with greater transparency to the information used by HP’s management in its financial and operational decision-making and allows investors to see HP’s results “through the eyes” of management. We further believe that providing this information better enables investors to understand HP’s operating performance and to evaluate the efficacy of the methodology and information used by management to evaluate and measure such performance.

© Copyright 2012 Hewlett-Packard Development Company, L.P. The information contained herein is subject to change without notice.
4
1. All non-GAAP numbers have been adjusted to exclude certain items. A reconciliation of specific adjustments to GAAP results for the current and prior periods is included on slides 17 and 18, and in the GAAP to non-GAAP slides that appear as part of the supplemental slides of this presentation. A description of HP’s use of non-GAAP information is provided on slide 3 under “Use of non-GAAP Financial Information.”
2. Includes Corporate Investments, eliminations and other items not included in segment results 3. As part of a realignment of the structure of HP’s business in fiscal 2012, the Personal Systems segment (formerly known as the Personal Systems Group segment) and the Printing segment (formerly known as the Imaging and Printing
Group segment) have been structured beneath a newly formed Printing and Personal Systems Group. While the Printing and Personal Systems Group is not a financial reporting segment, HP provides financial data aggregating the segments within it in order to provide a supplementary view of its business
Q4 FY12 results overview
$ in millions
Q4 Net
Revenue
Growth
Y/Y%
Non-GAAP OP
$
Non-GAAP OP
% of rev
Non-GAAP OP
$ Y/Y
Non-GAAP OP
% Y/Y
Personal Systems(3) $8,705 (14%) $309 3.5% ($269) (2.2) pts
Printing(3) $6,080 (5%) $1,067 17.5% $274 5.1 pts
Printing and Personal Systems Group $14,785 (11%) $1,376 9.3% $5 1.0 pts
Services $8,711 (6%) $1,234 14.2% $24 1.1 pts
Enterprise Servers, Storage and Networking $5,119 (9%) $423 8.3% ($294) (4.5) pts
Software $1,171 14% $318 27.2% $34 (0.6) pts
HP Financial Services $966 1% $104 10.8% $6 0.5 pts
Total HP (1) (2)
$29,959 (7%) $3,112
10.4%
($27)
0.7 pts
Financial Summary • Net revenue of $30.0B, down 7% Y/Y and down 4% Y/Y in constant currency
• Non-GAAP(1) diluted EPS of $1.16, down 1% Y/Y
• GAAP loss per share of $3.49
• Cash flow from operations of $4.1B, up 69% Y/Y
• $124M in share repurchases and $260M in dividends

© Copyright 2012 Hewlett-Packard Development Company, L.P. The information contained herein is subject to change without notice.
5
1. All non-GAAP numbers have been adjusted to exclude certain items. A reconciliation of specific adjustments to GAAP results for the current and prior periods is included on slides 17 and 18, and in the GAAP to non-GAAP slides that appear as part of the supplemental slides of this presentation. A description of HP’s use of non-GAAP information is provided on slide 3 under “Use of non-GAAP Financial Information.”
2. Includes Corporate Investments, eliminations and other items not included in segment results 3. As part of a realignment of the structure of HP’s business in fiscal 2012, the Personal Systems segment (formerly known as the Personal Systems Group segment) and the Printing segment (formerly known as the Imaging and Printing
Group segment) have been structured beneath a newly formed Printing and Personal Systems Group. While the Printing and Personal Systems Group is not a financial reporting segment, HP provides financial data aggregating the segments within it in order to provide a supplementary view of its business
FY12 results overview
$ in millions
FY12 Net
Revenue
Growth
Y/Y%
Non-GAAP OP
$
Non-GAAP OP
% of rev
Non-GAAP OP
$ Y/Y
Non-GAAP OP
% Y/Y
Personal Systems(3) $35,650 (10%) $1,706 4.8% ($644) (1.1) pts
Printing(3) $24,487 (6%) $3,585 14.6% ($342) (0.4) pts
Printing and Personal Systems Group $60,137 (9%) $5,291 8.8% ($986) (0.7) pts
Services $34,922 (2%) $4,095 11.7% ($1,108) (2.9) pts
Enterprise Servers, Storage and Networking $20,491 (7%) $2,132 10.4% ($865) (3.2) pts
Software $4,060 21% $827 20.4% $105 (1.0) pts
HP Financial Services $3,819 6% $388 10.2% $40 0.5 pts
Total HP (1) (2)
$120,357 (5%) $11,145
9.3%
($2,606)
(1.5) pts
Financial Summary • Net revenue of $120.4B, down 5% Y/Y and down 4% Y/Y in constant currency
• Non-GAAP(1) diluted EPS of $4.05, down 17% Y/Y
• GAAP loss per share of $6.41
• Cash flow from operations of $10.6B, down 16% Y/Y
• $1.6B in share repurchases and $1.0B in dividends

© Copyright 2012 Hewlett-Packard Development Company, L.P. The information contained herein is subject to change without notice.
6
Q4 FY12 revenue By segment(1) By region
EMEA 36%,
down 8% Y/Y
U.S. 35%
Asia Pacific 19%,
down 4% Y/Y
Americas 45%, down 6% Y/Y
Canada/ Latin America
10%
Printing(2) 20%
Personal Systems(2)
28%
Services 28%
Enterprise Servers, Storage
& Networking 17%
HP Financial Services & Corp. Investments
3% Software 4%
1. Revenue mix calculated based on total segments, which excludes eliminations and other items not included in segment results. 2. As part of a realignment of the structure of HP’s business in fiscal 2012, the Personal Systems segment (formerly known as the Personal Systems Group segment) and the Printing segment (formerly known as the Imaging and
Printing Group segment) have been structured beneath a newly formed Printing and Personal Systems Group. While the Printing and Personal Systems Group is not a financial reporting segment, HP provides financial data aggregating the segments within it in order to provide a supplementary view of its business

© Copyright 2012 Hewlett-Packard Development Company, L.P. The information contained herein is subject to change without notice.
7
Revenue & non-GAAP diluted EPS performance
4Q09 1Q10 2Q10 3Q10 4Q10 1Q11 2Q11 3Q11 4Q11 1Q12 2Q12 3Q12 4Q12
Revenue (in billions) $30.8 $31.2 $30.8 $30.7 $33.3 $32.3 $31.6 $31.2 $32.3 $30.0 $30.7 $29.7 $30.0
Non-GAAP Diluted EPS $1.14 $1.07 $1.09 $1.08 $1.33 $1.36 $1.24 $1.10 $1.17 $0.92 $0.98 $1.00 $1.16
$0.00
$0.10
$0.20
$0.30
$0.40
$0.50
$0.60
$0.70
$0.80
$0.90
$1.00
$1.10
$1.20
$1.30
$1.40
$1.50
$12
$14
$16
$18
$20
$22
$24
$26
$28
$30
$32
$34
$36
(2)
(1)(2)
1. Q4 FY2011 amount shown is for non-GAAP net revenue. All other revenue amounts shown are GAAP net revenue. 2. All non-GAAP numbers have been adjusted to exclude certain items. A reconciliation of specific adjustments to GAAP results for the current and prior periods is included on slides 17 and 18, and in the GAAP to non-GAAP slides that
appear as part of the supplemental slides of this presentation. A description of HP’s use of non-GAAP information is provided on slide 3 under “Use of non-GAAP Financial Information.”
Rev
enu
e ($
bill
ion
s)
No
n-G
AA
P D
iluted
EP
S

© Copyright 2012 Hewlett-Packard Development Company, L.P. The information contained herein is subject to change without notice. 8
© Copyright 2012 Hewlett-Packard Development Company, L.P. The information contained herein is subject to change without notice.
Y/Y revenue growth % Y/Y constant currency revenue growth %
(15%)
(10%)
(5%)
0%
5%
10%
15%
20%
$4
$6
$8
$10
$12
$14
3Q11 4Q11 1Q12 2Q12 3Q12 4Q12
Y/Y
rev
enu
e g
row
th %
$ in
bill
ion
s
(15%)
(10%)
(5%)
0%
5%
10%
15%
20%
$0
$1
$2
$3
$4
$5
$6
$7
3Q11 4Q11 1Q12 2Q12 3Q12 4Q12
Y/Y
rev
enu
e g
row
th %
$ in
bill
ion
s
(15%)
(10%)
(5%)
0%
5%
10%
15%
20%
$6
$8
$10
$12
$14
$16
3Q11 4Q11 1Q12 2Q12 3Q12 4Q12
Y/Y
rev
enu
e g
row
th %
$ in
bill
ion
s
Americas (including U.S.)
EMEA Asia Pacific
United States
(15%)
(10%)
(5%)
0%
5%
10%
15%
20%
$2
$4
$6
$8
$10
$12
3Q11 4Q11 1Q12 2Q12 3Q12 4Q12
Y/Y
rev
enu
e g
row
th %
$ in
bill
ion
s
Regional revenue trends

© Copyright 2012 Hewlett-Packard Development Company, L.P. The information contained herein is subject to change without notice.
9
Revenue growth
4Q09 1Q10 2Q10 3Q10 4Q10 1Q11 2Q11 3Q11 4Q11 1Q12 2Q12 3Q12 4Q12
Constant currency -5.0% 5.4% 8.4% 10.6% 8.8% 4.3% 1.3% -2.3% -6.1% -7.9% -2.9% -2.5% -4.1%
As reported -8.4% 8.2% 12.7% 11.4% 8.1% 3.6% 2.5% 1.5% -3.0% -7.0% -3.0% -4.9% -6.7%
(10%)
(5%)
0%
5%
10%
15%
(1)(2)
Y/Y
rev
enu
e g
row
th (
%)
(1)(2)
1. Q4 FY2011 percentage shown is for non-GAAP net revenue. All other percentages shown are for GAAP net revenue. 2. All non-GAAP numbers have been adjusted to exclude certain items. A reconciliation of specific adjustments to GAAP results for the current and prior periods is included on slides 17 and 18, and in the GAAP to non-GAAP slides that
appear as part of the supplemental slides of this presentation. A description of HP’s use of non-GAAP information is provided on slide 3 under “Use of non-GAAP Financial Information.”
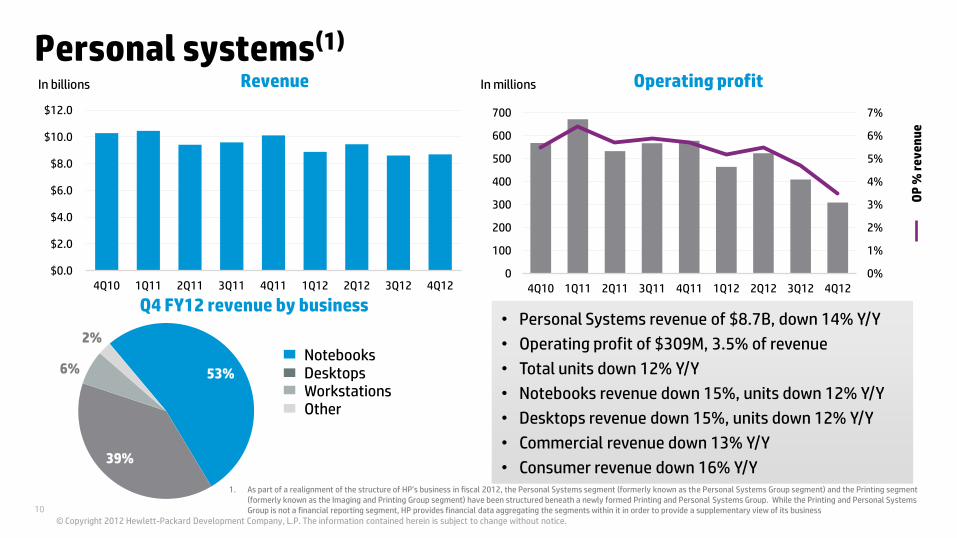
© Copyright 2012 Hewlett-Packard Development Company, L.P. The information contained herein is subject to change without notice. 10
$0.0
$2.0
$4.0
$6.0
$8.0
$10.0
$12.0
4Q10 1Q11 2Q11 3Q11 4Q11 1Q12 2Q12 3Q12 4Q12
Personal systems(1)
0%
1%
2%
3%
4%
5%
6%
7%
0
100
200
300
400
500
600
700
4Q10 1Q11 2Q11 3Q11 4Q11 1Q12 2Q12 3Q12 4Q12
OP
% r
ev
en
ue
53%
39%
6%
2% Notebooks Desktops Workstations Other
• Personal Systems revenue of $8.7B, down 14% Y/Y
• Operating profit of $309M, 3.5% of revenue
• Total units down 12% Y/Y
• Notebooks revenue down 15%, units down 12% Y/Y
• Desktops revenue down 15%, units down 12% Y/Y
• Commercial revenue down 13% Y/Y
• Consumer revenue down 16% Y/Y
In billions In millions Revenue Operating profit
Q4 FY12 revenue by business
© Copyright 2012 Hewlett-Packard Development Company, L.P. The information contained herein is subject to change without notice.
1. As part of a realignment of the structure of HP’s business in fiscal 2012, the Personal Systems segment (formerly known as the Personal Systems Group segment) and the Printing segment (formerly known as the Imaging and Printing Group segment) have been structured beneath a newly formed Printing and Personal Systems Group. While the Printing and Personal Systems Group is not a financial reporting segment, HP provides financial data aggregating the segments within it in order to provide a supplementary view of its business

© Copyright 2012 Hewlett-Packard Development Company, L.P. The information contained herein is subject to change without notice. 11
$0.0
$1.0
$2.0
$3.0
$4.0
$5.0
$6.0
$7.0
$8.0
4Q10 1Q11 2Q11 3Q11 4Q11 1Q12 2Q12 3Q12 4Q12 4%
8%
12%
16%
20%
$500
$700
$900
$1,100
$1,300
4Q10 1Q11 2Q11 3Q11 4Q11 1Q12 2Q12 3Q12 4Q12
OP
% o
f re
ve
nu
e
Printing(1)
66%
24%
10% Supplies Commercial Hardware
Consumer Hardware
„ Printing revenue of $6.1B, down 5% Y/Y
„ Operating profit of $1,067M, 17.5% of revenue
„ Supplies revenue down 1% Y/Y
„ Total Hardware units down 20% Y/Y
„ Consumer Hardware units down 22% Y/Y
„ Commercial Hardware units down 15% Y/Y
In billions In millions Operating profit
Q4 FY12 revenue by business
© Copyright 2012 Hewlett-Packard Development Company, L.P. The information contained herein is subject to change without notice.
Revenue
1. As part of a realignment of the structure of HP’s business in fiscal 2012, the Personal Systems segment (formerly known as the Personal Systems Group segment) and the Printing segment (formerly known as the Imaging and Printing Group segment) have been structured beneath a newly formed Printing and Personal Systems Group. While the Printing and Personal Systems Group is not a financial reporting segment, HP provides financial data aggregating the segments within it in order to provide a supplementary view of its business

© Copyright 2012 Hewlett-Packard Development Company, L.P. The information contained herein is subject to change without notice. 12
© Copyright 2012 Hewlett-Packard Development Company, L.P. The information contained herein is subject to change without notice.
42%
30%
28%
Services
2%
4%
6%
8%
10%
12%
14%
16%
18%
$0
$200
$400
$600
$800
$1,000
$1,200
$1,400
$1,600
4Q10 1Q11 2Q11 3Q11 4Q11 1Q12 2Q12 3Q12 4Q12
OP
% r
ev
en
ue
$0.0
$2.0
$4.0
$6.0
$8.0
$10.0
4Q10 1Q11 2Q11 3Q11 4Q11 1Q12 2Q12 3Q12 4Q12
„ Services revenue of $8.7B, down 6% Y/Y
„ Operating profit of $1,234M, 14.2% of revenue
„ ITO revenue down 6% Y/Y
„ Technology Services revenue down 4% Y/Y
„ ABS revenue down 7% Y/Y
Q4 FY12 revenue by business
In billions In millions Revenue Operating profit
Infrastructure Technology Outsourcing (ITO)
Technology Services
Application and Business Services (ABS)

© Copyright 2012 Hewlett-Packard Development Company, L.P. The information contained herein is subject to change without notice. 13
© Copyright 2012 Hewlett-Packard Development Company, L.P. The information contained herein is subject to change without notice.
0%
2%
4%
6%
8%
10%
12%
14%
16%
0
100
200
300
400
500
600
700
800
900
1000
4Q10 1Q11 2Q11 3Q11 4Q11 1Q12 2Q12 3Q12 4Q12
OP
% r
ev
en
ue
Enterprise servers, storage and networking (ESSN) In billions In millions Revenue Operating profit
• ESSN revenue of $5.1B, down 9% Y/Y
• Operating profit of $423M, 8.3% of revenue
• ISS revenue down 7% Y/Y
• Storage revenue down 13% Y/Y
• BCS revenue down 25% Y/Y
• Networking revenue up 7% Y/Y
61% 19%
8%
12% Industry Standard Servers (ISS)
Business Critical Systems (BCS)
Storage
Networking
Q4 FY12 revenue by business
$0.0
$1.0
$2.0
$3.0
$4.0
$5.0
$6.0
4Q10 1Q11 2Q11 3Q11 4Q11 1Q12 2Q12 3Q12 4Q12

© Copyright 2012 Hewlett-Packard Development Company, L.P. The information contained herein is subject to change without notice. 14
42%
40%
18%
Software
$0
$200
$400
$600
$800
$1,000
$1,200
4Q10 1Q11 2Q11 3Q11 4Q11 1Q12 2Q12 3Q12 4Q12 0%
5%
10%
15%
20%
25%
30%
35%
$0
$50
$100
$150
$200
$250
$300
$350
4Q10 1Q11 2Q11 3Q11 4Q11 1Q12 2Q12 3Q12 4Q12
OP
%re
ve
nu
e
In millions In millions Revenue Operating profit
• Software revenue of $1.2B, up 14% Y/Y
• Operating profit of $318M, 27.2% of revenue
• Licenses revenue up 9% Y/Y
• Support revenue up 9% Y/Y
• Services revenue up 48% Y/Y
© Copyright 2012 Hewlett-Packard Development Company, L.P. The information contained herein is subject to change without notice.
Licenses
Support
Services
Q4 FY12 revenue by type
© Copyright 2012 Hewlett-Packard Development Company, L.P. The information contained herein is subject to change without notice. 15
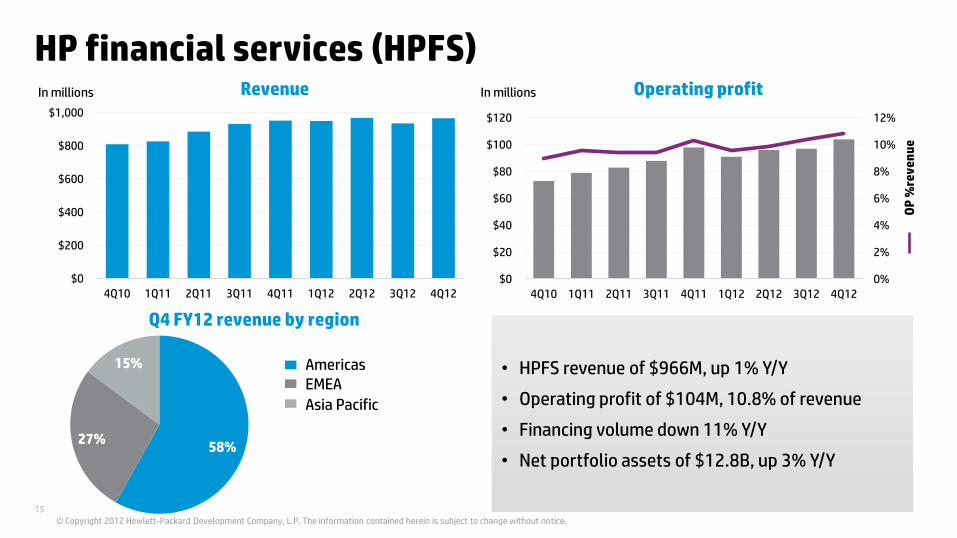
58% 27%
15%
HP financial services (HPFS)
$0
$200
$400
$600
$800
$1,000
4Q10 1Q11 2Q11 3Q11 4Q11 1Q12 2Q12 3Q12 4Q12 0%
2%
4%
6%
8%
10%
12%
$0
$20
$40
$60
$80
$100
$120
4Q10 1Q11 2Q11 3Q11 4Q11 1Q12 2Q12 3Q12 4Q12
OP
%re
ve
nu
e
Americas EMEA
Asia Pacific
• HPFS revenue of $966M, up 1% Y/Y
• Operating profit of $104M, 10.8% of revenue
• Financing volume down 11% Y/Y
• Net portfolio assets of $12.8B, up 3% Y/Y
In millions In millions Revenue Operating profit
Q4 FY12 revenue by region
© Copyright 2012 Hewlett-Packard Development Company, L.P. The information contained herein is subject to change without notice.

© Copyright 2012 Hewlett-Packard Development Company, L.P. The information contained herein is subject to change without notice. 16
© Copyright 2012 Hewlett-Packard Development Company, L.P. The information contained herein is subject to change without notice.
Non-GAAP(1) financial information
In millions except
per share amounts
Q4 FY12
Q3 FY12
Q4 FY11
Revenue $29,959 100% $29,669 100% $32,264 100%
Cost of sales $22,711 75.8% $22,712 76.6% 24,756 76.7%
Total OpEx $4,136 13.8% $4,220 14.2% 4,369 13.6%
Operating profit $3,112 10.4% $2,737 9.2% 3,139 9.7%
Interest & other, net (188) (224) (125)
Pre-tax earnings 2,924 9.8% 2,513 8.5% 3,014 9.3%
Income tax 643 540 664
Net earnings 2,281 7.6% 1,973 6.7% 2,350 7.3%
Diluted EPS
$1.16 $1.00 $1.17
1. All non-GAAP numbers have been adjusted to exclude certain items. A reconciliation of specific adjustments to GAAP results for this quarter and prior periods is included on slides 17 and 18, and in the GAAP to non-GAAP slides that appear as part of the supplemental slides of this presentation. A description of HP’s use of non-GAAP information is provided on slide 3 under “Use of non-GAAP Financial Information.”

© Copyright 2012 Hewlett-Packard Development Company, L.P. The information contained herein is subject to change without notice. 17
© Copyright 2012 Hewlett-Packard Development Company, L.P. The information contained herein is subject to change without notice.
Q4 FY12 GAAP to non-GAAP bridge
In millions except
per share amounts GAAP
Impairment of goodwill
and purchased intangible
assets
Amortization of
purchased
intangibles assets
Restructuring
charges
Acquisition
related charges Non-GAAP
Revenue $29,959 $29,959
Cost of sales 22,711 22,711
Total OpEx 13,736 (8,847) (372) (378) (3) 4,136
Operating (loss) / profit (6,488) 8,847 372 378 3 3,112
Interest & other, net (188) (188)
Pre-tax (loss) / earnings (6,676) 8,847 372 378 3 2,924
Income tax
178 231 187 45 2 643
Tax rate -2.7% 22.0%
Net (loss) / earnings ($6,854) $2,281
Diluted (loss) / earnings per
share ($3.49) $1.16

© Copyright 2012 Hewlett-Packard Development Company, L.P. The information contained herein is subject to change without notice. 18
© Copyright 2012 Hewlett-Packard Development Company, L.P. The information contained herein is subject to change without notice.
FY12 GAAP to non-GAAP bridge
In millions except
per share amounts GAAP
Wind down of
webOS device
business
Wind down of non-
strategic
businesses 1
Impairment of
goodwill and
purchased
intangible assets
Amortization of
purchased
intangibles
assets
Restructuring
charges
Acquisition
related charges Non-GAAP
Revenue $120,357 $120,357
Cost of sales 92,385 36 (108) 92,313
Total OpEx 39,029 (18,035) (1,784) (2,266) (45) 16,899
Operating (loss) /
profit (11,057) (36) 108 18,035 1,784 2,266 45 11,145
Interest & other, net (876) (876)
Pre-tax (loss) /
earnings (11,933) (36) 108 18,035 1,784 2,266 45 10,269
Income tax 717 (13) 34 235 600 647 14 2,234
Tax rate -6.0% 21.8%
Net (loss) / earnings ($12,650) $8,035
Diluted (loss) /
earnings per share ($6.41) $4.05
1. Primarily represents contract-related charges, including inventory write-downs, related to winding down certain retail publishing business activities within the Printing segment

© Copyright 2012 Hewlett-Packard Development Company, L.P. The information contained herein is subject to change without notice. 19
© Copyright 2012 Hewlett-Packard Development Company, L.P. The information contained herein is subject to change without notice.
Gross cash & net cash
4Q10 1Q11 2Q11 3Q11 4Q11 1Q12 2Q12 3Q12 4Q12
Gross cash $11.0 $10.0 $12.8 $13.0 $8.1 $8.2 $8.7 $9.9 $11.8
Net cash ($10.6) ($9.9) ($9.7) ($12.2) ($22.0) ($22.2) ($21.0) ($19.5) ($16.4)
Net cash excl. HPFS net debt ($1.5) ($0.4) $0.2 ($2.1) ($11.7) ($11.8) ($10.6) ($9.1) ($5.8)
($25.0)
($20.0)
($15.0)
($10.0)
($5.0)
$0.0
$5.0
$10.0
$15.0
1. Includes cash and cash equivalents, short-term investments, and certain liquid long-term investments 2. Net cash is defined as gross cash less total company debt including the effect of hedging 3. Net cash excl HPFS debt = HP net cash plus HPFS net debt
In billions
(1)
(3)
(2)

© Copyright 2012 Hewlett-Packard Development Company, L.P. The information contained herein is subject to change without notice. 20
© Copyright 2012 Hewlett-Packard Development Company, L.P. The information contained herein is subject to change without notice.
Cash flow
$13.4
$11.9 $12.6
$10.6
$2.4
$4.1
$10.2
$8.4 $9.1
$7.5
$1.2
$3.5
$0.0
$2.0
$4.0
$6.0
$8.0
$10.0
$12.0
$14.0
$16.0
FY09 FY10 FY11 FY12 Q4 FY11 Q4 FY12
Cash flow from operations Free cash flow
In billions
1. Free cash flow = cash flow from operations less net capital expenditures
(1)

© Copyright 2012 Hewlett-Packard Development Company, L.P. The information contained herein is subject to change without notice. 21
© Copyright 2012 Hewlett-Packard Development Company, L.P. The information contained herein is subject to change without notice.
Stock repurchase
4Q10 1Q11 2Q11 3Q11 4Q11 1Q12 2Q12 3Q12 4Q12
Stock repurchase $4.0 $2.3 $2.7 $4.6 $0.5 $0.8 $0.3 $0.4 $0.1
$0.0
$0.5
$1.0
$1.5
$2.0
$2.5
$3.0
$3.5
$4.0
$4.5
$5.0
In billions
FY08 FY09 FY10 FY11 FY12
Stock repurchase $9.6 $5.1 $11.0 $10.1 $1.6
Shares received 216 132 240 262 67
0
50
100
150
200
250
300
$0
$2
$4
$6
$8
$10
$12
In billions
Quarterly trends FY08 – FY12
$9.2B remaining in stock repurchase authorization at the end of Q4 FY12
In millions

© Copyright 2012 Hewlett-Packard Development Company, L.P. The information contained herein is subject to change without notice. 22
© Copyright 2012 Hewlett-Packard Development Company, L.P. The information contained herein is subject to change without notice.
Outlook
Full year FY13 guidance
GAAP Diluted EPS
$2.10 – $2.30
Non-GAAP Diluted EPS(2) $3.40 – $3.60
Q1 FY13 guidance
GAAP Diluted EPS
$0.34 – $0.37
Non-GAAP Diluted EPS(1) $0.68 – $0.71
1. First quarter fiscal 2013 non-GAAP diluted EPS estimates exclude after-tax costs of approximately $0.34 per share, related primarily to the amortization of purchased intangible assets, restructuring charges and acquisition-related charges.
2. Full year fiscal 2013 non-GAAP diluted EPS estimates exclude after-tax costs of approximately $1.30 per share, related primarily to the amortization of purchased intangible assets, restructuring charges and acquisition-related charges.

© Copyright 2012 Hewlett-Packard Development Company, L.P. The information contained herein is subject to change without notice. 23
Supplemental slides
© Copyright 2012 Hewlett-Packard Development Company, L.P. The information contained herein is subject to change without notice. 24
© Copyright 2012 Hewlett-Packard Development Company, L.P. The information contained herein is subject to change without notice.
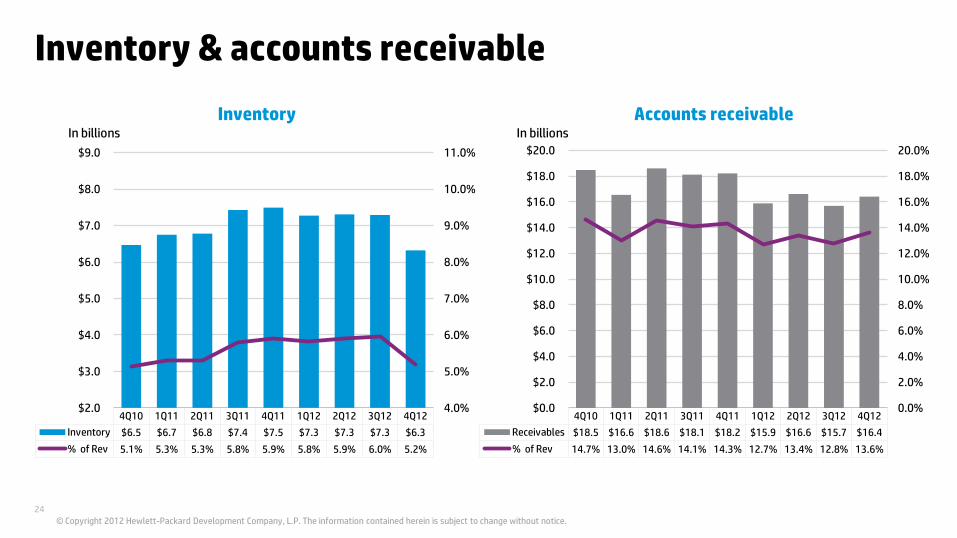
Inventory & accounts receivable
4Q10 1Q11 2Q11 3Q11 4Q11 1Q12 2Q12 3Q12 4Q12
Inventory $6.5 $6.7 $6.8 $7.4 $7.5 $7.3 $7.3 $7.3 $6.3
% of Rev 5.1% 5.3% 5.3% 5.8% 5.9% 5.8% 5.9% 6.0% 5.2%
4.0%
5.0%
6.0%
7.0%
8.0%
9.0%
10.0%
11.0%
$2.0
$3.0
$4.0
$5.0
$6.0
$7.0
$8.0
$9.0
4Q10 1Q11 2Q11 3Q11 4Q11 1Q12 2Q12 3Q12 4Q12
Receivables $18.5 $16.6 $18.6 $18.1 $18.2 $15.9 $16.6 $15.7 $16.4
% of Rev 14.7% 13.0% 14.6% 14.1% 14.3% 12.7% 13.4% 12.8% 13.6%
0.0%
2.0%
4.0%
6.0%
8.0%
10.0%
12.0%
14.0%
16.0%
18.0%
20.0%
$0.0
$2.0
$4.0
$6.0
$8.0
$10.0
$12.0
$14.0
$16.0
$18.0
$20.0
Inventory Accounts receivable In billions In billions
© Copyright 2012 Hewlett-Packard Development Company, L.P. The information contained herein is subject to change without notice. 25
© Copyright 2012 Hewlett-Packard Development Company, L.P. The information contained herein is subject to change without notice.
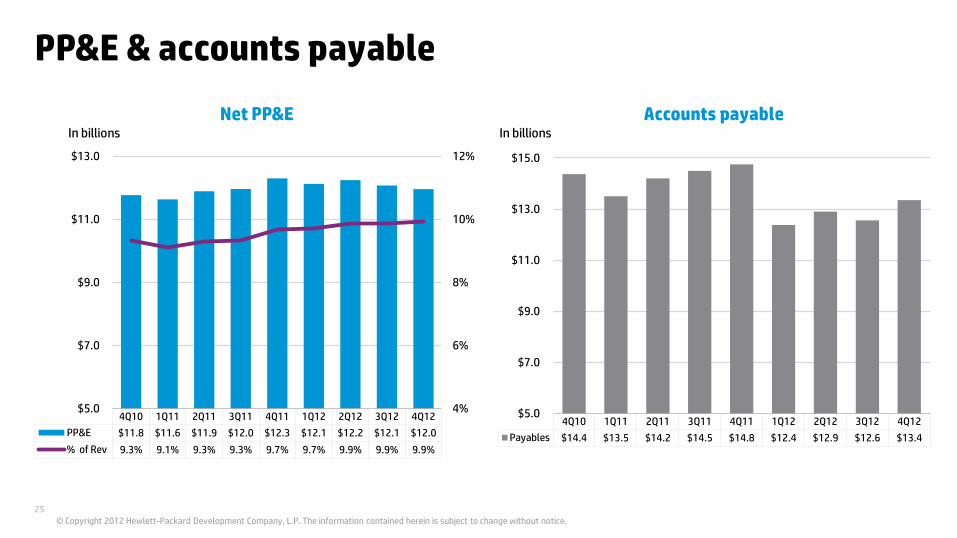
PP&E & accounts payable
4Q10 1Q11 2Q11 3Q11 4Q11 1Q12 2Q12 3Q12 4Q12
Payables $14.4 $13.5 $14.2 $14.5 $14.8 $12.4 $12.9 $12.6 $13.4
$5.0
$7.0
$9.0
$11.0
$13.0
$15.0
4Q10 1Q11 2Q11 3Q11 4Q11 1Q12 2Q12 3Q12 4Q12
PP&E $11.8 $11.6 $11.9 $12.0 $12.3 $12.1 $12.2 $12.1 $12.0
% of Rev 9.3% 9.1% 9.3% 9.3% 9.7% 9.7% 9.9% 9.9% 9.9%
4%
6%
8%
10%
12%
$5.0
$7.0
$9.0
$11.0
$13.0
In billions In billions
Net PP&E Accounts payable
© Copyright 2012 Hewlett-Packard Development Company, L.P. The information contained herein is subject to change without notice. 26
© Copyright 2012 Hewlett-Packard Development Company, L.P. The information contained herein is subject to change without notice.
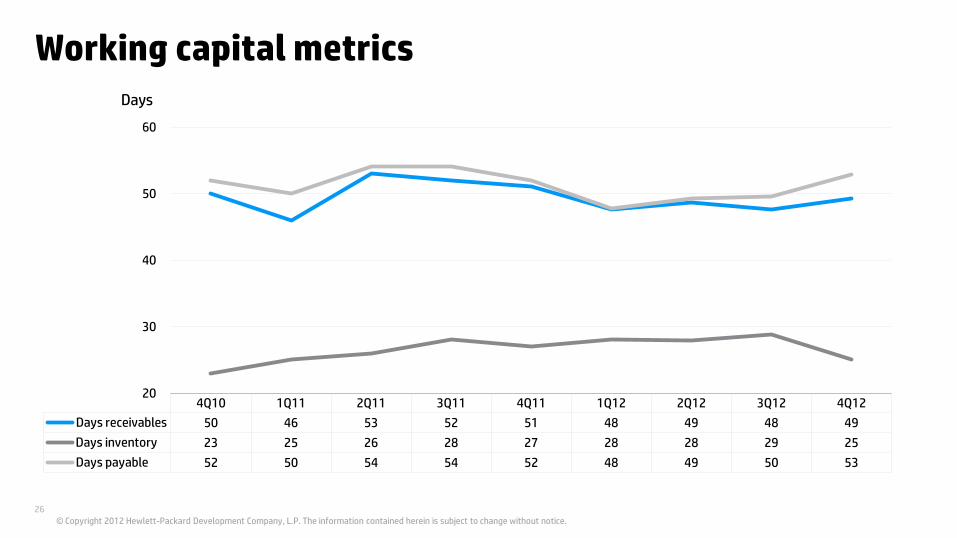
Working capital metrics
4Q10 1Q11 2Q11 3Q11 4Q11 1Q12 2Q12 3Q12 4Q12
Days receivables 50 46 53 52 51 48 49 48 49
Days inventory 23 25 26 28 27 28 28 29 25
Days payable 52 50 54 54 52 48 49 50 53
20
30
40
50
60
Days

© Copyright 2012 Hewlett-Packard Development Company, L.P. The information contained herein is subject to change without notice. 27
© Copyright 2012 Hewlett-Packard Development Company, L.P. The information contained herein is subject to change without notice.
HPFS supplemental data
1. Depreciation and net capital expenditures are shown net of inter-company eliminations.
In millions Q4 FY12 Q3 FY12 Q4 FY11
Depreciation (1)
$429 $437 $448
Net capital expenditures (1)
$299 $325 $585
Sequential increase in net financing
receivables $341 ($56) $63

© Copyright 2012 Hewlett-Packard Development Company, L.P. The information contained herein is subject to change without notice. 28
© Copyright 2012 Hewlett-Packard Development Company, L.P. The information contained herein is subject to change without notice.
Q3 FY12 GAAP to non-GAAP bridge
In millions except
per share amounts GAAP Wind down of non-
strategic businesses 1
Impairment of
goodwill and
purchased intangible
assets
Amortization of
purchased
intangibles assets
Restructuring
charges
Acquisition
related charges Non-GAAP
Revenue $29,669 $29,669
Cost of sales 22,820 (108) 22,712
Total OpEx 15,682 (9,188) (476) (1,795) (3) 4,220
Operating (loss) / profit (8,833) 108 9,188 476 1,795 3 2,737
Interest & other, net (224) (224)
Pre-tax (loss) / earnings (9,057) 108 9,188 476 1,795 3 2,513
Income tax (200) 34 4 139 563 - 540
Tax rate 2.2% 21.5%
Net (loss) / earnings ($8,857) $1,973
Diluted (loss) / earnings
per share ($4.49) $1.00
1. Primarily represents contract-related charges, including inventory write-downs, related to winding down certain retail publishing business activities within the Printing segment

© Copyright 2012 Hewlett-Packard Development Company, L.P. The information contained herein is subject to change without notice. 29
© Copyright 2012 Hewlett-Packard Development Company, L.P. The information contained herein is subject to change without notice.
Q2 FY12 GAAP to non-GAAP bridge
In millions except
per share amounts GAAP Wind down of webOS
device business
Amortization of
purchased intangibles
Restructuring
charges
Acquisition
related charges Non-GAAP
Revenue $30,693 $30,693
Cost of sales 23,541 36 23,577
Total OpEx 4,930 (470) (53) (17) 4,390
Operating profit 2,222 (36) 470 53 17 2,726
Interest & other, net (243) (243)
Pre-tax earnings 1,979 (36) 470 53 17 2,483
Income tax 386 (13) 138 17 6 534
Tax rate 19.5% 21.5%
Net earnings $1,593 $1,949
Diluted EPS
$0.80 $0.98

© Copyright 2012 Hewlett-Packard Development Company, L.P. The information contained herein is subject to change without notice. 30
© Copyright 2012 Hewlett-Packard Development Company, L.P. The information contained herein is subject to change without notice.
Q1 FY12 GAAP to non-GAAP bridge
In millions except
per share amounts GAAP Amortization of
purchased intangibles Restructuring charges
Acquisition
related charges Non-GAAP
Revenue $30,036 $30,036
Cost of sales 23,313 23,313
Total OpEx 4,681 (466) (40) (22) 4,153
Operating profit 2,042 466 40 22 2,570
Interest & other, net (221) (221)
Pre-tax earnings 1,821 466 40 22 2,349
Income tax 353 136 22 6 517
Tax rate 19.4% 22.0%
Net earnings $1,468 $1,832
Diluted EPS
$0.73 $0.92

© Copyright 2012 Hewlett-Packard Development Company, L.P. The information contained herein is subject to change without notice. 31
© Copyright 2012 Hewlett-Packard Development Company, L.P. The information contained herein is subject to change without notice.
FY11 GAAP to non-GAAP bridge
In millions except
per share amounts GAAP
Wind down of
webOS device
business
Impair. of goodwill
and purchased intangible
assets
Amort. of
purchased
intangibles
Restructuring
charges
Acquisition
related charges Non-GAAP
Revenue $127,245 142 $127,387
Cost of sales 97,418 (548) 96,870
Total OpEx 20,150 (65) (885) (1,607) (645) (182) 16,766
Operating profit 9,677 755 885 1,607 645 182 13,751
Interest & other, net (695) 276 (419)
Pre-tax earnings 8,982 755 885 1,607 645 458 13,332
Income tax 1,908 198 25 489 198 135 2,953
Tax rate 21.2% 22.1%
Net earnings $7,074 $10,379
Diluted EPS
$3.32 $4.88

© Copyright 2012 Hewlett-Packard Development Company, L.P. The information contained herein is subject to change without notice. 32
© Copyright 2012 Hewlett-Packard Development Company, L.P. The information contained herein is subject to change without notice.
Q4 FY11 GAAP to non-GAAP bridge
In millions except
per share amounts GAAP
Wind down of
webOS device
business
Impair. of goodwill
and purchased intangible
assets
Amort. of
purchased
intangibles
Restructuring
charges
Acquisition
related charges Non-GAAP
Revenue $32,122 142 $32,264
Cost of sales 25,304 (548) 24,756
Total OpEx 6,023 (65) (885) (411) (179) (114) 4,369
Operating profit 795 755 885 411 179 114 3,139
Interest & other, net (401) 276 (125)
Pre-tax earnings 394 755 885 411 179 390 3,014
Income tax 155 198 25 127 47 112 664
Tax rate 39.3% 22.0%
Net earnings $239 $2,350
Diluted EPS
$0.12 $1.17

© Copyright 2012 Hewlett-Packard Development Company, L.P. The information contained herein is subject to change without notice. 33
© Copyright 2012 Hewlett-Packard Development Company, L.P. The information contained herein is subject to change without notice.
Q3 FY11 GAAP to non-GAAP bridge
In millions except
per share amounts GAAP Amort. of
Purchased Intangibles Restructuring Acquisition
related charges Non-GAAP
Revenue $31,189 $31,189
Cost of sales 23,901 23,901
Total OpEx 4,768 (358) (150) (18) 4,242
Operating profit 2,520 358 150 18 3,046
Interest & other, net (121) (121)
Pre-tax earnings 2,399 358 150 18 2,925
Income tax
473 108 56 6 643
Tax rate 19.7% 22.0%
Net earnings $1,926 $2,282
Diluted EPS
$0.93 $1.10

© Copyright 2012 Hewlett-Packard Development Company, L.P. The information contained herein is subject to change without notice. 34
© Copyright 2012 Hewlett-Packard Development Company, L.P. The information contained herein is subject to change without notice.
Q2 FY11 GAAP to non-GAAP bridge
In millions except
per share amounts GAAP Amort. of
Purchased Intangibles Restructuring Acquisition
related charges Non-GAAP
Revenue $31,632 $31,632
Cost of sales 23,832 23,832
Total OpEx 4,832 (413) (158) (21) 4,240
Operating profit 2,968 413 158 21 3,560
Interest & other, net (76) (76)
Pre-tax earnings 2,892 413 158 21 3,484
Income tax
588 126 46 7 767
Tax rate 20.3% 22.0%
Net earnings $2,304 $2,717
Diluted EPS
$1.05 $1.24
© Copyright 2012 Hewlett-Packard Development Company, L.P. The information contained herein is subject to change without notice. 35
© Copyright 2012 Hewlett-Packard Development Company, L.P. The information contained herein is subject to change without notice.
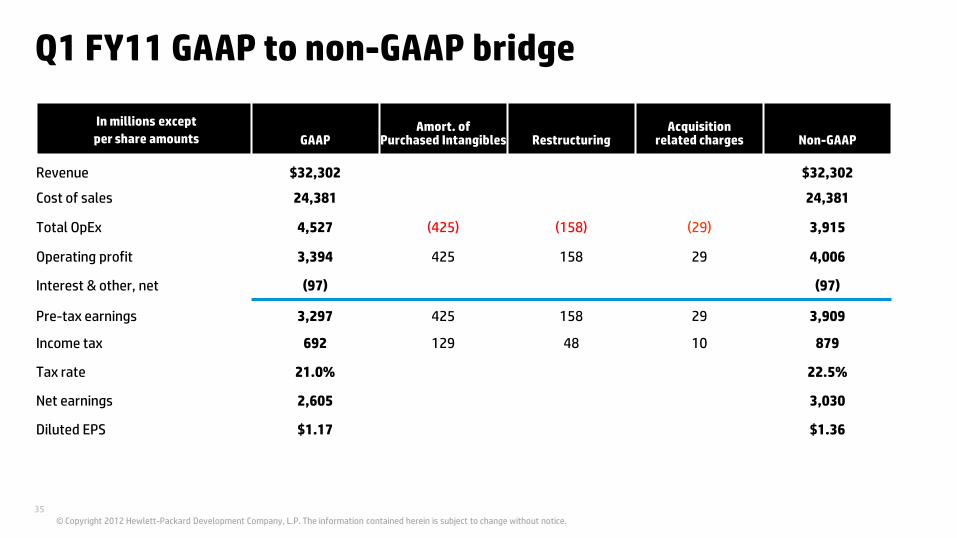
Q1 FY11 GAAP to non-GAAP bridge
In millions except
per share amounts GAAP Amort. of
Purchased Intangibles Restructuring Acquisition
related charges Non-GAAP
Revenue $32,302 $32,302
Cost of sales 24,381 24,381
Total OpEx 4,527 (425) (158) (29) 3,915
Operating profit 3,394 425 158 29 4,006
Interest & other, net (97) (97)
Pre-tax earnings 3,297 425 158 29 3,909
Income tax 692 129 48 10 879
Tax rate 21.0% 22.5%
Net earnings 2,605 3,030
Diluted EPS
$1.17 $1.36

© Copyright 2012 Hewlett-Packard Development Company, L.P. The information contained herein is subject to change without notice. 36
© Copyright 2012 Hewlett-Packard Development Company, L.P. The information contained herein is subject to change without notice.
FY10 GAAP to non-GAAP bridge
In millions except
per share amounts GAAP Amort. of
Purchased Intangibles Restructuring Acquisition
related charges Non-GAAP
Revenue $126,033 $126,033
Cost of sales 95,852 95,852
Total OpEx 18,702 (1,484) (1,144) (293) 15,781
Operating profit 11,479 1,484 1,144 293 14,400
Interest & other, net (505) (505)
Pre-tax earnings 10,974 1,484 1,144 293 13,895
Income tax
2,213 391 342 83 3,029
Tax rate 20.2% 21.8%
Net earnings 8,761 10,866
Diluted EPS
$3.69 $4.58

© Copyright 2012 Hewlett-Packard Development Company, L.P. The information contained herein is subject to change without notice. 37
© Copyright 2012 Hewlett-Packard Development Company, L.P. The information contained herein is subject to change without notice.
Q4 FY10 GAAP to non-GAAP bridge
In millions except
per share amounts GAAP Amort. of
Purchased Intangibles Restructuring Acquisition
related charges Non-GAAP
Revenue $33,278 $33,278
Cost of sales 24,968 24,968
Total OpEx 5,015 (424) (235) (51) 4,305
Operating profit 3,295 424 235 51 4,005
Interest & other, net (81) (81)
Pre-tax earnings 3,214 424 235 51 3,924
Income tax 676 98 68 18 860
Tax rate 21.0% 21.9%
Net earnings 2,538 3,064
Diluted EPS
$1.10 $1.33

© Copyright 2012 Hewlett-Packard Development Company, L.P. The information contained herein is subject to change without notice. 38
© Copyright 2012 Hewlett-Packard Development Company, L.P. The information contained herein is subject to change without notice.
Q3 FY10 GAAP to non-GAAP bridge
In millions except
per share amounts GAAP Amort. of
Purchased Intangibles Restructuring Acquisition
related charges Non-GAAP
Revenue $30,729 $30,729
Cost of sales 23,340 23,340
Total OpEx 5,066 (383) (598) (127) 3,958
Operating profit 2,323 383 598 127 3,431
Interest & other, net (134) (134)
Pre-tax earnings 2,189 383 598 127 3,297
Income tax
416 100 175 31 722
Tax rate 19.0% 21.9%
Net earnings 1,773 2,575
Diluted EPS
$0.75 $1.08
© Copyright 2012 Hewlett-Packard Development Company, L.P. The information contained herein is subject to change without notice. 39
© Copyright 2012 Hewlett-Packard Development Company, L.P. The information contained herein is subject to change without notice.
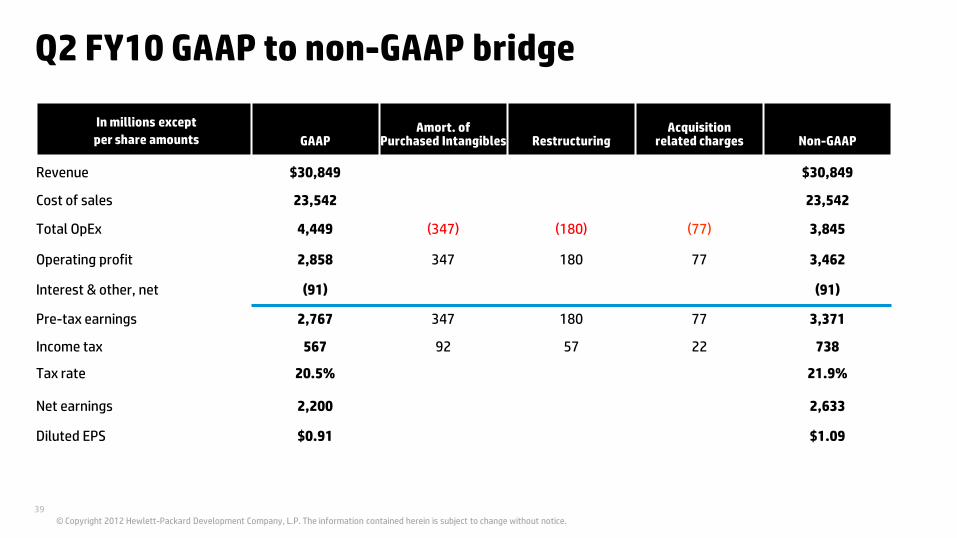
Q2 FY10 GAAP to non-GAAP bridge
In millions except
per share amounts GAAP Amort. of
Purchased Intangibles Restructuring Acquisition
related charges Non-GAAP
Revenue $30,849 $30,849
Cost of sales 23,542 23,542
Total OpEx 4,449 (347) (180) (77) 3,845
Operating profit 2,858 347 180 77 3,462
Interest & other, net (91) (91)
Pre-tax earnings 2,767 347 180 77 3,371
Income tax 567 92 57 22 738
Tax rate 20.5% 21.9%
Net earnings 2,200 2,633
Diluted EPS
$0.91 $1.09
© Copyright 2012 Hewlett-Packard Development Company, L.P. The information contained herein is subject to change without notice. 40
© Copyright 2012 Hewlett-Packard Development Company, L.P. The information contained herein is subject to change without notice.
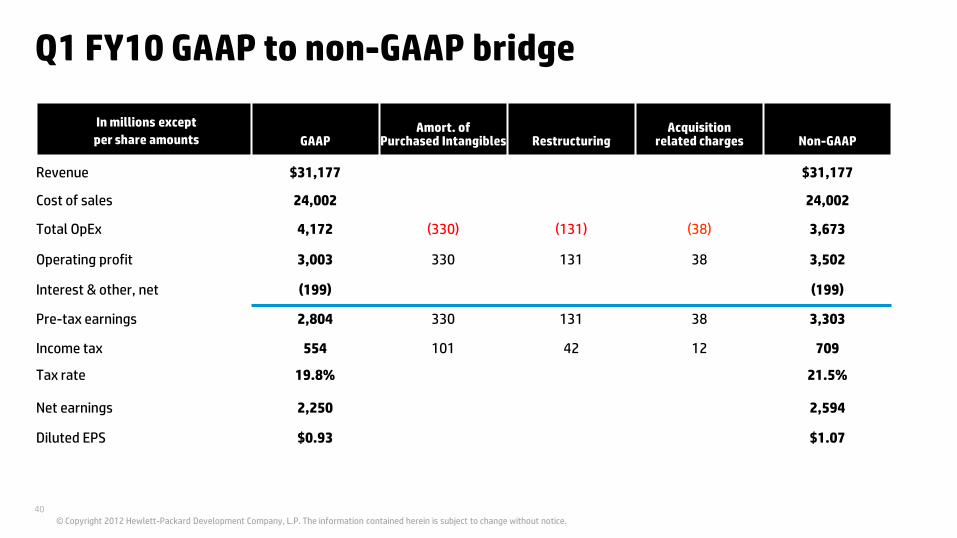
Q1 FY10 GAAP to non-GAAP bridge
In millions except
per share amounts GAAP Amort. of
Purchased Intangibles Restructuring Acquisition
related charges Non-GAAP
Revenue $31,177 $31,177
Cost of sales 24,002 24,002
Total OpEx 4,172 (330) (131) (38) 3,673
Operating profit 3,003 330 131 38 3,502
Interest & other, net (199) (199)
Pre-tax earnings 2,804 330 131 38 3,303
Income tax
554 101 42 12 709
Tax rate 19.8% 21.5%
Net earnings 2,250 2,594
Diluted EPS
$0.93 $1.07

© Copyright 2012 Hewlett-Packard Development Company, L.P. The information contained herein is subject to change without notice. 41
© Copyright 2012 Hewlett-Packard Development Company, L.P. The information contained herein is subject to change without notice.
FY09 GAAP to non-GAAP bridge
In millions except
per share amounts GAAP Amort. of
Purchased Intangibles Restructuring Acquisition
related charges Non-GAAP
Revenue $114,552 $114,552
Cost of sales 87,489 87,489
Total OpEx 16,927 (1,578) (640) (242) 14,467
Operating profit 10,136 1,578 640 242 12,596
Interest & other, net (721) (721)
Pre-tax earnings 9,415 1,578 640 242 11,875
Income tax 1,755 451 197 79 2,482
Tax rate 18.6% 20.9%
Net earnings 7,660 9,393
Diluted EPS
$3.14 $3.85

© Copyright 2012 Hewlett-Packard Development Company, L.P. The information contained herein is subject to change without notice. 42
© Copyright 2012 Hewlett-Packard Development Company, L.P. The information contained herein is subject to change without notice.
Q4 FY09 GAAP to non-GAAP bridge
In millions except
per share amounts GAAP Amort. of
Purchased Intangibles Restructuring Acquisition
related charges Non-GAAP
Revenue $30,777 $30,777
Cost of sales 23,466 23,466
Total OpEx 4,178 (401) (38) (60) 3,679
Operating profit 3,133 401 38 60 3,632
Interest & other, net (132) (132)
Pre-tax earnings 3,001 401 38 60 3,500
Income tax 589 117 11 19 736
Tax rate 19.6% 21.0%
Net earnings 2,412 2,764
Diluted EPS
$0.99 $1.14
Related Documents