Citation: Kaminski, M.M. How Strong Are Soccer Teams? The “Host Paradox” and Other Counterintuitive Properties of FIFA’s Former Ranking System. Games 2022, 13, 22. https:// doi.org/10.3390/g13020022 Academic Editors: Maria Gallego and Ulrich Berger Received: 27 November 2021 Accepted: 25 February 2022 Published: 3 March 2022 Publisher’s Note: MDPI stays neutral with regard to jurisdictional claims in published maps and institutional affil- iations. Copyright: © 2022 by the author. Licensee MDPI, Basel, Switzerland. This article is an open access article distributed under the terms and conditions of the Creative Commons Attribution (CC BY) license (https:// creativecommons.org/licenses/by/ 4.0/). games Article How Strong Are Soccer Teams? The “Host Paradox” and Other Counterintuitive Properties of FIFA’s Former Ranking System Marek M. Kaminski Department of Political Science and Institute for Mathematical Behavioral Sciences, University of California, Social Science Plaza, Irvine, CA 92697, USA; [email protected] Abstract: I investigate the paradoxes associated with the Fédération Internationale de Football Association (FIFA) point-based ranking of national soccer teams. The ranking has been plagued with paradoxes that incentivize teams to avoid playing friendly matches, i.e., matches that are not part of any official FIFA tournament or preliminaries, and applying other counterintuitive strategies. The most spectacular paradox was the dramatic underrating of the hosts of major tournaments. For a long time, host teams, which were absent from preliminary matches, would play only friendly matches that awarded few points. Here, I present three models that estimate the magnitude of the resulting “host effect” at 14.2–16 positions. Such an estimate counteracts the intuition that a large investment in hosting a tournament should result in an improvement in the host team’s standing. However, as discussed here, a given host’s low ranking could decrease interest in the tournament, and likely result in a major loss of advertisement revenue. Keywords: football; soccer; FIFA ranking; social choice paradoxes; point systems; host paradox; World Cup 1. Introduction I investigate the paradoxes associated with the former FIFA ranking. Among a variety of its counterintuitive properties was a very poor treatment of tournament hosts. The source of problems was the low weight assigned to friendly matches, or friendlies, i.e., matches that are not part of any official FIFA tournament or preliminaries, versus the preliminaries of both the World Cup and the regional Federation Cups (the multiplier of 1 versus 2.5). Hosts advance to main tournaments automatically; therefore, they do not play in the preliminaries, which typically started about two years before the main event. Thus, for approximately two years before the tournament, the host plays only low-scoring friendlies. Here, it is important to notice that a team’s ranking is the weighted sum of its scores over the course of four years (with the weights equal to 0.2, 0.3, 0.5, and 1, from the most distant year to the most recent, respectively). If a team only played friendlies over two years, the friendlies had a total weight approximately equal to 0.75 of all the team’s results of the past four years. Thus, paradoxically, even if a host scores very well in the friendlies, its position in the rankings is usually doomed to decline. FIFA has vaguely acknowledged that host teams have “less opportunity for getting more points” [1]. There are also various publications that describe the problem with respect to specific hosts; for example, Wang and Vandebroek [2] described how their ranking system and its variants would have avoided the host effect problem for the organizers of Euro 2012—Poland and Ukraine.). Consider the 2018 soccer World Cup that took place in Russia. At the time, Russia was criticized by various countries for the annexation of Ukrainian Crimea and the “hybrid war” in Donbass. Ultimately, the presidents of some participating countries decided to skip the World Cup. Another problem was the poor standing of the Russian team. On 7 June 2018, just before the first match, the Fédération Internationale de Football Association (FIFA) rated Russian Sbornaya at position 70, the lowest ranked team of all 32 World Cup Games 2022, 13, 22. https://doi.org/10.3390/g13020022 https://www.mdpi.com/journal/games

Welcome message from author
This document is posted to help you gain knowledge. Please leave a comment to let me know what you think about it! Share it to your friends and learn new things together.
Transcript
�����������������
Citation: Kaminski, M.M. How
Strong Are Soccer Teams? The “Host
Paradox” and Other Counterintuitive
Properties of FIFA’s Former Ranking
System. Games 2022, 13, 22. https://
doi.org/10.3390/g13020022
Academic Editors: Maria Gallego and
Ulrich Berger
Received: 27 November 2021
Accepted: 25 February 2022
Published: 3 March 2022
Publisher’s Note: MDPI stays neutral
with regard to jurisdictional claims in
published maps and institutional affil-
iations.
Copyright: © 2022 by the author.
Licensee MDPI, Basel, Switzerland.
This article is an open access article
distributed under the terms and
conditions of the Creative Commons
Attribution (CC BY) license (https://
creativecommons.org/licenses/by/
4.0/).
games
Article
How Strong Are Soccer Teams? The “Host Paradox” and OtherCounterintuitive Properties of FIFA’s Former Ranking SystemMarek M. Kaminski
Department of Political Science and Institute for Mathematical Behavioral Sciences, University of California,Social Science Plaza, Irvine, CA 92697, USA; [email protected]
Abstract: I investigate the paradoxes associated with the Fédération Internationale de FootballAssociation (FIFA) point-based ranking of national soccer teams. The ranking has been plaguedwith paradoxes that incentivize teams to avoid playing friendly matches, i.e., matches that are notpart of any official FIFA tournament or preliminaries, and applying other counterintuitive strategies.The most spectacular paradox was the dramatic underrating of the hosts of major tournaments.For a long time, host teams, which were absent from preliminary matches, would play only friendlymatches that awarded few points. Here, I present three models that estimate the magnitude of theresulting “host effect” at 14.2–16 positions. Such an estimate counteracts the intuition that a largeinvestment in hosting a tournament should result in an improvement in the host team’s standing.However, as discussed here, a given host’s low ranking could decrease interest in the tournament,and likely result in a major loss of advertisement revenue.
Keywords: football; soccer; FIFA ranking; social choice paradoxes; point systems; host paradox;World Cup
1. Introduction
I investigate the paradoxes associated with the former FIFA ranking. Among a varietyof its counterintuitive properties was a very poor treatment of tournament hosts. Thesource of problems was the low weight assigned to friendly matches, or friendlies, i.e.,matches that are not part of any official FIFA tournament or preliminaries, versus thepreliminaries of both the World Cup and the regional Federation Cups (the multiplier of1 versus 2.5). Hosts advance to main tournaments automatically; therefore, they do notplay in the preliminaries, which typically started about two years before the main event.Thus, for approximately two years before the tournament, the host plays only low-scoringfriendlies. Here, it is important to notice that a team’s ranking is the weighted sum of itsscores over the course of four years (with the weights equal to 0.2, 0.3, 0.5, and 1, from themost distant year to the most recent, respectively). If a team only played friendlies over twoyears, the friendlies had a total weight approximately equal to 0.75 of all the team’s resultsof the past four years. Thus, paradoxically, even if a host scores very well in the friendlies,its position in the rankings is usually doomed to decline. FIFA has vaguely acknowledgedthat host teams have “less opportunity for getting more points” [1]. There are also variouspublications that describe the problem with respect to specific hosts; for example, Wang andVandebroek [2] described how their ranking system and its variants would have avoidedthe host effect problem for the organizers of Euro 2012—Poland and Ukraine.).
Consider the 2018 soccer World Cup that took place in Russia. At the time, Russia wascriticized by various countries for the annexation of Ukrainian Crimea and the “hybridwar” in Donbass. Ultimately, the presidents of some participating countries decided toskip the World Cup. Another problem was the poor standing of the Russian team. On7 June 2018, just before the first match, the Fédération Internationale de Football Association(FIFA) rated Russian Sbornaya at position 70, the lowest ranked team of all 32 World Cup
Games 2022, 13, 22. https://doi.org/10.3390/g13020022 https://www.mdpi.com/journal/games
Games 2022, 13, 22 2 of 22
competitors. Critics pronounced that the Russian team was “arguably the poorest in thehistory of Russian football” [3], saying that Russia was lucky to be drawn in a relativelyeasy first-round group, but also that this was “even better news for Uruguay, Saudi Arabiaand Egypt, because they get to face Russia—the worst Pot 1 team by a wide margin” [4].In fact, Russia turned out to be a tough opponent and achieved considerable success inthe tournament. For major competitions, teams are grouped into “pots”: Pot 1 includesthe top-ranked teams worldwide (for the World Cup or preliminaries) or within eachconfederation (for Confederation Cups or preliminaries); Pot 2 includes the same numberof teams ranked immediately lower, and so on. Each grouping includes one team fromeach pot.
Russia humiliated Saudi Arabia 5:0 and convincingly beat Egypt 3:1 in the first-group,round-robin phase of the 2018 World Cup. Ultimately, Russia became the first team toadvance to the last-16 knockout phase. Among the eight Pot 1 teams, Poland and Germanyfailed to qualify, and Argentina did so only thanks to a last-minute goal. Russia’s “safetymargin” was comfortable: they would have advanced due to their superior goal difference.Then, in two dramatic matches, Russia first beat the soccer superpower Spain in a penaltyshoot-out, and then narrowly lost a penalty shoot-out to Croatia—an ultimate finalist thatlost only to France. Russia was thus very close to advancing to the semifinals.
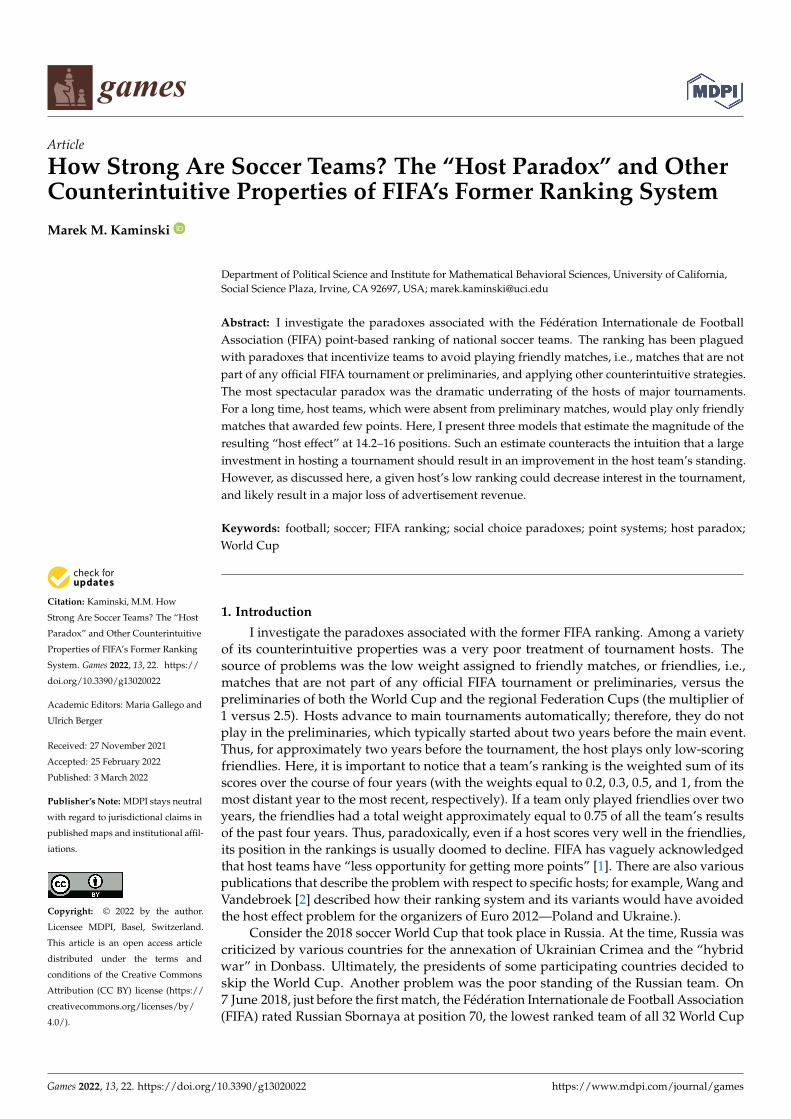
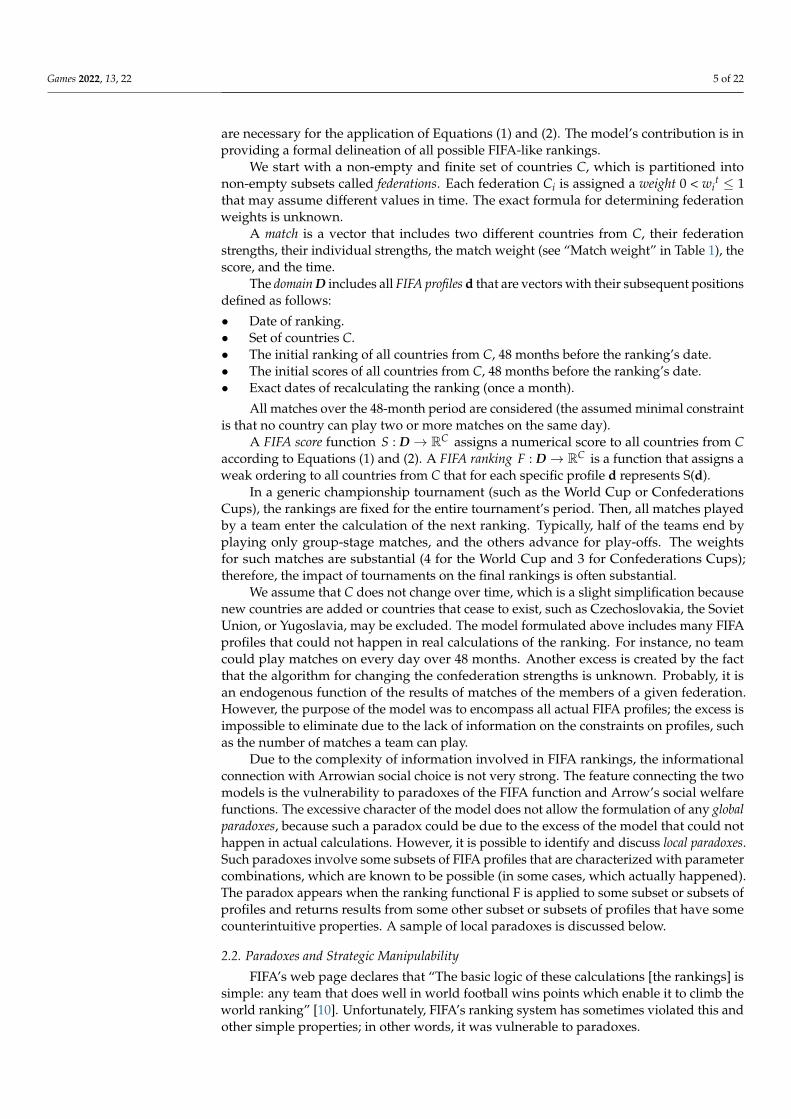
Better-than-expected performance of the host of a tournament is likely to be partlydue to home-field advantage, an effect widely observed in major soccer national leagues(see Table 2 in [5]. However, the potential home bias effect comes during the tournament,whereas any substantial host’s slide in the rankings precedes the tournament. Thus,possible home bias present in tournament results does not explain the pre-tournament fallin the rankings (see Figure 1). Reviewing Russia’s record, we must ask: was it really anoverperformance of the Russian team? Systems other than the FIFA’s ranking rated theRussian Sbornaya much higher: from 42 [6] to 45 [7], and 49 [8].
Games 2022, 13, x FOR PEER REVIEW 3 of 23
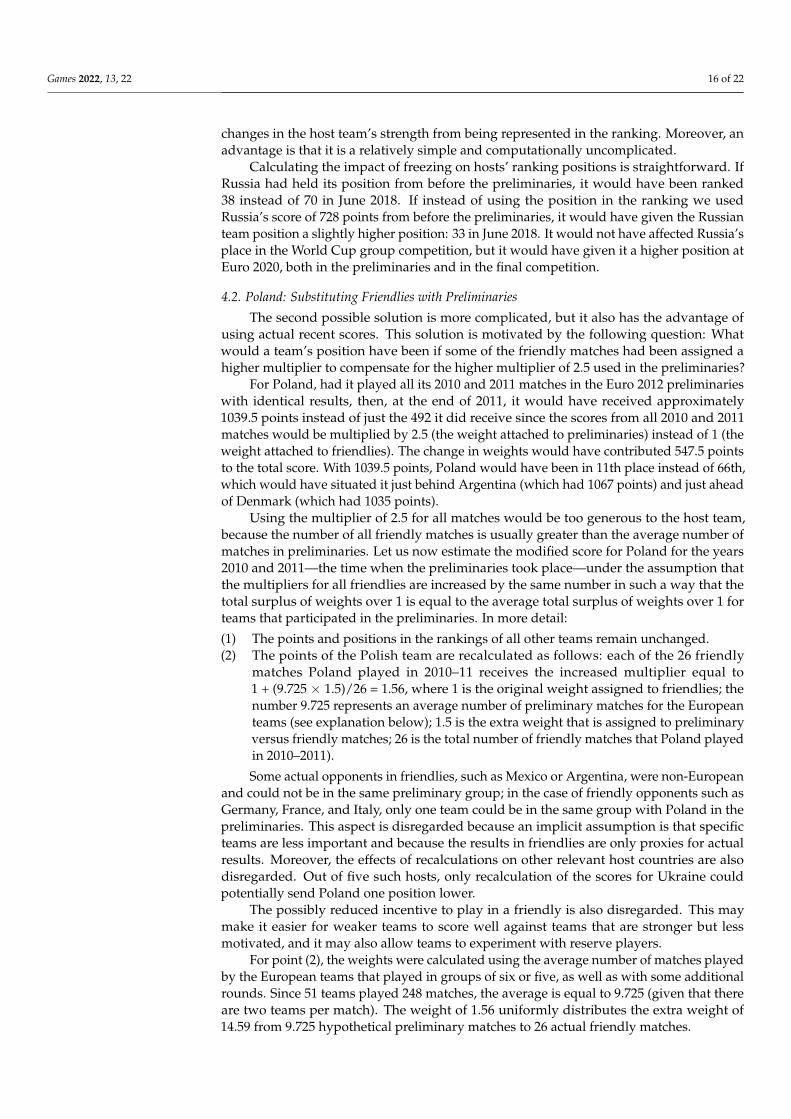
Figure 1. Russia’s downturn in FIFA rankings in the 30 months prior to the 2018 World Cup. Note: Figure illustrates Russia’s position in the FIFA rankings from January 2016 to June 2018. A major slide follows the start of the preliminaries on 4 September 2016.
In this paper, I investigate this perverse “host effect,” which can lead to what I term a “host paradox”. The “host effect” was originally introduced by Kaminski [9]. The preliminary analysis dealt mostly with the performance of the Polish team and the data were limited to pre-2012 tournaments. In Section 2, I begin by reconstructing the details of the former FIFA ranking system and briefly discuss a few paradoxical traits of the ranking. In Section 3, using the data from past tournaments, I examine the magnitude of the host effect. Next, I discuss possible solutions to the paradox. Finally, I conclude with an assessment of the paradox’s consequences.
2. The Paradoxes and Strategic Manipulability of FIFA’s Ranking System FIFA is the international governing body of 211 national soccer associations.
Founded in 1904 and headquartered in Zürich, Switzerland, FIFA is managed by a 25-member executive committee, which is headed by a president. FIFA’s main activity is the organization of the FIFA World Cup, the preliminaries, and other tournaments. It coordinates the activities of six regional federations that supervise their members’ local championships and friendlies. The six federations include the Asian Football Confederation (AFC, with Australia included); Confederation of African Football (CAF); Confederation of North, Central American and Caribbean Association Football (CONCACAF); South American Football Confederation (CONMEBOL); Oceania Football Confederation (OFC); and Union of European Football Associations (UEFA).
Among FIFA’s highest profile activities is announcing its monthly ranking of national soccer teams. From this ranking, the media duly notes the positions of the teams, and their exact location—whether high or low—can affect the generosity of team sponsors. Moreover, a team’s ranking determines its chances of drawing opponents in the preliminaries and main tournaments of the various cups, including the World Cup, because of its allocation among different pots. Having a higher ranking implies a lower expected ranking of opponent. For example, consider team A from Pot 1 versus team B from Pot 2. A and B have the same chance of meeting any specific opponent from Pot 3 and higher pots. However, in addition, A will face one opponent from Pot 2 while B will
Figure 1. Russia’s downturn in FIFA rankings in the 30 months prior to the 2018 World Cup. Note:Figure illustrates Russia’s position in the FIFA rankings from January 2016 to June 2018. A majorslide follows the start of the preliminaries on 4 September 2016.
Games 2022, 13, 22 3 of 22
Similar cases of “overperformance” have happened in previous tournaments as well,and they also involved tournament hosts outperforming expectations. In almost all cases,the tournament was preceded by a long slide of the host in the ranking. As mentionedearlier, the problem was that FIFA’s ranking system seriously undervalued the friendlymatches played by the tournaments’ hosts, whereas other teams played in highly valuedpreliminaries. The preliminaries for the 2018 World Cup started as early as 12 March 2015(in Asia), and as late as 4 September 2016 (in Europe), and they lasted until 15 November2017. Thus, in the time leading up to the 2018 World Cup, Russia had predictably beensliding in the world rankings (see Figure 1).
In this paper, I investigate this perverse “host effect,” which can lead to what I terma “host paradox”. The “host effect” was originally introduced by Kaminski [9]. Thepreliminary analysis dealt mostly with the performance of the Polish team and the datawere limited to pre-2012 tournaments. In Section 2, I begin by reconstructing the detailsof the former FIFA ranking system and briefly discuss a few paradoxical traits of theranking. In Section 3, using the data from past tournaments, I examine the magnitude ofthe host effect. Next, I discuss possible solutions to the paradox. Finally, I conclude with anassessment of the paradox’s consequences.
2. The Paradoxes and Strategic Manipulability of FIFA’s Ranking System
FIFA is the international governing body of 211 national soccer associations. Foundedin 1904 and headquartered in Zürich, Switzerland, FIFA is managed by a 25-memberexecutive committee, which is headed by a president. FIFA’s main activity is the organi-zation of the FIFA World Cup, the preliminaries, and other tournaments. It coordinatesthe activities of six regional federations that supervise their members’ local championshipsand friendlies. The six federations include the Asian Football Confederation (AFC, withAustralia included); Confederation of African Football (CAF); Confederation of North,Central American and Caribbean Association Football (CONCACAF); South AmericanFootball Confederation (CONMEBOL); Oceania Football Confederation (OFC); and Unionof European Football Associations (UEFA).
Among FIFA’s highest profile activities is announcing its monthly ranking of nationalsoccer teams. From this ranking, the media duly notes the positions of the teams, and theirexact location—whether high or low—can affect the generosity of team sponsors. Moreover,a team’s ranking determines its chances of drawing opponents in the preliminaries andmain tournaments of the various cups, including the World Cup, because of its allocationamong different pots. Having a higher ranking implies a lower expected ranking ofopponent. For example, consider team A from Pot 1 versus team B from Pot 2. A andB have the same chance of meeting any specific opponent from Pot 3 and higher pots.However, in addition, A will face one opponent from Pot 2 while B will face one opponentfrom Pot 1. The position in the ranking is a proxy for the teams’ level of strength; therefore,A will theoretically face a weaker opponent than B.
FIFA’s ranking system has evolved over time. Before a major rule change that occurredin 2018, the previous system (established in 2006) factored in the results of the officialmatches that the national team played in during the previous four years, their opponents’ranking positions, the strength level of the opponents’ federations, and the importance ofeach match. Each team receives points for every game it plays. Then, about once a month,the teams’ average scores are calculated for the past 12 months, the 12 months before that,etc. A team’s ranking position reflects its weighted average score for the prior 48 months, asort of a moving weighted average. The details of the procedure are presented in Table 1.The procedures, scores, and ranking positions are drawn from FIFA’s website [10]. It shouldbe noted that the procedure for ranking women’s soccer teams is different; see [11] for acomparison of the FIFA men and women ranking systems.
Games 2022, 13, 22 4 of 22
Table 1. Factors affecting the scores for individual matches.
Factor Symbol Definition
Match score ms Victory: 3; tie: 1; defeat: 0; penalty shoot-out: 2 for winner, 1 for loser
Match weight mw Friendly: 1; preliminaries to World or Federation Cup: 2.5;Federation or Confederation Cup: 3; World Cup: 4
Opponent strength str = 1, st = 200
For opponent ranked r: 1 < r ≤ 150, st = 200 − rr > 150, st = 50
Federation strength fs In June 2018: CONMEBOL—1; UEFA—0.99; other—0.85Note: If preliminaries included a two-match game, and if the results were symmetric, the result of the secondmatch was disregarded and the points were assigned as if penalties were applied. Supposedly, a change took placein 2012 regarding this aspect, but the exact new rules were never perfectly clear and could not be reconstructed.
A score for every match was equal to the product of four factors characterizing thestrength of the opponent (as a sort of inversed ranking) and its confederation, the match’simportance, and the match’s result:
sm = ms×mw× st× f s (1)
The average score for the year (beginning at a certain date and ending exactly 12 monthslater) was equal to the arithmetic mean of all matches if the team played at least five times.With a smaller number of matches (i.e., between 0 and 4), the average was multiplied by0.2 × m. The position in the ranking, r, at a given moment represented the total weightedsum of points over the previous four years according to the formula:
s = sm−1 + 0.5 sm−2 + 0.3 sm−3 + 0.2 sm−4 (2)
where sm−i was the average score of the matches played over the period between 12(i − 1)and 12i months previously.
2.1. The Model
The problem of ranking certain objects based on individual information was firstformalized by Arrow [12] and was implicitly present in various earlier works of welfareeconomists. Arrow’s simple setup involved assigning linear social orderings to all profilesof individual linear orderings. In the Arrowian approach, there was no “true” underlyingsocial ranking, but only the aggregation of preferences; on the other side of the continuum,there are problems such as Condorcet jury, where the task is to find the underlying trueoutcome. Soccer and other sport rankings occupy the position somewhere between the twoextremes: there is no true deterministic ranking of team’s strength. The ranking should beprobably treated as some probabilistic device that provides estimates of teams’ strengths ora semi order, where only big differences in the scores are meaningful. It is intuitively clearthat a strong team paired with a weak team would have a better chance of winning, butit is also clear that this relation is not deterministic. Empirically, the situation resemblesselecting a competition winner based on experts’ judgments. There is some arbitrariness inthe judgments, but they are also not completely detached from candidates’ performance(see, e.g., [13]). Empirical analysis of factors affecting match results such as home bias isperformed using success functions [5].
FIFA’s soccer rankings consider much more complex information than preferenceprofiles. Moreover, the constraints on certain relevant parameters are not well defined.The informal model formulated below is “excessive” in that it covers an excessive domainthat encompasses all possible combinations of information components, but also somecombinations that would not happen in reality. The ranking is defined for a specific dateand aggregates the information over a period of time. The parameter “time” assumesall dates from the prior 48 months as values. Our goal is to define all components that
Games 2022, 13, 22 5 of 22
are necessary for the application of Equations (1) and (2). The model’s contribution is inproviding a formal delineation of all possible FIFA-like rankings.
We start with a non-empty and finite set of countries C, which is partitioned intonon-empty subsets called federations. Each federation Ci is assigned a weight 0 < wi
t ≤ 1that may assume different values in time. The exact formula for determining federationweights is unknown.
A match is a vector that includes two different countries from C, their federationstrengths, their individual strengths, the match weight (see “Match weight” in Table 1), thescore, and the time.
The domain D includes all FIFA profiles d that are vectors with their subsequent positionsdefined as follows:
• Date of ranking.• Set of countries C.• The initial ranking of all countries from C, 48 months before the ranking’s date.• The initial scores of all countries from C, 48 months before the ranking’s date.• Exact dates of recalculating the ranking (once a month).
All matches over the 48-month period are considered (the assumed minimal constraintis that no country can play two or more matches on the same day).
A FIFA score function S : D→ RC assigns a numerical score to all countries from Caccording to Equations (1) and (2). A FIFA ranking F : D→ RC is a function that assigns aweak ordering to all countries from C that for each specific profile d represents S(d).
In a generic championship tournament (such as the World Cup or ConfederationsCups), the rankings are fixed for the entire tournament’s period. Then, all matches playedby a team enter the calculation of the next ranking. Typically, half of the teams end byplaying only group-stage matches, and the others advance for play-offs. The weightsfor such matches are substantial (4 for the World Cup and 3 for Confederations Cups);therefore, the impact of tournaments on the final rankings is often substantial.
We assume that C does not change over time, which is a slight simplification becausenew countries are added or countries that cease to exist, such as Czechoslovakia, the SovietUnion, or Yugoslavia, may be excluded. The model formulated above includes many FIFAprofiles that could not happen in real calculations of the ranking. For instance, no teamcould play matches on every day over 48 months. Another excess is created by the factthat the algorithm for changing the confederation strengths is unknown. Probably, it isan endogenous function of the results of matches of the members of a given federation.However, the purpose of the model was to encompass all actual FIFA profiles; the excess isimpossible to eliminate due to the lack of information on the constraints on profiles, suchas the number of matches a team can play.
Due to the complexity of information involved in FIFA rankings, the informationalconnection with Arrowian social choice is not very strong. The feature connecting the twomodels is the vulnerability to paradoxes of the FIFA function and Arrow’s social welfarefunctions. The excessive character of the model does not allow the formulation of any globalparadoxes, because such a paradox could be due to the excess of the model that could nothappen in actual calculations. However, it is possible to identify and discuss local paradoxes.Such paradoxes involve some subsets of FIFA profiles that are characterized with parametercombinations, which are known to be possible (in some cases, which actually happened).The paradox appears when the ranking functional F is applied to some subset or subsets ofprofiles and returns results from some other subset or subsets of profiles that have somecounterintuitive properties. A sample of local paradoxes is discussed below.
2.2. Paradoxes and Strategic Manipulability
FIFA’s web page declares that “The basic logic of these calculations [the rankings] issimple: any team that does well in world football wins points which enable it to climb theworld ranking” [10]. Unfortunately, FIFA’s ranking system has sometimes violated this andother simple properties; in other words, it was vulnerable to paradoxes.
Games 2022, 13, 22 6 of 22
Voting paradoxes were first investigated by Condorcet and Dodgson (see [14,15]). Theterm “paradox” was made popular in social choice theory, and especially in its politicalscience applications, in books by Brams [16] and Ordeshook [17]. The idea denotes asituation where a ranking behaves contrary to basic intuition, i.e., it does not satisfy certainproperties that would be informally considered “obvious”, “desired”, or “fair”. FIFA’sranking has generated multiple paradoxes and multiple incentives for strategically sensible,but also apparently counterintuitive behavior.
Vulnerability to paradoxes is often closely related to vulnerability to manipulation.Farquharson [18] suspected that Arrow’s theorem implies manipulability of all reasonablevoting methods; this suspicion was later proved by Gibbard [19] and Satterthwaite [20].This is also the case with FIFA’s ranking. Lasek et al. [21] listed several methods for the“optimization” of a team’s position in the FIFA rankings that include choosing the numberof matches, selecting the ideal opponents, avoiding friendlies, and creating score-improvingcoalitions. Wang and Vandebroek [2] further analyzed such strategic opportunities; as didKaiser [22,23] in another sport.
Certain features of the FIFA formula were bound to generate criticism from soccerfans. For instance, the number of points did not depend on whether a team played at home.Thus, in a match of similar importance, a team would receive more points for defeatingQatar at home (the controversial organizer of the 2022 World Cup, and, as of 7 June 2018,ranked 98th) than for a tie with Brazil (ranked 2nd) played in the famously intimidatingEstádio do Maracanã in Rio de Janeiro. Using the ranking positions and other data asof 7 June 2018, for any team, victory over Qatar would generate 102 × 3 × 0.85 = 260.1;however, a tie with Brazil would generate 198 × 1 × 1 = 198. The problem arises bothwith disregarding who was the host of the match and with the relatively high score of theweaker opponent.
Another problem is with the scores attached to friendlies. It is well understood thatfriendlies provide fewer points; therefore, a team that did well in the preliminaries couldstrategically avoid playing friendlies. For instance, Romania was criticized before the 2018World Cup preliminaries for strategically playing only one friendly (and being seeded).Similarly, Poland was criticized before the 2018 World Cup for not playing friendlies untilthe ranking seeded them in the top pot. Thanks to such quirks, a team could climb therankings despite common wisdom that would have placed that team much lower. Notably,in September 1993, as well as in July and August 1995, a relatively weak team of Norwaywas ranked second, whereas in April 2006, the United States was ranked fourth. When wereverse the ranking dates, in September 1993, the United States was ranked 26th, whereasin April 2006, Norway was ranked 40th.
Various paradoxical results happen systematically that are less obvious than “strategicmatch avoidance” and can be analyzed formally.
2.3. The Violation of Weak Goal Monotonicity
Intuitively, one might assume that a team’s score would increase, or at least stayunchanged, with each additional goal won by that team. However, until 2012, FIFA’srules sometimes violated this property, which may be called “weak goal monotonicity”. Aviolation happened when preliminaries included a two-legged, home-and-away fixture.When the results were symmetrical, the result of the second match was disregarded, andthe points were assigned as if penalty shots were applied.
For all teams A, B ∈ C, let us denote the score of team A from a match between Aand B when A scores a goals and B scores b goals as sma,b. A more formal definition of thisproperty is as follows:
Weak goal monotonicity: For all teams A, B ∈ C and for all matches between A and B,sma+1,b ≥ sma,b.
As an example, I provide the following scenario. Team A plays against Team B ina two-match competition to advance to the next round. A first defeats B at home 3:0,and then loses 0:3. If the match had ended at 0:2, A would have advanced to the next
Games 2022, 13, 22 7 of 22
round, receiving zero points for the lost match. When A concedes the third goal, thescore becomes symmetrical (3:0 and 0:3), and the result of the second match is decidedby penalties. However, crucially, we find that A’s score for this match would increasewith the conceding of a third goal, regardless of the result of the penalty shoot-out: If Aloses the penalty shoot-out, they receive some points with a multiplier of 1; on the otherhand, if A wins, the multiplier will be 2. In both cases, we see that the number for A ispositive, instead of receiving zero for losing 0:2. As an effect, conceding the third goalby A automatically increases A’s FIFA score for the match and, paradoxically, possibly itsposition in the rankings. Conversely, the mirror problem occurs for Team B, in that it wouldreceive more points for a match won 2:0 than for winning 3:0, regardless of the result of thepenalty shoot-out.
This “weak goal monotonicity” paradox has appeared in several matches. In theJordan–Kyrgyz Republic preliminaries on 19 October 2007, Jordan lost 0:2, and 10 dayslater, beat Kyrgyz Republic at home 2:0. Let us calculate the actual and hypothetical scorefor Jordan from the second match. The weights are as follows:
• 0.85—Opponent confederation’s strength.• 67—Opponent’s strength (Kyrgyz Republic on 24 October 2007 was ranked 133).• 2.5—Match’s weight (World Cup qualifier).• 2—Match’s score (Jordan won 2:0, and then it won penalty shots 6:5).
Jordan received a score of 284.75 for this match, i.e., the product of the four numberslisted above. For winning only 1:0, the last number on our list (the Match’s score) wouldhave been equal to 3, and Jordan would have received substantially more—0.85 × 67 × 2.5 × 3 = 427.125 points [24]. A similar problem was noted when, on12 July 2011, Saint Lucia defeated Aruba 4:2 after having lost previously, also by a scoreof 4:2. Furthermore, in November 2005, Australia beat Uruguay in a penalty shoot-outafter first losing 0:1, and then winning 1:0. Losing the goal guaranteed Uruguay the samescore as losing on penalties, or a better score in the case of winning the penalty shoot-out.Apparently, FIFA fixed this problem, although no proclaimed correction of the rules can befound [25]. For a comprehensive discussion of the problem, see [24].
In general, similar problems always appear when the result of a two-match competitionis settled by penalties. Penalties constitute an additional “mini-match” played after twosymmetrically completed games. If a penalty shoot-out affects the score, then we encounterdifficulties such as those described above. If the penalties do not affect the score, then thefact that one team beat the second one overall is disregarded.
2.4. Examples of Paradoxes and Their Strategic Consequences
Certain FIFA’s ranking local paradoxes are associated with non-intuitive shifts in theranking positions and violations of different versions of monotonicity (see Kaminski 2012).The following examples involve subsets of FIFA profiles with certain parameters fixed;under suitable ceteris paribus clauses, they illustrate the ranking’s potential for generatingparadoxes. Each of the examples discussed below can be formulated as an appropriateproperty or axiom that is violated.
In the examples below, we assume for simplicity that: (a) all teams (Reds, Blues, andpossibly Greens) played exactly five matches in the prior 12-month period; (b) all matchesplayed in the previous 48 months would not be reclassified into a different period afterthe ranking is modified; (c) no other matches were played between the time of the old andnew rankings by the teams in the examples or any other teams; and (d) the federations’strengths are equal to 1. The scores are rounded in the usual way.
Example 1. Winning a match moves the winner behind the loser.
The paradox is that, initially, Reds are ranked higher than Blues. In a friendly match,Reds defeat Blues, and as a result, Reds fall behind Blues in the ranking. For all teamsR, B ∈ C, let us denote R winning a match against B as RwB. Let us denote the ranking
Games 2022, 13, 22 8 of 22
of R and B before their match as r(R) and r(B), and the rankings after their match as r*(R)and r*(B).
Strong ranking reversal: For all teams R, B ∈ C and for all matches, [r(R) < r(B) & RwB]→ r∗(R) < r∗(B).
The numerical example illustrating the violation of this property is as follows:
• Reds: #20 in the ranking; 12 m points: 1100; total points in all previous periods: 200.• Blues: #30 in the ranking; 12 m points: 200; total points in all previous periods: 1050.
According to our assumptions, Reds are ranked higher than Blues with the totalof 1100 + 200 = 1300 points versus 200 + 1050 = 1250 points. Now, in a friendly match,Reds defeat Blues. Let us calculate the scores of both teams in the next ranking usingour assumptions:
• Reds receive 200 + 5/6 × 1100 + 1/6 × 170 = 1145.• Blues receive 1050 + 5/6 × 200 + 1/6 × 0 = 1216 2/3.
The next examples present the numbers that generate the described paradoxes in moreconcise formats. The rubrics in the examples are defined as follows:
• Team—the name of team.• Ranking—team’s ranking.• Score (last)—the average score from last year (five matches).• Score (3)—the average score from three previous years.• Final—the final score after the match or matches.
Example 2. Ranking leaders doomed to fall after the match regardless of the result.
Reds and Blues occupy the top two positions in the ranking. After their friendlymatch, a different team, Greens, is ranked first, regardless of the result. The propertythat is violated here may be formulated in a slightly more general way without assumingany specific positions for the three teams. Again, r(.) denotes the ranking before a matchbetween R and G and r*(.) denotes the ranking after the match. We assume that the onlychange in the parameters that happens is a single match between R and B.
Automatic exchange of leaders: For all teams R, B, G ∈ C, if r(R) < r(G) & r(B) <r(G) then r∗(R) < r∗(G) or r∗(B) < r∗(G).
A numerical example in Table 2 shows how this property may be violated.
Table 2. Automatic exchange of leaders.
Team Ranking Score (Last Year) Score (3) Final
Reds 1 1000 1000 no more than 1932Blues 2 990 1000 no more than 1933
Greens 3 950 1000 1950
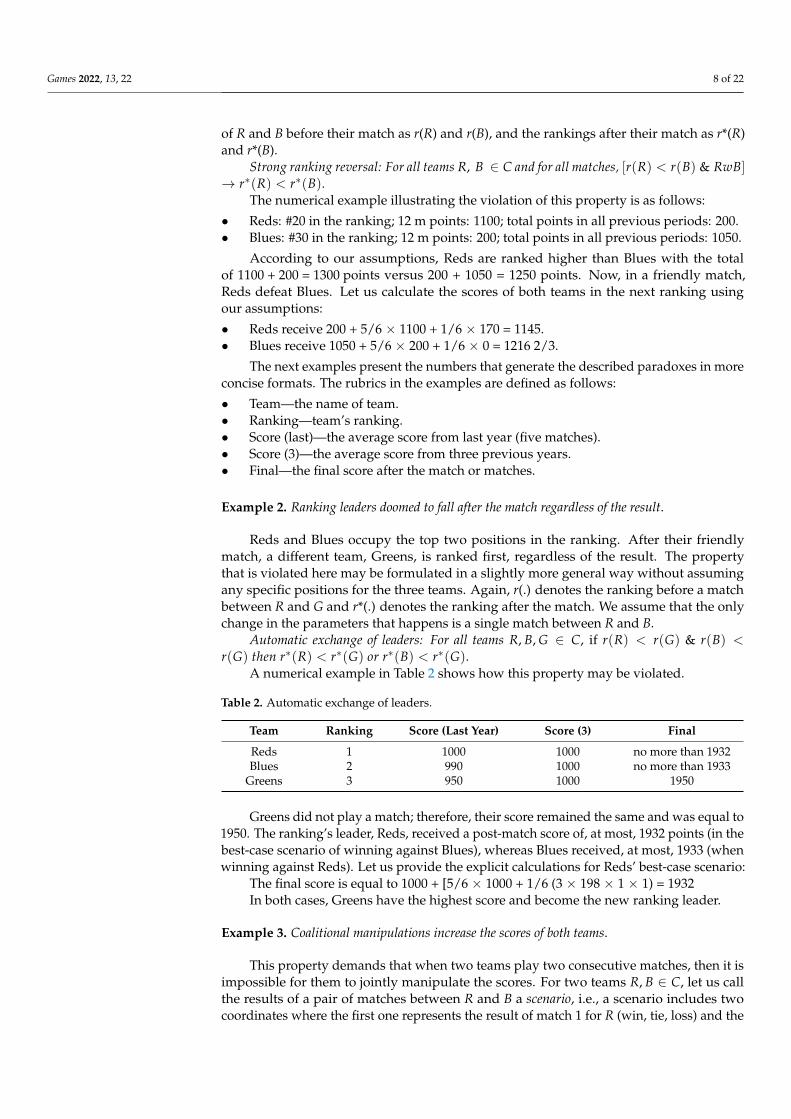
Greens did not play a match; therefore, their score remained the same and was equal to1950. The ranking’s leader, Reds, received a post-match score of, at most, 1932 points (in thebest-case scenario of winning against Blues), whereas Blues received, at most, 1933 (whenwinning against Reds). Let us provide the explicit calculations for Reds’ best-case scenario:
The final score is equal to 1000 + [5/6 × 1000 + 1/6 (3 × 198 × 1 × 1) = 1932In both cases, Greens have the highest score and become the new ranking leader.
Example 3. Coalitional manipulations increase the scores of both teams.
This property demands that when two teams play two consecutive matches, then it isimpossible for them to jointly manipulate the scores. For two teams R, B ∈ C, let us callthe results of a pair of matches between R and B a scenario, i.e., a scenario includes twocoordinates where the first one represents the result of match 1 for R (win, tie, loss) and the
Games 2022, 13, 22 9 of 22
second one represents the result of match 2 for R. For any two scenarios Si, let us denotethe points score by team R under Si as Si(A).
Coalition-proofness: For all teams R, B ∈ C and any two scenarios S1, S2, [S1(R) >S2(R)]→ [S1(B) ≤ S2(B)
].
The property says that R and B can never manipulate the results of the two matches tosimultaneously increase their scores as compared with some alternative scenario.
This problem appears always when, assuming the unchanged parameters betweenthe two matches, in S1 there are two ties and in S2 R wins once and B wins once. In such acase, the higher multiplier for winning is equal to 3, whereas the combined multiplier forthe two ties is equal to 2; this means that agreeing to one loss and one win versus two tiesincreases both teams’ total scores by 50%.
Example 4. Tournament punishes the winners.
Teams Reds, Blues, and Greens play in an informal round-robin tournament in onegroup. Ranking before the tournament: Reds–Blues–Greens; results of the round-robin:Reds win, Blues are second, and Greens are third (RtBtG); ranking after the tournament:Greens–Blues–Reds.
Without unnecessary formalizing the rules for a round-robin tournament, we use thecommon rules that the teams are ranked according to their total points and the tie-breakingrule is the surplus of goals (which is sufficient for our example). In this example, r(.) denotesthe rankings before the tournament and r*(.) denotes the ranking after the tournament. Weassume that the only change in the parameters that happens are three pairwise matchesamong R, B, and G.
Tournament reversal: For all teams R, B, G ∈ C and any tournament T, [RtBtG & r(R) < r(B)< r(G)] → ¬(r(R) > r(B) > r(G).
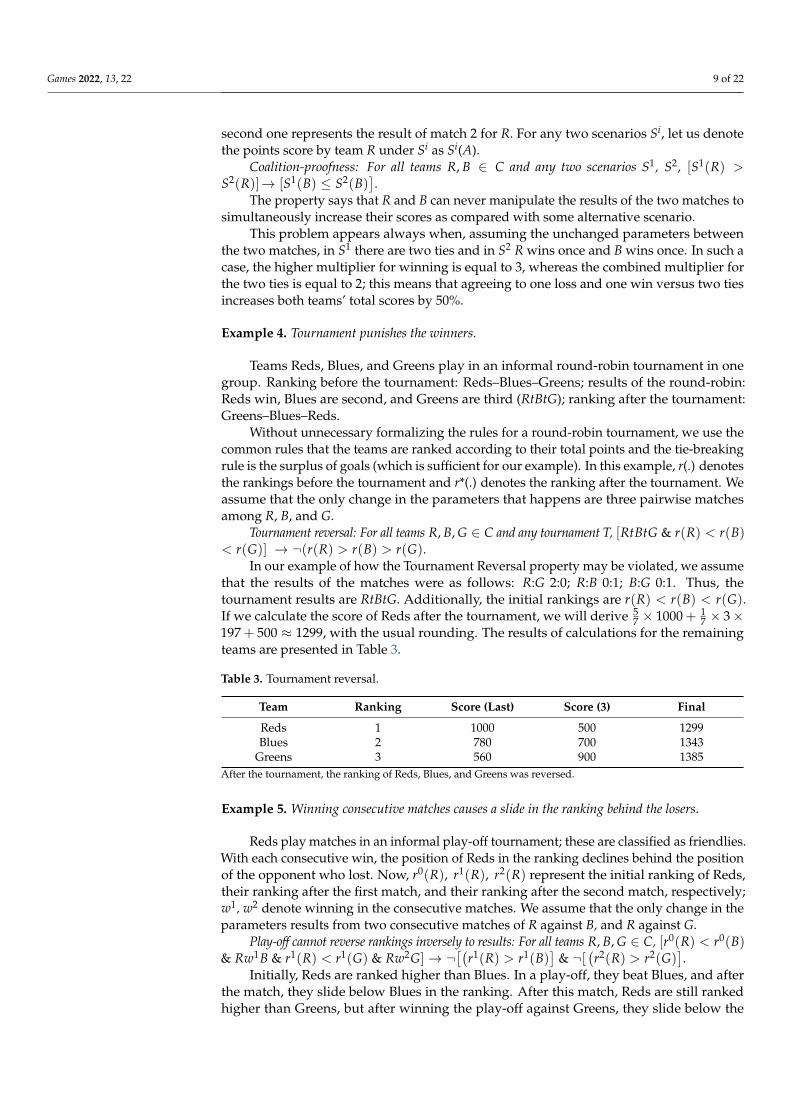
In our example of how the Tournament Reversal property may be violated, we assumethat the results of the matches were as follows: R:G 2:0; R:B 0:1; B:G 0:1. Thus, thetournament results are RtBtG. Additionally, the initial rankings are r(R) < r(B) < r(G).If we calculate the score of Reds after the tournament, we will derive 5
7 × 1000 + 17 × 3×
197 + 500 ≈ 1299, with the usual rounding. The results of calculations for the remainingteams are presented in Table 3.
Table 3. Tournament reversal.
Team Ranking Score (Last) Score (3) Final
Reds 1 1000 500 1299Blues 2 780 700 1343
Greens 3 560 900 1385After the tournament, the ranking of Reds, Blues, and Greens was reversed.
Example 5. Winning consecutive matches causes a slide in the ranking behind the losers.
Reds play matches in an informal play-off tournament; these are classified as friendlies.With each consecutive win, the position of Reds in the ranking declines behind the positionof the opponent who lost. Now, r0(R), r1(R), r2(R) represent the initial ranking of Reds,their ranking after the first match, and their ranking after the second match, respectively;w1, w2 denote winning in the consecutive matches. We assume that the only change in theparameters results from two consecutive matches of R against B, and R against G.
Play-off cannot reverse rankings inversely to results: For all teams R, B, G ∈ C, [r0(R) < r0(B)& Rw1B & r1(R) < r1(G) & Rw2G]→ ¬
[(r1(R) > r1(B)
]& ¬[
(r2(R) > r2(G)
].
Initially, Reds are ranked higher than Blues. In a play-off, they beat Blues, and afterthe match, they slide below Blues in the ranking. After this match, Reds are still rankedhigher than Greens, but after winning the play-off against Greens, they slide below the
Games 2022, 13, 22 10 of 22
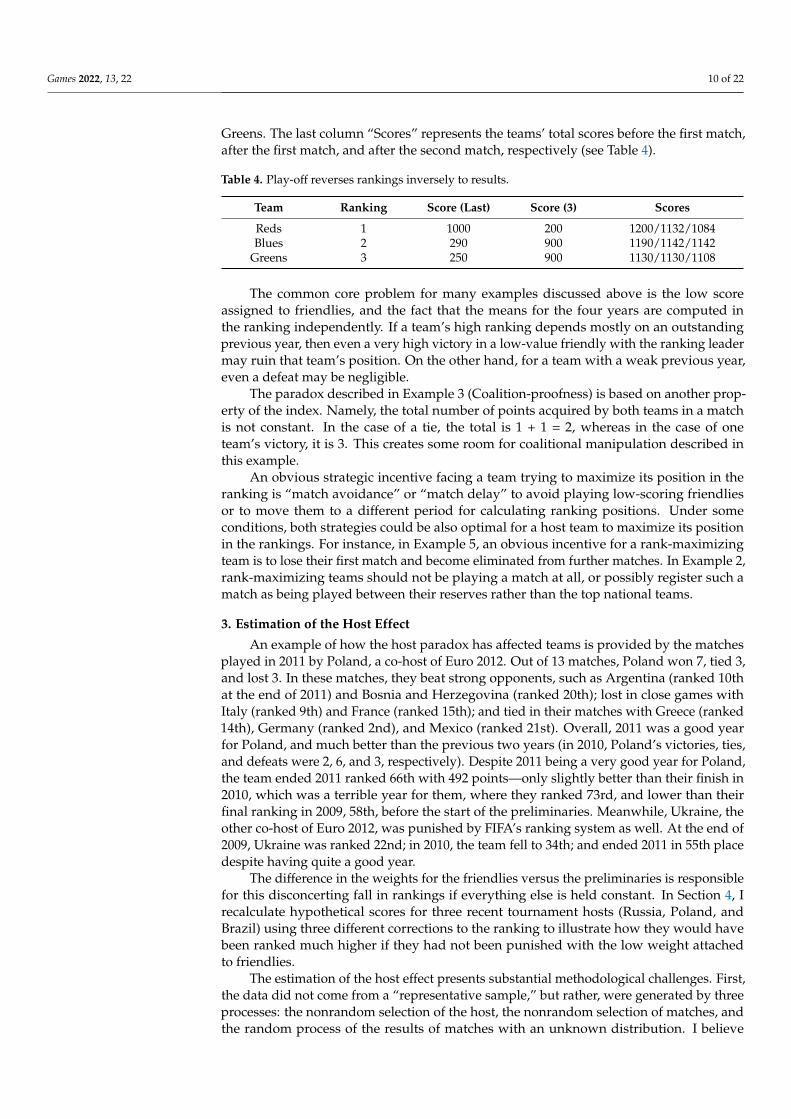
Greens. The last column “Scores” represents the teams’ total scores before the first match,after the first match, and after the second match, respectively (see Table 4).
Table 4. Play-off reverses rankings inversely to results.
Team Ranking Score (Last) Score (3) Scores
Reds 1 1000 200 1200/1132/1084Blues 2 290 900 1190/1142/1142
Greens 3 250 900 1130/1130/1108
The common core problem for many examples discussed above is the low scoreassigned to friendlies, and the fact that the means for the four years are computed inthe ranking independently. If a team’s high ranking depends mostly on an outstandingprevious year, then even a very high victory in a low-value friendly with the ranking leadermay ruin that team’s position. On the other hand, for a team with a weak previous year,even a defeat may be negligible.
The paradox described in Example 3 (Coalition-proofness) is based on another prop-erty of the index. Namely, the total number of points acquired by both teams in a matchis not constant. In the case of a tie, the total is 1 + 1 = 2, whereas in the case of oneteam’s victory, it is 3. This creates some room for coalitional manipulation described inthis example.
An obvious strategic incentive facing a team trying to maximize its position in theranking is “match avoidance” or “match delay” to avoid playing low-scoring friendliesor to move them to a different period for calculating ranking positions. Under someconditions, both strategies could be also optimal for a host team to maximize its positionin the rankings. For instance, in Example 5, an obvious incentive for a rank-maximizingteam is to lose their first match and become eliminated from further matches. In Example 2,rank-maximizing teams should not be playing a match at all, or possibly register such amatch as being played between their reserves rather than the top national teams.
3. Estimation of the Host Effect
An example of how the host paradox has affected teams is provided by the matchesplayed in 2011 by Poland, a co-host of Euro 2012. Out of 13 matches, Poland won 7, tied 3,and lost 3. In these matches, they beat strong opponents, such as Argentina (ranked 10that the end of 2011) and Bosnia and Herzegovina (ranked 20th); lost in close games withItaly (ranked 9th) and France (ranked 15th); and tied in their matches with Greece (ranked14th), Germany (ranked 2nd), and Mexico (ranked 21st). Overall, 2011 was a good yearfor Poland, and much better than the previous two years (in 2010, Poland’s victories, ties,and defeats were 2, 6, and 3, respectively). Despite 2011 being a very good year for Poland,the team ended 2011 ranked 66th with 492 points—only slightly better than their finish in2010, which was a terrible year for them, where they ranked 73rd, and lower than theirfinal ranking in 2009, 58th, before the start of the preliminaries. Meanwhile, Ukraine, theother co-host of Euro 2012, was punished by FIFA’s ranking system as well. At the end of2009, Ukraine was ranked 22nd; in 2010, the team fell to 34th; and ended 2011 in 55th placedespite having quite a good year.
The difference in the weights for the friendlies versus the preliminaries is responsiblefor this disconcerting fall in rankings if everything else is held constant. In Section 4, Irecalculate hypothetical scores for three recent tournament hosts (Russia, Poland, andBrazil) using three different corrections to the ranking to illustrate how they would havebeen ranked much higher if they had not been punished with the low weight attachedto friendlies.
The estimation of the host effect presents substantial methodological challenges. First,the data did not come from a “representative sample,” but rather, were generated by threeprocesses: the nonrandom selection of the host, the nonrandom selection of matches, andthe random process of the results of matches with an unknown distribution. I believe
Games 2022, 13, 22 11 of 22
that the first process could have affected the analysis in a noticeable way—mostly for theWorld Cup—whereas the second process did not introduce any systematic bias (see [26]on sample selection bias in the FIFA rankings). Second, in my calculations, I used rankingpositions, rather than FIFA scores, which created a problem due to the ordinal measurement.However, the paradox in the host effect that I am interested in is caused by a host’s lowposition in the rankings. Any result obtained with FIFA scores would have to be translatedinto a mean ranking loss, which would recreate the ordinality problem.
Below, I discuss three alternative methods. The data used in this analysis included26 hosts of eight World Cups, nine Asian Cups, and nine Euro Cups. After the change inthe ranking methodology in 2006, FIFA recalculated the teams’ rankings back to the year1993, which meant that the tournaments which took place from 1994 onward were included.Certain regional tournaments were omitted: specifically, the CAF and CONCACAF takeplace biannually, and their preliminaries are held in the same year as the main tournaments,which creates a short life span for a potential host effect. Additionally, the CONMEBOL hasa small number of members and no preliminary rounds, and the OFC has lower-rankedteams, with 11 official members; the best team is New Zealand, ranked 119th.
3.1. Average Dip in the Rankings
Considering the above, the most obvious question to ask is: what is the average dip(i.e., drop in positions) in the rankings caused by the host paradox? To begin to answer thisquestion, we assume the following notation for the key variables:
T—year of the tournament.rT—last ranking before the tournament (in the case of unclear timing, we use the
ranking from the month immediately preceding the month of the tournament).rP—the ranking immediately preceding the start of host’s confederation preliminaries.rT+4—the first ranking in January or February of year T + 4.∆ = rT − 1/2(rP + rT+4)—the estimated individual host effect.At the time of rP, there were no negative consequences of future preliminaries, whereas
at the time of rT+4, the preliminaries were too old to be included in the calculations. Themean of both rankings was used to smooth random variations in the teams’ levels ofperformance and the potential effect of the growing FIFA membership. There is no goodreason to assign speculatively unequal weights to both rankings. Finally, rT is the lastranking before the tournament, where the preliminaries still carry heavy weight; thisis publicized in the media and is often used as a measure of the host’s strength (seeAppendix A). A bar over a variable denotes its mean value.
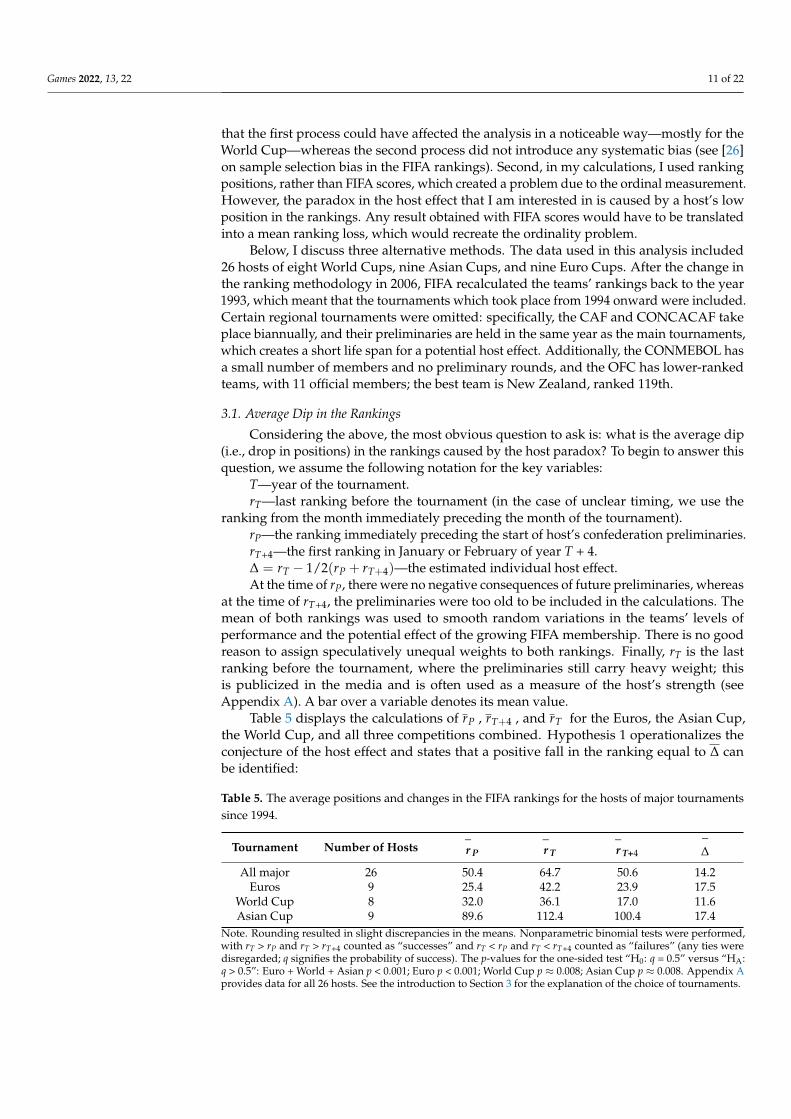
Table 5 displays the calculations of rP , rT+4 , and rT for the Euros, the Asian Cup,the World Cup, and all three competitions combined. Hypothesis 1 operationalizes theconjecture of the host effect and states that a positive fall in the ranking equal to ∆ canbe identified:
Table 5. The average positions and changes in the FIFA rankings for the hosts of major tournamentssince 1994.
Tournament Number of Hosts ¯r P
¯r T
¯r T+4
¯∆
All major 26 50.4 64.7 50.6 14.2Euros 9 25.4 42.2 23.9 17.5
World Cup 8 32.0 36.1 17.0 11.6Asian Cup 9 89.6 112.4 100.4 17.4
Note. Rounding resulted in slight discrepancies in the means. Nonparametric binomial tests were performed,with rT > rP and rT > rT+4 counted as “successes” and rT < rP and rT < rT+4 counted as “failures” (any ties weredisregarded; q signifies the probability of success). The p-values for the one-sided test “H0: q = 0.5” versus “HA:q > 0.5”: Euro + World + Asian p < 0.001; Euro p < 0.001; World Cup p ≈ 0.008; Asian Cup p ≈ 0.008. Appendix Aprovides data for all 26 hosts. See the introduction to Section 3 for the explanation of the choice of tournaments.
Games 2022, 13, 22 12 of 22
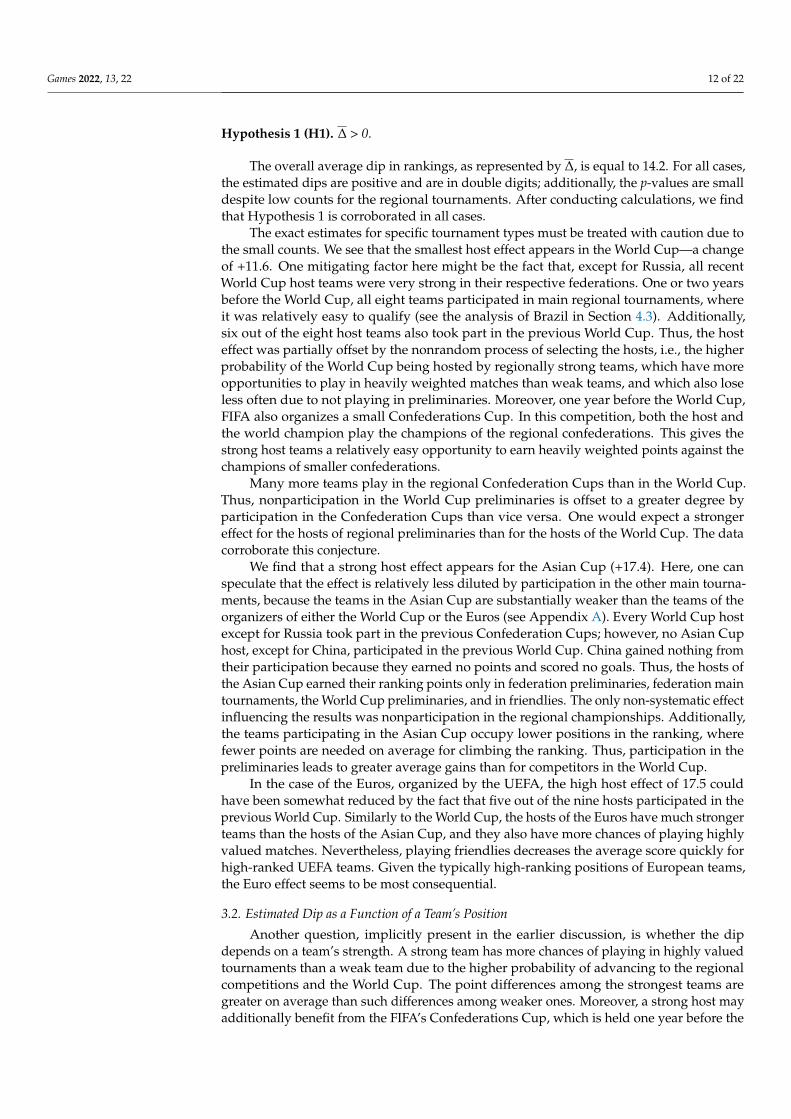
Hypothesis 1 (H1). ∆ > 0.
The overall average dip in rankings, as represented by ∆, is equal to 14.2. For all cases,the estimated dips are positive and are in double digits; additionally, the p-values are smalldespite low counts for the regional tournaments. After conducting calculations, we findthat Hypothesis 1 is corroborated in all cases.
The exact estimates for specific tournament types must be treated with caution due tothe small counts. We see that the smallest host effect appears in the World Cup—a changeof +11.6. One mitigating factor here might be the fact that, except for Russia, all recentWorld Cup host teams were very strong in their respective federations. One or two yearsbefore the World Cup, all eight teams participated in main regional tournaments, whereit was relatively easy to qualify (see the analysis of Brazil in Section 4.3). Additionally,six out of the eight host teams also took part in the previous World Cup. Thus, the hosteffect was partially offset by the nonrandom process of selecting the hosts, i.e., the higherprobability of the World Cup being hosted by regionally strong teams, which have moreopportunities to play in heavily weighted matches than weak teams, and which also loseless often due to not playing in preliminaries. Moreover, one year before the World Cup,FIFA also organizes a small Confederations Cup. In this competition, both the host andthe world champion play the champions of the regional confederations. This gives thestrong host teams a relatively easy opportunity to earn heavily weighted points against thechampions of smaller confederations.
Many more teams play in the regional Confederation Cups than in the World Cup.Thus, nonparticipation in the World Cup preliminaries is offset to a greater degree byparticipation in the Confederation Cups than vice versa. One would expect a strongereffect for the hosts of regional preliminaries than for the hosts of the World Cup. The datacorroborate this conjecture.
We find that a strong host effect appears for the Asian Cup (+17.4). Here, one canspeculate that the effect is relatively less diluted by participation in the other main tourna-ments, because the teams in the Asian Cup are substantially weaker than the teams of theorganizers of either the World Cup or the Euros (see Appendix A). Every World Cup hostexcept for Russia took part in the previous Confederation Cups; however, no Asian Cuphost, except for China, participated in the previous World Cup. China gained nothing fromtheir participation because they earned no points and scored no goals. Thus, the hosts ofthe Asian Cup earned their ranking points only in federation preliminaries, federation maintournaments, the World Cup preliminaries, and in friendlies. The only non-systematic effectinfluencing the results was nonparticipation in the regional championships. Additionally,the teams participating in the Asian Cup occupy lower positions in the ranking, wherefewer points are needed on average for climbing the ranking. Thus, participation in thepreliminaries leads to greater average gains than for competitors in the World Cup.
In the case of the Euros, organized by the UEFA, the high host effect of 17.5 couldhave been somewhat reduced by the fact that five out of the nine hosts participated in theprevious World Cup. Similarly to the World Cup, the hosts of the Euros have much strongerteams than the hosts of the Asian Cup, and they also have more chances of playing highlyvalued matches. Nevertheless, playing friendlies decreases the average score quickly forhigh-ranked UEFA teams. Given the typically high-ranking positions of European teams,the Euro effect seems to be most consequential.
3.2. Estimated Dip as a Function of a Team’s Position
Another question, implicitly present in the earlier discussion, is whether the dipdepends on a team’s strength. A strong team has more chances of playing in highly valuedtournaments than a weak team due to the higher probability of advancing to the regionalcompetitions and the World Cup. The point differences among the strongest teams aregreater on average than such differences among weaker ones. Moreover, a strong host mayadditionally benefit from the FIFA’s Confederations Cup, which is held one year before the
Games 2022, 13, 22 13 of 22
World Cup. All these aspects suggest that the ranking of a strong team is less vulnerable tothe host effect.
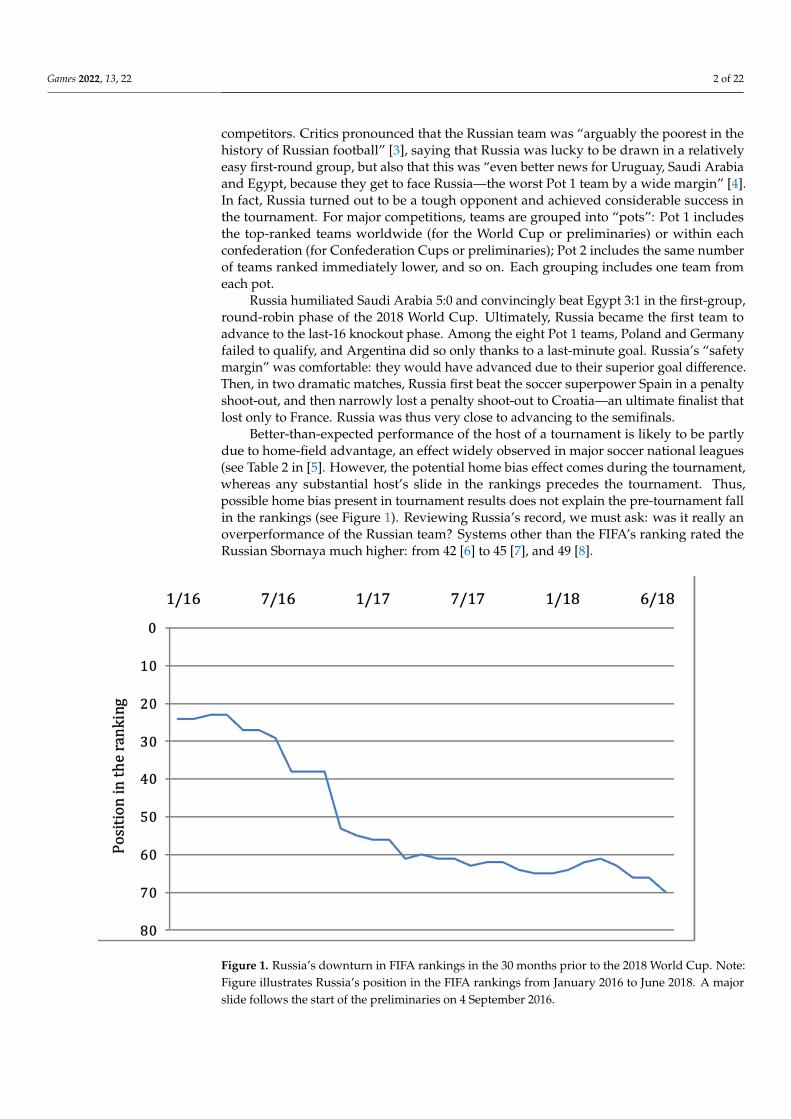
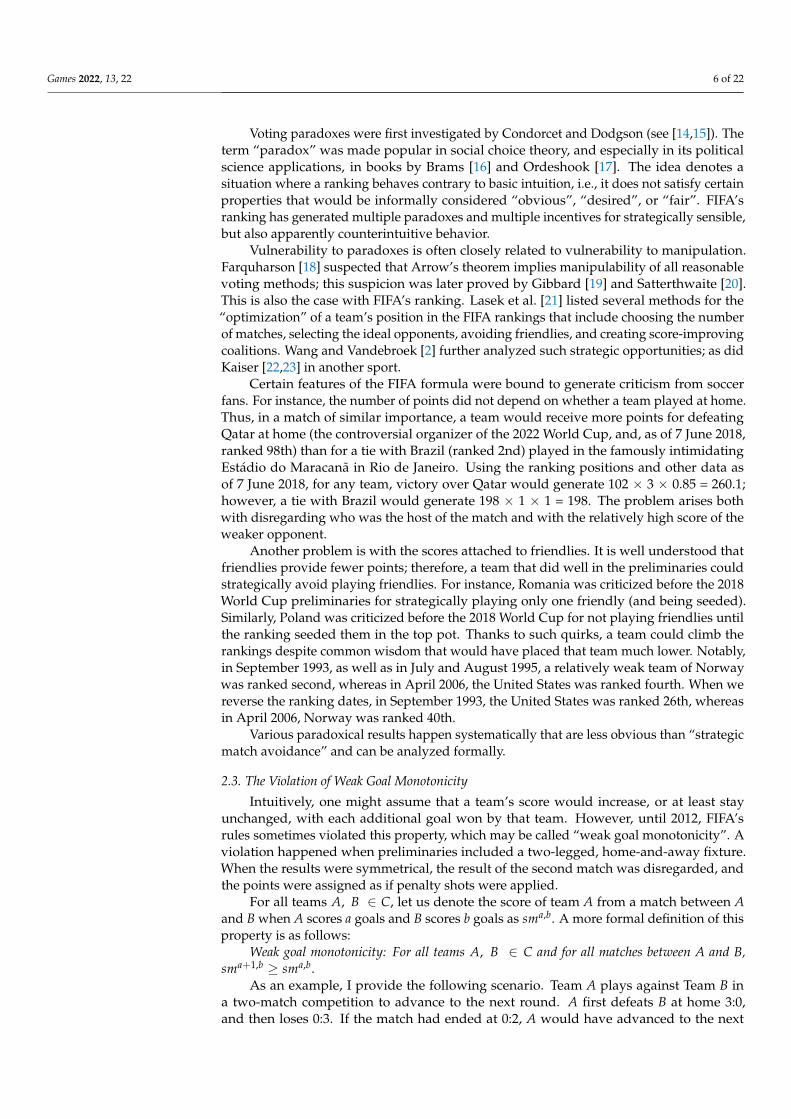
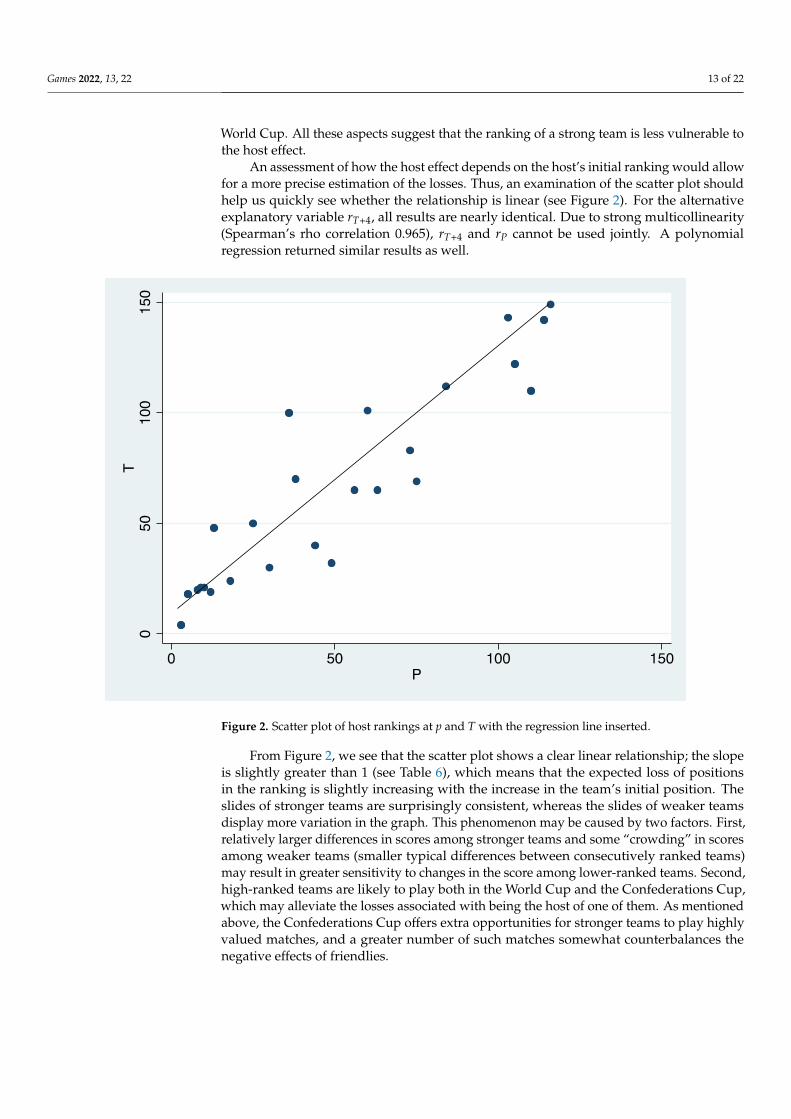
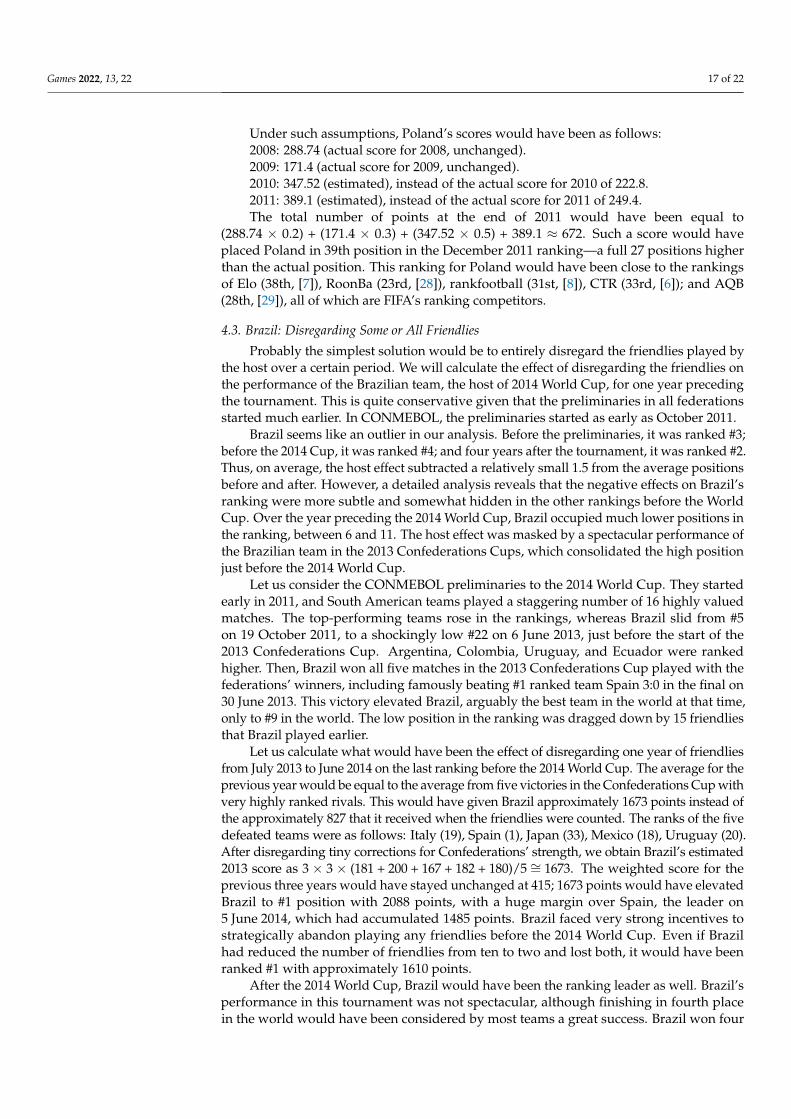
An assessment of how the host effect depends on the host’s initial ranking would allowfor a more precise estimation of the losses. Thus, an examination of the scatter plot shouldhelp us quickly see whether the relationship is linear (see Figure 2). For the alternativeexplanatory variable rT+4, all results are nearly identical. Due to strong multicollinearity(Spearman’s rho correlation 0.965), rT+4 and rP cannot be used jointly. A polynomialregression returned similar results as well.
Games 2022, 13, x FOR PEER REVIEW 14 of 23
Figure 2. Scatter plot of host rankings at p and T with the regression line inserted.
From Figure 2, we see that the scatter plot shows a clear linear relationship; the slope is slightly greater than 1 (see Table 6), which means that the expected loss of positions in the ranking is slightly increasing with the increase in the team’s initial position. The slides of stronger teams are surprisingly consistent, whereas the slides of weaker teams display more variation in the graph. This phenomenon may be caused by two factors. First, relatively larger differences in scores among stronger teams and some “crowding” in scores among weaker teams (smaller typical differences between consecutively ranked teams) may result in greater sensitivity to changes in the score among lower-ranked teams. Second, high-ranked teams are likely to play both in the World Cup and the Confederations Cup, which may alleviate the losses associated with being the host of one of them. As mentioned above, the Confederations Cup offers extra opportunities for stronger teams to play highly valued matches, and a greater number of such matches somewhat counterbalances the negative effects of friendlies.
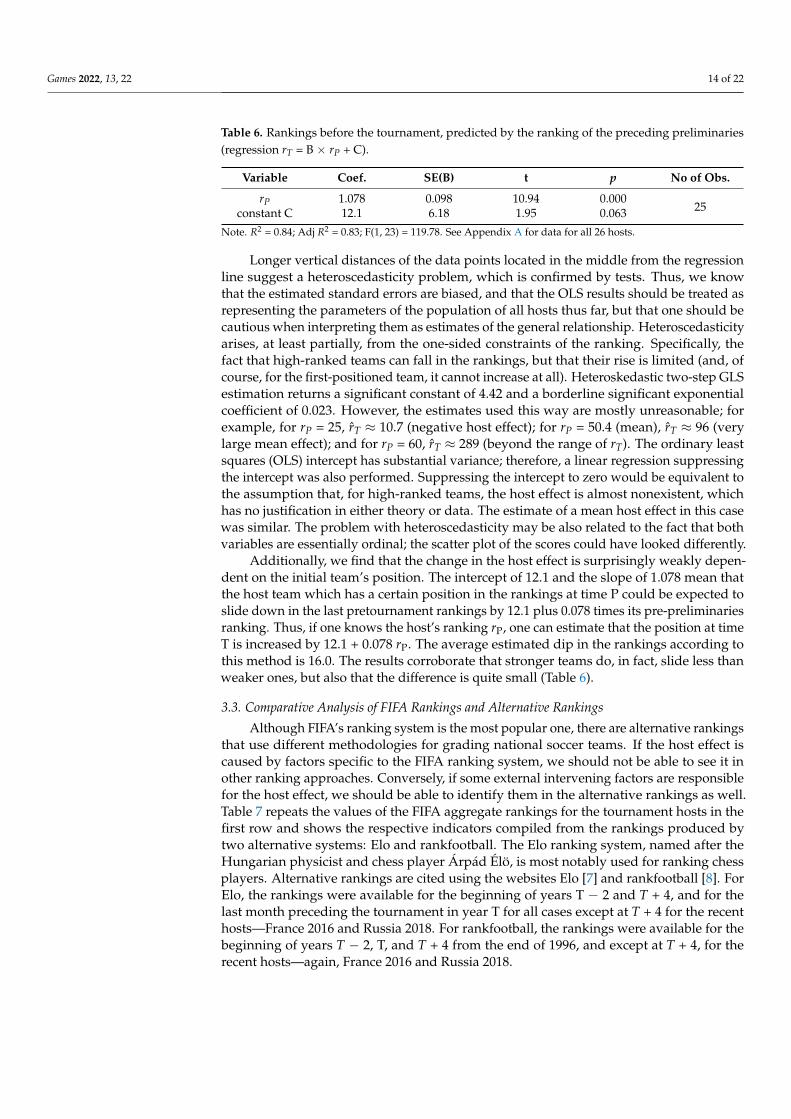
Table 6. Rankings before the tournament, predicted by the ranking of the preceding preliminaries (regression rT = B × rP + C).
Variable Coef. SE(B) t p No of Obs. rP 1.078 0.098 10.94 0.000
25 constant C 12.1 6.18 1.95 0.063
Note. R2 = 0.84; Adj R2 = 0.83; F(1, 23) = 119.78. See the Appendix for data for all 26 hosts.
Longer vertical distances of the data points located in the middle from the regression line suggest a heteroscedasticity problem, which is confirmed by tests. Thus, we know that the estimated standard errors are biased, and that the OLS results should be treated as representing the parameters of the population of all hosts thus far, but that one should be cautious when interpreting them as estimates of the general relationship. Heteroscedasticity arises, at least partially, from the one-sided constraints of the ranking. Specifically, the fact that high-ranked teams can fall in the rankings, but that their rise is limited (and, of course, for the first-positioned team, it cannot increase at all).
Figure 2. Scatter plot of host rankings at p and T with the regression line inserted.
From Figure 2, we see that the scatter plot shows a clear linear relationship; the slopeis slightly greater than 1 (see Table 6), which means that the expected loss of positionsin the ranking is slightly increasing with the increase in the team’s initial position. Theslides of stronger teams are surprisingly consistent, whereas the slides of weaker teamsdisplay more variation in the graph. This phenomenon may be caused by two factors. First,relatively larger differences in scores among stronger teams and some “crowding” in scoresamong weaker teams (smaller typical differences between consecutively ranked teams)may result in greater sensitivity to changes in the score among lower-ranked teams. Second,high-ranked teams are likely to play both in the World Cup and the Confederations Cup,which may alleviate the losses associated with being the host of one of them. As mentionedabove, the Confederations Cup offers extra opportunities for stronger teams to play highlyvalued matches, and a greater number of such matches somewhat counterbalances thenegative effects of friendlies.
Games 2022, 13, 22 14 of 22
Table 6. Rankings before the tournament, predicted by the ranking of the preceding preliminaries(regression rT = B × rP + C).
Variable Coef. SE(B) t p No of Obs.
rP 1.078 0.098 10.94 0.00025constant C 12.1 6.18 1.95 0.063
Note. R2 = 0.84; Adj R2 = 0.83; F(1, 23) = 119.78. See Appendix A for data for all 26 hosts.
Longer vertical distances of the data points located in the middle from the regressionline suggest a heteroscedasticity problem, which is confirmed by tests. Thus, we knowthat the estimated standard errors are biased, and that the OLS results should be treated asrepresenting the parameters of the population of all hosts thus far, but that one should becautious when interpreting them as estimates of the general relationship. Heteroscedasticityarises, at least partially, from the one-sided constraints of the ranking. Specifically, thefact that high-ranked teams can fall in the rankings, but that their rise is limited (and, ofcourse, for the first-positioned team, it cannot increase at all). Heteroskedastic two-step GLSestimation returns a significant constant of 4.42 and a borderline significant exponentialcoefficient of 0.023. However, the estimates used this way are mostly unreasonable; forexample, for rP = 25, rT ≈ 10.7 (negative host effect); for rP = 50.4 (mean), rT ≈ 96 (verylarge mean effect); and for rP = 60, rT ≈ 289 (beyond the range of rT). The ordinary leastsquares (OLS) intercept has substantial variance; therefore, a linear regression suppressingthe intercept was also performed. Suppressing the intercept to zero would be equivalent tothe assumption that, for high-ranked teams, the host effect is almost nonexistent, whichhas no justification in either theory or data. The estimate of a mean host effect in this casewas similar. The problem with heteroscedasticity may be also related to the fact that bothvariables are essentially ordinal; the scatter plot of the scores could have looked differently.
Additionally, we find that the change in the host effect is surprisingly weakly depen-dent on the initial team’s position. The intercept of 12.1 and the slope of 1.078 mean thatthe host team which has a certain position in the rankings at time P could be expected toslide down in the last pretournament rankings by 12.1 plus 0.078 times its pre-preliminariesranking. Thus, if one knows the host’s ranking rP, one can estimate that the position at timeT is increased by 12.1 + 0.078 rP. The average estimated dip in the rankings according tothis method is 16.0. The results corroborate that stronger teams do, in fact, slide less thanweaker ones, but also that the difference is quite small (Table 6).
3.3. Comparative Analysis of FIFA Rankings and Alternative Rankings
Although FIFA’s ranking system is the most popular one, there are alternative rankingsthat use different methodologies for grading national soccer teams. If the host effect iscaused by factors specific to the FIFA ranking system, we should not be able to see it inother ranking approaches. Conversely, if some external intervening factors are responsiblefor the host effect, we should be able to identify them in the alternative rankings as well.Table 7 repeats the values of the FIFA aggregate rankings for the tournament hosts in thefirst row and shows the respective indicators compiled from the rankings produced bytwo alternative systems: Elo and rankfootball. The Elo ranking system, named after theHungarian physicist and chess player Árpád Élö, is most notably used for ranking chessplayers. Alternative rankings are cited using the websites Elo [7] and rankfootball [8]. ForElo, the rankings were available for the beginning of years T − 2 and T + 4, and for thelast month preceding the tournament in year T for all cases except at T + 4 for the recenthosts—France 2016 and Russia 2018. For rankfootball, the rankings were available for thebeginning of years T − 2, T, and T + 4 from the end of 1996, and except at T + 4, for therecent hosts—again, France 2016 and Russia 2018.
Games 2022, 13, 22 15 of 22
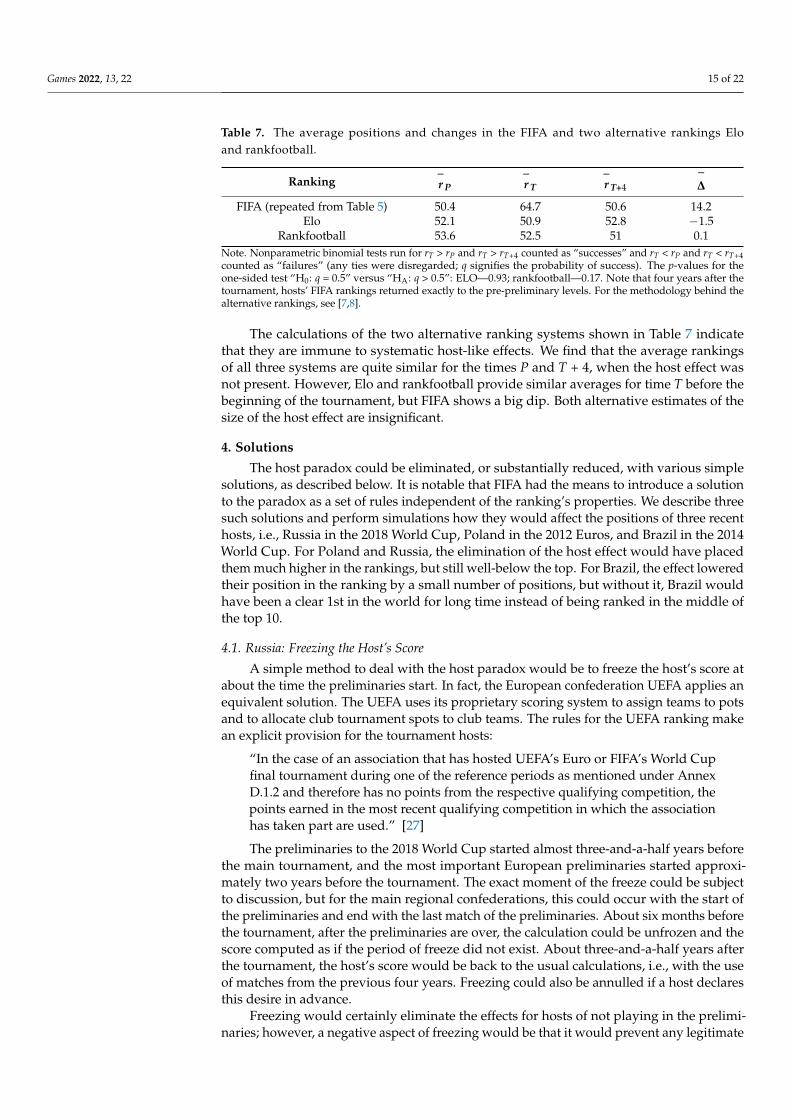
Table 7. The average positions and changes in the FIFA and two alternative rankings Eloand rankfootball.
Ranking ¯r P
¯r T
¯r T+4
¯∆
FIFA (repeated from Table 5) 50.4 64.7 50.6 14.2Elo 52.1 50.9 52.8 −1.5
Rankfootball 53.6 52.5 51 0.1Note. Nonparametric binomial tests run for rT > rP and rT > rT+4 counted as “successes” and rT < rP and rT < rT+4counted as “failures” (any ties were disregarded; q signifies the probability of success). The p-values for theone-sided test “H0: q = 0.5” versus “HA: q > 0.5”: ELO—0.93; rankfootball—0.17. Note that four years after thetournament, hosts’ FIFA rankings returned exactly to the pre-preliminary levels. For the methodology behind thealternative rankings, see [7,8].
The calculations of the two alternative ranking systems shown in Table 7 indicatethat they are immune to systematic host-like effects. We find that the average rankingsof all three systems are quite similar for the times P and T + 4, when the host effect wasnot present. However, Elo and rankfootball provide similar averages for time T before thebeginning of the tournament, but FIFA shows a big dip. Both alternative estimates of thesize of the host effect are insignificant.
4. Solutions
The host paradox could be eliminated, or substantially reduced, with various simplesolutions, as described below. It is notable that FIFA had the means to introduce a solutionto the paradox as a set of rules independent of the ranking’s properties. We describe threesuch solutions and perform simulations how they would affect the positions of three recenthosts, i.e., Russia in the 2018 World Cup, Poland in the 2012 Euros, and Brazil in the 2014World Cup. For Poland and Russia, the elimination of the host effect would have placedthem much higher in the rankings, but still well-below the top. For Brazil, the effect loweredtheir position in the ranking by a small number of positions, but without it, Brazil wouldhave been a clear 1st in the world for long time instead of being ranked in the middle ofthe top 10.
4.1. Russia: Freezing the Host’s Score
A simple method to deal with the host paradox would be to freeze the host’s score atabout the time the preliminaries start. In fact, the European confederation UEFA applies anequivalent solution. The UEFA uses its proprietary scoring system to assign teams to potsand to allocate club tournament spots to club teams. The rules for the UEFA ranking makean explicit provision for the tournament hosts:
“In the case of an association that has hosted UEFA’s Euro or FIFA’s World Cupfinal tournament during one of the reference periods as mentioned under AnnexD.1.2 and therefore has no points from the respective qualifying competition, thepoints earned in the most recent qualifying competition in which the associationhas taken part are used.” [27]
The preliminaries to the 2018 World Cup started almost three-and-a-half years beforethe main tournament, and the most important European preliminaries started approxi-mately two years before the tournament. The exact moment of the freeze could be subjectto discussion, but for the main regional confederations, this could occur with the start ofthe preliminaries and end with the last match of the preliminaries. About six months beforethe tournament, after the preliminaries are over, the calculation could be unfrozen and thescore computed as if the period of freeze did not exist. About three-and-a-half years afterthe tournament, the host’s score would be back to the usual calculations, i.e., with the useof matches from the previous four years. Freezing could also be annulled if a host declaresthis desire in advance.
Freezing would certainly eliminate the effects for hosts of not playing in the prelimi-naries; however, a negative aspect of freezing would be that it would prevent any legitimate
Games 2022, 13, 22 16 of 22
changes in the host team’s strength from being represented in the ranking. Moreover, anadvantage is that it is a relatively simple and computationally uncomplicated.
Calculating the impact of freezing on hosts’ ranking positions is straightforward. IfRussia had held its position from before the preliminaries, it would have been ranked38 instead of 70 in June 2018. If instead of using the position in the ranking we usedRussia’s score of 728 points from before the preliminaries, it would have given the Russianteam position a slightly higher position: 33 in June 2018. It would not have affected Russia’splace in the World Cup group competition, but it would have given it a higher position atEuro 2020, both in the preliminaries and in the final competition.
4.2. Poland: Substituting Friendlies with Preliminaries
The second possible solution is more complicated, but it also has the advantage ofusing actual recent scores. This solution is motivated by the following question: Whatwould a team’s position have been if some of the friendly matches had been assigned ahigher multiplier to compensate for the higher multiplier of 2.5 used in the preliminaries?
For Poland, had it played all its 2010 and 2011 matches in the Euro 2012 preliminarieswith identical results, then, at the end of 2011, it would have received approximately1039.5 points instead of just the 492 it did receive since the scores from all 2010 and 2011matches would be multiplied by 2.5 (the weight attached to preliminaries) instead of 1 (theweight attached to friendlies). The change in weights would have contributed 547.5 pointsto the total score. With 1039.5 points, Poland would have been in 11th place instead of 66th,which would have situated it just behind Argentina (which had 1067 points) and just aheadof Denmark (which had 1035 points).
Using the multiplier of 2.5 for all matches would be too generous to the host team,because the number of all friendly matches is usually greater than the average number ofmatches in preliminaries. Let us now estimate the modified score for Poland for the years2010 and 2011—the time when the preliminaries took place—under the assumption thatthe multipliers for all friendlies are increased by the same number in such a way that thetotal surplus of weights over 1 is equal to the average total surplus of weights over 1 forteams that participated in the preliminaries. In more detail:
(1) The points and positions in the rankings of all other teams remain unchanged.(2) The points of the Polish team are recalculated as follows: each of the 26 friendly
matches Poland played in 2010–11 receives the increased multiplier equal to1 + (9.725 × 1.5)/26 = 1.56, where 1 is the original weight assigned to friendlies; thenumber 9.725 represents an average number of preliminary matches for the Europeanteams (see explanation below); 1.5 is the extra weight that is assigned to preliminaryversus friendly matches; 26 is the total number of friendly matches that Poland playedin 2010–2011).
Some actual opponents in friendlies, such as Mexico or Argentina, were non-Europeanand could not be in the same preliminary group; in the case of friendly opponents such asGermany, France, and Italy, only one team could be in the same group with Poland in thepreliminaries. This aspect is disregarded because an implicit assumption is that specificteams are less important and because the results in friendlies are only proxies for actualresults. Moreover, the effects of recalculations on other relevant host countries are alsodisregarded. Out of five such hosts, only recalculation of the scores for Ukraine couldpotentially send Poland one position lower.
The possibly reduced incentive to play in a friendly is also disregarded. This maymake it easier for weaker teams to score well against teams that are stronger but lessmotivated, and it may also allow teams to experiment with reserve players.
For point (2), the weights were calculated using the average number of matches playedby the European teams that played in groups of six or five, as well as with some additionalrounds. Since 51 teams played 248 matches, the average is equal to 9.725 (given that thereare two teams per match). The weight of 1.56 uniformly distributes the extra weight of14.59 from 9.725 hypothetical preliminary matches to 26 actual friendly matches.
Games 2022, 13, 22 17 of 22
Under such assumptions, Poland’s scores would have been as follows:2008: 288.74 (actual score for 2008, unchanged).2009: 171.4 (actual score for 2009, unchanged).2010: 347.52 (estimated), instead of the actual score for 2010 of 222.8.2011: 389.1 (estimated), instead of the actual score for 2011 of 249.4.The total number of points at the end of 2011 would have been equal to
(288.74 × 0.2) + (171.4 × 0.3) + (347.52 × 0.5) + 389.1 ≈ 672. Such a score would haveplaced Poland in 39th position in the December 2011 ranking—a full 27 positions higherthan the actual position. This ranking for Poland would have been close to the rankingsof Elo (38th, [7]), RoonBa (23rd, [28]), rankfootball (31st, [8]), CTR (33rd, [6]); and AQB(28th, [29]), all of which are FIFA’s ranking competitors.
4.3. Brazil: Disregarding Some or All Friendlies
Probably the simplest solution would be to entirely disregard the friendlies played bythe host over a certain period. We will calculate the effect of disregarding the friendlies onthe performance of the Brazilian team, the host of 2014 World Cup, for one year precedingthe tournament. This is quite conservative given that the preliminaries in all federationsstarted much earlier. In CONMEBOL, the preliminaries started as early as October 2011.
Brazil seems like an outlier in our analysis. Before the preliminaries, it was ranked #3;before the 2014 Cup, it was ranked #4; and four years after the tournament, it was ranked #2.Thus, on average, the host effect subtracted a relatively small 1.5 from the average positionsbefore and after. However, a detailed analysis reveals that the negative effects on Brazil’sranking were more subtle and somewhat hidden in the other rankings before the WorldCup. Over the year preceding the 2014 World Cup, Brazil occupied much lower positions inthe ranking, between 6 and 11. The host effect was masked by a spectacular performance ofthe Brazilian team in the 2013 Confederations Cups, which consolidated the high positionjust before the 2014 World Cup.
Let us consider the CONMEBOL preliminaries to the 2014 World Cup. They startedearly in 2011, and South American teams played a staggering number of 16 highly valuedmatches. The top-performing teams rose in the rankings, whereas Brazil slid from #5on 19 October 2011, to a shockingly low #22 on 6 June 2013, just before the start of the2013 Confederations Cup. Argentina, Colombia, Uruguay, and Ecuador were rankedhigher. Then, Brazil won all five matches in the 2013 Confederations Cup played with thefederations’ winners, including famously beating #1 ranked team Spain 3:0 in the final on30 June 2013. This victory elevated Brazil, arguably the best team in the world at that time,only to #9 in the world. The low position in the ranking was dragged down by 15 friendliesthat Brazil played earlier.
Let us calculate what would have been the effect of disregarding one year of friendliesfrom July 2013 to June 2014 on the last ranking before the 2014 World Cup. The average for theprevious year would be equal to the average from five victories in the Confederations Cup withvery highly ranked rivals. This would have given Brazil approximately 1673 points instead ofthe approximately 827 that it received when the friendlies were counted. The ranks of the fivedefeated teams were as follows: Italy (19), Spain (1), Japan (33), Mexico (18), Uruguay (20).After disregarding tiny corrections for Confederations’ strength, we obtain Brazil’s estimated2013 score as 3 × 3 × (181 + 200 + 167 + 182 + 180)/5 ∼= 1673. The weighted score for theprevious three years would have stayed unchanged at 415; 1673 points would have elevatedBrazil to #1 position with 2088 points, with a huge margin over Spain, the leader on5 June 2014, which had accumulated 1485 points. Brazil faced very strong incentives tostrategically abandon playing any friendlies before the 2014 World Cup. Even if Brazilhad reduced the number of friendlies from ten to two and lost both, it would have beenranked #1 with approximately 1610 points.
After the 2014 World Cup, Brazil would have been the ranking leader as well. Brazil’sperformance in this tournament was not spectacular, although finishing in fourth placein the world would have been considered by most teams a great success. Brazil won four
Games 2022, 13, 22 18 of 22
matches, tied one, and lost two. The performance was worth of 9114 points total, whichequaled 1302 points per match. If the ten friendlies that Brazil played before the WorldCup were disregarded, in the first post-tournament ranking on July 17, 2014, Brazil wouldhave received 528 more points in addition to its 1241 for the total of 1769, ahead of #1Germany’s 1724 and well ahead of #2 Argentina’s 1606. Given that Brazil played very wellin tournaments and preliminaries after the 2014 World Cup, it would have stayed on topfor a long period of time.
5. Conclusions
As discussed in this paper, the host paradox has produced results that were deeplycounterintuitive. The FIFA ranking was based on counting weighted scores assignedto each of the previous one-year periods (see Equation (2)). The yearly scores were theaverages of a team’s performance in its matches, with weights given for the match’s result,the opponent’s ranking position and federation strength, and the match’s importance. Thehighest weights of 4 were attached to the World Cup matches; other tournament matcheshad a weight of 3 and all preliminaries had a weight of 2.5; a very low weight of 1 wasgiven to friendly matches (see Equation (1)). The fact that hosts of major tournamentswere admitted without preliminaries made them play low-weight friendlies instead ofpreliminaries for long periods of time. This led to paradoxical effects. Instead of climbingin the ranking—as one would expect of the host—hosts slid substantially because they hadno opportunity to acquire high scores from matches even if they were winning with highlyranked opponents.
The size of the host effect was estimated using two methods. The average dip in thehost’s position between the start of preliminaries and the beginning of the tournament was14.2. Regression estimates show an average dip of 16. At the same time, the competingrankings of ELO and Rankfootball showed minor and statistically insignificant changes inthe hosts’ positions (see Table 7).
Countries hosting soccer tournaments invest massive amounts of money to presentthemselves in the best possible light. The cost of the 2018 World Cup in Russia was esti-mated to be between USD 14.2 billion and USD 20 billion [30], whereas the economic impactwas estimated to be USD 30.8 billion over the 10 years from 2013 to 2023. Major soccertournaments provide an opportunity for a thriving democracy to promote its achievementsand for an autocracy to soften its image. This results in a broader stream of money goingto the host team. One would expect that a host team would benefit financially and, onaverage, improve its quality of play and its position in the rankings. Leeds and Leeds [31]found that having hosted a World Cup in the past strengthens a country’s FIFA score byadding 218 points on average; however, the estimate was not significant (see also [26,32,33].In reality, however, instead of the tournament host teams climbing slightly (as predicted bythe Elo ranking system), they began their steep slide down: according to our estimates, tobetween 14.1 and 16 positions lower (see Figure 3).
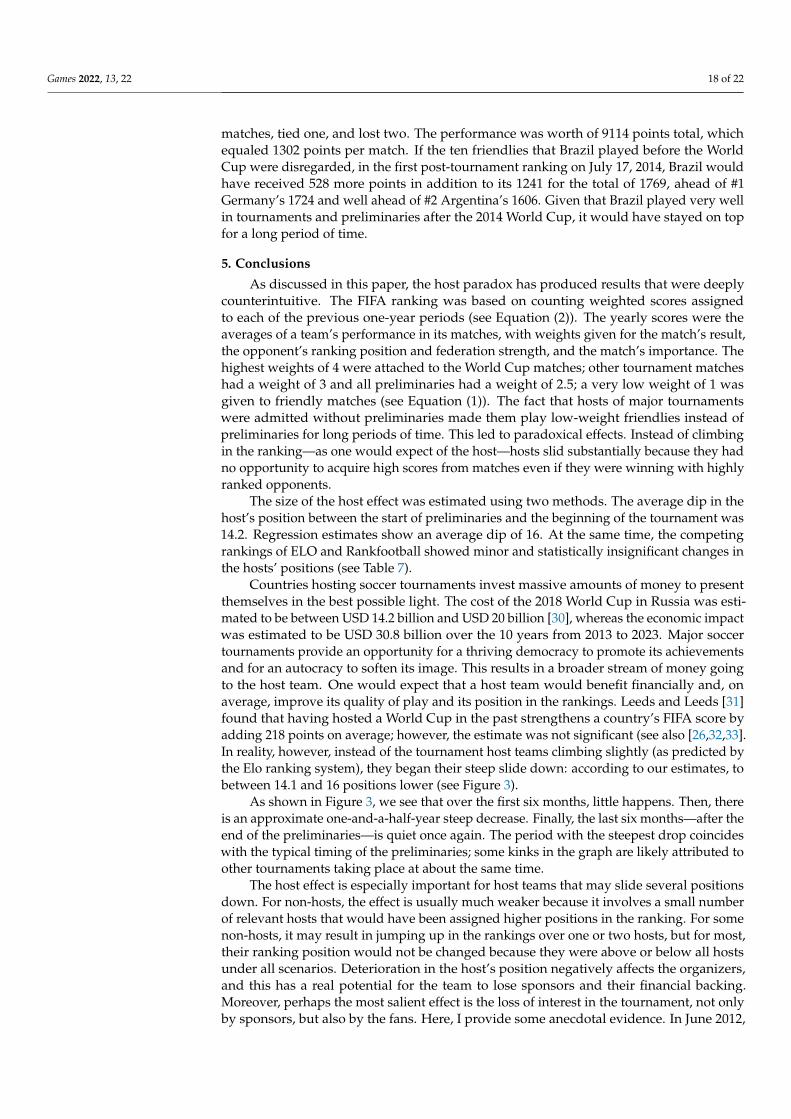
As shown in Figure 3, we see that over the first six months, little happens. Then, thereis an approximate one-and-a-half-year steep decrease. Finally, the last six months—after theend of the preliminaries—is quiet once again. The period with the steepest drop coincideswith the typical timing of the preliminaries; some kinks in the graph are likely attributed toother tournaments taking place at about the same time.
The host effect is especially important for host teams that may slide several positionsdown. For non-hosts, the effect is usually much weaker because it involves a small numberof relevant hosts that would have been assigned higher positions in the ranking. For somenon-hosts, it may result in jumping up in the rankings over one or two hosts, but for most,their ranking position would not be changed because they were above or below all hostsunder all scenarios. Deterioration in the host’s position negatively affects the organizers,and this has a real potential for the team to lose sponsors and their financial backing.Moreover, perhaps the most salient effect is the loss of interest in the tournament, not onlyby sponsors, but also by the fans. Here, I provide some anecdotal evidence. In June 2012,
Games 2022, 13, 22 19 of 22
I traveled to Poland while Euro 2012 was under way. While there, I engaged in a casualconversation with a cabbie about the chances of the Polish team. His response startedwith a resigned statement: “Mister, they are so low in FIFA’s rankings that nothing willhelp them.” Later that same day, I was talking with my father, who repeated this gloomyprognosis, using the same FIFA rankings to make his point. From these conversationsand my own reflections, it seems clear that a low position in the rankings may lead bothfans and sponsors to underestimate their team’s chances and decrease their interest inthe tournament.
Games 2022, 13, x FOR PEER REVIEW 19 of 23
5. Conclusions As discussed in this paper, the host paradox has produced results that were deeply
counterintuitive. The FIFA ranking was based on counting weighted scores assigned to each of the previous one-year periods (see Equation (2)). The yearly scores were the averages of a team’s performance in its matches, with weights given for the match’s result, the opponent’s ranking position and federation strength, and the match’s importance. The highest weights of 4 were attached to the World Cup matches; other tournament matches had a weight of 3 and all preliminaries had a weight of 2.5; a very low weight of 1 was given to friendly matches (see Equation (1)). The fact that hosts of major tournaments were admitted without preliminaries made them play low-weight friendlies instead of preliminaries for long periods of time. This led to paradoxical effects. Instead of climbing in the ranking—as one would expect of the host—hosts slid substantially because they had no opportunity to acquire high scores from matches even if they were winning with highly ranked opponents.
The size of the host effect was estimated using two methods. The average dip in the host’s position between the start of preliminaries and the beginning of the tournament was 14.2. Regression estimates show an average dip of 16. At the same time, the competing rankings of ELO and Rankfootball showed minor and statistically insignificant changes in the hosts’ positions (see Table 7).
Countries hosting soccer tournaments invest massive amounts of money to present themselves in the best possible light. The cost of the 2018 World Cup in Russia was estimated to be between USD 14.2 billion and USD 20 billion [30], whereas the economic impact was estimated to be USD 30.8 billion over the 10 years from 2013 to 2023. Major soccer tournaments provide an opportunity for a thriving democracy to promote its achievements and for an autocracy to soften its image. This results in a broader stream of money going to the host team. One would expect that a host team would benefit financially and, on average, improve its quality of play and its position in the rankings. Leeds and Leeds [31] found that having hosted a World Cup in the past strengthens a country’s FIFA score by adding 218 points on average; however, the estimate was not significant (see also [26,32,33]. In reality, however, instead of the tournament host teams climbing slightly (as predicted by the Elo ranking system), they began their steep slide down: according to our estimates, to between 14.1 and 16 positions lower (see Figure 3).
40
45
50
55
60
65
70
1 3 5 7 9 11 13 15 17 19 21 23 25 27 29Time (the last 30 months before the tournament) Ranking
Figure 3. Average downward slide of 26 tournament hosts over the 30 months preceding thetournament in the FIFA rankings. Note: Y-axis: Position in the rankings; X-axis: Subsequent months,starting 30 months before the tournament.
The host effect has led to substantial fluctuations in the host team’s position, bothbefore and after a tournament. The effect also contradicts FIFA’s intention to provide auniversal and objective tool for evaluating the strength of the teams [34]. A team’s lowranking translates into its lower chances in the next preliminaries, because the lower-ranked teams are placed in lower pots for the draw, where they can expect to face strongeropponents. In the preliminaries for the 2010 World Cup, CONCACAF, CAF, and UEFAused FIFA rankings from various months preceding the draw for separating teams intodifferent pots: for the 2010 World Cup, the October 2009 rankings were used; for thepreliminaries for the 2012 Olympics, CAF used rankings from March 2011 [35]. Before the2018 World Cup, one could observe the strategic behavior of some of the teams to maximizetheir positions in the rankings.
In the main tournament, hosts are usually seeded in the top pot, and this mechanismprovides some crude compensation for their lower position. However, the erroneousplacing of the hosts reduces the rankings’ power for predicting the results of matches. TheFIFA rankings’ predictive power was estimated as worse than almost all other alternativerankings, including the Elo ranking [36]. Luckner et al. [37] found that “prediction markets”outperformed the FIFA ranking system in terms of forecast accuracy. The FIFA rankingswere found to be somewhat accurate in predicting the success of the subsets of the top teamsin the World Cup finals [38], but the authors offered no comparison with other methods.
Prior to the 2018 Russian World Cup, some high-profile commentators made publiccomments disregarding the Russian team. This type of disparagement of teams is not
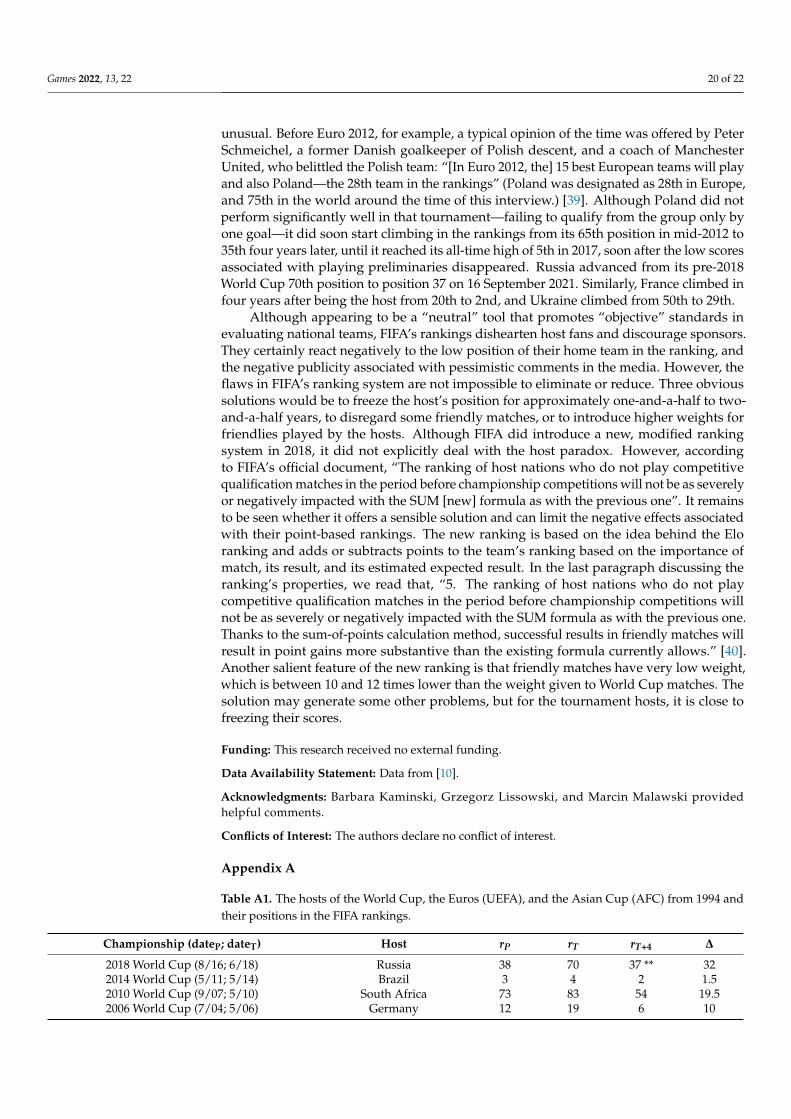
Games 2022, 13, 22 20 of 22
unusual. Before Euro 2012, for example, a typical opinion of the time was offered by PeterSchmeichel, a former Danish goalkeeper of Polish descent, and a coach of ManchesterUnited, who belittled the Polish team: “[In Euro 2012, the] 15 best European teams will playand also Poland—the 28th team in the rankings” (Poland was designated as 28th in Europe,and 75th in the world around the time of this interview.) [39]. Although Poland did notperform significantly well in that tournament—failing to qualify from the group only byone goal—it did soon start climbing in the rankings from its 65th position in mid-2012 to35th four years later, until it reached its all-time high of 5th in 2017, soon after the low scoresassociated with playing preliminaries disappeared. Russia advanced from its pre-2018World Cup 70th position to position 37 on 16 September 2021. Similarly, France climbed infour years after being the host from 20th to 2nd, and Ukraine climbed from 50th to 29th.
Although appearing to be a “neutral” tool that promotes “objective” standards inevaluating national teams, FIFA’s rankings dishearten host fans and discourage sponsors.They certainly react negatively to the low position of their home team in the ranking, andthe negative publicity associated with pessimistic comments in the media. However, theflaws in FIFA’s ranking system are not impossible to eliminate or reduce. Three obvioussolutions would be to freeze the host’s position for approximately one-and-a-half to two-and-a-half years, to disregard some friendly matches, or to introduce higher weights forfriendlies played by the hosts. Although FIFA did introduce a new, modified rankingsystem in 2018, it did not explicitly deal with the host paradox. However, accordingto FIFA’s official document, “The ranking of host nations who do not play competitivequalification matches in the period before championship competitions will not be as severelyor negatively impacted with the SUM [new] formula as with the previous one”. It remainsto be seen whether it offers a sensible solution and can limit the negative effects associatedwith their point-based rankings. The new ranking is based on the idea behind the Eloranking and adds or subtracts points to the team’s ranking based on the importance ofmatch, its result, and its estimated expected result. In the last paragraph discussing theranking’s properties, we read that, “5. The ranking of host nations who do not playcompetitive qualification matches in the period before championship competitions willnot be as severely or negatively impacted with the SUM formula as with the previous one.Thanks to the sum-of-points calculation method, successful results in friendly matches willresult in point gains more substantive than the existing formula currently allows.” [40].Another salient feature of the new ranking is that friendly matches have very low weight,which is between 10 and 12 times lower than the weight given to World Cup matches. Thesolution may generate some other problems, but for the tournament hosts, it is close tofreezing their scores.
Funding: This research received no external funding.
Data Availability Statement: Data from [10].
Acknowledgments: Barbara Kaminski, Grzegorz Lissowski, and Marcin Malawski providedhelpful comments.
Conflicts of Interest: The authors declare no conflict of interest.
Appendix A
Table A1. The hosts of the World Cup, the Euros (UEFA), and the Asian Cup (AFC) from 1994 andtheir positions in the FIFA rankings.
Championship (dateP; dateT) Host rP rT rT+4 ∆
2018 World Cup (8/16; 6/18) Russia 38 70 37 ** 322014 World Cup (5/11; 5/14) Brazil 3 4 2 1.52010 World Cup (9/07; 5/10) South Africa 73 83 54 19.52006 World Cup (7/04; 5/06) Germany 12 19 6 10
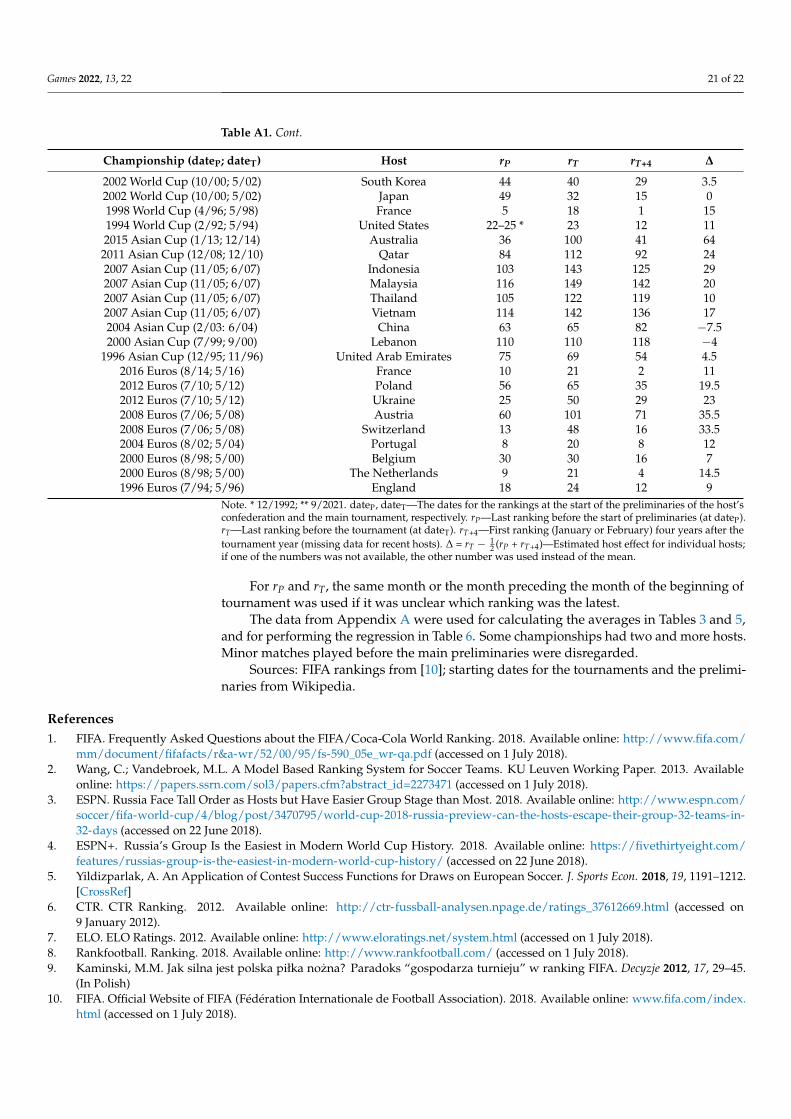
Games 2022, 13, 22 21 of 22
Table A1. Cont.
Championship (dateP; dateT) Host rP rT rT+4 ∆
2002 World Cup (10/00; 5/02) South Korea 44 40 29 3.52002 World Cup (10/00; 5/02) Japan 49 32 15 01998 World Cup (4/96; 5/98) France 5 18 1 151994 World Cup (2/92; 5/94) United States 22–25 * 23 12 112015 Asian Cup (1/13; 12/14) Australia 36 100 41 64
2011 Asian Cup (12/08; 12/10) Qatar 84 112 92 242007 Asian Cup (11/05; 6/07) Indonesia 103 143 125 292007 Asian Cup (11/05; 6/07) Malaysia 116 149 142 202007 Asian Cup (11/05; 6/07) Thailand 105 122 119 102007 Asian Cup (11/05; 6/07) Vietnam 114 142 136 172004 Asian Cup (2/03: 6/04) China 63 65 82 −7.52000 Asian Cup (7/99; 9/00) Lebanon 110 110 118 −4
1996 Asian Cup (12/95; 11/96) United Arab Emirates 75 69 54 4.52016 Euros (8/14; 5/16) France 10 21 2 112012 Euros (7/10; 5/12) Poland 56 65 35 19.52012 Euros (7/10; 5/12) Ukraine 25 50 29 232008 Euros (7/06; 5/08) Austria 60 101 71 35.52008 Euros (7/06; 5/08) Switzerland 13 48 16 33.52004 Euros (8/02; 5/04) Portugal 8 20 8 122000 Euros (8/98; 5/00) Belgium 30 30 16 72000 Euros (8/98; 5/00) The Netherlands 9 21 4 14.51996 Euros (7/94; 5/96) England 18 24 12 9
Note. * 12/1992; ** 9/2021. dateP, dateT—The dates for the rankings at the start of the preliminaries of the host’sconfederation and the main tournament, respectively. rP—Last ranking before the start of preliminaries (at dateP).rT—Last ranking before the tournament (at dateT). rT+4—First ranking (January or February) four years after thetournament year (missing data for recent hosts). ∆ = rT − 1
2 (rP + rT+4)—Estimated host effect for individual hosts;if one of the numbers was not available, the other number was used instead of the mean.
For rP and rT, the same month or the month preceding the month of the beginning oftournament was used if it was unclear which ranking was the latest.
The data from Appendix A were used for calculating the averages in Tables 3 and 5,and for performing the regression in Table 6. Some championships had two and more hosts.Minor matches played before the main preliminaries were disregarded.
Sources: FIFA rankings from [10]; starting dates for the tournaments and the prelimi-naries from Wikipedia.
References1. FIFA. Frequently Asked Questions about the FIFA/Coca-Cola World Ranking. 2018. Available online: http://www.fifa.com/
mm/document/fifafacts/r&a-wr/52/00/95/fs-590_05e_wr-qa.pdf (accessed on 1 July 2018).2. Wang, C.; Vandebroek, M.L. A Model Based Ranking System for Soccer Teams. KU Leuven Working Paper. 2013. Available
online: https://papers.ssrn.com/sol3/papers.cfm?abstract_id=2273471 (accessed on 1 July 2018).3. ESPN. Russia Face Tall Order as Hosts but Have Easier Group Stage than Most. 2018. Available online: http://www.espn.com/
soccer/fifa-world-cup/4/blog/post/3470795/world-cup-2018-russia-preview-can-the-hosts-escape-their-group-32-teams-in-32-days (accessed on 22 June 2018).
4. ESPN+. Russia’s Group Is the Easiest in Modern World Cup History. 2018. Available online: https://fivethirtyeight.com/features/russias-group-is-the-easiest-in-modern-world-cup-history/ (accessed on 22 June 2018).
5. Yildizparlak, A. An Application of Contest Success Functions for Draws on European Soccer. J. Sports Econ. 2018, 19, 1191–1212.[CrossRef]
6. CTR. CTR Ranking. 2012. Available online: http://ctr-fussball-analysen.npage.de/ratings_37612669.html (accessed on9 January 2012).
7. ELO. ELO Ratings. 2012. Available online: http://www.eloratings.net/system.html (accessed on 1 July 2018).8. Rankfootball. Ranking. 2018. Available online: http://www.rankfootball.com/ (accessed on 1 July 2018).9. Kaminski, M.M. Jak silna jest polska piłka nozna? Paradoks “gospodarza turnieju” w ranking FIFA. Decyzje 2012, 17, 29–45.
(In Polish)10. FIFA. Official Website of FIFA (Fédération Internationale de Football Association). 2018. Available online: www.fifa.com/index.
html (accessed on 1 July 2018).
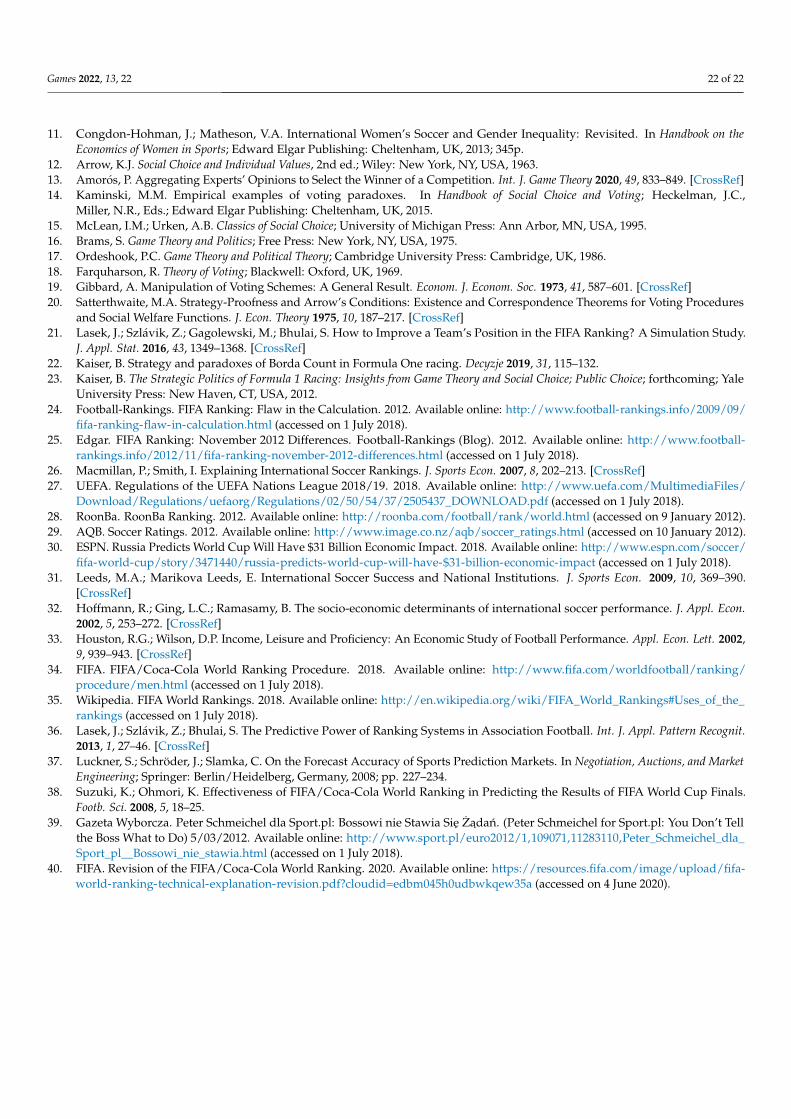
Games 2022, 13, 22 22 of 22
11. Congdon-Hohman, J.; Matheson, V.A. International Women’s Soccer and Gender Inequality: Revisited. In Handbook on theEconomics of Women in Sports; Edward Elgar Publishing: Cheltenham, UK, 2013; 345p.
12. Arrow, K.J. Social Choice and Individual Values, 2nd ed.; Wiley: New York, NY, USA, 1963.13. Amorós, P. Aggregating Experts’ Opinions to Select the Winner of a Competition. Int. J. Game Theory 2020, 49, 833–849. [CrossRef]14. Kaminski, M.M. Empirical examples of voting paradoxes. In Handbook of Social Choice and Voting; Heckelman, J.C.,
Miller, N.R., Eds.; Edward Elgar Publishing: Cheltenham, UK, 2015.15. McLean, I.M.; Urken, A.B. Classics of Social Choice; University of Michigan Press: Ann Arbor, MN, USA, 1995.16. Brams, S. Game Theory and Politics; Free Press: New York, NY, USA, 1975.17. Ordeshook, P.C. Game Theory and Political Theory; Cambridge University Press: Cambridge, UK, 1986.18. Farquharson, R. Theory of Voting; Blackwell: Oxford, UK, 1969.19. Gibbard, A. Manipulation of Voting Schemes: A General Result. Econom. J. Econom. Soc. 1973, 41, 587–601. [CrossRef]20. Satterthwaite, M.A. Strategy-Proofness and Arrow’s Conditions: Existence and Correspondence Theorems for Voting Procedures
and Social Welfare Functions. J. Econ. Theory 1975, 10, 187–217. [CrossRef]21. Lasek, J.; Szlávik, Z.; Gagolewski, M.; Bhulai, S. How to Improve a Team’s Position in the FIFA Ranking? A Simulation Study.
J. Appl. Stat. 2016, 43, 1349–1368. [CrossRef]22. Kaiser, B. Strategy and paradoxes of Borda Count in Formula One racing. Decyzje 2019, 31, 115–132.23. Kaiser, B. The Strategic Politics of Formula 1 Racing: Insights from Game Theory and Social Choice; Public Choice; forthcoming; Yale
University Press: New Haven, CT, USA, 2012.24. Football-Rankings. FIFA Ranking: Flaw in the Calculation. 2012. Available online: http://www.football-rankings.info/2009/09/
fifa-ranking-flaw-in-calculation.html (accessed on 1 July 2018).25. Edgar. FIFA Ranking: November 2012 Differences. Football-Rankings (Blog). 2012. Available online: http://www.football-
rankings.info/2012/11/fifa-ranking-november-2012-differences.html (accessed on 1 July 2018).26. Macmillan, P.; Smith, I. Explaining International Soccer Rankings. J. Sports Econ. 2007, 8, 202–213. [CrossRef]27. UEFA. Regulations of the UEFA Nations League 2018/19. 2018. Available online: http://www.uefa.com/MultimediaFiles/
Download/Regulations/uefaorg/Regulations/02/50/54/37/2505437_DOWNLOAD.pdf (accessed on 1 July 2018).28. RoonBa. RoonBa Ranking. 2012. Available online: http://roonba.com/football/rank/world.html (accessed on 9 January 2012).29. AQB. Soccer Ratings. 2012. Available online: http://www.image.co.nz/aqb/soccer_ratings.html (accessed on 10 January 2012).30. ESPN. Russia Predicts World Cup Will Have $31 Billion Economic Impact. 2018. Available online: http://www.espn.com/soccer/
fifa-world-cup/story/3471440/russia-predicts-world-cup-will-have-$31-billion-economic-impact (accessed on 1 July 2018).31. Leeds, M.A.; Marikova Leeds, E. International Soccer Success and National Institutions. J. Sports Econ. 2009, 10, 369–390.
[CrossRef]32. Hoffmann, R.; Ging, L.C.; Ramasamy, B. The socio-economic determinants of international soccer performance. J. Appl. Econ.
2002, 5, 253–272. [CrossRef]33. Houston, R.G.; Wilson, D.P. Income, Leisure and Proficiency: An Economic Study of Football Performance. Appl. Econ. Lett. 2002,
9, 939–943. [CrossRef]34. FIFA. FIFA/Coca-Cola World Ranking Procedure. 2018. Available online: http://www.fifa.com/worldfootball/ranking/
procedure/men.html (accessed on 1 July 2018).35. Wikipedia. FIFA World Rankings. 2018. Available online: http://en.wikipedia.org/wiki/FIFA_World_Rankings#Uses_of_the_
rankings (accessed on 1 July 2018).36. Lasek, J.; Szlávik, Z.; Bhulai, S. The Predictive Power of Ranking Systems in Association Football. Int. J. Appl. Pattern Recognit.
2013, 1, 27–46. [CrossRef]37. Luckner, S.; Schröder, J.; Slamka, C. On the Forecast Accuracy of Sports Prediction Markets. In Negotiation, Auctions, and Market
Engineering; Springer: Berlin/Heidelberg, Germany, 2008; pp. 227–234.38. Suzuki, K.; Ohmori, K. Effectiveness of FIFA/Coca-Cola World Ranking in Predicting the Results of FIFA World Cup Finals.
Footb. Sci. 2008, 5, 18–25.39. Gazeta Wyborcza. Peter Schmeichel dla Sport.pl: Bossowi nie Stawia Sie Zadan. (Peter Schmeichel for Sport.pl: You Don’t Tell
the Boss What to Do) 5/03/2012. Available online: http://www.sport.pl/euro2012/1,109071,11283110,Peter_Schmeichel_dla_Sport_pl__Bossowi_nie_stawia.html (accessed on 1 July 2018).
40. FIFA. Revision of the FIFA/Coca-Cola World Ranking. 2020. Available online: https://resources.fifa.com/image/upload/fifa-world-ranking-technical-explanation-revision.pdf?cloudid=edbm045h0udbwkqew35a (accessed on 4 June 2020).
Related Documents