Please note that this is an author-produced PDF of an article accepted for publication following peer review. The definitive publisher-authenticated version is available on the publisher Web site 1 British Journal of Nutrition November 2008; Volume 100 (5) : Pages 992-1003 http://dx.doi.org/10.1017/S0007114508966071 © 2008 Cambridge University Press Archimer Archive Institutionnelle de l’Ifremer http://www.ifremer.fr/docelec/ High levels of vegetable oils in plant protein-rich diets fed to gilthead sea bream (Sparus aurata L.): growth performance, muscle fatty acid profiles and histological alterations of target tissues Laura Benedito-Palos 1 , Juan C. Navarro 1 , Ariadna Sitjà-Bobadilla 1 , J. Gordon Bell 2 , Sadasivam Kaushik 3 and Jaume Pérez-Sánchez 1, * 1 Department of Biology, Culture and Pathology of Marine Species, Institute of Aquaculture Torre de la Sal (CSIC), 12595 Ribera de Cabanes, Castellón, Spain 2 Institute of Aquaculture, University of Stirling, Stirling FK9 4LA, UK 3 UMR Nutrition, Aquaculture and Genomics, INRA, Unité-Mixte INRA-IFREMER-Université Bordeaux I, 64310 Saint-Pée-sur-Nivelle, France *: Corresponding author : Pérez-Sánchez J., email address : [email protected] Abstract: The feasibility of fish oil (FO) replacement by vegetable oils (VO) was investigated in gilthead sea bream (Sparus aurata L.) in a growth trial conducted for the duration of 8 months. Four isolipidic and isoproteic diets rich in plant proteins were supplemented with L-lysine (0·55 %) and soya lecithin (1 %). Added oil was either FO (control) or a blend of VO, replacing 33 % (33VO diet), 66 % (66VO diet) and 100 % (VO diet) of FO. No detrimental effects on growth performance were found with the partial FO replacement, but feed intake and growth rates were reduced by about 10 % in fish fed the VO diet. The replacement strategy did not damage the intestinal epithelium, and massive accumulation of lipid droplets was not found within enterocytes. All fish showed fatty livers, but signs of lipoid liver disease were only found in fish fed the VO diet. Muscle fatty acid profiles of total lipids reflected the diet composition with a selective incorporation of unsaturated fatty acids in polar lipids. The robustness of the phospholipid fatty acid profile when essential fatty acid requirements were theoretically covered by the diet was evidenced by multivariate principal components analysis in fish fed control, 33VO and 66VO diets. Keywords: Essential fatty acids; Phospholipids; Soya lecithin; Lipoid liver disease

Welcome message from author
This document is posted to help you gain knowledge. Please leave a comment to let me know what you think about it! Share it to your friends and learn new things together.
Transcript

Ple
ase
note
that
this
is a
n au
thor
-pro
duce
d P
DF
of a
n ar
ticle
acc
epte
d fo
r pub
licat
ion
follo
win
g pe
er re
view
. The
def
initi
ve p
ublis
her-a
uthe
ntic
ated
ver
sion
is a
vaila
ble
on th
e pu
blis
her W
eb s
ite
1
British Journal of Nutrition November 2008; Volume 100 (5) : Pages 992-1003 http://dx.doi.org/10.1017/S0007114508966071 © 2008 Cambridge University Press
Archimer Archive Institutionnelle de l’Ifremer
http://www.ifremer.fr/docelec/
High levels of vegetable oils in plant protein-rich diets fed to gilthead sea bream (Sparus aurata L.): growth performance, muscle fatty acid profiles
and histological alterations of target tissues
Laura Benedito-Palos1, Juan C. Navarro1, Ariadna Sitjà-Bobadilla1, J. Gordon Bell2, Sadasivam Kaushik3 and Jaume Pérez-Sánchez1, *
1 Department of Biology, Culture and Pathology of Marine Species, Institute of Aquaculture Torre de la Sal (CSIC), 12595 Ribera de Cabanes, Castellón, Spain 2 Institute of Aquaculture, University of Stirling, Stirling FK9 4LA, UK 3 UMR Nutrition, Aquaculture and Genomics, INRA, Unité-Mixte INRA-IFREMER-Université Bordeaux I, 64310 Saint-Pée-sur-Nivelle, France *: Corresponding author : Pérez-Sánchez J., email address : [email protected]
Abstract: The feasibility of fish oil (FO) replacement by vegetable oils (VO) was investigated in gilthead sea bream (Sparus aurata L.) in a growth trial conducted for the duration of 8 months. Four isolipidic and isoproteic diets rich in plant proteins were supplemented with L-lysine (0·55 %) and soya lecithin (1 %). Added oil was either FO (control) or a blend of VO, replacing 33 % (33VO diet), 66 % (66VO diet) and 100 % (VO diet) of FO. No detrimental effects on growth performance were found with the partial FO replacement, but feed intake and growth rates were reduced by about 10 % in fish fed the VO diet. The replacement strategy did not damage the intestinal epithelium, and massive accumulation of lipid droplets was not found within enterocytes. All fish showed fatty livers, but signs of lipoid liver disease were only found in fish fed the VO diet. Muscle fatty acid profiles of total lipids reflected the diet composition with a selective incorporation of unsaturated fatty acids in polar lipids. The robustness of the phospholipid fatty acid profile when essential fatty acid requirements were theoretically covered by the diet was evidenced by multivariate principal components analysis in fish fed control, 33VO and 66VO diets. Keywords: Essential fatty acids; Phospholipids; Soya lecithin; Lipoid liver disease

3
Introduction 36
37
Marine fish farming is mostly based on diets containing high levels of n-3 highly 38
unsaturated fatty acids (n-3 HUFA), particularly eicosapentaenoic acid (EPA, 20:5n-3) and 39
docosahexaenoic acid (DHA, 22:6n-3). However, the continuous expansion of aquaculture and the 40
decreasing global availability of marine oil and fish meal force the industry to explore alternative 41
and sustainable lipid sources(1,2). In salmonids, the use of vegetable oils to replace the majority of 42
dietary fish oil (FO) is now feasible in practical aquafeeds without loss of growth performance(3-5). 43
Nevertheless, essential fatty acid (EFA) requirements differ between species. Thus, linoleic acid 44
(LA, 18:2n-6) and α-linolenic acid (LNA, 18:3n-3) can satisfy the EFA requirements of freshwater 45
fish, whereas marine fish require longer chain n-3 and n-6 polyunsaturated fatty acids (PUFA) for 46
optimal growth and health(6). Supporting this, fatty acid (FA) desaturation and elongation of LA and 47
LNA are well established in freshwater and anadromous fish species(7), but marine fish including 48
European sea bass(8) and gilthead sea bream(9,10) do not show rates for bioconversion of C18 PUFA 49
into C20 and C22 HUFA that would allow n-3 HUFA requirements to be met. 50
Signs of EFA deficiencies in fish include skin lesions and several neurological alterations 51
linked to reduced growth and survival rates during larval and juvenile on-growing phases(11). Lipoid 52
liver disease and intense accumulation of intestinal lipid droplets are also documented as metabolic 53
disorders arising from defective supplies of phospholipids(12-14) and n-3 HUFA(15). Additionally, FA 54
modulate immune responses and eicosanoid production from arachidonic acid (ARA, 20:4n-6) are 55
recognized as inflammatory agents, whereas DHA, and especially EPA-derived eicosanoids exert 56
anti-inflammatory effects in a wide variety of experimental models(16,17). However, factors other 57
than dietary ones may influence lipid metabolism, and relative rates of fat deposition and 58
mobilisation vary greatly as a result of environmental factors including parr-smolt transformation in 59
salmonids(18,19). Likewise, gonadal maturation and spawning have a significant impact in the muscle 60
FA profile of gilthead sea bream females(20). Deposition rates and FA profiles also vary seasonally 61
in wild gilthead sea bream(21), but the feeding regime is a major influence and most of these changes 62
can be overridden by full rations given under intensive aquaculture. Indeed, monitoring studies in 63
various Greek fish farms failed to show a seasonal impact in the muscle fat deposition and profiling 64
of gilthead sea bream(22). 65
Gilthead sea bream is a major cultured finfish in the Mediterranean area, and extensive 66
research to sustain further growth has proved that vegetable oils can replace up to 60% of the added 67
FO, in fish meal-based diets, without adverse effects on growth, feed efficiency and survival 68
rates(8,23,24). Additional studies have addressed the extensive replacement of fish meal by plant 69
proteins(25,26), and recently growth-compensatory mechanisms of the somatotropic axis have been 70

4
evidenced in short-term trials when juvenile fish were fed during the summer growth spurt with 71
plant protein-based diets and graded levels of vegetable oils(27). Indeed, with the total replacement 72
of dietary FO some growth reduction occurred, and it was accompanied by decreased production of 73
hepatic insulin-like growth factor-I (IGF-I) not compensated by the local expression (skeletal 74
muscle) of IGFs and/or growth hormone receptors. In humans and other animal models, there is 75
also increasing evidence linking endocrine and metabolic dysfunctions resulting in obesity and 76
insulin resistance with steatosic livers and altered FA profiles of phospholipids and stored 77
triglycerides(28). In this sense, three major goals were addressed herein in a gilthead sea bream trial 78
conducted over a growth trial of 8 months duration a) the relationship between dietary and muscle 79
FA profiles b) the robustness of the phospholipid FA profile when EFA requirements are 80
theoretically covered in the diet, and c) histological alterations of liver and intestine as sensitive 81
target tissues of lipid-metabolism deregulation. 82
83
84

5
Materials and methods 85
86
Diets 87
88
Four isoproteic, isolipidic and isoenergetic plant protein-based diets were made with a low 89
inclusion level (20%) of fish meal and fish soluble protein concentrates (Tables 1 and 2). All diets were 90
supplemented with L-lysine (0·55%) and contained soya lecithin (1%). Added oil was either 91
Scandinavian FO (control diet, CTRL diet) or a blend of vegetable oils, replacing 33% (33VO diet), 92
66% (66VO diet) and 100% (VO diet) of the FO. The blend of vegetable oils (2·5 rapeseed oil: 8·8 93
linseed oil: 3 palm oil) provided a similar balance of saturates, monoenes and PUFA to that found in 94
FO, but without HUFA(29,30). All diets were manufactured using a twin-screw extruder (Clextral, BC 95
45) at the INRA experimental research station of Donzacq (Landes, France), dried under hot air, sealed 96
and kept in air-tight bags until use. 97
98
Growth trial and tissue sampling 99
100
Juvenile gilthead sea bream (Sparus aurata L.) of Atlantic origin (Ferme Marine de Douhet, 101
Ile d’Oléron, France) were acclimated to laboratory conditions at the Institute of Aquaculture Torre 102
de la Sal (IATS) for 20 days before the start of the growth study. Fish of 16 g initial mean body 103
weight were distributed into 12 fibreglass tanks (500 litres) in groups of 60 fish per tank. Water 104
flow was 20 l/min, and oxygen content of outlet water remained higher than 85% saturation. The 105
growth study was undertaken over 8 months (May 23rd - January 18th), and day-length and water 106
temperature (11-27ºC) varied over the course of the trial following natural changes at IATS latitude 107
(40º 5’N; 0º 10’E). 108
Each diet was randomly allocated to triplicate groups of fish, and feed was offered by hand 109
to apparent visual satiety twice a day (9.00, 14.00 hours) from May to September, and once a day 110
(12.00 hours) from October to January. No mortality was registered, and feed intake was recorded 111
daily. At regular intervals, fish were counted and group-weighed under moderate anaesthesia 112
(3-aminobenzoic acid ethyl ester, MS 222; 100 μg/ml). At critical step windows over the growth 113
trial (midsummer, August 5th; early autumn, September 27th; and early winter, January 18th), 114
randomly selected fish (4 fish per tank; 12 fish per treatment) were killed by a blow on the head 115
prior to tissue sampling. Portions of dorsal muscle (white muscle) were extracted and rapidly 116
excised, frozen in liquid nitrogen, and stored at –80 ºC until FA analyses of lipid extracts. Liver and 117
intestine samples for fat content determinations and histological samples were taken only in 118
September (20 hours after the last feeding) when fish still show an active feeding behaviour. All 119
6
procedures were carried out according to national and institutional regulations (Consejo Superior de 120
Investigaciones Científicas, Institute of Aquaculture Torre de la Sal Review Board) and the current 121
European Union legislation on handling experimental animals. 122
123
Histology and tissue lipid content determinations 124
125
Tissue fragments of liver and hind gut were fixed in 10% buffered formalin, embedded in 126
Technovit-7100 resin (Kulzer, Heraeus, Germany), and stained with toluidine blue (TB) or 127
hematoxylin-eosin after thin sectioning (1-3 µm). Liver and muscle lipids were extracted according 128
to Folch et al.(31), and determined gravimetrically after the evaporation of the organic solvent under 129
a stream of nitrogen and overnight desiccation. 130
131
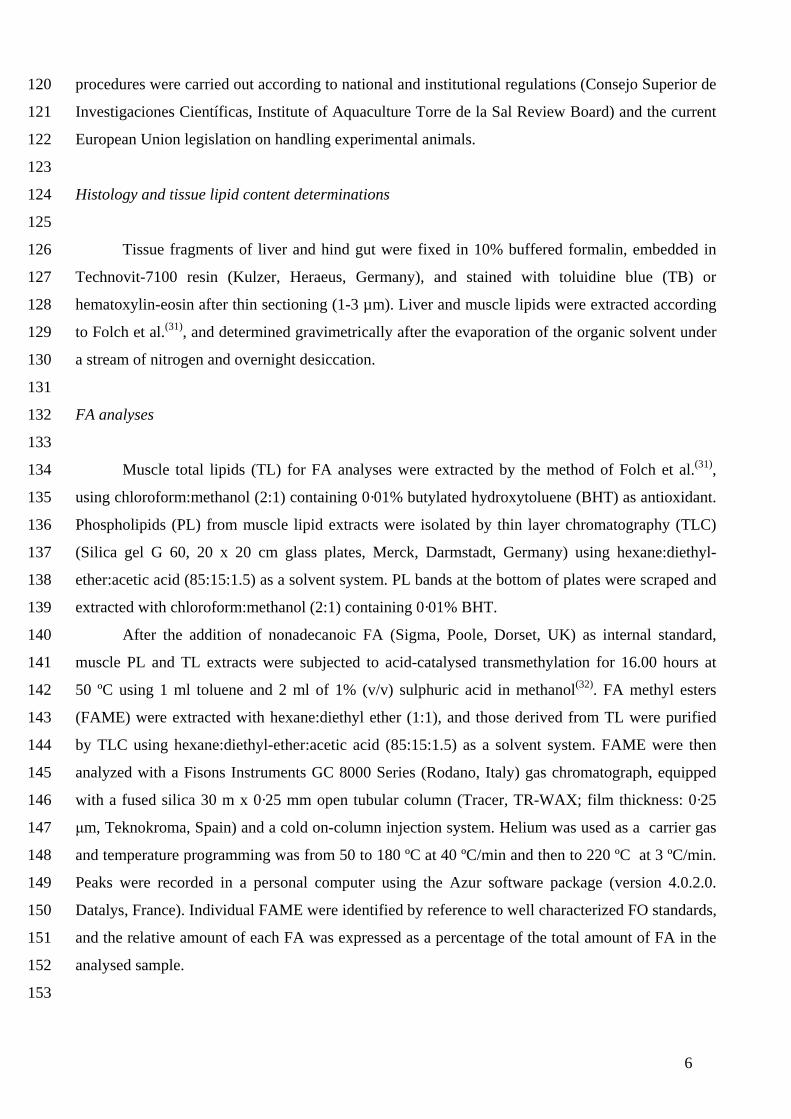
FA analyses 132
133
Muscle total lipids (TL) for FA analyses were extracted by the method of Folch et al.(31), 134
using chloroform:methanol (2:1) containing 0·01% butylated hydroxytoluene (BHT) as antioxidant. 135
Phospholipids (PL) from muscle lipid extracts were isolated by thin layer chromatography (TLC) 136
(Silica gel G 60, 20 x 20 cm glass plates, Merck, Darmstadt, Germany) using hexane:diethyl-137
ether:acetic acid (85:15:1.5) as a solvent system. PL bands at the bottom of plates were scraped and 138
extracted with chloroform:methanol (2:1) containing 0·01% BHT. 139
After the addition of nonadecanoic FA (Sigma, Poole, Dorset, UK) as internal standard, 140
muscle PL and TL extracts were subjected to acid-catalysed transmethylation for 16.00 hours at 141
50 ºC using 1 ml toluene and 2 ml of 1% (v/v) sulphuric acid in methanol(32). FA methyl esters 142
(FAME) were extracted with hexane:diethyl ether (1:1), and those derived from TL were purified 143
by TLC using hexane:diethyl-ether:acetic acid (85:15:1.5) as a solvent system. FAME were then 144
analyzed with a Fisons Instruments GC 8000 Series (Rodano, Italy) gas chromatograph, equipped 145
with a fused silica 30 m x 0·25 mm open tubular column (Tracer, TR-WAX; film thickness: 0·25 146
μm, Teknokroma, Spain) and a cold on-column injection system. Helium was used as a carrier gas 147
and temperature programming was from 50 to 180 ºC at 40 ºC/min and then to 220 ºC at 3 ºC/min. 148
Peaks were recorded in a personal computer using the Azur software package (version 4.0.2.0. 149
Datalys, France). Individual FAME were identified by reference to well characterized FO standards, 150
and the relative amount of each FA was expressed as a percentage of the total amount of FA in the 151
analysed sample. 152
153

7
Statistical analysis 154
155
Growth parameters (tank average values) and the relative amount of FA were checked for normal 156
distribution and homogeneity of variances, and when necessary arcsin transformation was 157
performed. Data were analyzed by one-way ANOVA followed by Student-Newman-Keuls (SNK) 158
test at a significance level of 5%. Also, the percentages of each FA were chemometrically analysed 159
by including them as variables in a multivariate principal components analysis (MPCA) model. 160
With such a parsimonic approach, the data set of variables (FA) is reduced into a smaller set of 161
factors or components. Parsimony is achieved by explaining the maximum amount of common 162
variance in a correlation matrix using the smallest number of explanatory concepts. Factors are 163
statistical entities that can be visualised as classification axes along which measurement variables 164
can be plotted, giving an idea of their correlation with the corresponding factor (loading). Score 165
plots are a graphical representation of individual (dietary groups) scores in the new subset of 166
measurement variables (factors). They illustrate the relationship among individual cases (dietary 167
groups), and the variables, and help in the analysis of data by showing graphical associations, or 168
through new statistical analyses. In the present work, factor scores were subsequently analyzed by 169
one way ANOVA and SNK multiple comparison tests. All analyses were made using the SPSS 170
package version 13.0 (SPSS Inc, Chicago, USA). 171

8
Results 172
173
Growth performance 174
Fish grew from 16 g to 240-270 g over a growth trial of 8 months duration under natural 175
light and temperature conditions (Fig. 1). The final body weight of fish fed the CTRL diet did not 176
differ from that of fish fed 33VO and 66VO diets, with overall specific growth rates ranging 177
between 1·12 and 1·16 (see Table 3). By contrast, the total replacement of FO dictated a slight but 178
significant reduction (10%) of final body weight in fish fed the VO diet. A concurrent and 179
significant decrease of voluntary feed intake (g DM intake) was found in fish fed the VO diet. Feed 180
efficiency (0·97-1·01) remained high and unchanged irrespective of dietary treatment. 181
182
Tissue fat deposition and histological alterations 183
184
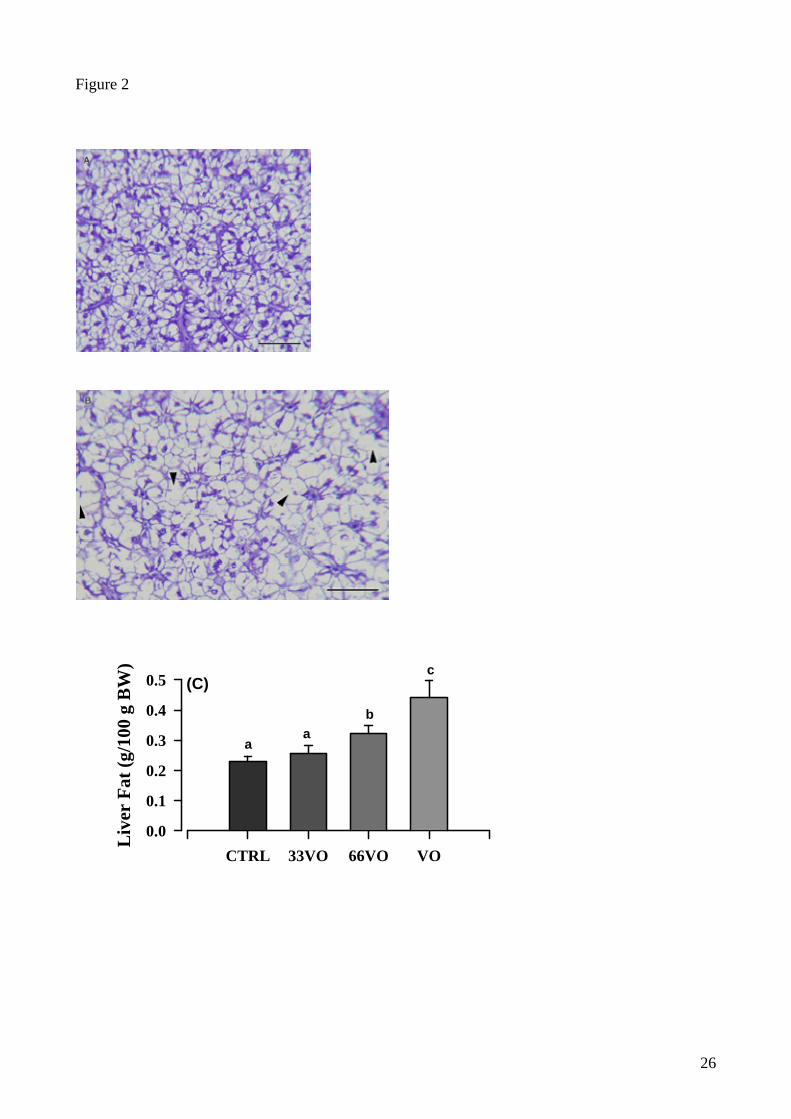
After the summer replenishment of energy stores, lipid content of dorsal white muscle 185
(6-8%) was not affected by the dietary treatment. Hepatic fat content in fish fed CTRL and 33VO 186
diets was high and of the same order of magnitude (15% on wet matter basis; 0·23-0·25 g/100g 187
body weight). A progressive and significant increase (up to 25%; 0·44 g/100 g body weight) was 188
found with the graded replacement of FO in fish fed 66VO and VO diets (Fig. 2C). However, signs 189
of initial and localized lipoid liver disease were only found with the total replacement of FO with 190
vegetable oils (Fig. 2A and B). None of the FO-replaced diets produced apparent signs of 191
histological damage in the intestine. Only one fish fed the VO diet had a moderate accumulation of 192
lipid droplets in the intestinal epithelium that was not considered pathological. 193
194
Muscle FA profile 195
196
The effects of dietary treatment upon muscle FA profiles of TL are shown in a time course 197
basis (Table 4). Overall, fish fed the CTRL diet contained 28% saturates (mainly 16:0 and 14:0), 198
almost 32% monoenes (over half of which were 18:1n-9), 12% n-6 FA (predominantly 18:2n-6), 199
and 18-20% n-3 HUFA (predominantly EPA and DHA). Increased amounts of 18:1n-9, 18:2n-6 and 200
18:3n-3, in combination with reduced proportions of n-3 HUFA and saturated FA, were found with 201
the progressive replacement of FO by vegetable oils. The two first components of MPCA accounted 202
for the 78% of variation of this data set, although 67·9% of variation was explained by component 1 203
itself (Fig. 3A). Thus, no grouping was recognized on the basis of sampling time (second factor 204
9
score), whereas four groups were significantly separated (SNK, P<0·05) and identified as VO, 205
66VO 33VO and CTRL in the first factor score (Fig. 3B). 206
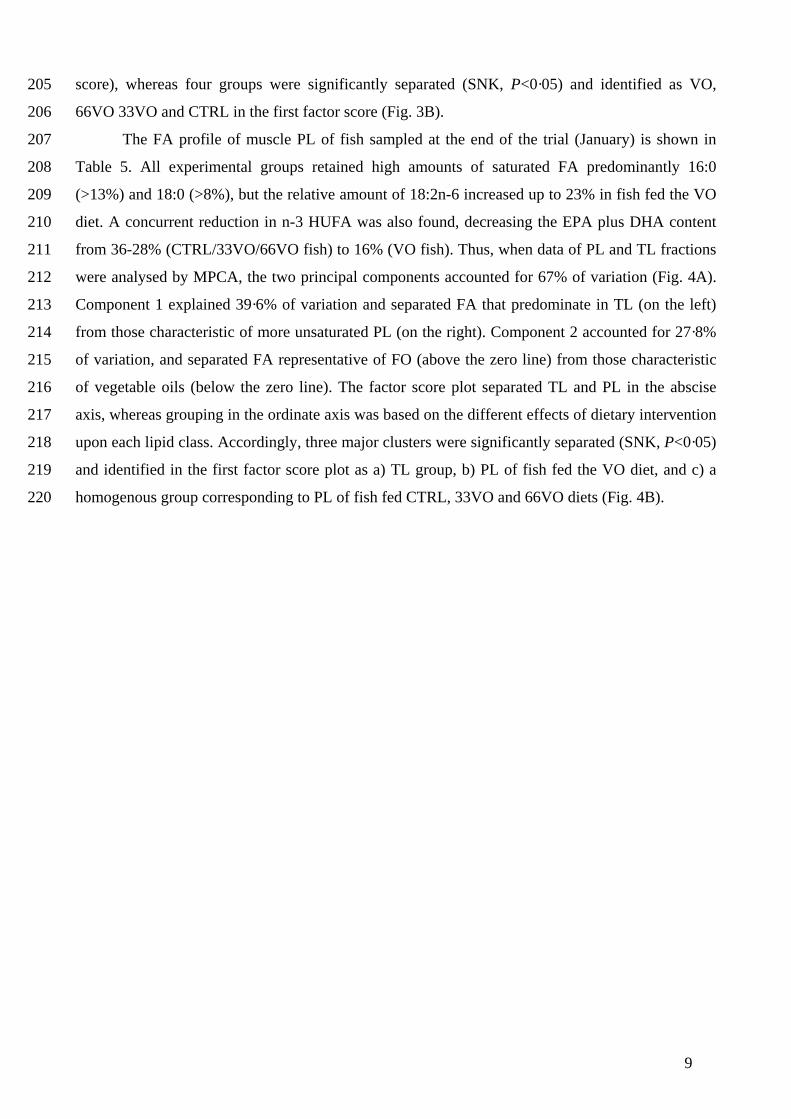
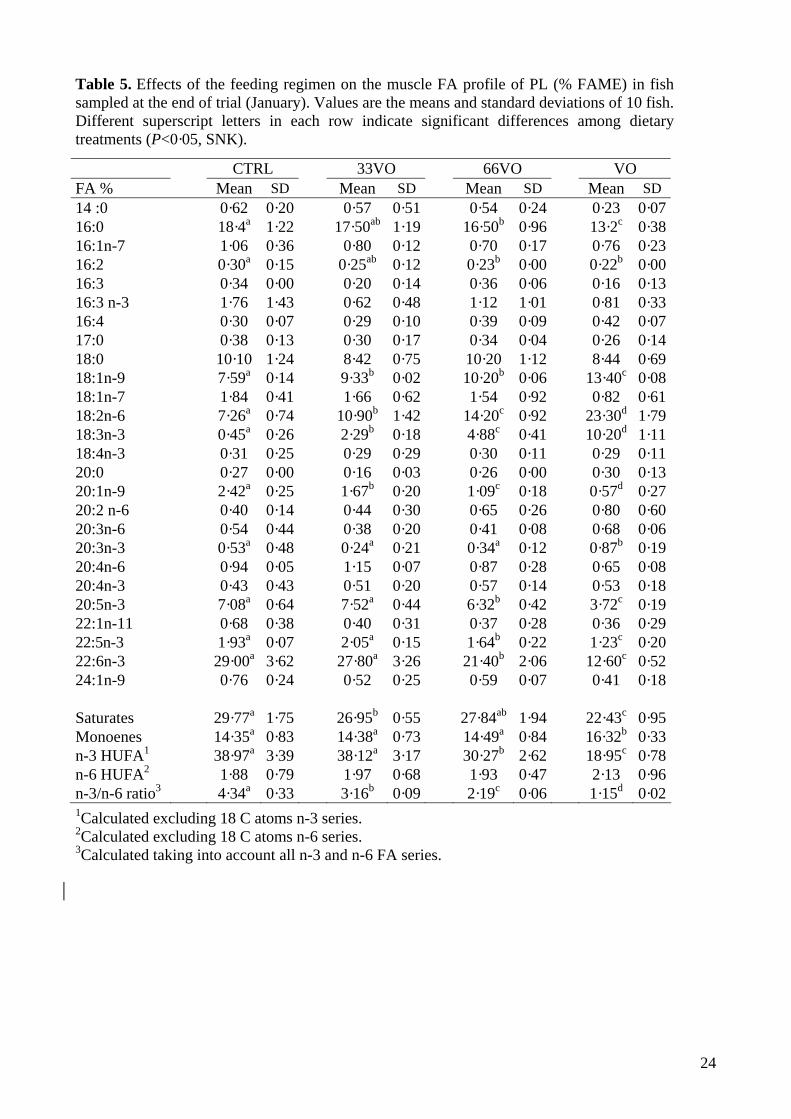
The FA profile of muscle PL of fish sampled at the end of the trial (January) is shown in 207
Table 5. All experimental groups retained high amounts of saturated FA predominantly 16:0 208
(>13%) and 18:0 (>8%), but the relative amount of 18:2n-6 increased up to 23% in fish fed the VO 209
diet. A concurrent reduction in n-3 HUFA was also found, decreasing the EPA plus DHA content 210
from 36-28% (CTRL/33VO/66VO fish) to 16% (VO fish). Thus, when data of PL and TL fractions 211
were analysed by MPCA, the two principal components accounted for 67% of variation (Fig. 4A). 212
Component 1 explained 39·6% of variation and separated FA that predominate in TL (on the left) 213
from those characteristic of more unsaturated PL (on the right). Component 2 accounted for 27·8% 214
of variation, and separated FA representative of FO (above the zero line) from those characteristic 215
of vegetable oils (below the zero line). The factor score plot separated TL and PL in the abscise 216
axis, whereas grouping in the ordinate axis was based on the different effects of dietary intervention 217
upon each lipid class. Accordingly, three major clusters were significantly separated (SNK, P<0·05) 218
and identified in the first factor score plot as a) TL group, b) PL of fish fed the VO diet, and c) a 219
homogenous group corresponding to PL of fish fed CTRL, 33VO and 66VO diets (Fig. 4B). 220

10
Discussion 221
222
The demand for feed in intensive aquaculture has increased over recent years and extensive 223
research has been done on alternative raw materials of vegetable origin. However, the main 224
constraint for the use of vegetable oils in marine fish feeds is the lack of n-3 long-chain PUFA, 225
particularly EPA and DHA. Moreover, quantitative requirements depend on species and growth 226
rates, and the biological demand for n-3 HUFA was at least 1·6% of dry matter for flatfish larvae(33) 227
decreasing to 0.8-0.6% in juvenile(34,35) and grower fish(36). Similar requirements were reported for 228
juvenile European sea bass(37) and gilthead sea bream(38). In the present study the theoretical 229
requirements of EFA were met by 33VO (1·6% EPA +DHA) and 66VO (0·9% EPA + DHA) diets, 230
but not by the VO diet (0·3% EPA + DHA). Thereby, in this and in a previous short-term trial(27), no 231
detrimental effects on growth performance were found with the replacement of up to 66% of the 232
added FO, whereas a slight but significant reduction in feed intake and weight gain was found with 233
the total FO replacement, indicating that a dietary supply of 0·3% of EPA+DHA was not sufficient 234
for normal growth and development of gilthead seabream. However, fish meal itself contains 235
appreciable amounts of FO, and trials conducted in our experimental facilities show that the total 236
replacement of the added FO is feasible without adverse effects on growth in gilthead sea bream 237
diets with a 30-35% fish meal inclusion (unpublished results). Regost et al.(39) also reported the 238
feasibility of the total replacement of FO by vegetable oils in turbot fed fish meal based-diets. 239
Similar results were reported in sharpsnout sea bream by Piedecausa et al.(40). However, in the 240
present study, we report for the first time, over the production cycle of a marine fish, the use of well 241
balanced plant protein diets with a low inclusion of marine raw materials (<20%) just to cover EFA 242
needs. 243
It is noteworthy that growth rates in the trial conducted in the present study were excellent 244
and even improved upon the values reported for fish of the same size class under similar 245
experimental conditions(25,26, 41,42). This fact can be attributed to the genetic improvement of fish 246
strains but also to better fish management, culture conditions and dietary formulation. Since fish 247
meal is also a source of PL, the plant protein mixture in this study was adequately supplemented 248
with amino acids and PL supplied in the form of soya lecithin. This added component is rich in 249
phosphatidylcholine (PC), a polar lipid molecule that is a natural component of lipoproteins and 250
cellular membranes adding fluidity and rigidity to cells as well as being required for lipoprotein 251
synthesis, lipid mobilisation and digestibility. Our experimental design does not delineate 252
unequivocally the beneficial effects of soya lecithin, but it must be noted that signs of intestine 253
damage and transport dysfunction (massive accumulation of lipid droplets) were not found in any 254
experimental group. By contrast, intense accumulation of lipid droplets was reported earlier in the 255

11
hind gut of juvenile gilthead sea bream fed plant protein and FO based-diets without phospholipid 256
supplementation(43). Similar histological alterations have been reported by other authors using 257
transmission electron microscopy(15) and, interestingly, earlier studies in young larvae demonstrated 258
that dietary lecithin increases the appearance of lipoproteins and enhances the lipid transport 259
through the gut(12,44,45). Likewise, intense accumulation of lipid droplets was seen in the 260
gastrointestinal tract of salmonids fed with plant oils, but this condition was reversed by 261
phospholipid supplementation(13,14). 262
Defects in FA storage and oxidation are a central initiating factor for metabolic and 263
endocrine alterations, resulting in enhanced FA flux from adipose tissue towards liver and 264
muscle(46,47). Ration size by itself is also a major disrupting factor, and long-term feeding close to 265
satiation increases hepatic fat deposition in gilthead sea bream juveniles, leading to lipoid liver 266
disease and enterocyte desquamation in fish fed commercial diets(48). Dietary inclusion of vegetable 267
oils(49,50) and plant proteins(43) also induces lipoid liver disease, and the role of tumour necrosis 268
factor-α (TNFα) and lipoprotein lipase (LPL) as lipolytic cytokines and rate-limiting enzymes in 269
tissue FA uptake has been reported in gilthead sea bream(51,52). Precise effects of nutrients on the 270
deregulation of lipid metabolic pathways still remain largely unknown, but several studies indicate 271
that soybean PC may alleviate signs of liver diseases, promoting a healthy lipid metabolism(12,53,54). 272
This notion is supported herein by the observation that hepatic fat deposition varied between 15% 273
and 25% of wet weight, though signs of initial and focal lipoid liver disease were only found with 274
the total FO replacement. By contrast, clear signs of liver disease have been reported with a liver fat 275
deposition below 15% in fish fed 16% lipid diets(43) (22% lipid diets were used in the present 276
study). This finding suggests that the fat threshold level for liver damage was significantly 277
increased in the present study. However, the extent to which this condition is due to PL 278
supplementation with soya lecithin rather than to other poorly defined dietary factors merits more 279
specific research. 280
Gilthead sea bream, as other poikilotherms, utilizes favourable conditions in summer for 281
rapid growth and replenishment of energy stores, but analyses of FA profiles in this and other fish 282
species including Atlantic salmon(55,56), rainbow trout(57), turbot(39) and European sea bass(58,59) 283
suggest a selective incorporation of n-3 PUFA in polar lipids and perhaps increased oxidation rates 284
of other more easily utilizable FA. Moreover, the seasonal cycling increases in fat storage alter the 285
ratio of polar and neutral lipids, driving the well reported changes in the muscle FA profile seen in 286
wild gilthead sea bream(21). In addition, there is experimental evidence linking FA profiles of wild 287
brown trout with the trophic level of the species, the location of the catch, and the size and 288
physiological status of the animal(60). However, feeding regimes under intensive aquaculture 289
production apparently override the impact of the season on the FA profile of farmed gilthead sea 290
12
bream(22). This notion is supported by data from the present study, and the MPCA analysis revealed 291
that the 68% of the total variation in the muscle FA profile of TL is explained by the dietary 292
component. Likewise, alterations in the muscle FA acid profile of cultured Chinook salmon are 293
viewed as a direct consequence of changes in body weight, fat deposition and ration size(61). This 294
information is of relevance and highlights important nutritional and quality traits, in particular for 295
meeting human requirements for n-3 PUFA and HUFA, which needs to be considered for a proper 296
timing and use of FO finishing diets for the recovery of a marine FA profile in fish fed vegetal oils 297
through most of the production cycle(29,30,39). 298
The degree of unsaturation of FA mediates the fluidity and structural integrity of cell 299
membranes, which may exacerbate signs of EFA deficiency during fish overwintering(1,62,63). This is 300
the reason why the analysis of PL FA profiles was focused herein on the cold season. At this time, 301
the factor score plot showed two major clusters corresponding to PL and TL subgroups. In addition, 302
the PL branch of fish fed CTRL, 33VO and 66VO diets appeared as a high homogenous group, 303
which evidenced the robustness of the PL FA profile when EFA requirements were theoretically 304
covered. However, fish fed VO diet were deficient in EFA, and PL-VO appeared as an outlier-305
group in the MPCA analysis. More detailed analyses revealed the relative enrichment of these fish 306
in 20:2n-6, 20:3n-6 and 20:3n-3. Since vegetable oils are devoid of these FA and they are part of the 307
biosynthetic routes of n-6 and n-3 HUFA, this finding highlights adaptive attempts to alleviate EFA 308
deficiencies. The accumulation of 20:3n-6 indicates increased Δ6 desaturation and elongation of 309
dietary 18:2n-6 that is driven by increased dietary and tissue levels of this FA, derived from 310
vegetable oils, as well as reduced tissue levels of n-3 HUFA(8). The increased levels of 20:2n-6 and 311
20:3n-3, which are “dead-end” elongation products of 18:2n-6 and 18:3n-3, respectively, reflect 312
increased levels of dietary C18 PUFA although increased levels of 20:3n-9, a marker of EFA 313
deficiency, were not observed. In gilthead sea bream, the expression of Δ-6 desaturase is highly 314
induced in fish fed a HUFA-free diet(10). There is also now evidence for a regulatory role of 315
conjugated LA acid upon the hepatic and intestine expression of fatty acyl elongase and Δ-6 fatty 316
acyl desaturase(64). However, a low activity of Δ-5 fatty acyl desaturase activity has been reported 317
either in vitro(65) or in vivo(9), which may act as a major constraining factor for bioconvertion of C18 318
PUFA into C20 and C22 HUFA at appreciable rates. 319
In summary, data on growth performance, tissue histology and FA analysis prompted us to 320
use practical diets with a low inclusion of marine raw materials through most of the production 321
cycle of gilthead sea bream, linking the robustness of the PL FA profile with endocrine, metabolic 322
and somatotropic factors. Precise effects at different developmental stages need to be further 323
evaluated, and interestingly muscle FA profiles and MPCA emerge not only as powerful tools to 324

13
understand foraging ecology and food webs, but also to evaluate alternative and sustainable 325
aquafeeds in a global change scenario. 326
327
Acknowledgements 328
This research was funded by EU (FOOD-CT-2006-16249: Sustainable Aquafeeds to Maximise the 329
Health Benefits of Farmed Fish for Consumers, AQUAMAX) and Spanish (AGL2004-06319-CO2) 330
projects. The authors declare there are no conflicts of interest perceived to bias this work. JG B and 331
S K have contributed in the experimental design of diets. A S-B has carried out the histology part. J-332
C N and L B-P have performed the fatty acid analyses and data process, and J P-S has coordinated 333
the work. 334

14
References 335 336 1. Sargent JR & Tacon AGJ (1999) Development of farmed fish: a nutritionally necessary 337
alternative to meat. Proc Nutr Soc Society 58, 377-383. 338
2. Watanabe T (2002) Strategies for further development of aquatic feeds. Fish Sci 68, 242-252. 339
3. Bell JG, McGhee F, Campbell PJ & Sargent JR (2003) Rapeseed oil as an alternative to marine 340 fish oil in diets of post-smolt Atlantic salmon (Salmo salar): changes in flesh fatty acid 341 composition and effectiveness of subsequent fish oil "wash out". Aquaculture 218, 515-528. 342
4. Bransden MP, Carter CG & Nichols PD (2003) Replacement of fish oil with sunflower oil in 343 feeds for Atlantic salmon (Salmo salar L.): effect on growth performance, tissue fatty acid 344 composition and disease resistance. Comp Biochem Physiol 135B, 611-625. 345
5. Torstensen BE, Froyland L, Ørnsrud R & Lie Ø (2004) Tailoring of a cardioprotective muscle 346 fatty acid composition of Atlantic salmon (Salmo salar) fed vegetable oils. Food Chem 87, 567-347 580. 348
6. Watanabe T (1982) Lipid nutrition in fish. Comp Biochem Physiol 73B, 3-15. 349
7. Sargent JR, Tocher DR & Bell JG (2002) The lipids. In: Fish Nutrition, 3th ed., pp. 181-257 350 [Halver JE, Hardy RW, editors]. San Diego, CA: Academic Press. 351
8. Mourente G, Dick JR, Bell JG & Tocher DR (2005) Effect of partial substitution of dietary fish 352 oil by vegetable oils on desaturation and β-oxidation of [1-14C]18:3n-3 (LNA) and [1-353 14C]20:5n-3 (EPA) in hepatocytes and enterocytes of European sea bass (Dicentrarchus labrax 354 L.). Aquaculture 248, 173-186. 355
9. Mourente G, Tocher DR (1994) In vivo metabolism of [1-14C]linolenic acid (18:3(n - 3)) and [1-356 14C]eicosapentaenoic acid (20:5(n - 3)) in a marine fish: Time-course of the desaturation / 357 elongation pathway. Biochim Biophys Acta - Lipids and Lipid Metabolism 1212, 109-118. 358
10. Seiliez I, Panserat S, Corraze G, Kaushik S & Bergot P (2003) Cloning and nutritional 359 regulation of a [Delta]6-desaturase-like enzyme in the marine teleost gilthead seabream (Sparus 360 aurata). Comp Biochem Physiol 135B, 449-460. 361
11. Sargent J, McEvoy L, Estevez A, Bell G, Bell M, Henderson J & Tocher D (1999) Lipid 362 nutrition of marine fish during early development: current status and future directions. 363 Aquaculture 179, 217-229. 364
12. Fontagné S, Geurden I, Escaffre AM & Bergot P (1998) Histological changes induced by 365 dietary phospholipids in intestine and liver of common carp (Cyprinus carpio L.) larvae. 366 Aquaculture 161, 213-223. 367
13. Olsen RE, Myklebust R, Kaino T & Ringo E (1999) Lipid digestibility and ultrastructural 368 changes in the enterocytes of Arctic char (Salvelinus alpinus L.) fed linseed oil and soybean 369 lecithin. Fish Physiol Biochem 21, 35-44. 370
14. Olsen RE, Dragnes BT, Myklebust R & Ringo E (2003) Effect of soybean oil and soybean 371 lecithin on intestinal lipid composition and lipid droplet accumulation of rainbow trout, 372 Oncorhynchus mykiss Walbaum. Fish Physiol Biochem 29, 181-192. 373

15
15. Caballero MJ, Izquierdo MS, Kjørsvik E, Montero D, Socorro J, Fernández AJ & Rosenlund G 374 (2003) Morphological aspects of intestinal cells from gilthead seabream (Sparus aurata) fed 375 diets containing different lipid sources. Aquaculture 225, 325-340. 376
16. Abeywardena MY, Head RJ (2001) Longchain n-3 polyunsaturated fatty acids and blood vessel 377 function. Cardiovasc Res 52, 361-371. 378
17. Calder PC (2006) Polyunsaturated fatty acids and inflammation. Prostaglandins Leukot Essent 379 Fatty Acids 75, 197-202. 380
18. Fonseca-Madrigal J, Karalazos V, Campbell PJ, Bell JG & Tocher DR (2005) Influence of 381 dietary palm oil on growth, tissue fatty acid compositions, and fatty acid metabolism in liver 382 and intestine in rainbow trout (Oncorhynchus mykiss). Aquacult Nutr 11, 241-250. 383
19. Fonseca-Madrigal J, Bell JG & Tocher DR (2006) Nutritional and environmental regulation of 384 the synthesis of highly unsaturated fatty acids and of fatty-acid oxidation in Atlantic salmon 385 (Salmo salar L.) enterocytes and hepatocytes. Fish Physiol Biochem 32, 317-328. 386
20. Almansa E, Martín MV, Cejas JR, Badía P, Jerez S & Lorenzo A (2001) Lipid and fatty acid 387 composition of female gilthead seabream during their reproductive cycle: effects of a diet 388 lacking n-3 HUFA. J Fish Biol 59, 267-286. 389
21. Özyurt G, Polat A & Özkütük S (2005) Seasonal changes in the fatty acids of gilthead sea 390 bream (Sparus aurata) and white sea bream (Diplodus sargus) captured in Iskenderun Bay, 391 eastern Mediterranean coast of Turkey. Eur Food Res Technol 220, 120-124. 392
22. Grigorakis K (2007) Compositional and organoleptic quality of farmed and wild gilthead sea 393 bream (Sparus aurata) and sea bass (Dicentrarchus labrax) and factors affecting it: a review. 394 Aquaculture 272, 55-75. 395
23. Izquierdo MS, Obach A, Arantzamendi L, Montero D, Robaina L & Rosenlund G (2003) 396 Dietary lipid sources for seabream and seabass: growth performance, tissue composition and 397 flesh quality. Aquacult Nutr 9, 397-407. 398
24. Izquierdo MS, Montero D, Robaina L, Caballero MJ, Rosenlund G & Ginés R (2005) 399 Alterations in fillet fatty acid profile and flesh quality in gilthead seabream (Sparus aurata) fed 400 vegetable oils for a long term period. Recovery of fatty acid profiles by fish oil feeding. 401 Aquaculture 250, 431-444. 402
25. Gómez-Requeni P, Mingarro M, Calduch-Giner JA, Médale F, Martin SAM, Houlihan DF, 403 Kaushik S & Pérez-Sánchez J (2004) Protein growth performance, amino acid utilisation and 404 somatotropic axis responsiveness to fish meal replacement by plant protein sources in gilthead 405 sea bream (Sparus aurata). Aquaculture 232, 493-510. 406
26. De Francesco M, Parisi G, Pérez-Sánchez J, Gómez-Requeni P, Médale F, Kaushik SJ, Mecatti 407 M & Poli BM (2007) Effect of high level fish meal replacement by plan proteins in gilthead sea 408 bream (Sparus aurata) on growth and body/fillets quality traits. Aquacult Nutr 13, 361-372. 409
27. Benedito-Palos L, Saera-Vila A, Calduch-Giner JA, Kaushik S & Pérez-Sánchez J (2007) 410 Combined replacement of fish meal and oil in practical diets for fast growing juveniles of 411 gilthead sea bream (Sparus aurata L.): Networking of systemic and local components of 412 GH/IGF axis. Aquaculture 267, 199-212. 413

16
28. Kelley DE (2002) Skeletal muscle triglycerides - An aspect of regional adiposity and insulin 414 resistance. Ann Ny Acad Sci 967, 135-145. 415
29. Torstensen BE, Froyland L, Ørnsrud R & Lie Ø (2005) Tailoring of Atlantic salmon (Salmo 416 salar L.) flesh lipid composition and sensory quality by replacing fish oil with a vegetable oil 417 blend. J Agric Food Chem 53, 10166-10178. 418
30. Mourente G, Good JE, Thompson KD & Bell JG (2007) Effects of partial substitution of dietary 419 fish oil with blends of vegetable oils, on blood leukocyte fatty acid compositions, inmune 420 function and histology in European sea bass (Dicentrarchus labrax L.). Br J Nutr 98, 770-779. 421
31. Folch J, Less N & Sloane-Stanley GH (1957) A simple method for insolation and purification of 422 total lipids from animal tissues. J Biol Chem 226, 497-509. 423
32. Christie WW (1982) Lipid analysis. Isolation, separation, identification and structural analysis 424 of lipids, 2nd ed., pp 207 [Christie WW]. Oxford: Pergamon Press. 425
33. Le Milinaire C, Gatesoupe FJ & Stephan G (1983) Quantitative approach to n-3 long-chain 426 poly-unsaturated fatty-acid requirement of turbot larvae (Scophthalmus-Maximus). C R Acad Sci 427 III, Sci Vie 296, 917-920. 428
34. Gatesoupe FJ, Leger C, Boudon M, Metailler R & Luquet P (1977) Lipid feeding of turbot 429 (Scophthalmus maximus L). Influence on growth of supplementation with methyl esters of 430 linolenic acid and fatty acids of ω9 series. Ann Hydrobiol 8, 247-254. 431
35. Lee SM, Lee JH & Kim KD (2003) Effect of dietary essential fatty acids on growth, body 432 composition and blood chemistry of juvenile starry flounder (Platichthys stellatus). Aquaculture 433 225, 269-281. 434
36. Leger C, Gatesoupe FJ, Metailler R, Luquet P & Fremont L (1979) Effect of dietary fatty acids 435 differing by chain lengths and ω series on the growth and lipid composition of turbot 436 Scophthalmus maximus L. Comp Biochem Physiol 64B, 345-350. 437
37. Skalli A & Robin JH (2004) Requirement of n-3 long chain polyunsaturated fatty acids for 438 European sea bass (Dicentrarchus labrax) juveniles: growth and fatty acid composition. 439 Aquaculture 240, 399-415. 440
38. Kalogeropoulos N, Alexis MN & Henderson RJ (1992) Effects of dietary soybean and cod-liver 441 oil levels on growth and body composition of gilthead bream (Sparus aurata). Aquaculture 104, 442 293-308. 443
39. Regost C, Arzel J, Robin J, Rosenlund G & Kaushik SJ (2003) Total replacement of fish oil by 444 soybean or linseed oil with a return to fish oil in turbot (Psetta maxima): 1. Growth 445 performance, flesh fatty acid profile, and lipid metabolism. Aquaculture 217, 465-482. 446
40. Piedecausa MA, Mazon MJ, Garcia Garcia B & Hernandez MD (2007) Effects of total 447 replacement of fish oil by vegetable oils in the diets of sharpsnout seabream (Diplodus 448 puntazzo). Aquaculture 263, 211-219. 449
41. Mingarro M, Vega-Rubín de Celis S, Astola A, Pendón C, Martínez Valdivia M & Pérez-450 Sánchez J (2002) Endocrine mediators of seasonal growth in gilthead sea bream (Sparus 451 aurata): the growth hormone and somatolactin paradigm. Gen Comp Endocrinol 128, 102-111. 452

17
42. Gómez-Requeni P, Mingarro M, Kirchner S et al. (2003) Effects of dietary amino acid profile 453 on growth performance, key metabolic enzymes and somatotropic axis responsiveness of 454 gilthead sea bream (Sparus aurata). Aquaculture 220, 749-767. 455
43. Sitjà-Bobadilla A, Peña-Llopis S, Gómez-Requeni P, Médale F, Kaushik S & Pérez-Sánchez J 456 (2005) Effect of fish meal replacement by plant protein sources on non-specific defence 457 mechanisms and oxidative stress in gilthead sea bream (Sparus aurata). Aquaculture 249, 387-458 400. 459
44. Salhi M, Hernández-Cruz CM, Bessonart M, Izquierdo MS & Fernández-Palacios H (1999) 460 Effect of different dietary polar lipid levels and different n-3 HUFA content in polar lipids on 461 gut and liver histological structure of gilthead seabream (Sparus aurata) larvae. Aquaculture 462 179, 253-263. 463
45. Liu J, Caballero MJ, Izquierdo MS, El-Sayed Ali T, Hernández-Cruz CM, Valencia A & 464 Fernández-Palacios H (2002) Necessity of dietary lecithin and eicosapentaenoic acid for growth, 465 survival, stress resistance and lipoprotein formation in gilthead sea bream Sparus aurata. Fish 466 Sci 68, 1165-1172. 467
46. Browning JD & Horton JD (2004) Molecular mediators of hepatic steatosis and liver injury. J 468 Clin Invest 114, 147-152. 469
47. Avramoglu RK, Basciano H & Adeli K (2006) Lipid and lipoprotein dysregulation in insulin 470 resistant states. Clin Chim Acta 368, 1-19. 471
48. Sitjà-Bobadilla A, Mingarro M, Pujalte MJ, Garay E, Alvarez-Pellitero P & Pérez-Sánchez J 472 (2003) Immunological and pathological status of gilthead sea bream (Sparus aurata L.) under 473 different long-term feeding regimes. Aquaculture 220, 707-724. 474
49. Caballero MJ, Izquierdo MS, Kjørsvik E, Fernández AJ & Rosenlund G (2004) Histological 475 alterations in the liver of sea bream, Sparus aurata L., caused by short- or long-term feeding 476 with vegetable oils. Recovery of normal morphology after feeding fish oil as the sole lipid 477 source. J Fish Dis 27, 531-541. 478
50. Wassef EA, Wahby OM & Sakr EM (2007) Effect of dietary vegetable oils on health and liver 479 histology of gilthead seabream (Sparus aurata) growers. Acuac Res 38, 852-861. 480
51. Saera-Vila A, Calduch-Giner JA, Gómez-Requeni P, Médale F, Kaushik S & Pérez-Sánchez J 481 (2005) Molecular characterization of gilthead sea bream (Sparus aurata) lipoprotein lipase. 482 Transcriptional regulation by season and nutritional condition in skeletal muscle and fat storage 483 tissues. Comp Biochem Physiol 142B, 224-232. 484
52. Saera-Vila A, Calduch-Giner JA, Navarro I & Pérez-Sánchez J (2007) Tumour necrosis factor 485 (TNF)α as a regulator of fat tissue mass in the Mediterranean gilthead sea bream (Sparus aurata 486 L.). Comp Biochem Physiol 146B, 338-345. 487
53. Canty DJ & Zeisel SH (1994) Lecithin and choline in human health and disease. Nutr Rev 52, 488 327-339. 489
54. Ipatova OM, Prozorovskaia NN, Torkhovskaia TI, Baranova VS & Guseva DA (2004) 490 Biological effects of the soybean phospholipids. Biomed Khim 50, 436-450. 491

18
55. Bell JG, McEvoy J, Tocher DR, McGhee F, Campbell PJ & Sargent JR (2001) Replacement of 492 fish oil with rapeseed oil in diets of atlantic salmon (Salmo salar) affects tissue lipid 493 compositions and hepatocyte fatty acid metabolism. J Nutr 131, 1535-1543. 494
56. Moya-Falcon C, Hvattum E, Tran TN, Thomassen MS, Skorve J & Ruyter B (2006) 495 Phospholipid molecular species, β-oxidation, desaturation and elongation of fatty acids in 496 Atlantic salmon hepatocytes: Effects of temperature and 3-thia fatty acids. Comp Biochem 497 Physiol 145B, 68-80. 498
57. Caballero MJ, Obach A, Rosenlund G, Montero D, Gisvold M & Izquierdo MS (2002) Impact 499 of different dietary lipid sources on growth, lipid digestibility, tissue fatty acid composition and 500 histology of rainbow trout, Oncorhynchus mykiss. Aquaculture 214, 253-271. 501
58. Richard N, Mourente G, Kaushik S & Corraze G (2006) Replacement of a large portion of fish 502 oil by vegetable oils does not affect lipogenesis, lipid transport and tissue lipid uptake in 503 European seabass (Dicentrarchus labrax L.). Aquaculture 261, 1077-1087. 504
59. Mourente G & Bell JG (2006) Partial replacement of dietary fish oil with blends of vegetable 505 oils (rapeseed, linseed and palm oils) in diets for European sea bass (Dicentrarchus labrax L.) 506 over a long term growth study: Effects on muscle and liver fatty acid composition and 507 effectiveness of a fish oil finishing diet. Comp Biochem Physiol 145B, 389-399. 508
60. Kaushik SJ, Corraze G, Radunz-Neto J, Larroquet L & Dumas J (2006) Fatty acid profiles of 509 wild brown trout and Atlantic salmon juveniles in the Nivelle basin. J Fish Biol 68, 1376-1387. 510
61. Kiessling A, Pickova J, Eales JG, Dosanjh B & Higgs D (2005) Age, ration level, and exercise 511 affect the fatty acid profile of chinook salmon (Oncorhynchus tshawytscha) muscle differently. 512 Aquaculture 243, 345-356. 513
62. Jobling M & Bendiksen EA (2003) Dietary lipids and temperature interact to influence tissue 514 fatty acid compositions of Atlantic salmon, Salmo salar L., parr. Acuac Res 34, 1423-1441. 515
63. Skalli A, Robin JH, Le Bayon N, Le Delliou H & Person-Le Ruyet J (2006) Impact of essential 516 fatty acid deficiency and temperature on tissues' fatty acid composition of European sea bass 517 (Dicentrarchus labrax). Aquaculture 255, 223-232. 518
64. Diez A, Menoyo D, Pérez-Benavente S et al. (2007) Conjugated linoleic acid affects lipid 519 composition, metabolism, and gene expression in gilthead sea bream (Sparus aurata L). J Nutr 520 137, 1363-1369. 521
65. Tocher DR, Ghioni C (1999) Fatty acid metabolism in marine fish: low activity of fatty acyl 522 delta5 desaturation in gilthead sea bream (Sparus aurata) cells. Lipids 34, 433-440. 523
524 525
19
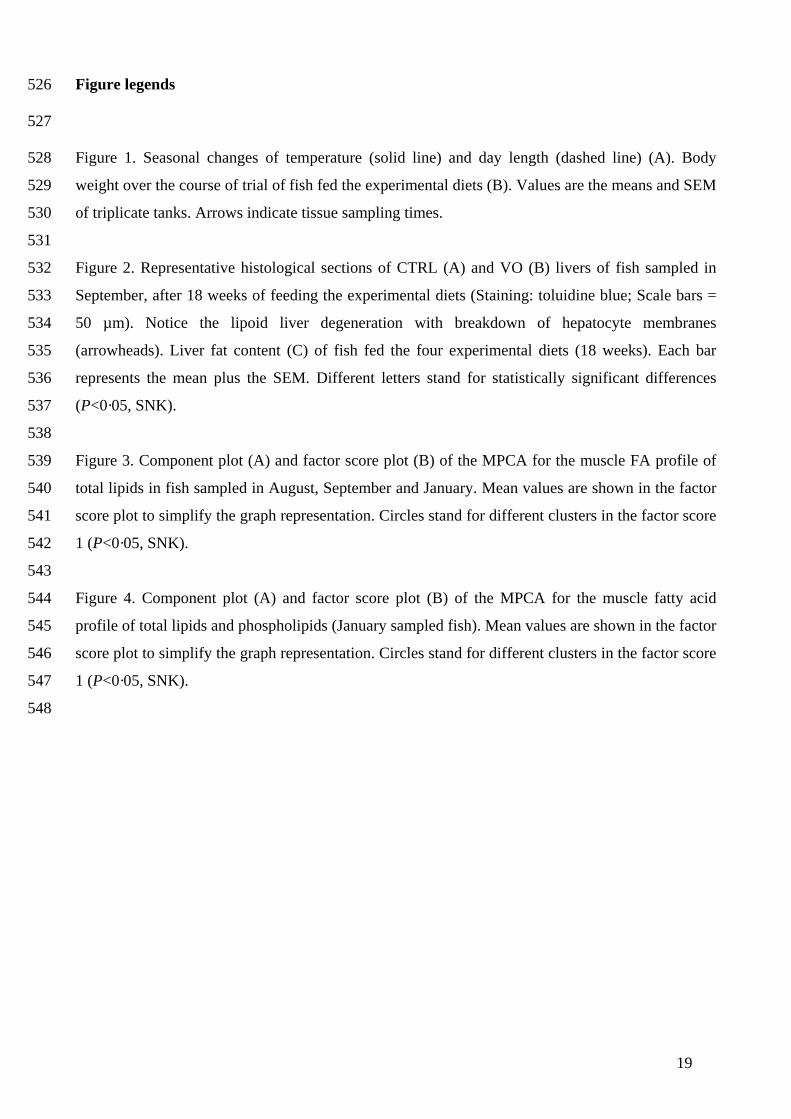
Figure legends 526
527
Figure 1. Seasonal changes of temperature (solid line) and day length (dashed line) (A). Body 528
weight over the course of trial of fish fed the experimental diets (B). Values are the means and SEM 529
of triplicate tanks. Arrows indicate tissue sampling times. 530
531
Figure 2. Representative histological sections of CTRL (A) and VO (B) livers of fish sampled in 532
September, after 18 weeks of feeding the experimental diets (Staining: toluidine blue; Scale bars = 533
50 µm). Notice the lipoid liver degeneration with breakdown of hepatocyte membranes 534
(arrowheads). Liver fat content (C) of fish fed the four experimental diets (18 weeks). Each bar 535
represents the mean plus the SEM. Different letters stand for statistically significant differences 536
(P<0·05, SNK). 537
538
Figure 3. Component plot (A) and factor score plot (B) of the MPCA for the muscle FA profile of 539
total lipids in fish sampled in August, September and January. Mean values are shown in the factor 540
score plot to simplify the graph representation. Circles stand for different clusters in the factor score 541
1 (P<0·05, SNK). 542
543
Figure 4. Component plot (A) and factor score plot (B) of the MPCA for the muscle fatty acid 544
profile of total lipids and phospholipids (January sampled fish). Mean values are shown in the factor 545
score plot to simplify the graph representation. Circles stand for different clusters in the factor score 546
1 (P<0·05, SNK). 547
548

20
Table 1. Ingredients and chemical composition of experimental diets.
Ingredient (%) CTRL 33VO 66VO VO Fish meal (CP 70%)1 15·00 15·00 15·00 15·00 CPSP 90 2 5·00 5·00 5·00 5·00 Corn gluten meal (CP 63%) 40·00 40·00 40·00 40·00 Soybean meal (CP 46%) 14·30 14·30 14·30 14·30 Extruded wheat (CP 15%) 4·00 4·00 4·00 4·00 Fish oil 3 15·15 10·15 5·15 0·00 Rapeseed oil 0·00 0·85 1·70 2·58 Linseed oil 0·00 2·90 5·80 8·79 Palm oil 0·00 1·25 2·50 3·79 Soya lecithin 1·00 1·00 1·00 1·00 Binder (sodium alginate) 1·00 1·00 1·00 1·00 Mineral premix 4 1·00 1·00 1·00 1·00 Vitamin premix 5 1·00 1·00 1·00 1·00 CaHPO4.2H2O (18%P) 2·00 2·00 2·00 2·00 L-Lysine 0·55 0·55 0·55 0·55 Proximate composition Dry matter (DM, %) 93·43 94·10 94·79 95·38 Protein (% DM) 48·98 48·74 49·03 48·65 Fat (% DM) 22·19 22·26 22·11 22·31 Ash (% DM) 6·54 6·57 6·62 6·41 EPA + DHA (% DM) 2·31 1·61 0·90 0·30 Gross energy (kJ/g DM) 24·72 24·71 24·65 24·49 1Fish meal (Scandinavian LT) 2Fish soluble protein concentrate (Sopropêche, France) 3Fish oil (Sopropêche, France) 4Supplied the following (mg / kg diet, except as noted): calcium carbonate (40% Ca) 2·15 g, magnesium hydroxide (60% Mg) 1·24 g, potassium chloride 0·9 g, ferric citrate 0·2 g, potassium iodine 4 mg, sodium chloride 0·4 g, calcium hydrogen phosphate 50 g, copper sulphate 0·3, zinc sulphate 40, cobalt sulphate 2, manganese sulphate 30, sodium selenite 0·3. 5Supplied the following (mg / kg diet): retinyl acetate 2·58, DL-cholecalciferol 0·037, DL-α tocopheryl acetate 30, menadione sodium bisulphite 2·5, thiamin 7·5, riboflavin 15, pyridoxine 7·5, nicotinic acid 87·5, folic acid 2·5, calcium pantothenate 2·5, vitamin B12 0·025, ascorbic acid 250, inositol 500, biotin 1·25 and choline chloride 500.

21
Table 2. Fatty acid composition of experimental diets (% FAME). Values are the mean of two determinations. FA % CTRL 33VO 66VO VO 14 :0 5·02 3·70 1·89 0·59 15:0 0·35 0·22 0·13 0·12 16:0 16·70 16·90 16·9 16·7 16:1n-7 4·63 2·97 1·96 0·76 16:1n-9 0·22 0·15 tr tr 16:2 0·49 0·35 0·26 0·14 16:3n-3 0·19 0·13 0·08 tr 16:4 0·40 0·29 0·17 tr 17:0 0·41 0·29 0·23 0·10 18:0 2·55 2·92 3·43 3·73 18:1n-9 12·50 17·50 21·90 25·90 18:1n-7 1·92 1·69 1·49 1·21 18:2n-6 12·10 15·70 19·20 21·30 18:3n-3 1·58 8·94 16·30 23·20 18:4n-3 2·16 1·47 0·82 0·20 20:0 0·30 0·30 0·31 0·29 20:1n-9 7·24 5·12 3·05 1·06 20:1n-7 0·21 0·16 0·09 tr 20:2n-6 0·17 0·12 0·11 tr 20:3n-3 0·08 0·07 tr tr 20:4n-6 0·31 0·22 0·13 tr 20:4n-3 0·43 0·28 0·15 tr 20:5n-3 6·86 4·68 2·75 0·94 22:0 tr 0·16 0·16 0·17 22:1n-11 10·19 6·74 3·68 0·74 22:1n-9 0·56 0·43 0·29 0·16 22:5n-3 0·64 0·40 0·18 tr 22:6n-3 8·34 5·68 3·38 1·06 Total 96·55 97·58 98·04 98·37 Saturates 25·33 24·33 22·89 21·53 Monoenes 37·47 34·76 32·46 29·83 n-3 HUFA1 16·35 11·11 6·46 2·00 n-6 HUFA2 0·48 0·34 0·24 tr
tr = trace values < 0·05 1Calculated excluding 18 C atoms n-3 series. 2Calculated excluding 18 C atoms n-6 series.

22
Table 3. Data on growth performance of fish fed the four experimental diets during 8 months. Values are the means and standard deviations of triplicate tanks.
1P values result from one-way ANOVA. Different superscript letters in each row indicate significant differences among dietary treatments (P<0.05, SNK). 2Specific growth ratio= [100 × (ln final fish wt − ln initial fish wt)] / days 3Feed efficiency = wet wt gain / dry feed intake
CTRL 33VO 66VO VO Mean SD Mean SD Mean SD Mean SD P 1
Initial body weight (g) 16·10 0·09 16·30 0·01 16·30 0·03 16·10 0·09 0·31 Final body weight (g) 257·80ab 11·84 269·57b 2·41 253·72a 0·16 237·39c 3·07 <0·05 DM intake (g/fish) 238·35a 6·68 256·87b 4·42 241·59a 2·69 226·11c 0·62 <0·001SGR (%) 2 1·14ab 0·01 1·16a 0·00 1·13b 0·00 1·11c 0·00 <0·05 FE3 1·01 0·02 0·98 0·00 0·98 0·01 0·97 0·01 0·07

23
Table 4. Effects of the feeding regimen on the muscle FA profile of TL (% FAME) in fish sampled in August, September and January. Values are the means and standard deviations of 10 fish. Different superscript letters in each row indicate significant differences over sampling time for each dietary treatment (P<0·05, SNK).
CTRL 33VO 66VO VO Aug Sep Jan Aug Sep Jan Aug Sep Jan Aug Sep Jan
FA % Mean SD Mean SD Mean SD Mean SD Mean SD Mean SD Mean SD Mean SD Mean SD Mean SD Mean SD Mean SD 14 :0 3·70a 0·22 3·67a 0·63 4·52b 0·36 2·48 0·41 2·54 0·41 2·60 0·42 1·79 0·16 1·62 0·15 1·77 0·31 0·90 0·12 0·79 0·12 1·12 0·45 16:0 20·40a 0·74 20·10a 0·81 18·30b 0·98 20·60a 0·79 19·00b 0·79 19·00b 0·44 17·80a 0·89 19·00b 0·90 17·20a 0·62 15·80 0·58 16·20 0·34 16·10 0·53 16:1n-7 4·75 0·28 4·58 0·74 5·38 0·52 3·60 0·51 3·65 0·51 3·64 0·50 2·93 0·18 2·56 0·21 2·85 0·38 1·77 0·34 1·52 0·21 2·15 0·52 16:2 0·25 0·02 0·25 0·02 0·28 0·02 0·13 0·05 0·18 0·05 0·15 0·02 0·08 0·03 0·13 0·04 0·11 0·03 tr tr 0·11 0·00 16:3 0·19 0·06 0·22 0·04 0·23 0·02 0·15 0·01 0·16 0·01 0·14 0·04 0·12 0·06 0·08 0·02 0·10 0·04 0·08 0·04 0·09 0·01 0·09 0·01 16:4 0·18 0·02 0·15 0·04 0·15 0·01 0·11 0·03 0·11 0·03 0·10 0·02 0·07 0·01 0·06 0·00 0·08 0·06 tr 0·07 0·02 0·13 0·05 17:0 0·22 0·02 0·26 0·05 0·23 0·01 0·20 0·04 0·18 0·04 0·19 0·02 0·12 0·06 0·18 0·01 0·21 0·06 0·14 0·56 0·14 0·56 0·13 0·01 18:0 3·82a 0·38 3·96a 0·66 3·00b 0·26 4·57 0·74 4·32 0·74 4·10 0·55 4·15 0·56 4·88 0·48 3·92 0·64 4·53 0·36 4·92 1·67 4·40 0·66 18:1n-9 17·40 0·56 16·00 0·86 16·80 0·98 20·40 1·40 20·60 1·41 18·50 2·85 25·00 1·61 23·80 0·91 24·50 2·25 28·20 0·78 27·50 0·08 27·30 3·06 18:1n-7 1·87 0·08 1·84 0·10 1·93 0·07 1·59 0·20 1·75 0·19 1·55 0·05 1·38 0·02 1·30 0·04 1·36 0·04 1·10 0·06 1·09 0·85 1·22 0·13 18:2n-6 10·70a 0·12 10·60a 0·65 11·80b 0·19 12·80a 0·93 13·40ab 0·93 14·90b 1·56 16·30a 0·46 16·60a 0·33 17·40b 0·15 19·40 0·52 20·40 1·54 20·50 1·66 18:3n-3 1·06 0·12 0·98 0·09 1·07 0·05 5·65 0·83 6·42 0·83 5·80 0·64 12·20 1·15 11·00 1·19 12·10 1·50 17·80 0·76 16·80 0·11 15·80 1·75 18:4n-3 1·28 0·08 1·22 0·22 1·38 0·10 0·89 0·20 1·00 0·20 0·83 0·13 0·81 0·12 0·64 0·15 0·77 0·12 0·63 0·08 0·51 0·03 0·55 0·13 20:0 0·18 0·02 0·18 0·02 0·18 0·01 0·17 0·06 0·20 0·06 0·17 0·02 0·16 0·01 0·16 0·01 0·17 0·01 0·15 0·01 0·17 0·10 0·16 0·01 20:1n-9 4·90 0·40 4·79 0·84 5·53 0·22 3·25 0·50 3·15 0·46 3·25 0·01 1·92 0·53 1·86 0·26 1·91 0·29 0·91 0·04 0·92 0·08 0·93 0·52 20:2n-6 0·22 0·00 0·24 0·02 0·25 0·03 0·23 0·06 0·28 0·02 0·26 0·01 0·27 0·01 0·27 0·03 0·27 0·03 0·28 0·02 0·33 0·03 0·33 0·03 20:3n-6 0·17 0·02 0·12 0·06 0·13 0·01 0·16 0·02 0·16 0·06 0·18 0·03 0·19 0·05 0·19 0·04 0·18 0·07 0·18 0·04 0·23 0·10 0·22 0·10 20:3n-3 0·07 0·00 0·09 0·03 0·08 0·00 0·12a 0·05 0·17b 0·05 0·16b 0·01 0·27ab 0·02 0·23a 0·04 0·29b 0·04 0·40 0·06 0·45 0·07 0·48 0·09 20:4n-6 0·49a 0·02 0·54a 0·16 0·38b 0·08 0·49 0·10 0·41 0·02 0·42 0·09 0·26 0·10 0·30 0·05 0·24 0·12 0·18 0·04 0·17 0·09 0·17 0·09 20:4n-3 0·58 0·06 0·59 0·07 0·66 0·04 0·49 0·00 0·52 0·15 0·52 0·06 0·47 0·03 0·39 0·05 0·45 0·05 0·34 0·04 0·34 0·39 0·35 0·05 20:5n-3 6·06 0·42 6·40 0·85 5·02 0·37 4·87 0·93 4·58 0·03 4·34 0·72 2·83 0·55 3·06 0·29 2·56 0·76 1·41 0·24 1·34 0·05 1·55 0·74 22:1n-9 0·62 0·08 0·31 0·08 0·42 0·03 0·22 0·10 0·29 0·93 0·26 0·03 0·20 0·15 0·11 0·02 0·28 0·12 0·10 0·15 0·09 0·03 0·14 0·04 22:1n-11 4·83 0·66 4·73 1·05 5·35 0·51 2·62 0·60 2·91 0·15 2·78 0·46 1·65 0·31 1·46 0·28 1·62 0·40 0·27 0·12 0·30 0·05 0·33 0·09 22:5n-3 1·31 0·10 1·37 0·10 1·51 0·11 1·10 0·07 1·06 0·08 1·25 0·15 0·80 0·17 0·63 0·10 0·69 0·41 0·36 0·1 0·32 0·17 0·45 0·09 22:6n-3 10·80 1·00 12·40 2·79 10·60 2·05 9·74 2·32 8·85 0·63 11·00 2·67 5·75 1·77 6·54 0·82 6·02 2·58 3·11 0·5 3·15 1·15 3·52 1·82 24:1n-9 0·56a 0·08 0·40b 0·04 0·41b 0·04 0·56a 0·03 0·40b 0·07 0·35b 0·08 0·40a 0·04 0·38a 0·04 0·32b 0·03 0·29 0·02 0·29 0·03 0·35 0·06 Saturates 28·32a 1·05 28·17a 0·81 26·23b 0·90 28·02 1·86 26·24 1·22 26·06 0·57 24·02a 1·32 25·84b 1·24 23·27a 0·97 21·52 0·78 22·22 0·77 21·91 0·93 Monoenes 34·93 1·46 32·65 3·61 35·82 1·92 32·24 3·36 32·75 2·93 30·33 4·07 33·48 2·43 31·47 1·09 32·84 3·41 32·64 0·96 31·71 1·97 32·42 3·35 n-3 HUFA1 18·82 1·48 20·85 3·59 17·87 2·38 16·32 3·14 15·18 3·26 17·27 3·44 10·12 2·49 10·85 1·23 10·01 3·73 5·62 0·81 5·60 1·61 6·35 2·75 n-6 HUFA2 0·88 1·13 0·09 0·11 0·76 0·06 0·88 0·11 0·85 0·22 0·86 0·11 0·72 0·15 0·76 0·13 0·69 0·19 0·64 0·07 0·73 0·18 0·72 0·20 tr = trace value < 0·05. 1Calculated excluding 18 C atoms n-3 series. 2Calculated excluding 18 C atoms n-6 series.
24
Table 5. Effects of the feeding regimen on the muscle FA profile of PL (% FAME) in fish sampled at the end of trial (January). Values are the means and standard deviations of 10 fish. Different superscript letters in each row indicate significant differences among dietary treatments (P<0·05, SNK).
1Calculated excluding 18 C atoms n-3 series. 2Calculated excluding 18 C atoms n-6 series. 3Calculated taking into account all n-3 and n-6 FA series.
CTRL 33VO 66VO VO FA % Mean SD Mean SD Mean SD Mean SD 14 :0 0·62 0·20 0·57 0·51 0·54 0·24 0·23 0·0716:0 18·4a 1·22 17·50ab 1·19 16·50b 0·96 13·2c 0·3816:1n-7 1·06 0·36 0·80 0·12 0·70 0·17 0·76 0·2316:2 0·30a 0·15 0·25ab 0·12 0·23b 0·00 0·22b 0·0016:3 0·34 0·00 0·20 0·14 0·36 0·06 0·16 0·1316:3 n-3 1·76 1·43 0·62 0·48 1·12 1·01 0·81 0·3316:4 0·30 0·07 0·29 0·10 0·39 0·09 0·42 0·0717:0 0·38 0·13 0·30 0·17 0·34 0·04 0·26 0·1418:0 10·10 1·24 8·42 0·75 10·20 1·12 8·44 0·6918:1n-9 7·59a 0·14 9·33b 0·02 10·20b 0·06 13·40c 0·0818:1n-7 1·84 0·41 1·66 0·62 1·54 0·92 0·82 0·6118:2n-6 7·26a 0·74 10·90b 1·42 14·20c 0·92 23·30d 1·7918:3n-3 0·45a 0·26 2·29b 0·18 4·88c 0·41 10·20d 1·1118:4n-3 0·31 0·25 0·29 0·29 0·30 0·11 0·29 0·1120:0 0·27 0·00 0·16 0·03 0·26 0·00 0·30 0·1320:1n-9 2·42a 0·25 1·67b 0·20 1·09c 0·18 0·57d 0·2720:2 n-6 0·40 0·14 0·44 0·30 0·65 0·26 0·80 0·6020:3n-6 0·54 0·44 0·38 0·20 0·41 0·08 0·68 0·0620:3n-3 0·53a 0·48 0·24a 0·21 0·34a 0·12 0·87b 0·1920:4n-6 0·94 0·05 1·15 0·07 0·87 0·28 0·65 0·0820:4n-3 0·43 0·43 0·51 0·20 0·57 0·14 0·53 0·1820:5n-3 7·08a 0·64 7·52a 0·44 6·32b 0·42 3·72c 0·1922:1n-11 0·68 0·38 0·40 0·31 0·37 0·28 0·36 0·2922:5n-3 1·93a 0·07 2·05a 0·15 1·64b 0·22 1·23c 0·2022:6n-3 29·00a 3·62 27·80a 3·26 21·40b 2·06 12·60c 0·5224:1n-9 0·76 0·24 0·52 0·25 0·59 0·07 0·41 0·18 Saturates 29·77a 1·75 26·95b 0·55 27·84ab 1·94 22·43c 0·95Monoenes 14·35a 0·83 14·38a 0·73 14·49a 0·84 16·32b 0·33n-3 HUFA1 38·97a 3·39 38·12a 3·17 30·27b 2·62 18·95c 0·78n-6 HUFA2 1·88 0·79 1·97 0·68 1·93 0·47 2·13 0·96n-3/n-6 ratio3 4·34a 0·33 3·16b 0·09 2·19c 0·06 1·15d 0·02

25
Figure 1
May Jun Jul Aug Sep Oct Nov Dec Jan Feb
Bod
y W
eigh
t (g)
0
50
100
150
200
250
300
Tem
pera
ture
(ºC
)
9121518
21242730
Day
leng
th (h
)
08
10
12
14
16(A)
CTRL 33VO 66VO VO
(B)
26
CTRL 33VO 66VO VO
Liv
er F
at (g
/100
g B
W)
0.0
0.1
0.2
0.3
0.4
0.5
b
c
aa
(C)
Figure 2

27
Component 1 (67.9%)-1.5 -1.0 -0.5 0.0 0.5 1.0 1.5
Com
pone
nt 2
(10.
2%)
-0.6
-0.4
-0.2
0.0
0.2
0.4
0.6
0.8
18:0
20:3 n-318:3 n-3
18:1 n-920:3 n-618:2 n-6
20:2 n-6
16:024:1 n-9
20:4 n-3
20:5 n-322:6 n-315:022:1 n-11
16:4
20:0
17:016:2 22:5 n-3
20:1 n-914:016:1 n-718:1 n-720:4 n-618:4 n-3
22:1 n-9 16:3
(A)
Factor score 1 -1.5 -1.0 -0.5 0.0 0.5 1.0 1.5
Fact
or sc
ore
2
-2
-1
0
1
2
Aug
SepAug
Sep
(B)
SepJan
Aug
Jan
Jan
Sep
Aug
Jan
TL-VO
TL-66VOTL-33VO
TL-CTRL
Figure 3

28
Figure 4
Component 1 (39.6%)-1.5 -1.0 -0.5 0.0 0.5 1.0 1.5
Com
pone
nt 2
(27.
8%)
-1.0
-0.8-0.6
-0.4-0.20.0
0.20.4
0.60.81.01.2
18:2 n-618:3 n-3
18:1 n-9
16:1 n-7 18:4 n-322:1 n-1114:0
16:020:1 n-9 18:1 n-7
20:4 n-3 16:220:5 n-322:5 n-3
16:3
24:1 n-922:6 n-317:020:4 n-6
18:020:0 16:4
20:3 n-620:2 n-6
20:3 n-3
(A)
Factor score 1 -1.5 -1.0 -0.5 0.0 0.5 1.0 1.5
Fact
or sc
ore
2
-2
-1
0
1
2TL-CTRL
TL-33VO
TL-66VO
TL-VO
PL-VO
PL-66VO
PL-33VO
PL-CTRL
(B)
Related Documents