ORIGINAL RESEARCH Health Care Utilization and Costs Associated with Nausea and Vomiting in Patients Receiving Oral Immediate-Release Opioids for Outpatient Acute Pain Management Elizabeth Marrett . Winghan Jacqueline Kwong . Feride Frech . Chunlin Qian Received: August 22, 2016 / Published online: October 4, 2016 Ó The Author(s) 2016. This article is published with open access at Springerlink.com ABSTRACT Introduction: Nausea and vomiting (NV) are common side effects of opioid use and limiting factors in pain management. This study sought to quantify the frequency of antiemetic prescribing and the impact of NV on health care resource utilization and costs in outpatients prescribed opioids for acute pain. The perspective was that of a commercial health plan. Methods: Medical and pharmacy claims from IMS PharMetrics Plus were used to identify patients initiating opioid therapy with a prescription for an oxycodone-, hydrocodone- or codeine-containing immediate-release product for acute use (B15-day supply) between October 1, 2013 and September 30, 2014. Patients with a medical claim for NV (International Classification of Diseases, Ninth Revision, Clinical Modification codes 787.0x), with or without an antiemetic prescription fill, were compared with patients with no NV claim or antiemetic prescription fill to assess differences in all-cause health care utilization and costs over 1 month. Propensity score matching (PSM) was used to adjust for between-group differences in baseline patient characteristics. Results: The co-prescribing of opioids with antiemetic agents was 10.2%. After PSM (n = 45,790 per group), patients with NV claims had significantly more hospitalizations (11.5% vs 4.2%), emergency department visits (65.0% vs 12.1%), and physician office visits (85.2% vs 64.5%) compared with patients with no NV claims (all P \0.0001). Mean total health care costs were higher among patients with a NV claim versus those without evidence of the side effect ($6290 vs $2309; P \0.0001). Among patients with a recent hospitalization, patients with NV claims had higher rates of 30-day rehospitalization than those with no NV claims (24.4% vs 3.0%; P \0.0001). Enhanced content To view enhanced content for this article go to http://www.medengine.com/Redeem/ 84E6F06069F22E1E. Electronic supplementary material The online version of this article (doi:10.1007/s40122-016-0057-y) contains supplementary material, which is available to authorized users. E. Marrett (&) Á W. J. Kwong Á C. Qian Daiichi Sankyo, Inc., Parsippany, NJ, USA e-mail: [email protected] F. Frech Spring, TX, USA Pain Ther (2016) 5:215–226 DOI 10.1007/s40122-016-0057-y

Welcome message from author
This document is posted to help you gain knowledge. Please leave a comment to let me know what you think about it! Share it to your friends and learn new things together.
Transcript
ORIGINAL RESEARCH
Health Care Utilization and Costs Associatedwith Nausea and Vomiting in Patients Receiving OralImmediate-Release Opioids for Outpatient Acute PainManagement
Elizabeth Marrett . Winghan Jacqueline Kwong . Feride Frech .
Chunlin Qian
Received: August 22, 2016 / Published online: October 4, 2016� The Author(s) 2016. This article is published with open access at Springerlink.com
ABSTRACT
Introduction: Nausea and vomiting (NV) are
common side effects of opioid use and limiting
factors in pain management. This study sought
to quantify the frequency of antiemetic
prescribing and the impact of NV on health
care resource utilization and costs in
outpatients prescribed opioids for acute pain.
The perspective was that of a commercial health
plan.
Methods: Medical and pharmacy claims from
IMS PharMetrics Plus were used to identify
patients initiating opioid therapy with a
prescription for an oxycodone-, hydrocodone- or
codeine-containing immediate-release product
for acute use (B15-day supply) between October
1, 2013 and September 30, 2014. Patients with a
medical claim forNV(InternationalClassification
ofDiseases,Ninth Revision,ClinicalModification
codes 787.0x), with or without an antiemetic
prescription fill, were compared with patients
withnoNVclaimor antiemetic prescriptionfill to
assess differences in all-cause health care
utilization and costs over 1 month. Propensity
score matching (PSM) was used to adjust for
between-group differences in baseline patient
characteristics.
Results: The co-prescribing of opioids with
antiemetic agents was 10.2%. After PSM
(n = 45,790 per group), patients with NV
claims had significantly more hospitalizations
(11.5% vs 4.2%), emergency department visits
(65.0% vs 12.1%), and physician office visits
(85.2% vs 64.5%) compared with patients with
no NV claims (all P\0.0001). Mean total health
care costs were higher among patients with a
NV claim versus those without evidence of the
side effect ($6290 vs $2309; P\0.0001). Among
patients with a recent hospitalization, patients
with NV claims had higher rates of 30-day
rehospitalization than those with no NV claims
(24.4% vs 3.0%; P\0.0001).
Enhanced content To view enhanced content for thisarticle go to http://www.medengine.com/Redeem/84E6F06069F22E1E.
Electronic supplementary material The onlineversion of this article (doi:10.1007/s40122-016-0057-y)contains supplementary material, which is available toauthorized users.
E. Marrett (&) � W. J. Kwong � C. QianDaiichi Sankyo, Inc., Parsippany, NJ, USAe-mail: [email protected]
F. FrechSpring, TX, USA
Pain Ther (2016) 5:215–226
DOI 10.1007/s40122-016-0057-y

Conclusions: Among outpatients prescribed
opioids for management of acute pain,
co-prescribing with antiemetics was low, and
the economic burden associated with NV was
high. Efforts to prevent NV in patients receiving
opioid therapy may improve patient outcomes
and provide cost savings to the health care
system.
Funding: Daiichi Sankyo, Inc.
Keywords: Acute pain; Analgesia; Analgesics;
Antiemetics; Health care costs; Health care
utilization; Rehospitalization; Opioid;
Opioid-induced nausea and vomiting;
Outpatient
INTRODUCTION
As the most common medical complaint in the
United States, pain represents a significant
public health burden, with estimated annual
direct and indirect costs exceeding $600 billion
[1]. Opioids are the most widely used analgesic
and part of a multimodal pain management
approach [2–5]. In 2012, health care
professionals wrote more than 259 million
prescriptions for opioid analgesics [6]. Careful
monitoring and judicious use are warranted, as
opioids are associated with life-threatening
adverse events, such as respiratory depression,
and there is also potential for diversion and
misuse [7–12]. Opioid-induced nausea and
vomiting (OINV), a common adverse event in
patients using opioid therapy for acute pain,
can be a significant barrier to effective pain
management [13–17]. Published reports of
OINV suggest that nausea develops in
approximately 40% of patients and vomiting
develops in approximately 20% of patients,
both of which may have a higher incidence in
clinical practice [18–23]. In a systematic review
of opioid-related adverse events in
postoperative patients, 31% reported
gastrointestinal adverse events, such as nausea,
vomiting, and constipation [24].
Gastrointestinal adverse events may be a
contributing factor to treatment
discontinuation [10]. Survey data have shown
that, to reduce gastrointestinal-related adverse
events, including nausea, vomiting, or
constipation, 13% of patients with acute pain
discontinued their opioid treatment, and 16%
of patients with acute pain reduced their dose of
opioids [25].
Inadequately treated acute pain has been
associated with an increased risk of progression
to chronic pain [10, 26–28]. In addition, studies
have shown that inadequately treated acute
pain may also result in problems ranging from
sleep impairment to the development of
depression or post-traumatic stress disorder
[29, 30]. Thus, OINV may significantly
compromise effective pain management
increasing overall health care utilization and
associated costs [10, 25, 31].
While there are ample data regarding the
economic consequences of nausea and
vomiting (NV) in the hospital setting
[23, 32–35], corresponding data in the
outpatient setting are limited. A previous
study that examined the costs of
gastrointestinal events in outpatients treated
with immediate-release (IR) opioids for
noncancer pain found that NV was associated
with increased all-cause health care utilization
and costs over a 3-month follow-up period [31].
However, as OINV typically occurs early in
treatment and resolves as tolerance develops
[36, 37], economic outcomes collected over this
timeframe may not be applicable for
shorter-term treatment. Although antiemetics
are effective in preventing and alleviating
216 Pain Ther (2016) 5:215–226
OINV, data pertaining to the rate of antiemetic
co-prescribing are scarce.
The objectives of this real-world study were
to describe antiemetic usage and to estimate the
economic burden associated with NV over a
30-day follow-up period among a large cohort
of outpatients receiving IR opioids for the
management of acute pain from the
perspective of a US commercial health plan.
METHODS
Patient Eligibility and Study Design
A retrospective analysis was conducted using
IMS PharMetrics Plus (IMS Health, Waltham,
MA, USA) real-world data. The database consists
primarily of US commercial preferred provider
organization plans, enrolling approximately 95
million total patients with both medical and
pharmacy benefits. The database contains
deidentified patient records and complies with
Health Insurance Portability and Accountability
Act patient privacy safeguards. The IMS
database provides a broad view of patient
health status and utilization of health care via
integrated medical and pharmacy claims. The
reimbursable amounts for covered medical
services and medications are also recorded
allowing for the assessment of allowed (versus
billed) costs. Due to the large number of
covered lives, the IMS database is generally
representative of the US commercially insured
population.
Medical and pharmacy claims were used to
identify patients initiating opioid therapy who
were aged C18 years and who filled a short-term
prescription (B15-day supply) for any IR
codeine-, hydrocodone-, or
oxycodone-containing tablet or capsule from
October 1, 2013 through September 30, 2014.
The aforementioned analgesics were selected for
this analysis as they represent the most
commonly prescribed opioids for the
treatment of acute pain in the outpatient
setting. The date of this first prescription fill
was considered the index date. Eligible patients
were required to have continuous enrollment in
the database for 180 days prior to the index date
(baseline period) and for 30 days after the index
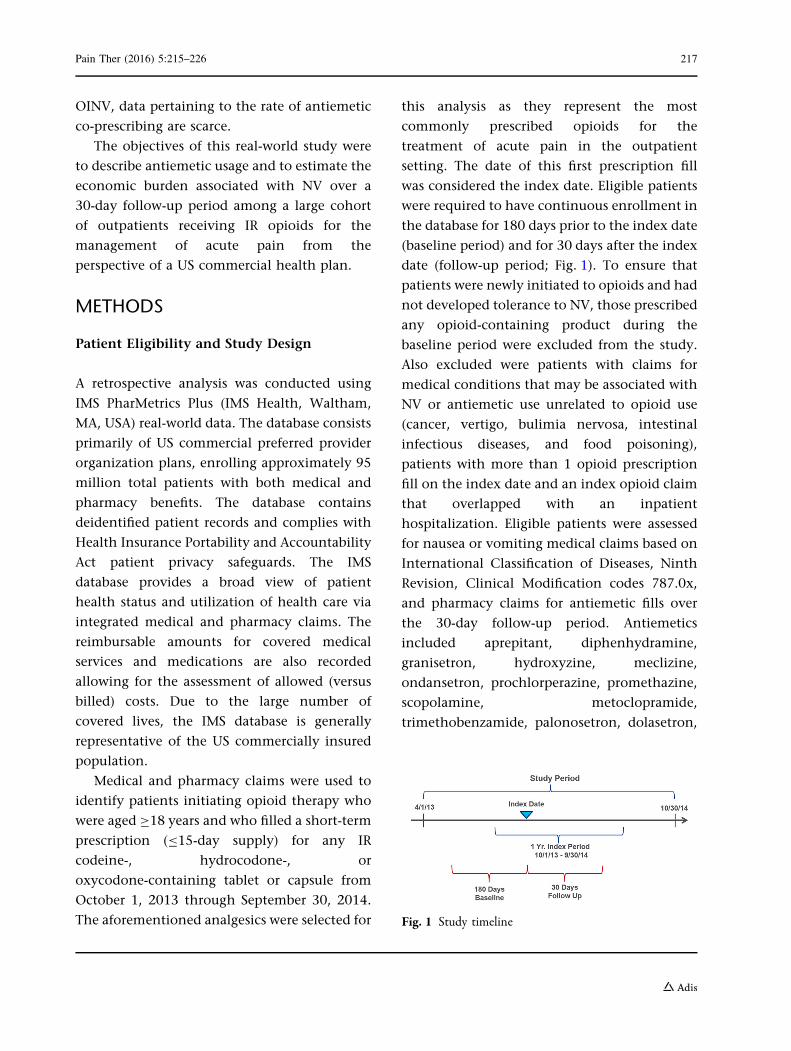
date (follow-up period; Fig. 1). To ensure that
patients were newly initiated to opioids and had
not developed tolerance to NV, those prescribed
any opioid-containing product during the
baseline period were excluded from the study.
Also excluded were patients with claims for
medical conditions that may be associated with
NV or antiemetic use unrelated to opioid use
(cancer, vertigo, bulimia nervosa, intestinal
infectious diseases, and food poisoning),
patients with more than 1 opioid prescription
fill on the index date and an index opioid claim
that overlapped with an inpatient
hospitalization. Eligible patients were assessed
for nausea or vomiting medical claims based on
International Classification of Diseases, Ninth
Revision, Clinical Modification codes 787.0x,
and pharmacy claims for antiemetic fills over
the 30-day follow-up period. Antiemetics
included aprepitant, diphenhydramine,
granisetron, hydroxyzine, meclizine,
ondansetron, prochlorperazine, promethazine,
scopolamine, metoclopramide,
trimethobenzamide, palonosetron, dolasetron,
Fig. 1 Study timeline
Pain Ther (2016) 5:215–226 217
and thiethylperazine. This article does not
involve any new studies of human or animal
subjects performed by any of the authors.
Study Outcomes
Measures of all-cause health care resource
utilization were hospitalizations (including
30-day readmission rates among a subgroup of
patients), emergency department (ED) visits,
and physician office visits. The prescribing rate
of antiemetics was examined. All-cause health
care costs (2013–2014 USD) were calculated for
inpatient, outpatient, and pharmacy services
using the allowed reimbursement payment
amount (inclusive of patient copay).
Statistical Analysis
Patients with a medical claim for NV with or
without a pharmacy claim for an antiemetic
agent (NV group) were compared with patients
having no medical claim for NV and no
pharmacy claim for an antiemetic agent (no
NV group). The incremental impact of NV on
health care resource utilization and costs over
the 30-day follow-up period was examined. The
rate of antiemetic use in the overall study
population was examined. In addition, rates of
30-day rehospitalization among the subgroup of
patients who were hospitalized within 2 days of
filling the index opioid prescription were
compared between patients with and without
a medical claim for NV during study follow-up.
Antiemetics can be used for reasons other than
NV, and therefore, patients with a pharmacy
claim for an antiemetic agent, but no medical
claim for NV were excluded from health care
resource use and cost comparisons.
Descriptive data were compared using t-tests
and Chi-squared tests for continuous and
categorical variables, respectively. Propensity
score matching (PSM) [38], using the Greedy
method with a caliper of 0.01, was used to
adjust for known differences in baseline patient
characteristics. Patients were matched on age,
gender, type of index opioid, health plan
characteristics and baseline antiemetic claims,
NV claims, total health care costs, and severity
of comorbid conditions using the Charlson
Comorbidity Index [39]. Health care resource
utilization and costs were assessed using the
propensity-matched cohorts.
Due to a residual imbalance between
propensity-matched groups, regression
analyses were conducted to generate adjusted
cost ratios and their 95% confidence intervals
(CI), accounting for differences in baseline
antiemetic use. Generalized linear models
(GLM) with log-link and gamma distribution
were used to adjust pharmacy and total costs.
Adjustment of inpatient and outpatient costs
required the use of a two-part model, due to the
large numbers of patients with zero costs;
logistic regression was used to estimate the
probability of having a positive cost, and GLM
with log-link and gamma distribution was used
to estimate the cost conditional on it being
positive.
For the subgroup analysis of patients
hospitalized within 2 days of filling index
opioid prescription, Kaplan–Meier curves were
generated to estimate 30-day rehospitalization
rates. All P values were considered to be
significant at P\0.05. Analyses were
performed using SAS version 9.3 (SAS Institute,
Cary, NC, USA).
RESULTS
Study eligibility was met by 2,120,806 patients
(Table S1). Of the total cohort of eligible
patients receiving an IR opioid prescription,
2.3% (n = 47,935) had a medical claim for NV
218 Pain Ther (2016) 5:215–226
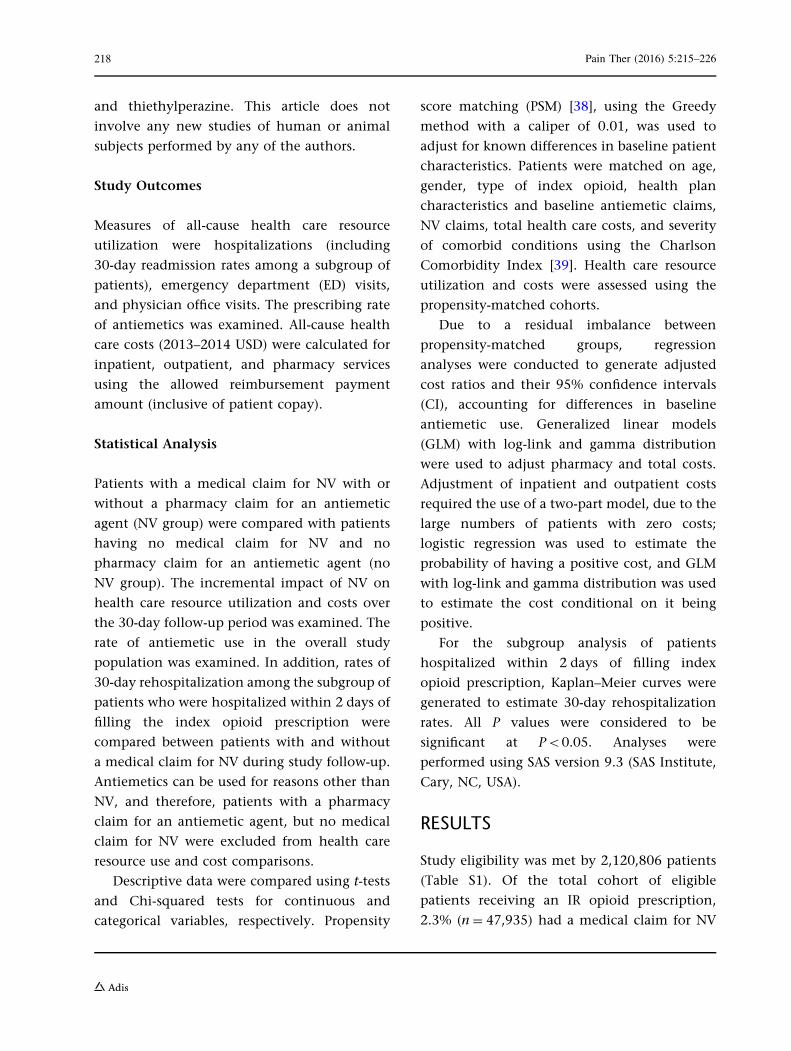
within 30 days of index opioid prescription,
with the majority of these patients (57.1%,
n = 27,375) having an NV claim occurring on
the index date (Fig. 2). Of patients with an NV
claim on the same day as the index opioid
prescription, 52.0% (n = 14,242) were also
co-prescribed an antiemetic.
Among all eligible patients receiving an IR
opioid prescription, 10.2% (n = 215,366) filled
an antiemetic prescription within 30 days after
the index opioid prescription, and most of these
patients (73.7%, n = 158,859) received the
antiemetic on the same day as the index
opioid prescription. Among patients who filled
an antiemetic prescription on the same date as
the index opioid prescription, 9.0%
(n = 14,242) also had an NV claim on the
index date (Fig. 2).
Among patients with an NV claim, 2145
were excluded from further analyses due to
having negative cost data. Baseline
characteristics for 45,790 patients with a
medical claim for NV, with or without an
antiemetic claim, and 1,835,228 patients, with
no medical claim for NV and no pharmacy
claim for an antiemetic, are shown in Table 1.
Compared with patients without NV claims,
patients with medical claims for NV were
younger and more likely to be female. They
were also more likely to be treated with
oxycodone, have previous claims for NV or
antiemetic use, have a greater comorbidity
burden, and have higher baseline total health
care costs. Baseline patient characteristics after
PSM were similar, with the exception of
baseline antiemetic use, which remained
significantly higher among patients with a
medical claim for NV versus no NV claim
(12.5% vs 11.8%; P = 0.002; Table S2).
Health Care Resource Utilization
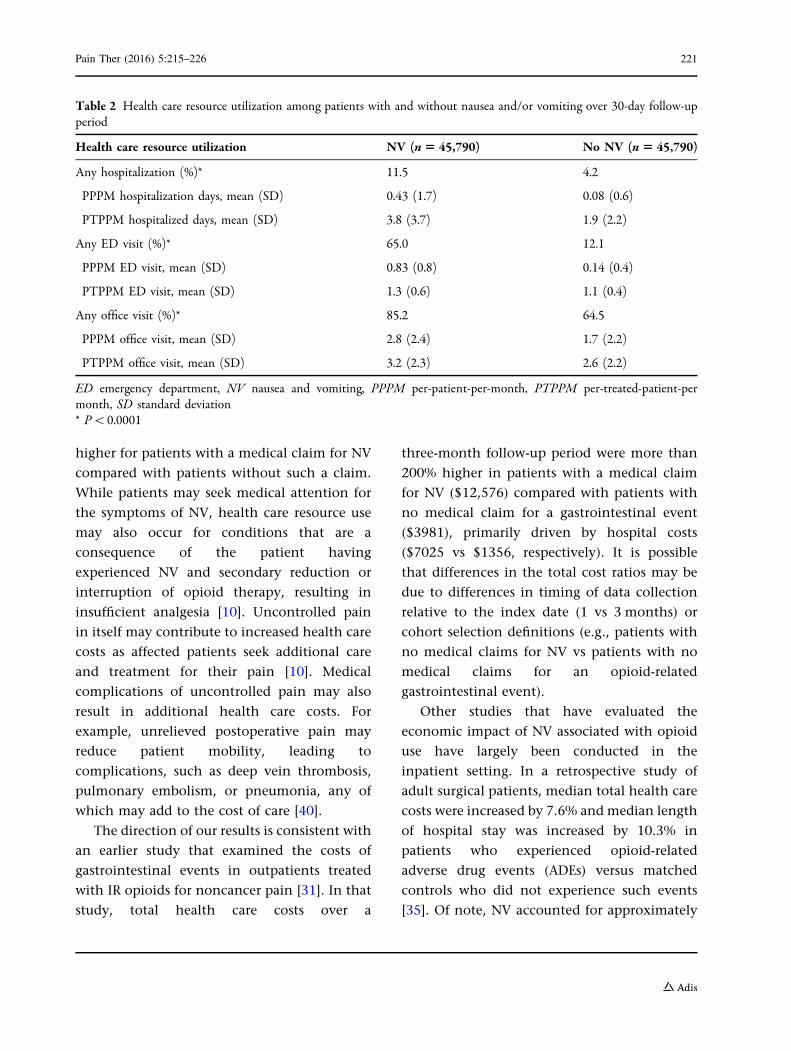
Patients with a claim for NV had significantly
more hospitalizations (11.5% vs 4.2%), ED visits
(65.0% vs 12.1%), and physician office visits
(85.2% vs 64.5%) in the 30 days following the
index opioid prescription compared with
patients having no NV claim (all P\0.0001;
Table 2). The unadjusted mean (standard
deviation [SD]) number of hospital days over
the 30-day follow-up period was 3.8 (3.7) days
for patients with an NVmedical claim versus 1.9
(2.2) days for patients without an NV claim,
corresponding to 0.43 (1.73)
per-member-per-month (PMPM) days for
patients with a medical claim for NV versus
0.08 (0.59) PMPM days for patients with no
evidence of NV. The unadjusted mean (SD)
number of ED visits was 1.3 (0.6) for patients
with NV claims versus 1.1 (0.4) for patients
without NV claims. Patients with NV claims also
had higher unadjusted mean (SD) number of
physician office visits (3.2 [2.3]) than patients
without a NV claim (2.6 [2.2]).
Fig. 2 Distribution of medical claims for nausea and/orvomiting and pharmacy claims for antiemetic agents over30-day follow-up period. NV nausea and/or vomiting
Pain Ther (2016) 5:215–226 219
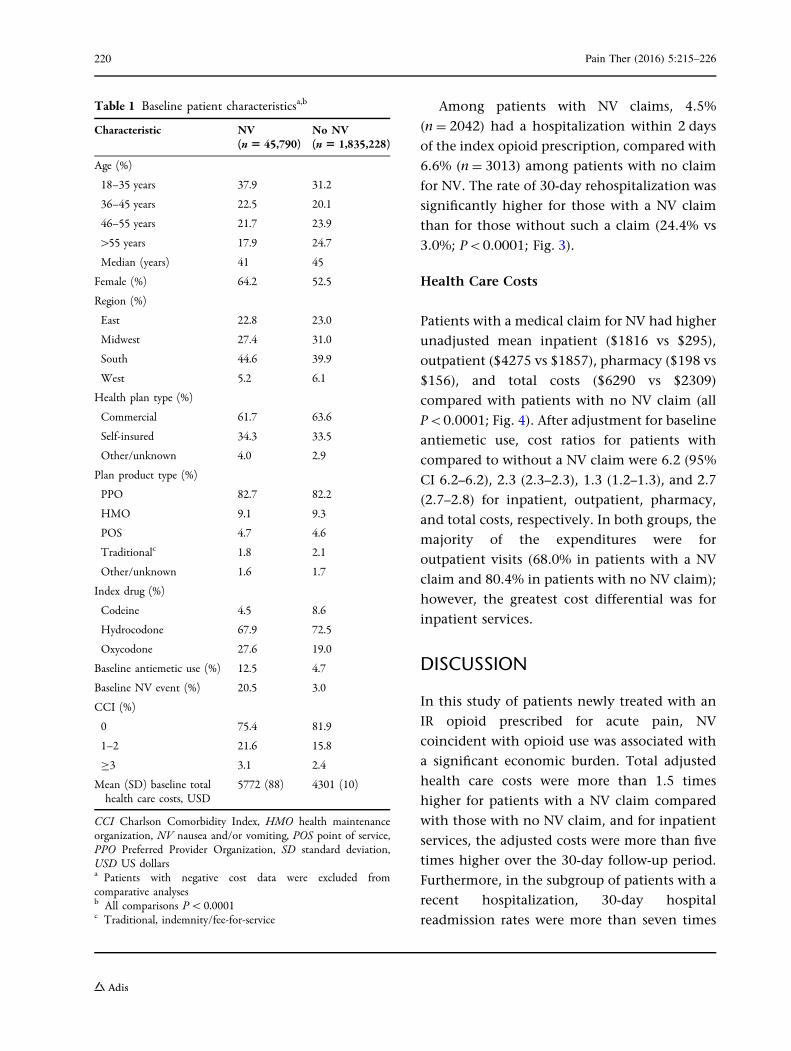
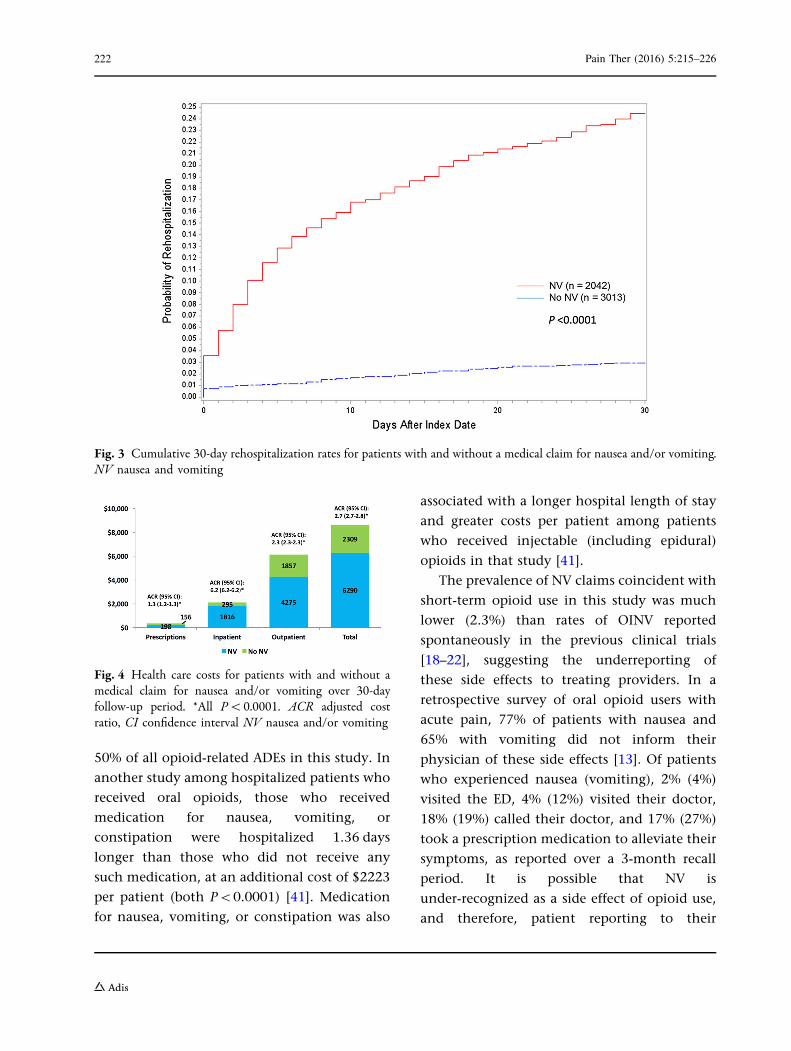
Among patients with NV claims, 4.5%
(n = 2042) had a hospitalization within 2 days
of the index opioid prescription, compared with
6.6% (n = 3013) among patients with no claim
for NV. The rate of 30-day rehospitalization was
significantly higher for those with a NV claim
than for those without such a claim (24.4% vs
3.0%; P\0.0001; Fig. 3).
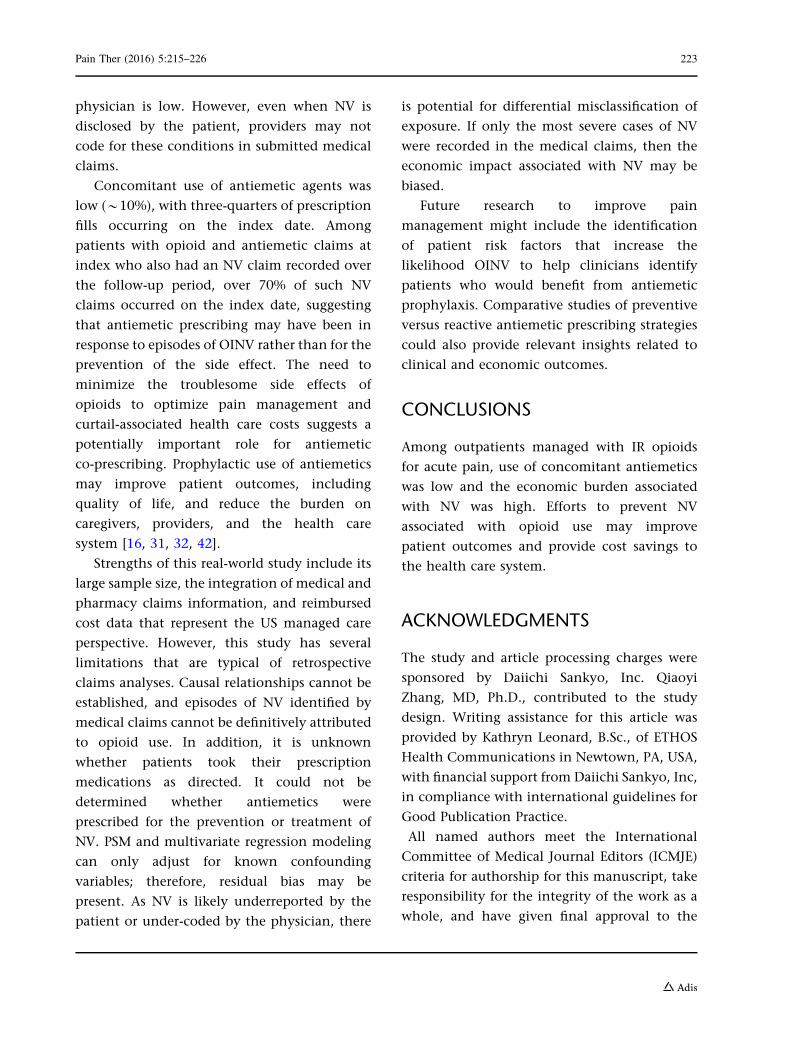
Health Care Costs
Patients with a medical claim for NV had higher
unadjusted mean inpatient ($1816 vs $295),
outpatient ($4275 vs $1857), pharmacy ($198 vs
$156), and total costs ($6290 vs $2309)
compared with patients with no NV claim (all
P\0.0001; Fig. 4). After adjustment for baseline
antiemetic use, cost ratios for patients with
compared to without a NV claim were 6.2 (95%
CI 6.2–6.2), 2.3 (2.3–2.3), 1.3 (1.2–1.3), and 2.7
(2.7–2.8) for inpatient, outpatient, pharmacy,
and total costs, respectively. In both groups, the
majority of the expenditures were for
outpatient visits (68.0% in patients with a NV
claim and 80.4% in patients with no NV claim);
however, the greatest cost differential was for
inpatient services.
DISCUSSION
In this study of patients newly treated with an
IR opioid prescribed for acute pain, NV
coincident with opioid use was associated with
a significant economic burden. Total adjusted
health care costs were more than 1.5 times
higher for patients with a NV claim compared
with those with no NV claim, and for inpatient
services, the adjusted costs were more than five
times higher over the 30-day follow-up period.
Furthermore, in the subgroup of patients with a
recent hospitalization, 30-day hospital
readmission rates were more than seven times
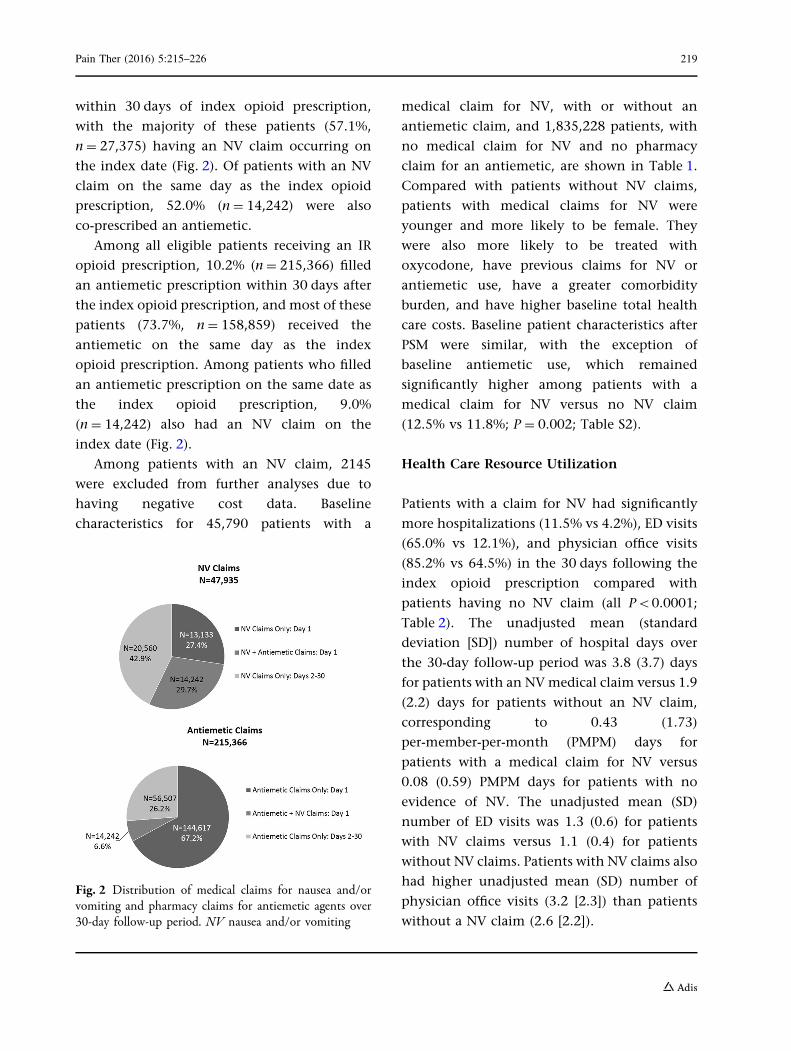
Table 1 Baseline patient characteristicsa,b
Characteristic NV(n 5 45,790)
No NV(n 5 1,835,228)
Age (%)
18–35 years 37.9 31.2
36–45 years 22.5 20.1
46–55 years 21.7 23.9
[55 years 17.9 24.7
Median (years) 41 45
Female (%) 64.2 52.5
Region (%)
East 22.8 23.0
Midwest 27.4 31.0
South 44.6 39.9
West 5.2 6.1
Health plan type (%)
Commercial 61.7 63.6
Self-insured 34.3 33.5
Other/unknown 4.0 2.9
Plan product type (%)
PPO 82.7 82.2
HMO 9.1 9.3
POS 4.7 4.6
Traditionalc 1.8 2.1
Other/unknown 1.6 1.7
Index drug (%)
Codeine 4.5 8.6
Hydrocodone 67.9 72.5
Oxycodone 27.6 19.0
Baseline antiemetic use (%) 12.5 4.7
Baseline NV event (%) 20.5 3.0
CCI (%)
0 75.4 81.9
1–2 21.6 15.8
C3 3.1 2.4
Mean (SD) baseline totalhealth care costs, USD
5772 (88) 4301 (10)
CCI Charlson Comorbidity Index, HMO health maintenanceorganization, NV nausea and/or vomiting, POS point of service,PPO Preferred Provider Organization, SD standard deviation,USD US dollarsa Patients with negative cost data were excluded fromcomparative analysesb All comparisons P\0.0001c Traditional, indemnity/fee-for-service
220 Pain Ther (2016) 5:215–226
higher for patients with a medical claim for NV
compared with patients without such a claim.
While patients may seek medical attention for
the symptoms of NV, health care resource use
may also occur for conditions that are a
consequence of the patient having
experienced NV and secondary reduction or
interruption of opioid therapy, resulting in
insufficient analgesia [10]. Uncontrolled pain
in itself may contribute to increased health care
costs as affected patients seek additional care
and treatment for their pain [10]. Medical
complications of uncontrolled pain may also
result in additional health care costs. For
example, unrelieved postoperative pain may
reduce patient mobility, leading to
complications, such as deep vein thrombosis,
pulmonary embolism, or pneumonia, any of
which may add to the cost of care [40].
The direction of our results is consistent with
an earlier study that examined the costs of
gastrointestinal events in outpatients treated
with IR opioids for noncancer pain [31]. In that
study, total health care costs over a
three-month follow-up period were more than
200% higher in patients with a medical claim
for NV ($12,576) compared with patients with
no medical claim for a gastrointestinal event
($3981), primarily driven by hospital costs
($7025 vs $1356, respectively). It is possible
that differences in the total cost ratios may be
due to differences in timing of data collection
relative to the index date (1 vs 3 months) or
cohort selection definitions (e.g., patients with
no medical claims for NV vs patients with no
medical claims for an opioid-related
gastrointestinal event).
Other studies that have evaluated the
economic impact of NV associated with opioid
use have largely been conducted in the
inpatient setting. In a retrospective study of
adult surgical patients, median total health care
costs were increased by 7.6% and median length
of hospital stay was increased by 10.3% in
patients who experienced opioid-related
adverse drug events (ADEs) versus matched
controls who did not experience such events
[35]. Of note, NV accounted for approximately
Table 2 Health care resource utilization among patients with and without nausea and/or vomiting over 30-day follow-upperiod
Health care resource utilization NV (n5 45,790) No NV (n5 45,790)
Any hospitalization (%)* 11.5 4.2
PPPM hospitalization days, mean (SD) 0.43 (1.7) 0.08 (0.6)
PTPPM hospitalized days, mean (SD) 3.8 (3.7) 1.9 (2.2)
Any ED visit (%)* 65.0 12.1
PPPM ED visit, mean (SD) 0.83 (0.8) 0.14 (0.4)
PTPPM ED visit, mean (SD) 1.3 (0.6) 1.1 (0.4)
Any office visit (%)* 85.2 64.5
PPPM office visit, mean (SD) 2.8 (2.4) 1.7 (2.2)
PTPPM office visit, mean (SD) 3.2 (2.3) 2.6 (2.2)
ED emergency department, NV nausea and vomiting, PPPM per-patient-per-month, PTPPM per-treated-patient-permonth, SD standard deviation* P\0.0001
Pain Ther (2016) 5:215–226 221
50% of all opioid-related ADEs in this study. In
another study among hospitalized patients who
received oral opioids, those who received
medication for nausea, vomiting, or
constipation were hospitalized 1.36 days
longer than those who did not receive any
such medication, at an additional cost of $2223
per patient (both P\0.0001) [41]. Medication
for nausea, vomiting, or constipation was also
associated with a longer hospital length of stay
and greater costs per patient among patients
who received injectable (including epidural)
opioids in that study [41].
The prevalence of NV claims coincident with
short-term opioid use in this study was much
lower (2.3%) than rates of OINV reported
spontaneously in the previous clinical trials
[18–22], suggesting the underreporting of
these side effects to treating providers. In a
retrospective survey of oral opioid users with
acute pain, 77% of patients with nausea and
65% with vomiting did not inform their
physician of these side effects [13]. Of patients
who experienced nausea (vomiting), 2% (4%)
visited the ED, 4% (12%) visited their doctor,
18% (19%) called their doctor, and 17% (27%)
took a prescription medication to alleviate their
symptoms, as reported over a 3-month recall
period. It is possible that NV is
under-recognized as a side effect of opioid use,
and therefore, patient reporting to their
Fig. 3 Cumulative 30-day rehospitalization rates for patients with and without a medical claim for nausea and/or vomiting.NV nausea and vomiting
Fig. 4 Health care costs for patients with and without amedical claim for nausea and/or vomiting over 30-dayfollow-up period. *All P\0.0001. ACR adjusted costratio, CI confidence interval NV nausea and/or vomiting
222 Pain Ther (2016) 5:215–226
physician is low. However, even when NV is
disclosed by the patient, providers may not
code for these conditions in submitted medical
claims.
Concomitant use of antiemetic agents was
low (*10%), with three-quarters of prescription
fills occurring on the index date. Among
patients with opioid and antiemetic claims at
index who also had an NV claim recorded over
the follow-up period, over 70% of such NV
claims occurred on the index date, suggesting
that antiemetic prescribing may have been in
response to episodes of OINV rather than for the
prevention of the side effect. The need to
minimize the troublesome side effects of
opioids to optimize pain management and
curtail-associated health care costs suggests a
potentially important role for antiemetic
co-prescribing. Prophylactic use of antiemetics
may improve patient outcomes, including
quality of life, and reduce the burden on
caregivers, providers, and the health care
system [16, 31, 32, 42].
Strengths of this real-world study include its
large sample size, the integration of medical and
pharmacy claims information, and reimbursed
cost data that represent the US managed care
perspective. However, this study has several
limitations that are typical of retrospective
claims analyses. Causal relationships cannot be
established, and episodes of NV identified by
medical claims cannot be definitively attributed
to opioid use. In addition, it is unknown
whether patients took their prescription
medications as directed. It could not be
determined whether antiemetics were
prescribed for the prevention or treatment of
NV. PSM and multivariate regression modeling
can only adjust for known confounding
variables; therefore, residual bias may be
present. As NV is likely underreported by the
patient or under-coded by the physician, there
is potential for differential misclassification of
exposure. If only the most severe cases of NV
were recorded in the medical claims, then the
economic impact associated with NV may be
biased.
Future research to improve pain
management might include the identification
of patient risk factors that increase the
likelihood OINV to help clinicians identify
patients who would benefit from antiemetic
prophylaxis. Comparative studies of preventive
versus reactive antiemetic prescribing strategies
could also provide relevant insights related to
clinical and economic outcomes.
CONCLUSIONS
Among outpatients managed with IR opioids
for acute pain, use of concomitant antiemetics
was low and the economic burden associated
with NV was high. Efforts to prevent NV
associated with opioid use may improve
patient outcomes and provide cost savings to
the health care system.
ACKNOWLEDGMENTS
The study and article processing charges were
sponsored by Daiichi Sankyo, Inc. Qiaoyi
Zhang, MD, Ph.D., contributed to the study
design. Writing assistance for this article was
provided by Kathryn Leonard, B.Sc., of ETHOS
Health Communications in Newtown, PA, USA,
with financial support from Daiichi Sankyo, Inc,
in compliance with international guidelines for
Good Publication Practice.
All named authors meet the International
Committee of Medical Journal Editors (ICMJE)
criteria for authorship for this manuscript, take
responsibility for the integrity of the work as a
whole, and have given final approval to the
Pain Ther (2016) 5:215–226 223
version to be published. All authors had full
access to all of the data in this study and take
complete responsibility for the integrity of the
data and accuracy of the data analysis.
Disclosures. Elizabeth Marrett is an
employee of Daiichi Sankyo, Inc. Winghan
Jacqueline Kwong is an employee of Daiichi
Sankyo, Inc. Chunlin Qian is an employee of
Daiichi Sankyo, Inc. Feride Frech is a former
employee of Daiichi Sankyo, Inc.
Compliance with Ethics Guidelines. This
article does not involve any new studies of
human or animal subjects performed by any of
the authors.
Open Access. This article is distributed
under the terms of the Creative Commons
Attribution-NonCommercial 4.0 International
License (http://creativecommons.org/licenses/
by-nc/4.0/), which permits any noncommer-
cial use, distribution, and reproduction in any
medium, provided you give appropriate credit
to the original author(s) and the source, provide
a link to the Creative Commons license, and
indicate if changes were made.
REFERENCES
1. Institute of Medicine Committee on AdvancingPain Research, Care, and Education. Relieving Painin America: a blueprint for transformingprevention, care, education, and research.Washington, DC: The National Academies Press;2011.
2. Fornasari D. Pain pharmacology: focus on opioids.Clin Cases Miner Bone Metab. 2014;11(3):165–8.
3. Kehlet H, Dahl JB. The value of ‘‘multimodal’’ or‘‘balanced analgesia’’ in postoperative paintreatment. Anesth Analg. 1993;77(5):1048–56.
4. Manchikanti L, Singh A. Therapeutic opioids: aten-year perspective on the complexities and
complications of the escalating use, abuse, andnonmedical use of opioids. Pain Physician.2008;11(2 Suppl):S63–88.
5. National Pharmaceutical Council and JointCommission on Accreditation of HealthcareOrganizations. Pain: current understanding ofassessment, management, and treatments. http://www.npcnow.org/system/files/research/download/Pain-Current-Understanding-of-Assessment-Management-and-Treatments.pdf. Accessed April 11, 2016.
6. Centers for Disease Control and Prevention. CDCVitalSigns: opioid painkiller prescribing. http://www.cdc.gov/vitalsigns/opioid-prescribing/. Acces-sed May 16, 2016.
7. US Food and Drug Administration. Fact Sheet—FDAopioids action plan. http://www.fda.gov/NewsEvents/Newsroom/FactSheets/ucm484714.htm. Accessed April 11, 2016.
8. Jarzyna D, Jungquist CR, Pasero C, et al. AmericanSociety for Pain Management Nursing guidelines onmonitoring for opioid-induced sedation andrespiratory depression. Pain Manag Nurs.2011;12(3):118–45.
9. Duensing L, Eksterowicz N, Macario A, Brown M,Stern L, Ogbonnaya A. Patient and physicianperceptions of treatment of moderate-to-severechronic pain with oral opioids. Curr Med ResOpin. 2010;26(7):1579–85.
10. Sinatra R. Causes and consequences of inadequatemanagement of acute pain. Pain Med.2010;11(12):1859–71.
11. Centers for Disease Control and Prevention. NewCDC opioid prescribing guidelines: improving theway opioids are prescribed for safer chronic paintreatment. http://www.wha.org/pdf/CDCguidelines_factsheet_opioids.pdf. Accessed May 27, 2016.
12. Dart RC, Surratt HL, Le Lait MC, et al. Diversion andillicit sale of extended release tapentadol in theUnited States. Pain Med. 2015;17(8):1490–6.
13. Gregorian RS Jr, Gasik A, Kwong WJ, Voeller S,Kavanagh S. Importance of side effects in opioidtreatment: a trade-off analysis with patients andphysicians. J Pain. 2010;11(11):1095–108.
14. Chung F, Lane R, Spraggs C, et al. Ondansetron ismore effective than metoclopramide for thetreatment of opioid-induced emesis inpost-surgical adult patients. Eur J Anaesthesiol.1999;16(10):669–77.
15. Smith HS, Laufer A. Opioid induced nausea andvomiting. Eur J Pharmacol. 2014;722:67–78.
224 Pain Ther (2016) 5:215–226
16. Anastassopoulos KP, Chow W, Ackerman SJ, TapiaC, Benson C, Kim MS. Oxycodone-related sideeffects: impact on degree of bother, adherence,pain relief, satisfaction, and quality of life. J OpioidManag. 2011;7(3):203–15.
17. Varrassi G, Muller-Schwefe GH. The internationalCHANGE PAIN physician survey: does specialisminfluence the perception of pain and its treatment?Curr Med Res Opin. 2012;28(5):823–31.
18. Chang DJ, Desjardins PJ, Bird SR, et al. Comparisonof rofecoxib and a multidose oxycodone/acetaminophen regimen for the treatment ofacute pain following oral surgery: a randomizedcontrolled trial. Curr Med Res Opin.2004;20(6):939–49.
19. Kalso E, Edwards JE, Moore RA, McQuay HJ. Opioidsin chronic non-cancer pain: systematic review ofefficacy and safety. Pain. 2004;112(3):372–80.
20. Daniels S, Casson E, Stegmann JU, et al. Arandomized, double-blind, placebo-controlledphase 3 study of the relative efficacy andtolerability of tapentadol IR and oxycodone IR foracute pain. Curr Med Res Opin.2009;25(6):1551–61.
21. Park YB, Ha CW, Cho SD, et al. A randomized studyto compare the efficacy and safety ofextended-release and immediate-release tramadolHCl/acetaminophen in patients with acute painfollowing total knee replacement. Curr Med ResOpin. 2015;31(1):75–84.
22. Musclow SL, Bowers T, Vo H, Glube M, Nguyen T.Long-acting morphine following hip or kneereplacement: a randomized, double-blind andplacebo-controlled trial. Pain Res Manag.2012;17(2):83–8.
23. Pizzi LT, Toner R, Foley K, et al. Relationshipbetween potential opioid-related adverse effectsand hospital length of stay in patients receivingopioids after orthopedic surgery. Pharmacotherapy.2012;32(6):502–14.
24. Wheeler M, Oderda GM, Ashburn MA, Lipman AG.Adverse events associated with postoperative opioidanalgesia: a systematic review. J Pain.2002;3(3):159–80.
25. Moskovitz BL, Benson CJ, Patel AA, et al. Analgesictreatment for moderate-to-severe acute pain in theUnited States: patients’ perspectives in thePhysicians Partnering Against Pain (P3) survey.J Opioid Manag. 2011;7(4):277–86.
26. Pergolizzi JV Jr, Raffa RB, Taylor R Jr. Treating acutepain in light of the chronification of pain. PainManag Nurs. 2014;15(1):380–90.
27. Shipton EA. The transition from acute to chronicpost surgical pain. Anaesth Intensive Care.2011;39(5):824–36.
28. Swegle JM, Logemann C. Management of commonopioid-induced adverse effects. Am Fam Physician.2006;74(8):1347–54.
29. Moeller-Bertram T, Keltner J, Strigo IA. Pain andpost traumatic stress disorder—review of clinicaland experimental evidence. Neuropharmacology.2012;62(2):586–97.
30. Brennan F, Carr DB, Cousins M. Pain management:a fundamental human right. Anesth Analg.2007;105(1):205–21.
31. Kwong WJ, Diels J, Kavanagh S. Costs ofgastrointestinal events after outpatient opioidtreatment for non-cancer pain. AnnPharmacother. 2010;44(4):630–40.
32. Eberhart L, Koch T, Kranke P, Rusch D, Torossian A,Nardi-Hiebl S. Activity-based cost analysis ofopioid-related nausea and vomiting amonginpatients. J Opioid Manag. 2014;10(6):415–22.
33. Kane-Gill SL, Rubin EC, Smithburger PL, BuckleyMS, Dasta JF. The cost of opioid-related adversedrug events. J Pain Palliat Care Pharmacother.2014;28(3):282–93.
34. Oderda GM, Evans RS, Lloyd J, et al. Cost ofopioid-related adverse drug events in surgicalpatients. J Pain Symptom Manag. 2003;25(3):276–83.
35. Oderda GM, Said Q, Evans RS, et al. Opioid-relatedadverse drug events in surgical hospitalizations:impact on costs and length of stay. AnnPharmacother. 2007;41(3):400–6.
36. Coluzzi F, Pappagallo M, National Initiative on PainControl. Opioid therapy for chronic noncancerpain: practice guidelines for initiation andmaintenance of therapy. Minerva Anestesiol.2005;71(7–8):425–33.
37. Smith HS, Smith JM, Seidner P. Opioid-inducednausea and vomiting. Ann Palliat Med.2012;1(2):121–9.
38. Coca-Perraillon M. Local and global optimalpropensity score matching. SAS Global Forum2007, April 16–19, 2007, Orlando, FL.
39. Quan H, Sundararajan V, Halfon P, et al. Codingalgorithms for defining comorbidities in ICD-9-CMand ICD-10 administrative data. Med Care.2005;43(11):1130–9.
40. Wells N, Pasero C, McCaffery M. Improving thequality of care through pain assessment and
Pain Ther (2016) 5:215–226 225
management. In: Hughes RG, editor. Patient safetyand quality: an evidence-based handbook fornurses. Rockville: Agency for Healthcare Researchand Quality; 2008. p. 469–97.
41. Suh DC, Kim MS, Chow W, Jang EJ. Use ofmedications and resources for treatment ofnausea, vomiting, or constipation in hospitalized
patients treated with analgesics. Clin J Pain.2011;27(6):508–17.
42. Lapane KL, Quilliam BJ, Benson C, Chow W, KimMS. Gastrointestinal events after opioid treatmentin nonmalignant pain: correlates of occurrence andimpact on health-related quality of life. J OpioidManag. 2013;9(3):205–16.
226 Pain Ther (2016) 5:215–226
Related Documents