Southern Illinois University Edwardsville SPARK SIUE Faculty Research, Scholarship, and Creative Activity 2-2016 Utilization and Costs of Compounded Medications for Commercially Insured Patients, 2012 – 2013 Timothy McPherson Southern Illinois University Edwardsville, [email protected] Patrick Fontane PhD St. Louis College of Pharmacy, [email protected] Express Scripts Holding Company Express Scripts Holding Company Follow this and additional works at: hp://spark.siue.edu/siue_fac Part of the Alternative and Complementary Medicine Commons , and the Other Pharmacy and Pharmaceutical Sciences Commons is Article is brought to you for free and open access by SPARK. It has been accepted for inclusion in SIUE Faculty Research, Scholarship, and Creative Activity by an authorized administrator of SPARK. For more information, please contact [email protected]. Recommended Citation McPherson, Timothy; Fontane, Patrick PhD; Express Scripts Holding Company; and Express Scripts Holding Company, "Utilization and Costs of Compounded Medications for Commercially Insured Patients, 2012 – 2013" (2016). SIUE Faculty Research, Scholarship, and Creative Activity. 26. hp://spark.siue.edu/siue_fac/26

Welcome message from author
This document is posted to help you gain knowledge. Please leave a comment to let me know what you think about it! Share it to your friends and learn new things together.
Transcript
Southern Illinois University EdwardsvilleSPARK
SIUE Faculty Research, Scholarship, and Creative Activity
2-2016
Utilization and Costs of CompoundedMedications for Commercially Insured Patients,2012 – 2013Timothy McPhersonSouthern Illinois University Edwardsville, [email protected]
Patrick Fontane PhDSt. Louis College of Pharmacy, [email protected]
Express Scripts Holding Company
Express Scripts Holding Company
Follow this and additional works at: http://spark.siue.edu/siue_fac
Part of the Alternative and Complementary Medicine Commons, and the Other Pharmacy andPharmaceutical Sciences Commons
This Article is brought to you for free and open access by SPARK. It has been accepted for inclusion in SIUE Faculty Research, Scholarship, andCreative Activity by an authorized administrator of SPARK. For more information, please contact [email protected].
Recommended CitationMcPherson, Timothy; Fontane, Patrick PhD; Express Scripts Holding Company; and Express Scripts Holding Company, "Utilizationand Costs of Compounded Medications for Commercially Insured Patients, 2012 – 2013" (2016). SIUE Faculty Research, Scholarship,and Creative Activity. 26.http://spark.siue.edu/siue_fac/26
Cover Page FootnoteThis is the Accepted Manuscript version of an article published in the Journal of Managed Care & SpecialtyPharmacy, 2016 Feb;22(2):172-181. The final version is available online at http://www.jmcp.org/doi/abs/10.18553/jmcp.2016.22.2.172.
This article is available at SPARK: http://spark.siue.edu/siue_fac/26

1
Utilization and costs of compounded medications for commercially insured patients, 2012 – 2013.
Timothy McPherson, Ph.D.1, Patrick Fontane, Ph.D.2, Reethi Iyengar, Ph.D.3, Rochelle Henderson, Ph.D.3
1School of Pharmacy, Southern Illinois University Edwardsville, Edwardsville, IL 62026 2Department of Liberal Arts, St. Louis College of Pharmacy, St. Louis, MO 63110 3Health Services Research, Express Scripts Holding Company, St. Louis, MO 63121
Corresponding author:
Timothy McPherson, Ph.D.
SIUE School of Pharmacy
200 University Park Dr.
Campus Box 2000
Edwardsville, IL 62026
618-650-5148

2
Abstract
Background: Although compounding has a long-standing tradition in clinical practice, insurers and pharmacy
benefit managers have instituted policies to decrease claims for compounded medications, citing questions
about their safety, efficacy, high costs, and lack of Food and Drug Administration (FDA) approval. There are no
reliable published data on the extent of compounding by community pharmacists nor the fraction of patients
who use compounded medications. Prior research suggests that compounded medications represent a relatively
small proportion of prescription medications, but these surveys were limited by small sample sizes, subjective
data collection methods, and low response rates.
Objective: To determine the number of claims for compounded medications, on a per user per year (PUPY)
basis, and the average ingredient cost of these claims among commercially insured patients in the United States
(US) for 2012 and 2013.
Methods: This study used prescription claims data from a nationally representative sample of commercially
insured members whose pharmacy benefits were managed by a large pharmacy benefit management company.
A retrospective claims analysis was conducted from January 1, 2012 through December 31, 2013. Annualized
prevalence, cost, and utilization estimates were drawn from the data. All prescription claims were adjusted to
30-day equivalents. Data mining techniques (association rule mining) were employed in order to identify the
most commonly combined ingredients in compounded medications.
Results: The prevalence of compound users was 1.1% (245,285) of eligible members in 2012 and 1.4%
(323,501) in 2013, an increase of 27.3%. Approximately 66% of compound users were female and the average
age of a compound user was approximately 42 years throughout the study period. The geographic distribution
of compound user prevalence was consistent across the US. Compound users’ prescription claims increased
36.6%, from approximately 7.1 million to approximately 9.7 million prescriptions from 2012 to 2013. The
number of claims for compounded medications increased by 34.2% from 486,886 to 653,360 during the same
period. PUPY utilization remained unchanged at 2 prescriptions per year from 2012 to 2013. The most
commonly compounded drugs were similar for all adult age groups, and represented therapies typically
indicated for chronic pain or hormone replacement therapy. The average ingredient cost for compounded
medications increased by 130.3% from $308.49 to $710.36 from 2012 to 2013. The average ingredient cost for
these users’ non-compounded prescriptions increased only 7.7%, from $148.75 to $160.20. For comparison, the
average ingredient cost for all prescription users’ claims was $81.50 in 2012, and increased by 3.8% to $84.57
in 2013.

3
Conclusions: Compound users represented 1.4% of eligible members in 2013. The average ingredient cost for
compound users’ compounded prescriptions ($710.36) was greater than for non-compounded prescriptions
($160.20). The one-year increase in average compounded prescription costs (130.3%) was also greater than for
non-compounded prescriptions (7.7%). Although prevalence of compound users and the PUPY utilization for
compounded prescriptions increased only slightly between 2012 and 2013, the mean and median cost of
compounded medications increased dramatically during this time. Text mining revealed that drug combinations
characteristic of topical pain formulations were among the most frequently compounded medications for adults.
What is already known about this subject:
o Scrutiny of compounded medications by insurers and regulatory agencies has recently increased. There
are no published objective data on the number of compounded medications dispensed by community
pharmacists nor the costs associated with these prescriptions.
o Prior studies on the extent of compounding were based on surveys with small numbers of responses and
respondents’ self-reported data.
What this study adds:
o This is the first published study to profile trends in use and cost of compounded medications using an
objective, nationally representative dataset.
o It is the first study to apply associative data mining procedures to discern the most often compounded
drugs and the conditional likelihood to observe the occurrence of Drug B if Drug A were present.
Disclosures
Southern Illinois University Edwardsville School of Pharmacy and St. Louis College of Pharmacy are members
of Professional Compounding Centers of America (PCCA). No proprietary or confidential information
regarding PCCA was consulted in conducting and reporting this research.
The authors report no financial or other conflicts of interest.

4
Utilization and costs of compounded medications for commercially insured patients, 2012 – 2013.
Introduction
Community pharmacists have traditionally compounded medications to provide patients with alternative
doses or combinations of drugs, allergen-free formulations, or dosage forms that were not commercially
available1. Pharmacy compounding allows for “…the preparation, mixing, assembling, altering, packaging, and
labeling of a drug, drug-delivery device, or device in accordance with a licensed practitioner’s prescription,
medication order, or initiative based on the practitioner/patient/pharmacist/compounder relationship in the
course of professional practice.”2
Although compounding has a long-standing tradition in clinical practice, insurers and pharmacy benefit
managers have recently instituted policies to decrease claims for compounded medications, citing questions
about their safety, efficacy, high costs and lack of Food and Drug Administration (FDA) approval.3-5 A
heightened focus has been placed on the practice of compounding by citizens, regulators, and insurers since the
2013 tragedy of contaminated steroid injections from New England Compounding Center, which caused serious
infections and other injuries to at least 751 patients and resulted in at least 64 patient deaths.6-8 The use of
compounded oral, topical, and transdermal medications dispensed by community pharmacies is also
increasingly being scrutinized.9 Proponents of compounding have argued that compounded medications
represent invaluable personalized therapies for patients who are not treated adequately with traditional FDA-
approved drug products.10, 11
Amidst this debate, two important questions remain unanswered: how many patients use compounded
medications per year, and how much do the medications cost? Survey research suggests that compounded
medications represent a relatively small portion of prescription medications, ranging from 2.3% to 12.2%.12-15
However, these studies were limited by small sample sizes, subjective data collection methods, and low
response rates. As such, there are no reliable published data on the extent of compounding by community
pharmacists nor the fraction of patients who use compounded medications.
Considering that 61.8% of the United States (US) population have private health insurance coverage and the
Affordable Care Act requires prescription drug coverage as one of the ten essential benefits that health plans
must provide, prescription claims data can be leveraged to examine prevalence, cost and utilization trends
among compounded medications.16, 17 With limited information about the usage patterns of compounded
medications, prescription claim databases offer the advantages of objective data, sample sizes that are
representative of a large proportion of the US population, and detailed information on compounded medications.
The objective of this study was to determine the number of claims for compounded medications, on a per user
per year (PUPY) basis, and the average ingredient cost of these claims among commercially insured patients in
5
the United States for 2012 and 2013. An additional goal was to examine which drugs were most often
compounded together.
Methods
Population
This study used prescription claims data from a nationally representative sample of commercially insured
members whose pharmacy benefits were managed by a large pharmacy benefit management company. The
health plan sponsors for these benefits included private- and public-sector employer groups, managed care
organizations, third-party administrators, and unions. Inclusion was limited to members who were eligible for
pharmacy benefits at any time between January 1, 2012 and December 31, 2013.
Study Design
A retrospective claims analysis was conducted from January 1, 2012 through December 31, 2013.
Annualized prevalence, cost and utilization estimates were drawn from the data. All prescription claims were
adjusted to 30-day equivalents by dividing the days supply by 30.4. This normalization is based on an average
month, calculated as 365 days/year ÷ 12 months/year = 30.4 days per month.
Under provisions of the Health Insurance Portability and Accountability Act of 1996, all data specific to
individual patients were removed from internal analytical datasets to maintain the privacy of protected health
information. The study was declared exempt by both Southern Illinois University Edwardsville (SIUE) and St.
Louis College of Pharmacy Institutional Review Boards, as only de-identified administrative pharmacy claims
data were used.
Study Variables
The primary outcome measures were number and percent of compound utilizers by age bands, prevalence of
users, PUPY utilization and cost associated with compounded medication. Members were defined as persons
eligible for prescription benefits at any time between January 1, 2012 and December 31, 2013. Prescription
medication users were defined as members who had at least one claim for a prescription medication between
January 1, 2012 and December 31, 2013. Compound users were defined as those prescription medication users
who had at least one claim for a compounded medication during the same period. Compounded medications
were identified at the point of service by the medication provider and submitted to the pharmacy benefit
manager. Age categories were birth to nine years, 10 to 19 years, 20 to 29 years, 30 to 39 years, 40 to 49 years,
50 to 59 years, 60 to 69 years, and 70 years or older. Prevalence of compound users was calculated as the
number of patients with at least one compound prescription in a calendar year divided by the number of
members eligible for pharmacy benefits for that year, expressed as a percentage. Utilization measures were
based on prescription claim counts. PUPY utilization for compounded medications was calculated as the

6
number of 30-day adjusted compounded prescriptions divided by the number of compound medication utilizers
per year. Average cost per prescription was calculated by dividing the total ingredient cost of compounded
medication claims by the number of 30-day adjusted compounded medication prescriptions per year. Ingredient
cost was calculated according to the average wholesale price (AWP), without administrative or dispensing fees.
Analysis
Descriptive and bivariate statistics were generated for the prevalence of use, cost and utilization measures
for 2012 and 2013. Prevalence of compound users was analyzed by age groups and gender as well as by
geography. Most often utilized drugs were also analyzed by age group to detect similarities/differences in the
type of compounded drugs used by patients in different age-bands and gender.
In order to identify the most commonly combined ingredients in compounded medications, the data mining
technique of association rule was employed. Data mining is increasingly being used in healthcare research to
examine a myriad of issues, including hospital infection control, screening adverse drug reactions, predicting
heart disease, exposure to air pollution and respiratory illness, diagnosing medical conditions, and in clinical
observations.18-23 However, to our knowledge, this is the first study to apply associative rule mining to analyze
compounded medications.
A priori algorithms for mining association rules were used in this study to identify drugs that were most
often compounded together. An a priori algorithm uses an iterative approach where n item sets are used to
explore n+1 item sets. In this study, item sets refer to unique drugs or different combinations of drugs. This
approach efficiently ascertains frequent sets in data.
To address the possibility of many frequently occurring combinations of drugs, minimum levels of support
(frequency) and confidence (conditional probability) were used. Support refers to how many times a particular
item/item set appears in the data and confidence refers to the conditional probability of item y appearing when
item/item set x is observed. In this study, we used a minimum support of 10% to determine how often a
particular drug or a combination of drugs appeared in compound medication claims. In addition, a minimum
confidence threshold of 50% was used to determine the drug combinations that occurred when a particular drug
(with at least 10% support) was observed in compound medication claims.
Results
Claims from retail pharmacies constituted more than 99% of total claims for compounded medications. The
remaining claims originated from hospitals, mail-order pharmacies, or other non-retail pharmacies.
Compound users
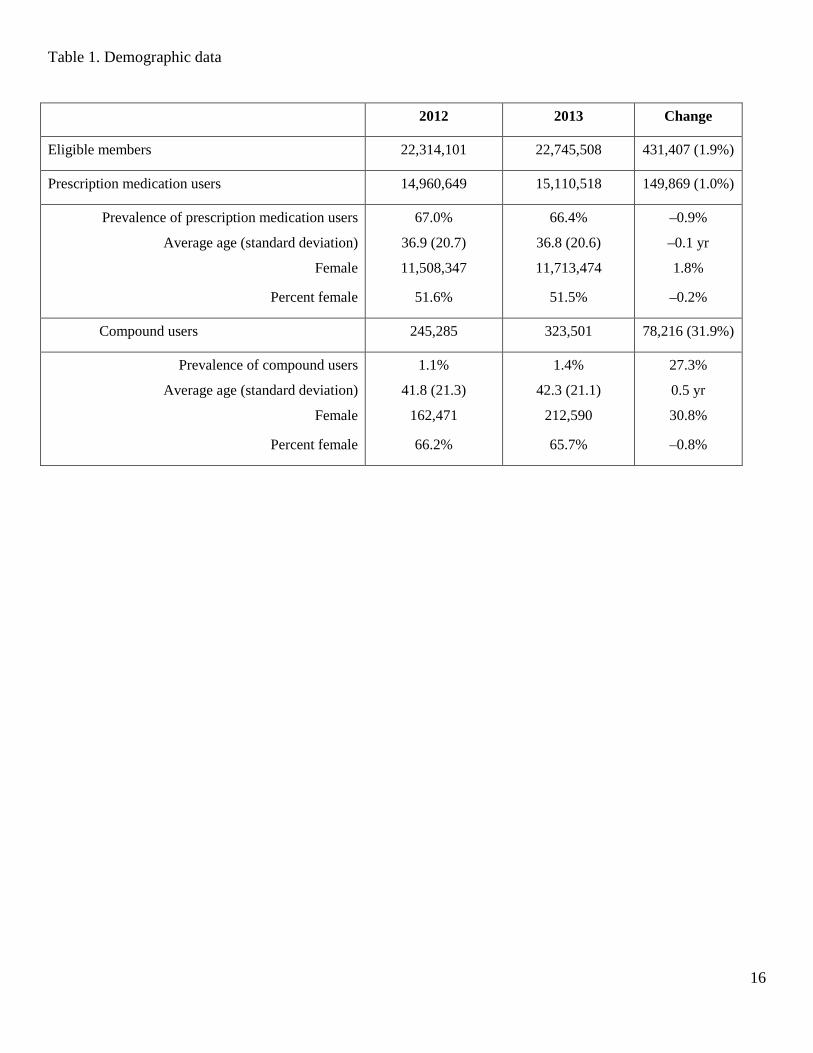
The demographics of the study population are summarized in Table 1. The number of eligible members in
2012 and 2013 were 22,314,101 and 22,745,508, respectively. Approximately two-thirds of members used at

7
least one prescription medication in both 2012 and 2013. The average age of prescription user was 36.9 in 2012
and 36.8 in 2013. Females represented 51.6% of prescription medication users in 2012 and 51.5% in 2013.
Compound users represented 1.1% of members (245,285) in 2012 and 1.4% of members (323,501) in 2013.
Compound users increased by 78,216 from 2012 to 2013, while members increased by 431,407. The prevalence
of compound users thus increased by 27.3% while the number of members increased by 1.9%. The prevalence
of prescription medication users increased by only 1% during this time.
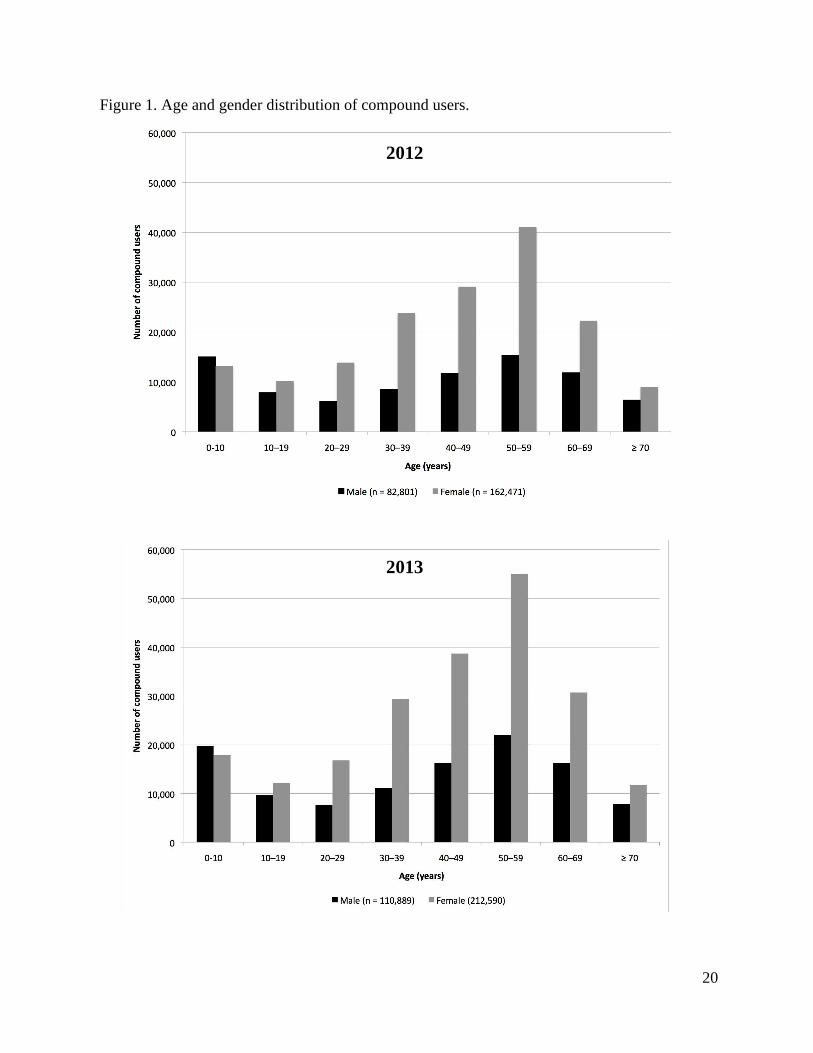
The distribution of compound users by age and gender is shown in Figure 1. The distributions were similar
for 2012 (Figure 1A) and 2013 (Figure 1B). Overall, the average age of a compound user was approximately 42
years, and approximately two thirds of compound users were female. Patients under 10 years old represented
the only category with a greater number of male than female compound users. The greatest proportion of female
compound users were aged 50 – 59 (approximately 26%) followed by 40 – 49 (approximately 18%), and 30 –
39 and 60 – 69 (approximately 14% each). The age distribution for male compound users was bimodal, with the
greatest proportion of 50 – 59 year olds (approximately 19%) and children under 10 years (approximately 18%).
The smallest proportion of compound users were aged 10 – 19 and greater than 70 years (approximately 6%
each) for females and 20 – 29 and greater than 70 years (approximately 7% each) for males.
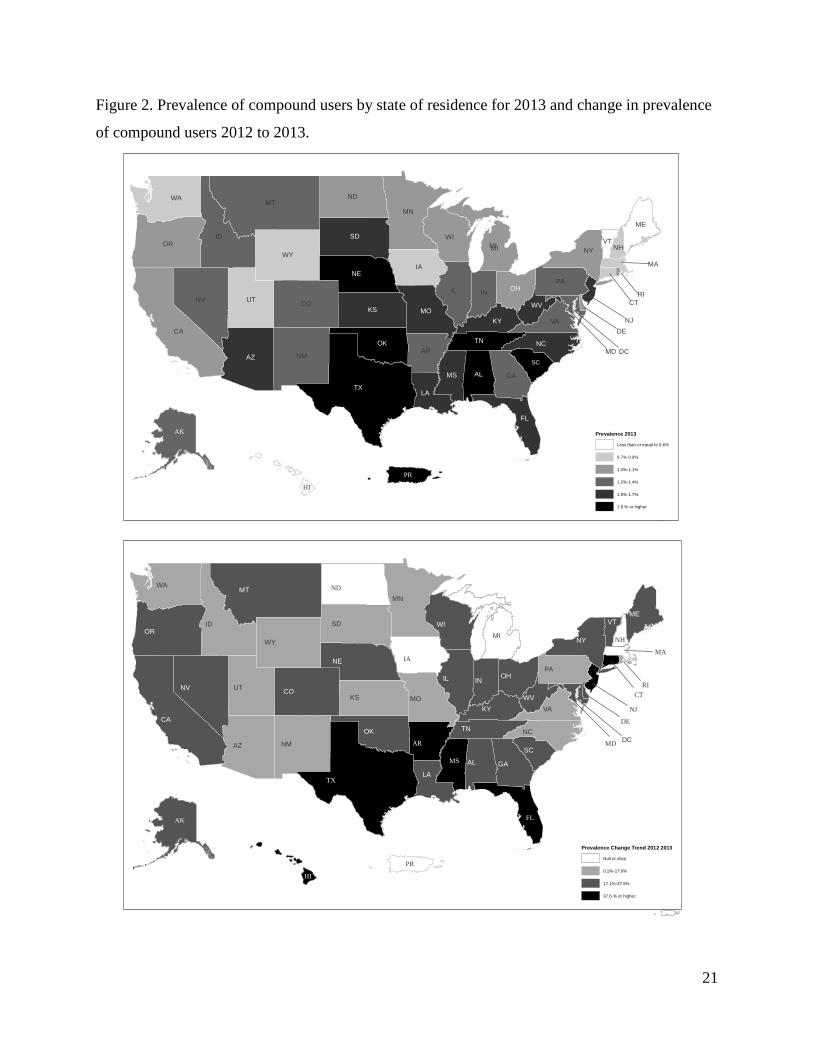
The prevalence of compound users by state of residence for 2013 is shown in Figure 2A. The national
average for prevalence of compound users was 1.4% and 40 states exhibited compound user rates of 1 – 2%.
Oklahoma (3.5%), Tennessee (2.4%), Alabama (2.3%), and Texas (2.2%) were the only states with prevalence
greater than 2%. The percentage increase in compound user prevalence from 2012 to 2013 is shown in Figure
2B. North Dakota was the only state with a decrease in the rate of compound users (–8.3%), while Iowa,
Massachusetts, Michigan, and New Hampshire exhibited no change. The largest increase in compound users
occurred in Texas (69.2%), Arkansas (62.5%), Mississippi (54.5%), Connecticut (50%), Hawaii (50%), New
Jersey (50%), and Florida (45.5%). All other states exhibited an increase in prevalence of 7 to 37.5%.
Claims for compounded medications
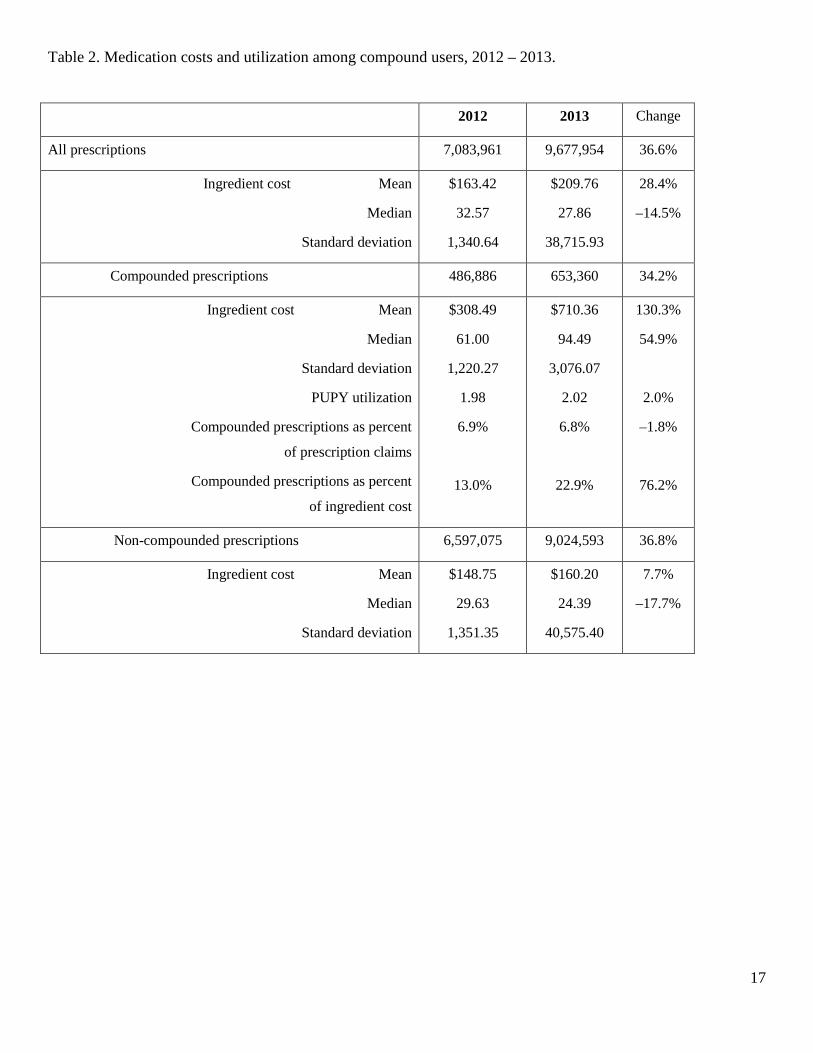
Compound users’ prescription cost and utilization data are summarized in Table 2. There were nearly 7.1
million prescription claims for compound users in 2012, of which 486,886 (6.9%) were compounded. In 2013,
claims increased to nearly 9.7 million total prescriptions (36.6% increase) and 653,360 compounded
medications (34.2% increase). The average utilization was 2 compounded prescriptions PUPY in both 2012 and
2013.
Prescription ingredient costs
Ingredient cost statistics for compound users’ prescription claims are shown in Table 2 and Figure 3. Both
the mean and median costs were greater for compounded medications than non-compounded drugs. The
average cost was $308.49 for compounded prescriptions and $148.75 for non-compounded prescriptions in

8
2012. In 2013, the average cost of compounded prescriptions increased by 130.3% to $710.36, while non-
compounded prescription increased by 7.7% to $160.20. For comparison, the average ingredient cost for all
prescription users’ claims was $81.50 in 2012 and increased by 3.8% to $84.57 in 2013. The median costs for
both types of prescriptions were much lower than the average values, reflecting the influence of a small number
of very high cost claims on the cost distribution (Figure 3). The median cost for compounded medications
increased by 54.9% from $61.00 to $94.49, while non-compounded prescriptions decreased 17.7% from $29.63
to $24.39.
Ingredients in compounded medications
The ten drugs most frequently included in compounded prescriptions in 2013 are shown in Table 3. Inactive
ingredients (diluents, ointment bases, flavorings, etc.) were not included in this analysis, but they were included
in the cost analysis (reported next). The lists for all adult age groups (≥ 20 years) were similar for both 2012
(data not shown) and 2013. These drugs primarily represent therapies for pain management (gabapentin,
baclofen, cyclobenzaprine, diclofenac, ketamine, lidocaine, bupivacaine, flubiprofen) or hormone replacement
(progesterone, estradiol, estriol, testosterone).
A text-mining procedure was applied to 2013 data to reveal drug combinations that were frequently
compounded together. Claims for compounded medications containing gabapentin (the most frequently
compounded drug overall) tended to also contain baclofen (67.7%), cyclobenzaprine (64.1%), and ketamine
(52.2%). Cyclobenzaprine (72.9%), gabapentin (61.4%), and baclofen (60.6%) were frequently presented in
claims with flurbiprofen. Neither progesterone nor fluticasone was associated with other drugs in the same
claim at or above the 50% confidence level.
The most frequently compounded drugs for children and adolescents (< 20 years of age) were more diverse
than those for adults (Table 3). The most commonly compounded medications for children were typically used
for gastric acid suppression (omeprazole and lansoprazole), hypertension (enalapril, atenolol, spironolactone),
and skin conditions (nystatin, hydrocortisone, zinc oxide, triamcinolone). The lists for 2012 (data not shown)
and 2013 were substantially similar to each other.
The ingredients that contributed the greatest cumulative costs to compounded medication claims in 2013 are
shown in Table 4. Both active and inactive ingredients were included in this analysis, as the cost for
compounded medications includes all ingredients. Gabapentin, ketamine, cyclobenzaprine, baclofen, lidocaine,
flurbiprofen, and fluticasone were consistently among the most expensive ingredients for patients older than 10
years in 2013. These drugs are commonly used individually and in various topical combinations for pain.24-27
Custom Lipo-max Cream ® (Professional Compounding Centers of America (PCCA), Houston, TX), Lipoderm
® (PCCA), and Pracasil Plus ® (PCCA), are proprietary non-medicated bases for topical drug products. Custom
Lipo-Max® appeared in the lists for all groups aged 10 and over, and Lipoderm® appeared in the lists for all
9
groups aged 20 and over. There were several differences between the lists of most expensive ingredients for
2012 (data not shown) and 2013 for patients over 10 years of age. Gabapentin, ketoprofen, ketamine,
cyclobenzaprine, and baclofen appeared on some of the lists for 2012, but with lower frequency than in 2013.
Similarly, the non-medicated topical bases appeared less frequently in 2012 than 2013.
The highest-expense ingredients for patients under 10 years old in both 2012 (data not shown) and 2013
primarily represented active drugs for treatment of a diverse array of medical conditions (influenza, gastric acid
suppression, skin conditions). The inactive ingredients were Pracasil Plus® (2013), sodium bicarbonate (2013),
and PCCA-Plus® oral syrup vehicle (2012 and 2013).
Discussion
The current study has established that compound users represented a small but increasing proportion of
eligible members for the study period of 2012 – 2013. The rate of increase in prevalence of compound users
(27.3%) and the number of claims for compounded medications (34.2%) were several times greater than the
rate of increase in eligible members (1.9%). Utilization was consistent at approximately 2 compounded
prescriptions PUPY. There was a concurrent increase of 130.3% in the mean ingredient cost for compounded
medications. The total ingredient costs for compounded medications increased from $134 million in 2012 to
$457 million in 2013. These finding are significant for managed care providers as they reconcile providing
access to medications for members while containing costs for clients. The increases in utilization and costs of
compounded medications may indicate a nascent trend that managed care providers should understand and
plan for.
Compounded prescriptions represented a similar percentage of users’ total prescription claims in both years
of the study (6.9% in 2012, 6.8% in 2013). However, as a percentage of users’ total prescription cost,
compounded medications increased by 76.2% from 2012 to 2103. The National Council for Prescription Drug
Programs (NCPDP) implemented revised standards D.0 effective January 1, 2012.28 The coverage change
incorporated inclusion of all ingredients in the compound medication for reimbursement as opposed to just the
most expensive ingredient. Although the new standards went into effect January 1, 2012, pharmacy benefit
managers had until April 1, 2012 to adopt and implement the standards. The pharmacy benefit manager
providing data for this study adopted the standard starting January 1, 2012 but some claims that were
inconsistent with D.0 were accepted until April 1, 2012. Implementation of the D.0 standards beginning in the
second quarter of 2012 may have, in part, contributed to lower the ingredient costs for compounded
medications in 2012.
The decrease in median cost for compound users’ non-compounded prescriptions was surprising. Further
investigation indicated that the primary cause was an increase in the generic fill rate for non-compounded
prescriptions among these patients from 2012 to 2013 (data not shown).
10
There appear to be no other data in the peer-reviewed literature with which to compare the results of this
analysis. Prior research on compounding by community pharmacists relied on pharmacists’ self-reports of their
prescription dispensing volumes. The current data, on the other hand, represent a nationwide population and all
of the claims submitted by eligible members for compounded medications for the two years studied. There are
no comparable published data on compounded prescription costs.
The prevalence of compound users was consistent across the US, as most states exhibited rates similar to the
national average. Only four states had prevalence of compound users greater than 2% in 2013. Future research
focused on states with high proportions of compound users may identify factors that predict compounded
medication use and that contribute to the increasing number and costs of compounded prescriptions.
Given the variety of drug therapy problems that compounding can address, diversity in the most frequently
compounded drugs by age and gender was expected. Claims for patients under 10 years of age represented
several therapeutic indications. However, the most frequently compounded drugs and most expensive
ingredients were very similar across all adult age-gender groups. For example, 20 – 29 year old women and 60
– 69 year old men had 9 of the 10 most frequently compounded drugs in common. The only drugs that were
different between these groups were the hormone replacement products progesterone (women) and testosterone
(men). The fact that pain management and hormone replacement were well-represented in the most frequently
compounded drugs is not surprising, as pharmacists have previously reported these as significant niche areas for
pharmacy compounding and two thirds of compound users were women.9, 13, 29
Prior research indicated that pharmacists were frequently called upon by physicians to recommend specific
compounded formulations appropriate to their patients’ medical needs.29, 30 Pharmacists may develop drug
formulations based on their own research and experience, or they may obtain standardized formulations from
medical and pharmacy journals, compounding suppliers, professional colleagues, etc. Standardization is
generally beneficial, in that pharmacists who employ well-characterized formulations are more likely to
compound medications of high quality, safety and purity.31 The high degree of association of several drugs in
the same prescriptions suggests that a few standardized topical pain formulations were widely adopted. The
sources of the formulations have not been rigorously investigated. However, there are several references that
pharmacists may use to support their compounding practice. Every issue of the International Journal of
Pharmaceutical Compounding (IJPC), for example, includes articles on professional and scientific issues
related to compounding and specific example formulations for compounded medications. The formulations
published in IJPC typically include quality control and stability information. The compounding supplier PCCA
claims a “…database of more than 8,000 proprietary formulations that have been pre-tested…” and employs
pharmacists to provide compounding-related technical support to their 3,600 member pharmacists in the US.32
Thus, it is plausible that the homogeneity in most frequently prescribed drugs was due, at least in part, to a few

11
standardized topical pain formulations having been widely recommended by compounding pharmacists
throughout the US.
The average utilization of 2 compounded prescriptions PUPY was unexpectedly low, considering that the
most frequently compounded drugs were typically recommended for medical issues with longer expected
durations of therapy, such as chronic pain and hormone replacement.26, 33-40 The data suggest instead that most
compounded medications were used for acute conditions. If so, the cost versus benefit relationship of the
compounded medications would warrant further study, as there are numerous treatment modalities for acute
pain syndromes, including manufactured drug products of several pharmacologic classes. It is also possible that
the compounded medications were prescribed for chronic conditions, but the users discontinued them after a
short duration of use due to unsatisfactory therapeutic response, loss of insurance coverage, etc. These data
argue for research into patient satisfaction and adherence to therapy with compounded medications to elucidate
the determinants of compounded medication use.
Health plans and pharmacy benefit managers have responded to the increase in prevalence of compound
users and costs of compounded medications by excluding ingredients used in compounding from
reimbursement. Express Scripts announced in June 2014 that 1,000 ingredients used in compounding would no
longer qualify for reimbursement beginning July 1, 2014.3 While the full list is confidential, a subset of 25 non-
covered ingredients was released to pharmacies. With the exceptions of lidocaine, testosterone, estradiol, estriol,
progesterone, and triamcinolone acetonide, all of the 10 most frequently compounded drugs and 10 most
expensive ingredients for adult age groups (≥ 20 years old) for 2013 appear on the excluded ingredient list
(disclosed with permission). It is not clear if these exceptions will continue to be reimbursed. It is impossible to
predict whether patients will continue to pay out of pocket for non-reimbursed compounded medications.
However, the reimbursement of compounded medications for commercially insured patients is expected to
decrease in 2014 due to the effects of the extensive ingredient exclusion lists.
Limitations
There were several limitations, many of which were derived from the exclusive use of pharmacy claims data.
The study population consisted only of commercially insured patients. Workers’ compensation claims,
Medicare claims, and non-insured prescriptions were not represented in the study. The study population was
members who were eligible at any time throughout the 2 year study period, so claims from chronic compound
users who were not continuously eligible may have decreased the PUPY utilization value. An unknown fraction
of pharmacies do not accept pharmacy benefit cards for compounded medications.41 However, insured patients
who purchased compounded medications from a non-participating pharmacy could submit a claim for
reimbursement of the prescription, and these self-submitted claims were included in the database.

12
The study results are generalizable to retail pharmacy claims, as they constituted more than 99% of the
compounded medication claims. Claims from hospitals, mail order, or other non-retail pharmacies constituted
less than 1% of the compounded medication claims.
Finally, the data did not include medical claims or diagnosis codes associated with conditions for which
compounded medications were being prescribed. Inferences regarding the therapeutic indications for
compounded medications were based on the drugs’ therapeutic classifications and users’ age and gender groups.
Conclusions
This is the first published study to profile trends in use of compounded medications using a diverse,
nationwide pharmacy dataset. Compound users represented 1.4% of eligible members in 2013. The average
ingredient cost for compound users’ compounded prescriptions ($710.36) was greater than for non-compounded
prescriptions ($160.20). The one-year increase in average compounded prescription costs (130.3%) was also
greater than for non-compounded prescriptions (7.7%). Although prevalence of compound users and the PUPY
utilization of compounded prescriptions increased only slightly between 2012 and 2013, the mean and median
cost of compounded medications increased dramatically during this time. Text mining revealed that drug
combinations characteristic of topical pain formulations were among the most frequently compounded
medications for adults.
Acknowledgment
The authors would like to acknowledge Chris Markson, PhD Candidate, New Jersey Institute of Technology
for his assistance on data analysis, especially for his help in associative rule mining, and the anonymous
reviewer who identified the Michigan initiative to standardize pediatric compounded medications.
13
References
1. Allen L. Guidelines for compounding practices. In: Allen L, The art, science, and technology of
pharmaceutical compounding. Washington, DC: American Pharmacists Association; 2012:1-18.
2. United States Pharmacopeial Convention. United States Pharmacopoeia and National Formulary, USP37-
NF32. Chapter 795: Pharmaceutical Compounding Nonsterile Preparations. Rockville, MD: United States
Pharmacopeial Convention; 2014.
3. Express Scripts. Closing the compounding loophole. Available at: http://lab.express-
scripts.com/insights/drug-options/closing-the-compounding-loophole. Accessed May 26, 2015.
4. OptumRx. Compounding pharmacies: a costly challenge. 2013. Available at:
https://www.optum.com/thought-leadership/compounding-pharmacies-costly-challenge.html. Accessed
May 26, 2015.
5. A Pollack. Pharmacies turn drugs into profits, pitting insurers vs. compounders. New York Times. August
14, 2014. Available at: http://nyti.ms/1oyHsp7. Accessed November 17, 2014.
6. Centers for Disease Control and Prevention. Multistate outbreak of fungal infection associated with
injection of methylprednisolone acetate solution from a single compounding pharmacy — United States,
2012. MMWR. 2012;61(41):839-42. Accessed November 11, 2014.
7. Centers for Disease Control and Prevention. Multistate outbreak of fungal meningitis and other infections
– case count. October 23, 2013. Available at: http://www.cdc.gov/hai/outbreaks/meningitis.html.
Accessed November 17, 2014.
8. Qureshi N, Wesolowicz L, Stievater T, et al. Sterile compounding: clinical, legal, and regulatory
implications for patient safety. J Manag Care Spec Pharm. 2014 Dec;20(12):1183-91. Available at:
http://www.amcp.org/JMCP/2014/December/18850/1033.html. Accessed May 26, 2015.
9. JM Glassgold. Compounded drugs. Congressional Research Service. June 3, 2013. Available at:
http://fas.org/sgp/crs/misc/R43082.pdf. Accessed November 17, 2014.
10. International Academy of Compounding Pharmacists. What is compounding. Available at:
https://iacp.site-ym.com/?page=1. Accessed November 17, 2014.
11. Protectmycompounds.com. About compounding. Available at: http://www.protectmycompounds.com.
Accessed November 17, 2014.
12. Cauthon KA, Bowman BJ, Gurney MK. Compounding practices and beliefs of Arizona pharmacists. Int J
Pharm Compd. 2013 Mar-Apr;17(2):154-61.
13. Huffman DC, Holmes ER. Specialty compounding for improved patient care: a national survey of
compounding pharmacists. Int J Pharm Compd. 2006;10(6):462-68.
14. Huffman DC, Holmes ER. Specialty compounding for improved patient care: 2006 national survey of

14
compounding pharmacists. Int J Pharm Compd. 2008;12(1):74-82.
15. McPherson TB, Fontane PE, Jackson KD, et al. Prevalence of compounding in independent community
pharmacy practice. J Am Pharm Assoc. 2006 Sep-Oct;46(5):568-73.
16. Academy of Managed Care Pharmacy. HHS finalizes rule for prescription drug benefit design under
essential health benefits to implement affordable care act provisions and clarifies preventive coverage for
certain OTC Items. Academy of Managed Care Pharmacy. 2/21/2013. Available at:
http://amcp.org/WorkArea/DownloadAsset.aspx?id=16173. Accessed November 17, 2014.
17. National Center for Health Statistics. Health, United States, 2013: with special feature on prescription
drugs. 2014. Available at: http://www.cdc.gov/nchs/data/hus/hus13.pdf. Accessed November 17, 2014.
18. Brossette SE, Sprague AP, Hardin M, et al. Association rules and data mining in hospital infection control
and public health surveillance. J Am Med Inform Assoc. 1998;5(4):373-81.
19. Demeter J, Szasz B. Data mining based on medical diagnosis. Proc 7th Intern Conf Appl Inform.
2007;1261-67. Available at: http://icai.ektf.hu/pdf/ICAI2007-vol1-pp261-267.pdf. Accessed May 26,
2015.
20. Ji Y, Ying H, Dews P, et al. A potential causal association mining algorithm for screening adverse drug
reactions in postmarketing surveillance. IEEE Trans Inf Technol Biomed. 2011;15(3):428-37.
21. Ordonez C, Omiecinski E, de Braal L, et al. Mining constrained association rules to predict heart disease.
Piscataway, NJ: The Institute of Electrical and Electronics Engineers, Inc.; 2001.
22. Payus C, Sulaiman N, Shahani M, et al. Association rules of data mining application for respiratory illness
by air pollution database. Intern J Basic Appl Sci. 2013;13(3):11-16. Available at:
http://www.ijens.org/Vol_13_I_03/136503-7474-IJBAS-IJENS.pdf. Accessed May 26, 2015.
23. Rashid MA, Hoque MT, Sattar A. Association rules mining based clinical observations. Available at:
http://arxiv.org/abs/1401.2571.
24. Allen L. Baclofen 5%, gabapentin 5%, ketoprofen 10%, and lidocaine 5% in pluronic lecithin organogel.
Int J Pharm Compd. 2010;14(6):514.
25. Allen L. Ketoprofen 5% and lidocaine hydrochloride 0.5% topical gel. Int J Pharm Compd.
2010;14(6):520.
26. Asbill S, Sweitzer SM, Spigener S, et al. Compounded pain formulations: what is the evidence. Int J
Pharm Compd. 2014;18(4):278-86.
27. CompoundingToday.com. Formula database. International Journal of Pharmaceutical Compounding.
Available at: http://compoundingtoday.com/Formulation/Formula.cfm. Accessed November 17, 2014.
28. National Government Services, Inc. Common Electronic Data Interchange. Instructions Related to
Transactions based on NCPDP Telecommunications Standard Version D.0. Available at:

15
http://www.cms.gov/Medicare/Billing/ElectronicBillingEDITrans/downloads/NCPDPD0CG.pdf.
Accessed November 25, 2014.
29. Yancey V, Yakimo R, Perry A, et al. Perceptions of pharmaceutical care among pharmacists offering
compounding services. J Am Pharm Assoc. 2008;48(4):508-14.
30. McPherson T, Fontane P. Patient-centered care in the community-based compounding practice setting. J
Am Pharm Assoc. 2010;50(1):37-44.
31. Michigan Pediatric Safety Collaboration. Statewide initiative to standardize the compounding of oral
liquids in pediatrics. Available at: http://mipedscompounds.org. Accessed May 26, 2015.
32. PCCA. What is PCCA? Available at: http://www.pccarx.com/patients/what-is-pcca-patients. Accessed
November 17, 2014.
33. Anitescu M, Benzon HT, Argoff CE. Advances in topical analgesics. Curr Opin Anesthesiol. 2013;26555-
61.
34. Ettinger B, Wang SM, Leslie RS, et al. Evolution of postmenopausal hormone therapy between 2002 and
2009. Menopause. 2012;19(6):610-15.
35. Hickey M, Elliott J, Davison SL. Hormone replacement therapy. BMJ. 2012;344e763.
36. Panay N, Hamoda H, Arya R, et al. The 2013 British Menopause Society & Women’s Health Concern
recommendations on hormone replacement therapy. Menopause International. 2013;19(2):59-68.
Available at: 23761319. Accessed November 17, 2014.
37. Ruiz AD, Daniels KR. The effectiveness of sublingual and topical compounded bioidentical hormone
replacement therapy in post-menopausal women: an observational cohort study. Int J Pharm Compd.
2014;18(1):70-77.
38. Schmidt P. The 2012 hormone therapy position statement of the North American Menopause Society.
Menopause. 2012;19(3):257-71.
39. Smith BH, Lee J, Price C, et al. Neuropathic pain: a pathway for care developed by the British Pain
Society. Brit J Anesthesiol. 2013;111(1):73-79.
40. Stephenson K, Neuenschwander PF, Kurdowska AK. The effects of compounded bioidentical transdermal
hormone therapy on hemostatic, inflammatory, immune factors: cardiovascular biomarkers; quality-of-life
measures; and health outcomes in perimenopausal and postmenopausal women. Int J Pharm Compd.
2013;17(1):74-85.
41. McElhiney LF. Optimizing third-party reimbursement for compounded medications. Int J Pharm Compd.
2013;17(3):201-4.
16
Table 1. Demographic data
2012 2013 Change
Eligible members 22,314,101 22,745,508 431,407 (1.9%)
Prescription medication users 14,960,649 15,110,518 149,869 (1.0%)
Prevalence of prescription medication users
Average age (standard deviation)
Female
Percent female
67.0%
36.9 (20.7)
11,508,347
51.6%
66.4%
36.8 (20.6)
11,713,474
51.5%
–0.9%
–0.1 yr
1.8%
–0.2%
Compound users 245,285 323,501 78,216 (31.9%)
Prevalence of compound users
Average age (standard deviation)
Female
Percent female
1.1%
41.8 (21.3)
162,471
66.2%
1.4%
42.3 (21.1)
212,590
65.7%
27.3%
0.5 yr
30.8%
–0.8%
17
Table 2. Medication costs and utilization among compound users, 2012 – 2013.
2012 2013 Change
All prescriptions 7,083,961 9,677,954 36.6%
Ingredient cost Mean
Median
Standard deviation
$163.42
32.57
1,340.64
$209.76
27.86
38,715.93
28.4%
–14.5%
Compounded prescriptions 486,886 653,360 34.2%
Ingredient cost Mean
Median
Standard deviation
PUPY utilization
Compounded prescriptions as percent
of prescription claims
Compounded prescriptions as percent
of ingredient cost
$308.49
61.00
1,220.27
1.98
6.9%
13.0%
$710.36
94.49
3,076.07
2.02
6.8%
22.9%
130.3%
54.9%
2.0%
–1.8%
76.2%
Non-compounded prescriptions 6,597,075 9,024,593 36.8%
Ingredient cost Mean
Median
Standard deviation
$148.75
29.63
1,351.35
$160.20
24.39
40,575.40
7.7%
–17.7%

18
Table 3. Ten most frequently compounded drugs by user age and gender, 2013
< 10 10 – 19 20 – 29 30 – 39 40 – 49 50 – 59 60 – 69 ≥ 70
Rank F M F M F M F M F M F M F M F M
1 Omeprazole
Omeprazole
Baclofen
Baclofen
Baclofen
Baclofen
Gabapentin
Gabapentin
Progesterone
Baclofen
Progesterone
Gabapentin
Progesterone
Gabapentin
Gabapentin
Gabapentin
2 Lansoprazole
Lansoprazole
Cyclobenzaprine HCl
Cyclobenzaprine HCl
Gabapentin
Cyclobenzaprine HCl
Progesterone
Baclofen
Gabapentin
Gabapentin
Estradiol
Baclofen
Estradiol
Baclofen
Baclofen
Baclofen
3 Enalapril maleate
Enalapril maleate
Gabapentin
Lidocaine HCl viscous
Cyclobenzaprine HCl
Gabapentin
Baclofen
Cyclobenzaprine HCl
Baclofen
Cyclobenzaprine HCl
Testosterone
Cyclobenzaprine HCl
Gabapentin
Cyclobenzaprine HCl
Cyclobenzaprine HCl
Cyclobenzaprine HCl
4 Nystatin Oseltamivir
Lidocaine HCl viscous
Methylcobalamin
Ketamine HCl
Ketamine HCl
Cyclobenzaprine HCl
Ketamine HCl
Cyclobenzaprine HCl
Ketamine HCl
Gabapentin
Testosterone
Baclofen
Testosterone
Diclofenac sodium
Diclofenac sodium
5 Oseltamivir
Hydrocortisone
Diclofenac sodium
Salicylic acid
Diclofenac sodium
Diclofenac sodium
Ketamine HCl
Diclofenac sodium
Testosterone
Diclofenac sodium
Baclofen
Ketamine HCl
Testosterone
Ketamine HCl
Ketamine HCl
Ketamine HCl
6 Hydrocortisone
Nystatin Salicylic acid
Gabapentin
Progesterone
Lidocaine
Diclofenac sodium
Lidocaine
Estradiol
Testosterone
Cyclobenzaprine HCl
Diclofenac sodium
Cyclobenzaprine HCl
Diclofenac sodium
Lidocaine
Testosterone
7 Zinc oxide
Zinc oxide
Lidocaine
Diclofenac sodium
Lidocaine
Lidocaine HCl viscous
Lidocaine
Bupivacaine HCl
Ketamine HCl
Lidocaine
Estriol Lidocaine
Diclofenac sodium
Lidocaine
Bupivacaine HCl
Lidocaine
8 Ursodiol
Baclofen
Hydrocortisone
Omeprazole
Bupivacaine HCl
Flurbiprofen
Bupivacaine HCl
Flurbiprofen
Diclofenac sodium
Bupivacaine HCl
Diclofenac sodium
Bupivacaine HCl
Ketamine HCl
Bupivacaine HCl
Progesterone
Bupivacaine HCl
9 Atenolol
Spironolactone
Ketamine HCl
Lidocaine
Flurbiprofen
Bupivacaine HCl
Flurbiprofen
Lidocaine HCL
Lidocaine
Flurbiprofen
Ketamine HCl
Flurbiprofen
Estriol Flurbiprofen
Lidocaine HCL
Lidocaine HCL
10 Baclofen
Triamcinolone acetonide
Bupivacaine HCl
Ketamine HCl
Lidocaine HCL
Lidocaine HCL
Testosterone
Testosterone
Bupivacaine HCl
Lidocaine HCL
Lidocaine
Lidocaine HCL
Lidocaine
Lidocaine HCL
Estradiol
Triamcinolone acetonide

19
Table 4. Ten most expensive ingredients in compounded medications by user age and gender, 2013.
< 10 10 – 19 20 – 29 30 – 39 40 – 49 50 – 59 60 – 69 ≥ 70
Rank F M F M F M F M F M F M F M F M
1 Oseltamivir
Oseltamivir
Gabapentin
Gabapentin
Gabapentin
Gabapentin
Gabapentin
Gabapentin
Gabapentin
Gabapentin
Gabapentin
Gabapentin
Gabapentin
Gabapentin
Gabapentin
Gabapentin
2 Lansoprazole
Omeprazole
Fluticasone proprionate
Fluticasone proprionate
Fluticasone proprionate
Ketamine HCl
Ketamine HCl
Ketamine HCl
Ketamine HCl
Ketamine HCl
Ketamine HCl
Ketamine HCl
Ketamine HCl
Ketamine HCl
Ketamine HCl
Ketamine HCl
3 Fluticasone proprionate
Lansoprazole
Flurbiprofen
Flurbiprofen
Ketamine HCl
Flurbiprofen
Fluticasone proprionate
Flurbiprofen
Flurbiprofen
Flurbiprofen
Flurbiprofen
Flurbiprofen
Flurbiprofen
Flurbiprofen
Flurbiprofen
Flurbiprofen
4 Omeprazole
Methylcobalamin
Ketamine HCl
Ubiquinol
Flurbiprofen
Fluticasone proprionate
Flurbiprofen
Fluticasone proprionate
Fluticasone proprionate
Custom Lipo-max (TM)
Custom Lipo-max (TM)
Custom Lipo-max (TM)
Custom Lipo-max (TM)
Custom Lipo-max (TM)
Custom Lipo-max (TM)
Custom Lipo-max (TM)
5 Sildenafil Leucovorin calcium
Custom Lipo-max (TM)
Ketamine HCl
Custom Lipo-max (TM)
Custom Lipo-max (TM)
Custom Lipo-max (TM)
Testosterone
Custom Lipo-max (TM)
Cyclobenzaprine HCl
Cyclobenzaprine HCl
Cyclobenzaprine HCl
Cyclobenzaprine HCl
Cyclobenzaprine HCl
Cyclobenzaprine HCl
Cyclobenzaprine HCl
6 Tacrolimus
Sildenafil Cyclobenzaprine HCl
Custom Lipo-max (TM)
Pracasil(TM) Plus
Cyclobenzaprine HCl
Cyclobenzaprine HCl
Cyclobenzaprine HCl
Cyclobenzaprine HCl
Fluticasone proprionate
Fluticasone proprionate
Baclofen Baclofen Baclofen Baclofen Baclofen
7 Nystatin Ubiquinol
Pracasil(TM) Plus
Cyclobenzaprine HCl
Cyclobenzaprine HCl
Baclofen Pracasil(T
M) Plus Custom Lipo-max (TM)
Baclofen Baclofen Baclofen Testosterone
Fluticasone proprionate
Alprostadil
Lipoderm (TM) base
Lipoderm (TM) base
8 Pracasil(TM) Plus
Sodium bicarbonate
Baclofen Oseltamivir
Baclofen Lipoderm (TM)base
Baclofen Baclofen Lipoderm (TM)
base
Testosterone
Lipoderm (TM) base
Lipoderm (TM) base
Lipoderm (TM) base
Lipoderm (TM) base
Ketoprofen
Ketoprofen
9 Baclofen Tacrolimus
Lipderm (TM) base
Pracasil(TM) Plus
Mometasone furoate
Pracasil(TM) Plus
Lipoderm (TM) base
Lipoderm (TM)base
Pracasil(TM) Plus
Lipoderm (TM) base
Progesterone
Fluticasone proprionate
Progesterone
Testosterone
Diclofenac sodium
Testosterone
10 Sodium bicarbonate
PCCA-Plus(TM)
Oseltamivir
Baclofen Lipoderm (TM)
base
Mometasone furoate
Bupivacaine HCl
Ethoxy diglycol
Progesterone
Ethoxy diglycol
Diclofenac sodium
Bupivacaine HCl
Mometasone furoate
Fluticasone proprionate
Bupivacaine HCl
Diclofenac sodium
20
Figure 1. Age and gender distribution of compound users.
2012
2013
21
Figure 2. Prevalence of compound users by state of residence for 2013 and change in prevalence
of compound users 2012 to 2013.
DC
MI
TX
MT
CA
ID
NV
AZ
OR
IL
NM
CO
MN
WY
SD
IA
ND
UT
KS
NE
WA
WI
OK
MI
MO
NY
FL
PA
IN
AL GA
AR
LA
NC
VAKY
TN
OH
MS
ME
SC
WV
VTNH
MA
CT
MD
NJ
PR
DE
RI
HI
Prevalence 2013
Less than or equal to 0.6%
0.7%-0.9%
1.0%-1.1%
1.2%-1.4%
1.5%-1.7%
1.8 % or higher
AK
PR
DC
MI
TX
MT
CA
ID
NV
AZ
OR
IL
NM
CO
MN
WY
SD
IA
ND
UT
KS
NE
WA
WI
OK
MO
NY
FL
PA
IN
AL GA
AR
LA
NC
VAKY
TN
OH
MS
ME
SC
WV
VT
NH
MD
NJ
MA
CT
DE
RI
HI
Prevalence Change Trend 2012 2013
Null or drop
0.1%-17.0%
17.1%-37.5%
37.6 % or higher
AK
PR

22
Figure 3. Ingredient cost distribution for compound users’ prescription claims.
$0
$1,000
$2,000
$3,000
$4,000
$5,000
$6,000
$7,000
95th percentile
90th percentile
75th percentile
50th percentile
Related Documents