NBER WORKING PAPER SERIES MEDICARE PART D'S EFFECTS ON ELDERLY DRUG COSTS AND UTILIZATION Jonathan D. Ketcham Kosali Simon Working Paper 14326 http://www.nber.org/papers/w14326 NATIONAL BUREAU OF ECONOMIC RESEARCH 1050 Massachusetts Avenue Cambridge, MA 02138 September 2008 We are grateful for financial support in purchasing Wolters Kluwer Health data in the form of grants awarded to Cornell University from Pfizer Inc and Merck Foundation, the philanthropic arm of Merck Inc. Special thanks to Jim Hendrix, Rusty Jones and Steven Pieri of Wolters Kluwer Health, to Michael North and Robert Harris for their research support, and to David Ridley, Kirsten Axelsen and 2008 ASHE session participants for valuable comments. The views expressed herein are those of the author(s) and do not necessarily reflect the views of the National Bureau of Economic Research. NBER working papers are circulated for discussion and comment purposes. They have not been peer- reviewed or been subject to the review by the NBER Board of Directors that accompanies official NBER publications. © 2008 by Jonathan D. Ketcham and Kosali Simon. All rights reserved. Short sections of text, not to exceed two paragraphs, may be quoted without explicit permission provided that full credit, including © notice, is given to the source.

Welcome message from author
This document is posted to help you gain knowledge. Please leave a comment to let me know what you think about it! Share it to your friends and learn new things together.
Transcript
NBER WORKING PAPER SERIES
MEDICARE PART D'S EFFECTS ON ELDERLY DRUG COSTS AND UTILIZATION
Jonathan D. KetchamKosali Simon
Working Paper 14326http://www.nber.org/papers/w14326
NATIONAL BUREAU OF ECONOMIC RESEARCH1050 Massachusetts Avenue
Cambridge, MA 02138September 2008
We are grateful for financial support in purchasing Wolters Kluwer Health data in the form of grantsawarded to Cornell University from Pfizer Inc and Merck Foundation, the philanthropic arm of MerckInc. Special thanks to Jim Hendrix, Rusty Jones and Steven Pieri of Wolters Kluwer Health, to MichaelNorth and Robert Harris for their research support, and to David Ridley, Kirsten Axelsen and 2008ASHE session participants for valuable comments. The views expressed herein are those of the author(s)and do not necessarily reflect the views of the National Bureau of Economic Research.
NBER working papers are circulated for discussion and comment purposes. They have not been peer-reviewed or been subject to the review by the NBER Board of Directors that accompanies officialNBER publications.
© 2008 by Jonathan D. Ketcham and Kosali Simon. All rights reserved. Short sections of text, notto exceed two paragraphs, may be quoted without explicit permission provided that full credit, including© notice, is given to the source.
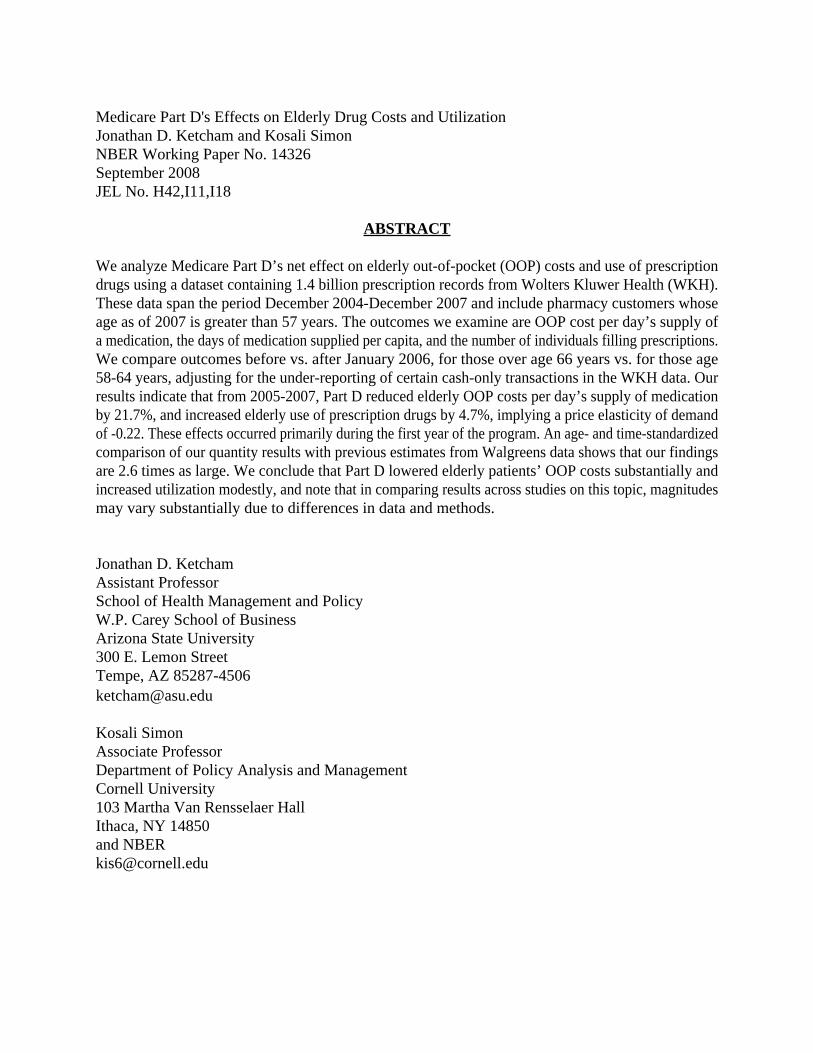
Medicare Part D's Effects on Elderly Drug Costs and UtilizationJonathan D. Ketcham and Kosali SimonNBER Working Paper No. 14326September 2008JEL No. H42,I11,I18
ABSTRACT
We analyze Medicare Part D’s net effect on elderly out-of-pocket (OOP) costs and use of prescriptiondrugs using a dataset containing 1.4 billion prescription records from Wolters Kluwer Health (WKH).These data span the period December 2004-December 2007 and include pharmacy customers whoseage as of 2007 is greater than 57 years. The outcomes we examine are OOP cost per day’s supply ofa medication, the days of medication supplied per capita, and the number of individuals filling prescriptions.We compare outcomes before vs. after January 2006, for those over age 66 years vs. for those age58-64 years, adjusting for the under-reporting of certain cash-only transactions in the WKH data. Ourresults indicate that from 2005-2007, Part D reduced elderly OOP costs per day’s supply of medicationby 21.7%, and increased elderly use of prescription drugs by 4.7%, implying a price elasticity of demandof -0.22. These effects occurred primarily during the first year of the program. An age- and time-standardizedcomparison of our quantity results with previous estimates from Walgreens data shows that our findingsare 2.6 times as large. We conclude that Part D lowered elderly patients’ OOP costs substantially andincreased utilization modestly, and note that in comparing results across studies on this topic, magnitudesmay vary substantially due to differences in data and methods.
Jonathan D. KetchamAssistant ProfessorSchool of Health Management and PolicyW.P. Carey School of BusinessArizona State University300 E. Lemon StreetTempe, AZ [email protected]
Kosali SimonAssociate ProfessorDepartment of Policy Analysis and ManagementCornell University103 Martha Van Rensselaer HallIthaca, NY 14850and [email protected]
2
After Medicare Part D was implemented in January, 2006 it covered 53 percent of
the elderly by mid-20061 and 54 percent of the elderly by January 2007.2 Despite
substantial interest from policymakers and researchers alike, few large scale studies of its
effects exist. In this paper we utilize a nationwide sample of prescriptions filled from
December, 2004 through December, 2007 to consider how prescription drug utilization
and out-of-pocket costs changed for the elderly relative to the near elderly during the first
and the second year of Medicare Part D. By using all elderly as the treatment group, we
study the aggregate impact caused by Part D. This captures the direct effects experienced
by those who added Part D as new coverage, substitution effects for those for whom Part
D replaced other coverage and indirect effects for those not on Part D but whose
coverage was affected by Part D’s existence. Studying the aggregate effect is also the
same approach adopted by the two existing peer-reviewed studies. Both prior studies
used data from a single pharmacy chain (Walgreens.)3 Yin et al. (2008) used data
covering September 2004-April 2007 for those aged 66 to 79 years, and use the
experience of those aged 60-63 as a control group.4 They find that Part D increased use of
medications by 1.1 percent and OOP costs fell by 8.8 percent during the initial open
enrollment period (January-May 2006.) During the following 11 months (June 2006-
April 2007), they found that utilization increased 5.7 percent and OOP costs decreased by
13.1 percent. Lichtenberg and Sun (2007) also used Walgreens data to compare drug use
among those aged 65 and over to those aged under 65 from September 2004 to December
2006;5 they find an increase of 12.8 percent in quantity and a 18.4 percent reduction in
out of pocket costs. In this paper we reconcile the seemingly disparate findings from
3
these two studies and compare them with our own results, paying attention to the various
strengths and weaknesses of each data source and method.
Studies on the effect of Part D on access to medications have also been conducted
with survey data. Levy and Weir (2008) used the Health and Retirement Study and found
that although there was substantial take-up of Part D by the uninsured, prescription
consumption did not appear to increase.6 Neuman et al. (2007) conducted a survey of
Medicare beneficiaries in Fall 2006 and report that relative to employer coverage, out of
pocket costs are higher under Part D.7 Prior to the implementation of Part D, Pauly
(2004)8 forecasted that Part D would reduce elderly patients’ OOP costs by 14 percent
overall, by halving costs for the 25 percent who were uninsured. Using a 0.4 price
elasticity of demand measure, he estimated a 6 percent increase in utilization as a result
of Part D. In discussing our results, we compare magnitudes and implied elasticities with
Pauly’s assumptions and predictions.
Data
We analyze a large data set of prescriptions covering the period December, 2004
through December, 2007 from Wolters Kluwer Health’s (WKH) “Source Lx” database.
Our dataset is comprised of 1,417,366,769 prescriptions filled by 34,198,008 unique
patients, whose age as of 2007 is 58 years or above. McKesson Corporation (formerly
Per-Se Technologies, and NDCHealth before that) collects these data primarily from their
switches that transmit electronic claims between pharmacies and third parties (e.g.,
insurance companies and pharmacy benefit managers) that help pay for prescriptions.
Source Lx covers all 50 states and includes approximately 31 percent of the nation’s
prescriptions, filled at approximately 32,000 pharmacies (not restricted to any particular
4
pharmacy chains), including retail, mail order, and hospital pharmacies and other
institutions that fill prescriptions such as long term care facilities.9 The dataset includes
prescription-fill level information on patient age, out-of-pocket costs vs. third party
payment amounts, number of days’ supply, the pharmacy’s ZIP Code, pharmacy type,
and an encrypted patient identifier that can track usage over time. Descriptive statistics
are provided in Appendix 1.
Methods
We first present nationwide difference-in-difference (DD) comparisons of the
aggregate change from January, 2005 to December, 2007 comparing two consistent
cohorts: a group who are always age-eligible for Medicare since January, 2006 (over 66
years as of 2007) vs. a group who are always age-ineligible for Medicare (age 58-64 as of
2007).10 The use of a control group is important to separate Part D’s effects from the
effect of other factors that changed over time. For example, several large products such as
Zoloft lost patent protection in 2006. To the extent that the near elderly also experienced
the effects of these other changes, our method identifies Part D’s effects better than a
simple comparison of 2005 and 2006 among the elderly. In addition to showing the
aggregate effects of part D for the first and second years of the programs, we also report
monthly estimates to consider how Medicare’s effects varied during the initial open
enrollment and transition period in early 2006, early in the calendar years before patients
had met their deductibles, and later in the year when some entered the donut hole. To
justify the use of our control group, we used data prior to the implementation of Part D to
validate the underlying assumption that the pre-part D time trend did not significantly
differ between the two age groups.
5
We present results for three main outcomes: days’ supply, number of patients
filling prescriptions, and patient OOP costs per prescription. We also analyzed total
prescriptions filled, but we do not report it separately because the results were virtually
identical to those for days supply. Because our two utilization outcomes (days supply and
number of patients with prescriptions filled) are compared in terms of totals for the two
cohorts over time, we must adjust for different rates of mortality for the two cohorts or
we could find relative decreases in total use occurring for the older cohort simply due to
more deaths. To do this, we normalize our totals by the size of the national population
estimated or projected by the US Census Bureau for each cohort at each point in time and
report per capita changes.11,12 We report the percent changes over time in three outcomes
to calculate the DD impact of Medicare Part D.
Part D can affect elderly patients’ net prescription drug utilization through several
pathways. First, Part D enrolled some elderly who previously lacked drug coverage;
assuming non-zero price elasticity of demand, new coverage would increase the quantity
of drugs consumed through lower OOP costs. To examine this extensive margin, we
report changes in the number of elderly filling any prescription before and after January
2006. Utilization could have also increased at the intensive margin for those previously
covered if their coverage under Part D is more generous than their previous coverage, for
example due to lower patient OOP costs or fewer supply-side restrictions such as prior
authorization requirements. Conversely, net utilization could have decreased if prior
coverage was more generous than Part D or if employers responded to Part D’s
introduction by reducing the generosity of retiree coverage.
6
Certain features of our data set pose hurdles to estimating the impact of Part D on
elderly use of prescription drugs and need to be explained upfront. For one, our data
largely but not exclusively track the same pharmacies over time. This unbalanced panel
nature could bias our results if the pharmacies that enter or leave the data cater to one of
the age cohorts disproportionally. To address this concern, we test the robustness of our
results on a panel of retail pharmacies that consistently reported data during our study
period. These include 77.4 percent of the total days supply in the full dataset.
The next three features of our data create biases with predictable signs for our
utilization estimates. First, our data under-report “pure cash” transactions (where there is
no third party to receive a claim), since they represent only 3.7 percent of our
prescriptions but are thought to comprise approximately 12 percent of nationwide
prescriptions for our age groups.13 Cash transactions for purchasers with drug discount
cards, claims filled before deductibles were met, and rejected claims by insured people
for uninsured (off-formulary) drugs are not subject to this under-reporting issue. This
under-representation of pure cash transactions could cause us to overestimate the effects
of Part D to the extent Part D disproportionately shifted elderly patients’ 2005 cash pay
purchases not observed in our data to insured purchases observed in our data in 2006 and
2007. Second, mail order pharmacies are under-represented in the WKH data; they
represent 2.1 percent of scripts in our data while they are 13.8 percent for all ages
nationwide in 2007.14 This would cause us to underestimate Part D’s utilization effects if
it disproportionately increased elderly patients’ use of mail order pharmacies. Third,
prescription sales data omit free samples by definition, causing an overestimate in Part
D’s effects on actual drug utilization if Part D caused free sampling to decrease. Thus,
7
there are three sources of drug procurement that are under-reported or absent in these data
(pure cash, mail order and free samples) that may have systematically changed as a result
of Part D, causing us to over- or under-estimate the true impact of Part D on the actual
quantity of medications used by seniors.
To correct the bias due to missing pure cash prescriptions, we used age and year-
specific estimates of the fraction of prescriptions filled that were pure cash when
prescriptions with all payment sources are fully represented, as reported by Wolters
Kluwer Health from other datasets.15 Comparing the two numbers tells us by how much
we need to multiply the volume of pure cash observed in our data to make up for the
fraction that we are missing. We perform this correction for quantity of days supply for
each age cohort and year. Likewise, we adjust our estimated effects on overall OOP cost
by adding in the missing pure cash observations. In so doing, we assume that the average
prices of missing pure cash transactions are similar to the average prices of the observed
pure cash transactions, i.e. that the missing transactions are missing at random.
Unfortunately, age-specific data on mail order use are not available to implement a
similar correction for their under-representation. In the discussion section we present
some evidence that this might not bias our results because the available data suggest that
mail order did not change systematically over time.
Finally, we compared our corrected results with prior estimates of the first year
utilization effect from Walgreens data. Compared to WKH Source Lx, Walgreens data
have advantages and disadvantages. Walgreens data fully report their pure cash
prescriptions, but their disadvantages include:
8
(i)Walgreens does not randomly locate its stores, so their records are not likely to
be representative of the entire population of US elderly. While our data contain
pharmacies from more than 80 percent of US counties, Walgreens pharmacies are located
only in about 30 percent of US counties,16 and Part D’s effects could have differed in
those areas. For example, the results would be an underestimate if the locations of
Walgreens are skewed towards areas where the elderly had more generous coverage prior
to 2006.
(ii) Walgreens implemented marketing efforts to take advantage of Part D’s
availability and anticipated large increases in their sales to the elderly by attracting
customers away from other pharmacies.17,18 There is also evidence that the pharmacy
benefits management arm, Walgreens Health Services may have played a role in
channeling patients into Walgreens pharmacies.19,20 If these activities caused customers
to switch away from other pharmacies to Walgreens after the implementation of Part D,
the existing results overestimates the general increase in utilization among the elderly due
to Part D.
(iii) Finally, Part D might have altered the extent to which elderly patients use
multiple pharmacies, and this could create unpredictable effects on estimates using only
data from Walgreens.
We replicated our analysis limiting our sample to just the ZIP Codes that include
Walgreens pharmacies to understand how the first factor may affect a comparison
between our results and Walgreens results.21 We also standardized the estimates (by
using comparable age groups and time frames) from the two existing Walgreens studies
to compare with similarly-standardized estimates from the WKH data.
9
Results
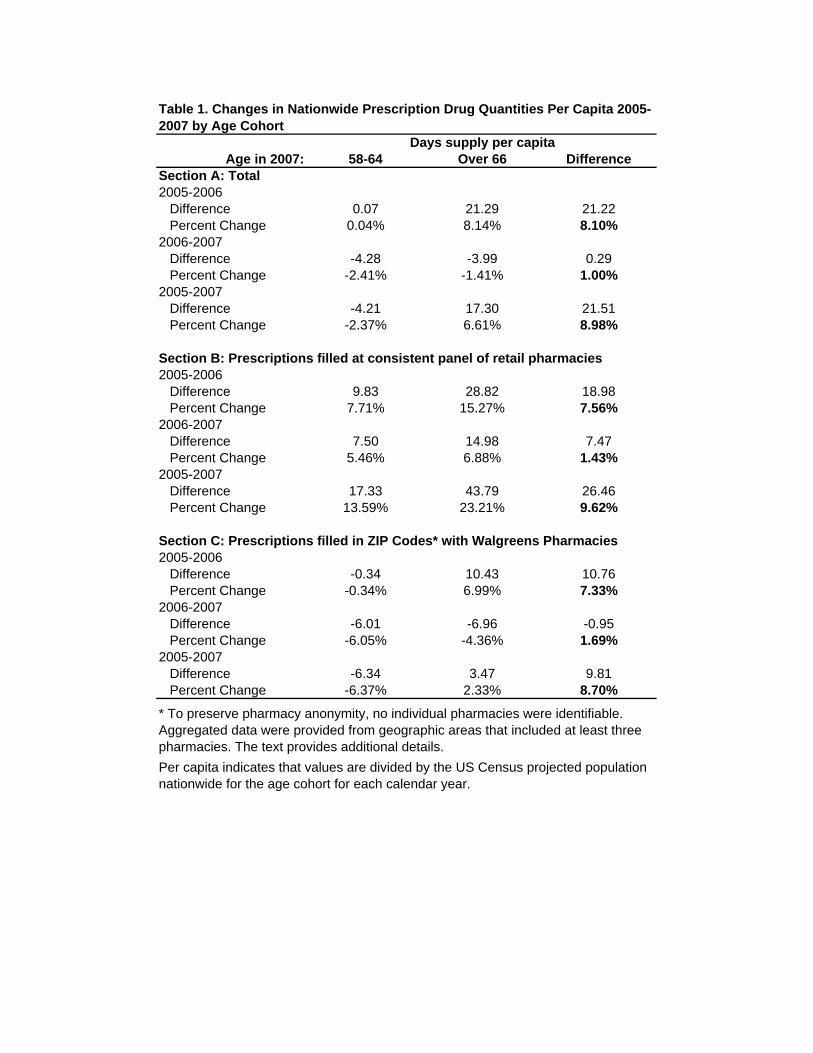
Table 1 reports descriptive nationwide DD results for the total days of medication
supplied, reported on a per capita basis to adjust for mortality differences between control
and treatment groups over time. Table 1 estimates were not adjusted for under-reported
pure cash claims. To assess whether the unbalanced pharmacy panel nature of our data
set affects our results, Section A presents the nationwide results, while Section B is
restricted to the set of consistently-represented retail pharmacies. The results for elderly
patients’ quantity of days supply in 2006 show an increase of 8.10 percent over the 2005
level relative to the change for the near-elderly. Results from the consistent panel of retail
pharmacies in Section B are similar but slightly smaller. The changes from 2006 to 2007
are much smaller; the relative increases in elderly patients’ utilization is in the range 1.0-
1.4 percent. Comparing 2007 with 2005, the results indicate that elderly patients’ use was
9.0 to 9.6 percent higher in 2007 than 2005, depending on whether we use all pharmacies
or just the subset of those consistently reporting data to WKH.
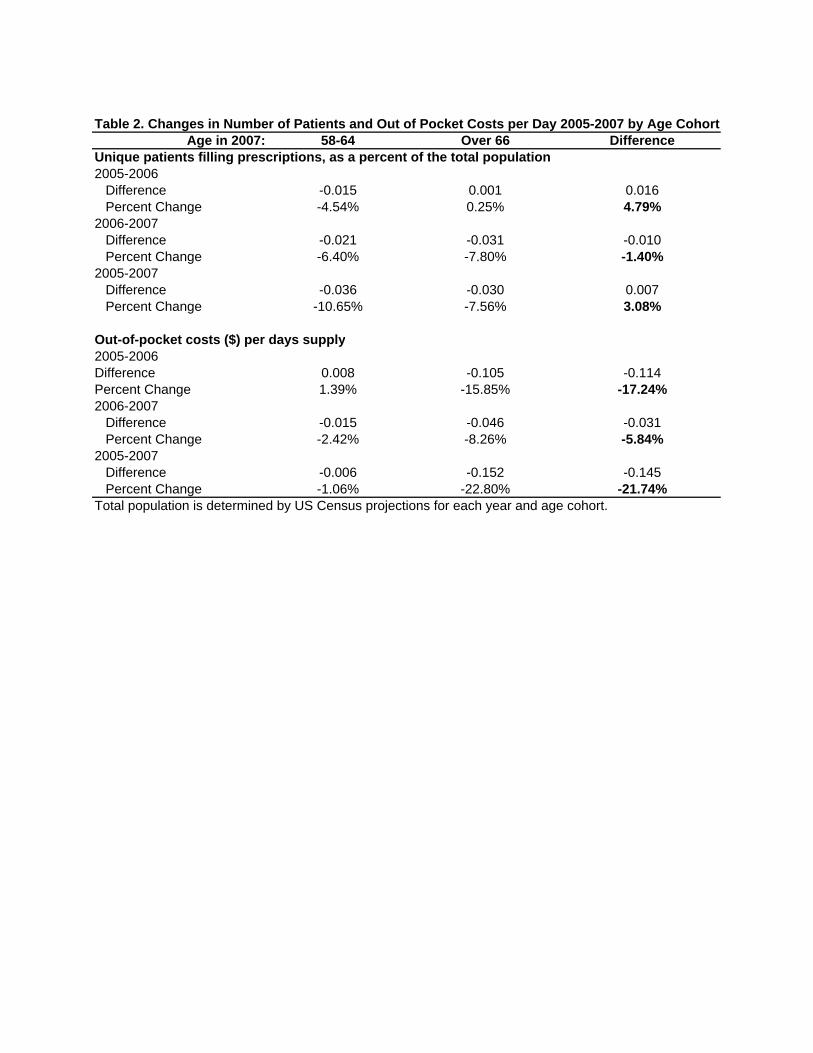
In Table 2 we report changes in the number of elderly filling any prescription (as
a percent of the population) and elderly patients’ average OOP per day’s supply relative
to the near elderly. Looking first at the top half of the table, we see that there is a 4.8
percent relative increase in the number of distinct elderly individuals filling any
prescription in the first year of the program. This increase in number of prescription
recipients is almost two thirds of the magnitude of the increase we observed for days
supply, suggesting that a substantial share of Part D’s benefits in its first year accrued at
the extensive margin to those previously not filling prescriptions. However, this
10
represents an overestimate of the number of new individuals filling prescriptions if Part D
caused relative reductions in pure cash claims among elderly patients as indicated by the
ancillary data provided by WKH. This results because it includes both those who did not
use any prescriptions in 2005 but did do so in 2006 due to the availability of Part D
coverage, as well as those who previously filled only pure cash prescriptions that were
not reported in our data. In the second year of the program, we actually see a small (1.4
percent) relative reduction in the number of elderly filling prescriptions,22 although the
overall change from 2005-2007 remained above 3 percent.
The results in the bottom half Table 2 indicate that between 2005 and 2006,
elderly patients’ OOP costs decreased both absolutely and relatively (15.8 and 17.2
percent, respectively), with the implied price elasticity of demand being 0.47. Between
2006 and 2007, the change in OOP prices was an additional 5.8 percent relative
reduction. The change from 2005-2007 implies a price elasticity of 0.44, although the
change from 2006-2007 alone suggests an elasticity of only 0.24. This could have
happened if, for example, there had been a relative increase in supply-side controls
between 2006 and 2007 among drug insurance plans that cover elderly patients.
The results above tell us how changes occurred from one year to the next. To
study the pattern of changes over time within the year, we report the total days’ supply in
the Figure 1a and the average OOP cost per days’ supply by month for each age cohort in
Figure 1b. January was typically the calendar month with the highest use among elderly
patients, resulting in the largest differences between them and the near elderly. The
difference increased at the onset of Part D and continued to rise through the initial open
enrollment period. For the rest of 2006 and 2007, these initial gains were sustained but
11
with little additional increase. In the latter months of both 2006 and 2007, elderly
patients’ relative utilization decreased somewhat, which is consistent with some entering
the donut hole and reducing their purchases. However, this pattern is evident to a lesser
degree in 2004 as well. The overall trend in Figure 1b shows that elderly patients’ OOP
costs exceeded those of the near elderly prior to Part D but immediately became lower
when Part D was implemented and remained lower for the rest of our study period.
Figure 1B shows increases in elderly patients’ OOP costs for August-November 2006 and
for May-October 2007,23 consistent with the approximate timing of the donut hole. The
figure also shows increases in OOP costs early in the year when spending for elderly and
near elderly are likely to be under the plan deductible.
In Table 3 we report the utilization and OOP cost results with the correction for
the under-representation of pure cash claims as described in the methods section. The
corrected increase in days supply is virtually identical to the unadjusted results for 2006
(8.1 percent) but decreased by 3.5 percent from 2006 to 2007. The relative changes in
out-of-pocket costs are smaller for 2006 (15.6 percent) but larger in 2007 (7.2 percent),
with a reduction from 2005-2007 virtually identical to the uncorrected results (21.7
percent.) The implied elasticity estimates are -0.52 for 2005-2006 and -0.22 for 2005-
2007.
We compared our corrected 2006 utilization results with those from other studies,
after we first reconciled the two Walgreens studies with each other. Table 4 presents a
summary. Yin et al. found a 1.1 percent increase in days’ supply of those age 66 to 79
relative to those age 60-63 during open enrollment (January-May, 2006), and a 5.9
percent increase during June 2006-April 2007, for a weighted average after Part D of 4.4
12
percent and a weighted average for 2006 of 3.9 percent (assuming the effects were equal
across months.) Lichtenberg and Sun reported a gain in 2006 of 12.8 percent relative to
those age 18-64. However, using the results for the increases by each age group reported
in Lichtenberg and Sun’s working paper Figure 4,24 and weighting by the US population
in each age group,25 we estimate that they would have found an increase of 3.7 percent if
they conducted the comparison implemented by Yin et al. Thus, an important observation
is that the two Walgreens results are virtually identical once the comparison is
standardized, despite different empirical methods. We cannot generate perfectly-
comparable results from our data because they begin in December rather than September
of 2004 and because WKH does not identify specific ages of the oldest patients to
preserve their anonymity. Thus we generated the DD comparison of the changes among
those age 60-63 vs. 66-77 in 2006 from the pre-Part D time period of December, 2004
through December, 2005 to all of 2006. As before, we adjust for changes in population
size and report utilization per capita. This exercise yielded a relative increase of 10.0
percent when not adjusting for under-reported pure cash prescriptions and 9.8 percent
when the adjustment was made. These are 2.6 times larger than the increase estimated
from Walgreens data. As an additional comparison, in Table 1 Section C we report
changes from the WKH data in ZIP Codes with Walgreens. The results are smaller than
our nationwide results. These results suggest that the estimates from Walgreens data
could be smaller than our results due to Walgreens store locations.
Discussion
13
After the implementation of Medicare Part D in January, 2006 elderly patients’
prescription drug utilization increased and out-of-pocket costs decreased substantially
relative to the near elderly. Studying 2005-2007 data without adjusting for the under-
reporting of pure cash prescriptions, we found that out-of-pocket costs experienced a 21.7
percent relative decrease while utilization experienced a relative increase of 9.0 percent.
A large majority of these changes occurred from 2005-2006. Because the number of
elderly filling prescriptions also grew during this time, these effects appear to result from
increased access by both the newly insured and by those previously covered. Adjusting
for the under-reporting of pure cash prescriptions yielded very similar results, with the
only notable difference occurring for the changes from 2006-2007. This is likely due to
changes in the pricing of generics at the pharmacies that reported all of their pure cash
claims to WKH. Our estimated increases in days supply for 2005-2006 are 2.6 times
larger than the most comparable results using Walgreens-only data. This is somewhat
surprising given Walgreens’ reported intentions to grow their Part D sales by attracting
elderly patients from other pharmacies. The differences might result from limitations in
either data source, the slight differences in the comparisons performed (age groups and
time periods, or our inclusion of other types of pharmacies), or methods (e.g. Lichtenberg
and Sun’s lack of adjustments for mortality rate differences, and the restriction by Yin et
al. to patients filling prescriptions at Walgreens in both years.) Both datasets share
several notable shortcomings as well. Both under-represent mail-order pharmacies, which
cause underestimates of Part D if it increased elderly patients’ use of mail order more
than the near elderly. Both also exclude free samples, which would cause overestimates
of the impact on actual procurement of prescription drugs if free samples were crowded
14
out by Part D. While there are no studies that estimate how much mail order or free
sample volumes have changed over the last few years for elderly patients specifically, the
overall trends in both measures suggest that neither of these biased our estimates much.
The share of total days supply filled by mail order increased minimally, from 13.5
percent in 2005 to 13.8 percent in 2007.26 Similarly, Verispan data indicates that free
samples increased by 4 percent in both 2006 and 2007, well above the increases of 1
percent from 2003-04 and 2 percent from 2004-05.27
Our results capture Part D’s net, aggregate effects on elderly patients, regardless
of whether they took up the new coverage or not. This is important to understanding the
efficiency of government expenditures on Part D. Part D could also have important
implications for equity given the pre-existing disparities in access to medical care under
Medicare and the specific policy goal of improving access among patients with lower
socioeconomic status.28,29,30 Part D has other potential benefits and costs that we have not
attempted to measure in this paper. These include spillovers of higher quantity or quality
prescription drug use to expenditures for other types of medical care,31,32 enhanced
wellbeing of elderly patients due to the insurance value of prescription drug coverage,
altered drug prices paid by other US consumers, and changed incentives to produce new
drugs.33,34 All of the possible net benefits must be weighed against the out of pocket costs
and the opportunity cost of the taxpayer’s bill for Part D to determine the economic
efficiency of this new government program.
15
References
1 Kaiser Family Foundation, the Medicare Prescription Drug Benefit, Factsheet,
November 2006 http://www.kff.org/medicare/upload/7044-05.pdf This represents a point
just after the end of open enrollment for 2006.
2 Kaiser Family Foundation, the Medicare Prescription Drug Benefit, Factsheet, October
2007 http://www.kff.org/medicare/upload/7044_07.pdf. This represents a point just after
the end of open enrollment for 2007.
3 A non-peer reviewed study by Amudsen Group (October 2006) reported that for a
certain sample of individuals who signed up for Part D and had previously been
uninsured, their usage increased and their out of pocket costs reduced. Average monthly
costs decreased 51 percent from 2005 to 2006 and average patient cost per day of supply
decreased 74 percent. Average number of prescriptions per month increased by 66
percent, and these results were constant across the older and younger among those over
age 65. This study does not use a control group or consider selection bias in who opts into
part D.
4 Yin W, Basu A, Zhang JX, Rabbani A, Meltzer DO, Alexander GC. The Effect of the
Medicare Part D prescription benefit on drug utilization and expenditures. Ann of Intern
Med. 2008;148:169-177.
5 Lichtenberg FR, Sun SX. The Impact of Medicare Part D on prescription drug use by
the elderly. Health Aff. 2007;6:1735-1744.
6 Levy H, Weir D. Take-Up of Medicare Part D and the SSA subsidy: Early results from
the Health and Retirement Study. Michigan Retirement Research Center Research Paper
16
No. WP 2007-163. 2007. Available online at
http://papers.ssrn.com/sol3/papers.cfm?abstract_id=1082832
7 Neuman, P, Strollo MK, Guterman S et al. Medicare prescription drug benefit progress
report: Findings from a 2006 national survey of seniors. Health Aff. 2007;26:w630-w643.
8 Pauly MV. Medicare drug coverage and moral hazard. Health Aff. 2004; 23:113-122.
9 Wolters Kluwer Health. Source Lx: Longitudinal Patient Data. 2006. Proprietary
marketing material.
10 When age is mentioned here and elsewhere in the paper, we refer to a patient’s age as
of 2007. Note that our treatment group (age 67 and up) is always Part D eligible since
they turned 65 in the year before the program was implemented. Our control group (age
64 and under) are always under age 65 during the time period of our study. Our data
include the patients’ birth year but not month, so we exclude those who turned 65 during
either 2006 or 2007. Because a small fraction of elderly are not Medicare-eligible and
some under 65 are, our treatment-control group definitions may cause small
underestimates of the effects of Part D. See Lichtenberg FR, Sun SX. The Impact of
Medicare Part D on prescription drug use by the elderly. Health Aff. 2007;6:1735-1744.
11 Source for US population projections by year:
http://www.census.gov/ipc/www/usinterimproj/.
12 Monthly data for the figure were from national population estimates:
http://www.census.gov/popest/national/asrh/2007-nat-res.html.
13 These additional data were provided by Wolters Kluwer Health.
14 Our calculations from the Wolters Kluwer Health Pharmacy Audit Suite Tool.
17
15 These other data are from pharmacies that report all transactions. However, these
pharmacies likely have higher proportion of pure cash than other pharmacies, so that
these corrected results rely on an upper bound estimate of the extent of pure cash while
our uncorrected results rely on a lower bound estimate.
16 Our calculations from data supplied by National Council for Prescription Drug
Programs for October, 2007.
17 Merrick A. Getting an A in Part D. The Wall Street Journal, June 21, 2006, p B1.
18 Frederick J. Walgreen looks for big gains as Medicare spurs PBM growth. Drug Store
News. July 11, 2005.
http://findarticles.com/p/articles/mi_m3374/is_9_27/ai_n14812274/pg_1. Accessed June
2, 2008.
19 Anonymous. Broad initiatives steer patients through Part D traffic. Drug Store News,
March 20, 2006. http://findarticles.com/p/articles/mi_m3374/is_4_28/ai_n16114814.
Accessed June 2, 2008.
20 Walgreens Newsroom. Walgreens offers support evaluating Medicare Part D plans.
November 14, 2007. http://news.walgreens.com/article_display.cfm?article_id=4882.
Accessed June 2, 2008.
21 These ZIP Codes were provided by the National Council for Prescription Drug
Programs (NCPDP) The NCPDP assigns a Provider Identification Number to every
licensed pharmacy in the US. See http://www.ncpdp.org/provider.asp. There are some
ZIP Codes we are not able to identify precisely; to preserve pharmacy anonymity in the
WKH data, each identifiable geographic unit includes at least three pharmacies. Those
18
ZIP Codes that had fewer were combined with numerically-adjacent ZIP Codes to create
“pseudoZIPs” that, when aggregated, included at least three.
22 We find this despite the fact our results are adjusted for mortality differences between
elderly and near elderly, because we divide by the estimated population.
23 The somewhat large increase in August 2006 resulted from a single cancer drug with
an OOP cost per day exceeding $900,000
24 Lichtenberg FR, Sun SX. The Impact of Medicare Part D on prescription drug use by
the elderly: Evidence from a large retail pharmacy chain. Working paper, Columbia
University, NBER and Walgreens Health Services. January 29, 2007.
25 http://www.census.gov/popest/national/asrh/2007-nat-res.html
26 Our estimates from Wolters Kluwer Health Pharmaceutical Audit Suite.
27 Verispan VONA prescription sales audit.
28 McClellan M, Skinner J. The incidence of Medicare. J Pub Econ. 2006;90:257-276.
29 Bhattacharya J, Lakdawalla D. The incidence of Medicare. J Pub Econ. 2006;90:277-
292.
30 Epstein AJ, Rathore SS, Alexander GC, Ketcham JD. Primary Care Physicians’ Views
on Medicare Part D Am J Mgd Care. 2008; forthcoming.
31 Goldman D, Philipson T. 2007. Integrated Insurance Design in the Presence of
Multiple Medical Technologies. NBER working paper 12870.
32 Lichtenberg FR. Have newer cardiovascular drugs reduced hospitalization? Evidence
from longitudinal country-level data on 20 OECD countries, 1995-2003. NBER Working
Paper 14008. Cambridge, MA: May 2008.
19
33 Duggan M, Scott-Morton F. 2007. The effect of Medicare Part D on pharmaceutical
prices and utilization. NBER working paper #13917.,
34 Blume-Kohout ME, Sood N. 2008. The impact of Medicare Part D on pharmaceutical
R&D. NBER working paper #13857.
Age in 2007: 58-64 Over 66 DifferenceSection A: Total2005-2006
Difference 0.07 21.29 21.22Percent Change 0.04% 8.14% 8.10%
2006-2007Difference -4.28 -3.99 0.29Percent Change -2.41% -1.41% 1.00%
2005-2007Difference -4.21 17.30 21.51Percent Change -2.37% 6.61% 8.98%
Section B: Prescriptions filled at consistent panel of retail pharmacies2005-2006
Difference 9.83 28.82 18.98Percent Change 7.71% 15.27% 7.56%
2006-2007Difference 7.50 14.98 7.47Percent Change 5.46% 6.88% 1.43%
2005-2007Difference 17.33 43.79 26.46Percent Change 13.59% 23.21% 9.62%
Section C: Prescriptions filled in ZIP Codes* with Walgreens Pharmacies2005-2006
Difference -0.34 10.43 10.76Percent Change -0.34% 6.99% 7.33%
2006-2007Difference -6.01 -6.96 -0.95Percent Change -6.05% -4.36% 1.69%
2005-2007Difference -6.34 3.47 9.81Percent Change -6.37% 2.33% 8.70%
Days supply per capita
Table 1. Changes in Nationwide Prescription Drug Quantities Per Capita 2005-2007 by Age Cohort
* To preserve pharmacy anonymity, no individual pharmacies were identifiable. Aggregated data were provided from geographic areas that included at least three pharmacies. The text provides additional details.Per capita indicates that values are divided by the US Census projected population nationwide for the age cohort for each calendar year.
Age in 2007: 58-64 Over 66 DifferenceUnique patients filling prescriptions, as a percent of the total population2005-2006
Difference -0.015 0.001 0.016Percent Change -4.54% 0.25% 4.79%
2006-2007Difference -0.021 -0.031 -0.010Percent Change -6.40% -7.80% -1.40%
2005-2007Difference -0.036 -0.030 0.007Percent Change -10.65% -7.56% 3.08%
Out-of-pocket costs ($) per days supply2005-2006Difference 0.008 -0.105 -0.114Percent Change 1.39% -15.85% -17.24%2006-2007
Difference -0.015 -0.046 -0.031Percent Change -2.42% -8.26% -5.84%
2005-2007Difference -0.006 -0.152 -0.145Percent Change -1.06% -22.80% -21.74%
Table 2. Changes in Number of Patients and Out of Pocket Costs per Day 2005-2007 by Age Cohort
Total population is determined by US Census projections for each year and age cohort.
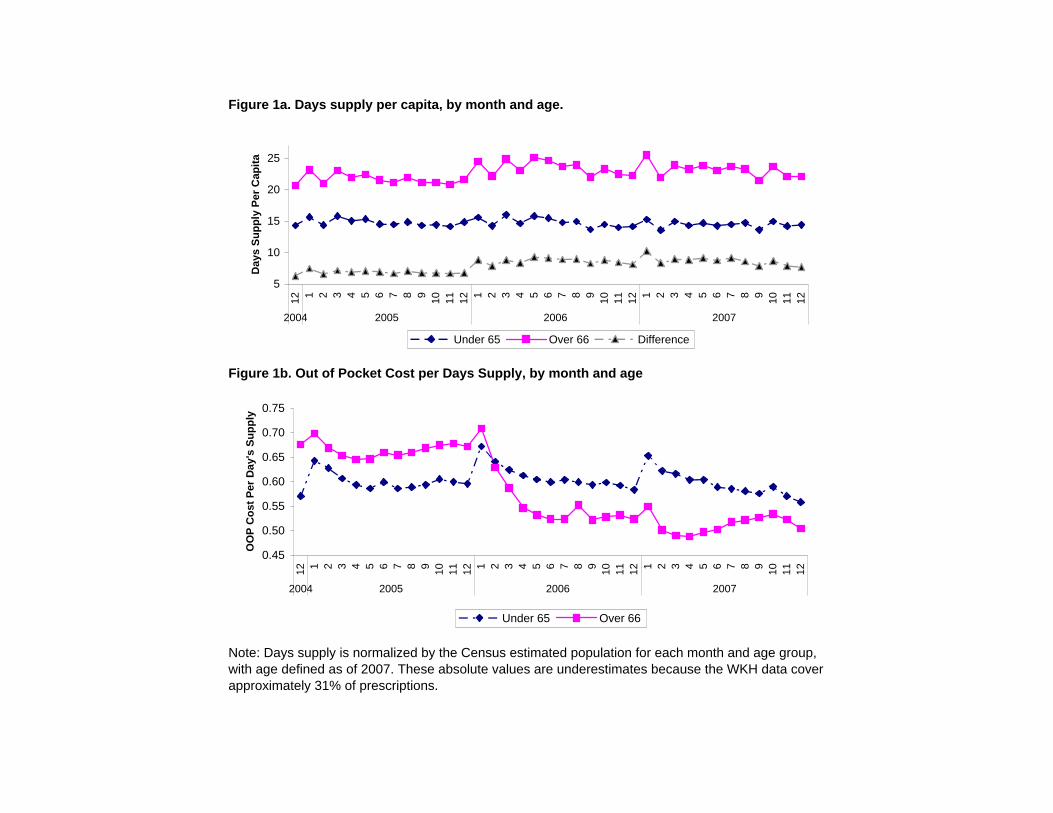
Figure 1a. Days supply per capita, by month and age.
Figure 1b. Out of Pocket Cost per Days Supply, by month and age
Note: Days supply is normalized by the Census estimated population for each month and age group, with age defined as of 2007. These absolute values are underestimates because the WKH data cover approximately 31% of prescriptions.
5
10
15
20
25
12 1 2 3 4 5 6 7 8 9 10 11 12 1 2 3 4 5 6 7 8 9 10 11 12 1 2 3 4 5 6 7 8 9 10 11 12
2004 2005 2006 2007
Day
s Su
pply
Per
Cap
ita
Under 65 Over 66 Difference
0.45
0.50
0.55
0.60
0.65
0.70
0.75
12 1 2 3 4 5 6 7 8 9 10 11 12 1 2 3 4 5 6 7 8 9 10 11 12 1 2 3 4 5 6 7 8 9 10 11 12
2004 2005 2006 2007
OO
P C
ost P
er D
ay's
Sup
ply
Under 65 Over 66
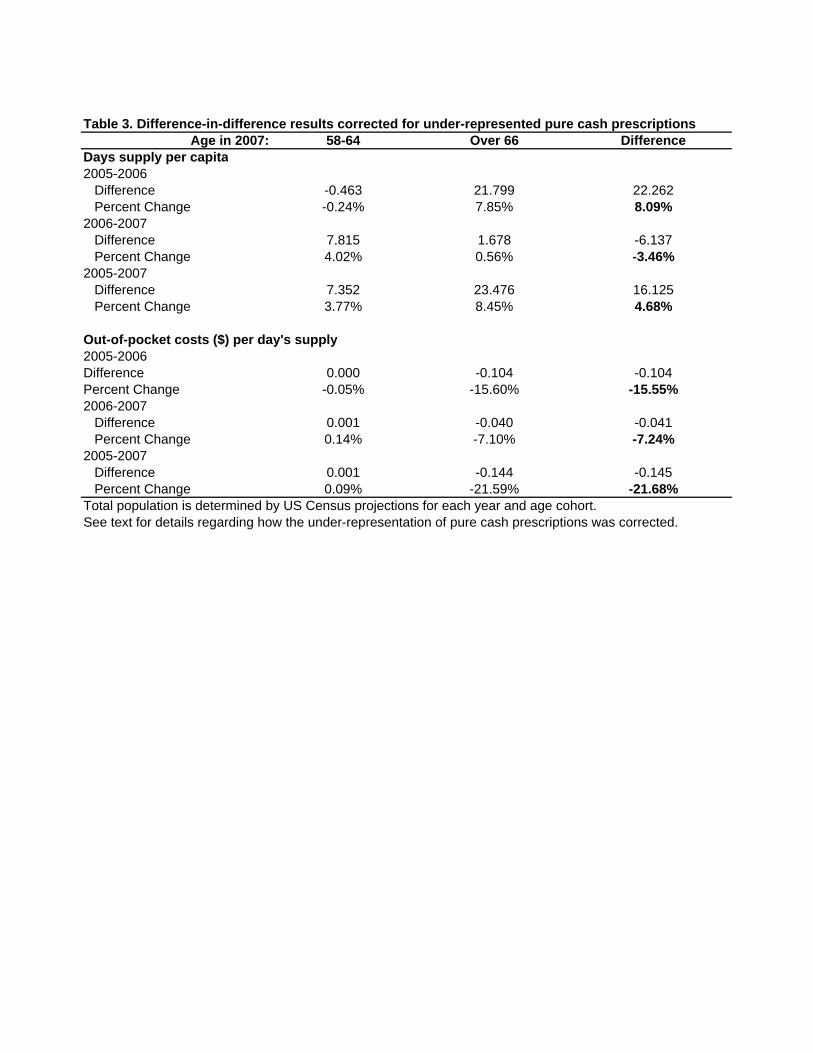
Age in 2007: 58-64 Over 66 DifferenceDays supply per capita2005-2006
Difference -0.463 21.799 22.262Percent Change -0.24% 7.85% 8.09%
2006-2007Difference 7.815 1.678 -6.137Percent Change 4.02% 0.56% -3.46%
2005-2007Difference 7.352 23.476 16.125Percent Change 3.77% 8.45% 4.68%
Out-of-pocket costs ($) per day's supply2005-2006Difference 0.000 -0.104 -0.104Percent Change -0.05% -15.60% -15.55%2006-2007
Difference 0.001 -0.040 -0.041Percent Change 0.14% -7.10% -7.24%
2005-2007Difference 0.001 -0.144 -0.145Percent Change 0.09% -21.59% -21.68%
See text for details regarding how the under-representation of pure cash prescriptions was corrected.
Table 3. Difference-in-difference results corrected for under-represented pure cash prescriptions
Total population is determined by US Census projections for each year and age cohort.
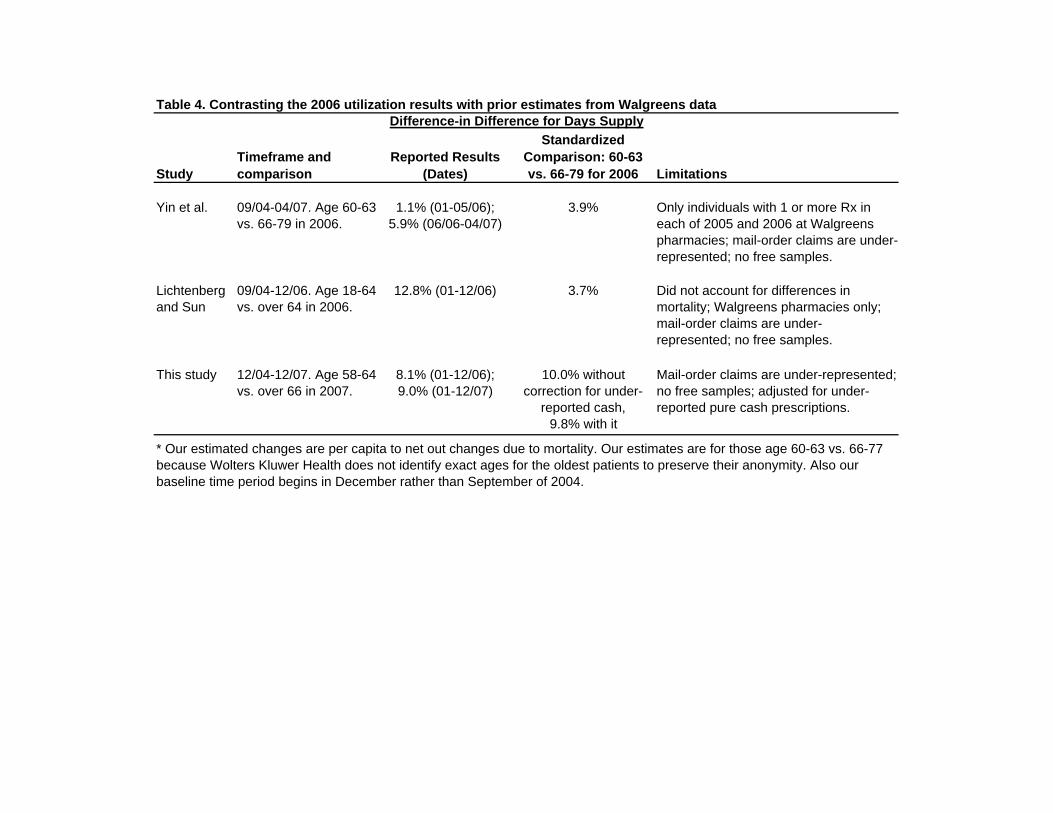
Table 4. Contrasting the 2006 utilization results with prior estimates from Walgreens data
StudyTimeframe and comparison
Reported Results (Dates)
Standardized Comparison: 60-63 vs. 66-79 for 2006 Limitations
Yin et al. 09/04-04/07. Age 60-63 vs. 66-79 in 2006.
1.1% (01-05/06); 5.9% (06/06-04/07)
3.9% Only individuals with 1 or more Rx in each of 2005 and 2006 at Walgreens pharmacies; mail-order claims are under-represented; no free samples.
Lichtenberg and Sun
09/04-12/06. Age 18-64 vs. over 64 in 2006.
12.8% (01-12/06) 3.7% Did not account for differences in mortality; Walgreens pharmacies only; mail-order claims are under-represented; no free samples.
This study 12/04-12/07. Age 58-64 vs. over 66 in 2007.
8.1% (01-12/06); 9.0% (01-12/07)
10.0% without correction for under-
reported cash, 9.8% with it
Mail-order claims are under-represented; no free samples; adjusted for under-reported pure cash prescriptions.
Difference-in Difference for Days Supply
* Our estimated changes are per capita to net out changes due to mortality. Our estimates are for those age 60-63 vs. 66-77 because Wolters Kluwer Health does not identify exact ages for the oldest patients to preserve their anonymity. Also our baseline time period begins in December rather than September of 2004.
Related Documents