1 GROWTH AND DEVELOPMENT 1. 1989 Q9 P1 Explain why several auxillary buds sprout when a terminal bud in a young tree is removed. ………………………………………………………………………………………… ………………………………………………………………………………………… ………………………………………………………………………………………… 2. 1990 Q11 P1 In an experiment, a group of students set up four glass jars as shown in the diagram below. Jar A, B and C were maintained at 25 for 7 days, while jar D was maintained at 0 for the same period of time. (a) What was this set up supposed to investigate? ………………………………………………………………………………………… ………………………………………………………………………………………… (b) Why was pyrogallic acid included in glass jar A ………………………………………………………………………………………… ………………………………………………………………………………………… (c) Explain why glass jar C and D were included in the experiment? ………………………………………………………………………………………………… ………………………………………………………………………………………………….. (d) What result would you expect in glass jar A and B at the end of the experiment? NAME INDEX NUMBER SCHOOL DATE

Welcome message from author
This document is posted to help you gain knowledge. Please leave a comment to let me know what you think about it! Share it to your friends and learn new things together.
Transcript
1
GROWTH AND DEVELOPMENT
1. 1989 Q9 P1
Explain why several auxillary buds sprout when a terminal bud in a young tree is
removed.
…………………………………………………………………………………………
…………………………………………………………………………………………
…………………………………………………………………………………………
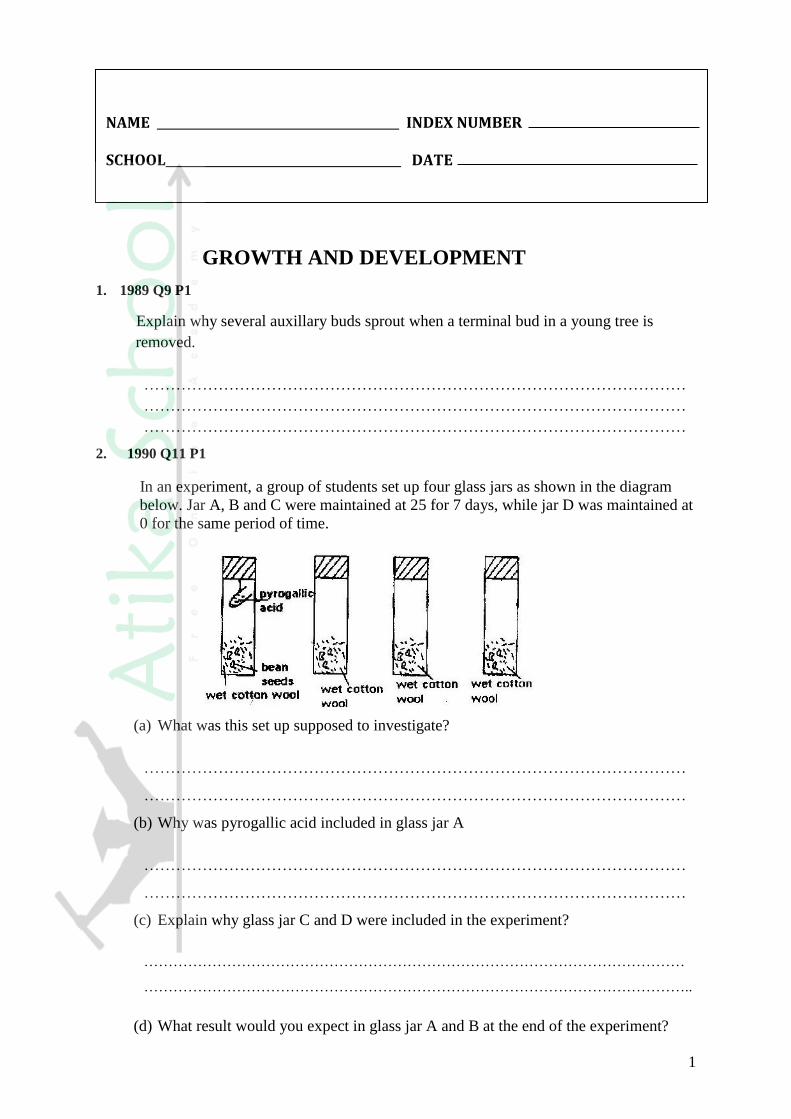
2. 1990 Q11 P1
In an experiment, a group of students set up four glass jars as shown in the diagram
below. Jar A, B and C were maintained at 25 for 7 days, while jar D was maintained at
0 for the same period of time.
(a) What was this set up supposed to investigate?
…………………………………………………………………………………………
…………………………………………………………………………………………
(b) Why was pyrogallic acid included in glass jar A
…………………………………………………………………………………………
…………………………………………………………………………………………
(c) Explain why glass jar C and D were included in the experiment?
…………………………………………………………………………………………………
…………………………………………………………………………………………………..
(d) What result would you expect in glass jar A and B at the end of the experiment?
NAME INDEX NUMBER
SCHOOL DATE
2
…………………………………………………………………………………………
…………………………………………………………………………………………
(e) State two artificial ways of breaking seed dormancy.
…………………………………………………………………………………………
…………………………………………………………………………………………
3. 1990 Q16 P1
(a) Describe the secondary thickening in flowering plants.
…………………………………………………………………………………………
…………………………………………………………………………………………
…………………………………………………………………………………………
…………………………………………………………………………………………
…………………………………………………………………………………………
…………………………………………………………………………………………
…………………………………………………………………………………………
…………………………………………………………………………………………
…………………………………………………………………………………………
…………………………………………………………………………………………
………………………………………………………………………………
(b) Describe one method, which can be used to measure the average growth rate of a
single leaf plant.
…………………………………………………………………………………………
…………………………………………………………………………………………
…………………………………………………………………………………………
…………………………………………………………………………………………
…………………………………………………………………………………………
…………………………………………………………………………………………
…………………………………………………………………………………………
…………………………………………………………………………………………
…………………………………………………………………………………………
…………………………………………………………………………………………
………………………………………………………………………………
4. 1992 Q15 P1
Removal of the apical bud from the shrub is a practice that the results in the
3
development of the lateral buds which later from the branches.
(a) Give reasons for the development of the lateral branches after the removal of the
Apical bud
…………………………………………………………………………………………
…………………………………………………………………………………………
(b)Suggest one application of this practice?
…………………………………………………………………………………………
(c) What is the importance of this practice?
…………………………………………………………………………………………
…………………………………………………………………………………………
5. 1993 Q16 P1 In an experiment some germination seeds were placed in a large airtight flask left for
four days.
(a) Suggest the expected changes in the composition of gases in the flask on
the fifth Day.
…………………………………………………………………………………………
…………………………………………………………………………………………
(b) Give your reasons for your answer in (a) above.
…………………………………………………………………………………………
…………………………………………………………………………………………
(c) Name two factors that cause dominancy in seeds
…………………………………………………………………………………………
…………………………………………………………………………………………
6. 1993 Q17 P1
In an experiment, maize grains were soaked in different concentrations of solutions X for
24 hours. In the control experiment the seeds were soaked in distilled water for the same
time. The seeds were placed on moist cotton wool in different Petri dishes. They
4
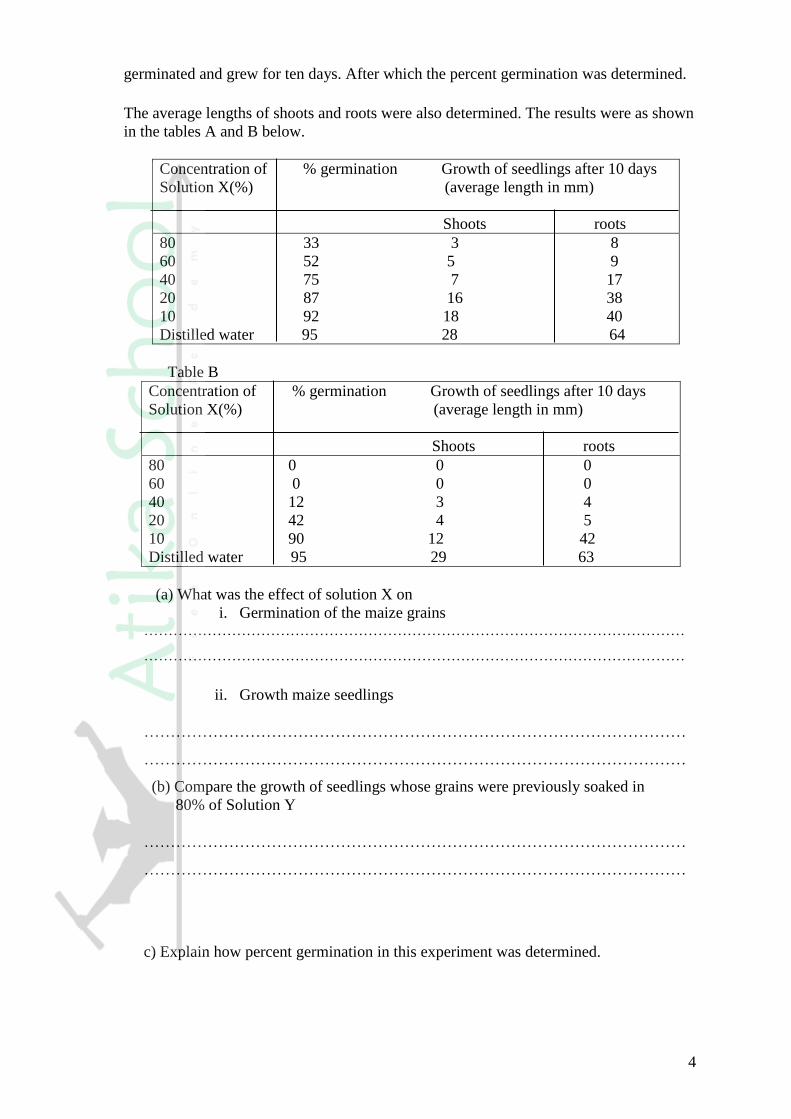
germinated and grew for ten days. After which the percent germination was determined.
The average lengths of shoots and roots were also determined. The results were as shown
in the tables A and B below.
Concentration of % germination Growth of seedlings after 10 days
Solution X(%) (average length in mm)
Shoots roots
80 33 3 8
60 52 5 9
40 75 7 17
20 87 16 38
10 92 18 40
Distilled water 95 28 64
Table B
Concentration of % germination Growth of seedlings after 10 days
Solution X(%) (average length in mm)
Shoots roots
80 0 0 0
60 0 0 0
40 12 3 4
20 42 4 5
10 90 12 42
Distilled water 95 29 63
(a) What was the effect of solution X on
i. Germination of the maize grains …………………………………………………………………………………………………
…………………………………………………………………………………………………
ii. Growth maize seedlings
…………………………………………………………………………………………
…………………………………………………………………………………………
(b) Compare the growth of seedlings whose grains were previously soaked in
80% of Solution Y
…………………………………………………………………………………………
…………………………………………………………………………………………
c) Explain how percent germination in this experiment was determined.
5
…………………………………………………………………………………………
…………………………………………………………………………………………
…………………………………………………………………………………………
d) From the results in tables A and B what other conclusions can be drawn
about solution X and Y?
…………………………………………………………………………………………
…………………………………………………………………………………………
e) Other than moisture and solution X and Y what other conditions were necessary
for germination of the maize grains?
…………………………………………………………………………………………
…………………………………………………………………………………………
f) State two ways in which indoleacetic acid (IAA) influences growth in plants.
…………………………………………………………………………………………
…………………………………………………………………………………………
7. 1994 Q7, 10, P1
7. Account for loss in dry weight of cotyledons in a germinating bean seed.
…………………………………………………………………………………………
…………………………………………………………………………………………
10. What is the effect of gibberellins on shoots of plants?
…………………………………………………………………………………………
…………………………………………………………………………………………
8. 1994 Q 18 P1 In an experiment to investigate the effect of heat on germination of seeds, eleven bags
each containing 50 bean seeds was placed in a water bath maintained at 90%. After 2
minutes, a bag was removed and the seeds contained were planted. The number that

6
germinated was recorded.
The procedure used for the beans was repeated for Acacia seeds.
The results obtained were as shown in the table below.
Number of seeds that germinated
Time (min) Beans seeds Acacia seeds
0 50 0
2 50 0
4 46 1
6 35 2
8 10 28
10 1 36
12 0 41
14 0 44
16 0 47
18 0 48
20 0 50
(a) Using a suitable scale and on the same axes draw graphs of time in hot water against
number of seeds that germinated for each plant. Use the horizontal axis for the seeds
that germinated.
(b) (i) After how many minutes would you expect 50% of acacia seeds exposed to the
hot to germinate?
…………………………………………………………………………………………
(ii) What was the minimum number of minutes after exposure of beans to hot water
was there no germination?
…………………………………………………………………………………………
…………………………………………………………………………………………
(c) From the graphs, which one of the two types of seeds was more sensitive to heat
influence on germination? Give reasons for your answer.
…………………………………………………………………………………………
…………………………………………………………………………………………
(d) Explain why the ability for the
(i) Beans seeds to germinate declined with time of exposure to heat
…………………………………………………………………………………………
…………………………………………………………………………………………
(ii) Acacia seeds to germinate improved with time of exposure to heat.
…………………………………………………………………………………………
…………………………………………………………………………………………
7
(e) What results would be expected if the temperature of water was maintained at
100oC
…………………………………………………………………………………………
…………………………………………………………………………………………
5oC
…………………………………………………………………………………………
…………………………………………………………………………………………
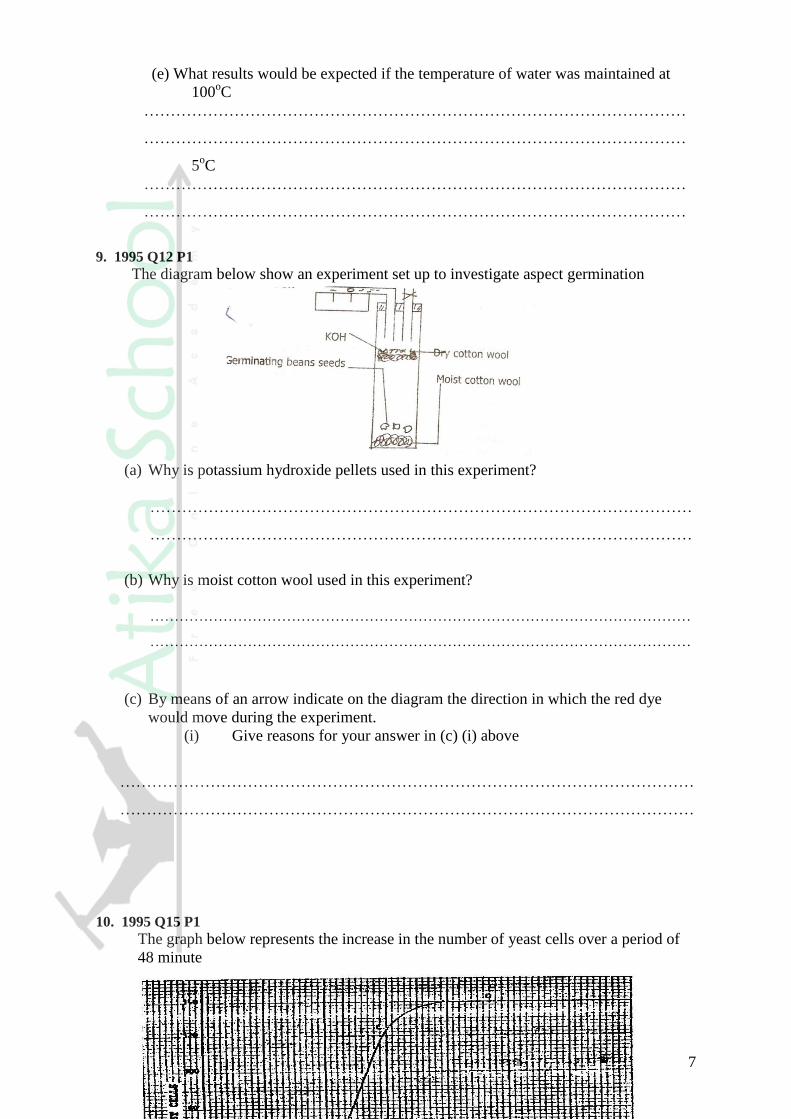
9. 1995 Q12 P1
The diagram below show an experiment set up to investigate aspect germination
(a) Why is potassium hydroxide pellets used in this experiment?
…………………………………………………………………………………………
…………………………………………………………………………………………
(b) Why is moist cotton wool used in this experiment?
…………………………………………………………………………………………………
…………………………………………………………………………………………………
(c) By means of an arrow indicate on the diagram the direction in which the red dye
would move during the experiment.
(i) Give reasons for your answer in (c) (i) above
………………………………………………………………………………………………
………………………………………………………………………………………………
10. 1995 Q15 P1 The graph below represents the increase in the number of yeast cells over a period of
48 minute

8
(a) Name the type of curve shown (1 mark)
……………………………………………………………………………………
(b) Determine the number of yeast cells after 26 minutes (1 mark)
……………………………………………………………………………………
……………………………………………………………………………………
(c) Work out the rate of cell division between 24 and 28 minutes (2 marks)
(d) After how long was the population of yeast cells 128? (1 mark)
……………………………………………………………………………………
……………………………………………………………………………………
(e) Name the phase of the curve labelled
(i) A to B
……………………………………………………………………………………
(ii) B to C
……………………………………………………………………………………
(f) Give reasons for the shape of the graph between points C and D (3marks)
……………………………………………………………………………………
……………………………………………………………………………………
……………………………………………………………………………………
(g) State five factors, which would cause human population growth to assume
the shape of the graph curve between points B and C (5 marks)

9
……………………………………………………………………………………
……………………………………………………………………………………
……………………………………………………………………………………
……………………………………………………………………………………
……………………………………………………………………………………
……………………………………………………………………………………
(h)Describe how the quadrant method can be used to estimate the population of
various species of plants in a given habitat (5 marks)
……………………………………………………………………………………
……………………………………………………………………………………
……………………………………………………………………………………
……………………………………………………………………………………
……………………………………………………………………………………
……………………………………………………………………………………
11. 1996 Q10 P1
A student set up an experiment as shown in the diagrams below
The set up was at room temperature for a week
(a) What was the aim of the experiment? (1 mark)
………………………………………………………………………………………
………………………………………………………………………………………
(b) What would be the expected results at the end of the experiment (2 marks)
………………………………………………………………………………………
………………………………………………………………………………………
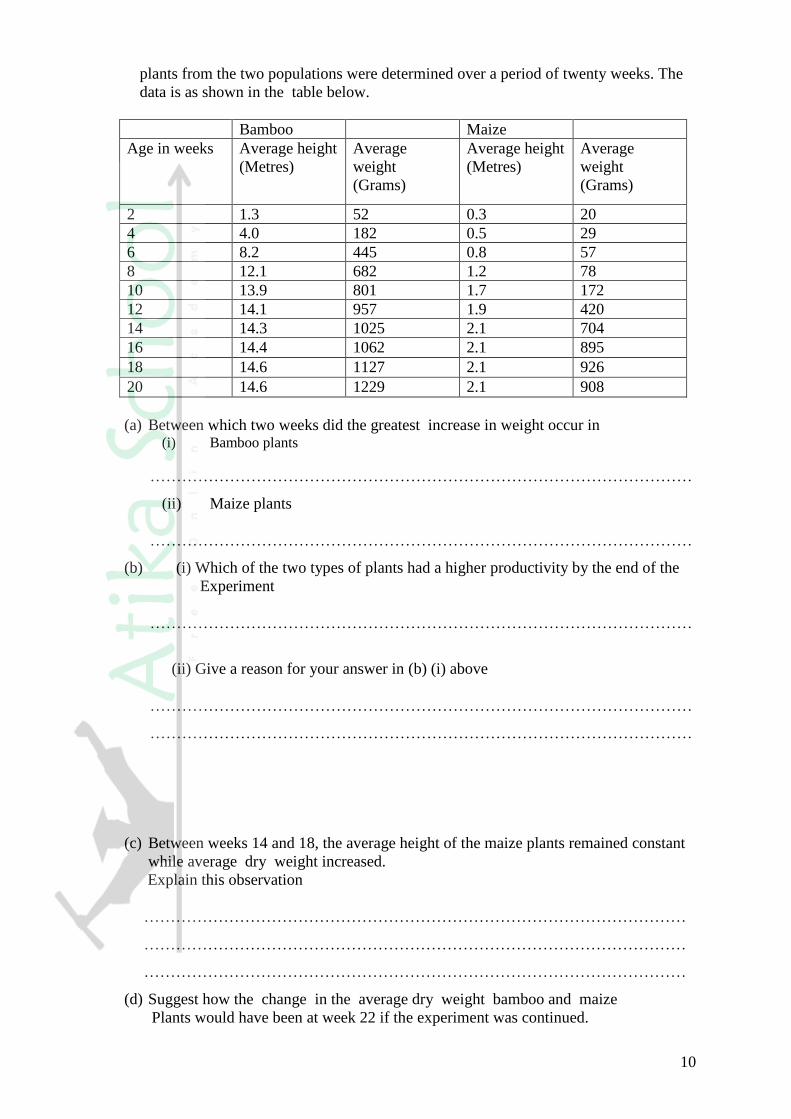
12. 1997 Q18 P1
An experiment was carried out to determine the growth rates of bamboo and a variety
of maize plants in two adjacent plots. The average height and average dry weight of
10
plants from the two populations were determined over a period of twenty weeks. The
data is as shown in the table below.
Bamboo Maize
Age in weeks Average height
(Metres)
Average
weight
(Grams)
Average height
(Metres)
Average
weight
(Grams)
2 1.3 52 0.3 20
4 4.0 182 0.5 29
6 8.2 445 0.8 57
8 12.1 682 1.2 78
10 13.9 801 1.7 172
12 14.1 957 1.9 420
14 14.3 1025 2.1 704
16 14.4 1062 2.1 895
18 14.6 1127 2.1 926
20 14.6 1229 2.1 908
(a) Between which two weeks did the greatest increase in weight occur in (i) Bamboo plants
…………………………………………………………………………………………
(ii) Maize plants
…………………………………………………………………………………………
(b) (i) Which of the two types of plants had a higher productivity by the end of the
Experiment
…………………………………………………………………………………………
(ii) Give a reason for your answer in (b) (i) above
…………………………………………………………………………………………
…………………………………………………………………………………………
(c) Between weeks 14 and 18, the average height of the maize plants remained constant
while average dry weight increased.
Explain this observation
…………………………………………………………………………………………
…………………………………………………………………………………………
…………………………………………………………………………………………
(d) Suggest how the change in the average dry weight bamboo and maize
Plants would have been at week 22 if the experiment was continued.

11
…………………………………………………………………………………………
…………………………………………………………………………………………
(e) Why was it appropriate for this experiment to use
(i) Dry weight instead of fresh weight
…………………………………………………………………………………………
…………………………………………………………………………………………
(ii) Weight and height
…………………………………………………………………………………………
…………………………………………………………………………………………
(f) Describe how the average height and weight of the plants were determined in this
experiment.
Average height
…………………………………………………………………………………………
…………………………………………………………………………………………
…………………………………………………………………………………………
…………………………………………………………………………………………
Average dry Weight
…………………………………………………………………………………………
…………………………………………………………………………………………
…………………………………………………………………………………………
…………………………………………………………………………………………
(g) Give a reason why secondary thickening does not occur in bamboo and maize plants
…………………………………………………………………………………………………
13. 1999 Q12
A student set up an experiment as shown in the diagram below.

12
a) i) What is being investigated in the experiment?
………………………………………………………………………………………
ii) On the diagram below indicate the expected results after three days.
iii) Why was it necessary to have wet cotton wool in the container?
……………………………………………………………………………………
……………………………………………………………………………………
b) What is the role of the following to a germinating seed
i) Oxygen
……………………………………………………………………………………
……………………………………………………………………………………
ii) Cotyledons.
……………………………………………………………………………………
……………………………………………………………………………………
14. 2001 Q15 P1
The diagram below represents a set up to investigate the conditions necessary for seed
germination.

13
The set up was left for 7 days
(a) What conditions were being investigated in the experiment?
………………………………………………………………………………………
………………………………………………………………………………………
(b) State three reasons for soaking seeds in set ups A and B
………………………………………………………………………………………
………………………………………………………………………………………
………………………………………………………………………………………
(c) What were the expected results after seven days?
………………………………………………………………………………………
………………………………………………………………………………………
15. 2002 Q4 P1
During germination and early growth, the day weight of the endosperm decreases
while that of the embryo increases. Explain.
………………………………………………………………………………………
………………………………………………………………………………………
16. 2002 Q19 P1
Describe the role of hormones in the growth and development of plants.
………………………………………………………………………………………
………………………………………………………………………………………
17. 2003 Q7 P1
The diagram below represents regions of a root tip.
a) Name the two regions above X in ascending order
…………………………………………………………………………………

14
b) State the function of the part labelled X
…………………………………………………………………………………
18. 2004 Q17 P1
During germination and growth of a cereal, the dry weight of endosperm, the
embryo and total dry weight were determined at two – day intervals.
The results are shown in the table below.
Time after planting
(days)
Dry weight of
endosperm
Dry weight of
embryo (mg )
Total dry
weight (mg)
0 43 2 45
2 40 2 42
4 33 7 40
6 20 17 37
8 10 25 35
10 6 33 39
a) Using the same axes, draw graphs of dry weigh of endosperm, embryo and the
total dry weight against time (7marks)
b) What is the total dry weight on day 5?
……………………………………………………………………………………
……………………………………………………………………………………
c) Account for:
i) Decrease in dry weight of endosperm from day 0 to 10 (2marks)
……………………………………………………………………………………
……………………………………………………………………………………
……………………………………………………………………………………
ii) Increase in dry weight of embryo from day 0 day 10 (2marks)
……………………………………………………………………………………
……………………………………………………………………………………
iii) Decrease in total dry weight from day 0 to day 8 (2marks)
……………………………………………………………………………………
……………………………………………………………………………………
iv) Increase in total dry weight after day 8 (1marks)
……………………………………………………………………………………
……………………………………………………………………………………
(b) Accounting for dormancy.

15
i) Within a seed
……………………………………………………………………………………
……………………………………………………………………………………
ii) Outside the seed
……………………………………………………………………………………
……………………………………………………………………………………
e) Give two characteristics of meristematic cells (2marks)
……………………………………………………………………………………
……………………………………………………………………………………
19. 2005 Q8 P1
Name three factors in seeds that cause dormancy. (3marks)
…………………………………………………………………………………………
…………………………………………………………………………………………
…………………………………………………………………………………………
20. 2006 Q14 P1
a) Distinguish between epigeal and hypogeal germination. (1mark)
…………………………………………………………………………………………
…………………………………………………………………………………………
b) Why is oxygen necessary in the germination of seeds? (2marks)
…………………………………………………………………………………………
…………………………………………………………………………………………
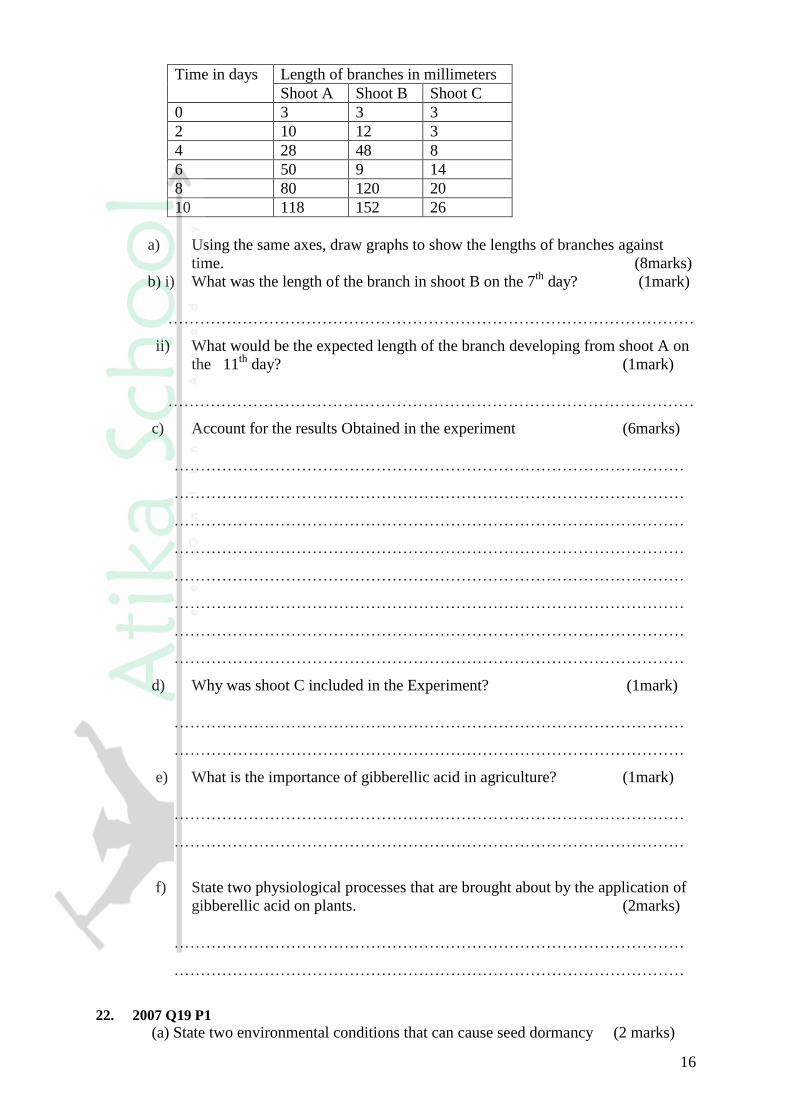
21. 2006 Q6 P2
An experiment was carried out to investigate the effect of hormones on growth of
lateral buds of three pea plants
The shoots were treated as follows:
Shoot A – Apical bud was removed.
Shoot B – Apical bud was removed and gibberellic acid placed on the cut shoot.
Shoot C – Apical bud was left intact.
The length of the branches developing from lateral buds were determined at regular
intervals.
The results obtained are as shown in the table below.
16
Time in days Length of branches in millimeters
Shoot A Shoot B Shoot C
0 3 3 3
2 10 12 3
4 28 48 8
6 50 9 14
8 80 120 20
10 118 152 26
a) Using the same axes, draw graphs to show the lengths of branches against
time. (8marks)
b) i) What was the length of the branch in shoot B on the 7th
day? (1mark)
………………………………………………………………………………………
ii) What would be the expected length of the branch developing from shoot A on
the 11th
day? (1mark)
………………………………………………………………………………………
c) Account for the results Obtained in the experiment (6marks)
……………………………………………………………………………………
……………………………………………………………………………………
……………………………………………………………………………………
……………………………………………………………………………………
……………………………………………………………………………………
……………………………………………………………………………………
……………………………………………………………………………………
……………………………………………………………………………………
d) Why was shoot C included in the Experiment? (1mark)
……………………………………………………………………………………
……………………………………………………………………………………
e) What is the importance of gibberellic acid in agriculture? (1mark)
……………………………………………………………………………………
……………………………………………………………………………………
f) State two physiological processes that are brought about by the application of
gibberellic acid on plants. (2marks)
……………………………………………………………………………………
……………………………………………………………………………………
22. 2007 Q19 P1
(a) State two environmental conditions that can cause seed dormancy (2 marks)
17
………………………………………………………………………………………
………………………………………………………………………………………
(b) Name the part of a bean that elongates to bring about epigeal germination
(1 mark)
………………………………………………………………………………………
23. 2007 Q23 P1
(a) Name the hormone that is responsible for apical dominance (1 mark)
………………………………………………………………………………………
(b) What is thigmotropism? (1 mark)
………………………………………………………………………………………
………………………………………………………………………………………
24. 2008 Q17 P1
Account for the following phases of a sigmoid curve of a growth of an organism
(a) Lag phase (1 mark)
………………………………………………………………………………………
………………………………………………………………………………………
(b) Plateau phase (1 mark)
………………………………………………………………………………………
………………………………………………………………………………………
25. 2008 Q21 P1
(a) What is seed dormancy (1 mark)
………………………………………………………………………………………
………………………………………………………………………………………
(b) Name a growth inhibitor in seeds (1 mark)
………………………………………………………………………………………
………………………………………………………………………………………
26. 2009 Q4 P1
(a) The state during which a seed cannot germinate even when conditions for
Germination are suitable is called (1 mark)
………………………………………………………………………………………
………………………………………………………………………………………
(b) The diagram below represents a stage during germination of a seed

18
(i) Name the type of germination illustrated in the diagram (1mark)
………………………………………………………………………………………
(ii) State the role of the part labelled x during germination of the seed (2 marks)
………………………………………………………………………………………
………………………………………………………………………………………
19. 2009 Q11 P1
In an experiment the shoot tip of a young tomato plant was decapitated as shown in
the diagram below
(a) State the expected results after 2 weeks (1 mark)

19
………………………………………………………………………………………
………………………………………………………………………………………
(b) Give a reason for your answer in (a) above (2 marks)
………………………………………………………………………………………
………………………………………………………………………………………
28. 2010 Q30 P1
What is meant by the apical dominance? (3 marks)
………………………………………………………………………………………
………………………………………………………………………………………
………………………………………………………………………………………
………………………………………………………………………………….......
29. 2010 Q1 P2
In an experiment, disinfected soaked bean seeds were put in a vacuum flask which
was then fitted with a thermometer as shown in the diagram below.
The temperature readings were taken every morning for three consecutive days.
a) Which process was being investigated? (1 mark)

20
………………………………………………………………………………………………
b) i) what were the expected results? (1 mark)
………………………………………………………………………………………
………………………………………………………………………………………
ii) account for the answer in (b) (i) above? (2 marks)
………………………………………………………………………………………
………….……………………………………………………………………………
c) Why were the seeds disinfected? (2 marks)
………………………………………………………………………………………………
………………………………………………………………………………………………
d) Why was a vacuum flask used in the set-up? (1 mark)
…………………………………………………………………………………………………
………………………………………………………………………………………………..
e) How would a control for this experiment be set? ( 1mark)
…………………………………………………………………………………………
…………………………………………………………………………………….......
30. 2011 Q28b , 29 P1
28. State two ways by which auxins regulate growth in seedlings (2marks)
…………………………………………………………………………………………
…………………………………………………………………………………………
29. State four reasons why water is significant in seed germination (4 marks)
…………………………………………………………………………………………
…………………………………………………………………………………………
…………………………………………………………………………………………
…………………………………………………………………………………………
31. 2011 Q5 P2
(a) The diagram below represents a flower.
Ovules
Ovary
Anther
21
(i) On the diagram, name two structures where meiosis occurs. (2marks)
…………………………………………………………………………………………
…………………………………………………………………………………………
(ii) How is the flower adapted to prevent self-pollination? (2marks)
…………………………………………………………………………………………
…………………………………………………………………………………………
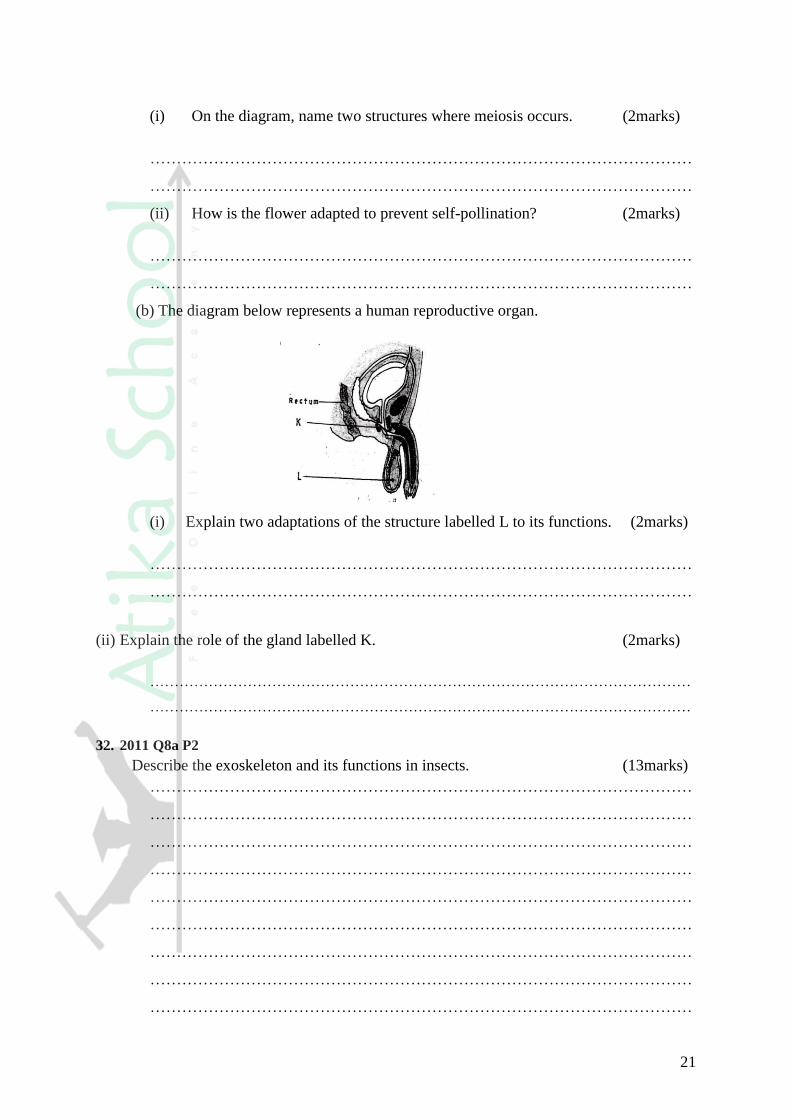
(b) The diagram below represents a human reproductive organ.
(i) Explain two adaptations of the structure labelled L to its functions. (2marks)
…………………………………………………………………………………………
…………………………………………………………………………………………
(ii) Explain the role of the gland labelled K. (2marks)
…………………………………………………………………………………………………
…………………………………………………………………………………………………
32. 2011 Q8a P2
Describe the exoskeleton and its functions in insects. (13marks)
…………………………………………………………………………………………
…………………………………………………………………………………………
…………………………………………………………………………………………
…………………………………………………………………………………………
…………………………………………………………………………………………
…………………………………………………………………………………………
…………………………………………………………………………………………
…………………………………………………………………………………………
…………………………………………………………………………………………

22
…………………………………………………………………………………………
…………………………………………………………………………………………
…………………………………………………………………………………………
…………………………………………………………………………………………
…………………………………………………………………………………………
…………………………………………………………………………………………
…………………………………………………………………………………………
…………………………………………………………………………………………
…………………………………………………………………………………………
…………………………………………………………………………………………
…………………………………………………………………………………………
…………………………………………………………………………………………
…………………………………………………………………………………………
…………………………………………………………………………………………
…………………………………………………………………………………………
…………………………………………………………………………………………
…………………………………………………………………………………………
…………………………………………………………………………………………
…………………………………………………………………………………………
32. 2012 Q16 P1
The diagram below represents an experimental set-up used by students to investigate a
certain process.
Flower Q produced seeds while P did not. Account for the results. (3marks)
…………………………………………………………………………………………………
…………………………………………………………………………………………………
23
………………………………………………………………………………………………
…………………………………………………………………………………………
33. 2012 Q20 P1
State three aspects that can be used to estimate growth in seedlings. (3 marks)
…………………………………………………………………………………………
…………………………………………………………………………………………
…………………………………………………………………………………………
……………………………………………………………………
34. 2012 Q24 P1
State four characteristics of Apical meristem cells. (4 marks)
…………………………………………………………………………………………
…………………………………………………………………………………………
…………………………………………………………………………………………
…………………………………………………………………………………………
Related Documents