Welcome message from author
This document is posted to help you gain knowledge. Please leave a comment to let me know what you think about it! Share it to your friends and learn new things together.
Transcript

The International Center for Tropical Agriculture (CIAT) is a not-for-profit organization that conducts sociallyand environmentally progressive research aimed at reducing hunger and poverty and preserving naturalresources in developing countries. CIAT is one of the 15 centers funded mainly by the 64 countries, privatefoundations, and international organizations that make up the Consultative Group on International AgriculturalResearch (CGIAR).
CIAT also receives funds for research and development services provided under contract to a growing numberof institutional clients.
Information and conclusions reported in this document do not necessarily reflect the position of any donoragency.
About the Partners
ASARECA FOODNET (Association for Strengthening Agricultural Research in Eastern and Central Africa)FOODNET is ASARECA’s post harvest and market research network for East and Central Africa. The network was establishedin 1999 and focuses on market analysis studies, market information, agroenterprise development, and related businessdevelopment support services. FOODNET works in collaborative partnerships with research and development partnersfrom the public and private sector.
CARECARE International is a global humanitarian organization working with over 45 million people in 70 of the world’s poorestcountries. CARE tackles underlying causes of poverty so that people can become self-sufficient. Recognizing that womenand children suffer disproportionately from poverty, CARE places special emphasis on working with women to createpermanent social change. Women are at the heart of CARE’s community-based efforts to improve basic education, preventthe spread of HIV, increase access to clean water and sanitation, expand economic opportunity and protect naturalresources. CARE also delivers emergency aid to survivors of war and natural disasters, and helps people rebuild theirlives.
Catholic Relief ServicesCatholic Relief Services (CRS) was founded in 1943 by the Catholic Bishops of the United States. Their mission is to assistthe poor and disadvantaged and promote development of all people and to foster charity and justice throughout the world.CRS operates on 5 continents and in over 90 countries. CRS aids the poor by first providing direct assistance thenencouraging these people to help with their own development.
CIPASLACipasla, an inter-institutional consortium that fosters sustainable agriculture in hillsides, was founded in 1993 and isbased in Pescador, a village in northern Cauca department, located in south-western Colombia. In its first phase Cipaslaincluded twelve public and private agencies and its structure involved a support committee consisting of communityrepresentatives. Cipasla’s agenda encompasses community organization, environmental education, soil and waterconservation, integrated crop management, marketing and agro-industry. Several CIAT projects have been implementedresearch activities in this region which is considered as a pilot site.
CLODESTCLODEST is a local inter-institutional committee that promotes sustainable development agriculture in the pilot region ofYorito-Sulaco, in north-central Honduras. This region includes plains and hillsides. CLODEST members include farmerassociations, development NGOs and CIAT. CLODEST conducts activities around community organizations, environmentaleducation, soil and water conservation, integrated crop management, marketing and agro-industry. Several CIAT projectshave implemented research activities in this region, which is considered as a pilot or reference site in Central America.
CorpotuniaCorpotunia, a local rural development NGO was founded in 1986 by community leaders and development NGOs andoperates in the Cauca Department, located in south-western Colombia. Corpotunia executes development projects fundedby the Colombian government and international donors. Its is a member of a research and development network in whichCIAT also participates, and makes use of participatory methods and tools with a business and market orientation, developedby CIAT’s Rural Agroenterprise Development Project.
SNVSNV is a Netherlands based international development organization that provides advisory services to nearly 1800 localorganizations in over 30 developing countries to support their fight against poverty. SNV is dedicated to a society where allpeople enjoy the freedom to pursue their own sustainable development. SNV works with organizations that operate atdistrict and provincial level and function as linking pins between national policies and frameworks and the people living intowns and communities. Its clients include private, governmental and civil society organizations.
About the Donors
CIDACanadian International Development Agency’s mandate is to support sustainable development in developing countries toreduce poverty and contribute to a more secure, equitable, and prosperous world. The Agency’s work is concentrated inthe poorest countries in Africa, Asia, and Latin America. CIDA’s program is based on the Millennium Development Goals,which it contributes through four key areas: social development, economic well-being, protection, conservation, andmanagement of the environment and governance.
DFIDThe Department for International Development (DFID) is the part of the UK Government that manages Britain’s aid to poorcountries and works to reduce extreme poverty. DFID’s work aims to bring people out of poverty through programs thatsettle conflicts, increase trade and improve health and education.
IDRCThe International Development Research Centre (IDRC) is a public corporation created by the Parliament of Canada in1970 to help developing countries use science and technology to find practical, long-term solutions to the social, economic,and environmental problems they face. Support is directed toward developing an indigenous research capacity to sustainpolicies and technologies that developing countries need to build healthier, more equitable, and more prosperous societies.
NZAIDNZAID is the Government’s International Aid and Development Agency. NZAID places a high priority on building strongpartnerships and concentrates its development assistance on activities that contribute to poverty elimination by creatingsafe, just and inclusive societies, fulfilling basic needs, and achieving environmental sustainability and sustainablelivelihoods. NZAID supports projects in the Pacific region, Asia, Africa and Latin America.
SDCThe Swiss Agency for Development and Cooperation (SDC) is organized and funded by the Swiss government and operatesby financing programs both directly and in partnership with other agencies to countries around the world.
USAIDThe United States Agency for International Development is an independent federal government agency that aims to furtherAmerica’s foreign policy interests in expanding democracy and free markets while improving the lives of the citizens of thedeveloping world. USAID supports long-term and equitable economic growth and advances U.S. foreign policy objectivesby supporting: economic growth, agriculture and trade; global health; and, democracy, conflict prevention and humanitarianassistance.
CIAT Rural Agroenterprise Development
Good Practice Guide 4
M. Lundy, M.V. Gottret, C. Ostertag,R. Best and S. Ferris
ISBN 978-958-694-092-4
Participatory Market Chain Analysisfor Smallholder Producers
Supported by the CGIAR
Centro Internacional de Agricultura TropicalInternational Center for Tropical AgricultureApartado Aéreo 6713Cali, ColombiaFax: +57 (2) 4450073E-mail: [email protected]: www.ciat.cgiar.org/agroempresas/ingles/index.htm
CIAT Publication No. 357ISBN 978-958-694-092-4Press run: 500Printed in ColombiaSeptember 2007
Lundy, MarkParticipatory market chain analysis for smallholder producers /
M. Lundy, M.V. Gottret, C. Ostertag, R. Best and S. Ferris. -- Cali, CO : Centro Internacional de Agricultura Tropical (CIAT), 2007.
113 p. -- (CIAT publication no. 357. CIAT Rural Agroenterprise Development.Good practice guide 4)ISBN 978-958-694-092-4
AGROVOC descriptors in English:1. Small enterprises. 2. Rural areas. 3. Farmer participation. 4. Market research.
5. Farmers. 6. Small farms. 7. Markets. 8. Developing countries.
Local descriptors in English:1. Participatory research. 2. Productive chains. 3. Rural agroenterprises.
AGROVOC descriptors in Spanish:1. Empresas pequeñas. 2. Zonas rurales. 3. Participación de agricultores.
4. Investigación de mercados. 5. Agricultores. 6. Explotación en pequeña escala.7. Mercados. 8. Países en desarrollo.
Local descriptors in Spanish:1. Investigación participativa. 2. Cadena productiva. 3. Agroempresas rurales.
I. Gottret, María Verónica. II. Ostertag Gálvez, Carlos Felipe. III. Best, Rupert.IV. Ferris, Shaun. V. Centro Internacional de Agricultura Tropical. VI. Tit. VII. Ser.
AGRIS subject category: E20 Organization, administration and management ofagricultural enterprises or farms /Organización, administración y manejo de empresasagrícolas o fincas
LC classification: HD 9000 .F8
Copyright CIAT 2007. All rights reserved
CIAT encourages wide dissemination of its printed and electronic publications for maximum public benefit.Thus, in most cases colleagues working in research and development should feel free to use CIAT materials fornoncommercial purposes. However, the Center prohibits modification of these materials, and we expect toreceive due credit. Though CIAT prepares its publications with considerable care, the Center does not guaranteetheir accuracy and completeness.
Contents
iii
PagePreface ix
Acknowledgments x
Introduction and Background to the Guide 1
THE THEORY
Section 1. An Area-based Approach to Rural Enterprise Development 5Introduction 5Food Security versus Income Security 6Area-based Approach to Rural Enterprise Development 7Agroenterprise as a Catalyst for Enabling Rural Innovation 10
Section 2. Market Chains and Service Providers: Basic Concepts 12Introduction 12Local Service Providers and their Role in Sustaining Market Chains 14Using Marketing Skills to Reduce Rural Poverty 16Situation Analysis 16
Section 3. Basic Steps in Developing a Competitive Market Chain Strategy 19Introduction 19Designing a Strategy for Increasing Market Chain Competitiveness 19Vision of the Market Chain 20A Wider Vision of the Market Chain 21Market Chains and Innovation 23Individual Enterprise Efficiency versus Market Chain Efficiency 24Raising Competitiveness through Market Chain Quality Assurance 25Raising Competitiveness through Mark of Origin (Apellation/Labeling) 25Market Chains, Supply Chains, and Value Chains 25Scale of Evaluation and Level of Participation 26Considerations When Applying the Method at Diverse Scales of Intervention 26Observations on the Use of Participatory Methods 28Summary 30
Section 4. Guidelines for Adapting the Process to Local Needs 31Introduction 31Market Orientation 32Market Chain Focus from “End to End” 32Coordination among Different Actors to Identify and Develop Synergies 32Working with the Private Sector 32Selection of Key Informants in Decision-Making Processes 32Respecting People’s Time, Needs, and Differences 32Combining Research and Development Activities to Promote Innovation 33Mixing Short-, Medium-, and Long-term Activities with Available Resources 33Identifying a Process Facilitator 34
CIAT
Note
Please click on the links in blue to access each section.
iv
Participatory Market Chain Analysis for Smallholder Producers
Page
THE PRACTICAL WORK
Section 5. Selecting a Market Chain 37Introduction 37Selection Criteria Used to Choose an Appropriate Market Chain 38Definition of Individualized Selection Criteria 40A Methodology for Prioritizing Market Chains 40Selection Tools 41Merits of a Pilot Project to Test the Process 43
Section 6. Planning and Executing a Rapid Market Survey 45Introduction 45Planning for the Survey 46Starting the Market Chain Analysis 47Survey Teams 48Checklists and Summary Sheets 48Documenting Results 51Using Results 53Feeding Back Results 54
Section 7. Identification of Key “Actors” in Market Chains and Steps forBusiness Planning 55
Introduction 55Identification of Actors 56Differentiation of Actors within the Market Chain 57Meetings to Convene the Actors 59Organizing Workshops 59Sources of Market Chain Information 60
Section 8. Participatory Market Chain Analysis 62Introduction 62Criteria for the Analysis of Complex Systems 62Formation of Working Groups 64Tools 64Mapping the Market Chain 65Provision of Business Development Services 68Market Chain History 71
Section 9. Analysis of Critical Points in the Market Chain 74Introduction 74Identification of Limiting Factors 75Analysis of Cause and Effect 78Comparing the Market Chain to the Competition—“Benchmarking” 80Prospective Market Tendencies and Defining a Simple Marketing Strategy 83Designing a Logical Path to Increase Competitiveness 84Visioning—Where Do We Want to Go and How Do We Get There? 85Preparation of Business Plans 87
Page
Section 10. Negotiating a Strategy to Increase Competitiveness 90Introduction 90Systematization of Results: Technical Document 91Negotiation Workshop 92Design of the Final Strategy to Increase Competitiveness 95
Section 11. Monitoring of Strategies to Increase Competitiveness: General Guidelines 98Introduction 98Monitoring and Evaluation 98Possible Factors for a Monitoring and Evaluation System 99Results on Livelihoods (by Gender, Population Groups, and Economic Status) 100
Appendices1. Marketing Checklist to Evaluate Key Points in the Market Chain for a Commodity 1022. Summary Information Sheet: Example from Banana Market Survey 1033. Outline of a Business/Investment Plan 104
Glossary 106
Bibliography 113
Contents
v
vi
Page
List of Figures1. Flow chart of key stages in the participatory agroenterprise development approach 82. Market chain and its business support services 133. Forward and backward market linkages for enterprise 144. Stages in the design of a strategy to increase competitiveness 195. Components of a market chain 206. Wider perspective of a market chain 217. Decision tree of rural agroindustrial committee of CIPASLA 418. Sources of primary information 499. Wider perspective of a market chain 56
10. Triangulation of data 6311. Process of forming working groups 6412. Coffee market chain map, municipality of Sulaco, Honduras 6713. Analysis of critical points in the market chain 7514. Example of a problem tree 7915. Simple example of a general problem tree for a market chain 8016. Complete example of a general problem tree for a market chain 8117. Using a problem tree to identify solutions 8218. Example of a solution tree 8219. Definition of a logical path 8620. Complete simple logical path with actions and results 8621. Complete logical path with parallel actions and results 8722. Example of a logical path for a strategy to increase competitiveness 88
List of Tables1. Planning, organization, and timing for rural agroenterprise development 92. Service providers that support enterprise development 153. Enterprise relations: Production chain versus value chain 264. Considerations when applying the method at different scales 295. Identifying a process facilitator 346. Ansoff matrix for risk assessment 397. Growth prospects and product types 428. Technical and environmental issues against feasibility index 429. Organizational capacity assessment 43
10. Assessment of products by weighted scoring 4311. Results of a rapid market survey for panela (unrefined sugar) 5212. Actors identified by functional category in the market chain 5713. Differentiation of actors in the functional category of production 5714. Timeline of design workshops for a strategy development 6115. Matrix of the analysis of services received (by clients) 6916. Matrix of the analysis of services supplied 6917. Example of production services supplied in Guamote 7018. Example of production services received in Guamote 7019. Example of the timeline of the farmer association development 7220. Incomplete example of a pairwise ranking exercise 7621. Complete example of a pairwise ranking exercise 7622. Final ranking of limitations 7723. Example of a consolidation of limitations in a market chain 7724. Simple benchmarking tool 8325. Market strategy opportunities for mango market chain of Ecuador 85
Participatory Market Chain Analysis for Smallholder Producers
Contents
Page
List of Tables26. Market opportunities and requirements for broccoli in Ecuador 8527. Example of a matrix of problems per activity and actor 9328. Example of business opportunities matrix and investment plans 9329. Identification of alliances by each stage of the market chain 9430. Time and resources required to implement a marketing strategy 9531. Indicators and sources of verification within the market chain 10032. Indicators and sources of verification of the market 10033. Indicators and sources of verification of livelihoods 101
List of Boxes1. Organic cacao and sustainable advantages 242. Example of a value market chain: “Las Brisas,” Santa Cruz de Turrialba 273. Selection criteria used for discarding options 444. Some practical tips for conducting an interview 505. Example of an actor typology from Santa Cruz de Turrialba, Costa Rica 586. Black pepper in Pucallpa, Peru 967. Cut flowers in Cauca, Colombia 96
vii
viii
About the Authors
Mark LundyCorresponding author, based in CIAT headquarters, Cali, Colombia. United States of America National.Senior Research Fellow, Rural Agroenterprise Development Project.E-mail: [email protected]
María Verónica GottretBased in CIAT headquarters, Cali, Colombia. Bolivian National.Senior Research Fellow, Rural Agroenterprise Development Project.E-mail: [email protected]
Carlos Ostertag.Based in CIAT headquarters, Cali, Colombia. Dual Colombian/United States of America National.Senior Marketing and Business Administration Officer, Rural Agroenterprise Development Project.E-mail: [email protected]
Rupert BestBased in FAO offices, Rome, Italy. British National.Senior Technical Advisor for the Global Forum for Agricultural Research.E-mail: [email protected]
Shaun FerrisBased in CIAT headquarters, Cali, Colombia. Dual British/Australian National.CIAT Project Manager, Rural Agroenterprise Development Project.E-mail: [email protected]
Participatory Market Chain Analysis for Smallholder Producers
Preface
ix
The Participatory Market Chain AnalysisGuide was developed as a key step in the‘area-based approach to rural
agroenterprise development’. The guide is basedon the principles of developing market-ledinterventions that go beyond single interventionprojects. The aim of this guide is to enableservice providers to work with a range of actorsin selected market chains and designinterventions that initiate systemic changes inthe marketplace.
The approach seeks to empower producer groupsto engage with markets more effectively andstrengthen their business linkage with otherentrepreneurs. The goal is to upgrade the level ofcompetitiveness for all actors within a marketchain and thus enable rural producers, traders,and processors to make the shift fromopportunistic and irregular market linkages tosystematic players within growth value chains.
This guide is the fourth in a series of documentsdesigned to support agencies implementingparticipatory agroenterprise developmentprograms operating within defined geographicalareas. The guide series currently includes:
1. Strategy Paper: A Participatory and Area-based Approach to Rural AgroenterpriseDevelopment.
2. A Participatory Guide to DevelopingPartnerships, Area Resource Assessment andPlanning Together.
3. Identifying Market Opportunities for RuralSmallholder Producers.
4. Participatory Market Chain Analysis forSmallholder Producers.
5. Evaluating and Strengthening RuralBusiness Development Services.
6. A Market Facilitator’s Guide to ParticipatoryAgroenterprise Development.
7. Collective Marketing for SmallholderProducers.
8. A Guide to Rapid Market Appraisals forSmallholder Agroenterprise Development.
9. A Guide to Agricultural Marketing Extension.10. A Guide to Policy Analysis for Smallholder
Agroenterprise Development and Advocacy.
Note to usersService providers should read the guides in theirentirety, to absorb the ideas and concepts priorto going to the field. Our experience has shownthat best results are attained when theseprocesses are not implemented in a mechanicalmanner; rather that the principles areinterpreted and adapted to local conditionsbased on the marketing environment, availableresources, and anticipated scale ofimplementation.
Discover your InnovationDiscover your InnovationDiscover your InnovationDiscover your InnovationDiscover your Innovation
Acknowledgments
x
This guide is the result of several years ofparticipatory research in several pilot siteareas in Latin America, and more recently
in Africa and Southeast Asia. The guide has beentested with farmer organizations, local andinternational nongovernmental organizations,governmental organizations, and the privatesector. Without the efforts and ideas from eachof the partners below this document would nothave been possible. We would like to recognizeparticular support received from:
· Communities of the Cabuyal River micro-watershed in Cauca Department, Colombia.
· Support organizations in the RuralAgroindustrial Committee of the ConsorcioInterinstitucional para una AgriculturaSostenible en Ladera (CIPASLA).
· Communities of the municipalities of Yoritoand Sulaco, Yoro Department, Honduras.
· Microenterprise Committee of the ComitéLocal para el Desarrollo Sostenible de laCuenca del Río Tascalapa (CLODEST).
· Members of the Consorcio para elDesarrollo Sostenible de Ucayalí (CODESU) ofPucallpa, Peru.
· CARE Nicaragua and in particular theRENACER and FAROL projects located inEstelí and Matagalpa, respectively.
· CRS Eastern Africa and their support to thelearning alliance development process inEastern Africa.
· ASARECA and its support to agroenterpriseactivities through the regional marketing andagroenterprise network FOODNET.
· PABRA and its support to agroenterprisedevelopment in Eastern and Southern Africathrough the Enabling Rural Developmentproject.
· DFID in support of the Agroenterprise projectin Latin America and Africa.
· SDC support to the Agroenterprise project inVietnam and Laos.
This text attempts to document and share thework of these pioneers so that other ruralcommunities can apply what has been learned,and thus contribute to improving theirlivelihoods.
The authors also wish to acknowledge thegenerous support provided by the MINGAProgram of the International DevelopmentResearch Centre (IDRC) of Canada whichpermitted the development of field activities, andthe elaboration of this guide. The support ofmany CIAT colleagues have served in a similarfashion, as have the queries of students in theFirst and Second International Courses,“Linking small-scale rural producers to marketchains: Design of strategies to increasecompetitiveness,” offered jointly with the Centerfor Competitiveness of Eco-Enterprises of theCentro Agronómico Tropical de Investigación yEnseñanza (CATIE), of Costa Rica.
We give thanks to DFID for their logistic andfinancial support over many years which haveenabled partners to learn, discover, and createthis body of knowledge. Thanks also go to USAIDand CRS for providing funds to publish thesedocuments.
Technical and language editing of this documentwas done by Libby Finney. A special word ofthanks to Jorge Enrique Gutiérrez for hisdrawings.
Participatory Market Chain Analysis for Smallholder Producers
1
Introduction and Background to the Guide
Introduction and Background to the Guide
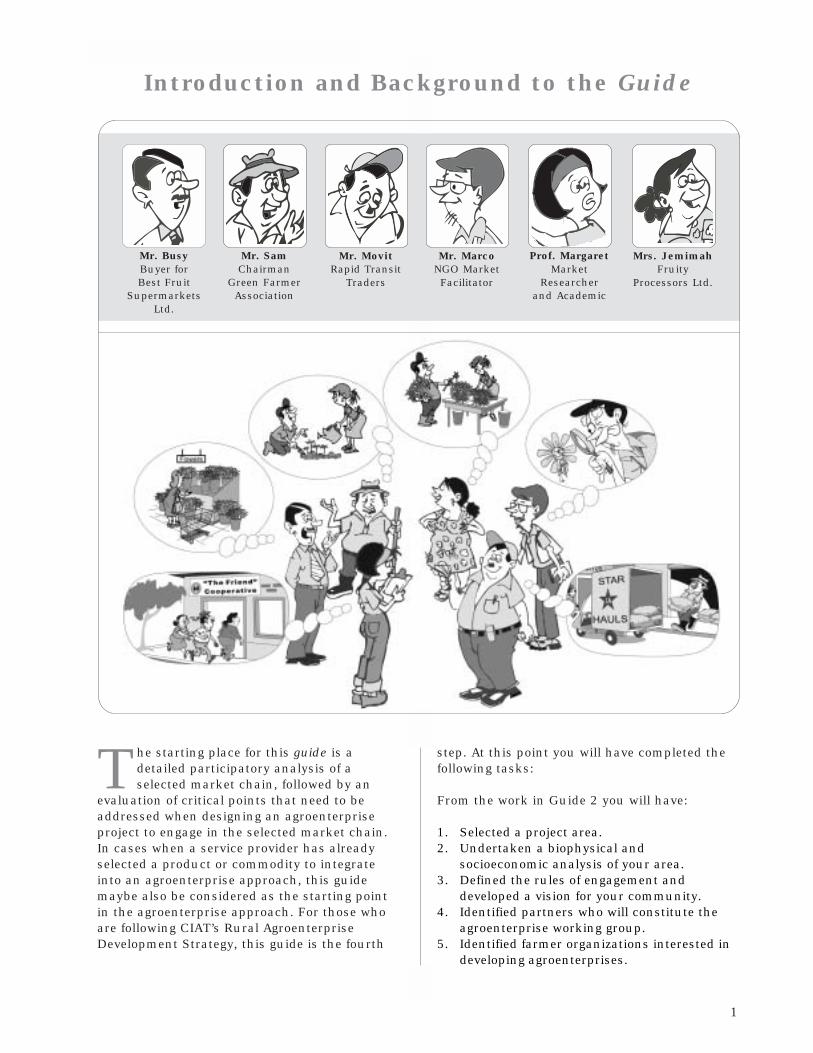
Mr. BusyBuyer forBest Fruit
SupermarketsLtd.
Mr. SamChairman
Green FarmerAssociation
Mr. MarcoNGO MarketFacilitator
Prof. MargaretMarket
Researcherand Academic
Mrs. JemimahFruity
Processors Ltd.
Mr. MovitRapid Transit
Traders
The starting place for this guide is adetailed participatory analysis of aselected market chain, followed by an
evaluation of critical points that need to beaddressed when designing an agroenterpriseproject to engage in the selected market chain.In cases when a service provider has alreadyselected a product or commodity to integrateinto an agroenterprise approach, this guidemaybe also be considered as the starting pointin the agroenterprise approach. For those whoare following CIAT’s Rural AgroenterpriseDevelopment Strategy, this guide is the fourth
step. At this point you will have completed thefollowing tasks:
From the work in Guide 2 you will have:
1. Selected a project area.2. Undertaken a biophysical and
socioeconomic analysis of your area.3. Defined the rules of engagement and
developed a vision for your community.4. Identified partners who will constitute the
agroenterprise working group.5. Identified farmer organizations interested in
developing agroenterprises.
2
Participatory Market Chain Analysis for Smallholders Producers
From the work in Guide 3 you will have:
1. Undertaken a rapid market opportunitiesidentification survey to identify a long list ofoptions that are or could be produced inyour area.
2. Used selection criteria to reduce manyproduct options to develop a short list.
3. Undertaken a production, financial, andmarket evaluation of short listed products.
4. Discussed feasible options with farmergroups.
5. Selected possible options to develop intoagroenterprise projects.
Based on this previous work, the reader willhave selected at least one product option forparticipatory market chain analysis. For serviceproviders with considerable marketingexperience more product options maybeconsidered, but it is recommended that firsttime users of this methodology test the processwith one option.
This guide is divided into 11 sections. Eachsection is designed to explain the reasonsbehind the methodology and steps that areuseful in the field. The sections in this guideinclude:
1. An Area-based Approach to Rural EnterpriseDevelopment.
2. Market Chains and Service Providers: BasicConcepts.
3. Basic Steps in Developing a CompetitiveMarket Chain Strategy.
4. Guidelines for Adapting the Process to LocalNeeds.
5. Selecting a Market Chain.6. Planning and Executing a Rapid Market
Survey.7. Identification of Key “Actors” in Market
Chains and Steps for Business Planning.8. Participatory Market Chain Analysis.9. Analysis of Critical Points in the Market
Chain.10. Negotiating a Strategy to Increase
Competitiveness.11. Monitoring of Strategies to Increase
Competitiveness: General Guidelines.
To facilitate better understanding, each sectionis structured in the following way:
· Guiding questions that introduce thethemes and ask the reader to reflect on theirexperience.
· Conceptual support relating to the themesintroduced.
· Appropriate tools to facilitate participativeprocesses of planning, analysis, and designof strategies to increase competitiveness withsmallholders and the other enterprise actorsin the market chain.
· Practical examples of experiences with thismethodology in Latin America related withthe theme of the section.
· A review at the end of the section thatrestates the main ideas.

THE THEORY
5
An Area-based Approach to Rural Enterprise Development
SECTION 1
An Area-based Approach to Rural EnterpriseDevelopment
Guiding questions
1. Why is being competitive in the marketplace more important today than 20 years ago?2. Why have rural development approaches oriented towards agricultural productivity failed to
improve rural family income?3. What are the elements of an area approach for rural enterprise development?4. Who are the local actors that participate in this approach?5. Why is the formation of a local group for inter-institutional work important for facilitating
processes of rural enterprise development?6. Why is diversification a useful option for small-scale farmers?
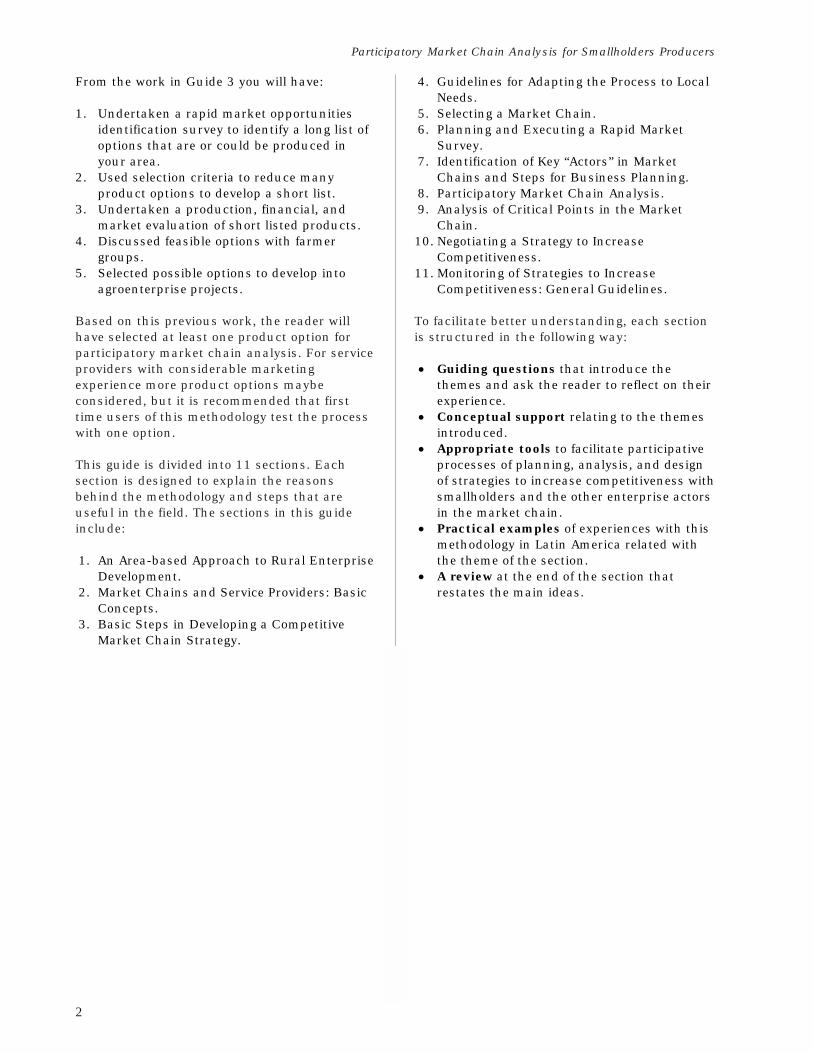
IntroductionTraditionally farmers have made decisions onwhat they should grow, what they should keepfor home consumption, and what they are ableto sell at the marketplace. In former times saleswould have centered on local markets and itwould have been rare for a farmer to venture farafield in search of new market opportunities orto consider developing new, higher valueproducts. This traditional form of agriculturestarts to change as communities and nationsbegin to modernize. Through processes of
urbanization, generally fostered byindustrialization, demand for food from urbandwellers becomes dependent upon moresophisticated arrangements that requireaggregation of farm produce, transportation,storage, wholesaling, processing, and retailing.As cities expand, food supply systems developinto increasingly longer and more complexmarket chains with many market channels andspecialization of roles in the market chainbased on product type, levels of added valueand market segmentation.
6
Participatory Market Chain Analysis for Smallholder Producers
In most cases marketing system work well,however problems can occur in the food supplysystem when there are shocks, such as severedrought, floods, major disease outbreaks or civilunrest which can disrupt market supplies. Inthe case of agricultural markets, problems alsooccur due to seasonal effects, which can beexacerbated by the lag time between farmersobserving a price trend or opportunity andbeing able to respond, after making decisions toplant, grow, and harvest a specific crop or torear animals. Consequently, changes in marketsupply conditions in one year can lead to majorswings in the supply and demand ofagricultural goods in subsequent years. This issometimes referred to as boom to bustmarketing cycles.
In an attempt to avoid problems in foodsupplies and reduce price volatility within theagricultural marketplace, governments in manycountries have taken it upon themselves toregulate the market, setting up supportmeasures such as subsidies, floor prices, andquotas for specific commodities in an attempt tomatch demand with supply.
In the 1940-1950’s period, many countries inthe developed and developing world managedfood systems through subsidies to supportagricultural production. During this timegovernments set prices, assisted withcooperative development, and invested in publicstorage and transport systems. This era ofgovernment support was good for farmers, asthe government shared the business risk andfarmers were able to plan production based ona known price. Unfortunately mostgovernments were unable to adapt to changingtimes. Procurement agencies became weigheddown by poor management which led touneconomic internal price structures. Overtime, farmers in developing countries wereunable to compete on international marketsand maintaining high domestic support pricesled to massive internal debts. When internaldebts could no longer be paid, the InternationalMonetary Fund (IMF) and World Bank wererequired to renegotiate loans. As a result, manydeveloping countries had to adopt reformpackages known as the Structural AdjustmentPrograms (SAPs).
The reform programs meant that governmentswithdrew from agricultural markets and in thelast 20 years, markets in most developingcountries have been increasingly liberalized.
Prices are no longer controlled by governmentsbut are subject to the laws of supply anddemand. The role of government has reducedto regulation while the operations of themarket are left to the devices of manyindividuals, companies, and associations thatmake up the private sector. For many small-scale farmers, their position has changed overthe past 40 years from being a free local agent,to a virtual government contractor and mostrecently to an agent that has to compete withcountries across the globe, even to supplylocal markets. Farmers regardless of size mustassume the full risk of doing business in thisnew trading environment many smallholdershave to competing against farmers who receivesubsidies.
A large percentage of the rural population inthe developing world therefore finds itselffacing a crossroads, on the one hand,traditional products are steadily losing valuein a rapidly globalizing market, and on theother hand, their natural resource base isbeing eroded due to pressures that placetoday’s food and income ahead of care fortomorrow’s resources. As a result, manyfamilies face an increasingly difficult future inagriculture and increasing numbers of peopleare abandoning the countryside in search ofalternative options in cities and even abroad,without achieving or being able to contributetowards dignified livelihoods for their familymembers.
Confronting this reality are governments,donors, and development organizations thataim to support rural development projectswith an increasing focus on raising incomes.Unfortunately, many development projectsand development practitioners only look atone part of the market chain, on-farmproduction, and these projects often havelimited effectiveness on livelihood issues.
Food Security versus IncomeSecurityA focus on production is often justified by theconcept that smallholder producers shouldfocus their efforts on having sufficient food toprovide for the family first and thereafter basetheir marketing strategies on surplusproduction. The ability of a community toavoid famine is clearly a sensible approachand food security is a basic tenet in thedevelopment pathway. Unfortunately, the foodsecurity approach has tended to dominate
7
An Area-based Approach to Rural Enterprise Development
agricultural interventions for the past30-40 years, meaning that developmentprojects, regardless of market access issues,have remained focused on increasingproduction of low value, staple food ratherthan taking on a broader concept of economicsecurity. This approach takes advantage of amore diversified approach to farm incomesbased on local opportunities, local assets, andthe competitive advantages of the communityin which the project is located. Majordevelopment projects are all too often basedon macro economic analyses that attempt toachieve growth through improving traditionalfood security cropping systems and, by doingso, subject many thousands of communitiesto a limited economic outlook, based on anational perspective. In this scenario,countries that are maize-based work on maizeproduction, countries that are rice-basedproduce more rice. The first result of foodsecurity is achieved, but the communities areoften unable to gain the skills to take on thesecond step of finding and developing othersupplementary income streams.
An alternative “market driven” approach, asoutlined in this series of guides, aims toempower rural communities with basicmarketing skills that will enhance their abilityto engage with markets in a more sustainableand stable manner. To achieve the shift from aproduction to a market orientation means thatfarmers need to be more organized. They mustacquire new skills in financial and businessmanagement and be able to respond tochanges in dynamic markets. Acquiring theseskills also means that service providers,involved in providing agricultural advice, alsoneed to gain new skills to assist localcommunities to plan and sell their goods andservices based on market demand, and towork on sustainability through marketsrather than on handouts.
The approach to rural agroenterprisedevelopment begins with participatoryprocesses to ensure the full involvement ofcommunity members. The conceptualthinking starts from the marketplace butplanning for the market is undertaken with aclear understanding of the needs, capacities,and desires of the clients, i.e., the ruralfamilies being targeted by a specificdevelopment intervention.
Working with a specific community, the serviceprovider1 can build a clear understanding oflocal marketing conditions and how best towork with farmers to resolve critical points in aparticular market chain. Developing thisknowledge with farmers is a key element indeveloping sustainable and competitiveagroenterprises. Before investing in a sector theservice provider and for example, a lead farmergroup, should evaluate the likely affects thatchanges such as (i) increasing productivity,(ii) improving quality, and (iii) increasingvolume of sale, will have on their target market.Our view is that projects designed withadequate market information can improve thesustainability of development efforts and thatincreased incomes are essential if ruralproducers are to complement the resourcesprovided by development actors.
Most importantly, by taking a market orenterprise approach, the end point in thedevelopment process changes from a short-termphysical goal, i.e., increasing the amount ofmaize that is produced by a farm family, to alonger term social goal in which people learnskills that will enable them to adapt continuallyin a changing environment, that is to be able toinnovate in the face of change.
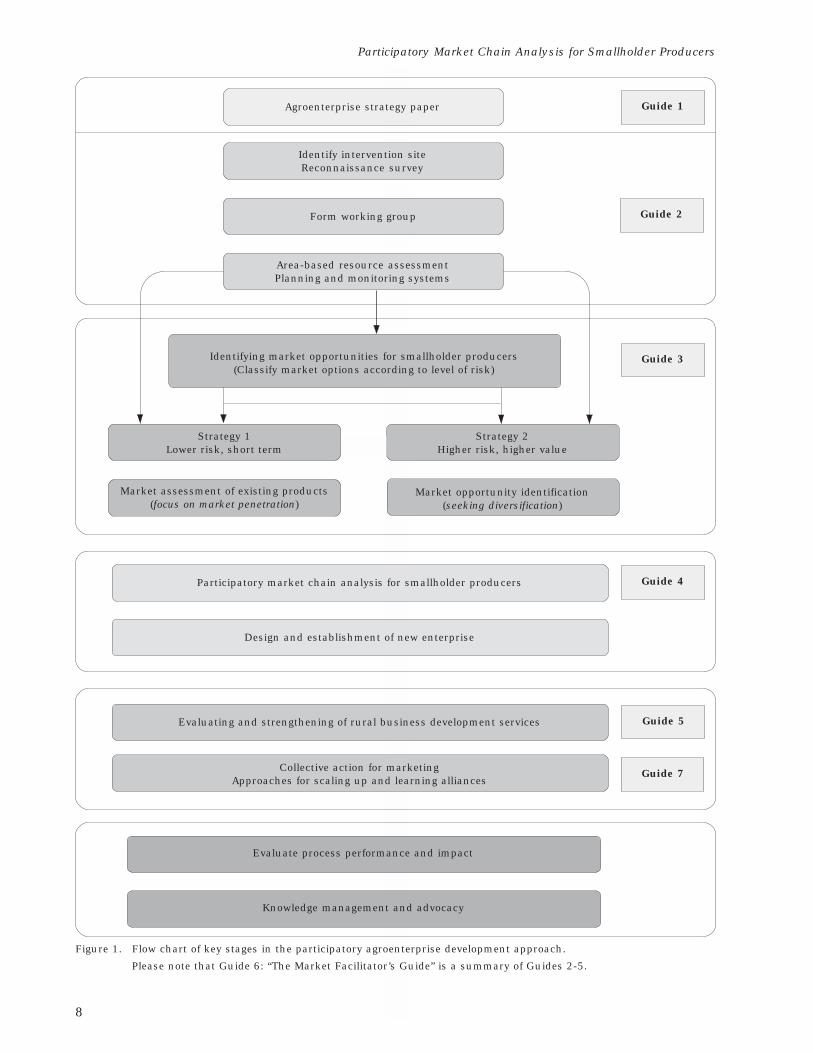
Area-based Approach to RuralEnterprise DevelopmentTo address these issues, CIAT’s RuralAgroenterprise Development Project (RAeD) hasdeveloped methodologies that aim to respond tothe entrepreneurial needs of rural developmentorganizations. The overall process is entitled“A Participatory and Area-based Approach toRural Agroenterprise Development” (Ferriset al., 2006), which has been developed andtested with partners in Latin America, Africa,and Southeast Asia. The approach comprises aseries of interconnected methodological stepsthat seek to improve local capacity in linkingfarmers to markets. Within each element, thereare sub-steps that guide the service providerand community towards agroenterpriseselection and market engagement: The keysteps in the process are shown in Figure 1.
1. Service provider in this context refers to the agencyor group of actors that take on the mandate or role ofcoordinating a development project or interventionsto support a community. The service provider couldalso be referred to as the “change agent”.
8
Participatory Market Chain Analysis for Smallholder Producers
Agroenterprise strategy paper
Identify intervention siteReconnaissance survey
Form working group
Area-based resource assessmentPlanning and monitoring systems
Identifying market opportunities for smallholder producers(Classify market options according to level of risk)
Strategy 1Lower risk, short term
Strategy 2Higher risk, higher value
Market opportunity identification(seeking diversification)
Market assessment of existing products(focus on market penetration)
Participatory market chain analysis for smallholder producers
Design and establishment of new enterprise
Evaluating and strengthening of rural business development services
Collective action for marketingApproaches for scaling up and learning alliances
Evaluate process performance and impact
Knowledge management and advocacy
Guide 1
Guide 2
Guide 3
Guide 4
Guide 5
Guide 7
Figure 1. Flow chart of key stages in the participatory agroenterprise development approach.
Please note that Guide 6: “The Market Facilitator’s Guide” is a summary of Guides 2-5.
9
An Area-based Approach to Rural Enterprise Development
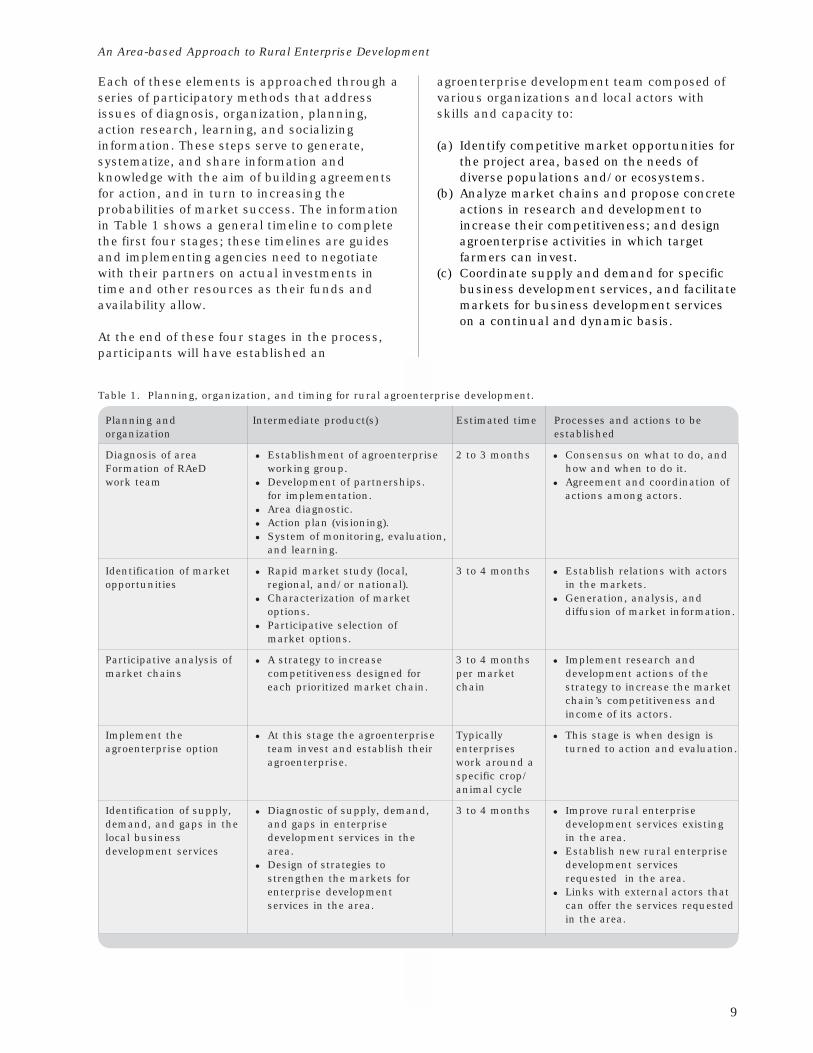
Each of these elements is approached through aseries of participatory methods that addressissues of diagnosis, organization, planning,action research, learning, and socializinginformation. These steps serve to generate,systematize, and share information andknowledge with the aim of building agreementsfor action, and in turn to increasing theprobabilities of market success. The informationin Table 1 shows a general timeline to completethe first four stages; these timelines are guidesand implementing agencies need to negotiatewith their partners on actual investments intime and other resources as their funds andavailability allow.
At the end of these four stages in the process,participants will have established an
agroenterprise development team composed ofvarious organizations and local actors withskills and capacity to:
(a) Identify competitive market opportunities forthe project area, based on the needs ofdiverse populations and/or ecosystems.
(b) Analyze market chains and propose concreteactions in research and development toincrease their competitiveness; and designagroenterprise activities in which targetfarmers can invest.
(c) Coordinate supply and demand for specificbusiness development services, and facilitatemarkets for business development serviceson a continual and dynamic basis.
Table 1. Planning, organization, and timing for rural agroenterprise development.
Planning and Intermediate product(s) Estimated time Processes and actions to beorganization established
Diagnosis of area · Establishment of agroenterprise 2 to 3 months · Consensus on what to do, andFormation of RAeD working group. how and when to do it.work team · Development of partnerships. · Agreement and coordination of
for implementation. actions among actors.
· Area diagnostic.
· Action plan (visioning).
· System of monitoring, evaluation,and learning.
Identification of market · Rapid market study (local, 3 to 4 months · Establish relations with actorsopportunities regional, and/or national). in the markets.
· Characterization of market · Generation, analysis, andoptions. diffusion of market information.
· Participative selection ofmarket options.
Participative analysis of · A strategy to increase 3 to 4 months · Implement research andmarket chains competitiveness designed for per market development actions of the
each prioritized market chain. chain strategy to increase the marketchain’s competitiveness andincome of its actors.
Implement the · At this stage the agroenterprise Typically · This stage is when design isagroenterprise option team invest and establish their enterprises turned to action and evaluation.
agroenterprise. work around aspecific crop/animal cycle
Identification of supply, · Diagnostic of supply, demand, 3 to 4 months · Improve rural enterprisedemand, and gaps in the and gaps in enterprise development services existinglocal business development services in the in the area.development services area. · Establish new rural enterprise
· Design of strategies to development servicesstrengthen the markets for requested in the area.enterprise development · Links with external actors thatservices in the area. can offer the services requested
in the area.
10
Participatory Market Chain Analysis for Smallholder Producers
Although the methodology for theagroenterprise development process has beenpresented as a linear set of events with fixedcontents and times, the process should not beconsidered a recipe. Each process of ruralenterprise development will be different, basedon the conditions of the area where theapproach is implemented, the capacities andinterest of the participants, and the needs thatemerge from this interface.
The methodology should be viewed as a set ofprinciples and skills that are developed throughcommunity action in a flexible and interactivemanner. The service providers should take careto encourage local adaptation and innovation.The service providers should also take time forperiodic evaluation of the process according tothe needs of the community, taking intoaccount their experiences and the context. It isimportant to document and systematize localexperiences so that information can besocialized and shared with others, and thuslead to the identification of general rules andlessons learned, that enrich and improve theapproach as well as the specific methods.
Agroenterprise as a Catalyst forEnabling Rural InnovationAlthough there is a growing consensus thatagroenterprise development is a robust processthat offers many small farm families in Africa,Latin America, and Southeast Asia a ladder outof poverty, there are a number of challengesthat must be met in order to make this happen.These include:
1. Building the skills base and social capital offarmers to enable them to gain a betterunderstanding of markets and how torespond to dynamic market needs.
2. Enabling small farmers to diversify theiroutputs so that their efforts can benefit fromhigh value market opportunities as wellsupport low value staple food systems andthus take advantage of market opportunitiesprofitably.
3. Providing farmers with basic methods andtools for group formation so that the manymillions of small-scale farmers can benefitfrom economies of scale where it isappropriate through collective actionprocesses that are locally owned.
4. Building the capacity of developmentoriented service providers to supportagroenterprise within a defined project area
and facilitate farmers’ access to localbusiness support services.
5. Transforming research from generators ofnew knowledge and technologies to serviceproviders for enterprise customers—government, NGOs, private sector, andfarmer organizations.
The ability of smallholders in developingcountries to address these issues is importantas they face an increasing imperative toincorporate themselves into the marketeconomy in order to generate cash income thatwill allow them to meet their basic needs, andthereby improve their livelihoods. Thesesmallholders have been accustomed primarilyto producing basic food staples for their ownsubsistence, with a little surplus to buyessentials. Many of the products that areproduced by small-scale farmers are of lowvalue and even the so-called “cash crops” haveexperienced severe price declines in their realterms over the past 2 to 3 decades. Theincreasingly harsh or competitive marketingreality within the agricultural sector is theresult of the trade liberalization process,globalization, improved production efficiency ofmedium to large-scale producers, andoversupply of the major commodity markets,
Among the options that smallholders have forconfronting this situation are:
· Improving the competitiveness of theproducts they grow.
· Diversification, by incorporating into theirproduction system higher value crops orlivestock that have an identified marketdemand.
· Adding value to and/or achieving economiesof scale through collective action for bothproduction and marketing of their traditionalcrops and livestock products.
· Entering new and more equitable tradingarrangements with larger buyers throughmechanisms such as fair trade and labelingbased on method of production such asorganic or by “mark of origin2” appellationsystems.
2. Mark of origin or “appellation” is a method used bywhich producers and processors to differentiate theirproduce and protect price premiums by legallyregistering their products such that no otherproducers or processors can this name, title or logo,unless they produce the product within a legallyrecognized area or territory and use a specific and ortraditional method of production and/or processing.
11
An Area-based Approach to Rural Enterprise Development
There are many simple ways in which farmerscan add value to their produce, such as use ofimproved uniform seed, bulking and gradingproducts, and in many cases by working inmarketing groups. Farmers can diversify theirproduction and use part of their land for highervalue crops and in some cases farmers can selltheir produce into higher value marketplaces.All of these methods aim to take advantage ofthe rapidly changing market environment beingled by urban consumers, who have moresophisticated market needs such as organicand fair-trade markets.
In order to take advantage of these potentialoptions, farmers, however, must be able tounderstand market opportunities and beingable to respond to changing market needs.Farmers must also provide products andservices at a price that is competitive with rivalsuppliers and there is increasing social
pressure to ensure that production systems areenvironmentally sustainable. To achieve desiredlevels of competitiveness, farmers and theirservice providers need to build strategies thatincorporate the following elements:
· A clear market orientation, producing theright product for the right buyer at the righttime and price.
· The establishment of production systemsthat makes efficient use of existing financial,human, and natural resources.
· The incorporation of necessary post-harvesthandling and processing techniques.
· Appropriate business and marketing skillsand organizational schemes which lead toeconomies of scale by reducing costs andincreasing marketable volumes of produce.
· Improved links among market chain actorsand flows of both market-based informationand new production technologies.
12
Participatory Market Chain Analysis for Smallholder Producers
SECTION 2
Market Chains and Service Providers:Basic Concepts
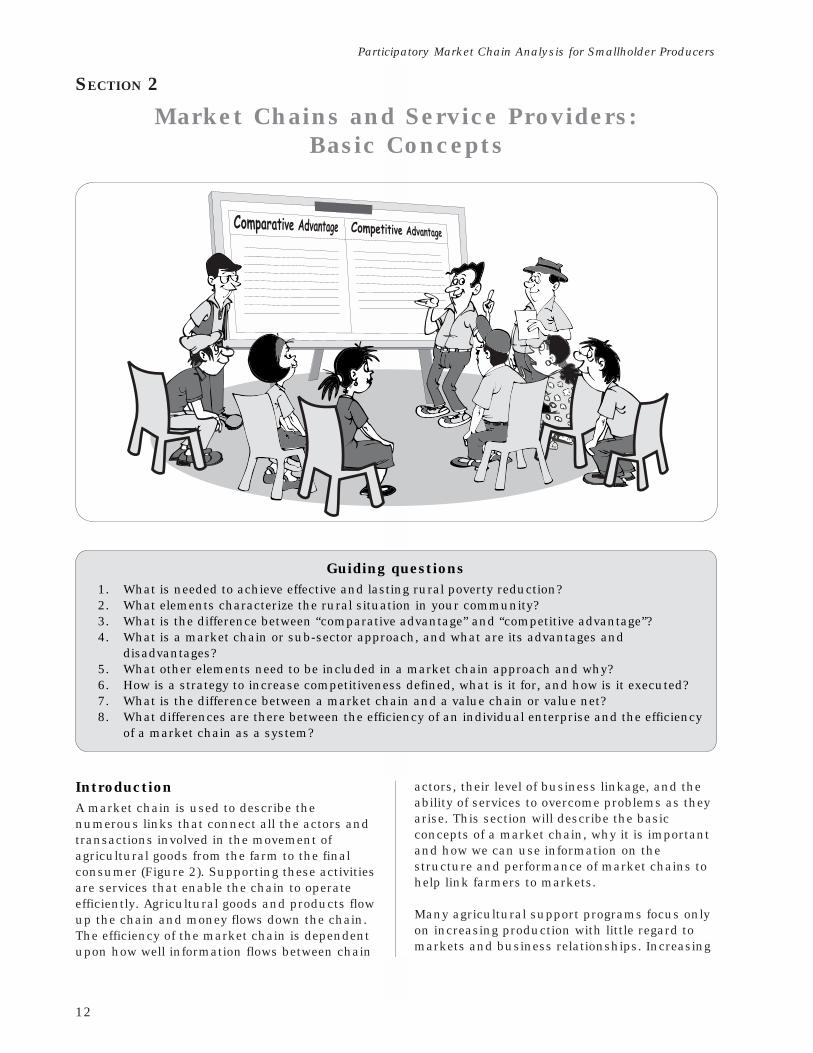
Guiding questions1. What is needed to achieve effective and lasting rural poverty reduction?2. What elements characterize the rural situation in your community?3. What is the difference between “comparative advantage” and “competitive advantage”?4. What is a market chain or sub-sector approach, and what are its advantages and
disadvantages?5. What other elements need to be included in a market chain approach and why?6. How is a strategy to increase competitiveness defined, what is it for, and how is it executed?7. What is the difference between a market chain and a value chain or value net?8. What differences are there between the efficiency of an individual enterprise and the efficiency
of a market chain as a system?
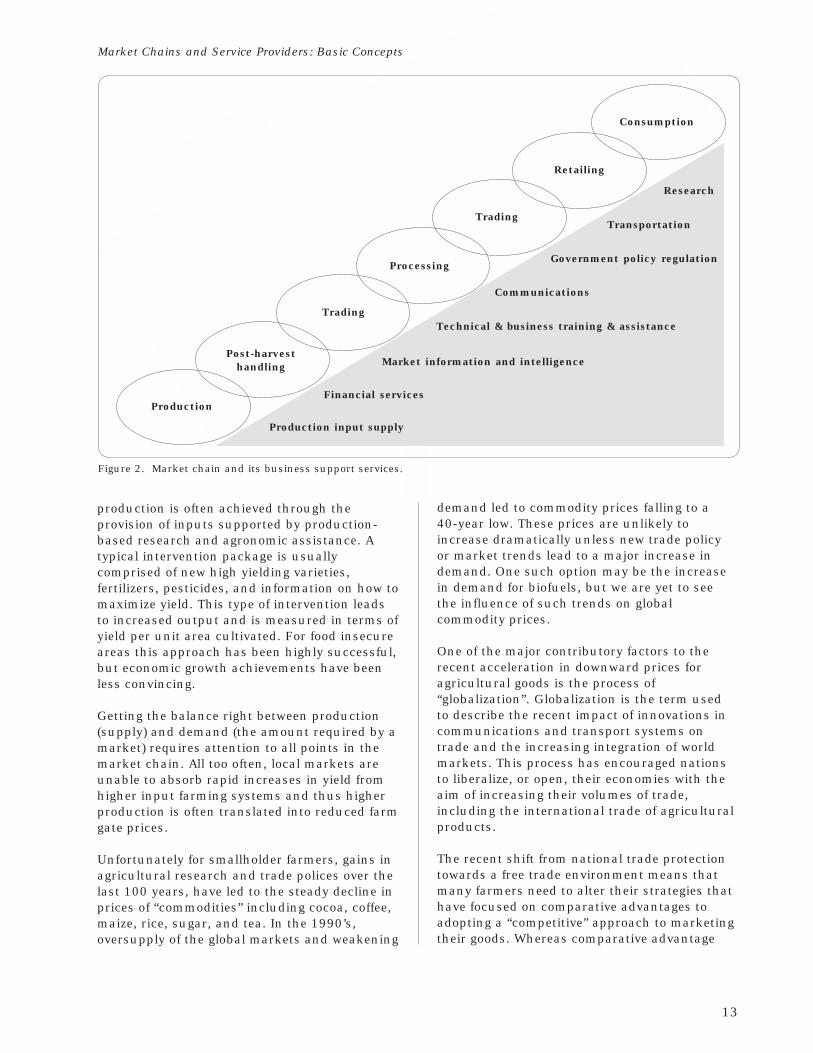
IntroductionA market chain is used to describe thenumerous links that connect all the actors andtransactions involved in the movement ofagricultural goods from the farm to the finalconsumer (Figure 2). Supporting these activitiesare services that enable the chain to operateefficiently. Agricultural goods and products flowup the chain and money flows down the chain.The efficiency of the market chain is dependentupon how well information flows between chain
actors, their level of business linkage, and theability of services to overcome problems as theyarise. This section will describe the basicconcepts of a market chain, why it is importantand how we can use information on thestructure and performance of market chains tohelp link farmers to markets.
Many agricultural support programs focus onlyon increasing production with little regard tomarkets and business relationships. Increasing
13
Market Chains and Service Providers: Basic Concepts
production is often achieved through theprovision of inputs supported by production-based research and agronomic assistance. Atypical intervention package is usuallycomprised of new high yielding varieties,fertilizers, pesticides, and information on how tomaximize yield. This type of intervention leadsto increased output and is measured in terms ofyield per unit area cultivated. For food insecureareas this approach has been highly successful,but economic growth achievements have beenless convincing.
Getting the balance right between production(supply) and demand (the amount required by amarket) requires attention to all points in themarket chain. All too often, local markets areunable to absorb rapid increases in yield fromhigher input farming systems and thus higherproduction is often translated into reduced farmgate prices.
Unfortunately for smallholder farmers, gains inagricultural research and trade polices over thelast 100 years, have led to the steady decline inprices of “commodities” including cocoa, coffee,maize, rice, sugar, and tea. In the 1990’s,oversupply of the global markets and weakening
Consumption
Retailing
Trading
Processing
Trading
Post-harvesthandling
Production
Research
Transportation
Government policy regulation
Communications
Technical & business training & assistance
Financial services
Market information and intelligence
Production input supply
Figure 2. Market chain and its business support services.
demand led to commodity prices falling to a40-year low. These prices are unlikely toincrease dramatically unless new trade policyor market trends lead to a major increase indemand. One such option may be the increasein demand for biofuels, but we are yet to seethe influence of such trends on globalcommodity prices.
One of the major contributory factors to therecent acceleration in downward prices foragricultural goods is the process of“globalization”. Globalization is the term usedto describe the recent impact of innovations incommunications and transport systems ontrade and the increasing integration of worldmarkets. This process has encouraged nationsto liberalize, or open, their economies with theaim of increasing their volumes of trade,including the international trade of agriculturalproducts.
The recent shift from national trade protectiontowards a free trade environment means thatmany farmers need to alter their strategies thathave focused on comparative advantages toadopting a “competitive” approach to marketingtheir goods. Whereas comparative advantage
14
Participatory Market Chain Analysis for Smallholder Producers
builds on access to local assets, such as climateand natural resources, competitive advantagesare achieved when farmers can manage theirresources to sell quality goods, at a profit andoffer their customers better value than rivalsuppliers. To be competitive in today’smarketplace, farmers in developing countriesneed to be better organized, at both theenterprise and market chain levels. Thesefarmers need access to new technologies andrelevant market information and must takeadvantage of their low labor and energy coststo offer consumers unbeatable produce value.Farmers also need to understand how theirmarkets function and how their enterprise canbe better positioned within a market chainto enhance their market performance.
To be successful in this environment, farmersand their service providers need to learn newskills and take a proactive approach in themarketplace. Understanding how an enterprisefits within a market chain allows theentrepreneur to make better business decisions,such as finding better market options,trustworthy buyers and learning to appreciatethe quality that is required by consumers at theend of the market chain.
All of this requires a sound understanding ofthe basics of markets and how to monitor andrespond to market changes. Thisresponsiveness applies to their dealings withinput markets, output markets, and servicemarkets. Input markets is the term used todescribe the physical products such as seeds,irrigation, fertilizer, chemicals, plastic tunnel
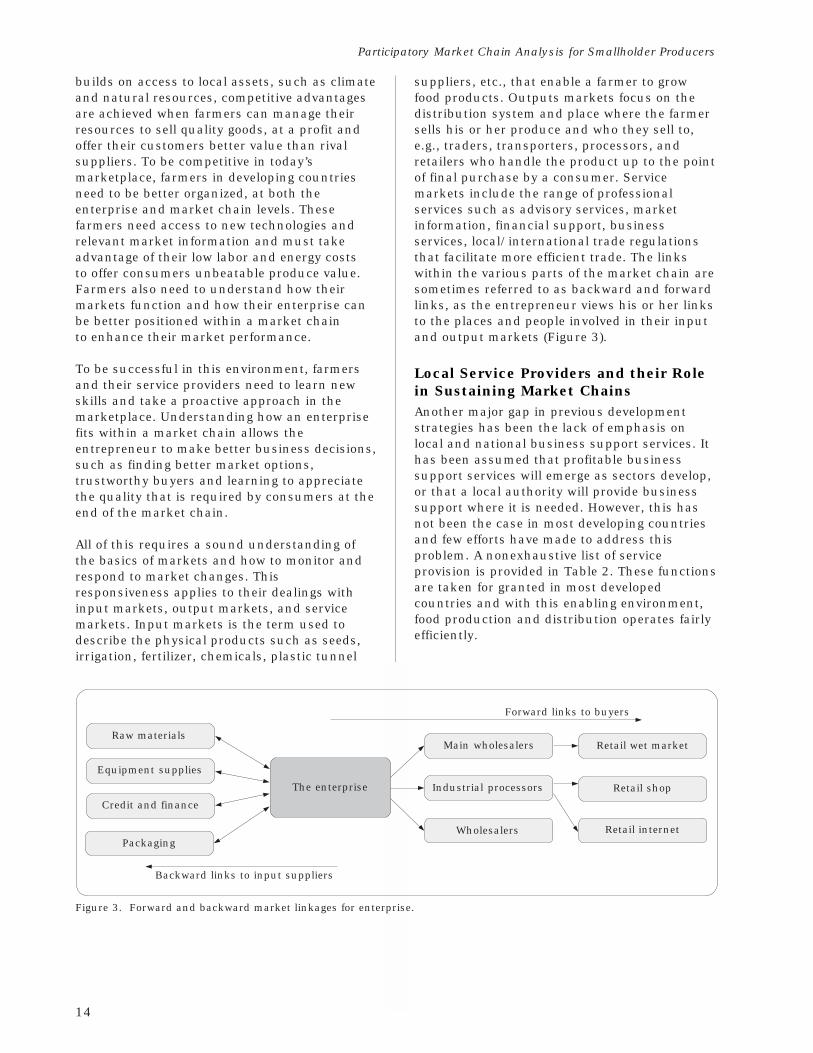
Raw materials
Equipment supplies
Credit and finance
The enterprise
Wholesalers
Industrial processors
Main wholesalers Retail wet market
Retail internet
Retail shop
Packaging
Figure 3. Forward and backward market linkages for enterprise.
Forward links to buyers
Backward links to input suppliers
suppliers, etc., that enable a farmer to growfood products. Outputs markets focus on thedistribution system and place where the farmersells his or her produce and who they sell to,e.g., traders, transporters, processors, andretailers who handle the product up to the pointof final purchase by a consumer. Servicemarkets include the range of professionalservices such as advisory services, marketinformation, financial support, businessservices, local/international trade regulationsthat facilitate more efficient trade. The linkswithin the various parts of the market chain aresometimes referred to as backward and forwardlinks, as the entrepreneur views his or her linksto the places and people involved in their inputand output markets (Figure 3).
Local Service Providers and their Rolein Sustaining Market ChainsAnother major gap in previous developmentstrategies has been the lack of emphasis onlocal and national business support services. Ithas been assumed that profitable businesssupport services will emerge as sectors develop,or that a local authority will provide businesssupport where it is needed. However, this hasnot been the case in most developing countriesand few efforts have made to address thisproblem. A nonexhaustive list of serviceprovision is provided in Table 2. These functionsare taken for granted in most developedcountries and with this enabling environment,food production and distribution operates fairlyefficiently.
15
Market Chains and Service Providers: Basic Concepts
The lack of investment in agriculturalbusiness development services (BDS) anddeteriorating market linkages has meant thatthe agricultural sector has stagnated. For thepoorest communities in developing countries,this has meant that their only source ofincome is very limited and explains the factthat the highest levels of poverty are found inrural areas.
The failure of governments to provide effectivesupport services to stimulate agriculture hasopened a major gap for alternative publiclyfunded nongovernment organizations (NGOs)to provide local communities with access to“not for profit” goods and services. Theprimary role of these organizations has beento build capacity in food security but this rolehas expanded to include a gambit of othersupport services including health, education,finance, and environment. It is clearlycheaper for developed nations to provideprophylactic services to produce food locallyrather than the extremely expensive andhighly distorting alternative of providing relieffood supplies.
Even though NGOs have proven to be aneffective service provider, there continues tobe debate about whether these external
agencies should be empowered at the expenseof local government capacity. To date thereality is that NGOs continue to grow,especially in the poorest areas, as they areoften considered to be more accountable andshow better value for investment thangovernment agencies.
This, however, leads to a second question, andthat is whether NGOs should provide serviceswith their own staff or whether they shouldbuild capacity in local services providers, bothpublic and private. Our contention is thatNGOs should place far greater emphasis onthe facilitation of services and in theirproduction and marketing projects. Theyshould facilitate local services rather than hirestaff to provide such services. If NGOs are toenable local communities to create their ownopportunities for income growth, they need tobe much more business oriented. NGOsshould work from a market led approach toproduction and they should build enterprisesustainability through strengthening of local,national, and regional support services. Asthis is a long-term endeavor, it is asimportant to strengthen the ability ofservice providers, as it is to build thecapacity of farmers to produce for markets.
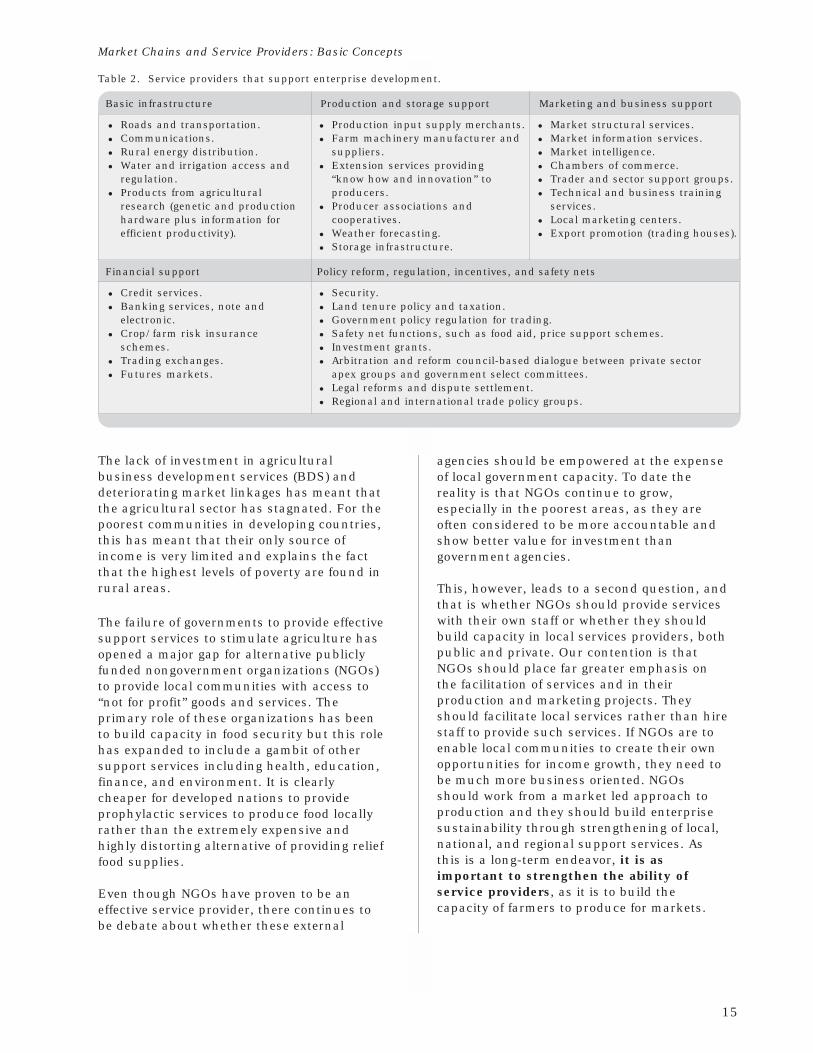
Table 2. Service providers that support enterprise development.
Basic infrastructure Production and storage support Marketing and business support
· Roads and transportation. · Production input supply merchants. · Market structural services.
· Communications. · Farm machinery manufacturer and · Market information services.
· Rural energy distribution. suppliers. · Market intelligence.
· Water and irrigation access and · Extension services providing · Chambers of commerce.regulation. “know how and innovation” to · Trader and sector support groups.
· Products from agricultural producers. · Technical and business trainingresearch (genetic and production · Producer associations and services.hardware plus information for cooperatives. · Local marketing centers.efficient productivity). · Weather forecasting. · Export promotion (trading houses).
· Storage infrastructure.
Financial support Policy reform, regulation, incentives, and safety nets
· Credit services. · Security.
· Banking services, note and · Land tenure policy and taxation.electronic. · Government policy regulation for trading.
· Crop/farm risk insurance · Safety net functions, such as food aid, price support schemes.schemes. · Investment grants.
· Trading exchanges. · Arbitration and reform council-based dialogue between private sector
· Futures markets. apex groups and government select committees.
· Legal reforms and dispute settlement.
· Regional and international trade policy groups.
16
Participatory Market Chain Analysis for Smallholder Producers
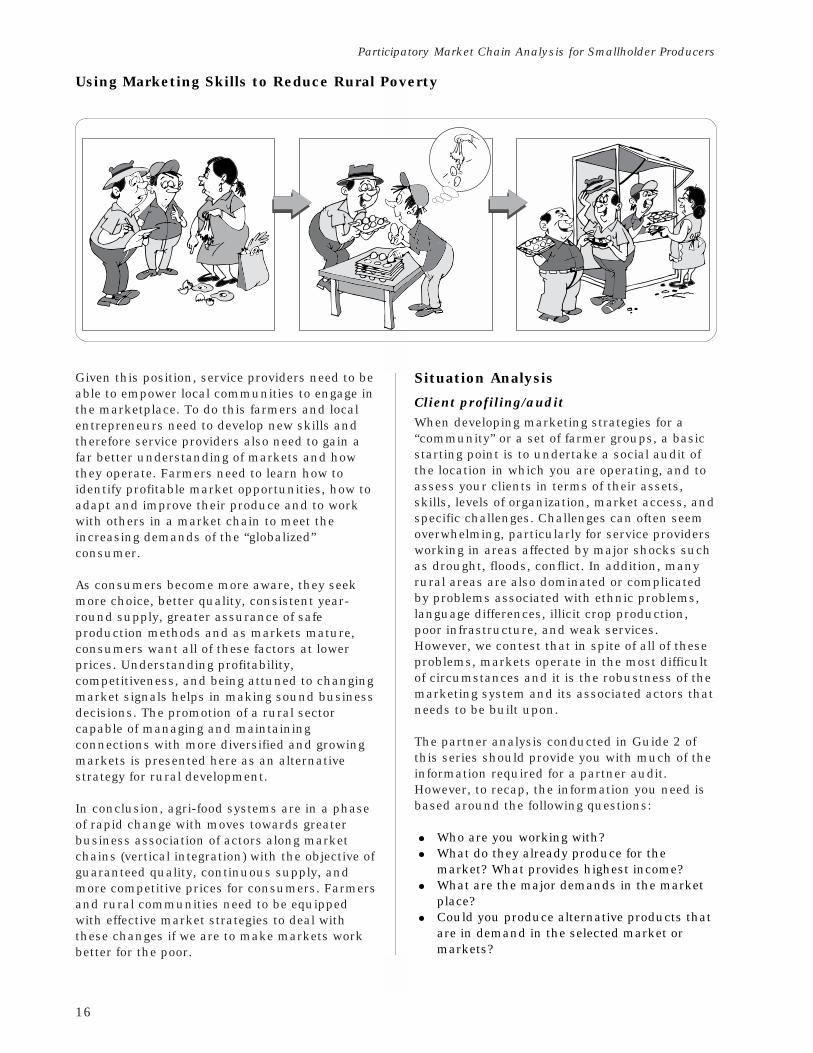
Using Marketing Skills to Reduce Rural Poverty
Given this position, service providers need to beable to empower local communities to engage inthe marketplace. To do this farmers and localentrepreneurs need to develop new skills andtherefore service providers also need to gain afar better understanding of markets and howthey operate. Farmers need to learn how toidentify profitable market opportunities, how toadapt and improve their produce and to workwith others in a market chain to meet theincreasing demands of the “globalized”consumer.
As consumers become more aware, they seekmore choice, better quality, consistent year-round supply, greater assurance of safeproduction methods and as markets mature,consumers want all of these factors at lowerprices. Understanding profitability,competitiveness, and being attuned to changingmarket signals helps in making sound businessdecisions. The promotion of a rural sectorcapable of managing and maintainingconnections with more diversified and growingmarkets is presented here as an alternativestrategy for rural development.
In conclusion, agri-food systems are in a phaseof rapid change with moves towards greaterbusiness association of actors along marketchains (vertical integration) with the objective ofguaranteed quality, continuous supply, andmore competitive prices for consumers. Farmersand rural communities need to be equippedwith effective market strategies to deal withthese changes if we are to make markets workbetter for the poor.
Situation Analysis
Client profiling/auditWhen developing marketing strategies for a“community” or a set of farmer groups, a basicstarting point is to undertake a social audit ofthe location in which you are operating, and toassess your clients in terms of their assets,skills, levels of organization, market access, andspecific challenges. Challenges can often seemoverwhelming, particularly for service providersworking in areas affected by major shocks suchas drought, floods, conflict. In addition, manyrural areas are also dominated or complicatedby problems associated with ethnic problems,language differences, illicit crop production,poor infrastructure, and weak services.However, we contest that in spite of all of theseproblems, markets operate in the most difficultof circumstances and it is the robustness of themarketing system and its associated actors thatneeds to be built upon.
The partner analysis conducted in Guide 2 ofthis series should provide you with much of theinformation required for a partner audit.However, to recap, the information you need isbased around the following questions:
· Who are you working with?
· What do they already produce for themarket? What provides highest income?
· What are the major demands in the marketplace?
· Could you produce alternative products thatare in demand in the selected market ormarkets?
17
Market Chains and Service Providers: Basic Concepts
· How well organized are the farmers,individuals, groups, or associations?
· What are their financial skills? Do they havefinancial assets?
· Does the group have reliable business/marketing skills?
· What level of risk are your clients able toadopt?
· Do local service providers have the skills tosupport promising enterprise options?
Issues of crop diversification have differentimplications for different smallholders andoptions for enterprise development are generallyrelated to key aspects including: (i) marketaccess, (ii) asset and skills base, and(iii) current level of commercialization.
To differentiate groups, we can use the followingdescriptors, based on a recent evaluation ofrural producer groups:
Rural World 1: “Globally competitive”:
· Part of consolidated market chains—highlevels of collaboration (vertical integration)with processors and retailers.
· Have access to financial services and marketinformation.
Rural World 2: “Shrinking middle”:
· Local orientation, generally supplyingnational markets, includes landowners,residual suppliers to wholesale or bulkcommodity markets.
· This group is generally under capitalized,currently suffering from declining terms oftrade3.
Rural World 3: “Fragile livelihoods”:
· Limited access to productive resources.
· Multi-occupational migrants straddling ruraland urban residencies.
· Unskilled and uneducated, dependent uponlow-waged, casual family labor.
· Generally not involved in global food andfiber production.
Most farm families that service providers workwith in the developing world are a combinationof Rural World 2 and Rural World 3. However,within a project area there maybe some RuralWorld 1 operators which may have specificskills that you can use in your marketingstrategies. For the Rural World 3 producers,asset levels are typically low but even indifficult circumstances, taking on more diversemarkets can also help to reduce overall risk.The asset and skills audit will enable aknowledgeable service provider to developappropriate marketing strategies that enablefarmers to start on a pathway towardsincorporating higher value crops andproduction systems into their market options.
Farmer perspectives and interventionoptionsUsing rapid methods to assess the marketingcapacity of a rural community will assistexternal agencies to decide upon specific typesof marketing interventions they can use once amarket chain has been studied in more detail.The following section gives insight into basicintervention options that can be developed afterthe analysis in this Guide.
1. Individual rather than collectivecompetitiveness: Given the incomeuncertainty faced by farmers in many ruralareas, it is not unexpected to find thatindividuals seek short-term solutions basedonly on their needs as opposed to developinginitiatives that promote competitivenessthrough collective action. In areas that haveexperienced managerial problems withcooperatives, there are low levels of trust. Asa starting point, initiatives that can buildcapacity to address market options as agroup is a first step in working towardseconomies of scale and building betterbusiness relations between actors.
2. Focus on enterprise competitiveness: Poorfarmers in the Rural World 3 category tendto focus on growing and selling produce withno marketing strategy. Introducingmarketing concepts will enable these clientsto understand their marketing options andwork towards being more competitive. This
3. Declining terms of trade relates to the changes inrelative value of specific products in the marketplaceover time. For many developing countries, producersof raw commodities face declining incomes as pricesfor a given unit of product falls on the world marketcompared to increasing prices received by producersof other goods. An example of relative priceschanges: farmers in developing countries sell coffeeinto the world market but face a steadily fallingbuyers price, whereas producers of Mercedes Benzcars sell their goods at increasing prices over time.Therefore over time due to the declining relativeprice of coffee, the coffee producer must continuallysell more coffee to be able to buy the same car.
18
Participatory Market Chain Analysis for Smallholder Producers
can be achieved through basic methods suchas product aggregation and grading. Moresophisticated marketing methods can lead toproduct differentiation4, marketsegmentation5, and the development ofspecific client niches.
3. Focus on strengthening market chains:The links in the market chain (production,post-harvest management, marketing, andbusiness development services) are oftendisjointed in agricultural markets,generating an inefficient flow of informationalong the market chain. This lack ofmarketing information and coordinationalong the market chain allows some actorsto exploit other market chain actors unfairly.This type of exploitation is usually markedby excessive profit, i.e. rents, being extractedby a particular market chain actor at onepoint in the market chain. This can beovercome if market chain actors along thechain initiate a process of strengtheningtheir business links to enjoy the benefits ofsystemic market chain improvements. Thisapproach, often referred to as value chaindevelopment, means that different actorshave shared goals and work to maximizetheir role in a specific market chain.
4. Strengthening managerial capacity:Many rural organizations are weak in terms
of their managerial skills. They have limitedcapacity to identify and analyze criticalpoints in their market chains; they do notfully appreciate the gains that can be madeby building relationships with others in themarket chain and are often unable to findstrategies or actions to improve theirbusiness opportunities as they do not havethe appropriate business skills to move intomore lucrative markets and also to increasetheir competitiveness. Many producercooperatives fall into this category. Usingmarket chain approaches is particularlyrelevant to these types of organizations, asmany can learn the necessary skills fromtheir business partners and through makinglinks to specialist business developmentservices. Some service providers specialize inthe area of business services andinterventions that cluster service providersto support large cooperatives or producerassociations can be a very effective means ofunlocking the potential of organizations thatare unable to growth their business.
5. Lack of business development services:As has been discussed, one of the majorproblems in poor rural areas is the lack ofbusiness development services to supportand sustain new initiatives in theagricultural sector. In the past most serviceproviders have focused on advice forincreased production. In many cases, serviceproviders do not have the right staff or skillsto offer such services to rural communities.In this case, steps in supporting this areamay require basic learning by the NGO first.Having acquired skills in businessmanagement, the service provider canundertake interventions that identifyexisting business support services with aview to strengthening them. In areas wheresuch services are lacking, efforts should bemade to build such services so as to lay thefoundations for more sustainable marketinginterventions by producer groups and localentrepreneurs.
4. Product differentiation: The act of taking a singleproduct and using product development methods tomake different types of product from an original,e.g., take a standard product such as a 50 kg ofunsorted, unwashed potatoes, and change this isinto (i) sorted washed potatoes, (ii) add value bysorting and packaging into 10 kg, 5 kg bags ofpotatoes according to use—baking potato, chippingpotato, boiling potato, add processing value bychanging potatoes into precooked frozen chips,crisps, starch for soups, etc.
5. Market segmentation: Generally related to dividingconsumers into sales groups to target a specificproduct (i.e., products which target children,families, rich people, middle income groups, etc.).
19
Basic Steps in Developing a Competitive Market Chain Strategy
SECTION 3
Basic Steps in Developing a CompetitiveMarket Chain Strategy
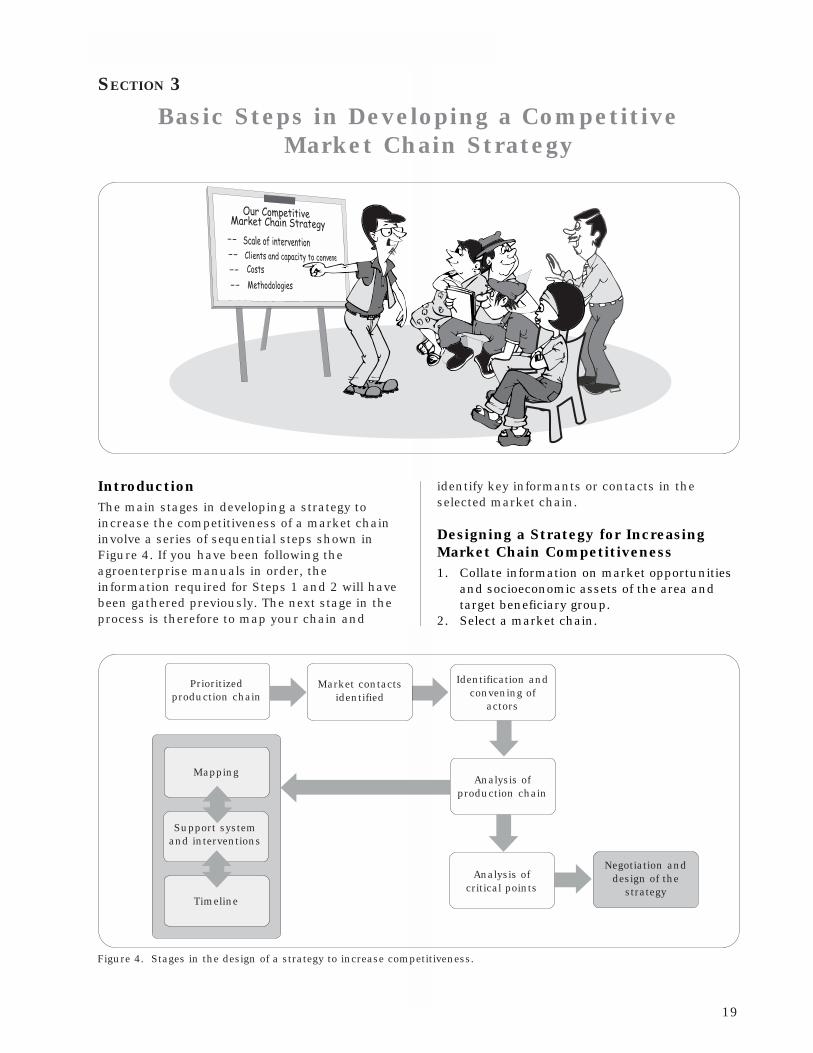
IntroductionThe main stages in developing a strategy toincrease the competitiveness of a market chaininvolve a series of sequential steps shown inFigure 4. If you have been following theagroenterprise manuals in order, theinformation required for Steps 1 and 2 will havebeen gathered previously. The next stage in theprocess is therefore to map your chain and
identify key informants or contacts in theselected market chain.
Designing a Strategy for IncreasingMarket Chain Competitiveness1. Collate information on market opportunities
and socioeconomic assets of the area andtarget beneficiary group.
2. Select a market chain.
Figure 4. Stages in the design of a strategy to increase competitiveness.
Mapping
Support systemand interventions
Timeline
Negotiation anddesign of the
strategy
Analysis ofproduction chain
Identification andconvening of
actors
Market contactsidentified
Prioritizedproduction chain
Analysis ofcritical points
20
Participatory Market Chain Analysis for Smallholder Producers
3. Identify contacts including the differentactors and interest groups that should formpart of the analysis.
4. Map the market chain with participationfrom representatives from the chain.
5. Evaluate the level of business organizationalong the market chain.
6. Review the services available to support theselected market chain.
7. Catalogue past interventions in the area withparticular attention to those which impactupon the selected chain and chain actors.
8. Analyze critical points for the development ofthe market chain.
9. Develop a long-term strategic vision basedon market prospects and possibilities forproduct and process innovation.
10. Around this vision, design a set of strategiesto resolve the critical points, takingadvantage of opportunities that contribute toan increased level of competitiveness for themarket chain and its actors.
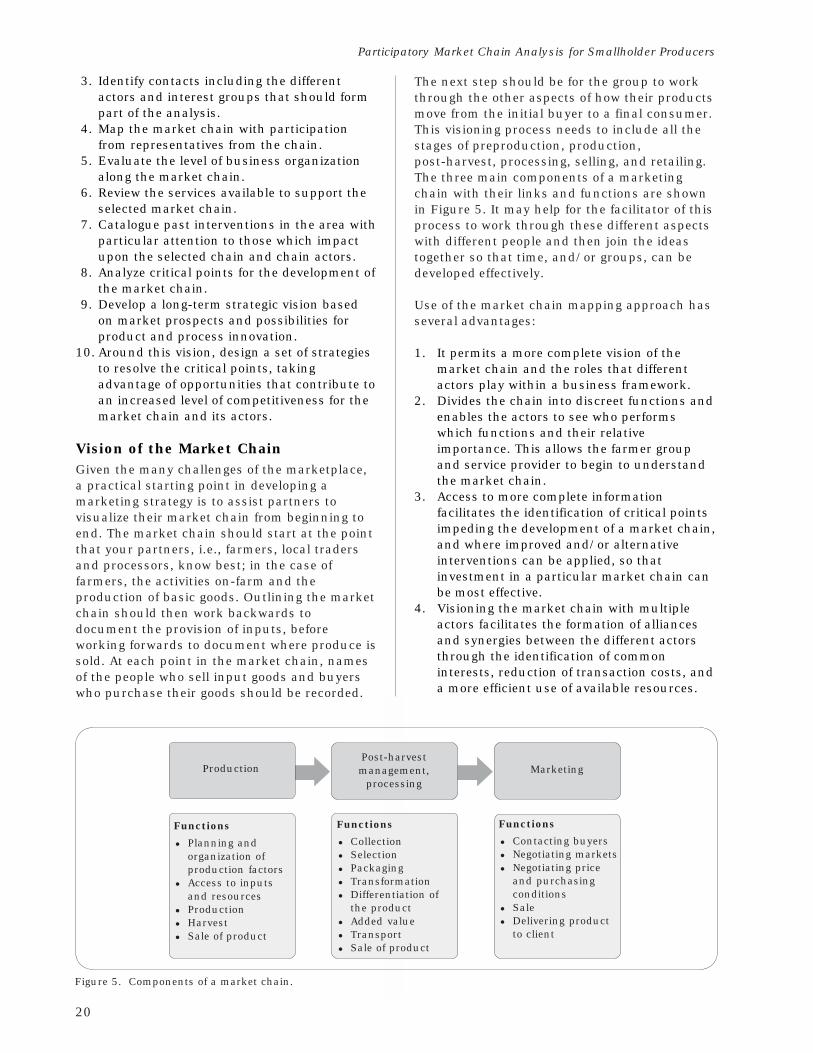
Vision of the Market ChainGiven the many challenges of the marketplace,a practical starting point in developing amarketing strategy is to assist partners tovisualize their market chain from beginning toend. The market chain should start at the pointthat your partners, i.e., farmers, local tradersand processors, know best; in the case offarmers, the activities on-farm and theproduction of basic goods. Outlining the marketchain should then work backwards todocument the provision of inputs, beforeworking forwards to document where produce issold. At each point in the market chain, namesof the people who sell input goods and buyerswho purchase their goods should be recorded.
Figure 5. Components of a market chain.
The next step should be for the group to workthrough the other aspects of how their productsmove from the initial buyer to a final consumer.This visioning process needs to include all thestages of preproduction, production,post-harvest, processing, selling, and retailing.The three main components of a marketingchain with their links and functions are shownin Figure 5. It may help for the facilitator of thisprocess to work through these different aspectswith different people and then join the ideastogether so that time, and/or groups, can bedeveloped effectively.
Use of the market chain mapping approach hasseveral advantages:
1. It permits a more complete vision of themarket chain and the roles that differentactors play within a business framework.
2. Divides the chain into discreet functions andenables the actors to see who performswhich functions and their relativeimportance. This allows the farmer groupand service provider to begin to understandthe market chain.
3. Access to more complete informationfacilitates the identification of critical pointsimpeding the development of a market chain,and where improved and/or alternativeinterventions can be applied, so thatinvestment in a particular market chain canbe most effective.
4. Visioning the market chain with multipleactors facilitates the formation of alliancesand synergies between the different actorsthrough the identification of commoninterests, reduction of transaction costs, anda more efficient use of available resources.
Marketing
Functions
· Planning andorganization ofproduction factors
· Access to inputsand resources
· Production
· Harvest
· Sale of product
Functions
· Collection
· Selection
· Packaging
· Transformation
· Differentiation ofthe product
· Added value
· Transport
· Sale of product
Functions
· Contacting buyers
· Negotiating markets
· Negotiating priceand purchasingconditions
· Sale
· Delivering productto client
Post-harvestmanagement,
processingProduction
21
Basic Steps in Developing a Competitive Market Chain Strategy
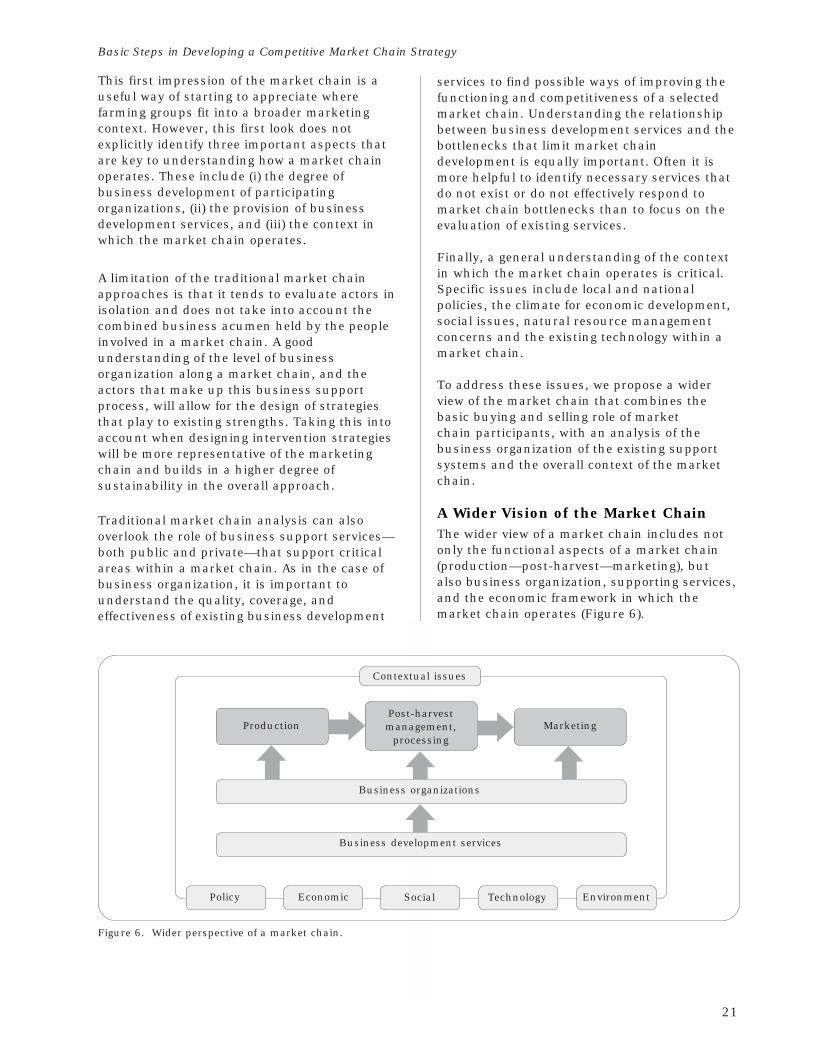
This first impression of the market chain is auseful way of starting to appreciate wherefarming groups fit into a broader marketingcontext. However, this first look does notexplicitly identify three important aspects thatare key to understanding how a market chainoperates. These include (i) the degree ofbusiness development of participatingorganizations, (ii) the provision of businessdevelopment services, and (iii) the context inwhich the market chain operates.
A limitation of the traditional market chainapproaches is that it tends to evaluate actors inisolation and does not take into account thecombined business acumen held by the peopleinvolved in a market chain. A goodunderstanding of the level of businessorganization along a market chain, and theactors that make up this business supportprocess, will allow for the design of strategiesthat play to existing strengths. Taking this intoaccount when designing intervention strategieswill be more representative of the marketingchain and builds in a higher degree ofsustainability in the overall approach.
Traditional market chain analysis can alsooverlook the role of business support services—both public and private—that support criticalareas within a market chain. As in the case ofbusiness organization, it is important tounderstand the quality, coverage, andeffectiveness of existing business development
services to find possible ways of improving thefunctioning and competitiveness of a selectedmarket chain. Understanding the relationshipbetween business development services and thebottlenecks that limit market chaindevelopment is equally important. Often it ismore helpful to identify necessary services thatdo not exist or do not effectively respond tomarket chain bottlenecks than to focus on theevaluation of existing services.
Finally, a general understanding of the contextin which the market chain operates is critical.Specific issues include local and nationalpolicies, the climate for economic development,social issues, natural resource managementconcerns and the existing technology within amarket chain.
To address these issues, we propose a widerview of the market chain that combines thebasic buying and selling role of marketchain participants, with an analysis of thebusiness organization of the existing supportsystems and the overall context of the marketchain.
A Wider Vision of the Market ChainThe wider view of a market chain includes notonly the functional aspects of a market chain(production—post-harvest—marketing), butalso business organization, supporting services,and the economic framework in which themarket chain operates (Figure 6).
Contextual issues
ProductionPost-harvestmanagement,
processingMarketing
Business organizations
Business development services
Policy Economic Social Technology Environment
Figure 6. Wider perspective of a market chain.
22
Participatory Market Chain Analysis for Smallholder Producers
By taking this broader view, this methodologyaims to fill gaps that have been identified intraditional market chain analysis and by doingso contribute to the principles which we believeare essential from the perspective of the poorrural producer. These principles include:
1. Identifying chain actors and theirrolesExperience has shown that the success orfailure of a market chain intervention dependsprincipally on the partnerships that are builtbetween actors and business organizations thatparticipate in a particular chain. This methodtherefore requires that market chain actors areclearly identified and existing relationsunderstood. This information enables theindividuals involved in the design of anenterprise to develop strategies built on trustand recognition rather than only focusing onopportunities and balance sheets.
2. Seeking equity in the market chainThorough analysis of the market chain anddeveloping strategies to increasecompetitiveness is not only a matter ofmaximizing profit; it should also take intoaccount a fair distribution of gains along themarket chain. As such the method seeks to
identify interventions that generate a moreequitable distribution of benefits, and alsoensures that rural smallholders, their familiesand their communities are involved in thedecision-making process. This aspect is crucialif the design of strategies is to achieve a majorgoal in poverty reduction through the provisionof benefits for producers, i.e., those with leastresources.
3. Designing strategiesThe use of the term “strategy” permits thedesign and implementation of a series ofcomplementary projects guided by commonand clear, demand-led objectives, and anoverall competitive vision for the marketingchain.
4. Focus on competitivenessThe methodology aims to generate a consensusbetween actors involved in the market chainwith the view of facilitating better managementof intervention resources by focusinginvestment on increasing the competitiveness ofa market chain.
CIAT’s Rural Agroenterprise DevelopmentProject has developed the following workingdefinitions of competitive strategies:
What is a marketing strategy to increase competitiveness?
A marketing strategy that increases competitiveness is a set of activities that are planned andcarried out with the active participation of diverse actors within a market chain, that sharecommon objectives, around which one or more business organizations and/or interest groups arelinked.
Why focus on a strategy to increase competitiveness?
A strategy to increase competitiveness seeks to strengthen or establish a market chain that hasbeen prioritized based on its market potential, sustainable production system, and capacity togenerate income and employment for a given rural population.
How is a strategy to increase competitiveness carried out?
A strategy to increase competitiveness is carried out through short-, medium-, and long-termresearch and development activities in production, post-harvest management and processing,marketing, business organization, and business development services, involving multiple actorsalong the market chain and is based on an analysis of the critical points which limit the marketchain’s competitiveness.
23
Basic Steps in Developing a Competitive Market Chain Strategy
Market Chains and InnovationPromoting processes of change or“innovation” is crucial when attempting toincrease competitiveness within marketchains. However, most opportunities forinnovation are situation specific, touching ona few or many of the links in a market chainincluding: input supply, production, post-harvest management, processing, marketing,business organization, and businessdevelopment services. Ideally innovationsraise the competitiveness for the marketchain as a system and thus capture addedvalue that can be shared by manyparticipants within the chain. It is more oftenthe case that innovations assist particularactors or groups of actors along the chainenabling them to capture additional value.The ability to capture added value at specificpoints in a market chain should not beconfused with the highly negative connotationassociated with the extraction of “rents” thatis often laid at the door of unscrupuloustraders. Typically this type of exploitivebehavior is symptomatic of highly inefficientmarket chains that are manipulated throughlocal political power. The approach presentedhere aims to identify and remove suchdistortions.
The use of innovation is particularlyimportant when attempting to differentiate aproduct in the market. The process of settinga product apart from the rest adds overallvalue by attracting consumers and thenbuilding product loyalty. Examples of thisapproach include the use of logos, brandingor labels that distinguish one product frommany similar types, or places emphasis onhow a product was produced, such asorganic, sustainable, or socially responsible,or via new presentations and the developmentof new products. These strategies are whereinnovation can play a major role in gaininglonger-term added value for a product in theface of competition.
Over the past decade, trading standards suchas fair trade and organic production havebeen developed as a means to gain highermarket prices for small-scale producers. Thelogic behind the organic strategy was thatmany small-scale producers are by default,often organic producers as they do not havethe necessary funds to apply chemicalfertilizers or pesticides to their crops. Thesefarmers can easily conform to organic
production and receive a premium price fortheir products. In this case, the innovation toincrease market chain competitiveness wasorganic certification.
However, as illustrated in the case of organiccacao (see Box 1), simply taking on an organic“certification” based on a minimal financialinvestment without also taking on new skills orknowledge, may not confer long lasting marketbenefits. This is because when basic marketstrategies show themselves to be successful,many other producers can replicate the same“competitive advantage”. In economists’ terms,the “barrier to entry” for this market innovationwas low and, thus, the innovation was easilyreplicable by others, leading to oversupply ofthe product.
Based on this experience with organiccacao, what lessons can we learn aboutinnovation and competitive advantages6?:1. If an innovation is easily replicable by other
producers, it tends to be quickly copied andthus loses the advantage and added gain.
2. Profitable innovations, no matter howcomplicated, are copied sooner or later andthus the initial profitability will decline withtime.
3. This indicates that processes of marketinformation and innovation should becontinuous and require periodic updatingand analysis to maintain competitiveadvantages and profitability.
Large multinational companies investconsiderable time and money in improving theirproducts and generating product brands todifferentiate their products from rival products.Branding is supported with large promotionalbudgets that can make certain products suchas Coca-cola, Kiwi fruit, Manchester United,“household” names. It is often the case that theexistence of an easily identifiable brand or labeltranslates into a more sustainable competitiveadvantage in the long term rather thaninnovations in systems of production andpost-harvest.
Does the power of branding have implicationsfor the processes of rural enterprisedevelopment that are being promotednowadays? New approaches to market-based
6. For wider discussion on this theme, consultKaplinsky (2000). See also Kaplinsky and Morris(2001).
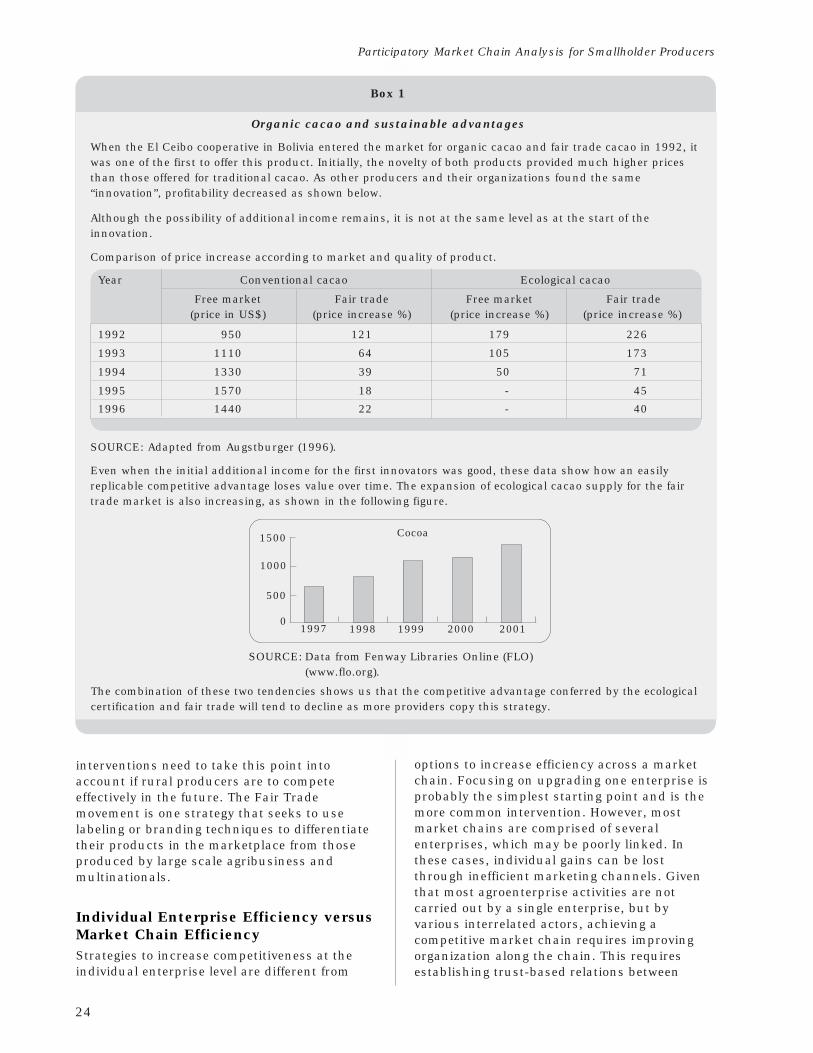
24
Participatory Market Chain Analysis for Smallholder Producers
Box 1
Organic cacao and sustainable advantages
When the El Ceibo cooperative in Bolivia entered the market for organic cacao and fair trade cacao in 1992, itwas one of the first to offer this product. Initially, the novelty of both products provided much higher pricesthan those offered for traditional cacao. As other producers and their organizations found the same“innovation”, profitability decreased as shown below.
Although the possibility of additional income remains, it is not at the same level as at the start of theinnovation.
SOURCE: Data from Fenway Libraries Online (FLO)(www.flo.org).
Even when the initial additional income for the first innovators was good, these data show how an easilyreplicable competitive advantage loses value over time. The expansion of ecological cacao supply for the fairtrade market is also increasing, as shown in the following figure.
Cocoa
1997 1998 1999 2000 2001
1500
1000
500
0
interventions need to take this point intoaccount if rural producers are to competeeffectively in the future. The Fair Trademovement is one strategy that seeks to uselabeling or branding techniques to differentiatetheir products in the marketplace from thoseproduced by large scale agribusiness andmultinationals.
Individual Enterprise Efficiency versusMarket Chain EfficiencyStrategies to increase competitiveness at theindividual enterprise level are different from
options to increase efficiency across a marketchain. Focusing on upgrading one enterprise isprobably the simplest starting point and is themore common intervention. However, mostmarket chains are comprised of severalenterprises, which may be poorly linked. Inthese cases, individual gains can be lostthrough inefficient marketing channels. Giventhat most agroenterprise activities are notcarried out by a single enterprise, but byvarious interrelated actors, achieving acompetitive market chain requires improvingorganization along the chain. This requiresestablishing trust-based relations between
The combination of these two tendencies shows us that the competitive advantage conferred by the ecologicalcertification and fair trade will tend to decline as more providers copy this strategy.
Comparison of price increase according to market and quality of product.
Year Conventional cacao Ecological cacao
Free market Fair trade Free market Fair trade(price in US$) (price increase %) (price increase %) (price increase %)
1992 950 121 179 226
1993 1110 64 105 173
1994 1330 39 50 71
1995 1570 18 - 45
1996 1440 22 - 40
SOURCE: Adapted from Augstburger (1996).
25
Basic Steps in Developing a Competitive Market Chain Strategy
potential rivals. This challenges the serviceprovider to facilitate a move beyond theconflictive competitive relations that operate inmany market chains. When taking a marketchain focus, there are no good or bad actors,the approach should focus on a “systemic” levelof efficiency that seeks to benefit all theparticipants.
Raising Competitiveness throughMarket Chain Quality AssuranceAnother important issue in sustaining marketperformance is product quality. For productstraded formally, e.g., internationally or throughmajor international supermarkets, products willonly be accepted if they meet strict food safetyprotocols such as ISO, HACCP7, andEUREPGAP8. These protocols are conductedthroughout the market chain and therefore it isvital that all actors within a market chainmaintain these stringent quality procedures ifthey are to avoid losing income or have theirproduce downgraded. For consumers this markof quality gives them greater confidence inbuying a product that has been approved by amarket chain scheme. Measures such asHACCP requires that actors along marketchains work in a more coordinated manner andby doing so, gain a greater market share.
EUROTRACE is another legislative approachbeing used by the European Union to trackquality from point of sale back to point ofproduction. Retailers use this quality-basedprocess as part of a market chain inventoryprocess. EUROTRACE however offers anotheropportunity to differentiate a product on themarket, as it provides an avenue to reduce therisk taken by a buyer when purchasing frommultiple sources across the globe. Once againthe emphasis is on recognition of roles andlinkages between multiple actors within amarket chain and this requires a high degree ofcoordination to be successful.
Raising Competitiveness through Markof Origin (Appellation/Labeling)In France, the government has invested largesums of money in promoting the certification oforigin for agricultural products, known as“Appellation of Origin” Certification: First usedin 1935 for validating wine vintages, the AOChas expanded to include a range of agricultural
products including dairy products, farm-raisedpoultry and olives.
While it does not guarantee quality, AOC doesimpart important knowledge to consumers—they can follow regions with good crop years,learn reputable producers and buy accordingly.
The AOC certificates essentially link theproduct with its locale and manner ofproduction in such a way that it is easilydistinguishable from products having similarcharacteristics produced by industrial firms. Anexample of this type of labeling by originincludes the exclusive drink of the rich,“Champagne”, an otherwise unremarkablesparkling white wine.
According to the mark of origin procedure, thelabel “Champagne” can only be applied to wineproduced from the region of Champagne,according to traditional methods. Similarsparkling white wines that are grown elsewhereand sold at a fraction of the price of realChampagne, is now labeled “Method deChampagne”, to disassociate it from the originalproduct.
The French government’s Institute ofDenomination of Origin expects eventually toachieve coverage of 20% of French productssold. Currently, France sells US$18 billionproducts with a certificate of denomination oforigin (Becker, 2003). This method is now beingapplied to high value traditional products inother countries such as high quality coffeeorigins and in many developing countries thisapproach provides a lucrative opportunity for alimited number of producers.
Market Chains, Supply Chains, andValue Chains9
The terms production chains, supply chains,market chains, and value chains are often usedinterchangeably, but there are some importantdifferences. In its simplest definition, the termsproduction chain, supply chain, market chainare synonyms used to describe all participantsinvolved in an economic activity which usesinputs and services to enable a product to bemade and delivered to a final consumer. A valuechain is understood as a strategic networkbetween a number of independent businessorganizations. According to Hobbs et al.
7. Hazard quality assurance at critical point.8. For more information, see www.eurep.org 9. For more information, consult Hobbs et al. (2000).
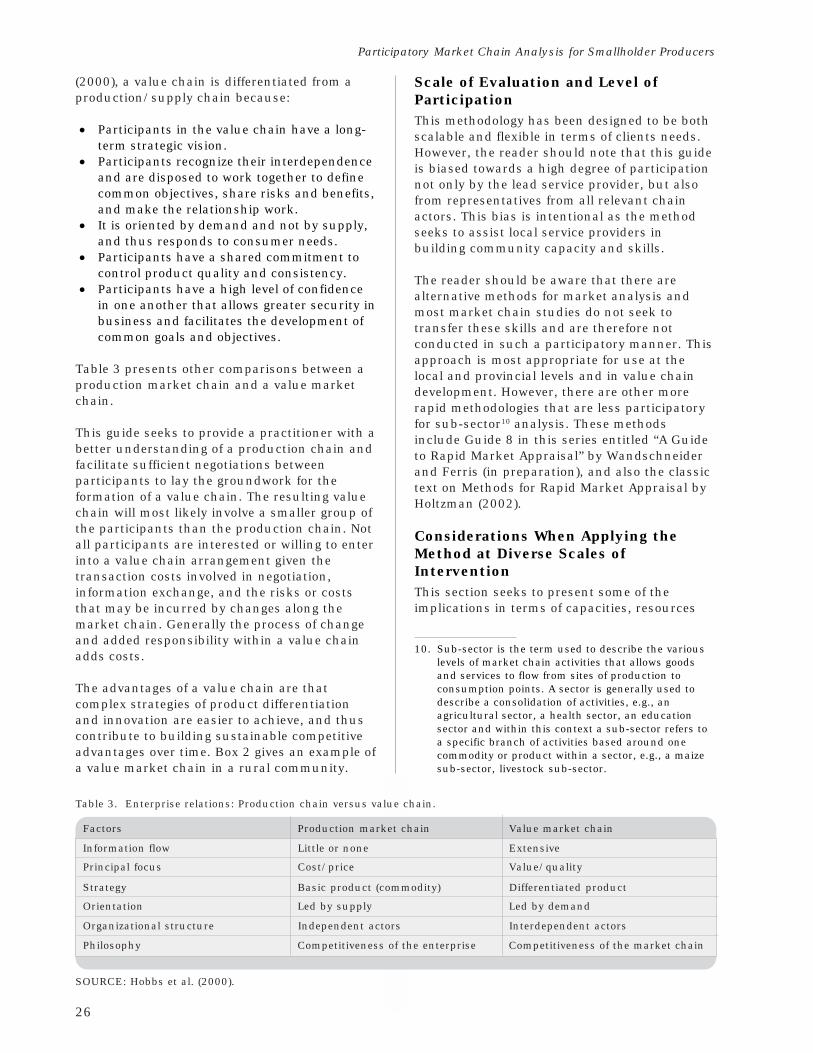
26
Participatory Market Chain Analysis for Smallholder Producers
(2000), a value chain is differentiated from aproduction/supply chain because:
· Participants in the value chain have a long-term strategic vision.
· Participants recognize their interdependenceand are disposed to work together to definecommon objectives, share risks and benefits,and make the relationship work.
· It is oriented by demand and not by supply,and thus responds to consumer needs.
· Participants have a shared commitment tocontrol product quality and consistency.
· Participants have a high level of confidencein one another that allows greater security inbusiness and facilitates the development ofcommon goals and objectives.
Table 3 presents other comparisons between aproduction market chain and a value marketchain.
This guide seeks to provide a practitioner with abetter understanding of a production chain andfacilitate sufficient negotiations betweenparticipants to lay the groundwork for theformation of a value chain. The resulting valuechain will most likely involve a smaller group ofthe participants than the production chain. Notall participants are interested or willing to enterinto a value chain arrangement given thetransaction costs involved in negotiation,information exchange, and the risks or coststhat may be incurred by changes along themarket chain. Generally the process of changeand added responsibility within a value chainadds costs.
The advantages of a value chain are thatcomplex strategies of product differentiationand innovation are easier to achieve, and thuscontribute to building sustainable competitiveadvantages over time. Box 2 gives an example ofa value market chain in a rural community.
Table 3. Enterprise relations: Production chain versus value chain.
Factors Production market chain Value market chain
Information flow Little or none Extensive
Principal focus Cost/price Value/quality
Strategy Basic product (commodity) Differentiated product
Orientation Led by supply Led by demand
Organizational structure Independent actors Interdependent actors
Philosophy Competitiveness of the enterprise Competitiveness of the market chain
SOURCE: Hobbs et al. (2000).
Scale of Evaluation and Level ofParticipationThis methodology has been designed to be bothscalable and flexible in terms of clients needs.However, the reader should note that this guideis biased towards a high degree of participationnot only by the lead service provider, but alsofrom representatives from all relevant chainactors. This bias is intentional as the methodseeks to assist local service providers inbuilding community capacity and skills.
The reader should be aware that there arealternative methods for market analysis andmost market chain studies do not seek totransfer these skills and are therefore notconducted in such a participatory manner. Thisapproach is most appropriate for use at thelocal and provincial levels and in value chaindevelopment. However, there are other morerapid methodologies that are less participatoryfor sub-sector10 analysis. These methodsinclude Guide 8 in this series entitled “A Guideto Rapid Market Appraisal” by Wandschneiderand Ferris (in preparation), and also the classictext on Methods for Rapid Market Appraisal byHoltzman (2002).
Considerations When Applying theMethod at Diverse Scales ofInterventionThis section seeks to present some of theimplications in terms of capacities, resources
10. Sub-sector is the term used to describe the variouslevels of market chain activities that allows goodsand services to flow from sites of production toconsumption points. A sector is generally used todescribe a consolidation of activities, e.g., anagricultural sector, a health sector, an educationsector and within this context a sub-sector refers toa specific branch of activities based around onecommodity or product within a sector, e.g., a maizesub-sector, livestock sub-sector.
27
Basic Steps in Developing a Competitive Market Chain Strategy
required, and methodologies for this approachdepending on the scale of analysis. The term“scale” refers to the geographic coverage inwhich the market works. This guide works atthree scales (local, provincial, and national) thatcan be defined as:
Box 2
Example of a value market chain: “Las Brisas,” Santa Cruz de Turrialba
When the cheese factory Las Brisas began activities over 10 years ago, it functioned like all the other plantsin the cheese-making cluster of Santa Cruz de Turrialba in Costa Rica. The company had unstable relationswith suppliers and buyers. As the sector evolved and became more competitive, Las Brisas developedstrategies to move from being just one more player in the production chain to carving out its own value chain.
This search led to the establishment of trust-based relationships with both suppliers and buyers. On the milkproduction input market side, La Brisas made its biggest milk provider a new partner in the business, andthus guaranteed 70% of its daily consumption.
On the output market side, Las Brisas pursued two market strategies. First, it developed contacts with one ofits clients—a biscuit factory—to produce a special cheese for manufacturing biscuits. The two businessesjointly obtained support from the University of Costa Rica for specific research on the best type of cheese forthe biscuits. Through this product development process, Las Brisas was able to enter a new market, in whichno competition existed, as well as assisting the biscuit factory to expand production and sales. Secondly,Las Brisas consolidated relations with an important chain of supermarkets in San José, the country’s capital,through the application of a methodical quality control process for its own brand. This relationship hasresulted in joint promotion and marketing strategies as well as the development and testing of new productsbased on consumer demands detected by the supermarket.
What are the results has Las Brisas achieved through its value chain strategy?
1. The quality of its products is recognized as being the best in the zone and, therefore, have highacceptance in the market.
2. Las Brisas is the only business from the cheese cluster in Santa Cruz that sells consistently directly tosupermarkets in San José. In 2001, a promotion of cream was so successful that it contracted additionalproduction with other plants of Santa Cruz, but under its supervision and brand.
3. Las Brisas suffers less than other businesses during times of milk shortage.
In summary, constituting a value market chain has given Las Brisas an important competitive edge oversimilar plants that share the same comparative advantages.
SOURCE: Personal interviews (November 2002).
LocalRefers to a scale ranging from a village to acommunity/municipality. This scale is usefulwhen seeking to work closely with processes ofcommunity development and communitymanagement of natural resources.
Provincial/DistrictIncludes more than a municipality and canreach as far as a province or department/district. This scale is useful for working withmore geographically dispersed agroenterprisemarket chains, or those with more complexinteraction, such as clusters or local agri-foodsystems.
NationalFocuses on one single market chain at thenational level and presents advantages when the
28
Participatory Market Chain Analysis for Smallholder Producers
objective of the exercise is to formulate policiesor plans in medium- or long-term to promotenational competitiveness in a given product.
As the scale shifts from local, through provincialto national, there are several changes that needto be considered. Some of the likely changes andquestions that should be answered beforestarting are listed below:
Clients and capacity to conveneWho are the intended beneficiaries? How are theyorganized? Who are the key actors of the marketchain and what are their roles? How will benefitsfrom this process be shared betweenbeneficiaries and the wider community? Whomshould we convene for work at the scaleproposed? Do we have the capacity to bring theseactors together?
Your project design should have clarity in regardto these issues before any work is undertaken.Defining the client is probably the most importantdecision in the process.
CostsWhat can we achieve with the available budget?The definition of viable objectives with theavailable resources is important and can haveimportant implications for the scale at which wework. It is better to work at a smaller scale ratherthan attempting to work at a level where resourcesare insufficient to guarantee results.
Methodologies and level of detailHow do we choose an adequate basket ofmethodologies for the scale at which we wish towork? Methods that work well at a local scale areprobably less effective at a national scale. Thisconsideration is related to the degree ofparticipation that can be achieved at the differentscales, level of detail, information requirements,and costs. What is the key information that wehave to collect and analyze? Collecting additionalinformation, however interesting it may be,implies more analysis and additional costs.
Management, negotiation, andimplementation capacityWhat implications does the chosen scale have interms of management and negotiation withimportant decision makers? How strong will ournegotiating position be in relation to key decisionmakers in the market chain as we expand thearea of coverage? Can we reasonably implementa strategy at this scale?
Representation and level of participationWhat are the considerations for guaranteeingactive participation and adequaterepresentation of all actors and interestsinvolved in the market chain? As we increasethe geographical scope, the direct participationof our target beneficiaries is likely to fall, andthese factors need to be discussed and resolved.
Recognition of actorsHow do we assure that we hear the needs of allactors in the market chain? This point requiresspecial care both with the market chain’sweaker actors (i.e., the poor, ethnic minorities,women, among others) and those considerednegative (i.e., traders) whose ideas tend not tobe taken into account.
Differentiated strategiesHow do we guarantee that the final strategyincludes differentiated solutions according tothe needs of the diverse actors? Allagroenterprise market chains includeheterogeneous actors, and thus demanddifferentiated solutions according to their needsinstead of “one size fits all” strategy.
Potential for impactWhat is the potential impact of actions at thechosen scale in terms of number ofbeneficiaries, economic development, naturalresource management, social and genderequity, impact on class relations, or others?
Table 4 summarizes some of the considerationsof scale in relation to the themes previouslydefined.
Observations on the Use ofParticipatory MethodsThis guide is based on participatory methodsadapted from the school of ParticipativeLearning and Action (PLA). These methods,which include focus groups, mapping,visualizations, social dramas, and other formsof facilitated reflection, seek to prioritize notonly documented results, but also the processof application. Although a concrete result isgenerated at each stage in the process, i.e., amap, a matrix, a table, etc., these products arenot the central purpose of the exercise. Of equalimportance and benefit to the group members isthe time and space they have invested inanalysis and reflection around themethodological tool. The discussions and
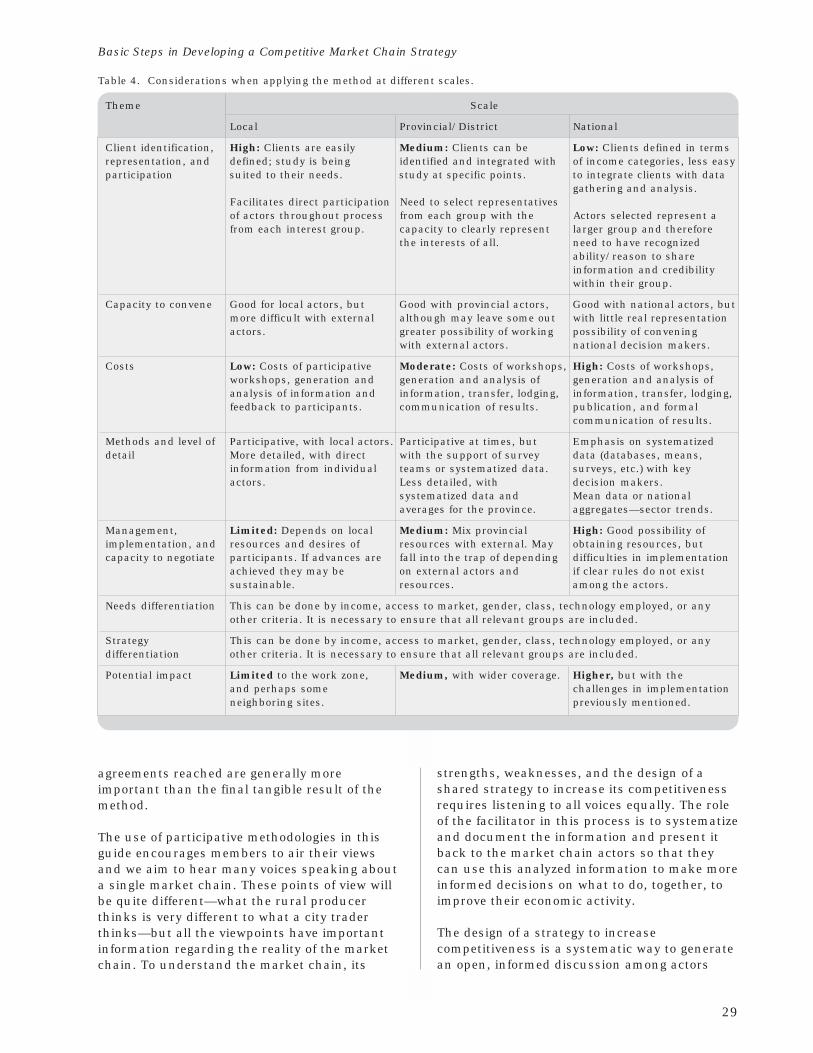
29
Basic Steps in Developing a Competitive Market Chain Strategy
Table 4. Considerations when applying the method at different scales.
Theme Scale
Local Provincial/District National
Client identification, High: Clients are easily Medium: Clients can be Low: Clients defined in termsrepresentation, and defined; study is being identified and integrated with of income categories, less easyparticipation suited to their needs. study at specific points. to integrate clients with data
gathering and analysis.Facilitates direct participation Need to select representativesof actors throughout process from each group with the Actors selected represent afrom each interest group. capacity to clearly represent larger group and therefore
the interests of all. need to have recognizedability/reason to shareinformation and credibilitywithin their group.
Capacity to convene Good for local actors, but Good with provincial actors, Good with national actors, butmore difficult with external although may leave some out with little real representationactors. greater possibility of working possibility of convening
with external actors. national decision makers.
Costs Low: Costs of participative Moderate: Costs of workshops, High: Costs of workshops,workshops, generation and generation and analysis of generation and analysis ofanalysis of information and information, transfer, lodging, information, transfer, lodging,feedback to participants. communication of results. publication, and formal
communication of results.
Methods and level of Participative, with local actors. Participative at times, but Emphasis on systematizeddetail More detailed, with direct with the support of survey data (databases, means,
information from individual teams or systematized data. surveys, etc.) with keyactors. Less detailed, with decision makers.
systematized data and Mean data or nationalaverages for the province. aggregates—sector trends.
Management, Limited: Depends on local Medium: Mix provincial High: Good possibility ofimplementation, and resources and desires of resources with external. May obtaining resources, butcapacity to negotiate participants. If advances are fall into the trap of depending difficulties in implementation
achieved they may be on external actors and if clear rules do not existsustainable. resources. among the actors.
Needs differentiation This can be done by income, access to market, gender, class, technology employed, or anyother criteria. It is necessary to ensure that all relevant groups are included.
Strategy This can be done by income, access to market, gender, class, technology employed, or anydifferentiation other criteria. It is necessary to ensure that all relevant groups are included.
Potential impact Limited to the work zone, Medium, with wider coverage. Higher, but with theand perhaps some challenges in implementationneighboring sites. previously mentioned.
agreements reached are generally moreimportant than the final tangible result of themethod.
The use of participative methodologies in thisguide encourages members to air their viewsand we aim to hear many voices speaking abouta single market chain. These points of view willbe quite different—what the rural producerthinks is very different to what a city traderthinks—but all the viewpoints have importantinformation regarding the reality of the marketchain. To understand the market chain, its
strengths, weaknesses, and the design of ashared strategy to increase its competitivenessrequires listening to all voices equally. The roleof the facilitator in this process is to systematizeand document the information and present itback to the market chain actors so that theycan use this analyzed information to make moreinformed decisions on what to do, together, toimprove their economic activity.
The design of a strategy to increasecompetitiveness is a systematic way to generatean open, informed discussion among actors
30
Participatory Market Chain Analysis for Smallholder Producers
from a market chain. But, at the end of the day,those who decide what to do, design actionplans, and implement them are the actorsthemselves.
SummaryIn this section, we have reviewed some basicconcepts about market chains; an initialdefinition of what the strategy to increasecompetitiveness can be, how it is designed, andhow it is carried out; some key ideas on
production versus value market chains; someappreciations regarding the scale ofintervention; and finally, some initial ideas onthe use of participative methodologies. In thenext section, we will look in more detail at theprinciples behind this method. Many of theseprinciples relate to the concepts that we haveseen in this section, and together form aphilosophy that supports the design ofstrategies to increase competitiveness.
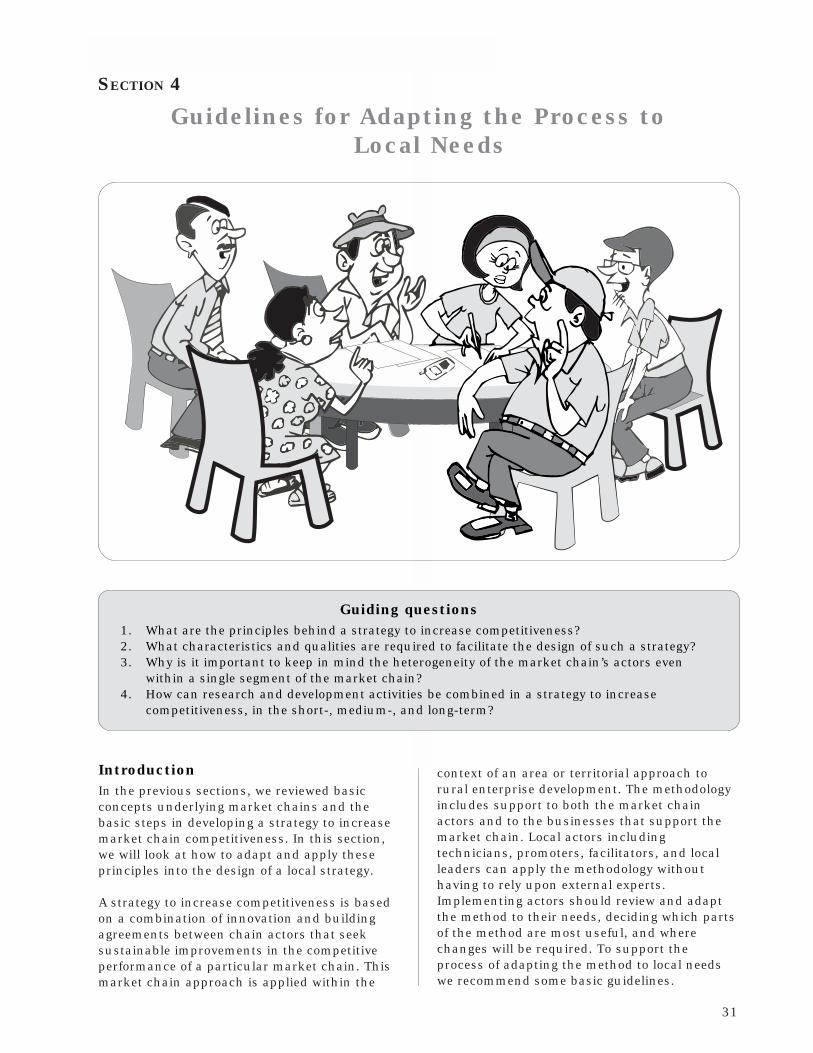
31
Guidelines for Adapting the Process to Local Needs
SECTION 4
Guidelines for Adapting the Process toLocal Needs
Guiding questions1. What are the principles behind a strategy to increase competitiveness?2. What characteristics and qualities are required to facilitate the design of such a strategy?3. Why is it important to keep in mind the heterogeneity of the market chain’s actors even
within a single segment of the market chain?4. How can research and development activities be combined in a strategy to increase
competitiveness, in the short-, medium-, and long-term?
IntroductionIn the previous sections, we reviewed basicconcepts underlying market chains and thebasic steps in developing a strategy to increasemarket chain competitiveness. In this section,we will look at how to adapt and apply theseprinciples into the design of a local strategy.
A strategy to increase competitiveness is basedon a combination of innovation and buildingagreements between chain actors that seeksustainable improvements in the competitiveperformance of a particular market chain. Thismarket chain approach is applied within the
context of an area or territorial approach torural enterprise development. The methodologyincludes support to both the market chainactors and to the businesses that support themarket chain. Local actors includingtechnicians, promoters, facilitators, and localleaders can apply the methodology withouthaving to rely upon external experts.Implementing actors should review and adaptthe method to their needs, deciding which partsof the method are most useful, and wherechanges will be required. To support theprocess of adapting the method to local needswe recommend some basic guidelines.
32
Participatory Market Chain Analysis for Smallholder Producers
Market OrientationA competitive strategy should be considered asa business tool, designed to support enterpriseactivities that increase income and respond tomarket demands. Before designing a marketchain strategy, local facilitators should have aclear idea of the strengths, weaknesses, andpotential for enterprise development in theirlocal area, and have up-to-date information onthe market opportunities open to the projectarea and the aims of the client group. Methodsto gather this information are dealt with inGuides 2 and 3 of this series.
Market Chain Focus from “End to End”This methodology reviews all the functions ofthe market chain starting from input provisionto the consumption of the final product. Theexisting enterprise and available businessdevelopment services are analyzed as well asthe functions of input provision, production,post-harvest management, processing, andmarketing. This requires that key players in thesystem are identified and participate in theprocess of market chain analysis. Developing amulti-actor group and having a wide analyticalframework is important in understanding themarket chain as a business system, and at thesame time identifying critical points where aminimum of effort will generate maximumbenefits.
Coordination among Different Actorsto Identify and Develop SynergiesThe methodology assumes that areas ofcommon interest between diverse actors alongthe market chain are not evident. For thisreason, the methodology seeks to incorporateand motivate a range of actors to definecommon objectives and strategies, thuspermitting a coordinated effort between them.In this approach, it is important to ensure thatkey actors are included in the system. Theorganization facilitating the process shouldhave friendly relations with key informants oractors, or be disposed to build theserelationships during the course of the process.Building contacts with actors in the privatesector including enterprises, supermarkets,local, and external traders and those offeringbusiness development services, etc., issometimes complicated, given time limitations.However, the ability to negotiate with theseactors is critical because of the information they
manage regarding the market chain and marketpotential.
Working with the Private SectorAn additional objective is the identification anddevelopment of synergies among actors alongthe market chain. The organization facilitatingthe process should involve representatives of allactors along the market chain to highlight theirinterdependence and the possibilities ofimproving their business activities. This doesnot mean that all actors participate at all timesin the design of the strategy. Most private sectorrepresentatives will not attend long workshopsand therefore the process facilitator may needto interview some market chain representativesto capture their opinions and relay these ideasto the group in the design phase. Wherepossible, private sector representatives shouldreview the analysis of the market chain and bekey participants in the final design of a marketchain strategy. Despite being less participativedue to time constraints, these actors can oftenhelp (or hinder) any proposed change in themarket chain, and therefore must be included.
Selection of Key Informants inDecision-Making ProcessesUnderstanding how a market chain functionsand who the key players are, is vital to havinggood representation from the market chain.These key informants range from inputsuppliers, producers, those who are involvedwith post-harvest management, processing, andmarketing of the final product, to businessdevelopment service providers. Key informantsneed to participate actively so that theirviewpoints are clearly heard and incorporatedinto the information gathering and strategydevelopment.
Respecting People’s Time, Needs, andDifferencesIn certain circumstances it is better to separateactors so that their time is used mosteffectively. Traders for example are busy peopleand do not appreciate time spent discussingother peoples business that is not relevant totheir area of activity. The facilitator shouldtherefore evaluate whether certain groups in themarket chain are best interviewed within amixed group, or interviewed separately. Forexample, if a market chain includes theparticipation of large-, medium-, and small-
33
Guidelines for Adapting the Process to Local Needs
scale producers, with diverse technologies,different access to resources, and thus differentopportunities and limitations, it is important tohave representatives of each group to designeffective support strategies to meet theirdifferent needs. People or organizations involvedin processing activities are another example; theuse of different levels of processing technologycan affect processing efficiency, costs, and finalproduct quality. At a consumer level,differentiation is also important. For example,consumers of varying income levels may havevarying demands based either on productquality or price, or a combination of the two.The facilitator should take care to separatethese types of actors and groups as this will notonly help to focus future interventions moreappropriately, but will also use people’s time ina respectful and meaningful manner. Thefacilitator should constantly review people’scomments on the process, and if participantsare bored, or feel their time is not being wellused, the process needs to be changed.
Combining Research and DevelopmentActivities to Promote InnovationThe final strategy to improve thecompetitiveness of a market chain can includeboth research and development activities, whichmay take place at any point along the marketchain. Research actions may focus onimproving productivity, post-harvestmanagement, processing, marketing, or theprovision of business development services withthe purpose of improving market chaincompetitiveness. At the same time, other actorsmay implement development activities seekingto increase the market chain’s competitiveness.
Typically short-term activities focus ondevelopment outcomes, but as the strategyadvances, and research results are obtained,other innovations are introduced which may beof a medium to longer term nature. Severalactors along the market chain often implementthe longer term interventions.
The process of innovation is typically long termand, if possible, permanent. A reasonably longtime horizon is important to improving marketchain competitiveness. In other words,improving the market chain quickly isimportant, but if substantial, or sustainedimprovements are sought, a more strategicresearch approach that facilitates innovationmay be required. Strategic research is notnecessarily an action carried out by specialists
or research centers, although these mayparticipate, but rather a permanent focus ofinnovation, learning, and diffusion that drawson both experts, and the knowledge of marketchain actors and their own capacity forinnovation.11
Mixing Short-, Medium-, and Long-term Activities with AvailableResourcesA strategy to increase competitiveness, whichincludes both research and developmentactivities, can be divided into short-, medium-,and long-term actions and should be developedwith a sound understanding of whetherexternal resources are required or not. In thefirst instance, a strategy should be based onlocal actions using local resources andknowledge, before seeking external support.This is useful because it promotes a positivedynamic between the actors and helps acommunity to realize that they can do thingsthemselves, without waiting or relying onexternal support. If a community is to embarkon a business strategy, it is always best todevelop processes and activities that are withintheir financial reach. In the medium and longterm, as a business idea advances, local andexternal resources and knowledge can be mixedmore effectively, and at the same time morecomplex actions or strategies designed andimplemented to increase competitiveness.
There are three main reasons why it isimportant to think about time and resourcesfrom the start of the process:
1. A process initiated with local resources andknowledge tends to strengthen localcapacities for analyzing and resolvingproblems, and thus assists in thedevelopment of capacities for innovation.
2. Seeking solutions to market chain needsbased on existing local resources instead ofwaiting for external resources (or projects) to
11. Three clear examples here are the master builders oflocal processing plants who may be excellentadaptors and diffusers of improvements in post-harvest technology, Local Agricultural ResearchCommittees (CIALs, the Spanish acronym), thatcarry out applied research focused on cropproduction at the community level, and ResearchGroups in Rural Agroindustry (GIAR, the Spanishacronym) that integrates post harvest technologyand production improvements to develop valueadded products targeted towards a specific marketdemand.
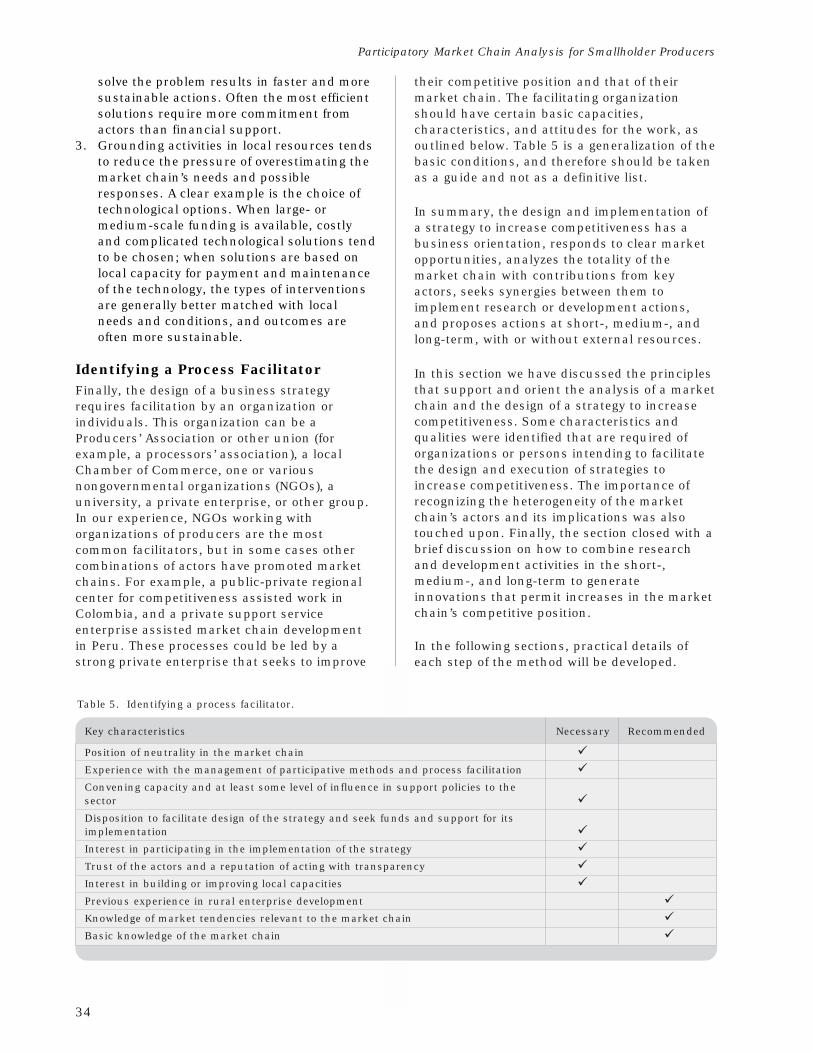
34
Participatory Market Chain Analysis for Smallholder Producers
solve the problem results in faster and moresustainable actions. Often the most efficientsolutions require more commitment fromactors than financial support.
3. Grounding activities in local resources tendsto reduce the pressure of overestimating themarket chain’s needs and possibleresponses. A clear example is the choice oftechnological options. When large- ormedium-scale funding is available, costlyand complicated technological solutions tendto be chosen; when solutions are based onlocal capacity for payment and maintenanceof the technology, the types of interventionsare generally better matched with localneeds and conditions, and outcomes areoften more sustainable.
Identifying a Process FacilitatorFinally, the design of a business strategyrequires facilitation by an organization orindividuals. This organization can be aProducers’ Association or other union (forexample, a processors’ association), a localChamber of Commerce, one or variousnongovernmental organizations (NGOs), auniversity, a private enterprise, or other group.In our experience, NGOs working withorganizations of producers are the mostcommon facilitators, but in some cases othercombinations of actors have promoted marketchains. For example, a public-private regionalcenter for competitiveness assisted work inColombia, and a private support serviceenterprise assisted market chain developmentin Peru. These processes could be led by astrong private enterprise that seeks to improve
their competitive position and that of theirmarket chain. The facilitating organizationshould have certain basic capacities,characteristics, and attitudes for the work, asoutlined below. Table 5 is a generalization of thebasic conditions, and therefore should be takenas a guide and not as a definitive list.
In summary, the design and implementation ofa strategy to increase competitiveness has abusiness orientation, responds to clear marketopportunities, analyzes the totality of themarket chain with contributions from keyactors, seeks synergies between them toimplement research or development actions,and proposes actions at short-, medium-, andlong-term, with or without external resources.
In this section we have discussed the principlesthat support and orient the analysis of a marketchain and the design of a strategy to increasecompetitiveness. Some characteristics andqualities were identified that are required oforganizations or persons intending to facilitatethe design and execution of strategies toincrease competitiveness. The importance ofrecognizing the heterogeneity of the marketchain’s actors and its implications was alsotouched upon. Finally, the section closed with abrief discussion on how to combine researchand development activities in the short-,medium-, and long-term to generateinnovations that permit increases in the marketchain’s competitive position.
In the following sections, practical details ofeach step of the method will be developed.
Table 5. Identifying a process facilitator.
Key characteristics Necessary Recommended
Position of neutrality in the market chain !Experience with the management of participative methods and process facilitation !Convening capacity and at least some level of influence in support policies to thesector !Disposition to facilitate design of the strategy and seek funds and support for itsimplementation !Interest in participating in the implementation of the strategy !Trust of the actors and a reputation of acting with transparency !Interest in building or improving local capacities !Previous experience in rural enterprise development !Knowledge of market tendencies relevant to the market chain !Basic knowledge of the market chain !

THE PRACTICAL WORK
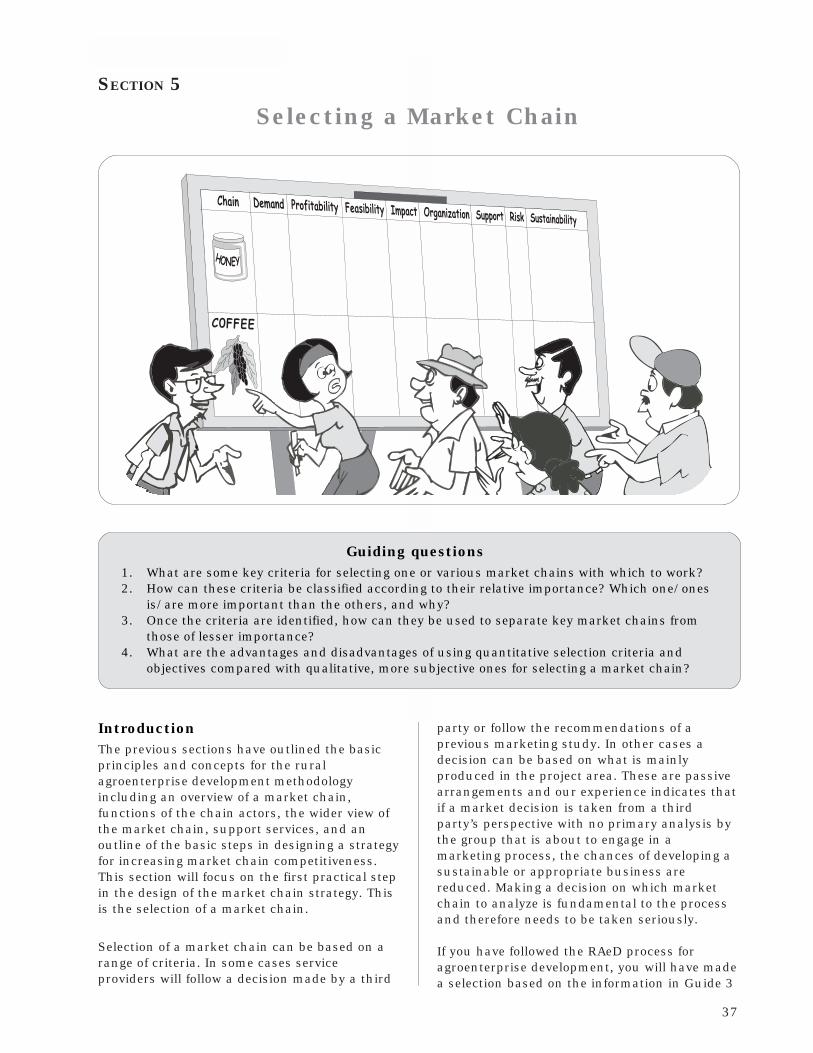
37
Selecting a Market Chain
SECTION 5
Selecting a Market Chain
Guiding questions1. What are some key criteria for selecting one or various market chains with which to work?2. How can these criteria be classified according to their relative importance? Which one/ones
is/are more important than the others, and why?3. Once the criteria are identified, how can they be used to separate key market chains from
those of lesser importance?4. What are the advantages and disadvantages of using quantitative selection criteria and
objectives compared with qualitative, more subjective ones for selecting a market chain?
IntroductionThe previous sections have outlined the basicprinciples and concepts for the ruralagroenterprise development methodologyincluding an overview of a market chain,functions of the chain actors, the wider view ofthe market chain, support services, and anoutline of the basic steps in designing a strategyfor increasing market chain competitiveness.This section will focus on the first practical stepin the design of the market chain strategy. Thisis the selection of a market chain.
Selection of a market chain can be based on arange of criteria. In some cases serviceproviders will follow a decision made by a third
party or follow the recommendations of aprevious marketing study. In other cases adecision can be based on what is mainlyproduced in the project area. These are passivearrangements and our experience indicates thatif a market decision is taken from a thirdparty’s perspective with no primary analysis bythe group that is about to engage in amarketing process, the chances of developing asustainable or appropriate business arereduced. Making a decision on which marketchain to analyze is fundamental to the processand therefore needs to be taken seriously.
If you have followed the RAeD process foragroenterprise development, you will have madea selection based on the information in Guide 3
38
Participatory Market Chain Analysis for Smallholder Producers
of this series, entitled “Identifying MarketOpportunities for Smallholder Producers andProcessors”12. There is, however, no one correctway for making a choice of markets since it is adecision of the organization that will implementthe agroenterprise process. Whatever the criteriaused for selection, it is important to reflect uponthe impact that the use of a particular set ofcriteria may have on the success, or not, of themarket chain selected. Here are some helpfultips for selection criteria that have been useful inprevious applications of the methodology. Thissection explains the ideas briefly, and ends withthe presentation of a concrete field experience.
Selection Criteria Used to Choose anAppropriate Market ChainThe following criteria may be useful but do notrepresent an exhaustive list and they should bemodified according to the criteria of theorganization that will lead the process. However,in most cases the following principles are auseful guide:
· Market options must be feasible in thecontext of the small rural agroenterprise;technological and investment requirementsmust be in accordance to this socioeconomiccontext.
· The market option must be attractive as abusiness; it should offer an adequateprofitability or cost-benefit ratio.
· The market option must be sustainable andshould not harm the environment.
Market demandHow much demand is there for the marketchain’s product? Is the market for this productgrowing rapidly or slowly? Is it stable ordiminishing? We recommend working withproducts that show strong to moderate marketgrowth, as this usually implies the market canabsorb additional supply. In the case of newproducts, a survey of intent to buy can be doneto identify potential market size12. It is best to doyour own study but you can use informationfrom recent market studies, or surveys made byprivate or state institutions.
ProfitabilityHow profitable is the production or processing ofthis product? How does the product’sprofitability compare with what a bank pays on
money in a savings account? Profitability ofvarious products can be done by comparinggross margins, or through calculating theinternal rate of return (IRR) of a product. Werecommend that those, not familiar with the IRRtechnique, seek advice from an accountant. Inevaluating profitability, there are no hard andfast rules, given that the opportunity costs forlabor tend to be low or nonexistent in many ruralareas. It is important that the product besufficiently profitable for the producers at actualmarket prices, and that the market demand besufficient to assimilate additional producewithout entering a state of oversupply and pricedecline.
Feasibility of productionEven though market demand exists for aproduct, it is vital to be sure that it is possible toproduce this product in the project area givenexisting social, economic, and environmentalconditions with the quality that the marketdemands. Is the production system for thisproduct consistent with sustainable naturalresource management? The selection of marketchains that adapt to existing conditions andcoincide with the facilitating organization’sconcept of natural resource management isrecommended. If this is not the case, thefacilitating organization should identifystrategies to resolve feasibility limitations (forexample, find a supplier of credit who can assistwith installation costs of perennial crops such asfruits, simple systems of water harvest, micro-irrigation systems, or the identification ofimproved post-harvest technologies). Theexistence of feasibility questions should notnecessarily eliminate the product since solutionscan be included as part of the activities toincrease the market chain’s competitiveness.
Potential impactHow many families could benefit from a strategyto increase competitiveness in this marketchain? Will this strategy generate strong,medium, or low impact, in terms of income forproducers? What impact will this strategy haveon least favored groups/on women as opposed tomen? It is also important to ascertain if thestrategy will generate rural farm or non-farmemployment, and for whom. If the targetpopulation of the project or organization is aspecific segment of the population (for example,small-scale producers, women, indigenouspopulations, youth, or others), it is important toask ourselves if this group will be able to takeadvantage of the additional gains foreseen by the12. For more information, consult Ostertag (1999).
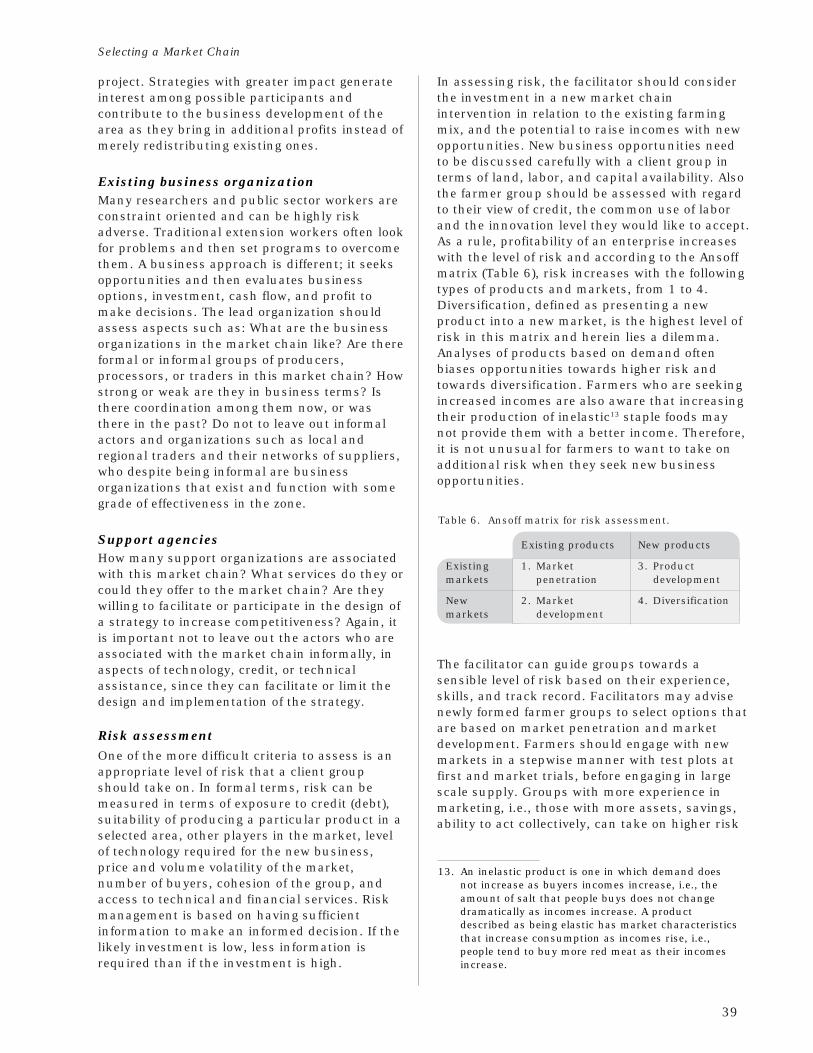
39
Selecting a Market Chain
project. Strategies with greater impact generateinterest among possible participants andcontribute to the business development of thearea as they bring in additional profits instead ofmerely redistributing existing ones.
Existing business organizationMany researchers and public sector workers areconstraint oriented and can be highly riskadverse. Traditional extension workers often lookfor problems and then set programs to overcomethem. A business approach is different; it seeksopportunities and then evaluates businessoptions, investment, cash flow, and profit tomake decisions. The lead organization shouldassess aspects such as: What are the businessorganizations in the market chain like? Are thereformal or informal groups of producers,processors, or traders in this market chain? Howstrong or weak are they in business terms? Isthere coordination among them now, or wasthere in the past? Do not to leave out informalactors and organizations such as local andregional traders and their networks of suppliers,who despite being informal are businessorganizations that exist and function with somegrade of effectiveness in the zone.
Support agenciesHow many support organizations are associatedwith this market chain? What services do they orcould they offer to the market chain? Are theywilling to facilitate or participate in the design ofa strategy to increase competitiveness? Again, itis important not to leave out the actors who areassociated with the market chain informally, inaspects of technology, credit, or technicalassistance, since they can facilitate or limit thedesign and implementation of the strategy.
Risk assessmentOne of the more difficult criteria to assess is anappropriate level of risk that a client groupshould take on. In formal terms, risk can bemeasured in terms of exposure to credit (debt),suitability of producing a particular product in aselected area, other players in the market, levelof technology required for the new business,price and volume volatility of the market,number of buyers, cohesion of the group, andaccess to technical and financial services. Riskmanagement is based on having sufficientinformation to make an informed decision. If thelikely investment is low, less information isrequired than if the investment is high.
In assessing risk, the facilitator should considerthe investment in a new market chainintervention in relation to the existing farmingmix, and the potential to raise incomes with newopportunities. New business opportunities needto be discussed carefully with a client group interms of land, labor, and capital availability. Alsothe farmer group should be assessed with regardto their view of credit, the common use of laborand the innovation level they would like to accept.As a rule, profitability of an enterprise increaseswith the level of risk and according to the Ansoffmatrix (Table 6), risk increases with the followingtypes of products and markets, from 1 to 4.Diversification, defined as presenting a newproduct into a new market, is the highest level ofrisk in this matrix and herein lies a dilemma.Analyses of products based on demand oftenbiases opportunities towards higher risk andtowards diversification. Farmers who are seekingincreased incomes are also aware that increasingtheir production of inelastic13 staple foods maynot provide them with a better income. Therefore,it is not unusual for farmers to want to take onadditional risk when they seek new businessopportunities.
13. An inelastic product is one in which demand doesnot increase as buyers incomes increase, i.e., theamount of salt that people buys does not changedramatically as incomes increase. A productdescribed as being elastic has market characteristicsthat increase consumption as incomes rise, i.e.,people tend to buy more red meat as their incomesincrease.
Table 6. Ansoff matrix for risk assessment.
Existing products New products
Existing 1. Market 3. Productmarkets penetration development
New 2. Market 4. Diversificationmarkets development
The facilitator can guide groups towards asensible level of risk based on their experience,skills, and track record. Facilitators may advisenewly formed farmer groups to select options thatare based on market penetration and marketdevelopment. Farmers should engage with newmarkets in a stepwise manner with test plots atfirst and market trials, before engaging in largescale supply. Groups with more experience inmarketing, i.e., those with more assets, savings,ability to act collectively, can take on higher risk
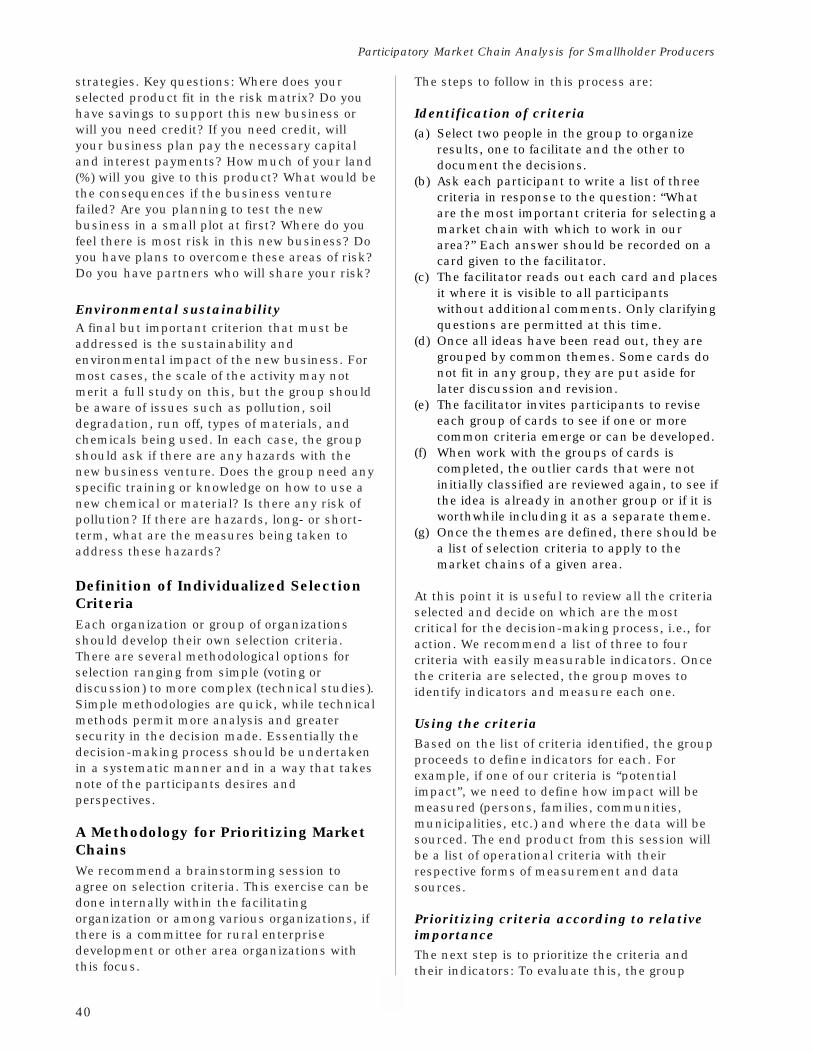
40
Participatory Market Chain Analysis for Smallholder Producers
strategies. Key questions: Where does yourselected product fit in the risk matrix? Do youhave savings to support this new business orwill you need credit? If you need credit, willyour business plan pay the necessary capitaland interest payments? How much of your land(%) will you give to this product? What would bethe consequences if the business venturefailed? Are you planning to test the newbusiness in a small plot at first? Where do youfeel there is most risk in this new business? Doyou have plans to overcome these areas of risk?Do you have partners who will share your risk?
Environmental sustainabilityA final but important criterion that must beaddressed is the sustainability andenvironmental impact of the new business. Formost cases, the scale of the activity may notmerit a full study on this, but the group shouldbe aware of issues such as pollution, soildegradation, run off, types of materials, andchemicals being used. In each case, the groupshould ask if there are any hazards with thenew business venture. Does the group need anyspecific training or knowledge on how to use anew chemical or material? Is there any risk ofpollution? If there are hazards, long- or short-term, what are the measures being taken toaddress these hazards?
Definition of Individualized SelectionCriteriaEach organization or group of organizationsshould develop their own selection criteria.There are several methodological options forselection ranging from simple (voting ordiscussion) to more complex (technical studies).Simple methodologies are quick, while technicalmethods permit more analysis and greatersecurity in the decision made. Essentially thedecision-making process should be undertakenin a systematic manner and in a way that takesnote of the participants desires andperspectives.
A Methodology for Prioritizing MarketChainsWe recommend a brainstorming session toagree on selection criteria. This exercise can bedone internally within the facilitatingorganization or among various organizations, ifthere is a committee for rural enterprisedevelopment or other area organizations withthis focus.
The steps to follow in this process are:
Identification of criteria(a) Select two people in the group to organize
results, one to facilitate and the other todocument the decisions.
(b) Ask each participant to write a list of threecriteria in response to the question: “Whatare the most important criteria for selecting amarket chain with which to work in ourarea?” Each answer should be recorded on acard given to the facilitator.
(c) The facilitator reads out each card and placesit where it is visible to all participantswithout additional comments. Only clarifyingquestions are permitted at this time.
(d) Once all ideas have been read out, they aregrouped by common themes. Some cards donot fit in any group, they are put aside forlater discussion and revision.
(e) The facilitator invites participants to reviseeach group of cards to see if one or morecommon criteria emerge or can be developed.
(f) When work with the groups of cards iscompleted, the outlier cards that were notinitially classified are reviewed again, to see ifthe idea is already in another group or if it isworthwhile including it as a separate theme.
(g) Once the themes are defined, there should bea list of selection criteria to apply to themarket chains of a given area.
At this point it is useful to review all the criteriaselected and decide on which are the mostcritical for the decision-making process, i.e., foraction. We recommend a list of three to fourcriteria with easily measurable indicators. Oncethe criteria are selected, the group moves toidentify indicators and measure each one.
Using the criteriaBased on the list of criteria identified, the groupproceeds to define indicators for each. Forexample, if one of our criteria is “potentialimpact”, we need to define how impact will bemeasured (persons, families, communities,municipalities, etc.) and where the data will besourced. The end product from this session willbe a list of operational criteria with theirrespective forms of measurement and datasources.
Prioritizing criteria according to relativeimportanceThe next step is to prioritize the criteria andtheir indicators: To evaluate this, the group
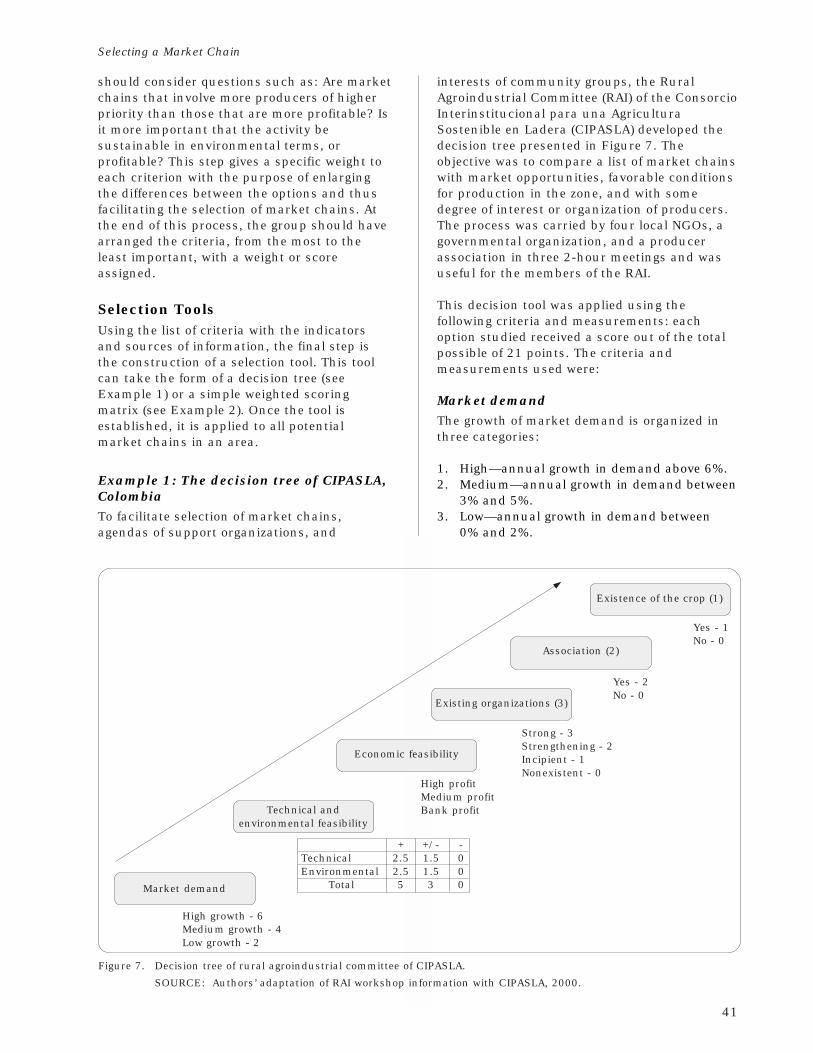
41
Selecting a Market Chain
should consider questions such as: Are marketchains that involve more producers of higherpriority than those that are more profitable? Isit more important that the activity besustainable in environmental terms, orprofitable? This step gives a specific weight toeach criterion with the purpose of enlargingthe differences between the options and thusfacilitating the selection of market chains. Atthe end of this process, the group should havearranged the criteria, from the most to theleast important, with a weight or scoreassigned.
Selection ToolsUsing the list of criteria with the indicatorsand sources of information, the final step isthe construction of a selection tool. This toolcan take the form of a decision tree (seeExample 1) or a simple weighted scoringmatrix (see Example 2). Once the tool isestablished, it is applied to all potentialmarket chains in an area.
Example 1: The decision tree of CIPASLA,ColombiaTo facilitate selection of market chains,agendas of support organizations, and
interests of community groups, the RuralAgroindustrial Committee (RAI) of the ConsorcioInterinstitucional para una AgriculturaSostenible en Ladera (CIPASLA) developed thedecision tree presented in Figure 7. Theobjective was to compare a list of market chainswith market opportunities, favorable conditionsfor production in the zone, and with somedegree of interest or organization of producers.The process was carried by four local NGOs, agovernmental organization, and a producerassociation in three 2-hour meetings and wasuseful for the members of the RAI.
This decision tool was applied using thefollowing criteria and measurements: eachoption studied received a score out of the totalpossible of 21 points. The criteria andmeasurements used were:
Market demandThe growth of market demand is organized inthree categories:
1. High—annual growth in demand above 6%.2. Medium—annual growth in demand between
3% and 5%.3. Low—annual growth in demand between
0% and 2%.
Figure 7. Decision tree of rural agroindustrial committee of CIPASLA.
SOURCE: Authors’ adaptation of RAI workshop information with CIPASLA, 2000.
Association (2)
Existing organizations (3)
Economic feasibility
Technical andenvironmental feasibility
Market demand
Existence of the crop (1)
Yes - 2No - 0
Strong - 3Strengthening - 2Incipient - 1Nonexistent - 0
High profitMedium profitBank profit
High growth - 6Medium growth - 4Low growth - 2
+ +/- -Technical 2.5 1.5 0Environmental 2.5 1.5 0 Total 5 3 0
Yes - 1No - 0
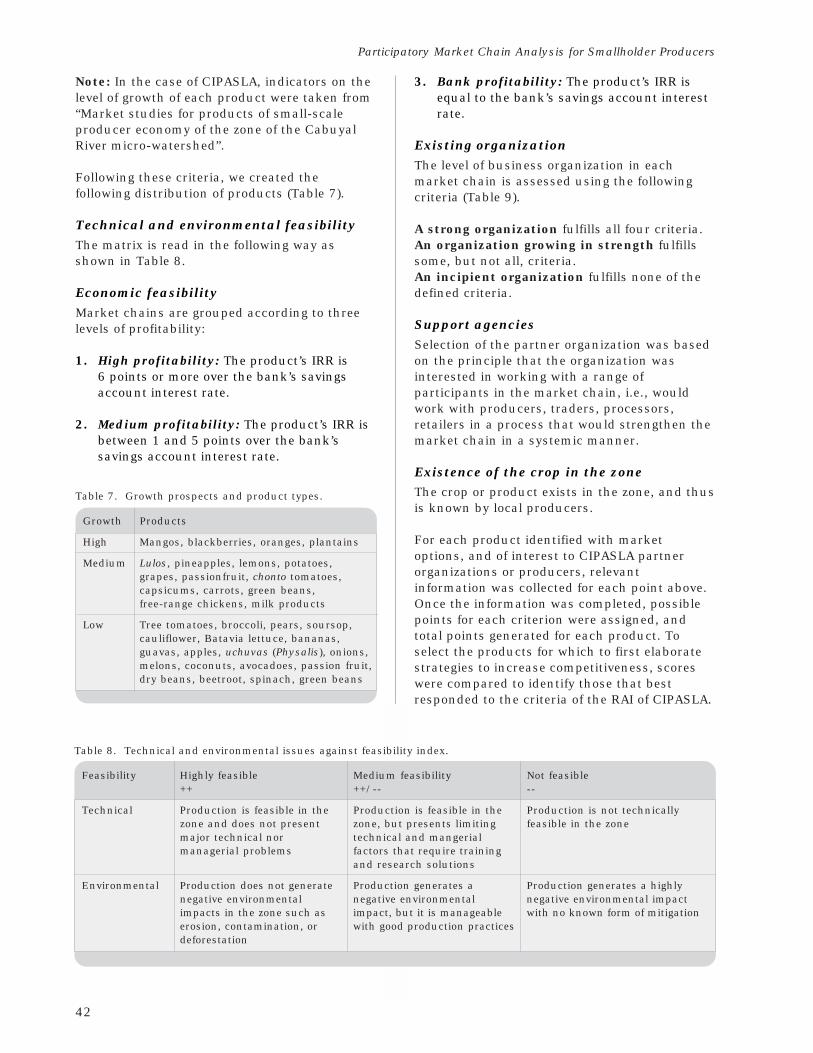
42
Participatory Market Chain Analysis for Smallholder Producers
Note: In the case of CIPASLA, indicators on thelevel of growth of each product were taken from“Market studies for products of small-scaleproducer economy of the zone of the CabuyalRiver micro-watershed”.
Following these criteria, we created thefollowing distribution of products (Table 7).
Technical and environmental feasibilityThe matrix is read in the following way asshown in Table 8.
Economic feasibilityMarket chains are grouped according to threelevels of profitability:
1. High profitability: The product’s IRR is6 points or more over the bank’s savingsaccount interest rate.
2. Medium profitability: The product’s IRR isbetween 1 and 5 points over the bank’ssavings account interest rate.
Table 7. Growth prospects and product types.
Growth Products
High Mangos, blackberries, oranges, plantains
Medium Lulos, pineapples, lemons, potatoes,grapes, passionfruit, chonto tomatoes,capsicums, carrots, green beans,free-range chickens, milk products
Low Tree tomatoes, broccoli, pears, soursop,cauliflower, Batavia lettuce, bananas,guavas, apples, uchuvas (Physalis), onions,melons, coconuts, avocadoes, passion fruit,dry beans, beetroot, spinach, green beans
3. Bank profitability: The product’s IRR isequal to the bank’s savings account interestrate.
Existing organizationThe level of business organization in eachmarket chain is assessed using the followingcriteria (Table 9).
A strong organization fulfills all four criteria.An organization growing in strength fulfillssome, but not all, criteria.An incipient organization fulfills none of thedefined criteria.
Support agenciesSelection of the partner organization was basedon the principle that the organization wasinterested in working with a range ofparticipants in the market chain, i.e., wouldwork with producers, traders, processors,retailers in a process that would strengthen themarket chain in a systemic manner.
Existence of the crop in the zoneThe crop or product exists in the zone, and thusis known by local producers.
For each product identified with marketoptions, and of interest to CIPASLA partnerorganizations or producers, relevantinformation was collected for each point above.Once the information was completed, possiblepoints for each criterion were assigned, andtotal points generated for each product. Toselect the products for which to first elaboratestrategies to increase competitiveness, scoreswere compared to identify those that bestresponded to the criteria of the RAI of CIPASLA.
Table 8. Technical and environmental issues against feasibility index.
Feasibility Highly feasible Medium feasibility Not feasible++ ++/-- --
Technical Production is feasible in the Production is feasible in the Production is not technicallyzone and does not present zone, but presents limiting feasible in the zonemajor technical nor technical and mangerialmanagerial problems factors that require training
and research solutions
Environmental Production does not generate Production generates a Production generates a highlynegative environmental negative environmental negative environmental impactimpacts in the zone such as impact, but it is manageable with no known form of mitigationerosion, contamination, or with good production practicesdeforestation
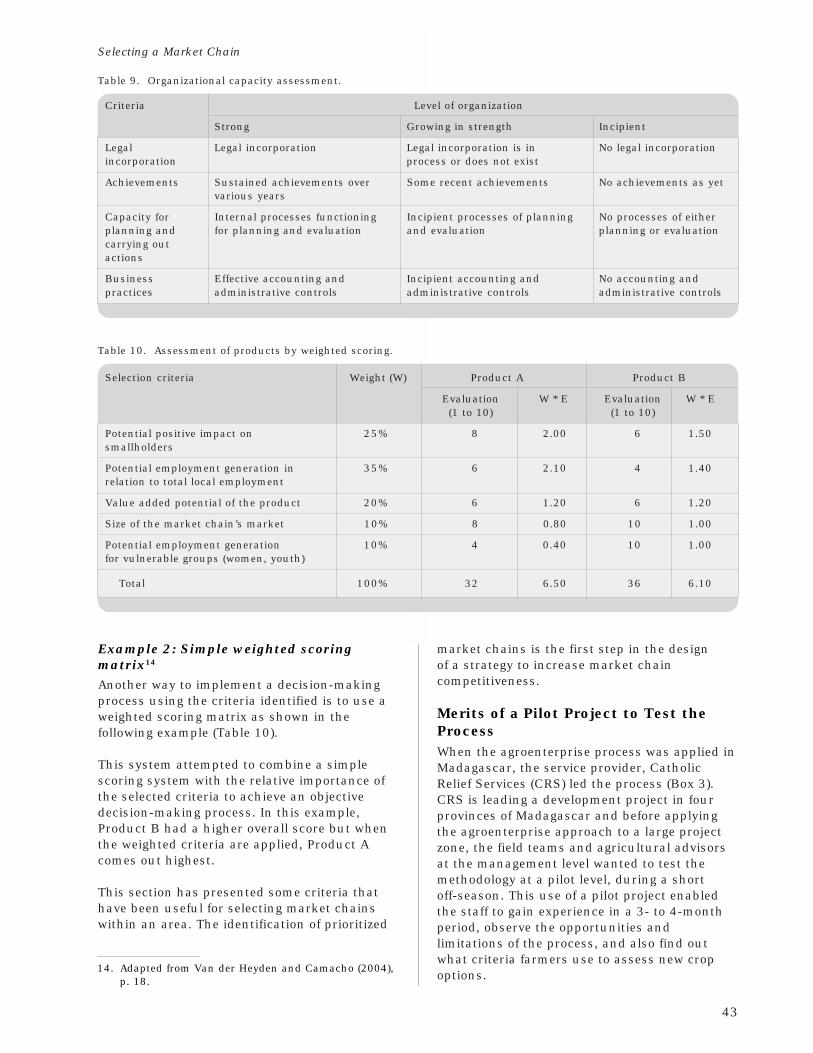
43
Selecting a Market Chain
Example 2: Simple weighted scoringmatrix14
Another way to implement a decision-makingprocess using the criteria identified is to use aweighted scoring matrix as shown in thefollowing example (Table 10).
This system attempted to combine a simplescoring system with the relative importance ofthe selected criteria to achieve an objectivedecision-making process. In this example,Product B had a higher overall score but whenthe weighted criteria are applied, Product Acomes out highest.
This section has presented some criteria thathave been useful for selecting market chainswithin an area. The identification of prioritized
Table 10. Assessment of products by weighted scoring.
Selection criteria Weight (W) Product A Product B
Evaluation W * E Evaluation W * E(1 to 10) (1 to 10)
Potential positive impact on 25% 8 2.00 6 1.50smallholders
Potential employment generation in 35% 6 2.10 4 1.40relation to total local employment
Value added potential of the product 20% 6 1.20 6 1.20
Size of the market chain’s market 10% 8 0.80 10 1.00
Potential employment generation 10% 4 0.40 10 1.00for vulnerable groups (women, youth)
Total 100% 32 6.50 36 6.10
market chains is the first step in the designof a strategy to increase market chaincompetitiveness.
Merits of a Pilot Project to Test theProcessWhen the agroenterprise process was applied inMadagascar, the service provider, CatholicRelief Services (CRS) led the process (Box 3).CRS is leading a development project in fourprovinces of Madagascar and before applyingthe agroenterprise approach to a large projectzone, the field teams and agricultural advisorsat the management level wanted to test themethodology at a pilot level, during a shortoff-season. This use of a pilot project enabledthe staff to gain experience in a 3- to 4-monthperiod, observe the opportunities andlimitations of the process, and also find outwhat criteria farmers use to assess new cropoptions.
Table 9. Organizational capacity assessment.
Criteria Level of organization
Strong Growing in strength Incipient
Legal Legal incorporation Legal incorporation is in No legal incorporationincorporation process or does not exist
Achievements Sustained achievements over Some recent achievements No achievements as yetvarious years
Capacity for Internal processes functioning Incipient processes of planning No processes of eitherplanning and for planning and evaluation and evaluation planning or evaluationcarrying outactions
Business Effective accounting and Incipient accounting and No accounting andpractices administrative controls administrative controls administrative controls
14. Adapted from Van der Heyden and Camacho (2004),p. 18.
44
Participatory Market Chain Analysis for Smallholder Producers
Box 3
Selection criteria used for discarding options
The product selection criteria used by CRS staff were in six categories. If a product failed in more than onecategory it was rejected. This was a rapid process that was completed by the field staff.
Selection criteria
1. Ease of productionIs the crop grown in the area?Can the crop be grown in the area?Are people already growing this crop?Is the crop grown in the off-season?Does the crop need any special inputs, such as irrigation, pesticides, and fertilizer?Can the product be produced in the off-season?
2. Market demandIs there strong market demand?Is demand based on season or festival? And does that fall into the intended production phase?Is the demand for high volume or a niche market?Are there many buyers or only 1?
3. Financial cost of productionDoes the production required a high investment?Is credit required for this production?
4. SocialDoes the product have any special social significance? Is the product subject to any taboos?
5. EnvironmentDoes the production come with any hazards or potential harm to the environment?
6. StorageIs the product to be stored? Is the technology available for storage?How long can the product be stored if market changes?
A rapid market survey questionnaire wasdeveloped by the agroenterprise team. Theteams conducted the survey with a range ofsales points/market actors in a 10-day periodusing four teams. The survey focused on themajor local market town of Ansirabe, and otherlocal markets in the area. No information wascollected on national or international markets.A CRS Project Officer led each team. Theinformation was synthesized at a groupmeeting and results presented to farmers. Thetimeframe for the development of thequestionnaire was 3 days.
Considerable preparation time was spent indeveloping a simple questionnaire andtranslating it into Malagasy. The Project Officersfocused on two questions in their questionnaire,(i) what do people buy most and (ii) what isscarce in the market.
The group developed the discard criteria, the firstlevel of discard was based on whether the cropcould be grown in the area and this reducedproducts from 50 to 31. The next level ofdiscard used their own 14-point criteria and thisenabled them to reduce the number from31 to 11 possibilities. The three marketopportunity matrices, e.g., production, marketingand financial analysis were used to reduce thepossibilities to six options. Farmers reviewedthese options prior to planting.
All six options from the Market OpportunityIdentification survey were tested by somefarmers. Project staff found that the moreprogressive farmers, located on the main roadwanted to try more exotic ideas, whereas thepoorer farmers in the remote areas were not keento try any new ideas. The major point is that themarketing study clearly encouraged innovationsto take place, but farmers wanted to match theirrisk profile with their investments.

45
Planning and Executing a Rapid Market Survey
SECTION 6
Planning and Executing a Rapid Market Survey
Guiding questions1. What are the key steps in planning for a rapid market survey?2. Why is secondary data important?3. Why is it useful to have up to date market information for the market chain’s products before
beginning the analysis?4. What information is it useful to have about the product or products, the market, the rules of
the game, and the buyers?5. How can we generate reliable information on the market in a quick and efficient way?6. What decisions can be made based on up-to-date market information, and what implications
do these have for elaborating a strategy to increase competitiveness?
IntroductionFollowing the selection of one or more marketchains, the next step is to gather commercialinformation on the product and market chainsidentified, to identify buyers, and determineissues of price, quality, and delivery that areacceptable to an identified buyer, who isseeking to undertake new business with your
farmer groups. To undertake this analysis, werecommend reviewing existing data andcarrying out a rapid survey with known orpotential buyers of the product. This phase ofthe method seeks to place the agroenterprisedesign process on a firm footing with reliablemarket data, and at the same time to identifyand get to know the actors in the market chain.
46
Participatory Market Chain Analysis for Smallholder Producers
Likewise, this is a good opportunity to invitekey market chain actors to participate in theanalysis of the market chain and to assist indeveloping a strategy to increasecompetitiveness. The following sections outlinesthe steps in planning data gathering throughsecondary data mining and conducting amarket survey. It takes into account the type ofmarket, the skills of the team, and the time andfinancial resources that are available.
Planning for the SurveyA good survey must be well planned and haveclear objectives. The group involved in the datagathering and survey need to discuss the levelof information required, geographic scope of thesurvey, people to be involved, and their rolesand responsibilities. The following sectionoutlines some aspects that the survey teamshould consider as part of this exercise.
Formulate the survey team according toskills and size of the study
· The survey team should ideally includerepresentation from the service provider,research, accountancy, and one or tworepresentatives of the relevant farmergroups. Depending on the type of productselected, it is an advantage if one of thegroup members has some expertise in thisarea, i.e., a livestock specialist if the dairysector is being evaluated.
· Team size should be relative to the scope ofthe study. The team should consider howmany surveys will be conducted, theirlocations, and the logistics required toenable the survey team to get to these pointsin the market.
· A budget should be developed which meetsthe needs of the survey team and providesresources to write up results in addition tothe field time.
· We recommend that teams of two or threepersons conduct market interviews. Oneperson will ask questions and engage theinterviewee, a second person will recordnotes and observe gaps in the information,and a third person can monitor the processand keep time.
Make sure the survey is focused on theselected market chain
· When formulating your plan avoid collectinginformation that is interesting but notrelevant to the needs of the enterprise/clientgroup.
· Draw a theoretical map of your survey zoneand market channels to be included in thesurvey. Make sure you collect all theinformation you need to develop a businessplan and later link up with particular actorsin the market chain.
· Find key informants to give you backgroundinformation and insights into the mostuseful people to interview prior to setting outon the survey.
Make a list of people to contact, use keyinformants as a guide
· As part of your theoretical map, includeinformation sources and types of people thatyou will interview and the numbers ofinterviews that you plan to make at eachpoint in the market chain. We recommendthat four to five persons at one point in thechain are interviewed so that data can becrossed check, triangulated, and confirmedwith other market chain actors.
· Use your key informant’s information toguide this process. A key informant can be(i) a leading agent in this market chain,(ii) an ex-researcher who knows the sector,or (iii) a retired schoolteacher who is familiarwith the area. The key informant should actas your soundboard during the survey andas a source of constructive criticism.
Select sites/locations/industries to bevisited and plan for follow up visits basedon information from first meetings
· Depending on the nature of the marketchain being investigated, plan your visits,and be well prepared when visiting eachinterviewer. Do not go to an interviewwithout having the purpose of the visitclearly in your mind.
· Be observant, do the answers from theperson fit the situation? Use localobservation to color your interview.
Design interview checklists and pretest
· Develop checklists that will guide youthrough an interview.
· Train your interviewers using pretests sothat you are sure they will collect the correctinformation.
· Adapt checklists, where needed to specifictypes of interviewee, e.g., a checklist for aprocessor is different from a checklist for amarket retailer.
· It is often useful to split the appraisal andchecklists into two parts:
47
Planning and Executing a Rapid Market Survey
(i) Demand questions focused on urban andmarket outlets.
(ii) Supply chain questions focused on actorsin the market chain often rurally located.
Collate information and write report
· Select one person in the group who willcollate data and be responsible for writingup results.
· The findings from the results should bereviewed by the team and debated.
Use of results
· The final report should be presented orally tothe relevant farmer groups andagroenterprise team.
· A written document should outline theprocess, major findings, andrecommendations.
· The document should also provideinformation on key informants or actorswithin the market chain who may beinterested in participating in the design of amarket chain competitiveness strategy.
Starting the Market Chain Analysis15
Collection of secondary dataAs with any type of research or analysis, thestarting point in an investigation should be aserious review of existing information withregard to the product, how the product isgrown, and the main markets. Secondaryinformation is extremely valuable as it is lowcost, the work has been done by others and itusually only requires systematizing. Accessinggood secondary data will save you considerabletime and money. Sources of secondaryinformation include those listed below:
Sources of secondary information:
· Market information services.
· Consultancy reports.
· Research institutions (CGIAR and others).
· Chambers of Commerce.
· Trade associations.
· Wholesalers.
· Internet.
· Development projects (NGOs).
· Agribusiness development centers.
· Press, specialized trade/commodity journals.
· Export promotion boards.
It is unfortunately the case that many projectsdo not invest time into secondary datacollection and often miss opportunities andwaste resources because of this. In somecases this is due to incentives that pay forfieldwork rather than data collection andanalysis. We recommend that this aspect of thework be taken seriously as there is a lot ofinformation available. Review of thisinformation may lead to avoidance of false trailsand may produce good contacts who couldassist with the efficient collection of primarydata.
Collection of primary market chain dataIn the context of this methodology, a “rapidmarket survey” should not be confused with acomplete sub-sector marketing study. A rapidmarket survey identifies critical aspects in theflow of a particular commodity or product fromthe point(s) of production to the point(s) of sale.Specifically the market chain survey aims togather information that will reveal newbusiness opportunities or identify keybottlenecks in the market chain. Thisinformation is vital when moving to design themarket chain strategy. The required informationcan be divided between data about the product,buyers, linkages between buyers, and otherspecific observations defined by theagroenterprise group prior to the survey. It isimportant to define the types of informationrequired for making business along the marketchain more dynamic, i.e., the data beinggathered should focus on opportunities forbusiness development.
In addition to providing marketing information,the survey will also enable farmer groups andservice providers to identify key actors in thechain with the view of establishing newbusiness options. It also permits theidentification of possible strategic partnerswithin the design of the strategy to increaseoverall market chain competitiveness. Hence themarket survey should not be considered as anend point, but as essential groundwork for thenext steps.
Data about the clients:The basic data needed about the clients are:
· Name.
· Location (exact address, city, department,etc.).
· Contact information (telephone, fax, cellularphone, electronic mail, etc.).
15. This section presents a simplified version of a rapidmarket survey. For a complete explanation onidentifying market opportunities, consult Ostertag(1999).
48
Participatory Market Chain Analysis for Smallholder Producers
· Type of client (i.e., position in the chain:trader, supermarket, restaurant, hotel,institution).
· What other products are bought.
Data about the product and the marketchain:
· Commodity characteristics (grades, types,varieties).
· Presentation of the product (weight,packaging, etc.).
· Product volumes (aggregate market size,individual buying conditions).
· Frequency and site of product delivery(dates, periods, market site, on-farm).
· Consumption patterns (seasonality, trends).
· Supply situation, production (demand,storage, trade flows).
· Product price and form of payment, pricepaid (cash, credit, for how many days).
· Price relationships (seasonal, cyclical,supply–demand).
· Actors in the chain (market channels,marketing arrangements).
· Marketing behavior (practices, verticalintegration, market power).
· Legal requirements for selling products(sanitary registration, bar codes, packaging,legalized invoices, etc.).
· Market infrastructure (roads, markets,communications).
· Government (regulation, marketing, pricefixing).
· Global Trade (world market situation, tariffs,sanitary and phytosanitary regulations,technical barriers to trade).
· Timing of the study (timing of study relativeto market cycle).
Survey Teams16
The complexity of the survey and therequirements for interviewees vary according tothe type of market being analyzed. If the studyis focusing on sales in a local market, then asmall team of two or three people working for2-3 days may be sufficient. In estimating thetime required for the survey it should beconsidered that excluding transportation, astandard interview might take 30 minutes to1 hour. In some cases it may take 2 hours whenan interviewee has many products to discuss,or is a key actor.
The composition of the team members willchange according to market type. For a localmarket, the producers themselves orsecondary school or university students cancarry out the market survey, with limitedtraining. However, as the market surveybecomes more complex and requires analysisof large urban markets, far from whereproducers live, it is recommended to organizea mixed group of producers, extensionworkers, researchers, agents from thefacilitating organization, and students toconduct the survey.
Checklists and Summary SheetsThe simplest way of performing a marketsurvey is by means of a structured or semi-structured interview with actors in the marketchain. Checklists for interviews should bedesigned beforehand and pretested by thefacilitating organization. Training should begiven to those persons involved in datacollection, i.e., producers, extension workers,students, or any other suitable group. As themarket chain becomes more extended, thepretesting of the checklist requires moreattention.
The survey group should participate in thedesign of the survey instrument (checklist) andbe involved in formulating questions to makesure they understand them. Once the surveyinstrument is designed, it should be testedwith local actors to: (a) verify that theinformation sought is obtained; (b) identifypossible gaps, and (c) ascertain that thesurvey can be carried out in a reasonable time.Logistics and costs of the survey can be basedon the information gathering process at thepretest phase.
Likewise, the forms that will be used forrecording the data should be tested, and theirease of use verified. When the tools are ready,groups of researchers are formed to performthe survey, and each is assigned tasks.17 Asample checklist for a market chain analysis isgiven in Appendix 1.
16. For a full discussion on the theme of methodologies,consult Ostertag (2000).
17. These groups can be composed of a single person orup to three or four persons. According to CIATexperience, groups of two to four persons are bestsince it is difficult for a single person to interviewand document answers at the same time, while largegroups tend to intimidate those being interviewed.
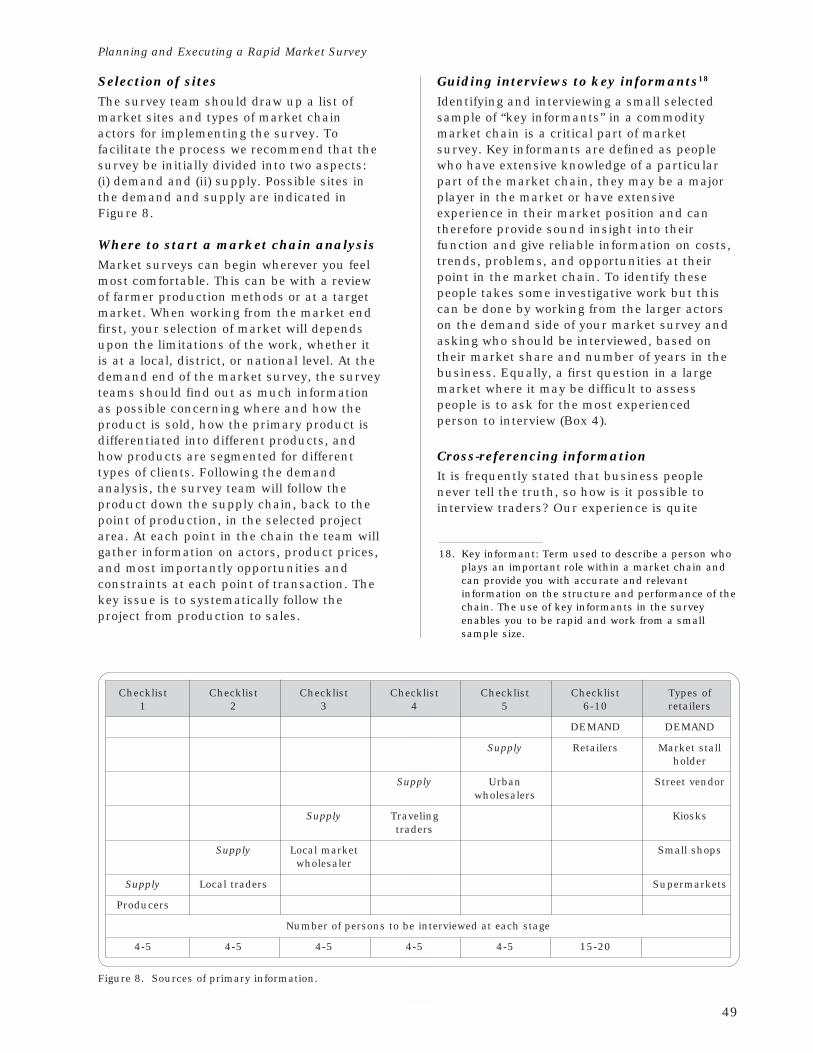
49
Planning and Executing a Rapid Market Survey
Selection of sitesThe survey team should draw up a list ofmarket sites and types of market chainactors for implementing the survey. Tofacilitate the process we recommend that thesurvey be initially divided into two aspects:(i) demand and (ii) supply. Possible sites inthe demand and supply are indicated inFigure 8.
Where to start a market chain analysisMarket surveys can begin wherever you feelmost comfortable. This can be with a reviewof farmer production methods or at a targetmarket. When working from the market endfirst, your selection of market will dependsupon the limitations of the work, whether itis at a local, district, or national level. At thedemand end of the market survey, the surveyteams should find out as much informationas possible concerning where and how theproduct is sold, how the primary product isdifferentiated into different products, andhow products are segmented for differenttypes of clients. Following the demandanalysis, the survey team will follow theproduct down the supply chain, back to thepoint of production, in the selected projectarea. At each point in the chain the team willgather information on actors, product prices,and most importantly opportunities andconstraints at each point of transaction. Thekey issue is to systematically follow theproject from production to sales.
Guiding interviews to key informants18
Identifying and interviewing a small selectedsample of “key informants” in a commoditymarket chain is a critical part of marketsurvey. Key informants are defined as peoplewho have extensive knowledge of a particularpart of the market chain, they may be a majorplayer in the market or have extensiveexperience in their market position and cantherefore provide sound insight into theirfunction and give reliable information on costs,trends, problems, and opportunities at theirpoint in the market chain. To identify thesepeople takes some investigative work but thiscan be done by working from the larger actorson the demand side of your market survey andasking who should be interviewed, based ontheir market share and number of years in thebusiness. Equally, a first question in a largemarket where it may be difficult to assesspeople is to ask for the most experiencedperson to interview (Box 4).
Cross-referencing informationIt is frequently stated that business peoplenever tell the truth, so how is it possible tointerview traders? Our experience is quite
18. Key informant: Term used to describe a person whoplays an important role within a market chain andcan provide you with accurate and relevantinformation on the structure and performance of thechain. The use of key informants in the surveyenables you to be rapid and work from a smallsample size.
Figure 8. Sources of primary information.
Checklist Checklist Checklist Checklist Checklist Checklist Types of1 2 3 4 5 6-10 retailers
DEMAND DEMAND
Supply Retailers Market stallholder
Supply Urban Street vendorwholesalers
Supply Traveling Kioskstraders
Supply Local market Small shopswholesaler
Supply Local traders Supermarkets
Producers
Number of persons to be interviewed at each stage
4-5 4-5 4-5 4-5 4-5 15-20
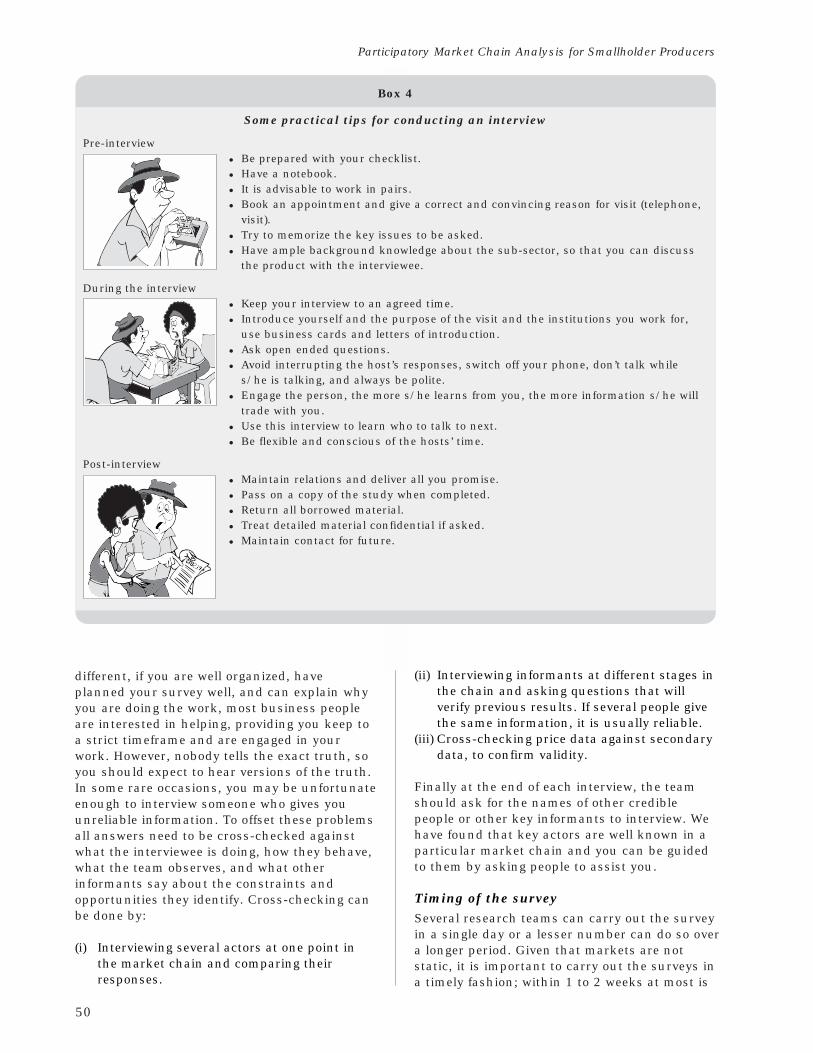
50
Participatory Market Chain Analysis for Smallholder Producers
Box 4
Some practical tips for conducting an interview
Pre-interview
· Be prepared with your checklist.
· Have a notebook.
· It is advisable to work in pairs.
· Book an appointment and give a correct and convincing reason for visit (telephone,visit).
· Try to memorize the key issues to be asked.
· Have ample background knowledge about the sub-sector, so that you can discussthe product with the interviewee.
During the interview
· Keep your interview to an agreed time.
· Introduce yourself and the purpose of the visit and the institutions you work for,use business cards and letters of introduction.
· Ask open ended questions.
· Avoid interrupting the host’s responses, switch off your phone, don’t talk whiles/he is talking, and always be polite.
· Engage the person, the more s/he learns from you, the more information s/he willtrade with you.
· Use this interview to learn who to talk to next.
· Be flexible and conscious of the hosts’ time.
Post-interview
· Maintain relations and deliver all you promise.
· Pass on a copy of the study when completed.
· Return all borrowed material.
· Treat detailed material confidential if asked.
· Maintain contact for future.
different, if you are well organized, haveplanned your survey well, and can explain whyyou are doing the work, most business peopleare interested in helping, providing you keep toa strict timeframe and are engaged in yourwork. However, nobody tells the exact truth, soyou should expect to hear versions of the truth.In some rare occasions, you may be unfortunateenough to interview someone who gives youunreliable information. To offset these problemsall answers need to be cross-checked againstwhat the interviewee is doing, how they behave,what the team observes, and what otherinformants say about the constraints andopportunities they identify. Cross-checking canbe done by:
(i) Interviewing several actors at one point inthe market chain and comparing theirresponses.
(ii) Interviewing informants at different stages inthe chain and asking questions that willverify previous results. If several people givethe same information, it is usually reliable.
(iii) Cross-checking price data against secondarydata, to confirm validity.
Finally at the end of each interview, the teamshould ask for the names of other crediblepeople or other key informants to interview. Wehave found that key actors are well known in aparticular market chain and you can be guidedto them by asking people to assist you.
Timing of the surveySeveral research teams can carry out the surveyin a single day or a lesser number can do so overa longer period. Given that markets are notstatic, it is important to carry out the surveys ina timely fashion; within 1 to 2 weeks at most is
51
Planning and Executing a Rapid Market Survey
best so that data captured can be easilycompared. If the selected market is large, anurban center for example, the work should bedivided amongst several groups of researchers.At the end of the day it is useful for the groupsto meet to review results, compare notes, anddecide how to manage any difficulties and howto proceed on subsequent days. All the datashould be written up at the end of each day andbe handed over to one person who isresponsible for documenting the process.
Use of alternative information typesIf the actors hope to use the survey results tomotivate changes in the form of production orproduct quality, it is useful, in addition toqualitative and empirical data, to gather graphicevidence of the visits to the market and theproducts. Photographs or videos can be used fordemonstration at a later date, and to facilitatethe socializing of information with other marketchain actors. Sometimes, being able to clearlyshow the differences between the quality of oneproduct and another, or a new form ofpackaging, is enough to motivate a change inthe market chain.
Going beyond observation to identifyingfuture partnersIn addition to standard marketing data, one ofthe aims of the survey will be to identifywhether any of the buyers in the chain wouldbe interested in finding new suppliers of aproduct and whether s/he would be interestedin participating in a more strategic long-termrelations with groups of producers. One of themain objectives of the survey should be toidentify actors in the chain with whom acommercial relation can be established.Therefore the marketing survey is a process thatgoes beyond simply establishing whether“market demand exists” and how products flow,to identifying people with whom the client groupand service providers can later negotiate.
When the survey team finds an actor(s) in thechain that express reservations about workingwith small-scale producers, it is important thatthe group perseveres to find other buyers whoare more amenable to the process. To assist inthe process of follow up activities, the surveyteam can record details of each interview onto asummary sheet at the end of each day. Asummary sheet for interview evaluation andfollow up is given in Appendix 2. This sheet hasbeen used to good effect in other surveys; it
enables the enterprise team to rapidly reviewresults some days after the event, with a view tomaking specific contacts for linkage into thedesign strategy.
Documenting ResultsOnce the survey is complete, results should beanalyzed and written up as soon as possible.There are many ways of documenting andsystematizing survey results. It is important tochoose a format that permits a usefulcomparison of information, and that makessense to the participants. Information to beincluded in the format can include:
· Name of the company or client.
· Location and contact information.
· Quantity of the product bought by day,week, month, or year.
· Means of delivery of the product [(with orwithout processing and required packaging(bag, basket, tray, etc.)].
· Present source of the product being boughtand present suppliers.
· Prices and form of payment.
· Special requirements (health registration,bar codes, etc.).
· Possibility of selling to this client.
In the case of market chains that includemultiple products, it is useful to generate atable for each product. For example, whengathering information for a dairy market chain,there will be multiple products and thereforeinterviews will be needed with buyers for freshmilk, pasteurized milk, cheese, yogurt, andother sub-products. Each specific product hasdifferent characteristics that are important toidentify and document. Table 11 presents anexample format that has been used in the pastfor this type of survey.
Responsibility for writing up the resultsAt the outset of the survey, one person shouldbe designated to collate the information fromthe interview teams and be responsible forwriting up the final report. The analyst andwriting position is crucial to the success of thesurvey and therefore the groups should selectsomeone who has a track record of writing goodreports and has the time to fulfill this taskwithin a 2-3 week period form the end of thesurvey. Most importantly, this person shouldagree to the task and be remuneratedaccordingly.
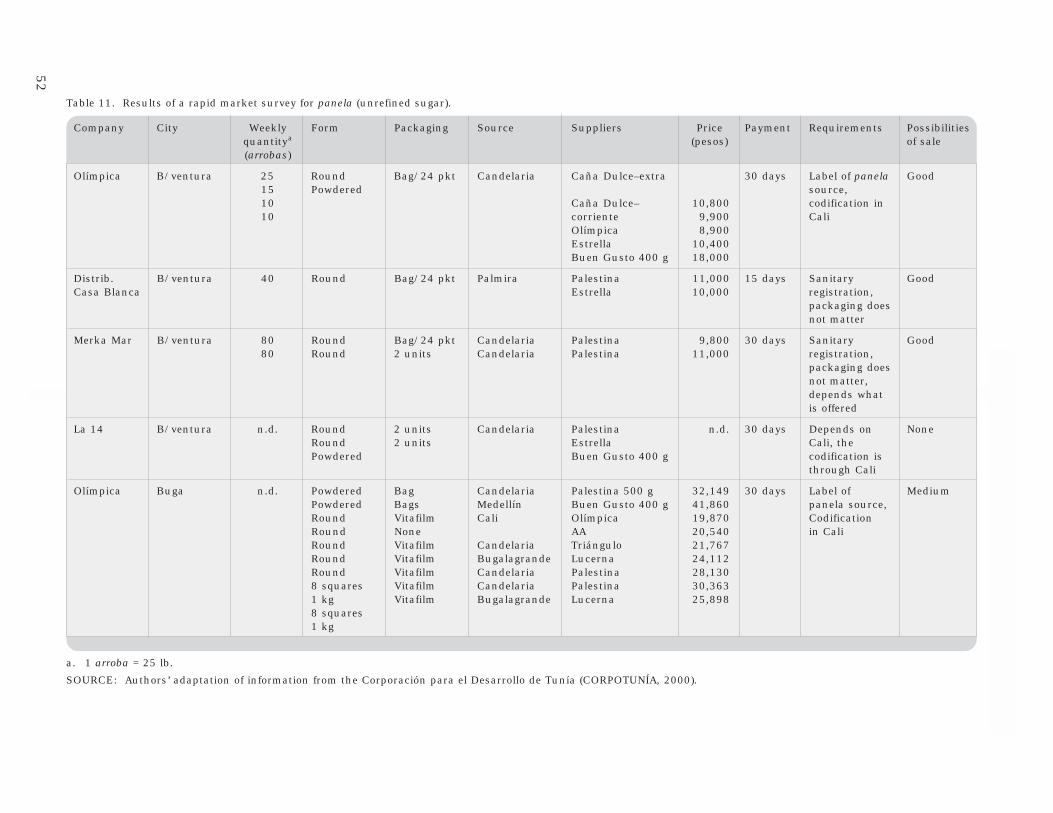
52
Pa
rticipa
tory M
ark
et Ch
ain
An
aly
sis for Sm
allh
older P
rodu
cers
Table 11. Results of a rapid market survey for panela (unrefined sugar).
Company City Weekly Form Packaging Source Suppliers Price Payment Requirements Possibilitiesquantitya (pesos) of sale(arrobas)
Olímpica B/ventura 25 Round Bag/24 pkt Candelaria Caña Dulce–extra 30 days Label of panela Good15 Powdered source,10 Caña Dulce– 10,800 codification in10 corriente 9,900 Cali
Olímpica 8,900Estrella 10,400Buen Gusto 400 g 18,000
Distrib. B/ventura 40 Round Bag/24 pkt Palmira Palestina 11,000 15 days Sanitary GoodCasa Blanca Estrella 10,000 registration,
packaging doesnot matter
Merka Mar B/ventura 80 Round Bag/24 pkt Candelaria Palestina 9,800 30 days Sanitary Good80 Round 2 units Candelaria Palestina 11,000 registration,
packaging doesnot matter,depends whatis offered
La 14 B/ventura n.d. Round 2 units Candelaria Palestina n.d. 30 days Depends on NoneRound 2 units Estrella Cali, thePowdered Buen Gusto 400 g codification is
through Cali
Olímpica Buga n.d. Powdered Bag Candelaria Palestina 500 g 32,149 30 days Label of MediumPowdered Bags Medellín Buen Gusto 400 g 41,860 panela source,Round Vitafilm Cali Olímpica 19,870 CodificationRound None AA 20,540 in CaliRound Vitafilm Candelaria Triángulo 21,767Round Vitafilm Bugalagrande Lucerna 24,112Round Vitafilm Candelaria Palestina 28,1308 squares Vitafilm Candelaria Palestina 30,3631 kg Vitafilm Bugalagrande Lucerna 25,8988 squares1 kg
a. 1 arroba = 25 lb.
SOURCE: Authors’ adaptation of information from the Corporación para el Desarrollo de Tunía (CORPOTUNÍA, 2000).
53
Planning and Executing a Rapid Market Survey
Results from the analysis for the enterprisedevelopment stage:
· Identified market opportunities for anenterprise.
· Key constraints in the market chain.
· Technology requirements to enter a specificmarket.
· Promising partners in the market chain, or inresearch, that may be able to assist indeveloping an idea to a pilot stage.
· Names of potential business partners thatmay want to test a new product.
Essential results from the demand side ofthe market chain analysis:
· Identify the major products and market chains.
· Provide figures on the size of these markets,and a figure of the total market demand forthe product in question.
· At the product level, information is requiredon price, volume, trends, quality criteria,current uses, and potential uses.
· The results should prioritize products interms of where the enterprise can increasesales, increase product value, and volume oftrade (i.e., how to be more competitive).
· The process of demand analysis should recordthe names of traders, buyers, and processors,so that any future intervention can bedeveloped in partnership with these actorsafter the analysis of the results have beenmade.
Essential results from the supply side ofthe market chain analysis:
· A map of the zone being analyzed with majorproduction zones, of the selected commodity.
· For a commodity, the study should provideinformation on seasonality of production.
· Trend information on prices of the target rawcommodity and if possible for processedproducts derived from the raw material (i.e.,cassava roots, cassava chips, cassava flour,cassava starch, etc.).
· Marketing costs along the market chain,showing costs paid by and to theintermediaries and from the farmer to theconsumer. This information should includemargins along the chain.
· Flows of the commodity through the mainsupply chains, coming from the major areasof production.
Using ResultsThe results of a rapid market survey are usefulin various ways. First, the results give an
indication of the types of product(s) in demandand information on volumes and prices ofproduce entering the market. Information such ashow much of the product the market is presentlyabsorbing and at what price (a rough proxy forproduct demand) is important. The survey resultswill also provide a clearer idea on productdelivery and the form of payment presently used.Based on this information, the differencesbetween the quality of this product or itspackaging and existing market norms can beidentified. Also, it is possible to revise themechanisms of payment managed by the clients,analyze which is the most favorable for themarket chain’s producers, and what would be theimplications of beginning negotiations withdifferent types of buyers19.
Second, the survey should provide initial ideas onopportunities and constraints in the system andareas of inefficiency or excess rents in the marketchain. These aspects of the study highlight areasfor innovation. Finally, the survey will alsoprovide a list of contacts of people in the marketchain that have expressed an interest in furtherparticipation in developing the enterprisestrategy. This is essential, as it is these actorswho will be crucial in bringing together andparticipating in new agroenterprise initiativesthat feed into the market chain concept.
Based on the survey, clients can be classifiedaccording to the possibility of selling to them ortheir strategic value for the market chain. Someuseful criteria in this exercise can be the volumethat each client manages, the segment s/heattends, the use s/he gives to the product20, theprice s/he pays or is prepared to pay, anddisposition (or not) to establish strategic relations
19. A good evaluation of the requirements and rules ofthe game that reign in different segments of themarket is useful. At times a “good” market turns outto be not so good when these factors are analyzed. Aconcrete case is the supermarkets that tend toextend payments to their suppliers for 30 days ormore, and at the same time discount money forproduct not sold. At the outset, their prices andvolumes are favorable, but it may not be the mostprofitable segment for small-scale producers.
20. If clients exist that use the product in different forms(for example, the extraction of essential oils fromaromatic plants), it is important to take them intoaccount. Sometimes these non-traditionalbusinesses have greater possibilities of growth anddemand for strategic relations than the traditionalchannels. Furthermore, because of being relativelynew, there is possibly less competition in thesesegments.
54
Participatory Market Chain Analysis for Smallholder Producers
Feeding Back Results
The team leader or lead writer should preparewritten and oral/PowerPoint slidepresentations. The results should be circulatedto the group and be fully understood by thefarmer groups. Hence the presentation needs tobe well rehearsed and provide the mostimportant details of the study, i.e., essentialinformation, that has been mentioned but alsowhat this means in terms of potentialapplication as related to the:
· Enterprise/market opportunities.
· Research, development, and service providerinnovation opportunities.
· Local administration and policy developmentopportunities.
In the reporting stage it is highly recommendedto include several of the market chain’s key
producers or processors, since these actors arein a good position to evaluate the results, give areality check where needed, and assist indiffusing survey results to their neighbors andacquaintances.
In this section, we reviewed the principalreasons for carrying out a rapid market surveyif we do not have access to up-to-date data onthe products and markets with which to work. Ashort list of the key data to collect regardingclients, product characteristics, form ofpayment, and other strategic themes werediscussed. Finally, some simple methods, formsof documenting the results, and theirusefulness for a strategy to increasecompetitiveness were mentioned. In the nextsection, we will proceed to identify the keyactors and design strategies to convene them forthe strategy’s elaboration.
with other members of the market chain. At thistime, it is important to make sure thatinformation generated covers the market(s) inwhich we hope to work.
Finalizing the process of information and marketcontacts, the organization or facilitating groupshould have a clear idea of:
· Who the clients of the market chain’sproduct(s) are.
· Where they are located and how to contactthem.
· The rules of the game that govern the marketand its most important segments.
· The quality requirements for diverse marketsegments.
· Which of the clients should participate(directly or indirectly) in the design of astrategy to increase competitiveness?
55
Identification of Key “Actors” in Market Chains and Steps for Business Planning
SECTION 7
Identification of Key “Actors” in Market Chainsand Steps for Business Planning
Guiding questions1. Who are the key actors in the market chain that should be consulted for their point of view?2. Are there important differences between actors that participate in the same link of the market
chain? What are they? Why do they exist?3. Why is it useful to differentiate the actors along the market chain? What are some advantages
or disadvantages of doing this?4. Which actors have the capacity to lead processes of innovation in the market chain? Which
factors are important for promoting lasting changes in the market chain?
IntroductionUp to this point in the practical section of theguide we have covered two steps whichcontribute towards our aim of developing astrategy to increase market chaincompetitiveness:
(i) Selecting the market chain in which to work.(ii) Executing a market survey.
In this section, we will cover the final step ofpreparation prior to developing the market chainstrategy. Having undertaken a rapid marketsurvey, the group will have made contact withnumerous actors in the market chain. Thissection provides methods to identify key actors inthe market chain and a strategy for theorganization of workshops for the development ofthe new market chain strategy. At the end of this
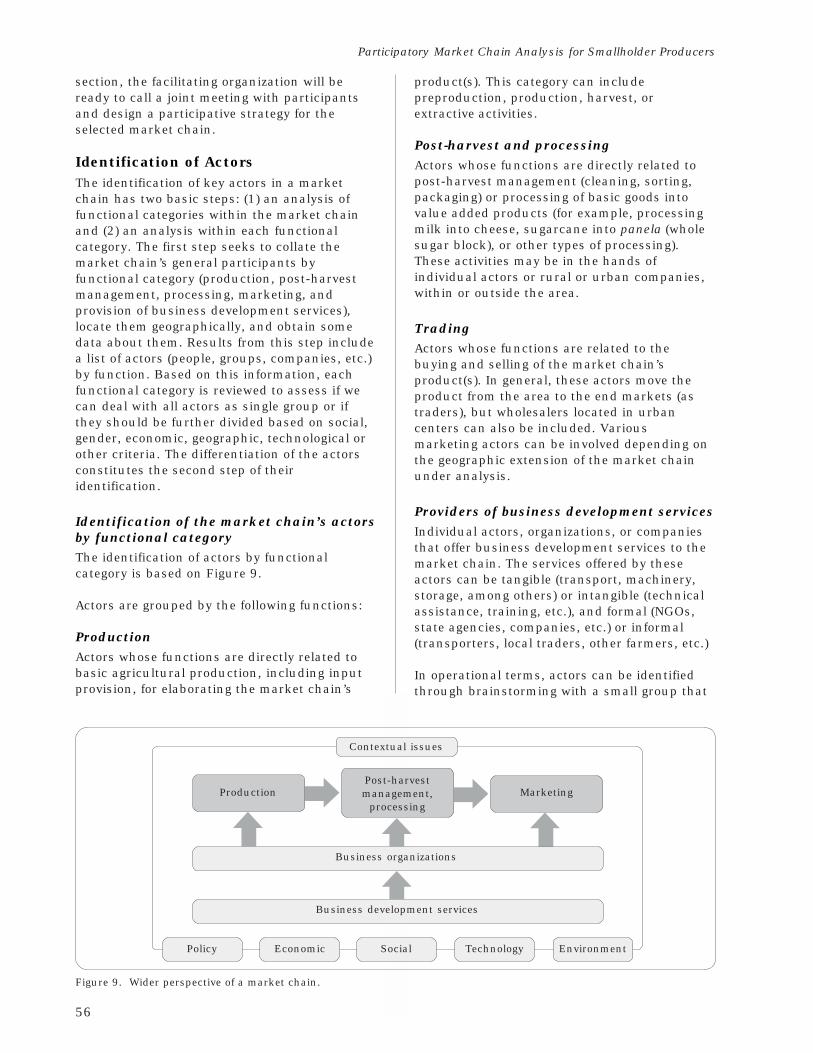
56
Participatory Market Chain Analysis for Smallholder Producers
section, the facilitating organization will beready to call a joint meeting with participantsand design a participative strategy for theselected market chain.
Identification of ActorsThe identification of key actors in a marketchain has two basic steps: (1) an analysis offunctional categories within the market chainand (2) an analysis within each functionalcategory. The first step seeks to collate themarket chain’s general participants byfunctional category (production, post-harvestmanagement, processing, marketing, andprovision of business development services),locate them geographically, and obtain somedata about them. Results from this step includea list of actors (people, groups, companies, etc.)by function. Based on this information, eachfunctional category is reviewed to assess if wecan deal with all actors as single group or ifthey should be further divided based on social,gender, economic, geographic, technological orother criteria. The differentiation of the actorsconstitutes the second step of theiridentification.
Identification of the market chain’s actorsby functional categoryThe identification of actors by functionalcategory is based on Figure 9.
Actors are grouped by the following functions:
ProductionActors whose functions are directly related tobasic agricultural production, including inputprovision, for elaborating the market chain’s
Contextual issues
Post-harvestmanagement,
processing
Business development services
Policy Economic Social
Marketing
Technology Environment
Figure 9. Wider perspective of a market chain.
product(s). This category can includepreproduction, production, harvest, orextractive activities.
Post-harvest and processingActors whose functions are directly related topost-harvest management (cleaning, sorting,packaging) or processing of basic goods intovalue added products (for example, processingmilk into cheese, sugarcane into panela (wholesugar block), or other types of processing).These activities may be in the hands ofindividual actors or rural or urban companies,within or outside the area.
TradingActors whose functions are related to thebuying and selling of the market chain’sproduct(s). In general, these actors move theproduct from the area to the end markets (astraders), but wholesalers located in urbancenters can also be included. Variousmarketing actors can be involved depending onthe geographic extension of the market chainunder analysis.
Providers of business development servicesIndividual actors, organizations, or companiesthat offer business development services to themarket chain. The services offered by theseactors can be tangible (transport, machinery,storage, among others) or intangible (technicalassistance, training, etc.), and formal (NGOs,state agencies, companies, etc.) or informal(transporters, local traders, other farmers, etc.)
In operational terms, actors can be identifiedthrough brainstorming with a small group that
Production
Business organizations
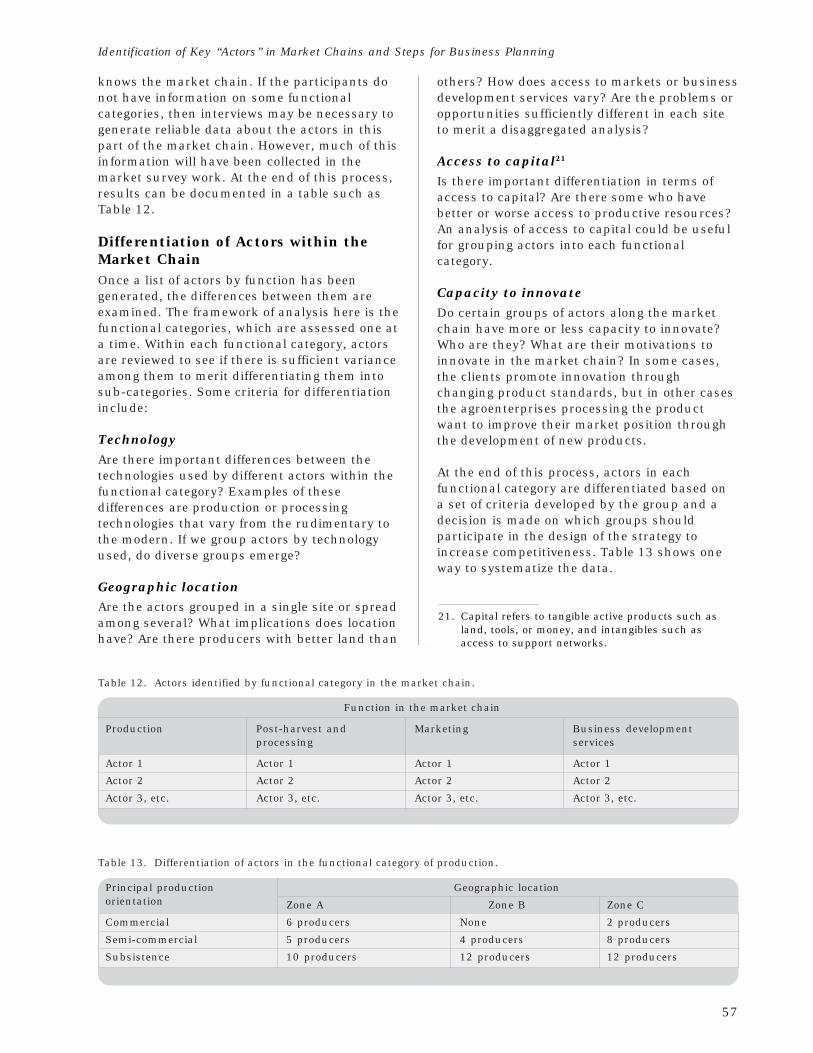
57
Identification of Key “Actors” in Market Chains and Steps for Business Planning
knows the market chain. If the participants donot have information on some functionalcategories, then interviews may be necessary togenerate reliable data about the actors in thispart of the market chain. However, much of thisinformation will have been collected in themarket survey work. At the end of this process,results can be documented in a table such asTable 12.
Differentiation of Actors within theMarket ChainOnce a list of actors by function has beengenerated, the differences between them areexamined. The framework of analysis here is thefunctional categories, which are assessed one ata time. Within each functional category, actorsare reviewed to see if there is sufficient varianceamong them to merit differentiating them intosub-categories. Some criteria for differentiationinclude:
TechnologyAre there important differences between thetechnologies used by different actors within thefunctional category? Examples of thesedifferences are production or processingtechnologies that vary from the rudimentary tothe modern. If we group actors by technologyused, do diverse groups emerge?
Geographic locationAre the actors grouped in a single site or spreadamong several? What implications does locationhave? Are there producers with better land than
Table 12. Actors identified by functional category in the market chain.
Function in the market chain
Production Post-harvest and Marketing Business developmentprocessing services
Actor 1 Actor 1 Actor 1 Actor 1
Actor 2 Actor 2 Actor 2 Actor 2
Actor 3, etc. Actor 3, etc. Actor 3, etc. Actor 3, etc.
others? How does access to markets or businessdevelopment services vary? Are the problems oropportunities sufficiently different in each siteto merit a disaggregated analysis?
Access to capital21
Is there important differentiation in terms ofaccess to capital? Are there some who havebetter or worse access to productive resources?An analysis of access to capital could be usefulfor grouping actors into each functionalcategory.
Capacity to innovateDo certain groups of actors along the marketchain have more or less capacity to innovate?Who are they? What are their motivations toinnovate in the market chain? In some cases,the clients promote innovation throughchanging product standards, but in other casesthe agroenterprises processing the productwant to improve their market position throughthe development of new products.
At the end of this process, actors in eachfunctional category are differentiated based ona set of criteria developed by the group and adecision is made on which groups shouldparticipate in the design of the strategy toincrease competitiveness. Table 13 shows oneway to systematize the data.
Table 13. Differentiation of actors in the functional category of production.
Principal production Geographic locationorientation Zone A Zone B Zone C
Commercial 6 producers None 2 producers
Semi-commercial 5 producers 4 producers 8 producers
Subsistence 10 producers 12 producers 12 producers
21. Capital refers to tangible active products such asland, tools, or money, and intangibles such asaccess to support networks.
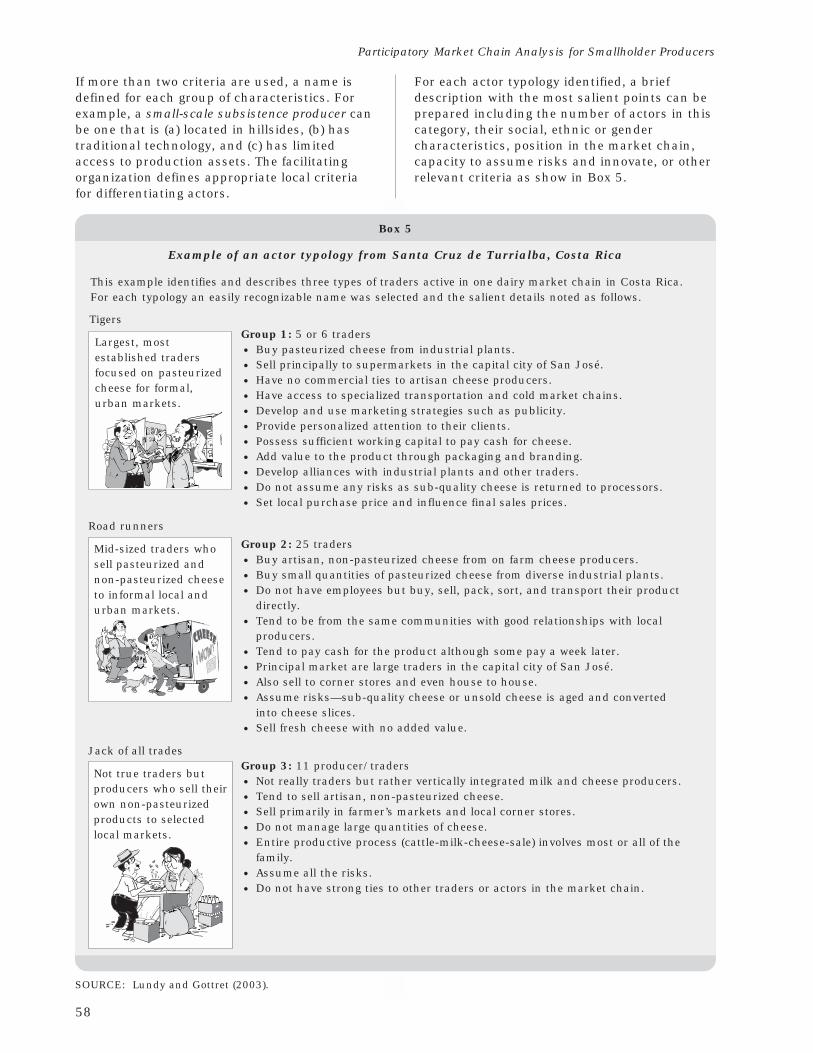
58
Participatory Market Chain Analysis for Smallholder Producers
If more than two criteria are used, a name isdefined for each group of characteristics. Forexample, a small-scale subsistence producer canbe one that is (a) located in hillsides, (b) hastraditional technology, and (c) has limitedaccess to production assets. The facilitatingorganization defines appropriate local criteriafor differentiating actors.
For each actor typology identified, a briefdescription with the most salient points can beprepared including the number of actors in thiscategory, their social, ethnic or gendercharacteristics, position in the market chain,capacity to assume risks and innovate, or otherrelevant criteria as show in Box 5.
SOURCE: Lundy and Gottret (2003).
Box 5
Example of an actor typology from Santa Cruz de Turrialba, Costa Rica
This example identifies and describes three types of traders active in one dairy market chain in Costa Rica.For each typology an easily recognizable name was selected and the salient details noted as follows.
Group 1: 5 or 6 traders
· Buy pasteurized cheese from industrial plants.
· Sell principally to supermarkets in the capital city of San José.
· Have no commercial ties to artisan cheese producers.
· Have access to specialized transportation and cold market chains.
· Develop and use marketing strategies such as publicity.
· Provide personalized attention to their clients.
· Possess sufficient working capital to pay cash for cheese.
· Add value to the product through packaging and branding.
· Develop alliances with industrial plants and other traders.
· Do not assume any risks as sub-quality cheese is returned to processors.
· Set local purchase price and influence final sales prices.
Group 2: 25 traders
· Buy artisan, non-pasteurized cheese from on farm cheese producers.
· Buy small quantities of pasteurized cheese from diverse industrial plants.
· Do not have employees but buy, sell, pack, sort, and transport their productdirectly.
· Tend to be from the same communities with good relationships with localproducers.
· Tend to pay cash for the product although some pay a week later.
· Principal market are large traders in the capital city of San José.
· Also sell to corner stores and even house to house.
· Assume risks—sub-quality cheese or unsold cheese is aged and convertedinto cheese slices.
· Sell fresh cheese with no added value.
Group 3: 11 producer/traders
· Not really traders but rather vertically integrated milk and cheese producers.
· Tend to sell artisan, non-pasteurized cheese.
· Sell primarily in farmer’s markets and local corner stores.
· Do not manage large quantities of cheese.
· Entire productive process (cattle-milk-cheese-sale) involves most or all of thefamily.
· Assume all the risks.
· Do not have strong ties to other traders or actors in the market chain.
Tigers
Largest, mostestablished tradersfocused on pasteurizedcheese for formal,urban markets.
Road runners
Mid-sized traders whosell pasteurized andnon-pasteurized cheeseto informal local andurban markets.
Jack of all trades
Not true traders butproducers who sell theirown non-pasteurizedproducts to selectedlocal markets.
59
Identification of Key “Actors” in Market Chains and Steps for Business Planning
The objective of this exercise is not tocomplicate the selection process of participants,but rather to verify that groups representativeof the all market chain functions will beincluded in the design phase. The mainjustification for this is to ensure that we willreceive the most complete view possible of themarket chain. If, for example, we only includeprocessors using modern technology, theidentified problems and support options will beadequate for them, but not for the otherprocessors that use more rudimentarytechnology. The same occurs with thegeographic location of the market chain actors.Hillside producers, for example, commonly facedifferent problems than do lowland producers.What is important is to ensure that all groupsexpected to participate in market chain analysisand in the final strategy are identified andincluded. This approach correctly identifieslimitations and constructs adequate solutionsfor their diverse conditions.
Meetings to Convene the ActorsOnce a market chain’s actors have beenidentified and analyzed, representatives fromeach group are selected to participate indesigning the strategy to increase marketcompetitiveness. It is neither necessary nordesirable to convene all of the actors, but ratherto choose a subgroup of strategic actors for thisprocess. The definition of strategic depends onthe objectives of the strategy. If we are seekingto improve the links of small-scale hillsideproducers with an intermediate urban market,and finally with various export companies, thenstrategic actors should be selected from each ofthese groups.
For the selection of these actors, two generalcriteria have been useful: (1) interest inparticipating and (2) capacity to improve themarket chain. The second criterion is importantsince it leads us to analyze which of the actorscan influence the market chain most andincludes these powerful actors, sometimesknown as market chain “captains”, in theexercise. These persons and companies exercisediverse forms of influence on the market chain.For example, a producer or group of producersthat has experience in developing innovativeproduction technologies can exert a lot ofinfluence on how production occurs. In asimilar fashion, a processing company that isinterested in new forms of product presentation,
developing new products for the market, orentering an alliance with producers can havegreat influence. The final buyers of the producthave purchasing power, and if they participate,they can facilitate rapid and lasting changes inthe relations between other actors. Finally, thesupport organization(s) (including the one thatfacilitates the market chain analysis) hasnegotiating power with the diverse actors.Often, this power is used to negotiate betterterms of exchange between the different actors,and at the same time verify that all arecomplying with what was agreed on. In thissense, all of the identified actors are reviewedand the most appropriate selected for theexercise.
An observation on numbersA common error is to attempt to involveeveryone. Provided that good representation ofthe different actors exists, there is no benefit inhaving a larger number of participants. Inpractice, producers are the most numerousparticipants, followed by processors andsupport organizations. The group that leastparticipates in workshops, but not in theimplementation of the strategy, tends to betraders or buyers. Try to assemble the mostactive, respected and knowledgeable people.
Organizing WorkshopsWorkshops with identified actors for mappingthe market chain, identification, and analysis ofproblems and of final negotiation are theprincipal form of obtaining information,discussing difficulties, seeking possiblesolutions, and achieving agreements among theactors. Within the workshops, the main factorsto keep in mind are: explaining the process ofelaborating a strategy to increasecompetitiveness, the site and the time neededfor each workshop and for the whole process,the expected results and benefits, and the useof the results. Each factor is described below.
Selection of an adequate siteThe elaboration of the strategy requires variousspaces for group work, plus a central site whereall participants can be brought together. Thefollowing steps of the method explain when todo group work and when to hold plenarysessions. If separate sites are used for differentactors, we recommend they are close enough tofacilitate plenary sessions.
60
Participatory Market Chain Analysis for Smallholder Producers
SchedulingThe methods described in this guide requiretime. It is important to clarify with theparticipants how much time is needed, and howmuch time they are prepared to invest.
The processAt the start of the first workshop or informativemeeting, it is important to explain toparticipants why increased competitiveness isimportant, how the process will function, whowill participate, at what times, and the expectedresults and benefits. Highlighting that thisprocess seeks synergies among actors isimportant to clarify that the process does notintend to exclude actors, but rather to improvethe overall functioning of the market chain.
Presentation of participantsOnce the process is clarified, we recommend around of presentations to provide backgroundon the roles and experience of the actorspresent. There are many ways of doing this,such as choosing a method that promotescontacts along the market chain, for example,traders present producers, processors presentsupport organizations, and then vice versa. Theidea is to show to the group who theparticipants are, their role in the market chain,and what their expectations or interests are inthe process.
Expected outputsAt the start, it is a good idea to explain theexpected outputs of the process. Generally,these results seek to increase the marketchain’s competitiveness, but it may be that thefacilitating organization wishes to highlightadditional benefits for the market chain actors.For example, explaining to those that offerbusiness development services that the resultscan be used to present funding proposals toimprove the market chain, or to the traders thatresults will include shared quality criteria alongthe market chain.
Use of resultsFrom the start it is necessary to make clear thatthe results of this process will be shared amongthe participants, may form part of futureprojects, and are the basis for negotiation at theend of the process. If there are any concerns inthis regard, it is good to clarify them at thistime or achieve specific agreements about theuse of the information. At the end of each stage
of the process, systematized results should beshared with all participants in a timely fashion.
Ownership of resultsGiven that most of the information comes fromthe market chain actors, their contributionsmust be recognized in whatever document orpresentation comes out of the process. Werecommend listing the names of the chainactors who have participated in each workshopon the first page of the report, not only to givecredit where it is due, but also as a way ofbuilding ownership of the process. Thefacilitating organization should be recognizedfor its work, but it must be remembered thatthe real owners of the information are themarket chain actors themselves.
Timeline for workshopsDeveloping a strategy to increasecompetitiveness usually requires four 6-hourworkshops, and which can be organized over3 or 4 months, depending on the availability ofthe actors. These workshops cover:
(i) Market chain analysis.(ii) Identification of limiting factors.(iii) Proposed solutions to these limiting factors.(iv) Negotiation among the market chain actors
for the final strategy.
The information in Table 14 shows a timelineused by an NGO in Colombia. However, underdifferent circumstances and at different levels ofintervention, these timeframes can change. InMadagascar, which initially developed theprocess within a pilot project, all four workshopexercises, for 6 market chains, focused in at adistrict level of intervention, were completedwithin one 3-day residential meeting. While thiswas efficient, leaving time between meetings hascertain benefits in that it allows a widerdiffusion of results and opportunities forinformal discussions among participants thatmay facilitate the later process of negotiation.
Therefore, the service provider needs to adaptthis methodology to the situation, based onavailable resource of time and money.
Sources of Market Chain InformationAs we enter into the design phase, the sourcesof primary information on the market chain willtend to be from the actors themselves. Thisinformation may be limited as some market
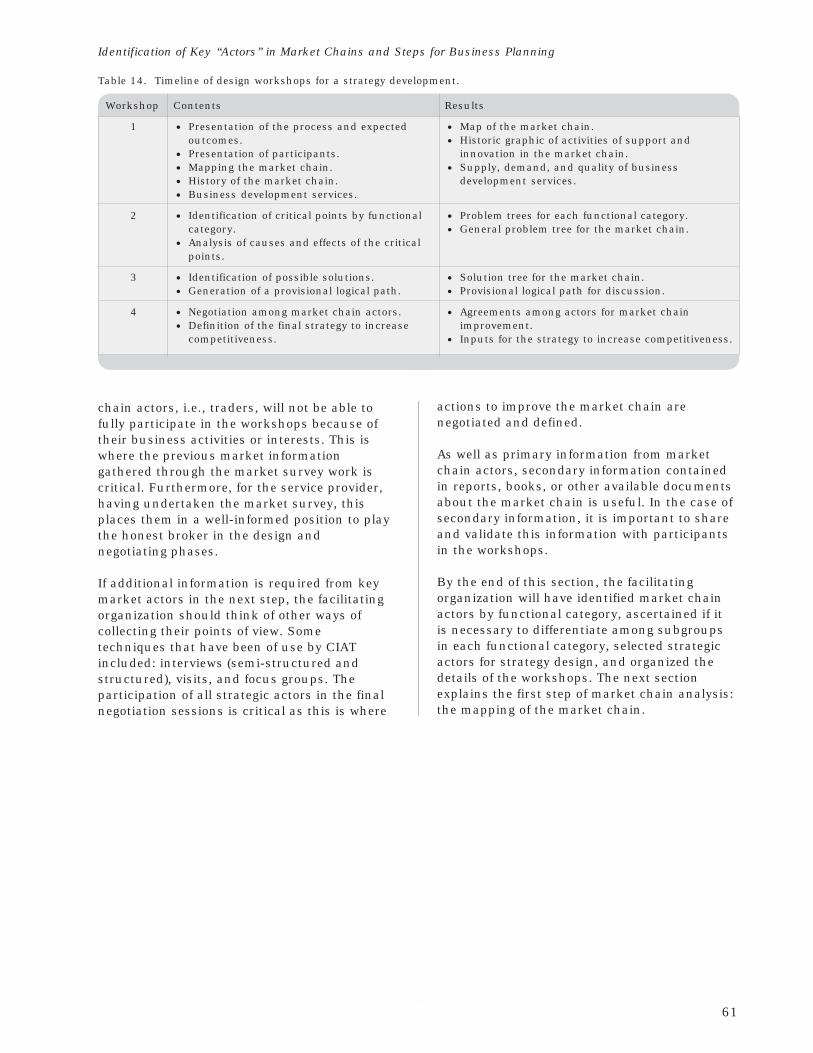
61
Identification of Key “Actors” in Market Chains and Steps for Business Planning
Table 14. Timeline of design workshops for a strategy development.
Workshop Contents Results
1 · Presentation of the process and expected · Map of the market chain.outcomes. · Historic graphic of activities of support and
· Presentation of participants. innovation in the market chain.
· Mapping the market chain. · Supply, demand, and quality of business
· History of the market chain. development services.
· Business development services.
2 · Identification of critical points by functional · Problem trees for each functional category.category. · General problem tree for the market chain.
· Analysis of causes and effects of the criticalpoints.
3 · Identification of possible solutions. · Solution tree for the market chain.
· Generation of a provisional logical path. · Provisional logical path for discussion.
4 · Negotiation among market chain actors. · Agreements among actors for market chain
· Definition of the final strategy to increase improvement.competitiveness. · Inputs for the strategy to increase competitiveness.
chain actors, i.e., traders, will not be able tofully participate in the workshops because oftheir business activities or interests. This iswhere the previous market informationgathered through the market survey work iscritical. Furthermore, for the service provider,having undertaken the market survey, thisplaces them in a well-informed position to playthe honest broker in the design andnegotiating phases.
If additional information is required from keymarket actors in the next step, the facilitatingorganization should think of other ways ofcollecting their points of view. Sometechniques that have been of use by CIATincluded: interviews (semi-structured andstructured), visits, and focus groups. Theparticipation of all strategic actors in the finalnegotiation sessions is critical as this is where
actions to improve the market chain arenegotiated and defined.
As well as primary information from marketchain actors, secondary information containedin reports, books, or other available documentsabout the market chain is useful. In the case ofsecondary information, it is important to shareand validate this information with participantsin the workshops.
By the end of this section, the facilitatingorganization will have identified market chainactors by functional category, ascertained if itis necessary to differentiate among subgroupsin each functional category, selected strategicactors for strategy design, and organized thedetails of the workshops. The next sectionexplains the first step of market chain analysis:the mapping of the market chain.
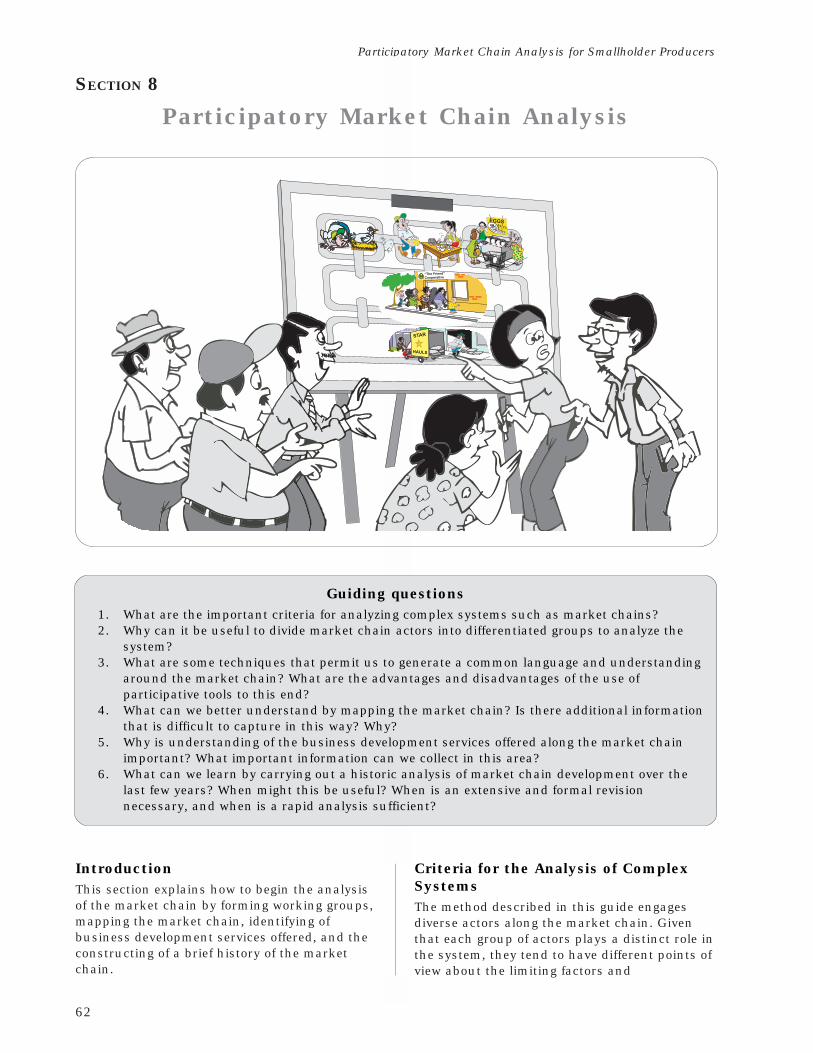
62
Participatory Market Chain Analysis for Smallholder Producers
SECTION 8
Participatory Market Chain Analysis
Guiding questions1. What are the important criteria for analyzing complex systems such as market chains?2. Why can it be useful to divide market chain actors into differentiated groups to analyze the
system?3. What are some techniques that permit us to generate a common language and understanding
around the market chain? What are the advantages and disadvantages of the use ofparticipative tools to this end?
4. What can we better understand by mapping the market chain? Is there additional informationthat is difficult to capture in this way? Why?
5. Why is understanding of the business development services offered along the market chainimportant? What important information can we collect in this area?
6. What can we learn by carrying out a historic analysis of market chain development over thelast few years? When might this be useful? When is an extensive and formal revisionnecessary, and when is a rapid analysis sufficient?
IntroductionThis section explains how to begin the analysisof the market chain by forming working groups,mapping the market chain, identifying ofbusiness development services offered, and theconstructing of a brief history of the marketchain.
Criteria for the Analysis of ComplexSystemsThe method described in this guide engagesdiverse actors along the market chain. Giventhat each group of actors plays a distinct role inthe system, they tend to have different points ofview about the limiting factors and
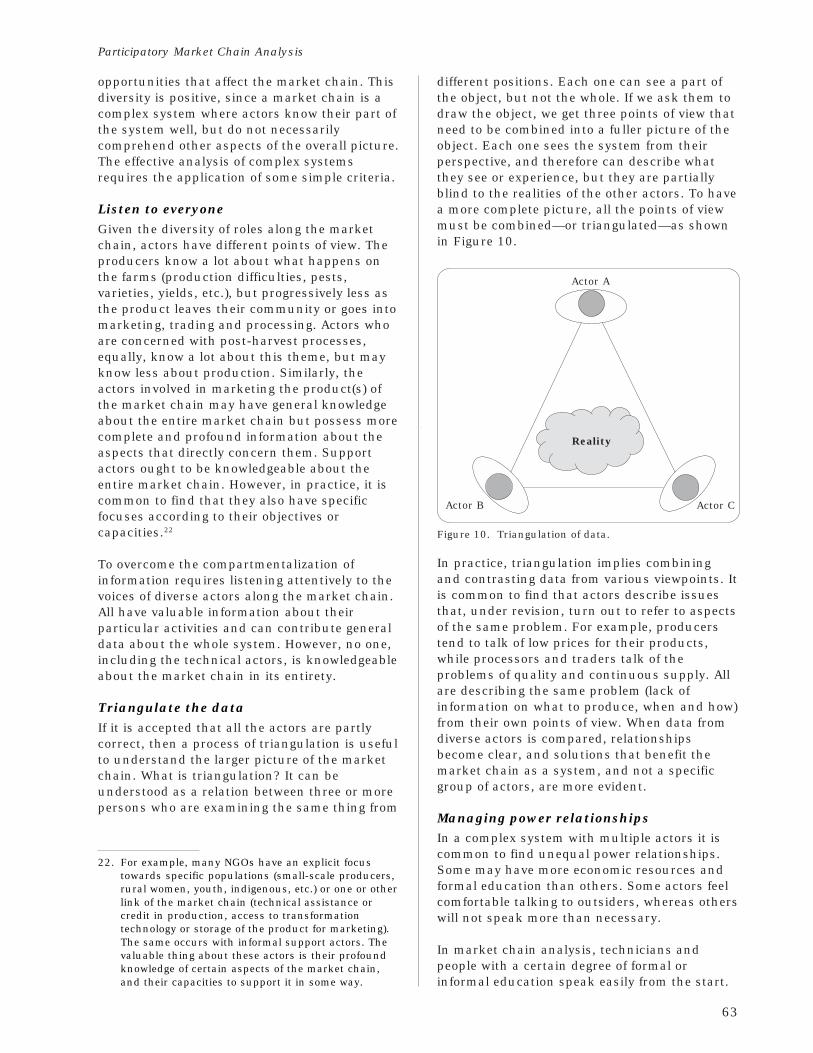
63
Participatory Market Chain Analysis
opportunities that affect the market chain. Thisdiversity is positive, since a market chain is acomplex system where actors know their part ofthe system well, but do not necessarilycomprehend other aspects of the overall picture.The effective analysis of complex systemsrequires the application of some simple criteria.
Listen to everyoneGiven the diversity of roles along the marketchain, actors have different points of view. Theproducers know a lot about what happens onthe farms (production difficulties, pests,varieties, yields, etc.), but progressively less asthe product leaves their community or goes intomarketing, trading and processing. Actors whoare concerned with post-harvest processes,equally, know a lot about this theme, but mayknow less about production. Similarly, theactors involved in marketing the product(s) ofthe market chain may have general knowledgeabout the entire market chain but possess morecomplete and profound information about theaspects that directly concern them. Supportactors ought to be knowledgeable about theentire market chain. However, in practice, it iscommon to find that they also have specificfocuses according to their objectives orcapacities.22
To overcome the compartmentalization ofinformation requires listening attentively to thevoices of diverse actors along the market chain.All have valuable information about theirparticular activities and can contribute generaldata about the whole system. However, no one,including the technical actors, is knowledgeableabout the market chain in its entirety.
Triangulate the dataIf it is accepted that all the actors are partlycorrect, then a process of triangulation is usefulto understand the larger picture of the marketchain. What is triangulation? It can beunderstood as a relation between three or morepersons who are examining the same thing from
different positions. Each one can see a part ofthe object, but not the whole. If we ask them todraw the object, we get three points of view thatneed to be combined into a fuller picture of theobject. Each one sees the system from theirperspective, and therefore can describe whatthey see or experience, but they are partiallyblind to the realities of the other actors. To havea more complete picture, all the points of viewmust be combined—or triangulated—as shownin Figure 10.
22. For example, many NGOs have an explicit focustowards specific populations (small-scale producers,rural women, youth, indigenous, etc.) or one or otherlink of the market chain (technical assistance orcredit in production, access to transformationtechnology or storage of the product for marketing).The same occurs with informal support actors. Thevaluable thing about these actors is their profoundknowledge of certain aspects of the market chain,and their capacities to support it in some way.
Reality
Actor A
Actor B Actor C
Figure 10. Triangulation of data.
In practice, triangulation implies combiningand contrasting data from various viewpoints. Itis common to find that actors describe issuesthat, under revision, turn out to refer to aspectsof the same problem. For example, producerstend to talk of low prices for their products,while processors and traders talk of theproblems of quality and continuous supply. Allare describing the same problem (lack ofinformation on what to produce, when and how)from their own points of view. When data fromdiverse actors is compared, relationshipsbecome clear, and solutions that benefit themarket chain as a system, and not a specificgroup of actors, are more evident.
Managing power relationshipsIn a complex system with multiple actors it iscommon to find unequal power relationships.Some may have more economic resources andformal education than others. Some actors feelcomfortable talking to outsiders, whereas otherswill not speak more than necessary.
In market chain analysis, technicians andpeople with a certain degree of formal orinformal education speak easily from the start.
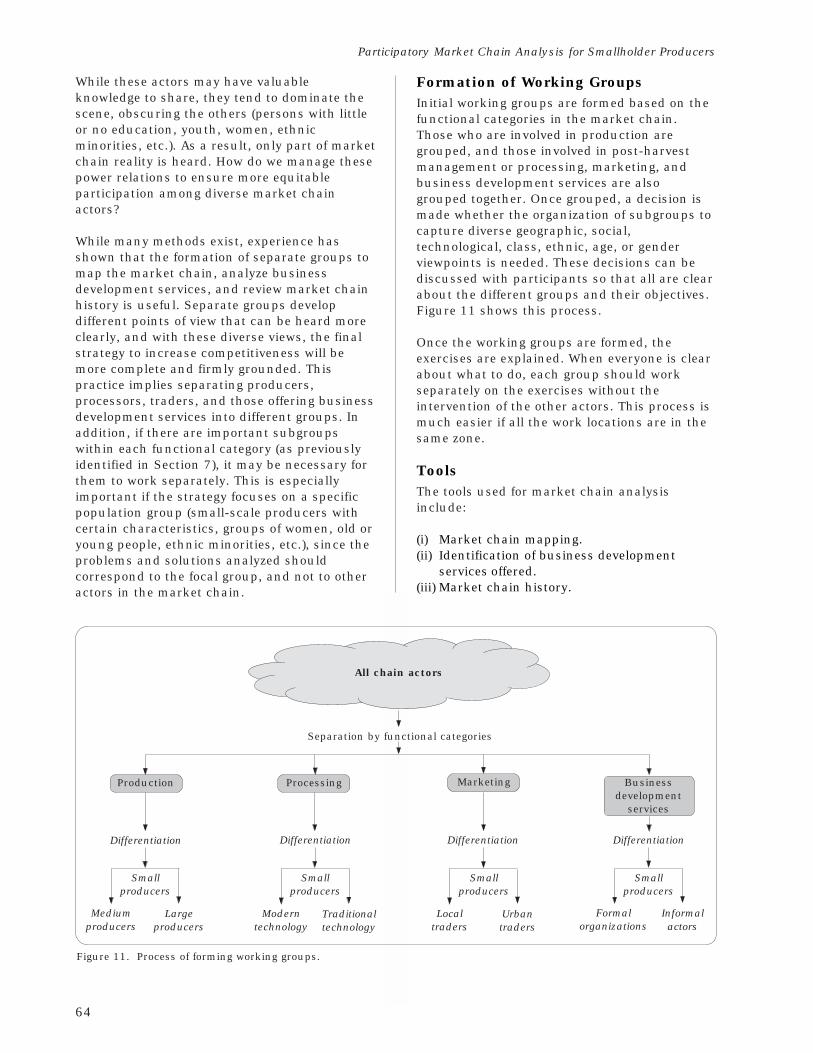
64
Participatory Market Chain Analysis for Smallholder Producers
While these actors may have valuableknowledge to share, they tend to dominate thescene, obscuring the others (persons with littleor no education, youth, women, ethnicminorities, etc.). As a result, only part of marketchain reality is heard. How do we manage thesepower relations to ensure more equitableparticipation among diverse market chainactors?
While many methods exist, experience hasshown that the formation of separate groups tomap the market chain, analyze businessdevelopment services, and review market chainhistory is useful. Separate groups developdifferent points of view that can be heard moreclearly, and with these diverse views, the finalstrategy to increase competitiveness will bemore complete and firmly grounded. Thispractice implies separating producers,processors, traders, and those offering businessdevelopment services into different groups. Inaddition, if there are important subgroupswithin each functional category (as previouslyidentified in Section 7), it may be necessary forthem to work separately. This is especiallyimportant if the strategy focuses on a specificpopulation group (small-scale producers withcertain characteristics, groups of women, old oryoung people, ethnic minorities, etc.), since theproblems and solutions analyzed shouldcorrespond to the focal group, and not to otheractors in the market chain.
Formation of Working GroupsInitial working groups are formed based on thefunctional categories in the market chain.Those who are involved in production aregrouped, and those involved in post-harvestmanagement or processing, marketing, andbusiness development services are alsogrouped together. Once grouped, a decision ismade whether the organization of subgroups tocapture diverse geographic, social,technological, class, ethnic, age, or genderviewpoints is needed. These decisions can bediscussed with participants so that all are clearabout the different groups and their objectives.Figure 11 shows this process.
Once the working groups are formed, theexercises are explained. When everyone is clearabout what to do, each group should workseparately on the exercises without theintervention of the other actors. This process ismuch easier if all the work locations are in thesame zone.
ToolsThe tools used for market chain analysisinclude:
(i) Market chain mapping.(ii) Identification of business development
services offered.(iii) Market chain history.
All chain actors
Separation by functional categories
Production Processing Marketing Businessdevelopment
services
Differentiation Differentiation Differentiation Differentiation
Mediumproducers
Largeproducers
Formalorganizations
Informalactors
Moderntechnology
Traditionaltechnology
Localtraders
Urbantraders
Smallproducers
Figure 11. Process of forming working groups.
Smallproducers
Smallproducers
Smallproducers
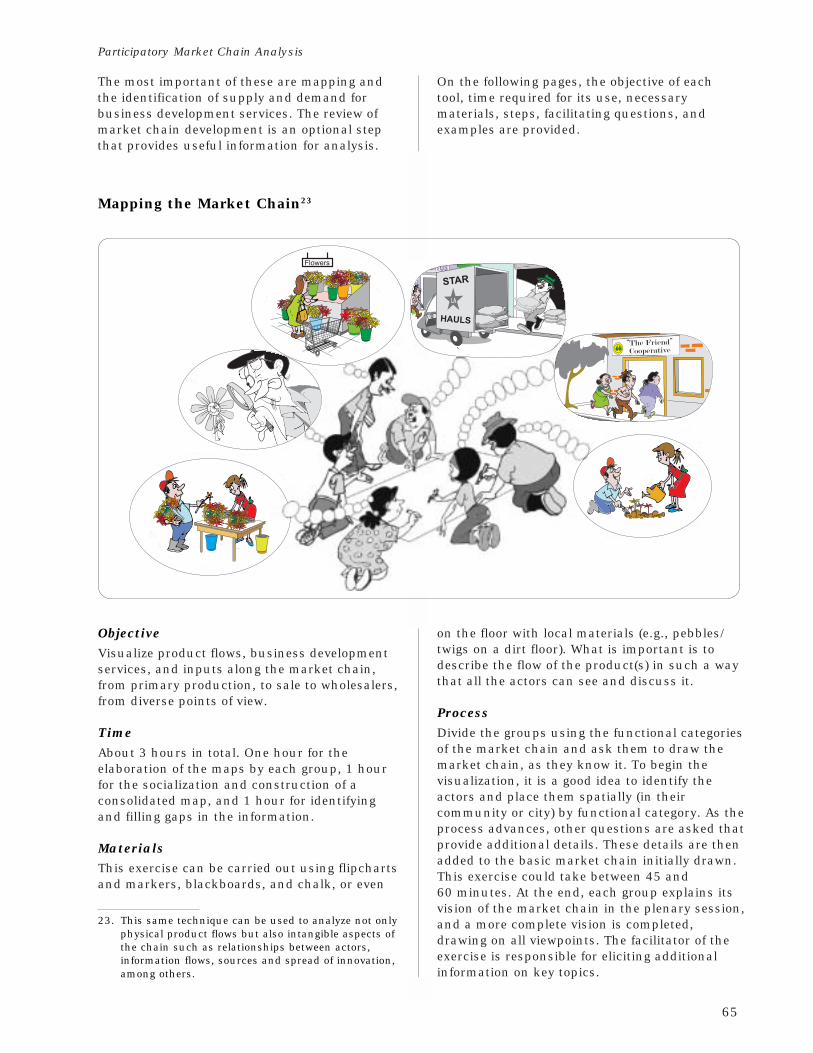
65
Participatory Market Chain Analysis
The most important of these are mapping andthe identification of supply and demand forbusiness development services. The review ofmarket chain development is an optional stepthat provides useful information for analysis.
Mapping the Market Chain23
23. This same technique can be used to analyze not onlyphysical product flows but also intangible aspects ofthe chain such as relationships between actors,information flows, sources and spread of innovation,among others.
ObjectiveVisualize product flows, business developmentservices, and inputs along the market chain,from primary production, to sale to wholesalers,from diverse points of view.
TimeAbout 3 hours in total. One hour for theelaboration of the maps by each group, 1 hourfor the socialization and construction of aconsolidated map, and 1 hour for identifyingand filling gaps in the information.
MaterialsThis exercise can be carried out using flipchartsand markers, blackboards, and chalk, or even
on the floor with local materials (e.g., pebbles/twigs on a dirt floor). What is important is todescribe the flow of the product(s) in such a waythat all the actors can see and discuss it.
ProcessDivide the groups using the functional categoriesof the market chain and ask them to draw themarket chain, as they know it. To begin thevisualization, it is a good idea to identify theactors and place them spatially (in theircommunity or city) by functional category. As theprocess advances, other questions are asked thatprovide additional details. These details are thenadded to the basic market chain initially drawn.This exercise could take between 45 and60 minutes. At the end, each group explains itsvision of the market chain in the plenary session,and a more complete vision is completed,drawing on all viewpoints. The facilitator of theexercise is responsible for eliciting additionalinformation on key topics.
On the following pages, the objective of eachtool, time required for its use, necessarymaterials, steps, facilitating questions, andexamples are provided.
66
Participatory Market Chain Analysis for Smallholder Producers
Facilitating questionsSome basic facilitating questions for thisexercise appear below. We recommendorganizing key questions into a checklist forthose facilitating the group work. Some of thesequestions can be formulated to start or supportthe process of visualization, while others aremore suited for later stages or for reviewing thefinal maps, identifying gaps, andcomplementing the data already generated bythe group. The results of the questions shouldbe noted on the map itself or by one of thefacilitators of the process in his/her notes.These replies greatly enrich the original mapand show participants how much they alreadyknow about the market chain.
Actors:
· Who are they?
· Where are they located?
· What are their functions in the marketchain?
· How do they relate to one another? Arerelations good, average, or poor? Why?
· What are their characteristics (gender, class,age, education, abilities, know-how, etc.)?
Markets:
· Where do we sell what we produce (in eachlink of the market chain)?
Product characteristics:
· What are the characteristics of the product?
· What are the volumes of production,monthly or annually?
· How much of the product is sold in themarkets, monthly or annually?
Costs, yields, and distribution of themarket chain’s value:
· How much does it cost us to produce (ineach link of the market chain)?24
· What are the buying and selling prices ateach stage of the market chain? Are theystable during the year, or do they fluctuate?
· How efficient (yields by area planted,conversion factors, etc.) are the diverseactivities in the market chain?
· What is the distribution of the total incomefrom the market chain between the actors
like? Which groups gain more and whichless, and why?25
Business development services:
· Who (in each link of the market chain)supports us?
· How do they support us? What services dothey offer (in each link of the market chain)?
· What is the quality of the services offered?Here, care must be taken to visualize thesupport received by informal actors(intermediaries, moneylenders, etc.) that attimes are more effective than that of theother support groups.
Rules of the game:
· What is the form of payment at each stage ofthe market chain?
· What are the quality requirements?
· What is the buying frequency?
· Describe the relations between market chainactors. Are they happy with the existingrelationships? Why or why not?
If the facilitating organization has more specificquestions, these can be included in the finalfacilitation tool, making the necessaryadaptations so that they are of maximum helpin visualizing and understanding the marketchain. Additional tools can be combined withthe mapping exercise to document specificinformation of interest to the participants andthe facilitating organization. One example isthat of gender analysis, where the relative rolesof women, men, and children can be analyzedalong the market chain in the variousproductive activities. A more complete analysisin this sense could examine not only roles andresponsibilities but also access to resources,knowledge, and gendered decision making bymarket chain actors.
If, at the end of the exercise, there are parts ofthe market chain with major gaps, it is probablethat we have left out one or more key actors inthese functional categories. A strategy to elicitand include their points of view is needed.
Example from HondurasFigure 12 presents an example of a marketchain map generated by a group of coffee
25. In this part, it is a good to review the role of eachgroup in the market chain bearing in mind the risksassumed, value added, and access to information orkey contacts.
24. Commonly no one has any idea about this, butsometimes one or more producers can provide anapproximate idea.
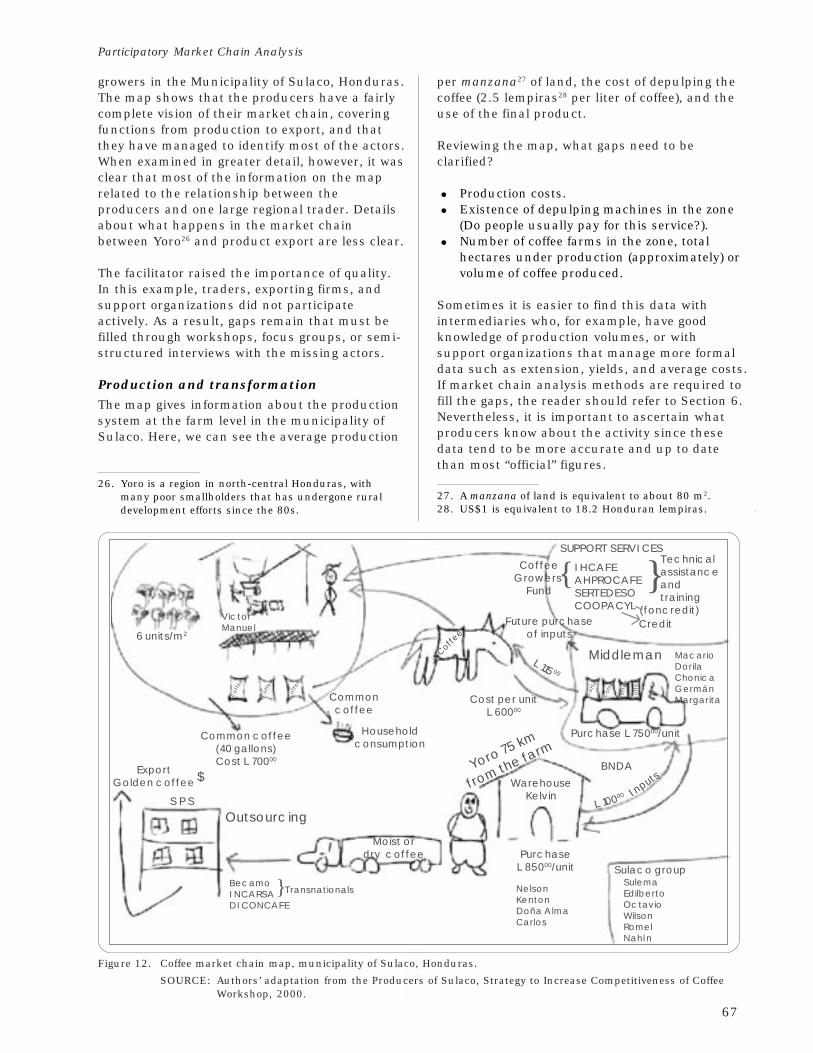
67
Participatory Market Chain Analysis
growers in the Municipality of Sulaco, Honduras.The map shows that the producers have a fairlycomplete vision of their market chain, coveringfunctions from production to export, and thatthey have managed to identify most of the actors.When examined in greater detail, however, it wasclear that most of the information on the maprelated to the relationship between theproducers and one large regional trader. Detailsabout what happens in the market chainbetween Yoro26 and product export are less clear.
The facilitator raised the importance of quality.In this example, traders, exporting firms, andsupport organizations did not participateactively. As a result, gaps remain that must befilled through workshops, focus groups, or semi-structured interviews with the missing actors.
Production and transformationThe map gives information about the productionsystem at the farm level in the municipality ofSulaco. Here, we can see the average production
Figure 12. Coffee market chain map, municipality of Sulaco, Honduras.
SOURCE: Authors’ adaptation from the Producers of Sulaco, Strategy to Increase Competitiveness of CoffeeWorkshop, 2000.
per manzana27 of land, the cost of depulping thecoffee (2.5 lempiras28 per liter of coffee), and theuse of the final product.
Reviewing the map, what gaps need to beclarified?
· Production costs.
· Existence of depulping machines in the zone(Do people usually pay for this service?).
· Number of coffee farms in the zone, totalhectares under production (approximately) orvolume of coffee produced.
Sometimes it is easier to find this data withintermediaries who, for example, have goodknowledge of production volumes, or withsupport organizations that manage more formaldata such as extension, yields, and average costs.If market chain analysis methods are required tofill the gaps, the reader should refer to Section 6.Nevertheless, it is important to ascertain whatproducers know about the activity since thesedata tend to be more accurate and up to datethan most “official” figures.
27. A manzana of land is equivalent to about 80 m2.28. US$1 is equivalent to 18.2 Honduran lempiras.
26. Yoro is a region in north-central Honduras, withmany poor smallholders that has undergone ruraldevelopment efforts since the 80s.
6 units/m2
ExportGolden coffee
S P S
Outsourcing
Moist ordry coffee
WarehouseKelvin
PurchaseL 85000/unit
L 10000
Sulaco group
SUPPORT SERVICESTechnicalassistanceandtraining
Credit
Middleman
Cost per unitL 60000
Commoncoffee
Householdconsumption
coff
ee
coff
ee
coff
ee
Coffee
coff
ee
coff
ee
co
ffe
e
co
ffe
e
IHCAFEAHPROCAFESERTEDESOCOOPACYL
MacarioDorilaChonicaGermánMargarita
SulemaEdilbertoOctavioWilsonRomelNahín
}
Purchase L 75000/unit
}
Yoro 75 km
from the farm
InputsBNDA
NelsonKentonDoña AlmaCarlos
BecamoINCARSADICONCAFE
}
$
CoffeeGrowers’
Fund
Future purchaseof inputs
L 115 00
(foncredit)
Common coffee(40 gallons)Cost L 70000
VictorManuel
Transnationals
68
Participatory Market Chain Analysis for Smallholder Producers
MarketingThe map helps us appreciate Sulaco’s system ofcoffee marketing. The data included are:(a) price of production per load of coffee;(b) traders’ purchase price; (c) names of localtraders with an indication of which ones aremost important; (d) sales price to regionaltraders; (e) names of regional traders with anindication of which is the most important;(f) final destination of the coffee—San PedroSula; and (g) names of the export firms knownby producers.
This exercise provides key information to planfuture research activities, such as semi-structured interviews with the local andregional traders and visits to export firms inSan Pedro Sula.
What are the gaps in this information?
· Prices between Yoro and the export firmsand the price of Honduran coffee ininternational markets.
· The use of “futures” by local traders toguarantee volume at favorable prices. Whoprovides the funding for this? Local tradersor regional traders? What are the advantagesor disadvantages of this system for theactors involved?
· The support lent by intermediaries toproducers (services provided, costs, volumes,and frequency).
Support systemThe support system, both formal and informal,is clearly defined. In this case, producersreceive formal assistance (technical assistance,training, and some credit) from public andprivate firms (see Figure 8), while businesssupport (marketing, transport, inputs, andadvances of working capital through futurepurchases) come from traders.
In the case of the traders, a more complex, two-way relationship is shown, than with supportorganizations. In this space, what data aremissing?
· Information on the actual relationshipsbetween traders and producers. Is it a stablerelationship, or do producers feel exploited?What is the real flow of funds like in thisrelationship? The trader advances resources,but what is the final cost of these resourcesfor the producer?
· More details on the relations between localand regional traders. In addition to buyingthe coffee, what role does the regional traderplay?
· More information on the businessdevelopment services provided by supportorganizations. Are they efficient, of goodquality, sufficient? Does everyone haveaccess to these services? Do they respond toproducers’ needs?
The map was generated in a relatively shortamount of time (less than 1 hour) by a group ofsmall-scale producers. At the same time, other,less complete maps were generated by othergroups. After reviewing all maps, it was decidedto use this one as the base map for the analysisof the coffee market chain in Yorito and Sulaco.Another interesting point is the level of detail(names, for example) that appears for theinformal actors. This contact information is ofgreat use to identify key sources of informationfor follow-up work.
Provision of Business DevelopmentServices
ObjectiveTo make a simple list of business developmentservices that exist along the market chain andto qualify their quality and identify gaps forfuture improvements.
TimeAbout 2 hours in total; 1 hour for identifying,describing, and qualifying the services byfunctional category, and another hour forsocializing the results and comparing themamongst the groups.
MaterialsThis exercise can be done using flipcharts andmarkers, blackboards, and chalk, or even onthe floor with local materials (e.g., pebbles,twigs, chalk, etc.). What is important is todescribe the services supplied and received insuch a way that all the actors can see anddiscuss them.
ProcessContinuing with the same groups used formapping, the groups should proceed to examinesupply and demand of formal and informalbusiness development services in each functionof the market chain. The groups of producers,processors, and traders analyze their respective
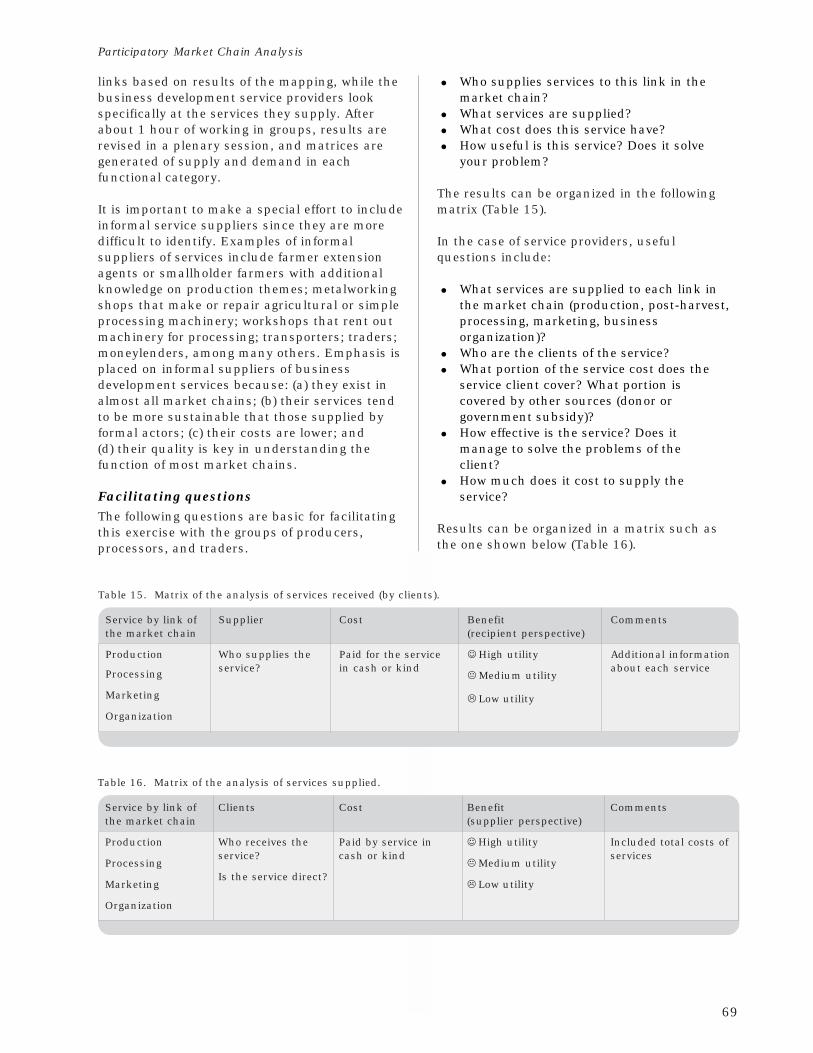
69
Participatory Market Chain Analysis
links based on results of the mapping, while thebusiness development service providers lookspecifically at the services they supply. Afterabout 1 hour of working in groups, results arerevised in a plenary session, and matrices aregenerated of supply and demand in eachfunctional category.
It is important to make a special effort to includeinformal service suppliers since they are moredifficult to identify. Examples of informalsuppliers of services include farmer extensionagents or smallholder farmers with additionalknowledge on production themes; metalworkingshops that make or repair agricultural or simpleprocessing machinery; workshops that rent outmachinery for processing; transporters; traders;moneylenders, among many others. Emphasis isplaced on informal suppliers of businessdevelopment services because: (a) they exist inalmost all market chains; (b) their services tendto be more sustainable that those supplied byformal actors; (c) their costs are lower; and(d) their quality is key in understanding thefunction of most market chains.
Facilitating questionsThe following questions are basic for facilitatingthis exercise with the groups of producers,processors, and traders.
· Who supplies services to this link in themarket chain?
· What services are supplied?
· What cost does this service have?
· How useful is this service? Does it solveyour problem?
The results can be organized in the followingmatrix (Table 15).
In the case of service providers, usefulquestions include:
· What services are supplied to each link inthe market chain (production, post-harvest,processing, marketing, businessorganization)?
· Who are the clients of the service?
· What portion of the service cost does theservice client cover? What portion iscovered by other sources (donor orgovernment subsidy)?
· How effective is the service? Does itmanage to solve the problems of theclient?
· How much does it cost to supply theservice?
Results can be organized in a matrix such asthe one shown below (Table 16).
Table 15. Matrix of the analysis of services received (by clients).
Service by link of Supplier Cost Benefit Commentsthe market chain (recipient perspective)
Production Who supplies the Paid for the service ☺ High utility Additional information
Processing service? in cash or kind" Medium utility
about each service
Marketing # Low utility
Organization
Table 16. Matrix of the analysis of services supplied.
Service by link of Clients Cost Benefit Commentsthe market chain (supplier perspective)
Production Who receives the Paid by service in ☺ High utility Included total costs ofservice? cash or kind services
ProcessingIs the service direct?
" Medium utility
Marketing # Low utility
Organization
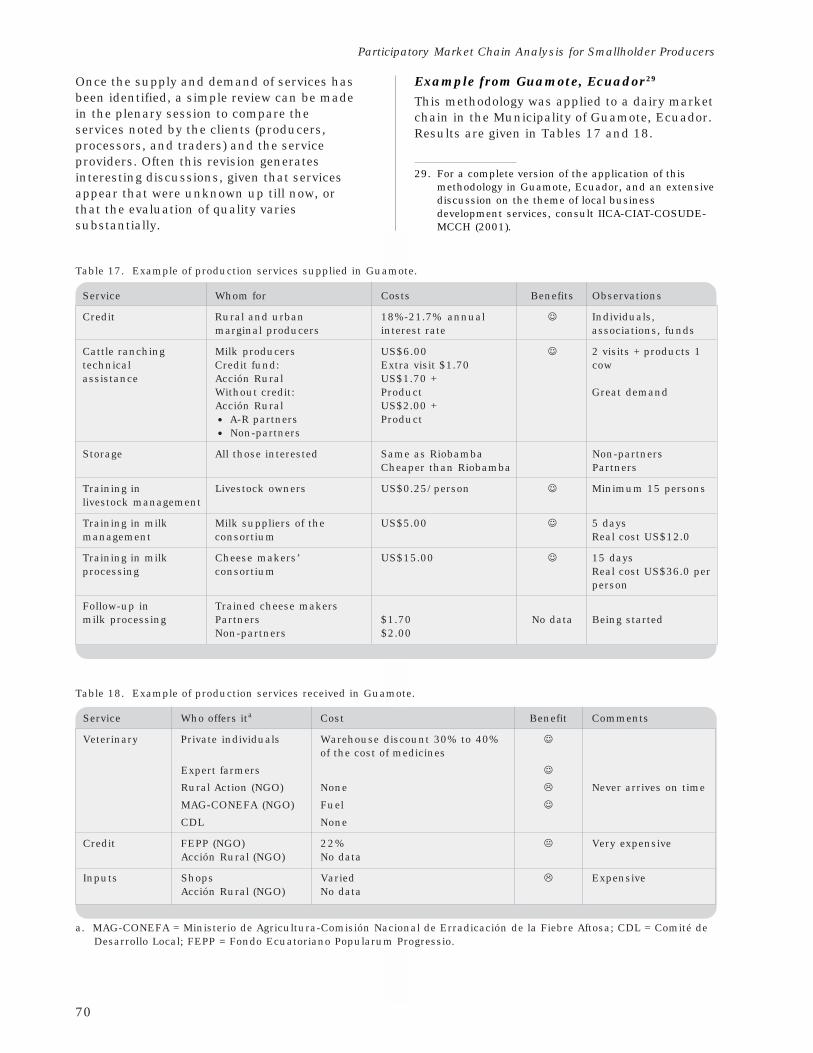
70
Participatory Market Chain Analysis for Smallholder Producers
Once the supply and demand of services hasbeen identified, a simple review can be madein the plenary session to compare theservices noted by the clients (producers,processors, and traders) and the serviceproviders. Often this revision generatesinteresting discussions, given that servicesappear that were unknown up till now, orthat the evaluation of quality variessubstantially.
29. For a complete version of the application of thismethodology in Guamote, Ecuador, and an extensivediscussion on the theme of local businessdevelopment services, consult IICA-CIAT-COSUDE-MCCH (2001).
Table 18. Example of production services received in Guamote.
Service Who offers ita Cost Benefit Comments
Veterinary Private individuals Warehouse discount 30% to 40% ☺of the cost of medicines
Expert farmers ☺
Rural Action (NGO) None # Never arrives on time
MAG-CONEFA (NGO) Fuel ☺
CDL None
Credit FEPP (NGO) 22% " Very expensiveAcción Rural (NGO) No data
Inputs Shops Varied # ExpensiveAcción Rural (NGO) No data
a. MAG-CONEFA = Ministerio de Agricultura-Comisión Nacional de Erradicación de la Fiebre Aftosa; CDL = Comité de Desarrollo Local; FEPP = Fondo Ecuatoriano Popularum Progressio.
Table 17. Example of production services supplied in Guamote.
Service Whom for Costs Benefits Observations
Credit Rural and urban 18%-21.7% annual ☺ Individuals,marginal producers interest rate associations, funds
Cattle ranching Milk producers US$6.00 ☺ 2 visits + products 1technical Credit fund: Extra visit $1.70 cowassistance Acción Rural US$1.70 +
Without credit: Product Great demandAcción Rural US$2.00 +
· A-R partners Product
· Non-partners
Storage All those interested Same as Riobamba Non-partnersCheaper than Riobamba Partners
Training in Livestock owners US$0.25/person ☺ Minimum 15 personslivestock management
Training in milk Milk suppliers of the US$5.00 ☺ 5 daysmanagement consortium Real cost US$12.0
Training in milk Cheese makers’ US$15.00 ☺ 15 daysprocessing consortium Real cost US$36.0 per
person
Follow-up in Trained cheese makersmilk processing Partners $1.70 No data Being started
Non-partners $2.00
Example from Guamote, Ecuador29
This methodology was applied to a dairy marketchain in the Municipality of Guamote, Ecuador.Results are given in Tables 17 and 18.
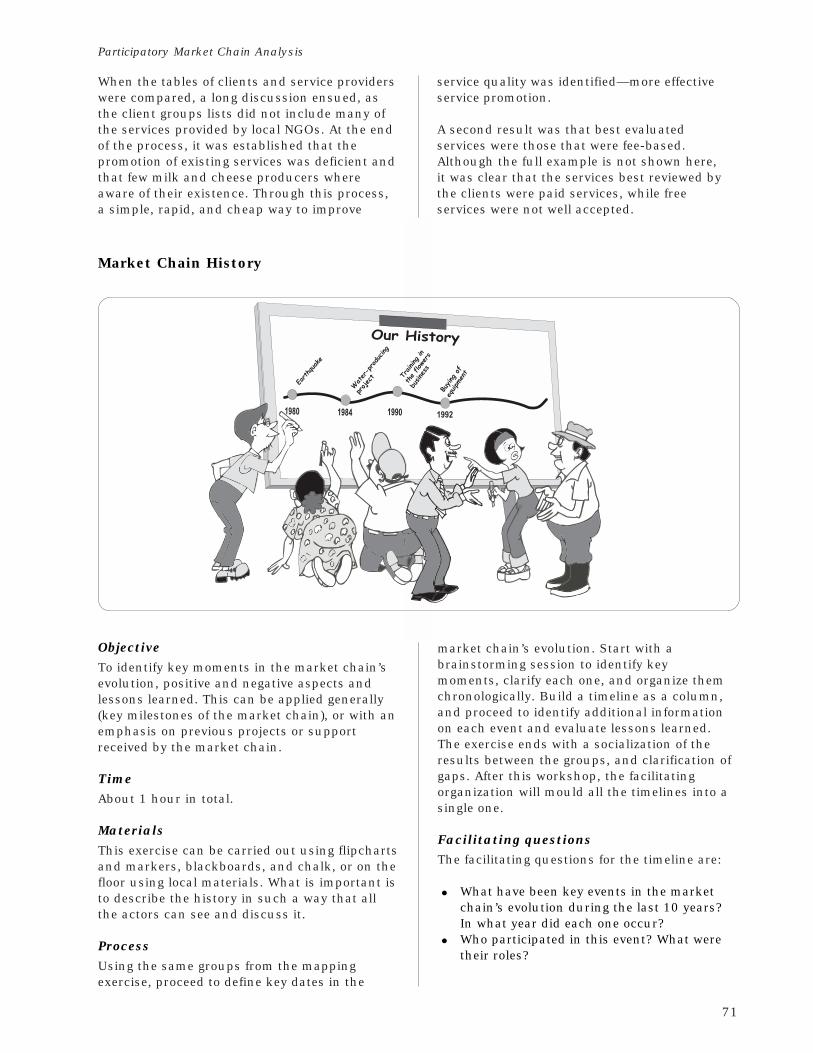
71
Participatory Market Chain Analysis
Market Chain History
ObjectiveTo identify key moments in the market chain’sevolution, positive and negative aspects andlessons learned. This can be applied generally(key milestones of the market chain), or with anemphasis on previous projects or supportreceived by the market chain.
TimeAbout 1 hour in total.
MaterialsThis exercise can be carried out using flipchartsand markers, blackboards, and chalk, or on thefloor using local materials. What is important isto describe the history in such a way that allthe actors can see and discuss it.
ProcessUsing the same groups from the mappingexercise, proceed to define key dates in the
market chain’s evolution. Start with abrainstorming session to identify keymoments, clarify each one, and organize themchronologically. Build a timeline as a column,and proceed to identify additional informationon each event and evaluate lessons learned.The exercise ends with a socialization of theresults between the groups, and clarification ofgaps. After this workshop, the facilitatingorganization will mould all the timelines into asingle one.
Facilitating questionsThe facilitating questions for the timeline are:
· What have been key events in the marketchain’s evolution during the last 10 years?In what year did each one occur?
· Who participated in this event? What weretheir roles?
When the tables of clients and service providerswere compared, a long discussion ensued, asthe client groups lists did not include many ofthe services provided by local NGOs. At the endof the process, it was established that thepromotion of existing services was deficient andthat few milk and cheese producers whereaware of their existence. Through this process,a simple, rapid, and cheap way to improve
service quality was identified—more effectiveservice promotion.
A second result was that best evaluatedservices were those that were fee-based.Although the full example is not shown here,it was clear that the services best reviewed bythe clients were paid services, while freeservices were not well accepted.
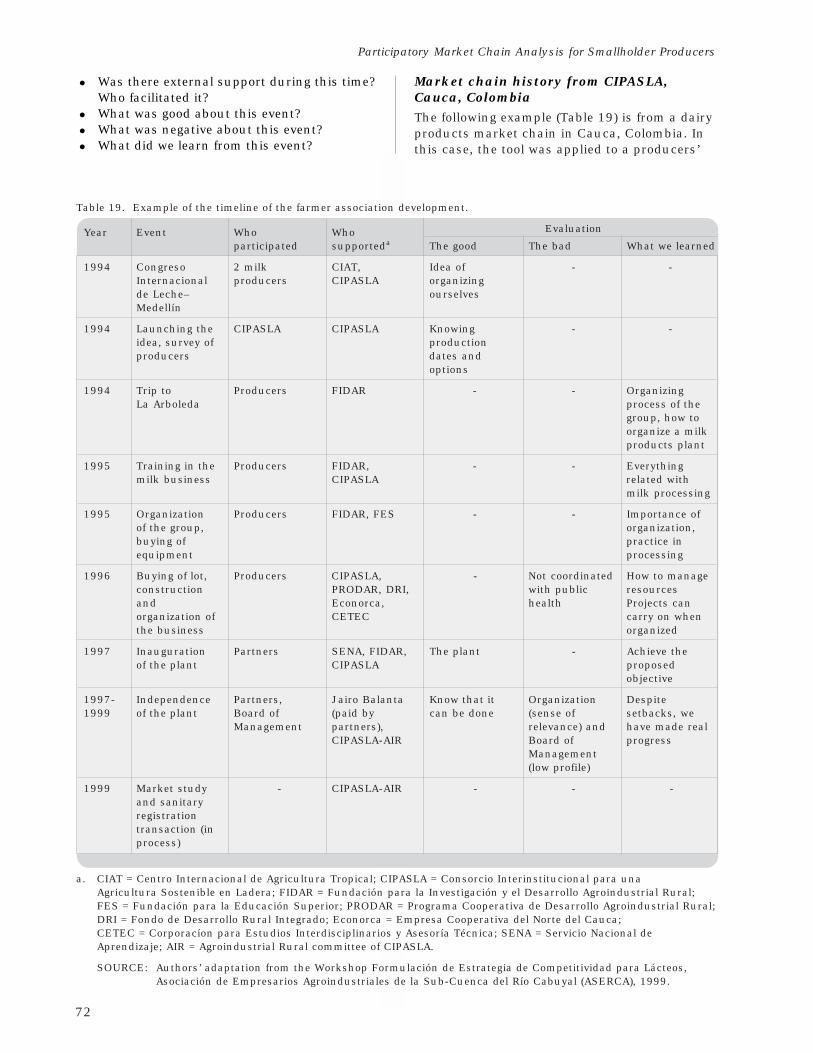
72
Participatory Market Chain Analysis for Smallholder Producers
· Was there external support during this time?Who facilitated it?
· What was good about this event?
· What was negative about this event?
· What did we learn from this event?
Market chain history from CIPASLA,Cauca, ColombiaThe following example (Table 19) is from a dairyproducts market chain in Cauca, Colombia. Inthis case, the tool was applied to a producers’
Table 19. Example of the timeline of the farmer association development.
Year Event Who Who Evaluation
participated supporteda The good The bad What we learned
1994 Congreso 2 milk CIAT, Idea of - -Internacional producers CIPASLA organizingde Leche– ourselvesMedellín
1994 Launching the CIPASLA CIPASLA Knowing - -idea, survey of productionproducers dates and
options
1994 Trip to Producers FIDAR - - OrganizingLa Arboleda process of the
group, how toorganize a milkproducts plant
1995 Training in the Producers FIDAR, - - Everythingmilk business CIPASLA related with
milk processing
1995 Organization Producers FIDAR, FES - - Importance ofof the group, organization,buying of practice inequipment processing
1996 Buying of lot, Producers CIPASLA, - Not coordinated How to manageconstruction PRODAR, DRI, with public resourcesand Econorca, health Projects canorganization of CETEC carry on whenthe business organized
1997 Inauguration Partners SENA, FIDAR, The plant - Achieve theof the plant CIPASLA proposed
objective
1997- Independence Partners, Jairo Balanta Know that it Organization Despite1999 of the plant Board of (paid by can be done (sense of setbacks, we
Management partners), relevance) and have made realCIPASLA-AIR Board of progress
Management(low profile)
1999 Market study - CIPASLA-AIR - - -and sanitaryregistrationtransaction (inprocess)
a. CIAT = Centro Internacional de Agricultura Tropical; CIPASLA = Consorcio Interinstitucional para unaAgricultura Sostenible en Ladera; FIDAR = Fundación para la Investigación y el Desarrollo Agroindustrial Rural;FES = Fundación para la Educación Superior; PRODAR = Programa Cooperativa de Desarrollo Agroindustrial Rural;DRI = Fondo de Desarrollo Rural Integrado; Econorca = Empresa Cooperativa del Norte del Cauca;CETEC = Corporacíon para Estudios Interdisciplinarios y Asesoría Técnica; SENA = Servicio Nacional deAprendizaje; AIR = Agroindustrial Rural committee of CIPASLA.
SOURCE: Authors’ adaptation from the Workshop Formulación de Estrategia de Competitividad para Lácteos,Asociación de Empresarios Agroindustriales de la Sub-Cuenca del Río Cabuyal (ASERCA), 1999.
73
Participatory Market Chain Analysis
association within the market chain tofacilitate a process of reflection on itsevolution and growth and to motivate futureactivities.
A variation on the market chain historyexercise is one focused on local processes ofinnovation to support the market chain orgenerate new products. If these processes areinvestigated, it is important to include a spaceto note the sources of the innovation(s), theirchannels of dissemination, and the resultsthey have had in the market chain. Actors
identified in this way are key when new changesin the market chain are proposed later in theanalysis process.
In this section, we have discussed how to formworking groups and three tools for marketchain analysis: mapping; supply and demand ofbusiness development services; and a marketchain history. Together, these tools permit afirst analysis of the market chain and prepareus for the next step, which is the identificationand analysis of factors limiting the marketchain’s competitiveness, and possible solutions.
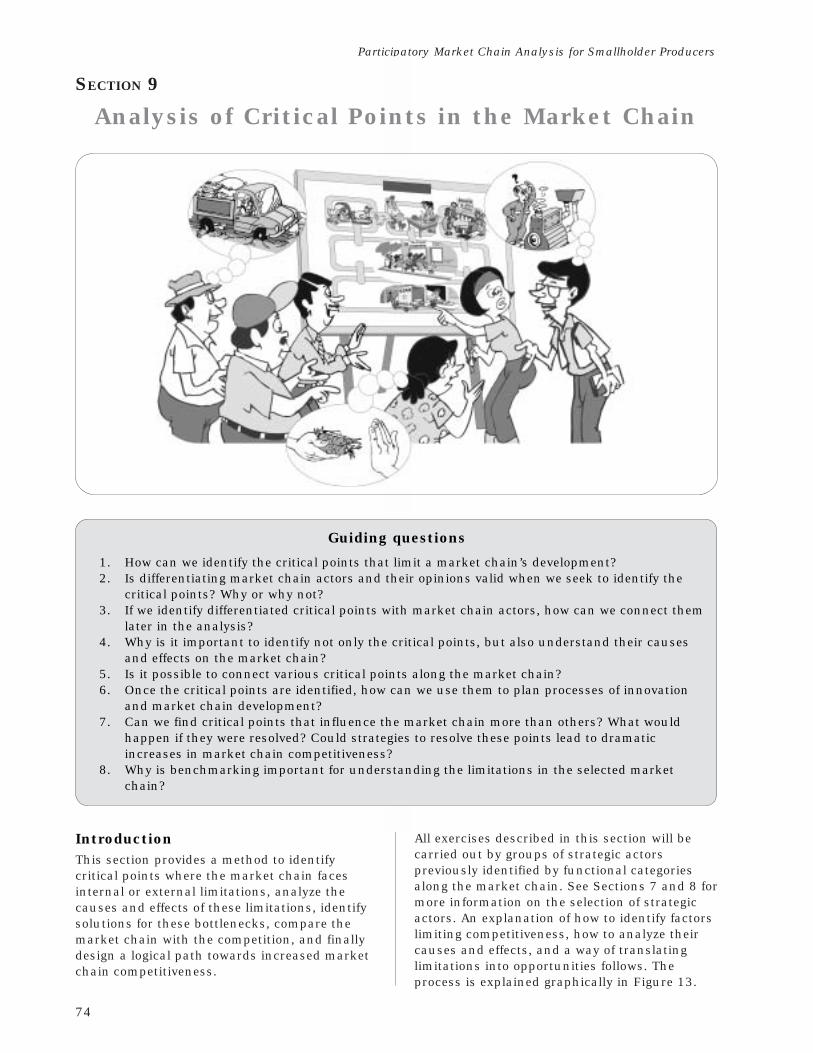
74
Participatory Market Chain Analysis for Smallholder Producers
SECTION 9
Analysis of Critical Points in the Market Chain
Guiding questions
1. How can we identify the critical points that limit a market chain’s development?2. Is differentiating market chain actors and their opinions valid when we seek to identify the
critical points? Why or why not?3. If we identify differentiated critical points with market chain actors, how can we connect them
later in the analysis?4. Why is it important to identify not only the critical points, but also understand their causes
and effects on the market chain?5. Is it possible to connect various critical points along the market chain?6. Once the critical points are identified, how can we use them to plan processes of innovation
and market chain development?7. Can we find critical points that influence the market chain more than others? What would
happen if they were resolved? Could strategies to resolve these points lead to dramaticincreases in market chain competitiveness?
8. Why is benchmarking important for understanding the limitations in the selected marketchain?
IntroductionThis section provides a method to identifycritical points where the market chain facesinternal or external limitations, analyze thecauses and effects of these limitations, identifysolutions for these bottlenecks, compare themarket chain with the competition, and finallydesign a logical path towards increased marketchain competitiveness.
All exercises described in this section will becarried out by groups of strategic actorspreviously identified by functional categoriesalong the market chain. See Sections 7 and 8 formore information on the selection of strategicactors. An explanation of how to identify factorslimiting competitiveness, how to analyze theircauses and effects, and a way of translatinglimitations into opportunities follows. Theprocess is explained graphically in Figure 13.
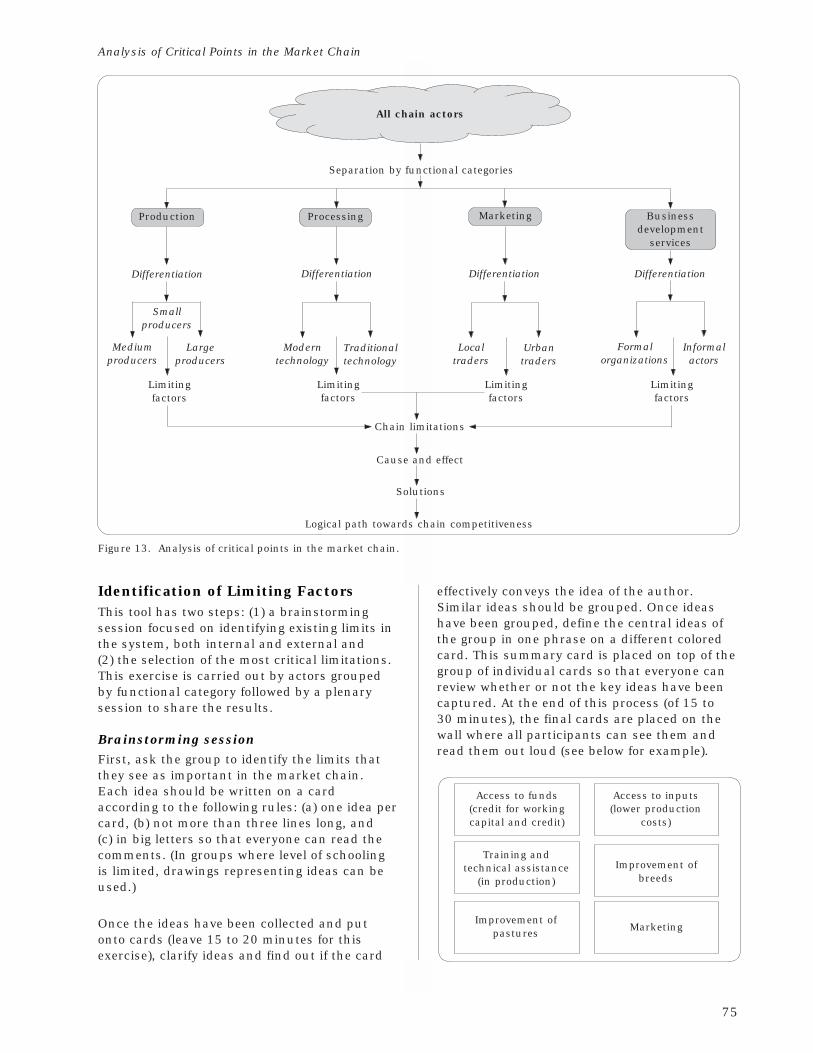
75
Analysis of Critical Points in the Market Chain
Identification of Limiting FactorsThis tool has two steps: (1) a brainstormingsession focused on identifying existing limits inthe system, both internal and external and(2) the selection of the most critical limitations.This exercise is carried out by actors groupedby functional category followed by a plenarysession to share the results.
Brainstorming sessionFirst, ask the group to identify the limits thatthey see as important in the market chain.Each idea should be written on a cardaccording to the following rules: (a) one idea percard, (b) not more than three lines long, and(c) in big letters so that everyone can read thecomments. (In groups where level of schoolingis limited, drawings representing ideas can beused.)
Once the ideas have been collected and putonto cards (leave 15 to 20 minutes for thisexercise), clarify ideas and find out if the card
All chain actors
Separation by functional categories
Production Processing Marketing Businessdevelopment
services
Differentiation Differentiation Differentiation Differentiation
Mediumproducers
Largeproducers
Formalorganizations
Informalactors
Moderntechnology
Traditionaltechnology
Localtraders
Urbantraders
Smallproducers
Limitingfactors
Limitingfactors
Limitingfactors
Limitingfactors
Chain limitations
Cause and effect
Solutions
Logical path towards chain competitiveness
Figure 13. Analysis of critical points in the market chain.
effectively conveys the idea of the author.Similar ideas should be grouped. Once ideashave been grouped, define the central ideas ofthe group in one phrase on a different coloredcard. This summary card is placed on top of thegroup of individual cards so that everyone canreview whether or not the key ideas have beencaptured. At the end of this process (of 15 to30 minutes), the final cards are placed on thewall where all participants can see them andread them out loud (see below for example).
Access to funds(credit for workingcapital and credit)
Access to inputs(lower production
costs)
Training andtechnical assistance
(in production)
Marketing
Improvement ofbreeds
Improvement ofpastures
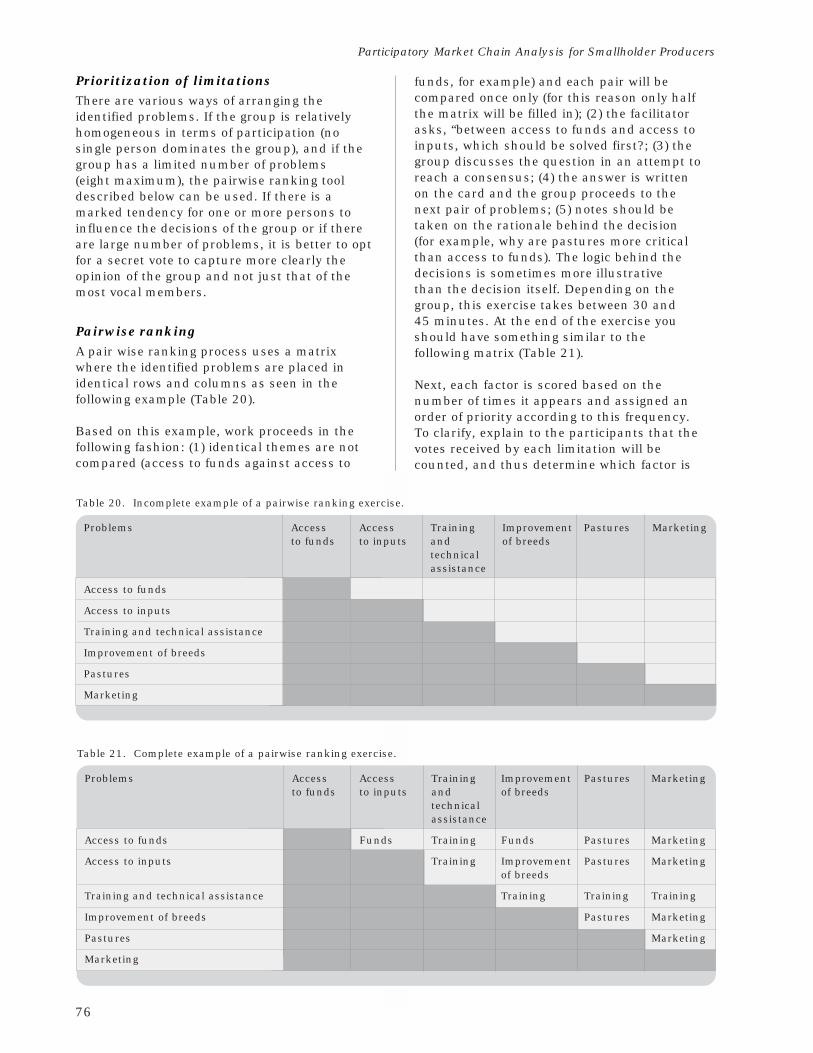
76
Participatory Market Chain Analysis for Smallholder Producers
Prioritization of limitationsThere are various ways of arranging theidentified problems. If the group is relativelyhomogeneous in terms of participation (nosingle person dominates the group), and if thegroup has a limited number of problems(eight maximum), the pairwise ranking tooldescribed below can be used. If there is amarked tendency for one or more persons toinfluence the decisions of the group or if thereare large number of problems, it is better to optfor a secret vote to capture more clearly theopinion of the group and not just that of themost vocal members.
Pairwise rankingA pair wise ranking process uses a matrixwhere the identified problems are placed inidentical rows and columns as seen in thefollowing example (Table 20).
Based on this example, work proceeds in thefollowing fashion: (1) identical themes are notcompared (access to funds against access to
Table 20. Incomplete example of a pairwise ranking exercise.
Problems Access Access Training Improvement Pastures Marketingto funds to inputs and of breeds
technicalassistance
Access to funds
Access to inputs
Training and technical assistance
Improvement of breeds
Pastures
Marketing
funds, for example) and each pair will becompared once only (for this reason only halfthe matrix will be filled in); (2) the facilitatorasks, “between access to funds and access toinputs, which should be solved first?; (3) thegroup discusses the question in an attempt toreach a consensus; (4) the answer is writtenon the card and the group proceeds to thenext pair of problems; (5) notes should betaken on the rationale behind the decision(for example, why are pastures more criticalthan access to funds). The logic behind thedecisions is sometimes more illustrativethan the decision itself. Depending on thegroup, this exercise takes between 30 and45 minutes. At the end of the exercise youshould have something similar to thefollowing matrix (Table 21).
Next, each factor is scored based on thenumber of times it appears and assigned anorder of priority according to this frequency.To clarify, explain to the participants that thevotes received by each limitation will becounted, and thus determine which factor is
Table 21. Complete example of a pairwise ranking exercise.
Problems Access Access Training Improvement Pastures Marketingto funds to inputs and of breeds
technicalassistance
Access to funds Funds Training Funds Pastures Marketing
Access to inputs Training Improvement Pastures Marketingof breeds
Training and technical assistance Training Training Training
Improvement of breeds Pastures Marketing
Pastures Marketing
Marketing
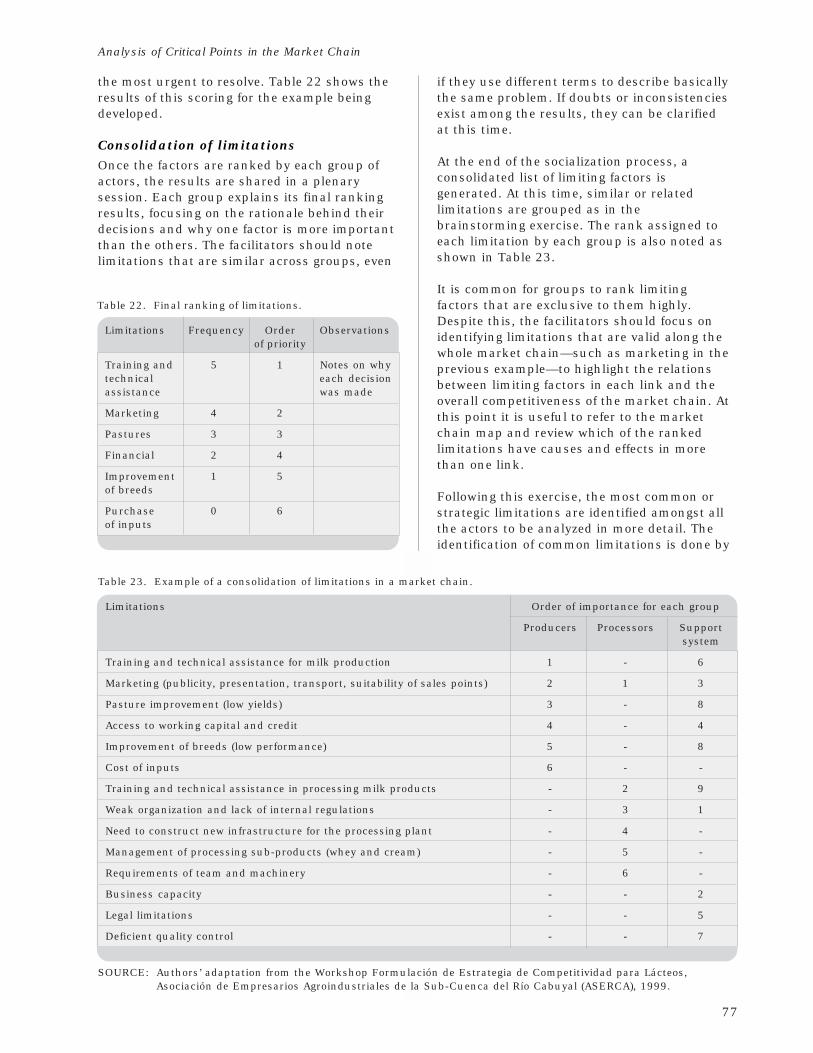
77
Analysis of Critical Points in the Market Chain
the most urgent to resolve. Table 22 shows theresults of this scoring for the example beingdeveloped.
Consolidation of limitationsOnce the factors are ranked by each group ofactors, the results are shared in a plenarysession. Each group explains its final rankingresults, focusing on the rationale behind theirdecisions and why one factor is more importantthan the others. The facilitators should notelimitations that are similar across groups, even
if they use different terms to describe basicallythe same problem. If doubts or inconsistenciesexist among the results, they can be clarifiedat this time.
At the end of the socialization process, aconsolidated list of limiting factors isgenerated. At this time, similar or relatedlimitations are grouped as in thebrainstorming exercise. The rank assigned toeach limitation by each group is also noted asshown in Table 23.
It is common for groups to rank limitingfactors that are exclusive to them highly.Despite this, the facilitators should focus onidentifying limitations that are valid along thewhole market chain—such as marketing in theprevious example—to highlight the relationsbetween limiting factors in each link and theoverall competitiveness of the market chain. Atthis point it is useful to refer to the marketchain map and review which of the rankedlimitations have causes and effects in morethan one link.
Following this exercise, the most common orstrategic limitations are identified amongst allthe actors to be analyzed in more detail. Theidentification of common limitations is done by
Table 23. Example of a consolidation of limitations in a market chain.
Limitations Order of importance for each group
Producers Processors Supportsystem
Training and technical assistance for milk production 1 - 6
Marketing (publicity, presentation, transport, suitability of sales points) 2 1 3
Pasture improvement (low yields) 3 - 8
Access to working capital and credit 4 - 4
Improvement of breeds (low performance) 5 - 8
Cost of inputs 6 - -
Training and technical assistance in processing milk products - 2 9
Weak organization and lack of internal regulations - 3 1
Need to construct new infrastructure for the processing plant - 4 -
Management of processing sub-products (whey and cream) - 5 -
Requirements of team and machinery - 6 -
Business capacity - - 2
Legal limitations - - 5
Deficient quality control - - 7
SOURCE: Authors’ adaptation from the Workshop Formulación de Estrategia de Competitividad para Lácteos,Asociación de Empresarios Agroindustriales de la Sub-Cuenca del Río Cabuyal (ASERCA), 1999.
Table 22. Final ranking of limitations.
Limitations Frequency Order Observationsof priority
Training and 5 1 Notes on whytechnical each decisionassistance was made
Marketing 4 2
Pastures 3 3
Financial 2 4
Improvement 1 5of breeds
Purchase 0 6of inputs
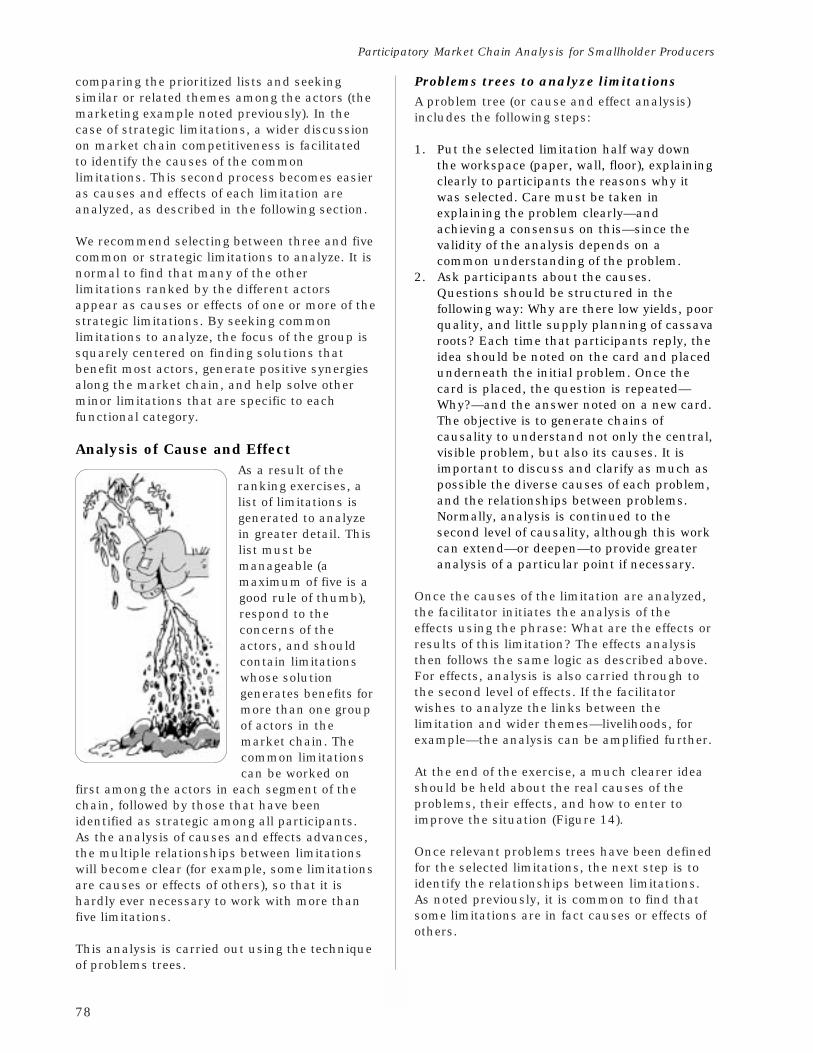
78
Participatory Market Chain Analysis for Smallholder Producers
comparing the prioritized lists and seekingsimilar or related themes among the actors (themarketing example noted previously). In thecase of strategic limitations, a wider discussionon market chain competitiveness is facilitatedto identify the causes of the commonlimitations. This second process becomes easieras causes and effects of each limitation areanalyzed, as described in the following section.
We recommend selecting between three and fivecommon or strategic limitations to analyze. It isnormal to find that many of the otherlimitations ranked by the different actorsappear as causes or effects of one or more of thestrategic limitations. By seeking commonlimitations to analyze, the focus of the group issquarely centered on finding solutions thatbenefit most actors, generate positive synergiesalong the market chain, and help solve otherminor limitations that are specific to eachfunctional category.
Analysis of Cause and EffectAs a result of theranking exercises, alist of limitations isgenerated to analyzein greater detail. Thislist must bemanageable (amaximum of five is agood rule of thumb),respond to theconcerns of theactors, and shouldcontain limitationswhose solutiongenerates benefits formore than one groupof actors in themarket chain. Thecommon limitationscan be worked on
first among the actors in each segment of thechain, followed by those that have beenidentified as strategic among all participants.As the analysis of causes and effects advances,the multiple relationships between limitationswill become clear (for example, some limitationsare causes or effects of others), so that it ishardly ever necessary to work with more thanfive limitations.
This analysis is carried out using the techniqueof problems trees.
Problems trees to analyze limitationsA problem tree (or cause and effect analysis)includes the following steps:
1. Put the selected limitation half way downthe workspace (paper, wall, floor), explainingclearly to participants the reasons why itwas selected. Care must be taken inexplaining the problem clearly—andachieving a consensus on this—since thevalidity of the analysis depends on acommon understanding of the problem.
2. Ask participants about the causes.Questions should be structured in thefollowing way: Why are there low yields, poorquality, and little supply planning of cassavaroots? Each time that participants reply, theidea should be noted on the card and placedunderneath the initial problem. Once thecard is placed, the question is repeated—Why?—and the answer noted on a new card.The objective is to generate chains ofcausality to understand not only the central,visible problem, but also its causes. It isimportant to discuss and clarify as much aspossible the diverse causes of each problem,and the relationships between problems.Normally, analysis is continued to thesecond level of causality, although this workcan extend—or deepen—to provide greateranalysis of a particular point if necessary.
Once the causes of the limitation are analyzed,the facilitator initiates the analysis of theeffects using the phrase: What are the effects orresults of this limitation? The effects analysisthen follows the same logic as described above.For effects, analysis is also carried through tothe second level of effects. If the facilitatorwishes to analyze the links between thelimitation and wider themes—livelihoods, forexample—the analysis can be amplified further.
At the end of the exercise, a much clearer ideashould be held about the real causes of theproblems, their effects, and how to enter toimprove the situation (Figure 14).
Once relevant problems trees have been definedfor the selected limitations, the next step is toidentify the relationships between limitations.As noted previously, it is common to find thatsome limitations are in fact causes or effects ofothers.
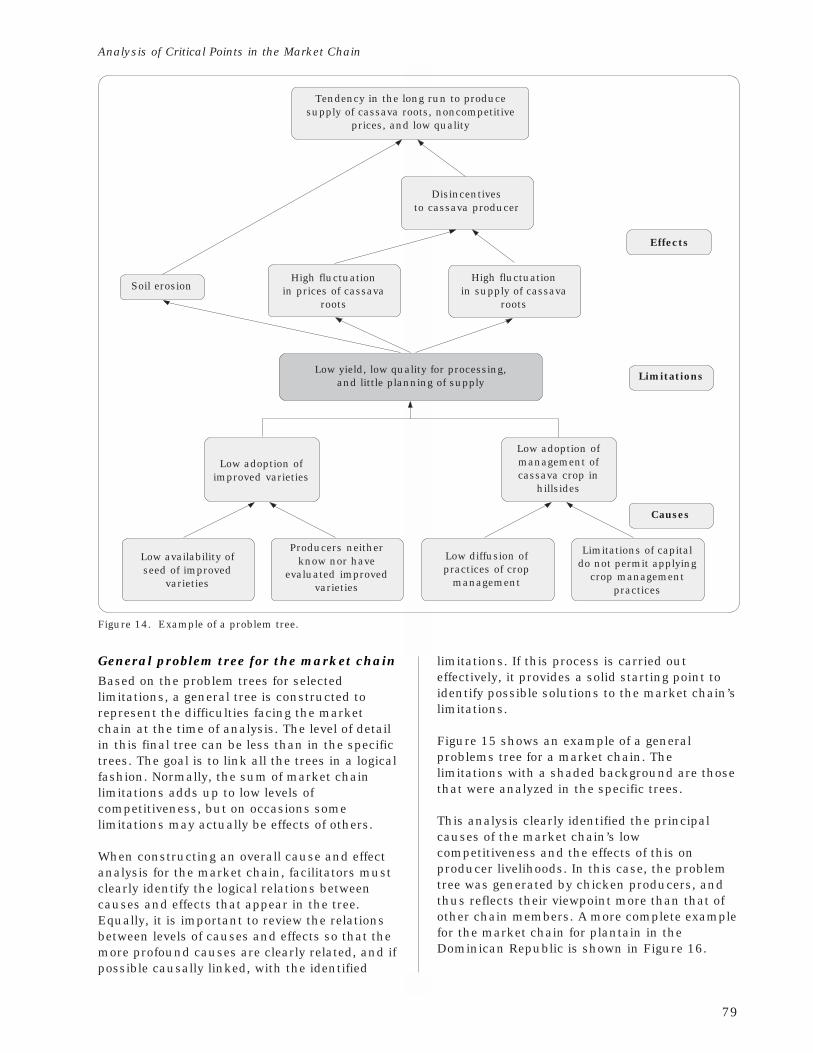
79
Analysis of Critical Points in the Market Chain
Figure 14. Example of a problem tree.
Tendency in the long run to producesupply of cassava roots, noncompetitive
prices, and low quality
Soil erosion
Effects
Limitations
Low adoption ofimproved varieties
Low adoption ofmanagement ofcassava crop in
hillsides
Causes
Limitations of capitaldo not permit applying
crop managementpractices
Low availability ofseed of improved
varieties
Producers neitherknow nor have
evaluated improvedvarieties
Low diffusion ofpractices of crop
management
Low yield, low quality for processing,and little planning of supply
High fluctuationin prices of cassava
roots
High fluctuationin supply of cassava
roots
Disincentivesto cassava producer
General problem tree for the market chainBased on the problem trees for selectedlimitations, a general tree is constructed torepresent the difficulties facing the marketchain at the time of analysis. The level of detailin this final tree can be less than in the specifictrees. The goal is to link all the trees in a logicalfashion. Normally, the sum of market chainlimitations adds up to low levels ofcompetitiveness, but on occasions somelimitations may actually be effects of others.
When constructing an overall cause and effectanalysis for the market chain, facilitators mustclearly identify the logical relations betweencauses and effects that appear in the tree.Equally, it is important to review the relationsbetween levels of causes and effects so that themore profound causes are clearly related, and ifpossible causally linked, with the identified
limitations. If this process is carried outeffectively, it provides a solid starting point toidentify possible solutions to the market chain’slimitations.
Figure 15 shows an example of a generalproblems tree for a market chain. Thelimitations with a shaded background are thosethat were analyzed in the specific trees.
This analysis clearly identified the principalcauses of the market chain’s lowcompetitiveness and the effects of this onproducer livelihoods. In this case, the problemtree was generated by chicken producers, andthus reflects their viewpoint more than that ofother chain members. A more complete examplefor the market chain for plantain in theDominican Republic is shown in Figure 16.
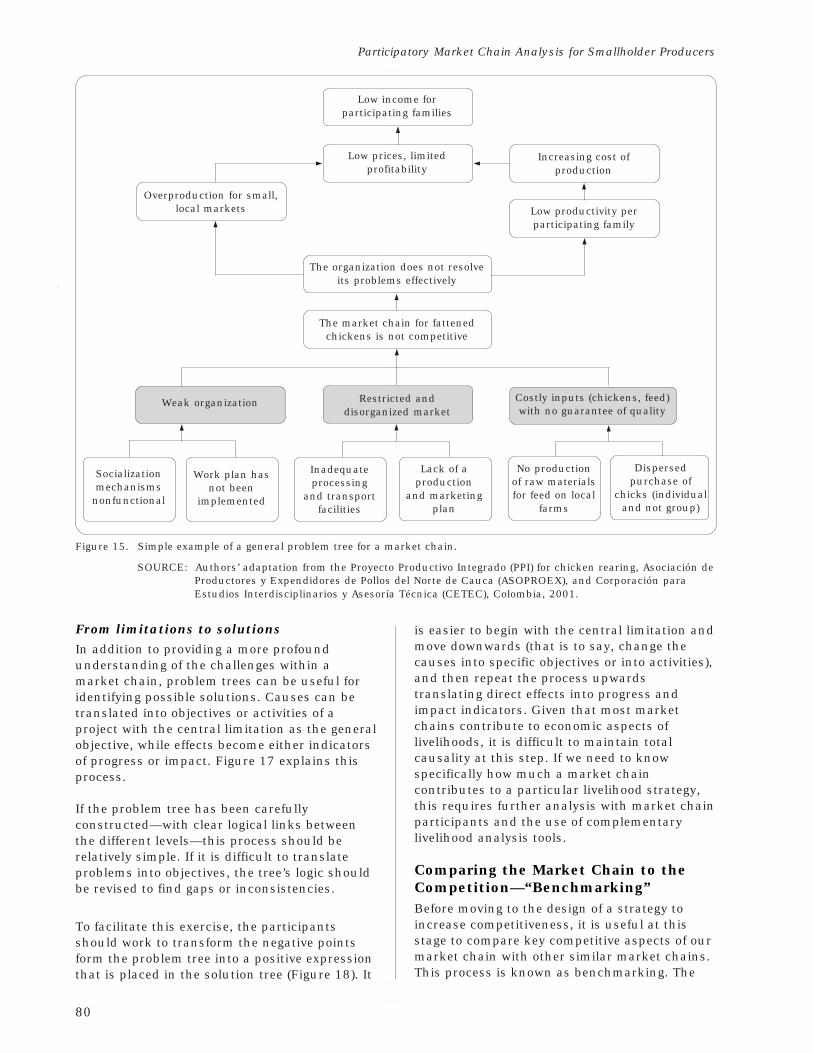
80
Participatory Market Chain Analysis for Smallholder Producers
Socializationmechanisms
nonfunctional
Work plan hasnot been
implemented
Inadequateprocessing
and transportfacilities
Lack of aproduction
and marketingplan
No productionof raw materialsfor feed on local
farms
Dispersedpurchase of
chicks (individualand not group)
Weak organization Restricted anddisorganized market
Costly inputs (chickens, feed)with no guarantee of quality
The market chain for fattenedchickens is not competitive
Low income forparticipating families
Low prices, limitedprofitability
Increasing cost ofproduction
Overproduction for small,local markets Low productivity per
participating family
The organization does not resolveits problems effectively
Figure 15. Simple example of a general problem tree for a market chain.
SOURCE: Authors’ adaptation from the Proyecto Productivo Integrado (PPI) for chicken rearing, Asociación deProductores y Expendidores de Pollos del Norte de Cauca (ASOPROEX), and Corporación paraEstudios Interdisciplinarios y Asesoría Técnica (CETEC), Colombia, 2001.
From limitations to solutionsIn addition to providing a more profoundunderstanding of the challenges within amarket chain, problem trees can be useful foridentifying possible solutions. Causes can betranslated into objectives or activities of aproject with the central limitation as the generalobjective, while effects become either indicatorsof progress or impact. Figure 17 explains thisprocess.
If the problem tree has been carefullyconstructed—with clear logical links betweenthe different levels—this process should berelatively simple. If it is difficult to translateproblems into objectives, the tree’s logic shouldbe revised to find gaps or inconsistencies.
To facilitate this exercise, the participantsshould work to transform the negative pointsform the problem tree into a positive expressionthat is placed in the solution tree (Figure 18). It
is easier to begin with the central limitation andmove downwards (that is to say, change thecauses into specific objectives or into activities),and then repeat the process upwardstranslating direct effects into progress andimpact indicators. Given that most marketchains contribute to economic aspects oflivelihoods, it is difficult to maintain totalcausality at this step. If we need to knowspecifically how much a market chaincontributes to a particular livelihood strategy,this requires further analysis with market chainparticipants and the use of complementarylivelihood analysis tools.
Comparing the Market Chain to theCompetition—“Benchmarking”Before moving to the design of a strategy toincrease competitiveness, it is useful at thisstage to compare key competitive aspects of ourmarket chain with other similar market chains.This process is known as benchmarking. The
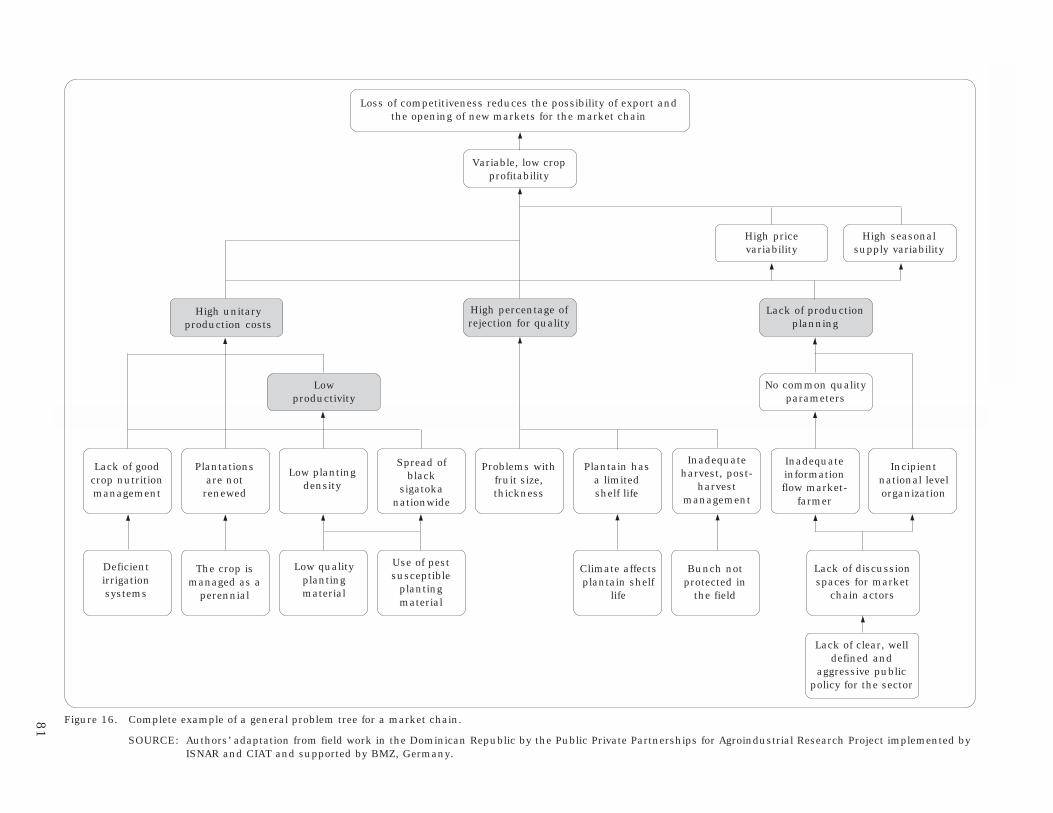
81
An
aly
sis of Critica
l Poin
ts in th
e Ma
rket C
ha
in
Loss of competitiveness reduces the possibility of export andthe opening of new markets for the market chain
Variable, low cropprofitability
High pricevariability
High seasonalsupply variability
High unitaryproduction costs
High percentage ofrejection for quality
Lack of productionplanning
Lowproductivity
No common qualityparameters
Lack of goodcrop nutritionmanagement
Plantationsare notrenewed
Low plantingdensity
Spread ofblack
sigatokanationwide
Problems withfruit size,thickness
Plantain hasa limitedshelf life
Inadequateharvest, post-
harvestmanagement
Inadequateinformationflow market-
farmer
Incipientnational levelorganization
Deficientirrigationsystems
The crop ismanaged as a
perennial
Low qualityplantingmaterial
Use of pestsusceptible
plantingmaterial
Climate affectsplantain shelf
life
Bunch notprotected in
the field
Lack of discussionspaces for market
chain actors
Lack of clear, welldefined and
aggressive publicpolicy for the sector
Figure 16. Complete example of a general problem tree for a market chain.
SOURCE: Authors’ adaptation from field work in the Dominican Republic by the Public Private Partnerships for Agroindustrial Research Project implemented byISNAR and CIAT and supported by BMZ, Germany.
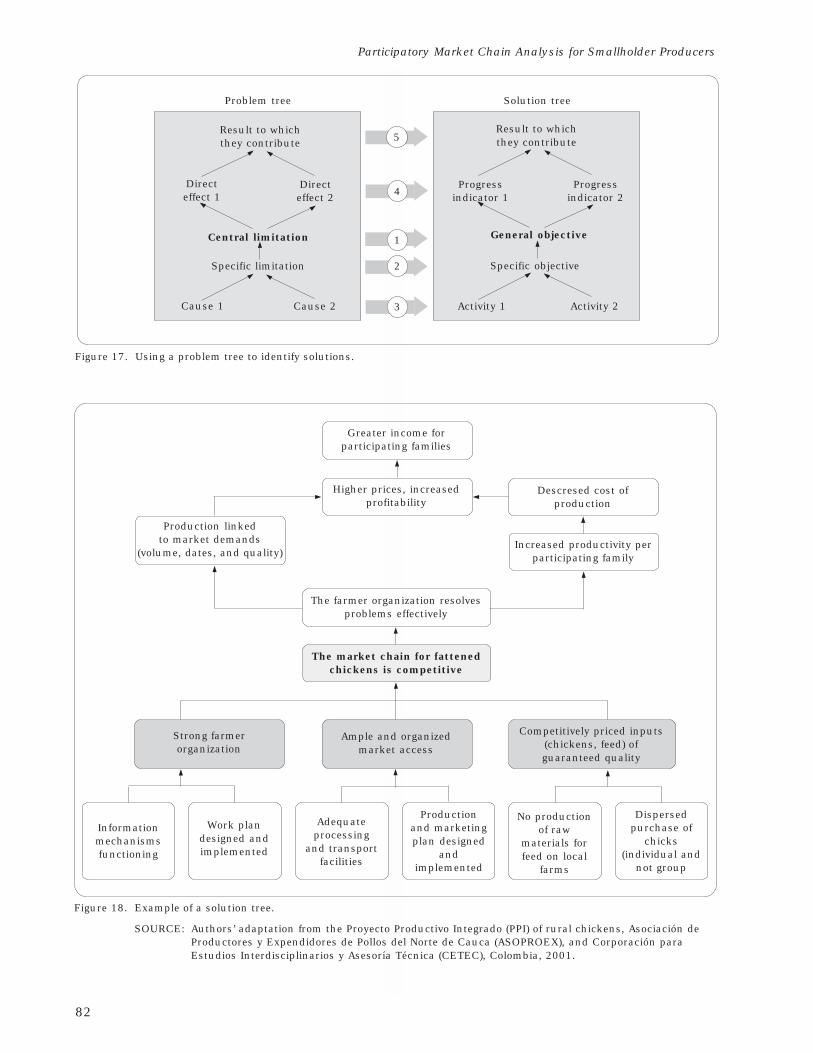
82
Participatory Market Chain Analysis for Smallholder Producers
Problem tree Solution tree
Result to whichthey contribute
Directeffect 1
Directeffect 2
Central limitation
Specific limitation
Cause 1 Cause 2
Result to whichthey contribute
Progressindicator 1
Progressindicator 2
General objective
Specific objective
Activity 1 Activity 2
Figure 17. Using a problem tree to identify solutions.
5
4
1
2
3
Informationmechanismsfunctioning
Work plandesigned andimplemented
Adequateprocessing
and transportfacilities
Productionand marketingplan designed
andimplemented
No productionof raw
materials forfeed on local
farms
Dispersedpurchase of
chicks(individual and
not group
Strong farmerorganization
Ample and organizedmarket access
Competitively priced inputs(chickens, feed) ofguaranteed quality
The market chain for fattenedchickens is competitive
Greater income forparticipating families
Higher prices, increasedprofitability
Descresed cost ofproduction
Production linkedto market demands
(volume, dates, and quality)Increased productivity per
participating family
The farmer organization resolvesproblems effectively
Figure 18. Example of a solution tree.
SOURCE: Authors’ adaptation from the Proyecto Productivo Integrado (PPI) of rural chickens, Asociación deProductores y Expendidores de Pollos del Norte de Cauca (ASOPROEX), and Corporación paraEstudios Interdisciplinarios y Asesoría Técnica (CETEC), Colombia, 2001.
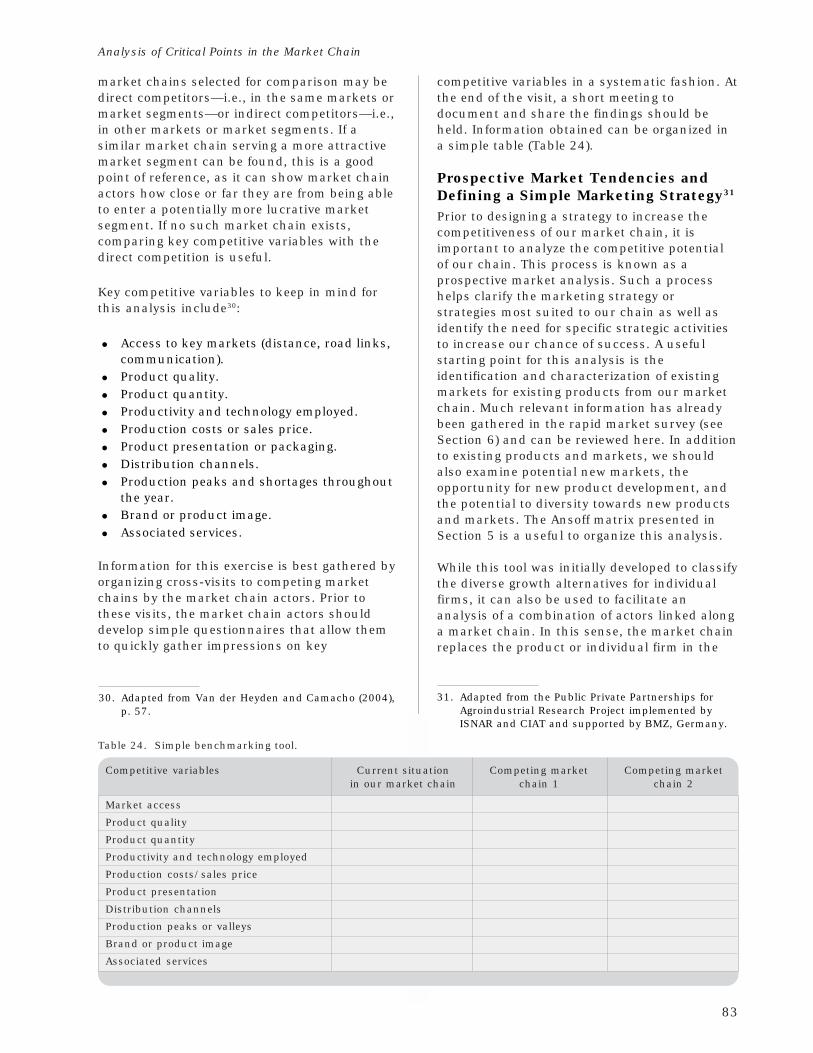
83
Analysis of Critical Points in the Market Chain
market chains selected for comparison may bedirect competitors—i.e., in the same markets ormarket segments—or indirect competitors—i.e.,in other markets or market segments. If asimilar market chain serving a more attractivemarket segment can be found, this is a goodpoint of reference, as it can show market chainactors how close or far they are from being ableto enter a potentially more lucrative marketsegment. If no such market chain exists,comparing key competitive variables with thedirect competition is useful.
Key competitive variables to keep in mind forthis analysis include30:
· Access to key markets (distance, road links,communication).
· Product quality.
· Product quantity.
· Productivity and technology employed.
· Production costs or sales price.
· Product presentation or packaging.
· Distribution channels.
· Production peaks and shortages throughoutthe year.
· Brand or product image.
· Associated services.
Information for this exercise is best gathered byorganizing cross-visits to competing marketchains by the market chain actors. Prior tothese visits, the market chain actors shoulddevelop simple questionnaires that allow themto quickly gather impressions on key
30. Adapted from Van der Heyden and Camacho (2004),p. 57.
Table 24. Simple benchmarking tool.
Competitive variables Current situation Competing market Competing marketin our market chain chain 1 chain 2
Market access
Product quality
Product quantity
Productivity and technology employed
Production costs/sales price
Product presentation
Distribution channels
Production peaks or valleys
Brand or product image
Associated services
competitive variables in a systematic fashion. Atthe end of the visit, a short meeting todocument and share the findings should beheld. Information obtained can be organized ina simple table (Table 24).
Prospective Market Tendencies andDefining a Simple Marketing Strategy31
Prior to designing a strategy to increase thecompetitiveness of our market chain, it isimportant to analyze the competitive potentialof our chain. This process is known as aprospective market analysis. Such a processhelps clarify the marketing strategy orstrategies most suited to our chain as well asidentify the need for specific strategic activitiesto increase our chance of success. A usefulstarting point for this analysis is theidentification and characterization of existingmarkets for existing products from our marketchain. Much relevant information has alreadybeen gathered in the rapid market survey (seeSection 6) and can be reviewed here. In additionto existing products and markets, we shouldalso examine potential new markets, theopportunity for new product development, andthe potential to diversity towards new productsand markets. The Ansoff matrix presented inSection 5 is a useful to organize this analysis.
While this tool was initially developed to classifythe diverse growth alternatives for individualfirms, it can also be used to facilitate ananalysis of a combination of actors linked alonga market chain. In this sense, the market chainreplaces the product or individual firm in the
31. Adapted from the Public Private Partnerships forAgroindustrial Research Project implemented byISNAR and CIAT and supported by BMZ, Germany.
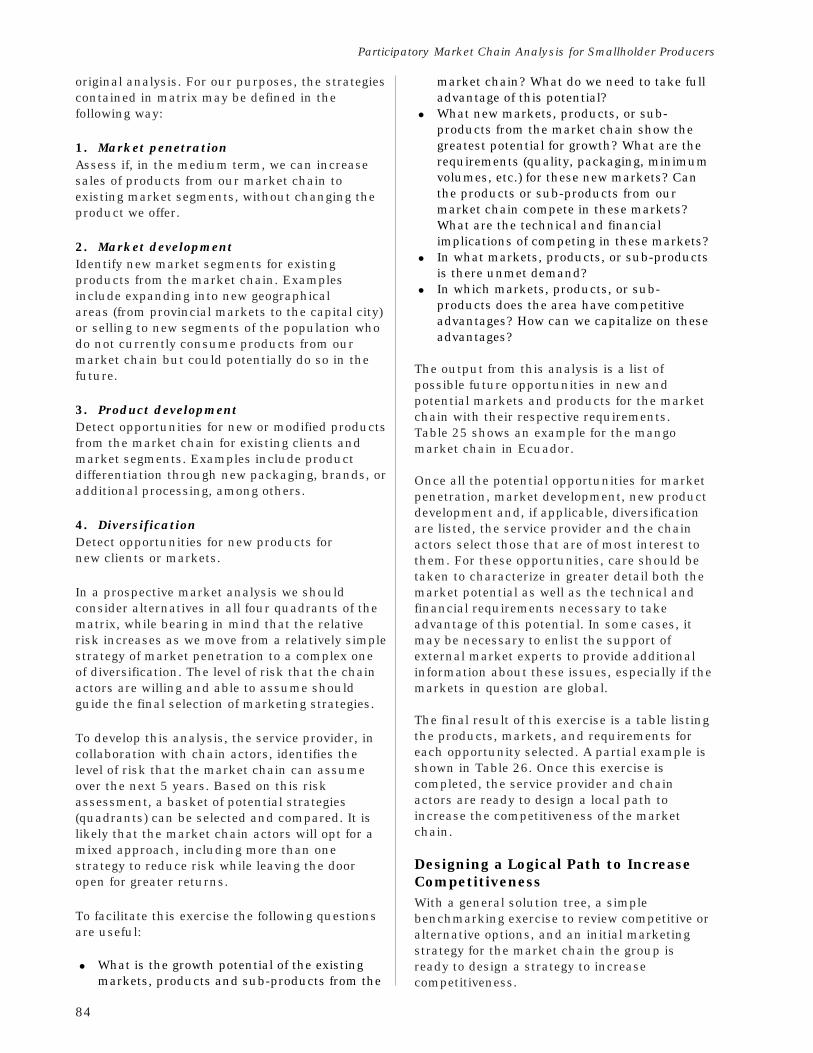
84
Participatory Market Chain Analysis for Smallholder Producers
original analysis. For our purposes, the strategiescontained in matrix may be defined in thefollowing way:
1. Market penetrationAssess if, in the medium term, we can increasesales of products from our market chain toexisting market segments, without changing theproduct we offer.
2. Market developmentIdentify new market segments for existingproducts from the market chain. Examplesinclude expanding into new geographicalareas (from provincial markets to the capital city)or selling to new segments of the population whodo not currently consume products from ourmarket chain but could potentially do so in thefuture.
3. Product developmentDetect opportunities for new or modified productsfrom the market chain for existing clients andmarket segments. Examples include productdifferentiation through new packaging, brands, oradditional processing, among others.
4. DiversificationDetect opportunities for new products fornew clients or markets.
In a prospective market analysis we shouldconsider alternatives in all four quadrants of thematrix, while bearing in mind that the relativerisk increases as we move from a relatively simplestrategy of market penetration to a complex oneof diversification. The level of risk that the chainactors are willing and able to assume shouldguide the final selection of marketing strategies.
To develop this analysis, the service provider, incollaboration with chain actors, identifies thelevel of risk that the market chain can assumeover the next 5 years. Based on this riskassessment, a basket of potential strategies(quadrants) can be selected and compared. It islikely that the market chain actors will opt for amixed approach, including more than onestrategy to reduce risk while leaving the dooropen for greater returns.
To facilitate this exercise the following questionsare useful:
· What is the growth potential of the existingmarkets, products and sub-products from the
market chain? What do we need to take fulladvantage of this potential?
· What new markets, products, or sub-products from the market chain show thegreatest potential for growth? What are therequirements (quality, packaging, minimumvolumes, etc.) for these new markets? Canthe products or sub-products from ourmarket chain compete in these markets?What are the technical and financialimplications of competing in these markets?
· In what markets, products, or sub-productsis there unmet demand?
· In which markets, products, or sub-products does the area have competitiveadvantages? How can we capitalize on theseadvantages?
The output from this analysis is a list ofpossible future opportunities in new andpotential markets and products for the marketchain with their respective requirements.Table 25 shows an example for the mangomarket chain in Ecuador.
Once all the potential opportunities for marketpenetration, market development, new productdevelopment and, if applicable, diversificationare listed, the service provider and the chainactors select those that are of most interest tothem. For these opportunities, care should betaken to characterize in greater detail both themarket potential as well as the technical andfinancial requirements necessary to takeadvantage of this potential. In some cases, itmay be necessary to enlist the support ofexternal market experts to provide additionalinformation about these issues, especially if themarkets in question are global.
The final result of this exercise is a table listingthe products, markets, and requirements foreach opportunity selected. A partial example isshown in Table 26. Once this exercise iscompleted, the service provider and chainactors are ready to design a local path toincrease the competitiveness of the marketchain.
Designing a Logical Path to IncreaseCompetitivenessWith a general solution tree, a simplebenchmarking exercise to review competitive oralternative options, and an initial marketingstrategy for the market chain the group isready to design a strategy to increasecompetitiveness.
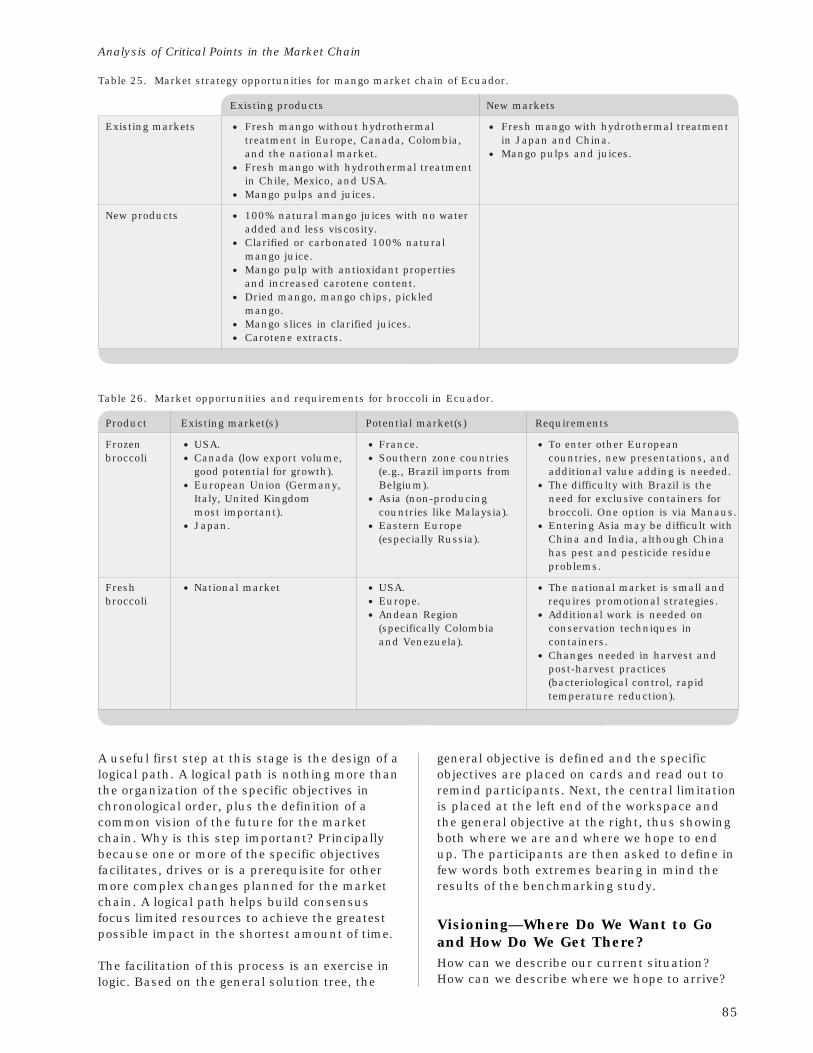
85
Analysis of Critical Points in the Market Chain
Table 26. Market opportunities and requirements for broccoli in Ecuador.
Product Existing market(s) Potential market(s) Requirements
Frozen · USA. · France. · To enter other Europeanbroccoli · Canada (low export volume, · Southern zone countries countries, new presentations, and
good potential for growth). (e.g., Brazil imports from additional value adding is needed.
· European Union (Germany, Belgium). · The difficulty with Brazil is theItaly, United Kingdom · Asia (non-producing need for exclusive containers formost important). countries like Malaysia). broccoli. One option is via Manaus.
· Japan. · Eastern Europe · Entering Asia may be difficult with(especially Russia). China and India, although China
has pest and pesticide residueproblems.
Fresh · National market · USA. · The national market is small andbroccoli · Europe. requires promotional strategies.
· Andean Region · Additional work is needed on(specifically Colombia conservation techniques inand Venezuela). containers.
· Changes needed in harvest andpost-harvest practices(bacteriological control, rapidtemperature reduction).
A useful first step at this stage is the design of alogical path. A logical path is nothing more thanthe organization of the specific objectives inchronological order, plus the definition of acommon vision of the future for the marketchain. Why is this step important? Principallybecause one or more of the specific objectivesfacilitates, drives or is a prerequisite for othermore complex changes planned for the marketchain. A logical path helps build consensusfocus limited resources to achieve the greatestpossible impact in the shortest amount of time.
The facilitation of this process is an exercise inlogic. Based on the general solution tree, the
general objective is defined and the specificobjectives are placed on cards and read out toremind participants. Next, the central limitationis placed at the left end of the workspace andthe general objective at the right, thus showingboth where we are and where we hope to endup. The participants are then asked to define infew words both extremes bearing in mind theresults of the benchmarking study.
Visioning—Where Do We Want to Goand How Do We Get There?How can we describe our current situation?How can we describe where we hope to arrive?
Table 25. Market strategy opportunities for mango market chain of Ecuador.
Existing products New markets
Existing markets · Fresh mango without hydrothermal · Fresh mango with hydrothermal treatmenttreatment in Europe, Canada, Colombia, in Japan and China.and the national market. · Mango pulps and juices.
· Fresh mango with hydrothermal treatmentin Chile, Mexico, and USA.
· Mango pulps and juices.
New products · 100% natural mango juices with no wateradded and less viscosity.
· Clarified or carbonated 100% naturalmango juice.
· Mango pulp with antioxidant propertiesand increased carotene content.
· Dried mango, mango chips, pickledmango.
· Mango slices in clarified juices.
· Carotene extracts.
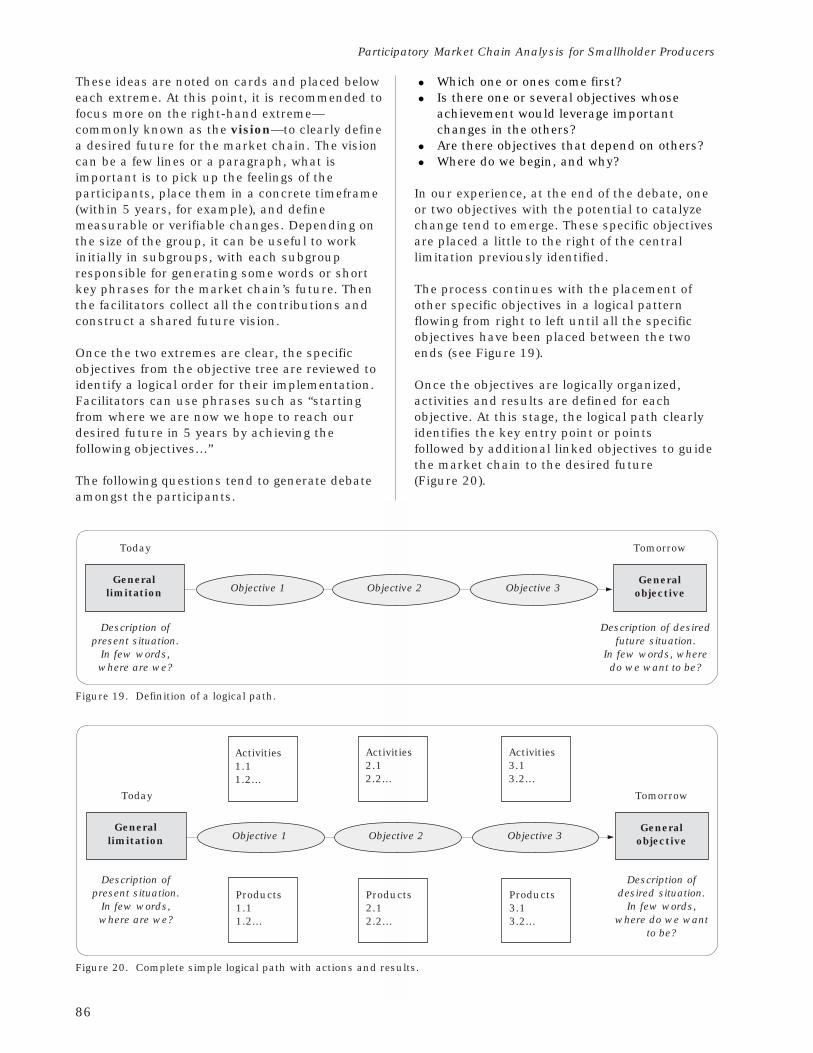
86
Participatory Market Chain Analysis for Smallholder Producers
These ideas are noted on cards and placed beloweach extreme. At this point, it is recommended tofocus more on the right-hand extreme—commonly known as the vision—to clearly definea desired future for the market chain. The visioncan be a few lines or a paragraph, what isimportant is to pick up the feelings of theparticipants, place them in a concrete timeframe(within 5 years, for example), and definemeasurable or verifiable changes. Depending onthe size of the group, it can be useful to workinitially in subgroups, with each subgroupresponsible for generating some words or shortkey phrases for the market chain’s future. Thenthe facilitators collect all the contributions andconstruct a shared future vision.
Once the two extremes are clear, the specificobjectives from the objective tree are reviewed toidentify a logical order for their implementation.Facilitators can use phrases such as “startingfrom where we are now we hope to reach ourdesired future in 5 years by achieving thefollowing objectives...”
The following questions tend to generate debateamongst the participants.
Generallimitation Objective 1 Objective 2
· Which one or ones come first?
· Is there one or several objectives whoseachievement would leverage importantchanges in the others?
· Are there objectives that depend on others?
· Where do we begin, and why?
In our experience, at the end of the debate, oneor two objectives with the potential to catalyzechange tend to emerge. These specific objectivesare placed a little to the right of the centrallimitation previously identified.
The process continues with the placement ofother specific objectives in a logical patternflowing from right to left until all the specificobjectives have been placed between the twoends (see Figure 19).
Once the objectives are logically organized,activities and results are defined for eachobjective. At this stage, the logical path clearlyidentifies the key entry point or pointsfollowed by additional linked objectives to guidethe market chain to the desired future(Figure 20).
GeneralobjectiveObjective 3
Description ofpresent situation.
In few words,where are we?
Description of desiredfuture situation.
In few words, wheredo we want to be?
Today Tomorrow
Figure 19. Definition of a logical path.
Activities1.11.2...
Activities2.12.2...
Activities3.13.2...
Products1.11.2...
Products2.12.2...
Products3.13.2...
Generallimitation Objective 1 Objective 2
GeneralobjectiveObjective 3
Description ofpresent situation.
In few words,where are we?
Description ofdesired situation.
In few words,where do we want
to be?
Today Tomorrow
Figure 20. Complete simple logical path with actions and results.
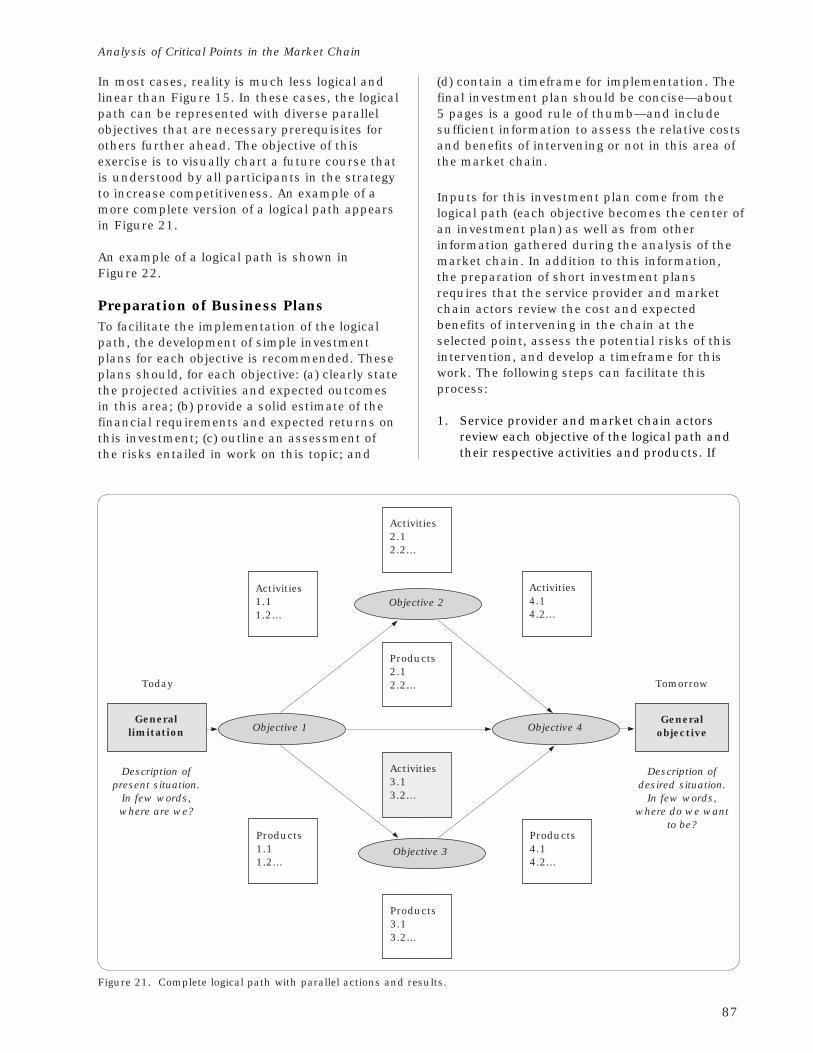
87
Analysis of Critical Points in the Market Chain
In most cases, reality is much less logical andlinear than Figure 15. In these cases, the logicalpath can be represented with diverse parallelobjectives that are necessary prerequisites forothers further ahead. The objective of thisexercise is to visually chart a future course thatis understood by all participants in the strategyto increase competitiveness. An example of amore complete version of a logical path appearsin Figure 21.
An example of a logical path is shown inFigure 22.
Preparation of Business PlansTo facilitate the implementation of the logicalpath, the development of simple investmentplans for each objective is recommended. Theseplans should, for each objective: (a) clearly statethe projected activities and expected outcomesin this area; (b) provide a solid estimate of thefinancial requirements and expected returns onthis investment; (c) outline an assessment ofthe risks entailed in work on this topic; and
Generalobjective
Description ofdesired situation.
In few words,where do we want
to be?
Tomorrow
Activities1.11.2...
Activities2.12.2...
Activities4.14.2...
Products1.11.2...
Products3.13.2...
Products4.14.2...
Generallimitation Objective 1
Objective 3
Objective 4
Description ofpresent situation.
In few words,where are we?
Today
Objective 2
Products2.12.2...
Activities3.13.2...
Figure 21. Complete logical path with parallel actions and results.
(d) contain a timeframe for implementation. Thefinal investment plan should be concise—about5 pages is a good rule of thumb—and includesufficient information to assess the relative costsand benefits of intervening or not in this area ofthe market chain.
Inputs for this investment plan come from thelogical path (each objective becomes the center ofan investment plan) as well as from otherinformation gathered during the analysis of themarket chain. In addition to this information,the preparation of short investment plansrequires that the service provider and marketchain actors review the cost and expectedbenefits of intervening in the chain at theselected point, assess the potential risks of thisintervention, and develop a timeframe for thiswork. The following steps can facilitate thisprocess:
1. Service provider and market chain actorsreview each objective of the logical path andtheir respective activities and products. If
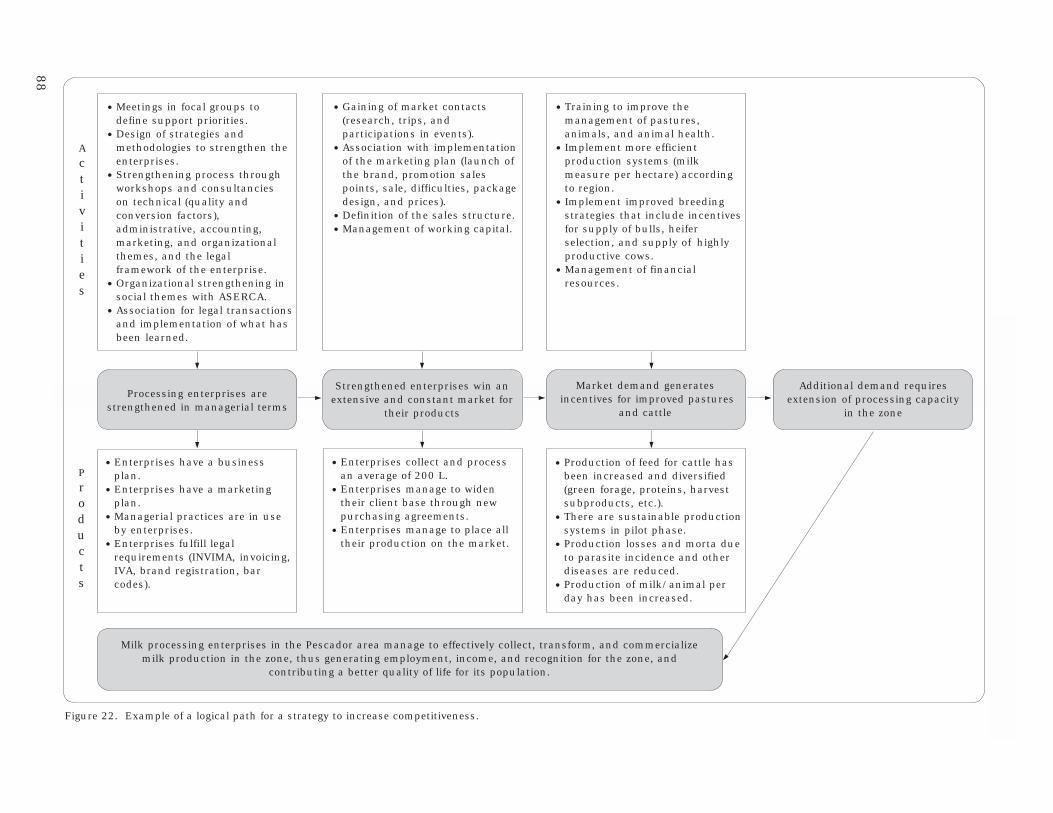
88
Pa
rticipa
tory M
ark
et Ch
ain
An
aly
sis for Sm
allh
older P
rodu
cers
·Meetings in focal groups todefine support priorities.
·Design of strategies andmethodologies to strengthen theenterprises.
·Strengthening process throughworkshops and consultancieson technical (quality andconversion factors),administrative, accounting,marketing, and organizationalthemes, and the legalframework of the enterprise.
·Organizational strengthening insocial themes with ASERCA.
·Association for legal transactionsand implementation of what hasbeen learned.
·Gaining of market contacts(research, trips, andparticipations in events).
·Association with implementationof the marketing plan (launch ofthe brand, promotion salespoints, sale, difficulties, packagedesign, and prices).
·Definition of the sales structure.
·Management of working capital.
·Training to improve themanagement of pastures,animals, and animal health.
· Implement more efficientproduction systems (milkmeasure per hectare) accordingto region.
· Implement improved breedingstrategies that include incentivesfor supply of bulls, heiferselection, and supply of highlyproductive cows.
·Management of financialresources.
Processing enterprises arestrengthened in managerial terms
Strengthened enterprises win anextensive and constant market for
their products
Market demand generates incentives for improved pastures
and cattle
·Enterprises have a businessplan.
·Enterprises have a marketingplan.
·Managerial practices are in useby enterprises.
·Enterprises fulfill legalrequirements (INVIMA, invoicing,IVA, brand registration, barcodes).
Additional demand requiresextension of processing capacity
in the zone
·Enterprises collect and processan average of 200 L.
·Enterprises manage to widentheir client base through newpurchasing agreements.
·Enterprises manage to place alltheir production on the market.
·Production of feed for cattle hasbeen increased and diversified(green forage, proteins, harvestsubproducts, etc.).
· There are sustainable productionsystems in pilot phase.
·Production losses and morta dueto parasite incidence and otherdiseases are reduced.
·Production of milk/animal perday has been increased.
Milk processing enterprises in the Pescador area manage to effectively collect, transform, and commercializemilk production in the zone, thus generating employment, income, and recognition for the zone, and
contributing a better quality of life for its population.
Activities
Products
Figure 22. Example of a logical path for a strategy to increase competitiveness.
89
Analysis of Critical Points in the Market Chain
these are judged appropriate they areadopted as the projected activities andoutcomes for the objective.
2. Activities are listed in chronologicalfashion—what comes first and what comeslater—and costs assigned to each. Assignedcosts should be as accurate and honest aspossible with the information available, asthey will provide an important point ofanalysis once outcomes and expectedbenefits are included.
3. Expected outcomes and benefits arereviewed for each objective to assure thatthey can be met with the proposed activitiesand financial resources. For each objective,the service provider should estimate thereturn on investment by quantifying theproposed outcomes or benefits andcomparing that figure with the sum of therequired investments. The return oninvestment usually has a longer timeframethan the investment plan but, as a rule ofthumb, should not exceed 5 years32.
4. Costs and benefits are compared to assessthe relative return for the plannedinvestments in each objective.
5. Information generated in this exercise isdocumented and the short investment plansprepared as inputs for the final strategy.
In our experience, the development of specificinvestment plans can be assigned to groups ofmarket chain actors and staff from the serviceprovider as an activity to develop between theend of the workshop on the logical path andprior to the final negotiation session with allchain actors. In this case, a space of 2 weeksshould be sufficient to develop a business planfor each objective of the logical path. Theseplans may be shared as soon as available but,in any case, will be presented and discussed atthe final session with all market chain actors.For an example of the format for a businessplan, see Appendix 3.
In this section we have explained how to carryout an analysis of critical points, from theiridentification to their translation into objectives,and their inclusion in a logical path to increasethe market chain’s competitiveness. In additionwe have presented simple exercises to assessthe competitive position of the market chainwith regard to similar market chains and selectmarketing positions to build on or strengthenthe competitive position of the market chain.With the logical path and investment plans inhand, the facilitating organization is ready tosystematize all the information generated up tonow and share it with the market chain actors.Based on this information, discussions will befacilitated, decisions made, and resourcescommitted to strengthen the market chain. Thenext section explains how to facilitate thenegotiating process between the actors anddesign the final strategy.
32. The participation of an accountant or someoneversed in simple financial analysis using Excel isrecommended at this stage, especially if no one inthe support organization of chain actors hasexperience in this kind of calculations.
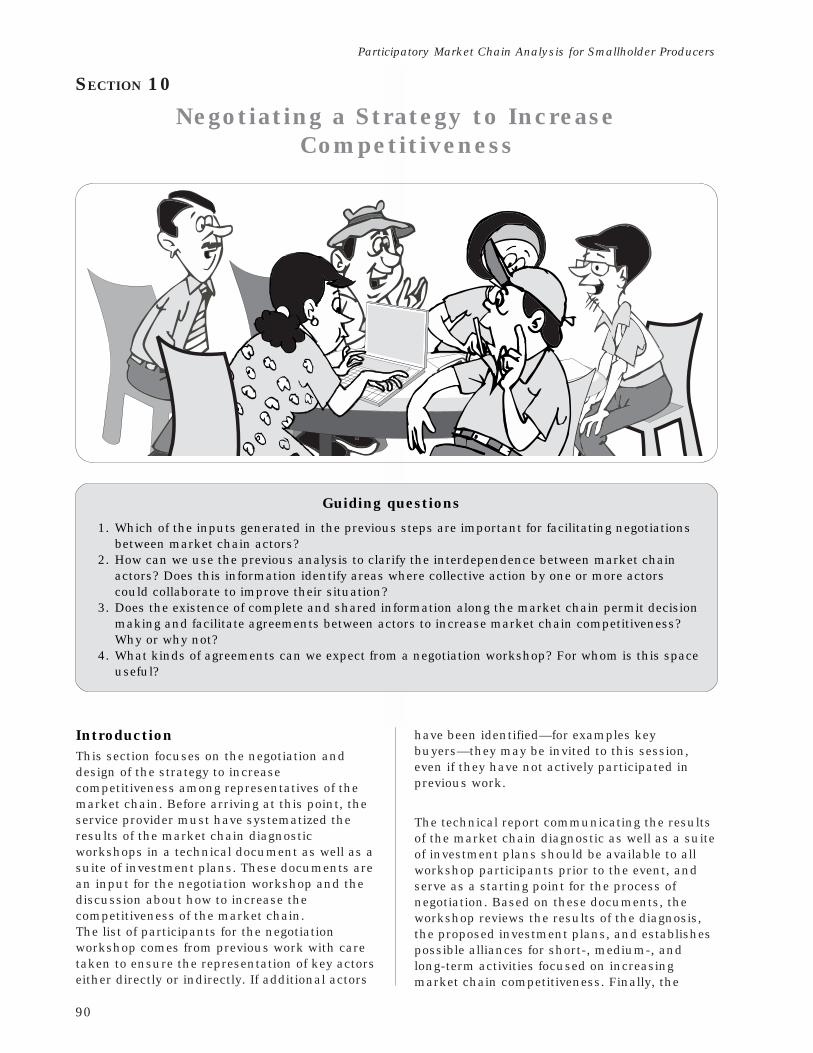
90
Participatory Market Chain Analysis for Smallholder Producers
SECTION 10
Negotiating a Strategy to IncreaseCompetitiveness
Guiding questions
1. Which of the inputs generated in the previous steps are important for facilitating negotiationsbetween market chain actors?
2. How can we use the previous analysis to clarify the interdependence between market chainactors? Does this information identify areas where collective action by one or more actorscould collaborate to improve their situation?
3. Does the existence of complete and shared information along the market chain permit decisionmaking and facilitate agreements between actors to increase market chain competitiveness?Why or why not?
4. What kinds of agreements can we expect from a negotiation workshop? For whom is this spaceuseful?
IntroductionThis section focuses on the negotiation anddesign of the strategy to increasecompetitiveness among representatives of themarket chain. Before arriving at this point, theservice provider must have systematized theresults of the market chain diagnosticworkshops in a technical document as well as asuite of investment plans. These documents arean input for the negotiation workshop and thediscussion about how to increase thecompetitiveness of the market chain.The list of participants for the negotiationworkshop comes from previous work with caretaken to ensure the representation of key actorseither directly or indirectly. If additional actors
have been identified—for examples keybuyers—they may be invited to this session,even if they have not actively participated inprevious work.
The technical report communicating the resultsof the market chain diagnostic as well as a suiteof investment plans should be available to allworkshop participants prior to the event, andserve as a starting point for the process ofnegotiation. Based on these documents, theworkshop reviews the results of the diagnosis,the proposed investment plans, and establishespossible alliances for short-, medium-, andlong-term activities focused on increasingmarket chain competitiveness. Finally, the
91
Negotiating a Strategy to Increase Competitiveness
logical path and investment plans are improvedor accepted and action plans developed for theirimplementation.
Below, we revise step by step how to facilitatethe design of a strategy to increasecompetitiveness.
Systematization of Results: TechnicalDocumentBefore the negotiation workshop, werecommend providing a technical document toparticipants, if this has not already been done,with the results from previous workshops. Thecontents of this document may follow the modelbelow or another identified by the facilitatingorganization.
Suggested contents1. Market chain selection: A brief description
of how and why the market chain wasselected.
2. Market survey, by select team: Key resultsof the market survey with special emphasison demand aspects including retail prices,price trends, product qualities, markettrends, and opportunities for new markets ornew products.
3. Identification of actors: Using theinformation from the summary interviewssheets and based on meetings, this sectionshould outline who are the actors convenedfor the design of the strategy to increasecompetitiveness. Why were they selected?Who was excluded and why?
4. Participatory analysis of the marketchain by selected actors:
a. Market chain map
· Presentation of the final market chainmap where product flows, actors’relationships and business developmentservices identified.
· A report on price formation, includingproduction costs for producers (ifpossible for the intermediaries andwholesalers), as well as the purchase andsales prices for each player.
· A report on income distribution along themarket chain focused on gross margin(inputs-outputs) and what percentage ofthe final price reaches each actor.
b. Characterization of the market chain’sactors
· Geographic location (where they arelocated).
· Role within the market chain (whatfunction is carried out: production,processing, support, accounting,marketing, transport, etc.).
· Level of organization (what grade ofbusiness organization each player has)and type of organization (farmerorganization, community developmentorganization, business firm, etc.).
· Managerial capacity (what managerialpractices are used such asadministration, accounting,management capacity, marketing, etc.).
· Disposition to participate in marketchain improvement (your perception ofeach player’s desire to participate inactivities to improve the market chain).
· Possible alliances identified betweenactors and their motivations. Whatpossible alliances are visualized,between whom, what are the factors thatmake the alliance possible? (Forexample, motivations such as incomegains, increased volume, improvementof product quality, opening new markets,etc.).
This last question is important since thenecessary details will be worked on in thenegotiation workshop with all market chainactors.
c. Business development services
Includes the business development servicesdemanded and supplied along the marketchain. The analysis of these data can bebased on the following questions:
· Who supplies business developmentservices to the market chain in thedifferent links?
· How is the quality and effectiveness ofthe services perceived both by the clientsand suppliers?
· Are there gaps between availableservices and those needed for increasingmarket chain competitiveness? What arethey?
· Are there services that have manysuppliers and few clients?
· Which services are paid for, and whichrequire subsidies to function? Is there a
92
Participatory Market Chain Analysis for Smallholder Producers
relationship between the quality of theservice and whether it is paid for orsubsidized?
d. The timeline and past interventions
Share the table of market chain history withthe actors.
· Analyze the types of support offered towhom and on what themes.
· If people have catalogued this support asnegative, analyze why.
· Share the outcome of previousinterventions and identified localcapacity to effect positive change.
5. Analysis of critical points: Include copiesof the general limitation tree and the generalsolution tree with ranked limitations andtheir analysis. If discussions are anticipated,it may be useful to have all the problemstrees generated available.
6. Logical path for the market chain:Include a copy of the logical path generatedfor the market chain with its respectiveactivities and results.
7. Options for investment plans to bepresented by group members: Present theshort investment plans with the followinginformation for each objective in the logicalpath:
· The projected activities and expectedoutcomes in this area.
· A solid estimate of the financialrequirements and expected returns onthis investment.
· An assessment of the risks entailed inwork on this topic.
· A timeframe for implementation.
In addition, give credit for data collection andanalysis to participants and facilitators in theworkshops in the summary document.
We recommend providing this technicaldocument with participants in the negotiationworkshop ahead of time so that they can reviewthe contents. It is also useful to kick off theworkshop with a brief presentation highlightingthe most important results from the diagnosticprocess. This aspect is important as some of theactors present in the negotiation workshop mayhave been absent from the previous workshops,
but are key to taking advantage of the businessopportunities open to the market chain.
Negotiation WorkshopObjectives1. Share and discuss the market chain
diagnosis with a representative group ofmarket chain actors.
2. Identify key points of common interestamong the different actors.
3. Negotiate possible alliances and collectiveactions (between more than one actor) totake advantage of market opportunities.
ParticipantsThe participation of key actors along the marketchain—especially those necessary to takeadvantage of specific business opportunities—isvital for this workshop. In this case, the serviceprovider should make every effort to involve keyactors who may have not participated activelyin other parts of the analysis but are key tochain development. This is often the case withmajor clients or traders with whom usefuldiscussions are more feasible, based on theinformation contained in the market chainanalysis.
Other types of actors can also be invited, suchas specialist service providers who alreadyprovide or may provide business developmentservices to the market chain, as well as NGOmanagers to evaluate the results depending onthe needs of the market chain. In addition, abanker/accountant may be useful to assist inthe revision of the investment plans.
Development of the workshopThe following steps are recommended for thenegotiation workshop. The service provider andmarket chain actors should revise theirapplicability, and adapt or change themaccording to their best criteria. Combining thefollowing list with less formal activities—i.e.,coffee breaks, lunch, mixers, or round-tablediscussions—is useful as well as serving toreinforce the informal relations between diverseactors along the market chain.
Presentation of limitations andopportunities by actorsAt the start, the problems found in the marketchain can be shared by each group of actors.An easy way of communicating this informationis by means of a matrix where the functional
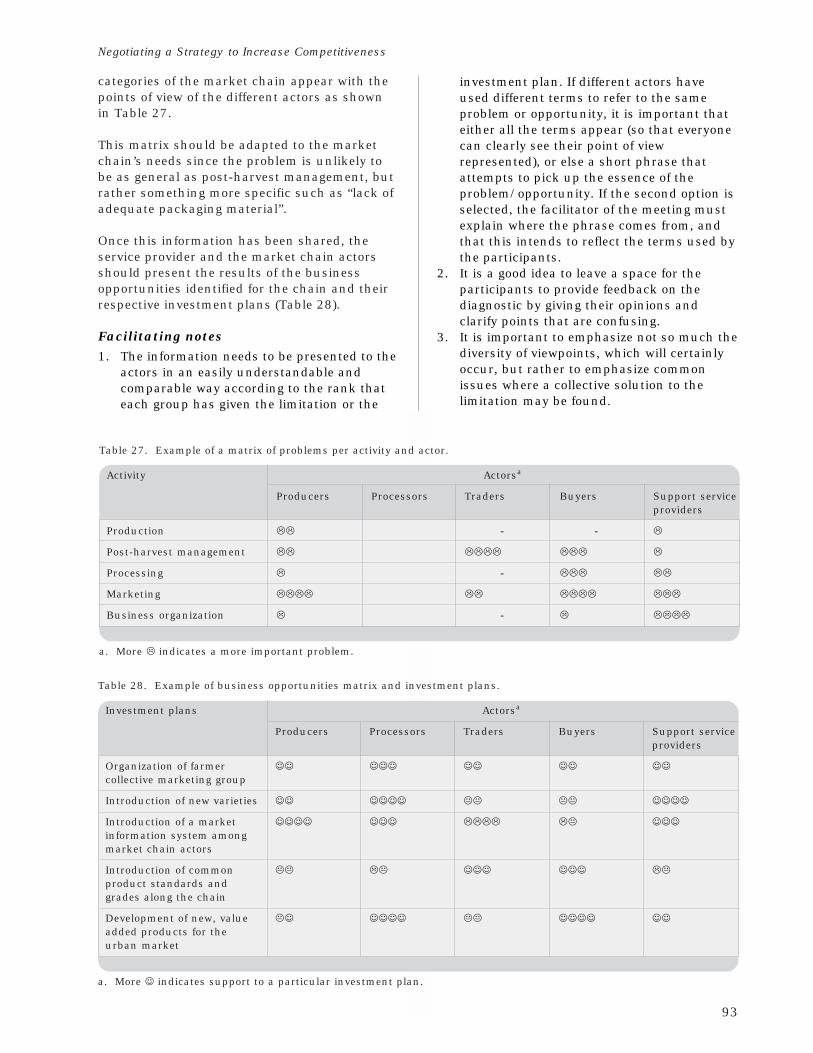
93
Negotiating a Strategy to Increase Competitiveness
categories of the market chain appear with thepoints of view of the different actors as shownin Table 27.
This matrix should be adapted to the marketchain’s needs since the problem is unlikely tobe as general as post-harvest management, butrather something more specific such as “lack ofadequate packaging material”.
Once this information has been shared, theservice provider and the market chain actorsshould present the results of the businessopportunities identified for the chain and theirrespective investment plans (Table 28).
Facilitating notes1. The information needs to be presented to the
actors in an easily understandable andcomparable way according to the rank thateach group has given the limitation or the
investment plan. If different actors haveused different terms to refer to the sameproblem or opportunity, it is important thateither all the terms appear (so that everyonecan clearly see their point of viewrepresented), or else a short phrase thatattempts to pick up the essence of theproblem/opportunity. If the second option isselected, the facilitator of the meeting mustexplain where the phrase comes from, andthat this intends to reflect the terms used bythe participants.
2. It is a good idea to leave a space for theparticipants to provide feedback on thediagnostic by giving their opinions andclarify points that are confusing.
3. It is important to emphasize not so much thediversity of viewpoints, which will certainlyoccur, but rather to emphasize commonissues where a collective solution to thelimitation may be found.
Table 28. Example of business opportunities matrix and investment plans.
Investment plans Actorsa
Producers Processors Traders Buyers Support serviceproviders
Organization of farmer ☺☺ ☺☺☺ ☺☺ ☺☺ ☺☺collective marketing group
Introduction of new varieties ☺☺ ☺☺☺☺ "" "" ☺☺☺☺
Introduction of a market ☺☺☺☺ ☺☺☺ #### #" ☺☺☺information system amongmarket chain actors
Introduction of common "" #" ☺☺☺ ☺☺☺ #"product standards andgrades along the chain
Development of new, value "☺ ☺☺☺☺ "" ☺☺☺☺ ☺☺added products for theurban market
a. More ☺ indicates support to a particular investment plan.
Table 27. Example of a matrix of problems per activity and actor.
Activity Actorsa
Producers Processors Traders Buyers Support serviceproviders
Production ## - - #
Post-harvest management ## #### ### #
Processing # - ### ##
Marketing #### ## #### ###
Business organization # - # ####
a. More # indicates a more important problem.
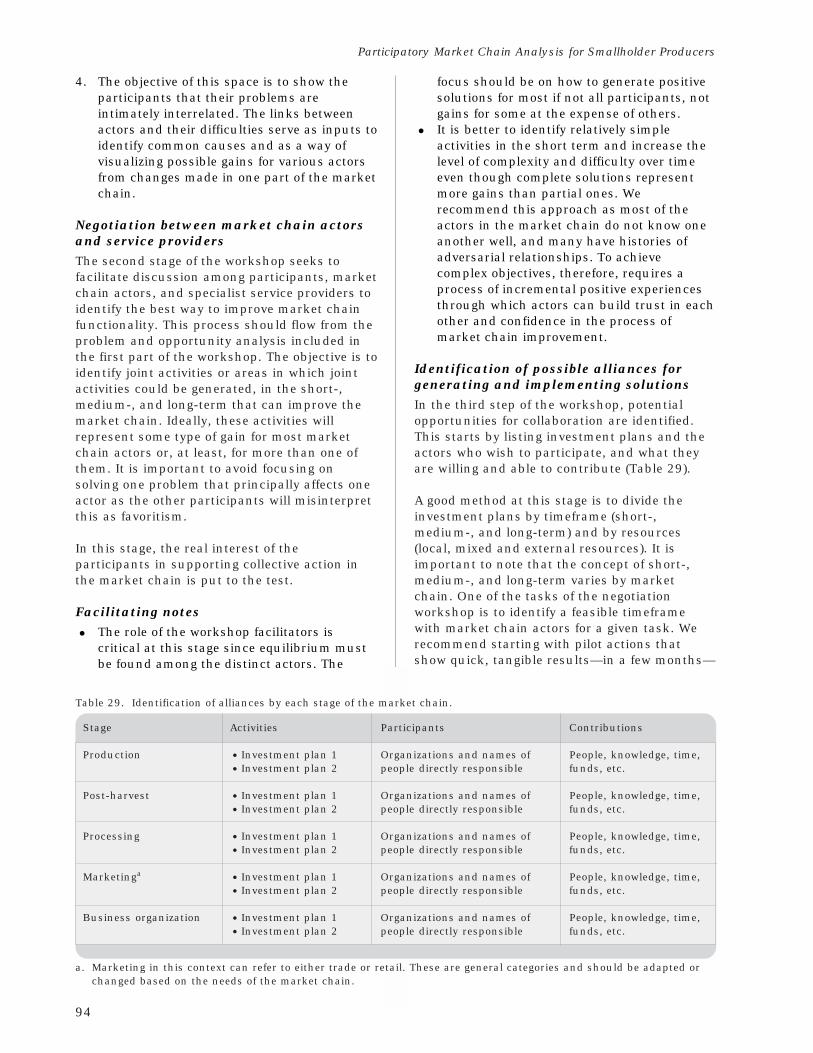
94
Participatory Market Chain Analysis for Smallholder Producers
4. The objective of this space is to show theparticipants that their problems areintimately interrelated. The links betweenactors and their difficulties serve as inputs toidentify common causes and as a way ofvisualizing possible gains for various actorsfrom changes made in one part of the marketchain.
Negotiation between market chain actorsand service providersThe second stage of the workshop seeks tofacilitate discussion among participants, marketchain actors, and specialist service providers toidentify the best way to improve market chainfunctionality. This process should flow from theproblem and opportunity analysis included inthe first part of the workshop. The objective is toidentify joint activities or areas in which jointactivities could be generated, in the short-,medium-, and long-term that can improve themarket chain. Ideally, these activities willrepresent some type of gain for most marketchain actors or, at least, for more than one ofthem. It is important to avoid focusing onsolving one problem that principally affects oneactor as the other participants will misinterpretthis as favoritism.
In this stage, the real interest of theparticipants in supporting collective action inthe market chain is put to the test.
Facilitating notes
· The role of the workshop facilitators iscritical at this stage since equilibrium mustbe found among the distinct actors. The
focus should be on how to generate positivesolutions for most if not all participants, notgains for some at the expense of others.
· It is better to identify relatively simpleactivities in the short term and increase thelevel of complexity and difficulty over timeeven though complete solutions representmore gains than partial ones. Werecommend this approach as most of theactors in the market chain do not know oneanother well, and many have histories ofadversarial relationships. To achievecomplex objectives, therefore, requires aprocess of incremental positive experiencesthrough which actors can build trust in eachother and confidence in the process ofmarket chain improvement.
Identification of possible alliances forgenerating and implementing solutionsIn the third step of the workshop, potentialopportunities for collaboration are identified.This starts by listing investment plans and theactors who wish to participate, and what theyare willing and able to contribute (Table 29).
A good method at this stage is to divide theinvestment plans by timeframe (short-,medium-, and long-term) and by resources(local, mixed and external resources). It isimportant to note that the concept of short-,medium-, and long-term varies by marketchain. One of the tasks of the negotiationworkshop is to identify a feasible timeframewith market chain actors for a given task. Werecommend starting with pilot actions thatshow quick, tangible results—in a few months—
Table 29. Identification of alliances by each stage of the market chain.
Stage Activities Participants Contributions
Production · Investment plan 1 Organizations and names of People, knowledge, time,
· Investment plan 2 people directly responsible funds, etc.
Post-harvest · Investment plan 1 Organizations and names of People, knowledge, time,
· Investment plan 2 people directly responsible funds, etc.
Processing · Investment plan 1 Organizations and names of People, knowledge, time,
· Investment plan 2 people directly responsible funds, etc.
Marketinga · Investment plan 1 Organizations and names of People, knowledge, time,
· Investment plan 2 people directly responsible funds, etc.
Business organization · Investment plan 1 Organizations and names of People, knowledge, time,
· Investment plan 2 people directly responsible funds, etc.
a. Marketing in this context can refer to either trade or retail. These are general categories and should be adapted orchanged based on the needs of the market chain.
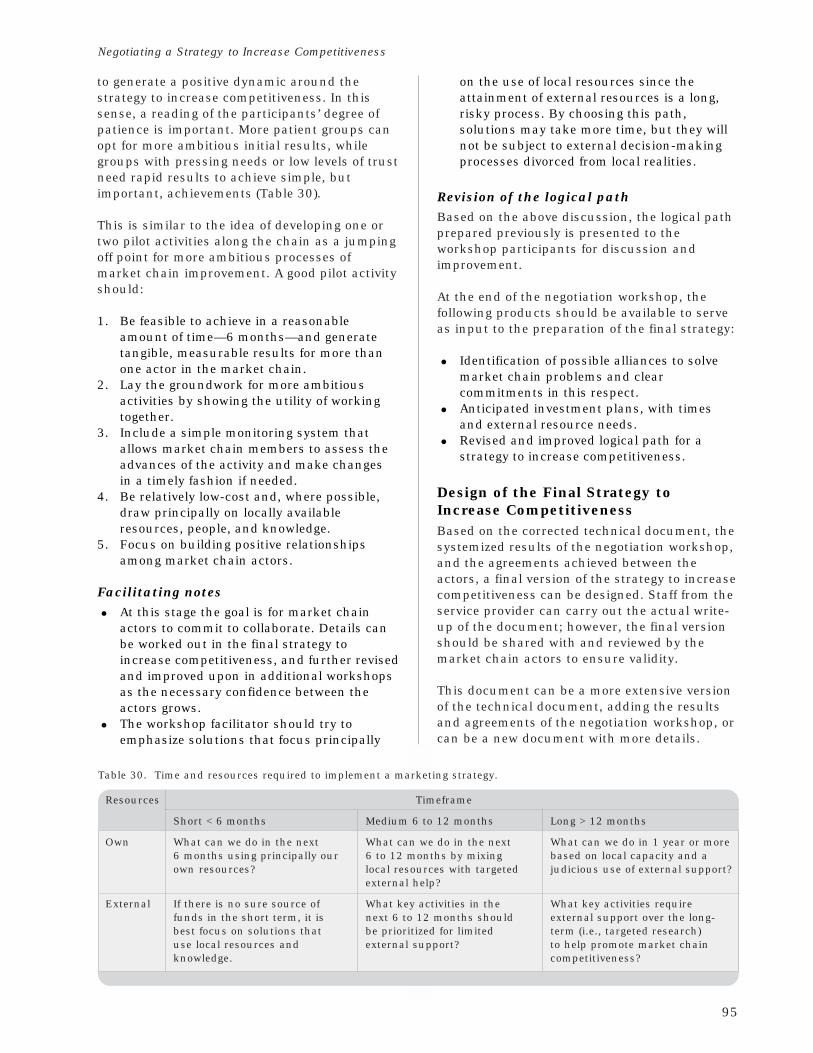
95
Negotiating a Strategy to Increase Competitiveness
to generate a positive dynamic around thestrategy to increase competitiveness. In thissense, a reading of the participants’ degree ofpatience is important. More patient groups canopt for more ambitious initial results, whilegroups with pressing needs or low levels of trustneed rapid results to achieve simple, butimportant, achievements (Table 30).
This is similar to the idea of developing one ortwo pilot activities along the chain as a jumpingoff point for more ambitious processes ofmarket chain improvement. A good pilot activityshould:
1. Be feasible to achieve in a reasonableamount of time—6 months—and generatetangible, measurable results for more thanone actor in the market chain.
2. Lay the groundwork for more ambitiousactivities by showing the utility of workingtogether.
3. Include a simple monitoring system thatallows market chain members to assess theadvances of the activity and make changesin a timely fashion if needed.
4. Be relatively low-cost and, where possible,draw principally on locally availableresources, people, and knowledge.
5. Focus on building positive relationshipsamong market chain actors.
Facilitating notes
· At this stage the goal is for market chainactors to commit to collaborate. Details canbe worked out in the final strategy toincrease competitiveness, and further revisedand improved upon in additional workshopsas the necessary confidence between theactors grows.
· The workshop facilitator should try toemphasize solutions that focus principally
on the use of local resources since theattainment of external resources is a long,risky process. By choosing this path,solutions may take more time, but they willnot be subject to external decision-makingprocesses divorced from local realities.
Revision of the logical pathBased on the above discussion, the logical pathprepared previously is presented to theworkshop participants for discussion andimprovement.
At the end of the negotiation workshop, thefollowing products should be available to serveas input to the preparation of the final strategy:
· Identification of possible alliances to solvemarket chain problems and clearcommitments in this respect.
· Anticipated investment plans, with timesand external resource needs.
· Revised and improved logical path for astrategy to increase competitiveness.
Design of the Final Strategy toIncrease CompetitivenessBased on the corrected technical document, thesystemized results of the negotiation workshop,and the agreements achieved between theactors, a final version of the strategy to increasecompetitiveness can be designed. Staff from theservice provider can carry out the actual write-up of the document; however, the final versionshould be shared with and reviewed by themarket chain actors to ensure validity.
This document can be a more extensive versionof the technical document, adding the resultsand agreements of the negotiation workshop, orcan be a new document with more details.
Table 30. Time and resources required to implement a marketing strategy.
Resources Timeframe
Short < 6 months Medium 6 to 12 months Long > 12 months
Own What can we do in the next What can we do in the next What can we do in 1 year or more6 months using principally our 6 to 12 months by mixing based on local capacity and aown resources? local resources with targeted judicious use of external support?
external help?
External If there is no sure source of What key activities in the What key activities requirefunds in the short term, it is next 6 to 12 months should external support over the long-best focus on solutions that be prioritized for limited term (i.e., targeted research)use local resources and external support? to help promote market chainknowledge. competitiveness?
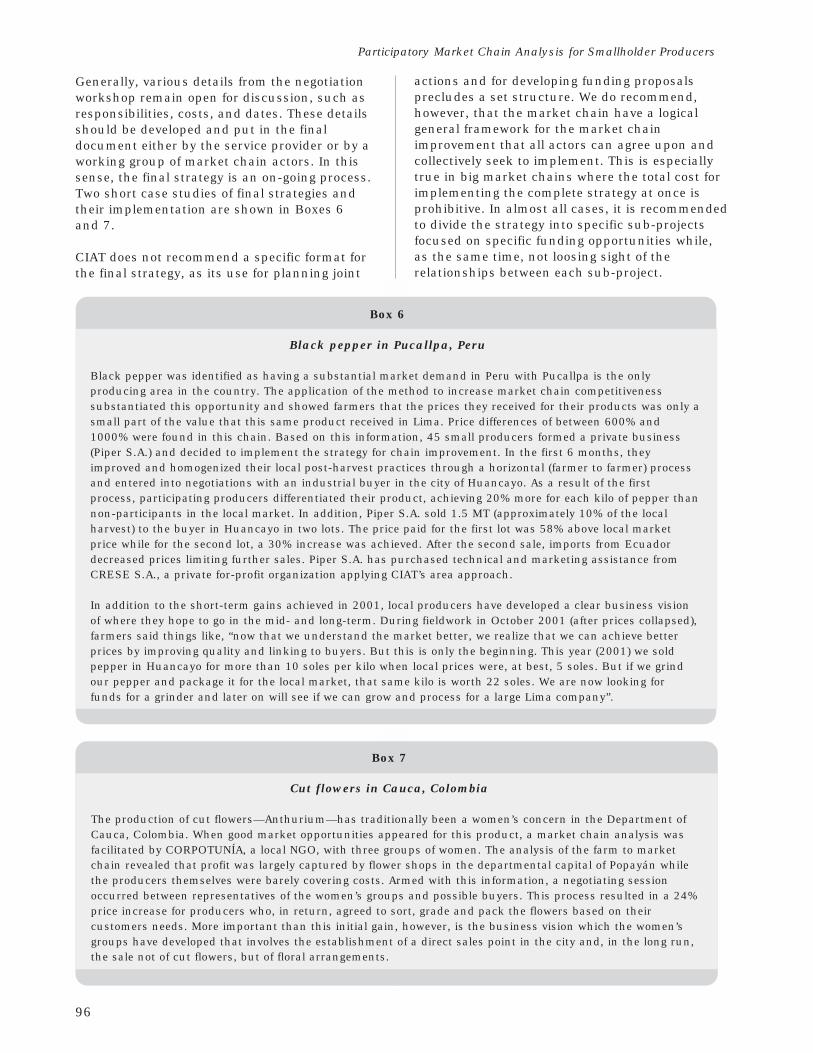
96
Participatory Market Chain Analysis for Smallholder Producers
Generally, various details from the negotiationworkshop remain open for discussion, such asresponsibilities, costs, and dates. These detailsshould be developed and put in the finaldocument either by the service provider or by aworking group of market chain actors. In thissense, the final strategy is an on-going process.Two short case studies of final strategies andtheir implementation are shown in Boxes 6and 7.
CIAT does not recommend a specific format forthe final strategy, as its use for planning joint
actions and for developing funding proposalsprecludes a set structure. We do recommend,however, that the market chain have a logicalgeneral framework for the market chainimprovement that all actors can agree upon andcollectively seek to implement. This is especiallytrue in big market chains where the total cost forimplementing the complete strategy at once isprohibitive. In almost all cases, it is recommendedto divide the strategy into specific sub-projectsfocused on specific funding opportunities while,as the same time, not loosing sight of therelationships between each sub-project.
Box 6
Black pepper in Pucallpa, Peru
Black pepper was identified as having a substantial market demand in Peru with Pucallpa is the onlyproducing area in the country. The application of the method to increase market chain competitivenesssubstantiated this opportunity and showed farmers that the prices they received for their products was only asmall part of the value that this same product received in Lima. Price differences of between 600% and1000% were found in this chain. Based on this information, 45 small producers formed a private business(Piper S.A.) and decided to implement the strategy for chain improvement. In the first 6 months, theyimproved and homogenized their local post-harvest practices through a horizontal (farmer to farmer) processand entered into negotiations with an industrial buyer in the city of Huancayo. As a result of the firstprocess, participating producers differentiated their product, achieving 20% more for each kilo of pepper thannon-participants in the local market. In addition, Piper S.A. sold 1.5 MT (approximately 10% of the localharvest) to the buyer in Huancayo in two lots. The price paid for the first lot was 58% above local marketprice while for the second lot, a 30% increase was achieved. After the second sale, imports from Ecuadordecreased prices limiting further sales. Piper S.A. has purchased technical and marketing assistance fromCRESE S.A., a private for-profit organization applying CIAT’s area approach.
In addition to the short-term gains achieved in 2001, local producers have developed a clear business visionof where they hope to go in the mid- and long-term. During fieldwork in October 2001 (after prices collapsed),farmers said things like, “now that we understand the market better, we realize that we can achieve betterprices by improving quality and linking to buyers. But this is only the beginning. This year (2001) we soldpepper in Huancayo for more than 10 soles per kilo when local prices were, at best, 5 soles. But if we grindour pepper and package it for the local market, that same kilo is worth 22 soles. We are now looking forfunds for a grinder and later on will see if we can grow and process for a large Lima company”.
Box 7
Cut flowers in Cauca, Colombia
The production of cut flowers—Anthurium—has traditionally been a women’s concern in the Department ofCauca, Colombia. When good market opportunities appeared for this product, a market chain analysis wasfacilitated by CORPOTUNÍA, a local NGO, with three groups of women. The analysis of the farm to marketchain revealed that profit was largely captured by flower shops in the departmental capital of Popayán whilethe producers themselves were barely covering costs. Armed with this information, a negotiating sessionoccurred between representatives of the women’s groups and possible buyers. This process resulted in a 24%price increase for producers who, in return, agreed to sort, grade and pack the flowers based on theircustomers needs. More important than this initial gain, however, is the business vision which the women’sgroups have developed that involves the establishment of a direct sales point in the city and, in the long run,the sale not of cut flowers, but of floral arrangements.
97
Negotiating a Strategy to Increase Competitiveness
In general terms, the strategy can beunderstood as a road map that defines a pathfor increasing the competitiveness of a marketchain. The way in which the strategy isimplemented depends on the actors themselves.There are examples of strategies ofcompetitiveness that are implemented by localactors (formal and informal) with a minimum ofexternal help, and others that have managed toobtain significant funding. It is important,therefore, not to view the strategy as a
document, but rather as the first step in aprocess of discussion, collaboration, andsupport between actors focused on changingtheir relationships in a substantial way, andtherefore the functioning of the market chain.
In the following and final section, some generalguidelines for the monitoring and evaluation ofstrategies to increase competitiveness arepresented.
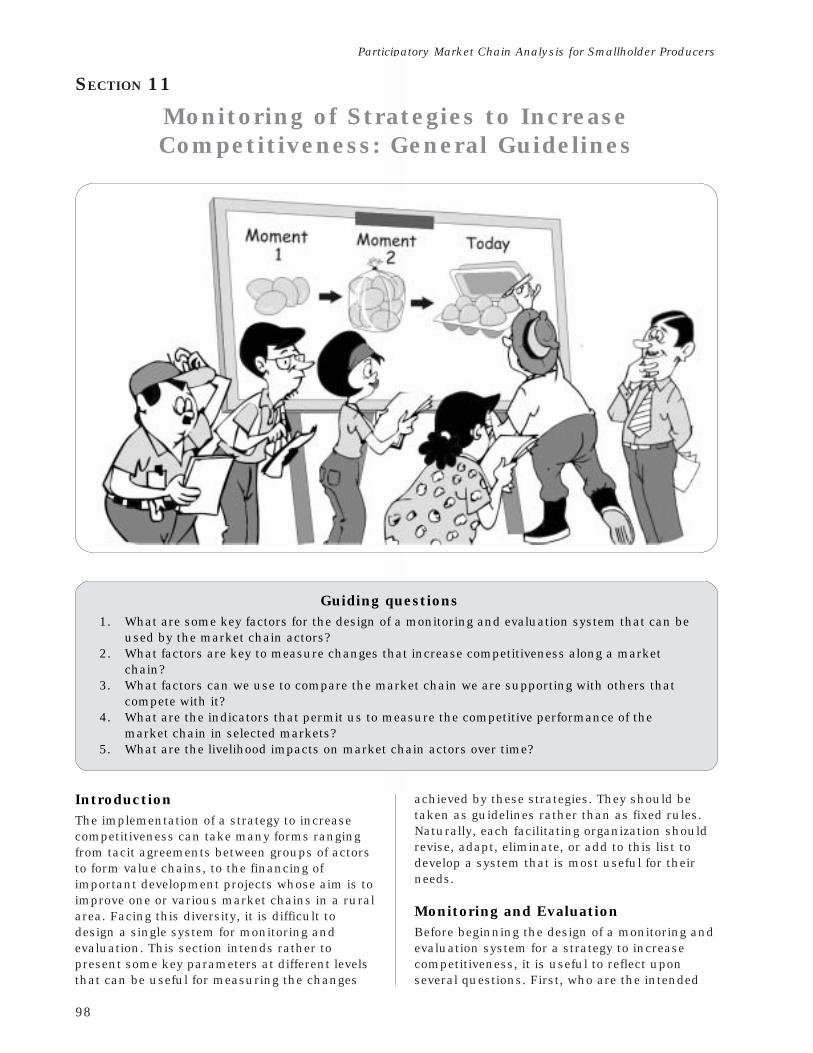
98
Participatory Market Chain Analysis for Smallholder Producers
SECTION 11
Monitoring of Strategies to IncreaseCompetitiveness: General Guidelines
Guiding questions1. What are some key factors for the design of a monitoring and evaluation system that can be
used by the market chain actors?2. What factors are key to measure changes that increase competitiveness along a market
chain?3. What factors can we use to compare the market chain we are supporting with others that
compete with it?4. What are the indicators that permit us to measure the competitive performance of the
market chain in selected markets?5. What are the livelihood impacts on market chain actors over time?
IntroductionThe implementation of a strategy to increasecompetitiveness can take many forms rangingfrom tacit agreements between groups of actorsto form value chains, to the financing ofimportant development projects whose aim is toimprove one or various market chains in a ruralarea. Facing this diversity, it is difficult todesign a single system for monitoring andevaluation. This section intends rather topresent some key parameters at different levelsthat can be useful for measuring the changes
achieved by these strategies. They should betaken as guidelines rather than as fixed rules.Naturally, each facilitating organization shouldrevise, adapt, eliminate, or add to this list todevelop a system that is most useful for theirneeds.
Monitoring and EvaluationBefore beginning the design of a monitoring andevaluation system for a strategy to increasecompetitiveness, it is useful to reflect uponseveral questions. First, who are the intended
99
Monitoring of Strategies to Increase Competitiveness: General Guidelines
users of the data generated by the proposedmonitoring and evaluation system? Will theusers be technicians, donors, or managers ofthe facilitating organizations, market chainactors, the government, or a mixture of these?How will the data be used by different groups?Depending on the users, a system or varioussystems should be designed in response to theirneeds, desires, and capacities. If a particulargroup is expected to help collect or analyze datain the process, it is important to ascertain if thegroup’s interests are clearly represented in theproposed system.
Second, the proposed system should besufficiently simple or complex to respond to theneeds of its users. If the monitoring andevaluation of the strategy will be implementedwith market chain actors, the system should bedesigned with their participation so that itresponds to their needs by generatinginformation useful for their decision-makingprocesses.
Third, what are the objectives of the monitoringand evaluation system? Is it a system to helprespond to the donor’s demands forinformation? Is it a system that intends to showthe actors how near or far they are from thelevels of competitiveness of other similar marketchains? Does it capture stories of positivechanges for publicity reports? Does itcollectively learn about what works in improvinga market chain and share it with others? Havingclarity about the rational behind the system isimportant so that it is designed correctly.
Finally, a monitoring and evaluation system tobe effective must continue to function over time.Who will manage the system? Who will takecharge of collecting, processing, and feedingdata into the system? How often? Will localpersons or external experts carry out theseactivities? How will the management of thesystem be paid for? The system should bedesigned to be feasible to manage, maintain,and use.
Possible Factors for a Monitoring andEvaluation SystemSome possible factors to take into account for amonitoring and evaluation system are set outbelow with their respective sources ofinformation. Again, this list does not intend tobe either complete or unique; it should be usedas input for the design of a system thatresponds to users’ needs.
Within the market chain
· Production costs: Evolution of productioncosts in the market chain’s different links.Are the costs stable, increasing, ordeclining?
· Yields per unit: Evolution of the yields, orproductivity per unit, invested or employedin the market chain. For example,production per hectare planted or quantityof cheese produced per liter of milk.
· Value of final product: Evolution of thecommercial value (in constant currency) ofthe final product or products of the marketchain. Is the value of the product increasing,stable, or declining?
· Profitability: Evolution of the product’sgross or net profit for the market chain.Profit can be calculated in each link as aneasy way to identify which actors capture agreater percentage of the benefits. Areoverall profits increasing, stable, ordeclining?
· Distribution of benefits: How does thedistribution of final product or productsvalue along the market chain and amongstdiverse actors evolve over time? Who retainsthe most value, and how does thisdistribution change over time? This indicatoris of special interest in projects focusedtowards poverty reduction.
· Improvement of the market chainproducts and efficiencies: There arevarious ways of improving a market chain.Kaplinsky and Morris (2001) identified fourkey trajectories.
· Process improvement: Increases in theefficiency in internal processes both inindividual enterprises, and betweenenterprises in a market chain. Examples in amarket chain are the frequent and timelydelivery of products with the requiredquality as well as the ability of serviceproviders to support market led/enterpriseinnovations.
· Product improvement: Introduction of newproducts or improvements in existingproducts more quickly than by rivals. Thisimplies changes in the processes ofdeveloping new products within and betweenenterprises.
· Functional improvement: Increases in theadded value by means of changes in theactivities managed within an enterprise (forexample, taking responsibility for qualitywithin the market chain) or moving thefocus of activities to different links of the
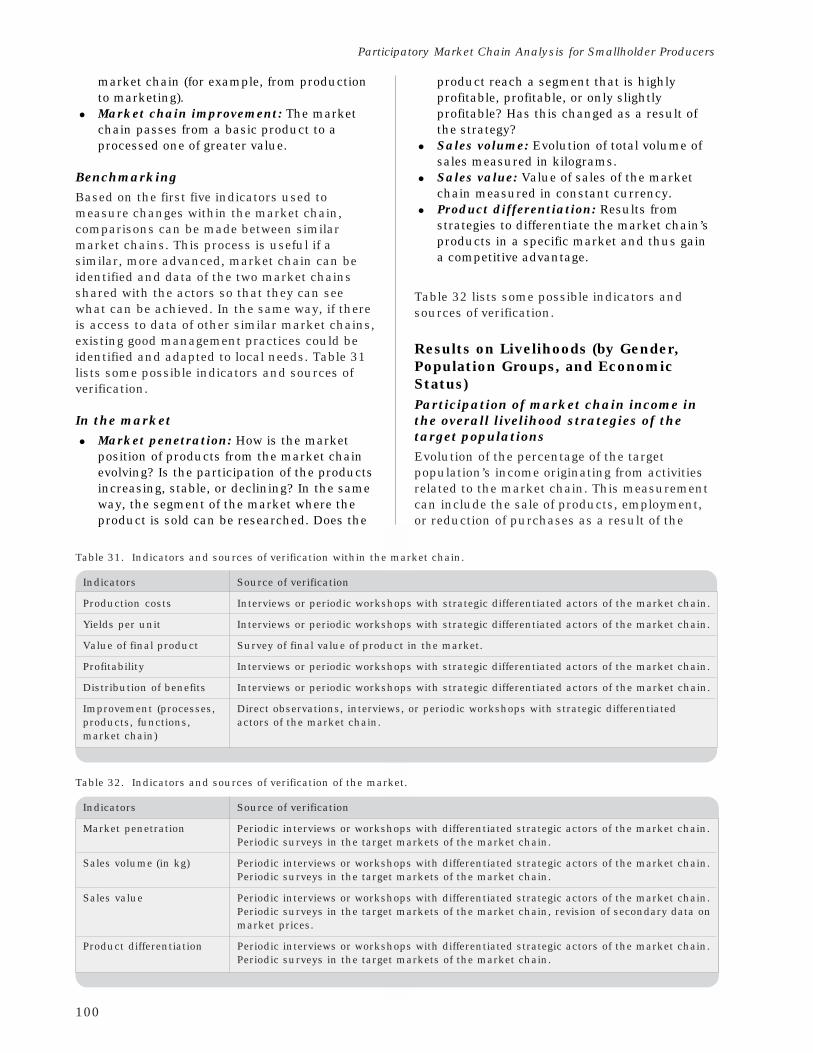
100
Participatory Market Chain Analysis for Smallholder Producers
market chain (for example, from productionto marketing).
· Market chain improvement: The marketchain passes from a basic product to aprocessed one of greater value.
BenchmarkingBased on the first five indicators used tomeasure changes within the market chain,comparisons can be made between similarmarket chains. This process is useful if asimilar, more advanced, market chain can beidentified and data of the two market chainsshared with the actors so that they can seewhat can be achieved. In the same way, if thereis access to data of other similar market chains,existing good management practices could beidentified and adapted to local needs. Table 31lists some possible indicators and sources ofverification.
In the market
· Market penetration: How is the marketposition of products from the market chainevolving? Is the participation of the productsincreasing, stable, or declining? In the sameway, the segment of the market where theproduct is sold can be researched. Does the
product reach a segment that is highlyprofitable, profitable, or only slightlyprofitable? Has this changed as a result ofthe strategy?
· Sales volume: Evolution of total volume ofsales measured in kilograms.
· Sales value: Value of sales of the marketchain measured in constant currency.
· Product differentiation: Results fromstrategies to differentiate the market chain’sproducts in a specific market and thus gaina competitive advantage.
Table 32 lists some possible indicators andsources of verification.
Results on Livelihoods (by Gender,Population Groups, and EconomicStatus)Participation of market chain income inthe overall livelihood strategies of thetarget populationsEvolution of the percentage of the targetpopulation’s income originating from activitiesrelated to the market chain. This measurementcan include the sale of products, employment,or reduction of purchases as a result of the
Table 31. Indicators and sources of verification within the market chain.
Indicators Source of verification
Production costs Interviews or periodic workshops with strategic differentiated actors of the market chain.
Yields per unit Interviews or periodic workshops with strategic differentiated actors of the market chain.
Value of final product Survey of final value of product in the market.
Profitability Interviews or periodic workshops with strategic differentiated actors of the market chain.
Distribution of benefits Interviews or periodic workshops with strategic differentiated actors of the market chain.
Improvement (processes, Direct observations, interviews, or periodic workshops with strategic differentiatedproducts, functions, actors of the market chain.market chain)
Table 32. Indicators and sources of verification of the market.
Indicators Source of verification
Market penetration Periodic interviews or workshops with differentiated strategic actors of the market chain.Periodic surveys in the target markets of the market chain.
Sales volume (in kg) Periodic interviews or workshops with differentiated strategic actors of the market chain.Periodic surveys in the target markets of the market chain.
Sales value Periodic interviews or workshops with differentiated strategic actors of the market chain.Periodic surveys in the target markets of the market chain, revision of secondary data onmarket prices.
Product differentiation Periodic interviews or workshops with differentiated strategic actors of the market chain.Periodic surveys in the target markets of the market chain.
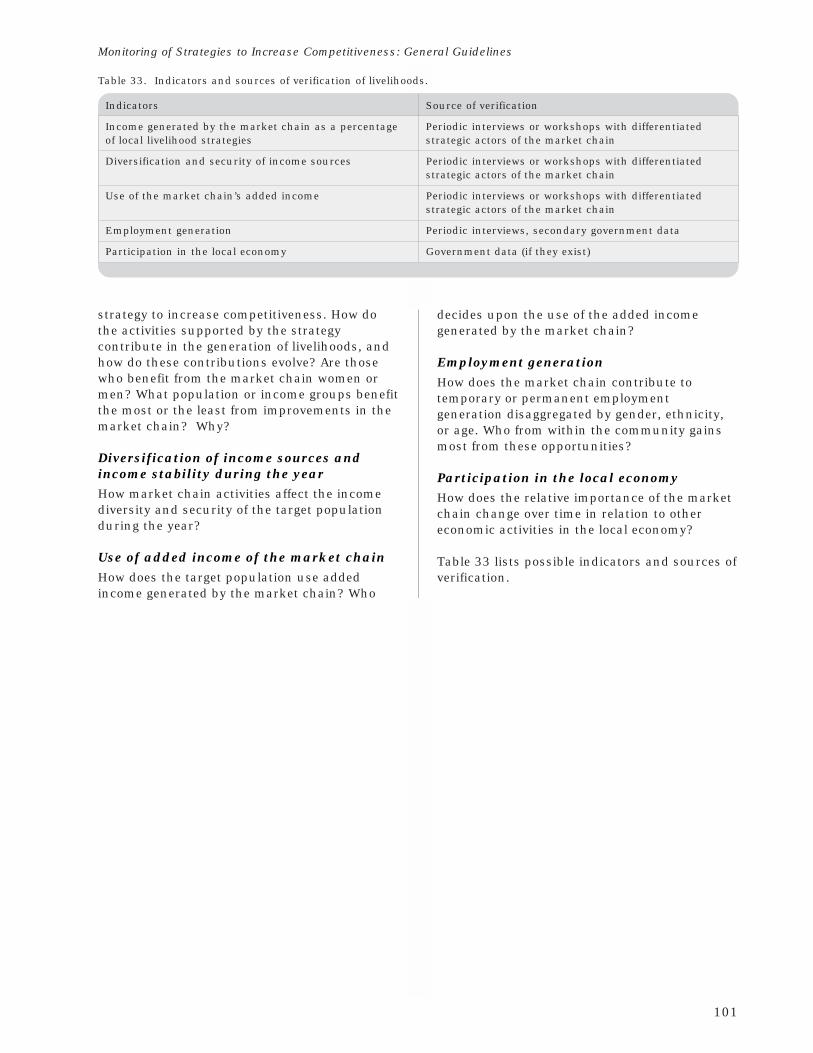
101
Monitoring of Strategies to Increase Competitiveness: General Guidelines
strategy to increase competitiveness. How dothe activities supported by the strategycontribute in the generation of livelihoods, andhow do these contributions evolve? Are thosewho benefit from the market chain women ormen? What population or income groups benefitthe most or the least from improvements in themarket chain? Why?
Diversification of income sources andincome stability during the yearHow market chain activities affect the incomediversity and security of the target populationduring the year?
Use of added income of the market chainHow does the target population use addedincome generated by the market chain? Who
Table 33. Indicators and sources of verification of livelihoods.
Indicators Source of verification
Income generated by the market chain as a percentage Periodic interviews or workshops with differentiatedof local livelihood strategies strategic actors of the market chain
Diversification and security of income sources Periodic interviews or workshops with differentiatedstrategic actors of the market chain
Use of the market chain’s added income Periodic interviews or workshops with differentiatedstrategic actors of the market chain
Employment generation Periodic interviews, secondary government data
Participation in the local economy Government data (if they exist)
decides upon the use of the added incomegenerated by the market chain?
Employment generationHow does the market chain contribute totemporary or permanent employmentgeneration disaggregated by gender, ethnicity,or age. Who from within the community gainsmost from these opportunities?
Participation in the local economyHow does the relative importance of the marketchain change over time in relation to othereconomic activities in the local economy?
Table 33 lists possible indicators and sources ofverification.
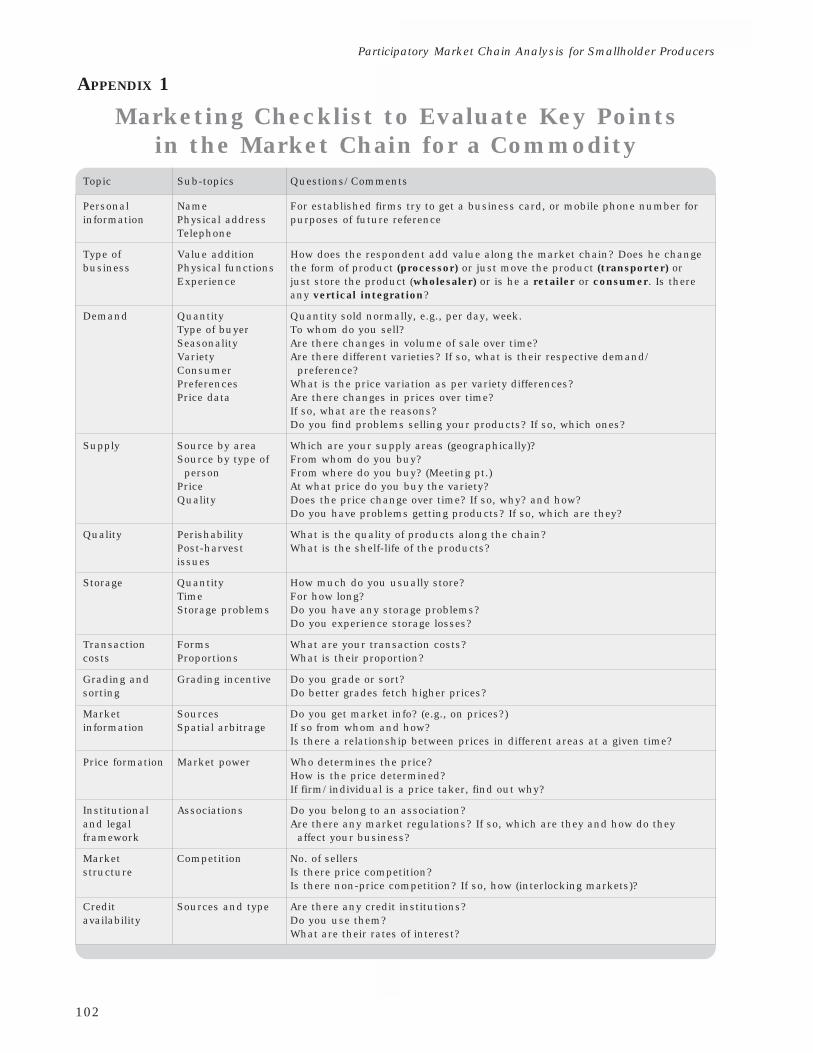
102
Participatory Market Chain Analysis for Smallholder Producers
APPENDIX 1
Marketing Checklist to Evaluate Key Pointsin the Market Chain for a Commodity
Topic Sub-topics Questions/Comments
Personal Name For established firms try to get a business card, or mobile phone number forinformation Physical address purposes of future reference
Telephone
Type of Value addition How does the respondent add value along the market chain? Does he changebusiness Physical functions the form of product (processor) or just move the product (transporter) or
Experience just store the product (wholesaler) or is he a retailer or consumer. Is thereany vertical integration?
Demand Quantity Quantity sold normally, e.g., per day, week.Type of buyer To whom do you sell?Seasonality Are there changes in volume of sale over time?Variety Are there different varieties? If so, what is their respective demand/Consumer preference?Preferences What is the price variation as per variety differences?Price data Are there changes in prices over time?
If so, what are the reasons?Do you find problems selling your products? If so, which ones?
Supply Source by area Which are your supply areas (geographically)?Source by type of From whom do you buy? person From where do you buy? (Meeting pt.)Price At what price do you buy the variety?Quality Does the price change over time? If so, why? and how?
Do you have problems getting products? If so, which are they?
Quality Perishability What is the quality of products along the chain?Post-harvest What is the shelf-life of the products?issues
Storage Quantity How much do you usually store?Time For how long?Storage problems Do you have any storage problems?
Do you experience storage losses?
Transaction Forms What are your transaction costs?costs Proportions What is their proportion?
Grading and Grading incentive Do you grade or sort?sorting Do better grades fetch higher prices?
Market Sources Do you get market info? (e.g., on prices?)information Spatial arbitrage If so from whom and how?
Is there a relationship between prices in different areas at a given time?
Price formation Market power Who determines the price?How is the price determined?If firm/individual is a price taker, find out why?
Institutional Associations Do you belong to an association?and legal Are there any market regulations? If so, which are they and how do theyframework affect your business?
Market Competition No. of sellersstructure Is there price competition?
Is there non-price competition? If so, how (interlocking markets)?
Credit Sources and type Are there any credit institutions?availability Do you use them?
What are their rates of interest?
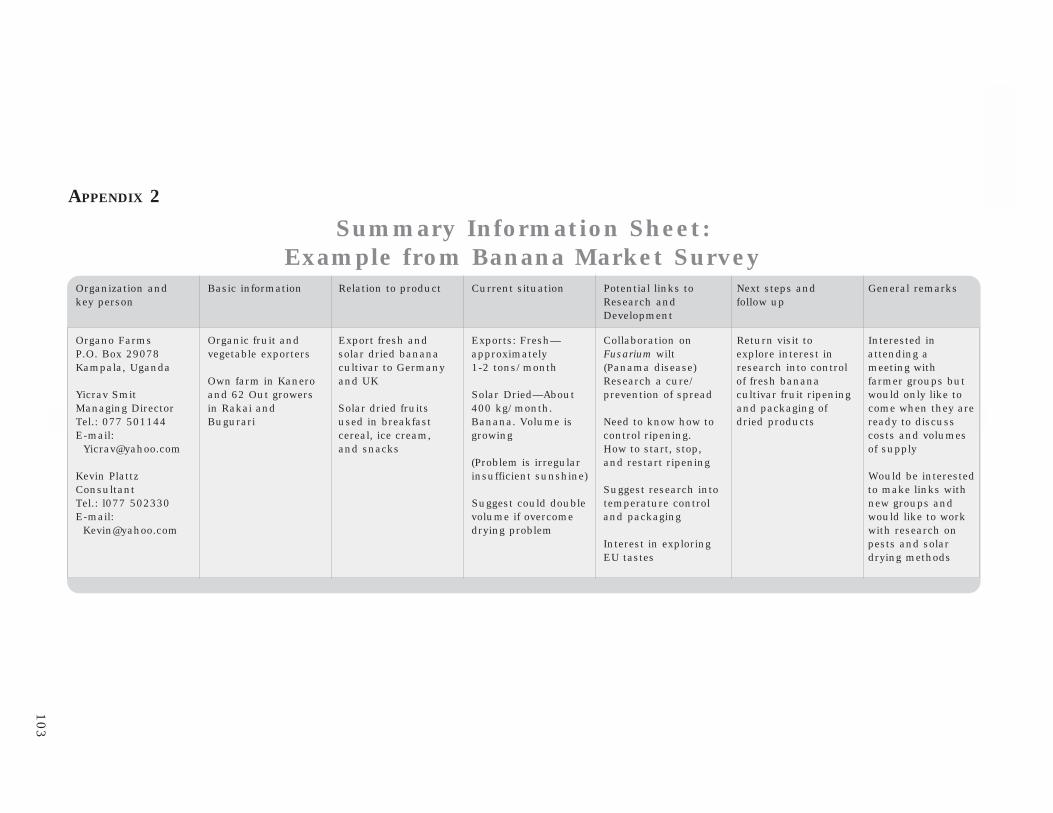
103
Ap
pen
dices
APPENDIX 2
Summary Information Sheet:Example from Banana Market Survey
Organization and Basic information Relation to product Current situation Potential links to Next steps and General remarkskey person Research and follow up
Development
Organo Farms Organic fruit and Export fresh and Exports: Fresh— Collaboration on Return visit to Interested inP.O. Box 29078 vegetable exporters solar dried banana approximately Fusarium wilt explore interest in attending aKampala, Uganda cultivar to Germany 1-2 tons/month (Panama disease) research into control meeting with
Own farm in Kanero and UK Research a cure/ of fresh banana farmer groups butYicrav Smit and 62 Out growers Solar Dried—About prevention of spread cultivar fruit ripening would only like toManaging Director in Rakai and Solar dried fruits 400 kg/month. and packaging of come when they areTel.: 077 501144 Bugurari used in breakfast Banana. Volume is Need to know how to dried products ready to discussE-mail: cereal, ice cream, growing control ripening. costs and volumes [email protected] and snacks How to start, stop, of supply
(Problem is irregular and restart ripeningKevin Plattz insufficient sunshine) Would be interestedConsultant Suggest research into to make links withTel.: l077 502330 Suggest could double temperature control new groups andE-mail: volume if overcome and packaging would like to work [email protected] drying problem with research on
Interest in exploring pests and solarEU tastes drying methods
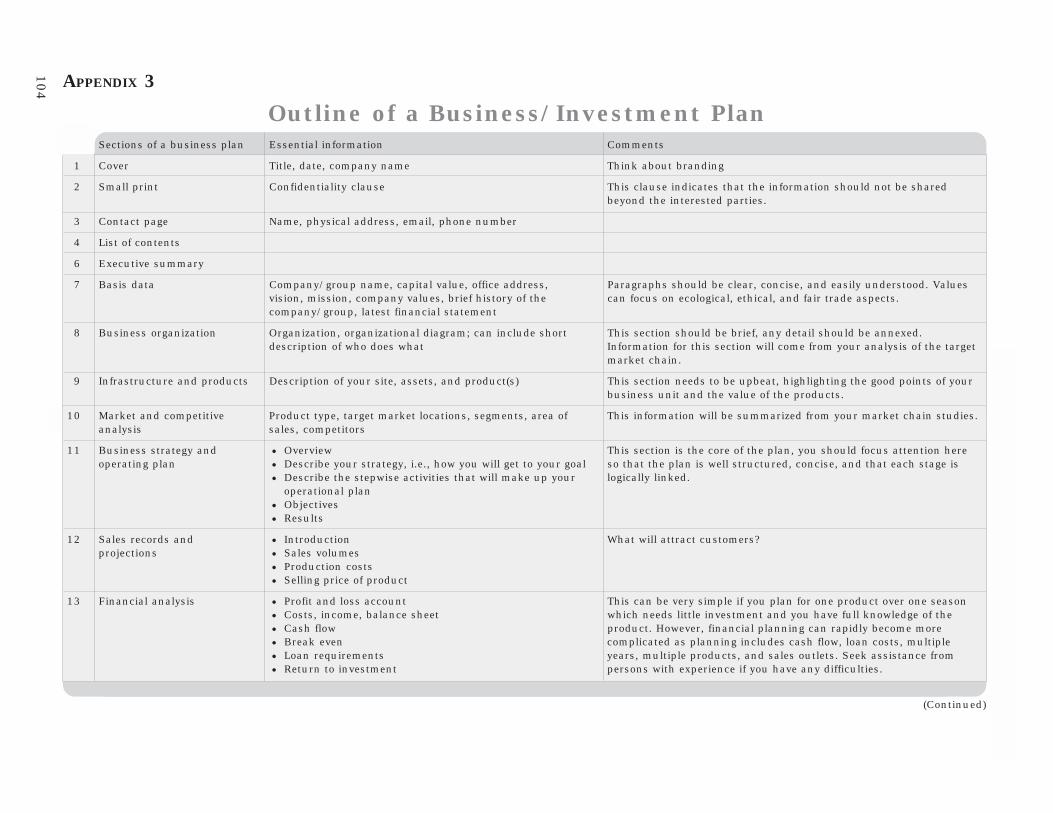
104
Pa
rticipa
tory M
ark
et Ch
ain
An
aly
sis for Sm
allh
older P
rodu
cers
APPENDIX 3
Outline of a Business/Investment PlanSections of a business plan Essential information Comments
1 Cover Title, date, company name Think about branding
2 Small print Confidentiality clause This clause indicates that the information should not be sharedbeyond the interested parties.
3 Contact page Name, physical address, email, phone number
4 List of contents
6 Executive summary
7 Basis data Company/group name, capital value, office address, Paragraphs should be clear, concise, and easily understood. Valuesvision, mission, company values, brief history of the can focus on ecological, ethical, and fair trade aspects.company/group, latest financial statement
8 Business organization Organization, organizational diagram; can include short This section should be brief, any detail should be annexed.description of who does what Information for this section will come from your analysis of the target
market chain.
9 Infrastructure and products Description of your site, assets, and product(s) This section needs to be upbeat, highlighting the good points of yourbusiness unit and the value of the products.
10 Market and competitive Product type, target market locations, segments, area of This information will be summarized from your market chain studies.analysis sales, competitors
11 Business strategy and · Overview This section is the core of the plan, you should focus attention hereoperating plan · Describe your strategy, i.e., how you will get to your goal so that the plan is well structured, concise, and that each stage is
· Describe the stepwise activities that will make up your logically linked.operational plan
· Objectives
· Results
12 Sales records and · Introduction What will attract customers?projections · Sales volumes
· Production costs
· Selling price of product
13 Financial analysis · Profit and loss account This can be very simple if you plan for one product over one season
· Costs, income, balance sheet which needs little investment and you have full knowledge of the
· Cash flow product. However, financial planning can rapidly become more
· Break even complicated as planning includes cash flow, loan costs, multiple
· Loan requirements years, multiple products, and sales outlets. Seek assistance from
· Return to investment persons with experience if you have any difficulties.
(Continued)
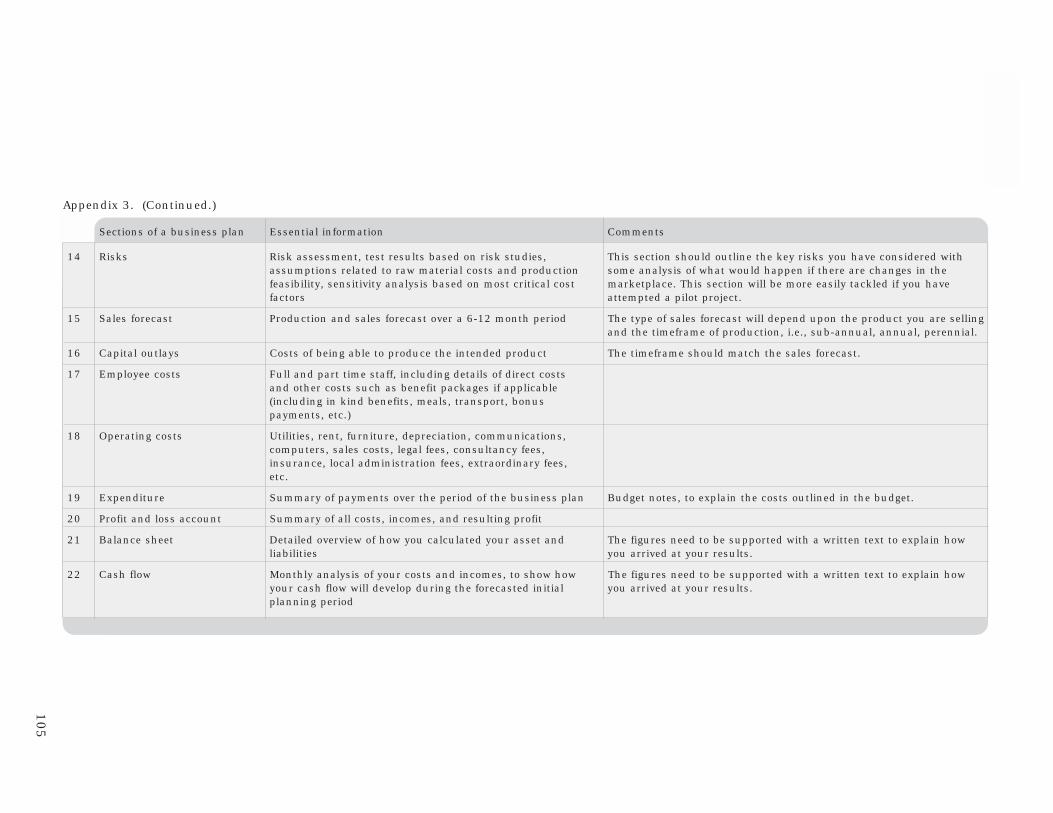
105
Ap
pen
dices
Sections of a business plan Essential information Comments
14 Risks Risk assessment, test results based on risk studies, This section should outline the key risks you have considered withassumptions related to raw material costs and production some analysis of what would happen if there are changes in thefeasibility, sensitivity analysis based on most critical cost marketplace. This section will be more easily tackled if you havefactors attempted a pilot project.
15 Sales forecast Production and sales forecast over a 6-12 month period The type of sales forecast will depend upon the product you are sellingand the timeframe of production, i.e., sub-annual, annual, perennial.
16 Capital outlays Costs of being able to produce the intended product The timeframe should match the sales forecast.
17 Employee costs Full and part time staff, including details of direct costsand other costs such as benefit packages if applicable(including in kind benefits, meals, transport, bonuspayments, etc.)
18 Operating costs Utilities, rent, furniture, depreciation, communications,computers, sales costs, legal fees, consultancy fees,insurance, local administration fees, extraordinary fees,etc.
19 Expenditure Summary of payments over the period of the business plan Budget notes, to explain the costs outlined in the budget.
20 Profit and loss account Summary of all costs, incomes, and resulting profit
21 Balance sheet Detailed overview of how you calculated your asset and The figures need to be supported with a written text to explain howliabilities you arrived at your results.
22 Cash flow Monthly analysis of your costs and incomes, to show how The figures need to be supported with a written text to explain howyour cash flow will develop during the forecasted initial you arrived at your results.planning period
Appendix 3. (Continued.)
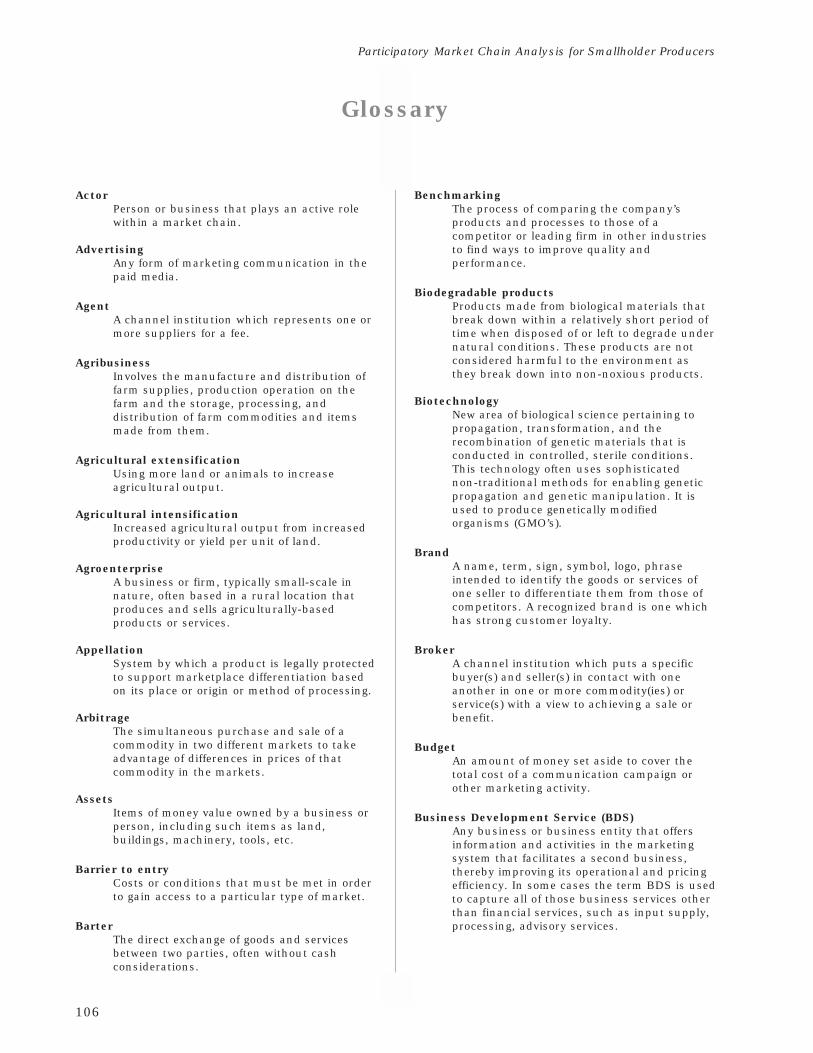
106
Participatory Market Chain Analysis for Smallholder Producers
Glossary
ActorPerson or business that plays an active rolewithin a market chain.
AdvertisingAny form of marketing communication in thepaid media.
AgentA channel institution which represents one ormore suppliers for a fee.
AgribusinessInvolves the manufacture and distribution offarm supplies, production operation on thefarm and the storage, processing, anddistribution of farm commodities and itemsmade from them.
Agricultural extensificationUsing more land or animals to increaseagricultural output.
Agricultural intensificationIncreased agricultural output from increasedproductivity or yield per unit of land.
AgroenterpriseA business or firm, typically small-scale innature, often based in a rural location thatproduces and sells agriculturally-basedproducts or services.
AppellationSystem by which a product is legally protectedto support marketplace differentiation basedon its place or origin or method of processing.
ArbitrageThe simultaneous purchase and sale of acommodity in two different markets to takeadvantage of differences in prices of thatcommodity in the markets.
AssetsItems of money value owned by a business orperson, including such items as land,buildings, machinery, tools, etc.
Barrier to entryCosts or conditions that must be met in orderto gain access to a particular type of market.
BarterThe direct exchange of goods and servicesbetween two parties, often without cashconsiderations.
BenchmarkingThe process of comparing the company’sproducts and processes to those of acompetitor or leading firm in other industriesto find ways to improve quality andperformance.
Biodegradable productsProducts made from biological materials thatbreak down within a relatively short period oftime when disposed of or left to degrade undernatural conditions. These products are notconsidered harmful to the environment asthey break down into non-noxious products.
BiotechnologyNew area of biological science pertaining topropagation, transformation, and therecombination of genetic materials that isconducted in controlled, sterile conditions.This technology often uses sophisticatednon-traditional methods for enabling geneticpropagation and genetic manipulation. It isused to produce genetically modifiedorganisms (GMO’s).
BrandA name, term, sign, symbol, logo, phraseintended to identify the goods or services ofone seller to differentiate them from those ofcompetitors. A recognized brand is one whichhas strong customer loyalty.
BrokerA channel institution which puts a specificbuyer(s) and seller(s) in contact with oneanother in one or more commodity(ies) orservice(s) with a view to achieving a sale orbenefit.
BudgetAn amount of money set aside to cover thetotal cost of a communication campaign orother marketing activity.
Business Development Service (BDS)Any business or business entity that offersinformation and activities in the marketingsystem that facilitates a second business,thereby improving its operational and pricingefficiency. In some cases the term BDS is usedto capture all of those business services otherthan financial services, such as input supply,processing, advisory services.
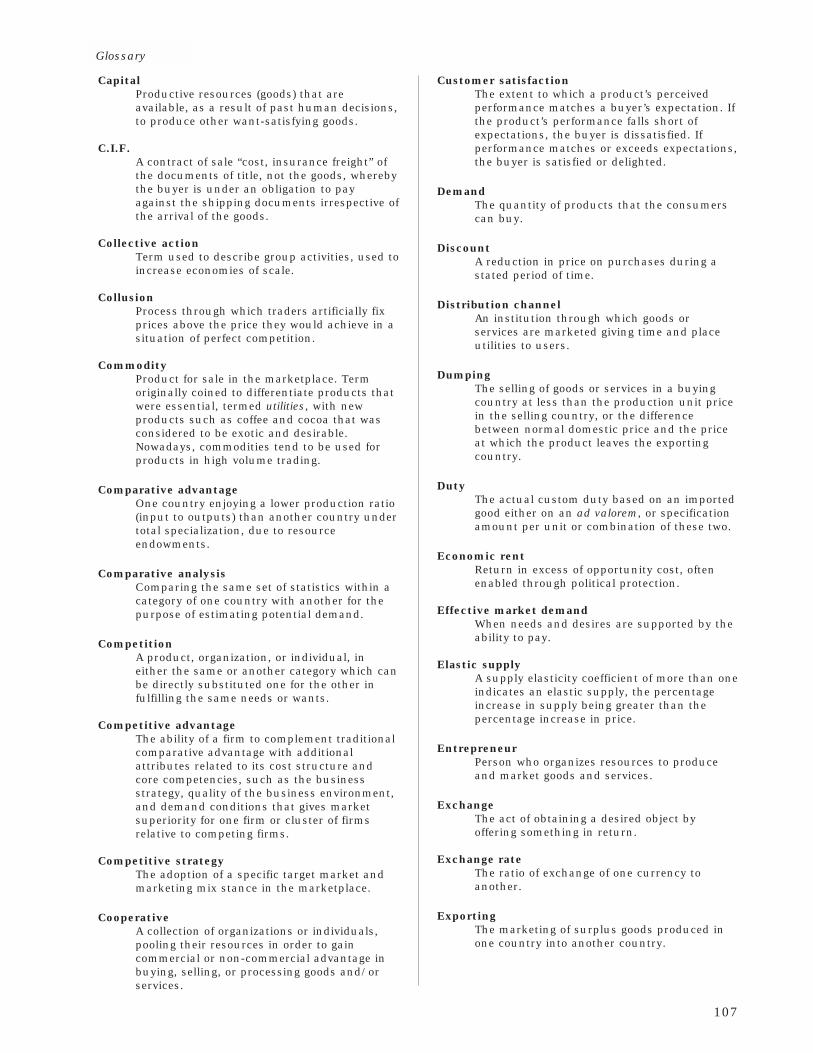
107
Appendices
CapitalProductive resources (goods) that areavailable, as a result of past human decisions,to produce other want-satisfying goods.
C.I.F.A contract of sale “cost, insurance freight” ofthe documents of title, not the goods, wherebythe buyer is under an obligation to payagainst the shipping documents irrespective ofthe arrival of the goods.
Collective actionTerm used to describe group activities, used toincrease economies of scale.
CollusionProcess through which traders artificially fixprices above the price they would achieve in asituation of perfect competition.
CommodityProduct for sale in the marketplace. Termoriginally coined to differentiate products thatwere essential, termed utilities, with newproducts such as coffee and cocoa that wasconsidered to be exotic and desirable.Nowadays, commodities tend to be used forproducts in high volume trading.
Comparative advantageOne country enjoying a lower production ratio(input to outputs) than another country undertotal specialization, due to resourceendowments.
Comparative analysisComparing the same set of statistics within acategory of one country with another for thepurpose of estimating potential demand.
CompetitionA product, organization, or individual, ineither the same or another category which canbe directly substituted one for the other infulfilling the same needs or wants.
Competitive advantageThe ability of a firm to complement traditionalcomparative advantage with additionalattributes related to its cost structure andcore competencies, such as the businessstrategy, quality of the business environment,and demand conditions that gives marketsuperiority for one firm or cluster of firmsrelative to competing firms.
Competitive strategyThe adoption of a specific target market andmarketing mix stance in the marketplace.
CooperativeA collection of organizations or individuals,pooling their resources in order to gaincommercial or non-commercial advantage inbuying, selling, or processing goods and/orservices.
Customer satisfactionThe extent to which a product’s perceivedperformance matches a buyer’s expectation. Ifthe product’s performance falls short ofexpectations, the buyer is dissatisfied. Ifperformance matches or exceeds expectations,the buyer is satisfied or delighted.
DemandThe quantity of products that the consumerscan buy.
DiscountA reduction in price on purchases during astated period of time.
Distribution channelAn institution through which goods orservices are marketed giving time and placeutilities to users.
DumpingThe selling of goods or services in a buyingcountry at less than the production unit pricein the selling country, or the differencebetween normal domestic price and the priceat which the product leaves the exportingcountry.
DutyThe actual custom duty based on an importedgood either on an ad valorem, or specificationamount per unit or combination of these two.
Economic rentReturn in excess of opportunity cost, oftenenabled through political protection.
Effective market demandWhen needs and desires are supported by theability to pay.
Elastic supplyA supply elasticity coefficient of more than oneindicates an elastic supply, the percentageincrease in supply being greater than thepercentage increase in price.
EntrepreneurPerson who organizes resources to produceand market goods and services.
ExchangeThe act of obtaining a desired object byoffering something in return.
Exchange rateThe ratio of exchange of one currency toanother.
ExportingThe marketing of surplus goods produced inone country into another country.
Glossary
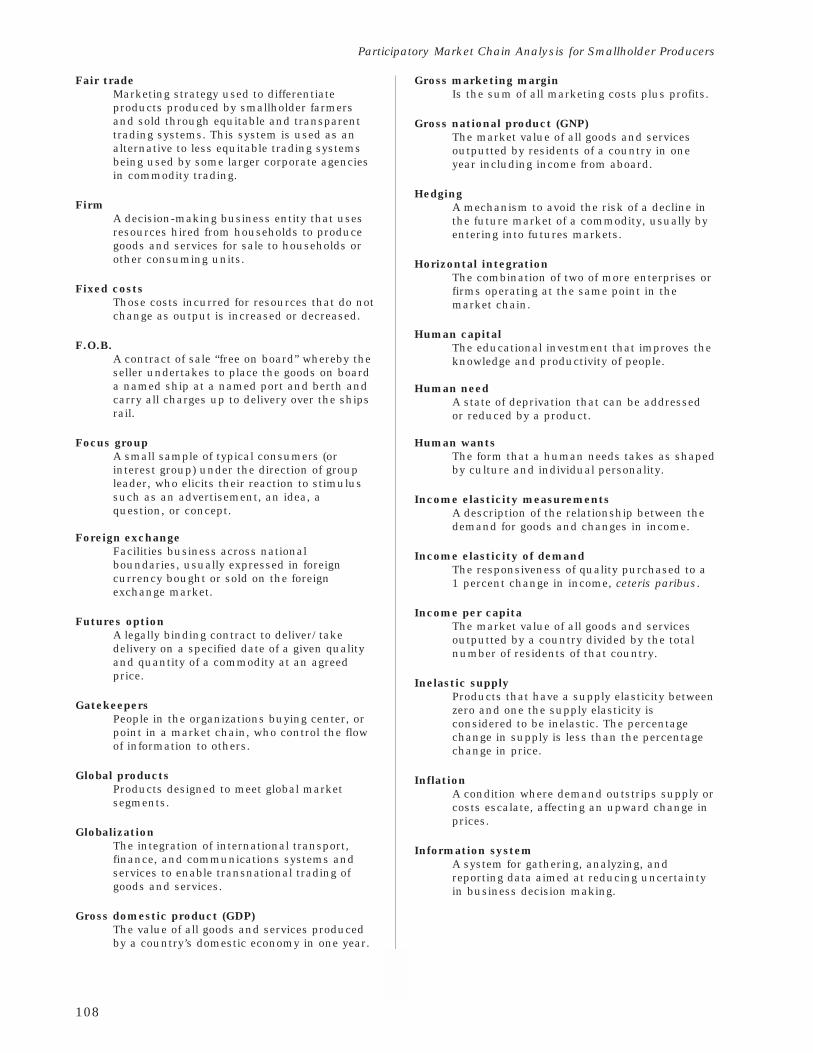
108
Participatory Market Chain Analysis for Smallholder Producers
Fair tradeMarketing strategy used to differentiateproducts produced by smallholder farmersand sold through equitable and transparenttrading systems. This system is used as analternative to less equitable trading systemsbeing used by some larger corporate agenciesin commodity trading.
FirmA decision-making business entity that usesresources hired from households to producegoods and services for sale to households orother consuming units.
Fixed costsThose costs incurred for resources that do notchange as output is increased or decreased.
F.O.B.A contract of sale “free on board” whereby theseller undertakes to place the goods on boarda named ship at a named port and berth andcarry all charges up to delivery over the shipsrail.
Focus groupA small sample of typical consumers (orinterest group) under the direction of groupleader, who elicits their reaction to stimulussuch as an advertisement, an idea, aquestion, or concept.
Foreign exchangeFacilities business across nationalboundaries, usually expressed in foreigncurrency bought or sold on the foreignexchange market.
Futures optionA legally binding contract to deliver/takedelivery on a specified date of a given qualityand quantity of a commodity at an agreedprice.
GatekeepersPeople in the organizations buying center, orpoint in a market chain, who control the flowof information to others.
Global productsProducts designed to meet global marketsegments.
GlobalizationThe integration of international transport,finance, and communications systems andservices to enable transnational trading ofgoods and services.
Gross domestic product (GDP)The value of all goods and services producedby a country’s domestic economy in one year.
Gross marketing marginIs the sum of all marketing costs plus profits.
Gross national product (GNP)The market value of all goods and servicesoutputted by residents of a country in oneyear including income from aboard.
HedgingA mechanism to avoid the risk of a decline inthe future market of a commodity, usually byentering into futures markets.
Horizontal integrationThe combination of two of more enterprises orfirms operating at the same point in themarket chain.
Human capitalThe educational investment that improves theknowledge and productivity of people.
Human needA state of deprivation that can be addressedor reduced by a product.
Human wantsThe form that a human needs takes as shapedby culture and individual personality.
Income elasticity measurementsA description of the relationship between thedemand for goods and changes in income.
Income elasticity of demandThe responsiveness of quality purchased to a1 percent change in income, ceteris paribus.
Income per capitaThe market value of all goods and servicesoutputted by a country divided by the totalnumber of residents of that country.
Inelastic supplyProducts that have a supply elasticity betweenzero and one the supply elasticity isconsidered to be inelastic. The percentagechange in supply is less than the percentagechange in price.
InflationA condition where demand outstrips supply orcosts escalate, affecting an upward change inprices.
Information systemA system for gathering, analyzing, andreporting data aimed at reducing uncertaintyin business decision making.
109
Appendices
InnovationAn idea, service, product, or technology thathas been developed and marketed to aconsumer who perceives it as novel. It is aprocess of identifying, creating, and deliveringnew product or service values that did notexist before in the marketplace.
Input marketsMarkets focused on products that supplyproduction-based activities; in agriculture thistypically means market actors that supplyseeds, tools, finance, and agrochemicals.
InterestThe charge made for borrowed money. Therate at which we discount future economicgoods.
Interest rateThe price of borrowed money.
IntermediariesDistribution channel firms or persons thathelp to find the customer or make sales tothem, including bulking agents, wholesaling,retailers that buy and resell goods.
International productsGoods or services seen as having extendedpotential into other markets.
Joint venturesAn enterprise in which two or more investorsshare ownership and control over propertyrights and operations.
Key informantsActive and leading members of the marketchain.
Key observersPeople who are knowledgeable about a marketchain but are not directly involved in thebusiness operations of the market chain.
Letter of creditA method of international payment wherebythe buyer instructs his own country bank toopen a credit with the seller’s own countrybank specifying the documents which theseller has to deliver to the bank for him/her toreceive payment.
LevyA tax imposed by government to meet aspecific objective.
LicensingA method of foreign operation cooperationwhereby an organization in one country agreesto permit a firm in another country to use themanufacturing, processing, trademark,know-how, or some other skill provided by thelicensor.
Local productsGoods or services seen only suitable in onesingle market.
LogoSymbol or emblem used to identify a specificproduct and for marketing purposes todifferentiate a specific product from similaritems.
Mark of origin (appellation)System by which producers and processorscan legally register their products so that noother producers or processors can use thisname, title or logo, unless they produce theproduct within a legally recognized area orterritory and use specifically laid downmethods of production and/or processing.
MarketThe set of all actual and potential buyers of aproduct or service.
Market chainTerm used to describe the multiple marketchannels through which a product or servicemoves until reaching the consumer.
Market efficiencyA comparison of the value of output to thevalue of inputs used in the marketing process.
Market entryThe way in which an organization entersforeign markets either by direct or indirectexport or production in a foreign country.
Market information services (MIS)People, equipment, and procedures to gather,sort, analyze, evaluate, and distribute needed,timely, and accurate information to marketingdecision makers.
Market mixThe set of controllable tactical marketingtools—product, price, place, and promotion—that a firm blends to produce the response itwants in the target marketplace.
Market positioningThe adoption of a specific market stance,leader, challenger, follower, flanker, oradopter, vis à vis competition.
Market researchThe function that links the consumer,customer, and public to the marketer throughinformation—information used to identify anddefine market opportunities and problems togenerate, refine, and evaluate marketingactions; to monitor marketing performanceand to improve the understanding of themarketing process.
Glossary
110
Participatory Market Chain Analysis for Smallholder Producers
Market segmentA group of consumers who respond in asimilar way to a given set of marketingstimuli.
Market segmentationDividing a market into distinct groups ofbuyers with different needs, characteristics, orbehavior, who might require separateproducts or marketing mixes.
Market speculationA marketing strategy whereby buyers holdstocks of a product in the hope that prices willincrease, so that they can maximize profitswhen they decide to sell. Physical speculationrequires that a lot or amount of produce ispurchased and stored. There are costsassociated with storage and for a speculationto be profitable the final sales value must bemore than the costs of storage.
Market supplyThe quantity of products that is offered forsale.
MarketingPlanning, executing, and controlling theconception, pricing, promotion anddistribution of ideas, goods and services inorder to build lasting, mutually profitableexchange relationships satisfying individualand organizational objectives.
Marketing costsAgricultural marketing refers to the activitiesinvolved in taking a product from the farmgate and delivering it in the form, at the timeand to the place that the buyer requires. Suchcosts are therefore incurred through handling,transport, storage, processing, packaging,market fees, risk management, brokerage,export handling, and others.
Marketing processThe process of analyzing marketopportunities, selecting target markets,developing a marketing mix, and managingthe marketing effort.
Marketing strategyThe marketing logic by which the businessunit hopes to achieve its marketing objectives.
MediaAny paid for communication channelincluding television, radio, posters, etc.
MiddlemanPerson who trades in goods, a buyer and sellerof goods and services.
Net marketing marginExcludes normal marketing costs, therebyproviding a measure of the profit realized. Netmarketing margins may however also includethe remuneration of the trader or processor’slabor, in which case it is not an exact profitindicator.
Niche marketingAdapting a company’s offerings and productsto more closely match the needs of one ormore sub-segments where there is often littlecompetition.
Non-tariff barriersMeasures, public or private, that causeintentionally traded goods or services to beallocated in such a way as to reduce potentialreal world income.
Opportunity costThe value of other opportunities given up inorder to produce or consume any good.
OptionA bilateral contract giving its holder the right,but not the obligation to buy or sell a specifiedasset at a specific price, at or up to, a specificdate. Type of financial instrument that givesthe holder the right to buy or sell futurescontracts.
Output marketsMarkets where harvested products aresold—these are the more traditional assembly,wholesale, and retail markets.
PackagingActivities involved designing and producingthe container or wrapper for a product.
PatentingLegal mechanism used to protect productsfrom being copied by other entrepreneurs. Thepatent scheme usually lasts for a designatedperiod of time, 10 years, after which time thescheme either elapses or the inventor orowner provides evidence of innovation torenew the patent to protect the value of thegiven intellectual property.
Penetration priceThe charging of a low price in order to gainvolume sales conducted under conditions oflittle product uniqueness and elastic demandpatterns.
Physical distributionThe act and functions of physicallydistributing goods and services including theelements of transport, warehousing, and orderprocessing.
111
Appendices
PlaceAll the company/firm activities that make theproduct or service available to the targetcustomer.
PriceThe amount of money charged for a product orservice or the sum of the values thatconsumers exchange for the benefits of havingor using a product or service.
Price ceilingThe maximum price which can be chargedbearing in mind competition and what themarket can bear.
Price elasticity of supplyDefined as a measure of the percentagechange in quantity supplied in response to apercent change in price. A supply elasticity of0.4 for cotton in the short run means that thequantity supplied increases 0.4% for a 1%increase in the price of cotton.
Price escalationThe difference between the domestic price andthe target price in foreign markets due to theapplication of duties, dealer margins, and/orother transaction costs.
Price floorThe minimum price which can be chargedbounded by product cost.
Primary dataThat data which is collected and generated aspart of a survey. Unpublished data fromindividuals or organizations.
ProductAnything that can be offered to a market forattention, acquisition, use of consumptionthat might satisfy a want or need. It includesphysical objects, services, persons, places,organizations, and ideas.
Product strategyA set of decisions regarding alternatives to thetarget market and the marketing mix given aset of market conditions.
PromotionActivities that communicate the product ofservice and its merits to target consumers andpersuade them to buy. The offer of aninducement to purchase, over and above theintrinsic value or price of a good service.
QualityThe totality of features and characteristics of aproduct or service that bear on its ability tosatisfy stated or implied needs.
QuotaA specific imported amount imposed by onecountry on another, when once filled cannotbe exceeded within a given time. When aquota is in force the price mechanism is notallowed to operate.
Relationship marketingThe process of creating, maintaining, andenhancing strong value laden relationshipswith customers and other stakeholders.
RentReturn in excess of opportunity cost, oftenenabled through political protection oradvantaged access to commercial information.
RetailerA channel institution which acts as anintermediary between other channelinstitutions and the end user and who usuallybreaks bulk, charging a margin for itsservices.
Secondary dataThat data which already exists in other texts.
SectorRelates to the all activities under the mandateof one government ministry, such agriculture,health, education, justice.
ServicesActivities, benefits, or satisfactions that areoffered for sale.
SMSShort message service, text used to transferinformation via mobile phones.
SpeculationThe purchase or sale of title to goods orfinancial obligations in the expectation offavorable price movements.
StandardizationSame goods or services marketed in eitherproduct, distribution, or advertising form,unchanged in any country.
Strategic business unitA self-contained grouping of organizations,products, or technologies which serve anidentified market and competes with identifiedcompetitors.
Strategic planA plan that describes how a firm will adapt totake advantage of opportunities in itsconstantly changing environment, therebymaintaining a strategic fit between the firm’sgoals and capabilities and its changing marketopportunities.
Glossary
112
Participatory Market Chain Analysis for Smallholder Producers
Sub-sectorA part of a sector. In agriculture, a sub-sectorfocuses on one area, such as grains, fish,livestock, etc., or can be more detailed to allthat relates to one particular commodity only,such as the maize, rice, cassava, beef sub-sectors.
SubstitutesTwo different goods or resources betweenwhich a choice is made to satisfy humanwants (or to produce a product).
Super brandA product that has world renownedreputation, for providing customer satisfactionand delight, e.g., the soft drink Coca-Cola, theNIKE sports shoe.
TariffAn instrument of terms of access normally theimposition of a single or multiple excise rateson an imported good.
TraceabilitySystem by which a product is tagged, suchthat it can be traced from source of origin tofinal user. This process may becomemandatory in formalized food markets.
Trade MarkLegally recognized name, symbol, or title,which can only be used for marketingpurposes by the originating or owningcompany.
TransactionA trade between two parties that involves atleast two things of value, agreed uponconditions, a time agreement, and a place ofagreement.
Transaction costsTransaction costs relate to the non-price costsof making a commercial exchange. These areexpenses incurred in finding someone to tradewith, time spent negotiating a deal and thecosts involved in ensuring that contracts arehonoured, all fall under the general categoryof transaction cost.
ValueThe consumer’s assessment of the product’soverall capacity to satisfy his or her needs.
Value addedThe contribution to final produce value byeach stage in the production, delivery, andmarketing process. Also, includestransformation processing of goods fromprimary to final state offered to a consumer.
Vertical integrationThe linkage of firms (enterprises) in differentstages of producing and/or marketing underthe ownership of a single firm.
WholesalerA channel institution which purchases andsells in bulk from either original suppliersand/or other channel intermediaries, charginga margin for its services.
113
Appendices
Bibliography
Augstburger, F. 1996. Agricultura ecológica enBolivia: ¿Una opción para la economíacampesina? [on line]. Extraído de RURALTERno. 15, 1996. La Paz, Bolivia. Available at:www.ciedperu.org/bae/b54c.htm
Becker, E. 2003. Western farmers fear Third-Worldchallenge to subsidies [on line]. New YorkTimes, September 8. Available at:www.nyt.com
Ferris, S.; Best, R.; Lundy, M.; Ostertag, C.; Gottret,M.; Wandschneider, T. 2006. Strategy paper:A participatory and area-based approach torural agroenterprise development. CentroInternacional de Agricultura Tropical (CIAT),Cali, Colombia. 44 p.
Hobbs, J.; Cooney, A.; Fulton, M. 2000. Value chainsin the agri-food sector: What are they? How dothey work? Are they for me? Department ofAgricultural Economics, University ofSaskatchewan, Canada. 32 p.
Holtzman, J.S. 2002. Rapid appraisals of commoditysubsectors. In: A guide to developingagricultural markets and agro-enterprises.World Bank.
IICA-CIAT-COSUDE-MCCH. 2001. Los servicioslocales: Un desafío del desarrollo rural[on line]. Available at: www.ciat.cgiar.org/agroempresas/pdf/els.pdf
Kaplinsky, R. 2000. Spreading the gains fromglobalisation: What can be learned from valuemarket chain analysis? [on line]. IDS WorkingPaper 110. Institute of Development Studies,Sussex, UK. Available at: www.ids.ac.uk/ids/bookshop/wp/wp110.pdf
Kaplinsky, R.; Morris, M. 2001. A handbook for valuechain research [on line]. Available at:www.ids.ac.uk/ids/global/pdfs/VchNov01.pdf
Lundy, M.; Gottret, M.V. 2003. Information resourcepackage from Second International Course onDeveloping Supply Market Chains withSmallholders, CATIE-CIAT, September 2003.CIAT Agroenterprise Project, Cali, Colombia.
Lundy, M., Ostertag, C.F., Best, R. 2002. Valueadding, agroenterprise and poverty reduction:A territorial approach for rural businessdevelopment [on line]. Paper presented at theFirst Henry A. Wallace Inter-AmericanScientific Conference, CATIE, Turrialba, CostaRica, 25-27 February. Available at:www.ciat.cgiar.org/agroempresas/pdf/value_adding.pdf
Ostertag, C.F. 1999. Identifying and assessing marketopportunities for small rural producers. Seriesof Tools for Decision Making in NaturalResource Management. Centro Internacionalde Agricultura Tropical (CIAT), Cali, Colombia.44 p.
Van der Heyden, D.; Camacho, P. 2004. Guíametodológica para el análisis de cadenasproductivas. Mesa de trabajo “DesarrolloEconómico” de la plataforma RURALTER.Quito, Ecuador, Marzo.
Wandschneider, T.; Ferris, R.S.B. A guide to rapidmarket appraisal. Centro Internacional deAgricultura Tropical (CIAT), Cali, Colombia.(In preparation).
CIAT Publication No. 357
Rural Agroenterprise Development
and
Corporate Communications andCapacity Strengthening Unit
Editing: Libby Finney
Editorial assistance: Gladys Rodríguez
Production: Anne DownesOscar Idárraga (layout)Julio C. Martínez (cover design)Jorge Enrique Gutiérrez (drawings)
Printing: Impresora Feriva S.A., Cali, Colombia
Related Documents