Assessment of Production and Marketing System of Goats In Dale District, Sidama Zone Endeshaw Assefa M.Sc Thesis In Partial Fulfillment of The Requirements for the Degree of Master of Science in Animal Production Submitted to The School of Graduate Studies Department of Animal Production and Range Sciences AWASSA COLLEGE OF AGRICULTURE UNIVERSITY OF HAWASSA AWASSA, ETHIOPIA June 2007Awassa

Welcome message from author
This document is posted to help you gain knowledge. Please leave a comment to let me know what you think about it! Share it to your friends and learn new things together.
Transcript
Assessment of Production and Marketing System of Goats In Dale District, Sidama Zone
Endeshaw Assefa
M.Sc Thesis
In Partial Fulfillment of The Requirements for the Degree of Master of Science in Animal Production
Submitted to The School of Graduate Studies
Department of Animal Production and Range Sciences
AWASSA COLLEGE OF AGRICULTURE
UNIVERSITY OF HAWASSA
AWASSA, ETHIOPIA
June 2007Awassa
Acknowledgements
I would like to express my deepest gratitude and heartfelt thanks to my advisor, Dr Girma
Abebe, for his invaluable comments, supports and follow up from the preparation of the proposal
up to the end of the research work. His careful follow up and guidance through out the study
period has contributed a lot to cover and complete timely the wider area coverage of the study
site. I also extend my sincere thanks to my co-advisor, Dr Yosef T/ Georgis, for his support in
providing valuable comments through out the study period and his important guidance during
data analysis.
Also my heart felt thanks extended to my co advisors Dr Azage Tegegne and Dr Berhanu G/
Medhin for their follow up, guidance and support in providing invaluable comments and
suggestions throughout my study period.
Sidama Zone Agricultural and Rural Development Coordination Office is highly acknowledged
for the material and. facility support and follow-up of the study. I would like to express again my
deepest and heartfelt thanks to Shebedino Agricultural and Rural Development Coordination
Office for their support in providing transport, materials and all rounded support from the very
beginning of the study period up to the end. Agricultural and Rural Development Coordination
Offices in Dale, Wonsho and Loka Abaya districts, the development agents and experts of the
three districts, as well as all participated farmers deserve my deepest appreciation for their
unreserved cooperation and collaboration during the study.
The study was carried out through the financial support of the IPMS project. I would like to
thank the project coordinators who facilitated this opportunity for researchers and graduate
fellows. Also my thanks extended to Ato Ketema Yilma and all the IPMS staff in ILRI and at
Dale Pilot Learning Woreda for their wholehearted support during field works and office
activities.
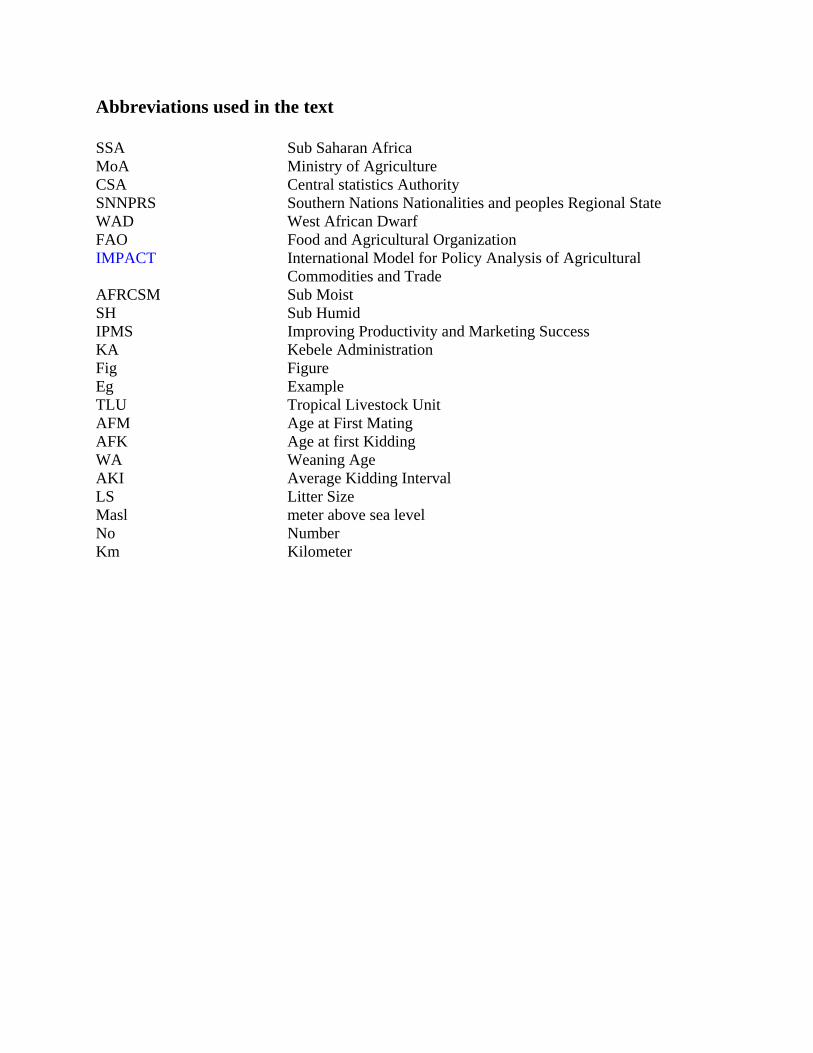
Abbreviations used in the text
SSA Sub Saharan Africa MoA Ministry of Agriculture CSA Central statistics Authority SNNPRS Southern Nations Nationalities and peoples Regional State WAD West African Dwarf FAO Food and Agricultural Organization IMPACT International Model for Policy Analysis of Agricultural
Commodities and Trade AFRCSM Sub Moist SH Sub Humid IPMS Improving Productivity and Marketing Success KA Kebele Administration Fig Figure Eg Example TLU Tropical Livestock Unit AFM Age at First Mating AFK Age at first Kidding WA Weaning Age AKI Average Kidding Interval LS Litter Size Masl meter above sea level No Number Km Kilometer
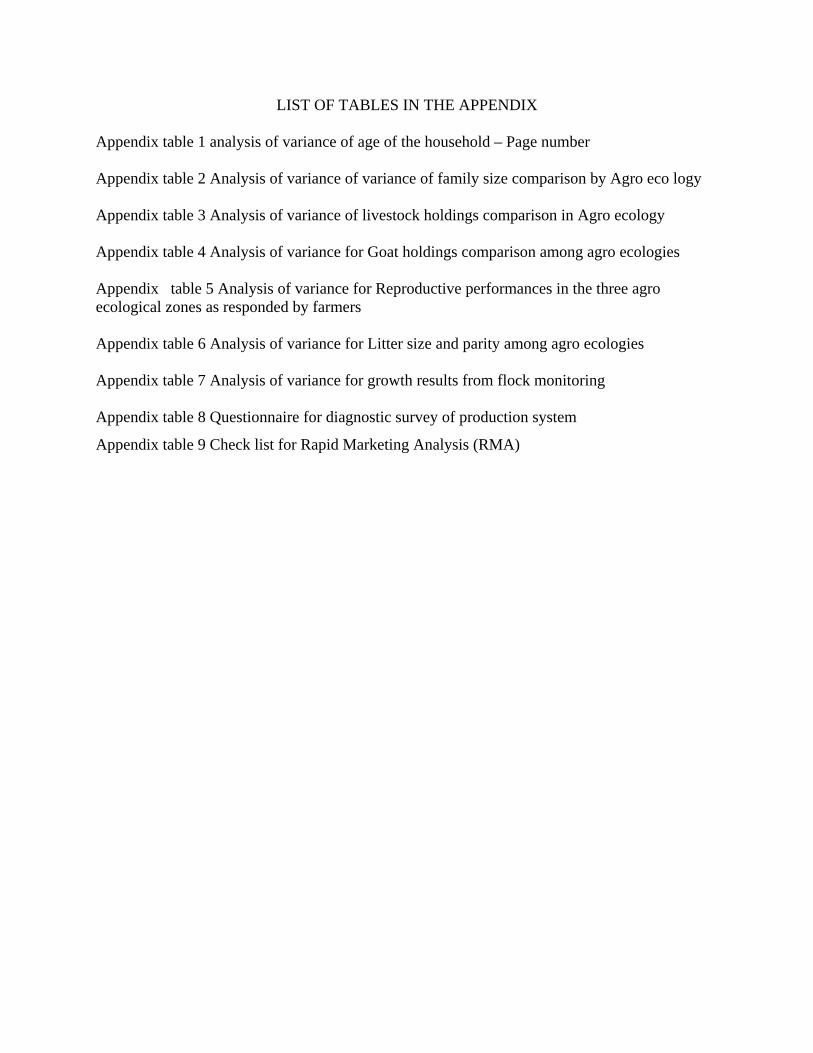
LIST OF TABLES IN THE APPENDIX
Appendix table 1 analysis of variance of age of the household – Page number
Appendix table 2 Analysis of variance of variance of family size comparison by Agro eco logy Appendix table 3 Analysis of variance of livestock holdings comparison in Agro ecology Appendix table 4 Analysis of variance for Goat holdings comparison among agro ecologies Appendix table 5 Analysis of variance for Reproductive performances in the three agro ecological zones as responded by farmers Appendix table 6 Analysis of variance for Litter size and parity among agro ecologies Appendix table 7 Analysis of variance for growth results from flock monitoring Appendix table 8 Questionnaire for diagnostic survey of production system
Appendix table 9 Check list for Rapid Marketing Analysis (RMA)
List of Tables
Table 1 Age of the household – Page number
Table 2 Family size and land holdings in two three-agro ecologies
Table 3 Mean livestock holdings per household
Table 4 Number of Goats per household
Table 5 Goats and sheep numbers per household before two year and of present as recalled by
flock holders
Table 6 Months with the highest number of birth
Table 7 Mean values for various reproductive parameters.
Table 8 Litter size and parity of goats
Table 9 Age at first service for backs.
Table 10 percentages of farmers that use different sources of breeding bucks
Table 11 Reasons for keeping bucks
Table 12 Goat milking and milk unitization percentage.
Table 13 percentage of respondents indicating feeds sources available for goats
Table 14 Shrubs and frees commonly fed to goats in the three agro ecologies.
Table 15 Months with surplus feed
Table 16 Months for the shortage of feeds
Table 17 Management systems
Table 18 the responsibility of family members in goat management
Table 19 Water sources during wet season
Table 20 Water sources during dry season
Table 21 Dry season distances
Table 22 Wet season distances
Table 23 Watering frequencies
Table 24 Problems related to health and disease control
Table 25 Common distance of the area
Table 26 Months of the highest goat mortality
Table 27 Type of goats sold in the last 12 months and the place of sales
Table 28 the highest around lowest price of goats in type and age estimated by responders
List of Figures
Figure 1 respondent by age and level of education …………Page
Figure 2 Income sources of households……………………………………………..
Figure 3 …………..
Figure 4
Figure 5 Typical goal flocks in moist kola (Loka Abaya)…………………………….
Figure 6 Purpose of keeping goats……………………………………………………..
Figure 7 Experience of farmers in goat husbandry ……………………………………
Figure 8 Criteria for culling goats……………………………………………………….
Figure 9 Criteria for selecting bucks ……………………………………………………
Figure 10 Lactating doe taken from a flock at moist kola district
Figure 11 Goats being looked after by midwife during supplementary gazing
Figure 12 Problems affecting the expansion of goat production
Figure 13 Castrate goats fattened by goat holder (Loka Abaya)
Figure 14 Assessing body conditions of goats in the market
Figure 15 reasons for selling goats
Figure 16 Old doe with triplet kinds (moist kola Loka Abaya district)
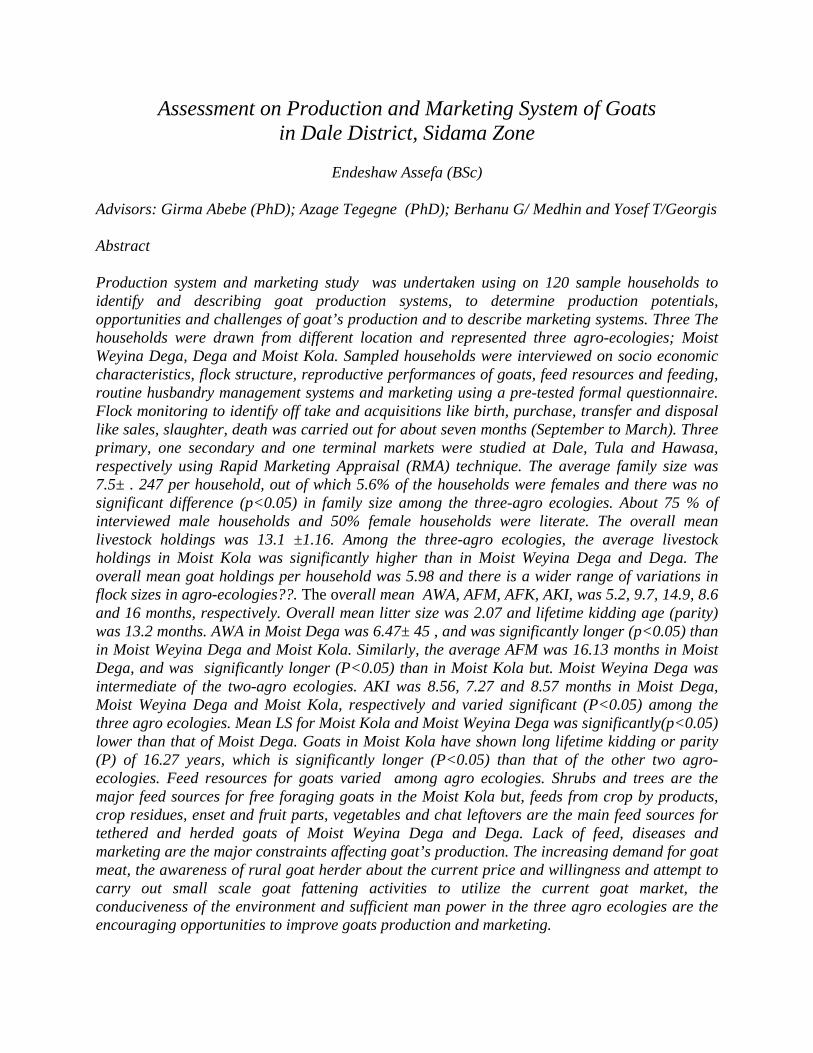
Assessment on Production and Marketing System of Goats in Dale District, Sidama Zone
Endeshaw Assefa (BSc)
Advisors: Girma Abebe (PhD); Azage Tegegne (PhD); Berhanu G/ Medhin and Yosef T/Georgis Abstract Production system and marketing study was undertaken using on 120 sample households to identify and describing goat production systems, to determine production potentials, opportunities and challenges of goat’s production and to describe marketing systems. Three The households were drawn from different location and represented three agro-ecologies; Moist Weyina Dega, Dega and Moist Kola. Sampled households were interviewed on socio economic characteristics, flock structure, reproductive performances of goats, feed resources and feeding, routine husbandry management systems and marketing using a pre-tested formal questionnaire. Flock monitoring to identify off take and acquisitions like birth, purchase, transfer and disposal like sales, slaughter, death was carried out for about seven months (September to March). Three primary, one secondary and one terminal markets were studied at Dale, Tula and Hawasa, respectively using Rapid Marketing Appraisal (RMA) technique. The average family size was 7.5± . 247 per household, out of which 5.6% of the households were females and there was no significant difference (p<0.05) in family size among the three-agro ecologies. About 75 % of interviewed male households and 50% female households were literate. The overall mean livestock holdings was 13.1 ±1.16. Among the three-agro ecologies, the average livestock holdings in Moist Kola was significantly higher than in Moist Weyina Dega and Dega. The overall mean goat holdings per household was 5.98 and there is a wider range of variations in flock sizes in agro-ecologies??. The overall mean AWA, AFM, AFK, AKI, was 5.2, 9.7, 14.9, 8.6 and 16 months, respectively. Overall mean litter size was 2.07 and lifetime kidding age (parity) was 13.2 months. AWA in Moist Dega was 6.47± 45 , and was significantly longer (p<0.05) than in Moist Weyina Dega and Moist Kola. Similarly, the average AFM was 16.13 months in Moist Dega, and was significantly longer (P<0.05) than in Moist Kola but. Moist Weyina Dega was intermediate of the two-agro ecologies. AKI was 8.56, 7.27 and 8.57 months in Moist Dega, Moist Weyina Dega and Moist Kola, respectively and varied significant (P<0.05) among the three agro ecologies. Mean LS for Moist Kola and Moist Weyina Dega was significantly(p<0.05) lower than that of Moist Dega. Goats in Moist Kola have shown long lifetime kidding or parity (P) of 16.27 years, which is significantly longer (P<0.05) than that of the other two agro- ecologies. Feed resources for goats varied among agro ecologies. Shrubs and trees are the major feed sources for free foraging goats in the Moist Kola but, feeds from crop by products, crop residues, enset and fruit parts, vegetables and chat leftovers are the main feed sources for tethered and herded goats of Moist Weyina Dega and Dega. Lack of feed, diseases and marketing are the major constraints affecting goat’s production. The increasing demand for goat meat, the awareness of rural goat herder about the current price and willingness and attempt to carry out small scale goat fattening activities to utilize the current goat market, the conduciveness of the environment and sufficient man power in the three agro ecologies are the encouraging opportunities to improve goats production and marketing.

Key words Goats, Agro ecology, Reproductive performances, litter size, kidding interval, age at first mating, Parity, Feed resources, crop residue, bushes and shrubs

1. Introduction
Goats account for about 30% of Africa's ruminant livestock and contribute to about 17
and 12% of the total meat and milk production, respectively. Sub-Saharan Africa (SSA)
accounts for over 60% of the total goat population in Africa, with estimated 147 million
goats representing about 80 indigenous breeds or strains distributed across all agro-
ecological zones and ruminant livestock production systems (Lebbie, 2004).
Goats are highly adapted to a broad range of climatic and geographic conditions and are
more widely distributed than any other mammalian livestock. The unique features of
goats which include selective feeding behavior that enables them to select the most
nutritious part of plant, fast reproduction, consumption of diversity of plant species and
low capital requirement makes them very important especially for the poor at densely
populated mixed farming areas.
Moreover, goats are capable of producing more milk on less feed and are not adversely
affected by declining range condition as cattle. They also have a significant
socioeconomic role in rural areas and especially in societies where women are among the
most resource poor people in Africa.
According to the most recent estimates, Ethiopia has 23.4 million goats (MoA, 2004).
Contrary to the general assumption that goats in Ethiopia are generally considered

associated with arid and semi arid lowlands, about a third of the national goat’s
population is found in agricultural highlands (Workneh, 2003; Nigatu, 1994). In Southern
Nations Nationalities and Peoples Regional State, (SNNPR), about 2.7 million goats are
kept by small flock holders at wider range of agro ecological zones (CSA, 2003). In the
Sidama zone about 183,462 goats are reared and contribute to 6.7% of the Regional
goat’s population. Among the woredas (districts) in Sidama Zone, Dale Woreda has
about 17,248 goats contributing to 17.1% of the total goat’s population in the Zone (CSA,
2003).
Dale Woreda is the biggest and densely populated district among the ten districts of the
Sidama Zone having suitable climatic diversity for plant growth that favors goat
production. The diversity of plant species grown, availability of agricultural and agro-
industrial by-products and integration of goats into the farming system makes the area
suitable for goat production. In the district, due to rapid population growth and
subsequent expansion of farmland, grazing land is shrinking and has reached a stage
where it could not support large ruminant production. In such a circumstance, goat
production has a role in serving as a source of income through sale of kids and milk
production. In recent years, the demand for goat meat is continuously rising presumably
due to the growing export market for goat. However, despite the huge number of goats
that are reared by smallholders and agro pastoralists in the district, productivity of the
goat and their system of production has received little attention in research and
development endeavors.
In the diagnosis and program design of the project entitled “Improving Productivity and
Market Success (IPMS)of Ethiopian Farmers” project, goat production and marketing
was considered as one of the priority commodities in Dale Woreda. In this regard,
assessment on the supply and demand of live animals for both the domestic and export
markets was identified to be an important research issue. Proper description of the
production and marketing systems and identification of the actual production constraints
as well as potential productivity of goats in the woreda is fundamental to any intervention
that will be designed and executed for the benefit of smallholders in the area. It was also
hypothesized that differences in agro-ecological zones results in different performance
levels of goats, their socio economic importance and their management system.
The objective of this study was, therefore, to study goat’s production and marketing
system. Specific objectives were to :
- identify and describe goat production systems
- determine production potentials
- describe marketing systems and identify opportunities and challenges of goats
production.
.
2. Literature Review
2.1. Production systems Small ruminants in tropical Africa are kept under traditional extensive systems. In the arid and
sub humid zones, cattle are reared with sheep and/or goats. In the humid zone, animals generally
graze freely, with access to household and kitchen wastes when available (Ademosun, 2003).
Production systems are identified on the basis of contribution of the livestock sub sector to the
total household revenue. Almost all the goat production systems in southern Ethiopia have been
designated as “traditional” (Workneh, 1992). These traditional production systems include
pastoral, agro-pastoral, agricultural and urban.
Production systems are segregated according to the degree of dependency on livestock and
livestock products for income or food, type of agriculture practiced in association with livestock
and mobility and duration of movement. Accordingly, more than 50% of household income
comes from livestock and in arid areas where there are little or no cropping activity, owners
travel longer distance year round looking for forage and water along specific orbits are classified
as pastoral system. In the semi arid regions, 10-50% of the income comes from livestock and
agriculture production is practiced along with livestock management and production. The system
is either transhumant or sedentary and is classified as agro-pastoral. The sedentary agricultural
system is where income of less than 10% is derived from livestock/livestock products and
livestock production is secondary to crop production (Wilson, 1988; Workneh 1992). Urban and
peri-urban production system is practiced in town and cities by wage earners who invest cash on
goat production for short-term profit (Ibrahim1998).
In pastoral system land assumes more importance whereas in agro pastoral, agricultural and
urban/peri-urban system labor is more important. As intensification increases, labor becomes
more important than land. The urban system is capital intensive since farmers invest cash to buy
goats or sheep to fatten for sale during peak demand. In this system the high wage for labor is the
main constraint (Ibrahim, 1998). According to the same author, in the pastoral system small
ruminants obtain their feed from rangelands. In agro-pastoral systems rangeland is used but crop
residues assume more importance. In most agricultural systems, crop residue, household waste
and forages are used for feeding small ruminants.
Traditional livestock farming is very diverse and is dependent on climate and soil, and is very
much linked to the availability of local resources either plant growth or the species and breed of
animals reared. Traditionally extensive systems of production share common characteristics such
as limited number of animals per unit area relatively limited use of advanced technology low
productivity per animal grazing and the use of agriculture-on farm by products (Boyazoglu,
2002).

2.2. Growth and reproductive performance .
A study using West African Dwarf (WAD) goats owned by 45 farmers indicated that in the wet
season goats had access to either fodder banks or natural pasture, after crop harvest goats roamed
freely. The result of these two grazing systems indicated that mean litter size was 1.67 + 0.08 and
1.56 + 0.06, respectively, and was affected by parity (P<0.05). Births accounted for 87% of all
entries while multiple births accounted for about 68 % of all the kids (Ikwuegbu et al., 1994).
Field performance of goats in the humid southeastern regions of Cote d’Ivoire, reported that the
uncorrected litter size was 1.52. Annual kidding rate was 234.1%, and this high reproductive
performance was achieved due to the short kidding intervals in three kidding over a period of
two years. Number of kids born per year in Djallonke does varied between 2.0 and 2.7
(Armbruster, 1993).
In South Africa mean kidding percentage, (number of kids born per doe per year), for maiden
does was 76% and that older does 64%. Abortion rate was 29%, and the high incidence of
abortion may be indicative of inadequate nutrition during the last stage of pregnancy
(Mahanjana, 2000)
Kidding rate and litter size of goats kept in southern Ethiopia was reported to be 80% and 1.03,
respectively (Girma et al., 2000). According to these authors, low litter size obtained was
attributed to the fact that most goats were in their first parity. Kids could attain body weight of
up to 20 kg at less than one year of age (Girma et al., 2000)
Preliminary survey of indigenous goat types and goat husbandry practice in Southern Ethiopia
indicated that the highest litter size of 1.35 (n=2463), two quadruplets, 48 triplets and 755 twins
were recorded for home bred and purchased does implying the multiple birth frequency of 32. 68
%. This goat type may be categorized as a dual-purpose type (Workneh, 1992).
On farm study conducted on Arsi Bale goat types in Boricha District Sidama zone and Arsi
Negele District (Oromia), by Behailu and Samuel, (2003) indicated that more mating was
observed between December and February with the highest kidding occurring between June and
August. Age at first kidding was reported to be 441±101 days (c.v. =40 days), fertility rate of
65.9% prolificacy 1.4% kids per birth, and kidding interval of 282±87 days (c.v. 24%). In the
Boricha district of the Sidama zone, reported 1.1 kids per birth of litter size, 325±92 days
kidding interval and 586±87days (c.v. =15%) for age at first kidding.
A recent on farm monitoring of goats conducted in Adami Tulu by Tatek et al. (2004) indicated
that average prolificacy, parturition interval, litter size were 121%, 8.07 months and 1.21,
respectively. These authors also reported that among the total births, about 36.3% were twins and
triplets. The same authors from their on farm growth performance assessment of Arsi Bale goats
also reported that birth weight, weaning weight and pre- weaning growth rate were 2.23 kg, 8.39
kg, and 72.21 g/day, respectively.
2.3 Description of goat types in the study area
According to the classification by Farm Africa (1996), goats in study area fall under the Arsi-
Bale type. The Arsi-Bale goats are described as short legged, hairy, short and erect ears and
horns with predominantly dark color. The Sidama goats according to Farm Africa are
synonymous with Arsi-Bale, and described as medium sized, slender, convex head profile,
horizontally carried ear, shorthaired and backward oriented horn (Nigatu, 1994).
Arsi-Bale breed is found throughout the Arsi and Bale regions up to altitudes of 4000 masl. They
are also found in the higher altitudes of Sidama and western Hararge. The goat breed is found in
all the agro-pastoral lowlands of the Rift Valley from Lake Abaya in the south-to-south Shoa in
the north. Arsi-Bale goats are kept in small flocks in mixed farming systems in the highlands, as
well as in the agro-pastoral systems in the lower altitudes (Farm Africa, 1998).
The Sidama goat is from Arsi Bale type and distributed throughout with the Sidama ethnic
group. Bale mountains manifest hairy coat apparently due to the influence of Gishe (Arsi-Bale)
goats in Bale. The population size of this goat type is estimated to be about 150,000 based on
official estimate of goat’s number in the Sidama area of about 6500 square kilometer. This goat
type is spread across three-production system in Sidama. Flock sizes are three to four times
bigger in agro-pastoral system than in the highland agricultural zone (Workneh, 1992).
Woyto Guji goat types related to Arsi Bale goat found in southern Sidama North Wolayita, and
South Omo mainly kept by pastoral ethnic group. More notably this goat type inhabits those
areas in Sidama known to be endemic with trypanosomiasis especially to the south of Lake
Abaya and Western Genale Catchments area (Farm Africa, 1996).

2.4. Feed resources and feeding system The survey conducted on indigenous goat type in Southern Ethiopia revealed that in pastoral and
agro-pastoral systems of Southern Ethiopia; rangelands provided the only source of feed
throughout the year. Both Sidama and Borena agro-pastoralists supplement goats with thinning
of maize and sorghum and crop residues during the wet and dry seasons In agricultural areas not
only crop residue but also chopped fodder, browses and kitchen wastes are supplied to goats.
Goats also graze on fallow land in agricultural systems perennial crop growing areas, presumably
due to limited pastureland (Workneh, 1992)
The potential of crop residues as livestock feed increases with rising population density, while
the demand for them depends on the livestock population density and the alternative functions of
crop residues in the farming system. At the village level, stocking rates differ greatly between
individual farmers. Stock-poor farmers may have excess to feed, while stock-rich farmers,
despite having more cropland and higher crop yields, may be short of feed. In mixed cropping
systems with long growing seasons, intercropping may restrict the access of livestock to crop
residue, such that the residues of early-maturing crops may decompose in situ without being
grazed (Leeuw, 2003).
Increased livestock holdings will stimulate mono cropping or the intercropping of crops of
similar cycle length. In the future, rising demand for locally grown crops and for livestock
products may lead to higher use of inputs, resulting in higher crop and crop residue yields, feed
budgeting and the allocation of feeds to different classes of stock ranked according to their
revenue-earning capacity. New cropping patterns may evolve that allocate larger shares of land
to grain legumes and roots/tubers. This will diversify and enhance crop residue quality, a process
that can be further promoted through the inclusion of by-products in feeds (Leeuw, 2003).
Perennial crops (enset and coffee) are common in areas with a high population density such as
Sidama. The system of feeding is predominantly free grazing. Tethered feeding is practiced
around perennial crop growing areas in Sidama. Some farmers provide crop residues, thinning of
maize or sorghum, kitchen waste and chopped browse. Provision of mineral supplements in the
form of natural licks and table salt is common among the Sidama people. Kids are sometimes
provided with supplements (Farm Africa, 1998)
Livestock feed scarcity is often the major cause of livestock mortality during drought in the
Enset (Enset ventricosum)-livestock mixed farming systems in the Kokossa district of the Bale
highlands in southeastern Ethiopia (Desta, 2004). Livestock mortality associated with feed
scarcity was investigated in the livestock-enset, enset-livestock and enset-livestock-cereals
production systems of the Ararso, Jafaro and Bokore sub districts of Kokossa, respectively, using
farmers' perceptions during a drought year in 1998, an average rainfall year in 1999 and a wet
year in 2000. Livestock mortality was variable between years and between farming systems.
Greater livestock mortality occurred during the drought than in an average or wet year.
Generally, mortality was greater in the livestock-enset and least in the enset-cereals-livestock
production system. Among livestock, cattle experienced greater mortality than small ruminants
and equines (Desta, 2004).
Total feed demand depends on the overall local stocking rate, but the ratio of supply to demand
varies across seasons and years as well as between individual farms. Variability in ratios between
farms is greatest where communal grazing land is scarce, as for example in the Ethiopian
highlands, Rwanda and Kenya. Where access and use of feed is entirely farmer-controlled,
benefits from intensification of the crop subsystem can translate directly into higher livestock,
modest increments in input levels can double the output of cereal crop residue, which, having
full control, the farmer can manipulate and manage so as to increase feed supplies and effective
use by livestock. When farmers perceive the true value of their crop residues they often reassess
them as a marketable commodity and start to engage in trade in feeds. This allows stock-poor
producers to extract added value when intensifying their own cropping enterprises (Leeuw,
2003).
The goats can be left to forage free-range for part of the day but are brought in to be fed the main
part of their ration. In the dry season, free-range goats will only find dry vegetation or crop
residues in the fields (stubble grazing). These may supply some energy, but the protein content is
very low. Even by cutting and carrying such foodstuffs to enclosed animals it will be hard to
meet their requirements. Goats can be fed fruits and vegetables like cassava or sweet potatoes, or
the leaves of these plants, if available. Banana peelings, and sugar cane tops are also suitable,
although not so nutritious. Feed supplements will also have to be given, if goats are enclosed
during the rains, fresh grasses, legumes, tree foliage should be cut for them. Fodder trees are
useful for this. Crop thinning or cuttings (maize, etc.) can also be fed, as well as weeds. Sweet
potato vines are very nutritious (Jansen, 2004).
The effect of different feeding systems was conducted using Somali and Arsi Bale goats’ It
was found that Somali goats managed under semi-intensive system returned a higher profit
margin than the goats managed under extensive and intensive systems (Getahun et al., 2005).
These authors suggested combining grazing with concentrate supplementation is potentially
more profitable than either grazing without concentrate supplementation or pen feeding with
no grazing.
On the other hand, the marginal rate of return for Arsi-Bale goats was negative in all the three
systems. The loss of money encountered in goats managed under the extensive system was
relatively lower than the goats under other treatments. The additional income from
supplementation of concentrates does not justify the additional cost accompanied with it for
these goats. Grazing seems the only viable option for Arsi-Bale goats during the dry season.
Repeating this experiment during the wet season to generate data for the whole year would
gave more conclusive result since the availability and quality of feeds, cost of variable inputs
and prices of the animals varied from season to season (Getahun et al.,, 2005).
Forage legumes could be established under maize with out reducing the grain or stover yield.
Leaf defoliation up to 50% did not affect the grain or stover yield components or the yield of
under sown legume (AFRC, 2004). In the highlands, where common grazing areas have been
declining due to population pressure, crop thinning and weeds from the cultivated land provide a
large part of supplementary feed available to the goats. Thus, the size of cultivated area has to be
considered as a limiting factor. However, there is no evidence to show that land is any more
limited to the total flock out put than the total labor at the disposal of the household than the
biomass of goats to be maintained (Workneh, 2004).
.According to a study conducted in Belessa (Amhara region of Ethiopia) the feed available in
Kola agro-ecology is good compared to Dega agro-ecology. The critical feed shortage season in
Belessa Woreda is from January to the end of June, depending on the on set of rainfall. If the rain
starts early in the season (May), all the private and communal grazing land as well as forest and
shrub are a good source of feed so that livestock will not face feed shortage. However, during
drought years or delays in the start of rainfall, feed and water shortage are major problems and
high livestock mortality is common.

The study conducted in Amhara region found that ownership of various types of livestock has
declined, and there has been a significant change in utilization of feed resources: while use of
communal grazing lands, private pastures, woodlots and forest areas as feed sources has
declined, the proportion of households using crop residues and purchased feed has increased. In
addition, the proportion of households with better access to woreda towns significantly improved
ownership of oxen and goats, while improvement in access to all-weather roads reduced
ownership of oxen (Benin et al., 2002).
The study conducted at Addilo (SNNPR) and Kofole (Oromia) areas also showed that lack of
feed which is directly related to shrinking farm size, was ranked as the major constraint by
Addilo respondents, while small ruminant disease was ranked as top most priority problem at
Kofole (Getahun, et al., 2006).
2.5 Health and major diseases affecting goat production
Animal health problems of various origins are among the numerous factors responsible for poor
goat production and productivity. Farmers classify diseases on the bases of clinical sign, severity,
onset and duration of the disease and considering species and age it affects. Farmers' indigenous
knowledge that was handed down over generations in handling and treating livestock health
problems are enormous and are still useful in Ghinchi area Oromia region (Ethiopia) (Yosef,
2002) An integrated multi disciplinary research and development approach with the full
participation of the farming community is of paramount importance to improve their livestock
husbandry and management practices and to improve and make use of an age-old enormous
knowledge in handling and treating different animal health problems (Yoseph, 2002).
A study on ectoparasites on small ruminant was carried out in three districts (woredas) of the
eastern part of Amhara regional state, Ethiopia, from November 2003 to March 2004. The result
indicated that out of 752 goats examined, 56.4% of goats were infested with one or more
ectoparasites. The ectoparasites identified in goats were Linognathus spp., 28.3%; ticks, 22.2%;
Sarcoptic mite, 6.1%; and Ctenocephalide spp., 8.1%. In goats, the risk of Sarcoptic mange
infestation in the low and midland was 4.6 and 5.0 times higher than the highland respectively
(?????)
2. 4. Marketing and profitability of goats
2.4.1. Market structures and marketing channel
Markets are important for agricultural growth and sustainable development. Lack of markets, or
poor access to those markets that exist, not only affects farmers and livestock herders locally in
rural areas, but is a drain on the potential of the entire country. Creating local and national
markets and improved access to them, allows specialization and diversification into new
agricultural products that make profits for rural households and decrease poverty and hunger.
Marketing channel describes the movement of a product or commodity from the site of
production to the place of consumption. It may include transportation, handling and storage,
ownership transfers, processing, and distribution (Pinkerton, 2002).
The marketing channels that small stock farmers were mostly aware of are butchers,
middlemen/traders and individuals. Some farmers still believe that financial assistance policy
projects were useable even though they have been phased out. The most used marketing channels
individuals ranked as the most favored, then butcheries as the second most favored and middle

men as the third favored. The least favored was financial assistance policy projects while the rest
were largely seen as unfavored. The usage of other marketing channel is very low. Auction and
cooperatives are none existent (Nsoso, 2004)
The growing demand for small ruminants in local and international markets, the improving
transportation infrastructure, and the experience of farmers in small ruminant keeping are
practical opportunities to enhance the contribution of the sector. Furthermore, research on the
complex cause–effect relationships is needed to derive policy implications (Getahun, 2006).
Efficient and integration of marketing determine the tradability of products and the accessibility
of market to farmers. Improving market efficiency contributes to the increased level of food
security by reducing consumer prices, increasing returns to producers or both. That is returns to
better supply of food. A study conducted in SNNPR State by Million (2003) indicated that
inadequate transport network, limited number of large interregional traders with inadequate
storage and working capital high handling costs, inadequate market information system weak
bargaining power of producers, and lack of processing facilities have contributed to inefficient
livestock market in the region.
2.4.2. Live animal marketing systems and demand for meat
The marketing of goats and goat products in the tropics is very variable, and depends on location
and prevailing production conditions. Traditional production trends tend to be associated with
local marking conditions. Uncertainty and lack of assessment for reasonable prices are the main
marketing problems, which are resulted due to unorganized marketing. In an organized
marketing system there is usually assurance of reasonable prices for quality products and these

are linked to reliable supply sources. In the traditional marketing system, it is a small enterprise,
the overhead cost is low and the products are sold in the simplest possible way. Labor is plentiful
in rural area, but the capital investment is small. The market is essentially low income and
consumers look for cheapest meat available and buy in small quantity, however, as affluence
increases, as the same time standards of living change, people will be prepared to pay higher
prices and consume more meat (Devendra, 1982).
Demand for meat is largely festival-led, and thus, predictable with well-set patterns for buying
reason. Stock movements between markets is unregulated and increasingly disorganized and may
add up to 12% to the final sales prices with a corresponding loss of condition on the part of the
animals (Peter, 1998).
For the period from 1998 to 2020, The International Model for Policy Analysis of Agricultural
Commodities and Trade (IMPACT) predicts developing countries aggregate consumption
growth rates of meat and milk to be 3.0 and 2.9% per year respectively, compared to 0.8 and
0.6%, respectively in developed country. Aggregate meat consumption in developing countries is
projected to grow by 72 million metric ton between 2003 and 2020, whereas, the corresponding
figure for developed countries is 9 million metric ton (Delgado, 2005). The study also revealed,
based on empirical data, that population growth, urbanization and income growth in developing
countries are fuelling a massive increase in demand for food of animal origin. These changes in
the dietary pattern of billions of people could significantly improve the well being of many poor
people in rural areas (Ehui et al., 2003).
Henning Seinfeld (2004) indicated that, globally, per caput food consumption continues to
increase both in the developing and industrialized countries, as well as in countries in transition,
as a result of increasing average per caput real incomes. Changes are also occurring in the type of
food consumed. With increasing incomes, demand for greater food variety and for higher value
and quality foods such as meat, eggs and milk, increases. Between 1997/1999 and 2030, per
caput meat consumption in developing countries is projected to increase from 25.5 to 37 kg per
person compared with an increase from 88 to 100 kg in the industrialized countries (Seinfeld,
2003). The same author also revealed that wide regional and country differences are also evident
in the quantity and type of animal products consumed—reflecting the traditional preferences
based on availability, relative prices and religious and taste preferences. Sub-Saharan Africa has
had low levels of animal products consumption that have changed little over the last 30 years.
While an increase in food consumption is predicted, only minor increases are projected for
animal products consumption.
The viability of goat’s enterprise depends not only on technical and biological efficiency, but
also, on a well organized marketing system. At present goats markets are characterized by poorly
managed and unrealistic carcass grading, pricing, inadequate promotion of goat meat and
inadequate and inefficient transport system. These problems will have to be corrected if goat
production is to be improved (Shumba, 2004).
Marketing has a significant role in increasing livestock production. Livestock herders can
strongly be initiated by increased price and marketing situations. Marketing enhance producers
to focus more on their animal productivity. However, there are factors affecting livestock
marketing and domestic livestock trade in Ethiopia and other neighboring countries. These

problems are particularly pronounced in distant areas away from large cities and urban centers.
These are poor infrastructures, high transport costs, taxation, intermediate costs and cartels. It
suffices to say that livestock are the most repeatedly taxed agricultural commodity group in the
region in route to their final destinations. For example, traders pay as many as 20 types of taxes
between points of purchase and destinations/ final exit points in Sudan, traders in Ethiopia are
also subjected to paying transit and sales taxes of widely varying nature within the country.
Kenya livestock traders may not pay fees and taxes as in many places as in Sudan or Ethiopia
(Yakob, 2003). The same author indicated that transport constitute a major cost factor in
livestock trade whether in Ethiopia, Kenya or Sudan. In Kenya transport costs constitute between
25-40% of the total price, the same holds true for Sudan and Ethiopia.
In addition to problems encountered due to taxation and transport too many middlemen affect the
efficiency of the livestock markets. In the Sudan livestock may change hands 2 to 6 times until
they reach the terminal market). Even then, the final transaction in the terminal markets is also
carried out through middlemen on commission basis. Terminal livestock prices as a result, end
up 3 or 4 times higher than the producer's price (Yakob, 2003).
2.4.3 Market information system and its influence on price
The existing livestock markets are loosely integrated due to lack of sufficient market
information. Thus, a market information system is required that allows stakeholders to get
information on quantity and price, both on the domestic and foreign markets. There is no
information as to the extents of competitive marketing prices and farmer-sellers being able to do

more than to accept what traders offer. Commercial transactions are dominated by the traders,
and largely to their advantages (Peter, 1998). Furthermore, market research is critical to identify
problems and constraints in the marketing systems and to know the requirements of the external
market, and to design policies and regulations that allow to have effective production and
marketing system internally and to match supply with the external demand (Belachew, 2003).
A review of structure performance and development initiatives about livestock marketing in
Ethiopia by Ayele et al. (2003) indicated that the available research results for livestock
marketing in Ethiopia are outdated. Current knowledge on livestock market structure,
performance and prices is poor and inadequate for designing policies and institutions to
overcome perceived problems in the domestic and export marketing systems. In particular,
information is required on the incentive structure, spatial and temporal bottlenecks and price and
information structure throughout the marketing chain including the export market.
According to Ayele (2003), available time series (livestock number and price) data are valuable
because they can be useful to relate and model the effects of external shocks (e.g. policy
changes, livestock development projects, climatic variations, regulations and taxes) to the
marketing system. Recent information on location specific marketing constraints, livestock
sources, prices, margins, stock marketing routes and market information endowments are
unknown. How prices and margin volatility are affected by other variables (e.g. season, climate
variation, crop prices) is also unknown for any tier of the livestock marketing chain.
The formulation of future livestock marketing policy that aims to improve the current system can
benefit from historical data, but will also require current market information. If Ethiopia’s

livestock is to compete successfully in the export market, particularly in its traditional outlets,
e.g. the Arabian Peninsula, minimizing inefficiency in the domestic market and understanding
the opportunities in the export market will be critical (Ayele, 2003).
Increasing the volume of export without considering the production potential of the country
affect the total animal production of the country. For example Sudan's ambitious export program
is aimed at reaching an export volume of some 10 million shoats a year. Given the chance,
Ethiopia and Kenya could also like to increase their export volume to the maximum, the question
is; how can each country determine what it can export without significantly affecting its resource
base. Available data on the off-take volume of livestock is far from accurate in all the three
countries. For example, annual off-take figures for the major terminal markets in the Sudan show
too wide variations from year to year to be reliable (Yakab, 2003).
2.4.4. Profitability of goats production
One means to create and conserve pastoral wealth is to encourage more timely sales of animals
and investment of proceeds in endeavors that enhance human capital and diversify local
economies where possible. Such strategies will only be possible if marketing channel can be
improved and rural financial services are made more accessible (Getachew, 2003). The same
author revealed that the livelihood of the smallholders is highly dependent on the cash income
derived from livestock and livestock products. Alleviating constraints to marketing, improving
market information and upgrading marketing infrastructures will potentially increase the welfare
of smallholder producers and urban consumers and improve the national balance of payments.
The more farmers are aware of the market demand and price, the higher will be their bargaining
power that could improve their income through getting a larger share of the consumer spending.
Market infrastructural and institutional set-ups will improve the access of producers to potential
markets whereby they could supply more volumes with higher share of the end market price.
These improvement measures will raise the household income and purchasing power of
producers and local traders, which in turn will create positive impacts on the local economy. On
the other hand, when income of the producers increases through better access to information,
market and infrastructure, they could improve production, both in terms of quantity and quality,
thereby benefiting consumers.
A study conducted in Nigeria, Imo State, indicated that the gender-perceived production
constraints; the relative contributions of these ruminants to the farm household net income; and
the implications of these contributions to loan repayments if production is assigned on gender
basis. Results showed that within the ruminant class of livestock, small ruminants, particularly
goats, dominate the others, followed by sheep and then, cattle. Their relative contribution to total
farm household net income follows the same order (Oguoma, 2003).

3. Materials and Methods
3.1. The study site
3.1.1. Description of the area
The study was conducted in Dale district in the SNNPR State, Ethiopia. Dale district is the
biggest district among the ten districts in Sidama Zone. It occupies 1411 km2 of land area and
situated at about 320 km south of Addis Ababa (IPMS, 2005), at 6.45N and 38.23E (Lemma,
1996). According to the recently available agro climatic zone classifications, the district is found
in two different sub zones (SM1-2) and (SH2-7) (MoA, 2002). The first one (SM1-2) is hot to
warm sub- moist lakes and the Rift Valley. At the western part of the district around Lake Abaya
bordering Humbo district of Wolayita zone, having an altitude of 1170 masl. The second one is
Tepid to cool Sub humid Mountains (SH2-7), covering 3200 masl, in the middle and the eastern
part of the district.
The regional government of SNNPR in 2006 split the former Dale district in to three Woredas,
namely: Wonsho, Dale and Loka Abaya districts. in which the first represents moist Dega agro-
climate having altitude ranging from 2300 up to3200 masl, while the latter two are under the
category of moist weyina Dega from 1500 to 2300 and moist kola from 1170 up to 1500 masl.
This study was conducted in the previous Dale district that covers all the three-agro climatic
conditions.
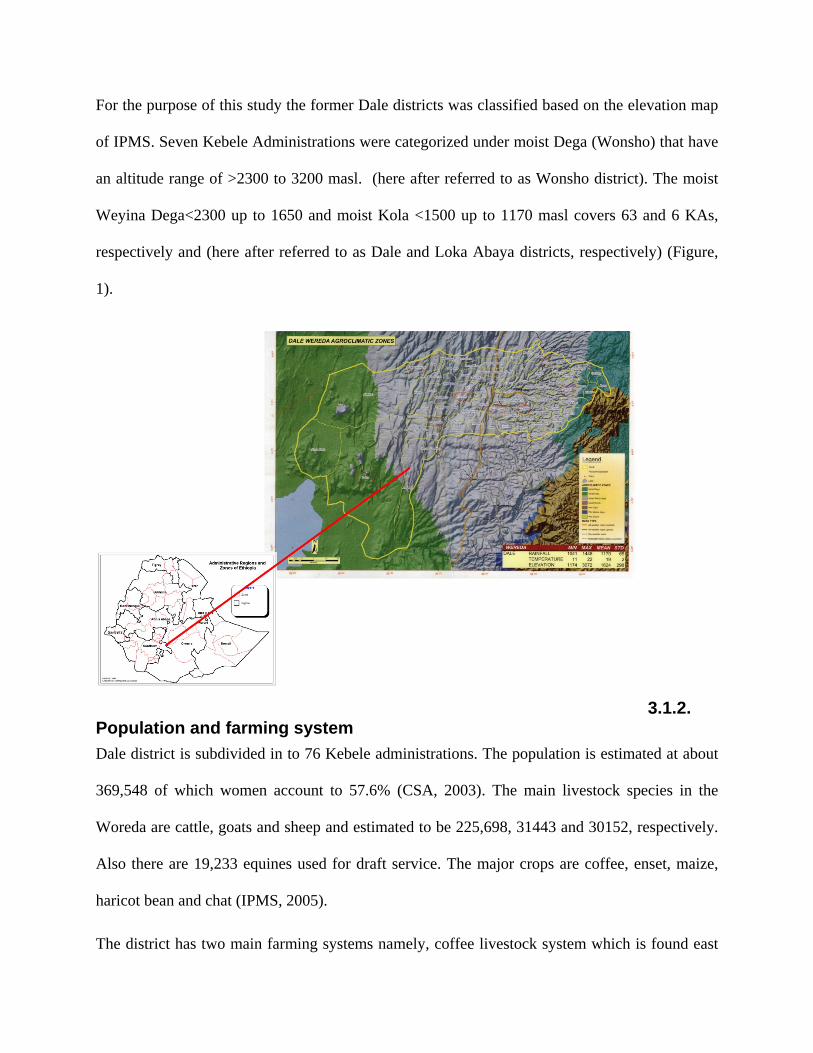
For the purpose of this study the former Dale districts was classified based on the elevation map
of IPMS. Seven Kebele Administrations were categorized under moist Dega (Wonsho) that have
an altitude range of >2300 to 3200 masl. (here after referred to as Wonsho district). The moist
Weyina Dega<2300 up to 1650 and moist Kola <1500 up to 1170 masl covers 63 and 6 KAs,
respectively and (here after referred to as Dale and Loka Abaya districts, respectively) (Figure,
1).
3.1.2. Population and farming system Dale district is subdivided in to 76 Kebele administrations. The population is estimated at about
369,548 of which women account to 57.6% (CSA, 2003). The main livestock species in the
Woreda are cattle, goats and sheep and estimated to be 225,698, 31443 and 30152, respectively.
Also there are 19,233 equines used for draft service. The major crops are coffee, enset, maize,
haricot bean and chat (IPMS, 2005).
The district has two main farming systems namely, coffee livestock system which is found east
of the main high way that transverse Dale from north to south and haricot bean livestock system
found at western part of the high way. In the latter system, haricot bean and goats are considered
as the priority commodity. Besides, the main system, two systems with minor area coverage are
found at two opposite extremes one in the extreme east at high altitude where farmers grow
cereals and horticultural crops and herding cattle, sheep and goats while the other at extreme
west bordering Lake Abaya, focusing on livestock production mainly goats and cattle.
The mean annual rainfall at Awada research sub center in Yirgalem town is 1314 mm. There are
two cropping seasons in the area. The first season starts at the mid of February and end up on the
late April, locally known as “Belg” which is used for pasture production and also for Maize, root
and tuber crop cultivation. The second and the big season locally known as “Meher”, that starts
at the beginning of June and end up at the end of November (Abebe, 2000; IPMS, 2005).
3.2. Sampling methods and data collection
3.2.1. Sampling techniques
The study was conducted using formal as well as informal methods. Multistage sampling
technique was employed. In the first stage, Kebele Administrations (KAs) that are the lowest
administrative unit, involved in the study were selected using stratified sampling technique.
Agro-climatic distribution of the Woreda (district) was used in order to stratify the Kebeles in the
district.
In the Second, stage, proportional allocation techniques was used in order to determine the
number of sample Kebele from each stratum. As a result, a total of eight i.e. 1, 6, and 1 Kebeles
from moist Dega (Wonsho district), moist Weyina Dega (Dale district) and moist Kola (Loka
Abaya district) were selected, respectively. On the third stage, random sampling technique was
used to identify Kebeles that were included in the survey study. Finally, households that were
participated in the study were selected using simple random selection method after identifying
the goat owners from the community using purposive sampling method.
3.3. Surveying methods
3.3.1. Reconnaissance survey
Reconnaissance survey was carried out in the selected eight Kebeles in order to identify the
existing system of production. Informal interviews were conducted using key informant such as
knowledgeable people, elders’ popular and experienced farmers. Furthermore, extension staffs
from agricultural office and representatives from Kebeles administrations had participated during
group discussions.
3.3.2. Diagnostic survey
After having conducted group discussions, a questionnaire was developed, pre tested and
translated into Amharic. Eight enumerators, one for each Keble, were recruited and trained for
two days. There after, diagnostic survey was carried out using local language (Sidamigna). In
this cross sectional survey, 15 farmers from each Kebele and a total of 120 participants, from 8
Kebeles were involved and interviewed. The number of households interviewed was, 15, 90 and
15 from moist Dega, moist weyina Dega and Moist Kola areas, respectively. The questionnaire
consisted of main parameters like household structure, production system including, breeds and
breeding, feeding, animal health situations and disease control, etc. The questionnaire used to get

pertinent information in the study is in Appendix Table 5.

3.3.3. Flock monitoring .
Sixty participants were involved in the flock monitoring study on a continuous basis for a period
of seven months (September to March). Body weight of animals in the flock was measured and
recorded at the beginning of the study period. Data on health and disease situations, production
and reproductive performances, disposal of goats (sales, death, transfer, slaughter), labor
utilization and other traditional husbandry practices were collected during the monitoring period
using six trained enumerators that were assigned to each selected study site. Furthermore, the
researcher on a monthly basis supervised data collection. Data collection sheets used for the
monitoring study are presented in Appendix Table 6.
3.3.4. Statistical methods
Data entry and statistical analysis were performed using SPSS computer package. Statistical
analysis like Frequency, percentages, mean, range standard deviation and standard errors were
used to describe qualitative data. Analysis of variance was used means were compared using
Tukeys and Newman’s tests. Data were tested for homogeneity of variance using Leven’s test
(Zar, 1996) in order to ensure that the assumption for the F test was not violated.
4. Results and Discussions
4.1. Demographic characteristics
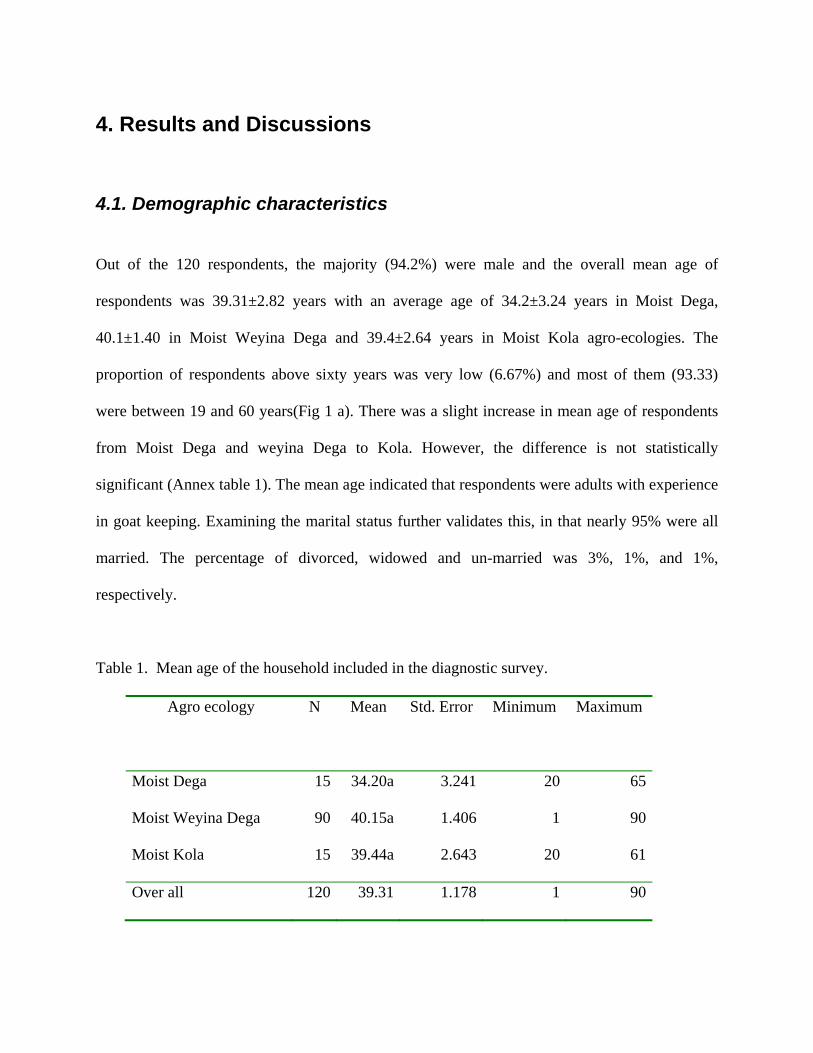
Out of the 120 respondents, the majority (94.2%) were male and the overall mean age of
respondents was 39.31±2.82 years with an average age of 34.2±3.24 years in Moist Dega,
40.1±1.40 in Moist Weyina Dega and 39.4±2.64 years in Moist Kola agro-ecologies. The
proportion of respondents above sixty years was very low (6.67%) and most of them (93.33)
were between 19 and 60 years(Fig 1 a). There was a slight increase in mean age of respondents
from Moist Dega and weyina Dega to Kola. However, the difference is not statistically
significant (Annex table 1). The mean age indicated that respondents were adults with experience
in goat keeping. Examining the marital status further validates this, in that nearly 95% were all
married. The percentage of divorced, widowed and un-married was 3%, 1%, and 1%,
respectively.
Table 1. Mean age of the household included in the diagnostic survey.
Agro ecology
N
Mean
Std. Error
Minimum
Maximum
Moist Dega 15 34.20a 3.241 20 65
Moist Weyina Dega 90 40.15a 1.406 1 90
Moist Kola 15 39.44a 2.643 20 61
Over all 120 39.31 1.178 1 90

Out of the interviewed male-headed households, 75% were literate, and on the other hand, only
50% of females (spouse) were literate. Considering males who attended school, proportionately,
a higher percentage (28%) attended grade 7-10 than elementary grads 1-3(20%) and 4-6(19%).
Some 4% were 10th grade complete or above. The high proportion (7 to 10th) is recorded at moist
weyina Dega (Dale). This area is different from the other two-agro ecologies by having
secondary schools and more accessible to urban centers (Yirgalem and Wondo towns). Some of
the herders were those who interrupted learning from junior schools and attracted in to farming
activities. Where as, Female representation decreases in higher grades by nearly 50% compared
to their numbers in elementary grades i.e., 26% in grades 1-3 compared to 13% and 10% in grade
4-6 and 7-10, respectively (Figure, 1b). Educated female is by far less than that of males in the
community. This is to be expected because families in most developing countries are reluctant to
send their female children to school. However, this situation has been improving in recent years.
During the time of the survey, all children of the interviewed household that reached school age
(>7years) were sent to school and therefore no illiterate children were encountered (Fig, 1b).
This indicates that, the communities in the studied area are quite aware of the benefits of sending
children (including girls) to school. The availability of schools within a reasonable distance from
homestead (a school within Kebele) is the other encouraging factor for children’s education.
The overall mean family size per household was 7.5±0.247 and was not significantly different
(P<0.05) among the three agro-climatic zones. Relatively higher family size per household was
recorded in Moist Weyina Dega (7. 9 ±0. 29) followed by moist Kola (6.8±0. 47) and moist Dega
(6.4±0. 58). This value was higher than the national, 5.2 person and regional- (SNNPR), person
average (CSA, 2003). On the other hand, these values are lower than the findings of Workneh
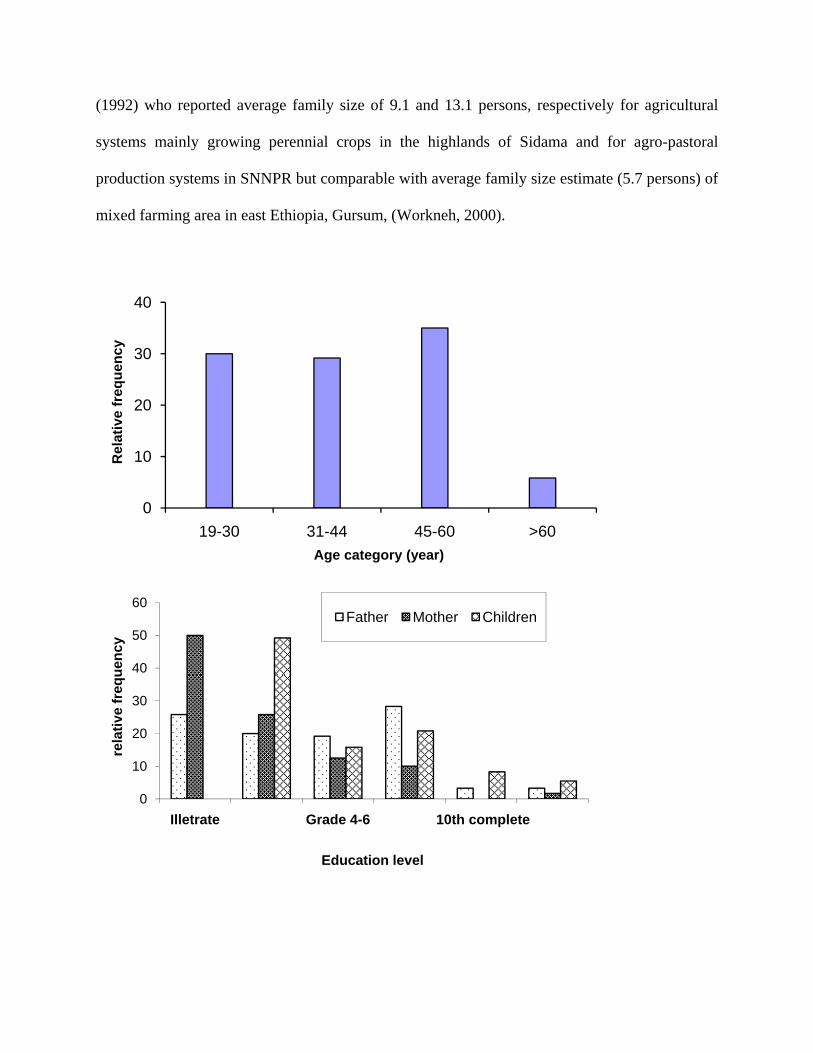
(1992) who reported average family size of 9.1 and 13.1 persons, respectively for agricultural
systems mainly growing perennial crops in the highlands of Sidama and for agro-pastoral
production systems in SNNPR but comparable with average family size estimate (5.7 persons) of
mixed farming area in east Ethiopia, Gursum, (Workneh, 2000).
0
10
20
30
40
19-30 31-44 45-60 >60
Rel
ativ
e fr
eque
ncy
Age category (year)
0
10
20
30
40
50
60
Illetrate Grade 4-6 10th complete
rela
tive
freq
uenc
y
Education level
Father Mother Children
Average land holding per household was significantly different among the three-agro- ecologies
(p <0.001). On average, households in moist Dega (Wonsho) possessed significantly large land
(2.18 hectare/hh) than those in Weyina Dega (1.27 hectare/hh) (Table 2). The average value for
Kola was (1.77 hectare / hh), was intermediate between the two.
Due to small land size and large family size per household, the ratio of family size to house hold
land holding was significantly high in Moist Weyina Dega than sparsely populated Dega and
Kola agro ecologies. The reason for high population in Moist Weyina Dega as expressed during
group discussions was mainly related to the conduciveness of the area for cash crop production
such as coffee and chat which is quite an attraction to new comers who consider production and
trading of coffee and chat as a good source of income. Also once established, migration from
Weyina Dega to other parts is minimal.
The overall mean livestock holding per household also varied across the three-agro ecologies, (p
<0.005) (Annex Table 2). Average holdings per household in Moist Dega 9.4 animals per
household and Weyina Dega 11.9 animals per household were comparable but were less than
half of the value for an average household (24.4 animals per household) in moist Kola district
(Table 2).
On the other hand, livestock to land ratio per household for Dega (4.64 animals per hectare) is
significantly lower than the livestock density per hectare per household in the other two agro
ecologies (Table 2). Relatively low livestock holdings coupled with large land area per
household in Dega may account to the sparse density of animals in Dega. In addition, people

from the Dega move their flock to the lowlands around Lake Abaya during the dry season in
search of grazing, and this may have also contributed to fairly low livestock density in the Dega
ecology.
Table 2 Family size, land and livestock holdings per households in the three-agro ecologies
Agro ecology
Dega Weyina Dega Kola No. of respondents 15 90 15
Average family size/HH 6.5a 7.87a 6.81a
Average No of persons/HH/hectare
3.26a
10.31b
5.06a
Mean total land holding/HH (hectare)
2.18a 1.27b 1.77ab
Land use Crop land Grazing land Forest land and others
1.83 0.28 0.05
1.11 0.088 0.065
1.56 0.17 0.10
Average total livestock holding/HH
9.40a (TLU 3.47) a
11.9a (TLU 4.44) a
24.4b (TLU 10.82) b
Mean livestock holding household-1hectar-1
4.64 a
11.95b b
14.66 b
Note that means value that bear the same letters are not significantly different from each other at 5% level of significance All the categories of livestock species shown in the Table 3 are found in all the three agro-
ecologies but species composition varies depending up on the type of climate. Cattle and goats
constitute equal proportion to the livestock density in Kola and Weyina Dega. In Dega however,
cattle are given first priority and sheep are as important as goats accounting nearly 50% of the
livestock density.
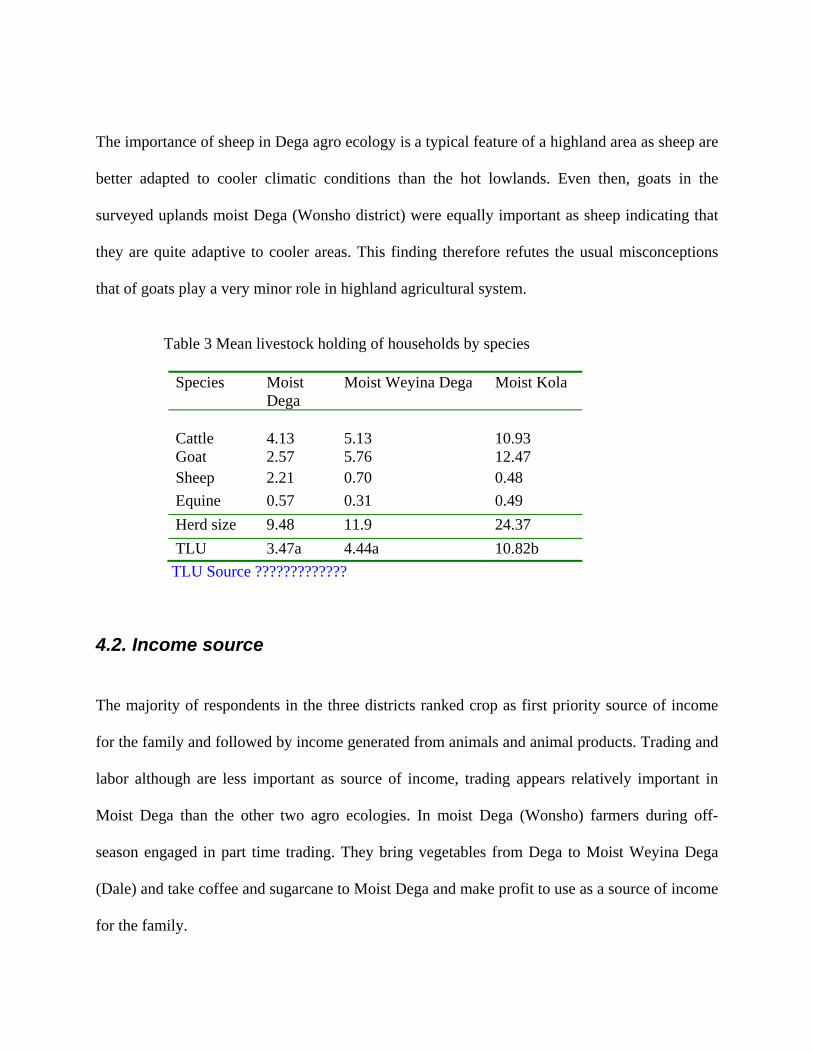
The importance of sheep in Dega agro ecology is a typical feature of a highland area as sheep are
better adapted to cooler climatic conditions than the hot lowlands. Even then, goats in the
surveyed uplands moist Dega (Wonsho district) were equally important as sheep indicating that
they are quite adaptive to cooler areas. This finding therefore refutes the usual misconceptions
that of goats play a very minor role in highland agricultural system.
Table 3 Mean livestock holding of households by species
Species Moist Dega
Moist Weyina Dega Moist Kola
Cattle
4.13
5.13
10.93
Goat 2.57 5.76 12.47 Sheep 2.21 0.70 0.48 Equine 0.57 0.31 0.49 Herd size 9.48 11.9 24.37 TLU 3.47a 4.44a 10.82b
TLU Source ?????????????
4.2. Income source
The majority of respondents in the three districts ranked crop as first priority source of income
for the family and followed by income generated from animals and animal products. Trading and
labor although are less important as source of income, trading appears relatively important in
Moist Dega than the other two agro ecologies. In moist Dega (Wonsho) farmers during off-
season engaged in part time trading. They bring vegetables from Dega to Moist Weyina Dega
(Dale) and take coffee and sugarcane to Moist Dega and make profit to use as a source of income
for the family.
Among crops, coffee and chat income took the first place in Moist Weyina Dega, Enset and
vegetables income in Moist Dega, and maize and haricot bean in Moist Kola. Goats are
important source of income in Moist Kola agro-ecology. Although farmers have diversified
income sources, 15% of the respondents ranked goats as first, while 63% as second major source
of income in the Kola agroecology.
4.3. Goats in the three agro ecologies
On the basis of phenotypic characterization, goats in the studied areas are of two types. The goats
in the highland district Wonsho (Moist Dega) that is adjacent to Bale resembled Arsi-Bale goat
type and possess hairy coat. The Moist Kola goats that are found around Laka Abaya are similar
to the Sidama goat type (Workneh, 1992). These goats are fairly similar to those in Moist
Weyina Dega (around Dale district) but they differ markedly from the highland Dega goats. The
Sidama goat type are bigger in size than the Arsi-Bale goats found in the Moist Dega (Wonsho),
whereas, the midland goats found around Dale district are intermediate in size.
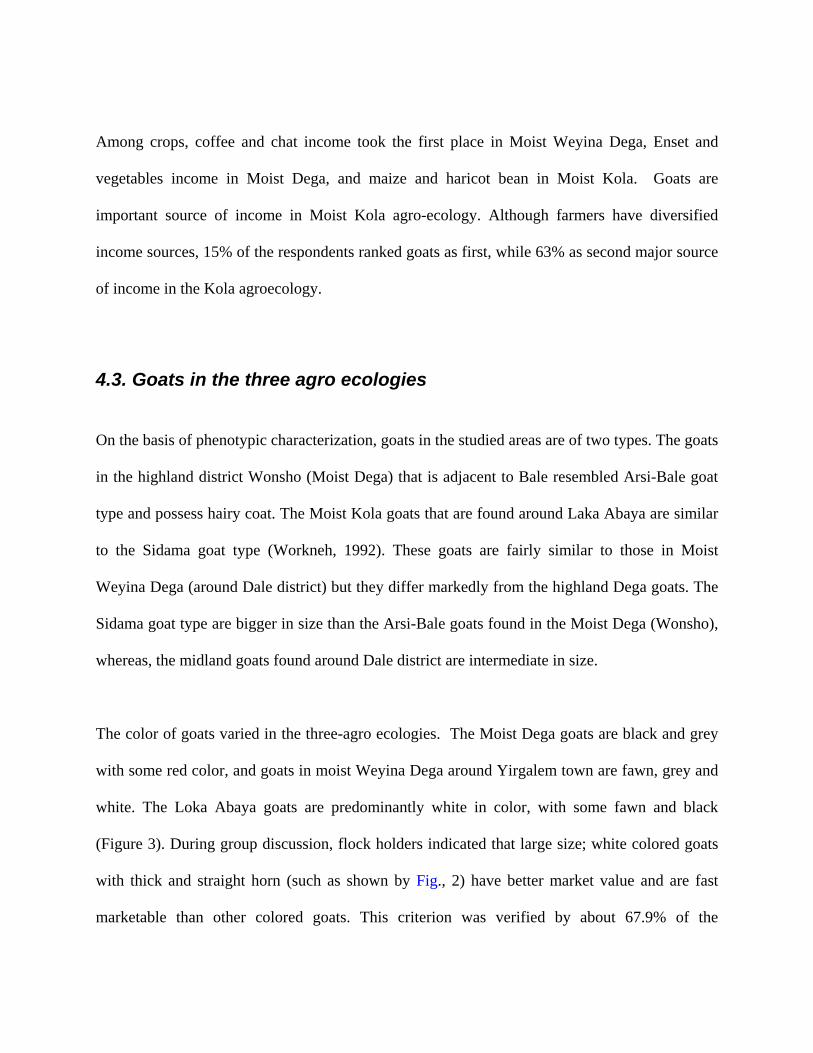
The color of goats varied in the three-agro ecologies. The Moist Dega goats are black and grey
with some red color, and goats in moist Weyina Dega around Yirgalem town are fawn, grey and
white. The Loka Abaya goats are predominantly white in color, with some fawn and black
(Figure 3). During group discussion, flock holders indicated that large size; white colored goats
with thick and straight horn (such as shown by Fig., 2) have better market value and are fast
marketable than other colored goats. This criterion was verified by about 67.9% of the
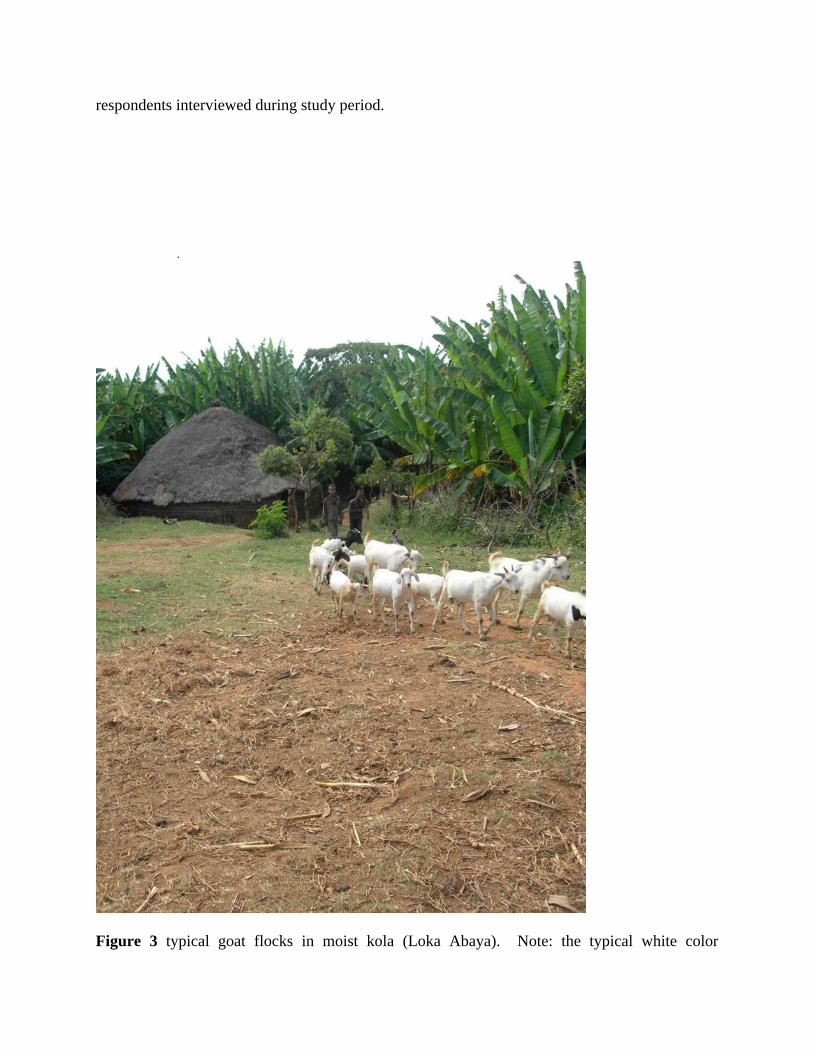
respondents interviewed during study period.
.
Figure 3 typical goat flocks in moist kola (Loka Abaya). Note: the typical white color

dominance and bucks with straight horn.
4.4. Flock size and structure
There is a wider range of variations in flock size. 12.5 ±2.186 Goats per household was
registered in Moist Kola, which is significantly higher (P<0.05 Annex table 5) than flock size in
Moist Dega (2.67±0 .361) and in Moist Weyina Dega (5.46± 0.549). The largest holding registered
in Moist Kola, Felka Kebele (31 goats) and the smallest holding (1) was recorded at the Moist
Weyina Dega and Dega (Bokasso and Bera Kebeles, respectively). The over all mean flock size
for all the study site was 5.98±0.547 (Table 4) of which 53.5% were does, 13.4% castrates, 13.8%
bucks, 10.6 doe kids, and 8.8% buck kids of less than six months of age.
The overall mean flock size is lower than previously average flock size (7±9) for densely
populated perennial crop cultivating farming systems in the highlands as well as in agro pastoral
societies in semi arid areas of Sidama, SNNPR (Farm Africa, 1996). It is higher than the average
flock size 4.7 and 13.6 goats per household reported for Karapokoto and Tchein agro-pastoral
tribe in Kenya and Chad, respectively (Ibrahim, 1998). Where as, it is lower than values reported
for most small stockholder farmers holding 1 to 40 goats per household in Kweneng district of
Botswana (Nsoso, 2004).
The breeding stock consists of 63.4% female (including all age from young kids up to old doe)
and 36.6% all age male flocks. This proportion is lower than the over all average of 75.8%
female reported by Workneh (1992, Nigatu et al., 2005). The proportion of male goat in the
presently investigated areas was low in the flock. Farmers in the studied area mainly retain
female goats in the flock for replacement purpose and remove male goats either by directly
selling them or castrating and feeding them prior to selling. The ratio of female to male is 4:1
and the proportion of does is smaller when compared to the previous findings of Workneh (1992)
who reported a doe to buck ratio of 11:1 and closer to (5:1) ratio of agro-pastoral society in
South Ethiopia, which was reported by Nigatu et al., (2005). The reason for the reduction of the
doe number was discussed with respective flock holders in each Keble. Accordingly, they said
that young farmers (children above 18) when separated from their parents they share livestock
mainly female goats to establish their own flock using female does as foundation stock. Hence
this may have caused a gradual fell in does per household. So this may have contributed to the
present low ratio of does to buck compared to values reported a decade and half ago by previous
workers (Workneh 1992).
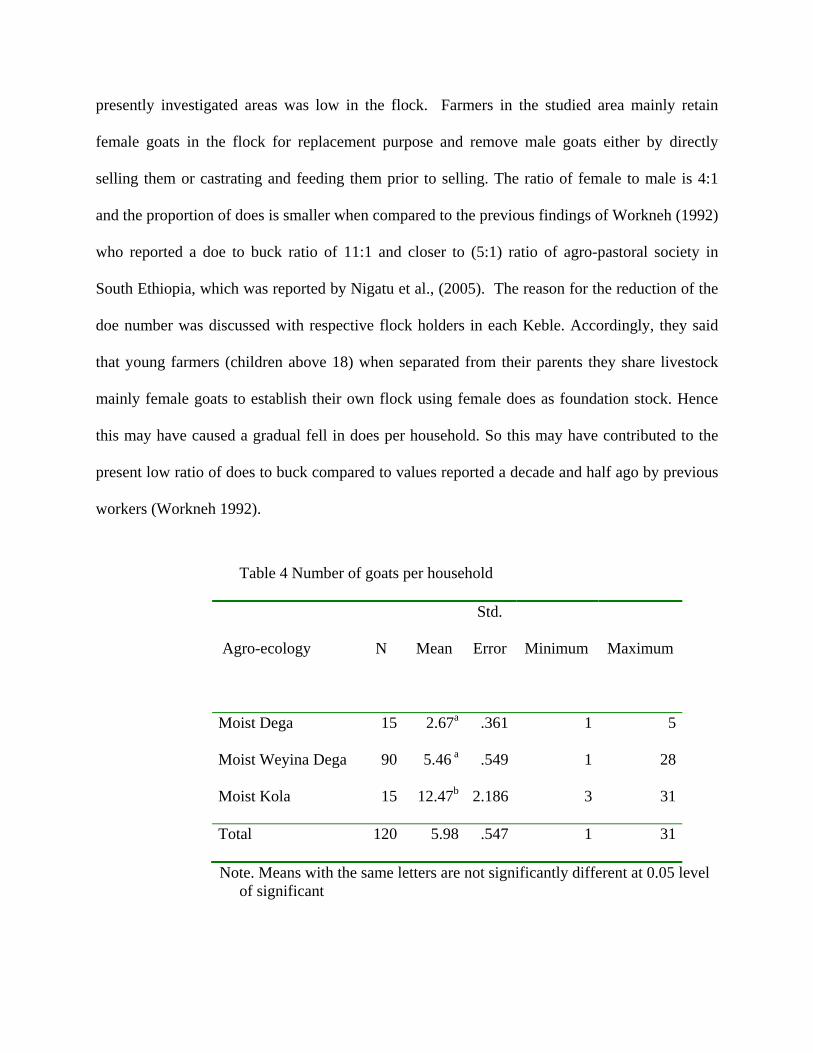
Table 4 Number of goats per household
Agro-ecology
N
Mean
Std.
Error
Minimum
Maximum
Moist Dega 15 2.67a .361 1 5
Moist Weyina Dega 90 5.46 a .549 1 28
Moist Kola 15 12.47b 2.186 3 31
Total 120 5.98 .547 1 31
Note. Means with the same letters are not significantly different at 0.05 level of significant
4.5. Reasons for keeping goats
Farmers keep goats for many reasons, the major reasons being that they are the source of food,
cash and a form of savings (Ibrahim, 1998). In Moist Kola (Loka Abaya), goats are mainly kept
as a means of savings i.e., farmers accumulate money as a hedge against emergency by keeping
large flock of goats; the second reason for keeping goats is sales to generate income (Table 5). In
addition to these two major reasons, farmers also viewed the uses of goats for milk production
(13.3%) meat (10%) or both (1.7%). On the other hand, only (1%) of respondents considered
goats as a sign of social status (prestige).
Besides these major reasons, in Moist Weyina Dega some respondents (2.5%) used goat’s
manure for fertilizer. Farmers with no cattle reared goats for the purpose of manure, because,
enset particularly at its early stage require high amount of manure. In this coffee and enset
growing midland, traditionally farmers decompose manure and kitchen wastes by depositing on
the back yards in the form of heap. After a long period of decomposition they used the compost
for back yard vegetables, enset and coffee as organic source of fertilizer. With this regard, goats
contribute manure for agricultural system, which is returned to the crop production system
(nutrient cycling) to benefit vegetable garden, food crop and cash crops enhances the
sustainability of the system (Ibrahim, 1998).
During group discussion, the community members strongly stressed on that goats can be easily
sold in the nearby markets whenever there is an urgent need for cash, hence they protect cattle
from being sold for minor problems. The reasons are similar with the result from traditional

small stock farmers survey by Nsoso (2004) in Botswana, who indicated that most farmers sell
their goats because of urgent cash needs. The present findings on the other hand, is different
from the results of a study on rural community farming system in South Africa which indicated
meat consumption as major reason for keeping goats (Braker et al., 2002).
In Moist Weyina Dega (near Yirgalem town Dale) and in Moist Dega (Wonsho) farmers use goat
milk and there were some farmers who had no other alternative source of milk for their children.
Furthermore, goats are slaughtered for home consumption occasionally, for example, when there
is birth in the family or when a respected guest visits the family. In contrast to the report of Farm
Africa, (1996) people in Sidama have no tradition or culture of slaughtering goats during
“Fitche” (The new year celebrated by Sidama people, based on cultural calendar of Sidama).
Table 5 Purposes of Keeping goats
Purposes Moist Dega Moist Weyina Dega Moist Kola Total
Savings 6.7 46.7 61.6 38.3
Sales 32.6 26.7 28.8 29.17
Milk 20.6 10 0.83 13.3
Meat 26.6 10 0.83 11.6
Milk & meat 6.7 4.4 0 4.8
Manure 6.7 2.27 0 2.5
Prestige 0 0 8 0.8
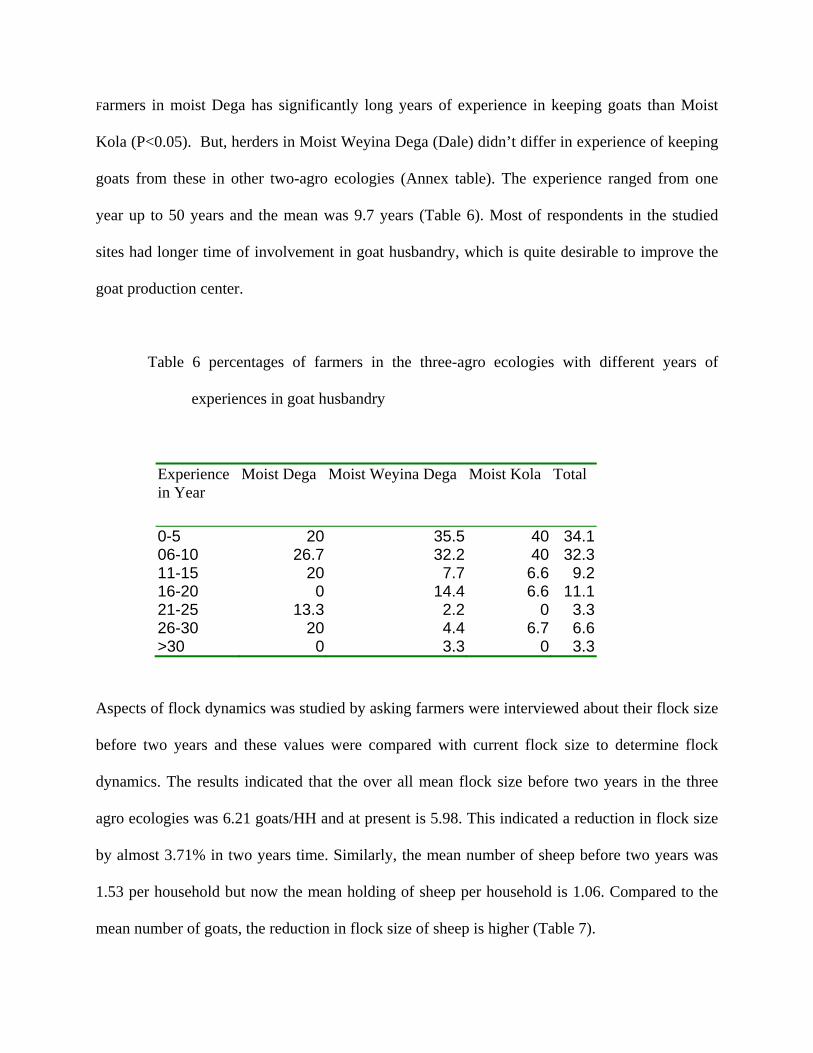
Farmers in moist Dega has significantly long years of experience in keeping goats than Moist
Kola (P<0.05). But, herders in Moist Weyina Dega (Dale) didn’t differ in experience of keeping
goats from these in other two-agro ecologies (Annex table). The experience ranged from one
year up to 50 years and the mean was 9.7 years (Table 6). Most of respondents in the studied
sites had longer time of involvement in goat husbandry, which is quite desirable to improve the
goat production center.
Table 6 percentages of farmers in the three-agro ecologies with different years of
experiences in goat husbandry
Experience in Year
Moist Dega Moist Weyina Dega Moist Kola Total
0-5 20 35.5 40 34.1 06-10 26.7 32.2 40 32.3 11-15 20 7.7 6.6 9.2 16-20 0 14.4 6.6 11.1 21-25 13.3 2.2 0 3.3 26-30 20 4.4 6.7 6.6 >30 0 3.3 0 3.3
Aspects of flock dynamics was studied by asking farmers were interviewed about their flock size
before two years and these values were compared with current flock size to determine flock
dynamics. The results indicated that the over all mean flock size before two years in the three
agro ecologies was 6.21 goats/HH and at present is 5.98. This indicated a reduction in flock size
by almost 3.71% in two years time. Similarly, the mean number of sheep before two years was
1.53 per household but now the mean holding of sheep per household is 1.06. Compared to the
mean number of goats, the reduction in flock size of sheep is higher (Table 7).

Although goat flock size reduced when considering the overall mean, but this is not the picture
when considering by agro ecology: For example, flock size did show increase in Kola, and even
the reduction is not the same in Dega and Weyina Dega. Although the overall mean flock size of
goats reduced at present when compared with what it used to be two years ago, flock dynamics
differed in the three agro ecologies. For example, in Moist Dega, mean goat number per
household reduced from 4.93 to 2.67, which is a 45% reduction in two years time (Table 7). But
the reduction in Moist Weyina Dega was only 12%. Contrary to these two agro ecologies, goat
flock size has showed increase by 63% in Moist Kola (Table7)
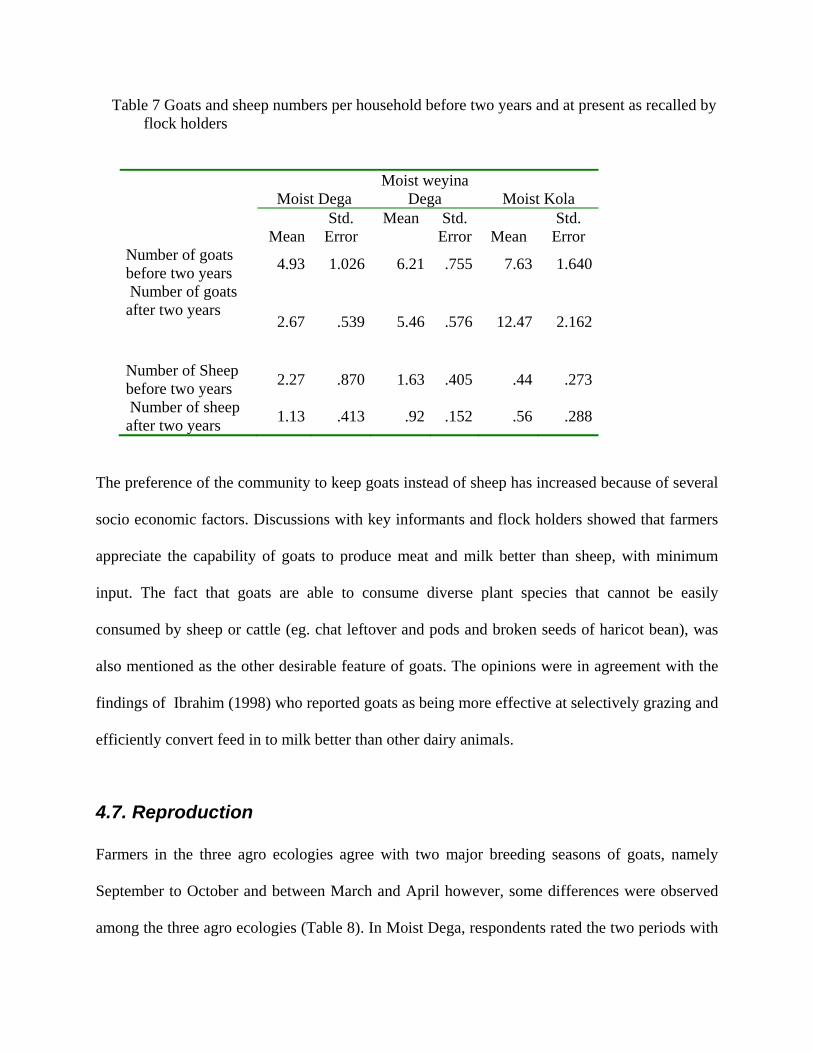
Table 7 Goats and sheep numbers per household before two years and at present as recalled by flock holders
Moist Dega Moist weyina
Dega Moist Kola
Mean Std.
Error Mean Std.
Error Mean Std.
Error Number of goats before two years 4.93 1.026 6.21 .755 7.63 1.640
Number of goats after two years
2.67 .539 5.46 .576 12.47 2.162
Number of Sheep before two years 2.27 .870 1.63 .405 .44 .273
Number of sheep after two years 1.13 .413 .92 .152 .56 .288
The preference of the community to keep goats instead of sheep has increased because of several
socio economic factors. Discussions with key informants and flock holders showed that farmers
appreciate the capability of goats to produce meat and milk better than sheep, with minimum
input. The fact that goats are able to consume diverse plant species that cannot be easily
consumed by sheep or cattle (eg. chat leftover and pods and broken seeds of haricot bean), was
also mentioned as the other desirable feature of goats. The opinions were in agreement with the
findings of Ibrahim (1998) who reported goats as being more effective at selectively grazing and
efficiently convert feed in to milk better than other dairy animals.
4.7. Reproduction Farmers in the three agro ecologies agree with two major breeding seasons of goats, namely
September to October and between March and April however, some differences were observed
among the three agro ecologies (Table 8). In Moist Dega, respondents rated the two periods with

almost equal proportion (53.3% to 46.7%, respectively). And the latter is similar with the report
of Behailu and Samuel (2003) that reported breeding season for goats in Boricha (Sidama) and
Arsi districts, mainly at the beginning of the small rainy season (Belg) that favors the vegetative
growth and production of browse trees and shrubs
Likewise, about half the respondents in Weyina Dega and Kola agree that September and
October are periods of high births. On the other hand, the proportion of respondents in these two
agro-ecologies who rated March and April as peak birth time were lower compared to these in
Dega. i. e. about 1 in 3 in Weyina Dega and 1 in 4 in Kola. Rather, some respondents in weyina
Dega (12%) and proportionately considerable number in Kola (20%) said their goats breed
throughout the year. This indicated that goats in Kola are more efficient in their reproduction
followed by these in Weyina Dega than in Dega.
.
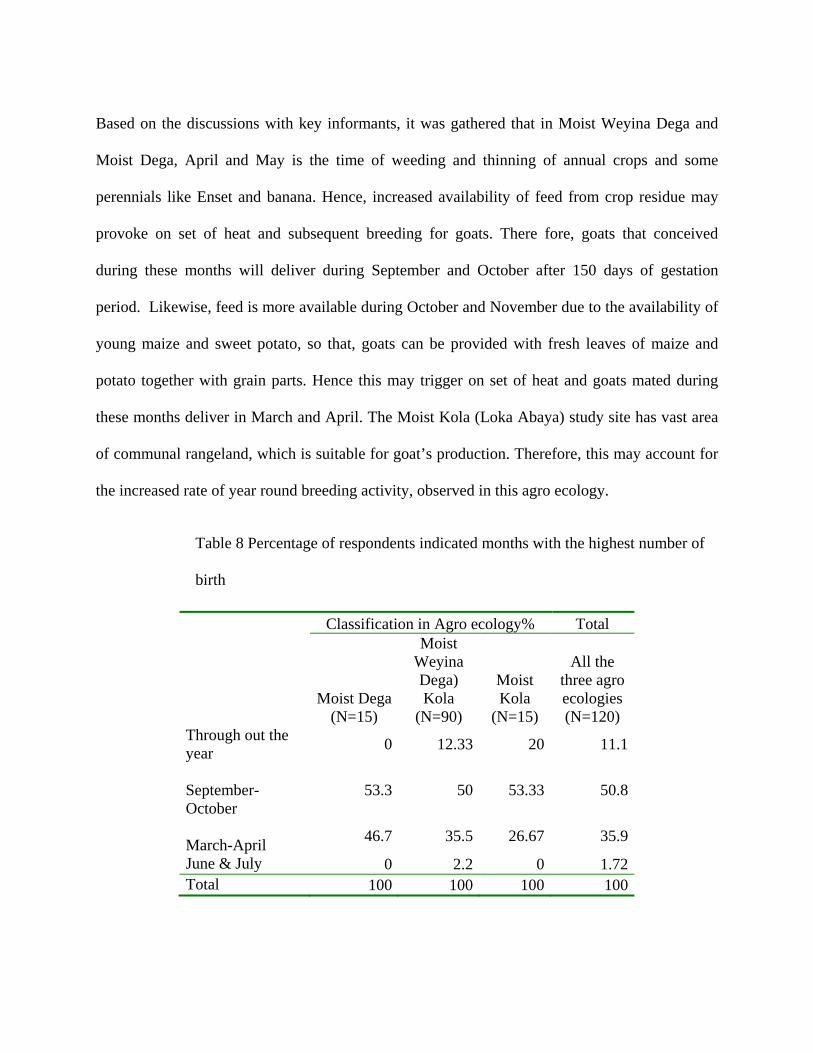
Based on the discussions with key informants, it was gathered that in Moist Weyina Dega and
Moist Dega, April and May is the time of weeding and thinning of annual crops and some
perennials like Enset and banana. Hence, increased availability of feed from crop residue may
provoke on set of heat and subsequent breeding for goats. There fore, goats that conceived
during these months will deliver during September and October after 150 days of gestation
period. Likewise, feed is more available during October and November due to the availability of
young maize and sweet potato, so that, goats can be provided with fresh leaves of maize and
potato together with grain parts. Hence this may trigger on set of heat and goats mated during
these months deliver in March and April. The Moist Kola (Loka Abaya) study site has vast area
of communal rangeland, which is suitable for goat’s production. Therefore, this may account for
the increased rate of year round breeding activity, observed in this agro ecology.
Table 8 Percentage of respondents indicated months with the highest number of
birth
Classification in Agro ecology% Total
Moist Dega (N=15)
Moist Weyina Dega) Kola
(N=90)
Moist Kola
(N=15)
All the three agro ecologies (N=120)
Through out the year 0 12.33 20 11.1
September-October
53.3 50 53.33 50.8
March-April 46.7 35.5 26.67 35.9
June & July 0 2.2 0 1.72 Total 100 100 100 100
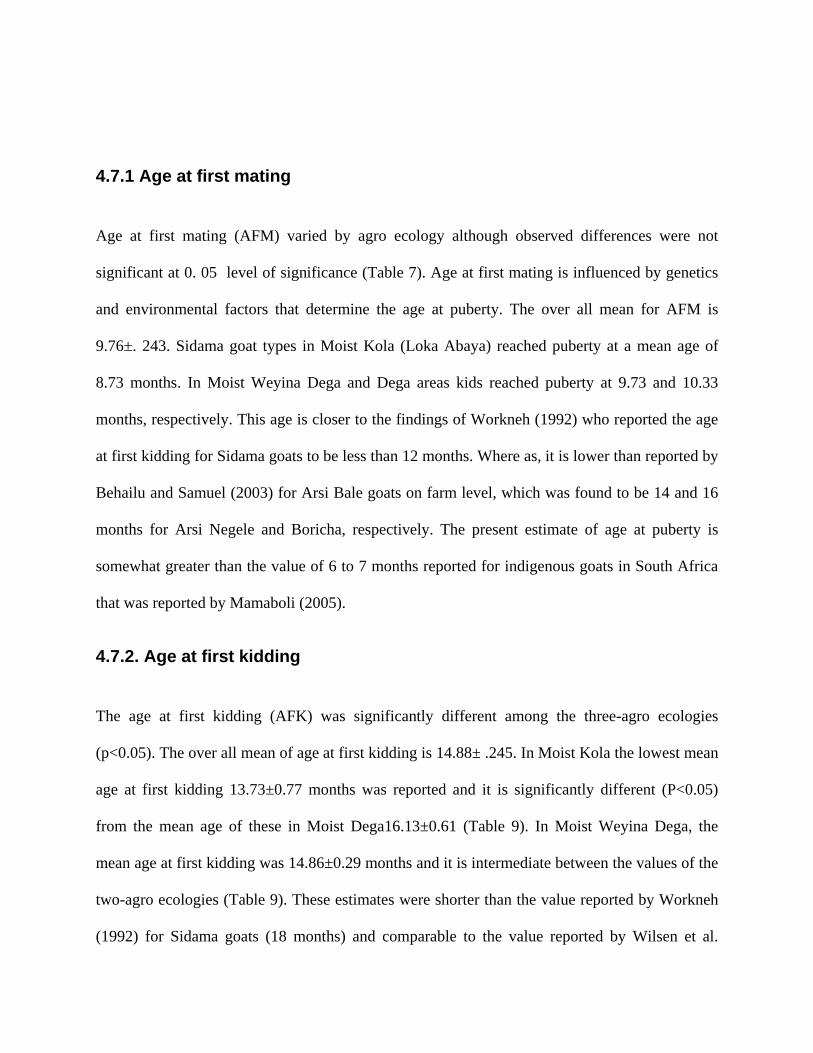
4.7.1 Age at first mating Age at first mating (AFM) varied by agro ecology although observed differences were not
significant at 0. 05 level of significance (Table 7). Age at first mating is influenced by genetics
and environmental factors that determine the age at puberty. The over all mean for AFM is
9.76±. 243. Sidama goat types in Moist Kola (Loka Abaya) reached puberty at a mean age of
8.73 months. In Moist Weyina Dega and Dega areas kids reached puberty at 9.73 and 10.33
months, respectively. This age is closer to the findings of Workneh (1992) who reported the age
at first kidding for Sidama goats to be less than 12 months. Where as, it is lower than reported by
Behailu and Samuel (2003) for Arsi Bale goats on farm level, which was found to be 14 and 16
months for Arsi Negele and Boricha, respectively. The present estimate of age at puberty is
somewhat greater than the value of 6 to 7 months reported for indigenous goats in South Africa
that was reported by Mamaboli (2005).
4.7.2. Age at first kidding
The age at first kidding (AFK) was significantly different among the three-agro ecologies
(p<0.05). The over all mean of age at first kidding is 14.88± .245. In Moist Kola the lowest mean
age at first kidding 13.73±0.77 months was reported and it is significantly different (P<0.05)
from the mean age of these in Moist Dega16.13±0.61 (Table 9). In Moist Weyina Dega, the
mean age at first kidding was 14.86±0.29 months and it is intermediate between the values of the
two-agro ecologies (Table 9). These estimates were shorter than the value reported by Workneh
(1992) for Sidama goats (18 months) and comparable to the value reported by Wilsen et al.

(1989) for Togo, Sahil and Maradi goats, which was 15, 13 and 14 months, respectively.
4.7.3. Kidding interval
The interval between two parturitions is the kidding interval. Kidding interval generally declines
with age suggesting the younger kids take longer to regain body condition after kidding. The
over all mean of kidding interval (AKI) for the three agro ecologies is 257±0.16 days. The mean
kidding interval for Loka Abaya Sidama type goats in Moist Kola was 7.27± 0 .267months,
which was significantly lower (P<0.05) than the value of the other two agro ecologies(Table 9).
The value in Moist Weyina Dega was 8.56±0.18 months, which was again significantly shorter
than the value of Moist Dega (10±0.352 months. The value for the Loka Abaya is comparable
with mean values reported for Arsi Bale goats , 8.7 months (Tatek, 2004) but comparable with
that of Arsi Bale goat type in adjacent district, Boricha, (339 days) Behailu and Samuel, (2003).
Also, comparable with Mootse goats in South Africa, (8.4) months and west African Dwarf
Goats (8.3 months) in Southern Nigeria (Ikwuegbu et al., 1996). On the other hand, the mean
kidding interval of goats in Moist Weyina Dega around Dale District and those of Moist Dega
(Wonsho study sites) are quite high compared to the above-mentioned literatures values.
Key informants indicated that the variation in kidding interval is largely associated with variation
in management system. For instance, goats provided with free ranging extensive system at Moist
Kola (Loka Abaya), have shorter kidding interval. For example, at Felka (one of the study site at
Loka Abaya), there is vast rangeland with diverse browse species where goats free forage. Here,
individual flock holding is large and the number of bucks left in the flock is large (about 4:1
ratio) This may have contributed to the observed shorter kidding interval of goats in this area

(Moist Kola) as compared to the other sites. The other reason that contributes for the shorter
kidding interval in Kola agro ecology may be the availability of divert browse species which
provide opportunities for the goats better selection and there by optimize their nutrient intake.
According to Alemayehu (2003), browse trees or shrubs are important animal feed in Ethiopia;
they provide protein, vitamins and mineral elements, which are lacking in grassland pastures.
4.7.4. Weaning age
Weaning age (WA) varied among the three-agro ecologies. It is mainly dependent on genetics
and environmental factors. The over all mean of age at weaning is 5.19±0.124 months. In Moist
Kola (Loka Abaya) goats reached weaning age at 4.3±0.316 months, which was significantly
lower (P<0.05) than those in Moist Dega agro-ecology. Feed is more available in Kola (Loka
Abaya) area as discussed earlier and farmers do not use goat milk and it is completely left for
kids to suckle. Because of better feeding, does become in heat within shorter time after kidding
once pregnant owners forcefully wean kids in order to give sufficient time for the pregnant doe
to improve its condition for the subsequent birth. Goats in Moist Weyina Dega had significantly
lower weaning age 5.09±0.129 months (p<0.05) than these of Moist Dega but no significant
difference was observed with Moist Kola (Table 9).
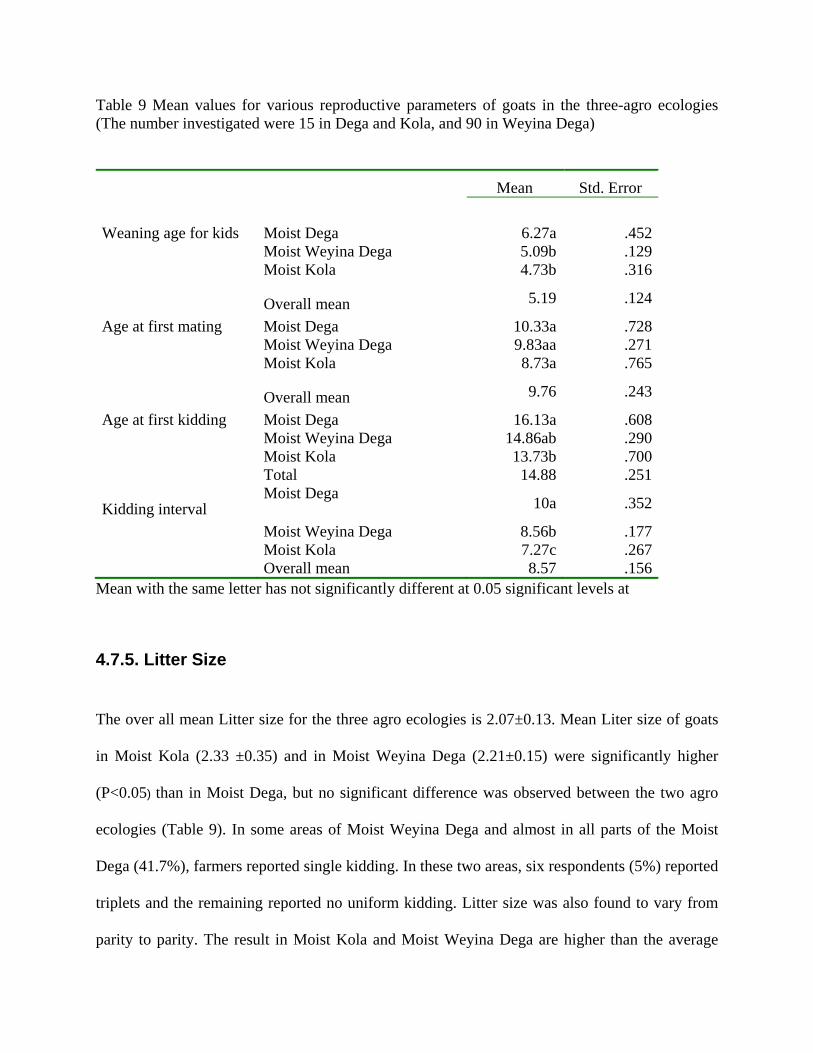
Table 9 Mean values for various reproductive parameters of goats in the three-agro ecologies (The number investigated were 15 in Dega and Kola, and 90 in Weyina Dega)
Mean Std. Error
Weaning age for kids Moist Dega 6.27a .452 Moist Weyina Dega 5.09b .129 Moist Kola 4.73b .316
Overall mean 5.19 .124
Age at first mating Moist Dega 10.33a .728 Moist Weyina Dega 9.83aa .271 Moist Kola 8.73a .765
Overall mean 9.76 .243
Age at first kidding Moist Dega 16.13a .608 Moist Weyina Dega 14.86ab .290 Moist Kola 13.73b .700 Total 14.88 .251
Kidding interval Moist Dega 10a .352
Moist Weyina Dega 8.56b .177 Moist Kola 7.27c .267 Overall mean 8.57 .156
Mean with the same letter has not significantly different at 0.05 significant levels at
4.7.5. Litter Size
The over all mean Litter size for the three agro ecologies is 2.07±0.13. Mean Liter size of goats
in Moist Kola (2.33 ±0.35) and in Moist Weyina Dega (2.21±0.15) were significantly higher
(P<0.05) than in Moist Dega, but no significant difference was observed between the two agro
ecologies (Table 9). In some areas of Moist Weyina Dega and almost in all parts of the Moist
Dega (41.7%), farmers reported single kidding. In these two areas, six respondents (5%) reported
triplets and the remaining reported no uniform kidding. Litter size was also found to vary from
parity to parity. The result in Moist Kola and Moist Weyina Dega are higher than the average
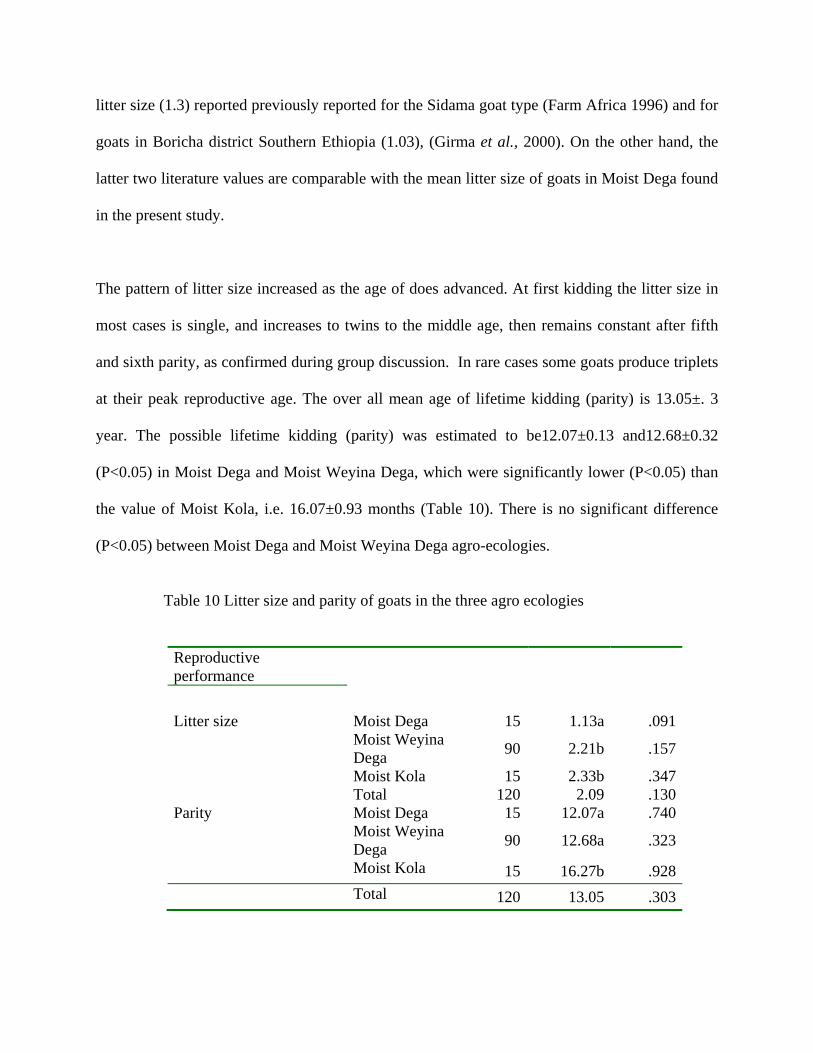
litter size (1.3) reported previously reported for the Sidama goat type (Farm Africa 1996) and for
goats in Boricha district Southern Ethiopia (1.03), (Girma et al., 2000). On the other hand, the
latter two literature values are comparable with the mean litter size of goats in Moist Dega found
in the present study.
The pattern of litter size increased as the age of does advanced. At first kidding the litter size in
most cases is single, and increases to twins to the middle age, then remains constant after fifth
and sixth parity, as confirmed during group discussion. In rare cases some goats produce triplets
at their peak reproductive age. The over all mean age of lifetime kidding (parity) is 13.05±. 3
year. The possible lifetime kidding (parity) was estimated to be12.07±0.13 and12.68±0.32
(P<0.05) in Moist Dega and Moist Weyina Dega, which were significantly lower (P<0.05) than
the value of Moist Kola, i.e. 16.07±0.93 months (Table 10). There is no significant difference
(P<0.05) between Moist Dega and Moist Weyina Dega agro-ecologies.
Table 10 Litter size and parity of goats in the three agro ecologies
Reproductive performance
Litter size Moist Dega 15 1.13a .091 Moist Weyina
Dega 90 2.21b .157
Moist Kola 15 2.33b .347 Total 120 2.09 .130Parity Moist Dega 15 12.07a .740 Moist Weyina
Dega 90 12.68a .323
Moist Kola 15 16.27b .928 Total 120 13.05 .303
4.7.6.Culling
Culling is a common practice in all the three-agro ecologies. Forty nine respondents (40.8%)
culled their goats due to poor body condition, 40 respondents (33.3%) reported poor production
as the main cause of culling, and 24 respondents (20%) reported older age and the rest 5.9 %
indicated the combination of health, reproduction color and bad animal characteristics as the
major factors for culling goats from the flock. This being the overall situations, differences were
noted among the studied agro-ecologies, which respect to reasons for culling. In Moist Dega and
Weyina Dega, the three factors, namely poor body condition, poor productivity and older age
were the main reasons for culling goats (Figure 4). On the other hand, in Moist Kola, poor
production was the single most important reason for culling as indicated by more than 70% of
respondents (Figure 3)
Figure 4 Percentage of respondents who suggested different reasons for culling goats in the three-agro ecologies
01020304050607080
Moist Dega
Moist Weyina Dega
Moist Kola Over all
Perc
enta
ge
Agro ecology
Poor body condition
Poor productivity
Older age
Temperament
Health
Color
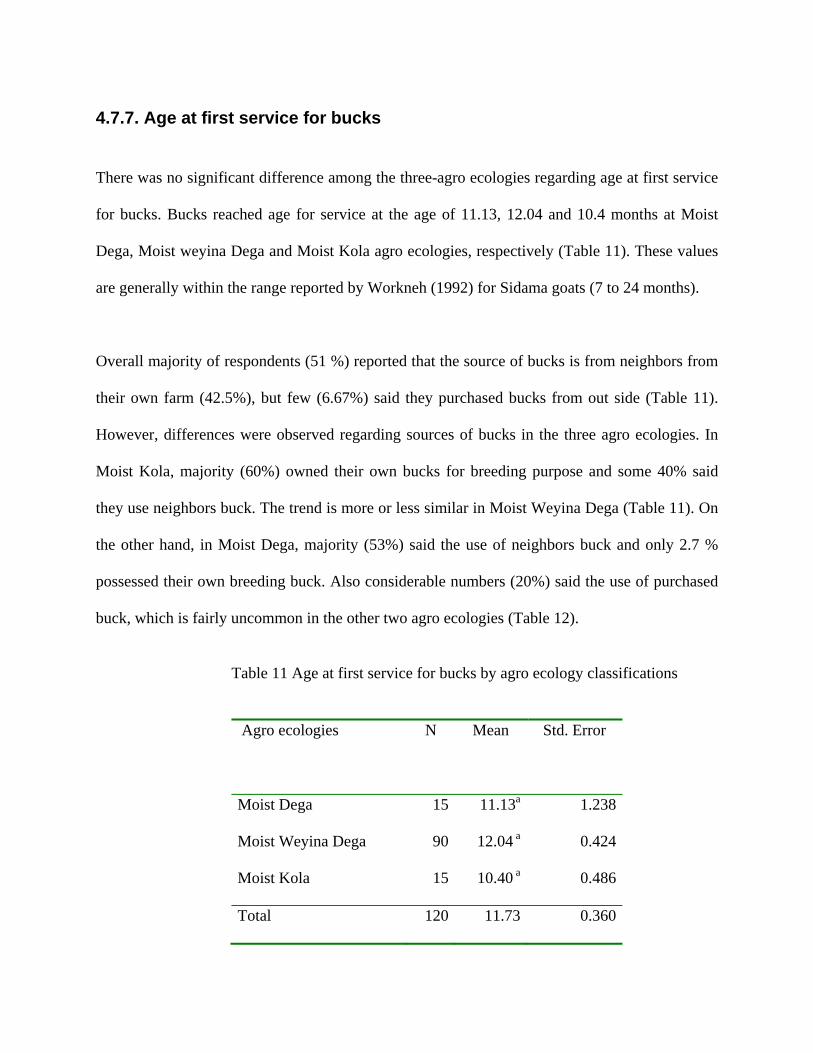
4.7.7. Age at first service for bucks
There was no significant difference among the three-agro ecologies regarding age at first service
for bucks. Bucks reached age for service at the age of 11.13, 12.04 and 10.4 months at Moist
Dega, Moist weyina Dega and Moist Kola agro ecologies, respectively (Table 11). These values
are generally within the range reported by Workneh (1992) for Sidama goats (7 to 24 months).
Overall majority of respondents (51 %) reported that the source of bucks is from neighbors from
their own farm (42.5%), but few (6.67%) said they purchased bucks from out side (Table 11).
However, differences were observed regarding sources of bucks in the three agro ecologies. In
Moist Kola, majority (60%) owned their own bucks for breeding purpose and some 40% said
they use neighbors buck. The trend is more or less similar in Moist Weyina Dega (Table 11). On
the other hand, in Moist Dega, majority (53%) said the use of neighbors buck and only 2.7 %
possessed their own breeding buck. Also considerable numbers (20%) said the use of purchased
buck, which is fairly uncommon in the other two agro ecologies (Table 12).
Table 11 Age at first service for bucks by agro ecology classifications Agro ecologies
N
Mean
Std. Error
Moist Dega 15 11.13a 1.238
Moist Weyina Dega 90 12.04 a 0.424
Moist Kola 15 10.40 a 0.486
Total 120 11.73 0.360

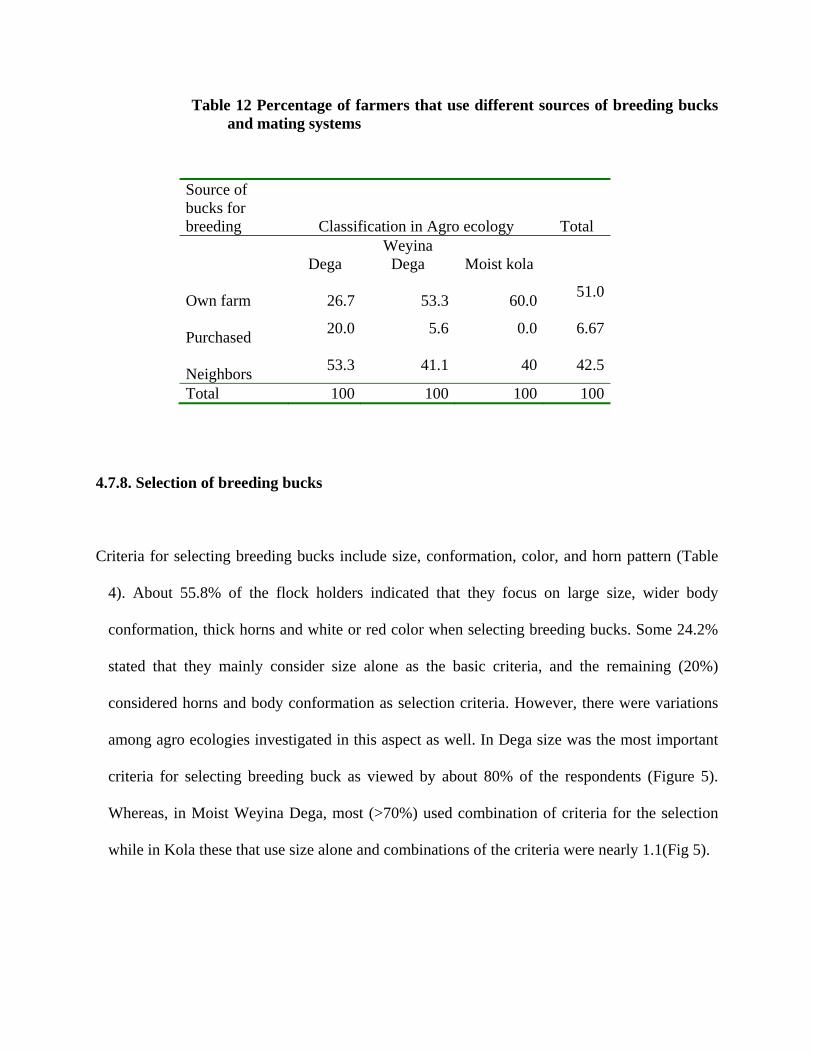
Table 12 Percentage of farmers that use different sources of breeding bucks and mating systems
Source of bucks for breeding Classification in Agro ecology Total
Dega Weyina Dega Moist kola
Own farm 26.7 53.3 60.0 51.0
Purchased 20.0 5.6 0.0 6.67
Neighbors 53.3 41.1 40 42.5
Total 100 100 100 100
4.7.8. Selection of breeding bucks
Criteria for selecting breeding bucks include size, conformation, color, and horn pattern (Table
4). About 55.8% of the flock holders indicated that they focus on large size, wider body
conformation, thick horns and white or red color when selecting breeding bucks. Some 24.2%
stated that they mainly consider size alone as the basic criteria, and the remaining (20%)
considered horns and body conformation as selection criteria. However, there were variations
among agro ecologies investigated in this aspect as well. In Dega size was the most important
criteria for selecting breeding buck as viewed by about 80% of the respondents (Figure 5).
Whereas, in Moist Weyina Dega, most (>70%) used combination of criteria for the selection
while in Kola these that use size alone and combinations of the criteria were nearly 1.1(Fig 5).

Figure 5 Criteria for selecting bucks Controlled mating is usually practiced at Moist Weyina Dega (Dale) and Dega (Wonsho)
because, tethering is commonly used system of management in these agro ecologies and goats
fed by cut and carry system. Therefore, goats are not allowed to free foraging, the owners follow
the heat period of the doe and allocate bucks for mating. Thus, in these two agro ecologies,
farmers have better control over breeding activities and have better opportunities for selecting
breeding bucks. Uncontrolled or open mating is common in Moist Kola free ranging goats. No
restriction to browse and tethering is unusual; goats can mate with known or unknown bucks on
the field during browsing. This type of management is extensive and doesn’t give chance to
select productive flock and it may expose to goats that have inferior production.
0102030405060708090
Dega Weyina Dega
Kola
size
Horn color and body conformatio
Size, horn color and body conformation
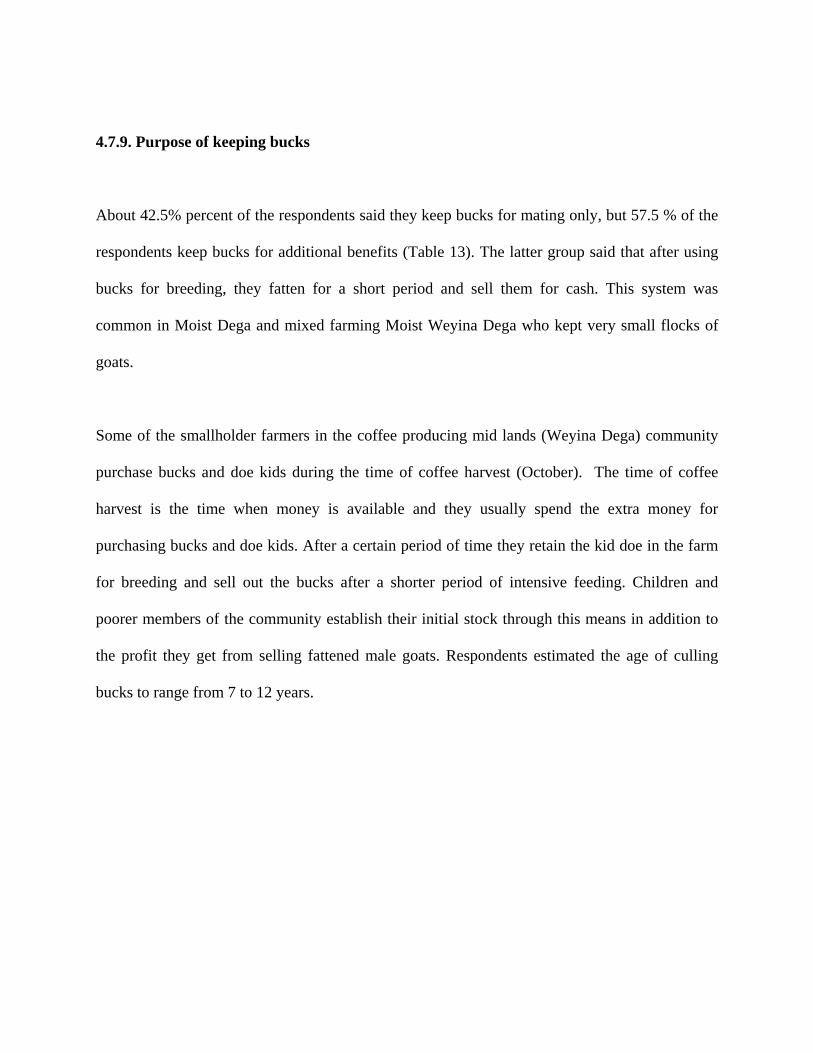
4.7.9. Purpose of keeping bucks
About 42.5% percent of the respondents said they keep bucks for mating only, but 57.5 % of the
respondents keep bucks for additional benefits (Table 13). The latter group said that after using
bucks for breeding, they fatten for a short period and sell them for cash. This system was
common in Moist Dega and mixed farming Moist Weyina Dega who kept very small flocks of
goats.
Some of the smallholder farmers in the coffee producing mid lands (Weyina Dega) community
purchase bucks and doe kids during the time of coffee harvest (October). The time of coffee
harvest is the time when money is available and they usually spend the extra money for
purchasing bucks and doe kids. After a certain period of time they retain the kid doe in the farm
for breeding and sell out the bucks after a shorter period of intensive feeding. Children and
poorer members of the community establish their initial stock through this means in addition to
the profit they get from selling fattened male goats. Respondents estimated the age of culling
bucks to range from 7 to 12 years.

Table 13. Reason for keeping bucks in the three agro ecologies
Reason
Classification in Agro ecology
Moist Dega, %
Moist Weyina Dega, %
Moist Kola,
% For mating 20.0 60.0 42.8 51.0
Socio cultural reasons
6.67 4.28 0.0 5.0
Both for mating and socio cultural reasons
73.3 35.7 57.2 44.0
Total 100 100 100 100
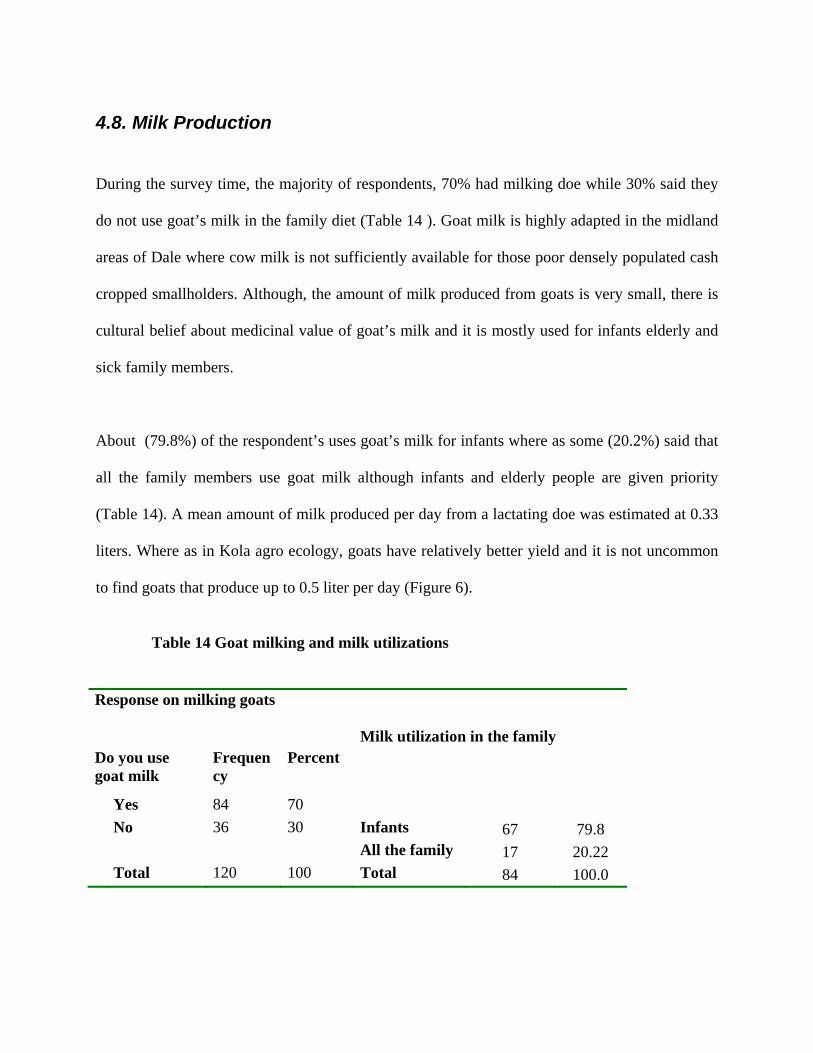
4.8. Milk Production
During the survey time, the majority of respondents, 70% had milking doe while 30% said they
do not use goat’s milk in the family diet (Table 14 ). Goat milk is highly adapted in the midland
areas of Dale where cow milk is not sufficiently available for those poor densely populated cash
cropped smallholders. Although, the amount of milk produced from goats is very small, there is
cultural belief about medicinal value of goat’s milk and it is mostly used for infants elderly and
sick family members.
About (79.8%) of the respondent’s uses goat’s milk for infants where as some (20.2%) said that
all the family members use goat milk although infants and elderly people are given priority
(Table 14). A mean amount of milk produced per day from a lactating doe was estimated at 0.33
liters. Where as in Kola agro ecology, goats have relatively better yield and it is not uncommon
to find goats that produce up to 0.5 liter per day (Figure 6).
Table 14 Goat milking and milk utilizations Response on milking goats
Milk utilization in the family
Do you use goat milk
Frequency
Percent
Yes 84 70 No 36 30 Infants 67 79.8 All the family 17 20.22 Total 120 100 Total 84 100.0

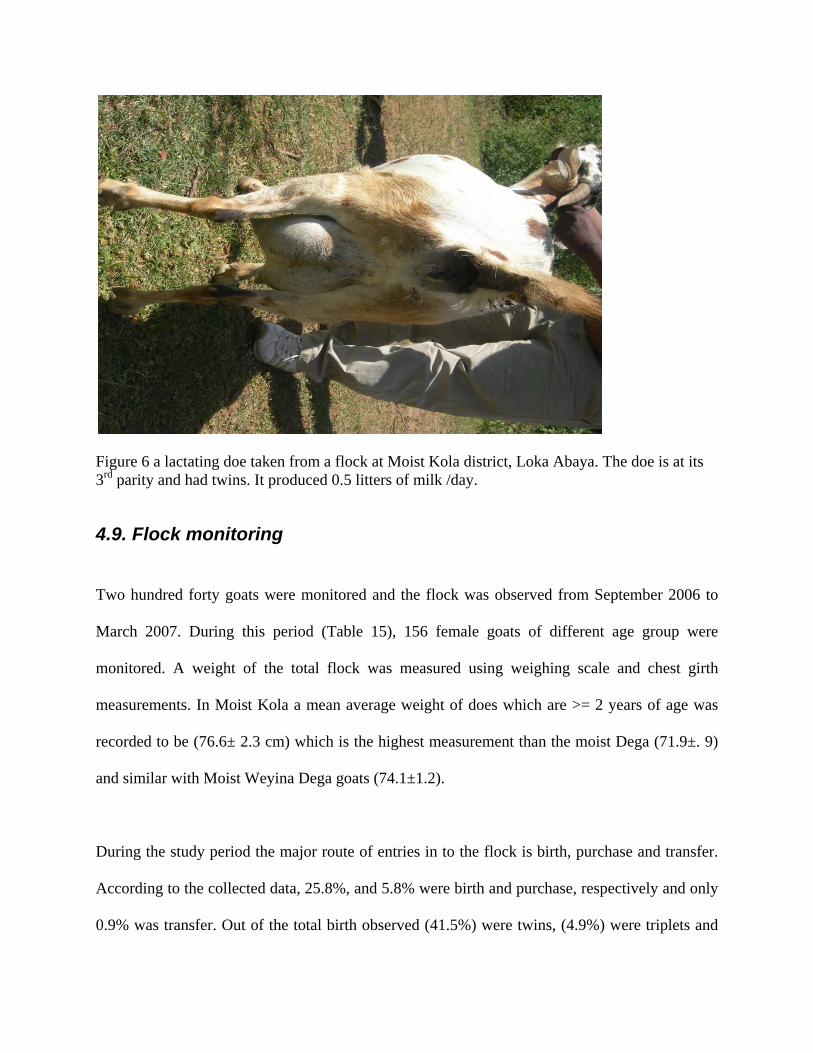
Figure 6 a lactating doe taken from a flock at Moist Kola district, Loka Abaya. The doe is at its 3rd parity and had twins. It produced 0.5 litters of milk /day.
4.9. Flock monitoring
Two hundred forty goats were monitored and the flock was observed from September 2006 to
March 2007. During this period (Table 15), 156 female goats of different age group were
monitored. A weight of the total flock was measured using weighing scale and chest girth
measurements. In Moist Kola a mean average weight of does which are >= 2 years of age was
recorded to be (76.6± 2.3 cm) which is the highest measurement than the moist Dega (71.9±. 9)
and similar with Moist Weyina Dega goats (74.1±1.2).
During the study period the major route of entries in to the flock is birth, purchase and transfer.
According to the collected data, 25.8%, and 5.8% were birth and purchase, respectively and only
0.9% was transfer. Out of the total birth observed (41.5%) were twins, (4.9%) were triplets and

(53.6%) were single birth were observed.
Mean kid weight at birth is significantly different among the three-agro ecologies (P<0.05)
(Table 14). The highest birth weight was recorded in Moist Kola (2.9 Kg) and it is significantly
higher (P<0.05) than the other two-agro ecologies. The lowest weight was observed in Moist
Dega (2.2Kg) and Moist Weyina Dega has an intermediate birth weight (2.5 Kg). The practice of
weaning kids from their does differ according to the system of management in the three agro
ecologies. The weaning weight for all the three agro ecologies was recorded after 120 days of
birth. So the mean weaning weight at specified period in Moist Kola was (11.5±0.53 Kg), which
is significantly higher (P<0.05) than Moist Weyina Dega (9.2±0.26) and Moist Dega (8.25±0.
35) (Annex Table 7). It is different from that of the interviewed results, because weaning age is
different in all agro ecologies and mainly determined by the herders’ management system. But,
for the purpose of our study all kids after specified period (120 days) were recorded in all agro
ecologies in order to identify the weaning weight.
The variation in weaning weight is due to the experience of farmers in using goat milk for
household consumption. In moist Kola herders completely allow kids to suckle their does, where
as in moist Dega farmers milk their goats and partial allow kids to suckle. But, in Moist Weyina
Dega, although the farmers used the milk for home consumption, they provide supplementary
feed for goats and their suckling kids prior to milking time.
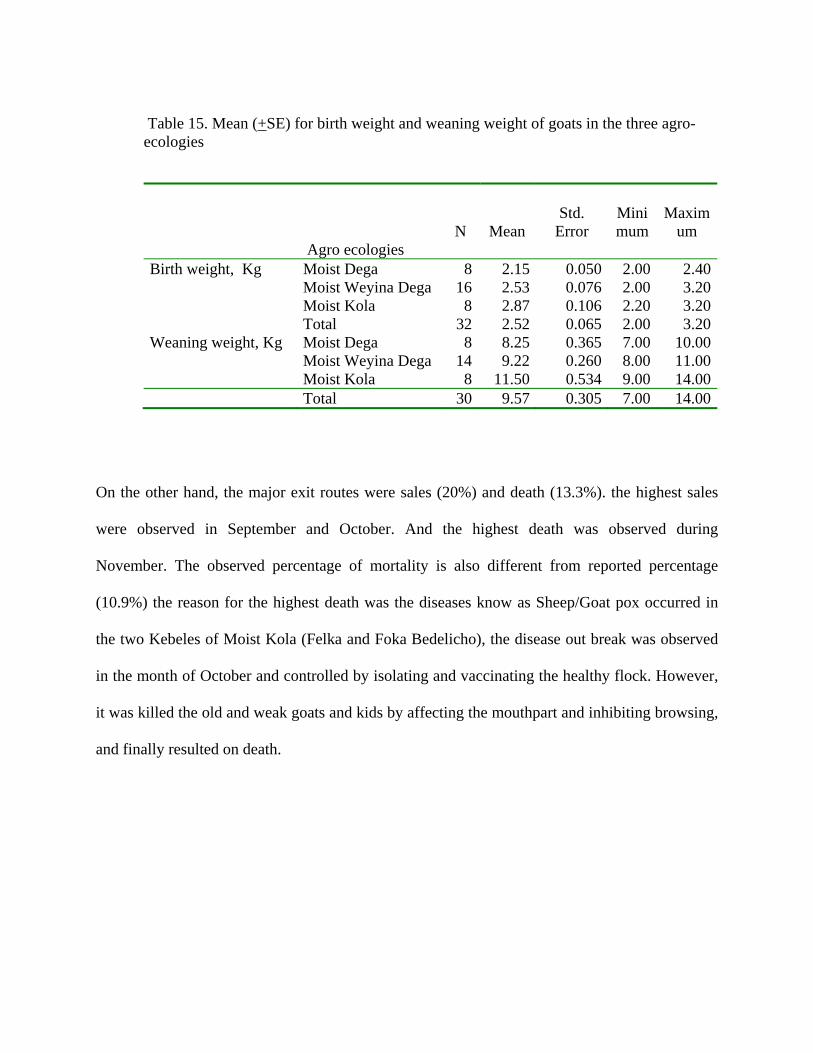
Table 15. Mean (+SE) for birth weight and weaning weight of goats in the three agro-ecologies
Agro ecologies
N
Mean
Std. Error
Minimum
Maximum
Birth weight, Kg Moist Dega 8 2.15 0.050 2.00 2.40 Moist Weyina Dega 16 2.53 0.076 2.00 3.20 Moist Kola 8 2.87 0.106 2.20 3.20 Total 32 2.52 0.065 2.00 3.20Weaning weight, Kg Moist Dega 8 8.25 0.365 7.00 10.00 Moist Weyina Dega 14 9.22 0.260 8.00 11.00 Moist Kola 8 11.50 0.534 9.00 14.00 Total 30 9.57 0.305 7.00 14.00
On the other hand, the major exit routes were sales (20%) and death (13.3%). the highest sales
were observed in September and October. And the highest death was observed during
November. The observed percentage of mortality is also different from reported percentage
(10.9%) the reason for the highest death was the diseases know as Sheep/Goat pox occurred in
the two Kebeles of Moist Kola (Felka and Foka Bedelicho), the disease out break was observed
in the month of October and controlled by isolating and vaccinating the healthy flock. However,
it was killed the old and weak goats and kids by affecting the mouthpart and inhibiting browsing,
and finally resulted on death.
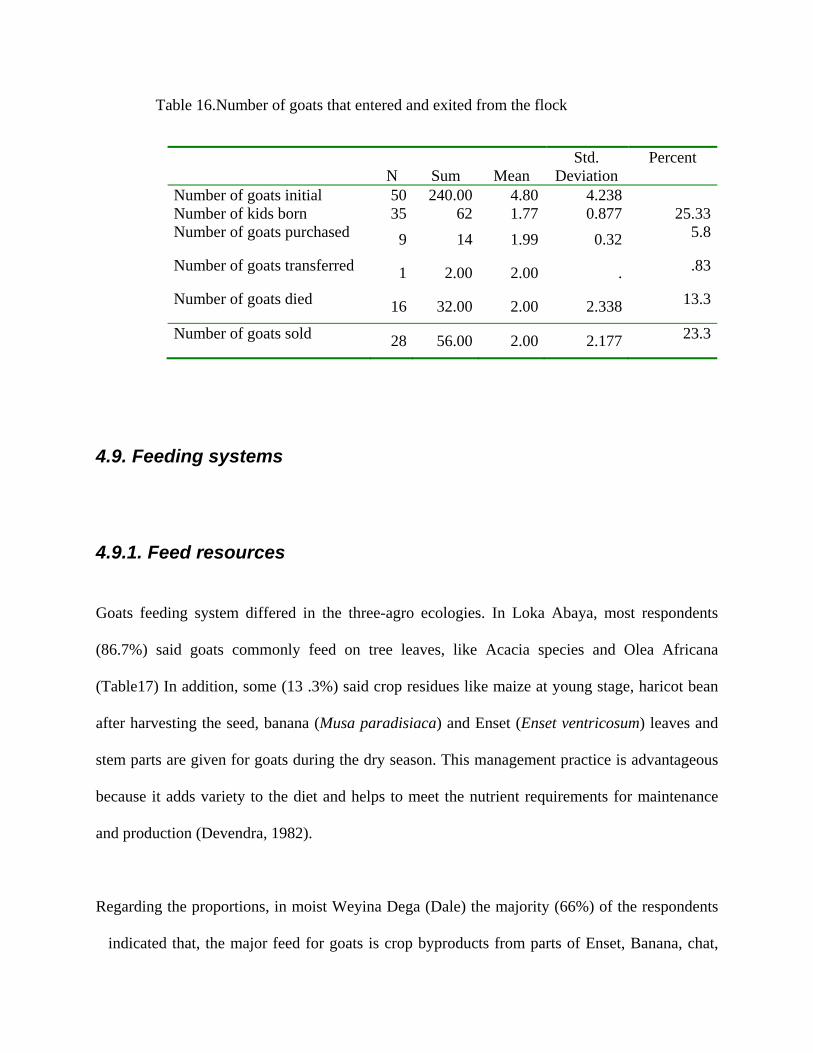
Table 16.Number of goats that entered and exited from the flock
N Sum Mean Std.
Deviation Percent
Number of goats initial 50 240.00 4.80 4.238 Number of kids born 35 62 1.77 0.877 25.33Number of goats purchased 9 14 1.99 0.32 5.8
Number of goats transferred 1 2.00 2.00 . .83
Number of goats died 16 32.00 2.00 2.338 13.3
Number of goats sold 28 56.00 2.00 2.177 23.3
4.9. Feeding systems
4.9.1. Feed resources
Goats feeding system differed in the three-agro ecologies. In Loka Abaya, most respondents
(86.7%) said goats commonly feed on tree leaves, like Acacia species and Olea Africana
(Table17) In addition, some (13 .3%) said crop residues like maize at young stage, haricot bean
after harvesting the seed, banana (Musa paradisiaca) and Enset (Enset ventricosum) leaves and
stem parts are given for goats during the dry season. This management practice is advantageous
because it adds variety to the diet and helps to meet the nutrient requirements for maintenance
and production (Devendra, 1982).
Regarding the proportions, in moist Weyina Dega (Dale) the majority (66%) of the respondents
indicated that, the major feed for goats is crop byproducts from parts of Enset, Banana, chat,
sweet potato haricot bean, weeds and tinning of annual crop (Table 15). Due to the declining
trend of communal pasture, bush and forestland are less available in cash crop producing
midland areas. Thus, with a decline with woodlots and forest areas as feed sources, the
proportion of households that use crop residues and purchased feed has increased. As a result,
the number of animals reared by smallholder has reduced gradually and the system of
management and feed utilization has changed over time from free range extensive management
to tethering and cut and carry feeding system.
Where as, in Moist Dega (Wonsho) and Moist Kola (Loka Abaya), the majority 46.7% and
86.7% of participants, respectively indicated that shrubs bushes and tree branches are the major
sources of feed for goats (Table 15). The browsing supplies some of the goats needs, but manual
feeding provides the greater part. In the dry season free-range goats will only find dry vegetation
or crop residues in the fields. These may supply some energy, but the protein content is very low
(Jansen, 2004).
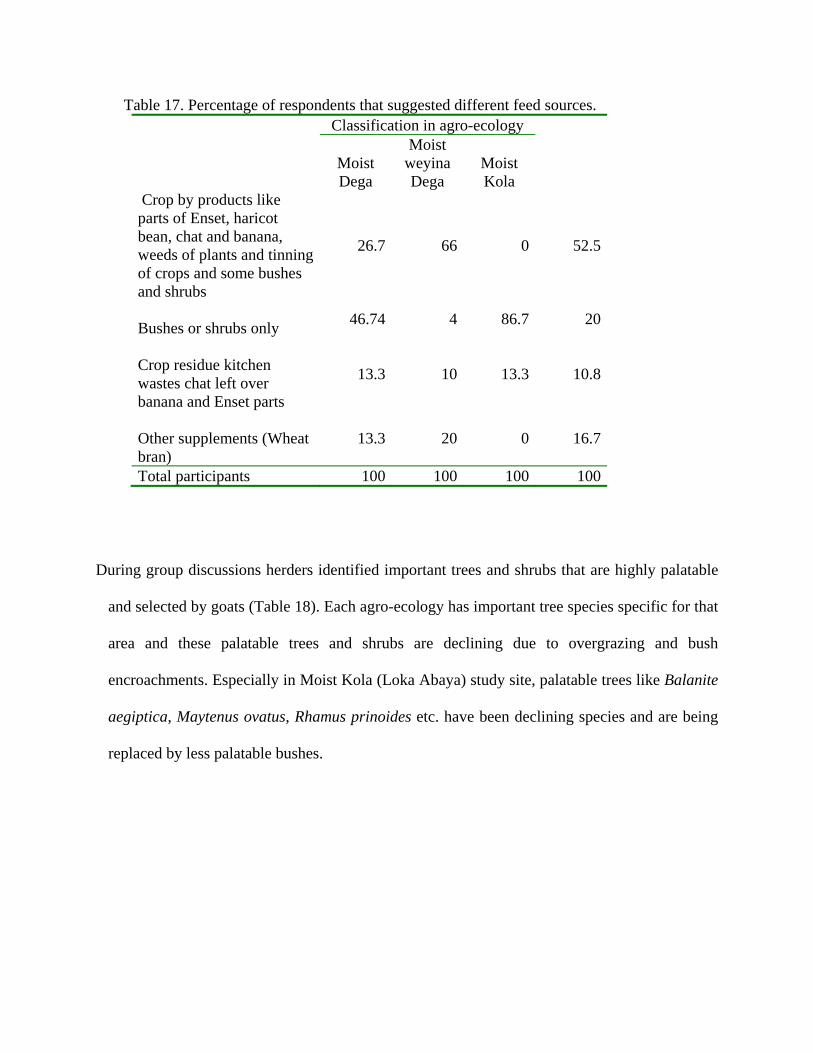
Table 17. Percentage of respondents that suggested different feed sources.
Classification in agro-ecology
Moist Dega
Moist weyina Dega
Moist Kola
Crop by products like parts of Enset, haricot bean, chat and banana, weeds of plants and tinning of crops and some bushes and shrubs
26.7 66 0 52.5
Bushes or shrubs only 46.74 4 86.7 20
Crop residue kitchen wastes chat left over banana and Enset parts
13.3 10 13.3 10.8
Other supplements (Wheat bran)
13.3 20 0 16.7
Total participants 100 100 100 100
During group discussions herders identified important trees and shrubs that are highly palatable
and selected by goats (Table 18). Each agro-ecology has important tree species specific for that
area and these palatable trees and shrubs are declining due to overgrazing and bush
encroachments. Especially in Moist Kola (Loka Abaya) study site, palatable trees like Balanite
aegiptica, Maytenus ovatus, Rhamus prinoides etc. have been declining species and are being
replaced by less palatable bushes.
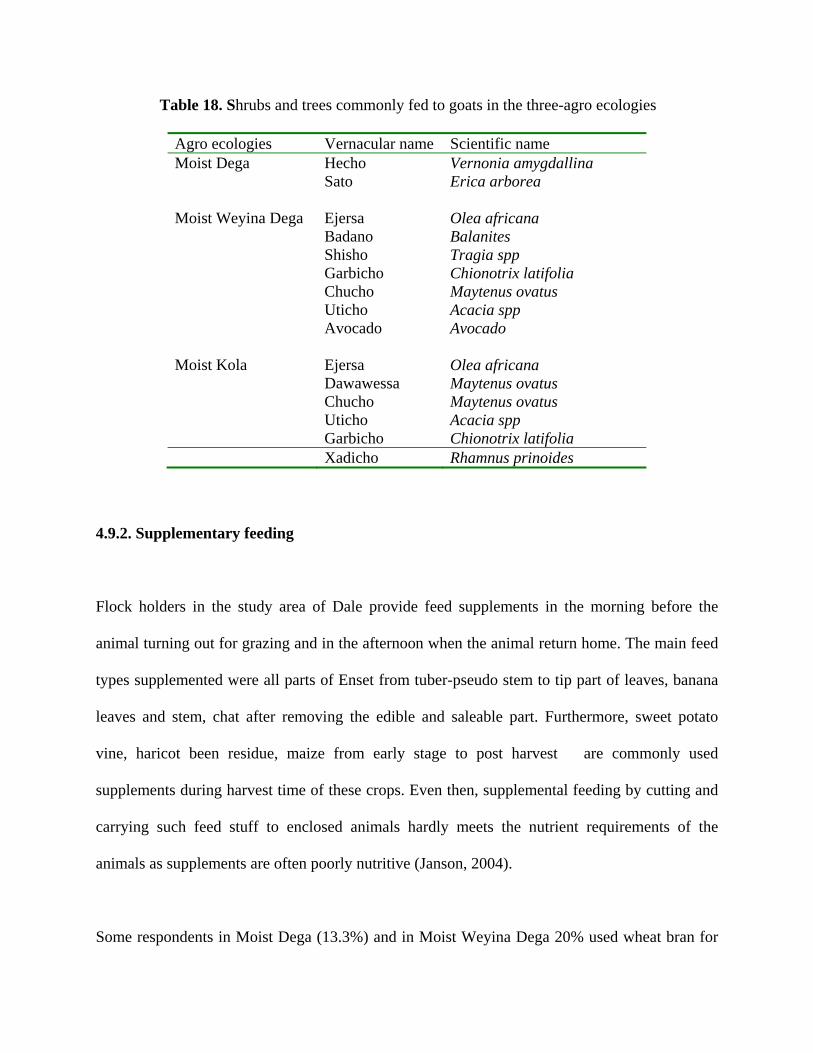
Table 18. Shrubs and trees commonly fed to goats in the three-agro ecologies
Agro ecologies Vernacular name Scientific name Moist Dega Hecho Vernonia amygdallina Sato Erica arborea Moist Weyina Dega Ejersa Olea africana Badano Balanites Shisho Tragia spp Garbicho Chionotrix latifolia Chucho Maytenus ovatus Uticho Acacia spp Avocado Avocado Moist Kola Ejersa Olea africana Dawawessa Maytenus ovatus Chucho Maytenus ovatus Uticho Acacia spp Garbicho Chionotrix latifolia Xadicho Rhamnus prinoides
4.9.2. Supplementary feeding
Flock holders in the study area of Dale provide feed supplements in the morning before the
animal turning out for grazing and in the afternoon when the animal return home. The main feed
types supplemented were all parts of Enset from tuber-pseudo stem to tip part of leaves, banana
leaves and stem, chat after removing the edible and saleable part. Furthermore, sweet potato
vine, haricot been residue, maize from early stage to post harvest are commonly used
supplements during harvest time of these crops. Even then, supplemental feeding by cutting and
carrying such feed stuff to enclosed animals hardly meets the nutrient requirements of the
animals as supplements are often poorly nutritive (Janson, 2004).
Some respondents in Moist Dega (13.3%) and in Moist Weyina Dega 20% used wheat bran for
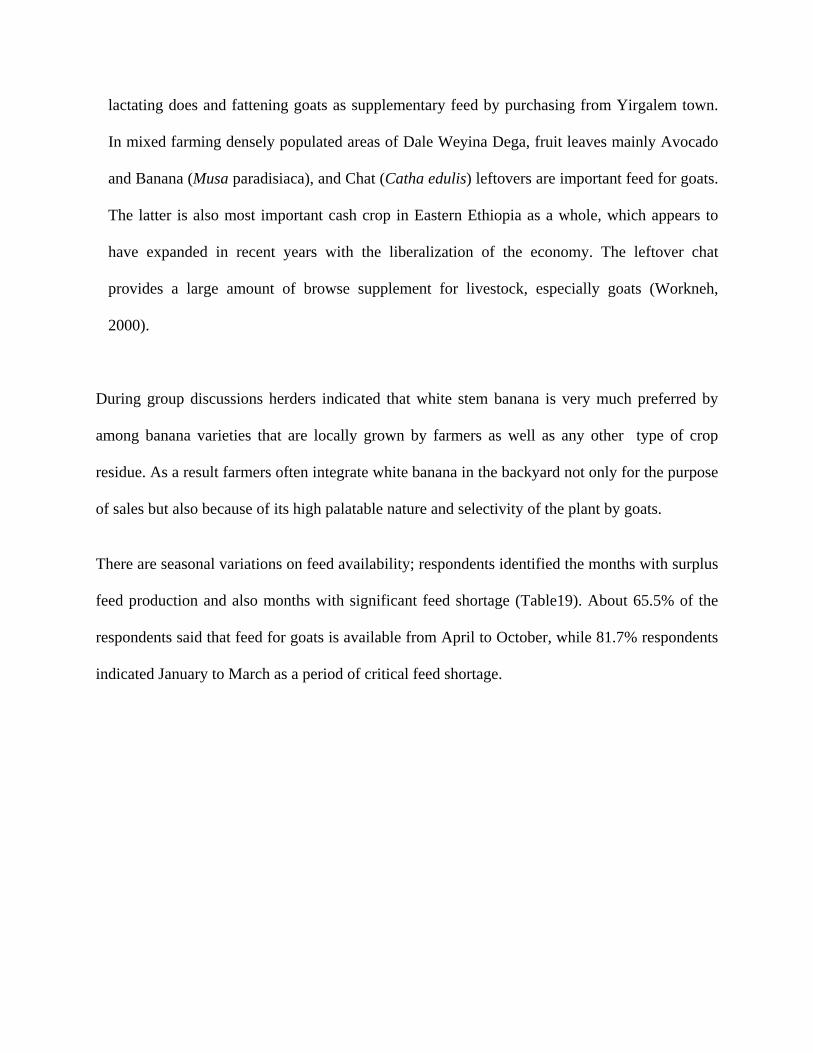
lactating does and fattening goats as supplementary feed by purchasing from Yirgalem town.
In mixed farming densely populated areas of Dale Weyina Dega, fruit leaves mainly Avocado
and Banana (Musa paradisiaca), and Chat (Catha edulis) leftovers are important feed for goats.
The latter is also most important cash crop in Eastern Ethiopia as a whole, which appears to
have expanded in recent years with the liberalization of the economy. The leftover chat
provides a large amount of browse supplement for livestock, especially goats (Workneh,
2000).
During group discussions herders indicated that white stem banana is very much preferred by
among banana varieties that are locally grown by farmers as well as any other type of crop
residue. As a result farmers often integrate white banana in the backyard not only for the purpose
of sales but also because of its high palatable nature and selectivity of the plant by goats.
There are seasonal variations on feed availability; respondents identified the months with surplus
feed production and also months with significant feed shortage (Table19). About 65.5% of the
respondents said that feed for goats is available from April to October, while 81.7% respondents
indicated January to March as a period of critical feed shortage.

Table19. Different periods of the year rated according to availability f surplus feed in the three agro ecologies.
Classification within Agro ecology
Moist Dega
Moist Weyina Dega Moist Kola
April-October 86.7 58.8 66.7 63.3 December-March
0 2.2 0 1.67
July -October 6.67 1.1 20 4.17
October-November
0 28.9 0 21.6
September-November
6.6 8.9 13.67 9.17
Months from May to October are in the rainy season; shrubs, bushes and other types of plants are
adequately available. In Moist Kola (Loka Abaya) during this time feeds from shrubs, trees and
bushes are available and surplus. On the other hand, in cash crop producing Moist Weyina Dega
(Dale), even though annual and perennial crops occupy land, feeds like weeds, thinning of crops
and tree trunks can support goats. According to Workneh (2004) in the highlands, where
common grazing areas have decreased due to population pressure, crop thinning and weeds from
cultivated land provide a large part of supplementary feed available to the goats. Between
September and December feed is surplus because of crop harvest and the aftermath used as feed
of goats.
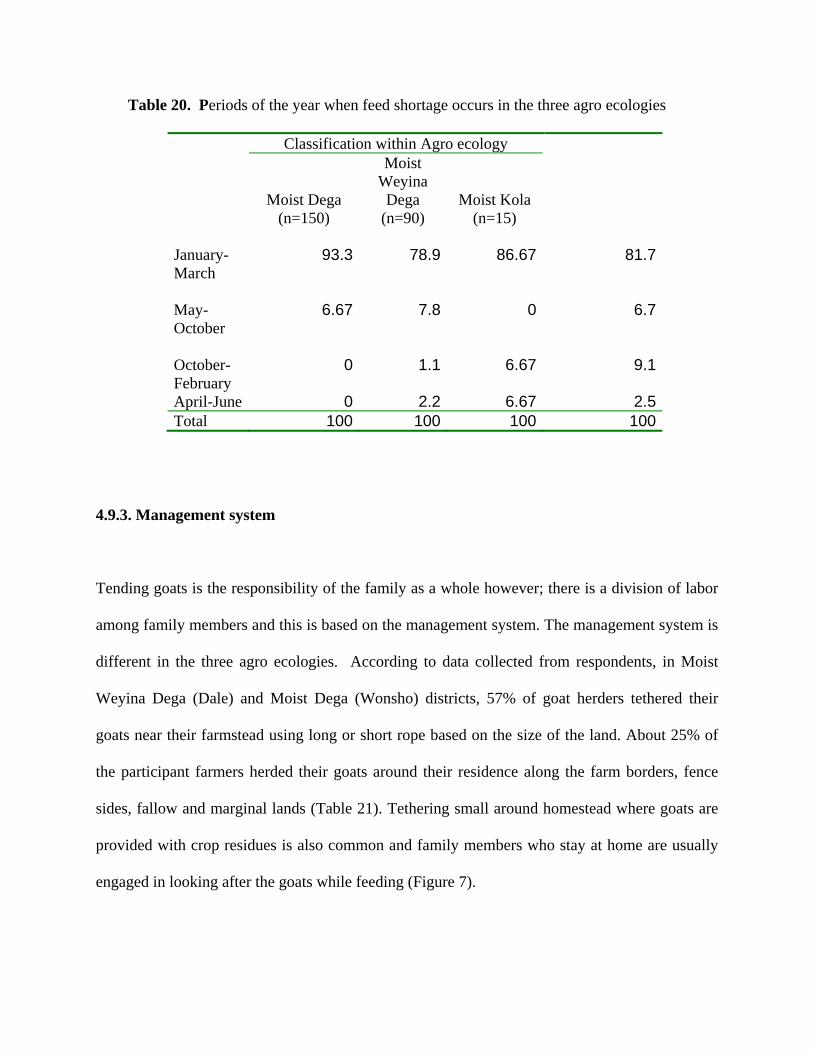
Table 20. Periods of the year when feed shortage occurs in the three agro ecologies
Classification within Agro ecology
Moist Dega (n=150)
Moist Weyina Dega
(n=90) Moist Kola
(n=15) January-March
93.3 78.9 86.67 81.7
May-October
6.67 7.8 0 6.7
October-February
0 1.1 6.67 9.1
April-June 0 2.2 6.67 2.5Total 100 100 100 100
4.9.3. Management system
Tending goats is the responsibility of the family as a whole however; there is a division of labor
among family members and this is based on the management system. The management system is
different in the three agro ecologies. According to data collected from respondents, in Moist
Weyina Dega (Dale) and Moist Dega (Wonsho) districts, 57% of goat herders tethered their
goats near their farmstead using long or short rope based on the size of the land. About 25% of
the participant farmers herded their goats around their residence along the farm borders, fence
sides, fallow and marginal lands (Table 21). Tethering small around homestead where goats are
provided with crop residues is also common and family members who stay at home are usually
engaged in looking after the goats while feeding (Figure 7).
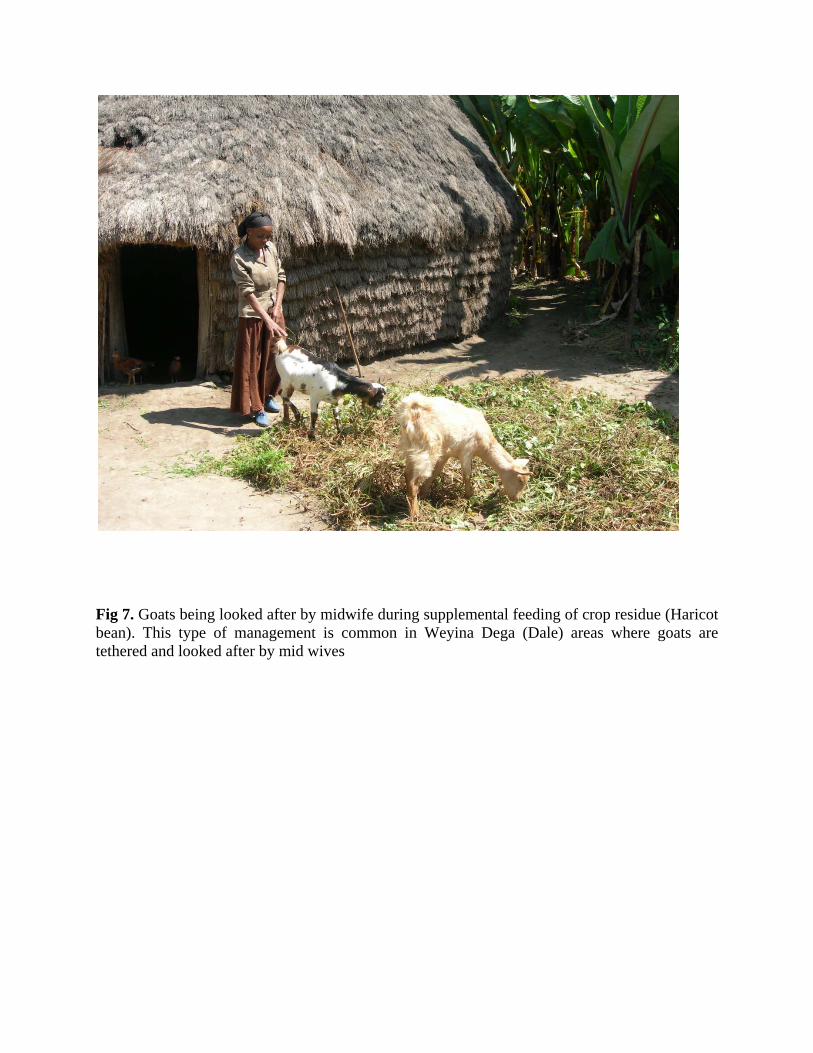
Fig 7. Goats being looked after by midwife during supplemental feeding of crop residue (Haricot bean). This type of management is common in Weyina Dega (Dale) areas where goats are tethered and looked after by mid wives

Information gathered during group discussions indicated that tethering is popular with small
holders because of shortage of grazing land in the predominantly cropping area of moist Weyina
Dega and Dega agro-ecologies. This system also reduces labor inputs. This is important because
labor shortage is common, especially during the rainy season, when most people are engaged in
other farming activities. Conversely, farmers with large size animals herd their goats because
labor is available and herding large flock of goats is difficult (Davies, 2003).
Table21. System of management classification in the three agro- ecologies (% of respondents)
Management system
Classification in Agro ecology
Total
Moist Dega
Moist Weyina Dega
Moist Kola
Herding in the bushes 0 2.2 46.67 7.5 Herding around the farmstead 13.33 22.2 13.33 20
Unherded but browse in the bush 6.67 12.2 40 15
Tethering 80 63.3 0 57.5
Total 100 100 100 100
Extensive management of goats is dominant at Moist Kola Loka Abaya where free ranging of
goats is common. The system is advantageous for goats since it gives opportunity to select and
freely forage from the bushes. In all the three agro ecologies mainly male children below 15
carry out herding. But in Moist Weyina Dega and Moist Kola, households take the part of
herding (43.3% and 40%), respectively. In moist Kola and Moist Weyina Dega male children
below 15 ages carry out herding, while in Dega the participation of households in herding goats
is low because households in Dega pass their time with grazing animals (cattle and sheep) and
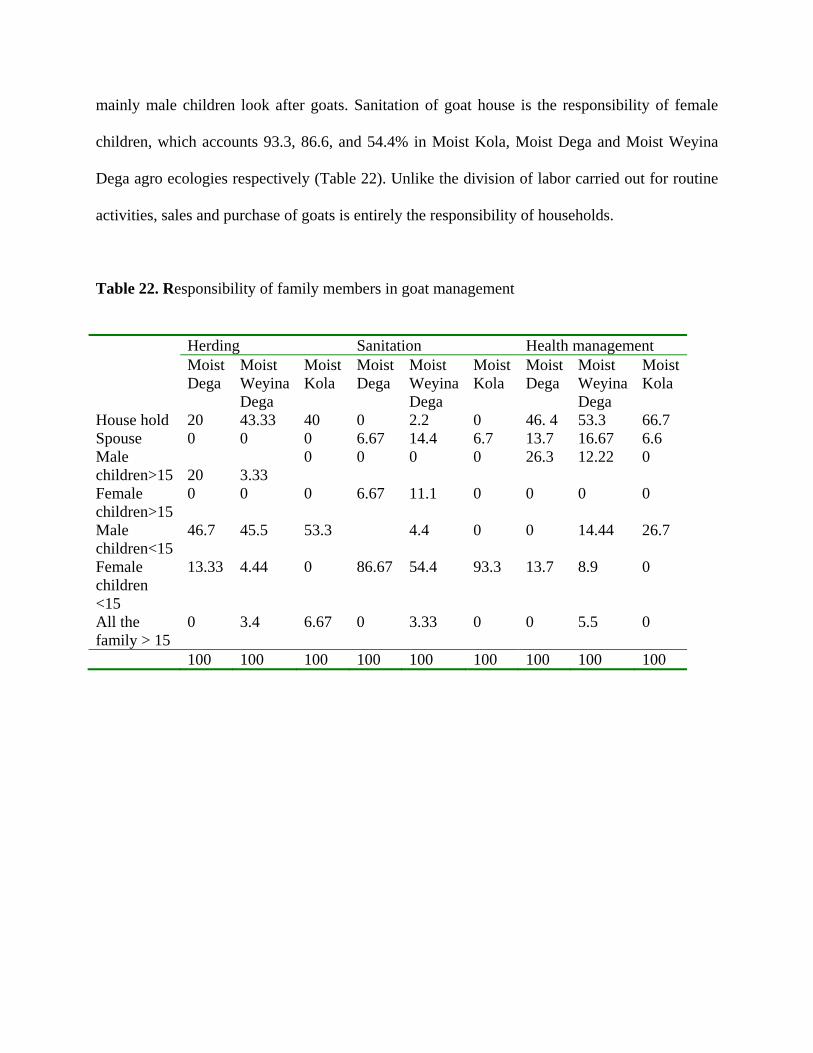
mainly male children look after goats. Sanitation of goat house is the responsibility of female
children, which accounts 93.3, 86.6, and 54.4% in Moist Kola, Moist Dega and Moist Weyina
Dega agro ecologies respectively (Table 22). Unlike the division of labor carried out for routine
activities, sales and purchase of goats is entirely the responsibility of households.
Table 22. Responsibility of family members in goat management
Herding Sanitation Health management
Moist Dega
Moist Weyina Dega
Moist Kola
Moist Dega
Moist Weyina Dega
Moist Kola
Moist Dega
Moist Weyina Dega
Moist Kola
House hold 20 43.33 40 0 2.2 0 46. 4 53.3 66.7 Spouse 0 0 0 6.67 14.4 6.7 13.7 16.67 6.6 Male children>15
20
3.33
0 0 0 0 26.3 12.22 0
Female children>15
0 0 0 6.67 11.1 0 0 0 0
Male children<15
46.7 45.5 53.3 4.4 0 0 14.44 26.7
Female children <15
13.33 4.44 0 86.67 54.4 93.3 13.7 8.9 0
All the family > 15
0 3.4 6.67 0 3.33 0 0 5.5 0
100 100 100 100 100 100 100 100 100

4.10. Water sources and watering
Compared to cattle and sheep, goats are efficient in using water. They have a low rate of water
turn over per unit of body weight (Devendra, 1982). In the three-agro ecologies of Dale, four
types of water sources are available namely: river, pond, hand dug well and streams are
commonly used (Table 23). Ponds are the main water sources in the Moist Kola (Loka Abaya)
especially during the wet season (April to September). During the rest of the year, most of the
flock holders trek their goats to Lake Abaya, and Blatte River (Table 24).
Table 23 Water sources during wet season in the three-agro ecology as responded by flock
holders
Water source
Classification in Agro ecology
Total
Moist Dega
Moist weyina Dega
Moist Kola
Hand dug well 13.33 24.4 6.67 20.8 Pond 13.33 18.6 80 25.8
River 66.67 27.9 13.33 31.7
Stream 6.67 26.7 0 20.8
Hand dug well, and spring 0 2.3 0 0.9
Total 100 100 100 100
In Dega rivers are common water sources during wet and dry seasons (also hand dug wells are
also more used during the dry season) In Moist Weyina Dega all the four sources water are
commonly used during both seasons (Table 24)

Table 24 Water source during dry season, classification by Agro ecology
Water source
Classification in Agro ecology
Total
Moist Dega
(N=15)
Moist weyina Dega
(N=100)
Moist Kola
(N=15) Hand dug well 27 29 6 26 Pond 0 19 69 31
River 67 29 25 33
Stream 6.6 21 0 10
Pipe 0 2 0 0
Total 100 100 100 100
In Moist Dega and Weyina Dega, the majority of respondents 53.3% and 56.7%, respectively
travel less than a kilometer to water their goats during the dry season (Table 25) said they travel
less than a kilometer to water their goats during the dry season. On the other hand 33.1% and
15.6 % of the respondents in Dega and Weyina Dega respectively. Still substantial proportion of
households (27.8%) in the Weyina Dega agro-ecology travel up to 10 Km to water their stock.
In moist Kola during dry season 86.7% and 13.3% of respondents travel to watering point 6 to 10
km and above 10 km, respectively (Table 25). But, during the wet season only 20% of
respondents in Moist Kola travel 6-10 Km to water their goats and can be available within less
than 1Km for most of them. Similarly, water is available with in less than a kilometer for most
(>75%) of farmers in the other two agro-ecologies (Table 26).

Table 25 Distance to watering points during the dry season, percentage in agro ecology
Distance, Km
Classification by agro-ecology (%)
Total
Moist Dega
(N=15) Moist Weyina Dega (n=90)
Moist Kola
(N= 15) <1 53.33 56.67 0 49.2 1-5 33.33 15.55 0 15.8
6-10 13.33 27.77 86.7 33.3
>10 0 0 13.33 1.7
Total 100 100 15 100
Table 26 Distance to watering points during the wet season as responded by flock
herders in the three-agro ecologies
Distance
Classification by agro-ecology (%)
Total
Moist Dega
(N=15)
Moist weyina Dega
(N=90) Moist Kola
(N=15) <1km 80 76.7 60 75 1-5km 20 22.2 20 21.7
6-10km 0 1.1 20 3.3
Total 15 90 15 120
Watering frequency varied according to location and season. During the dry season, Moist Kola
(Loka Abaya) herders water their goats every second day, whereas in moist Weyina Dega and
Dega >90% of the respondents provide their animals with water once a day or it is freely
available (Table 26).
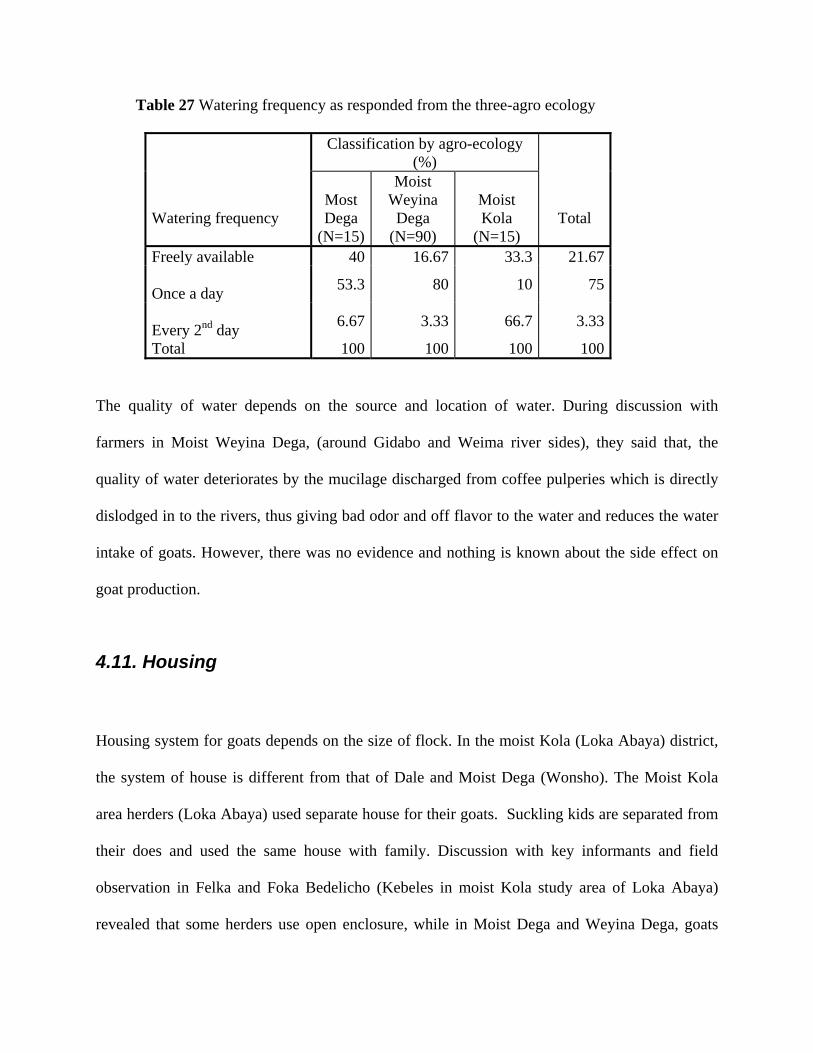
Table 27 Watering frequency as responded from the three-agro ecology
Watering frequency
Classification by agro-ecology (%)
Total
Most Dega
(N=15)
Moist Weyina Dega
(N=90)
Moist Kola
(N=15) Freely available 40 16.67 33.3 21.67 Once a day 53.3 80 10 75
Every 2nd day 6.67 3.33 66.7 3.33
Total 100 100 100 100 The quality of water depends on the source and location of water. During discussion with
farmers in Moist Weyina Dega, (around Gidabo and Weima river sides), they said that, the
quality of water deteriorates by the mucilage discharged from coffee pulperies which is directly
dislodged in to the rivers, thus giving bad odor and off flavor to the water and reduces the water
intake of goats. However, there was no evidence and nothing is known about the side effect on
goat production.
4.11. Housing
Housing system for goats depends on the size of flock. In the moist Kola (Loka Abaya) district,
the system of house is different from that of Dale and Moist Dega (Wonsho). The Moist Kola
area herders (Loka Abaya) used separate house for their goats. Suckling kids are separated from
their does and used the same house with family. Discussion with key informants and field
observation in Felka and Foka Bedelicho (Kebeles in moist Kola study area of Loka Abaya)
revealed that some herders use open enclosure, while in Moist Dega and Weyina Dega, goats

share the same house with the family.
The materials used for housing also vary according to the economic status of the family. Very
small numbers of herders (10%) build goat house using corrugated iron sheet for roofs and wood
and mud for wall construction. Where as, the majority of flock holders (90%) construct goat
houses using grasses for roofs and wood and mud for wall and floor.
4.12. Diseases
Animal disease is one of the major problems affecting goat production. Six major diseases
attacking goats were identified and reported by flock owners (Table28), of which trypanosomes
ranked first accounting 36% of the respondents in the Moist Kola (Loka Abaya) area.
Traypanosomosis is classified in-group II diseases constitutes the main disease constraints to
ruminant productivity in Sub Saharan Africa (Ibrahim, 2002). According to the Author, the
disease is widely distributed and transmitted by vector, strongly influenced by the environment
and the production system known to depress productivity and cause mortality. In Moist Kola it is
an important disease during wet season and farmers are trying to control by organizing Tsetse
controlling group in the four Kebeles of Moist Kola. This group has contributed money and
purchase acariside from tsetse eradication program. They are working in collaboration with
Agricultural and rural development offices at Woreda level and IPMS Dale coordinating office.
Sheep pox is also identified as the major disease of small ruminants affecting goats.
During discussions carried out at Felka Kebele Moist Kola (Loka Abaya), the herders of this
area reported that they move their goats from Lake Abaya to Moist Weyina Dega before the
onset of tsetse infestation (before May) in order to avoid the risk of the disease. Tsetse flies
multiply during the wet season (May to June), according to the discussions with the herders in
Bokito and Felka, and the disease attacks goats in wet season.
The other important diseases were heart water (17%). and sheep and goat pox (12%). goat pox,
locally known as “Fuso”, is highly contagious disease of goats, causing a significant loss of body
condition ends up with death. In field observation pox lesions were found on the skin and
mouthpart and prevents feeding partially at early stage and gradually the animal stops eating.
There is no traditional treatment identified and known by local healers. However, the disease can
easily be prevented through mass vaccination. This calls for; strengthening and providing
veterinary service. On the other hand, internal parasites were seen to be health problems of goats
in Moist Dega and Moist Weyina Dega (Dale Chancho Kebele) and partially at Loka Abaya
when herders move to the Lakeside. The disease causes weight loss, emaciation and finally
death.
There is no as such a strong veterinary service provided particularly for lowland flock holders.
As verified during group discussions, there has been no vaccination given during the last five
years against any type of goat diseases. There is no veterinary clinic in the Moist Kola area. The
district has one main clinic at Yirgalem town serving the Moist Weyina Dega flock holders and
another clinic serving more than 12 Kebeles around Moist Dega (Wonsho). The distance to
veterinary clinics vary according to agro ecology. Despite having a large flock of goats, Moist
Kola (Loka Abaya) area herders have no access to veterinary service. Farmers have to travel

more than 20 km in order to get service. Such circumstances force them to buy veterinary
medicines from illegal sources.
The major diseases reported are presented in Table 20. Problems related to goat’s health
management were discussed with the respondents and the problems are presented in order of
importance. About 35.8% of the respondents reported a lack of veterinary clinic as the major
problem, 20.5% the shortage of veterinarians, and 20% showed inaccessibility to the road, and
14.2% high price of drugs. A few respondents (2.5%) showed the shortage of medicine and 6.7%
did not have problem of disease (Table 29).
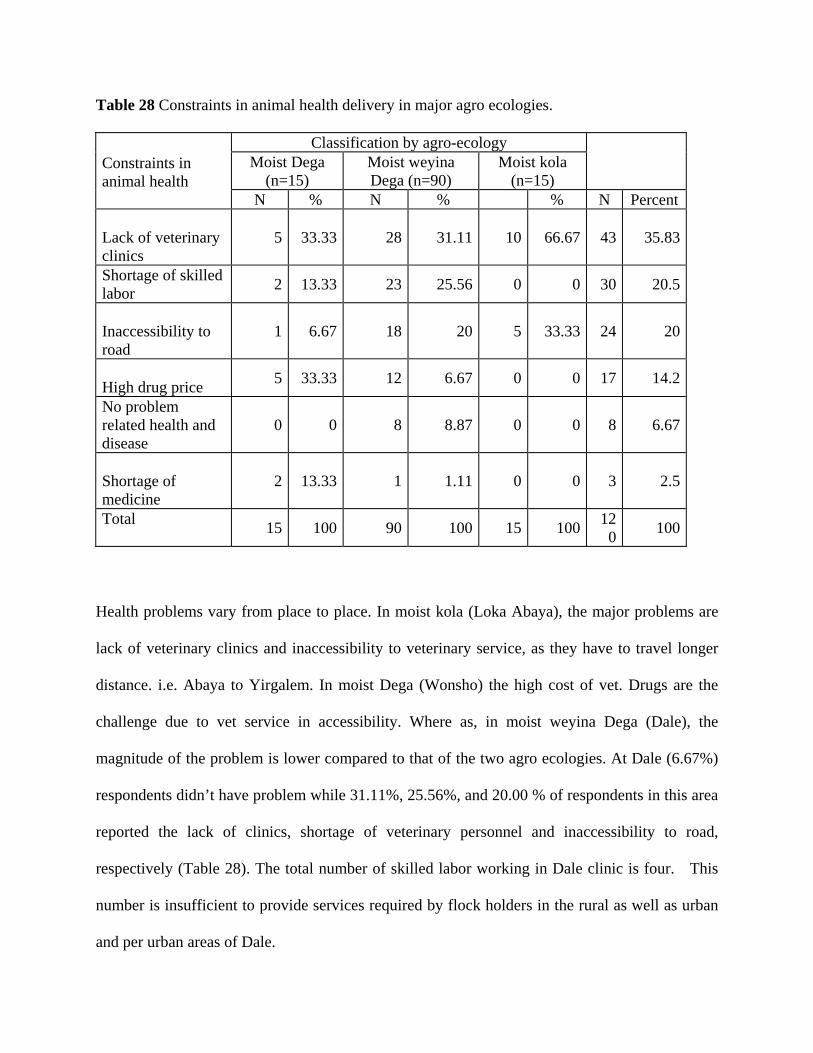
Table 28 Constraints in animal health delivery in major agro ecologies.
Constraints in animal health
Classification by agro-ecology
Moist Dega (n=15)
Moist weyina Dega (n=90)
Moist kola (n=15)
N % N % % N Percent Lack of veterinary clinics
5 33.33 28 31.11 10 66.67 43 35.83
Shortage of skilled labor 2 13.33 23 25.56 0 0 30 20.5
Inaccessibility to road
1 6.67 18 20 5 33.33 24 20
High drug price 5 33.33 12 6.67 0 0 17 14.2
No problem related health and disease
0 0 8 8.87 0 0 8 6.67
Shortage of medicine
2 13.33 1 1.11 0 0 3 2.5
Total 15 100 90 100 15 100 120 100
Health problems vary from place to place. In moist kola (Loka Abaya), the major problems are
lack of veterinary clinics and inaccessibility to veterinary service, as they have to travel longer
distance. i.e. Abaya to Yirgalem. In moist Dega (Wonsho) the high cost of vet. Drugs are the
challenge due to vet service in accessibility. Where as, in moist weyina Dega (Dale), the
magnitude of the problem is lower compared to that of the two agro ecologies. At Dale (6.67%)
respondents didn’t have problem while 31.11%, 25.56%, and 20.00 % of respondents in this area
reported the lack of clinics, shortage of veterinary personnel and inaccessibility to road,
respectively (Table 28). The total number of skilled labor working in Dale clinic is four. This
number is insufficient to provide services required by flock holders in the rural as well as urban
and per urban areas of Dale.

Table 29 Diseases and percentage of respondents in the study area
Diseases Classification by agro-ecology
Total Local name English name ??
Dega (N=15)
Weyina Dega
(N=90) Moist Kola
(N=15) Shillo
Trypanosomisis 0 50.7 46.7 37.9
Harisho
Heart water
46.7 17 6.7 21
Fusso
Goat pox 0 10.7 46.7 15.8
Deisha
Colt parasites
46.7 10.7 0 15.8
Bijajo
External parasite
6.7 1.53 0 2.1
Feed poisoning Toxicity 0 9.33 0 7 Total 100 100 100 100
Diseases affect all age groups of goats. The goat herders recalled mortality that occurred during
last year and the summarized data indicate that out of 718 goats recorded, 78 goats (10.9%) died
during the last twelve months (November 1998 to October 1999). The proportion among
different age group of goats was 42.7 % does (including doe kid), 39.2% bucks (including buck
kids) and 17.9% kids less than three months of age.
According to informants 30% of mortality was attributed to disease, 3.3% was due to predators,
and 2.5% due to accident. The majority (63 %) of the respondents encountered no death in the
flock during the study period. The highest prevalence of diseases was observed between January
and March (Table 30).

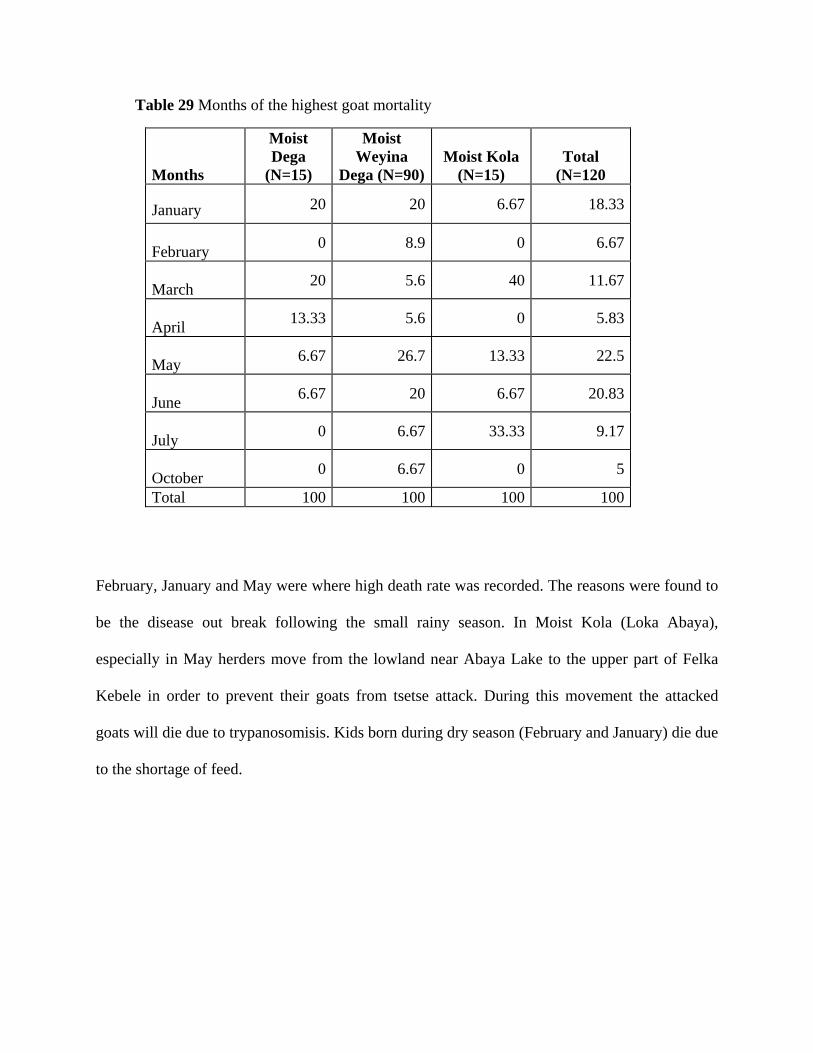
Table 29 Months of the highest goat mortality
Months
Moist Dega
(N=15)
Moist Weyina
Dega (N=90)Moist Kola
(N=15) Total
(N=120
January 20 20 6.67 18.33
February 0 8.9 0 6.67
March 20 5.6 40 11.67
April 13.33 5.6 0 5.83
May 6.67 26.7 13.33 22.5
June 6.67 20 6.67 20.83
July 0 6.67 33.33 9.17
October 0 6.67 0 5
Total 100 100 100 100 February, January and May were where high death rate was recorded. The reasons were found to
be the disease out break following the small rainy season. In Moist Kola (Loka Abaya),
especially in May herders move from the lowland near Abaya Lake to the upper part of Felka
Kebele in order to prevent their goats from tsetse attack. During this movement the attacked
goats will die due to trypanosomisis. Kids born during dry season (February and January) die due
to the shortage of feed.
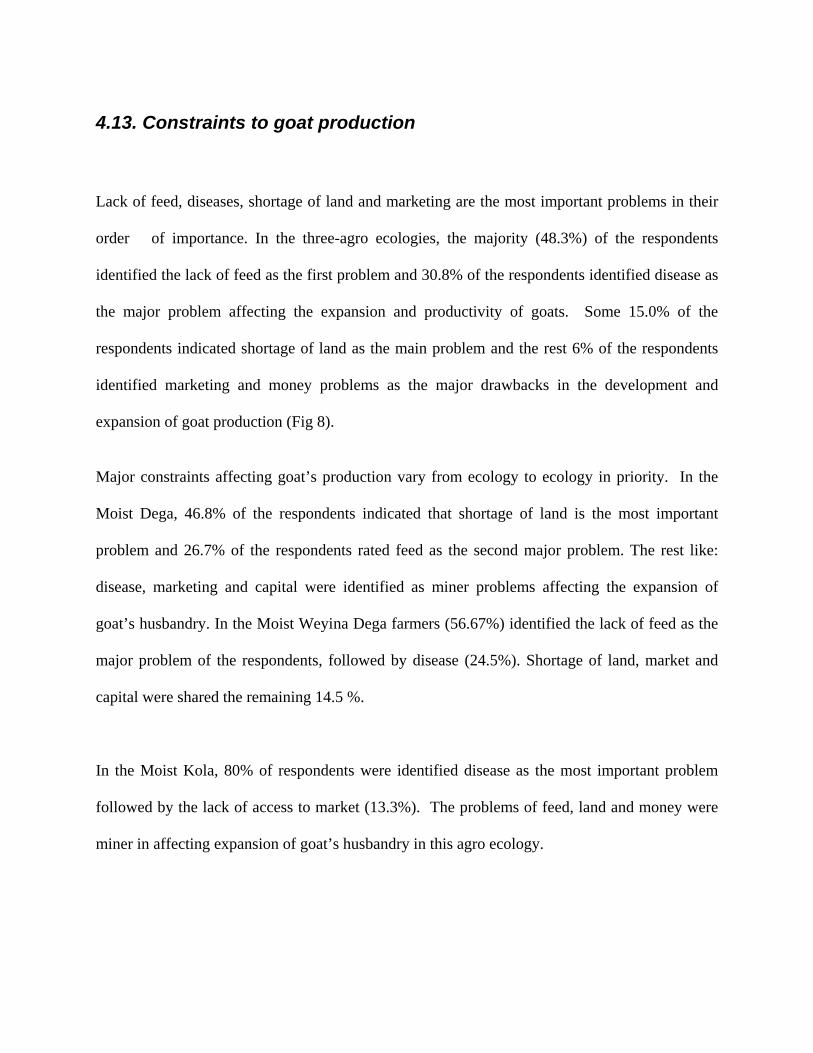
4.13. Constraints to goat production
Lack of feed, diseases, shortage of land and marketing are the most important problems in their
order of importance. In the three-agro ecologies, the majority (48.3%) of the respondents
identified the lack of feed as the first problem and 30.8% of the respondents identified disease as
the major problem affecting the expansion and productivity of goats. Some 15.0% of the
respondents indicated shortage of land as the main problem and the rest 6% of the respondents
identified marketing and money problems as the major drawbacks in the development and
expansion of goat production (Fig 8).
Major constraints affecting goat’s production vary from ecology to ecology in priority. In the
Moist Dega, 46.8% of the respondents indicated that shortage of land is the most important
problem and 26.7% of the respondents rated feed as the second major problem. The rest like:
disease, marketing and capital were identified as miner problems affecting the expansion of
goat’s husbandry. In the Moist Weyina Dega farmers (56.67%) identified the lack of feed as the
major problem of the respondents, followed by disease (24.5%). Shortage of land, market and
capital were shared the remaining 14.5 %.
In the Moist Kola, 80% of respondents were identified disease as the most important problem
followed by the lack of access to market (13.3%). The problems of feed, land and money were
miner in affecting expansion of goat’s husbandry in this agro ecology.
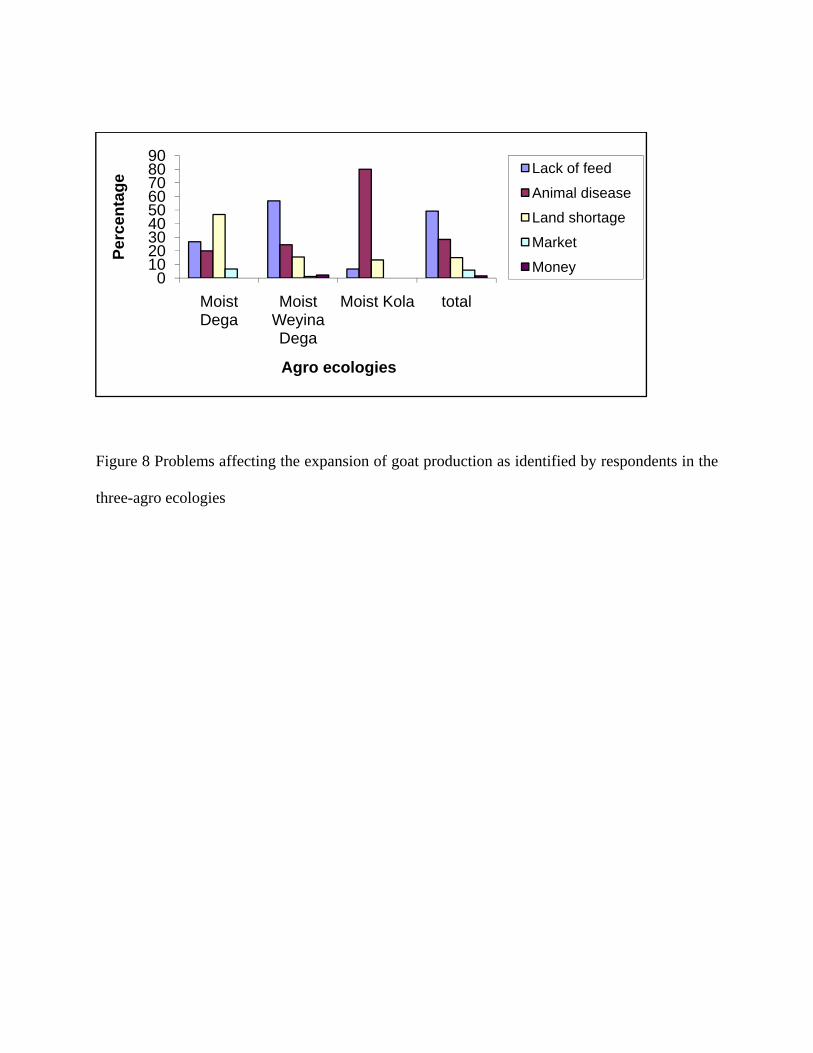
Figure 8 Problems affecting the expansion of goat production as identified by respondents in the
three-agro ecologies
0102030405060708090
Moist Dega
Moist Weyina Dega
Moist Kola total
Perc
enta
ge
Agro ecologies
Lack of feed
Animal disease
Land shortage
Market
Money

5. Marketing
5.1. Marketing structures, locations and marketing systems
In the three selected primary markets located in three agro ecologies, livestock of all species
(cattle, sheep and goats) were sold and purchased in every market days. The first primary market
is Bokasso located in Moist Dega agro ecology (Wonsho). It is the smallest market compared to
the other two markets (Sasamo Deala and Hantate), the predominant species marketed were
sheep and goats. The market also consists of young bull, heifers and calves. The number
marketed estimated up to four hundred per week (up to two hundred animals every market day).
The area has all season roads with 12 km distance from Yirgalem town crossing Shebedino on
the way to Hawasa. No electric and Telecommunication facilities are available; there is no fence,
and animals marketed on open area. Local traders after purchasing the animals they trek animals
to secondary and terminal markets.
The second market was Sasasamo Deala; Moist Weyina Dega (Dale) this market is bigger than
Bokasso market here; the predominant livestock species are goats followed by cattle and sheep.
The market is situated at 7 km west to Yirgalem town, and has dry season road, which is 6 km
apart from the main Addis Ababa to Moyle transversal highway. No market structures except
collection yard or fences, feeding and watering troughs are available.
Hantate market (Moist Kola) is the third and the biggest primary market that is found at Loka
Abaya district (newly established district that was separated from the former Dale). This market
is the biggest market accommodating the large number of livestock species predominantly goats
and followed by cattle and sheep. The market is located 21 km apart from Yirgalem town and 61
km from Hawasa terminal market. It has fenced market place constructed by Kebele
administration of Hantate in order to control the inlet and out let for the purpose of taxation.
5.2. Marketing system participants in the three primary markets
Market participants in Bokasso (Wonsho market at moist weyina Dega) were producers, retailers
and small-scale traders. Here, the sellers are producers, retailers and local traders from
surrounding Kebele administrations (KAs) such as Bokasso, Duba, Dagia Haroshifa and Tuticha.
The latter two Kebeles are from neighboring districts such as Shebedino and Arbegona,
respectively.

In the second market at Naramo Deala the market participants were also producers from near by
KAs such as: Weininata, , Gane, Kege, Dasse, Bera and Chume the densely populated mixed
farming cash cropped Kebele administrations (KAs) of Dale district wholesalers and retailers
from nearby community and mainly from Yirgalem town. The sellers are producers and small-
scale local traders (selling not more than 2 goats) and the buyers are local butcheries, Restaurants
and Hotels of Yirgalem town.
In Hantate market (The biggest market at moist kola area or in Dale district accommodating up
to 500 animals per week and up to 250 every market day), the number of producers involved was
large but the number of traders was small when compared to other adjacent markets and, in
relation to the number of marketed goats. The reason was discussed with producers and traders in
the market; it was found out that the distance of the market from Hawasa and Yirgalem towns
and inaccessibility to transport facilities might have affected the traders to come to the market
and participate continuously in buying and selling processes. The price of goats in this market is
relatively lower than the other two markets. It was verified by group discussions and by the price
estimate data collected from producers during survey time. But, this condition is changing due to
some facilities like road and electricity that are recently developing in the new district (Loka
Abaya).
Among the market players, some of the buyers are producers. Producers’ purchase goats for two
main reasons. Firstly, for rearing for the purpose of milk or for other multi purposes of goats,
farmers who have no other cattle purchased goats as foundation flock, especially those young
farmers who recently separated from their family due to marriage. Secondly, farmers purchase
goats during the time when money is available (coffee harvesting season) and keep goats for a
certain period, resale again during cropping season and used for input purchasing like fertilizer
and seeds.
The producers were an important market players bringing small size to large flock of goats to the
market with different age group including old doe with their lactating kids (Fig 1). The buyers
were traders from Tula (near Hawasa town), Derara big market at Boricha district and Hawasa
towns. Also, producers buy goats from market for the purpose of rearing, they identify and select
by looking at the body conditions, the size color and its litter size (prolificacy) by simple
observation and by asking back history about the goats from the owner.

5.2. Mode of marketing and setting price
Pricing is based on body conditions. Body condition is estimated on assessing muscle and body
cover over the loin and chest area. However, there is no standard price for different body
condition scores. No weighing scales used for any type of animal. By holding especially the
chest part up, they also estimate the weight and condition of the goat. Most farmers in rural areas
agree “the worst pest” they face nowadays is low price and researches so far have not found
adequate measures to help. Many agricultural research and development institutions have
realized that, small-scale farmer’s key concern is not only agricultural productivity but also
better price (Thomas, 2005).
It was also observed that price was negotiable by brokers. Market participants also confirmed the
presence of this experience during discussions. The middlemen ask the producer about the price
and his approximation and maximum expectations, and the minimum possible price. And at the
same time he will ask the buyer how much he/she affords. Successful middleman (broker) gets
for their service amount of ranging from 2 – 4 birr per animal from both the seller and buyer
(Fig, 9).

Figure 9 Assessing body condition of goats in the market
The prices of small ruminant’s peak during religious festivals and are low during the cropping
season. Furthermore, price depends on animal attributes such as weight, sex and followed by the
time of religious festivals like Easter, New Year, and Christmas.
Therefore, the price for all age of goats in the months between Septembers to December has
escalated up and lowers at February and March and again rises up to the end of April. In general,
these conditions revealed that, the price determined not only by the attributes and the current
status of goats, but also seasonality in association with availability of money, supply and demand
has played a significant role in determining prices of goats.

5.3. Reason for selling goats
The data collected from goat producers at their farm gate (residential area) showed that, the
majority (64.2%) respondents have sold their goats during the last 12 months. The main reason
to sale goats at house hold level (60.8%) was purchase of input for crop production, for payment
School fees, and to utilize for other routine house hold expenses.
Figure 14 reasons for selling goats responses from interviewed participants
In moist weyina Dega, Some goat holders (5%) sale their flock in order to de-stock the size that
helped to resist the shortage of feed encountered during dry season. Also there were subsistence
goat herders in moist Weyina Dega (Dale) that buy goats during the time when feed and money
is available (October), and sale it again on the mid of January and February after feeding the
subsequent three months, there by getting some amount of profit obtained from feeding margin
they fulfill the cash needed by the family.
In Felka (one of the moist kola Kebele at Loka Abaya), the main reason for selling goats was
disease that forced the respondents (24%) to sale their goats. It was observed during the study
period that of flock holders sold their goats due to the out break of sheep and goats fox which

was highly contagious disease affecting the whole part of body and immediately pass on to other
flocks. Hence, the flock holder’s strategy was they isolated and sold the healthy goats in order to
minimize the risk of contamination.
The other sellers are traders, they buy from primary market and trek to secondary markets and
get the difference as a profit.

5.4. Reasons for buying
As discussed earlier, the number and type of buyers vary according to the stage; at primary
market buyers were farmers (producers) and traders, while at secondary and terminal markets (in
Hawasa and Tula) buyers were traders butcheries restaurants/hotels individual consumers and
institutional users.
In the three primary markets of Dale, producers and traders were asked about the reason of
buying goats. Some (34%) of farmers, who involved in buying goats, indicated that, goats are
bought not only for rearing or for economic purpose but to use them for saving. Later on they
sell them and buy input for crop production. The reason might have to be to reduce unnecessary
expenses occurred during money available time, and putting cash at hand in rural area may
expose for unexpected expenses and unnecessary entertainments when they go to urban markets.
As indicated by interviewed sellers (Producers) during cheapest season purchase goats and kept
for shorter period on high plane of feeding and will fetch higher price and thus get good profit
i.e. they engaged in trading goats after cropping season The other buyers are also producers who
aimed to make money from goat rearing (fig 3).

Figure 10 Old doe with triplet kids came from Felka Kebele Administration (KA). It was bought by producers from Hantate market,
Loka Abaya (moist Kola), and used for rearing purpose. The Doe was on its seventh parity produced one single four
twins and one triplet kids.
5.5. Types of marketed goats and their price
According to the information obtained from the survey of production system who participated on
production system survey, out of 120 respondents 94 respondents or (86.1%) sold their goats in
the market and (13.82 %) at farm get for local traders (Table 31).
Goats of every age category (kids to old does, bucks castrates) age of goats were marketed at the
three selected primary markets. In Bokasso Market mainly breeding goats (pregnant does and
heifers, bucks) are purchased and sold for producers. Besides, meat goats particularly buck is
sold for traders coming from Tula and Yirgalem. In Hantate market, all age categories from kids
to old doe and goats with triplet litter size were seen in the market (fig. 15). It indicated that,
retaining the younger age, replacement stock prolificacy and the sex compositions of goats was
not considered farmers design their goats for sales.
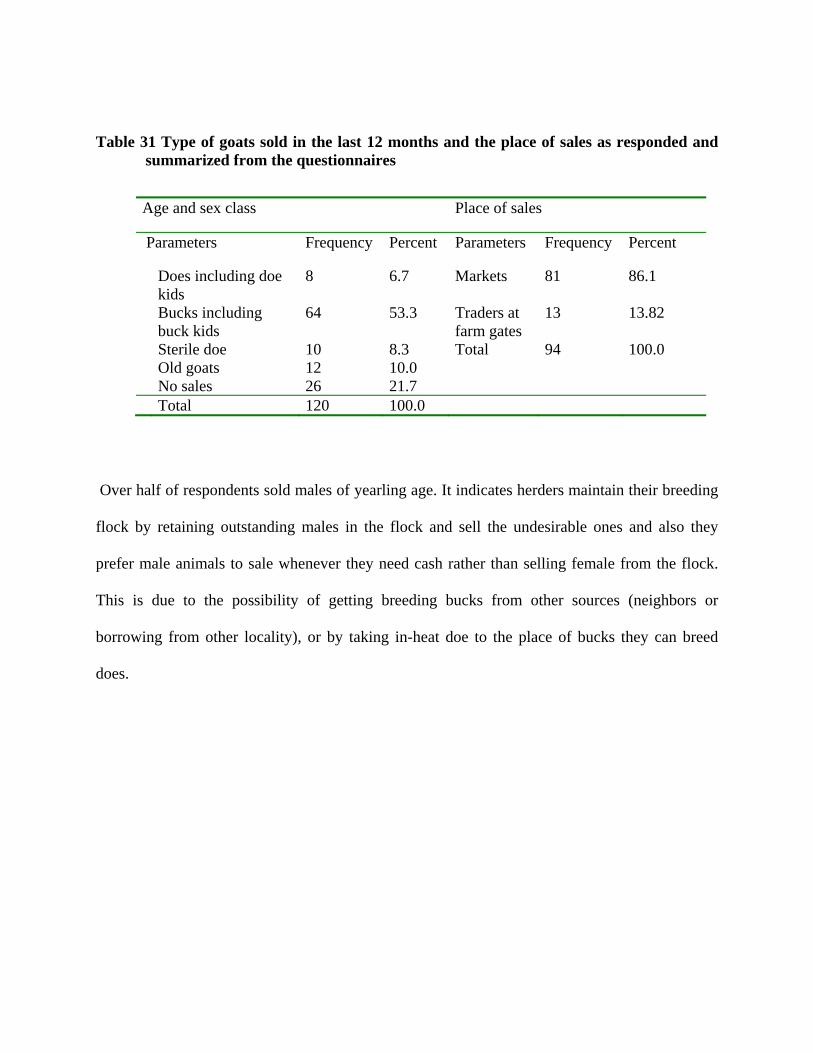
Table 31 Type of goats sold in the last 12 months and the place of sales as responded and summarized from the questionnaires
Age and sex class Place of sales
Parameters Frequency Percent Parameters Frequency Percent
Does including doe kids
8 6.7 Markets 81 86.1
Bucks including buck kids
64 53.3 Traders at farm gates
13 13.82
Sterile doe 10 8.3 Total 94 100.0 Old goats 12 10.0 No sales 26 21.7 Total 120 100.0
Over half of respondents sold males of yearling age. It indicates herders maintain their breeding
flock by retaining outstanding males in the flock and sell the undesirable ones and also they
prefer male animals to sale whenever they need cash rather than selling female from the flock.
This is due to the possibility of getting breeding bucks from other sources (neighbors or
borrowing from other locality), or by taking in-heat doe to the place of bucks they can breed
does.
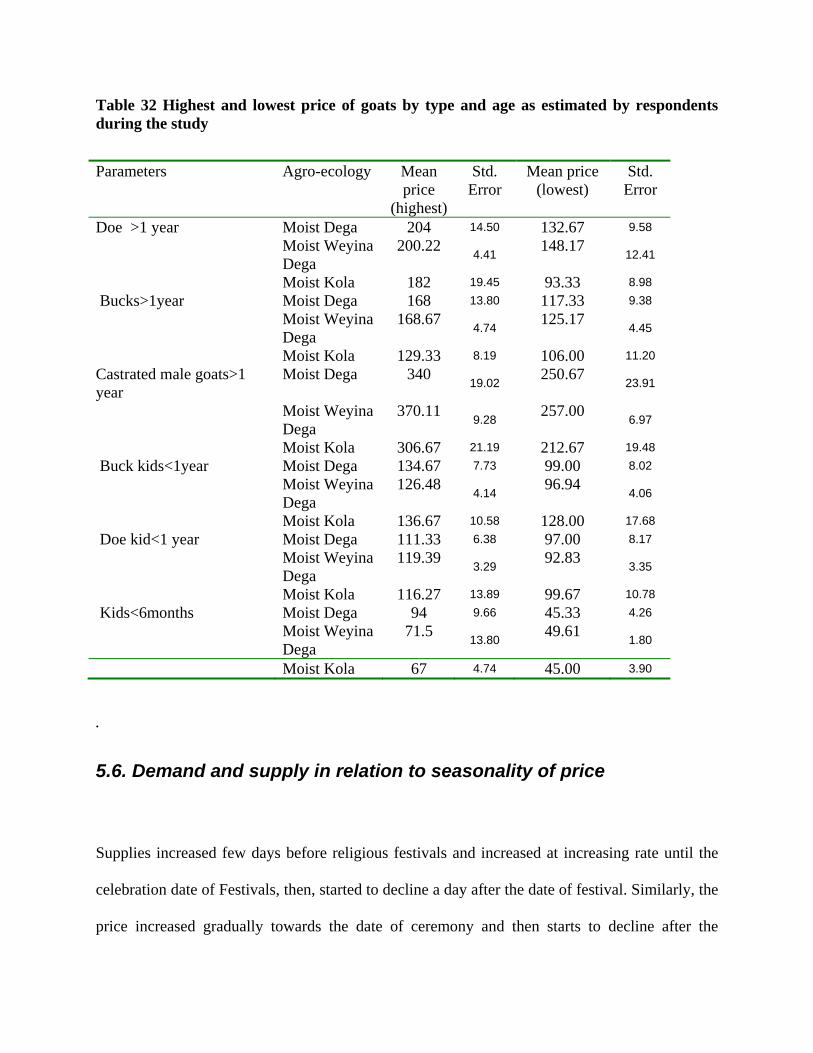
Table 32 Highest and lowest price of goats by type and age as estimated by respondents during the study
Parameters Agro-ecology Mean price
(highest)
Std. Error
Mean price (lowest)
Std. Error
Doe >1 year Moist Dega 204 14.50 132.67 9.58 Moist Weyina
Dega 200.22 4.41 148.17 12.41
Moist Kola 182 19.45 93.33 8.98 Bucks>1year Moist Dega 168 13.80 117.33 9.38 Moist Weyina
Dega 168.67 4.74 125.17 4.45
Moist Kola 129.33 8.19 106.00 11.20 Castrated male goats>1 year
Moist Dega 340 19.02 250.67 23.91
Moist Weyina Dega
370.11 9.28 257.00 6.97
Moist Kola 306.67 21.19 212.67 19.48 Buck kids<1year Moist Dega 134.67 7.73 99.00 8.02 Moist Weyina
Dega 126.48 4.14 96.94 4.06
Moist Kola 136.67 10.58 128.00 17.68 Doe kid<1 year Moist Dega 111.33 6.38 97.00 8.17 Moist Weyina
Dega 119.39 3.29 92.83 3.35
Moist Kola 116.27 13.89 99.67 10.78 Kids<6months Moist Dega 94 9.66 45.33 4.26 Moist Weyina
Dega 71.5 13.80 49.61 1.80
Moist Kola 67 4.74 45.00 3.90
.
5.6. Demand and supply in relation to seasonality of price
Supplies increased few days before religious festivals and increased at increasing rate until the
celebration date of Festivals, then, started to decline a day after the date of festival. Similarly, the
price increased gradually towards the date of ceremony and then starts to decline after the
celebration of the religious holidays.
According to the data collected during a week of Ethiopian Christmas on December 26, 1999 E
C. (477 goats) entered the market, it was the highest number compared to the data collected on
ordinary market days in Hawasa market from November to February, also the market day on the
last week of Easter, Hawasa market was monitored again and found that more than 760 matured
and more of male castrated goats were counted entering Hawasa market on Thursday. However,
an average number of goats entered Hawasa market during this study period were 235 during
ordinary market day.
According to the information obtained from producers and traders, the cheapest time of the year
was May to July and to some extent August. This time is the season for Enset plantation and
Moist Kola farmers during this time are at maximum need of money, in order to purchase Enset
seedlings from highland farmers and farmers at Moist Dega and Kola require input like fertilizer
and improved seeds particularly maize and haricot bean.
On the other hand, September is the time for the children to go to school and, farmers need
money to purchase necessary items and pay school fee. In Moist weyina Dega, some farmers
purchase food items by selling their goats during May and June until the back yard maize
matured and reached for consumption.
Goats are the major sources of cash that are sold in higher quantity during these months.
Accordingly, the supply increased beyond the amount that was ordinarily demanded by
consumers and has a direct effect on current price. Thus the price during these months was much

lesser than that of other months in contrast the supply was higher than other times.
So goats are the most salable animals among livestock species at house hold level, that are used
as pocket cash during the time of shortage and no one look for the better price rather than solving
urgent problems. Furthermore, a large supply of goats and low number of buyers in the market
influence the price of these months when compared to other seasons, Farmers loose bargaining
power and sale their goats for the price that is mainly determined by buyers.
There was also the time for expensive prices of goats; and is mainly associated with coffee
collecting time (October up to December). Money is available at hands of most people in the
coffee producing midlands of Dale (moist weyina Dega), except the two extremes (the area
around Lake Abaya at western part of the district, and the extreme highlands bordering Bale of
Oromia and Arbegona district from Sidama Zone).
During this period, producers purchased goats for two main reasons. Firstly, to accumulate
wealth obtained from coffee sales and to preserve for the time of deficit. Secondly, it is the
harvesting time for the crops like maize, haricot bean and sweet potato in moist weyina Dega and
wheat and barley for moist Dega areas. With the intention of some farmers to carry out short
term fattening program, goats with poor body condition (emaciated due to the shortage of feed)
are purchased from other producers and fattened by high plane of feeding which, in turn benefit
from compensatory growth. The feed resources used for this are the post harvest residues or the
grain part of maize and haricot bean as a feed supplementation.
5.7. Market routes and marketing chains
Respondents identified two market routes. The first one begins from the eastern part from Moist
Dega at the border of Sidama and Bale (from Kokosa district of Bale zone). Mainly sheep and
some goat come from this area and marketed at Bokasso market (Moist Dega Wonsho). Local
Traders purchase these goats and trek to Tula terminal market through Shebedino and sale for
butcheries and hotel owners coming from Hawasa. And some traders trek to Yirgalem, Aleta
Wondo and Chuko to sale for butcheries Hotels and restaurants (Table 32).
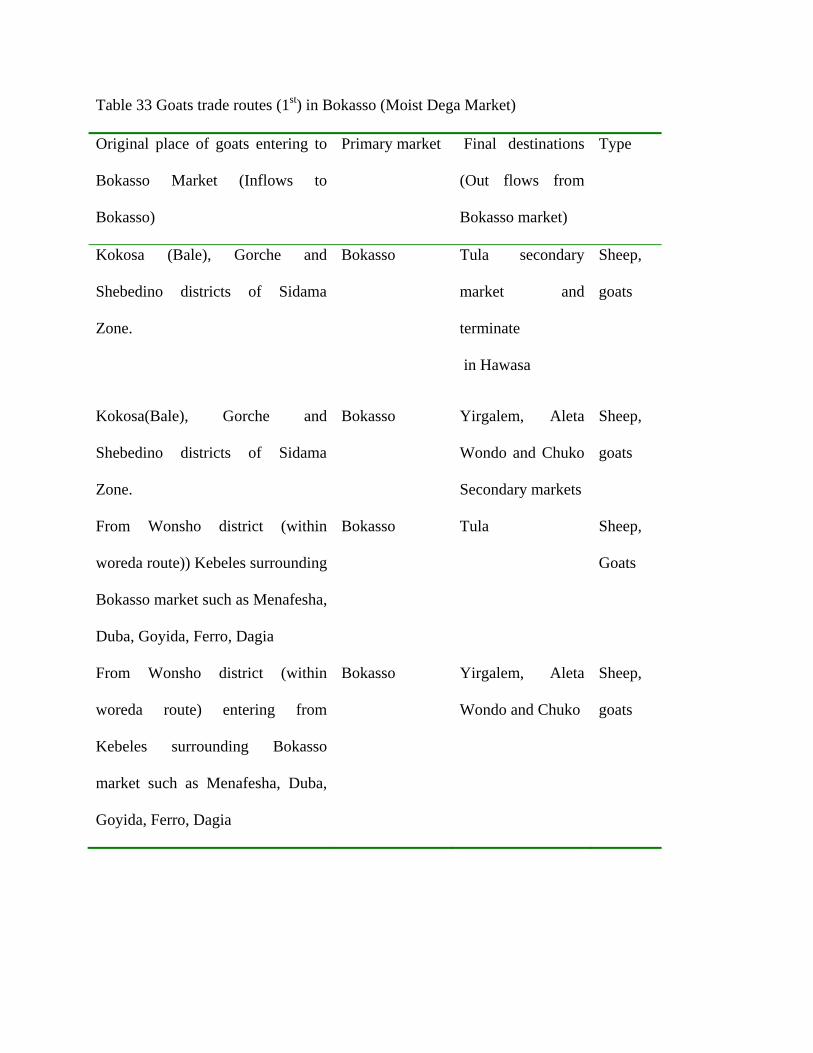
Table 33 Goats trade routes (1st) in Bokasso (Moist Dega Market)
Original place of goats entering to
Bokasso Market (Inflows to
Bokasso)
Primary market Final destinations
(Out flows from
Bokasso market)
Type
Kokosa (Bale), Gorche and
Shebedino districts of Sidama
Zone.
Bokasso Tula secondary
market and
terminate
in Hawasa
Sheep,
goats
Kokosa(Bale), Gorche and
Shebedino districts of Sidama
Zone.
Bokasso Yirgalem, Aleta
Wondo and Chuko
Secondary markets
Sheep,
goats
From Wonsho district (within
woreda route)) Kebeles surrounding
Bokasso market such as Menafesha,
Duba, Goyida, Ferro, Dagia
Bokasso Tula Sheep,
Goats
From Wonsho district (within
woreda route) entering from
Kebeles surrounding Bokasso
market such as Menafesha, Duba,
Goyida, Ferro, Dagia
Bokasso Yirgalem, Aleta
Wondo and Chuko
Sheep,
goats

The second route is the bigger in number of goats marketed. It is from the western part of Dale
district from the Moist Kola Agro pastoral communities in Felka, Foka bedelicho and Bokito
Kebeles, (Fig.33) via Foka Bedelicho and Gorbe (Small farm gets traded by local traders at Loka
Abaya District) and trekked to Derrara a small town in Boricha district, it is the all commodity
market accommodating all livestock species but, goats in higher quantity. Traders collect goats,
go through Dimtu (Wolayita), Boricha, and Lokke and finally terminate at Hawasa terminal
market.
Table 34 Market routes (2nd) at Loka Abaya Moist Kola
Producers original place and inflow of
goats to Hantate Market (Loka Abaya)
Market
place
Type
of
animal
Destination (outflow from
Moist Kola (Loka Abaya)
Felka, Foka Bedelicho and Bokito
Agro pastoral community in moist
Kola, Loka Abaya
Hantate Goats Derara market at Boricha
district to Yirba, Leku and
Tula Secondary markets
Felka, Foka Bedelicho, Aldebo and
other Kebeles around Hantate
Hantate Goats Tula and Hawasa
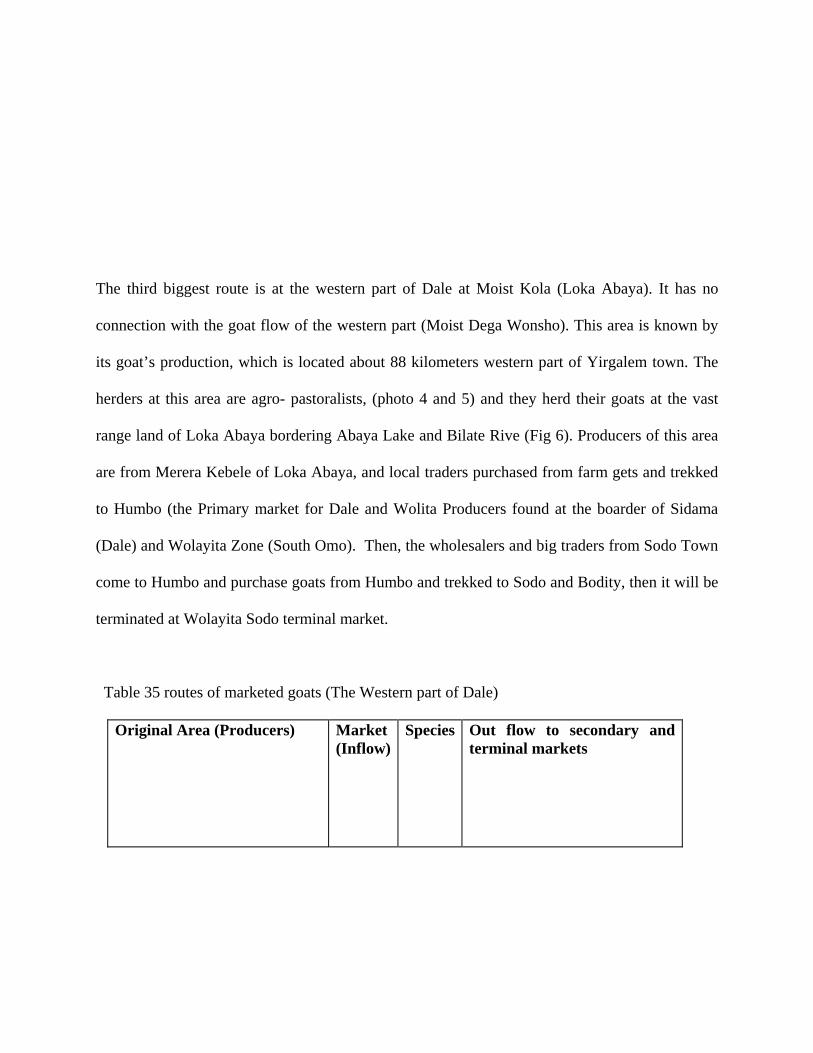
The third biggest route is at the western part of Dale at Moist Kola (Loka Abaya). It has no
connection with the goat flow of the western part (Moist Dega Wonsho). This area is known by
its goat’s production, which is located about 88 kilometers western part of Yirgalem town. The
herders at this area are agro- pastoralists, (photo 4 and 5) and they herd their goats at the vast
range land of Loka Abaya bordering Abaya Lake and Bilate Rive (Fig 6). Producers of this area
are from Merera Kebele of Loka Abaya, and local traders purchased from farm gets and trekked
to Humbo (the Primary market for Dale and Wolita Producers found at the boarder of Sidama
(Dale) and Wolayita Zone (South Omo). Then, the wholesalers and big traders from Sodo Town
come to Humbo and purchase goats from Humbo and trekked to Sodo and Bodity, then it will be
terminated at Wolayita Sodo terminal market.
Table 35 routes of marketed goats (The Western part of Dale)
Original Area (Producers) Market (Inflow)
Species Out flow to secondary and terminal markets

Merera agro pastorals in moist Kola Loka Abaya District
Humbo Goats Bodity, Boloso Sore (North Omo) and Wolayita Sodo secondary and terminal markets
Merera agro pastorals in moist Kola Loka Abaya District
Dimtu Goats Dimtu to Tula and Hawasa through Lokke
Merera agro pastorals in moist Kola Loka Abaya District
Dimtu Goats Dimtu to Yirba and Leku secondary market Tula and Hawasa
Marketing channels is a particular flow line of livestock and is identified by the market
participants. The marketing channel known by small stock farmers at primary market level, were
producers to producers, producers to local consumers, and producers to local traders and
wholesalers to consumers. Local traders and some individual consumers from Yirgalem, Leku
and Boricha towns purchase goats from producers at Bokasso Market. The first channel is
producer to local traders and then reached to consumer, the second is producer to other producers
using for different purposes and the third channel is from local traders to Wholesalers coming
from Yirgalem and Tula Secondary markets and finally reached consumers hand directly or
through butcheries and restaurants in terminal market Hawasa. The fourth channel is from
producers directly to consumers coming from Yirgalem and near by peri urbans.
1 Producers at Bokasso Local traders
2 Producers at Bokasso producers from other KA (for rearing)
3 Producers at Bokasso local assemblers from Yirgalem, Wondo and
Chuko
4 Local traders Wholesalers Consumers

But at terminal level in Hawasa and Sodo, the channel connected with butchery houses selling
raw and cocked goat meat to consumers, which are known, by their local name Fiyel tibs house.
Some passed through municipality Abattoirs and reached the consumers in legal way or Goats
also slaughtered in restaurants at a higher number with out entering the standard abattoirs, and
also there are individuals that purchased goats from terminal markets (Hawasa and Sodo towns)
and slaughtered in their home.
The data collected from Hawasa market from November1st to February 2007 for four months
indicated that, A mean number of goats entered in to Hawasa market through the three routes
were 275 per market day; it indicated that more than 550 goats per week and a total of 2200
goats per month entered through the three routes, disregarding the number of sheep entering the
market per market days. On other hand, the number of butchery houses before five years
(2003/2004) were 62 and recent information showed that 154 Restaurants and Hotels are
providing goats meat in the form of raw and cooked meat. This butcheries slaughter mainly
castrated and fattened steers and goats both castrated and un castrated.

5.8. Market infrastructures and marketing information
The market players mostly known by farmers are local traders and individual consumers. The
majority of flock herders (42.5%) of respondents informed about the existing situations of price
from market, (48.3%) from neighbors and the rest (9.2%) of the respondents get marketing
information from agricultural offices.
Discussions with small stock owners and market participants indicated that, they were not aware
of current market prices, out of their residential sites, how ever, Farmers in moist Dega (Dale
district) have better advantage of getting current information on goats marketing because of
being close to Hawasa town.
Primary markets at moist Dega (Wonsho) and moist weyina Dega (Dale) have no fence, where
as, Loka Abaya (Hantate market) has a fence and it can accommodate more than 500 animals at
once. On the other hand, the secondary markets at Yirgalem and Tula have fences with out any
other structures. The purpose of fencing is mainly to control animals in order to collect taxes by
waiting at the point of out let, taxation is a must, whether the cattle is sold or not the one who
come with the cattle should pay one Ethiopian birr per goat.
5.9. Consumption patterns, preference and market prospects of meat goats
Trends in consuming goat meat in rural areas have long time existence, however there are some
people in moist Dega (Wonsho area) in ancient time that traditionally refused consuming goat

meat. Most of the people in the study site discussed about the medicinal value of goats meat.
They culturally know Goat meat by its medicinal value, however it was not so far verified by
research work.
In Yirgalem and Hawasa towns before five years commonly large ruminants are used for meat in
butchery houses, in recent years butcheries started to provide goat’s meat equally with beef as an
alternative meat source for their consumers and goat meat became equally preferred by
consumers. The number of butcheries and restaurants currently using goat’s meat were 25 in
Yirgalem town. All butchery men interviewed were using goat’s meat in their butcheries and
67% of restaurants and caterers were slaughtering goats and sheep and provide to their customers
cooked goat meat and edible offal’s in the form of Dullet. According to discussion with the
owners and people involving in the activities, goat carcass has more dressing percentage than
sheep and also the quality of goat meat is better than sheep having a larger proportion of red
meat instead of having more fat. An experienced butchery men at Yirgalem town showed that,
the exceptional quality of goat’s meat is the distributions of fat through out the body instead of
being accumulated in specific areas like cattle and sheep. So that, the overall distribution of fat
makes goat meat every parts highly palatable, and no or little amount of refusals (wastes)
discarded from the carcass and /or offal’s of slaughtered goat.
The increasing price of large ruminants in turn increase the price of mea goat t, people
accustomed consuming cooked goat meat in the butcheries and restaurants which was not
commonly practiced before ten years. The number of goat meat butcheries before five years were
15 but now the total number of butcheries slaughtering goats together with cattle is 154
excluding the number of restaurants and Hotels preparing food from goat meat. Similarly, the
price of goats meat in 2003was 16 birr but now it is 36, an increase by 225% with in 5 years of
period. In the same way the price for a medium weight and age of meat goat before five years
was estimated by participants to be 80-120 birr, but know the highest price for middle age
castrate goat was estimated to be 250, 257 and 212 in Bokasso (moist Dega at Wonsho district),
Gane (moist weyina Dega, dale district) and Hantate (Loka Abaya district at moist kola) markets
respectively. The price is changed and increased at secondary market (Tula) and terminal market
in Hawasa town.
The owners of restaurants in Yirgalem town were asked and most of the respondents (88%)
indicated that, they purchased goats for slaughter from Gane market and some times sheep from
Bokasso primary market. There are seasons for cheapest price (July, June and august) but this
time is also not convenient for restaurant owners, because the demand for goat meat is very low
due to the shortage of money at the hand of consumers both in urban and mainly in rural. Most of
the people in the rural couldn’t purchase cooked meat or row meat from butcheries during this
season. The shortage remains consistent until the maturity and on set of garden coffee in the
backyard.
The price for fattened bull and steer is escalating from time to time; this condition gives way for
complementary products like mutton, goat and poultry meat. Reasonable price and availability
together with its small size makes goats to be slaughtered in the family house or it can be
slaughtered in-group by sharing money together.
5.10. Constraints and opportunities in goats production and marketing
Since the study area especially moist kola (Loka Abaya) is with the highest goat potential, and
far from urban centers, it needs strong marketing linkages with buyers other than local traders
and local butcheries. Attachments with goat exporters, meat processing factories and related big
assemblers, may help the producers to get appropriate price for their production and minimizes
the money lost in the middle due to unnecessary involvements of middlemen and local traders.
Herders were not market oriented; they didn’t consider when to produce goats, even the
preferable time of sales was not considered by a majority of the farmers. They clearly discussed
that, flock holders sale their goats if and only if they face money problem. No other alternate
source of money put aside for emergency cases during money available time especially during
coffee harvests. They consider goats as the main source of cash and sale them not by looking for
proper market and appropriate time, but they sale as they face money problem.
During price determination, the cost of production like feed, water, mineral supplement, housing,
veterinary and labor costs provided by the hose hold and his family members did not taken in to
account. Feed from farm, family labor and herbal medicine that was provided from traditional
hillers was not included as a cost of production. So that, farmers do not consider the price of
goats on the basis of costs incurred to grow or fatten the particular animal.
During our field assessment, we observed that, some farmers have a great potential and suitable
ground to handle goats for commercial purposes. But, they were rearing below the potential of
their resource (Feed, house family labor and the proximity to market etc.), they know little about
their future goat’s buyer, there was no pre hand negotiating system of marketing. Selling and
buying process completed in the market between unknown dealers and no pre- hand or post sales
agreements (like returning the defective goats back to the owner or re considering the situations
before sales once the sales process is over.
Lack of adequate and timely information on price, demand and supply of goats was another
problem; the main sources of information are market and neighbor to neighbor communications.
It is very limited and not adequate to tell the recent information about the current price of goats,
the type of market participants and the existing market channels of meat goats that are currently
working in domestic as well as export markets. Although the timeliness and consistency is not
clearly known, traders get more information than producer’s since they are moving from one
market to another and they are from the urban centers. So that, producer’s sale with out knowing
the current price and demand of their goats. Especially herders living in the moist kola (Loka
Abaya), are far from the information about the current marketing situations, they know only the
part of the local price and accept the price determined by the traders coming from urban centers.
Transportation problem and in adequate infrastructure are the major problems identified during
discussions with traders. Due to inaccessibility to road and distance from urban centers as well as
from big livestock markets, they trek animals over longer distance without adequate water and
feed. As a result, goats loose weight , which in turn reduce price as well as profit.
There are no private or governmental enterprises or cooperative associations working on
livestock marketing or other related livestock sales and purchasing activities. Most of the small
holders in the study site were not the members of any small stock associations or any type of
marketing institutions except farmers at Moist Weyina Dega and Dega participating in coffee
producers cooperatives. So they were fragmented to help each other to overcome the production
and marketing problems. Unorganized nature of the markets resulted on the problems of
fragmentations, which are believed to be among factors hampering successful small stock
marketing and better marketing channel.
6. Summery and Conclusion
6.1. Summery
Assessment on production system and marketing of goats in Dale district was carried out in the
three agro ecologies, comprising one Kebele in Wonsho, Moist Deg, six Kebeles in Dale, Moist
Weyina Dega and one Kebele from Loka Abaya Moist Kola agro ecologies. The overall
objective of the survey is to study and describe production systems and marketing in mixed
farming areas of Dale. The data collected from survey will be used to describe small ruminant
production systems and the production potential of the area and to identify constraints and
opportunities for goat’s production and marketing. Formal survey, focus group discussions and
flock monitoring techniques were used to collect data from August 2006 to March 2007.
Information obtained from 120 sample goat holders included household characteristics and
resources, socio economic features, traditional goat keeping systems and purposes of keeping
goats, feeding systems, feed resources and systems of feed utilizations, health and diseases of
goats, reproduction performances, flock dynamics, flock monitoring and other routine
management aspects related to goat production systems. Information on marketing systems and
market routes, marketing channels and market players, seasonality of prices in relation to supply
and demand of goats were collected and described using Rapid Marketing appraisal (RMA).
The overall mean family size per household was 7.5±0.247, was not significantly different
(P<0.05) among the three agro-climatic zones considered in this study. An average land holding
per household was significantly different in the three-agro ecology (P <0.001). On average,
households in moist Dega (Wonsho) possessed significantly large land (2.18hectare/hh) than
those in Weyina Dega 1.27 hectare/hh (Table1). The average value for Kola was 1.77 hectare /
household. Due to small land size and large family size per household, the ratio of family size to
house hold land holding was significantly high in moist weyina Dega than sparsely populated
Dega and Kola agro ecologies.
Average livestock holdings per household in Moist Dega (9.4 animals per household) and
weyina Dega 11.87 animals per household were comparable but were less than the value for an
average household (24.5 animals per household) in moist Kola district (Table 2). On the other
hand, livestock to land ratio per household for Dega is significantly lower than the livestock
density per hectare per household in the other two agro ecologies. Relatively low livestock
holdings coupled with large land area per household in Dega is due to the movement of flock
from the Dega agro ecology to the lowlands around Lake Abaya during the dry season in search
of grazing, and this may have also contributed to fairly low livestock density in the Dega
ecology.
All the four categories of livestock species (cattle, sheep, goats and donkey) are found in all the
three agro ecologies but species composition varies depending up on the type of climate. Cattle
and goats constitute equal proportion to the livestock density in Kola and Weyina Dega. In the
Dega, however, cattle are given first priority and sheep are as important as goats accounting
nearly 50% of the livestock density. Keeping goats in the study area is for multi purposes, the
Moist Kola (Loka Abaya) herders keep goats mainly as a means of savings, selling goats as a
means of household income was, the second important reason of herding goats (figure 5). In
addition to these two major reasons, farmers also viewed the uses of goats for milk production
(13.3%) meat (10%) or both (1.7%) On the other hand, only (1%) of respondents consider goats
as a sign of social status (prestige) Besides these major reasons, in Moist Weyina Dega some
respondents (2.5%) used goat’s manure for fertilizer. Farmers with no cattle reared goats for the
purpose of manure, because, enset, the staple food of the people in the study area, particularly at
its early growing stage require high amount of manure.
In all the three agro ecologies of Dale district, the breeding season for goats is from March to
April (39.4%) and September to October (49.2%). Some of the respondents reported that goat’s
breed throughout the year (Table 4). The major reasons for seasonal breeding are the availability
of feed and the warmer climate that favors goats to on set heat during these months. Goats that
are conceived during these months will be expected to kid during September and October.
Similarly, on September and October, annual crops (like maize) are on the young stage, the
family used the grain part for consumption and the leftover is used as a feed for goats. In
addition, sweet potato vine, weeds from haricot bean and coffee are feed supplements for

midland cash cropped area of Dale. Thus, goats conceived during these months and deliver
between March and April.
The over all mean for AFM is 9.76±0.243. There is no significant difference (P< 0.05) among
the three agro ecologies regarding age at first mating. Sidama goat types at Loka Abaya reached
puberty at 8.3 months which is the lowest estimate among the three agro ecologies as well as the
reported estimate of Workneh, (1992) which is below 12 months for the same goat type.
Significant variation was shown on age at first kidding between moist kola (13.73±0. 6 and moist
Dega Dega16.13±0.7. The over all mean for the three agro ecologies was 257±0. 16 days. The
mean kidding interval for Loka Abaya Sidama type goats in Moist Kola was 234± 0 .352 days
that is significantly lower (P< 0.05) than the other two agro ecologies. The reason for having the
lowest kidding interval in Moist Kola was assumed to be the presence of communal rangeland,
the availability of browsing shrubs and the free ranging system of goat feeding.
The over all mean age at weaning is 5.19±0.124 months. Similarly, the moist Kola goats weaned
at age of 4.3. ±0 .316 months that is significantly lower (P<0.05) than Moist Dega agro ecology.
The reason was discussed with key informants and it is feed availability in Kola (Loka Abaya)
area, farmers completely allow the kids to suckle their does. Moist Weyina Dega has
significantly lower weaning age 5.09±0.129 months (P<0.05) from that of Moist Dega but no
significant difference was reported with Moist Kola (Table 6). The highest litter size was
reported in Moist Kola 2.33 ±0.347, which is significantly higher than the other two-agro
ecologies and also higher than the overall average litter size (1.3) reported for Arsi Bale goat
type by Farm Africa, (1996). Mean age of lifetime kidding (Parity) is 13.05±0. 3 year. In Moist
Kola, parity is longer than the other two-agro ecologies and it is significantly higher age of
lifetime kidding that contributes for high number of kids per doe.
Feed resources and the system of feeding vary according to variations in agro ecology. In Moist
Kola, browse species are the main sources of feeds for goats. In moist Weyina Dega (Dale) the
majority (65.5%) of the respondents indicated that, the major feed for goats is crop residues from
parts of Enset, Banana, chat, sweet potato haricot bean, weeds and thinning of annual crops.
Because of the shortage of browsing land, tethering system of management by using cut and
carry system of feeding became a common system of tending goats in Moist Weyina Dega and
Dega agro ecologies. Especially during the rainy season, when most people are engaged in other
farming activities tethering is help full in reducing the demand of labor. Extensive system of
tending goats is dominant in Moist Kola Loka Abaya where free ranging of goats is popular. The
system is advantageous for goats since it gives chance to select and freely forage from the
bushes.
Diseases like Trypanosomosis, heart water, goat and sheep pox and parasites are the common
diseases affecting goat’s production in all the three agro ecologies. In moist kola
Trypanosomosis is an important disease, where as heart water and internal parasites are the
common diseases in Moist Weyina Dega and Dega agro ecologies. About 35.8% of the
respondents reported a lack of veterinary clinic as the major problem, 20.5% the shortage of
veterinarians, and 20% showed inaccessibility to the road, and 14.2% high price of drugs. A few
respondents (2.5%) showed the shortage of medicine as the main problem.

There are four primary goat markets in the district. Bokasso market represents the moist Dega
agro ecology, mainly dominated by sheep and followed by goats. Naramo Dela is bigger than
Bokasso and dominated by goats mainly marketed for meat purposes. Hantate is the big market
for goats. The predominant species is goats entering from agro pastoral societies like Merera
Kebele around lake Abaya. The marketing routes are identified in the district are of three origins.
The first one start from eastern highlands bordering Oromia (Bale zone), and flow in to Bokasso
Market and out flow from Bokasso Market through two directions. Tula, secondary market is the
main out flow of goats from Bokasso Market and Yirgalem and Aleta Wondo towns are the
second out flows of goats from this market. The main marketing channels are producers to
producers, producers to local traders and then reach to consumers, from producers directly sold
to consumers and from traders to whole sellers and then to consumers.
The price of goats fluctuates according to seasonal variations and religious holydays, during
coffee harvesting season the price for goats is relatively high and falls down after coffee season.
The time one week before and after religious holydays like Easter, Christmas, Meskel of
Christians and Id al Arefa and Ramadan of Moslems and the Ethiopian new year, the price raised
up and falls down a few days after the celebration of these holydays.
The main marketing problems reported by producers are lake of infrastructures like road,
shortage of the means of transportations, lack of information for the producers in Loka Abaya
(Merera and Felka) about the current price of goats in Hawasa and in other secondary and
terminal markets.

In general, the problems identified by respondents as the main factors affecting goats production
and marketing system are lack of feed, disease, shortage of land and inaccessibility to big
livestock markets are the most important problems in their order of importance. Having high
potential for goat’s production and suitable environment to develop small scale and subsistence
goat farms to market oriented and big goat production sectors is the main opportunities that were
identified by participants in the study areas.
6.2. Conclusions
Considerable differences were seen among the three agro ecologies. In moist Kola livestock
holdings indicated that the area having highest potential than the other two-agro ecologies. And
it has a potential for goats production. Goats in Moist Kola have appreciable reproductive
performances such as: early maturity, short kidding interval, high litter size, short weaning age
and weight, extended lifetime kidding (parity) as well as medium body conformation serving for
multi purposes and it is extensively milked as compared to the other two agro ecologies and
goats in other locations. These peculiar characters have paramount importance for goat keeping
agro pastoral societies and crop livestock producing smallholders in Moist Weyina Dega and
Dega. Further research investigations are essential in order to identify and select the superior and
economically important traits with in this eco type. Thus, livestock research institutions and
other related organizations should intervene in improving this eco type in order to utilize our
indigenous breed potential.
Crop livestock integration in Moist Weyina Dega and Dega is an important factor that enables
smallholders to obtain benefits from compensatory productions of the two sectors. Goats are
important integral parts among livestock in these densely populated crop livestock producing
areas, as tethering is the most adapted practice of management. Goats can easily be adapted with
crop production since weeds and crop leftovers and residual parts of perennial crops (Enset and
Chat) are cut, carried and provided to tethered goats. On the other hand, farmers with no cattle
keep goats to utilize their milk for their children and manure for their crops. Thus they are a good
substitute for the resource poor smallholder who cannot afford money to buy milking cow.
Interdependence between goat and crop production is supportive to overcome the problem of
land shortage, and it encourages the involvement of all the family members in providing feed for
goats and develops the division of labor among family members in the different sectors of
household farm activities.
Dale in general, has high potential feed resources for goat’s production. Although, goats are
more herded by agropastoral society in Moist Kola (Loka Abaya) they are well adapted and
serve for all the three agro ecologies. As observed by this study, goats perform better in moist
kola on the extensive free foraging system of management. In this agropastoral area, the main
problem is bush encroachments that are invading the palatable shrubs and bushes; thus, applying
systematic bush control strategies could solve the problem. Moreover, in Moist Weyina Dega the
availability of feeds from crop fields and back yards are useful and contribute for the better
performance and production of goats in this cash cropped areas. Integrated crop forage
production especially under sowing legumes like cowpea with chat and desmodium species
under enset crop is important and it helps to utilize the same land for more than one crop with
out affecting the yield of the perennial crops. Crop forage integrations were seen in Moist
Weyina Dega around Dale district on the backyard crop- forage production experienced by a few
farmers and they are using some tree legumes like pigeon pea, sesbania, leuceanea (also used for
coffee shade) by integrating with coffee, and some legumes like desmodium and cow pea with
enset and chat crops. These strategies are encouraging and should be supported by further
research works in order to verify which type of forage makes the best possible integrations with
these types of perennial and annual crops.
Two major diseases of goats namely trypanosomisis and sheep/goat pox was identified as the
major disease in Moist Kola, and Heart water and some parasitic infestations in Moist Weyina
Dega and Dega agro ecologies. Goat pox can easily be prevented through one time per two years
mass vaccination. Once goats are vaccinated against goat pox they can develop anti bodies that
will protect them up to two years. The vaccine is produced in Debre Zeit and it is freely
available. Hence, the only thing needed from the technical staff is timely arrangements of
vaccine program not only for this particular disease but also for other infectious diseases that can
be controlled by vaccines. On other hand, Trypanosomosis is economically important disease
affecting the wider range of flocks at agro-pastoral societies. The seasonal mobility of the
herders to protect their flock from tsetse-infested areas to cooler highlands is an appreciable
strategy. Besides this strategy, organizing herders in to cooperatives will be useful that would
help them to control tsetse by using acaricide. In this aspect the attempt of IPMS and WARDCO
in organizing herders in to tsetse controlling cooperatives is a good start but still it needs close
monitoring and supervision. As discussed with key informants at Felka Merera and Bokito
Kebele agro pastoral societies in Loka Abaya, herders could identify the right time of infestation
and they know more about actual period of tsetse multiplications and the area that is more
favorable for tsetse reproduction. Therefore, applying technical veterinary support and
encouraging the participation of the flock herders by selecting and training the Para-vets in tsetse
controlling program will be a useful strategy to overcome the hazards of the disease. Heart water
and parasite infestations are another problems affecting production of goats in Moist Weyina
Dega and Dega areas. Applying available veterinary services using the newly established
Farmers Training Centers (FTC) and the animal health graduates of agricultural and vocational
training centers will solve the problem. Furthermore, flock herders at Loka Abaya are using
traditionally known herbal medicines to treat their sick goats. Further research works are
essential in order to identify anti microbial or other effects of this area herbal drugs, and research
results and feedbacks on the amount and system of applications etc. will encourage to use the
indigenous knowledge of the herders and it will be supportive to the herders to solve their
problems by themselves using locally available traditional healers.
Inaccessibility of some area (Loka Abaya, Felka and Merera agropastoral goat herders) for
markets and urban centers is a crucial problem for marketing their goats. Herders of Merera and
Felka Kebeles travel more than 82 and 20 kms, respectively to bring their goats to Hantate
livestock market; otherwise, they have to sale their goats at farm gate or at Humbo (Semen Omo
Zone) market. So that, herders may discourage to engaged in market oriented production and
they fell to target market value while rearing goats and they couldn’t benefit from the existing
market situations. This can be solved by Facilitating market opportunities by connecting the
marketing route of this locality with big market players (traders, wholesalers, processors or

exporters) and establishing big and standardized livestock market in near by areas of Loka Abaya
will encourage the herders to produce more and to emphasize on their goat flocks.
In general, Dale district has a great potential in goat resource and it is suitable for goats
production by having goats with important economic traits like good milk yield, reproductive
capacity and appreciable growth performances (>11kg weaning weight) with diversified crop
production. Huge number of goat population is found in Kola area. It was proved that during the
study period around 8,000 goats were vaccinated against goat pox in the four Kebeles namely:
Felka, Aldabo, Areda gale and Foka Bedelicho of Moist Kola agro ecology. Where as, central
statistics Authority (CSA 2003) reported only 17248 goats in 76 rural Kebeles, almost a half of
this number was counted in the above Kola Kebeles using vaccine dozens. Therefore, it is
essential to conduct a census of goats in regional or zonal level that avoids under or over
estimation and it helps to know the trend of goats; to plan for the resources needed like vaccines,
treatments, and skilled manpower.
Further research investigations regarding the breeding aspects to select and develop positive and
most important qualitative and quantitative traits will help the herders of the three agro ecologies
as well as the adjacent districts to benefit from their potential resources. The production and the
productivity differences as well as management variations among the three agro ecologies were
observed by this study. Problems such as feed, disease and market were identified and described
according to the differences in agro ecologies. Thus, it is proved that there were differences in
goats management system, in reproductive performances of goats, feed resources and feeding
system, health status and diseases occurrences, marketing and all aspects of management systems

among the three agro ecologies of Dale. Therefore, development strategies and interventions
should focus on the specific problems and opportunities of that specific location rather than
implementing the same plan, the same design and resource to different agro ecologies.

7.References Addisu Abera, Azage Tegegne and A.k.Banerjee. 2002. Slaughter component yield
characteristics of some indigenous goat breeds in Ethiopia. EJAP (Ethiopian journal of animal production) Volume 2 number 1 pp, 89-90.
Adugna T., et al., 2000. Nutritional constraints and future prospects for goat production in East Africa. The opportunities and challenges of enhancing goat production in East Africa, a conference held at Debub University, Hawassa Ethiopia, from November 10 to 12, 2000. p43.
African Research Network for Agricultural By-products (ARNAB). 1989. Overcoming constraints to the efficient utilization of agricultural by products as animal feed. Proceedings of the Fourth Annual Workshop held at the Institute of Animal Research, Mankon Station, Bamenda, Cameron, 20 -27 October 1987. ARNAB, Addis Ababa, Ethiopia
Agaje Tesfaye et.al. 2001 smallholder production system and constraints in the highlands of North and West Shewa zones. In: proceedings of Ethiopian society of animal production (ESAP). Vo.9 number 1 Addis Ababa, Ethiopia. p 49
Alemayehu Mengistu. 2003. Country pasture/forage profile. Addis Ababa University,
Faculty of Science, Biology Department. Addis Ababa Ethiopia. Armbruster T. and K.J. Peters.1993. Traditional sheep and goat production in south east Cote d’
Ivories. Small ruminant research 11(1993) pp29, 290 Ascalew Tsegahun, et.,al.,2000.National goat research strategy in Ethiopia. The opportunities and challenges of enhancing goat production in East Africa, a conference held at Debub University, Hawassa Ethiopia, from November 10 to 12, 2000. p43.
Ayele Solomon, Assegid Workalemahu, Jabbar M.A., Ahmed M.M. and Belachew Hurissa. 2003. Livestock marketing in Ethiopia: A review of structure, performance and development initiatives. Socio-economics and Policy Research Working Paper 52. ILRI (International Livestock Research Institute), Nairobi, Kenya. p16,20.
Benin S., Ehui S. and Pender J. 2002. Policies for livestock development in the Ethiopian highlands. Socio-economics and Policy Research Working Paper 41. ILRI (International Livestock Research Institute), Addis Ababa, Ethiopia. p20.
Carl Jansen and Kees van den Burg. 2004. Goat keeping in the tropics. Agrodok 7, fourth edition: Digigrafi, Wageningen, The Netherlands. ISBN: 90-77073-55-8
Christopher Delgado, Mark Rosegrant, Henning Steinfeld, and Simeon Ehui. 1999.
Christopher Delgado.2005. Rising demand for milk and meat in developing country,
international livestock research institute (ILRI) N.W. Washington D.C. 20006.USA
CSA.2003. Central statistical Authority, Ethiopian Agricultural Sample Enumeration, 2001/2002. Southern Nation Nationalities and Peoples Region. Statistical report on livestock and farm implements. Addis Ababa, Ethiopia. pp, 35, 43

Davies A. T. and C.F. I. Onwuka 2003. Conservation of forage for dry season feeding in the humid zone of Nigeria. Department of Animal Nutrition, College of Animal Science and Livestock. Production, University of Agriculture, P.M.B. 2240, Abeokuta, Ogun State, Nigeria.
Desta, Z.H.; Oba, G. 2004. Feed scarcity and livestock mortality in enset farming systems in the Bale highlands of southern Ethiopia. Outlook on agriculture. , v. 33(4), p.277-280. , 11 ref. ISSN 0030-7270.
E. M. Nyambati1, C.N. Karue2 and N.K.R. Musimba. 2003. The value of Acacia brevispica and Leucaena leucocephala seedpods as a dry season supplement for calves in arid areas of Kenya. Nairobi Kenya.
Ehui S.K., Ahmed M.M., Berhanu Gebremedhin, Benin S.E., Nin Pratt A. and Lapar Ma.L. 2003. 10 years of Livestock Policy Analysis. Policies for improving productivity, competitiveness and sustainable livelihoods of smallholder livestock producers. ILRI (International Livestock Research Institute), Nairobi, Kenya. 118 pp.
Frank Pinkerton and Lynn Harwell. (2002). Marketing Channels for Meat Goats. http://goats.clemson.edu/NC%20Handbook/market.htm
Getachew Gebru, Solomon Desta, and D. Layne Coppack. 2003. Managing risk in pastoral systems, research and out reach experience of the pastoral risk management. In: proceedings of ESAP (Ethiopian society of animal production) challenges and opportunities of livestock marketing in Ethiopia. Yilma Jobre and Getachew Gebru (Eds) 10th annual conference of Ethiopia society of animal production (ESAP) held in Addis Ababa. Aug.22-24 p149
Getahun Legesse, Marlanna Sigmund, Girma Abebe and Anne valle. 2006. Smallholder sheep and goat production system in southern Ethiopia. Opportunities and limitations. Prosperty and poverity in a Globalized World challenges for Agricultural Research. Bonn, Germany.
Getinet Ameha, et. al. 2005. Phenotypic characterization of goat types in northern Ethiopia. EJAP. Ethiopian journal of animal production.V.5 number 1. Addis Ababa Ethiopia p13.
Ghirotti, M. 1998. The role of livestock in mitigating land degradation, poverty and child malnutrition in mixed farming system: the case of coffee growing mid lands of Sidama-Ethiopia. Livestock and the environment international conference World
Girma Abebe, Roger C. Merkeland Tilahun Sahilu. 2002. Enhancing food security and income generating potential of families in Southern Ethiopia through improved goat production and extension, a progress report of an ALO-funded project. In: the opportunity and challenges of enhancing goat production in East Africa. A conference held at Debub University, Hawasa, Ethiopia from November 10to 12, 2000
Githiori, J.B.; Hoglund, J.; Waller, P.J.; Baker, R.L. 2004. Evaluation of anthelmintic properties of
some plants used as livestock dewormers against Haemonchus contortus infections in sheep. Parasitology (UK), v. 129(2), p.245-253. ISSN 0031-1820.
Henning Steinfeld. 2004. The livestock revolution—a global veterinary mission. Veterinary
parasitology. Volume 125 issues1-2. A selection of presentations given during the 19th international conference of the World Association for the Advancement of Veterinary Parasitology Food and Agriculture Organization, AGAP, Room C-542, Viale delle Terme
di Caracalla, Rome 00100, Italy.p19 Ibrahim Hussen.1998. Small ruminant production technique ILRI manual 3. ILRI. International
livestock research institute, Nairobi Kenya. Ikwuegbu,O.A. G. Tarawali and R. M. Njwe.1996. The role of the West African Dwarf goat in the
economy of the smallholder arable farmer in the sub humid zone of Nigeria. Proceedings of the Third Biennial Conference of the African Small Ruminant Research Network, UICC, Kampala, Uganda, 5-9 December 1994. ILRI (International Livestock Research Institute) Nairobi, Kenya. 236pp
Jaitner, J. and Sowe E., Secka Njie and L. Dempfle. 2001. Ownership pattern and management practice of small ruminants in Gambia- implications for a breeding program. Small ruminant research 40(2001)101-108. www.elciver. Com/locate/smallrumres
Lebbie,.H.B. 2004. Goats under household conditions. Small Ruminant Research (The Netherlands), v. 51(2), p. 131-136. ISSN 0921-4488.
Leeuw P.N. de. 2003. Crop Residues in Tropical Africa: Trends in Supply, Demand and Use. International Livestock Research Institute, PO Box 30709, Nairobi, Kenya
Lemma Gonfa.1996. Climatic classification of Ethiopia. Metrological research report series. Addis Ababa, Ethiopia, p45
Livestock Production Programe (LPP, 2005). DFID. Department for international development. http://www,smallstock.info//credits/dfid.htm
Livestock to 2020: The Next Food Revolution Claude Courbois http://www.fao.org/DOCREP/MEETING/004/Y7022E/y7022e00.htm
Mahanjan A.M. and Cronje P.B. 2000. Factors affecting production in a communal farming system
in the Eastern Cape region of South Africa. .South Africa Journal of Science 30(20) 150-151
Million Tadesse. 2003. Challenges and opportunities in livestock products and marketing in Southern Nation Nationalities and peoples region. A case study of Wolayita Zone. In: proceeding of the 10th annual conference of the Ethiopian Society of Animal production (ASAP) August 21-23, Addis Ababa, Ethiopia. P
Nsoso S.J. and Monkhei M. and Tihwaafalio. B.E. 2004. A survey of traditional small stock farmer in molepole North Kweneng district, Botwanan Demographic parameters market practices and marketing channel. Livestock research for rural development16 (12) Botswana p8
Nwafor, C.U. 2004. Anthelmintics use for small ruminant production in The Gambia: a participatory and economic benefit-cost analysis. Livestock Research for Rural Development. , v. 16(9), article 68. , 46 ref. ISSN 0121-3784.
Oguoma, N.N.O. 2003. Financing small ruminant operations along gender lines in Imo State, Nigeria. Journal of Agriculture and Social Research (JASR), v. 3(1), p. 13-28. ISSN 1595-7470.
Ogwang, ET. Al, B.H. 1996. Socio-economic aspects of goat nutrition in Swaziland. . Proceedings of the Third Biennial Conference of the African Small Ruminant Research Network, UICC, Kampala, Uganda, 5-9 December 1994. ILRI (International Livestock Research
Institute) Nairobi, Kenya. 236pp Pagot. J. 1992. Animal production in the tropics. Macmillan press. Paramasivam, A.; Arunachalam, S.; Sivakumar, T.; Ramesh, V. 2002. conomics of body growth in
Barbari goats under intensive, semi-intensive and extensive systems of management. Indian Veterinary Journal. , v. 79(12), p. 40-44. , 6 ref. ISSN 0019-6479.
Peter S. 1998. The international marketing of hides and skins and leathers. MoA/FAO, (Ministry of Agriculture/ Food and Agricultural Oganization.p44.
Rodrigueza,A., Lamaran, a. Muhammed, A., Nisar, A., Shahb and Usman M. Price expectations of sheep and goats by producers and intermidaries in quetta market, Pakistan . Agricultural economics Vol.12, issue1,Appril, 1995 p79
Senait Seyoum.1990. Economics of Small ruminant meat production and consumption issue. Small
ruminant research and development in Africa. In: proceedings of the first Biennine small ruminant research net work ILRI, international livestock research institute. Nairobi, Kenya.
Shiferaw, Y.; Yohannes, A. [Yoseph Shiferaw; Aster Yohannes]. 2002. Livestock husbandry and
management, health problems and ethno veterinary practices in Ghinchi, west Shewa zone, Ethiopia. In: Towards farmers' participatory research: attempts and achievements in the central highlands of Ethiopia. Proceedings of client-oriented research evaluation workshop. Keneni, G. (ed.); Gojam, Y. (ed.); Bedane, K. (ed.); Yirga, C. (ed.); Dibabe, A. (ed.) p. 325-337. , 7 tables; 6 ref. Ethiopian Agricultural Research Organization, Addis Ababa. Addis Ababa (Ethiopia) : EARO.
Siamba, D.N.; Muhuyi, W.B.; Muia, J.M.K.; Lukibisi, F.B. 2005. The role of Kenya dual purpose
goats in drought recovery and food security in marginal areas of Kenya. Tropical Science. , v. 45(2), p. 74-76. , 9 ref. ISSN 0041-3291.
Tatek Woldu, Hailu Dadi, Meiso Guru, and Dadi Galashe.2004. Productivity of Arsi Bale goats under farming management condition: a case study of Arsi Negele In; ESAP (Ethiopian society of animal production).The role of Agricultural universities in transforming animal agriculture in Education, research and development. Tamirat Degefa and Fekede Feyissa (Eds). Proceedings of the 13th annual conference of Ethiopian society of animal production. ESAP., held in Addis Ababa, August 25-27, 2004. ESAP, Addis Ababa Ethiopia. P69
Tefera Sertse and Abebe Wosene, 2006. A study on ectoparasites of sheep and goats in eastern part of Amhara region, Northeast Ethiopia. Small ruminant research. www.elsevier. Com/locate/small ruminants
Teresa Adugna. 2003. Factors influencing adoption of cross bred dairy goats. The case of three districts in Eastern Ethiopia. In proceedings of ESAP (Ethiopia society of animal production) 2004. Animal biodiversity in Ethiopia status and prospects. Asfaw yimegnuhal and Tamirat Degefa (EDS). In: proceedings of the 11th Annual conference of the Ethiopian society of Animal production (ESAP) Held In Addis Ababa, Ethiopia. August 28-30, ESAP, Addis Ababa p332.
Tessema Zewde, Akililu Agide and Ameha sebsibe 2003. Assessments of the livestock production
system, available feed source and marketing situations in Belessa woreda a case study in drought prone area of Amhara. In: proceedings of ESAP (Ethiopian society of animal production) challenges and opportunities of livestock marketing in Ethiopia. Yilma Jobre and Getachew Gebru (Eds) 10th annual conference of Ethiopia society of animal production (ESAP) held in Addis Ababa. Aug.22-24
Trianti Djoharjani.1996. Survey on production systems of dual purpose Etawah goat and its potential for development Livestock research for rural development Volume 8. Number 2.University of Brawijaya, Faculty of Animal Husbandry. Jl. Veteran, Malang 65145. East Java, Indonesia.
Tuah, A. Dzowela.. B and A. N. Said.2003. The performance of sheep and goats fed crop residues in addition to limited grazing in the backyards of small-scale peri-urban farmers. Dept. of Animal Science, UST, Kumasi, Ghana
Workneh Ayalew and Woudyalew Mulatu. 2005. Farmers practices in the management of trypanosomosis in the Gibe Valley, South Western Ethiopia. In: proceedings of ESAP (Ethiopian society of animal production). Participatory innovation and research. Lesson for livestock development. Tamirat Degefa and Fekede Feyissa(Eds).Proceedings of 12th Annual conference of Ethiopian society of animal production. ESAP., held in Addis Ababa, August 12-14 2004. ESAP, Addis Ababa Ethiopia. P63
Workneh Ayalew, Reschkowsky B and king J.M. 2004. Concepts and calculations of net benefits from goats in Ethiopian smallholdings. EJAP (Ethiopian Journal of Animal production. Vo.4 Number 1, p49.
Workneh Ayallew, J.M.King, E.W. Bruns and B.Kischkowsky.2002. Practicalities of sustaining a goat cross breeding programs in Eastern Ethiopia. EJAP (Ethiopian journal of animal production) Vol2, Number1, PP81, 82.
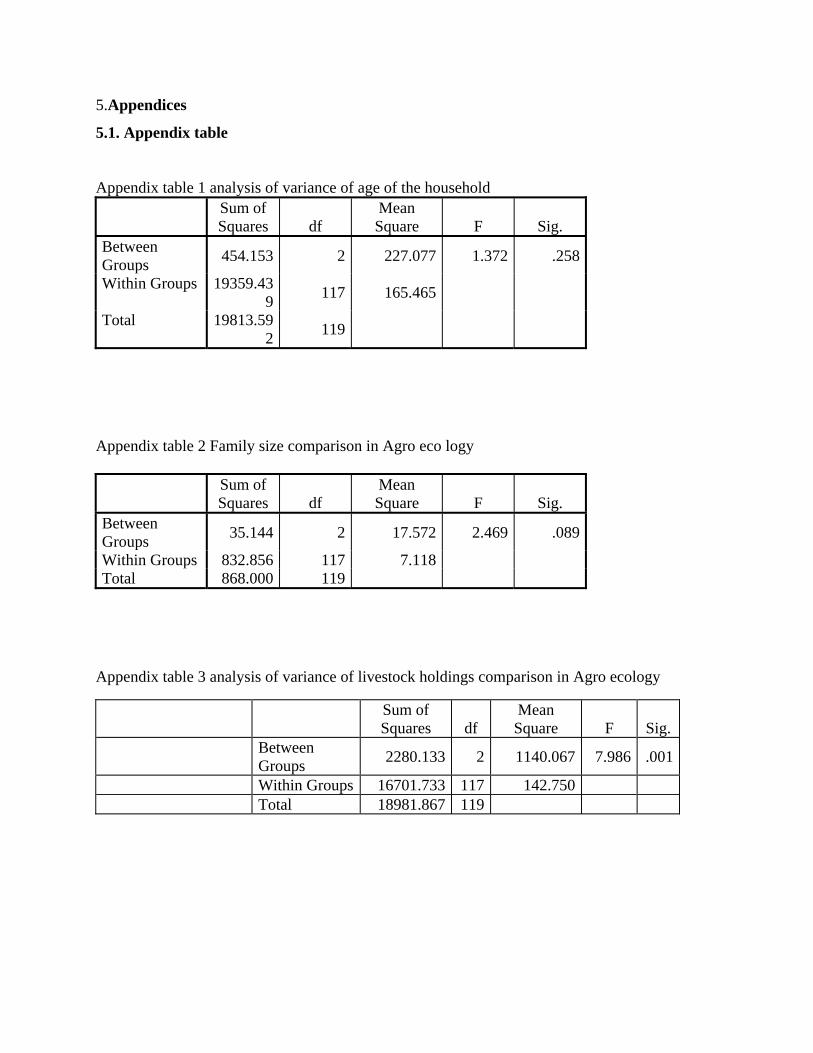
5.Appendices
5.1. Appendix table
Appendix table 1 analysis of variance of age of the household
Sum of Squares df
Mean Square F Sig.
Between Groups 454.153 2 227.077 1.372 .258
Within Groups 19359.439 117 165.465
Total 19813.592 119
Appendix table 2 Family size comparison in Agro eco logy
Sum of Squares df
Mean Square F Sig.
Between Groups 35.144 2 17.572 2.469 .089
Within Groups 832.856 117 7.118 Total 868.000 119
Appendix table 3 analysis of variance of livestock holdings comparison in Agro ecology
Sum of Squares df
Mean Square F Sig.
Between Groups 2280.133 2 1140.067 7.986 .001
Within Groups 16701.733 117 142.750 Total 18981.867 119
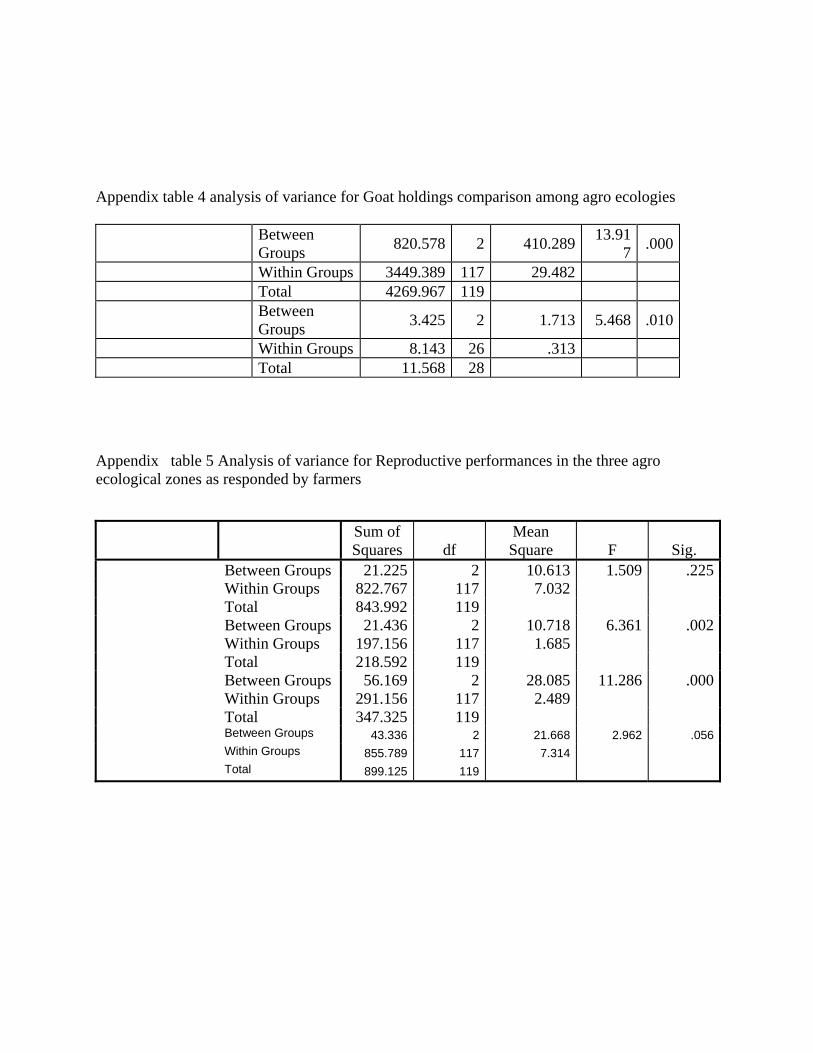
Appendix table 4 analysis of variance for Goat holdings comparison among agro ecologies Between
Groups 820.578 2 410.289 13.917 .000
Within Groups 3449.389 117 29.482 Total 4269.967 119 Between
Groups 3.425 2 1.713 5.468 .010
Within Groups 8.143 26 .313 Total 11.568 28
Appendix table 5 Analysis of variance for Reproductive performances in the three agro ecological zones as responded by farmers
Sum of Squares df
Mean Square F Sig.
Between Groups 21.225 2 10.613 1.509 .225Within Groups 822.767 117 7.032 Total 843.992 119
Between Groups 21.436 2 10.718 6.361 .002Within Groups 197.156 117 1.685 Total 218.592 119
Between Groups 56.169 2 28.085 11.286 .000Within Groups 291.156 117 2.489 Total 347.325 119
Between Groups 43.336 2 21.668 2.962 .056Within Groups 855.789 117 7.314 Total 899.125 119
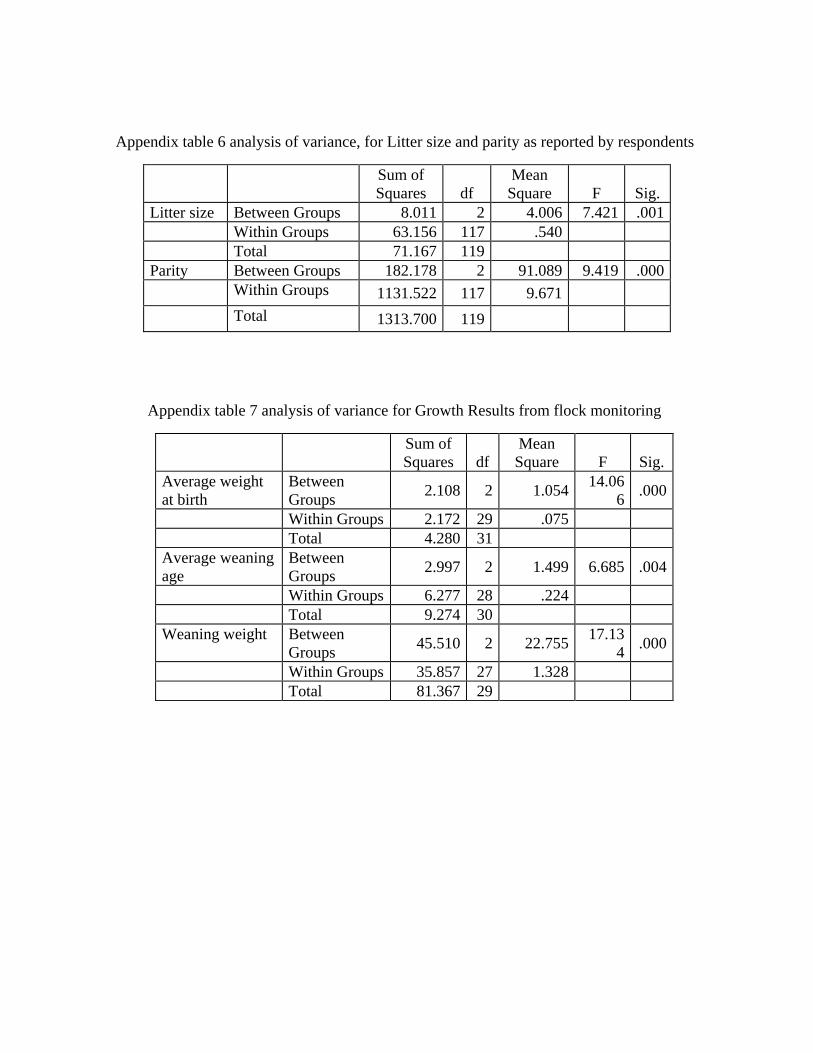
Appendix table 6 analysis of variance, for Litter size and parity as reported by respondents
Sum of Squares df
Mean Square F Sig.
Litter size Between Groups 8.011 2 4.006 7.421 .001 Within Groups 63.156 117 .540 Total 71.167 119 Parity Between Groups 182.178 2 91.089 9.419 .000 Within Groups 1131.522 117 9.671 Total 1313.700 119
Appendix table 7 analysis of variance for Growth Results from flock monitoring
Sum of Squares df
Mean Square F Sig.
Average weight at birth
Between Groups 2.108 2 1.054 14.06
6 .000
Within Groups 2.172 29 .075 Total 4.280 31 Average weaning age
Between Groups 2.997 2 1.499 6.685 .004
Within Groups 6.277 28 .224 Total 9.274 30 Weaning weight Between
Groups 45.510 2 22.755 17.134 .000
Within Groups 35.857 27 1.328 Total 81.367 29
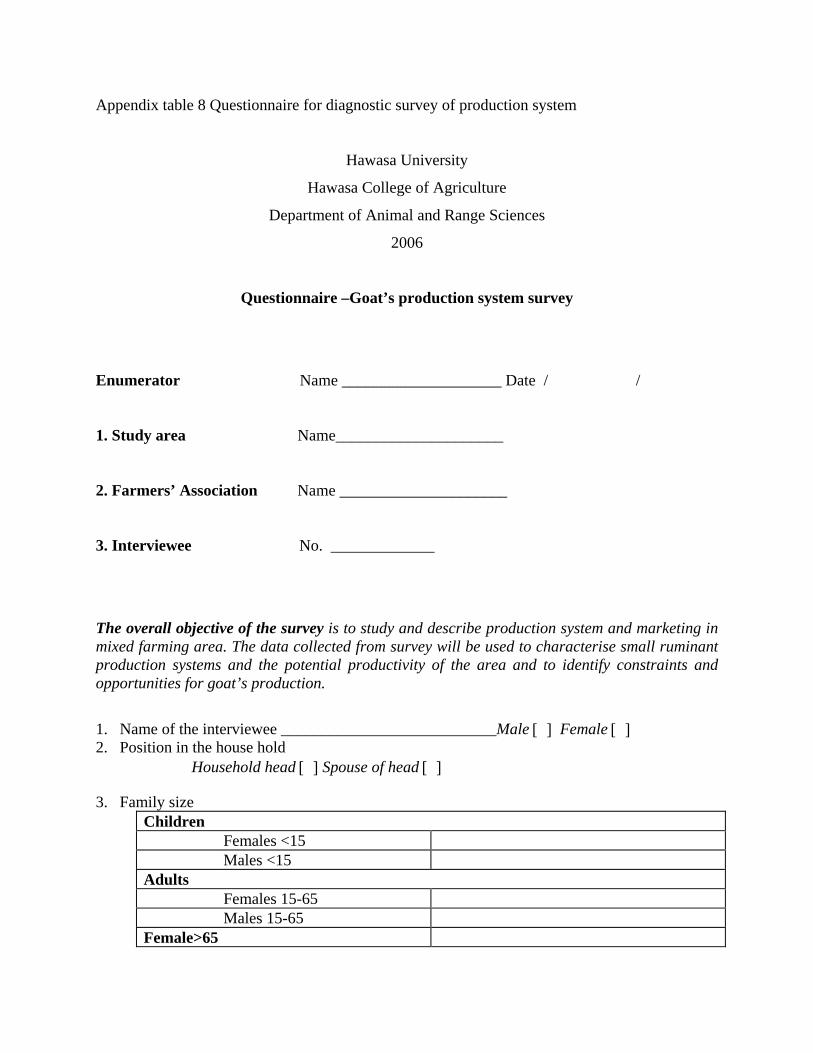
Appendix table 8 Questionnaire for diagnostic survey of production system
Hawasa University
Hawasa College of Agriculture
Department of Animal and Range Sciences
2006
Questionnaire –Goat’s production system survey
Enumerator Name ____________________ Date / /
1. Study area Name_____________________
2. Farmers’ Association Name _____________________
3. Interviewee No. _____________
The overall objective of the survey is to study and describe production system and marketing in mixed farming area. The data collected from survey will be used to characterise small ruminant production systems and the potential productivity of the area and to identify constraints and opportunities for goat’s production.
1. Name of the interviewee ___________________________Male [ ] Female [ ] 2. Position in the house hold
Household head [ ] Spouse of head [ ] 3. Family size
Children Females <15 Males <15 Adults Females 15-65 Males 15-65 Female>65

Male>65 Total
4. Education level of parents and children Education level Mother Father Number of children > 7years Illiterate Grade 1-3 Grade 4-6 Above grade 6 5. Source of Income Source Ra
nk Specify (what type?) Who in the house
hold decide On The income
Sale of crops Sale of animals and their products Sale of labor Petty trading Other_________________ Please rank 1 for most important source of income and 2,3,4,5 for the preceding successive income sources. Again rank 1,2,3,4,5, for decision-making power 6. Which type of animal is the best income generating species for family? Write in the order of importance 1,2,3,4, Species Rank Remark 7. Cost of production inputs excluding feeds (during the previous year).
Material inputs Cattle Goat Sheep
Medicine
Veterinary services
Breeding fee
Salt
Ropes
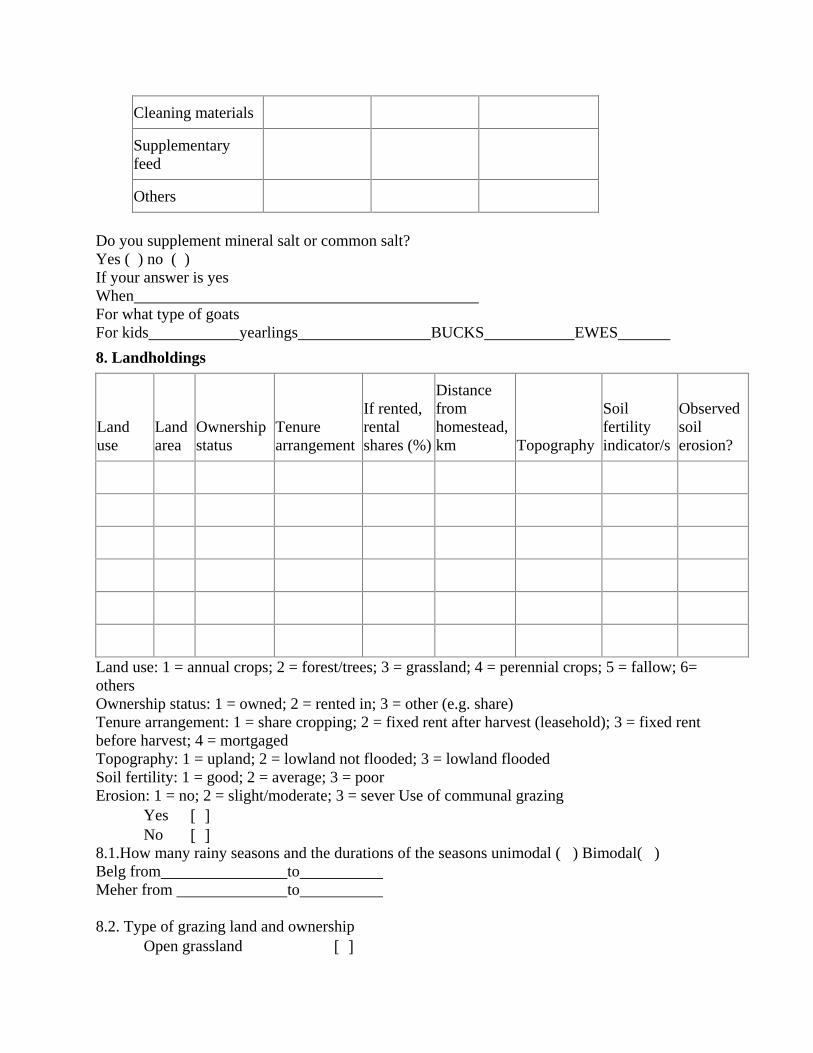
Cleaning materials
Supplementary feed
Others
Do you supplement mineral salt or common salt? Yes ( ) no ( ) If your answer is yes When For what type of goats For kids yearlings BUCKS EWES 8. Landholdings
Land use
Land area
Ownership status
Tenure arrangement
If rented, rental shares (%)
Distance from homestead, km Topography
Soil fertility indicator/s
Observed soil erosion?
Land use: 1 = annual crops; 2 = forest/trees; 3 = grassland; 4 = perennial crops; 5 = fallow; 6= others Ownership status: 1 = owned; 2 = rented in; 3 = other (e.g. share) Tenure arrangement: 1 = share cropping; 2 = fixed rent after harvest (leasehold); 3 = fixed rent before harvest; 4 = mortgaged Topography: 1 = upland; 2 = lowland not flooded; 3 = lowland flooded Soil fertility: 1 = good; 2 = average; 3 = poor Erosion: 1 = no; 2 = slight/moderate; 3 = sever Use of communal grazing
Yes [ ] No [ ]
8.1.How many rainy seasons and the durations of the seasons unimodal ( ) Bimodal( ) Belg from to Meher from to
8.2. Type of grazing land and ownership
Open grassland [ ]
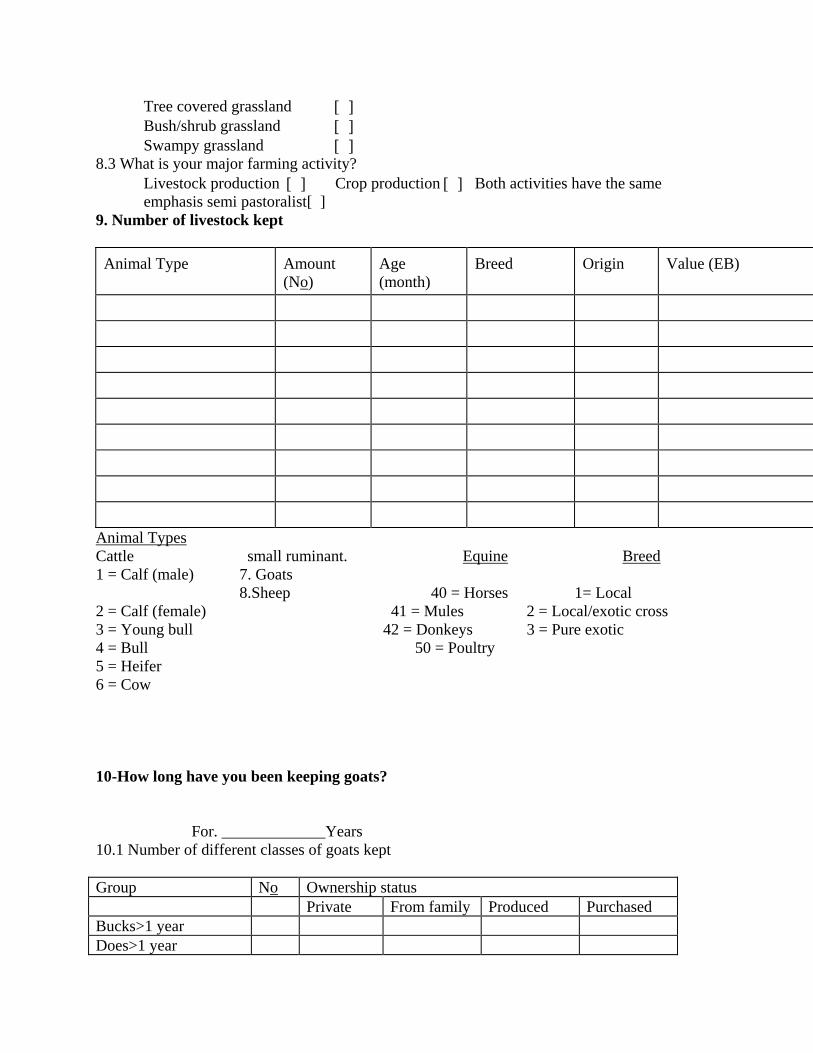
Tree covered grassland [ ] Bush/shrub grassland [ ] Swampy grassland [ ]
8.3 What is your major farming activity? Livestock production [ ] Crop production [ ] Both activities have the same emphasis semi pastoralist[ ]
9. Number of livestock kept Animal Type Amount
(No) Age (month)
Breed Origin Value (EB)
Animal Types Cattle small ruminant. Equine Breed 1 = Calf (male) 7. Goats 8.Sheep 40 = Horses 1= Local 2 = Calf (female) 41 = Mules 2 = Local/exotic cross 3 = Young bull 42 = Donkeys 3 = Pure exotic 4 = Bull 50 = Poultry 5 = Heifer 6 = Cow 10-How long have you been keeping goats?
For. _____________Years
10.1 Number of different classes of goats kept Group No Ownership status Private From family Produced Purchased Bucks>1 year Does>1 year
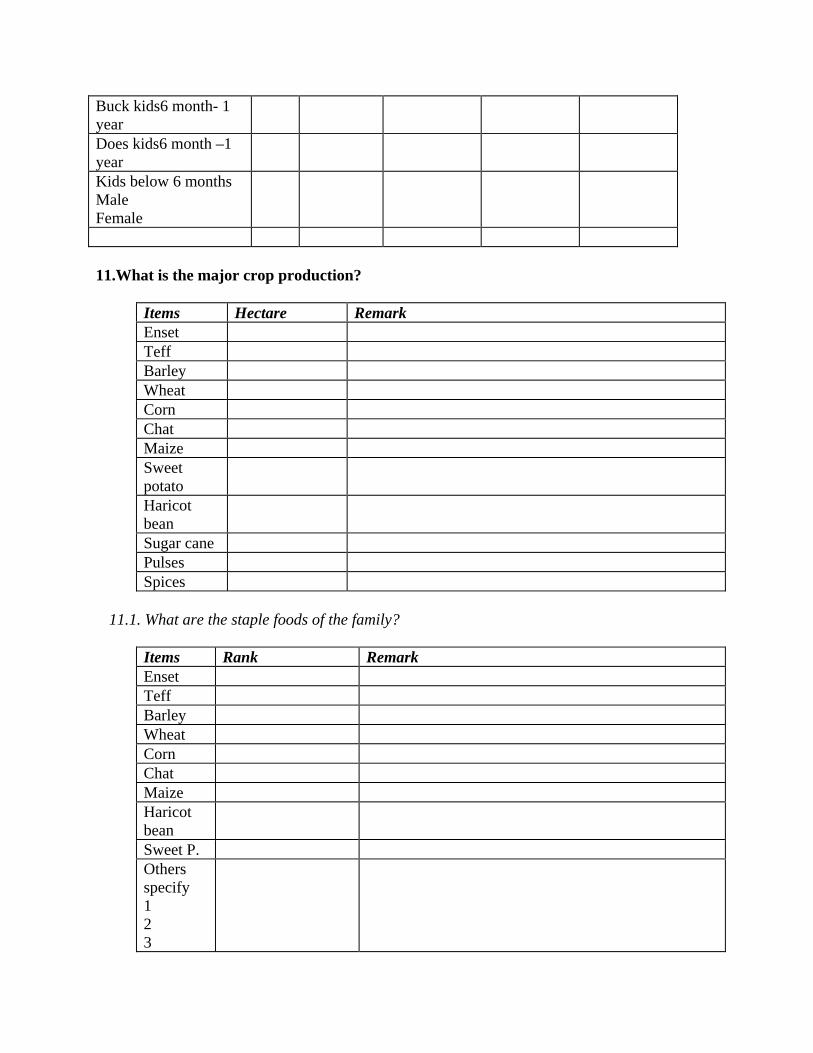
Buck kids6 month- 1 year
Does kids6 month –1 year
Kids below 6 months Male Female
11.What is the major crop production?
Items Hectare Remark Enset Teff Barley Wheat Corn Chat Maize Sweet potato
Haricot bean
Sugar cane Pulses Spices
11.1. What are the staple foods of the family?
Items Rank Remark Enset Teff Barley Wheat Corn Chat Maize Haricot bean
Sweet P. Others specify 1 2 3

(Please rank within columns using 1 for most common, 2 for next in the list) 11.2. What is the major cash crop in the household?
Items Rank Remark Enset Teff Barley Wheat Corn Coffee OTHERS 1 2 3 4
(Please rank within columns using 1 for most common, 2 for next in the list) 11.3. How often do you eat meat?
During holidays [ ] Once a week [ ] Once a month [ ] Twice a week [ ] Twice a month [ ] More often [ ]
Production system Purpose of keeping goats
Purpose Describe your reasons Meat Milk Breeding Manure Blood Skin Savings Wealth status Ceremonies Income
Members of household who own goat Number of goats Reason for keeping goats Head Spouse Head/spouse together Sons Daughters
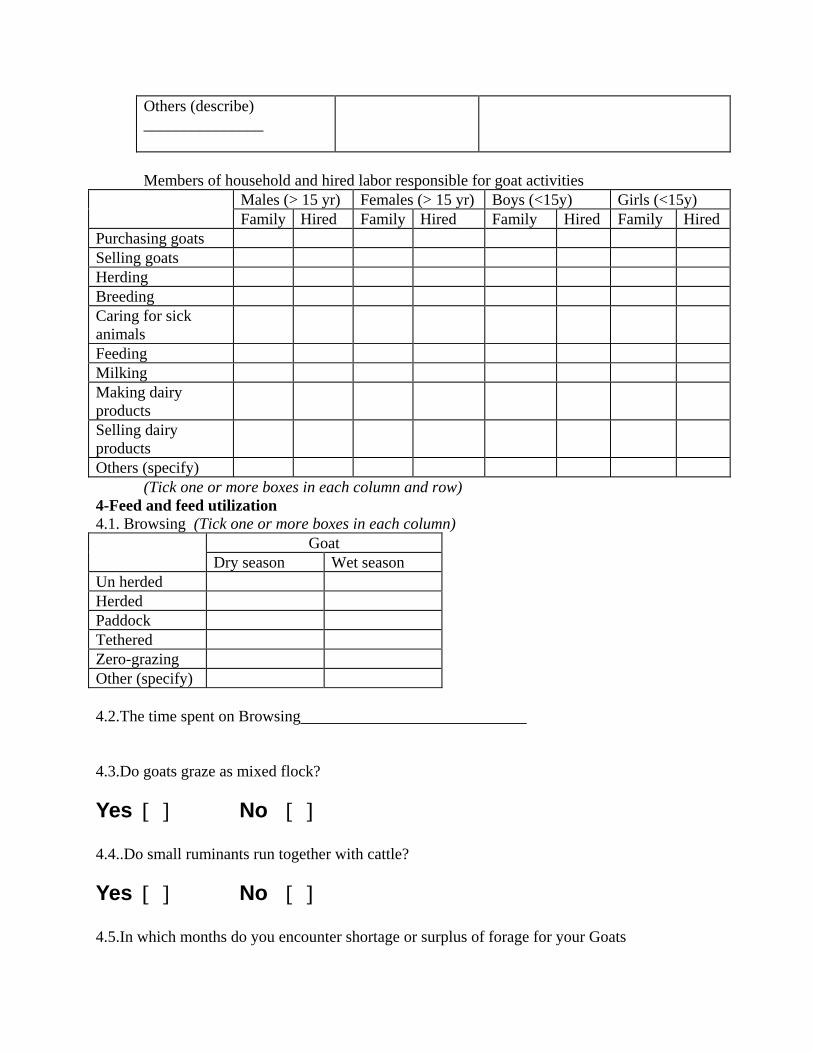
Others (describe) _______________
Members of household and hired labor responsible for goat activities
Males (> 15 yr) Females (> 15 yr) Boys (<15y) Girls (<15y) Family Hired Family Hired Family Hired Family Hired
Purchasing goats Selling goats Herding Breeding Caring for sick animals
Feeding Milking Making dairy products
Selling dairy products
Others (specify) (Tick one or more boxes in each column and row)
4-Feed and feed utilization 4.1. Browsing (Tick one or more boxes in each column) Goat
Dry season Wet season Un herded Herded Paddock Tethered Zero-grazing Other (specify) 4.2.The time spent on Browsing 4.3.Do goats graze as mixed flock?
Yes [ ] No [ ] 4.4..Do small ruminants run together with cattle?
Yes [ ] No [ ] 4.5.In which months do you encounter shortage or surplus of forage for your Goats
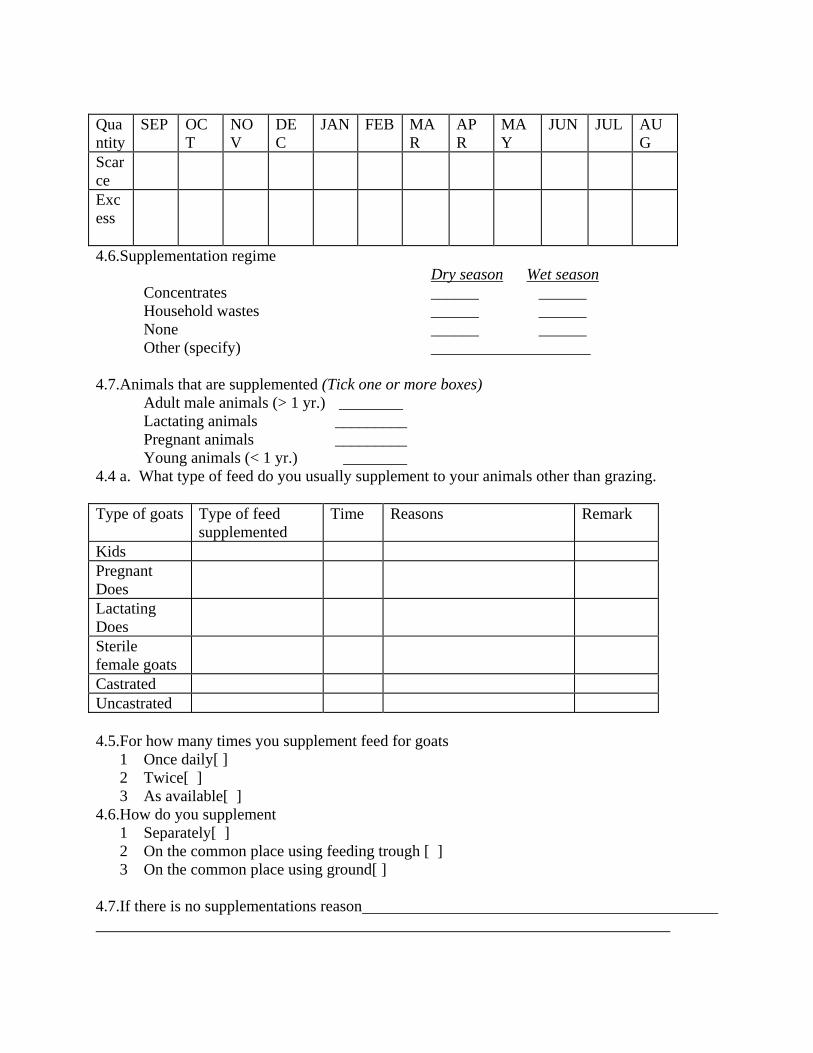
Quantity
SEP OCT
NOV
DEC
JAN FEB MAR
APR
MAY
JUN JUL AUG
Scarce
Excess
4.6.Supplementation regime Dry season Wet season
Concentrates ______ ______ Household wastes ______ ______ None ______ ______ Other (specify) ____________________
4.7.Animals that are supplemented (Tick one or more boxes) Adult male animals (> 1 yr.) ________ Lactating animals _________ Pregnant animals _________ Young animals (< 1 yr.) ________
4.4 a. What type of feed do you usually supplement to your animals other than grazing. Type of goats Type of feed
supplemented Time Reasons Remark
Kids Pregnant Does
Lactating Does
Sterile female goats
Castrated Uncastrated 4.5.For how many times you supplement feed for goats
1 Once daily[ ] 2 Twice[ ] 3 As available[ ]
4.6.How do you supplement 1 Separately[ ] 2 On the common place using feeding trough [ ] 3 On the common place using ground[ ]
4.7.If there is no supplementations reason

4.8.The major resource feed for goats Type Dry
season Wet season System
of feeding
Remark
Natural grazing •1 Communal •2 Private •3 Fallow land
Crop residue 1 2 3
House hold west Concentrate Improved/cultivated forage
System of feeding indicates cut and carry, tethering and other systems 4.9.What type of plants do you know your goats feed on or graze? (Please give their local/English name), rank best to least
a. ____________________________ b. _______________________________ c. ____________________________ d. _______________________________ e. ____________________________ f. _______________________________ g. ____________________________ h. ______________________________
4.10.Source of water (Tick one or more boxes in each column)
Dry season Wet season Borehole/water well ______ ______ Dam/pond ______ ______ River ______ ______ Spring ______ ______ Pipe water ______ ______ Rainwater ______ ______ Other (specify) ______ ______ 4.11.Distance to nearest watering point for adult animals (Tick one box in each column)
Dry season Wet season Water at home _______ _______ < 1 km _______ _______ 1-5 km _______ _______ 6-10 km _______ _______ > 5 km _______ _______

4.12.Are kids/ watered with adults Yes [ ] No [ ] 4.13.Frequency of watering for adults
Dry season Wet season Freely available ______ _______ Once a day ______ _______ Once in 2 days ______ _______ Once in 3 days ______ _______ Other (specify) __________________ 4.14.Water quality
Dry season Wet season Clean _______ _______ Muddy _______ _______ Salty _______ _______ Smelly _______ _______
4.15.The system of allotments 1 By taking to water point 2 Using watering troughs in side the shelter 3 The goats move to water point when they need to drink
4.16.Problems related on the major feeds and watering of Goats? 1 Increased level of livestock population 2 Low productivity of natural pasture/forage 3 Cropped land expansion 4 Population growth 5 Other reasons
4.17.What are the solutions you suggest to alleviate these problems? 4.18. Do you make hay?
1. Yes--------------- 2. No----- 4.19.If yes, from which land
1.Pasture land [ ] 2 Crop land (after fallow)[ 3.others 4.20. From which crop 1---------------------------2--------------------------3------------------------
4.20.Do you produce cultivable forage? 1. YES ------- 2. No
4.21 f yes, what type of forage do you have? 1.

2. 3. 4.
4.22.What are the major problems related to cultivated forage • We don’t have idea about improved forage[ ]
• It is difficult to get land to cultivate forage • Forage seeds and seedling problems • Others mention
4.23..Have you identified the seasons with surplus or shortage of feed for goats Yes[ ] No [ ] 4.24.If your answer is yes describe as follows
Type of feed Time when feed is scarce Time when feed is excess
4.25.Describe solutions and measures taken to solve the problems 4.26.If you are using concentrate as feed supplementations what are the problems you faced
1 It is not locally available [ ] 2 Price increment[ ] 3 Other reasons
4.27. Do you purchase feed from out side? 1 yes [ ] 2 No[ ]
If yes from where1- From neighbor farmers2-[ ]Farmers from other Kebelle3-[ ]From market4-[ ]1 AND 2[ ]1,2,AND 3[ ]
4.28.Use of manure and crop residues (during the previous year)
Animals Ruminants Non-ruminants
Manure: Cattle Buffalo Goat Sheep Pig Chicken Duck
Is manure collected, 1 – Yes, 2 – No.
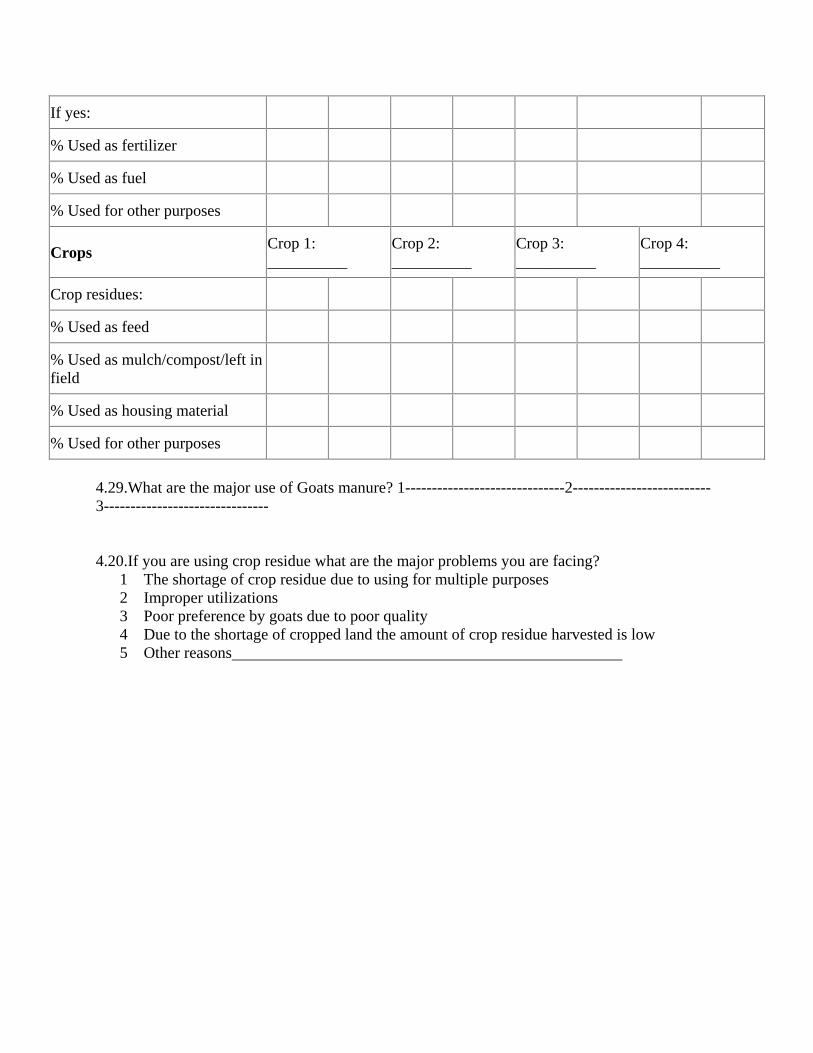
If yes:
% Used as fertilizer
% Used as fuel
% Used for other purposes
Crops Crop 1: __________
Crop 2: __________
Crop 3: __________
Crop 4: __________
Crop residues:
% Used as feed
% Used as mulch/compost/left in field
% Used as housing material
% Used for other purposes 4.29.What are the major use of Goats manure? 1------------------------------2--------------------------3------------------------------- 4.20.If you are using crop residue what are the major problems you are facing?
1 The shortage of crop residue due to using for multiple purposes 2 Improper utilizations 3 Poor preference by goats due to poor quality 4 Due to the shortage of cropped land the amount of crop residue harvested is low 5 Other reasons

5.Housing 5.1.Housing/enclosure for adult goats
With roof without roof In family house ______ Karaal ______attached with family house Separate house ______ Yard ______other specify-----------
5.2.At what time your goats use the shelter at night[ ]partially day time[ ]day and night[ ] 5.3.Why do you use the shelter? 54.If herded separately or with other animals indicate the time the month and the season
Type of goats With
other animals
Separately Season / month
Reason Remark
Bucks Does Yearlings Kids
5.5.Type of housing material (Tick one or more boxes in each column)
Roof Wall Floor Iron sheets Grass/bushes Wood Stone/bricks Earth/mud Concrete Other (specify) __________
5.6. Are kids housed with adults? Yes [ ] No [ ]
5.7.Do goats graze as mixed flock?
Yes [ ] No [ ] 5.8.Do small ruminants run together with cattle?
Yes [ ] No [ ]
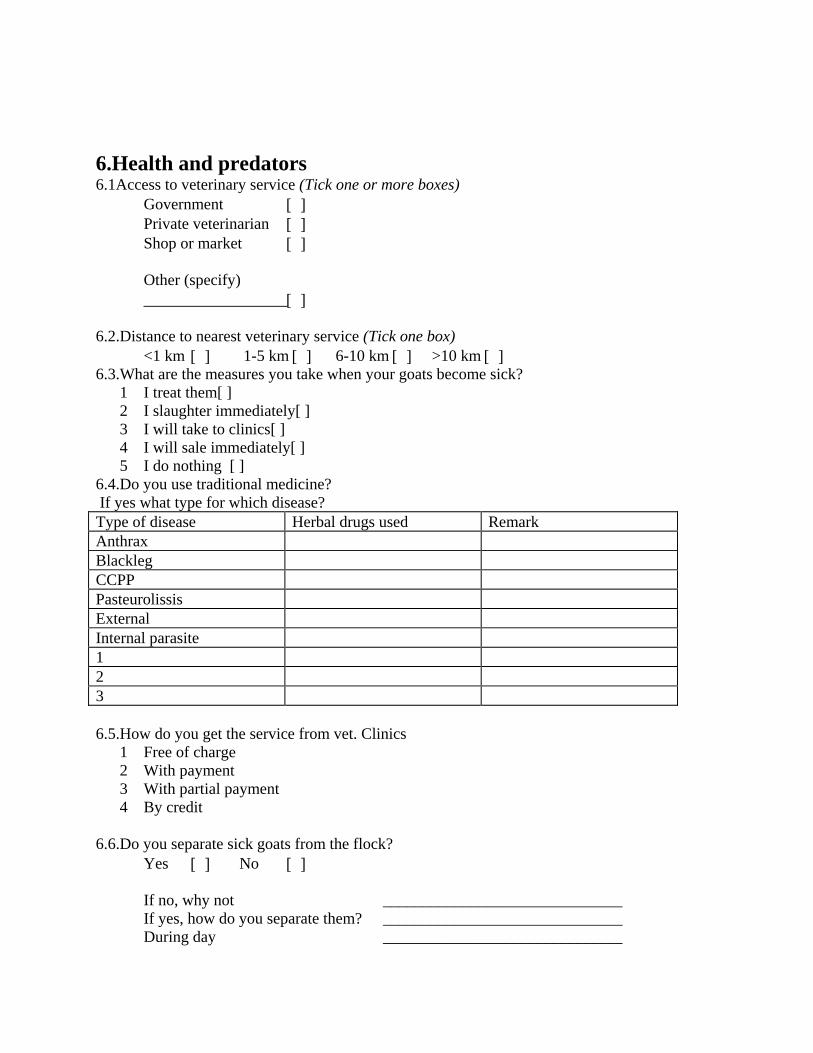
6.Health and predators 6.1Access to veterinary service (Tick one or more boxes)
Government [ ] Private veterinarian [ ] Shop or market [ ] Other (specify) __________________[ ]
6.2.Distance to nearest veterinary service (Tick one box)
<1 km [ ] 1-5 km [ ] 6-10 km [ ] >10 km [ ] 6.3.What are the measures you take when your goats become sick?
1 I treat them[ ] 2 I slaughter immediately[ ] 3 I will take to clinics[ ] 4 I will sale immediately[ ] 5 I do nothing [ ]
6.4.Do you use traditional medicine? If yes what type for which disease? Type of disease Herbal drugs used Remark Anthrax Blackleg CCPP Pasteurolissis External Internal parasite 1 2 3 6.5.How do you get the service from vet. Clinics
1 Free of charge 2 With payment 3 With partial payment 4 By credit
6.6.Do you separate sick goats from the flock?
Yes [ ] No [ ] If no, why not ______________________________ If yes, how do you separate them? ______________________________ During day ______________________________

During night ______________________________
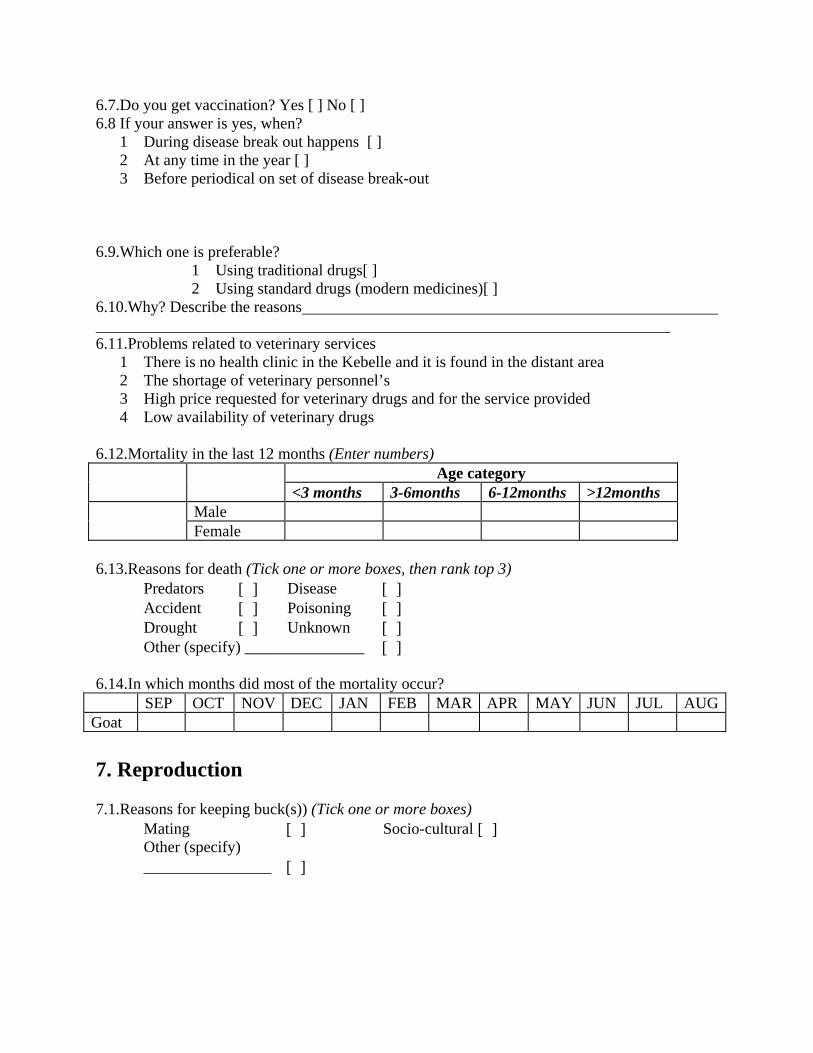
6.7.Do you get vaccination? Yes [ ] No [ ] 6.8 If your answer is yes, when?
1 During disease break out happens [ ] 2 At any time in the year [ ] 3 Before periodical on set of disease break-out
6.9.Which one is preferable?
1 Using traditional drugs[ ] 2 Using standard drugs (modern medicines)[ ]
6.10.Why? Describe the reasons 6.11.Problems related to veterinary services
1 There is no health clinic in the Kebelle and it is found in the distant area 2 The shortage of veterinary personnel’s 3 High price requested for veterinary drugs and for the service provided 4 Low availability of veterinary drugs
6.12.Mortality in the last 12 months (Enter numbers) Age category
<3 months 3-6months 6-12months >12months Male
Female 6.13.Reasons for death (Tick one or more boxes, then rank top 3)
Predators [ ] Disease [ ] Accident [ ] Poisoning [ ] Drought [ ] Unknown [ ] Other (specify) _______________ [ ]
6.14.In which months did most of the mortality occur?
SEP OCT NOV DEC JAN FEB MAR APR MAY JUN JUL AUGGoat 7. Reproduction 7.1.Reasons for keeping buck(s)) (Tick one or more boxes)
Mating [ ] Socio-cultural [ ] Other (specify) ________________ [ ]

7.2.Criteria for choice of buck(s) Size [ ] Color [ ] Horns [ ] Character [ ] Availability [ ] Other (specify) [ ] ______________________
7.3.Breeding/mating
Controlled [ ] Uncontrolled [ ] 7.4.Source of buck(s)) within the last 12 months (Tick one or more boxes)
Own buck (bred) [ ] Own buck (bought) [ ] Buck donated [ ] Buck borrowed [ ] Neighbor’s buck [ ] Communal buck [ ] Unknown buck [ ]
7.5.How do you detect the on –set of heat 7.6.Which season or month of the year the highest heat of goats observed (the main breeding season) 1 2. 3. 7.7.Do you select the best breeding Buck? Yes[ ] No [ ] 7.8.If yes write the criteria used to select the best buck from the flock 7.9.Do you select the best replacement female goat from your flock? Yes [ ] No [ ] 7.10.If yes what are the main criteria’s used to get the best replacement? Breed
1 Fast kidding interval [ ] 2 Body conformation [ ] 3 Prolificacy of their parents [ ] 4 Twining ability and maternity [ ] 5 Other reasons [ ]
7.11.Kidding ability 1 Twice/year 2 Once/year 3 Two-times/three year 4 Not permanent
7.12.Number of kids at birth 1 One at a time[ ] 2 Twins[ ] 3 Triplets [ ] 4 Above triplet[ ]
7.13.Do you have your own buck? Yes [ ] no[ ] How and at what system meting take place
1 They live together with does[ ] 2 There is specific time and they mix the bucks with in heat female[ ] 3 Other methods used 7.14.If mating is seasonal what are the reasons
1 Availability of feed [ ]

2 Convenient day temperature [ ] 3 To meet with highest birth and service time [ ] 4 Other [ ]
7.15.Can you tell us the following information? 10 Age at first kidding 11 Estimated weaning age of kids 12 Kidding interval 13 Average age of goats for market (marketable age) 14 Weight at market 15 Estimated number of kids produced in the life of Does (parity) 16 Age at first service of Bucks 17 Estimated service year of Bucks in the total life period (if estimation is possible) 18 Number of female goats served by a buck
7.16.Time of service after kidding • No limited time • After a month • After two months • After three months • More than three months
7.17.After birth how many days the kids stay with their Does 7.18 After how many days’ kids start feeding by them selves 7.19. Additional feeds used for kids at the beginning of browsing time 7.20.Kids of poor lactating or died Does are supplemented milk from
1 Cow milk [ ] 2 From other does [ ] 3 Other source or methods used [ ]
7.21.Any systems which make the kids to drop suckling 7.22.What are the reasons to separate the kids from suckling?
1 To make Does ready to the second heat 2 To give time to the successive birth 3 To prepare kids for marketing 4 Other reasons
7.23. What are the purposes of male goats, which are excess after selecting the best for breeding 1 They sold immediately [ ] 2 They will entered fattening program [ ] 3 They used for home slaughter [ ] 4 Other purposes [ ]
7.24.Culling due t o age, Female--------------years Male-------------years 7.25. Flock and herd dynamics Total number
Before At present
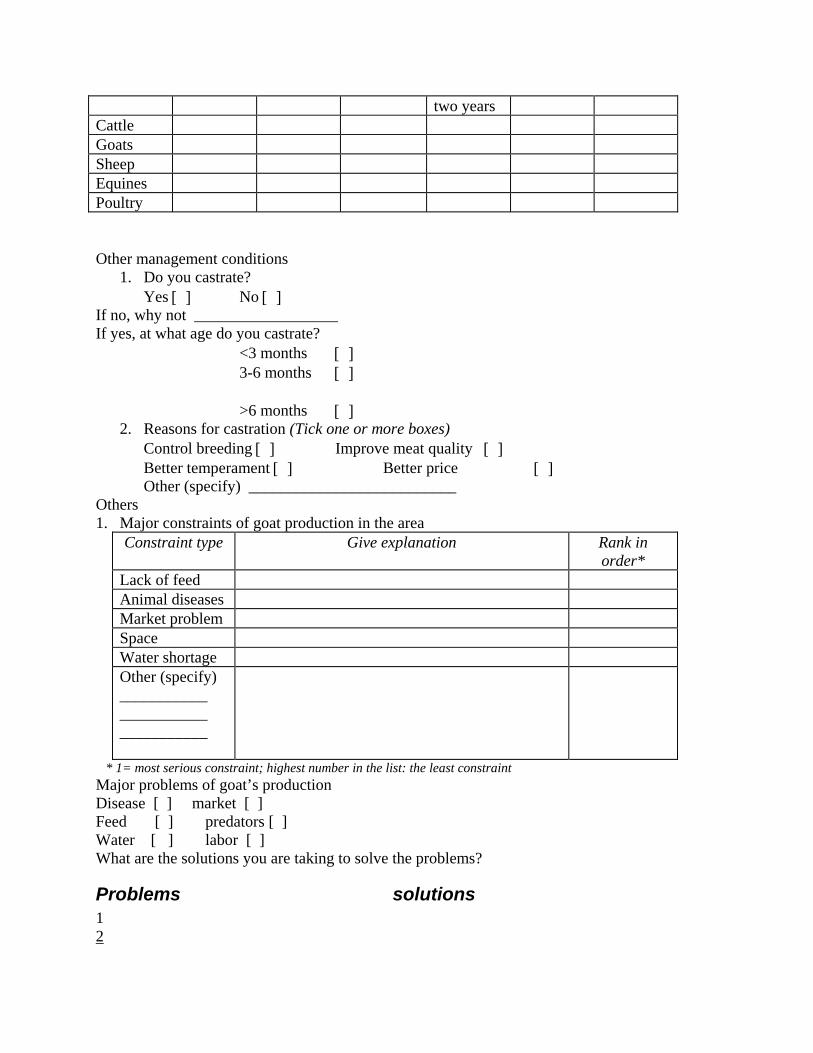
two years Cattle Goats Sheep Equines Poultry Other management conditions
1. Do you castrate? Yes [ ] No [ ]
If no, why not __________________ If yes, at what age do you castrate?
<3 months [ ] 3-6 months [ ] >6 months [ ]
2. Reasons for castration (Tick one or more boxes) Control breeding [ ] Improve meat quality [ ] Better temperament [ ] Better price [ ] Other (specify) __________________________
Others 1. Major constraints of goat production in the area
Constraint type Give explanation
Rank in order*
Lack of feed Animal diseases Market problem Space Water shortage Other (specify) ___________ ___________ ___________
* 1= most serious constraint; highest number in the list: the least constraint Major problems of goat’s production Disease [ ] market [ ] Feed [ ] predators [ ] Water [ ] labor [ ] What are the solutions you are taking to solve the problems?
Problems solutions 1 2

3
2. What are your most important sources of information on how to care for your goats? [ ] Family [ ]Neighbors [ ]Radio [ ] Gov. office:_____________________ [ ] NGO:____________________________________________________ 3. On what basic point you received information
• About feeding [ ] • Health [ ] • Breed [ ] • Others [ ]
4.Have you used the suggestion given? Yes [ ] No [ ] 5.IF your answer is yes What are the changes made after suggestions 1 2 3 4 6.Have you participated extension packages in the past years/ Describe the types 1 2 3 4 Advantages 1 2 3 4 Problems 1 2 3 4 7.Do you participate in any goat development project? Yes [ ] No [ ]
8.What benefits did you get as a result of your participation in the project? [ ] Income, [ ] Milk [ ] Meat Other_______________________________

9.How much milk do you get from your dairy goat daily?_______________ liters 10.Who consumes the milk from the goat?
a) ___________________ b) ___________________ 11.Do you want to expand your goats farm? Yes [ ] No [ ] 12.If no what are your reasons
1 land shortage for pasture[ ] 2 labour problem [ ] 3 they create damage for the crop farm [ ] 4 I prfere to keep other animals to keep [ ]
13.If you are interested to expand your goats production up to what extent 14.What should be the role of government to inhance the productivity of goats in your area? 15.Do you think that your goats are more productive than any other breeds in your or other localities?How Posetive aspecs poor sides
1 good conformation and growth [ ] poor body conditions [ ] 2 producing more than one kid at a time [ ] Reproductive problems [ ] 3 For their quality skin [ ] poor quality skin [ ] 4 Color, tail and noise positions [ ] others [ ]
16.If you are producing goats for meat purpose, how do you utilize 1 During holly days [ ] 2 When meat is requird by family[ ] 3 To invite respect gusts 4 As I get meat type goats [ ] 5 Other reasons[ ] About improved breeds 1.Did you get improved breeds in the last time Yes [ ] no [ ] 2.If there is no distribution what are the reasons 3.If distributed when/ year 4.The objective or purpose of distribution for meat[ ] for milk [ ] both meat and milk [ ]
5.Have you gained more advantage from improved breeds/ compred to locals 1 High meat production[ ] 2 High milk production [ ] 3 More prolific [ ] 4 Fast growing other reasons [ ]

6.Describe the poor sides of these breeds 7.The major prob lems related to cross breeds 8.Suggestions and comments about cross breeds

Appendix table 9 Questionnaire format on Rapid Marketing Appraisal(RMA)
Part I Hawasa University School of graduate studies Rapid marketing appraisal (RMA), Checklist
1. Goat producers at local/ primary market of Dale (Bokasso Hantate and Deala)
Address Region Zone woreda Kebelle Farmer’s code 1.1 Production
1 Why do you keep goats? And how long have you been keeping?------------------------------------------------------------------------------------------------------------------------------------------------------------------------------------------------------------------------------------------------------------------------------------------------------------
2 Amount (number) of different classes of goats kept?--------------------------------------------------------------------------------------------------------------------------------------------------------------------------------------------------------------------------------==========================================================----------------------------------------------------------------------------------------------------------------------------------------------------------------------------------------
3 What is the type of production (subsistence, market oriented or commercial)?
4 Do you want to expand and intensify your goats’ production? How and up to what extent?
5 What are the types of inputs used for your goats production? ----
6 Where did you get your initial stock? Do you have your own breeding-----------------------------------------------------------------------------------------------------------------------------------------------------------------------------------------------------)
7 Sources of stock supply? 8 Do you fatten goats for market? 9 Where is the source of goats purchased for fattening? 10 Factors to be considered in order to fatten goats at farm level? 11 For how long the activities of fattening take place?

Short time for ------------month Medium for --------------------month Long duration for --------------- month 12 Which duration is the best and the most profitable staying period?
Feed source and type of feed
Feed from own field Feed from out side sources Remark
1 Which types of feed are important for goat’s growth and development? (Exceptional feed types known by their quality to induce fast weight gain)
2 Access to veterinary service? Do you use feed additives in order to fasten the growth and production?
3 Economically important disease affecting goat’s growth and productivity? 4 Mortality in the last twelve months? And the causes of mortality? 5 Problems with input supply?
1.2. Marketing and market situations 1.2.1. Purchasing
1 Which seasons of the year is the best time for purchasing goats for your farm? Why is this time preferred for purchasing goats?
2 Do you purchase goats from market? 3 Which market is the most profitable, highly available by goats’ population, cheapest
in purchasing price etc? What are the reasons for purchasing goats? 4 What are the criteria’s used during purchasing goats for your farm? (Age, weight,
condition, sex, color, size, breed, etc)? 5 Who is your customer during purchasing goats? Who participate in buying and selling
process? 6 What are governmental or traditional regulations to be obeyed during purchasing
goats? 1.2.2. Marketing goats (sales) When did you start selling goats? For whom you sell your goats? (Your usual customer)? What are the reasons for selling goats? Which market is the best market for selling goats? Why do you prefer this

market for sales? The name of the market
Different routs of goats coming to this market
Reason for preferring this market
Frequency of selling
The best time for selling goats

Discuss about marketing access? Type, address and destinations of buyers?
Type of buyer Initial Address (coming from)
Final destinations (take the goats to special locality, mention the place)
1 What are the criteria that are important for sales? (Age, sex, weight, condition, color etc.)Which criterion is important for price determination?
2 Problems encountered during exchange? 3 Opportunities considered for production? Are you producing for market? What is your
source of capital? What type of labour used for production? 1.3.Credit service
1 What are your sources of credit? 2 Why did you need credit? 3 Have you repaid the credit you offered last time? 4 Is credit available, adequate, timeliness? 5 The interest rate, is it profitable, is it beneficial? 6 Problems associated with credit? The opportunities to improve the existing credit
service? 1.4.Extenstion service
1 Who is your source of information? 2 Have you got new idea about goats’ production and management? (Availability,
timeliness, accuracy and accessibility)? 3 What is the information, which is important to your activity and what are the benefits,
obtained using this information?

Part II Hawasa University School of graduate studies
Rapid marketing appraisal (RMA), Checklist Prepared to interview Traders (Retailers, wholesalers, and assemblers)
At local/primary markets of Dale (Bokasso, Hantate, Dela)
Region Woreda Market place Market day Name Residence Main work activity 1.About business When did you start trading goats? For how long year Why you prefer trading goats? What was your source of capital? And how much capital did you invest to start your initial trading? How much capital do you have at current? Is it progressive or regressive? Why? Source of capital
Amount of initial capital
Amount of current capital
Progressive compared to initial capital
Regressive compared to initial capital
No change
Reasons for good profit
Reasons for loss
What type of goats you are trading? Why do you prefer trading these types of goats?

2.Purchasing 1 Where you buy goats, rank the markets according to the availability, accessibility
price and other conditions related to goats marketing 2 Why do you prefer this market?

Market place (rank the best market number1)
Estimated number of goats per market day
The average number of goats you purchase per day
Distance from your residence
More profitable market day
Remark
1 Which type, age, colour, and body condition, are most preferable? 2 Do you transport goats other market places? Where? What is your means of
transportation? 3 At what particular season a large number of animals purchased from market 4 What are the relationship among the demand, supply season time and price of goats? 5 The time in with the highest supply and demand in relation to price situations Estimate the price of the following goats type Seasonal variations in price
Lowest price
Month Moderate
Month
Highest price
Month
Castrates Does Bucks Young female Young male
1 Discuss about the reasons for price fluctuations? 2 The criterion’s considered during purchasing goats for trading?
1. 2. 3. 4.
Which criteria of the above is the most important for buying goats for profit
Measurements used in the market to estimate price? 1 For weighting 2 Age determination 3 Body condition estimation 4 Meat quality and tenderness 5 What are price determinant factors
Who is responsible to fix price when you buy goats in the market? Who has a power to determine price?


3.Sales Which Market place and market day is the best for selling your goats? What are the reasons to prefer this market for sales?(describe in order of importance) Market place The best market day
for sales Reasons to prefer the market?
Which marketing structures are available
1 Could you sell all the purchased goats at once on the same market day? 2 Who is your buyer? 3 What is an average price you obtained per goat? 4 Castrated>2year birr------- 5 Uncastrated young <2 years birr------------------ 6 Does>2years birr----------------------- 7 Young female, <2 years Birr---------------------------- 8 Which type goats are profitable? Who is responsible to determine/fix price 9 What are the criteria used to determine price, and which criteria is the most preferable to
get the highest price (age, colour, body condition, weight, castration, etc.)?
4.Transportations 1 What is your means of transport (trekking by your self or help of hired labour, ISUZU,
other Trucks) 2 If you use the truck, how much money do you pay per goat? How many kilometres you
transport, what are the problems related to transportation, how many goats are transported per journey?
Type of transportation
How many goats move at one time
Amount paid per goat
Routes of travel from --to
Problems related to transportation
5.Market information 1 What are your sources of marketing information? Is the source available reliable recent
and accurate?

2 What is the estimated number of goats entered and exist per day in to the market and out of the market respectively? which season has the highest inflow and out flow?
3 What are the main Problems in relation to marketing (price, buyers problem, accessibility, market structures etc.)?
What are the main factors to be considered in relation to buying and selling goats in those market places? Discuss the problems and opportunities in relation to goats trading?
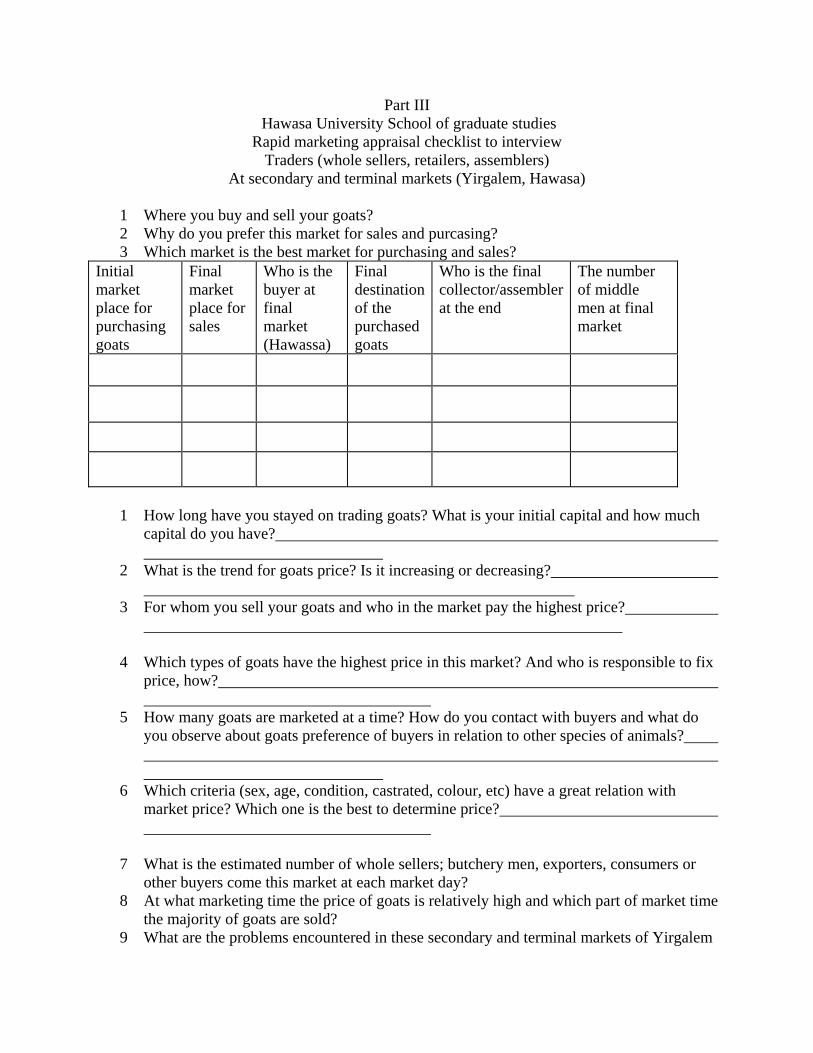
Part III Hawasa University School of graduate studies
Rapid marketing appraisal checklist to interview Traders (whole sellers, retailers, assemblers)
At secondary and terminal markets (Yirgalem, Hawasa) 1 Where you buy and sell your goats? 2 Why do you prefer this market for sales and purcasing? 3 Which market is the best market for purchasing and sales?
Initial market place for purchasing goats
Final market place for sales
Who is the buyer at final market (Hawassa)
Final destination of the purchased goats
Who is the final collector/assembler at the end
The number of middle men at final market
1 How long have you stayed on trading goats? What is your initial capital and how much
capital do you have?
2 What is the trend for goats price? Is it increasing or decreasing?
3 For whom you sell your goats and who in the market pay the highest price?
4 Which types of goats have the highest price in this market? And who is responsible to fix price, how?
5 How many goats are marketed at a time? How do you contact with buyers and what do you observe about goats preference of buyers in relation to other species of animals?
6 Which criteria (sex, age, condition, castrated, colour, etc) have a great relation with market price? Which one is the best to determine price?
7 What is the estimated number of whole sellers; butchery men, exporters, consumers or
other buyers come this market at each market day? 8 At what marketing time the price of goats is relatively high and which part of market time
the majority of goats are sold? 9 What are the problems encountered in these secondary and terminal markets of Yirgalem

and Hawassa respectively?
Part IV Hawasa University School of graduate studies
Rapid marketing appraisal, checklist to interview
Butchery men
1 When did you start slaughtering goats for meat? 2 Why do you prefer slaughtering goats? Why not sheep? 3 How many goats slaughtered and sold per day in your butchery? 4 Which type of goats are the most preferable by consumers and which type are profitable
for your business Types of goats Rank (1 for best)
Young male < 1 year ------------------------- - Young female < 1 year --------------------------- Castrated male > 1 year ---------------------------- Uncastrated male > 1 year --------------------------
Do you use communal slaughterhouse? Or, you have your own slaughtering place? 1 Are meat inspectors monitoring the slaughterhouse? 2 Which part of the carcass is condemned? Do meat inspectors usually condemn offal’s/
which part of the offal? 3 What are facilities available in the slaughterhouse? 4 What are equipments available in your butchery house? 5 How many goats are slaughtered and soled per day? How many reserve goats kept for the
next slaughter day? 6 Indicate the time in which the highest and the lowest number of goats slaughtering takes
place? 7 Season of the year number of goats slaughtered remark 8 ------------------------- 9 ------------------------- 10 ------------------------- 11 --------------------------
12 Who determine the sales price of meat? How much Birr does a kilo of meat cost? 13 Who is responsible to control meat quality and other measurement standards? 14 At what time (season) of the year the price variations for meat occurred
Time increased Time decreased Who is responsible to fix the price
Remark
How many times per year does the price of meat increased? Have you ever herd the time with the price reduction for meat?
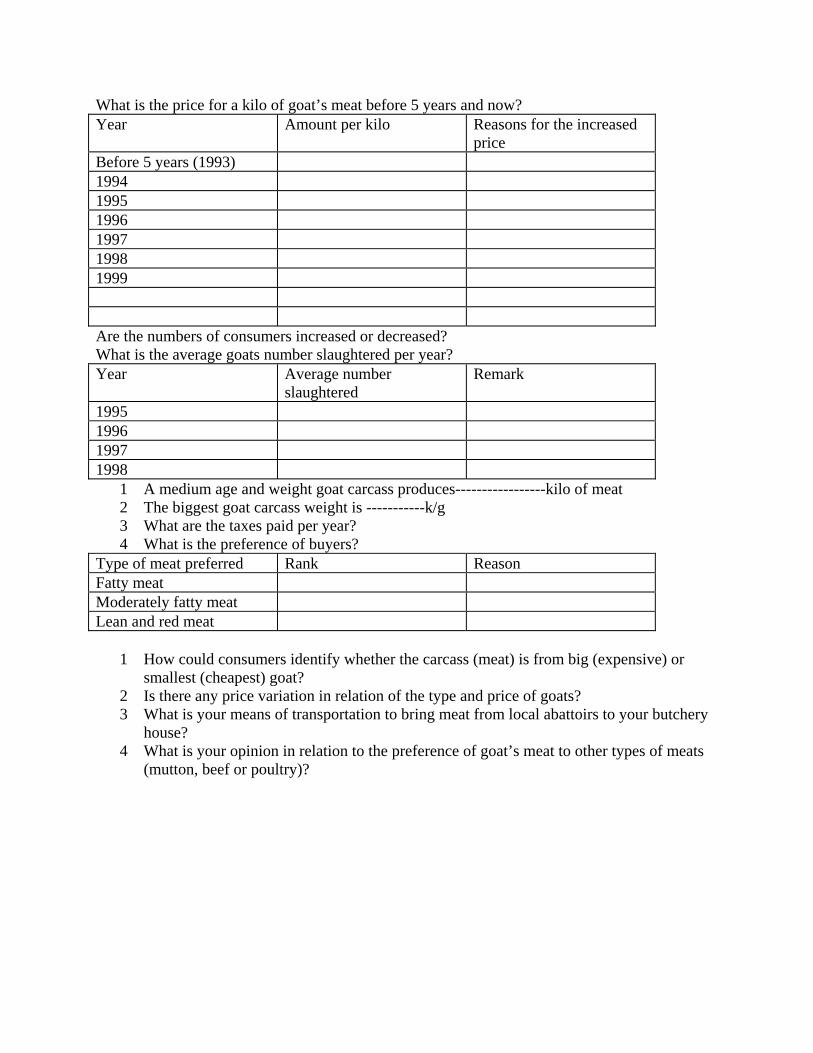
What is the price for a kilo of goat’s meat before 5 years and now? Year Amount per kilo Reasons for the increased
price Before 5 years (1993) 1994 1995 1996 1997 1998 1999 Are the numbers of consumers increased or decreased? What is the average goats number slaughtered per year? Year Average number
slaughtered Remark
1995 1996 1997 1998
1 A medium age and weight goat carcass produces-----------------kilo of meat 2 The biggest goat carcass weight is -----------k/g 3 What are the taxes paid per year? 4 What is the preference of buyers?
Type of meat preferred Rank Reason Fatty meat Moderately fatty meat Lean and red meat
1 How could consumers identify whether the carcass (meat) is from big (expensive) or smallest (cheapest) goat?
2 Is there any price variation in relation of the type and price of goats? 3 What is your means of transportation to bring meat from local abattoirs to your butchery
house? 4 What is your opinion in relation to the preference of goat’s meat to other types of meats
(mutton, beef or poultry)?

Part V Hawasa University School of graduate studies
RMA checklist to interview Restaurants and Hotels
At Yirgalem town and Hawasa
Address Region----------------------zone-----------------------woreda--------------------- Kebelle--------------------------House-------------------------work activity
Product supply What are services provided for consumers? Processed (cooked) meat--------------- Other type------------ Who are your usual consumers? What is the preference of your consumers? Goat meat--------------- Sheep meat-------------- Beef meat---------------- Doro wot----------------- What are the reasons you understood about the preference of goat’s meat in relation to other species? Do you buy meat from butcheries? Or you slaughter goats for your restaurant? What is the current price for a kilo of goat meat? Is there any difference among mutton, cavone and beef meat? Which season of the year is the most demand for meat goat? Which market place and market day is preferable to purchase goats? Why is this area goats are superior from others? By what quality is this area goat’s sprier? Average price of goats purchased to slaughter for your restaurant? Birr The type, age colour and condition of goats considered during purchasing goats to your restaurant? What type and quality of meat is most preferable and which type of meat are low in preference?


What is the trend of price? Compared to the last time? Year Price for a kilo
of goat meat Average price for cooked food
Remark
1996 1997 1998 Average weight and age of goats used for slaughtering kg year Who in the restaurant is responsible to purchase goats? How is price fixed for processed (cooked) food? Who is responsible to fix price?
When do you change the price of food prepared from goat’s meat What are the problems encountered to use goats meat for your restaurants? Especial quality of goat’s meat, that is preferable and usually recommended by the consumers? Discuss about consumers preference, taxation, market regulations etc., that should be improved and need emphasis by government? Who issue the license and who is responsible to evaluate the quality of restaurants in terms of price, quality and other situations?
Part VIII Hawasa University School of graduate studies
RMA checklist to interview
Individual consumers (at Yirgalem and Hawasa town)
Address
Region zone woreda
Kebele
Name age
1 Who is your source of goat’s meat?
2 How many times you slaughter goats for home consumption? And when do you usually purchase meat goats for home consumption?
3 Why do you prefer goat’s meat rather than mutton p[poultry or beef?
4 What are the best qualities of goat’s meat preferred by the consumers?
5 Where do you buy goats and from whom you are buying goats? And why you prefer this market for goats purchasing?
6 Which type of goats is most preferable by consumers?
7 Do you think goat’s meat substitute beef or mutton? Why is this happen?
8 What part of goat’s carcass has especial preference and the parts that are edible saleable and none edible?
9 Which part has the highest price?
10 How do you negotiate price? Who is responsible to fix price?
11 From your long time experience of consumption, which area (locations) of goats are with very important quality and quantity/? What are the reasons?
12 Have you observed seasonal variations in prices, supply and demand? Relate and discuss briefly?
13 What are the substitutes of goat’s meat during the time of scarcity?
14 What are the criteria’s considered during goats purchasing for consumption?
15 How do you observe the carcass of goat’s meat quality (lean meat, fat meat, fat dispersion, bone, edible offal none edible offal etc) in relation to other species?
16 Have you observed especial characteristics importantly preferable by your family and you?
17 Compare the price, quality, quantity and other conditions with meat obtained from butcheries and slaughtered in your house?
Part IX
Hawasa University School of graduate studies RMA checklist to interview knowledgeable people at Yirgalem and Hawasa town
Woreda livestock production, marketing and cooperatives officers
1 What is the system used to produce and market goats in your woreda? 2 Where is your market place to sale your goats? 3 Where is the potential source of goats to this town? Do you know the existing market
channel, can you express, how many channels are working here? 4 Which market is the terminal market? which are the major buyers in primary, secondary
and final (terminal) market? 5 What type of buyers (subsistence, market oriented, etc.) 6 Which type of animals offered to market, who is seller and who is buyer? Who is the
major supplier regarding goats? 7 Which market do you know as the major source of goats 8 The way that producers or traders transport goats to market and from market? 9 Do you know the number of goats marketed per day at primary market and at Yirgalem
market? 10 Who are the major traders? 11 Livestock market which doesn’t consists goats as commodity 12 Which are most profitable firma; Butchery men, wholesalers, retailers, producers mention
others? 13 How do you express market regulations, W hat is its role? 14 Are all traders are licensed, 15 Are there cooperatives, which are organized to carry out goats marketing activities? Do
you have an interest to organize meat goat producers? Is cooperation be a solution to solve problems related to marketing?
16 What are different forms of taxations, and how do you understand the amount and conditions of tax payments? Are the regulations are encouraging goats production?
17 Do you know the reasons why the producers bring their goats for sales? 18 What is the time and frequency of selling goats, why is the variations in time and
frequency occurred? 19 Do you know the inflow and out flow of goats to Yirgalem and out of Yirgalem? 20 Where is the destination of the out flow of the marketed goats? What are accesses
available in local, secondary and terminal markets? Can you identify and describe? 21 Problems encountered regarding marketing of goats? Do you know big sellers
(wholesalers) collectors and transporters of goats to A.A.? 22 What are the relationships between producers, wholesalers, retailers, exporters etc? 23 The extension service given to the farmers, what are the sources, is it up-to-date accurate
etc? What are your system of collecting data about goat’s production and marketing? How do you monitor the situations?

24 Do you monitor marketing situations? 25 Can you communicate with farmers? How do you exchange information with farmers?
Do you get from farmers? Through what mechanism and chain? 26 Are there any opportunities to transfer information and innovations to farmers? 27 What are the financial supports and sources in which the farmers could get in order to
enhance and expand their system of production? 28 Source, availability adequacy, timeliness, interest rate and other regulations regarding
credit? 29 Problems encountered with credit regulations? 30 The role of cooperatives regarding credit facilities? Is loans repaired annually? What is
the trend of the last year? 31 What are inputs provided to develop goat’s production? 32 Are there traders associations regarding goats marketing? 33 What type of compensations used if any damage, loss, or any accident occurred during
trading of goats? 34 Who is responsible to distribute inputs for goats (in sales basis or other way)? 35 About intensive and semi- intensive farms of goats? 36 Do you inform farmers or traders about the international or national trade of goats or
meat of goats? The reasons for high or low demand and supply of goats in the market? Factors affecting demand and supply? Exogenous or endogenous factors?
37 Do you think farmers at distant area have information about current marketing conditions?
Marketing system infrastructure 1 All weather roads available at local farm gets, secondary market or at each stage of sub
sector 2 Market places, market structures and main functions? 3 Infrastructures at primary market, secondary and terminal markets? (Watering troughs,
feeding troughs, holding chutes, assembly yards etc) 4 Do you get transport access, what is the available transport of the area 5 Is the woreda has processing Center? How big is it and what is its quality? 6 How they communicate with their customers? 7 Road, Tele, electric, and other infrastructures adequate? if not what are missing, and what
are excess and unutilised? 8 Opportunities to be considered to improve livestock marketing in general and meat goats
in particular?
Related Documents