i MARKET CHAIN ANALYSIS OF FRUITS FOR GOMMA WOREDA, JIMMA ZONE, OROMIA NATIONAL REGIONAL STATE M.Sc. Thesis AYELECH TADESSE August, 2011 HARAMAYA UNIVERSITY

Welcome message from author
This document is posted to help you gain knowledge. Please leave a comment to let me know what you think about it! Share it to your friends and learn new things together.
Transcript

i
MARKET CHAIN ANALYSIS OF FRUITS FOR GOMMA WOREDA,
JIMMA ZONE, OROMIA NATIONAL REGIONAL STATE
M.Sc. Thesis
AYELECH TADESSE
August, 2011
HARAMAYA UNIVERSITY

ii
MARKET CHAIN ANALYSIS OF FRUITS FOR GOMMA WOREDA,
JIMMA ZONE, OROMIA NATIONAL REGIONAL STATE
A Thesis Submitted to School of Graduate Studies
Haramaya University
In partial Fulfillment of the Requirements for the Degree of
MASTER OF SCIENCE IN AGRICULTURE (Agricultural Economics)
By
Ayelech Tadesse
August, 2011
Haramaya University

i
APPROVAL SHEET
SCHOOL OF GRADUATE STUDIES
HARAMAYA UNIVERSITY
As member of the Board of Examiners of the M. Sc. Thesis Open Defense Examination, we
certify that we have read, and evaluated the Thesis prepared by Ayelech Tadesse entitled:
Market Chain Analysis of Fruits for Gomma Woreda, Jimma Zone, Oromia National
Regional State and examined the candidate. We recommended that the Thesis be accepted as
fulfilling the Thesis requirement for the Degree of Master of Science in Agricultural
Economics.
______________________ ______________ ___________ Chairperson Signature Date
______________________ ______________ ___________ Internal Examiner Signature Date
______________________ ______________ ___________ External Examiner Signature Date
Final approval and acceptance of the thesis is contingent upon the submission of the final
copy of the thesis to the Council of Graduate Studies (CGS) through the Departmental
Graduate Committee (DGC) of the candidate’s major Department.
As thesis research advisors we hereby certify that we have read and evaluated the thesis
prepared under our direction and recommend that it can be submitted as fulfilling the thesis
requirement.
Moti Jaleta (PhD) __________________ _____________
Major Advisor Signature Date
Jema Haji (PhD) __________________ _______________
Co-Advisor Signature Date

ii
DEDICATION
This thesis is dedicated to my husband Dr. Girma Tesso for his dedicated partnership in the
success of my life, my daughters Abgiya and Rebekha and my sons Zerubabel and Yoseph for
their affection and love.

iii
STATEMENT OF AUTHOR
I the undersigned, hereby declare that the thesis- Market Chain Analysis of Fruits, for
Gomma Woreda, Jimma Zone, and Oromia National Regional State is the outcome of my
bonafide work and all sources of materials used for this thesis have been duly acknowledged.
This thesis has been submitted in partial fulfillment of the requirements for M. Sc. degree at
the Haramaya University and is deposited at the University Library to be made available to
borrowers under rules of the library. I solemnly declare that this thesis is not submitted to any
other institution anywhere for the award of any academic degree, diploma, or certificate.
Brief quotations from this thesis are allowable without special permission provided that an
accurate acknowledgement of the source is made. Requests for permission for extended
quotation from or reproduction of this manuscript in whole or in part may be granted by the
Head of the Department of Agricultural Economics or the Dean of the School of Graduate
Studies when the proposed use of material is in the interests of scholarship. In all other
instances, however, permission must be obtained from the author.
Name: Ayelech Tadesse Tokkon
Signature: _________________
Place: Haramaya University, Haramaya
Date of Submission: August, 2011

iv
BIOGRAPHICAL SKETCH
The author was born on August 5, 1962 in Oromia National Regional State, Bedelle, Ethiopia.
She attended her elementary and secondary education in Bedelle town. She joined Awassa
College of Agriculture in 1979 and obtained her Diploma in Plant Science Technology in
1981. Then she has served at Ministry of Rural and Agriculture Development in different
parts of the country at various positions. Then she joined Jimma University in 2002 to pursue
her B.Sc study and graduated in Horticulture in 2006. Finally, she joined the school of
Graduate Studies of the Harmaya University in 2007 to pursue her M.Sc degree in
Agricultural Economics.

v
ACKNOWLEDGMENT
At the outset I would like to praise the everlasting Father and the Prince of love and peace the
Almighty God who always let the bulk of unfinished work to be completed at a moment.
I am grateful to my respected major advisor Moti Jaleta (PhD), for his unreserved advice,
guidance, and constructive criticism starting from the very commencement up to thesis
completion. Without his encouragement, insight and professional expertise, the completion of
this work would not have been possible. My thanks also go to my co-advisor Dr. Jemma Haji
for his valuable comments on my research work.
In addition, I would like to express my sincere appreciation and gratitude to the ILRI/IPMS
for granting me the scholarship that covered tuition fees and research work, ILRI/IPMS staff
at Gomma pilot learning woreda for their supportive and immediate response on financial
facilitation. I would like also to thank the Manna District Office of Agriculture and Rural
Development for the institutional support to get the scholarship. I also wish to express my
heartfelt thanks to the many farmers and traders who responded to my numerous questions
with patience.
My special thanks and heartfelt gratitude extends to my husband Dr. Girma Tesso for his
patience, support and encouragement. I am also grateful for my best friends Birtukan Kebede,
Shimeles Endale and Tensae Alemayeu for their affection, unreserved encouragement,
inspiration and support. I also thank all people who assisted me in one way or another during
my study period.
I never forget to acknowledge Mr. Berhanu Megersa who helped me in data management and
for his unreserved advice.
Wishing all Holy blessings from Jesus Christ and be considered in His eternal Government.

vi
ACRONYMS AND ABBREVIATIONS
CC Contingency Coefficient
CGS Council of Graduate Studies
CIAT Centro International de Agricultural Tropical
CSA Central Statistical Authority
DAO District Agricultural Office
DGC Departmental Graduate Committee
ETB Ethiopian Birr
FAO Food and Agricultural Organization
FAOSTAT Food and Agricultural Organization Statistical Division
FGD Focus Group Discussion
FYM Farm Yard Manure
GTP Growth and Transformation Plan of Ethiopia
GMMLc Gross Marketing Margin of Local collectors
GMMp Gross Marketing Margin of Processors
GMMF Gross Marketing Margin of Farmers
GMMR Gross Marketing Margin of Retailers
GMMw Gross Marketing Margin of Wholesalers
HAD Horticultural Development Agency
HHH Household Head
IFAD International Fund for Agricultural Development
ILRI International Livestock Research Institution
IPMS Improving Productivity and Marketing Success
JARC Jimma Agricultural Research Center
MoARD Ministry of Agriculture and Rural Development
MoFED Ministry of Finance and Economic Development
NGOs Non Governmental Organizations
NMM Net Marketing Margin
OLS Ordinary Least Squares
PAs Peasant Associations
PPS Probability Proportional to Size
vii
ACRONYMS AND ABBREVIATIONS (Continued …)
SCP Structure Conduct and Performance
SPSS Statistical Packages for Social Sciences
SRS Systematic Random Sampling
SWOT Strength, Weakness, Opportunity and Threat
TGMM Total Gross Marketing Margin
VIF Variance Inflation Factor
WB World Bank

viii
TABLE OF CONTENTS
STATEMENT OF AUTHOR iii
BIOGRAPHICAL SKETCH iv
ACKNOWLEDGMENT v
ACRONYMS AND ABBREVIATIONS vi
TABLE OF CONTENTS viii
LIST OF TABLES xii
LIST OF FIGURES xiii
LIST OF APPENDICES xiv
ABSTRACT xv
1. INTRODUCTION 1
1.1. Background 1
1.2. Statement of the Problem 3
1.3. Research Questions 4
1.4. Objectives of the Study 5
1.5. Scope and Limitations of the Study 5
1.6. Significance of the Study 6
1.7. Organization of the Study 6
2. LITERATURE REVIEW 7
2.1. Theories and Basic Concepts 7
2.1.1. Marketing and marketing concepts 7
2.1.2. Marketing system 8
2.1.3. Marketing efficiency 8
2.1.4. Marketing channel 9
2.1.5. Market chain analysis 9
2.2. Peculiarities of Agricultural Production and Marketing 10
2.3. Market Supply 12
2.4. Approaches to the Study of Agricultural Marketing 12
2.4.1. Functional approach 13
2.4.2. Institutional approach 13

ix
TABLE OF CONTENTS (Continued…)
2.4.3. Commodity approach 13
2.5. Framework for Evaluating Efficiency of Agricultural Marketing System 14
2.5.1. Structure of the market 14
2.5.2. Conduct of the market 15
2.5.3. Performance of the market 16
2.5.3.1. Marketing costs 16
2.5.3.2. Marketing margin 17
2.6. Fruit Production and Marketing in Ethiopia 18
2.7. Empirical Studies on Marketable Supply 19
3. METHDOLOGY 22
3.1. Description of the Study Area 22
3.2. Types and Sources of Data 23
3.3. Sampling Methods 23
3.3.1. Producers survey 23
3.3.2. Traders’ survey 24
3.4. Methods of Data Collection 25
3.5. Method of Data Analysis 25
3.5.1. Descriptive analysis 26
3.5.1.1. Structure Conduct and Performance (S-C-P) model 26
3.5.1.2. Market concentration measure 26
3.5.1.3. Barriers to entry 27
3.5.1.4. Marketing margin 27
3.5.2. Econometric analysis 28
3.5.2.1. Econometric model specification 29
3.5.2.2. Specification of errors 29
3.5.3. Definitions of variables and Hypothesis 31
4. RESULTS AND DISCUSSION 35

x
TABLE OF CONTENTS (Continued…)
4.1. Socio-Demographic Characteristics of Farming Households 35
4.1.1. Age of the households 35
4.1.2. Family size 36
4.1.3. Experience 36
4.1.4. Education 37
4.1.5. Dependency ratio 37
4.1.6. Means of livelihood 38
4.1.7. Access to extension service 39
4.1.8. Access to and use of credit availability 40
4.1.9. Access to roads 40
4.1.10. Access to markets 41
4.1.11. Market information 41
4.2. Socio-Demographic Characteristics of traders 42
4.2.1. Age of the household 42
4.2.2. Experience 42
4.2.3. Education 43
4.2.4. Endowments of traders 43
4.3. Characterization of Fruit Production in Gomma Woreda 44
4.3.1. Average trees owned by households 44
4.3.2. Production and productivity of avocado and mango 45
4.4. Structure, Conduct and Performance of Fruits Marketing 52
4.4.1. Market participants, their rols and linkage 52
4.4.1.1. Avocado market channel 55
4.4.1.2. Mango market channel 57
4.4.2. Market Structure 59
4.4.2.1. The degree of market concentration 59
4.4.2.2. Degree of market transparency 59
4.4.2.3. Barriers to entry and exit 60
4.4.3. Market conduct 63
4.4.3.1. Producer's market conduct 63

xi
TABLE OF CONTENTS (Continued…)
4.4.3.2. Trader's market conduct 64
4.4.4. Marketing performance 66
4.4.4.1. Marketing cost 66
4.4.4.2. Marketing margin 67
4.4.4.3. Marketing profit 69
4.5. Determinants of Avocado and Mango Market Supply 71
4.6. SWOT analysis 75
4.6.1. Challenges along the market chains 77
4.6.2. Area of intervention required 78
5. SUMMARY, CONCLUSIONS AND RECOMMENDATIONS 79
5.1. Summary and Conclusions 79
5.2. Recommendations 81
6. REFERENCES 83
7. APPENDICES 92
xii
LIST OF TABLES
Table Page
Table 1. Sample distribution of mango and avocado producers ............................................ 24
Table 2. Sample distribution of mango and avocado traders………………………………. 24
Table 3. Socio-demographic characteristics of framing households ..................................... 35
Table 4. Average household size and dependency ratio ........................................................ 37
Table 5. Major means of income for farming households .................................................... 38
Table 6. Extenstion contact (%)…………………………………………………………….. 39
Table 7. Access to services .................................................................................................... 41
Table 8. Demographic characteristics of traders .................................................................... 42
Table 9. Economic realities of traders..................................................................................... 43
Table 10. Mango and avocado trees owned by growers ........................................................ 44
Table 11. Barriers to entry and exit of mango and avocado traders (%) ................................ 61
Table 12. Method of price setting and term of payment ......................................................... 65
Table 13. Marketing cost for different marketing agents (Birr/qt) ......................................... 67
Table 14. Marketing margins of traders in different marketing channels ............................... 68
Table 15. Marketing profit for different agents (Birr/qt) ........................................................ 69
Table 16. Determinants of avocado quantity supplied ............................................................ 72
Table 17. Determinants of mango quantity supplied .............................................................. 74
Table 18. SWOT analysis matrix ............................................................................................ 76

xiii
LIST OF FIGURES
Figures Page
Figure 1. Source of planting materials for mango and avocado 47
Figure 2. Source of labor for harvesting of avocado and mango 48
Figure 3. FYM application rate in avocado and mango (ton per hectare) 49
Figure 4. Production trend for the past five years 50
Figure 5. Proportion of market actors of avocado and mango in the study area 52
Figure 6. Volume and flow of avocado in Gomma woreda 56
Figure 7. Volume and flow of mango in Gomma woreda 58
Figure 8. Market place to buy avocado 65
Figure 9. Area of intervention required at micro and meso-level 78
xiv
LIST OF APPENDICES
Appendix Table Page
ANNEX 1. Producers’ interview schedule ............................................................................ 92
ANNEX 2. Traders’ interview schedule ................................................................................ 98
ANNEX 3. Checklist for farmers’ group discussion ............................................................ 105
ANNEX 4. Checklist for traders focus group discussion ..................................................... 106
ANNEX 5. Key informant discussion with horticultural experts (Woreda and Zone) ......... 107
ANNEX 6. FGD and key informants in the study area…………………………………….107
ANNEX 7. Production area of major tropical fruits (Ha in year) ........................................ 108
ANNEX 8. National production and yield of major tropical fruits in Ethiopia .................... 108
ANNEX 9. Avocado production across administrative regions of Ethiopia ........................ 109
ANNEX 10. Multi-collinearity test with VIF ....................................................................... 110
ANNEX 11. Contingency coefficient ................................................................................... 110

xv
Market Chain Analysis of Fruits for Gomma Woreda, Jimma Zone Oromia
National Regional State
ABSTRACT
In support of stimulating growth, economic development, food security and alleviating
poverty, the analysis of the marketing performance of fruits plays an important role in an on-
going or future fruit development plan. In spite of the policy options provided by the
Ethiopian government, there is very little empirical evidence on the fruit marketing system to
design appropriate policies for its improvement of fruit marketing in the study area.
Therefore, this study was aimed at analyzing the market chain of fruit for Gomma woreda,
Jimma Zone of Oromia National Regional State with the specific objectives of identifying the
major fruit marketing channels; quantifying the costs and margins for key fruit marketing
channels and identifying factors influencing fruit marketable supply in the study area. In
order to attain these objectives the study made use of primary and secondary data. The data
were generated by individual interview schedules and focus group discussions using pre-
tested semi structured questionnaires and checklists respectively. This was supplemented by
secondary data collected from different published and unpublished sources. Structure,
Conduct and Performance (SCP) approach was used to evaluate avocado and mango market
and Multiple Linear Regression Model was fitted to identify factors influencing the
marketable supply of avocado and mango in the study area. Structure of the market indicates
that licensing and years of avocado and mango trade experience did not hinder entry into
avocado and mango trade, but capital, education and market information were barriers to
enter into the trade. Analysis of marketing costs and margins revealed that processors (juice
house) received the highest (88.73%) marketing margin and producers received the least
(11.27%) marketing margins in avocado and mango trade business. Based on regression
model, the study has identified the main determinants of avocado and mango quantity supply.
Quantity of avocado produced, experience, education and price of avocado in the previous
year are factors that significantly affect quantity of avocado supplied to the market positively
at 1%, 5%, and at 10% level, respectively while lack of market access affects the supply
negatively at 10% level. Similarly quantity of mango produced, education and extension
contact are factors that significantly affect quantity of mango supplied to the market
positively. Therefore one of the most important variables influencing the market supply of
avocado and mango is avocado and mango quantity produced due to this, extension work
should focus on encouraging farmers to participate in avocado and mango production. This
particularly includes, capacity building, technological applications, improved extension and
plant breeding activities, there is also a need to increase new varieties that are disease
resistant and disseminate these technologies to potential areas. The findings suggests that,
effective market information service has to be established to provide accurate and timely
market information to farmers and traders on current supply of avocado and mango output,
demand and prices at national and regional levels. Infrastructural development is also a key
to support the sub-sector. In this arena, emphasis should be given to improved storage and
transportation system, offering credit and other services to improve effective production and
marketing of avocado and mango.

1
1. INTRODUCTION
1.1. Background
Fresh tropical fruits are on winning ground in world markets as to recent statistical figures
(Anonymous, 2001). Its production has risen by 7% annually since 1997; and the bulk of
these fruits (98%) are grown in developing countries. As Yeshitla (2004) indicated the latest
figure shows that pineapple accounts for 44% of the total traded volume, followed by
mangoes (27%), avocados (12%) and papayas (7%). The main reason for increase in demand
of tropical fruits is the growing familiarity of consumers with tropical fruits; their taste,
nutritional value and cooking qualities.
As Lumpkin et al. (2005) pointed out worldwide production of fruit and vegetable crops has
grown faster than that of cereal crops. Between 1960 and 2000, the area under horticultural
crops worldwide has doubled. Among the main reasons attributable to the growth, high return
from horticulture as compared to cereals was the prime one. Per capita farm income from
horticulture has been reported up to five times higher. Promotion of the production of, and
trade in, fruit and vegetables has recently become one of the key objectives of developing
countries. IFAD’s regional strategy for sub-Saharan Africa focuses on enhancing the income
of small holders within the context of trade liberalization. Smallholder production and the
marketing of fruits and vegetables is a key focus (IFAD, 2003). Most fruits are perennial trees
and can live more than fifty years (eg. mangos). Apart from their economic importance, they
are forest and environmentally friendly to fight against drought, use as shade, fire wood, food
security, agro industry, export, etc.
Ethiopia is agro-ecologically diverse and has a total area of 1.13 million km2. Many parts of
the country are suitable for growing temperate, sub-tropical or tropical fruits. For example,
substantial areas in the south and south-western parts of the country receive sufficient rainfall
to support fruits adapted to the respective climatic conditions. In addition, there are many
rivers and streams which could be used to grow various horticultural crops. Despite this
potential, however, production-market chore of fruits has remained immature in Ethiopia
(Joosten, 2007) mainly due to traditional focus which was in favor of cereals. Serious lack of

2
information and ‘on and off’ productions have also played their deterring role (Naamani,
2007). Realizing these gaps, lately however, the government of Ethiopia has launched
enabling environment to encourage chain actors. As a result, the Ministry of Agriculture has
elevated the horticulture sub-sector from a small section to a level of agency (World Bank,
2004; Joosten, 2007; Kahsay et al., 2008).
More than 47 thousand hectares of land is under fruit crops in Ethiopia. Bananas contributed
about 60.56% of the fruit crop area followed by Mangoes that contributed 12.61% of the area.
Nearly 3.5 million quintals of fruits was produced in the country. Bananas, papaya, mangoes
and orange took up 55.32%, 12.53%, 12.78% and 8.35% of the fruit production, respectively
(CSA, 2009). However, less than 2 % of all the produce is exported (Joosten, 2007). These
fruits are typically cultivated to supplement household income from their main crops. The few
state farms with about 3,000 ha mainly grow tropical fruits (banana, avocado, mango, orange,
and papaya) and are mainly located in the eastern Rift Valley (Seifu, 2003). Apples are
mainly grown in the highlands of Chencha, in the south, and are expected to expand to other
highland areas in the country (Joosten, 2007).
Oromia has diverse agro ecology and many areas are suitable for growing temperate,
subtropical or tropical fruits. Substantial areas receive sufficient rainfall and many lakes,
rivers and streams could also be used to support fruit production. Despite this potential, the
total land area under fruits is very small and mainly smallholder-based. According to CSA
(2009), the area under fruits is about 18313 hectares.
Gomma Woreda is endowed with diverse natural resource and has the capacity to grow
different annual and perennial crops. There are about five rivers in the Woreda. Even though
available land and water resources offer high potential for irrigation development in Gomma,
the present utilization level is very poor (IPMS, 2007). Fruit production in the Woreda is
mainly for market. The production is very fragmented and uncoordinated where all growers
produce similar type of crop resulting in glut typically in harvest season (mainly avocado and
3
mango). Avocado, mango, orange, banana and papaya are the major types of fruits which are
grown in the area.
1.2. Statement of the Problem
In Ethiopia, the existing income generating capacity of fruits as compared to its immense
potentials at the macro and micro level is not encouraging. Thus, from the total 3.5 million
quintals of fruits produced in Ethiopia, only less than 2% is exported (Joosten, 2007; MoARD,
2005).
According to Yilma (2009), the production potential of fruits is not widely and evenly
distributed across the various regions of the country. The cultivation is also seasonal and the
supply is scanty and volatile even in areas where irrigation is possible. The knowledge gap on
fruit production techniques and processing technologies is wide. Also, knowledge of domestic
consumers of the benefits of fruits is confined to very few varieties of fruits. Hence, domestic
demand, with the exception of few widely known tropical fruits, is generally small and,
various studies show that people generally consume fruits and vegetables on a daily basis, without
considering them as basic. These factors have adversely affected the growth and expansion of
the fruit sub-sector in Ethiopia.
Additionally Bezabih and Hadera (2007) stated that a production of horticultural product is
seasonal and price is inversely related to supply. During the peak supply period, the prices
decline. The situation is worsened by the pershability of the products and poor storage
facilities. Along the market channel, 25 percent of the product is spoiled.
Development needs of fruit in general and that of avocado and mango in particular is poorly
addressed in Ethiopia. But these days efforts have been stepped up to improve and support the
sector. With this line, the current Growth and Transformation Plan of Ethiopia (GTP)
prioritizes intensive production and commercialization of horticulture as a sector for attention.
Thus, the development policy initiates the need to accelerate and lucid the transformation of
the sub-sector from the subsistence to business and market-oriented agriculture. But, the

4
existing restraints of post-harvest and marketing infrastructures such as: packaging, pre
cooling, warehousing cold storage, pre-package and distribution have played their deterring
role on trade and consumption of fruits in Ethiopia (Seifu, 2003).
According to World Bank Group (2006), lack of concerted public support, scanty information,
poor understanding of how the market chain works; and lack of systematic documented
knowledge are main threats that hampered the benefit of the sector. Thus comprehensive data
collection along the chain is a must envisage the direction of input-output flows (Tsegaye et
al., 2009). If these jeopardize are not well addressed right onwards, it is obvious the country’s
competitiveness would trail far behind the existing stage.
Fruit production in Gomma woreda is mainly constrained by seasonality where surplus at
harvest is the main characteristics of the product (mainly avocado and mango). The nature of
the product on one hand and lack of organized marketing system on the other often resulted in
low producers’ price.
Even though fruit is economically and socially important, fruit marketing channel and their
characteristics have not yet been studied and analyzed for the target study area (Gomma
woreda) where great potential of fruit production (Avocado and Mango) exists. Therefore,
this study has the purpose of investigating fruits marketing chains and factors affecting fruit
supply to the market in Gomma woreda, which will narrow the information gap on the subject
and will contribute to better understand on improved strategies for reorienting marketing
system for the benefit of small farmers and traders.
1.3. Research Questions
This study attempted to answer the following research questions:
1. What are the major fruit marketing channels in the study area? and what is the role and
linkage of marketing agents;
2. Through which actor large percent of the products enter to the market?

5
3. Who gets the major share of the marketing margins in avocado and mango marketing
channels at the study area?
4. What are the constraints and opportunities of fruit marketing in the study area?
5. What are the major technological, institutional and socio economic determinants of
market supply of avocado and mango in Gomma woreda?
1.4. Objectives of the Study
The general objective of the study is to analyze the avocado and mango marketing chain in
district.
The specific objectives of the study are:
1. To identify the major fruit marketing channels in Gomma woreda;
2. To quantify costs and margins for key fruit marketing channels in Gomma district;
3. To identify factors affecting marketable supply of fruit in Gomma woreda.
1.5. Scope and Limitations of the Study
The study focused on identifying major fruits (Avocado and Mango) marketing channels,
estimating the marketing margins and costs for key marketing channels, and identifying
factors influencing marketable supply of fruits in Gomma woreda. The area coverage of this
study is limited to three PAs found in Gomma Woreda based on the level of production of the
two fruits and the fruits are limited to Avocado and Mango for their increasing coverage and
the marketing problem they used to face. The markets are purposively selected based on their
relative importance for avocado and mango market. However, the study is focused only in
Gomma Woreda due to budgetary and time limitations. Congruently, lack of record keeping
by chain actors was a challenging to collect relevant information in the channel. Thus, key
informants and secondary sources are extensively used to complement preliminary
information and to understand rationality behind the status of the market chains.

6
1.6. Significance of the Study
This study generated useful information in order to formulate fruit marketing development
projects and guidelines for interventions that will improve the efficiency of fruit marketing
system. The potential users of the findings are farmers (producers), traders, government and
non-government organizations, that have interest in improving fruit marketing system.
Researchers who want further investigation on fruit marketing will use the result from this
study.
1.7. Organization of the Study
Chapter one has enveloped introductions, statement of the problem, objectives, research
questions, scope and limitations and significance of the study. The second chapter has
intensely reviewed the available literature by entailing general concepts of market chain and
empirical research results executed elsewhere. The third chapter has enveloped components of
the research methodology including description of the study area, types of data and its
collection method and method of data analysis; while the fourth chapter discerned the
credential of the survey results by discussing it in comparison with the results of other studies.
Brief narrations of important findings of the study are presented in chapter five.

7
2. LITERATURE REVIEW
In this chapter the basic concepts of markets, marketing, marketing system and market
channel, factors affecting market supply, the approaches and methods to evaluate the
efficiency of agricultural markets have been discussed.
2.1. Theories and Basic Concepts
2.1.1. Marketing and marketing concepts
Market: A market is a point or a place or sphere within which price-making force operates
and exchanges of title tend to be accompanied by the actual movement of the goods affected
(Backman and Davidson, 1962; Andargachew, 1990). The concept of exchange and
relationships lead to the concept of market. It is the set of the actual and potential buyers of a
product (Kotler and Armstong, 2003). A market can be described as simple arrangements to
facilitate exchange of one thing for another (Bain and Howells, 1988). The most observable
features of a market are its pricing and exchange processes and it is more than a physical
place. No need to meet physically for a market to operate especially in today’s information
and communication technologies.
Agricultural marketing: The term marketing has been a very debatable concept and defined
in so many different ways by different scholars. This is because marketing, or more
specifically agricultural marketing, projects different impression to different groups of people
in a society, like farmers, traders and consumers (Kohls and Uhl, 1985). Marketing can be
described as the performance of all business activities involved in the flow of food products
and services from the point of initial agricultural production until they are in the hands of
consumers (Kohls and Uhl, 1985; Bain and Howells, 1988). According to Kotler and
Armstrong (2003), marketing is a societal process, by which individuals and groups obtain
what they need and want through creating, offering, and freely exchanging products and
services and value with others. Marketing is essentially a process like farming, manufacturing,
mining or construction (Backman and Davidson, 1962).

8
2.1.2. Marketing system
The concept of marketing system includes both physical distribution of economic input and
products and the mechanism of process or coordinating production and distribution (cited in
Andargachew 1990). Branson and Norvel (1983) defined the marketing system in terms of
what is otherwise known as marketing channel. In broad terms, marketing system may be
defined as the totality of product channels, market participants and business activities
involved in the physical and economic transfer of goods and services from producers to
consumers. Marketing system operates through a set of intermediaries performing useful
commercial functions in chain formations all the way from the producer to the final
consumers (Islam et al., 2001).
2.1.3. Marketing efficiency
It refers to the efficient allocation of resources to achieve the greatest possible consumer
satisfaction (Raymon, 2003). Efficiency of agricultural marketing according to Scarborough
and Kydd (1992) refers to the efficiency with which resources are used in marketing, in terms
of physical input and output ratios. An efficient firm or market produces the maximum
possible output from the input used, given location and environmental constraints, and it
minimizes resource inputs for any given output. There are numerous ways of estimating the
performance of agricultural marketing. However, two aspects of market efficiency are mostly
mentioned in agricultural marketing these are: operational efficiency and pricing efficiency
(Jesse, 1987).
Operational efficiency: It is defined as the provision of goods and services at least cost and
at a level of output, or combination of inputs, which ensures that, the value of marginal
product equals marginal factor costs. Sometimes it is also referred to as firm level allocative
efficiency. The fundamental question is assessing the static operational efficiency of market
and of marketing firms, are whether, the level of output per combinations of inputs are such
that marginal revenues equate with marginal costs (Scarborough and Kydd, 1992).

9
Pricing efficiency: It is concerned with accuracy, precision, and speed with which prices
reflect consumers’ demands and are passed back through the market channels to producers.
Pricing efficiency is, thus, affected by rigidity of marketing costs and the nature and degree of
competition in the industry. Activities that may improve pricing efficiency are improvement
of market news and information, and competition (Cramer and Jensen, 1982). If markets are
perfectly competitive, and prices reflect real costs of production, it can be shown that markets
will lead to an optimal allocation of resources reflecting the scarcity of resources relative to
consumer demand (Scarborough and Kydd, 1992).
The objective of pricing efficiency is thus to improve the operation of buying, selling, and
pricing aspect of the marketing process so that it remains responsive to consumer's preference
(Kohls and Uhl, 1985). Pricing inefficiencies arise when markets contain monopoly elements,
governments intervene by introducing restrictions on trade, and the cost of information is
zero, and so on.
2.1.4. Marketing channel
It is a business structure of interdependent organizations from the point of product origin to
the consumer with the purpose of moving products to their final consumption destination
(Kotler and Armstong, 2003). The analysis of marketing channels is intended to provide a
systematic knowledge of the flow of goods and services from their origin (producer) to their
final destination (consumer). This knowledge is acquired by studying the participants in the
process, i.e. those who perform physical marketing functions in order to obtain economic
benefits (Getachew, 2002). This channel may be short or long depending on the kind and
quality of the product marketed, available marketing services, and prevailing social and
physical environment (Islam et al., 2001).
2.1.5. Market chain analysis
A marketing chain is used to describe the numerous links that connect all actors and
transactions involved in the movement of agricultural products from the farm to the consumer

10
(Lunndy et al., 2004). It is the path one good follow from their source of original production
to ultimate destination for final use. Functions conducted in a marketing chain have three
things in common; they use up scarce resources, they can be performed better through
specialization, and they can be shifted among channel members (FAO, 2005). According to
Hobbs et al. (2000), the term supply chain refers to the entire vertical chain of activities: from
production on the farm, through processing, distribution, and retailing to the consumer. In
other words, it is the entire spectrum, from gate to plate, regardless of how it is organized or
how it functions.
Market chain is the term used to describe the various links that connect all the actors and
transactions involved in the movement of agricultural goods from the producer to the
consumer (CIAT, 2004). Commodity chain is the chain that connects smallholder farmers to
technologies that they need on one side of the chain and to the product markets of the
commodity on the other side (Mazula, 2006). Market chain analysis, therefore, identifies and
describes all points in the chain (producers, traders, transporters, processors, consumers),
prices in and out at each point, functions performed at each point/ who does what?, market
demand/ rising, constant, declining, approximate total demand in the channel, market
constraints and opportunities for the products.
2.2. Peculiarities of Agricultural Production and Marketing
Profitability of horticultural production has attracted most farmers due to higher farm income
as compared to cereal production. Cultivation of fruits and vegetables allows for productive
employment where the labor/land ratio is high, since horticultural production is usually labor
intensive. Increasing horticulture production contributes commercialization of the rural
economy and creates many off-farm jobs. However, expanding the scale of horticulture
production is often hindered by lack of market access, market information, and many
biological factors (Weinberger and Lumpkin, 2005).

11
Agricultural production is tied to specific locations due to the resource base is not best suited
at other locations. The scale of agricultural production tends to be small, seasonal, and
agricultural products exhibit natural variation (Van der Laan, 1999).
Due to the above characteristics put by Van der Laan (1999) agricultural products demand
marketing activities to be performed separately. Location specificity demand collection
followed by distribution, small-scale activity urges assembling, collecting and bulking.
Seasonality forced storage and stock holding. The natural variation of products creates the
need for sorting and standardization. Yet, by virtue of the spatial dispersion of producers and
consumers, the temporal lags between input application and harvest, the variable perishable
nature and storability of commodities, and the political sensitivity of basic food staples,
agricultural markets are prone to high transactions costs, significant risks and frequent
government interference.
Compared to most other products, agricultural products are both bulkier and more perishable.
Bulk affects the marketing functions concerned with physical handling. Products that occupy
a lot of space in relation to their value are expensive to transport and store. Pershability also
influences the marketing of farm products. All biological products ultimately deteriorate.
Even the most storable agricultural products, however, are usually more perishable than
industrial products (Kohls and Uhl, 1985). According to Kohls and Uhl (1985) these product
characteristics have their effect on the facilities necessary to market farm products. Bulkiness
requires large storage capacities. Perishable products require speedy handling and perhaps
special refrigeration.
According to Moti (2007) the existence of large number of farmers (sellers) and limited
number of merchants (buyers) particularly in the perishable product market, the bargaining
position of farmers is usually weak. Besides the market structure, farmers and merchants may
not have equal information from central transactions.

12
2.3. Market Supply
Marketed supply refers to the amount actually taken to the markets irrespective of the needs
for home consumption and other requirements. Whereas, the marketable surplus is the
residual with the producer after meeting the requirement of seed, payment in kind, and
consumption by farmer (Wolday, 1994). Marketed surplus is defined as the proportion of
output that is marketed (Harris, 1982). Marketed surplus may be equal to marketable surplus,
but may be less if the entire marketable surplus is not sold out and the farmers retain some
stock and if losses are incurred at the farm or during the transit (Thakur et al., 1997). In the
case of crops that are wholly or almost wholly marketed, the output and marketed surplus will
be the same (Reddy et al., 1995). The importance of marketed and marketable surplus has
greatly increased owning to the recent changes in agricultural technology as well as social
patterns. In order to maintain the balance between demand for and supply of food grains with
the rapid increases in demand due to higher growth population, urbanization, industrialization
and overall economic development accurate knowledge on marketed and marketable surplus
is essential in the process of proper planning for the procurement, distribution, export and
import of agricultural product (Malik et al., 1993).
The decision to supply market is one big question but usually is taken after the produce is at
hand or if decided earlier some other decisions have to be considered. Among many, the
choice of crop to grow, land size to allocate, and to which buyer to sell are some. These
choices of crop and market outlet choices are household specific and depend on several
attributes like household characteristics, farm resource endowments and access to market.
2.4. Approaches to the Study of Agricultural Marketing
Different circumstances involved in the demand and supply of agricultural products, and the
unique product characteristics, require a different approach for analyzing agricultural
marketing problems (Johan, 1988). The major and most commonly used approaches are
functional, institutional and commodity approaches.

13
2.4.1. Functional approach
Functional approach to study marketing is to break up the whole marketing process into
specialized activities performed in accomplishing the marketing process (Kohls and Uhl,
1985). The approach helps to evaluate marketing costs for similar marketing middlemen
and/or different commodities and costs and benefits of marketing functions (Kohls Uhl, 1985;
and Andargachew, 1990). The widely accepted functions are: exchange (buying and selling),
physical (processing, storage, packing, labeling and transportation), and facilitating
(standardizing, financing, risk bearing, promoting and market information). The exchange
function involves pricing, buying and selling which is a transfer of title between exchanging
parties.
2.4.2. Institutional approach
This approach focuses on the description and analysis of different organizations engaged in
marketing (producers, wholesalers, agents, retailers, etc) and pays special attention to the
operations and problems of each type of marketing institution. The institutional analysis is
based on the identification of the major marketing channels and it considers the analysis of
marketing costs and margins (Mendoza, 1995). An institutional approach for the marketing of
agricultural product should be instrumental in solving the three basic marketing problems,
namely consumers' demand for agricultural products, the price system that reflects these
demands back to producers and the methods or practices used in exchanging title and getting
the physical product from producers to consumers in the form they require, at the time and
place desired (Johan, 1988).
2.4.3. Commodity approach
In a commodity approach, a specific commodity or groups of commodities are taken and the
functions and institutions involved in the marketing process are analyzed (Kohls and Uhl,
1985). This approach is said to be the most practical as it helps to locate specific marketing
problems of each commodity and improvement measures. The approach follows the

14
commodity along the path between producer and consumer and is concerned with describing
what is done and how the commodity could be handled more efficiently (Purcell, 1979).
2.5. Framework for Evaluating Efficiency of Agricultural Marketing System
Structure, Conduct and Performance (SCP) model
The basic view of this approach is that, given certain basic conditions, the structure of an
industry or market determines conduct of buyers and sellers which influence its performance.
The basic conditions refer to characteristics which are exogenous to the market, for example
infrastructure, legal and policy environment and available technology. Efficiency factors can
be evaluated by examining marketing enterprises for structure, conduct and performance
(Abbott and Makeham, 1981). SCP model is one of the most common and pragmatic methods
for analyzing marketing system. It analyzes the relationship between functionally similar
firms and their market behavior as a group and, it is mainly based on the nature of various sets
of market attributes and relations between them and their performance (Scarborough and
Kydd, 1992). This analytical method is based on the theory that market structure and market
conduct determine the performance of a marketing system.
2.5.1. Structure of the market
The term market structure refers to the number of buyers and sellers, their size distribution,
the degree of product differentiation, and the ease of entry of new firms into an industry
(Abbott and Makeham, 1981 Cramer and Jensen, 1982; and Branson and Norvell, 1983).
Examples of such dimensions include:
a) Degree of buyers and sellers concentration: Number and size distribution of buyers and
sellers in the market.
b) Barriers to potential entrants: Refers to the relative ease or difficulty with which new
dealers may enter into market. Technological, economic, regulatory, institutional, and other
factors that inhibit firms from engaging in new businesses or entering new markets, and

15
c) Degree of product differentiation: Refers to the extent to which competing products in a
market are differentiated and it is expected to influence the competitive interrelationships
of sellers in the market.
Market concentration can be defined as the number and size of sellers and buyers in the
market. Concentration is believed to play a large part in the determination of market behavior
within an industry because it affects the interdependence of action among firms. The
relationships between concentration and market behavior and performance must not be
interpreted in isolation. Other factors, such as firms’ objectives, barrier to entry, economies of
scale, and assumptions about rival firms’ behavior, will be relevant in determining the degree
of concentration and relationship between concentration and behavior and performance
(Schere, 1980). Market structure can also be defined as characteristics of the organization of a
market, which seem to strategically influence the nature of competition and pricing behavior
within the market (Bain, 1968). Structural characteristics may be used as a basis for
classifying markets. Markets may be perfectly competitive; monopolistic; or oligopolistic
(Scott, 1995; Meijer, 1994). The organizational features of a market should be evaluated in
terms of the degree of seller concentration, entry barriers (licensing procedure, lack of capital,
know-how, and policy barriers), degree of transparency and degree of product differentiation
that condition or influence the conduct and strategies of competitors (Wolday, 1994).
2.5.2. Conduct of the market
Market conduct refers to the market behavior of all firms. In what way do they compete? Are
they looking for new techniques and do they apply them as practicable? Are they looking for
new investment opportunities, or are they disinvesting and transferring funds elsewhere?
Market conduct also deals with the behavior of firms that are price searchers and are expected
to act differently than those in a price-taker type of industry (Abbott and Makeham, 1981;
Cramers and Jensen, 1982).

16
2.5.3. Performance of the market
It is reflection of the impact of structure and conduct on product price, costs and the volume
and quality of output (Cramers and Jensen, 1982). If the market structure in an industry
resembles monopoly rather than pure competition, then one expects poor market performance.
According to Abbott and Makeham (1981), market performance is how successfully the
firm’s aims are accomplished, which shows the assessment of how well the process of
marketing is carried out.
As a method for analysis the SCP paradigm postulates, there exists a relationship between the
three levels distinguished. One can imagine a causal relations starting from the structure,
which determine the conduct, which together determine the performance (technological
progressiveness, growth orientation of marketing firms, efficiency of resource use, and
product improvement and maximum market services at the least possible cost) of agricultural
marketing system in developing countries (Meijer, 1994). The performance of a certain
market or industry depends on the conduct of its sellers and buyers which, in turn, is strongly
influenced by the structure of the relevant markets (Scarborough and Kydd, 1992).
Market performance can be evaluated by analyzing the costs and margins of marketing agents
in different channels. A commonly used measure of system performance is the marketing
margin or price spread. Margin or spread can be a useful descriptive statistics if it used to
show how the consumer’s food price is divided among participants at different levels of
marketing system (Getachew, 2002).
2.5.3.1. Marketing costs
It refers to those costs which are incurred to perform various marketing activities in the
transportation of goods from producer to consumers. Marketing costs includes handling cost
(packing and unpacking), costs of searching for a partner with whom to exchange, screening
potential trading partners to ascertain their trustworthiness, bargaining with potential trading

17
partners (officials) to reach an agreement, transferring the product, monitoring the agreement
to see that its conditions are fulfilled, and enforcing the exchange agreement (Holloway and
Ehui, 2002).
2.5.3.2. Marketing margin
It is a commonly used measure of the performance of a marketing system (Abbott and
Makeham, 1981). It is defined as the difference between the price the consumer pays and the
price that is obtained by producers, or as the price of a collection of marketing services, which
is the outcome of the demand for and supply of such services (Cramers and Jensen, 1982 and
William and Robinson, 1990; Holt, 1993). The size of market margins is largely dependent
upon a combination of the quality and quantity of marketing services provided the cost of
providing such services, and the efficiency with which they are undertaken and priced. For
instance, a big margin may result in little or no profit or even a loss for the seller involved
depending upon the marketing costs as well as on the selling and buying prices (Mendoza,
1995).
Under competitive market conditions, the size of market margins would be the outcome of the
supply and demand for marketing services, and they would be equal to the minimum costs of
service provision plus “normal” profit. Therefore, analyzing market margins is an important
means of assessing the efficiency of price formation in and transmission through the system.
There are three methods generally used in estimating marketing margin.
1. Detailed analyses of the accounts of trading firms at each stage of the marketing
channel (time lag method);
2. Computations of share of the consumer’s price obtained by producers and traders at
each stage of the marketing chain; and
3. Concurrent method: comparison of prices at different levels of marketing over the
same period of time (Mendoza, 19985 and Scarborough and Kydd, 1992).

18
2.6. Fruit Production and Marketing in Ethiopia
Ethiopia has a variety of fruit crops grown in different agro ecological Zones by small
farmers, mainly as a source of income as well as food. The production of fruit varies from
cultivating a few plants in the backyards, for home consumption, to large-scale production for
the domestic and home markets. According to CSA (2009) the area under these crops
(avocado, bananas, guava, lemons, mangoes, oranges, papayas and pineapples) were
estimated to be 47987 hectares. Oromia has diverse agro ecology and many areas are suitable
for growing temperate, subtropical or tropical fruits. Substantial areas receive sufficient
rainfall and many lakes, rivers and streams could also be used to support fruit production.
Despite this potential, the total land area under fruits is very small and mainly smallholder-
based. According to CSA (2009), the area under fruits is about 18313 hectares.
Avocado: Endowed with wide range of agro-ecological Zones and diversified resources,
Ethiopia is amid of the 10 major avocado producing countries of the world (FAOSTAT, 2004
and MoARD, 2009). With Global annual production of two to four million metric tons,
avocado is produced in many countries ranging from Asia and South America to Africa.
According to Mauro (2006), Ethiopia’s international involvement in horticultural trade and
production is growing at rate of 7 per cent per year by creating better opportunity to compete
on lucrative export market. Owing to these realities, with its shortest introduction to Ethiopia,
avocado is now produced by thousands of farmers and the mob has extended, these days, to
more than 7000 ha of land with annual production of 80,000 tones (CSA, 2008; FAOSTAT,
2004; Joosten, 2007)). The crop is a bright source of household income and a shade for spice
crops (MoARD, 2009).
Mango: It is a perennial tree which can live more than fifty years and it is also the leading
fruit produced in most parts of eastern and south-western Ethiopia both in area coverage and
quantities produced. There are also ample garden mango trees in different parts of the country
at farmer’s holdings. The livelihood of most of these farmers is highly supplemented by the
sale of mango fruits. The area coverage under mango in eastern Ethiopia has reached about
35% of the total acreage allotted for fruit production (Yeshitla, 2004).

19
According to FAOSTAT (2010) the total cultivated area for mango in Ethiopia is not more
than 12, 000 hectares. The highest annual production estimate in the past five years is 180,000
Mt and more area coverage is expected in the south-western and other parts of the country due
to more conducive climatic and edaphic factors. According to Yeshitela (2004) even if the
farmer’s livelihood is highly supplemented by the income from their mango trees, there is a
declining trend in yield and quality of mango due to old age, poor management and seedling
originated nature of the trees. However, there are exceptionally good yielding trees with best
quality fruits. Apart from its economic importance, it is forest and environmentally friendly to
fight against drought, use as shade and fire wood.
In the context of increasing the high value production of agricultural commodities, fruit tree
and perennial crops play an important role. This commodity group includes tropical nuts, fruit
trees, grapes, bananas, mango, pineapple, papaya, passion fruits, apples and others. Except
table banana, tropical fruit trees like mango, avocado and the like were not well known and
considered as diet by most Ethiopians (Yilma, 2009).
However, Yilma (2009) indicated that the expansion of state farms in the past command
economy and the prevailing expansion of private investors in different regions of the country
have contributed a lot on the introduction of fruits as business. Otherwise, areas suitable for
growing fruit trees are idle even near riverbanks where there is ample water supply for
growth. Because of the long period establishment cost of fruit trees before fruit setting,
knowledge limitations of food technology and market information, smallholders are not
practicing other fruit trees except banana. In general, fruit production is still backward, the
business is under developed and the private sector is not much attracted.
2.7. Empirical Studies on Marketable Supply
Dawit and Hailemariam (nd) stated the importance of horticultural crops for both domestic
and international markets as it was increasing at increasing rate from time to time associated
with the expansion of small-and large-scale irrigation facilities compounded by national and
regional extension service on the production of horticultural crops. They further reported three

20
options for selling horticultural crops which include selling right in the field/ farm gate; sell at
nearby markets and least proportion option to access distance markets where larger (93
percent)of the total produce was sold to wholesalers.
Similar research result by Beyene and Phillips (2007) have designated that, absences of
research and market information in Ethiopian honey value chain have wasted the nation’s
incalculable benefits. This study was further evidenced by Belay (2003) who stated that, lack
of government support such as: inadequate research and training, policies and strategies, have
increased knowledge gap among the Ethiopian small scale farmers.
A study on green beans by Lusby (2007) has revealed that, lack of crop husbandry skills and
limited extension services has constrained the productivity of the sector. Simultaneously,
Cormick and Schmitz (2001) have indicated even though firms in a system are formally
independent of one another, an increasing network through personal relations and repeated
transactions has assisted to inspect and alleviate the chain’s core problems by developing their
capacity and reducing the cost of the actors.
Abay (2007) identified the major factors that affect the supply of vegetables (onion and
tomato) at Fogera District. His study revealed that owned oxen number, family size, and
distance from development agent and experience has affected marketable supply of onion and
tomato. In similar way, Adugna (2009) identified major factors that affect marketable supply
of papaya in Alamata District. Adugna’s study revealed that papaya quantity produced
influenced marketable supply positively.
Unavailability of standardized packing material has forced exporters in Ethiopia to import
packing material from Netherlands and Israel (Wiersinga and Jager, 2009). But efforts are
now commenced to produce packing material in Ethiopia. According to FAO (2006), mango
farmers in Kenya are suffering from poor post-harvest handling which affected their income
where farmers are compelled to sell their product immediately after harvest. Thus hastened

21
ripeness of avocado at room temperature has aggravated ethylene release and necessitated
immediate utilization (Crosby, 2008; Stanlich, 2009).
Similarly, Bezabih and Hadera (2007) explore use of low level of improved agricultural
technologies, risks associated with weather conditions, diseases and pests, as the main reasons
for low productivity. Moreover, due to the increasing population pressure the land holding per
household is declining leading to low level of production to meet the consumption
requirement of the household. As a result, intensive production is becoming a means of
promoting agro-enterprise development in order to increase the land productivity.
Horticultural production gives an opportunity for intensive production and increases small
holders’ farmers’ participation in the market.
Additionally Bezabih and Hadera (2007) stated that production is seasonal and price is
inversely related to supply. During the peak supply period, the prices decline. The situation is
worsened by the pershability of the products and poor storage facilities. Along the market
channel, 25 percent of the product is spoiled.
Pershability is also one of the bottlenecks that hampered easy product flow along the chain
and reported to require fervent attention. Price negotiation while the commodity is en route to
final market has tiled actors to divert their destination to better price offering markets
(Formma and Dubon, 2006). Hence, losses of trust were the main feature reported and often
led to disputes among buyers and sellers. Producers are normally price takers and are
frequently exposed for cheating by intermediaries.
From these reviewed literatures severe production seasonality, seasonal price fluctuations,
poor pre-and post harvest handling, prevalence of pest and diseases, lack of storage are some
of the critical problems encountered horticulture production in Ethiopia.

22
3. METHDOLOGY
3.1. Description of the Study Area
Gomma Woreda is one of the 17 Woredas in Jimma Zone known for predominantly growing
coffee. It is located 403 km south west of Addis Ababa and about 50 km west of Jimma town.
One of the coffee biodiversity centers in Ethiopia is found in this Woreda. There are 39
peasant associations and 3 urban peasant associations. The number of agricultural households
in the Woreda was 45,567 (35,533 male headed (78%)) and 10,034 female headed (22%))
while the total population of the Woreda was 216,662 from which 110,448 are males and
106,174 females (CSA, 2009). Gomma is the second most densely populated Woreda in
Jimma Zone with a size of 96,361.72 ha (94.4 km2) including the two coffee state farms
which cover an area of 2704 ha (IPMS, 2007).
The average annual rainfall of the district is 1524 mm with low variability. It is bimodality
distributed in which the small rains are from March to April and the main rainy season from
June to October. Hence, crop and livestock production is not constrained by the amount and
distribution of rainfall. Altitude in Gomma ranges from 1387 to 2870 meters above sea level
(masl). Most parts of the Woreda lay between 1387 and 1643; and 1849 and 2067 masl.
However, few of the areas in the Woreda have altitudes ranging from 2229 to 2870 masl.
Nitosols is the most abundant covering about 90% of the Woreda. These soils are young soils
and are generally acidic soils. However, farmers grow crops that are acid tolerant. The pH of
the soils in Gomma ranges between 4.5 and 5.5. However, the commonly observed problem
related to aluminum and magnesium toxicity as a result of low pH is minimal. There are about
5 rivers in the Woreda. Even though available land and water resources offer high potential
for irrigation development in Gomma, the present utilization level is very poor (IPMS, 2007).

23
3.2. Types and Sources of Data
In order to address the objectives of the study, both primary and secondary data were used.
The primary data were collected using two types of interview schedule (one for farmers and
the other for traders). A checklist was also used to guide the informal discussion conducted to
generate data that cannot be collected from individual interviews. The primary data collected
from farmers focused on factors affecting avocado and mango market supply, size of output,
market information, credit access, access to market, number of avocado and mango trees
owned, extension service, and demographic characteristics of the household. Moreover, the
interview schedule for traders includes: types of traders (wholesalers, retailers, local
collectors, etc.), buying and selling strategies, source of market information, demographic
characteristics.
Secondary data are collected from different sources, such as: government institutions, the
District Agricultural Office, reports, bulletins and websites. Published and unpublished
documents were extensively reviewed to secure relevant secondary information.
3.3. Sampling Methods
Preliminary information about the study area was obtained from District Office of Agriculture
(DOA) to generate important information for questionnaire preparation for the formal survey
and to select sample PAs. An attempt was made to select representative samples in the
selection of sampled PAs, fruits (avocado and mango) producers and traders. The surveyed
PAs were Chedro Suse, Choche Lemi and Bulbulo fruit producing PAs.
3.3.1. Producers survey
Four stage sampling procedure is employed to select specific avocado and mango producer
households. First, by employing purposive sampling method Gomma Woreda is selected. In
the second stage, by using Simple Random Sampling technique three PAs are selected from
the available 21 avocado and mango producing PAs. Then by employing Probability
Proportional to Size (PPS) the number of farmers to be taken from each PAs is determined at
the third stage. Finally based on the sampling frame collected from each PAs, Systematic
24
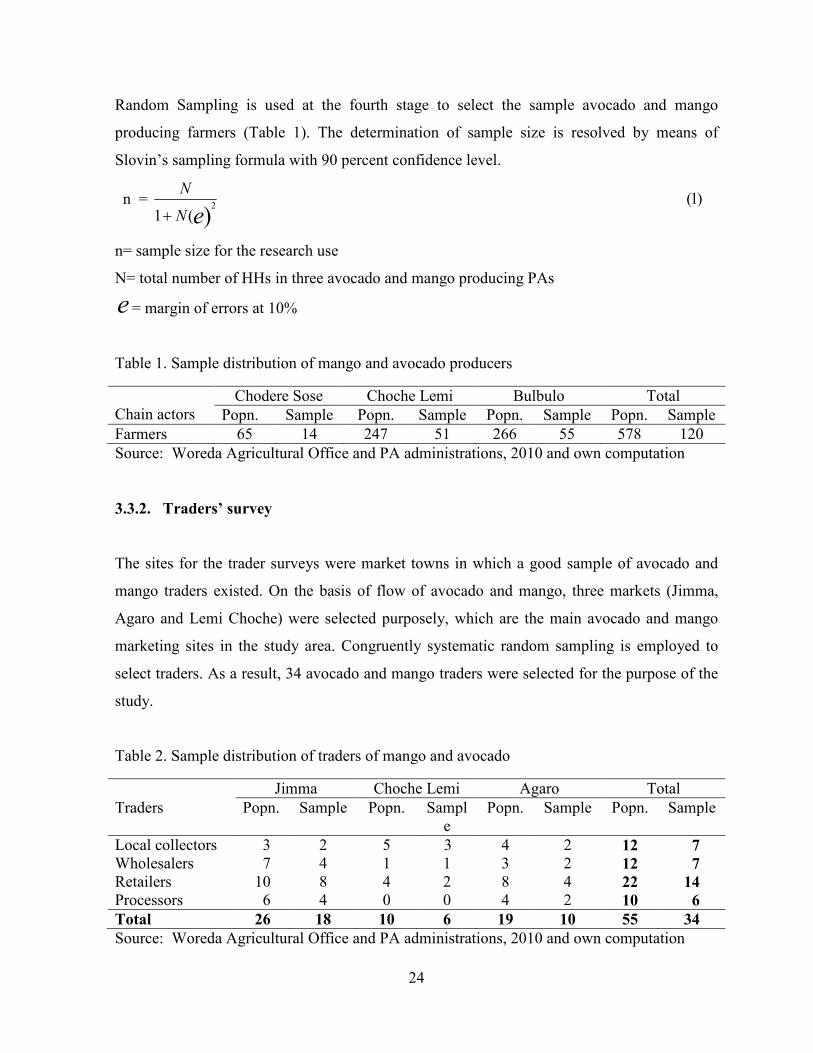
Random Sampling is used at the fourth stage to select the sample avocado and mango
producing farmers (Table 1). The determination of sample size is resolved by means of
Slovin’s sampling formula with 90 percent confidence level.
n = )1((1 )
2
eN
N
+
n= sample size for the research use
N= total number of HHs in three avocado and mango producing PAs
e = margin of errors at 10%
Table 1. Sample distribution of mango and avocado producers
Chain actors
Chodere Sose Choche Lemi Bulbulo Total Popn. Sample Popn. Sample Popn. Sample Popn. Sample
Farmers 65 14 247 51 266 55 578 120 Source: Woreda Agricultural Office and PA administrations, 2010 and own computation
3.3.2. Traders’ survey
The sites for the trader surveys were market towns in which a good sample of avocado and
mango traders existed. On the basis of flow of avocado and mango, three markets (Jimma,
Agaro and Lemi Choche) were selected purposely, which are the main avocado and mango
marketing sites in the study area. Congruently systematic random sampling is employed to
select traders. As a result, 34 avocado and mango traders were selected for the purpose of the
study.
Table 2. Sample distribution of traders of mango and avocado
Jimma Choche Lemi Agaro Total Traders Popn. Sample Popn. Sampl
e Popn. Sample Popn. Sample
Local collectors 3 2 5 3 4 2 12 7
Wholesalers 7 4 1 1 3 2 12 7
Retailers 10 8 4 2 8 4 22 14
Processors 6 4 0 0 4 2 10 6
Total 26 18 10 6 19 10 55 34
Source: Woreda Agricultural Office and PA administrations, 2010 and own computation

25
3.4. Methods of Data Collection
Enumerators who have college diploma and working as development agents were recruited
and trained for data collection. Before data collection, the questionnaire was pre-tested on five
farmers and three traders to evaluate the appropriateness of the design, clarity and
interpretation of the questions, relevance of the questions and time taken for an interview.
Hence, appropriate modifications and corrections were made on the questionnaire. Data are
collected under continuous supervision of the researcher.
The filled-in interview schedule was thoroughly checked for completeness and exactness.
Similarly, informal surveys are employed to study the marketing systems of avocado and
mango to obtain additional supporting information for the study.
Purposive sampling is employed to collect data from knowledgeable people (elders, youth,
and women farmers and responsible persons of different institutions) on the subject covering
three PAs in Gomma woreda and the regional market at Jimma town. The discussions are thus
held to access community level information through grounded theory which entailed
collection of relevant data until attainments of theoretical saturation (Haggablade and Gamser
1994; and Heisman, 1995). Thus, focus group discussions are held with three groups based on
pre-determined checklists (Annex 4) and a total of 20 key informants are interviewed from 6
different organizations and institutions (Annex 6). The time allotted for each discussion was 2
to 4 hours; but extended in some locations. Suitably, the data generated at various levels is
supported by field observations and triangulated with other data.
3.5. Method of Data Analysis
Two types of analysis, namely descriptive and econometric analysis are used for analyzing the
data collected from farmers and traders in the study area.
26
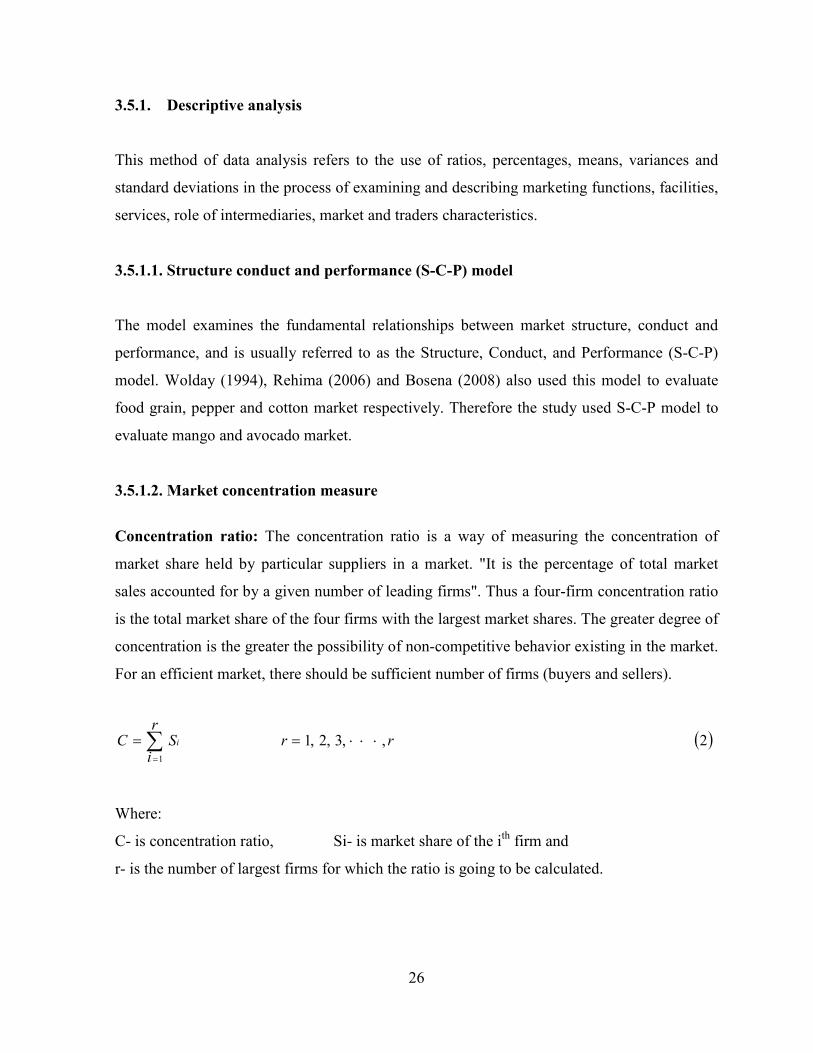
3.5.1. Descriptive analysis
This method of data analysis refers to the use of ratios, percentages, means, variances and
standard deviations in the process of examining and describing marketing functions, facilities,
services, role of intermediaries, market and traders characteristics.
3.5.1.1. Structure conduct and performance (S-C-P) model
The model examines the fundamental relationships between market structure, conduct and
performance, and is usually referred to as the Structure, Conduct, and Performance (S-C-P)
model. Wolday (1994), Rehima (2006) and Bosena (2008) also used this model to evaluate
food grain, pepper and cotton market respectively. Therefore the study used S-C-P model to
evaluate mango and avocado market.
3.5.1.2. Market concentration measure
Concentration ratio: The concentration ratio is a way of measuring the concentration of
market share held by particular suppliers in a market. "It is the percentage of total market
sales accounted for by a given number of leading firms". Thus a four-firm concentration ratio
is the total market share of the four firms with the largest market shares. The greater degree of
concentration is the greater the possibility of non-competitive behavior existing in the market.
For an efficient market, there should be sufficient number of firms (buyers and sellers).
( )2,,3,2,11
rrr
iSC i ⋅⋅⋅== ∑
=
Where:
C- is concentration ratio, Si- is market share of the ith firm and
r- is the number of largest firms for which the ratio is going to be calculated.

27
Kohls and Uhl (1985) bring into play as a rule of thumb, the four largest enterprises’
concentration ratio of 50% or more (an indication of a strongly oligopolistic industry), 33-50
% (a weak oligopoly) and less than that (competitive industry). The problem associated with
this index is the arbitrary selection of r (number of firms that are taken to compare the ratio).
3.5.1.3. Barriers to entry
The ease with which potential participants can enter various functions is commonly used as a
means of assessing the degree of competition in an industry (Scarborough and Kydd, 1992).
Stigler (2005) suggests about four points that can create barriers to entry: legal barriers
(license and patents), economies of scale, superior resources, and pace of entry. The modes of
entry into trade, means of building capital, means of acquiring marketing skills and contacts,
periods of apprenticeship, trader’s perceptions of barriers, the origins and levels of initial
capital required for traders of different sizes (functions, or commodities), and the degree of
mobility between functions and commodities can be used as centre of data to see the barriers
to entry (Timmer et al., 1983).
In fact, interviewing traders about barriers to entry might be difficult since all have entered
the market. Rather, observation of the age, gender, and ethnic distributions of owners, an
employees of different sizes of enterprises and the extent to which fluctuations in the number
of active traders follow rises and falls in profitability can be considered. Market structure is
most commonly evaluated by examining trends in the numbers and sizes of firms relative to
each other, and to number of consumers and producer, in particular times and places
(Scarborough and Kydd, 1992).
3.5.1.4. Marketing margin
Cost and price information is used to construct marketing cost and margin. Computing the
total gross marketing margin (TGMM) is always related to the final price paid by the end
buyer and is expressed as percentage (Mendoza, 1995).

28
TGMM = ( )3100×−
pricebuyerEnd
pricesellerFirstpricebuyerEnd
Where, TGMM is total gross marketing margin. It is useful to introduce the idea of producers’
gross margin (GMMp) which is the portion of the price paid by the consumer that goes to the
producer. The producers’ margin is calculated as:
)4(100arg
×−
=pricebuyerEnd
inmgrossMarketingpricebuyerEndGMMp
Where, GMMp = the producer's share in consumer price.
The net marketing margin (NMM) is the percentage of the final price earned by the
intermediaries as their net income after their marketing costs are deducted.
The percentages of net income that can be classified as pure profit (i.e. return on capital),
depends on the extension to such factors as the intermediaries’ own (working capital) costs.
The equation tells us that a higher marketing margin diminishes the producer’s share and vice
versa. It also provides an indication of welfare distribution among production and marketing
agents.
NMM = )5(100cosarg
×−
pricebuyerEnd
tsMarketinginmGross
Where- NMM is the net marketing margin
Higher NMM or profit of the marketing intermediaries reflects reduced downward and unfair
income distribution, which depresses market participation of smallholders.
3.5.2. Econometric analysis
This method of data analysis refers to the use of different economic and statistical tools or
models for testing hypothesis related to the objective of the study.

29
3.5.2.1. Econometric model specification
Following Green (2003), the multiple linear regression models is specified as Yi=F(X1, X2, X3,
X4, X5, X6, X7, X8, X9, X10, X11)
Where Yi= quantity of avocado and mango supplied to market
X1= Sex of HHH
X2= Age of HHH
X3= Education level of HHH
X4= Family size
X5= Market access
X6= Experience of the HHH
X7= Price of avocado and mango in 2008/09
X8= Extension access
X9= Information access
X10= Credit access
X11= Size of output
Econometric model specification of supply function in matrix notation is the following.
)6(UY +Χ= β
Where: Yi = fruit supplied to the market
β = a vector of estimated coefficient of the explanatory variables
X = a vector of explanatory variables
Ui = disturbance term
3.5.2.2. Specification of errors
Before fitting important variables into the regression models for analysis, it was necessary to
test multicollinearity problem among continuous variables and check associations among
discrete variables, which seriously affects the parameter estimates. According to Gujarati

30
(2003), multicollinearity refers to a situation where it becomes difficult to identify the
separate effect of independent variables on the dependent variable because of existing strong
relationship among them. The two measures that are often suggested to test the existence of
multicollinearity are Variance Inflation Factor (VIF) and Contingency Coefficients (CC).
Thus, Variance Inflation Factor (VIF) is used to check multicollinearity among continuous
variables. As a rule of thumb, if the VIF is greater than 10 (this will happen if R2 is greater
than 0.90), the variable is said to be highly collinear (Gujarati, 2003). A measure of
multicollinearity associated with the variance inflation factors is computed as:
VIF (Xi) = (1-Ri2)-1
Where, Ri2 is the multiple correlation coefficients between explanatory variables, the larger
the value of Ri2 is, the higher the value of VIF (Xi) causing higher collinearity in the variable
(Xi).
Contingency coefficient is used to check multicollinearity or association between discrete
variables. The value ranges between 0 and 1, with 0 indicating no association between the
variables and value close to 1 indicating a high degree of association between variables.
A popular measure of multicollinearity associated with the CC is defined as:
)7(2
2
χ+=
NCC x
Where, CC is contingency coefficient, χ2 is chi-square test and N is total sample size. If the
value of CC is greater than 0.75, the variables are said to be collinear.
Conversely, test for heteroscedasticity had undertaken for this study. There are a number of
test statistics for the detecting heteroscedasticity; According to Guiarati (2003) there is no
ground to say that one test statistics of hetroscedasticity is better than the others. Therefore,
due to its simplicity, Kroenker-Bessett (KB) test of heteroscedasticity was used for this study.
Similar to other test statistics of heteroscedasticity, KB test is based on the squared residuals
2
iu∧
However, instead of being regressed on one or more regressors, the squared residuals are
regressed on the squared estimated values of the regressand. Particularly, if the original model

31
Υ i= )8(
22110 uXXX ikikii++⋅⋅⋅+++ ββββ
u i is obtained from this mode and then
2u∧
is estimated as 2
iu∧
= αα 10+
2
iΥ∧
+u i
Where iΥ
∧
are the estimated values from the original model. The null hypothesis is α 1=
zero.
If this is not rejected, then, one can conclude that there is no heteroscedasticity. The null
hypothesis can be tested by the usual t-test or F-test.
3.5.3. Hypothesis and definitions of variables
In order to identify factors influencing avocado and mango marketable supply both
continuous and discrete variables were hypothesized based on economic theories and the
findings of different empirical studies. Accordingly, in order to investigate the determinants
of market supply, the following variables were constructed.
Dependent variable
Quantity supplied (2009/10): It is a continuous variable that represents the marketable
supply of avocado and mango by individual households to the market, which is measured in
quintals.
Independent variables: The explanatory variables expected to influence the dependent
variable are the following.
Quantity of avocado and mango produced: It is a continuous variable measured in quintals.
The variable is expected to have positive contribution to the amount of avocado and mango
supplied to the market. Farmers who produce more output per tree are expected to supply
more fruit (avocado and mango) to the market than those who produce less. Abay (2007) and
Adugna (2009) found that the amount of tomato and papaya produced by farming households
has augmented marketable supply of the commodities significantly.

32
Access to market: It is a continuous variable measured in walking time (minute) which
farmers spend time to sell their product to the market. If the farmer is located in a village or
distant from the market, he is poorly accessible to the market. The closer to the market the
lesser would be the transportation cost and time spent. Therefore, it is hypothesized that this
variable is negatively related to market participation and marketable surplus. A similar study
was conducted by Holloway et al (1999) milk-market development in the Ethiopian
highlands. His result indicates that distance-to market causes market surplus to decline.
Similar issue was studied by Wolday (1994) on food grain market in the case study of Alaba
Siraro, he identified that poor market access has significant and negative effect on quantity of
food grain supplied.
Price of avocado and mango: This is a continuous variable that measured annual average
price of avocado and mango in the reference market in 2008/09 i.e. the one year lagged price
of avocado and mango. When avocado and mango price is high in the market in the previous
year, farmers are motivated to take their produced to the market. Therefore this makes the
supply to be directly related to the previous year market price. The study by Goetz (1992) on
household marketing behavior in Sub-Saharan Africa found a significant positive relationship
between grain price and the probability of quantities sold.
Age of the household head: Age of the household, a continuous variable, was taken as one of
the explanatory variables. The expected sign was positive as age is one of the parameters of
human capital. As an individual stays long, he will have better knowledge and will decide to
allocate more size of land, produce more and supply more.
Sex of the household head: This is dummy variable that takes a value of one if the household
head is male and zero otherwise. Both men and women participate in fruit production. Male
households have been observed to have a better tendency than female household in fruit
production and supply of fruit due to obstacles such as lack of capital, and access to credit and
extension services. Tshiunza et al., (2001) discussed the determinants of market production of

33
cooking banana in Nigeria. In their study, male farmers tended to produce more cooking
banana than females.
Family size: It is a continuous variable, measured in man equivalent i.e. the availability of
active labour force in the household, which affects farmer's decisions to participate in market.
Since production is the function of labour, availability of labour is assumed to have positive
relation with volume of supply. However, family size is expected to have positive impact on
market volume of sales, but larger family size requires larger amounts for consumption,
reducing marketable surplus. A study by Singh and Rai (1998) found marketed surplus of
buffalo milk to be negatively affected by family size. However, a study conducted by Wolday
(1994) showed that household size had significant positive effect on quantity of teff marketed
and negative effect on quantity of maize marketed. In this context family size is expected to
have positive or negative impact on market participation and volume of sale.
Experience of the HH: This is a continuous variable measured in number of years. A
household with better experience in avocado and mango farming is expected to produce more
amounts of avocado and mango than the one with only less experience and, as a result, he is
expected to supply more amounts of avocado and mango to market. Therefore, experience in
avocado and mango production is expected to have positive relation with farm level
marketable supply of avocado and mango. Abay (2007) discussed that as farmer’s experience
increases the tomato supplied to market will increase in Fogera, South Gonder.
Access to market information: This is a dummy variable taking value of 1 if the producer
had access to market information and zero otherwise. It has been hypothesized that it affects
the marketable avocado and mango supply of the household positively. The better information
farmers have the more likely they supply fruit to the market. The general idea is that
maintaining a competitive advantage requires a sound business plan. Again, business
decisions are based on dynamic information such as consumer needs and market trends. This
requires due attention to new market opportunities, changing needs of the consumer and how
market trends influence buying (CIAT, 2004).

34
Access to extension: The objective of the extension service is introducing farmers to
improved agricultural inputs and to better methods of production. In this regard, extension is
assumed to have positive contribution to farm level marketable supply of avocado and mango.
It is a dummy variable with value of one if a household head has access to extension and zero
otherwise.
Education of household head: It is a dummy variable and refers to the formal schooling of a
respondent during the survey period. Those household heads who had formal education
determines the readiness to accept new ideas and innovations, and easy to get supply, demand
and price information and this enhances farmers’ willingness to produce more and increase
volume of sales. Therefore, formal education was hypothesized to positively influence market
participation and marketable surplus. Astewel (2010) who found that if paddy producer gets
educated, the amount of paddy supplied to the market increases, which suggests that
education improves level of sales that affects the marketable surplus.
Access to credit: This is a dummy variable, which assumes a value of one if the farmer has
credit access and zero otherwise. Access to credit would enhance the financial capacity of the
farmer to purchase the necessary inputs and increases output. Therefore, it is hypothesized
that access to credit would have positive influence on volume of sales.

35
4. RESULTS AND DISCUSSION
4.1. Socio-Demographic Characteristics of Farming Households
This section presents the profile of the sample respondents with regard to their age, sex,
family size and education level. There were only six female headed households from the 120
sampled producers. This is well acknowledged by Bezabih and Hadra (2007) who reported
less opportunity to females in Eastern parts of Ethiopia where only two female households
have participated from the total of 141 respondents.
4.1.1. Age of the households
The survey on this major demographic factor, measured in years, provided a clue on working
ages of households. The average age of the sample households was 44.53 years (Table 3),
with a range of 71 years where largest proportions of the household head lie within a
productive age i.e. (amid of 15 and 64 years). The survey result further indicated 20.8 percent
of the producers are youth viz. amid of 18 and 30 years of age whereas 49.2 percent of them
are adolescent (amid of 30 and 50 years). The overall result has thus indicated household
heads are prone to use resources with expected positive effect on market participation and
marketable surplus.
Table 3. Socio-demographic characteristics of framing households (in average and %)
Indicator Chodere Sose (N=18)
Bulbulo (N=52)
Choche Lemi (N=50)
Total (N=120)
Mean STD Mean STD Mean STD Mean STD Age of HHH 40.11 13.33 45.56 12.90 45.06 14.36 44.53 13.61 Family size 5.61 2.50 5.21 2.5 5.90 2.30 5.56 2.24 Experience (avocado) 11.72 3.86 7.40 4.98 6.78 4.99 7.79 5.08 Experience (Mango) 27.05 28.47 30.02 32.58 12.54 4.72 22.29 25.48
Education of HHH • Illiterate 10 19 20 18 • Read and write 17 15 10 14 • Primary education 35.4 33.9 25.3 32 • Secondary education 36.2 32.5 30.9 33 • Certificate & above 3 - - 3 Source: Survey result, 2011

36
4.1.2. Family size
A family size ranging between two and 13 is witnessed in the farming households; the
available data indicates that average family size in each household is 5.56. Bigger family size
has supported to boost volume of supply in the study areas to impact for better participation in
markets (Table 2). Thus existence of larger family size has positively affected the supply of
marketable surplus mainly due to lower dependency ratio reported in (Table 3).
The cluster analysis of sex by occupation have depicted 83 percent of the farming household
rely on family labor for planting, fertilizing and harvesting of the product. As to the report, the
labor for sorting is largely allotted to female while children are involved on fruit harvesting to
protect breakage of fragile avocado and mango branches. The assessment in labor
employment depicted that larger proportion of the household rely on family labor (especially
child labor) for harvesting (Fig. 3).
This is well supported by Wolday (1994) who indicated household size have had significant
positive effect on quantity of marketed teff. Similarly Bezabih and Hadera (2007) have also
witnessed that different sources of labor are employed in horticultural production of eastern
Ethiopia where family labor takes the lion share for labor allotments.
4.1.3. Experience
The respondents have an average of 7.79 and 22.29 years of experience in avocado and
mango production, respectively (ranging from 1 to 19 years for avocado and 2 to 40 years for
mango) (Table 3).
This reality implied that farming experience of more than seven years is witnessed by 85
percent of the respondents in the study area. This is similar to the minimum time required to
bear at least a fly crop of avocado and mango though research results from Jimma
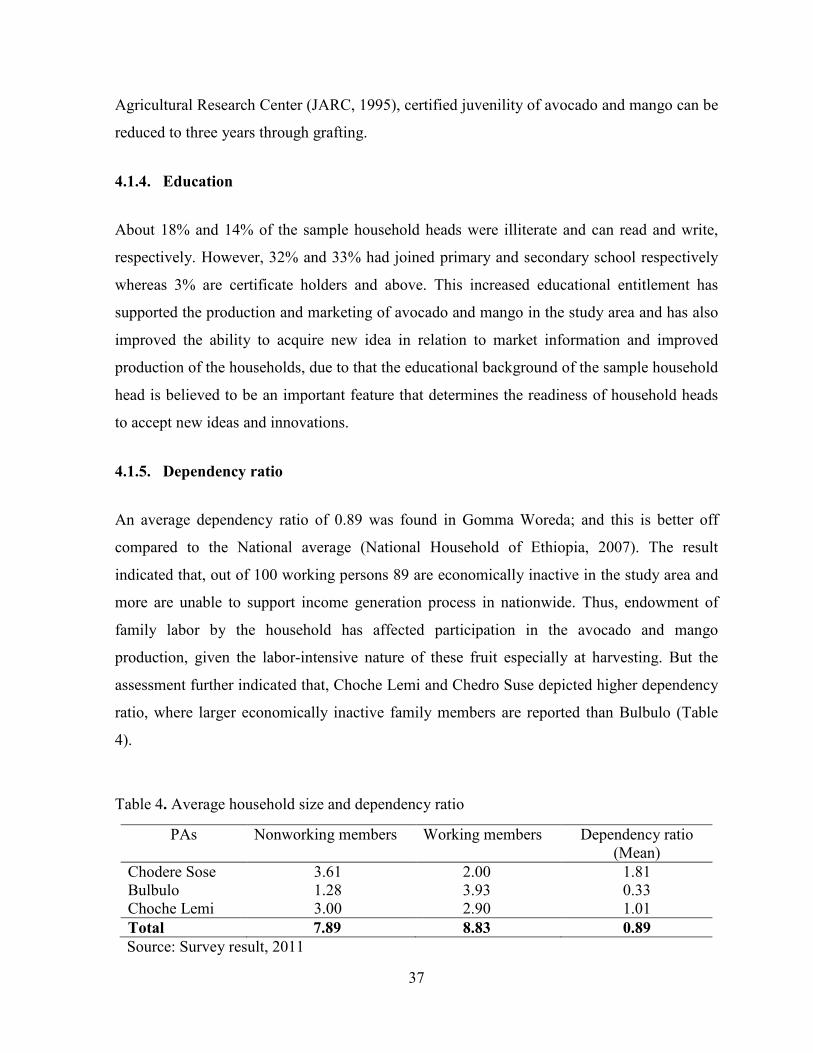
37
Agricultural Research Center (JARC, 1995), certified juvenility of avocado and mango can be
reduced to three years through grafting.
4.1.4. Education
About 18% and 14% of the sample household heads were illiterate and can read and write,
respectively. However, 32% and 33% had joined primary and secondary school respectively
whereas 3% are certificate holders and above. This increased educational entitlement has
supported the production and marketing of avocado and mango in the study area and has also
improved the ability to acquire new idea in relation to market information and improved
production of the households, due to that the educational background of the sample household
head is believed to be an important feature that determines the readiness of household heads
to accept new ideas and innovations.
4.1.5. Dependency ratio
An average dependency ratio of 0.89 was found in Gomma Woreda; and this is better off
compared to the National average (National Household of Ethiopia, 2007). The result
indicated that, out of 100 working persons 89 are economically inactive in the study area and
more are unable to support income generation process in nationwide. Thus, endowment of
family labor by the household has affected participation in the avocado and mango
production, given the labor-intensive nature of these fruit especially at harvesting. But the
assessment further indicated that, Choche Lemi and Chedro Suse depicted higher dependency
ratio, where larger economically inactive family members are reported than Bulbulo (Table
4).
Table 4. Average household size and dependency ratio
PAs Nonworking members Working members Dependency ratio (Mean)
Chodere Sose 3.61 2.00 1.81 Bulbulo 1.28 3.93 0.33 Choche Lemi 3.00 2.90 1.01 Total 7.89 8.83 0.89
Source: Survey result, 2011
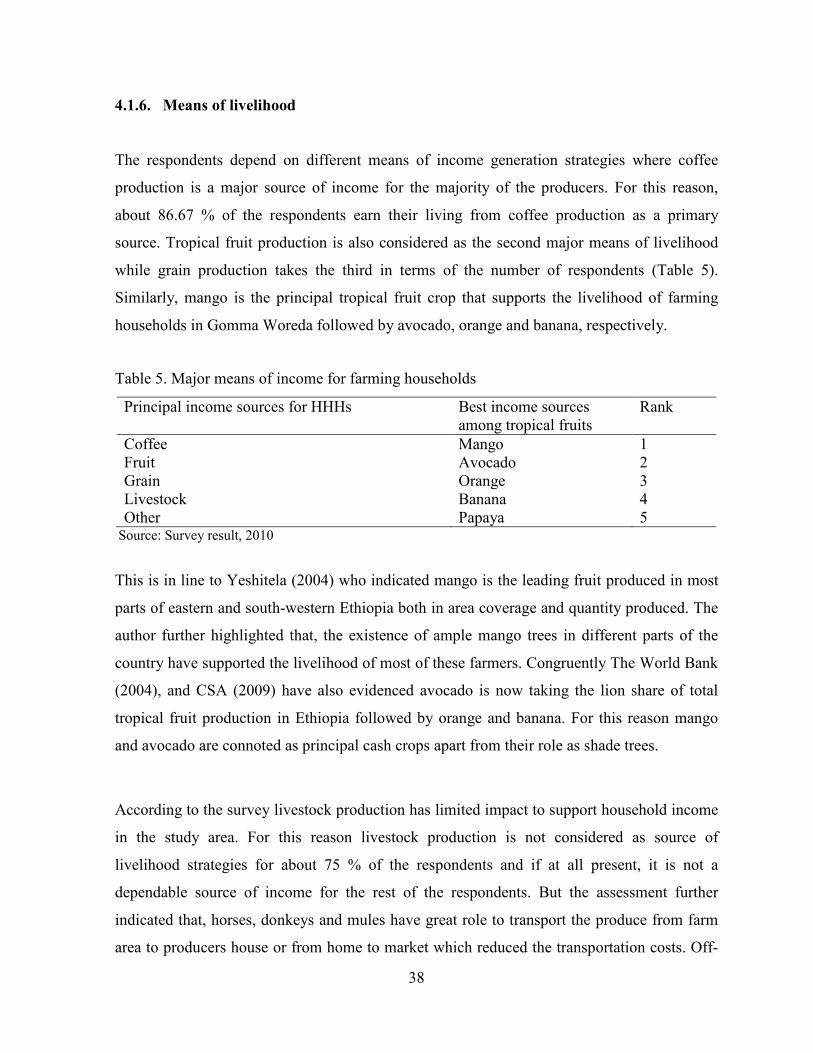
38
4.1.6. Means of livelihood
The respondents depend on different means of income generation strategies where coffee
production is a major source of income for the majority of the producers. For this reason,
about 86.67 % of the respondents earn their living from coffee production as a primary
source. Tropical fruit production is also considered as the second major means of livelihood
while grain production takes the third in terms of the number of respondents (Table 5).
Similarly, mango is the principal tropical fruit crop that supports the livelihood of farming
households in Gomma Woreda followed by avocado, orange and banana, respectively.
Table 5. Major means of income for farming households
Principal income sources for HHHs Best income sources among tropical fruits
Rank
Coffee Mango 1 Fruit Avocado 2 Grain Orange 3 Livestock Banana 4 Other Papaya 5
Source: Survey result, 2010
This is in line to Yeshitela (2004) who indicated mango is the leading fruit produced in most
parts of eastern and south-western Ethiopia both in area coverage and quantity produced. The
author further highlighted that, the existence of ample mango trees in different parts of the
country have supported the livelihood of most of these farmers. Congruently The World Bank
(2004), and CSA (2009) have also evidenced avocado is now taking the lion share of total
tropical fruit production in Ethiopia followed by orange and banana. For this reason mango
and avocado are connoted as principal cash crops apart from their role as shade trees.
According to the survey livestock production has limited impact to support household income
in the study area. For this reason livestock production is not considered as source of
livelihood strategies for about 75 % of the respondents and if at all present, it is not a
dependable source of income for the rest of the respondents. But the assessment further
indicated that, horses, donkeys and mules have great role to transport the produce from farm
area to producers house or from home to market which reduced the transportation costs. Off-
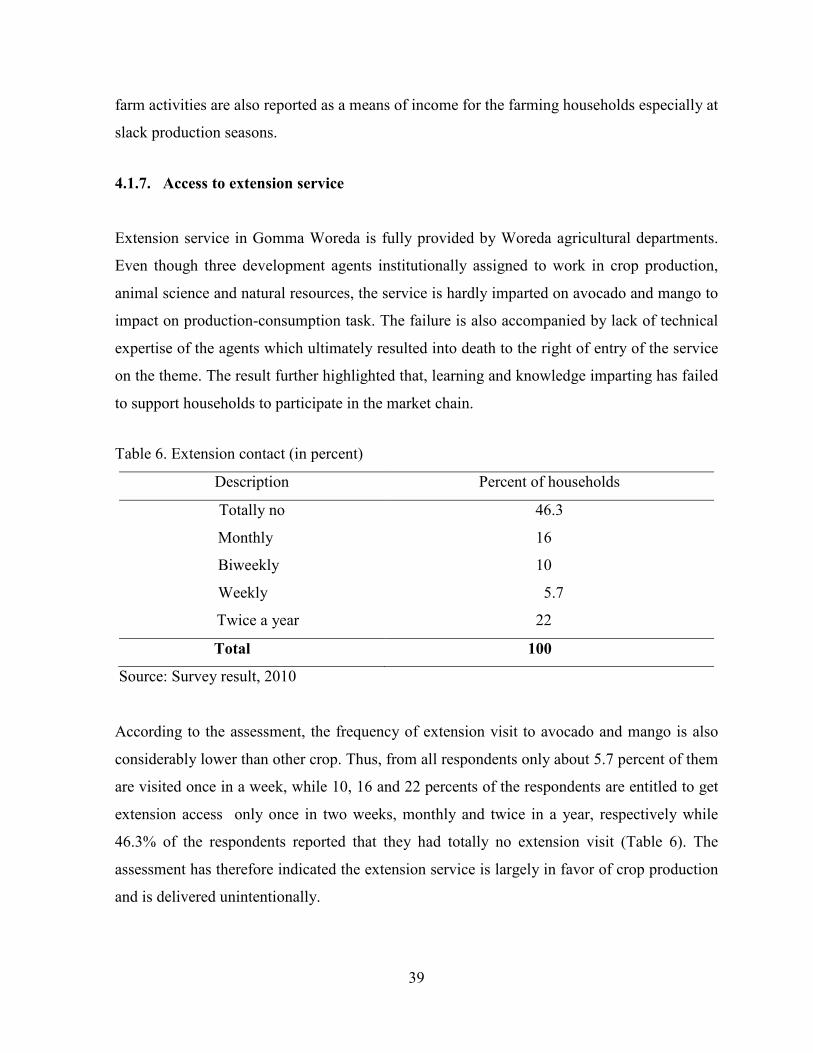
39
farm activities are also reported as a means of income for the farming households especially at
slack production seasons.
4.1.7. Access to extension service
Extension service in Gomma Woreda is fully provided by Woreda agricultural departments.
Even though three development agents institutionally assigned to work in crop production,
animal science and natural resources, the service is hardly imparted on avocado and mango to
impact on production-consumption task. The failure is also accompanied by lack of technical
expertise of the agents which ultimately resulted into death to the right of entry of the service
on the theme. The result further highlighted that, learning and knowledge imparting has failed
to support households to participate in the market chain.
Table 6. Extension contact (in percent)
Description Percent of households
Totally no 46.3
Monthly 16
Biweekly 10
Weekly 5.7
Twice a year 22
Total 100
Source: Survey result, 2010
According to the assessment, the frequency of extension visit to avocado and mango is also
considerably lower than other crop. Thus, from all respondents only about 5.7 percent of them
are visited once in a week, while 10, 16 and 22 percents of the respondents are entitled to get
extension access only once in two weeks, monthly and twice in a year, respectively while
46.3% of the respondents reported that they had totally no extension visit (Table 6). The
assessment has therefore indicated the extension service is largely in favor of crop production
and is delivered unintentionally.

40
This is in line with Carlson et al. (2005) and Sonko et al. (2005) who explained the current
extension approach was in favor of cereals but not fruits. Thus, it has negatively affected the
fruit production-marketing task. Belay (2003) also indicated agricultural extension service has
failed to bring major impact on productivity of fruits due to weak link between stakes and
associate workloads of extension agents. Davis (2007) has also stated that dearth of extension
service has led to poor linkage to support avocado industry.
4.1.8. Access to and use of credit availability
Credit is important to facilitate the introduction of innovative technologies and for input and
output marketing arrangements. Even if one micro-finance and four governmental and private
banks are available in the study area no credit is reported by the respondents from formal
banks; lack of definite credit service is reputed in the study area. Thus the lack for the
delivery has deterred the financial capacity of producers to purchase the necessary input for
the crops. For this reason informal credit system has come up as prevailing feature where
producers borrow money from wholesalers during slack seasons. And this condition affected
farm gate prices since farmers are forced to sell their produce at lower prices for their
borrowers which ultimately triggered to lower returns.
4.1.9. Access to roads
Availability and adequacy of road is important prerequisite to link producers with markets in
reduced transaction costs. The assessments on this continuum, measured in single feet-hour,
revealed 81 and 90 percent of respondents are reasonably nearer to the service where most
households can access the entry within half an hour of normal walk Table 7. Paradoxically
most of the farmers, have failed to use these accesses.
This is in line with the World Bank (2004) reported that better road density in the study area
i.e. 117 km per 1000 square km which is by far better than the national road infrastructure i.e.
30 km per 1000 square km. with significant difference between the three locations at 1
percent level of significance.

41
4.1.10. Access to markets
This is a distance measured in kilometers to reach the nearest market. The study revealed the
infrastructure in Gomma woreda is generally satisfactory and it is comparatively close to
nearby fruit markets (Table 7); which in turn has assisted farmers to lessen their transport cost
and augment their market surplus and margins. The access has further assisted to increase
avocado production by the farming households.
In paradox to abovementioned reality, some farmers explained the road infrastructure is
conducive to sell large proportion of avocado at farm gate (41 percent) followed by selling at
nearby Agaro market (34 percent). The overall research result highlighted closer markets have
prompted farmers to plant high value crops such as avocado and mango since they are not
much forced to transport their produce to distant markets where they sell at loss. The prospect
has thus assisted to minimize the transport cost and augment their market surplus
considerably.
Table 7. Access to services
Indicator
Chodere Sose (N=18)
Bulbulo (N=52)
Choche Lemi (N=50)
Total (N=120)
Mean STD Mean STD Mean STD Mean STD Distance to market (Km) 3.69 1.70 4.88 1.91 5.40 2.40 4.70 2.53 Dist. to development center (Km) 3.04 2.25 2.66 1.82 2.90 1.71 2.81 1.83 Dist. to all weather road (Km) 1.27 0.76 0.82 0.58 1.52 0.76 1.18 0.65 Source: Survey result, 2010
4.1.11. Market information
Closer look at access to market information depicted; as there is no system in place that
systematically collect, analyze and disseminate information relevant to the needs of different
actors. The triangulation through Focus Group Discussions has also certified the desperate
absence of the scheme which is in line to farmers’ complaints to the services. The assessment
depicted colleague farmers are the first source of information followed by producers while
traders, government extension workers and NGOs are second, third and fourth information

42
sources in Gomma woreda, respectively. But the overall assessment signified farmers get
limited market information than traders with their own efforts. Owing to inequitable access to
information, large proportion of market power is captured by traders who have diversified
information source including: neighbors, fruit traders, personal observation and better access
to mobile technology which favored traders to adverse risks of loss to this product.
4.2. Socio-Demographic Characteristics of Traders
4.2.1. Age of the household
The analysis on this demographic characteristics highlighted that, about 53 percent of traders
are youngster amid of 18-30 years of age and all the rest are adolescent with age group of 31-
50 years old. Congruently, with an average age of 30.15 years (Table 8) the maximum and
minimum age of HHH is reported as 17 and 55 years of age.
4.2.2. Experience
Traders had 5.41 years of experience on average Table 8. The research result indicated that,
experience has not much to do on trading as that of farming. According to the result, almost
all traders are categorized in productive age group and with this mere reality; the majority of
traders in the sampled markets had a mean 1-5 years of experience. This may explain that,
there is no barrier to entry in mango and avocado trade with respect to years of experience
(Table 10).
Table 8. Demographic characteristics of traders
Indicator
Agaro (N=12 ) Choche Lemi
(N=6 ) Jimma
(N=16 ) Total
t-value Mean STD Mean STD Mean STD Mean STD
Age of traders 28.83 7.15 24.33 5.99 33.31 9.65 30.15 8.739 20.115*** Experience 5.25 3.03 4.00 2.83 6.06 3.43 5.41 3.93 6.490***
(Units are in years) *** Significant at 1percent Source: Survey result, 2010

43
However, the statistical test for homogeneity, which was run to compare means of continuous
variable among markets designated occurrence of high significant difference at 1 percent level
(P<0.01) for age and experience (Table 8).
4.2.3. Education
It is a crucial factor for skill development and enhancing marketing decisions. The assessment
in this perspective signified 93.07 percent of traders are entitled to formal education (Table
11). This increased educational entitlement has supported the ability to acquire new idea in
relation to market information and new technologies.
4.2.4. Endowments of traders
The research result highlighted traders are privileged to access and use of important services
than farmers in the study area. The access of keeping fruit in separate store (64 percent) has
supported longer shelf life and thereby reduced the time to rancidness. Similarly, 64 percent
of traders are honored to mobile access while 26.5 percent of them are endowed with landline
telephone towards enhanced information (Table 9).
Table 9. Economic realities of traders
Endowments Percent Separate Store 64.71 Mobile access to market information 64.71 Land line telephone 26.50 Weighing scale 64.70 Juicer 23.50 Shop/shed 50.00 Motorbike 5.90 Bicycle 8.80 Source: Survey result, 2010
Among all surveyed traders, 64.7 and 23.5 percent of them are endowed with weighing scale
and juicers respectively. Congruently, 50 % had shop (shade) while 5.9 and 8.8 percent of
traders have motorbike and bicycle, respectively. The accesses assisted traders to govern the
chain through buyer driven approaches where relationships with actors remained personal.

44
This is in line with Kaplinsky (2004) who indicated participation in market is influenced by
particular competitors who has the upper hand to access important for the chain functions.
Thus, the “glue” holding producers is not equal to other actors where traders excessive power
as chain governor in buyer driven markets.
According to the assessment, most traders (64.71 %) are experiencing additional trading
activities other than fruits. Due to this very reason, 58.82 percent of these actors are involved
in fruit trading merely in main supply season. Simultaneously 41 percent of the traders are
involved in fruit trading seven days a week; while 14 and 44 percent of them are involved up
to five and three days a week, respectively.
4.3. Characterization of Fruit Production in Gomma Woreda
4.3.1. Average trees owned by households
The assessment on average trees on the farming household depicted the existence of large
difference between total average number of avocado and bearing trees owned by individuals
i.e. 17.24 and 6.23 (Table 10) numbers of avocado trees, respectively. The existence of this
remarkable range indicated the potential of large number of Juvenile avocado trees which
Table 10. Mango and avocado trees owned by growers
Indicator Chodere Sose
(N=18) Bulbulo (N=52)
Choche Lemi (N=50)
Total (N=120)
Mean STD Mean STD Mean STD Mean STD Avocado
Bearing tree number 8.44 2.12 3.32 0.23 8.38 2.05 6.23 2.40 Non bearing tree 13.28 5.16 4.22 1.70 18.08 6.60 11.26 7.44 Number of died trees 1.06 0.92 0.54 0.48 0.62 0.53 0.67 0.60 Total trees 21.72 7.50 6.48 2.77 7.86 11.17 17.24 6.73 Production (q/tree) 3.61 1.82 2.78 1.05 2.86 1.33 2.99 1.37
Mango Bearing tree number 6.60 4.60 5.03 3.16 5.27 4.09 5.37 3.84 Non bearing tree 2.33 2.41 4.33 15.46 1.74 2.20 2.81 9.71 Number of died trees 1.00 2.57 0.23 0.87 0.30 2.02 0.37 1.77 Total trees 8.60 3.85 7.08 3.21 7.00 4.61 7.26 4.02 Production (q/tree) 1.50 0.77 1.39 0.86 1.26 0.93 1.39 0.85
Source: Survey result, 2010

45
even didn’t commence its contribution in economical terms these days but with bright future
for the coming moment. But this reality is contrasting to the case in mango where almost all
existing trees are exhaustively exploited and their ages are too old to bear quality mango
produce.
The assessment further indicated higher ranges of total avocado trees among the respondents
(range=68) which is big figure not yet reported in any avocado exporting countries in Africa.
This is in line to Wasilwa et al. (2004) who pronounced Kenyan farmers have experienced
less opportunity with minimum current ranges of avocado trees; 22 in numbers for avocado.
The result has thus figured out the opportunity of Ethiopian avocado farmers than any other
African country.
4.3.2. Production and productivity of avocado and mango
Average productivity of 466 quintal per hectare of avocado is reported in the study area which
is exclusively larger than the national average i.e. 66 quintal per hectare (CSA, 2008). This
productivity is well evidenced by Woyessa and Berhanu (2010) and Zekarias (2010) who
reported better average yield of 156-780 qt per hectare, which is parallel to the current
appraisal.
This is analogous to Gillard and Godfroy (1995) who reported parallel average yield in Kenya
(332 quintal per hectare) but worse in Coted’Ivore and Cameroon who failed to conquer
prospects due to decreasing productivity which is less than 180 quintal per hectare. Edossa
(1997) has reported this yield difference could come from variation in cultivar, age of trees
and weather conditions.
___________________________________________
1This is a yield computed by assuming 156 trees are planted in one hectare (with spacing of 8m X 8m) for avocado and mango.
46
The research result also indicates that average productivity of 217 quintal per hectare of
mango is reported which is larger than the national average i.e. 150 quintal per hectare
(FAOSTAT, 2010). The total number of trees per hectare is 156.
Inputs used for avocado and mango production
Agricultural inputs are important elements for production and productivity. As a result the
typical inputs utilized for production of the two crops were seed/seedling, labor, land, and
compost/manure.
Planting material
With entire absence of improved varieties, mango and avocado production in Gomma Woreda
is exclusively based on distribution of mixed materials; which are mainly procured from
unknown sources such as: juice houses available in Jimma and Agaro towns. But its dearth
has little impact on its productivity. For this reason 42 and 36.3 percent of respondents have
acquired planting materials of mango and avocado from other farmers and markets,
respectively Fig. 2. These sources are the principal planting material sources in the study
areas followed by agricultural offices and own endeavors to produce the materials. The
envisaged result discerned the local seed system has come out as best-bet arena for planting
material distribution.
Unavailability of planting materials and seedlings from known origin are the principal
jeopardize in the study area. This is in line with Elfring et al. (2007) who indicated producers
are complaining about unavailability of planting materials in terms of quantities and qualities.

Source: Survey result, 2010
Figure 1. Source of planting materials for mango and avocado
Labor
The cluster analysis of sex by occupation have depicted 83 percent of the farming household
rely on family labor for planting, fertilizing and harvesting of the product. As to the report, the
labor for sorting is largely allotted to female while ch
protect breakage of fragile avocado and mango branches. Thus
above functions are covered by the family as opportunity cost but the cost for subsequent
seasonal work such as: loading
labor employment depicted that larger proportion of the household rely on family labor
(especially child labor) for harvesting followed by hired labor (12 %)
0
5
10
15
20
25
30
35
40
45
AGRI. devt.
office
Market
21.7
36.3
7.4
47
Source of planting materials for mango and avocado
The cluster analysis of sex by occupation have depicted 83 percent of the farming household
rely on family labor for planting, fertilizing and harvesting of the product. As to the report, the
labor for sorting is largely allotted to female while children are involved on fruit harvesting to
protect breakage of fragile avocado and mango branches. Thus, the entire labor cost for the
above functions are covered by the family as opportunity cost but the cost for subsequent
seasonal work such as: loading and unloading is covered by the traders. The assessment in
labor employment depicted that larger proportion of the household rely on family labor
(especially child labor) for harvesting followed by hired labor (12 %) Fig. 3.
Market JARC Own Stock From other
farmers
IPMS
6.28
22.5
5.3
34.2
0.8
12.8
42
Avocado Mango
The cluster analysis of sex by occupation have depicted 83 percent of the farming household
rely on family labor for planting, fertilizing and harvesting of the product. As to the report, the
ildren are involved on fruit harvesting to
the entire labor cost for the
above functions are covered by the family as opportunity cost but the cost for subsequent
and unloading is covered by the traders. The assessment in
labor employment depicted that larger proportion of the household rely on family labor
IPMS
5.3
2.8
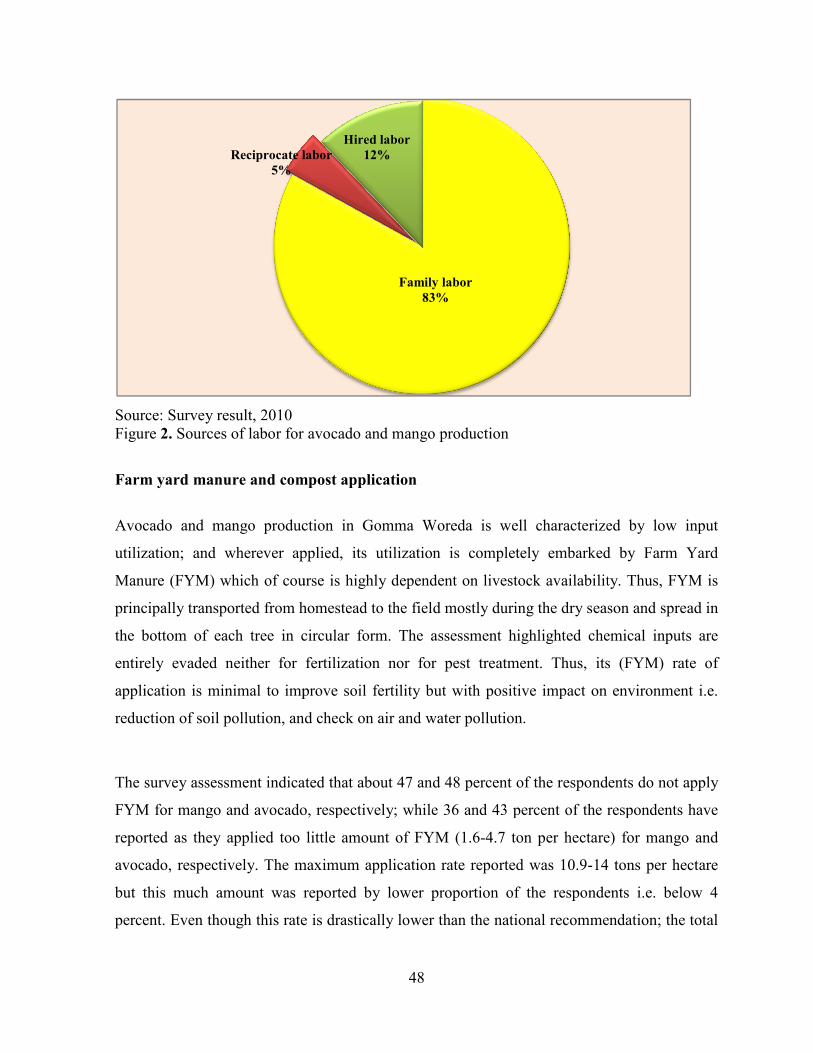
Source: Survey result, 2010 Figure 2. Sources of labor for
Farm yard manure and compost application
Avocado and mango production in
utilization; and wherever applied, its utilization is
Manure (FYM) which of course is highly dependent on livestock availability. Th
principally transported from homestead to the field mostly during the dry season and spread in
the bottom of each tree in circular form. The ass
entirely evaded neither for fertilization nor for pest treatment. Thus
application is minimal to improve
reduction of soil pollution, and
The survey assessment indicated
FYM for mango and avocado, respectively; while 36 and 43 percent of the respondents have
reported as they applied too little a
avocado, respectively. The maximum application rate reported was 10.9
but this much amount was reported by lower proportion of the respondents i.e. below 4
percent. Even though this rate is drastically lower than the national recommendation; the total
Reciprocate labor
5%
48
avocado and mango production
ompost application
Avocado and mango production in Gomma Woreda is well characterized by low input
applied, its utilization is completely embarked by Farm Yard
Manure (FYM) which of course is highly dependent on livestock availability. Th
principally transported from homestead to the field mostly during the dry season and spread in
the bottom of each tree in circular form. The assessment highlighted chemical inputs are
entirely evaded neither for fertilization nor for pest treatment. Thus, its
improve soil fertility but with positive impact on environment i.e.
reduction of soil pollution, and check on air and water pollution.
indicated that about 47 and 48 percent of the respondents do not apply
FYM for mango and avocado, respectively; while 36 and 43 percent of the respondents have
too little amount of FYM (1.6-4.7 ton per hectare
avocado, respectively. The maximum application rate reported was 10.9-14 tons
but this much amount was reported by lower proportion of the respondents i.e. below 4
ate is drastically lower than the national recommendation; the total
Family labor
83%
Reciprocate labor
Hired labor
12%
characterized by low input
embarked by Farm Yard
Manure (FYM) which of course is highly dependent on livestock availability. Thus, FYM is
principally transported from homestead to the field mostly during the dry season and spread in
essment highlighted chemical inputs are
its (FYM) rate of
impact on environment i.e.
that about 47 and 48 percent of the respondents do not apply
FYM for mango and avocado, respectively; while 36 and 43 percent of the respondents have
hectare) for mango and
14 tons per hectare
but this much amount was reported by lower proportion of the respondents i.e. below 4
ate is drastically lower than the national recommendation; the total

49
FYM applied in the study sites is still better to the virtually practiced elsewhere in Ethiopia
(Fig. 4).
Source: Survey result, 2010
Figure 3. FYM applied per tree per season for avocado and mango
This in line with Davis et al. (2007) who stated the current FYM application rate in Ethiopia
is negligible in that only 0.55 ton per hectare is applied; despite the national requirement
(29.84 ton per hectare).
Production system in practice (trend and inter-cropping)
According to the report 75 and 72.5 percent of the respondents were replied that, the trend of
avocado and mango production is apparently increasing across time, respectively (Table 5).
48.3
35.8
6.75 4.2
46.7
42.5
4.2 3.3 3.3
not applicable 1.6-4.7 4.7-7.8 7.8-10.9 10.9-14.0
FYM application rate in avocado and mango (ton per hectare)
mango avocado

50
This is reported by Woyessa and Berhanu (2010) who have indicated that the existence of
increasing trend of avocado production in the last several years.
However, the benefits earned from the production and marketing of both fruits is drastically
draining because of ever declining prices due to glut of production.
Source: Survey result, 2010
Figure 4. Production trend for the past five years
Congruently, 29.58 and 42.70 percents of respondents reported as they intercrop avocado and
mango with maize, taro, ginger, chat, cabbage and banana at early stage. This is line with
Gilliard and Godfroy (1995) who reported intercropping of avocado with short cycled crops;
which is very common in sub-Saharan Africa and most welcomed to utilize the empty space
during the first few years. The research result is also granted by Albertin and Nair (2004) who
reported similar parallel experiences in Coast Rica where avocado is well intercropped in
coffee production.
0.00
10.00
20.00
30.00
40.00
50.00
60.00
70.00
80.00
increasing decreasing stays the same
Pe
rce
ntil
e
avocado
Mango
75 72.5
13.3 10.8 11 16.67

51
Cropping calendar
The cropping calendar of avocado and mango is almost similar across the study areas where
majority of respondents (95%) have reported as they plant the seedlings from June to late July
and starts harvesting after 5-7 years after planting.
Attributable to its climacteric nature, avocado fruits do not ripe while it is attached to the tree.
Thus harvesting usually start after fruit dropping-which is principal maturity index in the
study areas. In consent to this line, 79.2 percent of the producers conduct harvesting
subsequently to the maturity index. This nature has assisted 20.8 percent of producers to let
hang the fruit on the tree before harvest unto best search for markets that can pay better
prices. The assessment further depicted harvesting in the study area is largely executed by
child labor by climbing on the tree. But use of picking hooks, shaking of trees and knocking
down fruits with wooden sticks are also exercised in the study areas; but at lower rate. The later
practices cause fruit droppings that may cause physical injury at any time.
The research result is in line with FAO (2005) which indicated cuts, punctures and bruises has
increased ethylene production and hastened fruit softening and ultimately caused mechanical
injuries and decay. Bower and Cutting (1998); Gilliard and Godfroy (1995) and Maru et al.
(in press) have also reported climacteric nature of avocado have allowed fruits to cling on the
tree up to 1.5 months.
Sorting and loading are principally carried out on farm gates and at primary procurement
centers through premises of primary procurers (Local collectors). Thus it is sorted according
to consignment needs of collectors where under-grades such as: Shrunken, smaller sizes, with
splits and punctures are reasonably expelled from transactions. But under-grads are
commonly consumed in farming household as best child foods and culinary uses.

52
4.4. Structure, Conduct and Performance of Fruits Marketing
4.4.1. Market participants, their roles and linkages
In this study, different avocado and mango market participants were identified in the
exchange functions between farmer and final consumer. Market participants in the study areas
include: producer, local collectors, wholesalers, retailers, processors and final consumers of
the product. Even though, each participant was involved in different activities (wholesale,
retail, assembly etc), based on major activity undertaken, the sampled market participants
were categorized into different categories.
About 53 and 50 percent of avocado and mango traders respectively have reported that,
retailing is principal functions in the chain. Similarly about 18 and 17 percent of the
respondents indicated that, as they are functioning in processing task (Fig.6).
Source: Survey result, 2010
Figure 5. Proportions of market actors of avocado and mango in the study area
Wholesaler Retailer Assemblers Processor
Avocado 13 53 11 18
Mango 10 50 11 17
0
10
20
30
40
50
60
Pe
rce
ntil
e
53
Producers: These are the primary or first link actors who cultivate and supply avocado and
mango to the market. The land for the abovementioned commodities was on its own plot to
produce the already mentioned crops. Since the products are very perishable in nature,
producers sell their produce right after harvest either at PA and/ or Woreda market.
The process of avocado and mango selling had similar selling procedures; where matured
fruits are collected once every week or on more intervals for almost four months. But, right
after collection, the products are taken either to road side, nearer PA market, Choche, Agaro
or Limu Shay; and it will be handed over to the local collectors, processors, retailers and a
limited amount is sold directly to consumers. Similarly, due to lack of adequate, reliable and
timely market information, farmers are forced to dispose their produce within limited period
at low selling price. Basket ‘Kirchat’ and containers made of plastics sacks ‘madaberia’ are
the customary packaging material for collection and product delivery of avocado and mango
in the study areas. Thus, due to limited production and supply of avocado and mango, storage
was not a problem at the moment, because what is produced now is marketed immediately
right after harvest. But it would be a critical problem in the near future when production and
productivity of avocado and mango is intensified and supplied to market within the study
area.
Local collectors: These are farmers or part time traders in assembly markets who collect
avocado and mango from farmers in village markets for the purpose of reselling it to
wholesalers, retailers and consumers in Agaro and Jimma market. They use their financial
resources and their local knowledge to bulk avocado and mango from the surrounding area.
They play important role and they do know areas of surplus well. They often receive cash
from wholesalers after or before sell.
Wholesalers: These are known for purchase of bulky products with better financial and
information capacity. They are major actors in the channel and they purchase avocado and
mango either directly from farmer or Local collectors. They procure and consign large
amount of avocado and mango to the regional market (Jimma) and to terminal markets (Addis

54
Ababa). They had two market outlets: they sell to terminal market and processors at regional
markets (Fig.7).
Retailers: Are known for their limited capacity of purchasing and handling products with low
financial and information capacity. Besides, these are the ultimate actors in the market chain
that purchase and deliver avocado and mango to consumers. But the assessment indicated, all
respondents in the study area were not licensed to sell avocado and mango.
Processors: Avocado and mango processing in the study area is apparently limited to juice
making where cafés, restaurants and juice houses takes the leads in cuisine preparation. Albeit
ample source of raw material for cosmetic industries; little is pursued on these fruits in the
study area. Thus there is only one agro-processing plant (Kaliti food complex) that underpin
on avocado, and it has already ceased its endeavor of blending avocado to produce pasta and
macaroni. But with recent nominations, the local Cosmetic Industry “Zenit Gebse Eshet”, has
launched producing of hair pomade by using avocado as raw material.
Consumers: From the consumers’ point of view, the shorter the marketing chain, the more
likely is the retail price going to be affordable. Consumers for this particular study mean those
households who bought and consume avocado and mango. They are individual households;
they bought the commodity for their own consumption only.
Marketing channels
According to Mendoza (1995), marketing channel is the sequence of intermediaries through
which whole avocado and mango passes from farmers to consumers. The analysis of
marketing channels is intended to provide a systematic knowledge of the flow of the goods
and services from their origin (producer) to the final destination (consumer).
The avocado and mango market channels, depicted in Figures 7 and 8, were constructed based
on the data collected in three markets. The result revealed that there are 6 and 8 major

55
marketing channels for avocado and mango respectively which obtained from traders’ survey.
Informal survey suggested that there are also possibilities that farmers sell their products
directly to consumers and retailers (channel I and VI). The estimated volume of production of
avocado was about 39668 quintals and the corresponding figure for mango was 45535
quintals in the year 2009/2010 from which about 38468 and 44235 quintals of avocado and
mango were sold respectively. Each followed their own channels, they are treated separately,
and the result obtained was the following.
4.4.1.1. Avocado market channel
Six marketing channel are identified for avocado of which two have went out of the region.
The channel comparison was made based on volume that passed through each channel.
Accordingly, the producer-Wholesaler-Terminal market channel carried the largest volume
i.e. 10772 qt of avocado which is 28 percent of the total volume followed by Producer-Local
collector-Wholesaler-Terminal market channel which carried a total volume of 7693 qt of
avocado and is about 20 percent of the total marketed (Fig 7).
I. Producer-Retailer-Consumer channel: This channel represented 15% of total avocado
(5770 qt) marketed during the survey period. The channel was found to be the fourth
important marketing channel in terms of volume.
II. Producer-Processor-Consumer channel: It accounted for 19% of total avocado (7309 qt)
marketed in the study area during the survey period. The channel was found to be the third
most important channel in terms of volume.
III. Producer-Wholesaler-Terminal market: Represented 28% of the total avocado (10771
qt) marketed during the survey period. It is the first most important channel in the study area
in terms of volume.
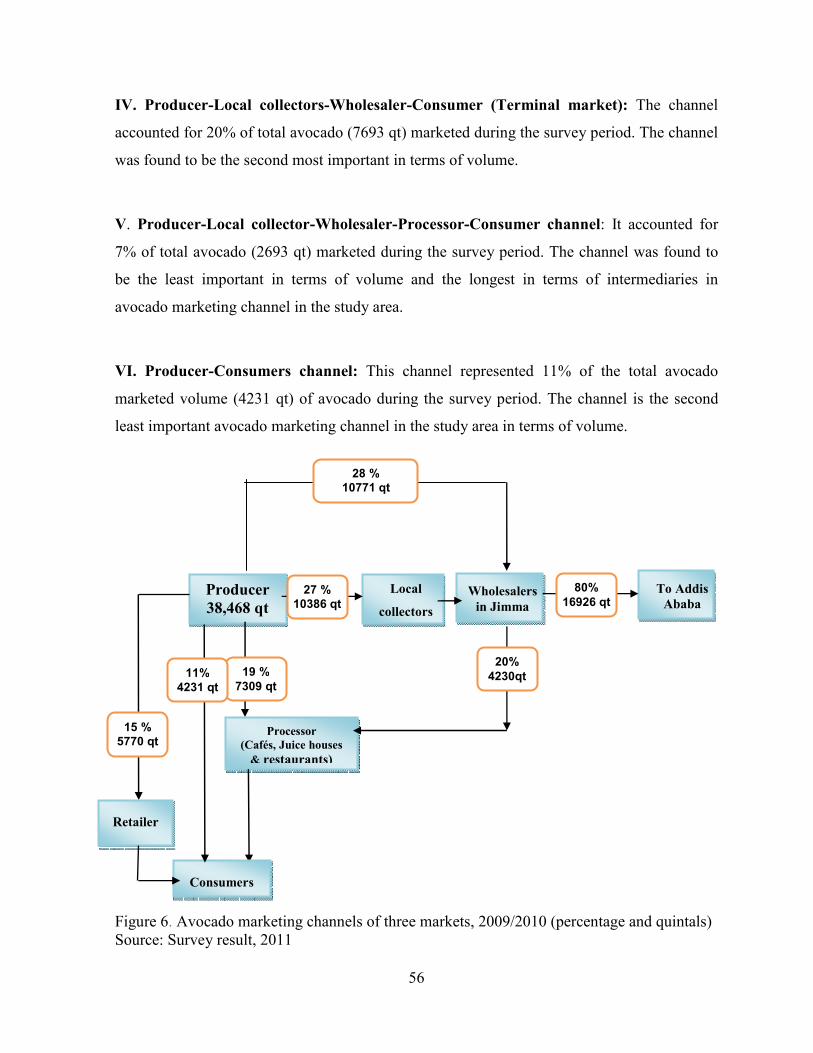
56
IV. Producer-Local collectors-Wholesaler-Consumer (Terminal market): The channel
accounted for 20% of total avocado (7693 qt) marketed during the survey period. The channel
was found to be the second most important in terms of volume.
V. Producer-Local collector-Wholesaler-Processor-Consumer channel: It accounted for
7% of total avocado (2693 qt) marketed during the survey period. The channel was found to
be the least important in terms of volume and the longest in terms of intermediaries in
avocado marketing channel in the study area.
VI. Producer-Consumers channel: This channel represented 11% of the total avocado
marketed volume (4231 qt) of avocado during the survey period. The channel is the second
least important avocado marketing channel in the study area in terms of volume.
Figure 6. Avocado marketing channels of three markets, 2009/2010 (percentage and quintals) Source: Survey result, 2011
To Addis
Ababa Wholesalers
in Jimma
Local
collectors
Producer
38,468 qt
3843
Processor
(Cafés, Juice houses
& restaurants)
Retailer
Consumers
28 %
10771 qt
80%
16926 qt
27 %
10386 qt
15 %
5770 qt
19 %
7309 qt
20%
4230qt
11%
4231 qt

57
4.4.1.2.Mango market channel
Eight marketing channels are exhibited in the study areas where all channels remained in the
region. According to the report, Producer-wholesaler-Retailer-consumer channel procured
largest volume of products (40 percent) followed by Producer-Local collector-Wholesaler-
Retailer-Consumer channel which accounted for 20 percent of the total mango marketed from
the market. The volume that passed through, Producer-Wholesaler-Retailer-Consumer
channel has the most important since it accounted the largest marketed volume (40%) Fig. 8.
I. Producer-Retailer-Consumer Channel: It represented 10% of the total mango marketed
(4424qt) during the survey period. The channel was identified to be the fourth important
mango marketing channel in the study area in terms of volume.
II. Producer-Processor-Consumer Channel: It accounted for 15% of total mango marketed
(6635 qt) in the study area during the survey period. The channel was found to be the third
important channel in terms of volume.
III. Producer-Local collectors-Processor-Consumer Channel: It accounted for 3% of total
mango marketed (1327qt) during the survey period. The channel was found to be the least
important in terms of volume.
IV. Producer-Wholesaler-Processor-Consumer Channel: It accounted for 4% of total
mango marketed (1769qt) during the survey period. The channel was found to be the second
least important in terms volume.
V. Producer-Local collectors-Wholesaler-Retailer-Consumer Channel: It represented 20
% of total mango marketed (8847) during the survey period. The channel was found to be the
second most important marketing channel in terms of volume.
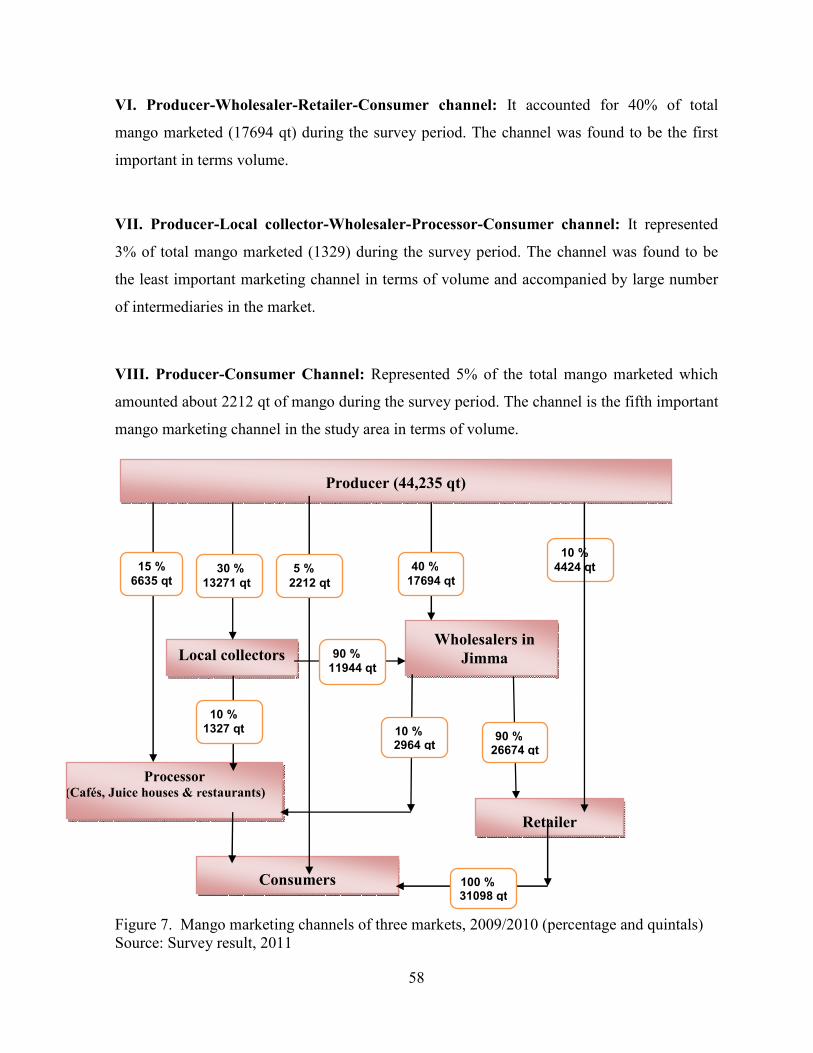
58
VI. Producer-Wholesaler-Retailer-Consumer channel: It accounted for 40% of total
mango marketed (17694 qt) during the survey period. The channel was found to be the first
important in terms volume.
VII. Producer-Local collector-Wholesaler-Processor-Consumer channel: It represented
3% of total mango marketed (1329) during the survey period. The channel was found to be
the least important marketing channel in terms of volume and accompanied by large number
of intermediaries in the market.
VIII. Producer-Consumer Channel: Represented 5% of the total mango marketed which
amounted about 2212 qt of mango during the survey period. The channel is the fifth important
mango marketing channel in the study area in terms of volume.
Figure 7. Mango marketing channels of three markets, 2009/2010 (percentage and quintals) Source: Survey result, 2011
Wholesalers in
Jimma
Consumers
15 %
6635 qt
Processor (Cafés, Juice houses & restaurants)
Local collectors
10 %
4424 qt 40 %
17694 qt
Retailer
30 %
13271 qt
10 %
1327 qt
Producer (44,235 qt)
5 %
2212 qt
90 %
11944 qt
90 %
26674 qt
10 % 2964 qt
100 % 31098 qt
59
4.4.2. Market structure
Market structure in food marketing is analyzed based on the number of buyers and sizes of
enterprises within the system, the degree of market transparency (market information), and
the condition of entry to and exit from trade (Scarborough and Kydd, 1992; Pender et al.,
2004).
In this study the market structure of avocado and mango is assessed using market
concentration ratio, degree of market transparency, flow of market price information within
markets and condition of entry into and exit from trade. For this reason, educational level,
trade experience, licensing procedure, lack of working capital and policy barriers are used as a
clue to examine the fruit market structure in Gomma Woreda. The result is listed as follows:
4.4.2.1. The degree of market concentration
Market concentration refers to the number and relative size distribution of buyers and sellers
in the market. For an efficient market, there should be sufficient number of firms (buyers and
sellers); firms of appropriate size are needed to fully capture economies of size; there should
be no barriers to entry into and exit from the market and should have full market information.
Concentration ratio was not calculated for avocado and mango due to low number of the
sampled wholesalers.
4.4.2.2. Degree of market transparency
The degree of market transparency refers to the timeliness and reliability of market
information that the traders have for their marketing decision. In a transparent market,
participants have adequate information about their competitors regarding their source of
supply and buying prices for better decisions.

60
Based on this essence, the assessment on the continuum indicated, only 26 and 47 percent of
producers and traders respectively have reported as they have adequate, timely and reliable
information in the study area. The research result has implied that, the market of the study
area is well characterized by lack of transparency in timeliness and reliability. The result has
also ascertained that traders have more privileged in information access than producers. The
reality assisted traders take hold of better market information through cellular phones (64.7
percent). The traders’ survey result has also indicated that about 75 % of the sample traders
got price information through combination of telephone, personal observation and other
traders. The rest (25 %) of the traders reported that they could guess market information from
the acts of other traders (e.g. interest to buy large volume of avocado and mango at higher
prices).
4.4.2.3. Barriers to entry and exit
Managerial know-how, working capital, legal and policy constraints are used to analyze
barriers of avocado and mango market entry and exit. Table 11 summarizes barriers to entry
and exit of fruit traders expressed in terms of education level attained, experience in fruit
trade, main sources of capital, access to credit and licensing of the sampled avocado/mango
traders across the sample markets.
i. Managerial know-how
Managerial know how is assessed to measure the ability and knowledge of avocado and mango
traders. The continuum is therefore examined by level of traders’ formal education and their
trade experiences.
a) Level of education
The result of traders’ survey in Table 11 indicated that, about 6.93 percent of the respondents
were illiterate; while the remaining 36.8 and 56.27 percent of trading household heads have
attended primary and secondary education, respectively. Since the majority of the traders are
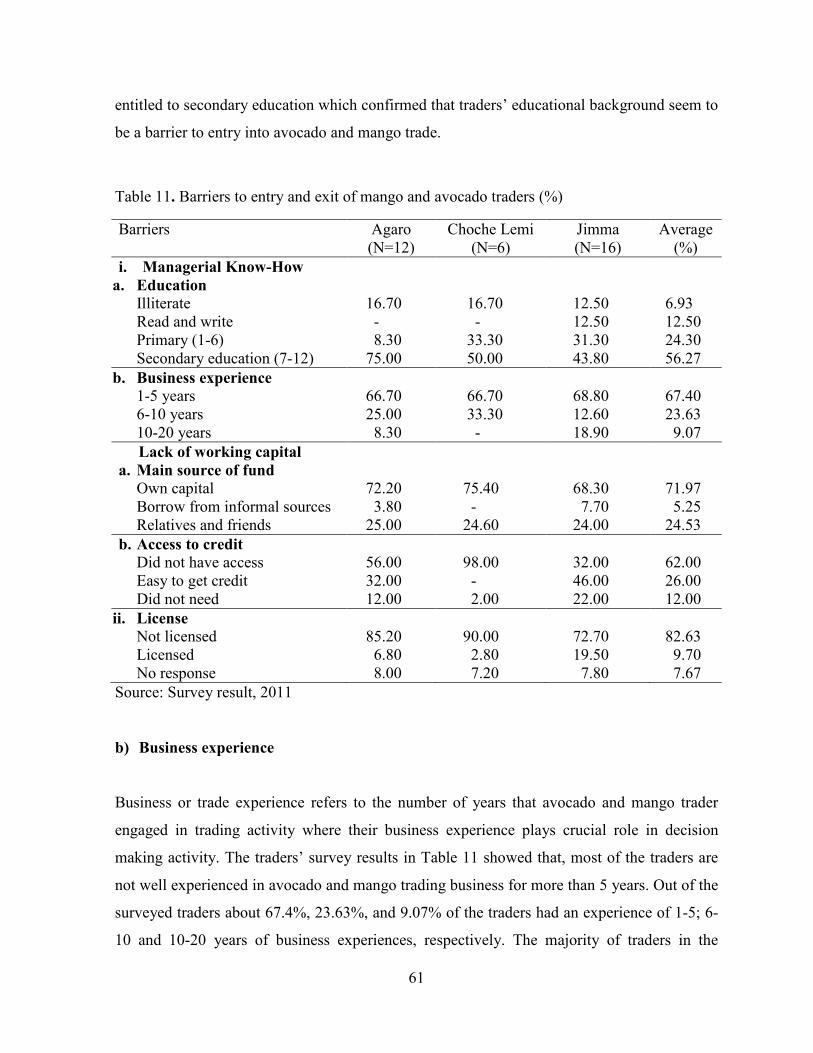
61
entitled to secondary education which confirmed that traders’ educational background seem to
be a barrier to entry into avocado and mango trade.
Table 11. Barriers to entry and exit of mango and avocado traders (%)
Barriers Agaro (N=12)
Choche Lemi (N=6)
Jimma (N=16)
Average (%)
i. Managerial Know-How
a. Education
Illiterate 16.70 16.70 12.50 6.93 Read and write - - 12.50 12.50 Primary (1-6) 8.30 33.30 31.30 24.30 Secondary education (7-12) 75.00 50.00 43.80 56.27
b. Business experience
1-5 years 66.70 66.70 68.80 67.40 6-10 years 25.00 33.30 12.60 23.63 10-20 years 8.30 - 18.90 9.07
Lack of working capital a. Main source of fund
Own capital 72.20 75.40 68.30 71.97 Borrow from informal sources 3.80 - 7.70 5.25 Relatives and friends 25.00 24.60 24.00 24.53
b. Access to credit
Did not have access 56.00 98.00 32.00 62.00 Easy to get credit 32.00 - 46.00 26.00 Did not need 12.00 2.00 22.00 12.00
ii. License
Not licensed 85.20 90.00 72.70 82.63 Licensed 6.80 2.80 19.50 9.70 No response 8.00 7.20 7.80 7.67
Source: Survey result, 2011
b) Business experience
Business or trade experience refers to the number of years that avocado and mango trader
engaged in trading activity where their business experience plays crucial role in decision
making activity. The traders’ survey results in Table 11 showed that, most of the traders are
not well experienced in avocado and mango trading business for more than 5 years. Out of the
surveyed traders about 67.4%, 23.63%, and 9.07% of the traders had an experience of 1-5; 6-
10 and 10-20 years of business experiences, respectively. The majority of traders in the

62
sampled markets had 1-5 years of experience. This may explain that there is no barrier to
entry in mango and avocado trade with respect to years of experience.
ii) Lack of working capital
a) Source of working capital
Working capital refers to the amount of money required by avocado and mango traders to
enter into the trading business. From the survey result, it was observed that the majority of
avocado and mango traders (71.97%) had their own source of capital for the respective
trading activities; while 24.53 percent of the traders have got their working capital from their
relatives and friends. But the remaining 5.25 percent of the traders have borrowed their capital
from informal credit sources (Table 11).
b) Access to credit services
However, traders’ survey result revealed that about 62% of avocado and mango traders
responded that they did not have access to credit where 26 percent of the traders are not
willing to get the service from the available formal credit sources due to collateral and other
complicated processes. The abovementioned factors are reported as constraining reasons to
expand the scale of operations and achieve greater efficiency in credit services. This implied
that, lack of capital discourages entry into avocado and mango trading.
iii) License of avocado and mango traders
In many business activities licensing is a major barrier. As a rule, a trader who has license in
one business is not allowed to perform any other businesses other than the business for which
he/she is licensed. However, this was not the case as most of the traders operating in the study
area who had no fruit trade license. Based on the survey result, about 82.63 % of the
respondents are not licensed in fruit trading while only 9.7 % of the traders had licenses.
However, the remaining 7.67 % of them were not volunteer to respond to this sensitive

63
question (Table 11). The assessment implied that, absence of trading license for both avocado
and mango trading activities had not restricted traders to enter and exit in avocado and mango
trading businesses.
4.4.3. Market conduct
Market conduct refers to the patterns of behavior of firms. This implies analysis of human
behavioral patterns that are not readily identifiable, obtainable, or quantifiable (Pomeroy and
Trinidad, 1995). There are no agreed upon procedures for analyzing the elements of market
conduct. Rather, some points are put to detect unfair price setting practices and the conditions
under which such practices prevail. In this study conduct of avocado and mango market is
analyzed in terms of the traders’ and price setting, purchasing and selling strategies.
4.4.3.1. Producers’ market conduct
The research result pointed out that, supply of avocado and mango occurs mainly from April
to October. But February and March are the months when prices of avocado reach at peak;
while July up to September are the months when avocado prices drains at rock bottom prices.
Similarly the assessment has highlighted that, November to March are months when prices of
mango reaches highest, while May to June are months when mango prices are lowest.
According to the assessment avocado was highly supplied to market from June to October
while for mango it was in the months of May and June. Respondents also reported that, there
were no significant sales in the months of December to March for both crops; but it extends
up to May for avocado.
It is also reported that, all farmers supply their avocado and mango produce only once in a
year. Simultaneously, 84 and 60 percents of mango and avocado producers sold their on cash
basis, while the remaining payment is conducted through advance payment for both crops.
64
The lack of modern post harvest handling practice and lack of facilitated storage facilities
have compelled producers to sell the fruits at prevailing prices. Knowing this, wholesalers put
pressure on producers to sell at low price. Starting from production up to marketing, every
farmer produces and sells on individual basis. This affected their bargaining power during the
sale of avocado and mango.
Price setting and terms of payment
The assessment indicated among all respondents, 92.5% of the farmers have reported as they
don’t negotiate on price to sell their produce; indicating this large amount of producers are
price takers. But 98.3 percent of the respondents stated the term of payment is conducted
through cash in hand system.
The selling strategy of the respondent farmers was open to any buyer. Thus, all producers sell
their produce to anybody as far as they offer better price.
4.4.3.2. Traders’ market conduct
Place to sell
The survey result indicated that, almost all transactions made on avocado and mango
marketing took place with direct contact between sellers and buyers. Large proportion of
avocado traders (41%) purchase the fruit directly from farmers at farm gate, while 34 and
16% of the traders purchase the fruit from Agaro and other village markets, respectively Fig.
9. Similarly 38 percent of mango traders purchase the fruit directly from the farmers at farm
gate, while 25, 20 and 17 percents of mango traders purchase the fruit at village
markets, roadside and Agaro market, respectively.

65
Source: Survey result, 2011
Figure 8. Market place to buy avocado
This is in line with Dawit and Hailemariam (2004) who stated that three different selling
options for horticultural crops which include: right in the field, sell at nearby markets, and
least proportion option to access distance markets.
Price setting and terms of payment
Table 12. Method of price setting and term of payment Price setting strategy Agaro
(N=12) Choche Lemi
(N=6) Jimma
(N=16) Average
Negotiation with farmers 33.30 16.70 31.30 27.10 Set by demand and supply 41.70 50.00 25.00 38.90 Myself 25.00 33.30 43.80 34.03 Term of payment
As soon as you sold 50.00 66.70 56.30 55.90 After some hours 8.30 16.70 12.50 11.80 On the other day after sale 41.70 16.70 31.30 32.40 Method of attracting suppliers
Giving better price 58.30 100 43.80 58.80 By visiting them 8.30 - 43.80 23.50 Fair scaling /weighing 8.30 - - 2.90 Giving pre-payment 16.70 - - 5.90 Offering credit service 8.30 - 12.50 8.80 Source: Survey result, 2011
Village market
16%
Farm gate
41%Roadside
9%
Agaro market
34%
66
The method of price setting is crucial importance in avocado and mango trading activity.
Accompanied by expediency of 38.9 percent of market demand and supply, 34 percent of
traders reported, as they set price by themselves. Simultaneously, larger proportion of traders
(55.9 percent) earn their money instantly after transaction while some of them (32.4 percent)
receive their money on the other day after sale (Table 11).
Selling and buying strategy
About 61.8 percent of the wholesalers are related to their buyers as clients (dembegna) while
other traders such as: Local collectors, retailers and processors are poorly related with their
clients with a value of 17.6, 23.5 and 14.7 percents, respectively. This indicated that,
wholesalers have better transaction relationships than other market actors. In other
perspective, most processors (73.5%) have better relationship with their suppliers while other
actors such as: wholesalers, retailers and Local collectors exhibited poorer relationship of
17.6, 14.7 and 11.8 percents, respectively. These premises indicated that, except for
processors, transactions with suppliers are conducted through non-regulars. The research
result has also signified that, 100 percent of purchasing of fruits from the study has taken
place without the interference of brokers.
The data in Table 11 showed that, avocado and mango traders have used different methods to
approach their clients. According to the assessment 58.8 and 23.5 percents of traders attracted
their suppliers by paying better price and by visiting them, respectively. Congruently, offering
credit service, giving pre-payment and fair scaling are the approaches often used by traders to
attract their suppliers with a value of 8.8, 5.9 and 2.9 percents, respectively.
4.4.4. Marketing performance
4.4.4.1. Marketing costs
Table 13 indicates different types of marketing cost related to the transaction of avocado and
mango by local collectors, wholesalers, retailers, and processors. The arrangement of

67
marketing cost revealed that storage loss is the highest cost for each marketing agents except
for processors who incur large cost for processing (manufacturing). This is due to the
perishable nature of both products. Thus, the storage loss is the amount highest followed by
transportation cost. Processors incur highest cost of all other traders because they incur
additional cost for processing.
Table 13. Marketing cost for different marketing agents (Birr/qt)
Cost of marketing Agents
Wholesaler Retailer Local collectors Processor Mean
Sack 3.50 3.00 4.00 4.00 3.63
Fill and stitch 3.00 3.00 1.50 3.50 3.67
Load/Unload 4.00 4.00 4.00 4.00 4.00
Transportation cost 20.00 - 12.00 12.00 14.67
Storage cost 3.00 2.00 2.50 2.00 2.38
Storage loss 11.50 11.50 11.50 20.00 13.63
Manufacturing cost - - - 250.00 250.00
Telephone 1.00 0.50 1.00 1.50 1.00
Guard 1.00 3.00 1.50 2.00 1.88
Personal expense 10.00 5.00 8.00 10.00 8.25
Total cost 53.00 32.00 46.00 307.00
Source: Survey result, 2011 4.4.4.2. Marketing margin
A. Avocado
Table 14 gave an overview of the marketing margin among different actors in different
channels. The total gross marketing margin (TGMM) is highest in Channel II and V which is
88.73% for each followed by channel I which accounts for 54% of the consumers’ price. Of
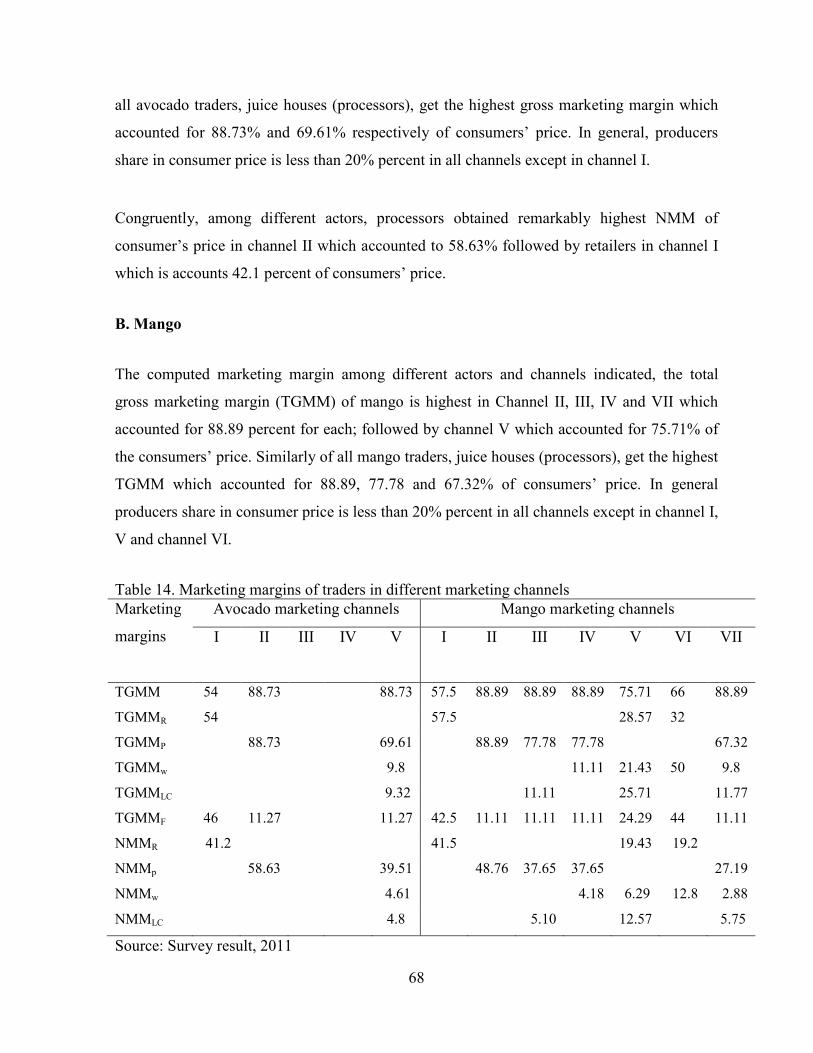
68
all avocado traders, juice houses (processors), get the highest gross marketing margin which
accounted for 88.73% and 69.61% respectively of consumers’ price. In general, producers
share in consumer price is less than 20% percent in all channels except in channel I.
Congruently, among different actors, processors obtained remarkably highest NMM of
consumer’s price in channel II which accounted to 58.63% followed by retailers in channel I
which is accounts 42.1 percent of consumers’ price.
B. Mango
The computed marketing margin among different actors and channels indicated, the total
gross marketing margin (TGMM) of mango is highest in Channel II, III, IV and VII which
accounted for 88.89 percent for each; followed by channel V which accounted for 75.71% of
the consumers’ price. Similarly of all mango traders, juice houses (processors), get the highest
TGMM which accounted for 88.89, 77.78 and 67.32% of consumers’ price. In general
producers share in consumer price is less than 20% percent in all channels except in channel I,
V and channel VI.
Table 14. Marketing margins of traders in different marketing channels Marketing
margins
Avocado marketing channels Mango marketing channels
I II III IV V I II III IV V
VI VII
TGMM 54 88.73 88.73 57.5 88.89 88.89 88.89 75.71 66 88.89
TGMMR 54 57.5 28.57 32
TGMMP 88.73 69.61 88.89 77.78 77.78 67.32
TGMMw 9.8 11.11 21.43 50 9.8
TGMMLC 9.32 11.11 25.71 11.77
TGMMF 46 11.27 11.27 42.5 11.11 11.11 11.11 24.29 44 11.11
NMMR 41.2 41.5 19.43 19.2
NMMp 58.63 39.51 48.76 37.65 37.65 27.19
NMMw 4.61 4.18 6.29 12.8 2.88
NMMLC 4.8 5.10 12.57 5.75
Source: Survey result, 2011

69
Similarly, among different market actors, juice houses’ obtain relatively highest NMM of
consumer’s price in channel II which accounted to 48.76% followed by retailers in channel I
which accounts for 41.5% of consumers’ price.
4.4.4.3. Marketing profit
A. avocado
Marketing profit of traders is summarized in Table 15. Profit of retailers was highest (Birr 103
per quintal) in channel I. This profit was made possible because of the direct purchase from
farmers through total elimination of intermediaries (local collectors, wholesalers), and direct
sale to consumers. The profit obtained by wholesalers was highest in channel V (Birr 47 per
quintal). Local collectors are benefited in channel V because of direct purchase from farmers.
In general, all marketing channels are profitable.
Table 15. Marketing profit for different agents (Birr/qt)
Agents Avocado marketing channels Mango marketing channels I II III IV V I II III IV V VI VII
Retailers Purchase price 115.00 85 250 170
Market cost 32.00 32 32 32
Selling price 250.00 200 350 250
Market profit 103.00 83 68 48
Processors Purchase price 115 310 85 170 170 250
Market cost 307 307 307 307 307 307
Selling price 1020 1020 765 765 765 765
Market profit 598 403 373 288 288 208
Wholesaler
s
Purchase price 210 85 175 85 175
Market cost 53 53 53 53 53
Selling price 310 170 250 170 250
Market profit 47 32 22 32 22
Local
collectors
Purchase price 115 85 85 85
Market cost 46 46 46 46
Selling price 210 170 175 175
Market profit 49 39 44 44 Source: Survey result, 2011

70
Processors obtain relatively highest profit per quintal in channel II and V which amounted to
598 and 403 per quintal respectively. Profit is somewhat high in channel II this is due to direct
purchase from farmers. Next to Channel II (i.e. sales direct purchase from farmers), channel V
(i.e. sales through local collectors) were comparatively the top three profitable (efficient)
channels for sale of avocado in the study areas.
B. Mango
The computation of marketing profit of traders indicated that, profit of retailers was highest in
channel I (Birr 83 per quintal) followed by channel V and VI which amounted Birr 68 and 48
per quintal respectively. Profit is higher in channel I this profit was made possible because of
the direct purchase from farmers through total elimination of intermediaries (local collectors,
wholesalers), and direct sale to consumers. The profit obtained by wholesalers was highest in
channel IV and VI (Birr 32 per quintal) while the profit obtained in channel V and VI 22
Birr per quintal due to purchase from local collectors. Profit of wholesalers is higher in
Channel IV and VI due to direct purchase from farmers.
Local collectors are benefited in channel III, V and VII which accounted Birr 39 and 44
(channel V and VII for each ) because of direct purchase from farmers at farm gate while at
channel III they got lower profit than channel V and VII due to the lower quality mango
purchased. In general, all marketing channels are profitable (efficient).
Processors obtain relatively highest profit per quintal in channel II, III, IV and VII which
amounted Birr 373, 288 (III and IV for each) and 208 respectively. Profit is somewhat high in
channel II which is due to direct purchase from farmers. Next to Channel II (i.e. sales direct
purchase from farmers), channel III and IV (i.e. sales through local collectors and
wholesalers) and channel VII (i.e. sales through local collectors and wholesalers) were
comparatively the top four profitable (efficient) channels for sale of avocado in the study
areas.
71
4.5. Determinants of Avocado and Mango Market Supply
Avocado and mango are produced mainly for market and both crops are important cash crops
in Gomma Woreda farmers in general and for the three PAs in particular. According to the
research report, all sample households are good suppliers of the commodity to the market.
Analysis of factors affecting farm level marketable supply of avocado and mango was found
to be important to identify factors constraining avocado and mango supply to market. In this
respect, 11 variables were hypothesized to affect farm level marketable supply of avocado and
mango. Multiple linear regression models were employed to identify the factors. For the
parameter estimates to be efficient, assumptions of Classical Linear Regression (CLR) model
should hold true. Hence, multicolliniarity and heteroscedasticity detection test were
performed using appropriate test statistics for each as follows.
Test for multicollinearity: All VIF values are less than 10. This indicates absence of serious
multicollinearity problem among independent continuous variables (Annex 9). Contingency
coefficient results indicated absence of serious multicolliniarity problem among the
independent dummy variables (Annex 10).
Since there is heteroscedasticity problem in the data set, the parameter estimates of the
coefficients of the independent variables cannot be BLUE. Therefore, to overcome the
problem, Robust OLS analysis with heteroscedasticity consistent covariance matrix was
estimated (Table 16).
Eleven explanatory variables were hypothesized to determine the household level marketable
supply of avocado and mango. Among these variables, only five variables namely (quantity
produced, age and market access, experience and price) were found significant for avocado.
While (education, quantity produced and extension access) were found significant for mango.
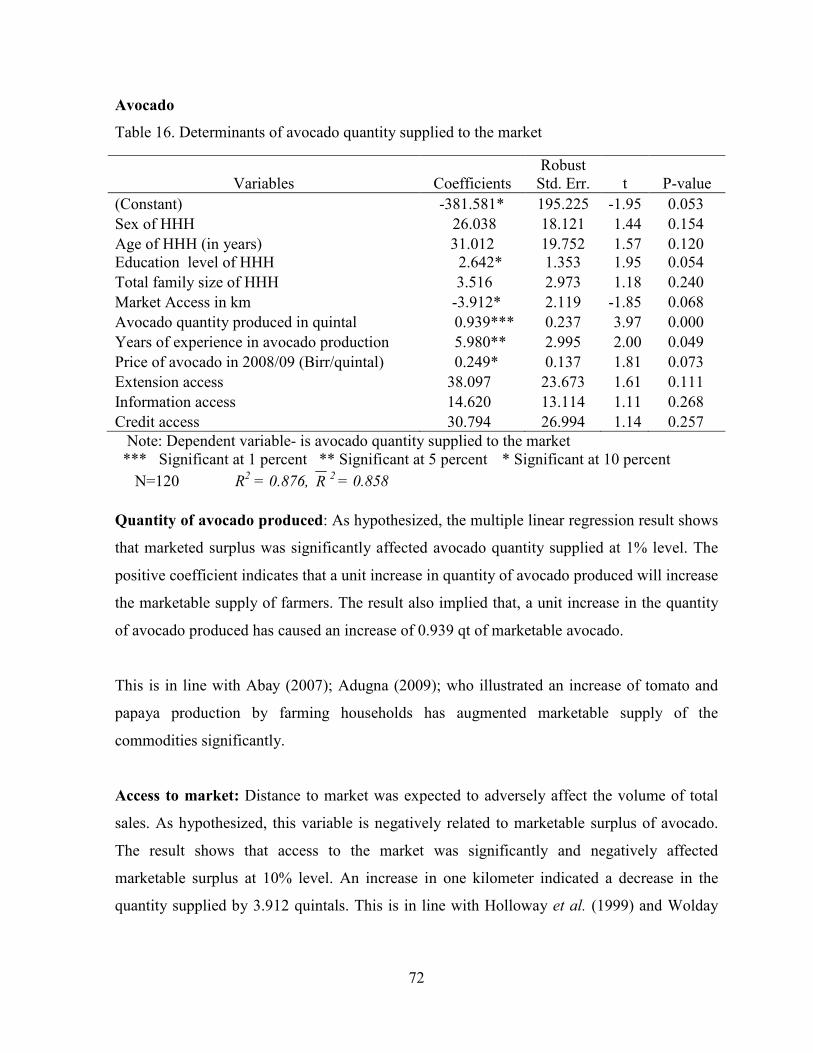
72
Avocado
Table 16. Determinants of avocado quantity supplied to the market
Variables Coefficients Robust
Std. Err. t P-value (Constant) -381.581* 195.225 -1.95 0.053 Sex of HHH 26.038 18.121 1.44 0.154 Age of HHH (in years) 31.012 19.752 1.57 0.120 Education level of HHH 2.642* 1.353 1.95 0.054 Total family size of HHH 3.516 2.973 1.18 0.240 Market Access in km -3.912* 2.119 -1.85 0.068 Avocado quantity produced in quintal 0.939*** 0.237 3.97 0.000 Years of experience in avocado production 5.980** 2.995 2.00 0.049 Price of avocado in 2008/09 (Birr/quintal) 0.249* 0.137 1.81 0.073 Extension access 38.097 23.673 1.61 0.111 Information access 14.620 13.114 1.11 0.268 Credit access 30.794 26.994 1.14 0.257 Note: Dependent variable- is avocado quantity supplied to the market *** Significant at 1 percent ** Significant at 5 percent * Significant at 10 percent N=120 R2
= 0.876, R2 = 0.858
Quantity of avocado produced: As hypothesized, the multiple linear regression result shows
that marketed surplus was significantly affected avocado quantity supplied at 1% level. The
positive coefficient indicates that a unit increase in quantity of avocado produced will increase
the marketable supply of farmers. The result also implied that, a unit increase in the quantity
of avocado produced has caused an increase of 0.939 qt of marketable avocado.
This is in line with Abay (2007); Adugna (2009); who illustrated an increase of tomato and
papaya production by farming households has augmented marketable supply of the
commodities significantly.
Access to market: Distance to market was expected to adversely affect the volume of total
sales. As hypothesized, this variable is negatively related to marketable surplus of avocado.
The result shows that access to the market was significantly and negatively affected
marketable surplus at 10% level. An increase in one kilometer indicated a decrease in the
quantity supplied by 3.912 quintals. This is in line with Holloway et al. (1999) and Wolday
73
(1994) who indicated that distance to market caused market surplus of milk and food grain to
decline.
Price of avocado: The coefficient of price of avocado which shows a positive relation to the
quantity of avocado sold or supplied to market. Producers checked the price of avocado for
their best benefit and this directs to the determinant to be significance at 10% level. The
positive and significant relationship between the variables indicates that as the price of
avocado at market rises, the quantity of avocado sold at the market also rises, which in turn
increases quantity of avocado sold per household per year. The coefficient of the variable also
confirms that a unit price increase in the avocado market directs to the household to increase
yearly avocado sales by 0.249 quts.
Education level of HHH: Education has showed positive effect on avocado quantity sold
with significance level at 10%. On average, if avocado producer gets educated, the amount of
avocado supplied to the market increases by 2.642 quintal. The result further indicated that,
education has improved the producing household ability to acquire new idea in relation to
market information and improved production, which in turn enhanced productivity and
thereby increased marketable supply of avocado and mango.
This is in line with Astewel (2010) who illustrate if paddy producer gets educated, the amount
of paddy supplied to the market increases, which suggests that education improves level of
sales that affects the marketable surplus.
Experience: The result has showed significant effect at 5% significant level for avocado with
expected positive sign. Thus, the result implied that, as farmer’s experience increase by one
year, the avocado supplied to market increased by 5.980 quintals. This is in line with Abay
(2007) who illustrated as farmer’s experience increased the volume of tomato supplied to the
market has increased in Fogera, District which is found in South Gonder.

74
Mango
Table 17. Determinants of mango quantity supplied
Variables Coefficients Robust
Std. Err. t p-value (Constants) -34.049** 26.479 -2.29 0.0201 Sex of HHH 2.724 2.903 0.94 0.350 Age of HHH in years 0.169 0.226 0.75 0.455
Education level of HHH 9.644** 4.759 2.03 0.045 Total family size of HHH 1.934 1.733 1.12 0.267 Market Access 0.593 0.440 1.35 0.181 Mango quantity produced in quintal. 0.816*** 0.059 13.62 0.000 Years of experience in mango production 0.075 0.093 0.8 0.425 Price of mango in 2008/09 (in Birr/quts.) 0.014 0.022 0.61 0.545 Extension access 9.595** 4.244 2.26 0.026 Information access 4.049 4.195 0.97 0.337 Credit access 2.036 4.833 0.42 0.674 Note: Dependent variable- is mango quantity supplied to the market N=120 R2
=0.887, R2 =0.886
*, ** and *** are significant at 10 percent, 5 percent and 1 percent, respectively Source: Survey result, 2011
Quantity of mango produced: The result was as hypothesized it indicates that households
who had produced more amount of mango had also supplied more amount of mango to
market than those who had produced less amount of mango due to insignificant consumption
of mango at home. The value of the coefficient for production of mango implies that an
increase in production of mango by one unit per hectare resulted in an increase in farm level
marketable supply of mango by 0.816 quintals.
Education level: On average, if mango producer gets educated, the amount of mango
supplied to the market increases by 9.644 quintal. This suggests that education improves level
of sales that affects the marketable surplus.
Extension access: the other significant variable was extension contact, which affected
positively the marketed supply of mango. On average, if a mango producer gets extension

75
contact the amount of mango supplied to the market increases by 9.595 quts. This suggests
that access to get extension service avails information regarding technology which improves
production that affects the marketable surplus.
However, all the other remaining variables such as: age of the household head, sex, total
family size, extension access, credit access, and market information access did not
significantly influenced the market supply of avocado in the study area as they expected.
While sex, age, family number, years of experience, extension, information, market, and
credit accesses were not significantly influenced the market supply of mango in the study area
as expected.
4.6. SWOT analysis
In light of the stakeholder analysis, mixed focus group discussions are executed with farmers
and traders to draw points of interventions and to address constraints by promoting the
strength of the chain. For this purpose, internal weakness and strengths of actors and external
opportunities and threats are analyzed under categories of economic, social, technological,
demographic and institutional themes. The main results of the SWOT analysis are listed under
(Table 18).

76
Table 18. SWOT analysis matrix
Strengths Weaknesses
Resources:
• Improving road access • Increasing telecom service • Potential for growth production • Accumulated traditional knowledge • Organic input utilization • Self preparation of seedlings
Marketing
• High supply (import substitution)
• rare informal communication
• Multiple customers • Payments received at delivery • Employment
Production:
• Shortage of agronomic management practices • Poor value addition activities • absence or poor Post harvest Technology
• Low price
Marketing • Poor Market information • Inability to join in groups for marketing
• High number of market functionaries
• Lack of organized information catering • Lack of credit services
Opportunities Threats
Production:
• Potential to increase area and productivity • Scope for processing industries (Juice
pharmaceuticals, cosmetics, food, etc) • Cooperatives can organize input supply Business Environment:
• High value crop • Prospect to provide assistance in technology
and market information • Transformation and development plan Market:
• Scope of value added Niche product • Big scope for import substitution • Premium revenue among tree crops
Production:
• Lack of appropriate varieties. • Increased supply of avocado and mango • Farmers not satisfied with the price they receive. • Epidemic fungal disease • High supply driven channel • Wild animals • Prevalence of heavy rainfall at maturity
Marketing • Adversarial, with hiding of information • Punitive i.e. no credit extended • Delays in price payments • Low price
Institutional
• Resource and capacity Constraints • Lack of coordination • Excessive local lending rate (10% per month). • Poor Technology generation & dissemination • Lack of reliable statistics on production • Weak extension support service
Source: Survey result, 2011)

77
4.6.1. Challenges along the market chains
Avocado root rot (P. cinnamomi) is the major constraining factor reported in all the study
areas by all most all of the surveyed avocado producing households. Shortage of plantings
materials and lack of pre and post harvest management technologies are also principal
setbacks hampering production of avocado and mango in smallholder producers. The overall
activities created power imbalances among actors which are largely controlled by
intermediaries and it has resulted into under priced outputs and discouraged the total volume
of production. Owing to lower socio-economic characteristics and high perishable nature of
the product, farmers’ bargaining power is too low to influence price.
Accompanied by dearth of technical expertise, the existing extension service has failed to
support and bring major impact on productivity of avocado and mango; this in turn has paved
the way for accessing to inequitable information where large proportion of market power is
captured by elite traders which favored them to govern the markets. Denial to access to
formal credit is also one of the major setbacks which ultimately affected farm gate prices
drastically.
Transportation and quality problem are also among the priority jeopardizes identified by
avocado and mango traders. Compared to the other parts of Ethiopia, the transport service in
the study areas is relatively better but what is rather difficult is the way fruits are handled and
transported, which exposed the products to drastic weathering and physical damage. Thus
most of the spoilage occurs at the level of packing into sacks, loading and transporting on the
rural rough road. The absence of specialized transportation facility has made avocado and
mango hauling to become customary and compelled the transportation system to rely on
traditional system just like transporting any other commodity on trucks or taxi.

78
4.6.2. Area of intervention required at micro and Meso-level
Business services that are feeding crucial information and governing the avocado and mango
market chain are mapped to illustrate potential interventions outside the market chain.
Source: Survey result, 2011
Figure 9. Area of Intervention Required at Micro and Meso-level
Procuring &
loading
Transport to
collection
centers
Tree
maintenance
Seedling
Preparation
Sorting
Planting
Harvesting Delivery to
Retailers, large
consumers
Transport to
Addis and
Jimma
Seedling from
NGO, JARC,
DoA
Local
consumption
Child labor f harvesting
Packaging
material
Bajaj,
human
porter,
horsebacks
vesting
Improved
harvester
Delivery to
grocers, cafés, ,
street vendors,
Tree
Street vending
and delivery
to cafés
Delivery to
grocers, cafés, street
vendors,
Training on grafting
techniques; and
developing root rot
tolerant/ resistant
cultivars
Training on
improved harvesting
tools
Development of Market
cooperatives, Cold chain
management and quality
standard
Training on
development of
packing
technology
Required Intervention at Micro-Level
• Improved Technology importation and hastened development to tackle the available jeopardizes
• Development of quality control and standard at all levels of chain
• Formation of avocado and mango producer groups
• Introduction of avocado and mango-quality-payment system
• Setting-up of avocado and mango information system in the region
• Cooperation with international breeders
Intervention at Meso Level
79
5. SUMMARY, CONCLUSIONS AND RECOMMENDATIONS
5.1. Summary and Conclusions
Given the large potential for fruit production in the country, their contribution to the total
GDP has been extremely low for many reasons. The most cited reasons include lack of market
oriented production which is too traditional and poorly supported by scientific
recommendations, excessive margin mainly due to inefficient and costly transport, absence of
fruit market information, inadequate government interventions and absence of market
regulations and legislations and its marketing activity is principally attributed to poor actors
skill. As a result, fruit marketing needs due attention in any on-going or future fruit
development plan.
Although comparative rewards such as: suitable agro-ecology, proximity to national market
and cheap provision of labor are opportunities, but declining prices, occurrence of deadly
fungal disease , poor market integration, absence of improved technologies and provision of
extension packages are major factors that hindered production-marketing task of avocado and
mango. With existing prominent organic production the product is not yet certified in the
study area.
Constraints hindering the development of avocado and mango are found in all the stages of
the chain. At the farm-level, lack clean seedlings and grafted seedlings have compelled
farmers to use inferior and low yielding materials. Storage facilities and absence of collective
bargaining power has also forced individual farmers to accept unfavorable deals.
Due to entire absence of improved varieties, avocado and mango production is exclusively
based on distribution of mixed materials; consequently the local seed system has come out as
best-bet arena and is now a common route for seedling dissemination in Gomma woreda.

80
Even though most payments are made instantly, in some areas payment in small part are some
of the marketing malpractices reported in the study area. Small scaling deduction, quoting of
lower prices and lack of market information are also common market malpractices in the
study area. Simultaneously, deficiency in capital and credit availability is also reported as
major problems that badly compelled farmers to sell their produce at whatever price given by
traders who have borrowed them earlier.
Absence of organized institution and system group marketing has made traders in a better
position to dominate the roost in pricing. The research result also indicated the existence of
six avocado and eight mango channels in Gomma Woreda. Producers-Consumer channel was
important to producers and consumers to get acceptable prices; while Producers-Local
collector-Wholesaler-Terminal market channel and Producer-Wholesaler-Retailer-Consumer
channel was the most important channels in terms of total volume marketed for avocado and
mango respectively.
Despite closeness of four governmental and private commercial banks and one (micro
finance) non-banking institution, denial to formal credit is prevalent. Thus informal credit
system is customary feature in the study area. Similarly large proportion of avocado is
consigned to terminal markets; while the remaining portion and all mangos which are
procured to the market is consumed at local markets on rock bottom price.
Therefore, a number of actions need to be undertaken in order to promote the development of
avocado and mango market chain. This particularly includes, capacity building, technological
applications, improved extension and plant breeding activities. Infrastructural development is
also a key to support the sub-sector. In this arena, emphasis should be given to improved
storage and transportation system and offering credit and other services to improve effective
production and marketing of the crops.

81
5.2. Recommendations
Based on the results of the study the following recommendations are made
� Generally, traders are capable of sourcing price information from different sources whereas
poor farmers rely on other farmers and government extension staff for the same information.
Therefore, there is a great need to make information available to farmers at the right time and
place in response to this challenge; it is also good to develop an integrated agricultural
marketing information system that will be linked to Woreda information center, and to link
them to government’s program.
� The quantity of avocado and mango produced at the farm level affected marketable supply
of avocado and mango positively and significantly. However, farmers are working under
limited plots of land by natural as well as socio-economic factors without using improved
technologies and agricultural inputs. Avocado and mango producers in Gomma Woreda used
little inputs (like FYM). Hence, increasing production and productivity of avocado and mango
per unit area of land is better alternative to increase marketable supply of avocado and mango.
Introduction of improved varieties, application of chemical fertilizers, using of modern
technologies, controlling disease and pest practices should be promoted to increase
production.
� The results of the study indicates provision of extension service improve market
participation of avocado and mango. Farmers have to linking production with marketing. And
also it is good to enlightening farmers to produce based on market signals, consumer
preferences and to direct or advice on the proper methods of handling, storing, transporting,
and above all improving quality of avocado and mango. Hence, it is recommended to assign
efficient extension system, updating the extension agent’s knowledge and skills with
improved production and marketing system.
� Changing the attitudes of farmers is a crucial factor in improving the marketing
performance of households. If farmers have awareness about the benefit of the specialty

82
market, they do not need only immediate economic advantages from the sale of their product.
In case of production, household heads with very limited education encounter in successfully
managing, fertilizer and pesticide applications, and also what to produce in line with taste and
preference of consumers demand, especially in the presence of ineffective extension services.
So stakeholders’ and Agricultural and Rural Development Offices have to create awareness
about the specialty of market. Continuous education and training on production and marketing
will have a positive impact on their attitudes.
���� Promoting potentially collective organizations (cooperatives) which are assumed to play
important role in improving the bargaining position of the producers and creating, lowering
transaction costs, reducing the level of oligopolistic market type by creating competitive
market
83
5. REFERENCES
Abay Akalu, 2007. Vegetable Market Chain Analysis: The Case of Fogera Woreda in ANRS of Ethiopia. An MSc Thesis Presented to the School of Graduate Studies of Haramaya University. 79p.
Abbot, J.C., and J.P. Makeham, 1981. Agricultural Economics and Marketing in the Tropics. Wing Tai Cheung Printing Co. Ltd, Rome. 58pp.
Abonesh Tesfaye, 2005. Imperfect Competition in Agricultural Markets: Evidence from Ethiopia. Journal of Development Economics, 76 (2): 405-425.
Adugna Gessesse, 2009. Analysis of Fruit and Vegetable Market Chains in Alamata, Southern Zone of Tigray: The Case of Onion, Tomato and Papaya. An MSc Thesis Presented to the School of Graduate Studies of Alemaya University.
Albertin, A. and P. K. R. Nair, 2004. Farmers’ Perspectives on the Role of Shade Trees in
Coffee Production Systems: An Assessment from the Nicoya Peninsula, Costa Rica, Human Ecology.
Andargachew Kebede, 1990. Sheep Marketing in the Central Highlands of Ethiopia. An MSc Thesis Presented to the School of Graduate Studies of Alemaya University. Ethiopia. 117p.
Anonymous, 2001. Information for Agricultural Development in ACP Countries. CTA, pp. 96.
Astewel Takele, 2010. Analysis of Rice Profitability and Marketing chain: The Case of Fogera Woreda, South Gondar Zone, Amhara National Regional State, Ethiopia. An MSc Thesis Presented to School of Graduate Studies of Haramaya University. 76p.
Backman, T. N. and W. R. Davidson, 1962. Marketing Principle. The Ronal Presses Co., New York. pp. 3-24.
Bain, J. S., 1968. Industrial Organization. 2nd Edition, John Wiley and Sons, New York. 258p.
Bain, K. and P. Howells, 1988. Understanding Markets: An Introduction and Practice of Marketing. Harvester Wheatsheaf, London.
Belay Kassa, 2003. Agricultural Extension in Ethiopia. Journal of Social Development in Africa, 18(1):

84
Beyene Tadesse and D. Philips, 2007. Ensuring Small Scale Producers in Ethiopia to Achieve Sustainable and Fair Access to honey markets. International Development Enterprises and Ethiopian Society of Appropriate Technology http://www.eap.gov.et/conetnt files/documents/ ea/documents/agricultural commodities/livestock/apiculture marketing/ ensuring small scale producers.pdf Accessed on 17th December, 2009.
Bezabih Emana and Hadera Gebremedhin, 2007. Constraints and Opportunities of Horticulture Production and Marketing in Eastern Ethiopia DCG Report No. 46.
Bosena Tegegne, 2008. Analysis of Cotton Marketing Chains: The Case of Metema Woreda, North Gonder Zone, Amhara National Regional State. An MSc Thesis Presented to the School of Graduate Studies of Haramaya University.
Bower, J. P. and J. G. Cutting, 1998. Avocado Fruit Development and Ripening Physiology. In: J. Janick (ed.) Horticultural Reviews. Volume 10: 229-271. Timber Press, Portland, OR. Posted with permission of J. Janick and the International Society for Horticultural Science.
Branson, R. E. and N. Norvell, 1983. Introduction of Agricultural Marketing, Mc Graw Hill Book Company, New York. 365p.
Carlsson, F., Köhlin, Alemu Mekonnen and Mahmud Yesuf. 2005. Are Agricultural Extension Packages What Ethiopian Farmers Want? A Stated Preference Analysis, Working Papers in Economics no. 172, August 2005, Department of Economics, Göteborg University.
CIAT (Centro International de Agricultureal Tropical), 2004. Increasing the Competitiveness of Market Chains of Smallholder’s Producers. Manual, 3: Territorial Approach to Rural Agro Enterprise Development Project.
Cramer, D. and D. Howitt, 2004. The Sage Dictionary of Statistics, a Practical Resource for Students in the Social Sciences, SAGE Publications, New Delhi.
Cramer, G. L. and W. Jensen, 1982. Agricultural Economics and Agribusiness, 2nd Edition. McGraw Hill Book Company, USA. 222p.
Crosby, A., 2008. Bats and Avocados, http://www.batplants.co.uk/avocado.htm Accessed on May 6, 2010
CSA (Central Statistical Authority), 2008. Federal Democratic Republic of Ethiopia, Central Statistical Agency, Agricultural Sample Survey, 2008, Volume 1, Report On Area and Production of Crops, (Private Peasant Holdings, Meher Season), Addis Ababa, June, 2008, Statistical Bulletin 417.

85
CSA (Central Statistical Authority), 2009. Area and Production of Major Crops. Sample Enumeration Survey. Addis Ababa, Ethiopia.
Davis, K., Ekboir, J., Wendmsyamregne M., Cosmas, M.O., Spiel man D. and Elias Zerfu, 2007. Strengthening Agricultural Education and Training in Sub-Saharan Africa Innovation Systems Perspective, IFPRI Discussion Paper 00736, December 2007.
Dawit Alemu and Hailemariam Teklewold, ----: Marketing of fruits and vegetables: Opportunities and constraints in the Rift Valley of Ethiopia. Melkasa & Debrezeit Agricultural Research Centers. 22p.
Edossa Etissa, 1997. Selection of Avocado (Persea Americana M.). Collection of Desirable Fruit Characteristics and Yield at Jimma, Proceedings of the 8th Annual Conference of the Crop Science Society of Ethiopia, Feb. 26-27, Addis Ababa, Ethiopia, pp: 26-35.
Elfring, W., Yohannes Agonafir and Mulgata Tefera, 2005. Value Chains Identification for Intervention, Progress Report on Identification Process, SNV Support to Business Organizations and Their Access to Markets.
FAO (Food and Agricultural Organization), 2005a. Addressing Marketing and Processing Constraints that Inhibit Agric-food exports: A guide for Policy Analysts and Planners. Agricultural Service Bulletin 160. Rome. Italy.
FAO (Food and Agricultural Organization), 2005b. Market Segmentation of Major Avocado Markets, Sugar and Beverages Group Raw Materials, Tropical and Horticultural Products Service Commodities And Trade Division. Food and Agriculture Organization of the United Nations.
FAO (Food and Agriculture Organization), 2006. Value Chain Analysis: A Case Study on Mangoes in Kenya, Prepared By the Sugar and Beverages Groups Raw Materials. Tropical and Horticultural Products Service Commodities and Trade Divisions Food and Agriculture Organization of the United States.
FAOSTAT (Food and Agricultural Organization Statistical Division), 2004.http://faosata.fao.org/site567/default.aspx/page/ID=567#ancor/FAOSTAT. Htm Accessed on 25th May, 2010.
FAOSTAT (UN Food and Agricultural Organization Statistical Division), 2010. Preliminary 2009 Data for Selected Countries and Products http://faostat.fao.org/site/567/DesktopDefault.aspx?PageID=567#ancor
Getachew Beshargo, 2002. Cattle Marketing in Western Shewa. M.Sc Thesis Presented to the School of Graduate Studies of Alemaya University, Ethiopia.

86
Gillard, J.P. and J. Godefroy, 1995. The Tropical Agriculturalist, Avocado, Macmillan Education Ltd, London.
Goetz, S. J., 1992. A Selectivity Model of Household Food Marketing Behavior in Sub- Saharan Africa. American Journal of Agricultural Economics, 74(2): 444-52.
Greene, W.H., 2003. Econometric Analysis. 5th Edition. Prentice Hall. Inc, London. 1026p.
Gujarati, D.N., 2003. Basic Econometrics. 4th Edition. McGraw-Hill, New York. Pp.563-636.
Haggablade and M. Gamser, 1991. Field Manual for Subsector Practitioners http://library.wur.nl/way/bestand/enclc/189236.pdf Accessed on 7th May, 2010.
Harris, B., 1982. The Marketed Surplus of Paddy in North Arcot District, Tamil Nadu: A Micro-Level Causal Model. Indian Journal of Agricultural Economics, 37 (2): 145-158.
Heisman, G., 1995. Research Method in Psychology, Fourth Edition. Houghton Mifflin Company, Boston, USA.
Hobbs, J.E., A. Cooney and M. Fulton, 2000. Value Chains in the Agric-food Sector: What Are They? How Do They Work? Are They for Me? Department of Agricultural Economics, University of Saskatchewan. Canada. 31p.
Holloway, G. and S. Ehui, 2002. Expanding Market Participation among Smallholder Livestock Producers: A Collection of Studies Employing Gibbs Sampling and Data from the Ethiopian highlands. Socio-economic and Policy Research Working Paper 48. ILRI, Nairobi, Kenya. 85p.
Holt, T., 1993. Risk Response in the Beef Marketing Channel: A Multivariate Generalized ARCH-M approach. American Journal of Agricultural Economics, 75: 559-571.
IFAD (International Fund for Agricultural Development), 2003. Promoting Market Access for the Rural Poor in Order to Achieve the Millennium Development Goals. Discussion Paper for the Twenty-Fifth Anniversary Session of IFAD’s Governing Council. Rome, Italy.
IPMS (Improving Productivity and Marketing Success), 2007. Gomma Pilot Learning Woreda Diagnosis and Program Design. Addis Ababa, Ethiopia. P85.
Islam, M.S., T.H. Miah and M. M. Haque, 2001. Marketing System of Marine Fish in Bangladesh. Bangladesh Agricultural Economics, 24(1 & 2): 127-142.

87
Jesse, V.E., 1987. Economic Efficiency and Marketing Order. Economic Efficiency in Agricultural and Food Marketing: pp. 217-228.
JARC (Jimma Agricultural Research Center), 2010. Center Profile, Jimma, Ethiopia.
Johan, H., McCoy and M.E. Shahran, 1988. Livestock and Meat Marketing’, Third Edition, Published by Van Nostrand Rein Hold Company, New York, U.S.A, p8.
Joonsten, F., 2007. Development Strategy for Export Oriented Horticulture in Ethiopia.
Kahsay Berhe, Yigzaw Dessalegn, Yisheak Baredo, Worku Teka, Hoestra, Dirk; and Azage Tegegne, 2008. Smallholder Based Fruit Seedling Supply System for Sustainable Fruit Production in Ethiopia: Lessons from IPMS Experience, ILRI. Addis Ababa, Ethiopia.
Kaplinsky, R., 2004. Competitions Policy and The Global Coffee and Cocoa Value Chains. Paper Prepared For United Nations Conference For Trade And Development (UNCTAD), Institute Of Development Studies, University of Sussex, and Centre For Research In Innovation Management, University of Brighton. http://www.acp-eu-trade.org/ library/files/Kaplinsky-Raphael_EN_052005_IDS_Competition-policy-and-the-global-coffee-and-cocoa-value-chains.pdf.
Kohls, R, L. and J.N. Uhl, 1985. Marketing of Agricultural Product. Fifth Edition. McMillan Publishing Company, NewYork, USA 624p.
Kolter, P. G., Armstrong, 2003. Principle of Marketing. 10th Edition, Hall of India Pvt. Ltd., New Delhi. 5-12p.
Lumpkin, T.A., K., Weinberger and S. Moore, 2005. Increasing Income through Fruits and Vegetable Production: Opportunities and Challenges. Marrakech, Morocco. 10p.
Lunndy, M., M.V. Gottret, W. Cifuentes, C. F. Ostertag, R. Best, D. Peters and S. Ferris, 2004. Increasing the Competitiveness of Market Chains for Small-holder Producers. Manual 3: Territorial Approach to Rural Ggro-enterprise Development. International Centre for Tropical Agriculture. Colombia.117p.
Lusby, F., 2007. Value Chain Program Design: Promoting Market Based Solutions And Competitiveness. http://www.actionforenterprise.org/paper07.pdf Accessed on 05th December, 2009.
Malik, D.S.N. Sigh and K.N. Rai, 1993. Marketed and Marketable Surplus of Wheat and Paddy Crops in Kuruk Sheta District of Harchyana, India. Journal of Agricultural Marketing, 7 (1): 59-67.

88
Maru Ayenew, Deribew Belew, Ali Mohamed and Wondyfraw Tefrea, (in press). Development of Simple Methods for Determination of Optimum Harvesting Date of Six Cultivars of Avocado Fruits.
Mauro, G., 2006. Can Horticultural Production Help African Small-holders to Escape Dependence on Export of Tropical Agricultural Commodities? http://www.webasa.org/ Pubblicazioni/Gioe_2006_2.pdf Accessed on 24th May, 2010.
Mazula, R., 2006. Commodity Chain Approach and Deal Structuring: An Agri- Business Case Study in Zimbabwe Progress Fund. PP.73-78., Zimbabwe. [Online] Available from: http://www.zoic.co.zw/documents.pdf. [Accessed on 10 Sptember 2008].
Meijer, P.W.M., 1994. The Function of Maize Market in Benin. Bert Broundjin, Benin. pp. 11 32.
Mendoza, G., 1995. A Primer on Marketing Channels and Margins. Lyme Rimer Publishers Inc., USA. 425p.
MoARD (Ministry of Agriculture and Rural Development). 2005. Vegetables and Fruits Production and Marketing Plan (Amharic Version), Ministry of Agriculture and Rural Development, Addis Ababa, Ethiopia.
Moti Jaleta, 2007. Econometric Analysis of Horticultural Production and Marketing in Central and Eastern Ethiopia. PhD Dissertation. Wageningen University. The Netherlands
Naamani, G., 2007. Developments in the Avocado World. California Avocado Society 2007:71-76, Tel-Aviv, Israel.
Pender, J., Ruben, R., Jabbar, M. and Eleni, Gebre-Medhin, 2004. Policies for Improved Land Management and Agricultural Land Management and Agricultural Market Development in the Ethiopian Highlands. Summary of Papers and Proceedings of a Workshop Held at the Ghion Hotel, Addis Ababa, Ethiopia. February 19 -20, 2004, IFPRI.
Pomeroy, R.S. and A.C. Trinidad, 1995. Industrial Organization and Market Analysis: p217- 238. In: G.J.Scott (eds.). Prices, Products, and People: Analyzing Agricultural Markets in Developing Countries. Lynne Reinner Publishers, Boulder, London.
Purcell, W., 1979. Agricultural Marketing: Systems, Co-ordination, Cash, and Future Prices. Reston Publishing Company, INC, Virginia.

89
Raymon, V.A., 2003. Vertical Cooperation and Marketing Efficiency in the Aquaculture Products Marketing Chain: A National Perspective from Vietnam. FAO, Rome, Italy: pp.132 -138.
Reddy, G.P., P.G. Chengappa and L. Achotch, 1995. Marketed Surplus Response of Millets: Some Policy Implications. Indian Journal of Agricultural Economics, 1(4): 668-674.
Rehima Musema, 2006. Analysis of Red Pepper Marketing: The Case of Alaba and Siltie in SNNPRS of Ethiopia. M. Sc. Thesis, Haramaya University.
Scarborough, V. and J. Kydd, 1992. Economic Analysis of Agricultural Markets. A Manual of Marketing Series 5, Chatham, UK: Natural Resource Institute: 172p.
Schere, F.M., 1980. Industrial Market Structure and Economic Performance. 2nd Edition. Rand McNally College Publishing Agency, USA. 342p.
Scott, G.J., 1995. Prices, Products and People: Analyzing Agricultural Markets in Developing Countries. Lynne Reinner Publishers, Boulder, London. 498p.
Seifu Gebremariam, 2003. Status of Commercial Fruit Production in Ethiopia, Addis Ababa, Ethiopia.
Singh, V. and K.N. Rai, 1998. Economics of Production and Marketing of Buffalo Milk in Haryana. Indian Agricultural Economics, 53(1): 43-52.
Sonko, S., Njue E., James M. and A. Jager, 2005. Pro-Poor Horticulture in East Africa and South East Asia, the Horticultural Sector in Uganda, EAST AFRICA, January 2005.
Stanlich A., 2005. Six Excellent Ways Avocados Keep You Healthy. http://www.Adoption articlesdirectory.com/Article/6-Excellent-Ways-Avocados-Keep-You-Healthy/27509 Stigler, G.J., 2005. The Theory of Price. Fourth Edition. Prentice-Hall of India, New Delhi. India. 371p.
Timmer, C.P., W.P. Falcon and S.P. Pearson, 1983. Food Policy Analysis. John Hopkins University Press for World Bank, Baltimore, London. 240p.
Thakur, D.S., D.R. Harbans Lal, K.D. Sharma and A.S. Saini, 1997. Market Supply Response and Marketing Problems of Farmers in the Hills. Indian Journal of Agricultural Economics, 52(1): 139-150.

90
Tsegaye Demissie, Ahmed Ali, Dilnesaw Zerfu, 2009, Availability and Consumption of Fruits and Vegetables in Nine Regions of Ethiopia with Special Emphasis to Vitamin A Deficiency Ethiopian Journal of Health Development, 23(3): 216-222.
Tshiunza, M. L., Lemchi, J. and A. Tenkonano, 2001. Determinants of Market Production of Cooking Banana in Nigeria. African Crop Science, 9(3): 537-547.
Van der Laan, H.L., 1999. Agricultural Marketing in Tropical Africa.p1-17.In: Van der Laan, H.L., et al., (eds.). Agricultural Marketing in Tropical Africa: Contributions from the Netherlands. Ashgate Publishing Limited. African Studies Center, Leiden, the Netherlands. 240p.
Wasilwa, L.A., J.K. Njuguna, E.N. Okoko and G.W. Watani, 2004. Status of Avocado Production in Kenya. Kenya Agricultural Research Institute, Nairobi, Kenya.
Weinberger, K. and T.A. Lumpkin, 2005. Horticulture for Poverty Alleviation. The Unfunded Revolution. AVRDC Working Paper No 1. The World Vegetable Center. Pp19.
World Bank, 2004. Poverty Reduction and Economic Management, Country Department for Ethiopia: Opportunities and Challenges for Developing High-value Agricultural exports in Ethiopia, Africa region, background report, April 9, 2004 http://sistersouces.worldbank. org/in/ethiopia/ resourecs/prem/opp/and/challenges/high/value/exoprts.pdf Accessed on 03rd April, 2004.
World Bank Group, 2006. Ethiopia: Developing Competitive Value Chain http:/siteresources. Worldbank.org/INTAFRSUMAFTPS/resources?aftpsnote29F0610-17.pdf Accessed on 17th, December. 2009.
Woyessa Garedew and Berhanu Tsegaye, 2010. Trends of Avocado (Persea americana M) Production and Its Constraints: in Mana Woreda ONRS of Ethiopia. A Potential Crop for Coffee Diversification.
Wiersinga, R. and A. Jager, 2009. Business Opportunities in the Ethiopia Fruit and Vegetables Sector. Wageningen University and Research Center, Final version, February 2009.
William, G. T. and K. L. Robinson, 1990. Agricultural Product Prices. Cornell University Press, 3rd edition, Ithaca and London.
Wolday Amha, 1994. Food Grain Marketing Development in Ethiopia after Reform 1990. A Case Study of Alaba Siraro. The PhD Dissertation Presented to Verlag Koster University. Berlin 293p.

91
Wolelaw Sendeku, 2005. Factors Determining Supply of Rice: A Study in Fogera District of Ethiopia: An MSc Thesis Submitted to School of Graduate Studies of Harmaya University.
Yeshitela, TB. and T. Nessel, 2004. Characterization and Classification of Mango Ecotypes Grown in Eastern Hararghe (Ethiopia). Sarhad Journal of Agriculture, 19(2): 179-180.
Yilma Tewodrose, 2009. United Nations Conference on Trade and Development.
Zekarias Shumeta, 2010. Avocado Production and Marketing in South Western Ethiopia. Trends in Agricultural Economics, 3(4): 190-206.

92
6. APPENDICES
ANNEX 1. Producers' Interview Schedule
Instructions to Enumerators
• Make brief introduction before starting any question, introduce yourself to the
farmers, greet them in local ways and make clear the objective of the study.
• Please fill the interview schedule according to the farmers reply (do not put your own
feeling).
• Please ask each question clearly and patiently until the farmer gets your points.
• Please do not use technical terms and do not forget local units.
Objectives of the study
• To identify the major fruit marketing channels in Gomma Woreda; • To quantify costs and margins for key fruit marketing channels; • To identify factors affecting marketable supply of fruits in Gomma Woreda.
I. Demographics 1. Name of household head______________________ Sex ______ Age ___________ years.
2. Marital status of household head ________. 1. Single 2. Married 3.Divorced 4.Widows 3. Religion of the household __________. 1. Orthodox 2. Protestant 3. Catholic 4. Muslim 4. Total number of family members’ ______. 1. Blow 15 years ______ 3. 30-50 years ____________ 2. 19-64 years _________ 4. Above 64 years ________ 5. Education level of household head _ 1. Illiterate 3. Primary school (1-6)________ 5. Certificate and above ____ 2. Read and write 4. Secondary school (7-12) _______
II. Area Information 6. Woreda ----------------------- Name of Rural Peasant Administration -------------------------- 7. Distance of your residence from the nearest market center. 1. For avocado _____ Km or _________________ walking time (minutes/hrs). 2. For mango ________ Km or _________________ walking time (minutes/hrs).
8. Distance of your residence to the nearest development center ______walking time
(minutes). 9. Distance to all weather road ____________ Km or _______hours walk.
Remark: The personal profile obtained from respondents with regard to the theme will be kept
confidential and will not have any consequence on the respondent in any ways. Please
give correct answers to the following questions.

93
10. Major means of income (in rank)
For all crop production (in rank) For perennial fruit crops (in rank) Coffee production ______ Grain production ________ Fruit production _________ Livestock production _________ Petty trading ________ Other sources _________
Avocado _________ Mango _________ Orange _________ Papaya _________ Pineapple _________ Banana ___________
11. Total number of avocado and mango trees under production, in 2010.
12. Type of planting material in use in 2010.
13. Experience on avocado production _______________ years. 14. Experience on mango production ________________ years.
Fruit
crop
Production system
in practice
1= Sole
2= Intercropping
3=Backyard
garden
4=Plantation
No of trees Months of
harvesting
----- to---
Average
Production
per tree
(K.gs/quts) Non-
bearing
Bearing Died Total
Avocado
Mango
Crop Type of
material
1= Local
2=Improved
3= Both
Sources of material
1=Agri.
Development
Office
2 =Market
3=NGOs
4= JARC
5= Own stock
6=From other
farmers
Name of
improved
varieties
in use
Problem on use of
improved materials
1=Availability
2= Low quality
3=High price
4=Unknown origin
5=Others (Specify)
Future plan
1=to increase
2=to decrease
3= remain
the same
Avocado
Mango

94
III. Production
15. Production of fruit (Avocado and Mango) and food grains in 2010. No Type of
Crop Area in timed
Quantity produced
(qt)
Quantity consumed
(qt)
For seed Quantity sold (qt)
Average selling
price/(qt)
Quantity purchased in 2010/qt
1 Teff 2 Maize 3 Wheat 4 Sorghum 5 Number of
avocado trees
6 Number of mango trees
16. What was your input for fruit (Avocado & Mango) production & their sources in 2010?
17. Trend of production and cropping pattern during the past 5 years? (Tick √)
Crop Trend of production If increasing, why? If decreasing, why?
Increasing Decreasing Same
Avocado Mango 18. Is supply of labor a problem during production? 1. ���� Yes 2. ���� No 19. What is the labor source for? 1. Avocado 1. P Family labor 3. P Labor exchange 2. P Hired labor 4. P Cooperation 2. Mango 1. P Family labor 3. P Labor exchange 2. P Hired labor 4. P Cooperation 20. What are the constraints of production? Rank horizontally* Crop Insects Diseases Weeds Seedling
Shortage
Fertilizer
shortage
Wild
animals
Theft Defruiting/
aborting
Avocado Mango
IV. Access to Services 21. Did you have extension contact in relation to fruit (avocado and mango) production in the
year 2010 cropping season? 1= Yes 0=No
22. If yes, how often the extension agent contacted you specifically for fruits production and
Inputs
used for
DAP Urea Compost
( amount in local
unit )
Manure
( amount in local
unit )
Pesticide
(Lt/kg)
specify Kg Source
* Kg Source
*
Avocado
Mango

95
marketing purpose in the year 2010? 1. Weekly 3. Monthly 5. Once in a year 2. Once in two week 4. Twice in the year 6. Any time I ask them
23. What was the extension advice specifically on fruit production? _ 1. Seed bed preparation 3. Fertilizer (compost) applications 5. Harvesting 2. Transplanting 4. Marketing of fruits 6. Post harvest handling 7. Others (specify) 24. Type of information/ services do you need in fruit production? Rank vertically*
No extension service is required on; Rank Avocado Mango
1 Seedling/ planting material preparation 2 Weed control method 3 Disease management 4 Field management after plantation 5 Post harvest treatments and storage 6 Marketing
25. Did you need credit in the year 2010? 1=Yes 0=No 26. If yes, have you received credit in 2010 for fruit production purpose? 1= Yes 0 =No 27. If yes, how much did you take for fruit production purpose? ----------Birr 28. For what purpose did you take the credit in relation to fruit production? _ 1. To purchase fertilizer for fruits 4. To rent in land to extend fruit production 2. To purchase seed/seedlings of fruits 5. Others (specify) 3. To purchase transporting animals 29. From whom did you get credit for fruit production? _ 1. Relative 3. Bank 5. Micro finance institution 7. Friends 2. Traders 4. NGO 6. Peasant association 8. Others (specify) --------
V. Marketing Aspect 30. Amount of avocado and mango fruit supplied to the market and market agents in 2010? Crop Place to sell
1=Farm gate 2=Local
market 3=Town
Distance to
market
(km)
Means of
Transport
1= On donkey
2= Vehicle
3=On foot
(Being carried)
To whom do you
sell?
1. Wholesaler 2. Retailer 3. Consumer 4. Processors 5. Brokers 6. Local collector
Terms of
sell
1=cash 2=credit 3=advance payment
Avocado Mango 31. How do you get market price information of fruits? ______________________________ 32. Did you know the market prices before you sold your fruits in 2010? 1=Yes 0=No 33 Did you know the nearby market price before you sold your fruit? 1=Yes 0=No 34 Did you know Jimma market price before you sold your fruit? 1=Yes 0=No 35. What is the trend of price for the last 5 years?
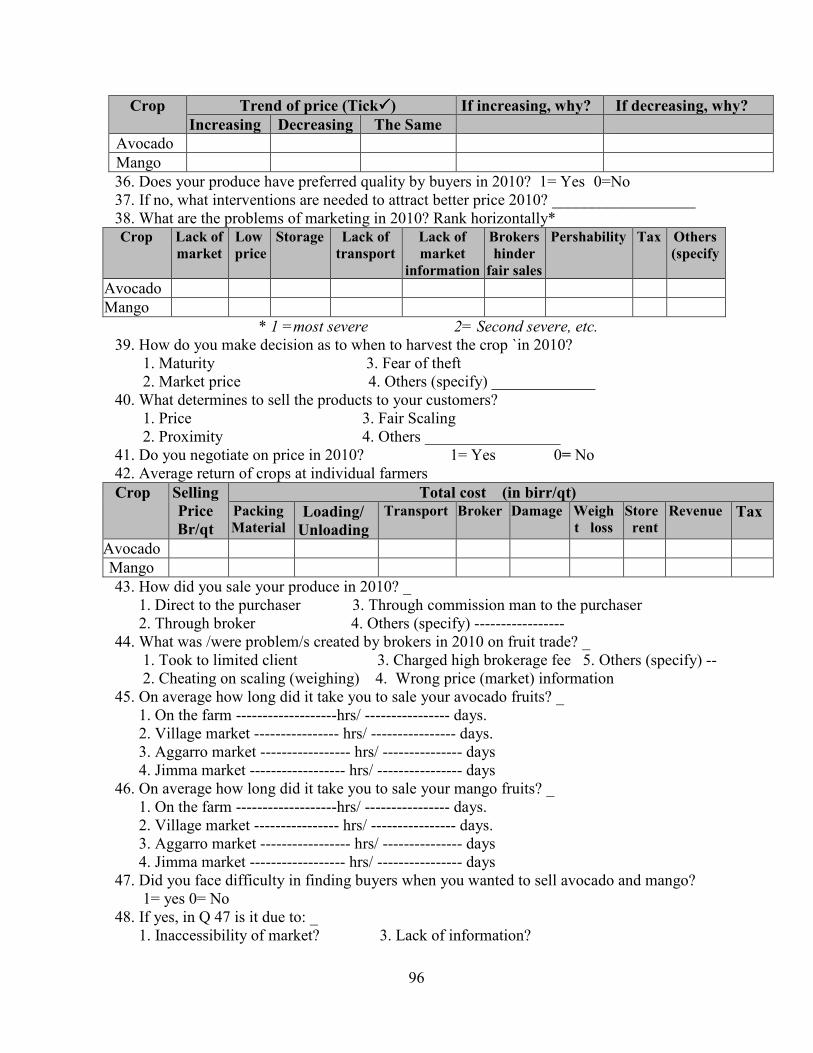
96
Crop Trend of price (Tick����) If increasing, why? If decreasing, why?
Increasing Decreasing The Same
Avocado Mango 36. Does your produce have preferred quality by buyers in 2010? 1= Yes 0=No 37. If no, what interventions are needed to attract better price 2010? __________________ 38. What are the problems of marketing in 2010? Rank horizontally* Crop Lack of
market Low price
Storage Lack of transport
Lack of
market information
Brokers
hinder fair sales
Pershability Tax Others
(specify
Avocado Mango
* 1 =most severe 2= Second severe, etc.
39. How do you make decision as to when to harvest the crop `in 2010? 1. Maturity 3. Fear of theft 2. Market price 4. Others (specify) _____________ 40. What determines to sell the products to your customers?
1. Price 3. Fair Scaling 2. Proximity 4. Others _________________
41. Do you negotiate on price in 2010? 1= Yes 0= No 42. Average return of crops at individual farmers Crop Selling
Price
Br/qt
Total cost (in birr/qt) Packing Material
Loading/
Unloading
Transport Broker Damage Weigh
t loss Store rent
Revenue Tax
Avocado Mango 43. How did you sale your produce in 2010? _ 1. Direct to the purchaser 3. Through commission man to the purchaser 2. Through broker 4. Others (specify) ----------------- 44. What was /were problem/s created by brokers in 2010 on fruit trade? _ 1. Took to limited client 3. Charged high brokerage fee 5. Others (specify) -- 2. Cheating on scaling (weighing) 4. Wrong price (market) information 45. On average how long did it take you to sale your avocado fruits? _ 1. On the farm -------------------hrs/ ---------------- days. 2. Village market ---------------- hrs/ ---------------- days. 3. Aggarro market ----------------- hrs/ --------------- days 4. Jimma market ------------------ hrs/ ---------------- days 46. On average how long did it take you to sale your mango fruits? _ 1. On the farm -------------------hrs/ ---------------- days. 2. Village market ---------------- hrs/ ---------------- days. 3. Aggarro market ----------------- hrs/ --------------- days 4. Jimma market ------------------ hrs/ ---------------- days 47. Did you face difficulty in finding buyers when you wanted to sell avocado and mango? 1= yes 0= No 48. If yes, in Q 47 is it due to: _ 1. Inaccessibility of market? 3. Lack of information?

97
2. Low price offered? 4. Others (specify) ----------- 49. What do you do if you didn’t get the expected price for your fruit supply? 1. Took back home 3. Sold at lower price 2. Took to another market on the same day 4. Sold on other market day 50. Who sets your selling price for fruits in 2010? _ 1. Yourself 3. Set by demand and supply 5. Others (specify) ------ 2. Buyers 4. Negotiations 51. When did you get the money after you sell to local collectors in credit? 1. As soon as I sold 3. On other- days 2. After some hours 4. Others (specify) ----------- 52. When did you get the money after you sell to retailers in credit? 1. As soon as I sold 3. On other- days 2. After some hours 4. Others (specify) ----------- 53. When did you get the money after you sell to wholesalers in credit? 1. As soon as I sold 3. On other- days 2. After some hours 4. Others (specify) ----------- 54. What is the average cost incurred to collect avocado fruit from the tree? -------- Birr/day/all trees. 55. What is the average cost incurred to collect mango fruit from the tree? ---------- Birr/day/all trees. 56. What are the average costs incurred for transporting and handling 1 qt of avocado to the
nearby market ---- birr? 57. What are the average costs incurred for transporting and handling 1 qt of mango to the
nearby market ------ birr? 58. Indicate if there is any loss while transporting 1 qt of avocado fruit from production area
to the nearby market ------------- k.gs. 59. Indicate if there is any loss while transporting 1 qt of mango fruit from production area to
the nearby market ---------- k.gs. 60. Specify if there are any other costs incurred --------- birr.
End of the interview
Thank you very much for responding to the questions.
Name of the Enumerator: ______________________ Date of Interview: ____________
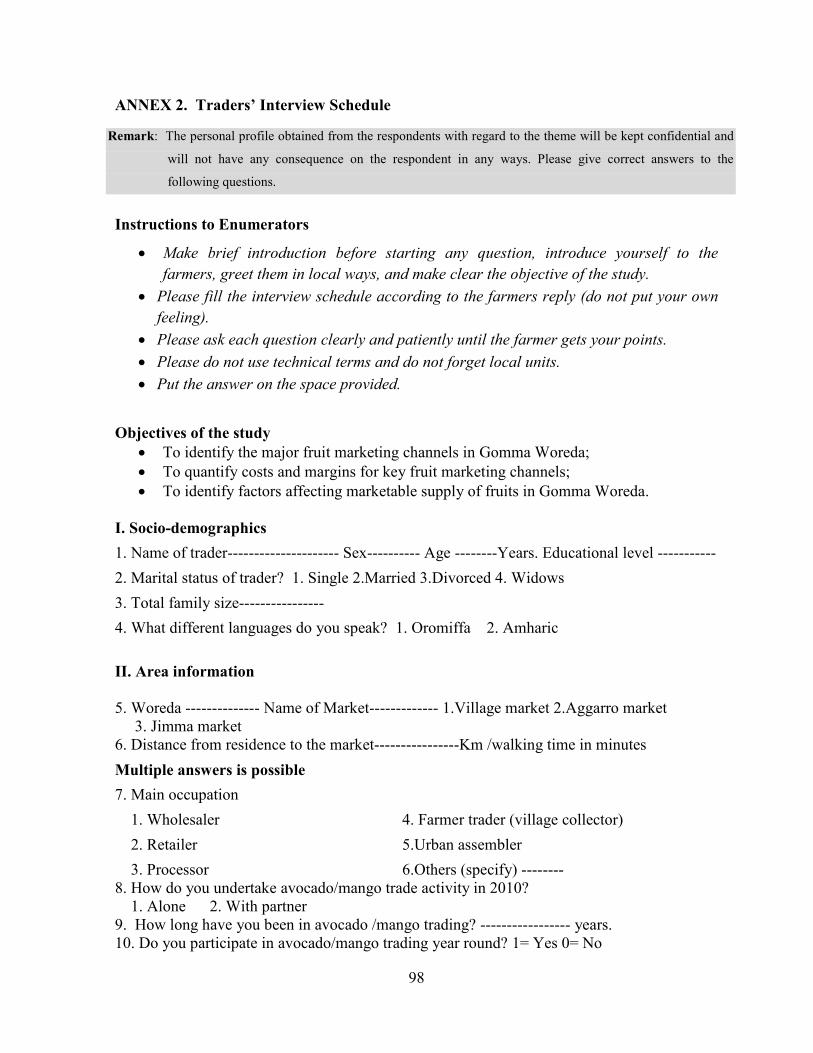
98
ANNEX 2. Traders’ Interview Schedule
Instructions to Enumerators
• Make brief introduction before starting any question, introduce yourself to the
farmers, greet them in local ways, and make clear the objective of the study.
• Please fill the interview schedule according to the farmers reply (do not put your own
feeling).
• Please ask each question clearly and patiently until the farmer gets your points.
• Please do not use technical terms and do not forget local units.
• Put the answer on the space provided.
Objectives of the study
• To identify the major fruit marketing channels in Gomma Woreda; • To quantify costs and margins for key fruit marketing channels; • To identify factors affecting marketable supply of fruits in Gomma Woreda.
I. Socio-demographics
1. Name of trader--------------------- Sex---------- Age --------Years. Educational level -----------
2. Marital status of trader? 1. Single 2.Married 3.Divorced 4. Widows
3. Total family size----------------
4. What different languages do you speak? 1. Oromiffa 2. Amharic
II. Area information 5. Woreda -------------- Name of Market------------- 1.Village market 2.Aggarro market 3. Jimma market 6. Distance from residence to the market----------------Km /walking time in minutes
Multiple answers is possible
7. Main occupation
1. Wholesaler 4. Farmer trader (village collector)
2. Retailer 5.Urban assembler
3. Processor 6.Others (specify) -------- 8. How do you undertake avocado/mango trade activity in 2010? 1. Alone 2. With partner 9. How long have you been in avocado /mango trading? ----------------- years. 10. Do you participate in avocado/mango trading year round? 1= Yes 0= No
Remark: The personal profile obtained from the respondents with regard to the theme will be kept confidential and
will not have any consequence on the respondent in any ways. Please give correct answers to the
following questions.

99
11. If no, at what period of the year do you participate? 1. Year round 2. When purchase price becomes low 3. During high supply 4. Other (specify) ----------------- 12. Do you practice trading other than fruits? 1= Yes 0=No 13. Number of market days in a week? __________________ 14. What percent of the total produce is sold on local market in 2010? 1. Avocado _____ % 2. Mango ______ %. 15. What percent of the produce will goes to domestic market (Jimma) in 2010? 1. Avocado___ %. 2. Mango _____ %. 16. What was the amount of your initial working capital when you start this fruit trade business? ------------------Birr. 17. What is the amount of your current working capital in 2010? __________________ Birr. 18. What is your source of working capital? __________________________________ 1. Own 2. Loan 3. Gift 4. Share 5. Others (specify) 19. If it was loan, from whom did you borrow? _ 1. Relative/family 3. Private money lenders. 5. NGO. 7. Friends. 2. Other traders 4. Micro finance institution. 6. Bank. 8. Others (specify) ------ 20. How much was the rate of interest? _______ Birr for formal, -------------- for informal. 21. What was the reason behind the loan? _ 1. To extend fruit trading. 2. To purchase fruit transporting vehicles/animals. 3. Others (specify) ---------------. 22. How was the repayment schedule? _ 1. Monthly 3. Semi-annually 5. Others (specify) ----- 2. Quarterly 4. When you get money 23. Is there change in accessing finance for fruit trade these days? 1. Improved 2. Deteriorated 3. No change 24. Who will buy avocado/mango fruits from you in 2010? 1. Wholesaler 2. Retailers 5. Others _________ 3. Household consumers 4. Brokers 25. From where did you purchase avocado/mango in 2010? 1. From village, name of village (specify) ------------------------------- 2. From market, name of market (specify) ------------------------------ 26. For whom do you purchase avocado/mango? 1. For own 2. For others 27. How did you sale your produce in 2010? 1. Direct to the purchaser 2.Throug broker 3. Other (specify) ------------- 28. Who sets the price in 2010? 1. Myself 2. Set by demand and supply 3. Buyers 4.Other ---- 29. How did you set price? 1. Set at time of advance given 2. Negotiated at delivery 3. At time of delivery 4. Others____________ 30. If purchasing price was set at the time of advance given, how did you agree? 1. Orally 2. Written agreement 3. Other (specify)______________ 31. When did you get the money after sale? 1. As soon as you sold 2. After some hours 3. On the other day after sale 4. Other (specify) _________ 32. Do you carry out any physical treatment to maintain product quality? 1. Yes 0. No 33. What do you do, if the product is not sold on time? 1. Took back home 2. Took to another market
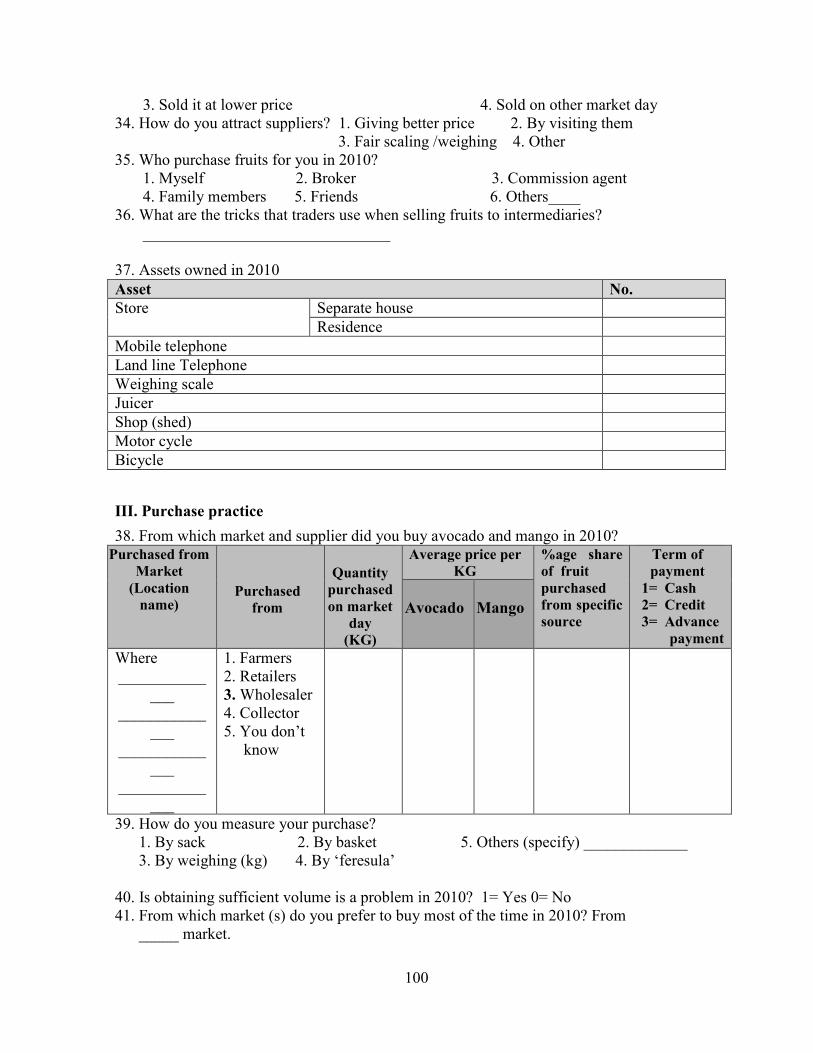
100
3. Sold it at lower price 4. Sold on other market day 34. How do you attract suppliers? 1. Giving better price 2. By visiting them 3. Fair scaling /weighing 4. Other 35. Who purchase fruits for you in 2010? 1. Myself 2. Broker 3. Commission agent 4. Family members 5. Friends 6. Others____ 36. What are the tricks that traders use when selling fruits to intermediaries? _______________________________ 37. Assets owned in 2010 Asset No.
Store Separate house Residence
Mobile telephone Land line Telephone Weighing scale Juicer Shop (shed) Motor cycle Bicycle
III. Purchase practice
38. From which market and supplier did you buy avocado and mango in 2010? Purchased from
Market (Location
name)
Purchased
from
Quantity
purchased on market
day (KG)
Average price per
KG %age share
of fruit purchased from specific
source
Term of
payment 1= Cash 2= Credit 3= Advance
payment
Avocado
Mango
Where ___________
___ ___________
___ ___________
___ ___________
___
1. Farmers 2. Retailers 3. Wholesaler 4. Collector 5. You don’t know
39. How do you measure your purchase? 1. By sack 2. By basket 5. Others (specify) _____________ 3. By weighing (kg) 4. By ‘feresula’ 40. Is obtaining sufficient volume is a problem in 2010? 1= Yes 0= No 41. From which market (s) do you prefer to buy most of the time in 2010? From _____ market.

101
42. Why do you prefer this market? 1. Better quality 3. High supply 2. Shortest distance 4. Others _____ 43. Which are the months of the year when prices are lowest? 1. Avocado___ 2. Mango ____ 44. Which are the months of the year when prices are highest? 1. Avocado ___ 2. Mango ___ 45. Is your purchasing price higher than your competitors? 1= Yes 0= No 46. If yes, what was the reason? 1. To attract suppliers 2. To buy more quantity 5. Others (specify) 3. To kick competitors 4. To get better quality 47. How many regular suppliers do you have 2010? 1. Producer ________ 3. Assembler _________ 5. Processors _____ 2. Wholesalers ________ 4. Retailers _________ 6. Others (specify ) 48. The reasons for low prices in 2010 are due to:
Reasons for low prices Yes No
- Favorable growing conditions/ excess supply
1= � 0= �
- Poor production 1= � 0= � -Trade regulations 1= � 0= � - Increase in supply of substitutes 1= � 0= � Other_______________________________________________________________________
IV. Selling practices 49. To which market and to whom did you sell avocado and mango in 2010 Sold to Market
(Location
name)
Sold to buyer
Quantity sold
on market
day
(KG)
Average price per
KG
%age share
of buyers
Term of
payment
1= Cash
2= Credit
3= Advance
payment
Avocado
Mango
Where ____________ ____________ ____________ ___________
1. Farmers traders 2. Retailers 3. Wholesaler 4. consumers 5. you don’t know
50. How did you attract your buyers? 1. By giving better price relate to others 3. By visiting them 2. By fair scaling (weighing) 4. Others (specify) 51. How many regular buyers do you have 2010? 1. Wholesalers_____ 3. Consumers_______ 5. Processors ______ 2. Assembler _____ 4. Retailers _____ 6. Others (specify) _____ 52. What is your packaging material? 1. Sisal sack 2. Plastic sack 3. Basket 4. Others______ 53. Do you know the market prices in different markets (on farm, village market, Aggaro
market, Jimma market) before you sold your fruits in 2010? 1=Yes 0= No 54. What is your source of information? _______________________________

102
55. How do you qualify the reliability, timeliness and adequacy of the information you got? regarding the nearby local and Jimma market. 1. It was reliable 3. It was timely 2. It was adequate 4. Others (specify) ---------- 56. Are you willing to pay for market information if it is available? 1= Yes 0= No
57. Accessibility to market roads in rainy seasons for vehicles is
1. Difficult 2. Easily accessible
58. If difficult, for how long? ______________Months
59. Do you have other branch shops/ shades to sell your avocado/mango in 2010? 1= Yes 0= No 60. What are the opportunities to expand fruit trading?___________________________ 61. Are there problems on fruit marketing? If yes what are the problems, and your suggestion
to overcome each Problem in 2010? No. Problem faced 1=yes
0=No
What do you
think are the
causes of this
problem?
What is your
suggestion to
solve? Avocado Mango
1 Credit 2 Theft 3 Price setting 4 Scaling/ Weighing 5 Shortage of supply 6 Storage problem 7 Lack of demand 8 Information flow 9 Natural quality problem
10 Government policy 11 No government support to
improve fruit marketing
12 Others (specify) 62. Are there restrictions imposed on unlicensed fruit traders? 1= Yes 0=No

103
63. Indicate your average cost incurred per quintal in the trading process of avocado and mango fruits in 2010.
Cost of Marketing
Birr/qt.
Avocado Mango
Purchas price per kg.
Labor employed to fill one qt and stitch/Packaging Load/ unload Brokerage Transportation: Vehicle Sorting License and Taxes Storage cost Storage loss Manufacture cost/processing cost Telephone expense Watching and warding Personal travel & other expense Others (specify) Total costs Selling price ( per Kg)
V. Marketing Services
64. Did you pay tax for the avocado and mango fruit you purchased in 2010? 1=Yes 0=No 65. Did you pay tax for the avocado and mango fruit you sold in 2010? 1=Yes 0=No 66. What was the basis of tax for the avocado and mango fruit you purchase in 2010? 1. Per sack_______ birr 3. Per basket ________ birr 5. Per kg _________ birr 2. Per quintal _____ birr 4. Fixed payment _____ birr 6. Others (specify) ________ 67. What was the basis of tax for the avocado and mango fruit you sell in 2010? 1. Per sack_______ birr 3. Per basket ________ birr 5. Per kg _________ birr 2. Per quintal ____ birr 4. Fixed payment _____ birr 6. Other (specify)________ 68. What is your opinion regarding the marketing fee paid in this market as compared to your
transaction? 1. Low 2. High 3. Average 4. You don’t Know 69. Is fruit trading in your locality needs a trading license? 1=Yes 0=No 70. If yes, how do you see the procedure to get the license? 1. Complicated 2. Easy 71. Did you have fruit trade license? 1=Yes 0= No 72. How much did you pay for fruit trade license for the beginning? _____Birr 73. How much is the yearly renewal payment? ________Birr 74. Did you store avocado and mango before you sold in 2010? 1= Yes 0= No 75. If yes in Q 74 for how long did you store avocado fruits in the store? Maximum for -------- Hrs or/days. 76. For how long did you store mango fruits in the store? Maximum for --------------- Hrs/days.

104
77. Amount of avocado fruits lost due to storage ------------------ k.gs/quts. 78. Amount of mango fruits lost due to storage ------------------ k.gs/quts. 79. Are you organized in any of the following organization?
Organization 1=Yes
2=No
Options set for benefits
Social association: ‘Iqub’
1. ���� Access to credit 2. ���� Encourage to save 3. ���� Facilitate joint marketing 4. ���� No benefit 5. ���� Got market information 6. ���� Coordinate purchase and sale 7. ���� Credibility 8. ���� Other (specify
Trade association
Marketing cooperative
End of the interview
Thank you very much for responding to the questions. Name of the Enumerator: ______________________ Date of Interview:
______________________
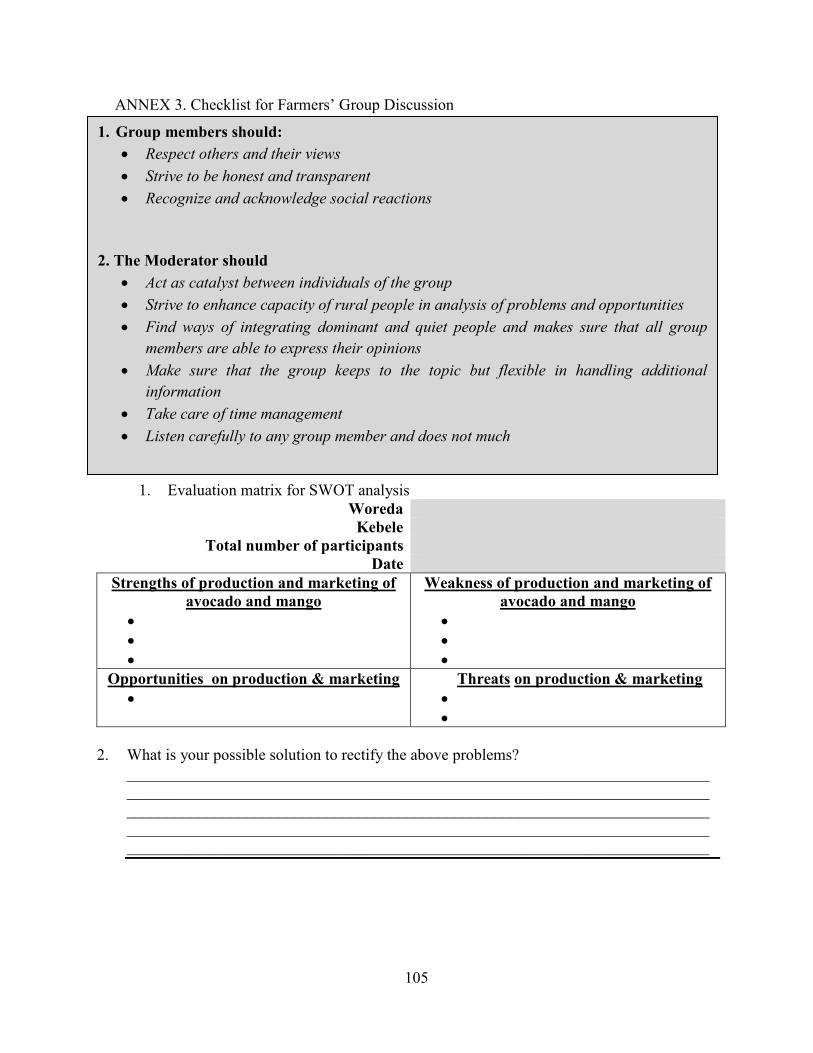
105
ANNEX 3. Checklist for Farmers’ Group Discussion
1. Evaluation matrix for SWOT analysis Woreda Kebele
Total number of participants Date
Strengths of production and marketing of
avocado and mango
•
•
•
Weakness of production and marketing of
avocado and mango
•
•
•
Opportunities on production & marketing
•
Threats on production & marketing
•
•
2. What is your possible solution to rectify the above problems?
_________________________________________________________________________ _________________________________________________________________________ _________________________________________________________________________ _________________________________________________________________________ _________________________________________________________________________
1. Group members should:
• Respect others and their views
• Strive to be honest and transparent
• Recognize and acknowledge social reactions
2. The Moderator should
• Act as catalyst between individuals of the group
• Strive to enhance capacity of rural people in analysis of problems and opportunities
• Find ways of integrating dominant and quiet people and makes sure that all group
members are able to express their opinions
• Make sure that the group keeps to the topic but flexible in handling additional
information
• Take care of time management
• Listen carefully to any group member and does not much

106
ANNEX 4. Checklist for Traders Focus Group Discussion
1. How do traders influence farmers’ participation in avocado and mango market/value
chain?
2. What are the major problems in marketing of avocado and mango?
3. Who is responsible for the above problem?
4. What is the quality trend of avocado and mango improving or deteriorating? Who is
responsible for the problem?
5. How these problems can be solved?
6. From whom do you purchase fruits at reasonable price?
1. Group members should:
• Respect others and their views
• Strive to be honest and transparent
• Recognize and acknowledge social reactions
2. The Moderator should
• Act as catalyst between individuals of the group
• Strive to enhance capacity of rural people in analysis of problems and opportunities
• Find ways of integrating dominant and quiet people and makes sure that all group
members are able to express their opinions
• Make sure that the group keeps to the topic but flexible in handling additional
information

107
ANNEX 5. Key Informant Discussion with Hort. Experts (Woreda and Zone) Woreda________________________
Kebele ________________________
Date ________________________
Name of interviewee ________________________
Title of the interviewee ________________________
1. What are the threats for avocado and mango extension service and input supply?
2. What are the most important constraining infrastructures affecting avocado and mango
production?
3. What are the possible solutions to correct these problems?
4. What is the role of FTCs on avocado and mango production? How?
5. What outputs are achieved on dissemination of avocado and mango technologies?
Table 6. FGD and key informants in the study areas S. No Farmers Group Discussion Number of
interviewee
1 Chedro sose 5 2 Bulbulo 6 3 Choche Lemei 7
Total 18
Key Informants
1 Jimma Zone Agricultural Office 1 2 Goma Woreda Agricultural Office 1 3 Jimma Agricultural Research Center 3 4 Jima Agric. Mechanization Research Center 3 5 Ethio-Telecom, South-Western Region 2 6 IPMS/ILRI Agaro knowledge Center 1 7 Juice house owners, hotel and restaurant owners 9
Total 20
Source: Survey result, 2011

108
ANNEX 7. Production area of Major Tropical Fruits (Ha in year) Avocado Oranges Papayas Pineapple Mango
Area (ha)
Yield (Hg/ha)
Area (ha)
Yield (Hg/ha)
Area (ha)
Yield (Hg/ha)
Area (ha)
Yield (Hg/ha)
Area (Hg/ha)
Yield (Hg/ha)
2002 10,000 80,000 2100 71,428 11300 200,000 120 5,000 10600 159600
2003 10,160 80,000 2533 49,790 11127 207,189 160 5,000 10887 163305
2004 8,000 81,250 3098 56,084 12500 208,000 200 5,000 11500 175000
2005 8,000 81,250 2761 90,546 12500 208,000 240 5,000 11500 175000
2006 4,716 73,886 5000 93,166 12500 208,000 280 5,000 11500 175000
2007 7,000 78,571 5200 92,307 12500 208,000 320 5,000 12000 180000
2008 6,473 66,196 3397 126,014 12500 208,000 87 5,172 12000 180000
2009 5,067 64,045 2440 120,250 - 208,000 - 5,172 12000 180000
Abridged from FAOSTAT | © FAO Statistics Division 2010 | 16 September 2010 ANNEX 8. National Production and Yield of Major Tropical Fruits in Ethiopia
Crop Number of
holders
Area in hectare Production in
quintal
Yield (qt/ha)
Avocado 820,712 6,473 428,492 66 Banana 1,963,514 39,426 2,610,592 66 Mango 695,030 6,731 484,361 72 Orange 420, 706 3,397 428,073 126 Papaya 696,835 4,003 572, 745 143 Pineapple 12,018 86.74 449 5 Abridged from CSA of Ethiopia, 2008

109
ANNEX 9. Avocado Production across Administrative Regions of Ethiopia Region Zone Number of
holders Area in hectare
Production in quintal
yield (qt/ha)
Amhara region West Gojam 9047 13 * * Oromia (total) 169972 1759 108530 62
Oromia
West Welega 33276 317 20864 66 Illubabor 6625 * * * Jimma 63341 * * * West Shewa 3737 * * * North Shewa 7848 39 * * East Shewa 1707 5 101.69 20 Borena 18545 244 15254.04 62 Southwest Shewa 2952 Guji 22036 438 27368.43 62 Kelem 1381 * * * West-Arsi 5065 * * *
Benshangul Gumuz (total) 1106 Asosa 1077 * * * SNNP (total) 634163 4653 319757 69 SNNP Zones
Gurage 50728 233 10487 45 Hadiya 72783 452 31592 70 Kembata-Tembaro
66428 463 28138 61
Sidama 144018 12156 87629 72 Gedeo 53063 526 39779 76 Wolayata 148457 1272 97112 76 South-omo 699 * * * Sheka 9370 37 1906 52 Kefa 16425 107 5334 50 Gamo-gofa 6698 14 357 26 Bench-maji 10312 54 2900 54 Silitie 20215 55 3137 57 Dawro 15267 111 6486 59
SNNP special Woredas
Yem 1045 5 * * Amaro 5777 45 4097 92 Burji 690 24 * * Basketo 5120 28 * * Konta 4401 24 803 33 Alaba 2242 6 * *
Gambela Region Mezhenger 4918 35 * * * Data not available Source: abridged from CSA of Ethiopia, 2008

110
ANNEX 10. Multi-collinearity test with VIF
Variables Tolerance VIF
Sex of HHH 0.777 1.287
Age of HHH 0.350 2.855
Education of HHH 0.341 2.932
Total family number 0.734 1.362
Access to market 0.902 1.108
Avocado output 0.340 2.939
Experience on avocado production 0.436 2.292
Avocado price in 2008/09 0.488 2.050
Extension access 0.913 1.095
Access to market information 0.727 1.375
Credit access 0.731 1.368
ANNEX 11. Contingency Coefficient
Credit
Access
Market inf. access Ext. access Sex
Credit access 1
Market inf. access 0.070 1
Ext. access 0.050 0.101 1
Sex 0.039 0.047 0.056 1
Related Documents