MASTER OF SCIENCE IN FINANCE MASTERS FINAL WORK PROJECT EQUITY RESEARCH: MERCK SHARP AND DOHME MIGUEL MORAIS OCTOBER 2021

Welcome message from author
This document is posted to help you gain knowledge. Please leave a comment to let me know what you think about it! Share it to your friends and learn new things together.
Transcript

MASTER OF SCIENCE IN
FINANCE
MASTERS FINAL WORK
PROJECT
EQUITY RESEARCH: MERCK SHARP AND DOHME
MIGUEL MORAIS
OCTOBER 2021

MASTER OF SCIENCE IN
FINANCE
MASTERS FINAL WORK
PROJECT
EQUITY RESEARCH: MERCK SHARP AND DOHME
MIGUEL MORAIS
SUPERVISOR:
TELMO FRANCISCO SALVADOR VIEIRA
OCTOBER 2021
i
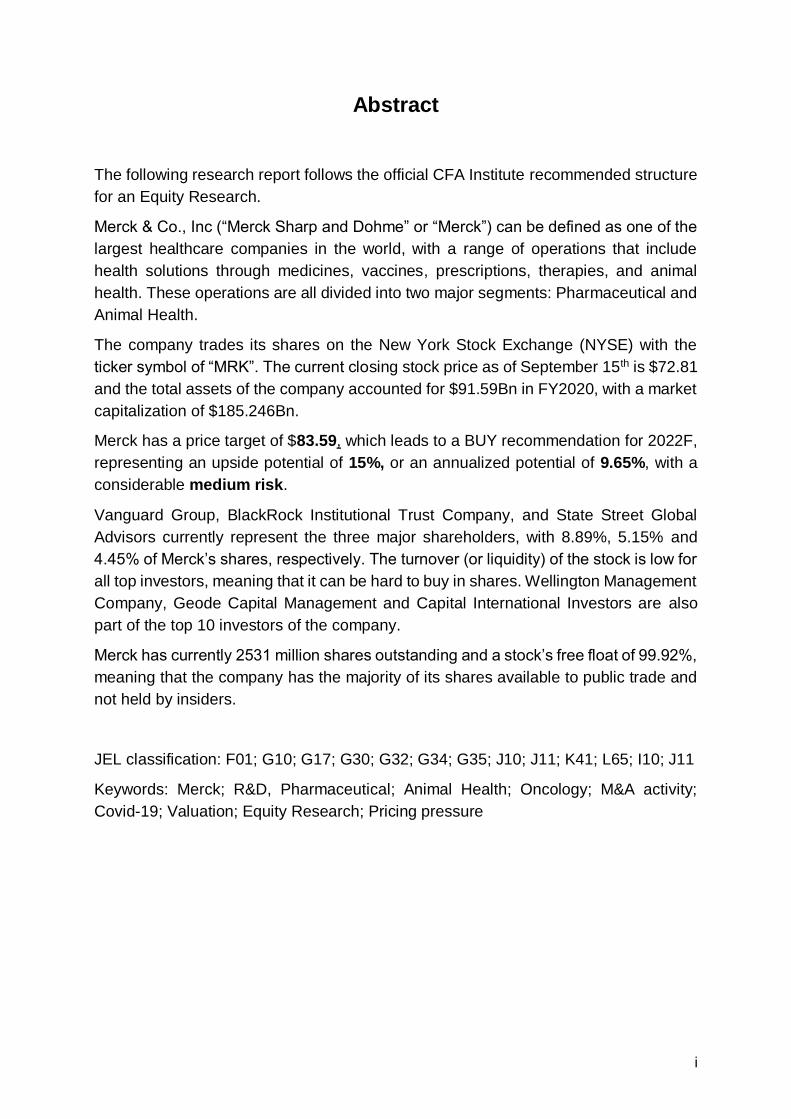
Abstract
The following research report follows the official CFA Institute recommended structure
for an Equity Research.
Merck & Co., Inc (“Merck Sharp and Dohme” or “Merck”) can be defined as one of the
largest healthcare companies in the world, with a range of operations that include
health solutions through medicines, vaccines, prescriptions, therapies, and animal
health. These operations are all divided into two major segments: Pharmaceutical and
Animal Health.
The company trades its shares on the New York Stock Exchange (NYSE) with the
ticker symbol of “MRK”. The current closing stock price as of September 15th is $72.81
and the total assets of the company accounted for $91.59Bn in FY2020, with a market
capitalization of $185.246Bn.
Merck has a price target of $83.59, which leads to a BUY recommendation for 2022F,
representing an upside potential of 15%, or an annualized potential of 9.65%, with a
considerable medium risk.
Vanguard Group, BlackRock Institutional Trust Company, and State Street Global
Advisors currently represent the three major shareholders, with 8.89%, 5.15% and
4.45% of Merck’s shares, respectively. The turnover (or liquidity) of the stock is low for
all top investors, meaning that it can be hard to buy in shares. Wellington Management
Company, Geode Capital Management and Capital International Investors are also
part of the top 10 investors of the company.
Merck has currently 2531 million shares outstanding and a stock’s free float of 99.92%,
meaning that the company has the majority of its shares available to public trade and
not held by insiders.
JEL classification: F01; G10; G17; G30; G32; G34; G35; J10; J11; K41; L65; I10; J11
Keywords: Merck; R&D, Pharmaceutical; Animal Health; Oncology; M&A activity;
Covid-19; Valuation; Equity Research; Pricing pressure

ii
Resumo
Este relatório segue a estrutura oficial recomendada pelo Instituto de CFA para uma
Equity Research.
Merck & Co., Inc. (“Merck Sharp and Dohme” ou “Merck”) pode ser definida como uma
das maiores empresas de saúde mundiais, com um conjunto de operações que
incluem soluções de saúde por via de medicamentos, vacinas, prescrições, terapias,
e saúde animal. Todas as operações mencionadas estão divididas em dois grandes
segmentos: Farmacêutica e Saúde Animal.
A empresa negoceia as suas ações na Bolsa de Valores de Nova Iorque (NYSE) com
o símbolo “MRK”. O preço atual das ações, em 15 de setembro de 2021. é de $72,81
e os Total de ativos da empresa contabilizou $91,59 bilhões no ano fiscal de 2020,
com uma capitalização de mercado de $185,246 mil milhões.
A Merck tem um preço-alvo de $83,59, o que leva a uma recomendação de “BUY”
para 2022F, o que representa um ganho potencial de 15%, ou de 9,65% depois de
anualizado, com um risco médio considerável.
O Vanguard Group, a BlackRock Institutional Trust Company e a State Street Global
Advisors representam atualmente os três principais acionistas, com 8,89%, 5,15% e
4,45% das ações da Merck, respectivamente. O “turnover” (ou liquidez) das ações é
baixo para todos os principais investidores, o que significa que pode ser difícil comprar
ações. Wellington Management Company, Geode Capital Management e Capital
International Investors também fazem parte dos 10 maiores investidores da empresa.
A Merck tem atualmente 2531 milhões de ações em circulação e um “free float” de
99,92%, o que significa que a empresa tem a maioria de suas ações disponíveis para
negociação pública e não detidas por “insiders”.
Classificação JEL: F01; G10; G17; G30; G32; G34; G35; J10; J11; K41; L65; I10; J11
Palavras-Chave: Merck; R&D, Farmacêutica; Saúde Animal; Oncologia; Fusões e
Aquisições; Covid-19; Avaliação de Empresas; Equity Research; Pressão de Preços

iii
Acknowledgements
I would like to thank my parents and closest friends for all the support shown
throughout these months.
To Professor Telmo Vieira, for all the attention and availability
iv
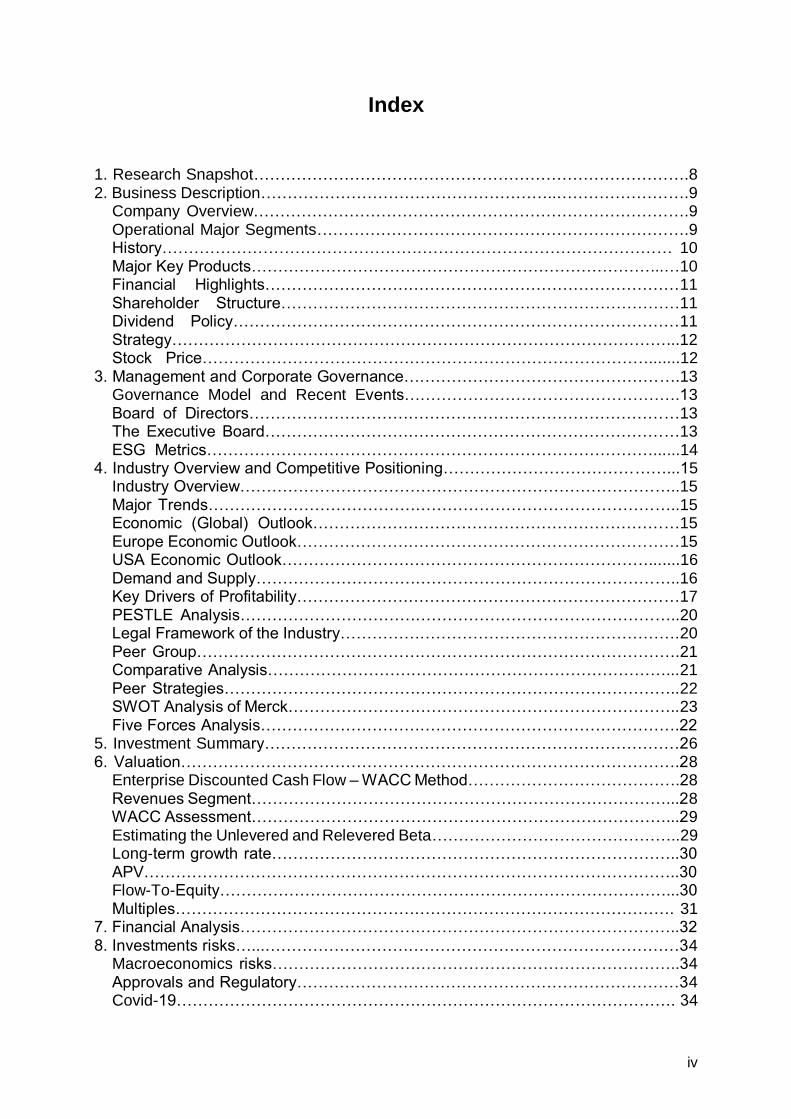
Index
1. Research Snapshot……………………………………………………………………….8 2. Business Description………………………………………………..…………………….9 Company Overview……………………………………………………………………….9 Operational Major Segments…………………………………………………………….9 History…………………………………………………………………………………… 10 Major Key Products…………………………………………………………………...…10 Financial Highlights……………………………………………………………………11 Shareholder Structure…………………………………………………………………11 Dividend Policy…………………………………………………………………………11 Strategy…………………………………………………………………………………...12 Stock Price………………………………………………………………………….......12 3. Management and Corporate Governance…………………………………………….13 Governance Model and Recent Events…………………………………………….13 Board of Directors………………………………………………………………………13 The Executive Board……………………………………………………………………13 ESG Metrics…………………………………………………………………………......14 4. Industry Overview and Competitive Positioning……………………………………...15 Industry Overview………………………………………………………………………..15 Major Trends……………………………………………………………………………..15 Economic (Global) Outlook……………………………………………………………15 Europe Economic Outlook………………………………………………………………15 USA Economic Outlook…………………………………………………………….......16 Demand and Supply……………………………………………………………………..16 Key Drivers of Profitability………………………………………………………………17 PESTLE Analysis………………………………………………………………………..20 Legal Framework of the Industry……………………………………………………….20 Peer Group……………………………………………………………………………….21 Comparative Analysis…………………………………………………………………...21 Peer Strategies…………………………………………………………………………..22 SWOT Analysis of Merck………………………………………………………………..23 Five Forces Analysis…………………………………………………………………….22 5. Investment Summary……………………………………………………………………26 6. Valuation………………………………………………………………………………….28 Enterprise Discounted Cash Flow – WACC Method………………………………….28 Revenues Segment……………………………………………………………………...28 WACC Assessment……………………………………………………………………...29 Estimating the Unlevered and Relevered Beta………………………………………..29 Long-term growth rate…………………………………………………………………..30 APV………………………………………………………………………………………..30 Flow-To-Equity…………………………………………………………………………...30 Multiples…………………………………………………………………………………. 31 7. Financial Analysis………………………………………………………………………..32 8. Investments risks…...……………………………………………………………………34 Macroeconomics risks…………………………………………………………………..34 Approvals and Regulatory………………………………………………………………34 Covid-19…………………………………………………………………………………. 34

v
Operational Risks……………………………………………………………….……….35 Compliance Risks………………………………………………………………………..35 R&D ………………………………..……………………………………………………..35 Sensitivity Analysis………………………………………………………………………36 Scenario Analysis………………………………………………………………………..36 Monte Carlo Simulation…………………………………………………………………38
vi
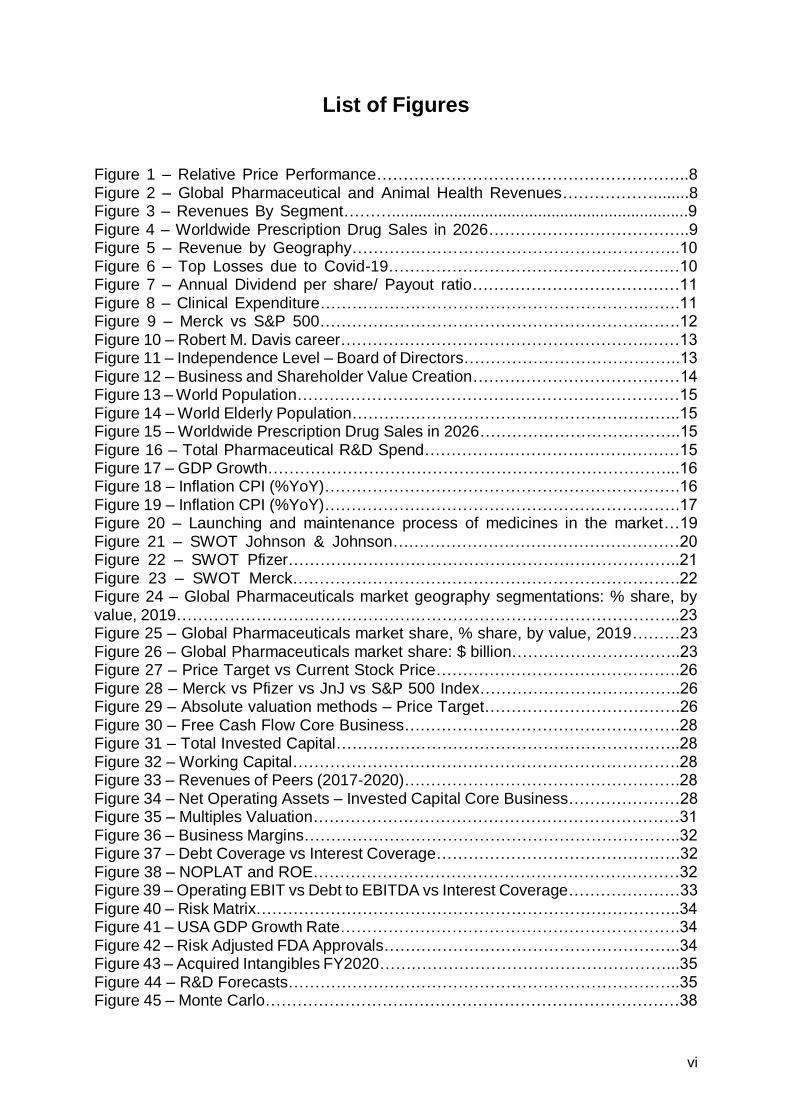
List of Figures
Figure 1 – Relative Price Performance…………………………………………………..8 Figure 2 – Global Pharmaceutical and Animal Health Revenues……………….......8 Figure 3 – Revenues By Segment………...................................................................9 Figure 4 – Worldwide Prescription Drug Sales in 2026………………………………..9 Figure 5 – Revenue by Geography……………………………………………………..10 Figure 6 – Top Losses due to Covid-19…………………………………………….…10 Figure 7 – Annual Dividend per share/ Payout ratio…………………………………11 Figure 8 – Clinical Expenditure…………………………………………………….…….11 Figure 9 – Merck vs S&P 500…………………………………………………….…….12 Figure 10 – Robert M. Davis career………………………………………………….……13 Figure 11 – Independence Level – Board of Directors…………………………………..13 Figure 12 – Business and Shareholder Value Creation…………………………………14 Figure 13 – World Population………………………………………………………………15 Figure 14 – World Elderly Population……………………………………………………..15 Figure 15 – Worldwide Prescription Drug Sales in 2026………………………………..15 Figure 16 – Total Pharmaceutical R&D Spend…………………………………………15 Figure 17 – GDP Growth…………………………………………………………………...16 Figure 18 – Inflation CPI (%YoY)………………………………………………………….16 Figure 19 – Inflation CPI (%YoY)………………………………………………………….17 Figure 20 – Launching and maintenance process of medicines in the market…19 Figure 21 – SWOT Johnson & Johnson………………………………………………20 Figure 22 – SWOT Pfizer………………………………………………………………..21 Figure 23 – SWOT Merck……………………………………………………………….22 Figure 24 – Global Pharmaceuticals market geography segmentations: % share, by value, 2019…………………………………………………………………………………..23 Figure 25 – Global Pharmaceuticals market share, % share, by value, 2019………23 Figure 26 – Global Pharmaceuticals market share: $ billion…………………………..23 Figure 27 – Price Target vs Current Stock Price……………………………………….26 Figure 28 – Merck vs Pfizer vs JnJ vs S&P 500 Index………………………………..26 Figure 29 – Absolute valuation methods – Price Target……………………………….26 Figure 30 – Free Cash Flow Core Business…………………………………………….28 Figure 31 – Total Invested Capital………………………………………………………..28 Figure 32 – Working Capital……………………………………………………………….28 Figure 33 – Revenues of Peers (2017-2020)…………………………………………….28 Figure 34 – Net Operating Assets – Invested Capital Core Business…………………28 Figure 35 – Multiples Valuation……………………………………………………………31 Figure 36 – Business Margins……………………………………………………………..32 Figure 37 – Debt Coverage vs Interest Coverage……………………………………….32 Figure 38 – NOPLAT and ROE……………………………………………………………32 Figure 39 – Operating EBIT vs Debt to EBITDA vs Interest Coverage…………………33 Figure 40 – Risk Matrix……………………………………………………………………..34 Figure 41 – USA GDP Growth Rate……………………………………………………….34 Figure 42 – Risk Adjusted FDA Approvals………………………………………………..34 Figure 43 – Acquired Intangibles FY2020………………………………………………...35 Figure 44 – R&D Forecasts………………………………………………………………..35 Figure 45 – Monte Carlo……………………………………………………………………38

vii
List of Tables
Table 1. Financial Highlights………………………………………………………….….8 Table 2. Shareholder Return Policy………………………………………………….…8 Table 3. ESG Scoring……………………………………………………………………14 Table 4. Global Exchange Rates……………………………………………………...17 Table 5. PESTLE Analysis……………………………………………………………...18 Table 6. Peer Group……………………………………………………………………..19 Table 7. Merck and Peers 3Y Beta Computation………………………………….29 Table 8. Capital Structure………………………………………………………………..29 Table 9. Merck and Peers 1Y Beta Computation………………………………….29 Table 10. Merck and Peers 3Y Beta Computation……………………………………..29 Table 11. Summary Output………………………………………………………………...29 Table 12. Long-term growth rate computations………………………………………….30 Table 13. WACC vs g……………………………………………………………………….36 Table 14. Optimistic Scenario……………………………………………………………..37 Table 15. Pessimistic Scenario……………………………………………………………37 Table 16. Super Optimistic…………………………………………………………………37 Table 17. Super Pessimistic……………………………………………………………….38
8
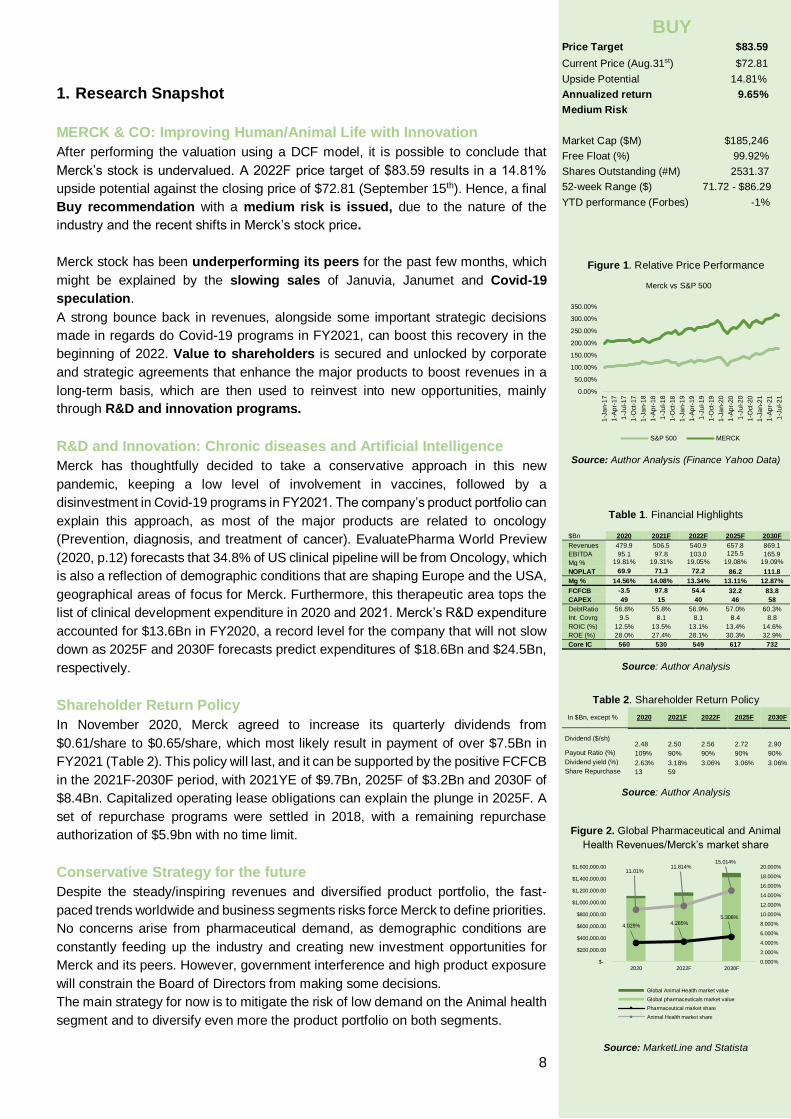
1. Research Snapshot
MERCK & CO: Improving Human/Animal Life with Innovation
After performing the valuation using a DCF model, it is possible to conclude that
Merck’s stock is undervalued. A 2022F price target of $83.59 results in a 14.81%
upside potential against the closing price of $72.81 (September 15th). Hence, a final
Buy recommendation with a medium risk is issued, due to the nature of the
industry and the recent shifts in Merck’s stock price.
Merck stock has been underperforming its peers for the past few months, which
might be explained by the slowing sales of Januvia, Janumet and Covid-19
speculation.
A strong bounce back in revenues, alongside some important strategic decisions
made in regards do Covid-19 programs in FY2021, can boost this recovery in the
beginning of 2022. Value to shareholders is secured and unlocked by corporate
and strategic agreements that enhance the major products to boost revenues in a
long-term basis, which are then used to reinvest into new opportunities, mainly
through R&D and innovation programs.
R&D and Innovation: Chronic diseases and Artificial Intelligence
Merck has thoughtfully decided to take a conservative approach in this new
pandemic, keeping a low level of involvement in vaccines, followed by a
disinvestment in Covid-19 programs in FY2021. The company’s product portfolio can
explain this approach, as most of the major products are related to oncology
(Prevention, diagnosis, and treatment of cancer). EvaluatePharma World Preview
(2020, p.12) forecasts that 34.8% of US clinical pipeline will be from Oncology, which
is also a reflection of demographic conditions that are shaping Europe and the USA,
geographical areas of focus for Merck. Furthermore, this therapeutic area tops the
list of clinical development expenditure in 2020 and 2021. Merck’s R&D expenditure
accounted for $13.6Bn in FY2020, a record level for the company that will not slow
down as 2025F and 2030F forecasts predict expenditures of $18.6Bn and $24.5Bn,
respectively.
Shareholder Return Policy
In November 2020, Merck agreed to increase its quarterly dividends from
$0.61/share to $0.65/share, which most likely result in payment of over $7.5Bn in
FY2021 (Table 2). This policy will last, and it can be supported by the positive FCFCB
in the 2021F-2030F period, with 2021YE of $9.7Bn, 2025F of $3.2Bn and 2030F of
$8.4Bn. Capitalized operating lease obligations can explain the plunge in 2025F. A
set of repurchase programs were settled in 2018, with a remaining repurchase
authorization of $5.9bn with no time limit.
Conservative Strategy for the future
Despite the steady/inspiring revenues and diversified product portfolio, the fast-
paced trends worldwide and business segments risks force Merck to define priorities.
No concerns arise from pharmaceutical demand, as demographic conditions are
constantly feeding up the industry and creating new investment opportunities for
Merck and its peers. However, government interference and high product exposure
will constrain the Board of Directors from making some decisions. The main strategy for now is to mitigate the risk of low demand on the Animal health
segment and to diversify even more the product portfolio on both segments.
BUY Price Target $83.59
Current Price (Aug.31st) $72.81
Upside Potential 14.81%
Annualized return 9.65%
Medium Risk
Market Cap ($M) $185,246
Free Float (%) 99.92%
Shares Outstanding (#M) 2531.37
52-week Range ($) 71.72 - $86.29
YTD performance (Forbes) -1%
Figure 1. Relative Price Performance
Source: Author Analysis (Finance Yahoo Data)
Table 1. Financial Highlights
$Bn 2020 2021F 2022F 2025F 2030F
Revenues 479.9 506.5 540.9 657.8 869.1
EBITDA 95.1 97.8 103.0 125.5 165.9
Mg % 19.81% 19.31% 19.05% 19.08% 19.09%
NOPLAT 69.9 71.3 72.2 86.2 111.8
Mg % 14.56% 14.08% 13.34% 13.11% 12.87%
FCFCB -3.5 97.8 54.4 32.2 83.8
CAPEX 49 15 40 46 58
DebtRatio 56.8% 55.8% 56.9% 57.0% 60.3%
Int. Covrg 9.5 8.1 8.1 8.4 8.8
ROIC (%) 12.5% 13.5% 13.1% 13.4% 14.6%
ROE (%) 28.0% 27.4% 28.1% 30.3% 32.9%
Core IC 560 530 549 617 732
Source: Author Analysis
Table 2. Shareholder Return Policy
In $Bn, except % 2020 2021F 2022F 2025F 2030F
Dividend ($/sh) 2.48 2.50 2.56 2.72 2.90
Payout Ratio (%) 109% 90% 90% 90% 90%
Dividend yield (%) 2.63% 3.18% 3.06% 3.06% 3.06%
Share Repurchase 13 59
Source: Author Analysis
Figure 2. Global Pharmaceutical and Animal
Health Revenues/Merck’s market share
Source: MarketLine and Statista
0.00%
50.00%
100.00%
150.00%
200.00%
250.00%
300.00%
350.00%
1-J
an-1
7
1-A
pr-
17
1-J
ul-1
7
1-O
ct-
17
1-J
an-1
8
1-A
pr-
18
1-J
ul-1
8
1-O
ct-
18
1-J
an-1
9
1-A
pr-
19
1-J
ul-1
9
1-O
ct-
19
1-J
an-2
0
1-A
pr-
20
1-J
ul-2
0
1-O
ct-
20
1-J
an-2
1
1-A
pr-
21
1-J
ul-2
1
Merck vs S&P 500
S&P 500 MERCK
4.029% 4.285%5.308%
11.01%11.814%
15.014%
0.000%
2.000%
4.000%
6.000%
8.000%
10.000%
12.000%
14.000%
16.000%
18.000%
20.000%
$-
$200,000.00
$400,000.00
$600,000.00
$800,000.00
$1,000,000.00
$1,200,000.00
$1,400,000.00
$1,600,000.00
2020 2022F 2030F
Global Animal Health market value
Global pharmaceuticals market value
Pharmaceutical market share
Animal Health market share

9
2. Business Description
Company Overview
Merck & Co., Inc or Merck (NYSE: MRK) is one of the major companies in the
Healthcare Industry, with operations in more than 140 countries. It operates as a
research biopharmaceutical company, and it has been redefining its operating model
to reduce costs and prioritize the R&D investments, which can generate long-term
sustainable profit.
This operating model contemplates a variety of areas, such as prescription
medicines, vaccines, biologic therapies, animal health products and other health
solutions related to the prevention of severe chronic diseases. Latest partnerships
also show an intend to tackle areas like immunology, neuroscience, cardiometabolic
diseases, oncology, cancer, diabetes, obesity, pain respiratory diseases and
vaccines.
Operational Major Segments
To group these different areas, the company divides its operations into two major
segments: Animal Health and Pharmaceutical.
The Animal Health segment has only been significant in recent years, as the results
have been impressive, even for the boards’ expectations. In this sector, the company
deals with veterinarians and animal producers/distributors through the
commercialization of vaccines for control, prevention, and treatment of diseases,
specifically directed to livestock and companion animals.
In FY2020, revenues reached an interesting value of $4.7Bn, accounting for 10% of
the company’s total revenue (figure 3), excluding the category of “Other Revenues”.
Following the covid-19 crisis, losses reached $50 million in this specific segment
according to the company’s financial reports, which did not affect the market leading
position.
Although Animal Health’s performance has been outstanding, pharmaceutical
segment holds most of the company’s core operating activities. According to the
company’s Financial Reports this segment includes every operation involving both
human health pharmaceutical and vaccine products, and it accounted for
approximately 90% of the company’s total revenue in 2020 (excluding “Other
Revenues”).
Both segments are related to the commercialization of drugs, vaccines, and other
pharmacy products, but the pharmaceutical’s relevance goes beyond this. The
involvement in disease prevention, hospital services and other medicine areas
makes this core segment for Merck.
Revenues in pharmaceutical industry of $43.02Bn in FY2020 (an increase of 2.5%
compared to the previous FY) proves how huge, important, and profitable this
segment can be, not forgetting the subsequent risk associated with it.
Despite this encouraging value, three risks need to be addressed. The increase of
innovation costs and decrease of returns (Pricing Pressure), the implementation time
for each product of 10 to 15 years, and the limited number of products available
represent an undesirable risk for every competing company in this Industry.
Figure 3. Revenues By Segment
Source: Author Analysis
Figure 4. Worldwide Prescription Drug Sales in 2026 (in $Bn)
Source: EvaluatePharma2021(May 2021)
90%
10%
Pharmaceutical Animal Health
59.3 54.1 53.9 49.9 47.6 43

10
Following the covid-19 crisis, losses reached $2.5Bn in this specific segment
according to the company’s financial reports.
Financial reports also include the segment of “Other Revenues”, recognized as a
non-core operational segment, due to the third-party manufacturing sales, hedging
activities, miscellaneous corporate revenues, and other small investments. Hence,
the residual values from the last 5 years confirm the lack of connection to the
company’s core operations.
To sum up this set of information, it is relevant to mention that both pharmaceutical
and animal health segments experienced a growth of 2.5% and 3% in FY2020,
respectively. This growth is not close to the ones recorded in the two previous fiscal
years, where rates reached approximately 6% and 10%. Covid-19 played an
important role in this.
In FY2020 Merck had 44% of its operations in the US, 28% in Europe, Middle East
and Africa (EMEA), 7% in China, 7% in Japan, 6% in Asia Pacific, 5% in Latin
America, and 3% in Other Locations. From this set of information (Figure 5), it is
relevant to mention the increase in the volume of operation in China, compared to
the previous fiscal year (increase of 2%) justifying the strategic movement of entering
in new emerging markets.
History
Merck’s history goes back to January 1,1891 when George Merck founded the company in
the U.S, with the purpose of distributing fine chemicals mainly in New York City.
The turning point occurred in 1925 when the son of George Merck (George W. Merck) became
president, leading the business to a route of innovation, bringing the attention to the research
capacity. This ambition was boosted by the merger with Powers-Weightman-Rosengarten in
1927. The following years solidified this position with the creation of the first research
laboratory which led to discovers in medicine.
1948 and 1953 are two of the most important years for the company, marked by the entry in
the animal health market with sulfaquinoxaline and by the merger with Sharp & Dohme
respectively.
Large companies like Merck are highly intense when it comes to mergers, acquisitions,
expansions, and R&D. Although they are all important to the course of operations, there a few
developments that have been more crucial than others. The formation of subsidiaries in
Cyprus, Germany, Holland, Peru, South Korea, and China by a joint venture represent
examples of important expansions that allowed Merck to boost their revenues, innovation, and
research in new and emerging markets.
Spin-offs and regulatory approvals have also been an important role to solidify the company’s
position in the industry.
In 2009 Merck became the second largest pharmaceutical company in the United States
based on revenue, due to a merger with Schering-Plough. In 2014 the FDA approved
BRAVECTO for the Animal Health division and KEYTRUDA for the Pharmaceutical division.
In this current year of 2021, the company closed an agreement with Gilead Sciences for
treatments in HIV, and another one with IMV to clinical trials in some of their products. It is
relevant to also mention the spin-off of Organon & Co, the acquisition of Pandion Therapeutics
Inc, and the two regulatory approvals related to Lynparza and Keytruda.
Figure 5. Revenue by Geography
Source: Author Analysis
2017 2018 2019 2020
Other
Latin America
Asia Pacific (other than China and Japan)
Japan
China
Europe, Middle East and Africa
United States
Total Revenues
Figure 6. Top Losses due to Covid-19 ($M)
Source: EvaluatePharma (2020, p.10)
-500
-450
-400
-350
-300
-250
-200
-150
-100
-50
0

11
Merck’s Key Products
Merck possesses a large product portfolio (Appendix 4), but it is worth mentioning
what is likely to become the top selling drug worldwide by 2026, Keytruda. It aims to
treat patients with skin cancer by detecting and fighting tumor cells. EvaluatePharma
World Preview (2021, p. 16) forecasts sales of $27bn in 2026, which represents the
double amount compared to its closest rival Humira.
It is undeniable that Merck does not rely on KEYTRUDA (Figure 6), as revenues
have also been bolstered by products like Lynparza, Lenvim and other animal health
products, but it is also undeniable that this product has an exponential potential
compared to others. FY2021 has been proving this point, as the company entered
in countless agreements to improve and distribute this product more efficiently.
Financial Highlights
Merck has been a stable company for the past five years, with revenues of $47.99Bn, an
operating EBITDA $9.5Bn, and a net income of $7.08Bn in FY2020. Although it represents
an increase when compared to the previous years, it was slowed down by the Covid-19
pandemic, when compared to FY2019.
Moreover, ROE accounted for 28% in FY2020, 37.7% in FY2019, 23.2% in FY2018 and only
7% in FY2017. The main drivers of this return are the ROA, financial leverage (Equity
Multiplier) and Net profit margin.
Net profit margin is identified as the main responsible for the low value of ROE in FY2017,
as it only accounted for 6%. The following three years show how low this value was. Thus, the
operating EBITDA Margin has also been the lowest in FY2017, with 18.4%. FY2018, FY2019
and FY2020 accounted for 22.8%,28.2% and 19.8% respectively. Consequently, the NOPLAT
is also reflecting this evolution, as margins accounted for 13.3% in FY2017, 17.9% in FY2018,
20.40% in FY2019 and 14.56% in FY2020.
Shareholder Structure
On the 21st of January 2021, the company reported having 104900 shareholders, 75.20% of
whom are Institutions, such as Investment Managers, Brokerage Firms, and strategic entities.
Having a 99.92% free float means that most of its shares are available to public trade and not
held by insiders, which is an important piece of information to current and possible future
shareholders. Despite being a global company, 61.69% of Merck’s investors are located in
North America, 12.12% in Europe and only 1.42% and 0.04% in Asia and Middle East,
respectively.
As of December 31, 2020, Merck had a total of 2.538Bn shares outstanding trading in the
New York Stock Exchange (NYSE). Figure 7 shows the stabilization of the payout policy and
the increase of annual dividends per share, which will keep increasing due to the companies
intends, 2019-2023 programs and recent agreements.
According to the Notice of Annual Meeting and Proxy Statement (2021, p. 8), the majority of
shareholders (92%) agreed to keep applying the “say-on-pay” model, which follows the
shareholder engagement policy. Despite the recent decrease in approvals, when compared
to the three previous years, the executive compensation and corporate governance programs
suffered minor changes and will keep prioritizing long-term shareholder value.
Overall, $7.5Bn of capital has returned to shareholders in FY2020, followed by an increase of
7% in quarterly dividends in January 2021.
At last, shareholders will see their total cumulative EPS reach levels of up to 67% in 2023 due
to the spinoff of Organon & Co in June 2021. The agreement was closed to acquire Alydia
Health and it costed $240M.
Dividend Policy
Dividends are included in the $7.5Bn capital returned to shareholders, with $2.668m paid in
dividends only to former Merck’s CEO. Annual dividend per share accounted for $2.48 in
FY2020 and will mostly reach $2.72 in 2025F and $2.90 in 2030F. This projection takes the
+9.48% CAGR and the +3.06% YoY of 2017-2020 period as an input to forecast those annual
payments to shareholders.
Figure 7. Annual Dividend per share/
Payout ratio
Source: Author Analysis
Figure 8. Clinical Expenditure
Source: EvaluatePharma (2020, p.13)
12
Moreover, capital allocation in FY2020 included dividends, proving how the creation of value
to shareholders value constitutes a core investment for the company.
Although the recent spinoff program may increase the EPS until 2023, the instability of the
market and the voting intentions of shareholders indicate a conservative and stable payout
policy of 90% for the next years.
Strategy
According to the Notice of Annual Meeting and Proxy Statement (2021, p. 45)
Merck’s strategy has 4 areas of focus to approach both short-term and long-term
horizons in order to increase revenues, performance unlocking then value to its
shareholders:
Scientific Breakthroughs: Development of Oncology, vaccines, and
investments in Hospital presence (including Health investments) are the core
areas where the company wants to use its research resources to improve both
products and probability of approvals. Advances in Phase 3 data from KN-581,
as well as Keytruda and Lynparza approvals, reinforce the importance and focus
on scientific research to strengthen the quality and dimension of products. A
range of vaccine approvals, advancements in Hospital support products/
treatments, and the new 17 approvals aligned with 4 key business transactions
in the Animal Health segment prove how active Merck is, in terms of advancing
the pipeline for these areas of focus.
Product Portfolio: Strong product portfolio drives revenues and keeps the long-
term sustainable growth secured. Revenue’s growth of 30% in Keytruda, 62% in
Lynparza, 43% in Lenvima, 6% in Gardasil franchise, 7% in Birdion and 10% in
Animal Health indicate future investments may be focused on these products and
areas. Positive returns in this range of products also guarantee a strong product
portfolio, due to the lack of dependence.
Capital Allocation: Merck’s strategy to reinvest its funds to create value for
shareholders is clear given the market conditions and the company’s strengths.
Priorities include reinvesting its earnings into R&D, Capital investments,
dividends, business developments and share repurchase. Capital investments
should reach $20Bn between 2020-2024 period.
Innovation: Nowadays, Merck is forced to enter in acquisitions agreements and
strategic collaborations to keep a differentiated science approach. Acquisitions of
ArQule and VelosBio followed by a strategic alliance with Seagen in 2020 helped
the $10.6Bn expenditure in business development investment. Altogether, Merck
entered in more than 100 transactions just in 2020 to reach competitive levels of
innovation and differentiation.
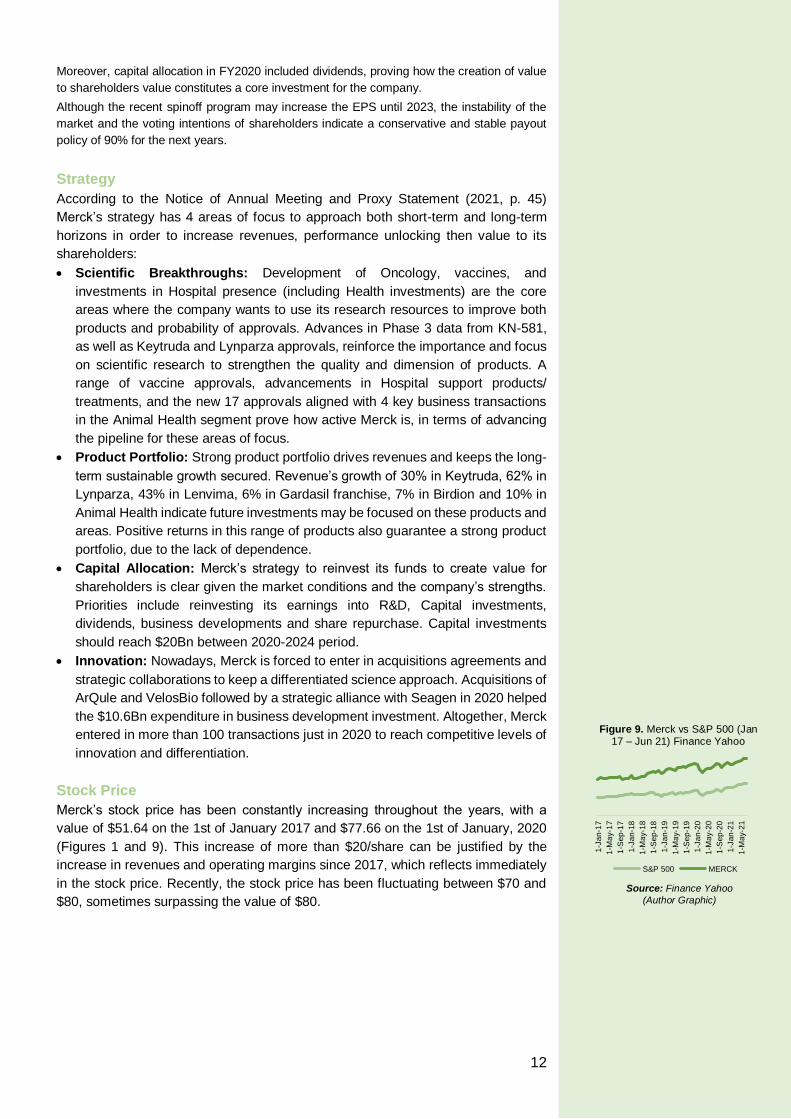
Stock Price
Merck’s stock price has been constantly increasing throughout the years, with a
value of $51.64 on the 1st of January 2017 and $77.66 on the 1st of January, 2020
(Figures 1 and 9). This increase of more than $20/share can be justified by the
increase in revenues and operating margins since 2017, which reflects immediately
in the stock price. Recently, the stock price has been fluctuating between $70 and
$80, sometimes surpassing the value of $80.
1-J
an
-17
1-M
ay-1
7
1-S
ep
-17
1-J
an
-18
1-M
ay-1
8
1-S
ep
-18
1-J
an
-19
1-M
ay-1
9
1-S
ep
-19
1-J
an
-20
1-M
ay-2
0
1-S
ep
-20
1-J
an
-21
1-M
ay-2
1
S&P 500 MERCK
Figure 9. Merck vs S&P 500 (Jan 17 – Jun 21) Finance Yahoo
Source: Finance Yahoo
(Author Graphic)
13
3. Management and Corporate Governance
Governance Model and Recent Events
Merck is ruled by a board of directors and an executive board that have the mission
to foresee the risks that can damage the company and guarantee an effective and
sustainable strategic direction. Mr. Kenneth C. Fraizer has step down as Chief
Executive Officer (CEO) on July 1, 2021, after spending 10 years in this role. Mr.
Fraizer joined the company in 1992 and served as the Senior Vice President from
1999 to 2006. His transition to CEO, chairman and President of Merck occurred in
2011 and since then he has also been a director of Exxon Mobil and PhRMA, and a
member of Board of Overseers of Weill Comell Medicine and Trustee of Cornerstone
Christian Academy. As for now, Mr. Fraizer is still actively involved as the executive
chairman of the company’s board of directors.
A new era has arrived with the new president and CEO Mr. Robert (Figure 10).
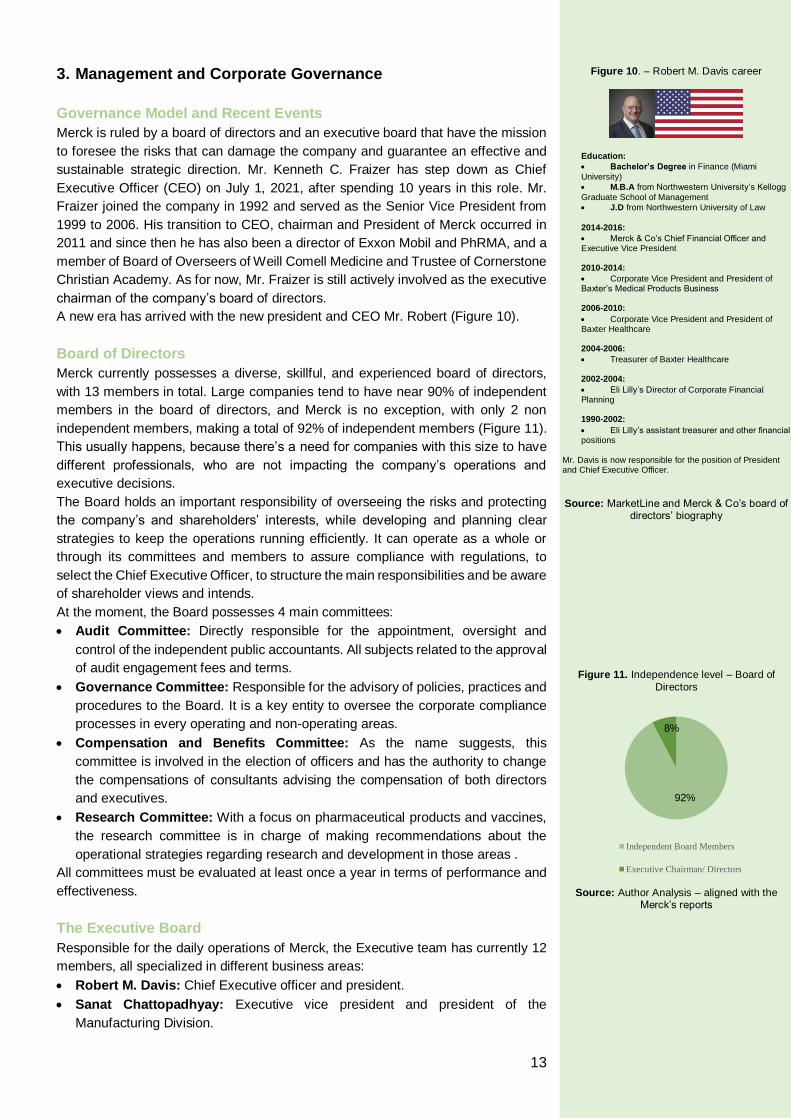
Board of Directors
Merck currently possesses a diverse, skillful, and experienced board of directors,
with 13 members in total. Large companies tend to have near 90% of independent
members in the board of directors, and Merck is no exception, with only 2 non
independent members, making a total of 92% of independent members (Figure 11).
This usually happens, because there’s a need for companies with this size to have
different professionals, who are not impacting the company’s operations and
executive decisions.
The Board holds an important responsibility of overseeing the risks and protecting
the company’s and shareholders’ interests, while developing and planning clear
strategies to keep the operations running efficiently. It can operate as a whole or
through its committees and members to assure compliance with regulations, to
select the Chief Executive Officer, to structure the main responsibilities and be aware
of shareholder views and intends.
At the moment, the Board possesses 4 main committees:
Audit Committee: Directly responsible for the appointment, oversight and
control of the independent public accountants. All subjects related to the approval
of audit engagement fees and terms.
Governance Committee: Responsible for the advisory of policies, practices and
procedures to the Board. It is a key entity to oversee the corporate compliance
processes in every operating and non-operating areas.
Compensation and Benefits Committee: As the name suggests, this
committee is involved in the election of officers and has the authority to change
the compensations of consultants advising the compensation of both directors
and executives.
Research Committee: With a focus on pharmaceutical products and vaccines,
the research committee is in charge of making recommendations about the
operational strategies regarding research and development in those areas .
All committees must be evaluated at least once a year in terms of performance and
effectiveness.
The Executive Board
Responsible for the daily operations of Merck, the Executive team has currently 12
members, all specialized in different business areas:
Robert M. Davis: Chief Executive officer and president.
Sanat Chattopadhyay: Executive vice president and president of the
Manufacturing Division.
Figure 10. – Robert M. Davis career
Education:
Bachelor’s Degree in Finance (Miami
University)
M.B.A from Northwestern University’s Kellogg
Graduate School of Management
J.D from Northwestern University of Law
2014-2016:
Merck & Co’s Chief Financial Officer and Executive Vice President 2010-2014:
Corporate Vice President and President of Baxter’s Medical Products Business 2006-2010:
Corporate Vice President and President of Baxter Healthcare 2004-2006:
Treasurer of Baxter Healthcare 2002-2004:
Eli Lilly’s Director of Corporate Financial Planning 1990-2002:
Eli Lilly’s assistant treasurer and other financial positions
Mr. Davis is now responsible for the position of President and Chief Executive Officer.
Source: MarketLine and Merck & Co’s board of directors’ biography
Figure 11. Independence level – Board of
Directors
Source: Author Analysis – aligned with the
Merck’s reports
92%
8%
Independent Board Members
Executive Chairman/ Directors

14
Frank Clyburn: Executive vice president and president of the Human Health
Division.
Richard R. DeLuca, Jr.: Executive vice president and president of Animal Health
Division.
Cristal N. Downing: Executive vice president and chief of communications and
public affairs officer.
Julie Louise Gerberding: Chief patient officer and executive vice president,
responsible for the Population Health and Sustainability Division.
Michael A. Klobuchar: Executive vice president and chief strategy officer.
Dean Y. Li: Executive vice president and president of research facilities.
Caroline Litchfield: Executive vice president and chief financial officer.
Steven C. Mizell: Executive vice president and chief of human resources.
Dave Williams: Chief information and digital officer.
Jennifer Zachary: Executive vice president, general counsel, and corporate
secretary.
Long-term incentives aim to increase +$500000 for Sanat Chattopadhyay and
+$150000 for Jennifer Zachary, with an annual base salary increase between 1.8%
and 13.8% in the Named Executive Officers of 2020.
ESG Metrics
ESG metrics is a framework that companies use to assess how environmental, social
and governance issues are being managed. The commitment to identify and reduce
greenhouse gas emissions and water use by 2025 is a priority for Merck, but there
are also other commitments that need to be addressed. The company recognizes
the access to health, environmental sustainability, employees, ethics, and core
values as the 4 main areas of focus.
Access to health aims to provide access to medicine, to ensure product quality and
safety, and also to tackle public health risks. According to the company’s ESG
progress report (2020/2021) there is an intend to provide health to 30 million people
of low- and middle-income countries (social investments in underprivileged U.S
population is included) by 2025, which will allow the company to reach at least 75%
of the global population and will also unlock value through partnerships and
innovative opportunities.
For employees, the goal appears to be focused on diversity, especially in higher
positions where Merck defines the clear objective of maintaining or increasing the
current inclusion index by 2025.
Moving on to environmental sustainability, greenhouse gas emission reduction sets
itself apart from other intentions due to the commitment established in 2019 to
achieve in 2030. This goal aims to reduce 30% in Scope 3 greenhouse gas emission
and 46% the operational greenhouse gas emission. Carbon neutrality and 100% of
renewable electricity by 2025 is also an expansion to take into account.
At last, ethics and values are aligned with the compliance to regulatory requirements
and the freedom of speech within employees.
Although the projects and future prospects regarding ESG are clear and positive, it
is crucial to evaluate how Merck & Co is actually performing for the past years in
terms of score. According to table 3 the ESG combined score for 2019 was B-, which
represented a downgrade comparing to 2018 (Score: B). The standard ESG score
was A- in 2019 and has not been changed since 2016. This can be explained by a
low score in environmental innovation (D-) and an extremely positive score in
emissions score (A+). The company reported environmental fines in 2019 of $17690
and a freshwater withdrawal of $20320000.
Figure 12. Business and Shareholder Value
Creation
Source: 2021 Notice of Annual Meeting and Proxy Statement
Table 3. ESG Scoring
Source: Bloomberg (Author Table)
ESG 2016 2017 2018 2019
Environmental Innovation Score D- D- D- D-
Emissions Score A A A+ A+
ESG Combined Score B B- B B-
ESG Score A- A- A- A-
Environmental Pillar Score B+ B+ B+ A-
Social Pillar Score A+ A+ A+ A+
Governance Pillar Score B+ B+ B- B
ESG Controversies Score C+ C- C+ C
Resource Use Score A- A- A- A+

15
4. Industry Overview and Competitive Positioning
Industry Overview
The pharmaceutical industry represents one of the largest industries within the
healthcare sector, with a range of subcategories that can go from development,
marketing and production of prescription medicines, vaccines, biologic therapies to
prevention of rare and chronic diseases. Innovation driven mainly by R&D has been
pushing the industry further and increasing the volume of investments. Hence,
revenues are also following this pattern and competition is getting higher by the
second. To support this characterization of the industry, EvaluatePharma reports
from 2020 and 2021 that predict a CAGR of 3.2% until 2026.
Despite the decrease in revenues due to Covid-19, the long-term growth is
reassured by the way the industry operates via innovation. Additionally, this
pandemic has also opened up new investment opportunities for companies, not only
by the development of vaccines, but also in prevention and treatment, which is
crucial for human health.
Major Trends
All data available suggests the industry will not only maintain, but also increase the
focus on specialized treatments affecting smaller groups of population. Generic
drugs commercialized to large groups of people are not adding the value they used
to add to large pharma companies, due to the increasing number of substitutes and
the pursuit of more effective treatments to severe diseases. In addition to this, prices
dropped in result of the pricing pressure applied by governments, reducing returns
and forcing companies to find solutions. Those solutions include heavy investments
in R&D to improve effectiveness, returns and faster results. Artificial intelligence,
collaborations and long-term projects will dominate the agenda of every big
pharmaceutical company for the foreseeable future.
Economic (Global) Outlook
According to OECD statistics, the percentage of GDP spent on healthcare will easily
surpass the average of 9%, Markets and economies like Germany, Italy, the UK,
Italy, and Australia already saw this indicator grow at least 1%.
Negative impact in growth and unemployment rates are still in present in 2021, but
it is fair to state that almost every country is finding a way to bounce back this
numbers.
Europe Economic Outlook
According to the International Monetary Fund (IMF), the global economy is climbing
out from the depths to which it had plummeted during the Lockdown that sticked the
world. Europe area was severely hit by this in March/April marking one the harshest
quarters in the last years, with a GDP growth rate decrease of 11.6% in the
correspondent quarter (Quarter 2, 2020). Shutting down economies, Brexit and other
government restrictions were the main cause for this abrupt reduction, which was
even worse in the UK, where the GDP growth rate fell 19.5%. It is also worth
mentioning the fall of 3.1% in employment rates and the negative inflation rates
recorded in the third and fourth quarter, with -0.03% and -0.28% respectively. After
Brexit, Europe shows to be highly dependent on markets like Germany, France,
Spain, and Italy, which can help the recovery in 2022.
Figure 13. World Population
Source: OECD Dataset
Figure 14. World Elderly Population
Source: OECD Dataset
Figure 15. Worldwide Prescription Drug Sales in 2026
Source: EvaluatePharma (2021, p.19)
Figure 16. Total Pharmaceutical R&D Spend ($BN)
Source: EvaluatePharma (2021, p.23)
0.00%
0.20%
0.40%
0.60%
0.80%
1.00%
1.20%
7,000,000,000.0
7,500,000,000.0
8,000,000,000.0
8,500,000,000.0
9,000,000,000.0
201
7201
9202
1F
202
3F
202
5F
202
7F
202
9F
World Population CAGR
0.00%
1.00%
2.00%
3.00%
4.00%
5.00%
6.00%
0.00
200,000,000.00
400,000,000.00
600,000,000.00
800,000,000.00
1,000,000,000.00
20
21
F
20
22
F
20
23
F
20
24
F
20
25
F
20
26
F
20
27
F
20
28
F
20
29
F
20
30
F
65 and ove CAGR
59.3 54.1 53.9 49.9 47.6 43
010203040506070
0.00%
2.00%
4.00%
6.00%
8.00%
10.00%
-40
10
60
110
160
210
260
201
7
201
8
201
9
202
0
202
1
202
2
202
3
202
4
202
5
202
6
R&D expenditure % Change

16
USA Economic Outlook
The importance of the United States, alongside China and Japan, is huge for the
pharmaceutical industry, as the three nations represent the top 3 markets globally.
China has been growing at the fastest pace, but the US still holds the badge for the
largest market, due to not only its size, but also the attractiveness for new drugs.
projects and other sources of business related to healthcare. Despite the recent
pricing pressure, the United States measures to be a reasonable free market to
healthcare. USA GDP felt the pandemic effect in the second quarter of 2020
registering a growth of only 0.36%, which is severe for a economy of this size. In this
quarter the recession made the economy contract 31.4% resulting in a significant
unemployment increase. For the foreseeable future, all economies should expect
huge positive shifts in 2022, followed by a stabilized growth of GDPs. According to
OECD Statistics, the USA economy should expect inflation rates to surround 2% for
the next 5 to 10 years. This makes sense not only because the inflation rate for the
first quarter of 2021 accounted for 4.85%, as result of the low inflation rates in 2020,
but also because pre-pandemic inflation rates were close to 2%. It is interesting to
mention how Japan and China can bolster the US market, due to the investment
opportunities for biopharmaceutical companies, as well as the demographic
conditions and governmental investments, that have been heavily increasing.
Covid-19 Impact
McKinsey highlights Globalization, China influence, innovation and digitalization as
the speeding trends boosted by this new crisis. Separate these terms from
pharmaceutical companies is impossible, as R&D and M&A activities are increasing
year-over-year for the last decade.
Despite how economies are going back to normal again, Covid-19 left long-lasting
marks in companies, and the temporary stagnation in R&D returns and the delay of
the implementation of new technologies are still affecting Merck and its peers.
Environmental concerns and sustainable intends were also postponed due to the
sudden needs in demand and supply globally. The heavy reliance on China for raw
materials, intermediates and APIs is a concern that arose with the crisis, and supply
chains were extremely pressured by this condition.
While the risk for pharma companies making branded products is lower, given that
they have several months of safety stock in APIs, some changes should be taken
into consideration such as assessing existing relationships with suppliers,
establishing inventory adjustments, and looking for opportunities to diversify supply
in the event of business interruption.
Another aspect that is changing is the way digital interaction is increasing, which also
represents a challenge in this industry, as companies will need to review the way
they deal with some products in their portfolio.
To conclude, people are now more skeptical towards hospital visits, but they are
willing to take actions in order to prevent their health, which can be an opportunity
for companies to invest in apps and other platforms to interact digitally with patients
Demand and Supply
In figure 4 and following the EvaluatePharma 2020 and 2021 forecasts, the demand
in prescription of medicines is, and will be growing at a positive pace. With an
expected CAGR of 6.05% from 2021 to 2025 Merck and other pharmaceutical
companies can expect their sales to keep growing for the next 5 to 10 years. The
economic and demographic shift (ageing population) have caused an increase in
chronic diseases, government expenditures on health, stressing the need for new
treatments and new ways of prevention. As stated before, the world population is not
only growing, but also becoming older, particularly in the European and North
Figure 17. GDP Growth
Source: IMF
Figure 18. Inflation CPI (%YoY)
Source: IMF
-10%
-5%
0%
5%
10%
15%
-20.00%
-15.00%
-10.00%
-5.00%
0.00%
5.00%
10.00%
15.00%
20.00%
Chin
a
De
ve
lope
d C
ountr
ies
Japan UK
United States Euro Area
OECD -Total China
-1.00%
0.00%
1.00%
2.00%
3.00%
4.00%
5.00%
-1.00%
-0.50%
0.00%
0.50%
1.00%
1.50%
2.00%
2.50%
3.00%
20
19
Q1
20
19
Q2
20
19
Q3
20
19
Q4
20
20
Q1
20
20
Q2
20
20
Q3
20
20
Q4
20
21
Q1
Chin
a
Deve
lop
ed
Co
un
trie
s
Japan UK
United States Euro Area
OECD -Total China

17
American market. Merck’s operations are focused in these two markets, and with the
increase of new diseases and new chronic problems, the company can look forward
to an increase in demand.
As these new trends grow, boosted by the Covid-19, studies indicate an increase
upon 50% in some countries, which will contribute to a higher demand for
pharmaceutical companies.
On the other hand, exchange rates are affecting the supply, due to the direct impact
it has on revenues, costs, and final profits. Hedging activities represent an effective
strategy for companies to follow in order to mitigate this risk.
Another driver of supply is the patents, that assure the company a
stable a strong source of revenues, due to the exclusivity rights that they confer. An
average of 3.2% of the market is estimated to be at risk for the next 5 years.
Key Drivers of Profitability
Before breaking down the main key drivers of profitability of Merck, it is important to
look back in time to understand how drug pricing and R&D have been impacting the
industry. It is also extremely crucial to evaluate of how Covid-19 will affect these two
variables and the industry as a whole.
Life expectancy aligned with the aging of population, R&D, M&A activities, and
Patents detach from other variables as the major drivers of profitability.
Governments’ investments and restrictions to price have been dominating the
industry’s agenda and causing pressure on supply chains, R&D and Patents
disputes. These three drivers are also being affected by the pandemic, due to the
need of immediate vaccines, treatments, and other sources of healthcare support.
Companies fight for an interesting market position as soon as opportunities like
Covid-19 appear, which increases competition and stresses the need to invest more
in R&D and technology to get quick outcomes.
Life expectancy/Aging of population: Shifts in demographic have been
shaping new trends and forcing countries to spend more in health. Merck
operates in large countries with different conditions, but the focus on Europe,
China/Japan and the USA guarantee a support for the future, as revenues and
profits can be bolstered by every subcategory related to chronic diseases, cancer,
and so on. The prevention of these diseases related to the long-life expectancy
also guarantee growth, especially in a company like Merck that tackle a wide
range of these preventions and treatments.
R&D: The long development of new medicines can result in delays in study
initiation, leading to increasing costs. On the other hand, these studies are
necessary to ensure a competitive drug classification and to boost the likelihood
of obtaining a good quality medicine. Since Merck’s foundation, R&D
investments, agreements, and setbacks have been taking part in every fiscal
year. This is the main key driver of costs and profitability, and recent studies
indicate a non-stop growth on this type of activity. This is also a driver that relies
heavily on approvals and patents, which will constantly generate risks. One prime
example of an area that carries both high costs and returns is Oncology. This
area is one of Merck’s main areas of focus, and clinical developments account
for $82Bn according to EvaluatePharma, which can generate $188.2Bn. These
numbers are not seen in other areas and Merck’s recent agreements,
collaborations and investments in Oncology and R&D research facilities indicate
that the company will keep exploring this area. To sum up, this is the key driver
of profitability and costs, which will keep feeding up the industry in the long-term
for what it also represents to human life.
M&A activities: The wide range of areas within this industry stress the urge for
companies to constantly enter in mergers and acquisition deals. This guarantees
Table 4. Global Exchange Rates
Year Exchange
Rate (€/$)
2015 1.1095
2016 1.1068
2017 1.1320
2018 1.1810
2019 0.8929
Source: MarketLine – Merck & Co., Inc. (Published: 14 Jun 2021)
Highlights
Worldwide prescription drug sales grow at
+6.4% CAGR between 2021 and 2026.
Abbvie to lead worldwide prescription sales in
2026, with $59.3Bn.
Keytruda to be the top-selling product in 2026
with global sales of $27Bn and a 11% CAGR.
Oncology prevails as the largest therapy area
in 2026, accounting for 22% of prescription
drug sales that year.
Worldwide Pharma R&D spend to grow at an
annualized rate of 4.2% to $254Bn in 2026,
with Roche as the biggest investor at $14Bn.
The highest valued R&D project, ranked by
NPV, is Eli Lilly’s tirzepatide, at close to $22Bn.
Patent expiries will put $226Bn in worldwide
prescription drug sales at risk between 2021
and 2026.
Source: EvaluatePharma (2021, p.16)
Figure 19. Inflation CPI (%YoY)
Source: EvaluatePharma (2021, p.22)
0.00%
1.00%
2.00%
3.00%
4.00%
5.00%
6.00%
0
10
20
30
40
50
60
2021 2022 2023 2024 2025 2026
Total Sales at Risk ($Bn)
Expected Sales Lost ($Bn)
%Market at Risk

18
a greater market share, and it also mitigates some risks, However, there is some
risk associate with it, especially when acquired companies are hugely
undervalued, which can impact Merck’s market value. One way to also reduce
the risk of these activities, is to enter into research collaborations, as Merck did
with Maverick Therapeutics and Surface Oncology.
Patents: Competition regarding patents approvals and expiration is complex, as
different markets offer different conditions. Differences can also include
governments pressure to reduce generics and patented drugs, which did not help
Merck’s revenues in 2019 and 2020 and will not help in the future. This is highly
connected to R&D, but it does represent a key driver of profitability due to the
competition and the advantages that come with patents.
PESTLE Analysis
Constant change and fast paced societies are shaping and creating new external
factors that will impact all companies, which will have to spend time to evaluate those
changes and how can they influence growth and returns.
Legal Framework of the Industry
Patents are the most important asset in pharmaceutical industry, as they provide to
each company exclusivity on their products.
The process of launching and maintenance of a medicine in the market, as it is
shown in the Figure 20, can be changed according to each country or geographical
region.
In U.S., it is strictly centralized and made by FDA approvals, that has role to give the
marketing authorization for the medicines. The costs of each FDA approval vary
depending on the area, as stated before.
In Europe, the process can be made by EMA or by National authorities, dependent
of the territory that they will be sold, EU territory or nationally.
POLITICAL ECONOMIC SOCIAL
Political changes, focus,
restrictions and pressure
on health industry;
Price regulation;
Worldwide crisis;
Changes in GDP,
unemployment rate, tax,
and environment;
Growth in investment in
healthcare per capita;
Reduction in consumer
income;
Price pressure;
More social awareness
and social concern;
Growth in aging
population;
Culture shifts;
Increasing of chronic
diseases;
TECHNOLOGICAL LEGAL ENVIRONMENTAL
More innovation and
technological
developments will affect
the services provisions,
customized treatments,
and the marketing of
products;
New digital opportunities
(apps, social media);
Innovation in biotech;
Machine learning
evolution;
High regulatory and
legislative restrictions;
Changes in advertising
laws;
More awareness
worldwide to
environmental issues,
such as pollution and
waste;
Table 5. PESTLE Analysis

19
The principal criteria that all medicines must have when applying to marketing
authorization are quality, safety, efficacy, and a positive-risk balance.
Figure 20. Launching and maintenance process of medicines in the market.
Peer Group
Merck operates in one of the most competitive industries worldwide with huge
number of major players. Although it can be straightforward to identify the top ten
companies in this realm, based on revenues, there is a need to define the company’s
peer group.
The following table represents Merck’s peer group:
Company
Name Ticker
Market
Cap
(Equity
Value)
Revenues Share% Country ROE D/E
Merck Sharp
and Dohme MRK 185246 46840 13.93% USA 27.59% 115.99%
Abbvie Inc ABBV 188169 45804 13.62% USA 188.25% 623.85%
Eli Lilly and
Co LLY 222969 24539.8 7.30% USA 150.18% 234.89%
Pfizer Inc PFIZ 250675 41908 12.46% USA 11.05% 57.85%
Bristol-
Myers
Squibb Co
BMY 138016 42518 12.65% USA -20.16% 123.07%
Amgen Inc AMGN 123065 25424 7.56% USA 76.13% 350.17%
Johnson &
Johnson JNJ 433833 82584 24.56% USA 23.49% 51.06%
AstraZeneca
PLC AZN 186695 26617 7.92% UK 22.23% 139.51%
Comparative Analysis
The peer group selected represents some of the Health and Healthcare Industry
leaders, which have been focusing on similar areas. Each area is approached
differently from each company, but every approach seems to be aligned with this
idea of innovation and sustainability, boosted by R&D. Innovation has certainly been
Research & Development
Manufacturing Data Tests & Evaluations
Manufacturing Authorization &
Sales
Product Monitorization
Table 6. Peer Group (Source: Bloomberg)

20
an even more crucial topic nowadays due to this new pandemic of Covid-19, which
requires a transformation in the companies’ business models. To understand the
dynamics in this industry, two companies of this peer group were chosen to compare
with Merck: Pfizer and Johnson & Johnson.
Peers Strategies
The variety of healthcare products and services require high risky investments in
R&D, and the constant need for innovation drives every company’s operation model
in this peer group. Knowing Merck strategy and areas of focus, it can now be
compared with Pfizer and Johnson & Johnson.
For Pfizer, the main focus lies on internal medicine, rare diseases, inflammation &
Immunology, vaccines and oncology. The main strategy here is to provide the best
services and products in each area with transparency, sustainability and with a
sense of care for the global health.
At last, Johnson & Johnson narrow their operations to consumer health products,
medical services, and pharmaceutical products. Seemingly to the other companies
J&J also wants to reduce the ecological footprint as they are willing to spend 800
million dollars for that purpose.
For a better understanding of the similarities and differences between the three
companies, a SWOT analysis is assessed to balance and weight the main points.
Strenghts
•Strong brand presence;•High product
diversification;•Covid-19 Vacine
Developments;•Scaled up
manufacturing capacity;•Strong R&D deparment;
Weaknesses
•Unethical operations;
•Overdependence on successful products;
Opportunities
•Expansion through M&A;
•Focus on emerging markets;
Threats
•Exchange Rate Risks;
•Pricing pressure;
•Patent risk;
•Manufacturing operation delays;
•Counterfeit products;
Figure 21- Swot Johnson &Johnson

21
SWOT Analysis of Merck
The SWOT analysis allows the investor to understand the dynamics between the
major strengths and weaknesses, as well as the possible opportunities and threats.
With this information, it is possible to check which risks are affecting the strengths,
and which ones can damage both strengths and opportunities. Merck & Co., Inc is
part of the pharmaceutical industry in different areas, with multiple locations
worldwide. This global presence, the financial performance and high returns, the
R&D, and product portfolio can easily be identified as the major strengths in the
company. Although these strengths can differ from the other three classifications in
a SWOT analysis, there is a huge connection, due to the risk of this type of industries.
Weaknesses include the dependency on key products, patents, legal risks, and the
high level of competition within the industry. As for the opportunities, the company is
already exploiting some of them for the last years. Corporate and strategic
agreements, acquisitions, and the emerging markets are the major opportunities that
can unlock value and provide a sustainable growth.
Similar to the weaknesses, the threats are mainly related to the nature of the industry
and the risks that come with it. The difference has to do with the animal health
industry, which can represent a future threat.
Strenghts
•Strong brand presence;
•High product diversification;
•Strong R&D department;
•Covid-19 vacine Developments;
Weaknesses
•Legal risks (Fraud involvment);
•High competition;
Opportunities
•Ability to apply new approaches to broader product development;
•M&A activity;
Threats
•Exchange Rate Risks;
•Pricing pressure;
•Patent risk;
•Manufacturing operation delays;
•Counterfeit products;
Figure 22. Swot Pfizer

22
Strengths
Worldwide presence represents an important operational advantage, as the
dependence level on a specific region decreases and the customer base increases.
As stated before, Merck had 44% of its operations in the US, 28% in Europe, Middle
East and Africa (EMEA), 7% in China, 7% in Japan, 6% in Asia Pacific, 5% in Latin
America, and 3% in Other Locations, which proves the wide range of locations,
leading to performance and profit opportunities as well.
R&D is the major key driver of profitability for Merck, and recent events has shown
how much the company has been investing. The recent investment in Nebraska, the
15600 people employed in 2019, and the other facilities in Switzerland, China, New
Jersey, Pennsylvania, California, and Massachusetts reinforce how much Merck
recognizes this business component as a major strength. The aim is to keep and
enlarge its product and patent portfolio, improve probability of success in the different
research programs conducted, and also protect the company from competition. In
FY2020 R&D accounted for 28.25% if the total sales, which is massive increase
when compared to the previous fiscal year. This value will not decrease in the future.
Financial performance and high returns are extremely important for investors and
Merck’s market value. Net Operating profit as been growing at a positive pace,
excluding FY2020 which has suffered the impacts of Covid-19. This financial
strength has been bolstered by products such as Keytruda, Lynparza, Lenvima, and
other animal health, and will allow the company to generate higher returns for
shareholders and to reinvest its profits to other growth opportunities. Net income
decreased in FY2020 compared to FY2019, but both values represent a huge
increase from FY2018 and FY2019.
Figure 23. Swot Merck
Strenghts
• Global Presence;
• Financial Performance and High returns;
• Strong R&D;
• Diversified product portfolio.
Weaknesses
• Dependency on key products;
• Legal risks;
Opportunities
• Emerging Markets;
• Corporate and Strategic Agreements;
• M&A activity
Threats
• Animal health Industry uncertainty;
• Pricing pressure;
• Patent risk;
• Risk and competition of the industry;
• Manufacturing operation delays;
• Counterfeit products.

23
Weaknesses
Having key products such as Keytruda. Janumet. Gardasil, and Bridion is an
advantage that generates positive cash flows for the company. However, this
dependency on key products also means an exposure that can harm Merck if any
negative event regarding any of these products occur. For instance, any patent
expiration, manufactures delays, side effects, and competition are some of the
events that can negatively impact Merck’s operating cash flow. Moreover, the legal
risks can also be described as a weakness due to high restrictions applied by some
markets.
Opportunities
Merck can expect a constant growth for the global pharmaceutical market, including
new emerging markets for the next years. Additionally, the Asia-Pacific area can also
represent a huge opportunity for the company, as one third of the world population
lives in this specific region. Corporate and strategic agreements will unlock value for
the company, as it enables Merck to enter into these new emerging markets, while
maintaining a keeping its position in the other markets where it already operates. For
example, in November 2020 Merck secured an approval from the European
Comission for cancer treatments with an agreement made with AstraZeneca in
Lynparza product. In addition, M&A activity will also enable these types of
achievements in other emerging markets.
Threats
Besides all threats inherent to all companies in this industry, such as patent risk,
pricing pressure, manufacturing delays, intense competition and counterfeit
products, there is one that can be identified as Merck’s specific threat at the moment.
This threat is the Animal health industry uncertainty, that can impact the total sales
of the company due to a variety of risk factors. Outbreak of diseases shifts in animal
consumption and demand, or unexpected vaccines requirements can severely
damage this segment and affect operating results. Furthermore, these events will
increase as the company grows in this market.
Five Forces Analysis
This section aims to study the company’s competitive environment, by analysing the
buyer and supplier power, the degree of rivalry, the new entrants, and the possible
substitutes. Determining the buyers and suppliers in Merck’s industry can be
challenging and require a careful analysis, due to the dimension of the
pharmaceutical market.
Buyers Power – MEDIUM HIGH (4)
Bargaining power of Buyers in this industry is relatively strong, since it includes all
powerful private institutions operating in the market, and governance forces that
have been controlling regulations, prices, and taxation. This is no surprise as the
industry deals with most precious asset of human life, healthcare.
- Acquisition of expensive equipment, clinical testing services, drugs, and
other materials. These acquisitions are often conducted by a small group of
large public and private institutions (e.g., National Health Service in the UK,
Figure 24. Global Pharmaceuticals market geography segmentations:
% share, by value, 2019
Source: MarketLine – Merck & Co., Inc.
(Published: 14 Jun 2021)
Figure 25. Global Pharmaceuticals market
share, % share, by value, 2019 (Merck is included in other with a market share of
3.948% in 2019.
Source: MarketLine – Merck & Co., Inc.
(Published: 14 Jun 2021)
Figure 26: Global Pharmaceuticals market share: $ billion, 2015-2019 and Forecast 2019-
2024
Source: MarketLine – Merck & Co., Inc.
(Published: 14 Jun 2021)
\
38.70%
28.90%
23.10%
2.50%6.80%
United States Asia-Pacific
Europe Middle East
Rest of the World
7.40%
5.40%
5.20%
5.20%
76.80%
Johnson & Johnson Bayer
Novartis Pfizer
Other
0.00%
1.00%
2.00%
3.00%
4.00%
5.00%
6.00%
7.00%
8.00%
$950,000.00
$1,000,000.00
$1,050,000.00
$1,100,000.00
$1,150,000.00
$1,200,000.00
$1,250,000.00
2019 2020 2021F 2022F 2023F 2024F
Global pharmaceuticals market value YoY
24
CVS Corporation, etc.…), which increases the buyer power not only
because of their size, but also because public institutions are adopting price
control strategies.
- Financial strength can explain the first point, as the largest companies like
Merck and public institutions are the only ones capable of purchasing large
and expensive quantities of drugs and other healthcare products. This was
on display during the handling of Covid-19 vaccines all over the world, where
small independent companies were not able to dispute this.
- Progress and innovation in medicine has been modifying switching products,
mainly due to new treatments that can replace existing products. The price
of these treatments will require huge investments from companies, resulting
in a high switching cost. Given this, it is fair to state that switching costs are
no longer low in this industry. This also applies to Merck, as the importance
of Oncology is growing for the last ten years.
- Following the last point, tendency to switch between products and services
has also been increasing, as new information about side effects, new
treatments and new developments strikes the market.
Supplier Power - MEDIUM HIGH (4)
Although BASF, Bayer and DowDuPoint can be identified as three of the leading
suppliers of raw materials, large pharmaceutical companies like Merck tend to
manufacture a lot of their APIs, chemicals and raw materials to reduce high reliance
on suppliers and to ass value to the company. However, small companies do not
have enough resources to fund their own manufacturing of these materials, which
will give more power to suppliers.
Any pharmaceutical company trying to enter and compete in this market
needs to find the best quality/cost relation, which will imply high investments.
Covid-19 can be a turning point as it forced companies to reevaluate their
dependency on suppliers, leading to new investments to mitigate this
condition. If Merck and other companies start to produce these materials,
suppliers’ power might be reduced, but as for now, it remains quite high. In
addition. quality versus cost relationship is quite similar within major
suppliers, which might slightly reduce their power,
Merck might consider this power as moderate, due to its size, but the reality
changes when a new specific event like Covid-19 takes place, where
companies struggle to find a specific supplier.
New Entrants – WEAK (2)
The top 10 pharmaceutical companies have been operating for more than 70 years,
and new companies have established themselves through alliances, mergers and
even acquisitions. It is an extremely hard industry to enter, and the following reasons
might explain why:
Regulators like Health Sciences Authority in Singapore and FDA will restrict
the entry of new players, especially start-ups with lack of up-front
investment. Even if a new start-up possesses funds to cover those initial
investments, there are still initial approvals a regulatory process that are
time-consuming. The probability of new competitors entering the market is
heavily impacted by these restrictions.
On top of that, recent markets like China and the US are putting pressure to
reduce prices, which will impact the overall returns of all companies

25
competing in those locations. Hence, new entrants will not be able to grow
their earning, as the returns on drugs and other products is significantly
reduced by this pressure.
Finally, the recruitment process for start-ups is tougher due to the education
required, and the salaries that come with it.
To sum up, the threat of new entrants is low not only because of market
conditions, but also because of barriers and time-consuming procedures.
Threat of substitutes – HIGH (4.5)
Despite the low threat of new entrants, patients still have the chance to choose
between a variety of drugs, treatments, and other medicines from different
established big pharmaceutical companies, as a result of the high competition in the
market. This is currently a trend, given the different genetic individual characteristics,
which will force patients to switch from one product to another. The main reasons
behind the current high threat of substitutes in the market are as follows:
Counterfeit drugs: Up to 50% of drugs sold online can be fake, and countries
like Russia can also have up to 27% of fake drugs on actual pharmacies.
This is not applied to the U.S or Europe, but it still represents a substitute for
companies like Merck, that are trying to expand their business in poor
nations as well.
Manufacturers of generics: Manufacturers can set much lower prices than
branded drugs, due to the reduced costs of clinical tests.
Old traditions: Modern medicine has discovered new ways of treatment and
innovative products, but there are still old myths related to some diseases
that prevail in Asian countries. People might choose to treat a severe
disease with animal food or some traditional drink instead of investing in a
new modern pharmaceutical product. Companies are hugely affected as
investments on new discoveries are extremely expensive.
Degrees of rivalry – MODERATE HIGH (3.5)
As seen before, Healthcare industry is dominated by a small group of companies,
followed by smaller biotech companies. Companies need to collaborate with each
other to bare the price of some drugs, and sometimes a group of specialized players
compete against another group. This type of competition results in a moderate high
level of rivalry. Some of the reasons behind this moderate level of rivalry are:
Incentive to buy smaller companies: Mergers and acquisitions allow big
pharmaceutical companies, such as Merck, Pfizer, AstraZeneca and
Johnson & Johnson, to eliminate potential rivals. So, despite the large size
of the top 10 pharmaceutical companies, this rivalry will tend to be between
those 10 large companies, as new rivals will most likely be acquired or will
just simply enter in a merge agreement. Patent expiration ca be viewed as
one of the reasons for this recent trend of acquiring new smaller innovative
companies.
It can be acceptable to categorize this section as high or strong, but the barriers of
entry will slightly reduce the degree of rivalry to moderate high, as the number of big
pharmaceutical companies will most likely not change in the short-term.
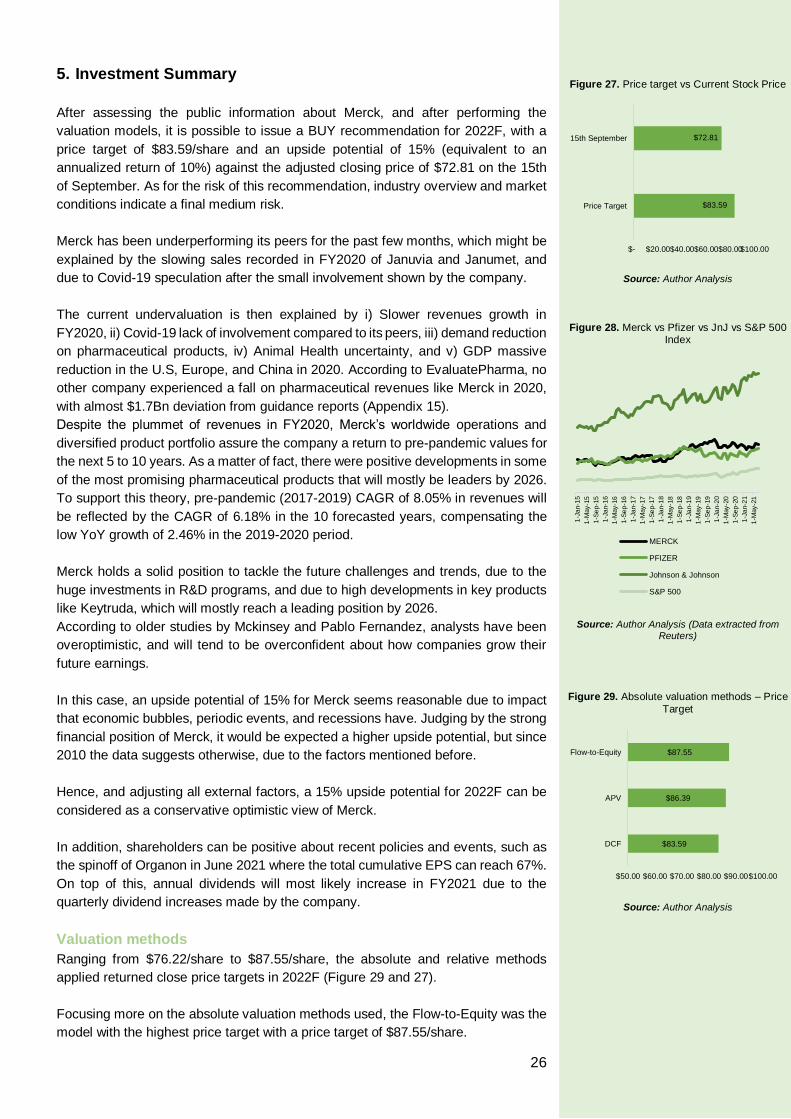
26
5. Investment Summary
After assessing the public information about Merck, and after performing the
valuation models, it is possible to issue a BUY recommendation for 2022F, with a
price target of $83.59/share and an upside potential of 15% (equivalent to an
annualized return of 10%) against the adjusted closing price of $72.81 on the 15th
of September. As for the risk of this recommendation, industry overview and market
conditions indicate a final medium risk.
Merck has been underperforming its peers for the past few months, which might be
explained by the slowing sales recorded in FY2020 of Januvia and Janumet, and
due to Covid-19 speculation after the small involvement shown by the company.
The current undervaluation is then explained by i) Slower revenues growth in
FY2020, ii) Covid-19 lack of involvement compared to its peers, iii) demand reduction
on pharmaceutical products, iv) Animal Health uncertainty, and v) GDP massive
reduction in the U.S, Europe, and China in 2020. According to EvaluatePharma, no
other company experienced a fall on pharmaceutical revenues like Merck in 2020,
with almost $1.7Bn deviation from guidance reports (Appendix 15).
Despite the plummet of revenues in FY2020, Merck’s worldwide operations and
diversified product portfolio assure the company a return to pre-pandemic values for
the next 5 to 10 years. As a matter of fact, there were positive developments in some
of the most promising pharmaceutical products that will mostly be leaders by 2026.
To support this theory, pre-pandemic (2017-2019) CAGR of 8.05% in revenues will
be reflected by the CAGR of 6.18% in the 10 forecasted years, compensating the
low YoY growth of 2.46% in the 2019-2020 period.
Merck holds a solid position to tackle the future challenges and trends, due to the
huge investments in R&D programs, and due to high developments in key products
like Keytruda, which will mostly reach a leading position by 2026.
According to older studies by Mckinsey and Pablo Fernandez, analysts have been
overoptimistic, and will tend to be overconfident about how companies grow their
future earnings.
In this case, an upside potential of 15% for Merck seems reasonable due to impact
that economic bubbles, periodic events, and recessions have. Judging by the strong
financial position of Merck, it would be expected a higher upside potential, but since
2010 the data suggests otherwise, due to the factors mentioned before.
Hence, and adjusting all external factors, a 15% upside potential for 2022F can be
considered as a conservative optimistic view of Merck.
In addition, shareholders can be positive about recent policies and events, such as
the spinoff of Organon in June 2021 where the total cumulative EPS can reach 67%.
On top of this, annual dividends will most likely increase in FY2021 due to the
quarterly dividend increases made by the company.
Valuation methods
Ranging from $76.22/share to $87.55/share, the absolute and relative methods
applied returned close price targets in 2022F (Figure 29 and 27).
Focusing more on the absolute valuation methods used, the Flow-to-Equity was the
model with the highest price target with a price target of $87.55/share.
Figure 27. Price target vs Current Stock Price
Source: Author Analysis
Figure 28. Merck vs Pfizer vs JnJ vs S&P 500 Index
Source: Author Analysis (Data extracted from Reuters)
Figure 29. Absolute valuation methods – Price
Target
Source: Author Analysis
$83.59
$72.81
$- $20.00 $40.00 $60.00 $80.00 $100.00
Price Target
15th September
1-J
an-1
5
1-M
ay-1
5
1-S
ep
-15
1-J
an-1
6
1-M
ay-1
6
1-S
ep
-16
1-J
an-1
7
1-M
ay-1
7
1-S
ep
-17
1-J
an-1
8
1-M
ay-1
8
1-S
ep
-18
1-J
an-1
9
1-M
ay-1
9
1-S
ep
-19
1-J
an-2
0
1-M
ay-2
0
1-S
ep
-20
1-J
an-2
1
1-M
ay-2
1
MERCK
PFIZER
Johnson & Johnson
S&P 500
$83.59
$86.39
$87.55
$50.00 $60.00 $70.00 $80.00 $90.00 $100.00
DCF
APV
Flow-to-Equity

27
Hence, the recommendation does not change in any of the valuation models, with
absolute valuation methods ranging from $83.59 in the WACC method to $87.55 in
the Flow-to-Equity. To sum up, all valuation methods adopted support the current
undervaluation of Merck and recognize the company’s financial and operational
strength worldwide.

28
6. Valuation
Enterprise Discounted Cash Flow – WACC Method
The first approach used to compute the price target of Merck was the Enterprise
Discounted Cash Flow (DCF model), using the measure of free cash flow (FCF) with
the weighted average cost of capital (WACC) as the discounted factor. This is
usually the best method for projects, business units and companies that aim to reach
and maintain a target level in their capital structure. By using this approach, the
company’s price target in 2022YE reached $83.59/share (Appendix 25), which
represents an upside potential of 10% when compared to the current stock price of
$76.29 on the 15th of September 2021.
Before performing this model, it is crucial to identify the main steps and variables
used to reach the final price target.
The critical variables that influence this valuation are i) Revenue’s growth ii) WACC
assessment and iii) Long-term growth rate.
Only after assessing those critical variables, it is possible compute the four steps to
value Merck’s equity. The first step is to discount the FCF by using the WACC, to
assess the value of operations, which will lead to an Operating Enterprise Value for
each forecasted year. Next, the identification and valuation of nonoperating assets
(Non-Core Invested Capital), operating leases, non-controlling interests needs to be
done, in order to reach the Enterprise value. The next step is to include Gross Debt
and Excess Cash to identify and valuate the Net Debt. At last, the simple subtraction
of those nonoperating assets, operating leases, non-controlling leases, and Net
Debt to the Operating Enterprise Value, will give the value of common equity. From
this value it is possible to assess the value per share by dividing that equity value
by the number of shares outstanding.
Revenues by Segment
As stated before, Merck divides its business segments into two major categories:
Pharmaceutical and Animal Healthcare. As a whole, total revenues should reach a
value close to $51.8bn according to the company’s report. Covid-19 slowed down
sales, so it is reasonable to assume a bounce back.
According to MarketLine, Global Pharmaceutical revenues had a compound annual
growth rate (CAGR) of 3.22% between 2017 and 2020, and forecasted values
assume a CAGR of 2.78% between 2021 and 2024. The forecasted growth between
2025 and 2030 is estimated by the global inflation (surrounding 3%), extracted from
the IMF and Statista data.
Merck’s market share reached 4.029% in FY2020 and based on the historical
average year-over-year growth of 0.128%, revenues for 2021 and 2022 will reach
$50.6bn and 54bn, respectively. This annual growth will maintain throughout the
forecast period. To add up to these assumptions, it is also relevant to mention the
product of Keytruda, which can reach the double amount of revenues by 2026,
according to EvaluatePharma. Taking all this information into account, revenues of
$69.6Bn in 2026 is reasonable, as the market share of Merck will stay close to 4%.
Despite Merck’s comfortable and leading position in the Animal Health market, its
market share evolution has not been reflecting that. A drop of more than 1% since
2018 raised questions about how Merck will approach this market in the future, due
to the rising competition and global economic conditions.
As stated before, Covid-19 affected revenues in FY2020, but they are expected to
increase in the future, due to Merck's leading position in this market, and due to the
17 new product approvals in 2020. This aligned with the 4 keys development
business transactions, will mostly likely result in a bounce back from the company
Figure 30. Free Cash Flow Core Business ($M)
Source: Author Analysis
Figure 31. Total Invested Capital ($M)
Source: Author Analysis
Figure 32. Working Capital ($M)
Source: Author Analysis
Figure 33. Revenues of Peers (2017-2020) ($M)
Source: Author Analysis
Figure 34. Net Operating Assets – Invested Capital Core Business ($M)
Source: Author Analysis
-2000
0
2000
4000
6000
8000
10000
20
18
20
19
20
20
20
21
F
20
22
F
20
23
F
20
24
F
20
25
F
20
26
F
20
27
F
20
28
F
20
29
F
20
30
F
0100002000030000400005000060000700008000090000
0
1000
2000
3000
4000
5000
0
10000
20000
30000
40000
50000
60000
70000
80000
90000
2017 2018 2019 2020
0
10000
20000
30000
40000
50000
60000
70000
80000

29
in 2021 onwards. To support these developments, Merck invested $100m in its
manufacturing facilities in Kansas (U.S)
The board has also stated this segment has been outperforming all expectations.
Hence, based on this information, Merck’s market share in this segment can be
expected to grow 0.4% per year, which will allow the company to get back to a 12%
market share by 2023. Pre pandemic values also reinforce this growth, and the
recent plans show an intend to explore more this segment.
To conclude, it is relevant to mention the company’s future strategy, which will aim
to diversify its portfolio, in order to mitigate the severe risk inherent to both segments.
WACC Assessment
There are important steps to assess the discount factor (WACC) in the Enterprise
Discounted Cash Flow, which need to be computed considering Merck and its peers.
Following the previous intentions to maintain a target level in its capital structure,
WACC will remain constant throughout the forecasted years. The Total Debt to
Enterprise Value will stay at 12%, as a response to the previous years, resulting in
a Equity to Enterprise Value of 88%.
Estimating the Unlevered and Relevered Beta – Beta of Equity
After computing and estimating the previous components of the capital structure, it
is crucial to assess Merck’s unlevered beta. By collecting the stock price of the
company’s peer group from the last 3 years and computing the respective returns
against the Standard & Poor index (S&P), it is possible to assess the unlevered beta
of each of the 7 companies. Next, the Beta formula is applied by dividing the
covariance of each company return against the benchmark by the variance of the
return of the benchmark over the last 3 years. This resulted in a levered Beta of 0.69
for Merck, and a lower limit of 0.63 and an upper limit of 0.74 with a confidence level
of 95% (Appendix 22).
The subsequent Relevered beta used to assess the unlevered cost of equity was
computed in two different ways, leading to the same relevered beta of 0.73. First
approach used the Debt-to-Equity ratio of each company and the corporate tax of
21% to remove the impact of debt to the levered betas estimated before. The
average of those betas is then used to add back the impact of debt to estimate the
relevered beta of each company. The average relevered beta is then used as the
beta of equity.
The second approach was to use the constant ratio of debt to equity (also constant
to operating leases), the beta of the company’s debt and the beta of the company’s
operating leases.
Using this approach requires a few steps to assess the values of both betas.
Implied Beta of the company´s debt computation starts by looking into Merck’s notes
due to pay in 10 years (1.45%), followed by the assessment of the probability of
default. Bond rating helps to find this probability, and by using Moody’s credit rating
of A1 and its default report of 2020 the loss giving default that fits companies like
Merk is 68.18%. With this probability and the annualized A1 probability of default
(computed with information in the same report – 0.16%) a cost of debt of 1.34% was
assessed, which resulted in an implied beta of the company’s debt of 0.003. USA
market risk premium of 5.5% by Fernandez and US 10Y bonds of 1.32% extracted
from Bloomberg were both used in all computations.
As for the implied beta of operating leases the same procedure is used with a
different loss given default, 40.24%, leading to a 0.012 beta.
Finally, the last step is to include these betas in the beta equity equation: Be = Bu +
ND/E * (Bu – implied Bd) + (OL/E) * (Bu – implied Bol).
Table 7. Merck and Peers 3Y Beta computation
Merck's Bond Rating 2020 Source
Moody's A1 Moody's
S&P Global A+ S&P Global
Source: Author analysis (Regression)
Table 8. Capital Structure for forecast
Bu 0.64
Be 0.73
Re 5.31%
Rd 1.34%
Rol 1.39%
WACC t 4.80%
Ru t 4.84%
Source: Author analysis
Table 9. Merck and Peers 1Y
Beta computation
Company 1Y Beta
Merck 0.70
Abbvie 0.71
Eli Lilly 0.73
Pfizer 0.68
Bristol-Myers 0.62
Amgen 0.80
Johnson & Johnson 0.68
Source: Author analysis (Regression)
Table 10. Merck and Peers 3Y
Beta computation
Company 3Y Beta
Merck 0.69
Abbvie 0.81
Eli Lilly 0.73
Pfizer 0.71
Bristol-Myers 0.67
Amgen 0.83
Johnson & Johnson 0.68
Source: Author analysis (Regression)
Table 11. Summary Output
Regression Statistics
Multiple R 0.66460226
R Square 0.44169617
Adjusted R Square 0.44095669
Standard Error 0.01137358
Observations 757
Source: Author analysis (Regression)

30
By including the corporate marginal tax rate of 22.55% the value of the WACC is
4.80% throughout the forecasted period.
Long-term growth rate
Estimating the growth rate based on historical data of Merck and its peers is not
sustainable. Historical growth rate of the last 5 years accounted for 6.35%, which is
not a good measure to use in valuations. To come up with a better measure, both
USA and Europe Gross Domestic long-term projections were used, by assessing
OECD dataset. Projections from 2022 up to 2060 predict an average growth rate of
1.89% for USA and 1.67% for Europe. Merck’s main operations take place in these
two geographical areas, with a weight of 61% in the USA and 39% for Europe. When
applying these weights to the average growth rates, the long-term growth rate in real
terms accounted for 1.81%.
The next step includes the estimation of the average inflation rate in both
geographical areas, by assessing the same dataset of OECD. Both inflation average
inflation rates were close, with 2.03% in the USA and 2.02% in Europe. By using the
fisher formula, the long-term growth rate in nominal terms accounted for 3.87%. The
final growth rate used for Merck ended up being the weighted average long-term
one, due to the industry the company operates. A growth rate close to 2% is the right
one, as the 3.87% would be too optimist and not realistic in this type of Industry.
Adjusted Present Value (APV)
Although APV uses the same free cash flow used in the DCF model, the discount
factor used is the unlevered cost of equity (Ru), instead of the WACC. This excluded
tax benefits related to debt, so in order to reach the equity value those tax benefits
need to be added back.
Unlevered cost of equity for Merck is 4.84% and it is computed by the following
formula: Cost of equity * E/EV + Cost of debt * ND/EV + Cost of operating leases *
OL/EV.
Again, the discount will always be stable for the future, and it leads to a price target
of $86.39 in FY2022, which is close to the one obtained in the DCF model. This
represents an upside potential of 13%.
Flow-To-Equity
Mixing assets with different risks and the blending of capital structure with operating
performance are the main reasons as to why this model is not recommended.
However, this can be a good model to use in banks or financial institutions, since the
core operations of these type of institutions are not separated from their capital
structure. Despite all of this, Flow-to-Equity can help to validate the accuracy of
Merck’s DCF valuation, by checking the proximity of both values.
This model also assumes a stable capital structure throughout time, and it includes
a cost of Equity of 5.31% as the discount factor. This value is obtained by simply
adding the risk-free rate to the multiplication of the equity beta and the market risk
premium.
This method results in a price target of $87.55/share in FY2022, which is close to
the ones obtained in the DCF and APV models. Hence, this can guarantee a
minimum level of accuracy, especially in the DCF one.
Table 12. Long-term growth rate computations
Zone Weight
USA 61%
Euro Area 39%
Average Inflation Rate (USA) 2.03%
Average Inflation Rate (Euro Area) 2.02%
Long-term Growth Rate (nominal) 3.87%
Average Growth Rate
(USA) 1.89%
Average Growth Rate
(Euro Area) 1.67%
Weighted Average Long-
term Growth Rate (real) 1.81%
Source: Author analysis (Regression)

31
Multiples
Valuing a company using the DCF model appears to be the most accurate, but it is
also insightful to perform a relative valuation approach, where the peer group is used
to assess the different types of multiples.
Figure 35 shows the three multiples used, which resulted in the following price
targets:
EV/EBITDA Ratio: Median and Average of the peers is 11.18x and 10.96x
respectively, leading to a Market Value of $218.17Bn, a Market Equity value
of $193.48Bn, and a final price target of $76.22/share. This lower value can
be explained by the exclusion of two companies from the computations, due
to their extremely high ratios. When included, the EV/EBITDA ratio goes up
to $88.60/share.
P/E Ratio: Median and Average of the peers is 26.94x and 28.82x
respectively, leading to a Market Value of $228.79Bn, a Market Equity value
of $204.1Bn, and a final price target of $80.41/share.
P/Sales Ratio: Median and Average of the peers is 4.76x and 5.12x
respectively, leading to a Market Value of $245.79Bn, a Market Equity value
of $221.11Bn, and a final price target of $87.11/share.
Figure 35. Multiples Valuation
Source: Author Analysis
$76.22
$80.41
$87.11
$- $20.00 $40.00 $60.00 $80.00 $100.00
1
2
3

32
7. Financial Analysis
Operational Performance
Merck experienced a significant growth in revenues, as they went from $40.1Bn in
2017 to $47.9Bn in 2020, representing a CAGR of 20%. Although it was a positive
and encouraging growth, the period of 2019-2020 reflected the Covid-19 impact, as
it only grew from $46.8Bn to $4EV7.9Bn. This is a small increase when compared
to the period of 2018-2019, where sales grew from $42.2Bn to $46.8Bn. Despite the
disappointing numbers, the recent developments related to the pandemic worldwide
can guarantee a return to normal, in terms of growth. Revenues will reach at least
$51Bn in FY2021 according to the board, which is aligned with the forecast
assessed. 2025F predicts revenues of $65.7Bn, mainly driven by the Keytruda and
other strong products in the pharmaceutical portfolio. The final year 2030F forecasts
revenues of $86.9Bn, due to the large size and key drivers of profitability within the
industry. Increasing aging of the population, pandemics similar to Covid-19 and
cancer will most likely be the boosters of Merck’s Revenues.
Operating EBITDA margin grew from 18.4% to 19.8% in 2017-2020 period, with a
surprising level in 2019, as it reached 28.2%. Forecast predict a stable operating
EBITDA with 19.1% for 2025F and 2030F, only shifting 0.1% between the forecast
period. The reason behind this has to do with the high risk in this type of industry,
where operational earning are highly driven by R&D returns, which represents a
huge risk if the projects don not meet their goals.
As expected, operating EBIT margin follows the operating EBITDA margin trend with
15.8% from 2025F to 2030F.
Activity
To measure the company’s efficiency and to understand how it manages its
resources, a few ratios are worth mentioning. First of all, the operating cash
conversion cycle of Merck decreased from 118.9 to 102.3 days in the 2017-2020
period. It is believed that the pressure on supply chains might have had an impact
on this short number of days in 2020, so it is normal to reach cash conversion cycle
of 113.1 days in 2025F and 113.4 days in 2030F. This will probably stabilize around
these numbers, as historical data indicates, but the shorter the better, so Merck
should also try to improve this ratio as best as it can.
Liquidity
Merck’s ability to pay its current liabilities with cash and cash equivalents can be
measured by the cash ratio, which has been between 0.4x and 0.6x in the 2017-
2020 period, with 0.5x in 2025F and a decrease to 0.4x in 2030F. Merck should
analyze this ratio, as it would be beneficial for shareholders to have a slightly higher
ratio, preferably between 0.5x and 1x.The current ratio follows the same trend and it
could also be improved as a value for FY2020 of 1.1x (equal to the forecasted years)
should be closer to 1.5x.
Profitability
While assessing ratios such as ROIC, ROE, Asset Turnover and Net Profit Margin,
it is possible to evaluate the overall ability of Merck to generate profits. Net Profit
margin increased from 6% to 14.8% in 2017-2020 period, with a surprising 20.9%
margin in FY2019. This ratio will most likely decrease to 13.4% in 2025F and to
12.9% in 2030F, mainly explained by pandemic impact and future trends in
pharmaceutical industry identified before. As for the ROE, Merck experienced a
similar unroll as the Net Profit Margin with 7% in FY2017, 28% in FY2020, 30.3% in
Figure 36. Business Margins
Source: Author Analysis
Figure 37. Debt Coverage
vs Interest Coverage
Source: Author Analysis
Figure 38. NOPLAT and ROE ($M)
Source: Author Analysis
0.0%
20.0%
40.0%
60.0%
80.0%
100.0%
2017 2018 2019 2020
Gross profit margin (%)
Operating EBITDA Margin (%)
Operating EBIT Margin (%)
0.0
2.0
4.0
6.0
8.0
10.0
12.0
14.0
0%
10%
20%
30%
40%
50%
60%
201
7
201
8
201
9
202
0
202
1F
202
2F
202
3F
202
4F
202
5F
202
6F
202
7F
202
8F
202
9F
203
0F
0.0%
10.0%
20.0%
30.0%
40.0%
50.0%
60.0%
70.0%
$0
$2,000
$4,000
$6,000
$8,000
$10,000
$12,000
Net Operating Profit After Tax(Adjusted)
Return on Equity
Net Profit Margin
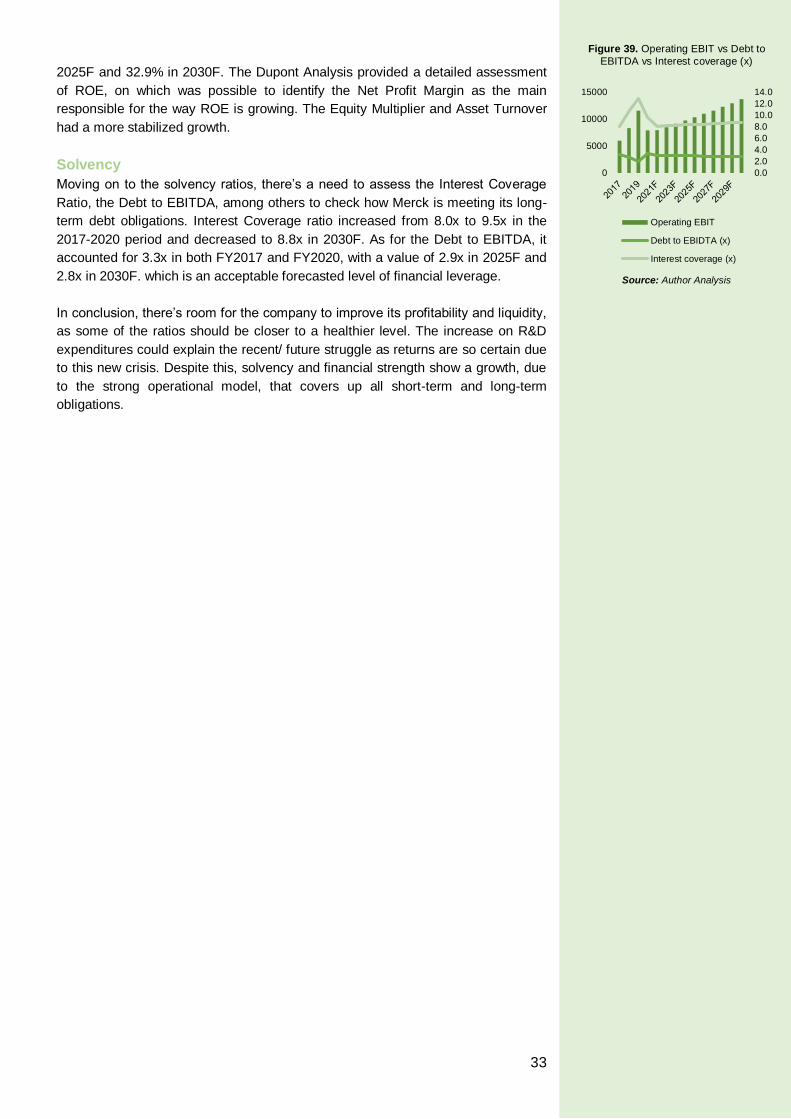
33
2025F and 32.9% in 2030F. The Dupont Analysis provided a detailed assessment
of ROE, on which was possible to identify the Net Profit Margin as the main
responsible for the way ROE is growing. The Equity Multiplier and Asset Turnover
had a more stabilized growth.
Solvency
Moving on to the solvency ratios, there’s a need to assess the Interest Coverage
Ratio, the Debt to EBITDA, among others to check how Merck is meeting its long-
term debt obligations. Interest Coverage ratio increased from 8.0x to 9.5x in the
2017-2020 period and decreased to 8.8x in 2030F. As for the Debt to EBITDA, it
accounted for 3.3x in both FY2017 and FY2020, with a value of 2.9x in 2025F and
2.8x in 2030F. which is an acceptable forecasted level of financial leverage.
In conclusion, there’s room for the company to improve its profitability and liquidity,
as some of the ratios should be closer to a healthier level. The increase on R&D
expenditures could explain the recent/ future struggle as returns are so certain due
to this new crisis. Despite this, solvency and financial strength show a growth, due
to the strong operational model, that covers up all short-term and long-term
obligations.
Figure 39. Operating EBIT vs Debt to
EBITDA vs Interest coverage (x)
Source: Author Analysis
0.0
2.0
4.0
6.0
8.0
10.0
12.0
14.0
0
5000
10000
15000
Operating EBIT
Debt to EBIDTA (x)
Interest coverage (x)
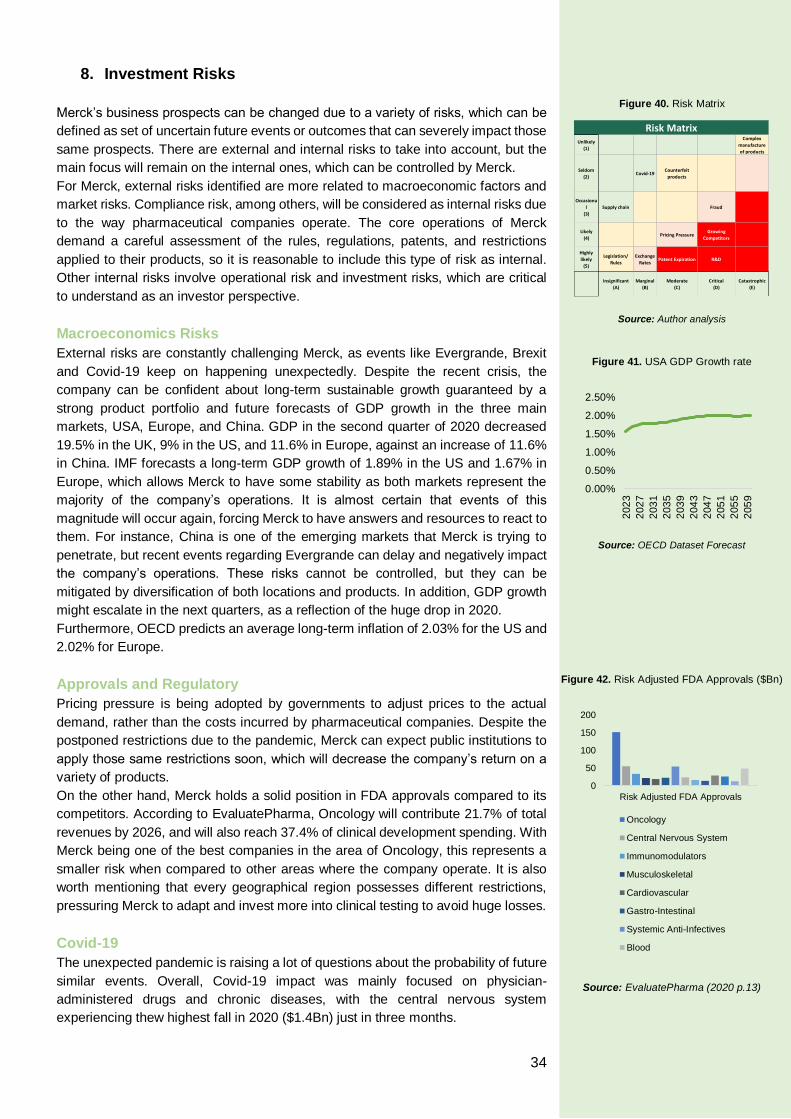
34
8. Investment Risks
Merck’s business prospects can be changed due to a variety of risks, which can be
defined as set of uncertain future events or outcomes that can severely impact those
same prospects. There are external and internal risks to take into account, but the
main focus will remain on the internal ones, which can be controlled by Merck.
For Merck, external risks identified are more related to macroeconomic factors and
market risks. Compliance risk, among others, will be considered as internal risks due
to the way pharmaceutical companies operate. The core operations of Merck
demand a careful assessment of the rules, regulations, patents, and restrictions
applied to their products, so it is reasonable to include this type of risk as internal.
Other internal risks involve operational risk and investment risks, which are critical
to understand as an investor perspective.
Macroeconomics Risks
External risks are constantly challenging Merck, as events like Evergrande, Brexit
and Covid-19 keep on happening unexpectedly. Despite the recent crisis, the
company can be confident about long-term sustainable growth guaranteed by a
strong product portfolio and future forecasts of GDP growth in the three main
markets, USA, Europe, and China. GDP in the second quarter of 2020 decreased
19.5% in the UK, 9% in the US, and 11.6% in Europe, against an increase of 11.6%
in China. IMF forecasts a long-term GDP growth of 1.89% in the US and 1.67% in
Europe, which allows Merck to have some stability as both markets represent the
majority of the company’s operations. It is almost certain that events of this
magnitude will occur again, forcing Merck to have answers and resources to react to
them. For instance, China is one of the emerging markets that Merck is trying to
penetrate, but recent events regarding Evergrande can delay and negatively impact
the company’s operations. These risks cannot be controlled, but they can be
mitigated by diversification of both locations and products. In addition, GDP growth
might escalate in the next quarters, as a reflection of the huge drop in 2020.
Furthermore, OECD predicts an average long-term inflation of 2.03% for the US and
2.02% for Europe.
Approvals and Regulatory
Pricing pressure is being adopted by governments to adjust prices to the actual
demand, rather than the costs incurred by pharmaceutical companies. Despite the
postponed restrictions due to the pandemic, Merck can expect public institutions to
apply those same restrictions soon, which will decrease the company’s return on a
variety of products.
On the other hand, Merck holds a solid position in FDA approvals compared to its
competitors. According to EvaluatePharma, Oncology will contribute 21.7% of total
revenues by 2026, and will also reach 37.4% of clinical development spending. With
Merck being one of the best companies in the area of Oncology, this represents a
smaller risk when compared to other areas where the company operate. It is also
worth mentioning that every geographical region possesses different restrictions,
pressuring Merck to adapt and invest more into clinical testing to avoid huge losses.
Covid-19
The unexpected pandemic is raising a lot of questions about the probability of future
similar events. Overall, Covid-19 impact was mainly focused on physician-
administered drugs and chronic diseases, with the central nervous system
experiencing thew highest fall in 2020 ($1.4Bn) just in three months.
Figure 40. Risk Matrix
Source: Author analysis
Figure 41. USA GDP Growth rate
Source: OECD Dataset Forecast
Figure 42. Risk Adjusted FDA Approvals ($Bn)
Source: EvaluatePharma (2020 p.13)
Unlikely
(1)
Complex
manufacture
of products
Seldom
(2)Covid-19
Counterfeit
products
Occasiona
l
(3)
Supply chain Fraud
Likely
(4)Pricing Pressure
Growing
Competitors
Highly
likely
(5)
Legislation/
Rules
Exchange
RatesPatent Expiration R&D
Insignificant
(A)
Marginal
(B)
Moderate
(C)
Critical
(D)
Catastrophic
(E)
Risk Matrix
0.00%
0.50%
1.00%
1.50%
2.00%
2.50%
202
3
202
7
203
1
203
5
203
9
204
3
204
7
205
1
205
5
205
9
0
50
100
150
200
Risk Adjusted FDA Approvals
Oncology
Central Nervous System
Immunomodulators
Musculoskeletal
Cardiovascular
Gastro-Intestinal
Systemic Anti-Infectives
Blood

35
Merck’s anesthesia products like Bridion are a prime example of how lockdown
measures directly impacted the company’s overall revenues, due to the reduced
number of worldwide surgeries.
Despite the huge investment opportunities that come with a disease, such as Covid-
19, the risks associated with it are too high to be ignored. A diversified portfolio can
reduce the impact, but it cannot eliminate it, as it will always reduce the demand of
physician-administered drugs and chronic diseases, areas where Merck is strong.
On top of this, Merck also incurred in costs with Covid-19 programs that were shut
down after a few months, proving how risky this type of investments can be.
Operational Risks
Operational risks are arguably the most controlled ones by the company and can be
assessed by taking a look into the geographical and segmental core operations. As
stated before, geographical risks present a high correlation with government
interference and sporadic events, especially in the USA, Europe, and China. Despite
its worldwide operational model, Merck has still a long way to grow and truly diversify
its operations, reducing then the risk of collapse in one of those markets.
Equally important, pharmaceutical, and animal health segments drive Merck’s
revenues, overall performance, and cash flow from operations. Each segment
compresses the following risks:
Pharmaceutical: Besides the recent crisis impact on physician-
administered drugs and chronic diseases, Merck is also facing pricing
pressure and the risk of substitutes products. The decrease in demand due
to external risks are not as big of a threat than the internal risks related to
these substitutes drugs that are taking advantage of patent expiration,
pricing pressure and the low switching costs associated to these types of
products.
Animal Health: Outbreak of diseases in animals represent the major risk in
this segment, due to the impact it has on demand and production, Merck is
the leader on this booming market, and that condition comes with an
escalation of risks such as epidemics, pandemics, pricing pressure and
weather changes.
Compliance Risks
Although Merck is not associated with recent fraudulent events, pharmaceutical
companies are always on the scope of regulatory and healthcare entities for possible
bad conduct during the development of products and treatments.
Despite the low fees applied to companies that don’t follow the rules and minimum
requires, it is still a relevant risk for Merck to pay attention to, as it can affect the
public perception of the whole company, leading to a decrease in demand and in
revenues.
R&D
Being the major driver of profitability of this industry, R&D programs and investments
also represent a huge risk for all companies. Similar to other companies, Merck’s
cost burden has been increasing over the years, with a weight of 28.25% in
percentage of revenues in FY2020. R&D spending doubled the growth rate of total
sales in the 2012-2019, and it expected to grow 3.62% between 2021 and 2026,
according to EvaluatePharma.
Both negative and positive impacts on R&D returns represent a huge change in the
final valuation for Merck, as it constitutes the core driver for the company’s
performance and financial strength.
Figure 43. Acquired Intangibles FY2020 ($M)
Source: Author Analysis (Data from Merck’s Proxy
Statement 2020
Figure 44. R&D Forecasts ($M)
Source: Author Analysis
0
2000
4000
6000
8000
10000
12000
14000
Products andproductrights
Licenses Trade names Other
2017 2018 2019 2020
1430815280
18582
24551
2021F 2022F 2025F 2030F

36
Delayed approvals, failed clinical tests, patents, and setbacks in research are some
of the risks to be aware of, within the umpteen R&D investment opportunities.
Price Target Sensitivity Analysis
By considering the investment risks mentioned above, and the critical variables in
the capital structure assessment, it was possible to see which variables impact the
final valuation, and by how much. The four variables selected were the cost of debt,
the cost of equity, long-term growth rate and weighted average cost of capital, since
they have a huge impact on the final price target.
Long-term Growth Rate vs WACC
For the first sensitivity simulation, both long-term growth rate and WACC variation of
0.25% were simultaneous simulated to check how the price target changes. As
shown in table 13, the price target drops to $77.47/share for a growth rate of 1.56%
and increases to $90.83/share for a growth rate of 2.06%, keeping everything else
constant. This variation is wider when the same methodology is applied to the cost
of capital, with a price target of $76.11 for a WACC of 5.05% and a price target of
$92.44/share for a WACC of 4.55%, keeping everything else constant.
Sensitivity Conclusions
After performing these simulations, it is possible to conclude that the final price target
is more sensitive with the variables of WACC, cost of Equity and Growth Rate. By
changing 0.25% in each variable the price target changes 10.58% with the WACC,
9.21% with the cost of equity, 7.32% with the long-term growth rate and only 0.85%
with the cost of debt. As expected, revenues, the cost of capital and the long-term
growth rate are the main critical variables that need to be carefully assessed, as
every shift result in a hefty change on the final valuation of Merck.
Scenario Analysis
Four different scenarios, based on Revenues and EBIT Margin, were created to
check what would be the impact on the final valuation:
Optimistic: 5% growth in both Revenues and EBIT margin YoY growth from
the Base Case result in a price target of $91.41 and an upside potential of
26%.
Growth Rate 83.59$ 1.31% 1.56% 1.81% 2.06% 2.31%
4.30% 86.59$ 94.08$ 103.06$ 114.05$ 127.79$
4.55% 78.85$ 85.08$ 92.44$ 101.27$ 112.08$
4.80% 72.22$ 77.47$ 83.59€ 90.83$ 99.52€
5.05% 66.48$ 70.95$ 76.11$ 82.13$ 89.25$
5.30% 61.46$ 65.31$ 69.70$ 74.78$ 80.70$
WA
CC
Table 13. WACC vs g

37
Pessimist:5% decrease in both Revenues and EBIT margin YoY growth
from the Base Case result in a price target of $75.46. and a downside
potential of only 4%.
Super Optimistic: An increase of 20% in both Revenues and EBIT margin
YoY growth from the Base Case result in a price target of $116.54 and an
upside potential of 60%.
DCF 2018 2019 2020 2021F 2022F 2023F 2024F 2025F 2026F 2027F 2028F 2029F 2030F
Unlevered FCFF 10202 5892 6206 6747 3769 7468 7938 9231 8627 9068
WACC 4.80% 4.80% 4.80% 4.80% 4.80% 4.80% 4.80% 4.80% 4.80% 4.80%
g 1.81%
Operating Enterprise Value 252874 259119 265350 271339 280594 286593 292411 297214 302852
Net Debt 21669 22885 24340 25747 26986 28262 29600 30972 32400
Operating Leases 1810 1647 1222 1059 4346 4346 4346 3475 3671
(+)Operating EV 252874 259119 265350 271339 280594 286593 292411 297214 302852
(-)Net Debt -21669 -22885 -24340 -25747 -26986 -28262 -29600 -30972 -32400
(-)Operating Leases -1810 -1647 -1222 -1059 -4346 -4346 -4346 -3475 -3671
(-)Non Core Invested Capital -2361 -2468 -2596 -2715 -2832 -2953 -3079 -3210 -3347
(-)Non Controlling Interests -89 -92 -94 -97 -100 -103 -106 -110 -113
Equity Value 226944 232027 237097 241721 246329 250929 255279 259448 263321
#Shares 2538 2538 2538 2538 2538 2538 2538 2538 2538
Price 89.41$ 91.41$ 93.41$ 95.23$ 97.04$ 98.86$ 100.57$ 102.21$ 103.74$
31st August 72.81$
Upside/downside potential 26%
Recommendation BUY
DCF 2018 2019 2020 2021F 2022F 2023F 2024F 2025F 2026F 2027F 2028F 2029F 2030F
Unlevered FCFF 9362 4986 5225 5709 2674 6309 6714 7938 7261 7664
WACC 4.80% 4.80% 4.80% 4.80% 4.80% 4.80% 4.80% 4.80% 4.80% 4.80%
g 1.81%
Operating Enterprise Value 213385 218641 223911 228948 237263 242342 247259 251189 255985
Net Debt 21669 22885 24340 25747 26986 28262 29600 30972 32400
Operating Leases 1810 1647 1222 1059 4346 4346 4346 3475 3671
(+)Operating EV 213385 218641 223911 228948 237263 242342 247259 251189 255985
(-)Net Debt -21669 -22885 -24340 -25747 -26986 -28262 -29600 -30972 -32400
(-)Operating Leases -1810 -1647 -1222 -1059 -4346 -4346 -4346 -3475 -3671
(-)Non Core Invested Capital -2361 -2468 -2596 -2715 -2832 -2953 -3079 -3210 -3347
(-)Non Controlling Interests -89 -92 -94 -97 -100 -103 -106 -110 -113
Equity Value 187455 191549 195658 199330 202998 206677 210128 213424 216453
#Shares 2538 2538 2538 2538 2538 2538 2538 2538 2538
Price 73.85$ 75.46$ 77.08$ 78.53$ 79.97$ 81.42$ 82.78$ 84.08$ 85.27$
31st August 72.81$
Upside/downside potential 4%
Recommendation BUY
DCF 2018 2019 2020 2021F 2022F 2023F 2024F 2025F 2026F 2027F 2028F 2029F 2030F
Unlevered FCFF 11477 7271 7703 8326 5434 9229 9799 11197 10702 11295
WACC 4.80% 4.80% 4.80% 4.80% 4.80% 4.80% 4.80% 4.80% 4.80% 4.80%
g 1.81%
Operating Enterprise Value 315060 322911 330708 338255 349056 356581 363897 370167 377232
Net Debt 21669 22885 24340 25747 26986 28262 29600 30972 32400
Operating Leases 1810 1647 1222 1059 4346 4346 4346 3475 3671
(+)Operating EV 315060 322911 330708 338255 349056 356581 363897 370167 377232
(-)Net Debt -21669 -22885 -24340 -25747 -26986 -28262 -29600 -30972 -32400
(-)Operating Leases -1810 -1647 -1222 -1059 -4346 -4346 -4346 -3475 -3671
(-)Non Core Invested Capital -2361 -2468 -2596 -2715 -2832 -2953 -3079 -3210 -3347
(-)Non Controlling Interests -89 -92 -94 -97 -100 -103 -106 -110 -113
Equity Value 289131 295819 302455 308637 314792 320917 326766 332401 337701
#Shares 2538 2538 2538 2538 2538 2538 2538 2538 2538
Price 113.90$ 116.54$ 119.15$ 121.59$ 124.01$ 126.43$ 128.73$ 130.95$ 133.04$
31st August 72.81$
Upside/downside potential 60%
Recommendation BUY
Table 14. Optimistic
Table 15. Pessimistic
Table 16. Super Optimistic
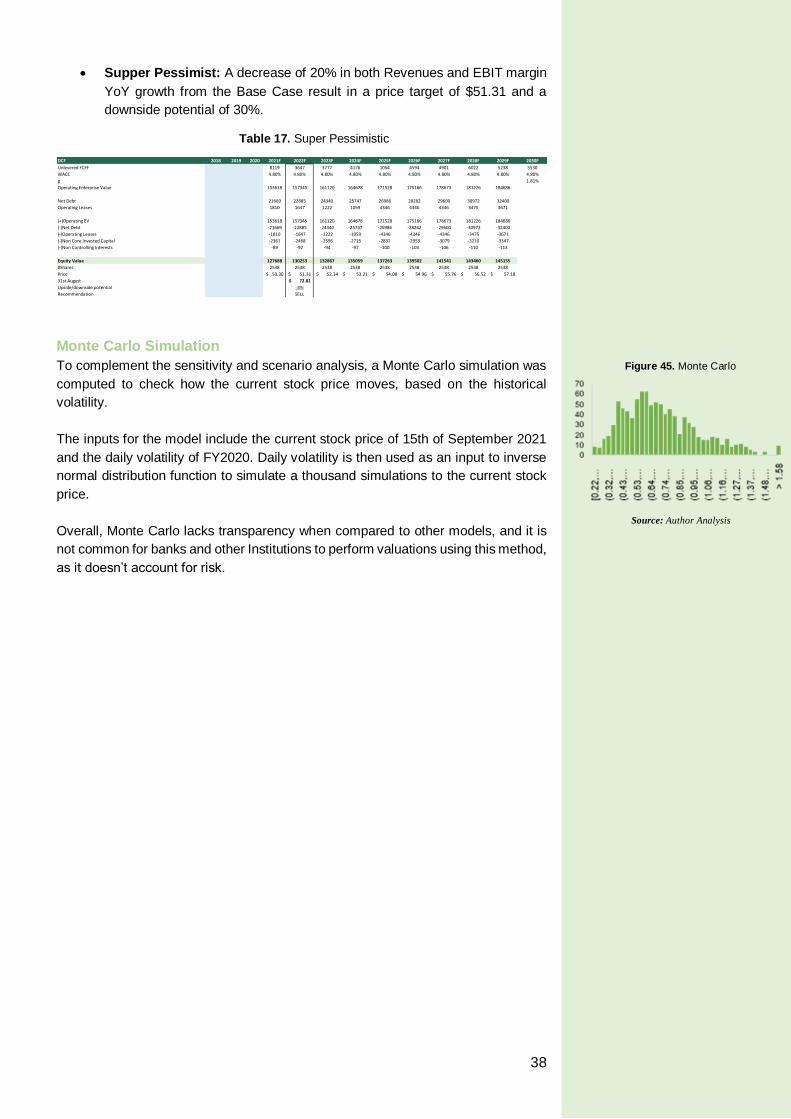
38
Supper Pessimist: A decrease of 20% in both Revenues and EBIT margin
YoY growth from the Base Case result in a price target of $51.31 and a
downside potential of 30%.
Monte Carlo Simulation
To complement the sensitivity and scenario analysis, a Monte Carlo simulation was
computed to check how the current stock price moves, based on the historical
volatility.
The inputs for the model include the current stock price of 15th of September 2021
and the daily volatility of FY2020. Daily volatility is then used as an input to inverse
normal distribution function to simulate a thousand simulations to the current stock
price.
Overall, Monte Carlo lacks transparency when compared to other models, and it is
not common for banks and other Institutions to perform valuations using this method,
as it doesn’t account for risk.
DCF 2018 2019 2020 2021F 2022F 2023F 2024F 2025F 2026F 2027F 2028F 2029F 2030F
Unlevered FCFF 8119 3647 3777 4176 1054 4594 4901 6022 5238 5530
WACC 4.80% 4.80% 4.80% 4.80% 4.80% 4.80% 4.80% 4.80% 4.80% 4.80%
g 1.81%
Operating Enterprise Value 153618 157345 161120 164678 171528 175166 178673 181226 184686
Net Debt 21669 22885 24340 25747 26986 28262 29600 30972 32400
Operating Leases 1810 1647 1222 1059 4346 4346 4346 3475 3671
(+)Operating EV 153618 157345 161120 164678 171528 175166 178673 181226 184686
(-)Net Debt -21669 -22885 -24340 -25747 -26986 -28262 -29600 -30972 -32400
(-)Operating Leases -1810 -1647 -1222 -1059 -4346 -4346 -4346 -3475 -3671
(-)Non Core Invested Capital -2361 -2468 -2596 -2715 -2832 -2953 -3079 -3210 -3347
(-)Non Controlling Interests -89 -92 -94 -97 -100 -103 -106 -110 -113
Equity Value 127688 130253 132867 135059 137263 139502 141541 143460 145155
#Shares 2538 2538 2538 2538 2538 2538 2538 2538 2538
Price 50.30$ 51.31$ 52.34$ 53.21$ 54.08$ 54.96$ 55.76$ 56.52$ 57.18$
31st August 72.81$
Upside/downside potential -30%
Recommendation SELL
Figure 45. Monte Carlo
Source: Author Analysis
Table 17. Super Pessimistic

39
Appendix
Appendix 1: Stock Performance
0%1000%2000%3000%4000%5000%6000%7000%8000%
1-J
an-8
5
1-M
ar-8
7
1-M
ay-8
9
1-J
ul-
91
1-S
ep
-93
1-N
ov-
95
1-J
an-9
8
1-M
ar-0
0
1-M
ay-0
2
1-J
ul-
04
1-S
ep
-06
1-N
ov-
08
1-J
an-1
1
1-M
ar-1
3
1-M
ay-1
5
1-J
ul-
17
1-S
ep
-19
S&P
50
0
Ind
ivid
ual
Sto
cks
Merck vs Pfizer vs Johnson & Johnson vs S&P 500 (1985-2021)
MERCK PFIZER Johnson & Johnson S&P 500
0.00%
1000.00%
2000.00%
3000.00%
4000.00%
5000.00%
6000.00%
7000.00%
8000.00%
1-J
an-1
5
1-M
ay-1
5
1-S
ep-1
5
1-J
an-1
6
1-M
ay-1
6
1-S
ep-1
6
1-J
an-1
7
1-M
ay-1
7
1-S
ep-1
7
1-J
an-1
8
1-M
ay-1
8
1-S
ep-1
8
1-J
an-1
9
1-M
ay-1
9
1-S
ep-1
9
1-J
an-2
0
1-M
ay-2
0
1-S
ep-2
0
1-J
an-2
1
1-M
ay-2
1
Merck vs Pfizer vs Johnson & Johnson vs S&P 500
(2015-2021)
MERCK PFIZER Johnson & Johnson S&P 500

2
Appendix 2: Major Products and Services (Source: MaketLine)

3
Appendix 3: Statement of Financial Position as Reported
Consolidated Balance Sheet ($ in millions except per share amounts) 2017 2018 2019 2020 CAGR
Assets
Current Assets
Cash and cash equivalents 6092 7965 9676 8062 9.79%
Short-term investments 2406 899 774 0
Accounts receivable (net of allowance for doubtful accounts of $85 in 2020 and $86 in 2019) 6873 7071 6778 7851 4.53%
Inventories (excludes inventories of $2,197 in 2020 and $1,480 in 2019 classified in Other assets - see Note 7) 5096 5440 5978 6310 7.38%
Other current assets 4299 4500 4277 5541 8.83%
Total current assets 24766 25875 27483 27764 3.88%
Investments 12125 6233 1469 785 -59.85%
Property, Plant and Equipment (at cost)
Land 365 333 343 350 -1.39%
Buildings 11726 11486 11989 12645 2.55%
Machinery, equipment and office furnishings 14649 14441 15394 16649 4.36%
Construction in progress 2301 3355 5013 7324 47.10%
29041 29615 32739 36968 8.38%
Less: accumulated depreciation 16602 16324 17686 18982 4.57%
12439 13291 15053 17986 13.08%
Goodwill 18284 18253 19425 20238 3.44%
Other Intangiles, Net 14183 13104 14196 14604 0.98%
Other Assets 5502 5225 6052 9317 19.19%
Deferred Income Taxes 573 656 719 894 15.98%
87872 82637 84397 91588 1.39%
Liabilities and Equity
Current Liabilities
Loans payable and current portion of long-term debt 3057 5308 3610 6431 28.13%
Trade accounts payable 3102 3318 3738 4594 13.99%
Accrued and other current liabilities 10427 10151 12549 13053 7.77%
Income taxes payable 708 1971 736 1575 30.54%
Dividends payable 1320 1458 1587 1674 8.24%
Total current liabilities 18614 22206 22220 27327 13.65%
Long-Term Debt 21353 19806 22736 25360 5.90%
Deferred Income Taxes 2219 1702 1470 1015 -22.95%
Other Noncurrent Liabilities 11117 12041 11970 12482 3.94%
Merck & Co., Inc. Stockholders’ Equity
Common stock, $0.50 par valueAuthorized - 6,500,000,000 sharesIssued - 3,577,103,522 shares in 2020 and 2019 1788 1788 1788 1788 0.00%
Other paid-in capital 39902 38808 39660 39588 -0.26%
Retained earnings 41350 42579 46602 47362 4.63%
Accumulated other comprehensive loss -4910 -5545 -6193 -6634 10.55%
78130 77630 81857 82104 1.67%
Less treasury stock, at cost:
1,046,877,695 shares in 2020 and 1,038,087,496 shares in 2019 43794 50929 55950 56787 9.05%
Total Merck & Co., Inc. stockholders’ equity 34336 26701 25907 25317 -9.66%
Noncontrolling Interests 233 181 94 87 -27.99%
Total equity 34569 26882 26001 25404 -9.76%
E + L 87872 82637 84397 91588 1.39%
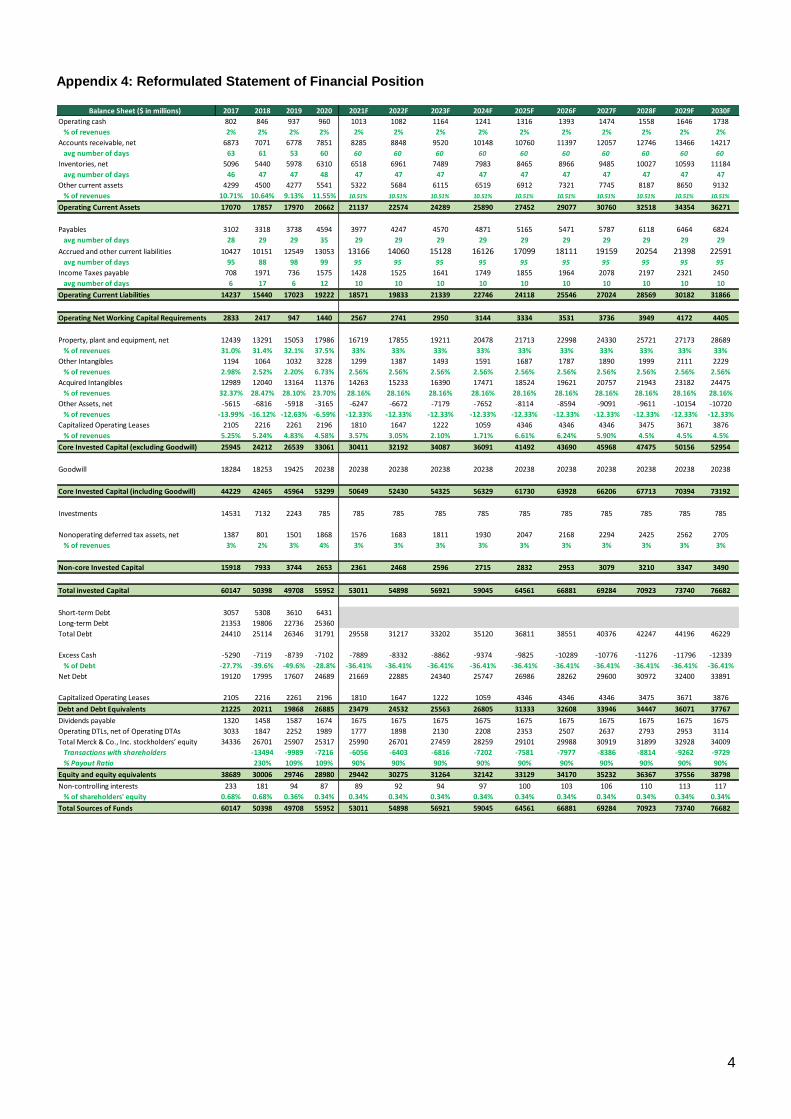
4
Appendix 4: Reformulated Statement of Financial Position
Balance Sheet ($ in millions) 2017 2018 2019 2020 2021F 2022F 2023F 2024F 2025F 2026F 2027F 2028F 2029F 2030F
Operating cash 802 846 937 960 1013 1082 1164 1241 1316 1393 1474 1558 1646 1738
% of revenues 2% 2% 2% 2% 2% 2% 2% 2% 2% 2% 2% 2% 2% 2%
Accounts receivable, net 6873 7071 6778 7851 8285 8848 9520 10148 10760 11397 12057 12746 13466 14217
avg number of days 63 61 53 60 60 60 60 60 60 60 60 60 60 60
Inventories, net 5096 5440 5978 6310 6518 6961 7489 7983 8465 8966 9485 10027 10593 11184
avg number of days 46 47 47 48 47 47 47 47 47 47 47 47 47 47
Other current assets 4299 4500 4277 5541 5322 5684 6115 6519 6912 7321 7745 8187 8650 9132
% of revenues 10.71% 10.64% 9.13% 11.55% 10.51% 10.51% 10.51% 10.51% 10.51% 10.51% 10.51% 10.51% 10.51% 10.51%
Operating Current Assets 17070 17857 17970 20662 21137 22574 24289 25890 27452 29077 30760 32518 34354 36271
Payables 3102 3318 3738 4594 3977 4247 4570 4871 5165 5471 5787 6118 6464 6824
avg number of days 28 29 29 35 29 29 29 29 29 29 29 29 29 29
Accrued and other current liabilities 10427 10151 12549 13053 13166 14060 15128 16126 17099 18111 19159 20254 21398 22591avg number of days 95 88 98 99 95 95 95 95 95 95 95 95 95 95
Income Taxes payable 708 1971 736 1575 1428 1525 1641 1749 1855 1964 2078 2197 2321 2450
avg number of days 6 17 6 12 10 10 10 10 10 10 10 10 10 10
Operating Current Liabilities 14237 15440 17023 19222 18571 19833 21339 22746 24118 25546 27024 28569 30182 31866
Operating Net Working Capital Requirements 2833 2417 947 1440 2567 2741 2950 3144 3334 3531 3736 3949 4172 4405
Property, plant and equipment, net 12439 13291 15053 17986 16719 17855 19211 20478 21713 22998 24330 25721 27173 28689
% of revenues 31.0% 31.4% 32.1% 37.5% 33% 33% 33% 33% 33% 33% 33% 33% 33% 33%
Other Intangibles 1194 1064 1032 3228 1299 1387 1493 1591 1687 1787 1890 1999 2111 2229
% of revenues 2.98% 2.52% 2.20% 6.73% 2.56% 2.56% 2.56% 2.56% 2.56% 2.56% 2.56% 2.56% 2.56% 2.56%
Acquired Intangibles 12989 12040 13164 11376 14263 15233 16390 17471 18524 19621 20757 21943 23182 24475
% of revenues 32.37% 28.47% 28.10% 23.70% 28.16% 28.16% 28.16% 28.16% 28.16% 28.16% 28.16% 28.16% 28.16% 28.16%
Other Assets, net -5615 -6816 -5918 -3165 -6247 -6672 -7179 -7652 -8114 -8594 -9091 -9611 -10154 -10720
% of revenues -13.99% -16.12% -12.63% -6.59% -12.33% -12.33% -12.33% -12.33% -12.33% -12.33% -12.33% -12.33% -12.33% -12.33%
Capitalized Operating Leases 2105 2216 2261 2196 1810 1647 1222 1059 4346 4346 4346 3475 3671 3876
% of revenues 5.25% 5.24% 4.83% 4.58% 3.57% 3.05% 2.10% 1.71% 6.61% 6.24% 5.90% 4.5% 4.5% 4.5%
Core Invested Capital (excluding Goodwill) 25945 24212 26539 33061 30411 32192 34087 36091 41492 43690 45968 47475 50156 52954
Goodwill 18284 18253 19425 20238 20238 20238 20238 20238 20238 20238 20238 20238 20238 20238
Core Invested Capital (including Goodwill) 44229 42465 45964 53299 50649 52430 54325 56329 61730 63928 66206 67713 70394 73192
Investments 14531 7132 2243 785 785 785 785 785 785 785 785 785 785 785
Nonoperating deferred tax assets, net 1387 801 1501 1868 1576 1683 1811 1930 2047 2168 2294 2425 2562 2705
% of revenues 3% 2% 3% 4% 3% 3% 3% 3% 3% 3% 3% 3% 3% 3%
Non-core Invested Capital 15918 7933 3744 2653 2361 2468 2596 2715 2832 2953 3079 3210 3347 3490
Total invested Capital 60147 50398 49708 55952 53011 54898 56921 59045 64561 66881 69284 70923 73740 76682
Short-term Debt 3057 5308 3610 6431
Long-term Debt 21353 19806 22736 25360
Total Debt 24410 25114 26346 31791 29558 31217 33202 35120 36811 38551 40376 42247 44196 46229
Excess Cash -5290 -7119 -8739 -7102 -7889 -8332 -8862 -9374 -9825 -10289 -10776 -11276 -11796 -12339
% of Debt -27.7% -39.6% -49.6% -28.8% -36.41% -36.41% -36.41% -36.41% -36.41% -36.41% -36.41% -36.41% -36.41% -36.41%
Net Debt 19120 17995 17607 24689 21669 22885 24340 25747 26986 28262 29600 30972 32400 33891
Capitalized Operating Leases 2105 2216 2261 2196 1810 1647 1222 1059 4346 4346 4346 3475 3671 3876
Debt and Debt Equivalents 21225 20211 19868 26885 23479 24532 25563 26805 31333 32608 33946 34447 36071 37767
Dividends payable 1320 1458 1587 1674 1675 1675 1675 1675 1675 1675 1675 1675 1675 1675
Operating DTLs, net of Operating DTAs 3033 1847 2252 1989 1777 1898 2130 2208 2353 2507 2637 2793 2953 3114
Total Merck & Co., Inc. stockholders’ equity 34336 26701 25907 25317 25990 26701 27459 28259 29101 29988 30919 31899 32928 34009
Transactions with shareholders -13494 -9989 -7216 -6056 -6403 -6816 -7202 -7581 -7977 -8386 -8814 -9262 -9729
% Payout Ratio 230% 109% 109% 90% 90% 90% 90% 90% 90% 90% 90% 90% 90%
Equity and equity equivalents 38689 30006 29746 28980 29442 30275 31264 32142 33129 34170 35232 36367 37556 38798
Non-controlling interests 233 181 94 87 89 92 94 97 100 103 106 110 113 117
% of shareholders' equity 0.68% 0.68% 0.36% 0.34% 0.34% 0.34% 0.34% 0.34% 0.34% 0.34% 0.34% 0.34% 0.34% 0.34%
Total Sources of Funds 60147 50398 49708 55952 53011 54898 56921 59045 64561 66881 69284 70923 73740 76682

5
Appendix 5: Income Statement as Reported
Appendix 6: Reformulated Income Statement
Incomce Statement ($ in millions except per share amounts) 2017 2018 2019 2020 CAGR
Sales 40122 42294 46840 47994 20%
Costs, Expenses and Other
Cost of Sales 12912 13509 14112 15485 20%
Selling, general and admnistrative 10074 10102 10615 10468 4%
Research and Development 10339 9752 9872 13558 31%
Restructuring costs 776 632 638 578 -26%
Other (income) expense, net -500 -402 139 -886 77%
33601 33593 35376 39203 17%
Income Before Taxes 6521 8701 11464 8791 35%
Taxes on Income 4103 2508 1687 1709 -58%
Net Income 2418 6193 9777 7082 193%
Less: Net Income (Loss) Attributable to Noncontrolling Interests 24 -27 -66 15 -38%
Net Income Attributable to Merck & Co., Inc 2394 6220 9843 7067 195%
Basic Earnings per Common Share Attributable to Merck & Co., Inc. Common Shareholders 0.88 2.34 3.84 2.79 217%
Earnings per Common Share Assuming Dilution Attributable to Merck & Co., Inc. Common Shareholders 0.87 2.32 3.81 2.78 220%

6
Appendix 7: Cash Flow Statement as Reported
Appendix 8: Reformulated Cash Flow Statement
Consolidated Statement of Cash Flows ($ in millions except per share amounts) 2017 2018 2019 2020
Cash Flows from Operating Activities
Net income 2418 6193 9777 7082
Adjustments to reconcile net income to net cash provided by operating activities:
Amortization 3221 3103 1973 1899
Depreciation 1455 1416 1679 1726
Intangible asset impairment charges 646 296 1040 1718
Change for the acquisition of VelosBio, Inc. 2660
Charge for the acquisition of Peloton Therapeutics, Inc 993
Charge for future payments related to collaboration license options 500 650
Deferred income taxes -2621 -509 -556 -668
Share-based compensation 312 348 417 475
Other 190 978 184 -49
Net changes in assets and liabilities:
Accounts receivable 297 -418 294 1002
Inventories -145 -911 -508 -855
Trade accounts payable 254 230 399 724
Accrued and other current liabilities -922 -341 376 -1138
Income taxes payable -3291 827 -2359 560
Noncurrent liabilities -123 -266 -237 -453
Other -1087 -674 -32 -2426
Net Cash Provided by Operating Activities 6451 10922 13440 10253
Cash Flows from Investing Activities
Capital expenditures -1888 -2615 -3473 -4684
Purchase of Seagen Inc. common stock -1000
Purchases of securities and other investments -10739 -7994 -3202 -95
Proceeds from sales of securities and other investments 15664 15252 8622 2812
Acquisition of VelosBio Inc., net of cash acquired -2696
Acquisition of ArQule, Inc., net of cash acquired -2545
Acquisition of Antelliq Corporation, net of cash acquired -3620
Acquisition of Peloton Therapeutics, Inc., net of cash acquired -1040
Other acquisitions, net of cash acquired -396 -431 -294 -1365
Other 38 102 378 130
Net Cash (Used in) Provided by Investing Activities 2679 4314 -2629 -9443
Cash Flows from Financing Activities
Net change in short-term borrowings -26 5124 -3710 2549
Payments on debt -1103 -4287 -1957
Proceeds from issuance of debt 4958 4419
Purchases of treasury stock -4014 -9091 -4780 -1281
Dividends paid to stockholders -5167 -5172 -5695 -6215
Proceeds from exercise of stock options 499 591 361 89
Other -195 -325 5 -438
Net Cash Used in Financing Activities -10006 -13160 -8861 -2832
Effect of Exchange Rate Changes on Cash, Cash Equivalents and Restricted Cash 457 -205 17 253
Net Increase (Decrease) in Cash, Cash Equivalents and Restricted Cash -419 1871 1967 -1769
Cash, Cash Equivalents and Restricted Cash at Beginning of Year (includes $268 of restricted cash at January 1, 2020 included in Other Assets) 6515 6096 7967 9934
Cash, Cash Equivalents and Restricted Cash at End of Year (includes $103 of restricted cash at December 31, 2020 included in Other Assets) 6096 7967 9934 8165
2017 2018 2019 2020 2021F 2022F 2023F 2024F 2025F 2026F 2027F 2028F 2029F 2030F
Operational Cash Flow Statement
NOPLAT (adjusted for operating cash taxes) 7569 9556 6990 7132 7218 7609 8231 8621 9085 9602 10090 10623 11182
Depreciation and amortization 1352 1593 1602 1802 1785 1907 2051 2187 2319 2456 2598 2746 2902
Gross Cash Flow 8921 11149 8592 8934 9003 9515 10282 10808 11404 12058 12688 13369 14083
Invested Capital - Net PP&E 2204 3355 4535 535 2922 3262 3318 3422 3604 3787 3989 4199 4418
Invested Capital - Operating Leases (net) 111 46 -65 -386 -163 -425 -163 3288 0 0 -871 196 205
Invested Capital - Goodwill 18284 18253 19425 20238 20238 20238 20238 20238 20238 20238 20238 20238 20238 20238
Invested Capital - NWC and Others 11401 8705 9225 12879 11882 12690 13653 14554 15432 16345 17291 18280 19312 20389
Investment - Goodwill, Operating Leases, NWC and Others -2728 1692 4467 -997 808 964 901 878 913 946 988 1032 1078
Investment Cash Flow 412 -5093 -8937 847 -3566 -3801 -4056 -7587 -4517 -4733 -4105 -5427 -5700
Free Cash Flow Core Business 9334 6057 -345 9781 5437 5714 6227 3220 6887 7324 8583 7942 8383
Non Core Business Cash Flow Statement
Non-core Result -2121 -1145 278 301 350 691 811 665 740 759 743 778 792 804
Invested Capital 15918 7933 3744 2653 2361 2468 2596 2715 2832 2953 3079 3210 3347 3490
Investment Cash Flow 7985 4189 1091 292 -107 -128 -119 -116 -121 -126 -131 -137 -143
Free Cash Flow Non Core Business 6840 4467 1392 642 584 683 546 623 638 618 647 655 661
Free Cash Flow 16174 10524 1047 10423 6022 6397 6772 3844 7525 7942 9230 8598 9044
Financial Cash Flow Statement
Noncontrolling interests -25 -21 -22 17 18 19 20 22 23 24 26 27 28
Financial Result -481 -592 -705 -650 -768 -811 -862 -912 -956 -1001 -1048 -1097 -1148 -1200
Net Financial Assets -25578 -23516 -23707 -30548 -26931 -28105 -29368 -30689 -35360 -36790 -38259 -38914 -40699 -42556
Investment in Net Financial Assets 2062 -192 -6841 3617 -1174 -1263 -1321 -4672 -1430 -1468 -656 -1785 -1857
Net Cash transactions with Shareholders -13494 -9989 -7216 -6056 -6403 -6816 -7202 -7581 -7977 -8386 -8814 -9262 -9729
Financing Cash Flow -16174 -10524 -1047 -10423 -6022 -6397 -6772 -3844 -7525 -7942 -9230 -8598 -9044

7
Appendix 9: Shareholder’s Equity Statement as Reported
Appendix 10: Reformulated Shareholder’s Equity Statement
Consolidated Statement of Equity ($ in millions except per share amounts) Common Stock Other Paid-In Capital Retained Earnings Accumulated Other Comprehensive Loss Treasury Stock Non-controlling Interests Total
Balance December 31, 2017 1788 39902 41350 ´-4910 -43794 233 34569
Net Income attributable to Merck & Co., Inc 6220 6220
Adoption of new accounting standards 322 -274 48
Other comprehensive loss, net of taxes -361 -361
Cash dividends declared on common stock ($1.99 per share) -5313 -5313
Treasury stock shares purchased -1000 -8091 -9091
Net loss attributable to noncontrolling interests -27 -27
Distributions attributable to noncontrolling interests -25 -25
Share-based compensation plans and other -94 956 862
Balance December 31, 2018 1788 38808 42579 -5545 -50929 181 26882
Net Income attributable to Merck & Co., Inc 9843 9843
Other comprehensive loss, net of taxes -648 -648
Cash dividends declared on common stock ($1.99 per share) -5820 -5820
Treasury stock shares purchased 1000 -5780 -4780
Net loss attributable to noncontrolling interests -66 -66
Distributions attributable to noncontrolling interests -21 -21
Share-based compensation plans and other -148 759 611
Balance December 31, 2019 1788 39660 46602 -6193 -55950 94 26001
Net Income attributable to Merck & Co., Inc 7067 7067
Other comprehensive loss, net of taxes -441 -441
Cash dividends declared on common stock ($1.99 per share) -6307 -6307
Treasury stock shares purchased -1281 -1281
Net loss attributable to noncontrolling interests 15 15
Distributions attributable to noncontrolling interests -22 -22
Share-based compensation plans and other -72 444 372
Balance December 31, 2020 1788 39588 47362 -6634 -56787 87 25404
2017 2018 2019 2020 2021F 2022F 2023F 2024F 2025F 2026F 2027F 2028F 2029F 2030F
Begining Equity 34569 26882 26001 25404 26079 26793 27553 28356 29201 30091 31026 32008 33041
Comprehensive Income (loss) 5859 9195 6626 6729 7114 7574 8002 8424 8863 9318 9794 10291 10810
Net Income 6220 9843 7067
Other comprehensive income (loss) -361 -648 -441
Net Transactions to Shareholders -13494 -9989 -7216 -6056 -6403 -6816 -7202 -7581 -7977 -8386 -8814 -9262 -9729
Share Issues 862 611 372
Share Repurchases -9091 -4780 -1281
Dividends -5313 -5820 -6307
Other 48 0 0
Noncontrolling interests -52 -87 -7 2 2 3 3 3 3 3 3 4 4
Ending Equity 26882 26001 25404 26079 26793 27553 28356 29201 30091 31026 32008 33041 34126

8
Appendix 11: Adjustments
($ in millions)
Deferred income taxes at December 31 consisted of: Assets Liabilities Assets Liabilities Assets Liabilities Assets Liabilities
Product intangibles and licenses 307 2256 720 1640 442 1778 141 1250
Inventory related 29 499 32 377 32 354 43 335
Accelerated depreciation 28 642 582 594 588
Equity investments 175
Pensions and other postretirement benefits 498 192 565 151 785 191 834 248
Compensation related 314 291 322 252
Unrecognized tax benefits 156 174 109 117
Net operating losses and other tax credit carryforwards 654 715 897 794
Other 909 52 621 66 764 84 808 81
Subtotal 2895 3641 3118 2816 3351 3001 2989 2677
Valuation allowance -900 -1348 -1101 -433
Total deferred taxes 1995 3641 1770 2816 2250 3001 2556 2677
Net deferred income taxes 1646 1046 750 121
Recognized as:
Other assets 573 656 719 894
Deferred Income Taxes 2219 1702 1470 1015
2017 2018 2019 2020
Deferred Tax Assets 2017 2018 2019 2020
Product intangibles and licenses 307 720 442 141
Inventory related 29 32 32 43
Accelerated depreciation 28 0 0 0
Equity investments 0 0 0 0
Pensions and other postretirement benefits 498 565 785 834
Compensation related 314 291 322 252
Unrecognized tax benefits 156 174 109 117
Net operating losses and other tax credit carryforwards 654 715 897 794
Other 909 621 764 808
Subtotal 2895 3118 3351 2989
Valuation allowance -900 -1348 -1101 -433
Total 1995 1770 2250 2556
Operating Tax Assets 364 752 474 184
2017 2018 2019 2020
Product intangibles and licenses 2256 1640 1778 1250
Inventory related 499 377 354 335
Accelerated depreciation 642 582 594 588
Equity investments 0 0 0 175
Pensions and other postretirement benefits 192 151 191 248
Compensation related 0 0 0 0
Unrecognized tax benefits 0 0 0 0
Net operating losses and other tax credit carryforwards 0 0 0 0
Other 52 66 84 81
Subtotal 3641 2816 3001 2677
Valuation allowance 0 0 0 0
Total 3641 2816 3001 2677
Operating Tax Liabilities 3397 2599 2726 2173
2017 2018 2019 2020 2021F 2022F 2023F 2024F 2025F 2026F 2027F 2028F 2029F 2030F
Operating deferred Tax Assets, Net -3033 -1847 -2252 -1989 -1777 -1898 -2130 -2208 -2353 -2507 -2637 -2793 -2953 -3114
-50.4% -22.3% -19.4% -25.2% -22.3% -22.3% -23.2% -22.6% -22.7% -22.8% -22.7% -22.8% -22.8% -22.8%
Increase (Decrease) in operating deferred taxes 625 1186 -405 263 212 -121 -232 -78 -144 -155 -130 -156 -160 -161
Nonoperating tax assets 1631 1018 1776 2372
Nonoperating tax liabilities 244 217 275 504
1387 801 1501 1868 1576 1683 1811 1930 2047 2168 2294 2425 2562 2705
-1646 -1046 -751 -121 -201 -215 -319 -278 -306 -339 -344 -368 -391 -410
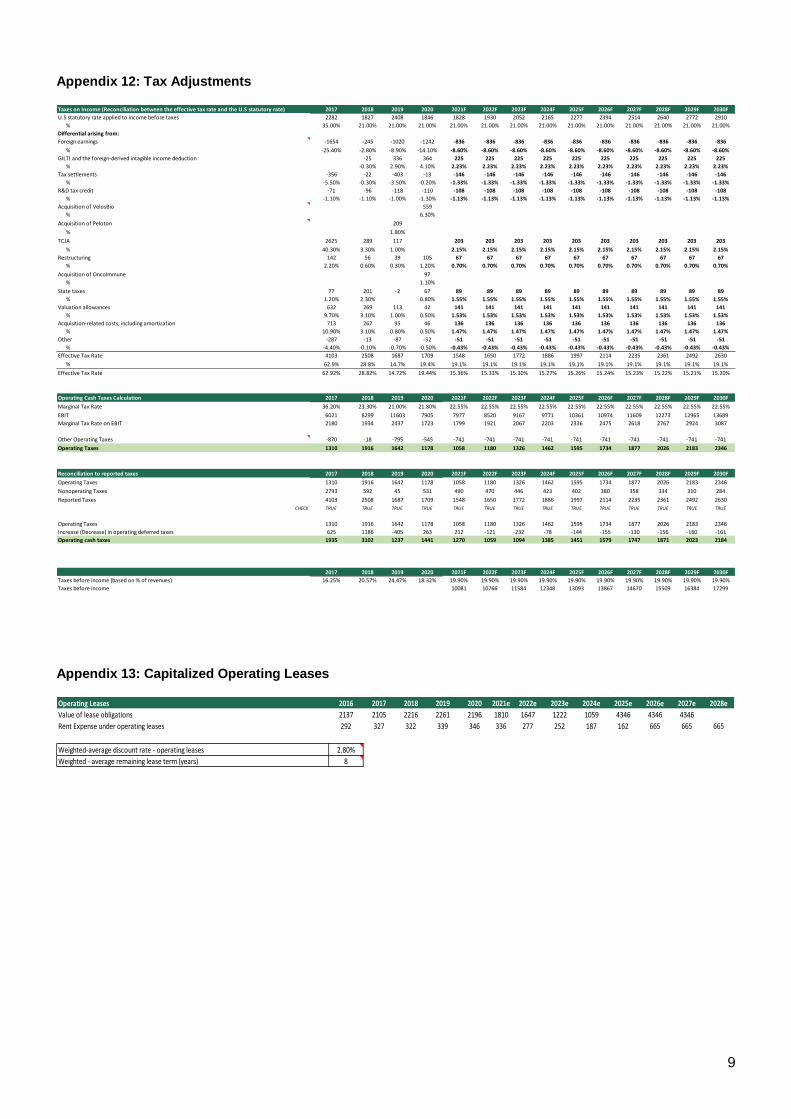
9
Appendix 12: Tax Adjustments
Appendix 13: Capitalized Operating Leases
Taxes on Income (Reconciliation between the effective tax rate and the U.S statutory rate) 2017 2018 2019 2020 2021F 2022F 2023F 2024F 2025F 2026F 2027F 2028F 2029F 2030F
U.S statutory rate applied to income before taxes 2282 1827 2408 1846 1828 1930 2052 2165 2277 2394 2514 2640 2772 2910
% 35.00% 21.00% 21.00% 21.00% 21.00% 21.00% 21.00% 21.00% 21.00% 21.00% 21.00% 21.00% 21.00% 21.00%
Differential arising from:
Foreign earnings -1654 -245 -1020 -1242 -836 -836 -836 -836 -836 -836 -836 -836 -836 -836
% -25.40% -2.80% -8.90% -14.10% -8.60% -8.60% -8.60% -8.60% -8.60% -8.60% -8.60% -8.60% -8.60% -8.60%
GILTI and the foreign-derived intagible income deduction -25 336 364 225 225 225 225 225 225 225 225 225 225
% -0.30% 2.90% 4.10% 2.23% 2.23% 2.23% 2.23% 2.23% 2.23% 2.23% 2.23% 2.23% 2.23%
Tax settlements -356 -22 -403 -13 -146 -146 -146 -146 -146 -146 -146 -146 -146 -146
% -5.50% -0.30% -3.50% -0.20% -1.33% -1.33% -1.33% -1.33% -1.33% -1.33% -1.33% -1.33% -1.33% -1.33%
R&D tax credit -71 -96 -118 -110 -108 -108 -108 -108 -108 -108 -108 -108 -108 -108
% -1.10% -1.10% -1.00% -1.30% -1.13% -1.13% -1.13% -1.13% -1.13% -1.13% -1.13% -1.13% -1.13% -1.13%
Acquisition of VelosBio 559
% 6.30%
Acquisition of Peloton 209
% 1.80%
TCJA 2625 289 117 203 203 203 203 203 203 203 203 203 203
% 40.30% 3.30% 1.00% 2.15% 2.15% 2.15% 2.15% 2.15% 2.15% 2.15% 2.15% 2.15% 2.15%
Restructuring 142 56 39 105 67 67 67 67 67 67 67 67 67 67
% 2.20% 0.60% 0.30% 1.20% 0.70% 0.70% 0.70% 0.70% 0.70% 0.70% 0.70% 0.70% 0.70% 0.70%
Acquisition of Oncolmmune 97
% 1.10%
State taxes 77 201 -2 67 89 89 89 89 89 89 89 89 89 89
% 1.20% 2.30% 0.80% 1.55% 1.55% 1.55% 1.55% 1.55% 1.55% 1.55% 1.55% 1.55% 1.55%
Valuation allowances 632 269 113 42 141 141 141 141 141 141 141 141 141 141
% 9.70% 3.10% 1.00% 0.50% 1.53% 1.53% 1.53% 1.53% 1.53% 1.53% 1.53% 1.53% 1.53% 1.53%
Acquisition-related costs, including amortization 713 267 95 46 136 136 136 136 136 136 136 136 136 136
% 10.90% 3.10% 0.80% 0.50% 1.47% 1.47% 1.47% 1.47% 1.47% 1.47% 1.47% 1.47% 1.47% 1.47%
Other -287 -13 -87 -52 -51 -51 -51 -51 -51 -51 -51 -51 -51 -51
% -4.40% -0.10% -0.70% -0.50% -0.43% -0.43% -0.43% -0.43% -0.43% -0.43% -0.43% -0.43% -0.43% -0.43%
Effective Tax Rate 4103 2508 1687 1709 1548 1650 1772 1886 1997 2114 2235 2361 2492 2630
% 62.9% 28.8% 14.7% 19.4% 19.1% 19.1% 19.1% 19.1% 19.1% 19.1% 19.1% 19.1% 19.1% 19.1%
Effective Tax Rate 62.92% 28.82% 14.72% 19.44% 15.36% 15.33% 15.30% 15.27% 15.26% 15.24% 15.23% 15.22% 15.21% 15.20%
Operating Cash Taxes Calculation 2017 2018 2019 2020 2021F 2022F 2023F 2024F 2025F 2026F 2027F 2028F 2029F 2030F
Marginal Tax Rate 36.20% 23.30% 21.00% 21.80% 22.55% 22.55% 22.55% 22.55% 22.55% 22.55% 22.55% 22.55% 22.55% 22.55%
EBIT 6021 8299 11603 7905 7977 8520 9167 9771 10361 10974 11609 12273 12965 13689
Marginal Tax Rate on EBIT 2180 1934 2437 1723 1799 1921 2067 2203 2336 2475 2618 2767 2924 3087
Other Operating Taxes -870 -18 -795 -545 -741 -741 -741 -741 -741 -741 -741 -741 -741 -741
Operating Taxes 1310 1916 1642 1178 1058 1180 1326 1462 1595 1734 1877 2026 2183 2346
Reconciliation to reported taxes 2017 2018 2019 2020 2021F 2022F 2023F 2024F 2025F 2026F 2027F 2028F 2029F 2030F
Operating Taxes 1310 1916 1642 1178 1058 1180 1326 1462 1595 1734 1877 2026 2183 2346
Nonoperating Taxes 2793 592 45 531 490 470 446 423 402 380 358 334 310 284
Reported Taxes 4103 2508 1687 1709 1548 1650 1772 1886 1997 2114 2235 2361 2492 2630
CHECK TRUE TRUE TRUE TRUE TRUE TRUE TRUE TRUE TRUE TRUE TRUE TRUE TRUE TRUE
Operating Taxes 1310 1916 1642 1178 1058 1180 1326 1462 1595 1734 1877 2026 2183 2346
Increase (Decrease) in operating deferred taxes 625 1186 -405 263 212 -121 -232 -78 -144 -155 -130 -156 -160 -161
Operating cash taxes 1935 3102 1237 1441 1270 1059 1094 1385 1451 1579 1747 1871 2023 2184
2017 2018 2019 2020 2021F 2022F 2023F 2024F 2025F 2026F 2027F 2028F 2029F 2030F
Taxes before income (based on % of revenues) 16.25% 20.57% 24.47% 18.32% 19.90% 19.90% 19.90% 19.90% 19.90% 19.90% 19.90% 19.90% 19.90% 19.90%
Taxes before income 10081 10766 11584 12348 13093 13867 14670 15509 16384 17299
Operating Leases 2016 2017 2018 2019 2020 2021e 2022e 2023e 2024e 2025e 2026e 2027e 2028e
Value of lease obligations 2137 2105 2216 2261 2196 1810 1647 1222 1059 4346 4346 4346
Rent Expense under operating leases 292 327 322 339 346 336 277 252 187 162 665 665 665
Weighted-average discount rate - operating leases 2.80%
Weighted - average remaining lease term (years) 8

10
Appendix 14: Key Financial Ratios
RATIOS Description 2017 2018 2019 2020 2021F 2022F 2023F 2024F 2025F 2026F 2027F 2028F 2029F 2030F
Activity
Collection Period (days) Time to collect its Accounts Receivable 62.5 60.2 54.0 55.6 58.1 57.8 57.6 57.9 58.0 58.0 58.1 58.1 58.1 58.1
Total assets turnover (x)How effeciently is the company using its current
and fixed assets to generate revenue0.7 0.8 0.9 0.9 0.9 1.0 1.0 1.1 1.1 1.1 1.1 1.1 1.1 1.2
Inventory Turnover (x) 2.5 2.6 2.5 2.5 2.5 2.6 2.6 2.6 2.6 2.6 2.6 2.6 2.6 2.6
Days of inventory at hand (DOH) 144.1 142.3 147.7 144.8 143.3 140.9 140.4 141.1 141.4 141.5 141.6 141.6 141.7 141.7
Receivables Turnover (x) 5.8 6.1 6.8 6.6 6.3 6.3 6.3 6.3 6.3 6.3 6.3 6.3 6.3 6.3
Days of sales outstanding (DSO) 62.5 60.2 54.0 55.6 58.1 57.8 57.6 57.9 58.0 58.0 58.1 58.1 58.1 58.1
Payables Turnover (x) 4.2 4.2 4.0 3.7 3.8 4.2 4.3 4.2 4.2 4.2 4.2 4.2 4.2 4.2
Number of days of payables (days) 87.7 86.7 91.3 98.2 95.7 86.0 85.7 86.1 86.3 86.3 86.4 86.4 86.5 86.5
Operating Cash Conversion Cycle (days)Time between the cash paid and the cash
received118.9 115.8 110.4 102.3 105.7 112.7 112.3 112.9 113.1 113.2 113.3 113.3 113.3 113.4
Liquidity
Current Ratio (x) Ability to pay its current liabilities 1.2 1.2 1.1 1.1 1.1 1.1 1.1 1.1 1.1 1.1 1.1 1.1 1.1 1.1
Quick Ratio (x)Ability to pay it current liabilities with more liquid
assets0.8 0.8 0.7 0.7 0.8 0.8 0.8 0.8 0.8 0.8 0.8 0.8 0.8 0.8
Cash Ratio (x)Ability to pay its current liabilities with cash or
cash equivalents0.4 0.5 0.6 0.4 0.5 0.5 0.5 0.5 0.5 0.5 0.5 0.4 0.4 0.4
Profitability
Gross profit margin (%)Percentage of revenue available to spend on
operating expenses, other expenses and cash67.8% 68.1% 69.9% 67.7% 67.7% 67.7% 67.7% 67.7% 67.7% 67.7% 67.7% 67.7% 67.7% 67.7%
Operating EBITDA Margin (%)How much the company is eaearing before
interest, taxes, depreciation and amortization18.4% 22.8% 28.2% 19.8% 19.3% 19.1% 19.0% 19.1% 19.1% 19.1% 19.1% 19.1% 19.1% 19.1%
Operating EBIT Margin (%)How much the company is earning before interest
and taxes 15.0% 19.6% 24.8% 16.5% 15.8% 15.8% 15.8% 15.8% 15.8% 15.8% 15.8% 15.8% 15.8% 15.8%
NOPAT ($M) Net Operating Profit After Tax (Adjusted) 5336 7569 9556 6990 7132 7218 7609 8231 8621 9085 9602 10090 10623 11182
IC ($M) Total Invested Capital 60147 50398 49708 55952 53011 54898 56921 59045 64561 66881 69284 70923 73740 76682
ROIC (%) Return on Invested Capital 8.9% 15.0% 19.2% 12.5% 13.5% 13.1% 13.4% 13.9% 13.4% 13.6% 13.9% 14.2% 14.4% 14.6%
NI margin (%) Net Profit Margin 6.0% 14.6% 20.9% 14.8% 14.1% 13.9% 13.7% 13.6% 13.4% 13.3% 13.2% 13.1% 13.0% 12.9%
ROA (%) Return on Assets 4.3% 9.7% 14.0% 9.1% 9.7% 9.8% 9.9% 9.9% 9.6% 9.7% 9.7% 9.8% 9.8% 9.8%
ROE (%) Return on Equity 7.0% 23.2% 37.7% 28.0% 27.4% 28.1% 29.0% 29.7% 30.3% 30.9% 31.4% 31.9% 32.4% 32.9%
NI/S (%) Net Profit Margin 6.0% 14.6% 20.9% 14.8% 14.1% 13.9% 13.7% 13.6% 13.4% 13.3% 13.2% 13.1% 13.0% 12.9%
S/TA (%) Total assets turnover 45.7% 49.6% 56.1% 54.5% 56.2% 59.6% 60.8% 61.4% 62.1% 62.8% 63.5% 64.2% 64.8% 65.5%
TA/E (%) Equity Multiplier 255.9% 319.3% 322.4% 347.6% 345.4% 339.0% 347.6% 356.1% 362.7% 368.4% 373.9% 379.1% 384.2% 389.1%
DuPont analysis Profitability detailed assessment 7.0% 23.2% 37.7% 28.0% 27.4% 28.1% 29.0% 29.7% 30.3% 30.9% 31.4% 31.9% 32.4% 32.9%
SG&A/Sales (%) 25.1% 23.9% 22.7% 21.8% 22.2% 22.2% 22.2% 22.2% 22.2% 22.2% 22.2% 22.2% 22.2% 22.2%
R&D/Sales (%) 25.8% 23.1% 21.1% 28.2% 28.2% 28.2% 28.2% 28.2% 28.2% 28.2% 28.2% 28.2% 28.2% 28.2%
SolvencyFirm's ability to meet its long-term debt
obligations
Debt-to-assets Percentage of total assets financed by debt 40.6% 49.8% 53.0% 56.8% 55.8% 56.9% 58.3% 59.5% 57.0% 57.6% 58.3% 59.6% 59.9% 60.3%
Debt-to-capital Firm's capital made up of debt 41.4% 48.3% 50.3% 55.6% 53.1% 53.8% 54.6% 55.3% 55.8% 56.2% 56.5% 56.9% 57.2% 57.5%
Debt-to-equity (x)Amount of debt compared to the amount of
equity0.7 0.9 1.0 1.3 1.1 1.2 1.2 1.2 1.3 1.3 1.3 1.3 1.3 1.4
Interest coverage (x) How can the company pay its interest expenses 8.0 10.8 13.0 9.5 8.1 8.1 8.2 8.3 8.4 8.5 8.6 8.7 8.8 8.8
Fixed charge coverage (x)How can the company pay its interest expenses
and fixed charges such as leases2.8 3.5 4.4 3.3 3.5 3.8 4.4 4.8 2.6 2.7 2.8 3.2 3.2 3.2
Debt to EBIDTA (x) Financial Leverage 3.3 2.6 2.0 3.3 3.0 3.0 3.0 3.0 2.9 2.9 2.9 2.8 2.8 2.8
Equity Multiplier (x)How is the company financing its assets via equity
1.7 1.9 1.9 2.2 2.0 2.0 2.1 2.1 2.2 2.2 2.2 2.2 2.2 2.2
Valuation Investors's return
Economic Value Added ($M) Its aims to measure the profitability of projects 5336 7569 9556 6990 7132 7218 7609 8231 8621 9085 9602 10090 10623 11182
Debt Coverage (%)How the company pays its debt obligations with
its operating income29% 37% 48% 29% 32% 32% 32% 33% 33% 33% 34% 34% 34% 35%
Growth Ratios
Sales Growth (%) 5.4% 10.7% 2.5% 5.5% 6.8% 7.6% 6.6% 6.0% 5.9% 5.8% 5.7% 5.6% 5.6%
Operating Income Growth (%) 41.8% 26.3% -26.9% 2.0% 1.2% 5.4% 8.2% 4.7% 5.4% 5.7% 5.1% 5.3% 5.3%
EBITDA Growth 30.4% 36.7% -28.0% 2.9% 5.4% 7.5% 6.8% 6.1% 5.9% 5.8% 5.7% 5.7% 5.6%
Net Income Growth 156.1% 57.9% -27.6% 1.0% 5.4% 6.1% 5.3% 5.0% 5.0% 4.9% 4.9% 4.9% 4.8%
EPS Growth (%) 165.9% 64.1% -27.3% 1.0% 5.4% 6.1% 5.3% 5.0% 5.0% 4.9% 4.9% 4.9% 4.8%
Working Caoital Growth (%) -14.7% -60.8% 52.1% 78.3% 6.8% 7.6% 6.6% 6.0% 5.9% 5.8% 5.7% 5.6% 5.6%
Efficiency Ratios - How the company uses its resources
Ability to generate profits
Number of times the inventory was turned over
during the fiscal year
Time between the sale and the cash collection
Average number of days the company takes to
pay its suppliers
Firm's ability to meet short-term obligations - how fast can assets be converted into cash

11
Appendix 15: Forecasting Assumptions – Revenues
Notes Source/Rational
SALES
Total Sales are expected to reach a value between 51.8 and 53.8 billion dollars according
to the board. Covid 19 slowed down sales, so it is wise to project a number closer to 51.8
billion dollars, and also look back at 2019 to verify the pattern before the pandemic. This
covid 19 impact on the company's 2020 revenue is well documented in the annual report.
The $1.7Bn deviation in 2020 is not expected to happen as covid programs were cancelled
in 2021, which will stabilize the forecasts. However, projection will not be close to 53.8Bn
for FY2021, due to this event and market conditions.
The final total sales are computed by summing the two major segments.
MarketLine, Statista
and IMF
Global Pharmaceutical market value MarketLine Forecast
Merck Pharmaceutical Sales
Merck's market share has been increasing for the past 3/4 years, and the recent
developments and agreements on products like Keytruda, Lynoarza and Lenvim can
confer a comfortable position for the next 5 years. YoY is based on historical values
YoY historical
average
Global Animal Health Sales Statista and IMF
(Inflation forecast)
Merck Animal Health Sales
As stated in Total Sales, revenues slowed down in 2020 due to covid, but they are
expected to increase in the future, due to Merck's leading position in the market and due to
the 17 new product approvals in 2020. This, aligned with the 4 key development business
transactions, will mostly likely result in a bounce back from the company in 2021 onwards.
The board has also stated this segment has been outperforming all expectations. Based
on this, it can be expected a growth of 0.4% YoY that will allow the company to get back to
a 12% market share. This is also aligned with the pre-pandemic growth.
YoY historical value
before the pandemic
Appendix 16: Revenues Forecasts – Global Pharmaceutical and Animal Health market value
($ in millions) 2020 2021F 2022F 2023F 2024F 2025F 2026F 2027F 2028F 2029F 2030F
Global pharmaceuticals market
value
106780
0
108660
0
111320
0
115000
0
119150
0
122819
8
126565
8
130362
8
134273
7
138301
9
142451
0
YoY 0.97% 1.76% 2.45% 3.31% 3.61% 3.08% 3.05% 3% 3% 3% 3%
($ in millions) 2020 2021F 2022F 2023F 2024F 2025F 2026F 2027F 2028F 2029F 2030F
Global Animal Health market value 42700 48000 54100 61000 62891 64828 66805 68809 70874 73000 75190
YoY 12.37% 12.41% 12.71% 12.75% 3.10% 3.08% 3.05% 3.00% 3.00% 3.00% 3.00%
Source: Statista, Statista and IMF (Global Inflation)
Appendix 17: Revenues Forecasts –Merck
($ in millions) 2020 2021F 2022F 2023F 2024F 2025F 2026F 2027F 2028F 2029F 2030F
Total Sales 47994 50648 54090 58198 62036 65778 69671 73704 77917 82316 86909
Pharmaceutical 43021 45169 47699 50747 54103 57341 60709 64199 67843 71648 75620
%Market value 4.029% 4.157% 4.285% 4.413% 4.541% 4.669% 4.797% 4.925% 5.053% 5.181% 5.308%
YoY 0.081% 0.128% 0.128% 0.128% 0.128% 0.128% 0.128% 0.128% 0.128% 0.128% 0.128%
Animal Health 4703 5479 6391 7451 7933 8437 8961 9505 10074 10668 11289
%Market value 11.01% 11.414% 11.814% 12.214% 12.614% 13.014% 13.414% 13.814% 14.214% 14.614% 15.014%
YoY -0.55% 0.40% 0.40% 0.40% 0.40% 0.40% 0.40% 0.40% 0.40% 0.40% 0.40%
Appendix 18: Forecasting Assumptions – Reformulated Income Statement
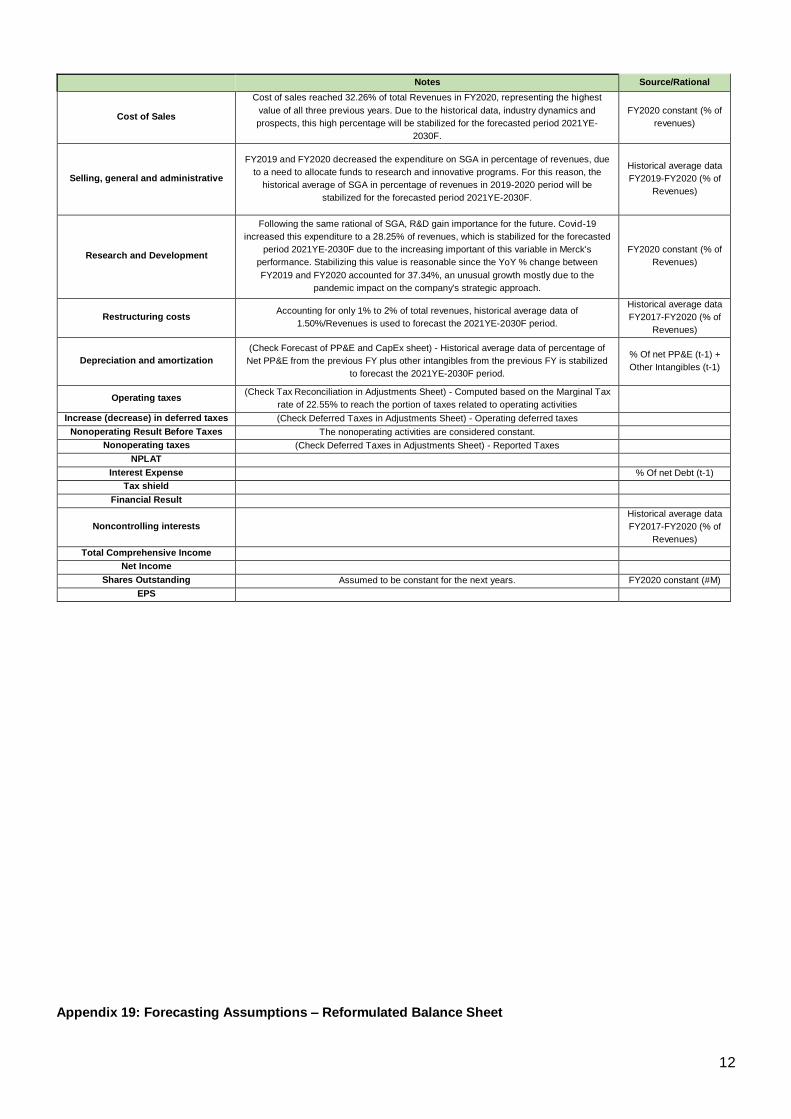
12
Notes Source/Rational
Cost of Sales
Cost of sales reached 32.26% of total Revenues in FY2020, representing the highest
value of all three previous years. Due to the historical data, industry dynamics and
prospects, this high percentage will be stabilized for the forecasted period 2021YE-
2030F.
FY2020 constant (% of
revenues)
Selling, general and administrative
FY2019 and FY2020 decreased the expenditure on SGA in percentage of revenues, due
to a need to allocate funds to research and innovative programs. For this reason, the
historical average of SGA in percentage of revenues in 2019-2020 period will be
stabilized for the forecasted period 2021YE-2030F.
Historical average data
FY2019-FY2020 (% of
Revenues)
Research and Development
Following the same rational of SGA, R&D gain importance for the future. Covid-19
increased this expenditure to a 28.25% of revenues, which is stabilized for the forecasted
period 2021YE-2030F due to the increasing important of this variable in Merck's
performance. Stabilizing this value is reasonable since the YoY % change between
FY2019 and FY2020 accounted for 37.34%, an unusual growth mostly due to the
pandemic impact on the company's strategic approach.
FY2020 constant (% of
Revenues)
Restructuring costs Accounting for only 1% to 2% of total revenues, historical average data of
1.50%/Revenues is used to forecast the 2021YE-2030F period.
Historical average data
FY2017-FY2020 (% of
Revenues)
Depreciation and amortization
(Check Forecast of PP&E and CapEx sheet) - Historical average data of percentage of
Net PP&E from the previous FY plus other intangibles from the previous FY is stabilized
to forecast the 2021YE-2030F period.
% Of net PP&E (t-1) +
Other Intangibles (t-1)
Operating taxes (Check Tax Reconciliation in Adjustments Sheet) - Computed based on the Marginal Tax
rate of 22.55% to reach the portion of taxes related to operating activities
Increase (decrease) in deferred taxes (Check Deferred Taxes in Adjustments Sheet) - Operating deferred taxes
Nonoperating Result Before Taxes The nonoperating activities are considered constant.
Nonoperating taxes (Check Deferred Taxes in Adjustments Sheet) - Reported Taxes
NPLAT
Interest Expense % Of net Debt (t-1)
Tax shield
Financial Result
Noncontrolling interests
Historical average data
FY2017-FY2020 (% of
Revenues)
Total Comprehensive Income
Net Income
Shares Outstanding Assumed to be constant for the next years. FY2020 constant (#M)
EPS
Appendix 19: Forecasting Assumptions – Reformulated Balance Sheet

13
Notes Source/Rational
Operating cash Estimated at 2% of the total revenues as the different literature suggest
for operating cash computation.
McKinsey's 7th edition guide to
corporate valuation "Measuring and
Managing the Value of Companies" (%
of Revenues)
Accounts receivable, net FY2020 accounted for 60 average days receivable. FY2020 constant average number of
days receivable (#Days)
Inventories, net Historical average number of inventory days in FY2017-FY2020
accounted for 47 days.
Historical average number of inventory
days (#Days)
Other current assets Historical average of other current assets in proportion of total revenues
in FY2017-FY2020 accounted for 10.51%. % of Revenues
Payables
Covid-19 may have delayed certain payments to suppliers and other
entities. For this reason, only the historical average of days payable
from FY2017 to FY2019 are considered. This number accounted for 29
days.
Historical average number of days
payable FY2017-FY2019 (#Days)
Accrued and other current liabilities Historical average number of accrued and other liabilities days in
FY2017-FY2020 accounted for 95 days.
Historical average number of accrued
and other liabilities days FY2017-
FY2019 (#Days)
Income Taxes payable Historical average number of income taxes payable days in FY2017-
FY2020 accounted for 10 days.
Historical average number of income
taxes payable days FY2017-FY2019
(#Days)
Property, plant and equipment, net Historical data average from FY2017-FY2020 resulted in a 33% of Total
Revenues
Historical average data FY2017-
FY2020 (% of Revenues)
Other Intangibles
FY2020 was excluded from the historical data average due to the
212.79% YoY increase when compared to FY2019. The average
accounted for 2.56%/Total Revenues
Historical average data FY2017-
FY2019 (% of Revenues)
Acquired Intangibles Historical data average from FY2017-FY2020 resulted in a 28.16% of
Total Revenues
Historical average data FY2017-
FY2020 (% of Revenues)
Other Assets, net Historical data average from FY2017-FY2020 resulted in a 12.33% of
Total Revenues
Historical average data FY2017-
FY2020 (% of Revenues)
Capitalized Operating Leases
Since the December 2019, accounting standards require companies to
incorporate their capitalized operating leases in the balance sheet.
Based on the weighted-average discount rate of operating leases and
weighted average remaining lease term (8 years in this case) included
in financial reports, it is possible to estimate the value of leases
obligations and rent expense under operating leases.
Merck's Financial Reports
Goodwill It is not possible to estimate the goodwill, so it assumed equal to
FY2020. FY2020 constant ($M)
Investments It is not possible to estimate future nonoperating investments, so it
assumed equal to FY2020. FY2020 constant ($M)
Nonoperating deferred tax assets, net (Check Deferred Taxes in Adjustments Sheet) - Nonoperating deferred
tax assets
Excess Cash
Difference between cash & cash equivalents/ short term investments
and operating cash for the historical years FY2017-FY2020. Forecasted
years 2021YE-2030F is computed using the historical average
percentage of Excess cash in terms of Net Debt, which is 36.41%
Historical average data FY2017-
FY2020 (% of Net Debt)
Dividends payable It is not possible to predict, so it is assumed as $1675M (Similar to the
previous Fiscal Year)
Operating DTLs, net of Operating DTAs (Check Deferred Taxes in Adjustments Sheet) - Operating Deferred Tax
Assets and Liabilities
Total Merck & Co., Inc. stockholders’
equity
Computation based on the addition of transactions made to
shareholders, the payout ratio and the total comprehensive income.
% Payout Ratio
FY2018 accounted for an excessive payout ratio of 230%, follow by a
ratio of 109% in FY2019 and FY2020. A payout ratio of 90% is assumed
in the forecasted period 2021YE-2030F following the approvals of
sustainable payment programs to shareholders.
Adjusted to 90%
Non-controlling interests Assumed to represent the same weight in terms of total revenues as the
one experienced in FY2020 FY2020 constant (% of Revenues)
Appendix 20: Forecasting Assumptions – Operating and Non-Operating Reformulation

14
Operating Assets (OA) 2020 2021F 2022F 2023F 2024F 2025F 2026F 2027F 2028F 2029F 2030F
Operating cash 960 1013 1082 1164 1241 1316 1393 1474 1558 1646 1738
Accounts receivable, net 7851 8285 8848 9520 10148 10760 11397 12057 12746 13466 14217
Inventories, net 6310 6518 6961 7489 7983 8465 8966 9485 10027 10593 11184
Other current assets 5541 5322 5684 6115 6519 6912 7321 7745 8187 8650 9132
Property, plant and equipment, net 17986 16719 17855 19211 20478 21713 22998 24330 25721 27173 28689
Other Intangibles 3228 1299 1387 1493 1591 1687 1787 1890 1999 2111 2229
Acquired Intangibles 11376 14263 15233 16390 17471 18524 19621 20757 21943 23182 24475
Other Assets 9317 6247 6672 7179 7652 8114 8594 9091 9611 10154 10720
Capitalized Operating Leases 2196 1810 1647 1222 1059 4346 4346 4346 3475 3671 3876
Goodwill 20238 20238 20238 20238 20238 20238 20238 20238 20238 20238 20238
Total Operating Assets 85003 81715 85607 90021 94380 102075
10666
1 111413 115504 120883 126499
Operating Liabilities (OL) 2020 2021F 2022F 2023F 2024F 2025F 2026F 2027F 2028F 2029F 2030F
Payables 4594 3977 4247 4570 4871 5165 5471 5787 6118 6464 6824
Accrued and other current liabilities 13053 13166 14060 15128 16126 17099 18111 19159 20254 21398 22591
Income Tax payable 1575 1428 1525 1641 1749 1855 1964 2078 2197 2321 2450
Other Liabilities 12482 12495 13344 14357 15304 16227 17188 18183 19222 20307 21440
Total Operating Liabilities 31704 31065 33177 35696 38051 40345 42733 45207 47791 50489 53307
Net Operating Assets - Invested
Capital Core Business 53299 50649 52430 54325 56329 61730 63928 66206 67713 70394 73192
Invested Capital (Non-Core
Business) 2020 2021F 2022F 2023F 2024F 2025F 2026F 2027F 2028F 2029F 2030F
Investments 785 785 785 785 785 785 785 785 785 785 785
Nonoperating deferred tax assets,
net 1868 1576 1683 1811 1930 2047 2168 2294 2425 2562 2705
Total Invested Capital Non-Core
Business 2653 2361 2468 2596 2715 2832 2953 3079 3210 3347 3490
Net Financial Assets (NFA) 2020 2021F 2022F 2023F 2024F 2025F 2026F 2027F 2028F 2029F 2030F
Excess Cash 7102 7889 8332 8862 9374 9825 10289 10776 11276 11796 12339
Short-term Debt -6431
Long-term Debt, net -25360
Total Debt -31791 -29558 -31217 -33202 -35120 -36811 -38551 -40376 -42247 -44196 -46229
Capitalized Operating Leases -2196 -1810 -1647 -1222 -1059 -4346 -4346 -4346 -3475 -3671 -3876
Dividends payable -1674 -1675 -1675 -1675 -1675 -1675 -1675 -1675 -1675 -1675 -1675
Operating DTLs, net of Operating
DTAs -1989 -1777 -1898 -2130 -2208 -2353 -2507 -2637 -2793 -2953 -3114
Total Financial Assets -30548 -26931 -28105 -29368 -30689 -35360 -36790 -38259 -38914 -40699 -42556
Total Common's Shareholder
Equity 25404 26079 26793 27553 28356 29201 30091 31026 32008 33041 34126
Total Invested Capital 2020 2021F 2022F 2023F 2024F 2025F 2026F 2027F 2028F 2029F 2030F

15
Invested Capital Core Business 53299 50649 52430 54325 56329 61730 63928 66206 67713 70394 73192
Invested Capital Core Business (excluding
Goodwill) 33061 30411 32192 34087 36091 41492 43690 45968 47475 50156 52954
Property, plant and equipment, net 17986 16719 17855 19211 20478 21713 22998 24330 25721 27173 28689
Working Capital 1440 2567 2741 2950 3144 3334 3531 3736 3949 4172 4405
Capitalized Operating Leases 2196 1810 1647 1222 1059 4346 4346 4346 3475 3671 3876
Goodwill 20238 20238 20238 20238 20238 20238 20238 20238 20238 20238 20238
Other Intangibles 14604 15562 16620 17882 19062 20212 21408 22647 23942 25293 26705
Other Assets, net -3165 -6247 -6672 -7179 -7652 -8114 -8594 -9091 -9611
-
10154
-
10720
Invested Capital Non Core Business 2653 2361 2468 2596 2715 2832 2953 3079 3210 3347 3490
Total Invested Capital 55952 53011 54898 56921 59045 64561 66881 69284 70923 73740 76682
Net Financial Assets
-
30548
-
26931
-
28105
-
29368
-
30689
-
35360
-
36790
-
38259
-
38914
-
40699
-
42556
Total Equity 25404 26079 26793 27553 28356 29201 30091 31026 32008 33041 34126
Appendix 21: Forecast of PP&E and CapEx
2020 2021F 2022F 2023F 2024F 2025F 2026F 2027F 2028F 2029F 2030F
Land 350 400 427 460 490 519 550 582 615 650 686
% of Revenues 0.73% 0.79% 0.79% 0.79% 0.79% 0.79% 0.79% 0.79% 0.79% 0.79% 0.79%
Buildings 12645 13716 14648 15761 16800 17814 18868 19960 21101 22292 23536
% of Revenues 26.35% 27.08% 27.08% 27.08% 27.08% 27.08% 27.08% 27.08% 27.08% 27.08% 27.08%
Machinery, equipment and office
furnishings 16649 17500 18690 20109 21435 22728 24073 25467 26922 28442 30029
% of Revenues 34.69% 34.55% 34.55% 34.55% 34.55% 34.55% 34.55% 34.55% 34.55% 34.55% 34.55%
Construction in progress 7324 5018 5359 5766 6146 6517 6903 7302 7720 8156 8611
% of Revenues 15.26% 9.91% 9.91% 9.91% 9.91% 9.91% 9.91% 9.91% 9.91% 9.91% 9.91%
PP&E 36968 36634 39124 42095 44872 47578 50394 53311 56358 59540 62862
% of revenues 77.03% 72.33% 72.33% 72.33% 72.33% 72.33% 72.33% 72.33% 72.33% 72.33% 72.33%
Less: accumulated depreciation 18982 19934 21289 22906 24417 25889 27421 29009 30667 32398 34206
% of Net PP&E 51.35% 54% 54% 54% 54% 54% 54% 54% 54% 54% 54%
Net PP&E 17986 16719 17855 19211 20478 21713 22998 24330 25721 27173 28689
37.48% 33.01% 33.01% 33.01% 33.01% 33.01% 33.01% 33.01% 33.01% 33.01% 33.01%
Acquired Intangibles 11376 14263 15233 16390 17471 18524 19621 20757 21943 23182 24475
% of revenues 23.70% 28.16% 28.16% 28.16% 28.16% 28.16% 28.16% 28.16% 28.16% 28.16% 28.16%
Other Intangibles (IPR&D) 3228 1299 1387 1493 1591 1687 1787 1890 1999 2111 2229
% of revenues 6.73% 2.56% 2.56% 2.56% 2.56% 2.56% 2.56% 2.56% 2.56% 2.56% 2.56%
Depreciation and amortization 1602 1802 1785 1907 2051 2187 2319 2456 2598 2746 2902
% of Net PP&E (t-1) + Other
Intangibles (t-1) 5.48% 5.53% 5.53% 5.53% 5.53% 5.53% 5.53% 5.53% 5.53% 5.53% 5.53%
Net Capex change -4943 -1494 -3980 -4525 -4498 -4571 -4800 -5027 -5283 -5550 -5829
% of revenues 10.55% 3.11% 7.86% 8.36% 7.73% 7.37% 7.30% 7.21% 7.17% 7.12% 7.08%
Appendix 22: Beta Regression
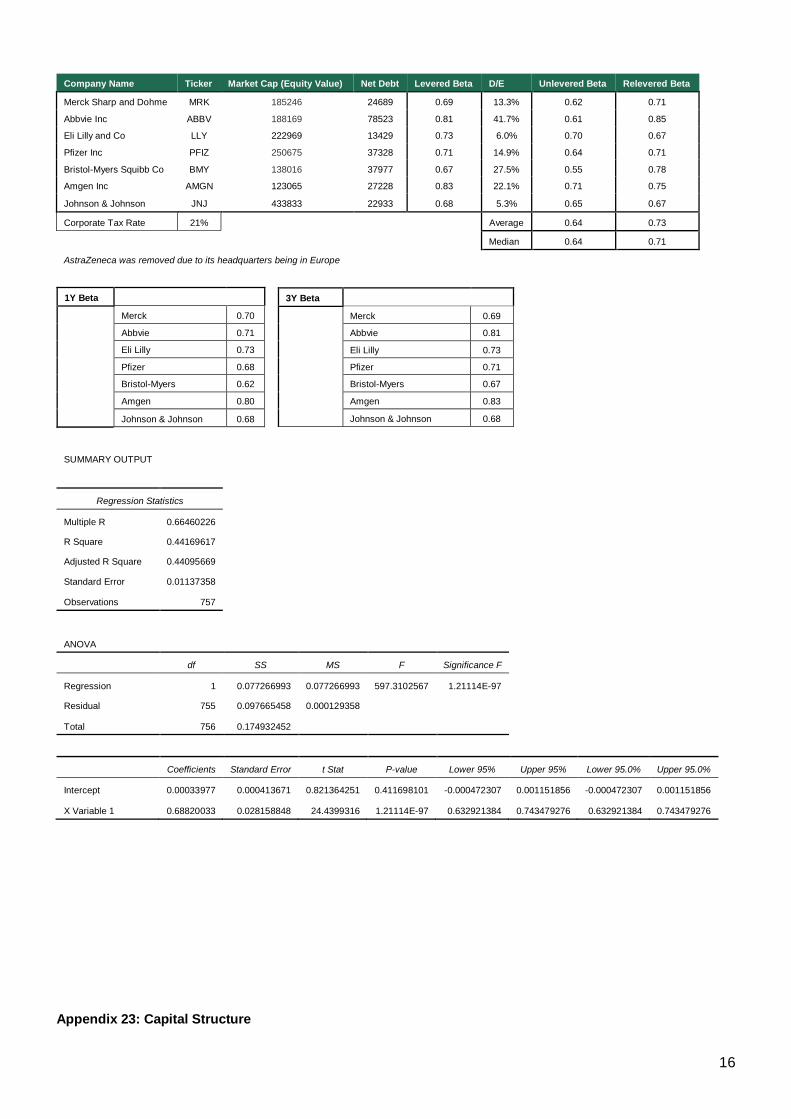
16
Company Name Ticker Market Cap (Equity Value) Net Debt Levered Beta D/E Unlevered Beta Relevered Beta
Merck Sharp and Dohme MRK 185246 24689 0.69 13.3% 0.62 0.71
Abbvie Inc ABBV 188169 78523 0.81 41.7% 0.61 0.85
Eli Lilly and Co LLY 222969 13429 0.73 6.0% 0.70 0.67
Pfizer Inc PFIZ 250675 37328 0.71 14.9% 0.64 0.71
Bristol-Myers Squibb Co BMY 138016 37977 0.67 27.5% 0.55 0.78
Amgen Inc AMGN 123065 27228 0.83 22.1% 0.71 0.75
Johnson & Johnson JNJ 433833 22933 0.68 5.3% 0.65 0.67
Corporate Tax Rate 21% Average 0.64 0.73
Median 0.64 0.71
AstraZeneca was removed due to its headquarters being in Europe
1Y Beta
Merck 0.70
Abbvie 0.71
Eli Lilly 0.73
Pfizer 0.68
Bristol-Myers 0.62
Amgen 0.80
Johnson & Johnson 0.68
SUMMARY OUTPUT
Regression Statistics
Multiple R 0.66460226
R Square 0.44169617
Adjusted R Square 0.44095669
Standard Error 0.01137358
Observations 757
ANOVA
df SS MS F Significance F
Regression 1 0.077266993 0.077266993 597.3102567 1.21114E-97
Residual 755 0.097665458 0.000129358
Total 756 0.174932452
Coefficients Standard Error t Stat P-value Lower 95% Upper 95% Lower 95.0% Upper 95.0%
Intercept 0.00033977 0.000413671 0.821364251 0.411698101 -0.000472307 0.001151856 -0.000472307 0.001151856
X Variable 1 0.68820033 0.028158848 24.4399316 1.21114E-97 0.632921384 0.743479276 0.632921384 0.743479276
Appendix 23: Capital Structure
3Y Beta
Merck 0.69
Abbvie 0.81
Eli Lilly 0.73
Pfizer 0.71
Bristol-Myers 0.67
Amgen 0.83
Johnson & Johnson 0.68

17
Merck's Bond Rating 2020 Source
Moody's A1 Moody's
S&P Global A+ S&P Global
(in millions of dollars) Dec-20 2021F 2022F 2023F 2024F 2025F 2026F 2027F 2028F 2029F 2030F
Price Per Share 77.90
Shares Outstanding 2538
Market Cap 197738 205488 210566 215644 220515 228265 233161 237907 241773 246388 250837
Net Debt 24689 21669 22885 24340 25747 26986 28262 29600 30972 32400 33891
Operating. Leases 2196 1810 1647 1222 1059 4346 4346 4346 3475 3671 3876
Total Debt 26885 23479 24532 25563 26805 31333 32608 33946 34447 36071 37767
EV 224623 233509 239279 245050 250585 259392 264956 270349 274742 279986 285042
E/EV 88.03% 88% 88% 88% 88% 88% 88% 88% 88% 88% 88%
ND/EV 10.99% 11% 11% 12% 12% 10% 10% 10% 11% 11% 11%
OL/EV 0.98% 0.78% 0.69% 0.50% 0.42% 1.68% 1.64% 1.61% 1.26% 1.31% 1.36%
TD/EV 11.97% 12% 12% 12% 12% 12% 12% 12% 12% 12% 12%
bu 0.64 0.64 0.64 0.64 0.64 0.64 0.64 0.64 0.64 0.64
be 0.73 0.73 0.73 0.73 0.73 0.73 0.73 0.73 0.73 0.73
Re 5.31% 5.31% 5.31% 5.31% 5.31% 5.31% 5.31% 5.31% 5.31% 5.31%
Rd 1.34% 1.34% 1.34% 1.34% 1.34% 1.34% 1.34% 1.34% 1.34% 1.34%
Rol 1.39% 1.39% 1.39% 1.39% 1.39% 1.39% 1.39% 1.39% 1.39% 1.39%
WACC t 4.80% 4.80% 4.80% 4.80% 4.80% 4.80% 4.80% 4.80% 4.80% 4.80%
Ru t 4.84% 4.84% 4.84% 4.84% 4.84% 4.84% 4.84% 4.84% 4.84% 4.84%
Rf 1.32% Bloomberg US 10y Bonds
MRP 5.50% Fernandez - USA
Relevered Equity Beta 0.73
Forward Looking Cost of Equity 5.31%
Rd 1.34%
YTM Merck & Co Corporate Bond 1.45% (2030, $750 millions) - Merck's Annual Report - Notes
Loss Given Default 68.18% moody's default report 28-feb-2020, exhibit 29 (sr. Unsec. Bond)
Probability of Default 0.16% Annualized A1 probability of default moody's 2020 report, exhibit 46
implied bd 0.003
Rol 1.387% yield of AA-rated debt using 10Y period
YTM 1.45% AA ytm 10 years bloomberg 31/12/2020
Loss Given Default 40.24% moody's default report 28-feb-2020, exhibit 29 (1st Linen, sem. Sec. Bond)
Probability of Default 0.16% Annualized A1 probability of default moody's 2020 report, exhibit 46
implied bol 0.012
Bu 0.64
Ru 4.84%
TD/EV (new) 12%
E/EV (new) 88%
Appendix 24: Historical Growth Rate – Peers
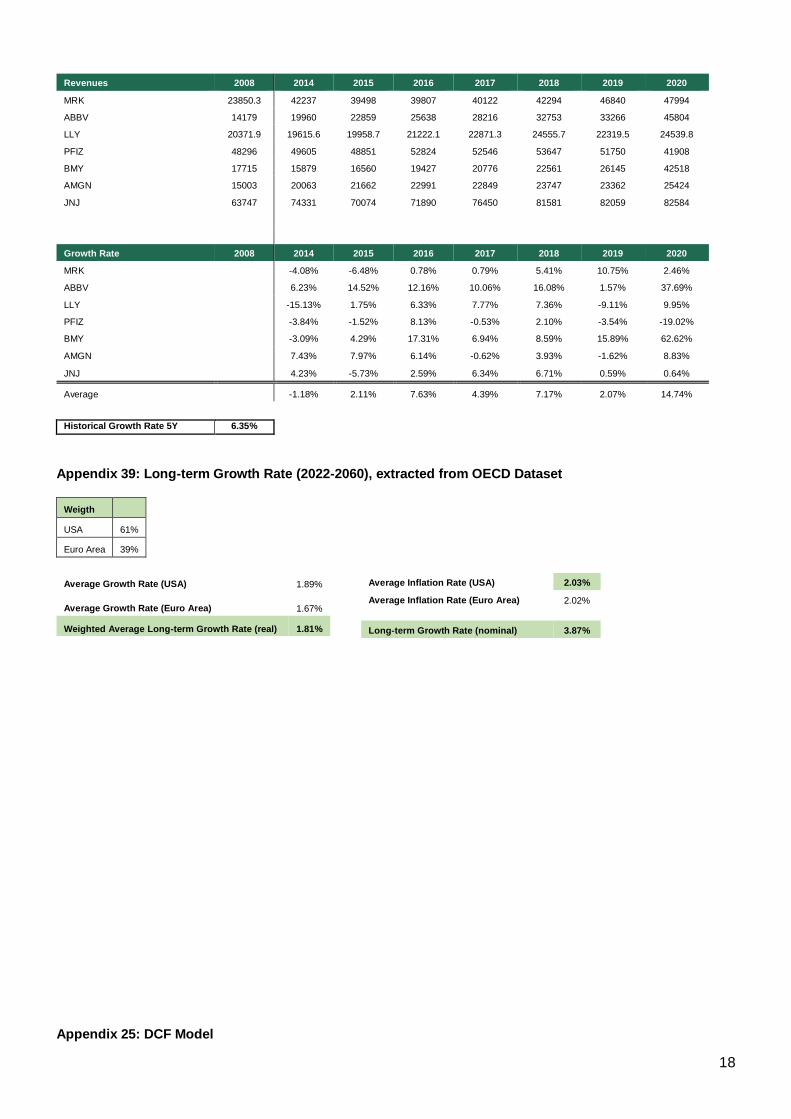
18
Revenues 2008 2014 2015 2016 2017 2018 2019 2020
MRK 23850.3 42237 39498 39807 40122 42294 46840 47994
ABBV 14179 19960 22859 25638 28216 32753 33266 45804
LLY 20371.9 19615.6 19958.7 21222.1 22871.3 24555.7 22319.5 24539.8
PFIZ 48296 49605 48851 52824 52546 53647 51750 41908
BMY 17715 15879 16560 19427 20776 22561 26145 42518
AMGN 15003 20063 21662 22991 22849 23747 23362 25424
JNJ 63747 74331 70074 71890 76450 81581 82059 82584
Growth Rate 2008 2014 2015 2016 2017 2018 2019 2020
MRK -4.08% -6.48% 0.78% 0.79% 5.41% 10.75% 2.46%
ABBV 6.23% 14.52% 12.16% 10.06% 16.08% 1.57% 37.69%
LLY -15.13% 1.75% 6.33% 7.77% 7.36% -9.11% 9.95%
PFIZ -3.84% -1.52% 8.13% -0.53% 2.10% -3.54% -19.02%
BMY -3.09% 4.29% 17.31% 6.94% 8.59% 15.89% 62.62%
AMGN 7.43% 7.97% 6.14% -0.62% 3.93% -1.62% 8.83%
JNJ 4.23% -5.73% 2.59% 6.34% 6.71% 0.59% 0.64%
Average -1.18% 2.11% 7.63% 4.39% 7.17% 2.07% 14.74%
Historical Growth Rate 5Y 6.35%
Appendix 39: Long-term Growth Rate (2022-2060), extracted from OECD Dataset
Weigth
USA 61%
Euro Area 39%
Appendix 25: DCF Model
Average Growth Rate (USA) 1.89%
Average Growth Rate (Euro Area) 1.67%
Weighted Average Long-term Growth Rate (real) 1.81%
Average Inflation Rate (USA) 2.03%
Average Inflation Rate (Euro Area) 2.02%
Long-term Growth Rate (nominal) 3.87%

19
DCF 2020 2021F 2022F 2023F 2024F 2025F 2026F 2027F 2028F 2029F 2030F
Unlevered FCFF 9781 5437 5714 6227 3220 6887 7324 8583 7942 8383
WACC 4.80% 4.80% 4.80% 4.80% 4.80% 4.80% 4.80% 4.80% 4.80% 4.8%
g 1.8%
Operating Enterprise
Value 233509 239279 245050 250585 259392 264956 270349 274742 279986
Net Debt 21669 22885 24340 25747 26986 28262 29600 30972 32400
Operating Leases 1810 1647 1222 1059 4346 4346 4346 3475 3671
(+) Operating EV 233509 239279 245050 250585 259392 264956 270349 274742 279986
(-) Net Debt -21669 -22885 -24340 -25747 -26986 -28262 -29600 -30972 -32400
(-) Operating Leases -1810 -1647 -1222 -1059 -4346 -4346 -4346 -3475 -3671
(-) Non-Core Invested
Capital -2361 -2468 -2596 -2715 -2832 -2953 -3079 -3210 -3347
(-) Non-Controlling
Interests -89 -92 -94 -97 -100 -103 -106 -110 -113
Equity Value 207579 212187 216797 220967 225128 229292 233217 236976 240455
#Shares 2538 2538 2538 2538 2538 2538 2538 2538 2538
Price Target $81.78 $83.59 $85.41 $87.05 $88.69 $90.33 $91.88 $93.36 $94.73
15th September $72.81
Upside/downside
potential
14.81%
Recommendation BUY
Appendix 26: APV Model
APV 2020 2021F 2022F 2023F 2024F 2025F 2026F 2027F 2028F 2029F 2030F
Unlevered FCFF 9781 5437 5714 6227 3220 6887 7324 8583 7942 8383
Ru 4.84% 4.84% 4.84% 4.84% 4.84% 4.84% 4.84% 4.84% 4.84% 4.84%
g 1.81%
Operating Enterprise Value 230612 236328 242043 247521 256271 261778 267113 271448 276633
Tax Shield 223 236 251 266 278 291 305 319 334 350
Ru 4.84% 4.84% 4.84% 4.84% 4.84% 4.84% 4.84% 4.84% 4.84% 4.84%
Value of Tax Shields 9737 9972 10203 10431 10658 10882 11102 11320 11533
Net Debt -21669 -22885 -24340 -25747 -26986 -28262 -29600 -30972 -32400
Operating Leases -1810 -1647 -1222 -1059 -4346 -4346 -4346 -3475 -3671
Non-core Invested capital -2361 -2468 -2596 -2715 -2832 -2953 -3079 -3210 -3347
Non-controlling interests -89 -92 -94 -97 -100 -103 -106 -110 -113
Equity Value 214509 219300 224088 228432 232764 237098 241191 245112 248748
Shares Outstanding (in millions) 2538 2538 2538 2538 2538 2538 2538 2538 2538
Price Target $84.51 $86.39 $88.28 $89.99 $91.70 $93.41 $95.02 $96.56 $98.00
15th September $72.81
Upside/downside potential 18.66%
Recommendation BUY
Appendix 27: Flow-to-Equity Model

20
Flow-to-Equity 2020 2021F 2022F 2023F 2024F 2025F 2026F 2027F 2028F 2029F 2030F
Net Income 7155 7540 7998 8425 8846 9284 9738 10212 10708 11226
Depreciation 952 1355 1617 1511 1473 1532 1587 1658 1731 1808
Gross Cash Flow 8107 8895 9615 9936 10319 10816 11325 11871 12440 13034
(-) Changes in operating working capital 1127 174 208 195 190 197 204 214 223 233
(-) CAPEX, net -1494 -3980 -4525 -4498 -4571 -4800 -5027 -5283 -5550 -5829
(+) Changes in Debt -2233 1659 1985 1918 1691 1740 1825 1871 1949 2033
FCFE 3254 6400 6867 7162 7249 7559 7920 8245 8615 9005
Re 5.31% 5.31% 5.31% 5.31% 5.31% 5.31% 5.31% 5.31% 5.31% 5.31%
g 1.81%
Equity Value 217096 222230 227169 232077 237157 242196 247142 252026 256799
Shares Outstanding (in millions) 2538 2538 2538 2538 2538 2538 2538 2538 2538
Price Target $87.55
15th September $72.81
Upside/downside potential 20.24%
Recommendation BUY
Appendix 28: Risk Matrix
RISK LIKELIHOOD (1-5) CONSEQUENCE (A-E) RISK RATING Breakdown ACTION
Patent Expiration 5 C 5C
Patents can create the ilusion of safety due to their conditions, but governments, third parties can seek to invalidate
or circumvent them. There's also a risk associate with the expiration date and its respective renewance, as
competitors will most likely try to steal it. Recently, Merck granted a patent in 2019 to create crypto-objects on
artifical intelligence, which will mitigate the supply chain risk, and has also put an end to a dispute against Pfizer over
a pneumococcal vaccine patent.
Invest more in R&D. New Jersey,
California, Massachussetts,
Nebraska, Pennsylvania,
Switzerland and China are the
current R&D facilities, that can
expand the patent portfolio.
Pricing Pressure 4 C 4C
Pricing pressure is one of the biggest concerns for Merck and the increasing demand, aging of global population have
been challenging all companies. These pressures are further compounded by controversies and political debates.
Governments and international markets have been acting towards a reduction of prices in generics and patented
drugs. This was boosted by the U.S recent health care system reform and third-parties pressure to reduce prices,
which have been negatively impacting Merck's revenues.
R&D 5 D 5E
R&D is by far the most important activity for a company like Meck, where sustainable growth and new medical
developments play a massive role in future earnings. Having said that, this comes with a expensive cost and risk, due
to the uncertainty and time to develop and start a R&D program. Success in R&D can result in an increase of market
share, revenues and product portfolio.
It has hard and complex to present
a solution to mitigate R&D risks, as
they will always exist.
Covid-19 2 B 2B
Despite the intends of Merck to desinvest in Covid-19 programs, the company is still involved in a lot of agreements
related to the pandemic. This agreements are more connected to the treatment of the disease, and do not represent
a high risk. Companies like Pfizer, J&J and Moderna encountered major risks regarding this matter, due to the huge
committments and investments made, which was way bigger than Merck.
Although the return will be lower
than most of its competitors,
Merck has mitigated this risk by not
being so much involved.
Exchange Rates 5 B 5CThis is na external factor that can damage Merck's reported sales, costs and earnings, and even the value of assets,
liabilities and cash flows.
Hedging strategies are crucial -
Merck spends a reasonable amount
on this type of strategies to
mitigate this risk.
Legislation/ Rules 5 A 5ALaws and health legislation needs to be complied with. They can be comlex, intensive, extensive and volatile, but
Merck needs to comply with them in order to prevent fees, delays in production and future restrictions.
Respect and follow the rules
depending on the
country/continent the company is
operating.
Growing competitors 4 D 4D
The large size of the industry means competitive peers, and it also means that every move is being followed by every
major player. This also means that Merck can incurr in huge losses in terms of market share if the company misses an
opportunity.
Invest more in R&D. New Jersey,
California, Massachussetts,
Nebraska, Pennsylvania,
Switzerland and China are the
current R&D facilities, that can
expand the patent portfolio.
Fraud 3 D 3D
This is a concept that can be misunderstood and mixed with the legislation risk. Even though they are similar, here the
risk is about the trend in the pharmaceutical industry of making fraudulent actions in order to achieve results faster,
which have been damaging humam lives. There are a lot of recent cases involving the big pharma companies related
to this type of fraud. Lawsuits and huge fees can be applied to this type of behaviour.
Respect and follow the rules
depending on the
country/continent the company is
operating.
Counterfeit Products 2 C 2CThe presence of falsified medicines is growing, and patients are being threatened. Reports of adverse events can
severely damage the company. Diversify the supply chain.
Supply chain 3 A 3AThe Covid-19 pandemy has proved that external factors can damage the supply chains. Merck operates in more than
140 countries, and events like this can seriously affect the suppliers.
Complex manufacture of products 1 E 1EThe complexity and dependency on sophisticated softwares and infrastructures can sometimes disrupt Merck's
operations and cause delays in the process as a whole.
Invest more in R&D. New Jersey,
California, Massachussetts,
Nebraska, Pennsylvania,
Switzerland and China are the
current R&D facilities, that can
expand the patent portfolio.

1
Disclosures and Disclaimer
This report is published for educational purposes by Master students and does not constitute an offer or a
solicitation of an offer to buy or sell any security, nor is it an investment recommendation as defined by
Article 12º A of the Código do Mercado de Valores Mobiliários (Portuguese Securities Market Code). The
students are not registered with Comissão de Mercado de Valores Mobiliários (CMVM) as financial analysts,
financial intermediaries or entities/persons offering any service of financial intermediation, to which
Regulamento (Regulation) 3º/2010 of CMVM would be applicable.
This report was prepared by a Master’s student in Finance at ISEG – Lisbon School of Economics and Management,
exclusively for the Master’s Final Work. The opinions expressed and estimates contained herein reflect the personal
views of the author about the subject company, for which he/she is sole responsible. Neither ISEG, nor its faculty
accepts responsibility whatsoever for the content of this report or any consequences of its use. The report was
supervised by Prof. Victor Barros, who revised the valuation methodologies and the financial model.
The information set forth herein has been obtained or derived from sources generally available to the public and
believed by the author to be reliable, but the author does not make any representation or warranty, express or implied,
as to its accuracy or completeness. The information is not intended to be used as the basis of any investment
decisions by any person or entity.
Recommendation System
Level of Risk SELL REDUCE HOLD/NEUTRAL BUY STRONG BUY
High Risk 0%≤ >0% & ≤10% >10% & ≤20% >20% & ≤45% >45%
Medium Risk -5%≤ >-5% & ≤5% >5% & ≤15% >15% & ≤30% >30%
Low Risk -10%≤ >-10% & ≤0% >0% & ≤10% >10% & ≤20% >20%
Related Documents