MASTER IN ACTUARIAL SCIENCE MASTER’S FINAL WORK INTERNSHIP REPORT INFERENCE OF THE RISK ASSOCIATED WITH A FUTURE PANDEMIC FOR A HEALTH INSURANCE COMPANY MARIA RODRIGUES DE CARVALHO GARCIA DE CASTRO SUPERVISION: ALFREDO DUARTE EGÍDIO DOS REIS MARLI ANDREIA MONTEIRO AMORIM FERREIRA OCTOBER - 2021

Welcome message from author
This document is posted to help you gain knowledge. Please leave a comment to let me know what you think about it! Share it to your friends and learn new things together.
Transcript
MASTER IN ACTUARIAL SCIENCE
MASTER’S FINAL WORK
INTERNSHIP REPORT
INFERENCE OF THE RISK ASSOCIATED WITH AFUTURE PANDEMIC FOR A HEALTH INSURANCECOMPANY
MARIA RODRIGUES DE CARVALHO GARCIA DECASTRO
SUPERVISION:
ALFREDO DUARTE EGÍDIO DOS REISMARLI ANDREIA MONTEIRO AMORIM FERREIRA
OCTOBER - 2021
GLOSSARY
AD Anderson-Darling. i, 20
C Estimated total cost in the reference scenario. i, 25, 27, 30
COVID-19 Coronavirus disease - in 2019. i–iii, 1–3, 13, 14, 17, 19, 23, 26, 29, 30, 34
CS Chi-Squared. i, 20
CVM Cramer Von Mises. i, 20
DGS Direção Geral da Saúde. i, 13, 14
H Nº of estimated hospitalizations in the reference scenario. i, 25, 27, 30
Hw ICU Nº of estimated hospitalizations with ICU in the reference scenario. i, 25
Hw/o ICU Nº of estimated hospitalizations w/o ICU in the reference scenario. i, 25
I Nº of estimated infections in the reference scenario. i, 25, 27, 30
ICU Intensive Care Unit. i, 13–17, 19–23
IPEs Individual Protection Equipments. i, ii, 3, 4, 17, 25
K-S Kolmogorov-Smirnov. i, 20
LoS Length of Stay. i, 19–24
MERS Middle East respiratory syndrome. i, 28–30
P Estimated aggregated risk premium in the reference scenario. i, 25
PCR Polymerase Chain Reaction. i, 3–5, 17, 25, 26
SARS Severe Acute respiratory syndrome. i, 28–30
WHO World Health Organization. i, 1, 2
i
ABSTRACT
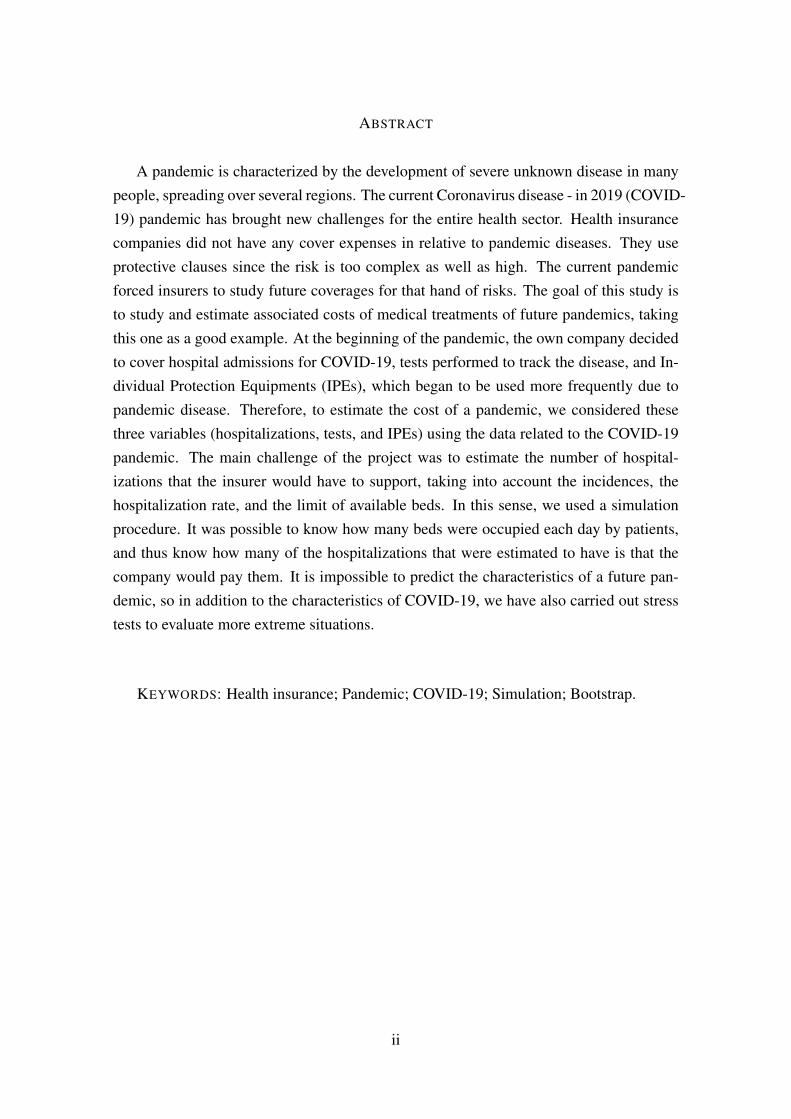
A pandemic is characterized by the development of severe unknown disease in manypeople, spreading over several regions. The current Coronavirus disease - in 2019 (COVID-19) pandemic has brought new challenges for the entire health sector. Health insurancecompanies did not have any cover expenses in relative to pandemic diseases. They useprotective clauses since the risk is too complex as well as high. The current pandemicforced insurers to study future coverages for that hand of risks. The goal of this study isto study and estimate associated costs of medical treatments of future pandemics, takingthis one as a good example. At the beginning of the pandemic, the own company decidedto cover hospital admissions for COVID-19, tests performed to track the disease, and In-dividual Protection Equipments (IPEs), which began to be used more frequently due topandemic disease. Therefore, to estimate the cost of a pandemic, we considered thesethree variables (hospitalizations, tests, and IPEs) using the data related to the COVID-19pandemic. The main challenge of the project was to estimate the number of hospital-izations that the insurer would have to support, taking into account the incidences, thehospitalization rate, and the limit of available beds. In this sense, we used a simulationprocedure. It was possible to know how many beds were occupied each day by patients,and thus know how many of the hospitalizations that were estimated to have is that thecompany would pay them. It is impossible to predict the characteristics of a future pan-demic, so in addition to the characteristics of COVID-19, we have also carried out stresstests to evaluate more extreme situations.
KEYWORDS: Health insurance; Pandemic; COVID-19; Simulation; Bootstrap.
ii
RESUMO
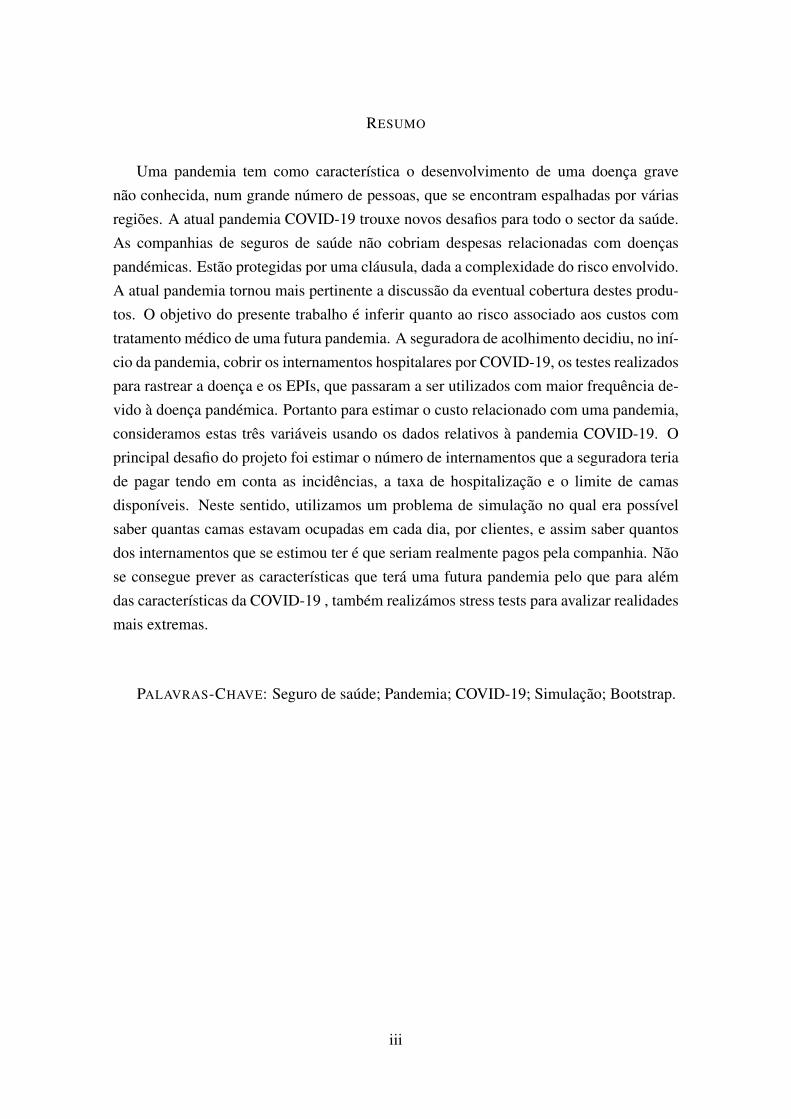
Uma pandemia tem como característica o desenvolvimento de uma doença gravenão conhecida, num grande número de pessoas, que se encontram espalhadas por váriasregiões. A atual pandemia COVID-19 trouxe novos desafios para todo o sector da saúde.As companhias de seguros de saúde não cobriam despesas relacionadas com doençaspandémicas. Estão protegidas por uma cláusula, dada a complexidade do risco envolvido.A atual pandemia tornou mais pertinente a discussão da eventual cobertura destes produ-tos. O objetivo do presente trabalho é inferir quanto ao risco associado aos custos comtratamento médico de uma futura pandemia. A seguradora de acolhimento decidiu, no iní-cio da pandemia, cobrir os internamentos hospitalares por COVID-19, os testes realizadospara rastrear a doença e os EPIs, que passaram a ser utilizados com maior frequência de-vido à doença pandémica. Portanto para estimar o custo relacionado com uma pandemia,consideramos estas três variáveis usando os dados relativos à pandemia COVID-19. Oprincipal desafio do projeto foi estimar o número de internamentos que a seguradora teriade pagar tendo em conta as incidências, a taxa de hospitalização e o limite de camasdisponíveis. Neste sentido, utilizamos um problema de simulação no qual era possívelsaber quantas camas estavam ocupadas em cada dia, por clientes, e assim saber quantosdos internamentos que se estimou ter é que seriam realmente pagos pela companhia. Nãose consegue prever as características que terá uma futura pandemia pelo que para alémdas características da COVID-19 , também realizámos stress tests para avalizar realidadesmais extremas.
PALAVRAS-CHAVE: Seguro de saúde; Pandemia; COVID-19; Simulação; Bootstrap.
iii
TABLE OF CONTENTS
Glossary i
Abstract ii
Resumo iii
Table of Contents iv
List of Figures vi
List of Tables vii
Acknowledgements viii
1 Introduction 11.1 Context . . . . . . . . . . . . . . . . . . . . . . . . . . . . . . . . . . . 11.2 Motivation . . . . . . . . . . . . . . . . . . . . . . . . . . . . . . . . . . 21.3 Project and Report Organization . . . . . . . . . . . . . . . . . . . . . . 3
2 Theoretical Introduction 42.1 Wilcoxon Mann-Whitney Test . . . . . . . . . . . . . . . . . . . . . . . 62.2 Tests of goodness of fit . . . . . . . . . . . . . . . . . . . . . . . . . . . 72.3 Simulation . . . . . . . . . . . . . . . . . . . . . . . . . . . . . . . . . . 102.4 Bootstrap confidence intervals . . . . . . . . . . . . . . . . . . . . . . . 11
3 Epidemiological information about COVID-19 133.1 Collected Data . . . . . . . . . . . . . . . . . . . . . . . . . . . . . . . 133.2 Incidence Rates . . . . . . . . . . . . . . . . . . . . . . . . . . . . . . . 133.3 Hospitalizations . . . . . . . . . . . . . . . . . . . . . . . . . . . . . . . 14
4 Risk assessments in case of complete coverage of the disease 174.1 Infections and hospitalizations . . . . . . . . . . . . . . . . . . . . . . . 174.2 Bed capacity . . . . . . . . . . . . . . . . . . . . . . . . . . . . . . . . . 174.3 Total estimated cost . . . . . . . . . . . . . . . . . . . . . . . . . . . . . 25
5 Stress Tests 265.1 Countries with more COVID-19 cases . . . . . . . . . . . . . . . . . . . 265.2 Using other metrics . . . . . . . . . . . . . . . . . . . . . . . . . . . . . 275.3 Other pandemics and epidemics . . . . . . . . . . . . . . . . . . . . . . 27
iv

MARIA CASTROINFERENCE OF THE RISK ASSOCIATED WITH A FUTURE PANDEMIC FOR A HEALTH INSURANCE
COMPANY
6 Loss and Combined Ratios 32
7 Conclusion 34
References 35
v
LIST OF FIGURES
1 Incidence rates per region in Portugal . . . . . . . . . . . . . . . . . . . 142 Male/Female ratios . . . . . . . . . . . . . . . . . . . . . . . . . . . . . 153 Estimated cases in the portfolio per month . . . . . . . . . . . . . . . . . 184 Estimated hospitalizations in the portfolio per month . . . . . . . . . . . 185 Histogram of LoS at ICU for ICU patients . . . . . . . . . . . . . . . . . 216 Histogram of LoS for patients who do not need ICU . . . . . . . . . . . . 227 Histogram of LoS at Hospital excluding ICU for patients who need ICU . 228 Histogram of LoS at ICU . . . . . . . . . . . . . . . . . . . . . . . . . . 239 Illustrative scheme of the way the beds were occupied . . . . . . . . . . . 2410 Estimated hospitalizations in the portfolio per month considering the num-
ber of beds available . . . . . . . . . . . . . . . . . . . . . . . . . . . . 25
vi
LIST OF TABLES
I STANDARD NORMAL DISTRIBUTIONL . . . . . . . . . . . . . . . . . . 7II INCIDENCE RATE PER GROUP AGE AND SEX IN PORTUGAL . . . . . . . 13III ESTIMATED PROBABILITIES OF AN INFECTED INDIVIDUAL NEEDING
HOSPITAL CARE . . . . . . . . . . . . . . . . . . . . . . . . . . . . . . 16IV PROBABILITIES OF AN INFECTED INDIVIDUAL NEEDING HOSPITAL CARE
USING THE DATA OF A PORTUGUESE HOSPITAL . . . . . . . . . . . . . 16V P-VALUES OF KS, AD, CVM AND CS TESTS . . . . . . . . . . . . . . 21VI MATRIX OF GENERATED LENGTH OF STAY FOR EACH POLICYHOLDER 24VII PROBABILITIES OF AN INFECTED INDIVIDUAL NEEDING HOSPITAL CARE 26VIII SUMMARY TABLE OF THE CHARACTERISTICS OF OTHER EPIDEMICS . . 29IX SUMMARY TABLE OF THE CASE SCENARIOS . . . . . . . . . . . . . . . 31X LOSS RATIO FOR ALL CASE SCENARIOS . . . . . . . . . . . . . . . . . 33
vii
ACKNOWLEDGEMENTS
I carried out this project during challenging times due to the COVID-19 pandemiccrisis. I was motivated by the relevance of the theme for the situation we are living andit turned out to be an interesting and gratifying experience. I am grateful to many peoplefor their help and support during this work. I would like to pay my special regards toProfessor Alfredo Egídio dos Reis for supervising this project. I would like to express mygratefulness to my supervisor at Multicare, Marli Ferreira, for the theoretical knowledgeshe shared, her tireless support, and her availability during the entire process. In addition,I would like to thank my colleagues at Multicare for making me feel welcome right fromthe start and for all the laughter. I would like to thank my friends for their willingness tolisten and for all their help. Finally, I am grateful for the support of my family and all theopportunities they have given me.
viii
INFERENCE OF THE RISK ASSOCIATED WITH A FUTURE PANDEMIC FOR A HEALTH
INSURANCE COMPANY
Maria Garcia de Castro
1 INTRODUCTION
The existing internship report results from my work developed at the Actuarial Of-fice from the health insurance company Multicare. Its main objective is to infer the riskassociated with the costs of medical treatment of a future pandemic.
1.1 Context
According to the World Health Organization (WHO), an epidemic is a new diseasethat affects a region, and a pandemic is an epidemic that spreads around the world throughhuman contact.
Since the Black Death in 1347, there have been quite a few pandemics and epidemicsreported. The Black Death was the deathliest after the Spanish Flu, in 1918, when 5%of the world’s population died. In Portugal, there were estimated from 50 to 70 thousandcasualties.
The 2019 new coronavirus, SARS-CoV-2, is a human coronavirus that spread world-wide (Petrosillo et al., 2020). The first case of COVID-19, in Portugal, was reported onthe 2nd of March 2020. By the 30th April 2021, Portugal counted with 834 442 cases and16 965 deaths. On this same day, 146 841 882 people had been infected and 1 104 743 haddied with COVID-19 in the world (“WHO Coronavirus (COVID-19) Dashboard”, 2019).
When the disease first appeared in Portugal, it was already known that some infectedpeople might need moderate and/or severe hospital care. At the time and until today,almost all the health insurers had a clause in their policies that liberates them from cov-ering any health costs related to pandemic diseases (no. 30 from the 4th clause - generalconditions). Despite an increase in outbreaks, there is a small range of pandemic-relatedproducts, in the world, given the complexity in pricing them because the risk is not wellunderstood. The COVID-19 pandemic could help change that because it provided animportant data source to help insurers better handle its risk and develop a vast range ofcovers in response like the ones we talked about in the following paragraphs.
Sirago is an underwriting manager that offers products for the South African insur-ance market. The company looks for market opportunities in particular products. Siragohas already created an original insurance solution to provide a safety net for hospitalized
1
MARIA CASTRO INTRODUCTION
people due to COVID-19. This pandemic product pays a lump sum stated benefit to in-fected policyholders hospitalized for more than 48 hours due to pandemic disease. It isonly available to people 60 years old or less (“New Pandemic Insurance solution pro-tects consumers against the financial ramifications of Covid-19 hospitalisation – SiragoUnderwriting Managers”, 2021).
The health system in India is essentially the responsibility of every state, which meansthat the federal government has no direct influence on the conditions in their health caresystem. In India, some insurers like Aditya Birla Health Insurance Co. Ltd., Bharti AXAGeneral Insurance Co. Ltd., Cholamandalam MS General Insurance Co. Ltd., EdelweissGeneral Insurance Co.Ltd., Future Generali India Insurance Co.Ltd. and others have al-ready developed products for pandemics. Bharti AXA General Insurance, for example,has a benefit-based individual product for an insured person who has to stay in a hospitalcontinuously for more than 72 hours to treat COVID-19. The product has a policy periodof 105 days, 195 days, and 285 days, respectively, as specified in the policy schedule.Thepolicy is available to people between 18 and 65 years old. The lump sum benefit is equalto 100% of the Sum Insured and is paid with a positive diagnosis of COVID-19 (“IRDAIWelcomes You”, 2020).
Discovery ZA has a World Health Organization (WHO) global outbreak benefit. Thisproduct covers risk assessment for each individual to understand his risk status at anypoint in time. In addition, the benefit ensures clients have access to vaccination, onlineconsultations, testing, and cover for out-of-hospital management and appropriate support-ive treatment. Related to in-hospital treatment due to COVID-19, the admission is subjectto approval and preauthorization and is covered from the Hospital Benefit based on theclient’s chosen health plan (“WHO Outbreak Benefit”, 2020).
Vitality insurance, a company focusing in private medical insurance in UK, also offerssome covers to its clients. Vitality health members who have personal health insurance,business health insurance, corporate healthcare, and vitality at work can buy a discountedantigen test. Even though UK health insurance does not cover emergencies, vitality healthinsurance clients who tested positive for COVID-19 and need hospitalization can get acash benefit. If the patients stay one to eight days at the hospital, they receive £250 perday. If they stay nine or more days, the benefit is £500 per day, subject to a total of £5000(“Coronavirus FAQs”, 2020).
1.2 Motivation
During the COVID-19 crisis, Multicare, the largest health insurance company in Por-tugal, came forward and offered to cover its clients’ costs. Therefore, the company paid
2
MARIA CASTRO INTRODUCTION
for all the Polymerase Chain Reaction (PCR) tests carried out by its customers, IPEs andalso for the admissions of customers who develop the most severe disease.
While in the beginning not much was known about the disease or the dimension itcould take, as of the day of this report there is a greater awareness of the danger pandemicsand epidemics represent and of the increasing frequency in which they occur. Therefore,the objective of this paper is to infer the risk associated with coverage of a future pandemicfor the health insurance.
1.3 Project and Report Organization
The project was organized in a forward manner where three main goals were defined:
• Collect epidemiological information about COVID-19;
• Risk assessment in case of complete coverage of COVID-19 and exclusively usingthe private sector;
• Impact analysis for more extreme scenarios.
To infer the risk associated with future pandemics, we start by estimating the total costof COVID-19 to the company in the first year of the pandemic. We assumed that the firstyear of the pandemic occurred from 1st March 2020 to 28th February 2021.
This report is divided into seven chapters. In Chapter 2, there is an introduction to themethodological approach. Then, in Chapter 3, the data collected and the first analysis willbe showned. Subsequently, Chapter 4 presents the process until calculating the total costof medical treatments of COVID-19 disease. In Chapter 5, more extreme situations wereevaluated. Finally, in Chapter 6, we analyzed some indicators to understand if pandemicrisks the company’s solvency.
3
MARIA CASTRO THEORETICAL INTRODUCTION
2 THEORETICAL INTRODUCTION
An insurance contract is made between an insurance company and one or more per-sons called the policyholders. The policyholder agrees to pay an amount to the insurercalled premium to transfer the risk from the policyholder to the insurance company.
The amount of the damages that the insurer undertakes to pay in case of a claim, iscovered by a premium paid by the insured. Usually, the premium is paid annually.
The annual pure premium, denoted by P , can be considered the average value of theannual cost of the disease, i.e., the average value of C, by E[C]. The actuarial premium,denoted by P ∗, is composed by the pure premium plus a heading, i.e., P ∗ = P+heading.
P = E[C] = E[C|S] · pS + E[C|S] · pS. (1)
Where C is the cost of the disease for an individual, pS is the probability of an indi-vidual being sick and pS = 1− pS .
The purpose of this insurance is to cover the expenses related to pandemic disease.Usually, E[C|S] = 0 because if the policyholder does not have the disease, there are nocosts for the insurance company. However, in the case of a pandemic product, there arecosts, from PCR tests and IPEs, even if the insured is not sick.
The annual cost of the disease is the sum of hospitalizations, PCR tests, and IPEs.
E[C] = E[Cost of hospitalizations] + E[Cost of PCR tests] + E[Cost of IPEs], (2)
where E[.] is the Expectation operator.
Cost of hospitalizations
The cost of hospitalizations is a combination of admissions with or without ICU.For the insurance company, the cost of hospitalization without ICU and with ICU are,respectively, C1 and C2. These values, C1 and C2, were previously agreed with privatesector hospitals.
In order to evaluate the risk of contracting a disease, i.e., determining the number ofinfected individuals, there is the incidence rate, I , given by the following formula:
I =no. of cases
no. of susceptible individuals. (3)
4
MARIA CASTRO THEORETICAL INTRODUCTION
The incidence rate differs depending on the age, sex, and region of residence of eachperson. So it makes sense to calculate an incidence rate for each group segmented by age,sex, and region (Equation 4):
Ia,s,r =no. of casesa,s,r
no. of susceptible individualsa,s,r. (4)
Where a = 0, 1, ..., 8 if age in years is in the intervals: [0;9], [10;19], . . . , [80;∞[; s=M, F and r is the region (Lisbon, North, Center, Alentejo, Algarve, Regional Administra-tions of Azores, Regional Administrations of Madeira).
The number of hospitalizations, Ha,s, is given by the number of infected individualsand the probability of developing severe disease, pa,s, i.e., being hospitalized. In order todetermine the probability that an infected individual needs to go to the hospital, it wasnecessary to use theoretical topics that will be spoken in the following sections.
HICUa,s = no. of estimated casesa,s · pICUa,s . (5)
Hw/o ICUa,s = no. of estimated casesa,s · pw/o ICUa,s . (6)
E[Cost of hospitalizations] = Hw/o ICUa,s · C1 +HICU
a,s · C2. (7)
Cost of PCR tests
We assumed that the number of PCR tests performed by the insurance company isdirectly proportional to the number of estimated cases in the portfolio because the data weused do not reject it. The constant of proportionality is α. It was determined consideringthe number of estimated cases and the number of tests paid by the company. In order toobtain the total cost, it is necessary to multiply by the average amount paid for each test,C3.
E[Cost of PCR tests] = α · (No. of estimated cases) · C3. (8)
5
MARIA CASTRO THEORETICAL INTRODUCTION
Cost of IPEs
The cost of EPIs was considered constant in all cases. The amount spent by the com-pany in the first year of the pandemic was used.
E[Cost of IPEs] = Total cost of observed IPEs. (9)
Therefore the total cost can be given by the following expression:
E[C] = Hw/o ICUa,s ·C1+H
ICUa,s ·C2+α·(No. of estimated cases)·C3+Total cost of observed IPEs.
(10)
2.1 Wilcoxon Mann-Whitney Test
The Wilcoxon Mann-Whitney test is a non-parametric test, which can be used to testwhether two samples are likely to derive from the same population, i.e., that the twopopulations have the same shape. It is used when the data are not normally distributed.
Suppose we have two randomly selected values from two populations. One sampleof X1 dimension n1 and another of X2 of dimension n2. X1 and X2 are two continuousrandom variables. It can be assumed that n2<n1.
The Wilcoxon-Mann-Whitney test was developed to compare the medians betweenthe two populations, denoted by M x1 and M x2
H0 : M x1 = M x2 vs H1 : M x1 6= M x2 . (11)
Test procedure
First, we joined the two samples in a single sample of n1 + n2 elements and ordered.The test statistic (T) is the sum of the ranks of the elements of the random sample of X2,because n2 < n1. When the values of n1 and n2 are high, the random variable T has anapproximately Normal distribution with mean (µT) and standard deviation (σT).
µT =n2(n1 + n2 + 1)
2. (12)
6
MARIA CASTRO THEORETICAL INTRODUCTION
σT =n1n2(n1 + n2 + 1)
12. (13)
ZT =T − µT√
σT∼ N(0, 1). (14)
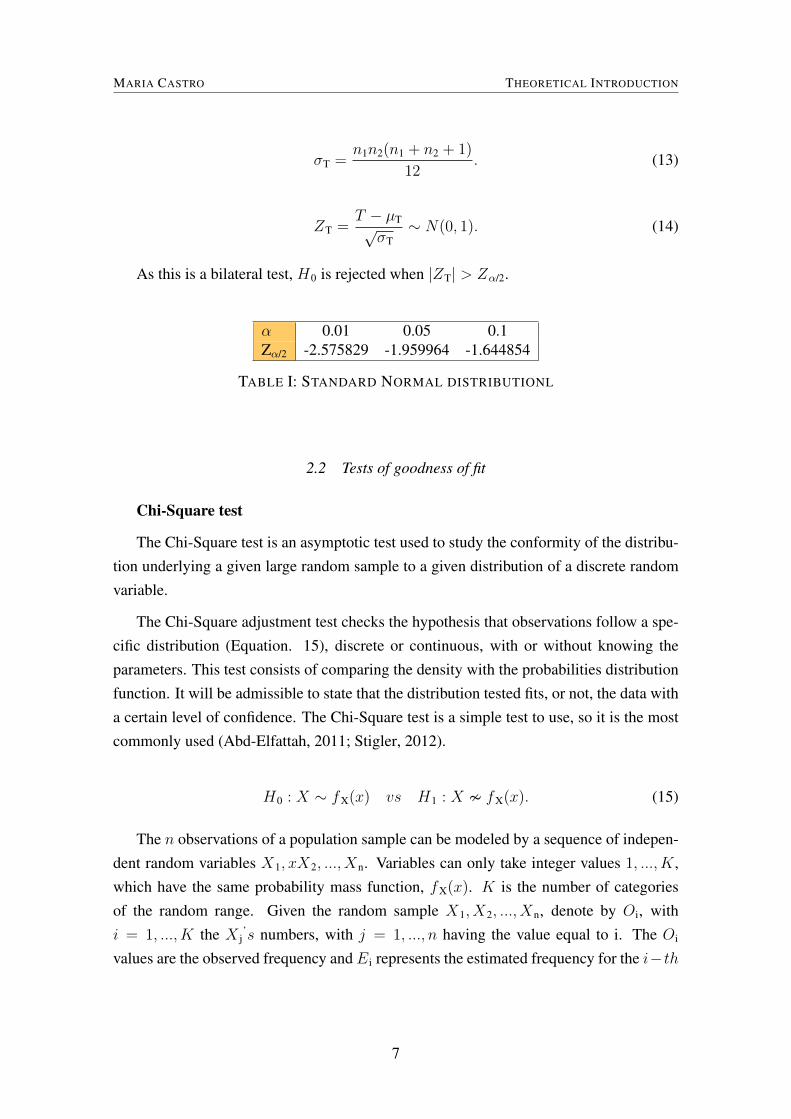
As this is a bilateral test, H0 is rejected when |ZT| > Zα/2.
α 0.01 0.05 0.1Zα/2 -2.575829 -1.959964 -1.644854
TABLE I: STANDARD NORMAL DISTRIBUTIONL
2.2 Tests of goodness of fit
Chi-Square test
The Chi-Square test is an asymptotic test used to study the conformity of the distribu-tion underlying a given large random sample to a given distribution of a discrete randomvariable.
The Chi-Square adjustment test checks the hypothesis that observations follow a spe-cific distribution (Equation. 15), discrete or continuous, with or without knowing theparameters. This test consists of comparing the density with the probabilities distributionfunction. It will be admissible to state that the distribution tested fits, or not, the data witha certain level of confidence. The Chi-Square test is a simple test to use, so it is the mostcommonly used (Abd-Elfattah, 2011; Stigler, 2012).
H0 : X ∼ fX(x) vs H1 : X � fX(x). (15)
The n observations of a population sample can be modeled by a sequence of indepen-dent random variables X1, xX2, ..., Xn. Variables can only take integer values 1, ..., K,which have the same probability mass function, fX(x). K is the number of categoriesof the random range. Given the random sample X1, X2, ..., Xn, denote by Oi, withi = 1, ..., K the X j
’s numbers, with j = 1, ..., n having the value equal to i. The Oi
values are the observed frequency and E i represents the estimated frequency for the i−th
7
MARIA CASTRO THEORETICAL INTRODUCTION
category.
K∑i=1
Oi =K∑i=1
E i = n. (16)
The test statistic is:
X2 =K∑i=1
(Oi − E i)2
E i. (17)
For significant level α, H0 is rejected when X2 > χ 2K(1-α).
Kolmogorov-Smirnov test
The Kolmogorov–Smirnov test is a nonparametric test used to compare a sample witha reference probability distribution.
The test statistic quantifies a distance between the empirical distribution function ofthe sample and the cumulative distribution function of the reference distribution. Thenull distribution of this statistic is calculated under the null hypothesis. H0 states that thesample follows the reference distribution, which can be continuous, discrete, or mixed.Subsequently, it will be compared with a theoretical value. Then it is possible to statewhether or not the distribution being tested fits (Stigler, 2012).
(X1, X2, ..., Xn) is a random sample of a population X . X i for i = 1, 2, . . . , n are nindependent and identically distributed (i.i.d.) observations. F n, the empirical distributionfunction, is defined as follows:
F̂ n(x) =1
n#{xi : xi 6 x}. (18)
(x1, x2, ..., xn) is a realization of (X1, X2, ..., Xn).
The sample distribution function is:
F n(x) =1
n#{X i : X i 6 x}. (19)
Let F’s be the distribution function of the population and F0 the function of the pro-posal distribution, which is continuous and specified.
H0 : F (x) = F 0(x) vs H1 : F (x) 6= F 0(x). (20)
8
MARIA CASTRO THEORETICAL INTRODUCTION
In this test the test statistic, Dn, is:
Dn = sup-∞ < x < +∞|F n(x)− F 0(x)|. (21)
The expected value of the test statistic is obtained when replacing the sample distri-bution function, F n(x) with the empirical distribution function, F̂ n(x).
dn = sup-∞ < x < +∞|F̂ n(x)− F 0(x)|. (22)
So if H0 is true, Dn is expected to take a small value. H0 is rejected, for a significancelevel α, if the observed value dn from the test statistic Dn is greater or equal than thecritical point Dn,α.
The Kolmogorov-Smirnov test is better than the Chi Square test. While the Chi-Square test is the total sum of the square of the distance between the two curves weightedto the expected frequency, the Kolmogorov-Smirnov test analyzes the maximum distancebetween the empirical and theoretical distributions. In addition, the Chi-Square test isused in large samples, while the K-S test can be applied to small ones.
There are more adjustment tests based on the same principle of comparison betweenexpected values and observed values. They are, for example, the Anderson-Darling (AD)and CramerVon Mises (CVM) adjustment tests. The difference between these two testslies in the expression of the test statistic and consequently in their respective theoreticalvalues.
The Anderson-Darling and CramerVon Mises tests have the same principle, as bothintegrate the square of the distance between the two functions. The difference is that theAnderson-Darling test differs in the weighting of this quantity.
In general, Kolmogorov-Smirnov and CramerVon Mises tests are more effective atdetecting variations in the middle of the distribution. At the same time, Anderson-Darlingis more powerful at highlighting variations in the tail of the distribution (Stigler, 2012).
9
MARIA CASTRO THEORETICAL INTRODUCTION
Anderson-Darling test
Test hypothesis:
H0 : F (x) = F 0(x) vs H1 : F (x) 6= F 0(x). (23)
Test statistic:A2n := n
∫(F n(x)− F 0(x))2
F 0(x)(1− F 0(x))dF 0(x). (24)
The test statistic uses a quadratic distance between F n and F 0. The distance isweighted by w(x).
w(x) =1
F 0(x)(1− F 0(x)). (25)
If H0 is true, then A2n is supposed to be small. Therefore H0 is rejected for large
values of A2n.
Cramer Von Mises test
Test hypothesis:
H0 : F (x) = F 0(x) vs H1 : F (x) 6= F 0(x). (26)
Test statistic:W 2n := n
∫(F n(x)− F 0(x))2dF 0(x). (27)
If H0 is true, then W 2n is supposed to be small. Therefore H0 is rejected for large
values of W 2n .
2.3 Simulation
Simulation uses specific mathematical techniques, which allow imitating almost realworld situations. Simulation models can be considered as a description of real systems.Therefore, running computer simulation models can provide more effective results with-out needing to interfere with the real system. When analyzed statistically, such resultsproduce information that can significantly contribute to making decisions or solving prob-lems.
To create a random sample from a population that has a known distribution, pseu-
10
MARIA CASTRO THEORETICAL INTRODUCTION
dorandom numbers and observations should be generated. Pseudorandom numbers arevalues of a random variable with a Uniform(0,1) distribution, while pseudorandom obser-vations are generated using the pseudorandom numbers and the required distribution.
One of the methods to generate pseudorandom numbers is the Lehmer random numbergenerator. The method is inspired by the multiplicative linear congruential generator,introduced by Lehmer in 1949.
The formula is:
Xn+1 = a ·Xn(mod m) n = 1, 2, ... (28)
U n = Xn/m (29)
Where U n is the generated random number of order n, a is a high multiplicative ordermodule m element, m is a prime number and, X0 is called the seed and is coprime to m.
Pseudorandom observations are generated using the pseudorandom numbers. Oncethe sequence of pseudorandom numbers is created, it is intended to define functions ofthese variables that follow a required distribution. A general method for generating sucha random variable is called the inverse transformation method, which is based on theorem1.
Theorem 1: Let U be a uniform (0,1) random variable. For any continuous distribu-tion function F the random variable X defined by
X = F -1(U) (30)
has distribution F. (Ross, 2013)
2.4 Bootstrap confidence intervals
The bootstrap method is a resampling technique having as a basis a computationallyintensive methodology. It establishes a new framework for simulation-based statisticalanalysis. It replicates small size samples using simulation.
One of the applications of this method is the estimation of the confidence interval.Only the bootstrap percentile confidence interval was used in this project. This is thefavorite method because it can be used whatever the sampling distribution is and it is thesimplest.
11
MARIA CASTRO THEORETICAL INTRODUCTION
Confidence intervals are grounded on the sampling distribution of a bootstrap statistic.The 95% confidence interval can be calculated with the 95% bootstrap statistics. The95% confidence interval starts by marking off the 95% central elements of the samplingdistribution. The critical values in any confidence interval are the marked percentiles thatgive us the 95% central elements. Therefore, the 2.5th and 97.5th percentiles are the criticalvalues. That is, the interval between the two percentiles of the bootstrap distribution is aconfidence interval. Hence, it is known as a bootstrap percentile confidence interval.
In summary, the bootstrap percentile confidence interval for 95% confidence can beeither the interval comprised between the 2.5th percentile and the 97.5th percentile of thebootstrap distribution or the interval up to the 95th percentile.
12
MARIA CASTRO EPIDEMIOLOGICAL INFORMATION ABOUT COVID-19
3 EPIDEMIOLOGICAL INFORMATION ABOUT COVID-19
This chapter will describe the type of data collected about COVID-19 in Portugal andhow it was analysed.
3.1 Collected Data
We collected the data from COVID-19 daily reports released by Direção Geral daSaúde (DGS). These reports have the number of accumulated cases, deaths and recoveredpeople, and the number of active cases, inpatients and Intensive Care Unit (ICU) inpa-tients on the day of the report. The number of accumulated cases and deaths is also givenby age group, sex, and region.
Age groups are defined in the following ten year intervals: 00-09, 10-19, 20-29, 30-39, 40-49, 50-59, 60-69, 70-79 and 80+. They are also separated by sex: Male (M) andFemale (F). In addiction, we consider seven regions: Lisbon, North, Center, Alentejo,
Algarve and the Regional Administrations of Azores and Madeira.
At this point, we calculated the new monthly cases by age group and sex. It was alsonecessary to calculate the new cases segmented by region.
At PORDATA, we collected the distribution of the population and calculated the inci-dences per month by region, age group and sex.
3.2 Incidence Rates
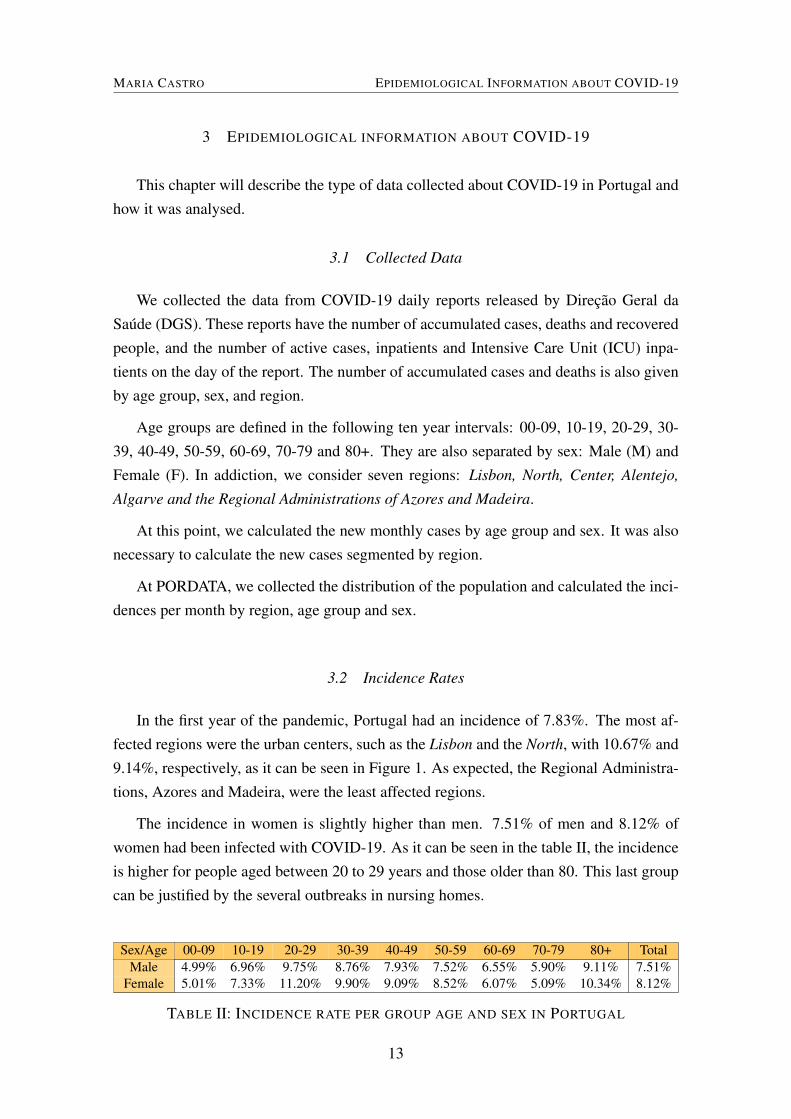
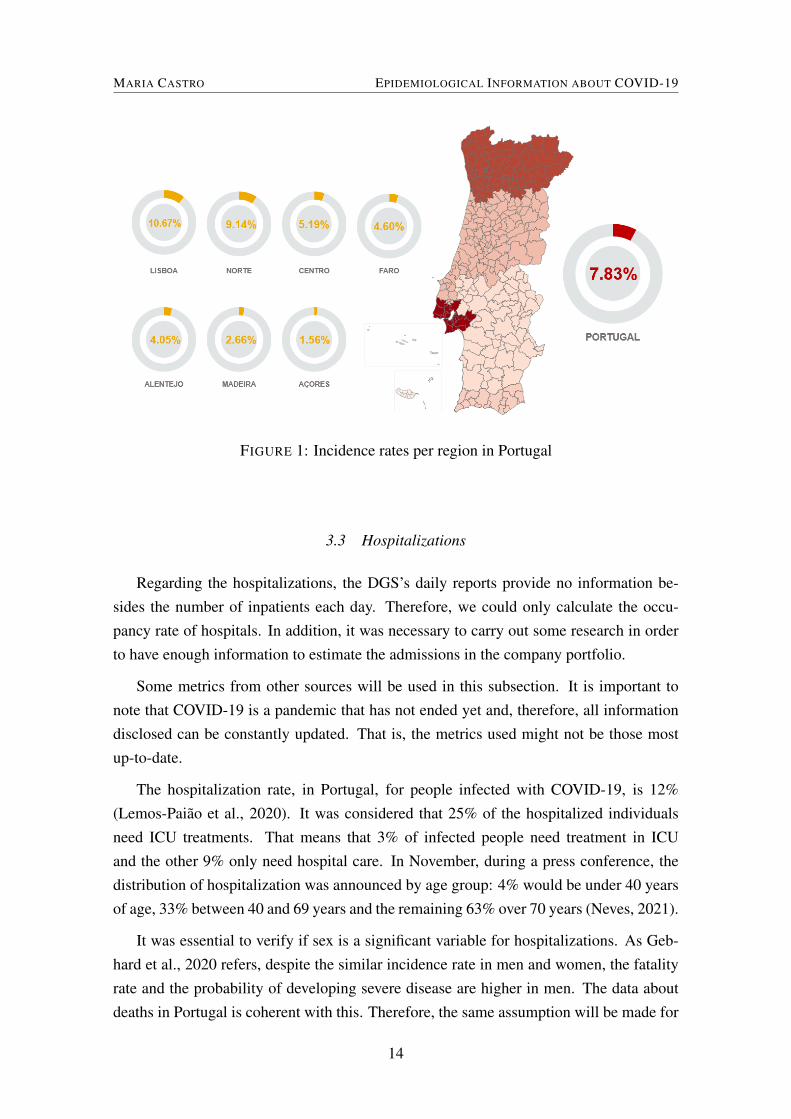
In the first year of the pandemic, Portugal had an incidence of 7.83%. The most af-fected regions were the urban centers, such as the Lisbon and the North, with 10.67% and9.14%, respectively, as it can be seen in Figure 1. As expected, the Regional Administra-tions, Azores and Madeira, were the least affected regions.
The incidence in women is slightly higher than men. 7.51% of men and 8.12% ofwomen had been infected with COVID-19. As it can be seen in the table II, the incidenceis higher for people aged between 20 to 29 years and those older than 80. This last groupcan be justified by the several outbreaks in nursing homes.
Sex/Age 00-09 10-19 20-29 30-39 40-49 50-59 60-69 70-79 80+ TotalMale 4.99% 6.96% 9.75% 8.76% 7.93% 7.52% 6.55% 5.90% 9.11% 7.51%
Female 5.01% 7.33% 11.20% 9.90% 9.09% 8.52% 6.07% 5.09% 10.34% 8.12%
TABLE II: INCIDENCE RATE PER GROUP AGE AND SEX IN PORTUGAL
13
MARIA CASTRO EPIDEMIOLOGICAL INFORMATION ABOUT COVID-19
FIGURE 1: Incidence rates per region in Portugal
3.3 Hospitalizations
Regarding the hospitalizations, the DGS’s daily reports provide no information be-sides the number of inpatients each day. Therefore, we could only calculate the occu-pancy rate of hospitals. In addition, it was necessary to carry out some research in orderto have enough information to estimate the admissions in the company portfolio.
Some metrics from other sources will be used in this subsection. It is important tonote that COVID-19 is a pandemic that has not ended yet and, therefore, all informationdisclosed can be constantly updated. That is, the metrics used might not be those mostup-to-date.
The hospitalization rate, in Portugal, for people infected with COVID-19, is 12%(Lemos-Paião et al., 2020). It was considered that 25% of the hospitalized individualsneed ICU treatments. That means that 3% of infected people need treatment in ICUand the other 9% only need hospital care. In November, during a press conference, thedistribution of hospitalization was announced by age group: 4% would be under 40 yearsof age, 33% between 40 and 69 years and the remaining 63% over 70 years (Neves, 2021).
It was essential to verify if sex is a significant variable for hospitalizations. As Geb-hard et al., 2020 refers, despite the similar incidence rate in men and women, the fatalityrate and the probability of developing severe disease are higher in men. The data aboutdeaths in Portugal is coherent with this. Therefore, the same assumption will be made for
14
MARIA CASTRO EPIDEMIOLOGICAL INFORMATION ABOUT COVID-19
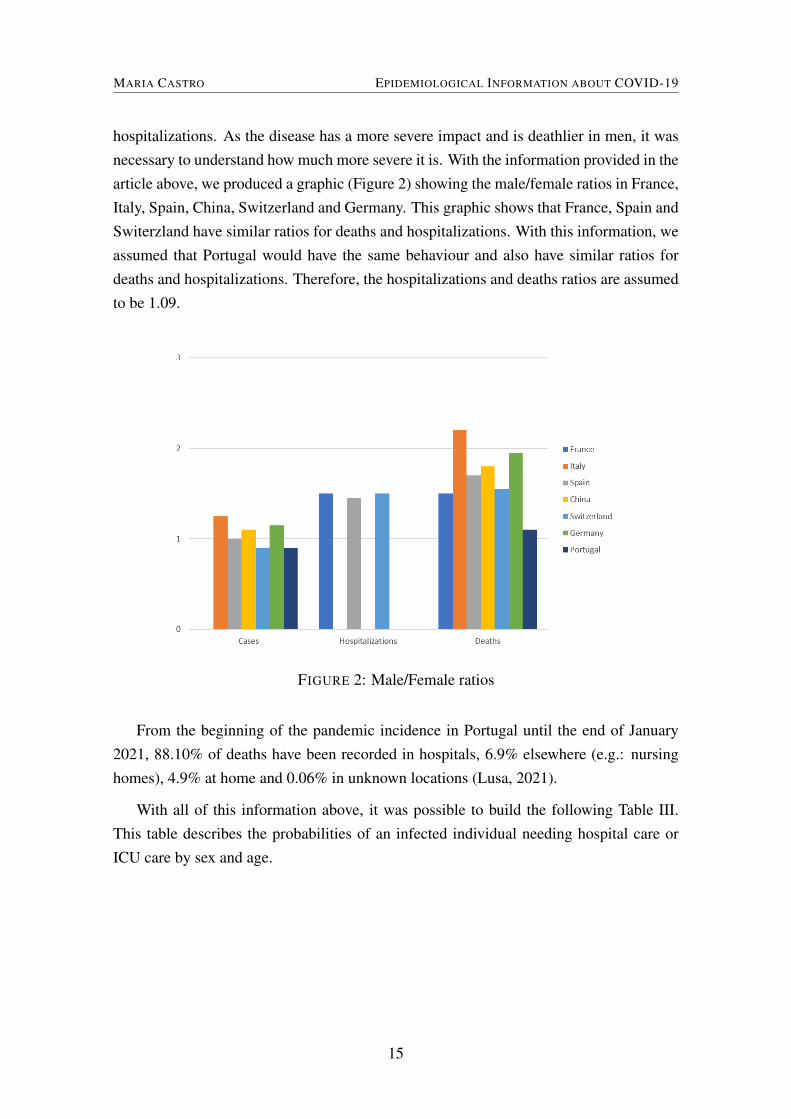
hospitalizations. As the disease has a more severe impact and is deathlier in men, it wasnecessary to understand how much more severe it is. With the information provided in thearticle above, we produced a graphic (Figure 2) showing the male/female ratios in France,Italy, Spain, China, Switzerland and Germany. This graphic shows that France, Spain andSwiterzland have similar ratios for deaths and hospitalizations. With this information, weassumed that Portugal would have the same behaviour and also have similar ratios fordeaths and hospitalizations. Therefore, the hospitalizations and deaths ratios are assumedto be 1.09.
FIGURE 2: Male/Female ratios
From the beginning of the pandemic incidence in Portugal until the end of January2021, 88.10% of deaths have been recorded in hospitals, 6.9% elsewhere (e.g.: nursinghomes), 4.9% at home and 0.06% in unknown locations (Lusa, 2021).
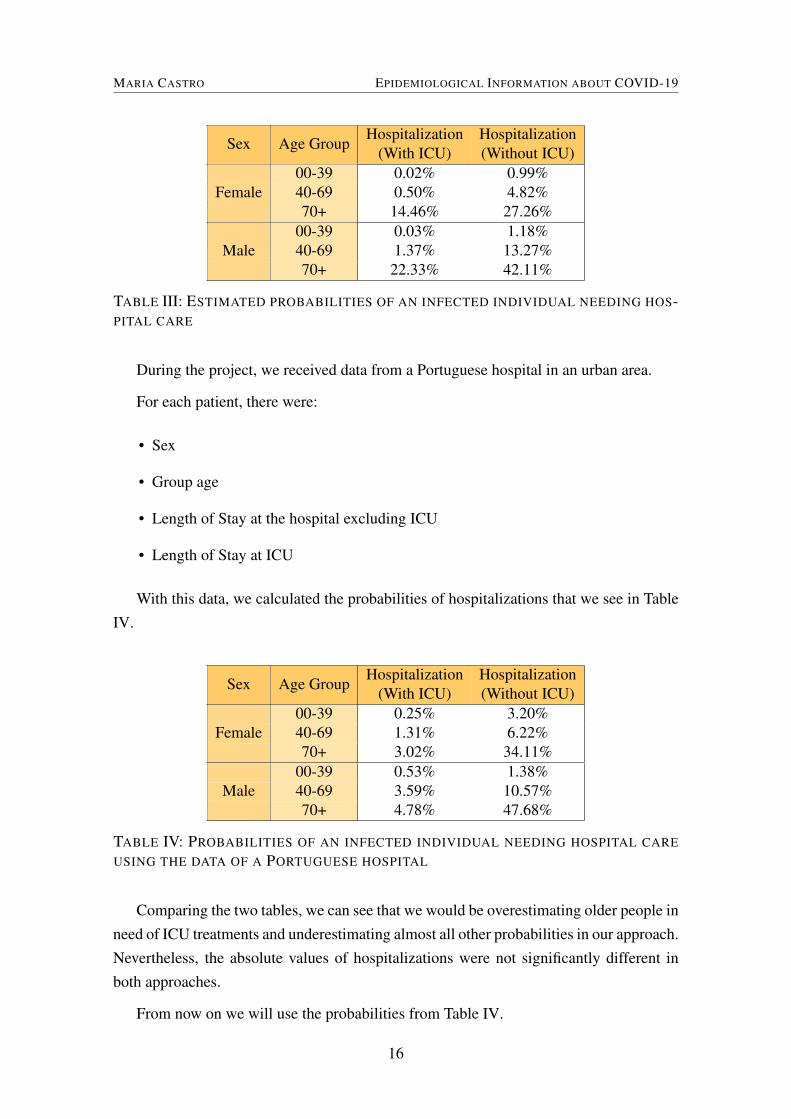
With all of this information above, it was possible to build the following Table III.This table describes the probabilities of an infected individual needing hospital care orICU care by sex and age.
15
MARIA CASTRO EPIDEMIOLOGICAL INFORMATION ABOUT COVID-19
Sex Age GroupHospitalization
(With ICU)Hospitalization(Without ICU)
00-39 0.02% 0.99%40-69 0.50% 4.82%Female70+ 14.46% 27.26%
00-39 0.03% 1.18%40-69 1.37% 13.27%Male70+ 22.33% 42.11%
TABLE III: ESTIMATED PROBABILITIES OF AN INFECTED INDIVIDUAL NEEDING HOS-PITAL CARE
During the project, we received data from a Portuguese hospital in an urban area.
For each patient, there were:
• Sex
• Group age
• Length of Stay at the hospital excluding ICU
• Length of Stay at ICU
With this data, we calculated the probabilities of hospitalizations that we see in TableIV.
Sex Age GroupHospitalization
(With ICU)Hospitalization(Without ICU)
00-39 0.25% 3.20%40-69 1.31% 6.22%Female70+ 3.02% 34.11%
00-39 0.53% 1.38%40-69 3.59% 10.57%Male70+ 4.78% 47.68%
TABLE IV: PROBABILITIES OF AN INFECTED INDIVIDUAL NEEDING HOSPITAL CARE
USING THE DATA OF A PORTUGUESE HOSPITAL
Comparing the two tables, we can see that we would be overestimating older people inneed of ICU treatments and underestimating almost all other probabilities in our approach.Nevertheless, the absolute values of hospitalizations were not significantly different inboth approaches.
From now on we will use the probabilities from Table IV.
16
MARIA CASTRO RISK ASSESSMENT IN CASE OF COMPLETE COVERAGE OF THE DISEASE
4 RISK ASSESSMENTS IN CASE OF COMPLETE COVERAGE OF THE DISEASE
The purpose of this chapter is to estimate the annual cost and the aggregate risk pre-mium of the current Pandemic in the Multicare portfolio, in the first year of the Pandemic.The data used for this chapter was the results from the previous chapter and the data pro-vided by the company that contains the personal information about the policyholders andthe amount paid for IPEs, PCR Tests and hospitalizations in the period between March2020 and February 2021.
It was necessary to estimate infections and hospitalizations in the portfolio. Con-cerning infections, we had no data on the number of infected policyholders. It happensbecause we do not know if a client is infected unless he has an internment authorizationapplication associated with a COVID-19 diagnosis. As mentioned, most COVID-19 pa-tients do not require hospitalization and, even within those who required and were insuredby Multicare, resorted to the public service. For this reason, the number of hospitaliza-tions we observed was much lower than what could have happened.
4.1 Infections and hospitalizations
It was considered that all the policyholders are susceptible to testing positive forCOVID-19. Therefore using the incidences calculated for Portugal and the probabili-ties of getting the most severe disease, we estimated the cases and hospitalizations permonth.
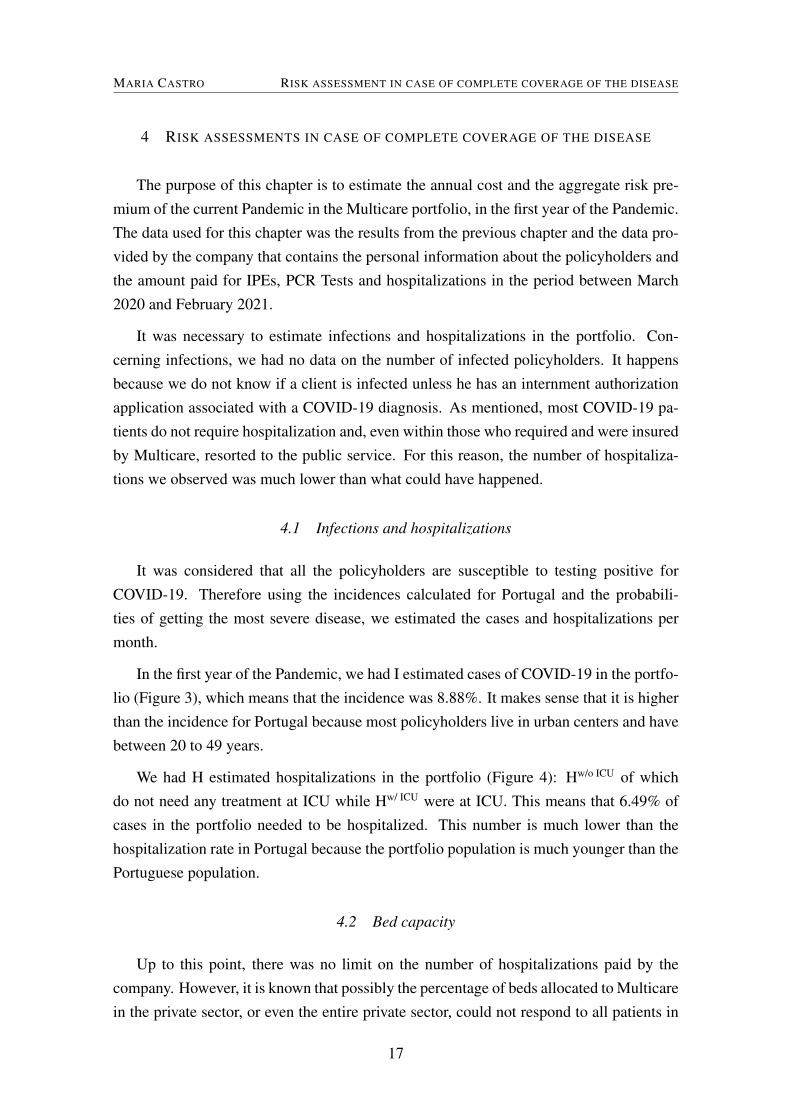
In the first year of the Pandemic, we had I estimated cases of COVID-19 in the portfo-lio (Figure 3), which means that the incidence was 8.88%. It makes sense that it is higherthan the incidence for Portugal because most policyholders live in urban centers and havebetween 20 to 49 years.
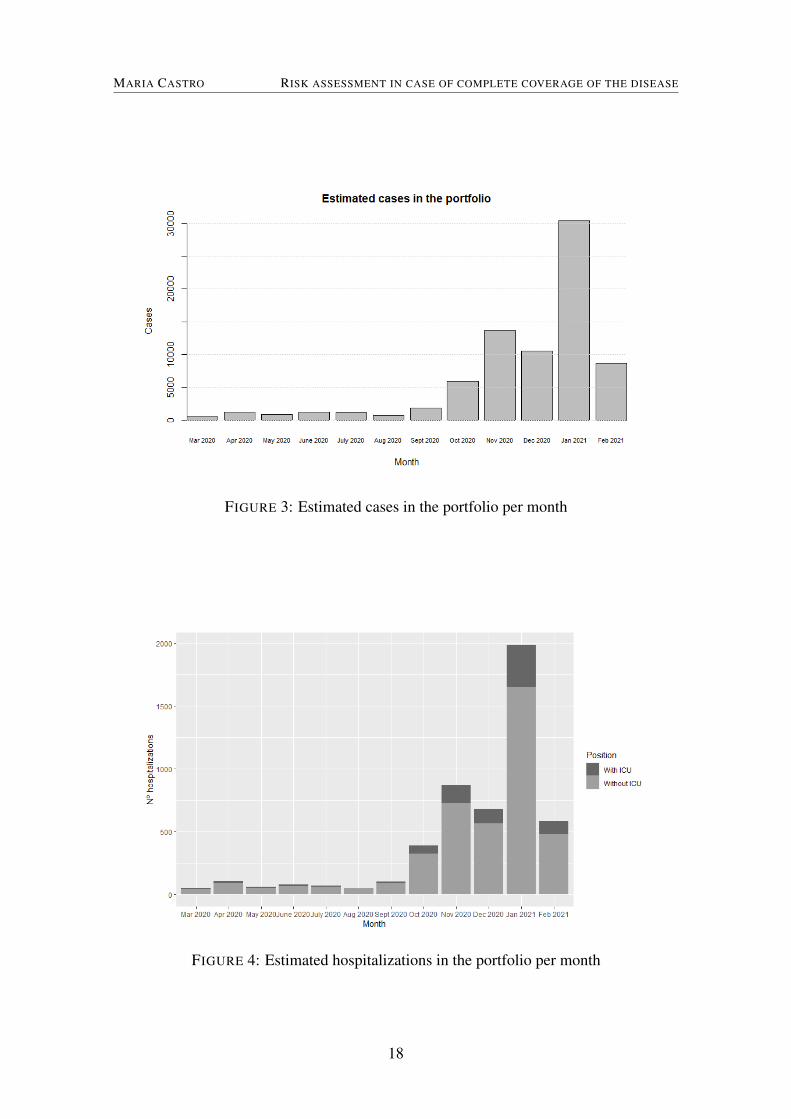
We had H estimated hospitalizations in the portfolio (Figure 4): Hw/o ICU of whichdo not need any treatment at ICU while Hw/ ICU were at ICU. This means that 6.49% ofcases in the portfolio needed to be hospitalized. This number is much lower than thehospitalization rate in Portugal because the portfolio population is much younger than thePortuguese population.
4.2 Bed capacity
Up to this point, there was no limit on the number of hospitalizations paid by thecompany. However, it is known that possibly the percentage of beds allocated to Multicarein the private sector, or even the entire private sector, could not respond to all patients in
17
MARIA CASTRO RISK ASSESSMENT IN CASE OF COMPLETE COVERAGE OF THE DISEASE
FIGURE 3: Estimated cases in the portfolio per month
FIGURE 4: Estimated hospitalizations in the portfolio per month
18
MARIA CASTRO RISK ASSESSMENT IN CASE OF COMPLETE COVERAGE OF THE DISEASE
need of hospital admission. So the costs of hospitalizations would be overestimated.
In order to know Multicare’s responsiveness when its customers are admitted to theprivate sector, it was necessary to know the percentage of beds allocated to Multicare andthe occupancy rate of these over the days. If a patient arrives at the hospital and there areno beds available, it was considered that he will be treated in another hospital, possiblypublic, without the company’s share.
So if the number of customers in need of hospitalization due to COVID-19 was similarto this reference scenario, it is very likely that Multicare would not respond to all ofthese patients. Therefore, the costs related to hospitalizations would be lower than thoseadmitting that the insurance company pays all the H hospitalizations.
This subsection will study the maximum amount that the insurer would pay for COVID-19 hospitalizations. According to some assumptions, a simulation was made, using thedistributions of the Length of Stay (LoS) at the hospital and the number of beds occupiedat each moment. When the beds allocated to the insurer are all occupied, it is consideredthat the insurer does not bear the costs of the next patients.
In 2019 the private sector had 11 812 beds and 212 ICU beds (“Camas dos hospitais”,2020). It was considered that a maximum of 30% of those beds are allocated to Multicare.
Length of Stay distributions
To model the distribution of hospitalization LoS, the sample of 2311 patients, whowere admitted with COVID-19 in a Portuguese hospital, was used.
With this information, it was possible to create three groups of patients:
• Those who just stay at ICU
• Those who do not stay at ICU
• Those who also need ICU treatments
Of these three patient groups, four samples for LoS were created:
• LoS at ICU for patients who just stay at ICU
• LoS at the hospital for patients who do not need ICU treatments
• LoS at the hospital excluding ICU for patients who also need ICU treatments
• LoS at ICU for patients who do not just stay at ICU
19
MARIA CASTRO RISK ASSESSMENT IN CASE OF COMPLETE COVERAGE OF THE DISEASE
We tested, with the Wilcoxon-Mann-Whitney test, if the LoS at ICU (LoS at ICU forpatients who just stay at ICU and LoS at ICU for patients who do not just stay at ICU)and LoS at hospital excluding ICU (LoS at the hospital for patients who do not needICU treatments and LoS at the hospital excluding ICU for patients who also need ICUtreatments) can be grouped into two samples, i.e., H01: All the LoS at ICU derive fromthe same population and H02: All the LoS at sick bay derive from the same population.
There are two independent random samples, one corresponding to LoS at ICU forpatients who just stay at ICU (from X2), and the other corresponds to LoS at ICU forpatients who do not just stay at ICU (from X1).
The test statistic, ZT, is 5.4583. As this is a bilateral test, H0 is rejected when |ZT|>Zα/2.It can be concluded, by observing Table I, that we reject H01 with a significance level of1%,5%, and 10%. The two samples could not be aggregated.
The same test was used to check whether to join the LoS at hospital excluding ICU.The test statistic is, ZT, is -216.84. As |ZT|>Zα/2, H02 is rejected, and it can be concludedthe same as for the ICU LoS.
As said in López-Cheda et al., 2021; Rees et al., 2020, LoS distributions are positivelyskewed because only a few patients have long LoS. Therefore, the distributions are oftenadjusted to a gamma, log-normal, or Weibull family of distributions.
Using the R package MASS, we adjusted the distributions to each LoS sample de-scribed above. For each sample, a Weibull, Gamma, Log-Normal, and Exponential dis-tribution ware adjusted so that it was possible to conclude which distribution best suited.The Erlang distribution, which is a gamma with integer α parameter, has great applica-bility, mainly due to its relationship with exponential and gamma distributions. In somecases, when a gamma fitted, we adjusted an Erlang distribution. In order to concludewhich distribution is more adequate for each LoS we used four adjustment tests: Chi-Squared (CS), Kolmogorov-Smirnov (K-S), Anderson-Darling (AD) and Cramer VonMises (CVM) tests. The CS test was only used when the tests performed did not allow usto make a final decision about LoS distributions.
20
MARIA CASTRO RISK ASSESSMENT IN CASE OF COMPLETE COVERAGE OF THE DISEASE
KS Test AD Test CVM Test CS TestWeibull (shape=1.314058, scale=18.119103) 0.39522 0.412042 0.72593 0.095891511
Log-Normal 0.039214 0.556785 0.267172Gamma 0.249917 0.901505 0.533042 0.000623007
LOS at ICU (ICU patients)
Exponential 0.038427 0.624578 0.428928Weibull 3.45E-08 0.523184 0.205147 9.93875E-91
Log-Normal (meanlog=2.156640, sdlog=1.035127 ) 0.001681 0.947863 0.913177 0.026832011Gamma 2.6E-09 0.340087 0.034399 2.89023E-24
LOS for patients who don’t need ICU
Exponential 1.1E-07 0.508873 0.538139 1.03388E-21Weibull (shape=1.185651, scale=16.291779 ) 0.093977 0.893323 0.890724 0.734737884
Log-Normal 0.012735 0.335595 0.006342Gamma (shape=1.42298095, rate=0.09290733) 0.165414 0.651666 0.152991 0.997979386
Erlang 0.015355 0.007041 0.657118LOS at Hospital excluding ICU for patients who need ICU
Exponential 0.000349 0.49628 0.910375Weibull (shape=1.023288, scale=7.908105) 0.330425 0.616656 0.568664 0.012988362
Log-Normal 0.074131 0.266312 0.144593 0.000741101Gamma (shape=1.0929632, rate=0.1396173) 0.309 0.377838 0.802735 0.025227549
Erlang 3.05E-06 0.000909 0.104788LOS at ICU for patients who were not only in the ICU
Exponential 0.208647 0.639239 0.252509 0.01032459
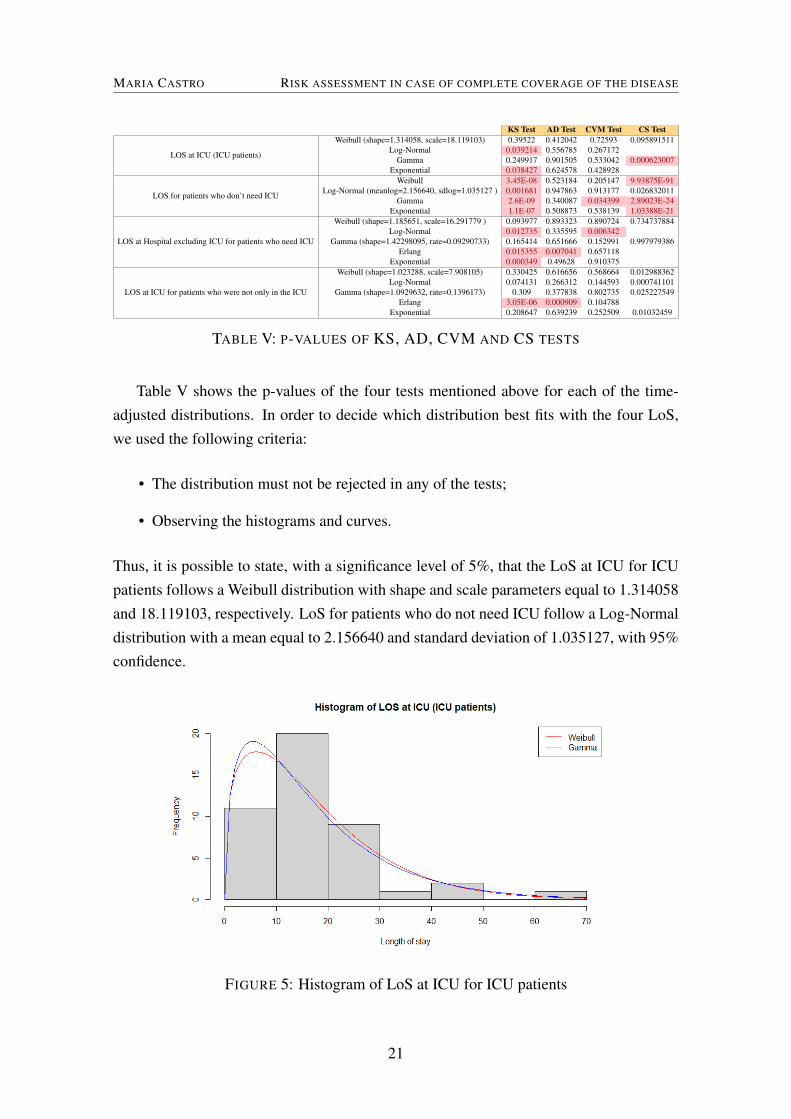
TABLE V: P-VALUES OF KS, AD, CVM AND CS TESTS
Table V shows the p-values of the four tests mentioned above for each of the time-adjusted distributions. In order to decide which distribution best fits with the four LoS,we used the following criteria:
• The distribution must not be rejected in any of the tests;
• Observing the histograms and curves.
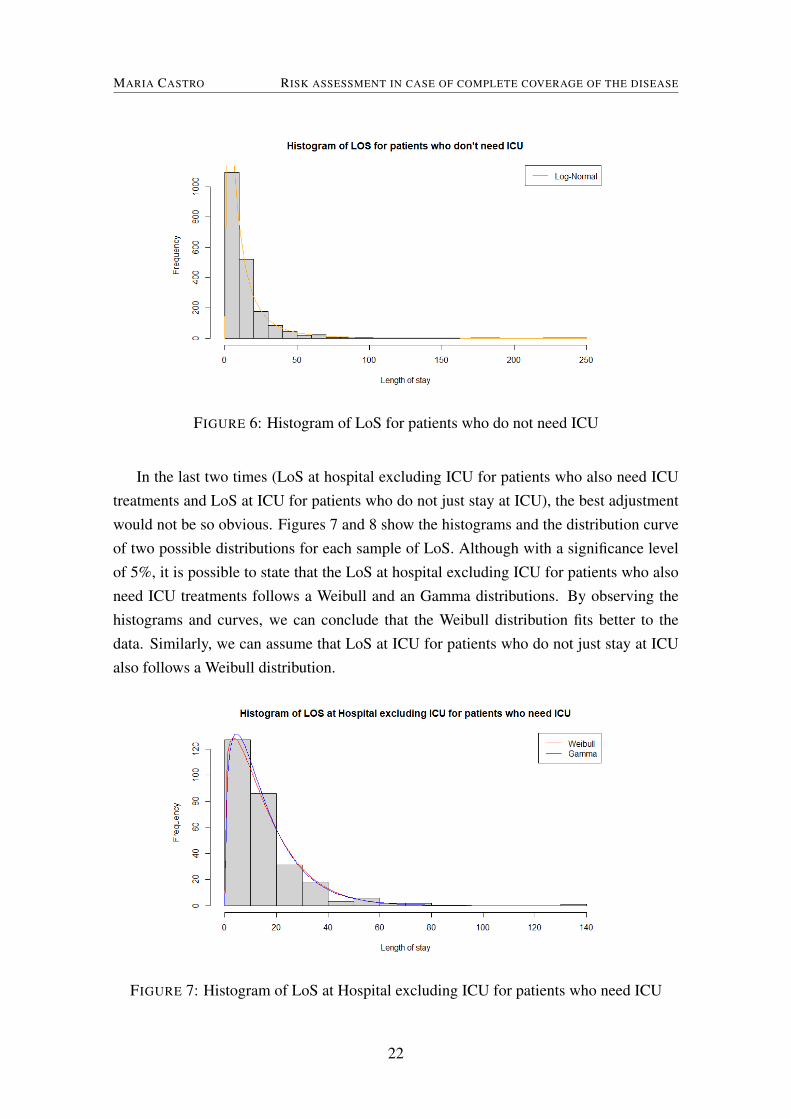
Thus, it is possible to state, with a significance level of 5%, that the LoS at ICU for ICUpatients follows a Weibull distribution with shape and scale parameters equal to 1.314058and 18.119103, respectively. LoS for patients who do not need ICU follow a Log-Normaldistribution with a mean equal to 2.156640 and standard deviation of 1.035127, with 95%confidence.
FIGURE 5: Histogram of LoS at ICU for ICU patients
21
MARIA CASTRO RISK ASSESSMENT IN CASE OF COMPLETE COVERAGE OF THE DISEASE
FIGURE 6: Histogram of LoS for patients who do not need ICU
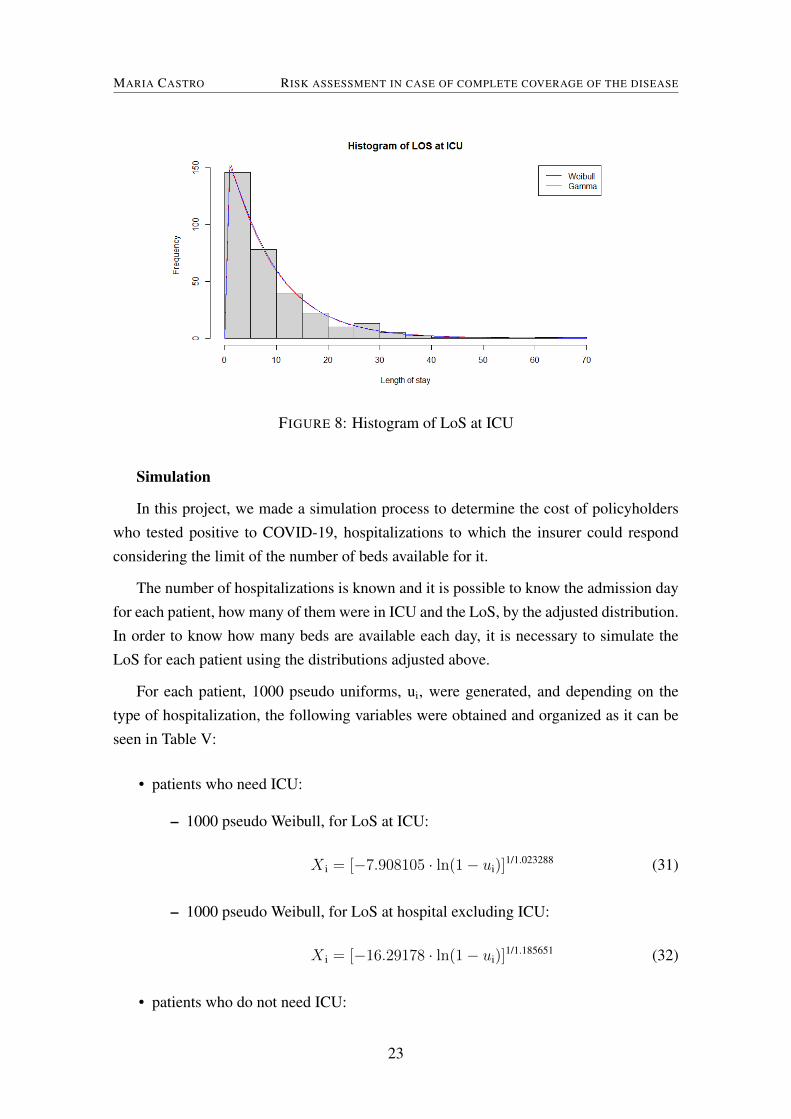
In the last two times (LoS at hospital excluding ICU for patients who also need ICUtreatments and LoS at ICU for patients who do not just stay at ICU), the best adjustmentwould not be so obvious. Figures 7 and 8 show the histograms and the distribution curveof two possible distributions for each sample of LoS. Although with a significance levelof 5%, it is possible to state that the LoS at hospital excluding ICU for patients who alsoneed ICU treatments follows a Weibull and an Gamma distributions. By observing thehistograms and curves, we can conclude that the Weibull distribution fits better to thedata. Similarly, we can assume that LoS at ICU for patients who do not just stay at ICUalso follows a Weibull distribution.
FIGURE 7: Histogram of LoS at Hospital excluding ICU for patients who need ICU
22
MARIA CASTRO RISK ASSESSMENT IN CASE OF COMPLETE COVERAGE OF THE DISEASE
FIGURE 8: Histogram of LoS at ICU
Simulation
In this project, we made a simulation process to determine the cost of policyholderswho tested positive to COVID-19, hospitalizations to which the insurer could respondconsidering the limit of the number of beds available for it.
The number of hospitalizations is known and it is possible to know the admission dayfor each patient, how many of them were in ICU and the LoS, by the adjusted distribution.In order to know how many beds are available each day, it is necessary to simulate theLoS for each patient using the distributions adjusted above.
For each patient, 1000 pseudo uniforms, ui, were generated, and depending on thetype of hospitalization, the following variables were obtained and organized as it can beseen in Table V:
• patients who need ICU:
– 1000 pseudo Weibull, for LoS at ICU:
X i = [−7.908105 · ln(1− ui)]1/1.023288 (31)
– 1000 pseudo Weibull, for LoS at hospital excluding ICU:
X i = [−16.29178 · ln(1− ui)]1/1.185651 (32)
• patients who do not need ICU:
23
MARIA CASTRO RISK ASSESSMENT IN CASE OF COMPLETE COVERAGE OF THE DISEASE
– 1000 pseudo Log-Normal, for the LoS at hospital:
X i = exp(1.035127 · Φ-1(ui) + 2.15664) (33)
Policyholder Code Entry day ICU LoS at ICU LoS at hospital (w/o ICU). . . ... ... ... ...
10A 10 No - 711B 11 No - 10. . . ... ... ... ...23S 23 Yes 14 10
TABLE VI: MATRIX OF GENERATED LENGTH OF STAY FOR EACH POLICYHOLDER
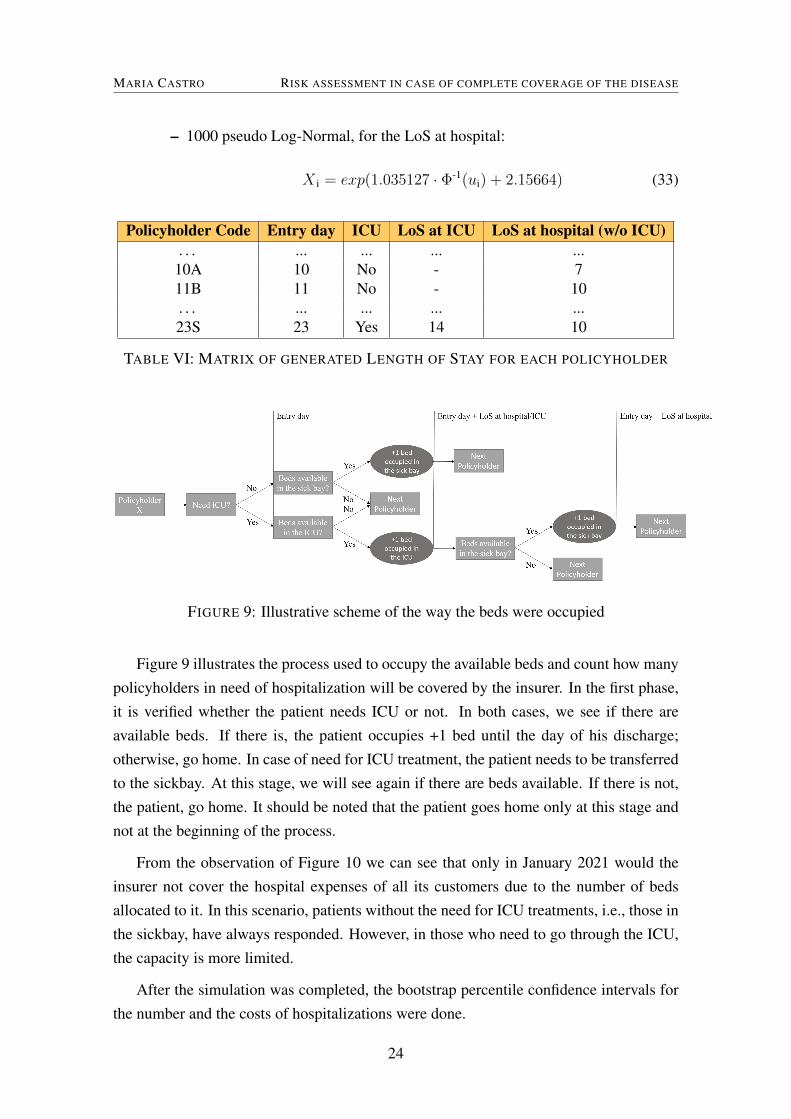
FIGURE 9: Illustrative scheme of the way the beds were occupied
Figure 9 illustrates the process used to occupy the available beds and count how manypolicyholders in need of hospitalization will be covered by the insurer. In the first phase,it is verified whether the patient needs ICU or not. In both cases, we see if there areavailable beds. If there is, the patient occupies +1 bed until the day of his discharge;otherwise, go home. In case of need for ICU treatment, the patient needs to be transferredto the sickbay. At this stage, we will see again if there are beds available. If there is not,the patient, go home. It should be noted that the patient goes home only at this stage andnot at the beginning of the process.
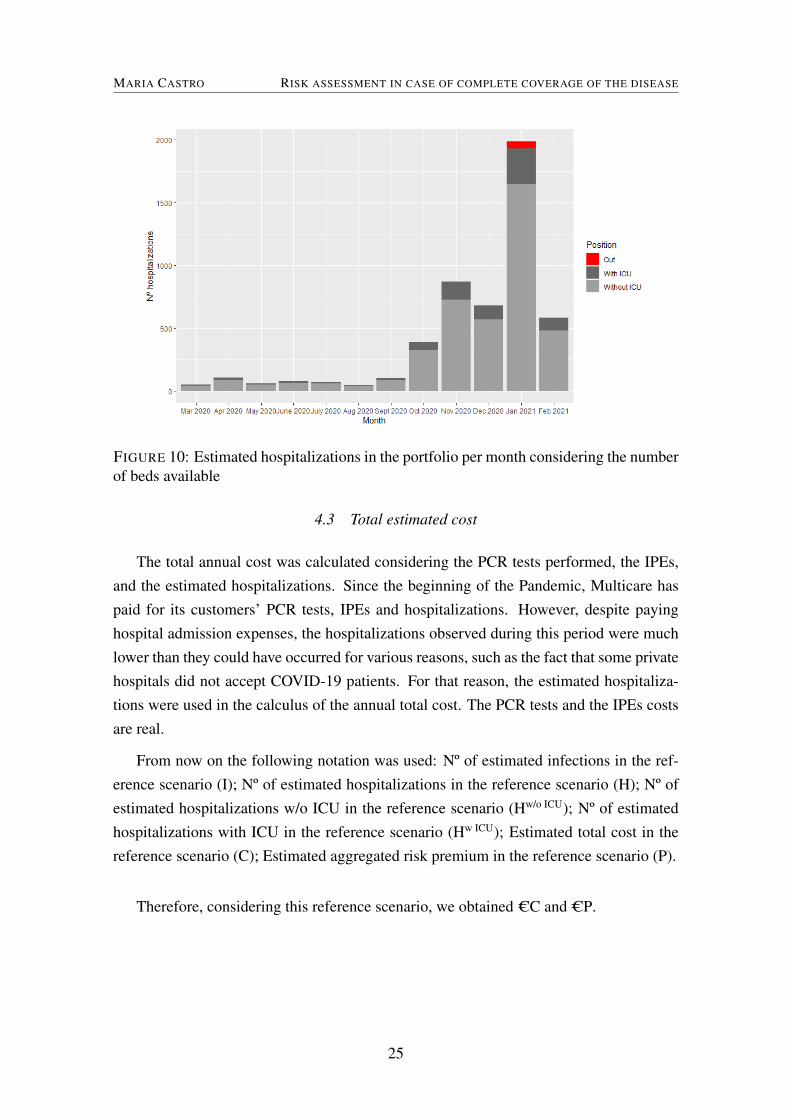
From the observation of Figure 10 we can see that only in January 2021 would theinsurer not cover the hospital expenses of all its customers due to the number of bedsallocated to it. In this scenario, patients without the need for ICU treatments, i.e., those inthe sickbay, have always responded. However, in those who need to go through the ICU,the capacity is more limited.
After the simulation was completed, the bootstrap percentile confidence intervals forthe number and the costs of hospitalizations were done.
24
MARIA CASTRO RISK ASSESSMENT IN CASE OF COMPLETE COVERAGE OF THE DISEASE
FIGURE 10: Estimated hospitalizations in the portfolio per month considering the numberof beds available
4.3 Total estimated cost
The total annual cost was calculated considering the PCR tests performed, the IPEs,and the estimated hospitalizations. Since the beginning of the Pandemic, Multicare haspaid for its customers’ PCR tests, IPEs and hospitalizations. However, despite payinghospital admission expenses, the hospitalizations observed during this period were muchlower than they could have occurred for various reasons, such as the fact that some privatehospitals did not accept COVID-19 patients. For that reason, the estimated hospitaliza-tions were used in the calculus of the annual total cost. The PCR tests and the IPEs costsare real.
From now on the following notation was used: Nº of estimated infections in the ref-erence scenario (I); Nº of estimated hospitalizations in the reference scenario (H); Nº ofestimated hospitalizations w/o ICU in the reference scenario (Hw/o ICU); Nº of estimatedhospitalizations with ICU in the reference scenario (Hw ICU); Estimated total cost in thereference scenario (C); Estimated aggregated risk premium in the reference scenario (P).
Therefore, considering this reference scenario, we obtained CC and CP.
25
MARIA CASTRO STRESS TESTS
5 STRESS TESTS
In this chapter, some stress tests were taken to see the impact on the portfolio if thepandemic was not exactly as it occurred in Portugal. At first, we though that it would beinteresting to see the situation of other countries. A survey was conducted to see whichcountries had more cases, per million people, than Portugal. Second, some assumptionswere changed, making two extreme scenarios. To conclude, rehearsals with the worstcharacteristics of other pandemics were taken.
To calculate the total cost of the following scenarios we consider that the number ofPCR tests is directly proportional to the estimated cases. A simulation procedure was alsomade for each of these scenarios in order to limit, from hospitalizations, those that theinsurer pays.
5.1 Countries with more COVID-19 cases
At this point, we ask the following question: "What would be the impact on the port-
folio if we were in another country?".
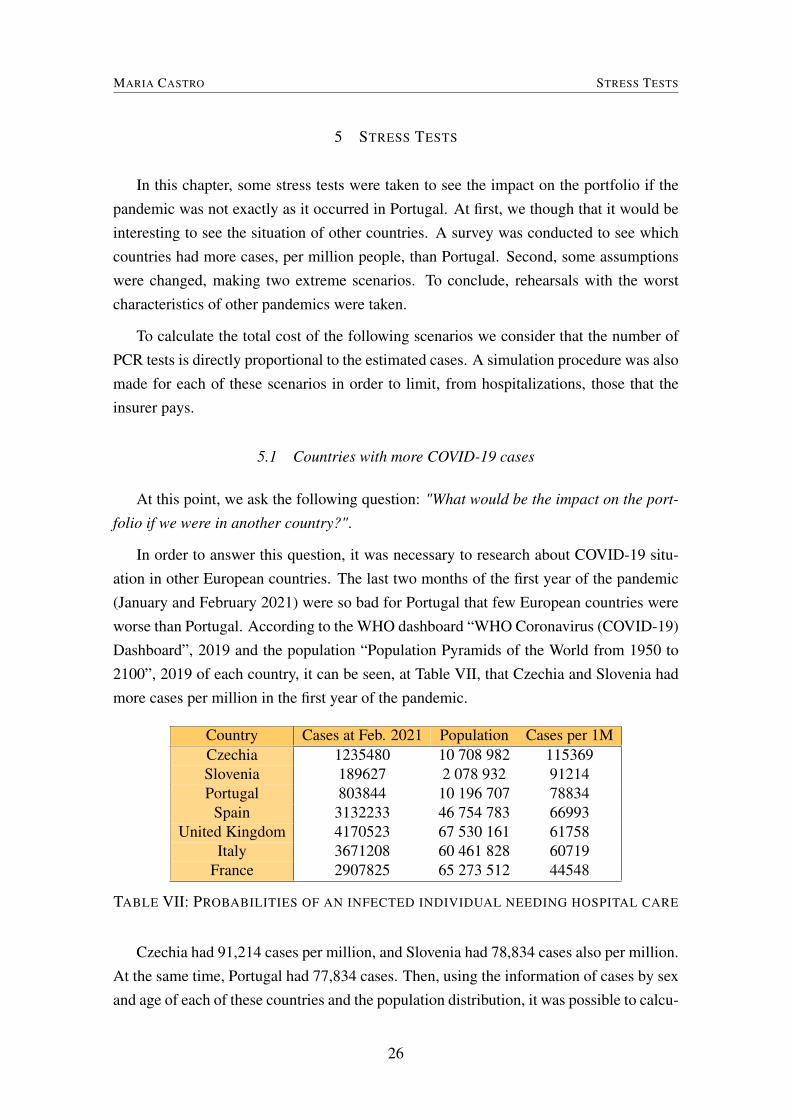
In order to answer this question, it was necessary to research about COVID-19 situ-ation in other European countries. The last two months of the first year of the pandemic(January and February 2021) were so bad for Portugal that few European countries wereworse than Portugal. According to the WHO dashboard “WHO Coronavirus (COVID-19)Dashboard”, 2019 and the population “Population Pyramids of the World from 1950 to2100”, 2019 of each country, it can be seen, at Table VII, that Czechia and Slovenia hadmore cases per million in the first year of the pandemic.
Country Cases at Feb. 2021 Population Cases per 1MCzechia 1235480 10 708 982 115369Slovenia 189627 2 078 932 91214Portugal 803844 10 196 707 78834
Spain 3132233 46 754 783 66993United Kingdom 4170523 67 530 161 61758
Italy 3671208 60 461 828 60719France 2907825 65 273 512 44548
TABLE VII: PROBABILITIES OF AN INFECTED INDIVIDUAL NEEDING HOSPITAL CARE
Czechia had 91,214 cases per million, and Slovenia had 78,834 cases also per million.At the same time, Portugal had 77,834 cases. Then, using the information of cases by sexand age of each of these countries and the population distribution, it was possible to calcu-
26
MARIA CASTRO STRESS TESTS
late the incidence rate and apply it to the portfolio. After that, cases and hospitalizationsin the portfolio were estimated.
If Multicare were in Czechia, there would be 1.47I cases and more than 1.60H hos-pitalizations. Using Slovenia data, the scenario was not so bad, but worst than Portugal.There were 1.18I cases and 1.31H hospitalizations. In order to see the impact on thefirst year of the pandemic costs, we estimated the total cost. As more hospitalizationsmean more costs, the total estimated cost would be C1.49C for Czechia and C1.26C forSlovenia.
5.2 Using other metrics
At the beginning of this study, it was said that 12% of infected individuals were hos-pitalized. In the beginning of the pandemic, it was considered that 15% of patients werehospitalized without ICU and 5% with ICU. These metrics are displayed on the DGSwebsite since the beginning of the pandemic (“Perguntas Frequentes Categoria - COVID-19”, 2019). For this case, there would have been 1.67H hospitalizations (10.82%), andthe total cost would be C1.36C.
The portfolio tendency is to converge for the Portuguese population. The distribu-tion of clients per region was maintained, i.e., for the number of clients in each region,the distribution per age and sex of each of these Portuguese regions was applied. In thisscenario, the incidence rate is also higher than the Portuguese rate because 70% of theportfolio lives in urban centres where the incidence rate is higher. There would be 0.96Iinfected people, which is 8.55% of the portfolio, and 11.87% of those would be hospi-talized. This means that the estimated total cost would increase to C1.45C because thenumber of hospitalizations increase.
5.3 Other pandemics and epidemics
For the WHO, an epidemic is "the occurrence in a community or region of cases of an
illness, specific health-related behaviour, or other health-related events clearly in excess
of normal expectancy. The community or region and the period in which the cases occur
are specified precisely. The number of cases indicating the presence of an epidemic varies
according to the agent, size, and type of population exposed, previous experience or lack
of exposure to the disease, and time and place of occurrence" (“WHO | Definitions”,2019). Therefore a pandemic is an epidemic that spread around the world.
The history of epidemics and pandemics is extensive. The first pandemic we knowoccurred between 430 B.C. and 427 B.C, the Plague of Athens, which killed two-thirds
27
MARIA CASTRO STRESS TESTS
of the Athens population. In 1347, began, in Central Asia, The Black Death plague, thelargest pandemic in history until 1918 with the Spanish Flu. The geographic origin ofthis Spanish Flu is unknown. During the first world war, as Spain was a neutral country,it was the first country to report cases. This pandemic infected 500 million people andkilled almost 5% of the world population. In Portugal, there were estimated between 50to 70 thousand deaths. In 1957, the Asian Flu emerged in Northern China and extended toalmost every country in 10 months, killing 1.1 million people. In 1968 appeared in HongKong a flu called The Hong-Kong Flu, which killed one million people, 500 thousand justin Hong Kong. At the end of the first quarter of 2009 came the Swine Flu, later called In-fluenza A Pandemic (“As Epidemias e as Pandemias na História da Humanidade”, 2020).There were 166 922 infected in Portugal and 122 people died (“Questions and answers onthe pandemic (H1N1) 2009”, 2009; “Spanish flu”, 2021).
Because of the extensive history of epidemics and pandemics, it would be relevantto study deeply some of the most recently epidemics and pandemics such as Measles,Severe Acute respiratory syndrome (SARS)-CoV and Middle East respiratory syndrome(MERS)-CoV. Next, we describe briefly each of these epi-/pan-demics and see their im-pact.
Measles
Measles is a viral infection characterized by high fever, cough, conjunctivitis, runnynose, and red spots in the skin. The virus infects the respiratory system and spreadsthroughout the body. The symptoms begin about 10 to 12 days after the infection and per-sist 4 to 7 days. It is highly contagious and can be transmitted from 4 days prior to 4 daysafter the onset of the symptoms. Serious complications occur more frequently in childrenunder the age of 5. Until 1963, before the vaccine, measles caused 2.6 million deaths ev-ery year. It was one of the main causes of infant mortality (“Measles”, 2019; “Sarampo”,2021). One-third of infected people had serious complications as acute encephalitis andpneumonia. The transmission rate is 23.9%, 10% of the infected individuals died, and67.5% recovered from the disease. In 2019, 364 811 cases of measles were reported - thehighest number in the last two decades. The reproduction number, R0, is higher than 3.7(“Modeling of measles epidemic with optimized fractional order under Caputo differen-tial operator | Elsevier Enhanced Reader”, 2021).
SARS-CoV
The Epidemic SARS appeared in November of 2002 in China and it caused severeacute respiratory syndrome. There were more than 8000 infected people, only 135 were
28
MARIA CASTRO STRESS TESTS
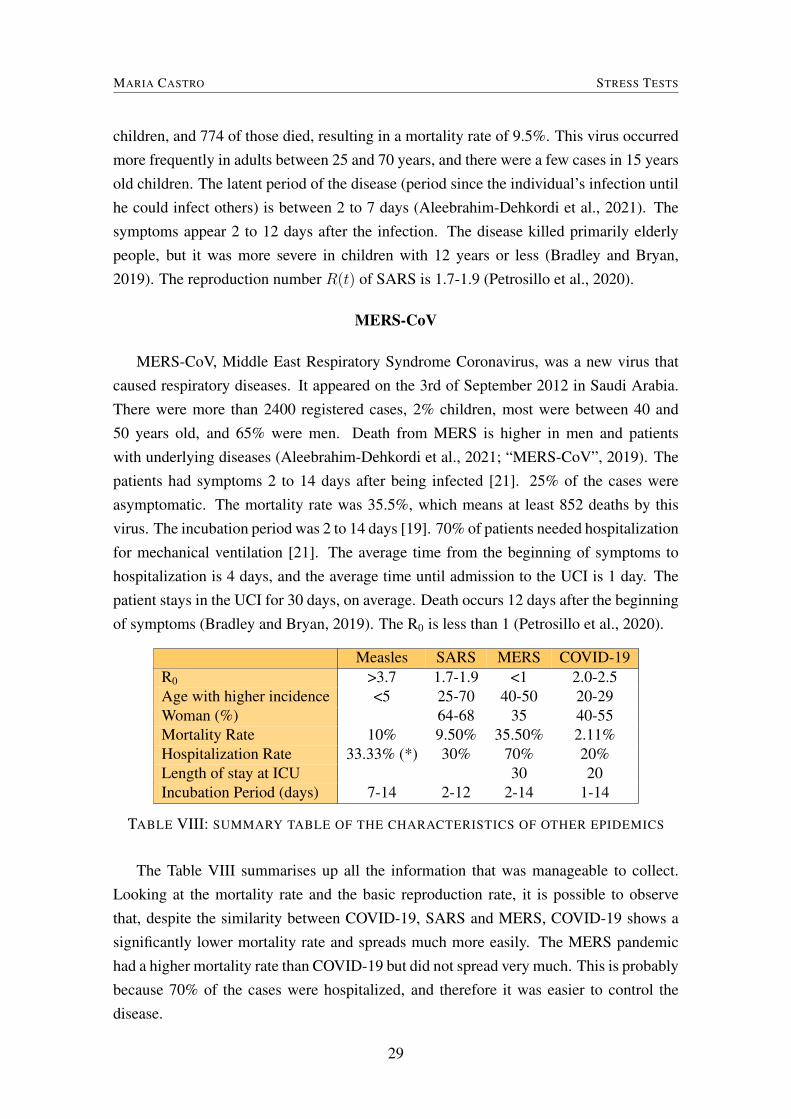
children, and 774 of those died, resulting in a mortality rate of 9.5%. This virus occurredmore frequently in adults between 25 and 70 years, and there were a few cases in 15 yearsold children. The latent period of the disease (period since the individual’s infection untilhe could infect others) is between 2 to 7 days (Aleebrahim-Dehkordi et al., 2021). Thesymptoms appear 2 to 12 days after the infection. The disease killed primarily elderlypeople, but it was more severe in children with 12 years or less (Bradley and Bryan,2019). The reproduction number R(t) of SARS is 1.7-1.9 (Petrosillo et al., 2020).
MERS-CoV
MERS-CoV, Middle East Respiratory Syndrome Coronavirus, was a new virus thatcaused respiratory diseases. It appeared on the 3rd of September 2012 in Saudi Arabia.There were more than 2400 registered cases, 2% children, most were between 40 and50 years old, and 65% were men. Death from MERS is higher in men and patientswith underlying diseases (Aleebrahim-Dehkordi et al., 2021; “MERS-CoV”, 2019). Thepatients had symptoms 2 to 14 days after being infected [21]. 25% of the cases wereasymptomatic. The mortality rate was 35.5%, which means at least 852 deaths by thisvirus. The incubation period was 2 to 14 days [19]. 70% of patients needed hospitalizationfor mechanical ventilation [21]. The average time from the beginning of symptoms tohospitalization is 4 days, and the average time until admission to the UCI is 1 day. Thepatient stays in the UCI for 30 days, on average. Death occurs 12 days after the beginningof symptoms (Bradley and Bryan, 2019). The R0 is less than 1 (Petrosillo et al., 2020).
Measles SARS MERS COVID-19R0 >3.7 1.7-1.9 <1 2.0-2.5Age with higher incidence <5 25-70 40-50 20-29Woman (%) 64-68 35 40-55Mortality Rate 10% 9.50% 35.50% 2.11%Hospitalization Rate 33.33% (*) 30% 70% 20%Length of stay at ICU 30 20Incubation Period (days) 7-14 2-12 2-14 1-14
TABLE VIII: SUMMARY TABLE OF THE CHARACTERISTICS OF OTHER EPIDEMICS
The Table VIII summarises up all the information that was manageable to collect.Looking at the mortality rate and the basic reproduction rate, it is possible to observethat, despite the similarity between COVID-19, SARS and MERS, COVID-19 shows asignificantly lower mortality rate and spreads much more easily. The MERS pandemichad a higher mortality rate than COVID-19 but did not spread very much. This is probablybecause 70% of the cases were hospitalized, and therefore it was easier to control thedisease.
29
MARIA CASTRO STRESS TESTS
The worst characteristics of each of the outbreaks were taken, and more trials wereperformed to estimate the cost.
The most impactful characteristics in the case of Measles are R0, which is higher thanCOVID-19, and the hospitalization rate. It was considered that all patients who developpneumonia are hospitalized. Carrying the rate of hospitalizatons would be 33%. It wouldbe necessary to use an epidemiological model to see the evolution of a pandemic withthis R0. However, epidemiological models did not fit the objective of this project. In thiscase, it was considered that there would be twice the cases of COVID-19. Therefore, ahospitalization rate of 33% and twice the number of infected was used in this scenario.There would be 2I cases and 7.02H hospitalizations. The estimated annual cost would beC3.46C.
In the scenario for the SARS-CoV epidemic, a higher hospitalization rate was consid-ered in the younger age groups, and it was also assumed that the overall hospitalizationrate would be 30%. In this case, the annual estimated cost would be C2.15C.
Based on the MERS-CoV epidemic, the last scenario, it was considered a 70% hospi-talization rate, instead of the 14%. The mean length of stay (LoS) at the hospital was 3/2of the average hospitalization time of COVID-19. Therefore, the impact of the increasein the average hospitalization time was considered proportional to the cost. In this case,the annual estimated cost would be C3.87C.
Finally, a scenario was made that contemplated the most extreme one. Therefore, itwas assumed that there would be twice as many infected patients, 70% of those would behospitalized, and that the time of hospitalization increased. Consequently, in this scenario,the estimated total cost would be C5.07C.
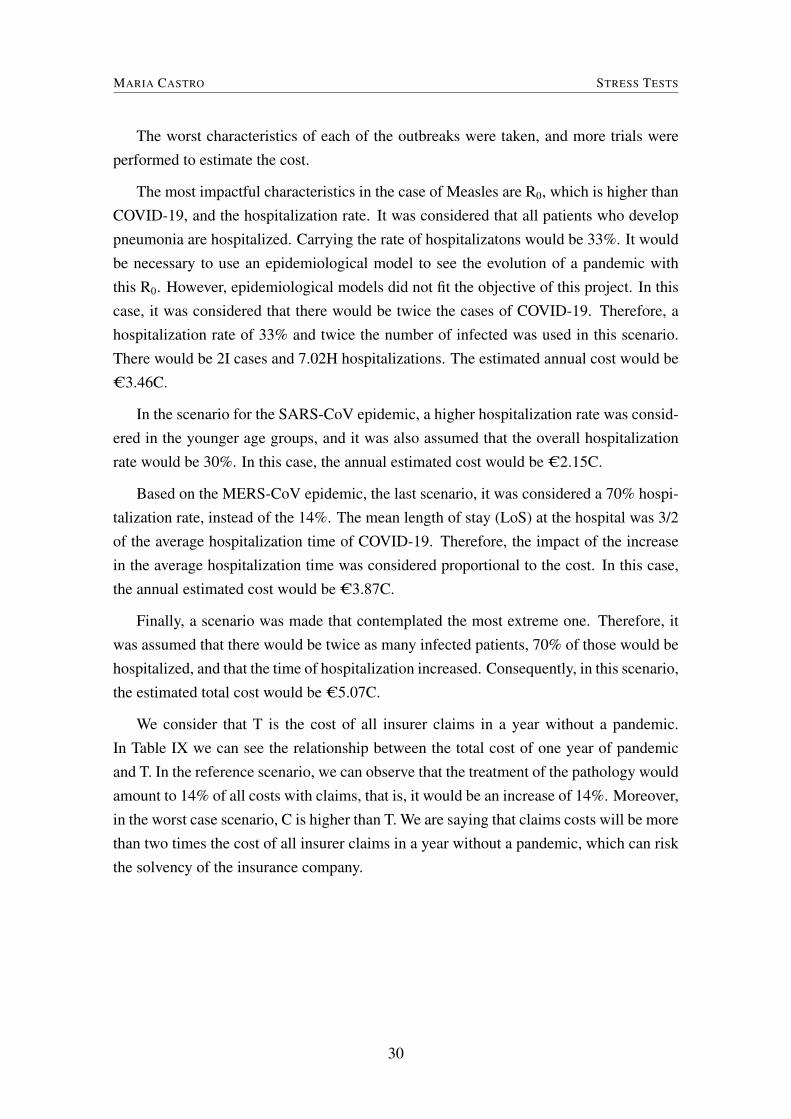
We consider that T is the cost of all insurer claims in a year without a pandemic.In Table IX we can see the relationship between the total cost of one year of pandemicand T. In the reference scenario, we can observe that the treatment of the pathology wouldamount to 14% of all costs with claims, that is, it would be an increase of 14%. Moreover,in the worst case scenario, C is higher than T. We are saying that claims costs will be morethan two times the cost of all insurer claims in a year without a pandemic, which can riskthe solvency of the insurance company.
30

MARIA CASTRO STRESS TESTS
Infected Hospw/o ICU Hospw/ ICU Total Cost(C) C/TMulticare I Hw/o ICU Hw/ ICU C 0.14With the incidences of the Czech Republic 1.47I 1.61Hw/o ICU 1.58Hw ICU 1.49C 0.21With the incidences of Slovenia 1.18I 1.31Hw/o ICU 1.30Hw/ ICU 1.26C 0.18Higher hospitalization rate (15% w/o ICU + 5% w/ICU) 1.00I 1.67Hw/o ICU 1.67Hw/ ICU 1.36C 0.19Assuming portfolio as the same distribution as Portugal 0.96I 1.59Hw/o ICU 2.61Hw/ ICU 1.45C 0.20Sarampo 2.00I 7.32Hw/o ICU 5.55Hw/ ICU 3.46C 0.49SARS 1.00I 3.69Hw/o ICU 2.50Hw/ ICU 2.15C 0.30MERS 1.00I 11.30Hw/o ICU 5.83Hw/ ICU 3.87C 0.55worst case scenario 2.00I 22.60Hw/o ICU 11.65Hw/ ICU 5,07C 0,72
TABLE IX: SUMMARY TABLE OF THE CASE SCENARIOS
31
MARIA CASTRO LOSS AND COMBINED RATIOS
6 LOSS AND COMBINED RATIOS
Loss Ratio
The loss ratio represents the relationship between losses, which include paid insuranceclaims and adjustments expenses, and total collected insurance premiums. Thus, the lossratio is the quotient between insurance claims paid plus adjustment expenses and the totalearned premiums (Equation 34).
Loss ratios vary depending on the type of insurance. For example, the loss ratio forhealth insurance is higher than the same ratio for car and property insurance because itis much more used. Loss ratios help assess the health and profitability of an insurancecompany. The lower the ratio, the greater the profitability of the insurance company. Forexample, if we observed high loss ratios, an insurance company cannot produce enoughrevenues or income, making it impossible to meet or pay its financial obligations.
Loss Ratio =Incurred Losses + Adjustment expenses
Earned Premium(34)
Combined Ratio
The combined ratio also measures profitability an insurance company uses to scalehow well it performs in its operations. The combined ratio is the quotient of the sum ofincurred losses and expenses and the earned premium (Equation 35).
Combined Ratio =Incurred Losses + Expenses
Earned Premium(35)
Insurance companies want a ratio below 100% because it indicates that the companymakes an underwriting profit. In comparison, a ratio higher than 100% means that theinsurance company is paying out more money in claims than receiving from premiums.
The combined ratio can be written as the sum of the Loss Ratio and the ExpensesRatio.
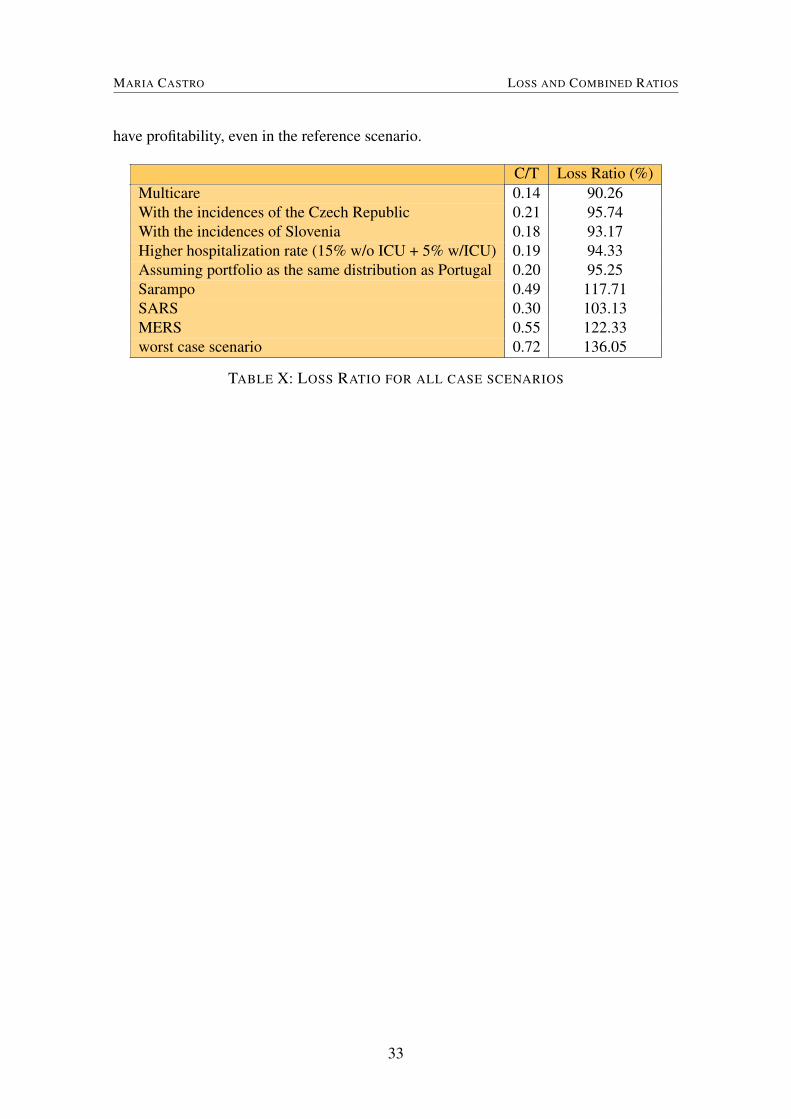
In 2019 Multicares Loss Ratio was 79.1%, and the Combined Ratio was 96.7%. Inthe reference scenario, we observed that the pandemic related costs would increase 14%of the annual costs of all claims. It means that the numerator increases by 14% andthe denominator, the premiums, remain the same. In Table X we can see that the LossRatio could vary from 90% to 136% depending on the circumstances. Therefore it is notdifficult for the Combined Ratio to reach 100%, and consequently, the insurer ceases to
32
MARIA CASTRO LOSS AND COMBINED RATIOS
have profitability, even in the reference scenario.
C/T Loss Ratio (%)Multicare 0.14 90.26With the incidences of the Czech Republic 0.21 95.74With the incidences of Slovenia 0.18 93.17Higher hospitalization rate (15% w/o ICU + 5% w/ICU) 0.19 94.33Assuming portfolio as the same distribution as Portugal 0.20 95.25Sarampo 0.49 117.71SARS 0.30 103.13MERS 0.55 122.33worst case scenario 0.72 136.05
TABLE X: LOSS RATIO FOR ALL CASE SCENARIOS
33
MARIA CASTRO CONCLUSION
7 CONCLUSION
This project was carried during changing times due to the COVID-19 pandemic crisis.The current pandemic has brought new challenges for the entire health sector, includinghealth insurance companies that did not cover expenses related to such pandemic crisis.Given the lack of data from previous pandemics and epidemics, and therefore, the com-plexity in charging pandemic-related products, the risk of these events happening was notwell understood. The current pandemic has made it more relevant to discuss the pos-sible coverage of these products. In Portugal, Multicare and other insurance companiesworldwide have also come forward with products to meet the needs of their policyholders.These products ranged from access to vaccination, online consultations, tests, or even alump sum benefit if hospitalization was required. This research aimed to estimate the totalcost for health insurance during a pandemic crisis to remove the clause that safeguards in-surers from this cost. COVID-19 brought us many data with which we could estimate thiscost. Therefore, considering the incidences, the hospitalization rate, the limit of availablebeds, and using a simulation process, we estimated the cost of one year of the pandemic.The medical treatment costs in a pandemic represent 14% of all insurer claims in a yearwithout a pandemic. Nothing guarantees us that the next pandemic will be precisely thesame as the current one, so when we perform the stress tests, we conclude that in theworst case scenario, the cost related to a pandemic is 0.72 times the cost of all other in-surance claims. Therefore it is very likely that the Loss and Combined Ratios are higherthan 100%, and the insurer does not have profitability, which can risk the solvency of theinsurance company. The steps to be taken include calculating a premium or an additionalpremium if it is taken into another existing product. The main challenge of this calculationis to consider that pandemics do not occur every year. However, on the other hand, we donot know the time until the next pandemic, which we will also consider as a variable.
34
MARIA CASTRO REFERENCES
REFERENCES
Abd-Elfattah, A. M. (2011). Goodness of fit test for the generalized Rayleigh distributionwith unknown parameters [Publisher: Taylor & Francis _eprint: https://doi.org/10.1080/00949650903348155]. Journal of Statistical Computation and Simulation,81(3), 357–366. https://doi.org/10.1080/00949650903348155
Aleebrahim-Dehkordi, E., Soveyzi, F., Deravi, N., Rabbani, Z., Saghazadeh, A., & Rezaei,N. (2021). Human Coronaviruses SARS-CoV, MERS-CoV, and SARS-CoV-2in Children [Publisher: Elsevier]. Journal of Pediatric Nursing: Nursing Care of
Children and Families, 56, 70–79. https://doi.org/10.1016/j.pedn.2020.10.020As Epidemias e as Pandemias na História da Humanidade. (2020). Retrieved April 22,
2021, from https://www.medicina.ulisboa.pt/newsfmul-artigo/99/epidemias-e-pandemias-na-historia-da-humanidade
Bradley, B. T., & Bryan, A. (2019). Emerging respiratory infections: The infectious dis-ease pathology of SARS, MERS, pandemic influenza, and Legionella. Seminars
in Diagnostic Pathology, 36(3), 152–159. https://doi.org/10.1053/j.semdp.2019.04.006
Camas dos hospitais. (2020). Retrieved June 22, 2021, from https://www.observatorio-das-desigualdades.com/2020/04/03/camas-dos-hospitais/
Coronavirus FAQs. (2020). Retrieved July 15, 2021, from https:/ /www.vitality.co.uk/coronavirus-faqs/
Gebhard, C., Regitz-Zagrosek, V., Neuhauser, H. K., Morgan, R., & Klein, S. L. (2020).Impact of sex and gender on COVID-19 outcomes in Europe. Biology of Sex Dif-
ferences, 11(1), 29. https://doi.org/10.1186/s13293-020-00304-9IRDAI Welcomes You. (2020). Retrieved July 13, 2021, from https://www.irdai.gov.in/
Defaulthome.aspx?Page=H1Lemos-Paião, A. P., Silva, C. J., & Torres, D. F. M. (2020). A New Compartmental Epi-
demiological Model for COVID-19 with a Case Study of Portugal. Ecological
Complexity, 44, 100885. https://doi.org/10.1016/j.ecocom.2020.100885López-Cheda, A., Jácome, M.-A., Cao, R., & Salazar, P. M. D. (2021). Estimating lengths-
of-stay of hospitalised COVID-19 patients using a non-parametric model: A casestudy in Galicia (Spain) [Publisher: Cambridge University Press]. Epidemiology
& Infection, 149. https://doi.org/10.1017/S0950268821000959Lusa. (2021). Covid-19: Vítimas mortais no domicílio quase triplicam em Janeiro. Re-
trieved May 10, 2021, from https : / / www. publico . pt / 2021 / 02 / 08 / sociedade /noticia/covid19-vitimas-mortais-domicilio-quase-triplicam-janeiro-1949835
35
MARIA CASTRO REFERENCES
Measles. (2019). Retrieved May 3, 2021, from https://www.who.int/news- room/fact-sheets/detail/measles
MERS-CoV. (2019). Retrieved April 22, 2021, from https://pandemic.internationalsos.com/overview/mers-overview
Modeling of measles epidemic with optimized fractional order under Caputo differentialoperator | Elsevier Enhanced Reader. (2021). https:/ /doi.org/10.1016/j .chaos.2021.110766
Neves, S. (2021). Covid-19. Um terço dos internados em Portugal está entre os 40 e os69 anos. Retrieved May 10, 2021, from https : / /www.publico .pt /2020/11/18/sociedade/noticia/covid19-terco-internados-portugal-estao-40-69-anos-1939711
New Pandemic Insurance solution protects consumers against the financial ramificationsof Covid-19 hospitalisation – Sirago Underwriting Managers. (2021). RetrievedJuly 13, 2021, from https : / / sirago . co . za /new- pandemic - insurance - solution -protects-consumers-against-the-financial-ramifications-of-covid-19
Perguntas Frequentes Categoria - COVID-19. (2019). Retrieved May 16, 2021, fromhttps://covid19.min-saude.pt/category/perguntas-frequentes/
Petrosillo, N., Viceconte, G., Ergonul, O., Ippolito, G., & Petersen, E. (2020). COVID-19, SARS and MERS: Are they closely related? [Publisher: Elsevier]. Clinical
Microbiology and Infection, 26(6), 729–734. https://doi.org/10.1016/j.cmi.2020.03.026
Population Pyramids of the World from 1950 to 2100. (2019). Retrieved May 16, 2021,from https://www.populationpyramid.net/%20world/2019/
Questions and answers on the pandemic (H1N1) 2009. (2009). Retrieved May 3, 2021,from https://www.ecdc.europa.eu/en/seasonal-influenza/2009-influenza-h1n1-faq
Rees, E. M., Nightingale, E. S., Jafari, Y., Waterlow, N. R., Clifford, S., B Pearson, C. A.,Group, C. W., Jombart, T., Procter, S. R., & Knight, G. M. (2020). COVID-19length of hospital stay: A systematic review and data synthesis. BMC medicine,18(1), 270. https://doi.org/10.1186/s12916-020-01726-3
Ross, S. M. (2013). Simulation [Google-Books-ID: 1Dwsyyty3P8C]. Academic Press.Sarampo. (2021). Retrieved May 3, 2021, from https://www.sns24.gov.pt/tema/doencas-
infecciosas/sarampo/Spanish flu [Page Version ID: 1018577093]. (2021). Retrieved April 22, 2021, from https:
//en.wikipedia.org/w/index.php?title=Spanish_flu&oldid=1018577093Stigler, S. M. (2012). Studies in the history of probability and statistics, L: Karl Pearson
and the Rule of Three. Biometrika, 99(1), 1–14. https://doi.org/10.1093/biomet/asr046
36

MARIA CASTRO REFERENCES
WHO | Definitions: Emergencies [Publisher: World Health Organization]. (2019). Re-trieved April 29, 2021, from https://www.who.int/hac/about/definitions/en/
WHO Coronavirus (COVID-19) Dashboard. (2019). Retrieved May 7, 2021, from https://covid19.who.int
WHO Outbreak Benefit. (2020). Retrieved July 15, 2021, from https://www.discovery.co.za/corporate/covid-19-benefits-and-cover
37
Related Documents