MASTER IN FINANCE MASTERS FINAL WORK PROJECT EQUITY RESEARCH: ALIBABA GROUP ANTONIO SCIAUDONE OCTOBER-2018

Welcome message from author
This document is posted to help you gain knowledge. Please leave a comment to let me know what you think about it! Share it to your friends and learn new things together.
Transcript

MASTER IN
FINANCE
MASTERS FINAL WORK
PROJECT
EQUITY RESEARCH: ALIBABA GROUP
ANTONIO SCIAUDONE
OCTOBER-2018
MASTERS IN
FINANCE
MASTERS FINAL WORK
PROJECT
EQUITY RESEARCH: ALIBABA GROUP
ANTONIO SCIAUDONE
SUPERVISOR:
PROFESSORA DOUTORA ANA ISABEL ORTEGA VENÂNCIO
OCTOBER-2018

TABLE OF CONTENTS
1.RESEARCH SNAPSHOT ....................................................................................................................... 1
2.BUSINESS DESCRIPTION .................................................................................................................... 2
KEY LEADING PLATFORMS.......................................................................................................................... 2 ALIBABA.COM......................................................................................................................................... 2 1668.COM ............................................................................................................................................ 2 TAOBAO.COM ......................................................................................................................................... 2 ALIMAMA .............................................................................................................................................. 2 TMALL .................................................................................................................................................. 2 ALIBABA CLOUD ...................................................................................................................................... 3 ALIEXPRESS ............................................................................................................................................ 3 CAINIAO ................................................................................................................................................ 3 ANT FINANCIAL ....................................................................................................................................... 3 OPERATIONAL STRATEGIES ......................................................................................................................... 3 SALES & MARKETING ........................................................................................................................................... 3 PAYMENT SYSTEM ................................................................................................................................................ 3 LOGISTICS ........................................................................................................................................................... 4
3.MANAGEMENT AND CORPORATE GOVERNANCE ............................................................................... 4
THE PARTNERSHIP MODEL ......................................................................................................................... 4 BOARD OF DIRECTORS .......................................................................................................................................... 4 AUDIT COMMITTEE .............................................................................................................................................. 5 COMPENSATION COMMITTEE ................................................................................................................................ 5 NOMINATING AND CORPORATE GOVERNANCE COMMITTEE ........................................................................................ 5 GOVERNANCE STRUCTURE AND DIRECTION .............................................................................................................. 5
4.INDUSTRY OVERVIEW AND COMPETITIVE POSITIONING .................................................................... 6
ECONOMIC OUTLOOK ............................................................................................................................... 6 ONLINE RETAIL INDUSTRY AND TRENDS......................................................................................................... 7 COMPETITIVE POSITIONING ........................................................................................................................ 9 MAIN COMPETITORS IN THE MARKET ............................................................................................................ 9 AMAZON ............................................................................................................................................... 9 EBAY .................................................................................................................................................. 10 GOME ................................................................................................................................................. 10 JD.COM............................................................................................................................................... 10 SUNING ............................................................................................................................................... 10 TENCENT ............................................................................................................................................. 10 VIPSHOP .............................................................................................................................................. 10 PESTEL ANALYSIS ................................................................................................................................... 11 PORTER’S FIVE FORCES ........................................................................................................................... 12 SWOT ANALYSIS .................................................................................................................................. 13
5.FINANCIAL ANALYSIS ...................................................................................................................... 15
REVENUE AND MAIN COSTS ...................................................................................................................... 15 DUPONT ANALYSIS ................................................................................................................................ 15
LIQUIDITY & EFFICIENCY .......................................................................................................................... 16 SOLVENCY ............................................................................................................................................ 16
6.VALUATION .................................................................................................................................... 16
DCF MODEL ........................................................................................................................................ 16 SALES REVENUE .................................................................................................................................... 17 GROSS MARGIN .................................................................................................................................... 17 CAPITAL EXPENDITURE ............................................................................................................................ 17 WEIGHTED AVERAGE COST OF CAPITAL (WACC) .......................................................................................... 18 TERMINAL VALUE .................................................................................................................................. 18 MULTIPLES VALUATION .......................................................................................................................... 18 MONTE CARLO SIMULATION AND SENSITIVITY ANALYSIS ................................................................................. 19
7. INVESTMENT RISKS ........................................................................................................................ 19
ECONOMIC RISK .................................................................................................................................... 19 MARKET RISKS ...................................................................................................................................... 19 OPERATIONAL RISKS............................................................................................................................... 20 OTHER RISKS ........................................................................................................................................ 21
8. REFERENCES .................................................................................................................................. 49
APPENDIX 1- MAIN BUSINESS UNITS .................................................................................................. 21
APPENDIX 2- ORGANIZATION STRUCTURE .......................................................................................... 23
APPENDIX 3 - CORPORATE GOVERNANCE STRUCTURE ........................................................................ 24
APPENDIX 4 - BOARD OF DIRECTORS .................................................................................................. 25
APPENDIX 5 - ALIBABA PARTNERSHIP (* PARTNERSHIP COMMITTEE MEMBERS) ................................. 26
APPENDIX 6- BALANCE SHEET ............................................................................................................ 28
APPENDIX 7- COMMON SIZE BALANCE SHEET ..................................................................................... 29
APPENDIX 8- INCOME STATEMENT .................................................................................................... 30
APPENDIX 9 - COMMON SIZE INCOME STATEMENT ............................................................................ 31
APPENDIX 10- CASHFLOW STATEMENT .............................................................................................. 32
APPENDIX 11- COMMON SIZE INCOME STATEMENT ........................................................................... 33
APPENDIX 12- DUPONT ANALYSIS ...................................................................................................... 34
APPENDIX 13- ALTMAN’S Z- SCORE ANALYSIS ..................................................................................... 34
APPENDIX 14- COST OF CAPITAL ANALYSIS ......................................................................................... 35
APPENDIX 15- DCF TABLE ................................................................................................................... 36
APPENDIX 16- DCF DETAILS ................................................................................................................ 37
APPENDIX 17- MULTIPLES METHOD ................................................................................................... 44
APPENDIX 18- RATING DEFINITION .................................................................................................... 45
APPENDIX 19- MONTE CARLO SIMULATION, SENSITIVITY AND SCENARIO ANALYSIS ............................ 46
APPENDIX 20 - RISK MATRIX .............................................................................................................. 48

INDEX OF FIGURES
FIGURE 1 - GMV AND REVENUE GROWTH IN US$ BILLION 2
FIGURE 2 - REVENUE GENERATED BY CATEGORY PROVIDED 2
FIGURE 3 – OPERATIONAL STRUCTURE 3
FIGURE 4 – GDP GROWTH RATE 6
FIGURE 5 - CHINA GDP PER CAPITA AND UNEMPLOYMENT RATE 6
FIGURE 6 - CHINA GROSS DEBT AND NON-FINANCIAL DEBT OVER GDP EXPRESSED IN % 6
FIGURE 7 - ONLINE RETAIL SALES IN CHINA IN BILLION US $ SOURCE: SOVEREIGN ANALYSIS 7
FIGURE 8 – AGE OF CHINESE ONLINE SHOPPERS 7
FIGURE 9 – TYPOLOGY OF TRANSACTION 7
FIGURE 10 - ONLINE GROWTH IN US$ BILLION IN TERMS OF CATEGORY PURCHASED 8
FIGURE 11 – URBAN PRIVATE CONSUMPTION BY CLASS IN PERCENTAGE 8
FIGURE 12 – PURCHASES BY CATEGORY 9
FIGURE 14 – REVENUE FORECAST IN US$ BILLION 15
FIGURE 15 – PROFITABILITY INDICATORS 15
FIGURE 16 – EFFICIENCY INDICATORS IN DAYS 15
FIGURE 17 – LIQUIDITY INDICATORS 16
FIGURE 18 – SOLVENCY INDICATORS 16

INDEX OF TABLES
TABLE 1- RISK ASSESSMENT 1
TABLE 2- RISK CLASSIFICATION MATRIX 1
TABLE 3- MARKET PROFILE 1
TABLE 4 – ALIBABA SHARE PRICE 1
TABLE 5 – SALES BREAKDOWN 17
TABLE 6 – COST OF CAPITAL 17
TABLE 7, 7.1 – INTRINSIC VALUE AND FCFF 18
TABLE 8 – EV/EBITDA MULTIPLES 18
TABLE 9 – P/E MULTIPLES 19
TABLE 10 – MONTE CARLO STATISTICS 19
TABLE 11 – RISK MATRIX 19
TABLE 12 – RISK DRIVERS 21

Abstract
This project comprehends an exhaustive analysis and valuation of Alibaba Group’s intrinsic
value for the end of 2018, according to ISEG’s Master’s in finance final work project. This
work follows the format recommended by the CFA Institute. Alibaba is an international
player, which has continuously changed the rules of doing business, focusing primary on
small and medium Chinese enterprises. The valuation takes into account the external
factors such as macroeconomic trends, industry projections and geopolitical evolution and
the company’s annual accounts. We compute the intrinsic value by using an absolute
valuation method, more specifically the Weighted Average Cost of Capital (WACC) and a
relative valuation method, considering the multiples method. Additionally, a sensitivity
analysis and Monte Carlo simulations were used to evaluate the robustness of the
assumptions. The final target price by the end of 2018 is 237.80 US$, representing a
growth potential of 52.44% from the current price of 156 US$ in September 30th, 2018.
Considering also the estimated high risk for the company, our final recommendation is
BUY.
Keywords: Alibaba Group; Equity Research; Weighted Average Cost of
Capital; Valuation; Discounted Cash Flow method; Relative Valuation
method; Retail Industry; E-commerce

Resumo
Este projeto compreende uma análise e avaliação detalhada do valor intrínseco do Grupo
Alibaba para o final de 2018, de acordo com o projeto final do Mestrado em Finanças do
ISEG. Este trabalho segue o formato recomendado pelo Instituto CFA. A Alibaba é uma
das maiores empresas multinacional que tem constatemente mudado as regras de fazer
negócios, concentrando-se em pequenas e médias empresas chinesas. A avaliação teve
em conta fatores externos, como tendências macroeconômicas, projeções da indústria e
evolução geopolítica e os relatório e contas da empresa. O valor intrínseco foi obtido pelo
método de avaliação absoluta, mais especificamente o Custo Médio Ponderado de Capital
(WACC) e pelo método relativo, o método dos múltiplos. Adicionalmente, realizou-se uma
análise de sensibilidade e uma simulação de Monte Carlo para testar a robustez dos
pressupostos utilizados. O preço-alvo no final de 2018, é de 237.80 US$, representando
um potencial de valorização de 52.44%, face ao preço atual de 156 US$, no dia 30 de
Setembro 2018. Considerando também o alto risco estimado para a empresa, a nossa
recomendação final é COMPRA.
Palavras-chave: Grupo Alibaba; Pesquisa de Ações, Custo Médio Ponderado de Capital;
Avaliação; Método de Fluxo de Caixa Descontado; Método de avaliação relativa; Indústria
de varejo; Comércio eletrônico

Abbreviations
APV – Adjusted Present Value
B – Beta
B2B- Business to Business
B2C- Business to Consumers
BASE- Beginning, Addition, Subtraction, Ending
BU – Business Unit
C2C- consumer to consumer
CAGR- Constant Annual Growth Rate
CAPEX – Capital Expenditure
CCC – Cash Cycle Conversion
COGS – Cost of Goods Sold
D&A – Depreciation and Amortization
DCF – Discounted Cash Flow
DIO – Days Inventory Outstanding
DPO – Days Payable Outstanding
DSO – Days Sales Outstanding
EBIT – Earnings Before Interest and Taxes
EBITDA – Earnings Before Interest, Taxes, Depreciation and Amortization
ER – Economic Risks
ERP – Equity Risk Premium
FCFF- Free Cash Flow to the Firm
FED- Federal Reserve System
FMCG – Fast Moving Consumer Goods
g – Perpetual Growth Rate
GDP – Gross Domestic Product
GMV- Gross Merchandise Value
IMF- International Monetary Fund
M&A- Mergers and Acquisitions
MR- Market Risks
NWC – Net Working Capital
NYSE – New York Stock Exchange
OR – Operational Risks
OTR- Other Risks
P&L – Profit & Loss (statement)
P.R.C.- Popular Republic of China
PESTEL- Political, Economic, Social, Technological, Environmental, Legal
PRC – Popular Republic of China
Rd – Cost of Debt
Rf – Risk-Free Rate
ROA – Return on Asset
ROE – Return on Equity
Ru – Unlevered Cost of Capital
S.W.O.T. – Strengths, Weaknesses, Opportunities and Threats
SAIC- State Administration for Industry & Commerce
TV – Terminal Value
W.A.C.C. – Weighted Average Cost of Capital
WACC- Weighted Average Cost of Capital
Y.O.Y- Year Over Year
1
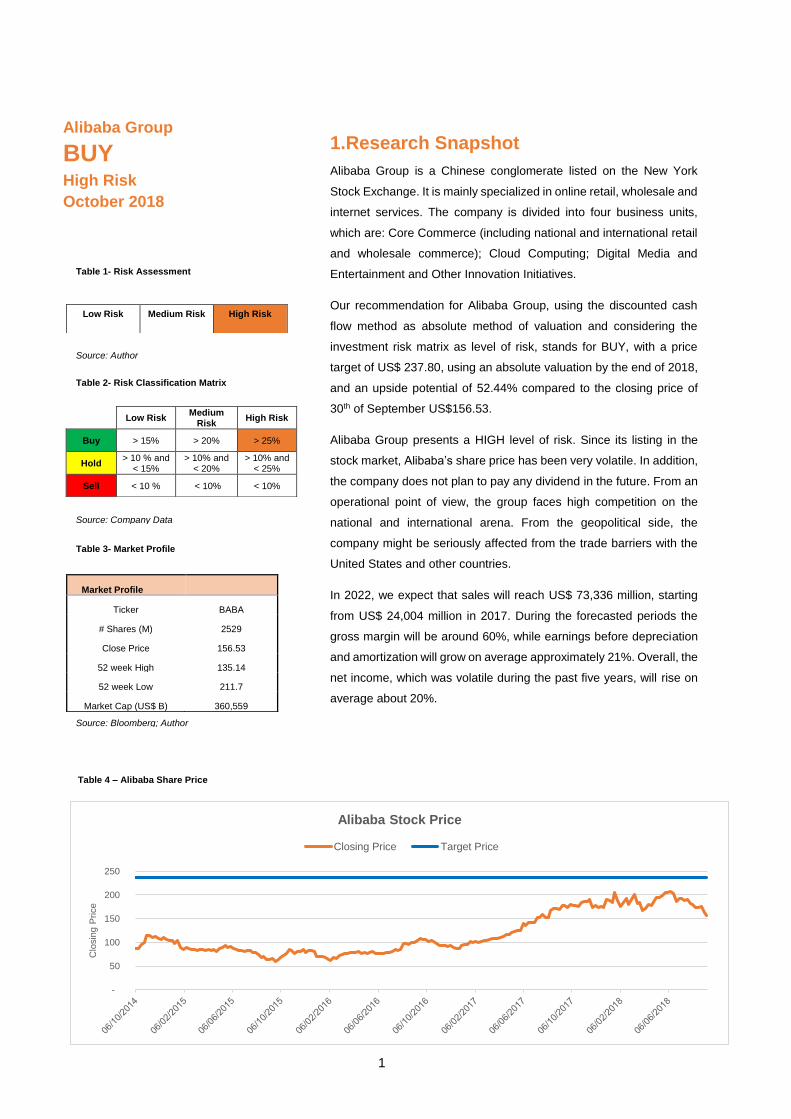
1.Research Snapshot
Alibaba Group is a Chinese conglomerate listed on the New York
Stock Exchange. It is mainly specialized in online retail, wholesale and
internet services. The company is divided into four business units,
which are: Core Commerce (including national and international retail
and wholesale commerce); Cloud Computing; Digital Media and
Entertainment and Other Innovation Initiatives.
Our recommendation for Alibaba Group, using the discounted cash
flow method as absolute method of valuation and considering the
investment risk matrix as level of risk, stands for BUY, with a price
target of US$ 237.80, using an absolute valuation by the end of 2018,
and an upside potential of 52.44% compared to the closing price of
30th of September US$156.53.
Alibaba Group presents a HIGH level of risk. Since its listing in the
stock market, Alibaba’s share price has been very volatile. In addition,
the company does not plan to pay any dividend in the future. From an
operational point of view, the group faces high competition on the
national and international arena. From the geopolitical side, the
company might be seriously affected from the trade barriers with the
United States and other countries.
In 2022, we expect that sales will reach US$ 73,336 million, starting
from US$ 24,004 million in 2017. During the forecasted periods the
gross margin will be around 60%, while earnings before depreciation
and amortization will grow on average approximately 21%. Overall, the
net income, which was volatile during the past five years, will rise on
average about 20%.
Low Risk Medium
Risk High Risk
Buy > 15% > 20% > 25%
Hold > 10 % and
< 15% > 10% and
< 20% > 10% and
< 25%
Sell < 10 % < 10% < 10%
Low Risk Medium Risk High Risk
Market Profile
Ticker BABA
# Shares (M) 2529
Close Price 156.53
52 week High 135.14
52 week Low 211.7
Market Cap (US$ B) 360,559
Table 1- Risk Assessment
Table 2- Risk Classification Matrix
Table 3- Market Profile
Table 4 – Alibaba Share Price
-
50
100
150
200
250
Clo
sin
g P
rice
Alibaba Stock Price
Closing Price Target Price
Source: Bloomberg; Author
Source: Company Data
Source: Author
Alibaba Group
BUY High Risk
October 2018

2
2.Business Description
Alibaba, founded in 1999 by Jack Ma is the largest retail platform in the world
in terms of Gross Merchandise Value (GMV), with a total of US$ 547 billion
and 454 million of active buyers in 2017 (Figure 1). It began as a B2B platform
with 1668.com, then, extend into B2C and C2C through Tmall and Taobao,
reaching the biggest US IPO in history in 2014. Nowadays, the group operates
as a middleman company, offering technology infrastructure, payment
platform, logistics and marketing tools, to connect and facilitate transactions
among merchants and customers all over the world. Despite its presence in
more than 200 countries, the Chinese market accounts for more than 80% of
total revenue. The new business areas such as Cloud Computing, Digital
Media and Entertainment and other Innovative Initiatives increased during the
last years, represented 15% of the revenue by the end of 2017 (Figure 2).
Key Leading Platforms
Alibaba.com
It is the first platform launched by the group, becoming in 2014 the world
largest B2B trading platform for SME (small medium enterprises). The
principal role is to link Chinese manufacturers, distributors and small
businesses with more than 240 countries.
1668.com
It is the second platform launched by the company, with the aim to connect
Chinese wholesalers within the nation.
Taobao.com
It is the biggest C2C e-commerce and the 8th most visited website in the
world, counting 617 monthly active users. It is the first C2C marketplace
launched by the company, allowing small businesses and individual
entrepreneurs to sell in the platform to Chinese speaking regions.
Alimama
It is an online advertising technology platform, providing a transparent system
to both web publishers and advertisers.
Tmall
It is a B2C online platform for local Chinese and international businesses to
sell premium products to Chinese consumers.
Figure 1 - GMV and Revenue Growth
in US$ Billion
171
272
398
463
547
GMV Revenue
Source: Company Data; Author
Figure 2 - Revenue Generated by
Category Provided
China Commer
ce76%
International Commerce
9%
Cloud Computing4%
Digital Media 9% Innovation
Initiatives2%
Source: Company Data; Author
3
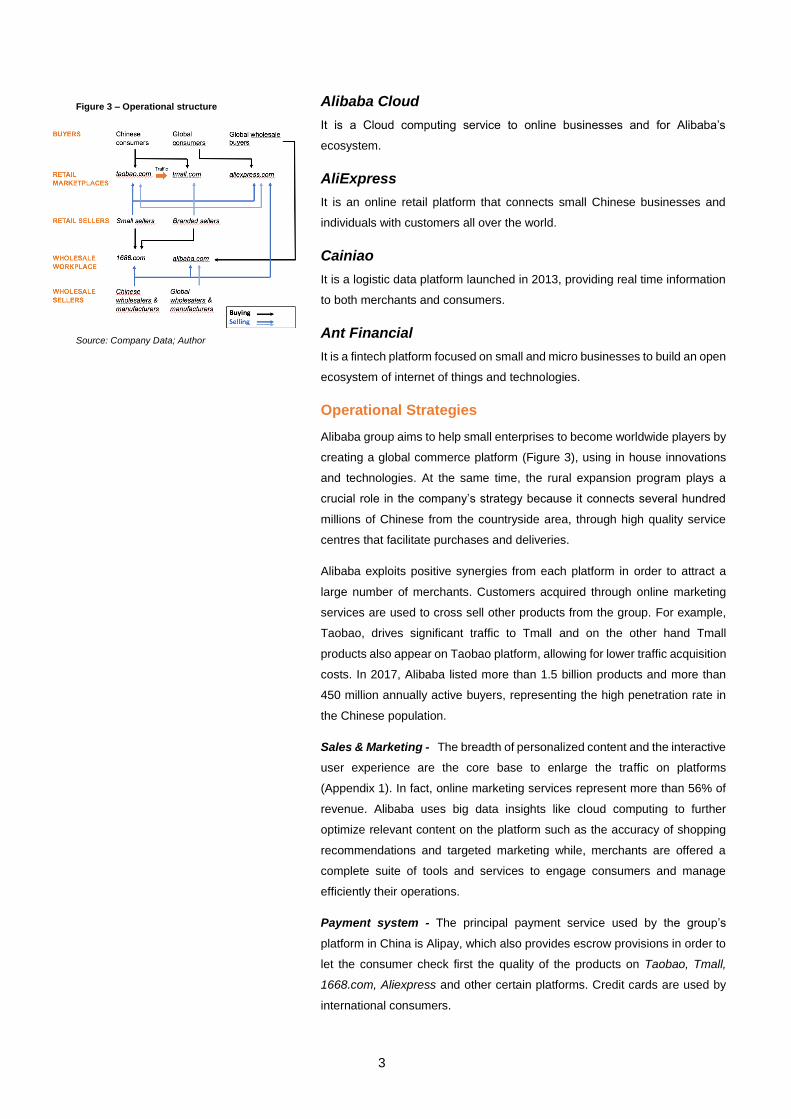
Alibaba Cloud
It is a Cloud computing service to online businesses and for Alibaba’s
ecosystem.
AliExpress
It is an online retail platform that connects small Chinese businesses and
individuals with customers all over the world.
Cainiao
It is a logistic data platform launched in 2013, providing real time information
to both merchants and consumers.
Ant Financial
It is a fintech platform focused on small and micro businesses to build an open
ecosystem of internet of things and technologies.
Operational Strategies
Alibaba group aims to help small enterprises to become worldwide players by
creating a global commerce platform (Figure 3), using in house innovations
and technologies. At the same time, the rural expansion program plays a
crucial role in the company’s strategy because it connects several hundred
millions of Chinese from the countryside area, through high quality service
centres that facilitate purchases and deliveries.
Alibaba exploits positive synergies from each platform in order to attract a
large number of merchants. Customers acquired through online marketing
services are used to cross sell other products from the group. For example,
Taobao, drives significant traffic to Tmall and on the other hand Tmall
products also appear on Taobao platform, allowing for lower traffic acquisition
costs. In 2017, Alibaba listed more than 1.5 billion products and more than
450 million annually active buyers, representing the high penetration rate in
the Chinese population.
Sales & Marketing - The breadth of personalized content and the interactive
user experience are the core base to enlarge the traffic on platforms
(Appendix 1). In fact, online marketing services represent more than 56% of
revenue. Alibaba uses big data insights like cloud computing to further
optimize relevant content on the platform such as the accuracy of shopping
recommendations and targeted marketing while, merchants are offered a
complete suite of tools and services to engage consumers and manage
efficiently their operations.
Payment system - The principal payment service used by the group’s
platform in China is Alipay, which also provides escrow provisions in order to
let the consumer check first the quality of the products on Taobao, Tmall,
1668.com, Aliexpress and other certain platforms. Credit cards are used by
international consumers.
Figure 3 – Operational structure
Source: Company Data; Author
4
Logistics - The logistics data platform, links consumers, vendors and
logistics service providers by improving the overall efficiency across the
logistics value chain. By the end of 2017 FY, Cainaio counted with 15 strategic
express courier partners, of those some are specialized on services for large
appliances and consumer electronics such as Haier Electronics and Suning.
Meanwhile, it employed more than 1.8 million delivery personnel in more than
600 cities and operated more than 180,000 hubs and sorting stations,
delivering 16.6 billion packages.
3.Management and Corporate Governance
The number of ordinary shares outstanding at 9/06/2017 were 2,529,364,189.
The free float accounted for 35.70%. The main institutional investors are
SoftBank and Yahoo, with stakes equal to 29.2% and 15%, respectively. The
directors and top executive own 10.6% of the total shares and Jack Ma and
Joseph Tsai hold 7% and 2.5% of ordinary shares outstanding, respectively.
The Partnership Model
The governance structure (Appendix 3) follows a particular “dual class
ownership structure”, where the partnership approach aims to embody the
vision of a large group of management partners. The Alibaba Committee is
an upper administrative body composed by: Jack Ma, Joe Tsai, Lucy Peng,
Daniel Zhang and Eric Jing, that nominates the partners and the member of
the committee itself. The committee serves a three years term and can serve
multiple terms. The committee members have the rights to nominate the
members itself, while also the partners can vote to remove the committees if
fail to promote their mission. Overall, the five members have high decisional
power over the company decisions.
The “Alibaba Partnership”, officially constructed in 2010, is made of 36
partners plus the committee members. All partners are entitled to one voting
right. The partnership is entitled to vote 11 directors, whose 4 are Alibaba
Partnership members.
Since Alibaba is a foreign company listed on the NYSE, it has the exemption
to not to have a majority of independent board members when it comes to
vote. Consequently, shareholders may not have the same benefits under the
NYSE regulation as other listed national companies.
Board of Directors - (Appendix 4) is composed by the three different groups,
with 11 members in total. SoftBank nominates one member. Directors are
elected for three-year term and may serve multiple terms. The Board of
Directors oversees the management of the business and affairs of the
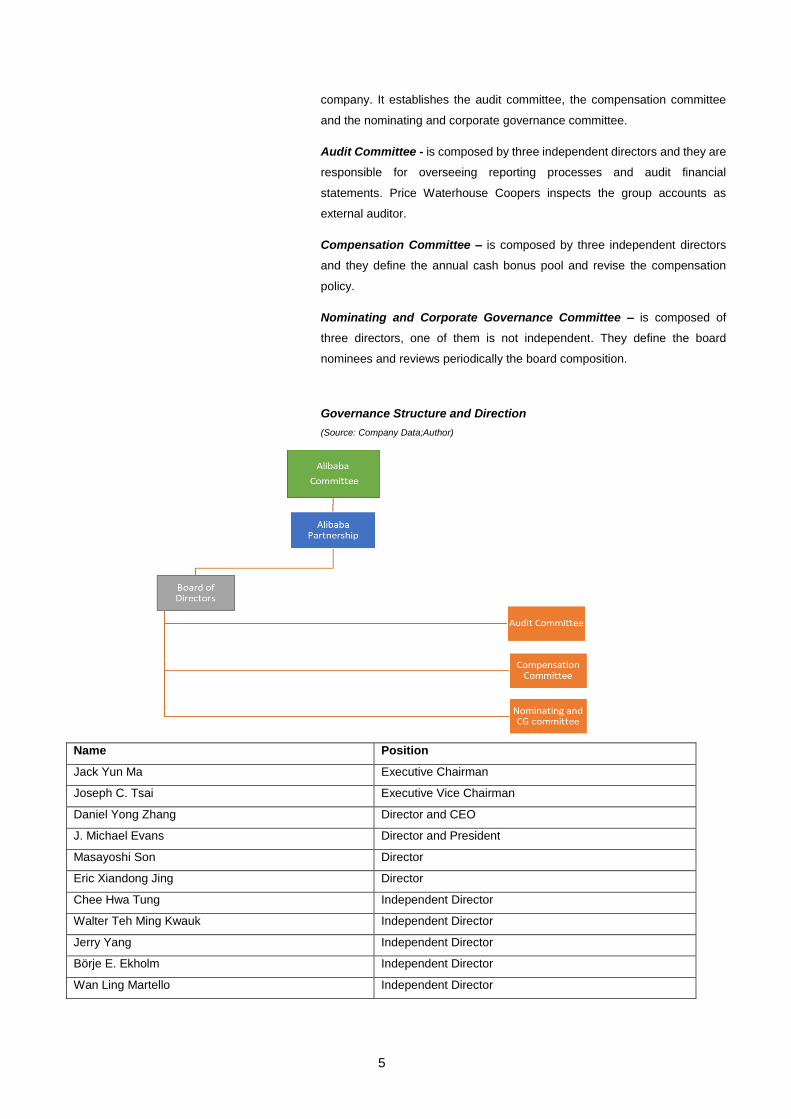
5
company. It establishes the audit committee, the compensation committee
and the nominating and corporate governance committee.
Audit Committee - is composed by three independent directors and they are
responsible for overseeing reporting processes and audit financial
statements. Price Waterhouse Coopers inspects the group accounts as
external auditor.
Compensation Committee – is composed by three independent directors
and they define the annual cash bonus pool and revise the compensation
policy.
Nominating and Corporate Governance Committee – is composed of
three directors, one of them is not independent. They define the board
nominees and reviews periodically the board composition.
Governance Structure and Direction
(Source: Company Data;Author)
Name Position
Jack Yun Ma Executive Chairman
Joseph C. Tsai Executive Vice Chairman
Daniel Yong Zhang Director and CEO
J. Michael Evans Director and President
Masayoshi Son Director
Eric Xiandong Jing Director
Chee Hwa Tung Independent Director
Walter Teh Ming Kwauk Independent Director
Jerry Yang Independent Director
Börje E. Ekholm Independent Director
Wan Ling Martello Independent Director
6
4.Industry Overview and Competitive
Positioning
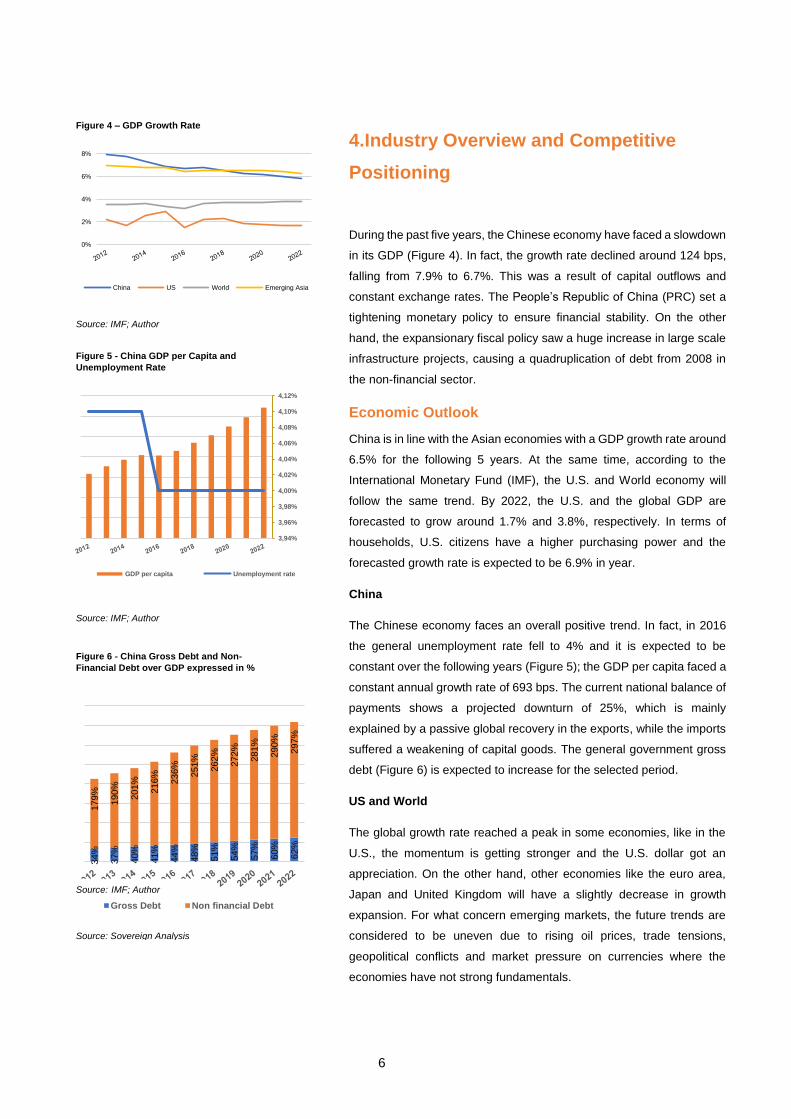
During the past five years, the Chinese economy have faced a slowdown
in its GDP (Figure 4). In fact, the growth rate declined around 124 bps,
falling from 7.9% to 6.7%. This was a result of capital outflows and
constant exchange rates. The People’s Republic of China (PRC) set a
tightening monetary policy to ensure financial stability. On the other
hand, the expansionary fiscal policy saw a huge increase in large scale
infrastructure projects, causing a quadruplication of debt from 2008 in
the non-financial sector.
Economic Outlook
China is in line with the Asian economies with a GDP growth rate around
6.5% for the following 5 years. At the same time, according to the
International Monetary Fund (IMF), the U.S. and World economy will
follow the same trend. By 2022, the U.S. and the global GDP are
forecasted to grow around 1.7% and 3.8%, respectively. In terms of
households, U.S. citizens have a higher purchasing power and the
forecasted growth rate is expected to be 6.9% in year.
China
The Chinese economy faces an overall positive trend. In fact, in 2016
the general unemployment rate fell to 4% and it is expected to be
constant over the following years (Figure 5); the GDP per capita faced a
constant annual growth rate of 693 bps. The current national balance of
payments shows a projected downturn of 25%, which is mainly
explained by a passive global recovery in the exports, while the imports
suffered a weakening of capital goods. The general government gross
debt (Figure 6) is expected to increase for the selected period.
US and World
The global growth rate reached a peak in some economies, like in the
U.S., the momentum is getting stronger and the U.S. dollar got an
appreciation. On the other hand, other economies like the euro area,
Japan and United Kingdom will have a slightly decrease in growth
expansion. For what concern emerging markets, the future trends are
considered to be uneven due to rising oil prices, trade tensions,
geopolitical conflicts and market pressure on currencies where the
economies have not strong fundamentals.
0%
2%
4%
6%
8%
China US World Emerging Asia
Source: Sovereign Analysis
Source: IMF; Author
Figure 6 - China Gross Debt and Non-
Financial Debt over GDP expressed in %
34%
37%
40%
41%
44%
48%
51%
54%
57%
60%
62%
179%
190%
201%
216%
236%
251%
262%
272%
281%
290%
297%
Gross Debt Non financial Debt
Figure 4 – GDP Growth Rate
Figure 5 - China GDP per Capita and
Unemployment Rate
3,94%
3,96%
3,98%
4,00%
4,02%
4,04%
4,06%
4,08%
4,10%
4,12%
GDP per capita Unemployment rate
Source: IMF; Author
Source: IMF; Author
7
In the U.S., the unemployment rate fell to the minimum, creating
additional inflationary pressures, while the current account increased
during the past years, like the excess global imbalances. The U.S.
economy shows higher level of debt compared but it seems to be
constant over the years, with a CAGR of 2.23%.
The Euro area growth forecast is expected to slow down to 1.9% in
2019, with a downside revision for Germany, France and Italy. The
growth forecast for emerging and developing Europe is expected to
increase around 3.6% in 2019, considering tightening financial
conditions for some countries like Turkey, with a huge external deficit.
The growth rate for the Latin America region is projected to be around
2.6% in 2019, mainly driven by commodity prices, while on the other side
some countries will apply tighter financial conditions.
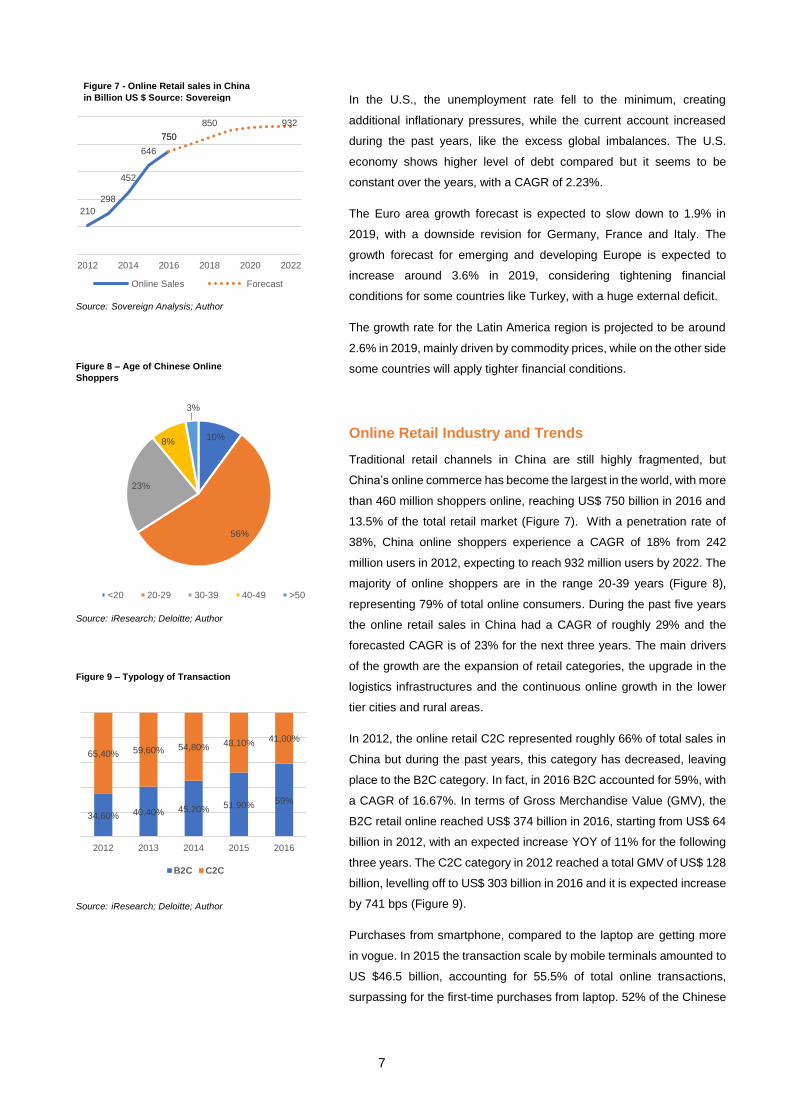
Online Retail Industry and Trends
Traditional retail channels in China are still highly fragmented, but
China’s online commerce has become the largest in the world, with more
than 460 million shoppers online, reaching US$ 750 billion in 2016 and
13.5% of the total retail market (Figure 7). With a penetration rate of
38%, China online shoppers experience a CAGR of 18% from 242
million users in 2012, expecting to reach 932 million users by 2022. The
majority of online shoppers are in the range 20-39 years (Figure 8),
representing 79% of total online consumers. During the past five years
the online retail sales in China had a CAGR of roughly 29% and the
forecasted CAGR is of 23% for the next three years. The main drivers
of the growth are the expansion of retail categories, the upgrade in the
logistics infrastructures and the continuous online growth in the lower
tier cities and rural areas.
In 2012, the online retail C2C represented roughly 66% of total sales in
China but during the past years, this category has decreased, leaving
place to the B2C category. In fact, in 2016 B2C accounted for 59%, with
a CAGR of 16.67%. In terms of Gross Merchandise Value (GMV), the
B2C retail online reached US$ 374 billion in 2016, starting from US$ 64
billion in 2012, with an expected increase YOY of 11% for the following
three years. The C2C category in 2012 reached a total GMV of US$ 128
billion, levelling off to US$ 303 billion in 2016 and it is expected increase
by 741 bps (Figure 9).
Purchases from smartphone, compared to the laptop are getting more
in vogue. In 2015 the transaction scale by mobile terminals amounted to
US $46.5 billion, accounting for 55.5% of total online transactions,
surpassing for the first-time purchases from laptop. 52% of the Chinese
Figure 7 - Online Retail sales in China
in Billion US $ Source: Sovereign
Analysis
210
298
452
646
750750
850 932
2012 2014 2016 2018 2020 2022
Online Sales Forecast
Figure 8 – Age of Chinese Online
Shoppers
Source: iResearch; Deloitte; Author
Source: Sovereign Analysis; Author
Source: Sovereign Analysis; Author
10%
56%
23%
8%
3%
<20 20-29 30-39 40-49 >50
34,60% 40,40% 45,20% 51,90%59%
65,40% 59,60% 54,80% 48,10%41,00%
2012 2013 2014 2015 2016
B2C C2C
Figure 9 – Typology of Transaction
Source: iResearch; Deloitte; Author

8
shop on a daily or weekly basis from their smartphone, compared to 14%
of the consumers globally.
In terms of categories, apparels, electronic appliances and fast-moving
consumer goods (FMCG) represent 25%, 18% and 13% of total Chinese
online GMV, respectively (Figure 10). Apparel and shoes have the
highest penetration rate among all categories. In 2016, it accounted for
31% and it is expected to grow 180 bps by 2020. In contrast, electronic
appliances by the end of 2020 will reach an online penetration of 55%.
Considering the provinces, Guangdong, Beijing, Zhejiang and
Shanghai, represent more than 72% of the total online market.
The online commerce in China is characterised by marketplaces where
products and services are provided on a single platform by several third
parties and processed by the marketplace operator. In China, the main
marketplaces for the B2C categories are JD and Tmall with a market
share of 25% and 57%, respectively in 2016, while for the C2C
categories, Taobao and Paipai (Tencent Holding) account for almost
total market share.
Merger and acquisition activities in China’s retail industry experienced
an exponential growth in 2012 and 2015. In 2011, the total transactions
increased to US$ 10.3 billion, due to Alibaba’s acquisition of Yahoo, for
US$ 7.1 billion, while in 2015 the total transactions reached US $15.6
billion and for the first-time Chinese e-commerce enterprises invested
abroad, representing 6.91% of total transactions. This phenomenon is
explicated by the national strategy “Belt and Road”, aiming to support
infrastructure construction and favourable policies for international
online shopping.
The household consumption in China showed that mass middle class in
2012 represented more than the half of total consumers, spending a total
amount of US $1.6 billion, while wealthy and indigent accounted for 11%
and 16%, respectively. The upper middle class will experience the
highest CAGR of 22.3% and a total volume of US $2.4 billion in 2022
(Figure 11). Geographically, the middle class will move from the coast
to the inner part of the country. In fact, by 2020 coastal population will
decrease from 87% to 61% and Tier 1 cities will lose their appeal in
favour of Tier 3 and Tier 4 cities, thanks to several infrastructure
developments. This will have a positive effect on online retailing.
From 2000 to 2010, urban Chinese individuals changed their shopping
habits. Discretionary spending experienced a substantial positive
increase, with a YOY growth rate of 4.7%, while semi-necessities
reached a total value of US $570 billion and essential goods slightly
grew. By 2020 the annual household consumption should rise to US
Figure 10 - Online growth in US$ billion in
terms of category purchased
188
135
98
251
177
132
Apparel Electronics FMCG
2016 2020
Wealthy ; 10%
Wealthy ; 25%
Upper Middle;
20%
Upper Middle;
56%
Mass Middle;
54%
Mass Middle;
14%
Indigent; 16%
Indigent; 5%
2012 2022
Figure 11 – Urban Private Consumption
by class in percentage
Source: iResearch; Euromonitor; Author
Source: Sovereign Analysis; Author
9
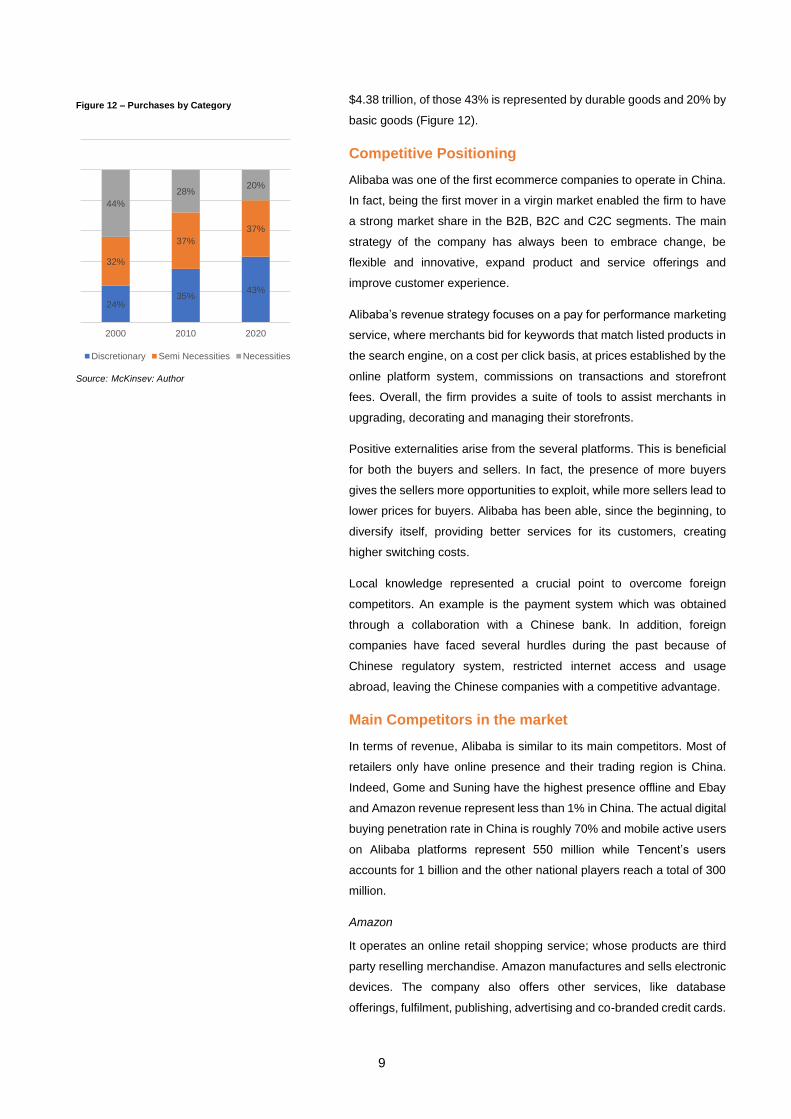
$4.38 trillion, of those 43% is represented by durable goods and 20% by
basic goods (Figure 12).
Competitive Positioning
Alibaba was one of the first ecommerce companies to operate in China.
In fact, being the first mover in a virgin market enabled the firm to have
a strong market share in the B2B, B2C and C2C segments. The main
strategy of the company has always been to embrace change, be
flexible and innovative, expand product and service offerings and
improve customer experience.
Alibaba’s revenue strategy focuses on a pay for performance marketing
service, where merchants bid for keywords that match listed products in
the search engine, on a cost per click basis, at prices established by the
online platform system, commissions on transactions and storefront
fees. Overall, the firm provides a suite of tools to assist merchants in
upgrading, decorating and managing their storefronts.
Positive externalities arise from the several platforms. This is beneficial
for both the buyers and sellers. In fact, the presence of more buyers
gives the sellers more opportunities to exploit, while more sellers lead to
lower prices for buyers. Alibaba has been able, since the beginning, to
diversify itself, providing better services for its customers, creating
higher switching costs.
Local knowledge represented a crucial point to overcome foreign
competitors. An example is the payment system which was obtained
through a collaboration with a Chinese bank. In addition, foreign
companies have faced several hurdles during the past because of
Chinese regulatory system, restricted internet access and usage
abroad, leaving the Chinese companies with a competitive advantage.
Main Competitors in the market
In terms of revenue, Alibaba is similar to its main competitors. Most of
retailers only have online presence and their trading region is China.
Indeed, Gome and Suning have the highest presence offline and Ebay
and Amazon revenue represent less than 1% in China. The actual digital
buying penetration rate in China is roughly 70% and mobile active users
on Alibaba platforms represent 550 million while Tencent’s users
accounts for 1 billion and the other national players reach a total of 300
million.
Amazon
It operates an online retail shopping service; whose products are third
party reselling merchandise. Amazon manufactures and sells electronic
devices. The company also offers other services, like database
offerings, fulfilment, publishing, advertising and co-branded credit cards.
24%35%
43%
32%
37%
37%
44%
28%20%
2000 2010 2020
Discretionary Semi Necessities Necessities
Source: McKinsey; Author
Figure 12 – Purchases by Category
10
EBay
The company operates marketplaces, StubHub and classified platforms,
connecting sellers and buyers from all over the world. The platforms are
accessible through online experience, mobile devices and application
programming interface.
Gome
It is one of the main electrical appliance retailers in China and Hong
Kong. The company offers household electrical appliances, mobile
phones and accessories, logistic services and business management
services.
JD.com
It is an online direct sales company in electronics and home appliance
products and general merchandise products sourced from
manufacturers, distributors and publishers in China.
Suning
It is a Chinese retail company, selling household appliances, digital
products and communication products. Suning is engaged in the sales
of communication products, small household appliances, digital and
information technology service products.
Tencent
It is a Chinese company mainly involved in the provision of value-added
services, through online games, community value added services and
application across various platforms, while the online advertising
services segment offer display based and performance-based
advertisements.
Vipshop
It is an online discount retailer for brands in China. The company offers
branded products to consumers in China through flash sales mainly on
its website. The flash sales model offers limited quantities of discounted
branded products in line for limited periods of time.
11
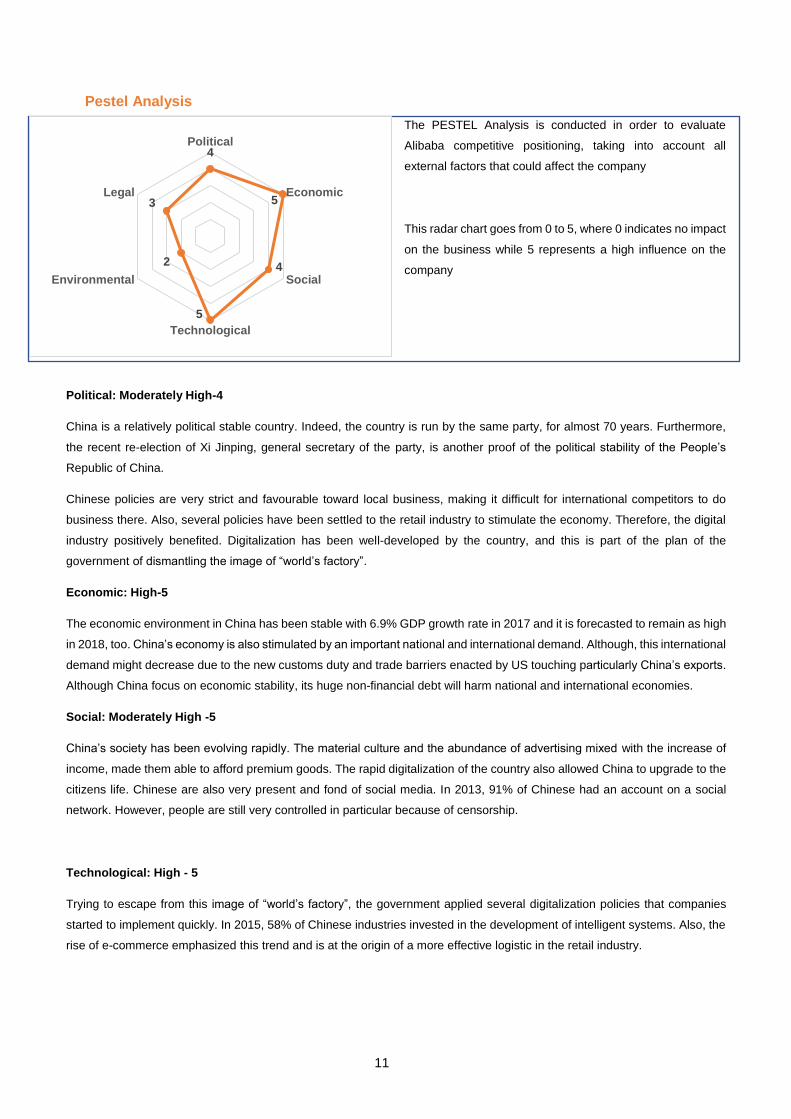
Pestel Analysis
The PESTEL Analysis is conducted in order to evaluate
Alibaba competitive positioning, taking into account all
external factors that could affect the company
This radar chart goes from 0 to 5, where 0 indicates no impact
on the business while 5 represents a high influence on the
company
Political: Moderately High-4
China is a relatively political stable country. Indeed, the country is run by the same party, for almost 70 years. Furthermore,
the recent re-election of Xi Jinping, general secretary of the party, is another proof of the political stability of the People’s
Republic of China.
Chinese policies are very strict and favourable toward local business, making it difficult for international competitors to do
business there. Also, several policies have been settled to the retail industry to stimulate the economy. Therefore, the digital
industry positively benefited. Digitalization has been well-developed by the country, and this is part of the plan of the
government of dismantling the image of “world’s factory”.
Economic: High-5
The economic environment in China has been stable with 6.9% GDP growth rate in 2017 and it is forecasted to remain as high
in 2018, too. China’s economy is also stimulated by an important national and international demand. Although, this international
demand might decrease due to the new customs duty and trade barriers enacted by US touching particularly China’s exports.
Although China focus on economic stability, its huge non-financial debt will harm national and international economies.
Social: Moderately High -5
China’s society has been evolving rapidly. The material culture and the abundance of advertising mixed with the increase of
income, made them able to afford premium goods. The rapid digitalization of the country also allowed China to upgrade to the
citizens life. Chinese are also very present and fond of social media. In 2013, 91% of Chinese had an account on a social
network. However, people are still very controlled in particular because of censorship.
Technological: High - 5
Trying to escape from this image of “world’s factory”, the government applied several digitalization policies that companies
started to implement quickly. In 2015, 58% of Chinese industries invested in the development of intelligent systems. Also, the
rise of e-commerce emphasized this trend and is at the origin of a more effective logistic in the retail industry.
4
5
4
5
2
3
Political
Economic
Social
Technological
Environmental
Legal

12
Environmental: Low - 2
Even though China is trying to make environmental efforts, this is still causing a lot of ecological issues. The efforts have been
not enough, such as tax on pollution, which is still making China one the most polluted country of the world.
Legal: Moderate - 3
Strict laws have been implemented in China to protect the consumers and especially the online transactions making the digital
retail industry very regulated. Also, China controls the data by stocking data in the country and allowing authorities to consult
them if necessary.
Porter’s Five Forces
The Porter Analysis is conducted in order to
evaluate Alibaba competitive positioning,
taking into account the main stakeholders
that could affect the company performance
This radar chart goes from 0 to 5, where 0
indicates no impact on the business while 5
represents a high influence on the company
Threats of New Entrants: Moderate – 3
Ecommerce industry is characterised by high returns and thus competition is quite fierce. Many firms are trying to enter the
market and imitate Alibaba’s business model. Since the company has a large loyal base among its customers, new entrants
find it very difficult to enter this market. Also, initial investments are quite high and market share is very limited. Despite these
issues, several companies have entered by applying differentiation strategies such as narrowing their segments.
Intensity of Rivalry Among Existing Competitors: Moderately High – 4
Alibaba and JD represent more than 80% of the market share while several other companies hold a very small slice of the
market. All of them compete on price, free takeaways, advertising wars and value-added services. Meanwhile many retailers
and brands are experimenting the Online to Offline (O2O) marketing, driving customers to the stores through online channels,
while others started to invest in omni channels capabilities improving operational efficiency, customer experience and
profitability.
Threats of Substitute: Moderately High – 4
Even if shopping in the stores is becoming a bit less popular, offline retailer still represents an alternative to online commerce.
In fact, online shopping lifestyle has entered only few years ago into Chinese habits.
Bargaining Power of Buyers: High – 5
3
4
45
3
Threats of NewEntrants
Intensity ofRivalry
Threats ofSubstitutes
Bagraining Powerof Buyers
bagraining Powerof Suppliers
13
Transaction and switching costs from a platform to another are relatively low. For this reason, buyers bargain for services and
quality and prices cuts keep the profitability of the industry in check. Chinese population is very large in volume reducing its
bargaining power. Nevertheless, overall the bargaining power of buyers is very high.
Bargaining power of suppliers: Moderate – 3
The abundance of suppliers and the ease of buyers of checking prices instantaneously, lower their power in terms of
negotiation and margins.
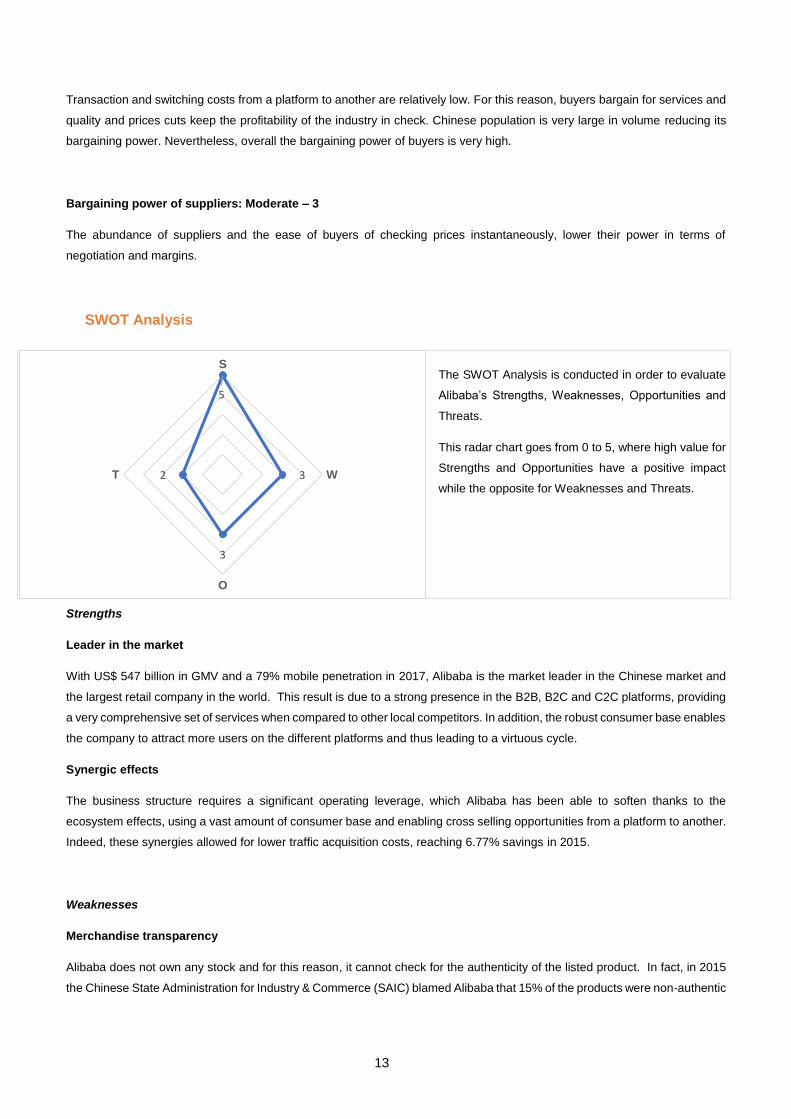
SWOT Analysis
The SWOT Analysis is conducted in order to evaluate
Alibaba’s Strengths, Weaknesses, Opportunities and
Threats.
This radar chart goes from 0 to 5, where high value for
Strengths and Opportunities have a positive impact
while the opposite for Weaknesses and Threats.
Strengths
Leader in the market
With US$ 547 billion in GMV and a 79% mobile penetration in 2017, Alibaba is the market leader in the Chinese market and
the largest retail company in the world. This result is due to a strong presence in the B2B, B2C and C2C platforms, providing
a very comprehensive set of services when compared to other local competitors. In addition, the robust consumer base enables
the company to attract more users on the different platforms and thus leading to a virtuous cycle.
Synergic effects
The business structure requires a significant operating leverage, which Alibaba has been able to soften thanks to the
ecosystem effects, using a vast amount of consumer base and enabling cross selling opportunities from a platform to another.
Indeed, these synergies allowed for lower traffic acquisition costs, reaching 6.77% savings in 2015.
Weaknesses
Merchandise transparency
Alibaba does not own any stock and for this reason, it cannot check for the authenticity of the listed product. In fact, in 2015
the Chinese State Administration for Industry & Commerce (SAIC) blamed Alibaba that 15% of the products were non-authentic
5
3
3
2
S
W
O
T
14
and on the same year, Kering indicted Alibaba for trademark infringing. At the same time, the company does not provide
enough information about vendors.
Governance Structure
The company was refused by the HKSE (Hong Kong Stock Exchange) because of the high concentration of power in Alibaba’s
Partnership. This partnership nominates the board of directors even if the number of shares they hold are less than the half.
Logistic issues
Even if Alibaba operates through Cainiao, a logistics data platform, linking their information system with those of logistics
service providers, it does not deliver any product and for this reason is not able to manage slow shipping times and
inefficiencies reaching final customers.
Opportunities
Global presence
Chinese market represents more than 80% of its total revenue, but Alibaba aims to serve the global market by acquiring new
foreign companies. At the time same, through “Rural Taobao Program”, it aims to reach around 600 million people which have
limited access to goods and services and help farmers to sell agricultural products to urban consumers.
Online to Offline (O2O)
The Chinese market is moving into an online to offline model, linking online purchases to physical stores, this trend is given
by the fact that more people are connected to internet through mobile phones than laptops. In fact, Alibaba and JD started to
invest respectively in Yiguo and Fruit Day to increase their brick-and -mortar presence.
Threats
Trade war
The $250bn tariffs imposed by the United States on finished consumer goods produced in China represents a barrier to
Chinese exports, and at the same time, the tariffs imposed by Chinese government over U.S. products give instability to the
geopolitical trading.
Government influence
Since the Communist Party plays a central role in the economy, Alibaba could be harmed by government regulations, such as
intensification of ecommerce rules and open boarders to foreign companies.
Logistics restrains
Chinese highway systems are not very extensive, and it is quite difficult to reach rural areas in a timely and inexpensive
manner. In addition, railway system is well developed for passengers while the access for freight is very limited. Outside large
cities, warehouse space is very restrained and less than 20% are fully equipped with computerized system.

15
5.Financial Analysis
Revenue and main costs
Alibaba’s sales come mainly from Chinese online retail commerce, in
fact it represents 72% of total business in 2017, while in 2015 and 2016
it was 78% and 79%. On the other hand, the cloud computing and digital
media and entertainment divisions had a sharp growth rate, 121% and
199% respectively. Indeed, digital media and entertainment accounted
13% of total revenue in 2017 and cloud computing division reached 4%
in the same year. For the coming years, we expect the same
composition of business lines, with online retail representing the main
revenue driver and the other keeping the same portion (Figure 14). Total
sales will continue to grow, but at a slower rate, as a result of the
forecasted slowdown in the Chinese economy. Operating costs, instead,
will have a significant impact in this period, indeed the investing program
planned by the company in Chinese businesses and other foreign
unicorns will impact on Alibaba’s profitability (Figure 15; Appendix 12) in
the short term, going from an average cost of goods sold of 31% in the
past years to 40% in the forecasted period. The main costs such as
product development, sales and marketing expenses, general and
administrative expenses will be constant in the future, keeping the same
percentage rate as in the previous four years
DuPont Analysis
The return on Equity over the past years suffered huge ups and downs,
in fact in 2014 it was around 53% while in 2017 and in 2022, it will be on
a 13% level. This is a result of a huge reduction in net profit margin,
going from 41% in 2014, to 27% in 2017 and 22% in 2022 mainly due to
the slowdown on revenue’s growth rate. The asset turnover ratio in 2022
will be on the same level as in 2014, around 47%, recovering from 31%
in 2017 due to revenue development and constant increase in total
assets. The equity multiplier suffered a steep decrease from 2.73 in
2104 to 1.56 in 2017, till 1.3 in 2022 because equity grew more than
doubled compared to 2017.
49%
39%
24%
64%
48%
20%
21%
19% 18%
0
10
20
30
40
50
60
70
2014 2016 2018 2020 2022
Total Revenue %Growth
Figure 14 – Revenue Forecast in US$
Billion
Figure 16 – Efficiency Indicators in Days
0
20
40
60
80
100
120
2014 2016 2018 2020 2022
Receivable Turnover Ratio
Account Payable Turnover
Source: Company Data; Author
Figure 15 – Profitability Indicators
10%
20%
30%
40%
50%
60%
70%
80%
2014 2016 2018 2020 2022
Gross Profit Margin Net Profit Margin
EBIT Margin EBITDA Margin
Source: Company Data; Author
Source: Company Data; Author

16
Liquidity & Efficiency
The company was very liquid during the past years (Figure 17). In fact,
the current and quick ratios were always above 1, proving to be solid for
short term obligations. Liquidity is driven by good working capital
management and good account receivable and payable days. Sales
outstanding is 5 days and payable outstanding is 23 days. In the coming
years, we expect Alibaba to start paying its vendors back on an average
of 18 days to be more attractive than the other competitors (Figure 16).
Consequently, liquidity performance will slightly worsen to an average
of 25% for cash over total assets. Alibaba’s average operating cycle over
the past years was -17 days, meaning that the cash conversion was
efficient, but if compared to the national competitors, they only did better
than Suning and JD.com. Tencent and Gome collected cash over -65
days.
Since 2014, Net debt was always negative but during the last years, it
increased considerably. Due to the fact that Alibaba is an internet
company, it has huge amount of cash and cash equivalents, while the
level of financial debt is represented mainly by unsecured senior notes
and bank borrowings. The later item experienced an increase in 2017.
Solvency
Alibaba has reduced its debt over total assets along the years from 29%
in 2014 to 18% in 2017 (Figure 18; Appendix 13). Its main competitors,
Tencent and Vipshop, had a similar capital structure, 25% and
20%, respectively in 2015, while Suning appeared to have a higher ratio,
mainly because it is an offline retailer. On the other hand, the financial
leverage was in line with Tencent’s, while JD.com and Suning showed
a lower gearing during the past periods
Looking at the Altman’s Z-score, credit strength indicators, Alibaba falls
into the middle interval of 2,14, meaning that the risk to fall into bankrupt
is low. Over the past four years, the company improved its profitability
level, reaching a ratio of 0,22 in 2016, however the EBIT/Total Asset
ratio decreased considerably.
6.Valuation
Absolute and relative valuation methods were used to estimate the
intrinsic value on a 5-year investment horizon.
DCF Model
We used a Discount Cash Flow model, with a Free Cash Flow to the
Firm (FCFF) method to generate the intrinsic value for Alibaba Group.
This procedure includes a 5-year projection of Income Statement,
Balance Sheet and Cashflow Statement (Appendix 6-11) and a Discount
Cash-Flow (DCF) analysis.
0,00
0,05
0,10
0,15
0,20
0,25
0,30
0,35
0,40
0,45
0,00
0,50
1,00
1,50
2,00
2,50
3,00
3,50
4,00
2014 2016 2018 2020 2022
Current Ratio Quick Ratio
Cash Ratio Cash / tot assets
Figure 18 – Solvency Indicators
29%
21%
16%18%
13%11%
10% 9% 8%
0%
5%
10%
15%
20%
25%
30%
35%
0,00
2,00
4,00
6,00
8,00
10,00
12,00
14,00
201420152016201720182019202020212022
Interest Coverage Ratio
Financial Leverage ratio
Debt to Total Assets
Figure 17 – Liquidity indicators
Source: Company Data; Author
Source: Company Data; Author
17
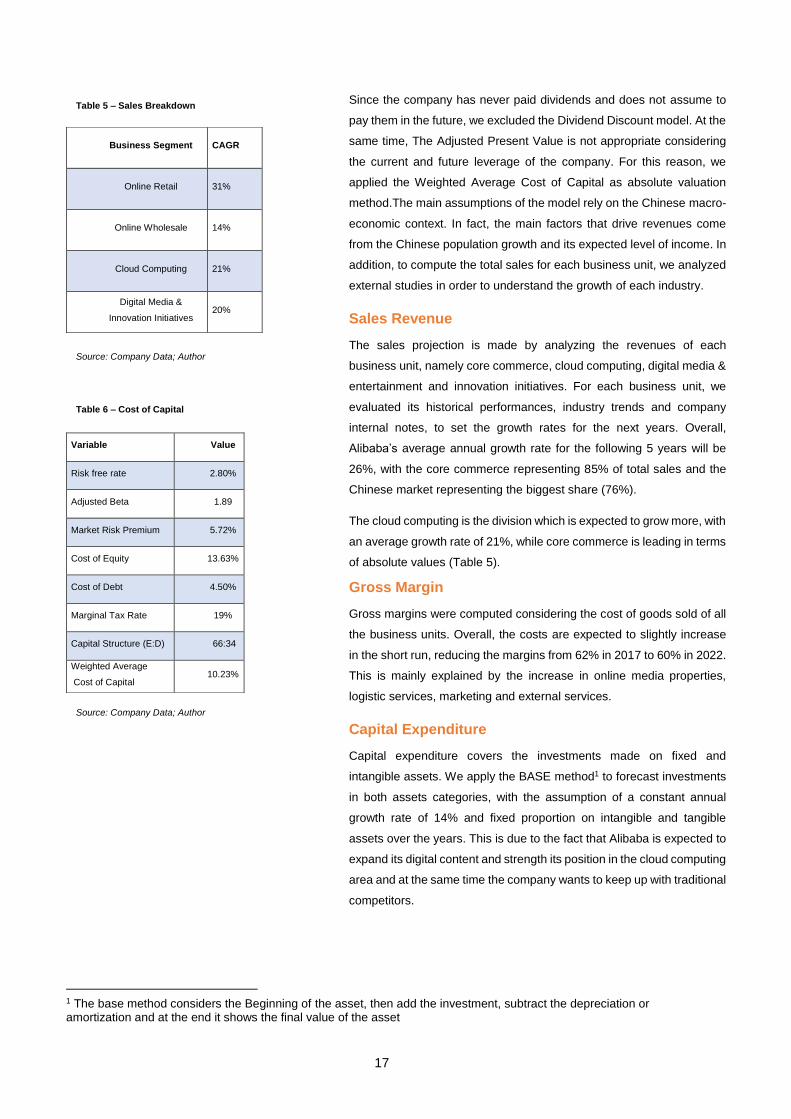
Since the company has never paid dividends and does not assume to
pay them in the future, we excluded the Dividend Discount model. At the
same time, The Adjusted Present Value is not appropriate considering
the current and future leverage of the company. For this reason, we
applied the Weighted Average Cost of Capital as absolute valuation
method.The main assumptions of the model rely on the Chinese macro-
economic context. In fact, the main factors that drive revenues come
from the Chinese population growth and its expected level of income. In
addition, to compute the total sales for each business unit, we analyzed
external studies in order to understand the growth of each industry.
Sales Revenue
The sales projection is made by analyzing the revenues of each
business unit, namely core commerce, cloud computing, digital media &
entertainment and innovation initiatives. For each business unit, we
evaluated its historical performances, industry trends and company
internal notes, to set the growth rates for the next years. Overall,
Alibaba’s average annual growth rate for the following 5 years will be
26%, with the core commerce representing 85% of total sales and the
Chinese market representing the biggest share (76%).
The cloud computing is the division which is expected to grow more, with
an average growth rate of 21%, while core commerce is leading in terms
of absolute values (Table 5).
Gross Margin
Gross margins were computed considering the cost of goods sold of all
the business units. Overall, the costs are expected to slightly increase
in the short run, reducing the margins from 62% in 2017 to 60% in 2022.
This is mainly explained by the increase in online media properties,
logistic services, marketing and external services.
Capital Expenditure
Capital expenditure covers the investments made on fixed and
intangible assets. We apply the BASE method1 to forecast investments
in both assets categories, with the assumption of a constant annual
growth rate of 14% and fixed proportion on intangible and tangible
assets over the years. This is due to the fact that Alibaba is expected to
expand its digital content and strength its position in the cloud computing
area and at the same time the company wants to keep up with traditional
competitors.
1 The base method considers the Beginning of the asset, then add the investment, subtract the depreciation or amortization and at the end it shows the final value of the asset
Business Segment CAGR
Online Retail 31%
Online Wholesale 14%
Cloud Computing 21%
Digital Media &
Innovation Initiatives 20%
Variable Value
Risk free rate 2.80%
Adjusted Beta 1.89
Market Risk Premium 5.72%
Cost of Equity 13.63%
Cost of Debt 4.50%
Marginal Tax Rate 19%
Capital Structure (E:D) 66:34
Weighted Average
Cost of Capital 10.23%
Table 5 – Sales Breakdown
Table 6 – Cost of Capital
Source: Company Data; Author
Source: Company Data; Author
18
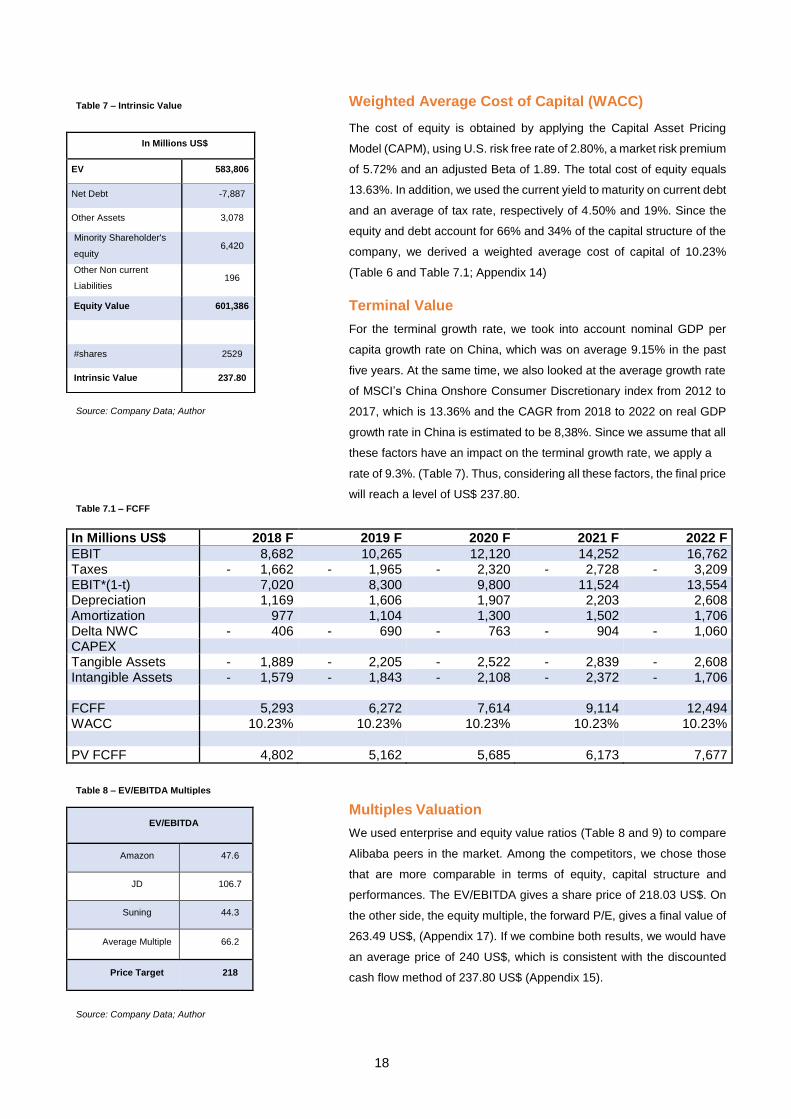
Weighted Average Cost of Capital (WACC)
The cost of equity is obtained by applying the Capital Asset Pricing
Model (CAPM), using U.S. risk free rate of 2.80%, a market risk premium
of 5.72% and an adjusted Beta of 1.89. The total cost of equity equals
13.63%. In addition, we used the current yield to maturity on current debt
and an average of tax rate, respectively of 4.50% and 19%. Since the
equity and debt account for 66% and 34% of the capital structure of the
company, we derived a weighted average cost of capital of 10.23%
(Table 6 and Table 7.1; Appendix 14)
Terminal Value
For the terminal growth rate, we took into account nominal GDP per
capita growth rate on China, which was on average 9.15% in the past
five years. At the same time, we also looked at the average growth rate
of MSCI’s China Onshore Consumer Discretionary index from 2012 to
2017, which is 13.36% and the CAGR from 2018 to 2022 on real GDP
growth rate in China is estimated to be 8,38%. Since we assume that all
these factors have an impact on the terminal growth rate, we apply a
rate of 9.3%. (Table 7). Thus, considering all these factors, the final price
will reach a level of US$ 237.80.
In Millions US$ 2018 F 2019 F 2020 F 2021 F 2022 F
EBIT 8,682 10,265 12,120 14,252 16,762 Taxes - 1,662 - 1,965 - 2,320 - 2,728 - 3,209 EBIT*(1-t) 7,020 8,300 9,800 11,524 13,554 Depreciation 1,169 1,606 1,907 2,203 2,608 Amortization 977 1,104 1,300 1,502 1,706 Delta NWC - 406 - 690 - 763 - 904 - 1,060 CAPEX Tangible Assets - 1,889 - 2,205 - 2,522 - 2,839 - 2,608 Intangible Assets - 1,579 - 1,843 - 2,108 - 2,372 - 1,706 FCFF 5,293 6,272 7,614 9,114 12,494 WACC 10.23% 10.23% 10.23% 10.23% 10.23% PV FCFF 4,802 5,162 5,685 6,173 7,677
Multiples Valuation
We used enterprise and equity value ratios (Table 8 and 9) to compare
Alibaba peers in the market. Among the competitors, we chose those
that are more comparable in terms of equity, capital structure and
performances. The EV/EBITDA gives a share price of 218.03 US$. On
the other side, the equity multiple, the forward P/E, gives a final value of
263.49 US$, (Appendix 17). If we combine both results, we would have
an average price of 240 US$, which is consistent with the discounted
cash flow method of 237.80 US$ (Appendix 15).
In Millions US$
EV 583,806
Net Debt -7,887
Other Assets 3,078
Minority Shareholder's
equity 6,420
Other Non current
Liabilities 196
Equity Value 601,386
#shares 2529
Intrinsic Value 237.80
EV/EBITDA
Amazon 47.6
JD 106.7
Suning 44.3
Average Multiple 66.2
Price Target 218
Table 7 – Intrinsic Value
Table 8 – EV/EBITDA Multiples
Source: Company Data; Author
Source: Company Data; Author
Table 7.1 – FCFF
19
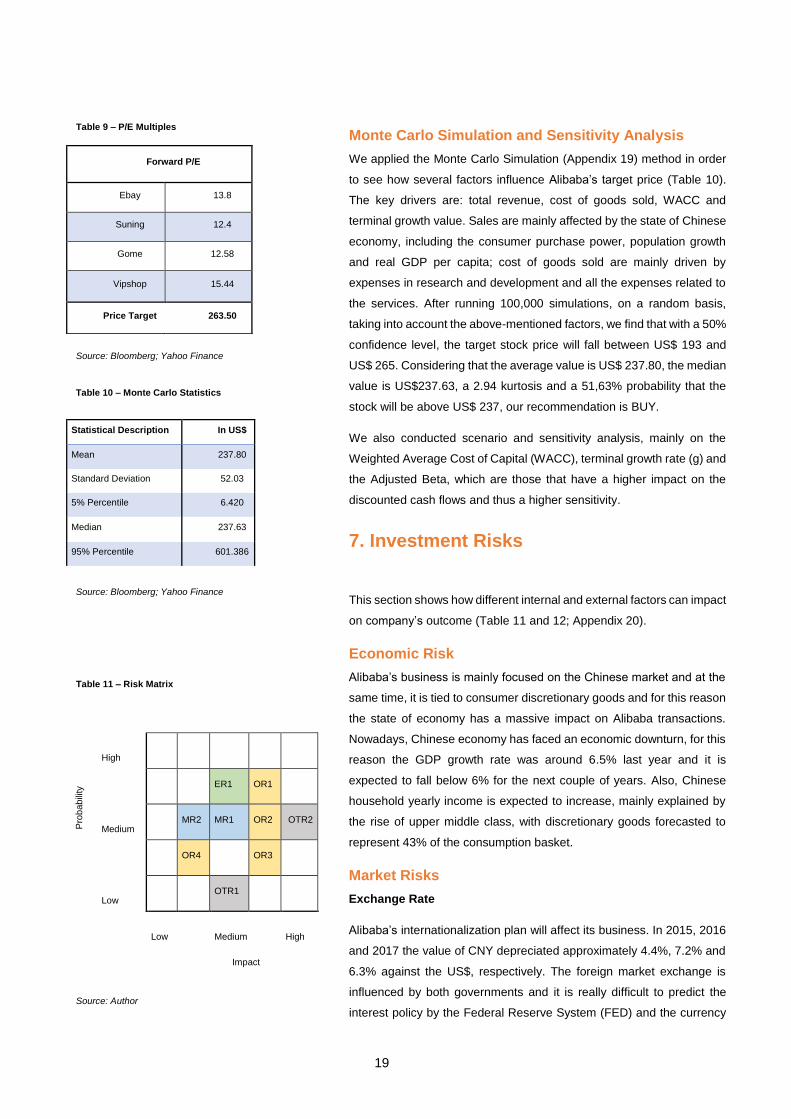
Monte Carlo Simulation and Sensitivity Analysis
We applied the Monte Carlo Simulation (Appendix 19) method in order
to see how several factors influence Alibaba’s target price (Table 10).
The key drivers are: total revenue, cost of goods sold, WACC and
terminal growth value. Sales are mainly affected by the state of Chinese
economy, including the consumer purchase power, population growth
and real GDP per capita; cost of goods sold are mainly driven by
expenses in research and development and all the expenses related to
the services. After running 100,000 simulations, on a random basis,
taking into account the above-mentioned factors, we find that with a 50%
confidence level, the target stock price will fall between US$ 193 and
US$ 265. Considering that the average value is US$ 237.80, the median
value is US$237.63, a 2.94 kurtosis and a 51,63% probability that the
stock will be above US$ 237, our recommendation is BUY.
We also conducted scenario and sensitivity analysis, mainly on the
Weighted Average Cost of Capital (WACC), terminal growth rate (g) and
the Adjusted Beta, which are those that have a higher impact on the
discounted cash flows and thus a higher sensitivity.
7. Investment Risks
This section shows how different internal and external factors can impact
on company’s outcome (Table 11 and 12; Appendix 20).
Economic Risk
Alibaba’s business is mainly focused on the Chinese market and at the
same time, it is tied to consumer discretionary goods and for this reason
the state of economy has a massive impact on Alibaba transactions.
Nowadays, Chinese economy has faced an economic downturn, for this
reason the GDP growth rate was around 6.5% last year and it is
expected to fall below 6% for the next couple of years. Also, Chinese
household yearly income is expected to increase, mainly explained by
the rise of upper middle class, with discretionary goods forecasted to
represent 43% of the consumption basket.
Market Risks
Exchange Rate
Alibaba’s internationalization plan will affect its business. In 2015, 2016
and 2017 the value of CNY depreciated approximately 4.4%, 7.2% and
6.3% against the US$, respectively. The foreign market exchange is
influenced by both governments and it is really difficult to predict the
interest policy by the Federal Reserve System (FED) and the currency
Forward P/E
Ebay 13.8
Suning 12.4
Gome 12.58
Vipshop 15.44
Price Target 263.50
Statistical Description In US$
Mean 237.80
Standard Deviation 52.03
5% Percentile 6.420
Median 237.63
95% Percentile 601.386
Pro
babili
ty
High
ER1 OR1
Medium MR2 MR1 OR2 OTR2
OR4 OR3
Low OTR1
Low Medium High
Impact
Table 10 – Monte Carlo Statistics
Table 9 – P/E Multiples
Table 11 – Risk Matrix
Source: Bloomberg; Yahoo Finance
Source: Bloomberg; Yahoo Finance
Source: Author
20
policy by the Chinese Communist party. A substantial percentage of
revenue, costs and financial assets are denominated in Renminbi, while
the majority of debt is held in US$. Thus, a fluctuation in the CNY has a
huge impact on liquidity and cash streams, and an appreciation of
US$/CNY would have a negative impact on financial results, that is also
the reason why Alibaba enters into hedging activities with regard to
exchange rates risks.
Interest Rate
The main exposure on interest rate risks is related to bank borrowings,
which are based on a spread over LIBOR. Over the total debt, around
30% carries floating interest rates, while the remaining part is made of
fixed interest rates.
Operational Risks
Growth Potential
During the recent years, Alibaba experienced an average revenue
growth rate of 45%. Sales growth mainly depends on the ability to grow
in the retail sector and at in the other business areas. These business
areas may not deliver outstanding results in the future due to
operational, technological and legal difficulties given by Alibaba
inexperience. At the same time, the company could face slowdown in
growth opportunities because of decreasing in consumer spending,
intense price wars and deceleration in online industries.
Technology infrastructure
Alibaba’s performance and reliability also depends on the technological
infrastructure, which is constantly updated. Meanwhile, during events
such as Singles day, the platform experienced unanticipated system
disruptions and slow time response. If these events continue to occur,
the functionality and effectiveness of the platform are seriously affected,
and this could result in a loss of customers and transactions.
Logistic Service Providers
All the merchants on Alibaba use third party logistic service providers,
which are connected with Caniao Network in terms of logistic data.
These services could be affected or interrupted by business disputes or
industry consolidation. Conversely, this could cause a delay in finding
an alternative in a reliable manner.
Regulatory Proceeding
Alibaba has been involved in high volume of litigation in China and a
small volume abroad, which were mainly related to intellectual property
infringement and consumer protection claims. Overall, this causes a loss
21
of reputation, while deter management’s attention, harming the whole
ecosystem.
Other Risks
Governance Model
The corporate governance model follows a dual class ownership, giving
a higher percentage of voting rights to the partners, while institutional
investors such as Softbank and Yahoo have limited voting rights. This
could represent excessive power over investment and operational
decisions, increasing risks in corporate governance.
International War trade
The recent barriers to trade imposed by the U.S. to China have a
significant impact on the national economy and indirectly impacted
Alibaba’s share price. This war can harm not only the relationship with
the US but also with other European countries, which represent a
possible target.
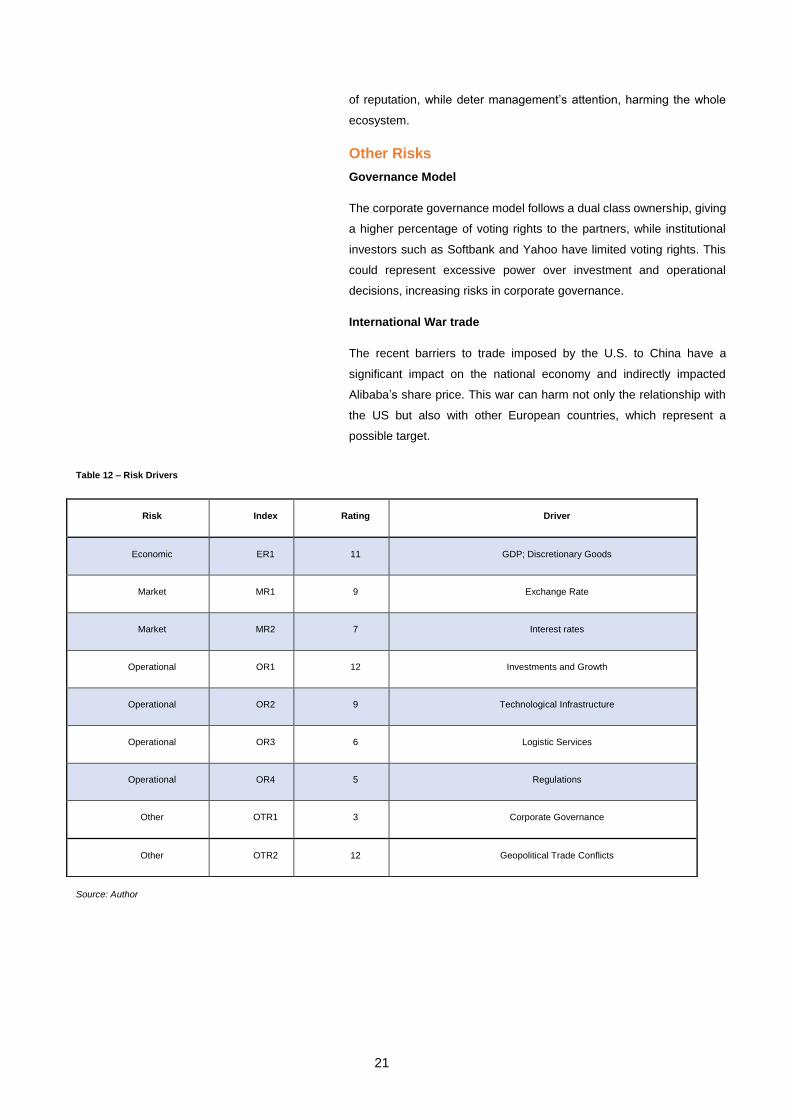
Risk Index Rating Driver
Economic ER1 11 GDP; Discretionary Goods
Market MR1 9 Exchange Rate
Market MR2 7 Interest rates
Operational OR1 12 Investments and Growth
Operational OR2 9 Technological Infrastructure
Operational OR3 6 Logistic Services
Operational OR4 5 Regulations
Other OTR1 3 Corporate Governance
Other OTR2 12 Geopolitical Trade Conflicts
Table 12 – Risk Drivers
Source: Author

22
Appendix 1- Main Business Units
Name Logo Description Launch
Alibaba.com
The first B2B platform launched by the company to connect
Chinese manufacturers, distributors and small
businesses to international wholesalers, trade agents and
manufacturers.
1999
1688.com
Online wholesale platform that allows Chinese merchants to
obtain products from domestic wholesalers.
1999
Taobao.com
C2C commerce-oriented marketplace, providing an
engaging and personalized experience, Consumers can
interact with other consumers and with merchants.
2003
Alimama
Marketing technology platform, that offers various marketing
services on websites and mobile apps.
2007
Tmall
B2C platform that offers branded products and premium shopping
experience for increasingly sophisticated Chinese
consumers, looking for high end national and international
products
2008
Alibaba Cloud
Cloud computing arm of the group. It provides a
comprehensive suite of cloud computing for online and mobile commerce ecosystem, including
marketplaces, start-ups, businesses and government
organizations.
2009
AliExpress
Global retail marketplace that allows consumers from all over the world to buy directly from
manufacturers and distributors in China
2010
Cainiao
Cainiao is a logistics data platform operator that provides
real time information to both merchants and consumers to
fulfil their transactions and improve delivery efficiency through data insights and
technology.
2013
Ant Financial
Financial services provider focused on serving small and
micro businesses and consumers, dedicated to build an open ecosystem of internet thinking and technologies. It
includes, Alipay, Ant Fortune, Zhima Credit and MYbank.
2014
23
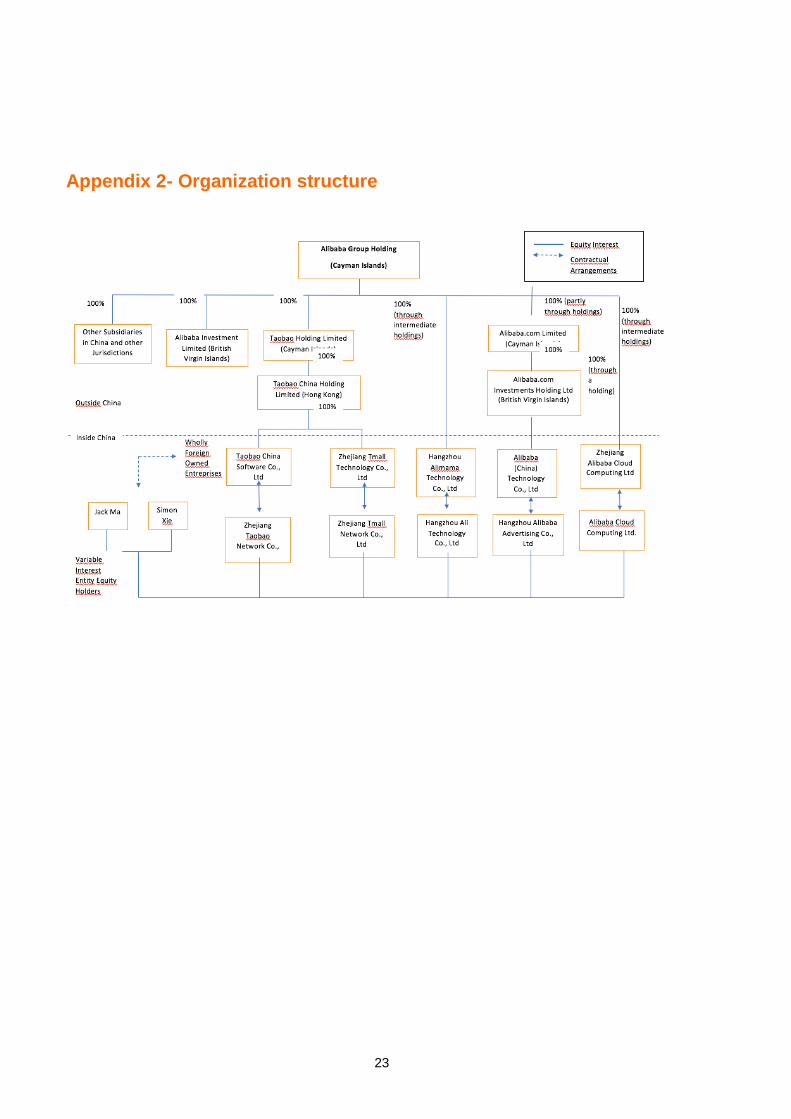
Appendix 2- Organization structure

24
Appendix 3 - Corporate Governance Structure
Alibaba
Committee
Alibaba Partnership
Board of Directors
Compensation Committee
Audit Committee
Nominating and CG committee
SoftBank
25
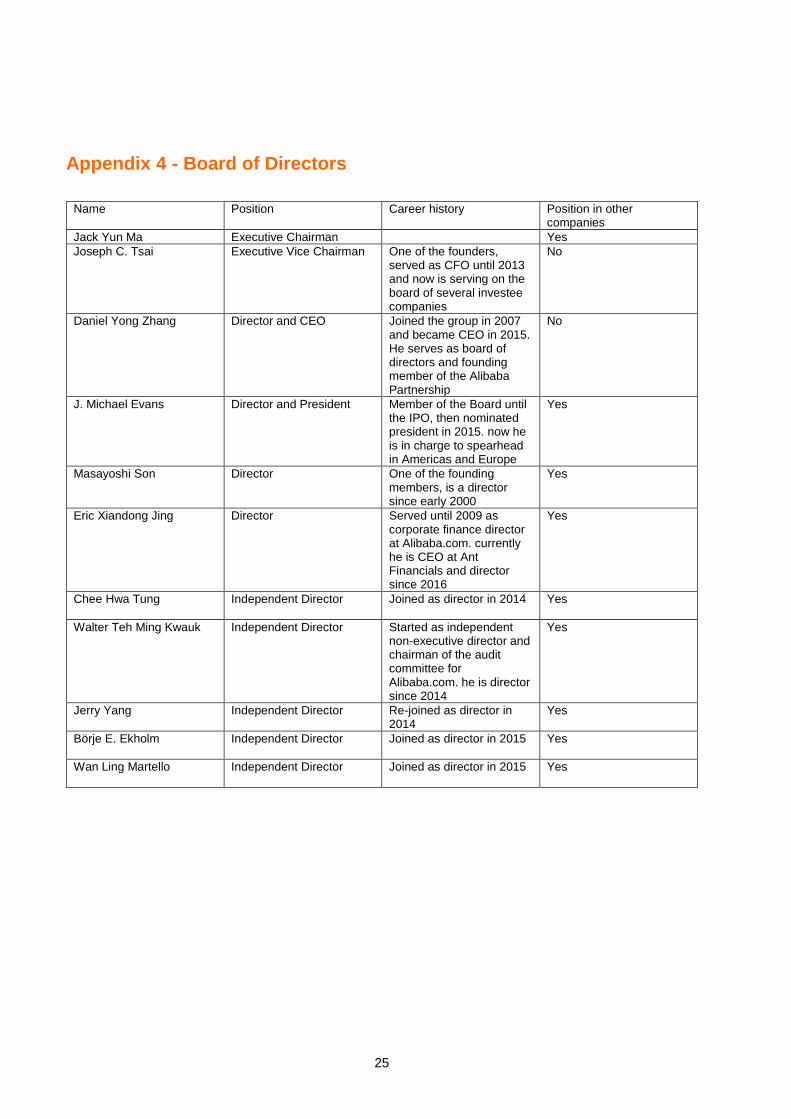
Appendix 4 - Board of Directors
Name Position Career history Position in other companies
Jack Yun Ma Executive Chairman Yes
Joseph C. Tsai Executive Vice Chairman One of the founders, served as CFO until 2013 and now is serving on the board of several investee companies
No
Daniel Yong Zhang Director and CEO Joined the group in 2007 and became CEO in 2015. He serves as board of directors and founding member of the Alibaba Partnership
No
J. Michael Evans Director and President Member of the Board until the IPO, then nominated president in 2015. now he is in charge to spearhead in Americas and Europe
Yes
Masayoshi Son Director One of the founding members, is a director since early 2000
Yes
Eric Xiandong Jing Director Served until 2009 as corporate finance director at Alibaba.com. currently he is CEO at Ant Financials and director since 2016
Yes
Chee Hwa Tung Independent Director Joined as director in 2014 Yes
Walter Teh Ming Kwauk Independent Director Started as independent non-executive director and chairman of the audit committee for Alibaba.com. he is director since 2014
Yes
Jerry Yang Independent Director Re-joined as director in 2014
Yes
Börje E. Ekholm Independent Director Joined as director in 2015 Yes
Wan Ling Martello Independent Director Joined as director in 2015 Yes
26
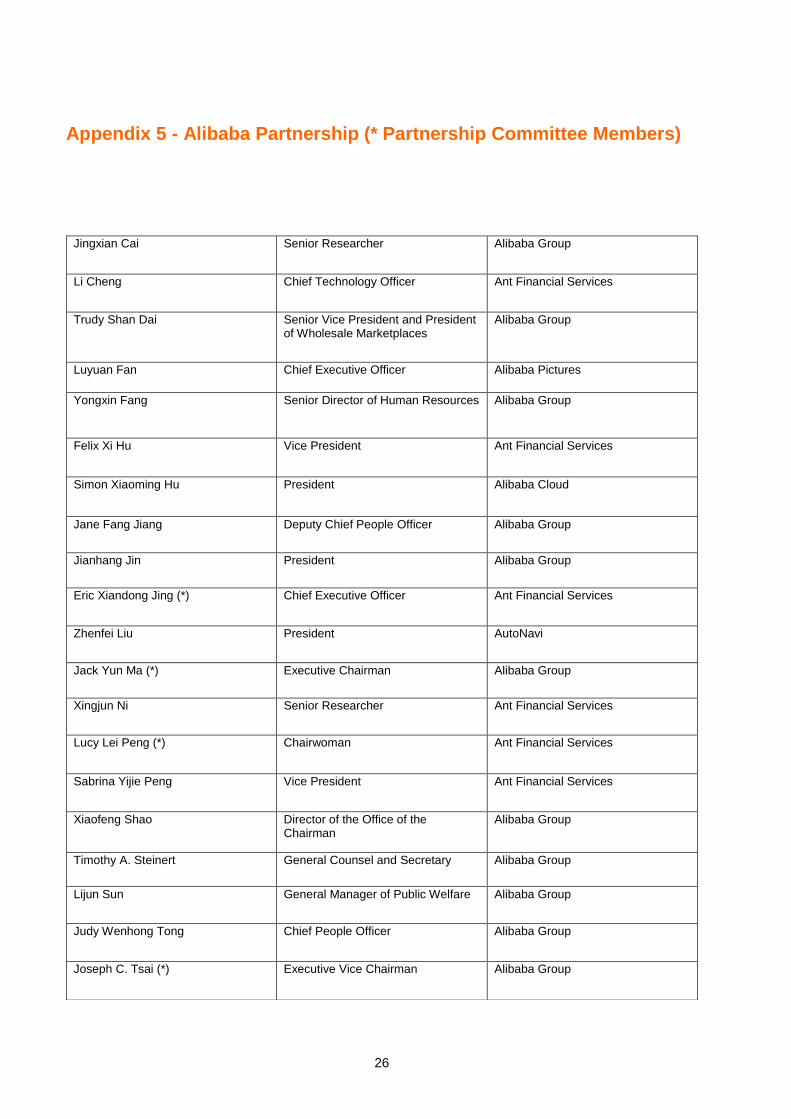
Appendix 5 - Alibaba Partnership (* Partnership Committee Members)
Jingxian Cai Senior Researcher Alibaba Group
Li Cheng Chief Technology Officer Ant Financial Services
Trudy Shan Dai Senior Vice President and President of Wholesale Marketplaces
Alibaba Group
Luyuan Fan Chief Executive Officer Alibaba Pictures
Yongxin Fang Senior Director of Human Resources Alibaba Group
Felix Xi Hu Vice President Ant Financial Services
Simon Xiaoming Hu President Alibaba Cloud
Jane Fang Jiang Deputy Chief People Officer Alibaba Group
Jianhang Jin President Alibaba Group
Eric Xiandong Jing (*) Chief Executive Officer Ant Financial Services
Zhenfei Liu President AutoNavi
Jack Yun Ma (*) Executive Chairman Alibaba Group
Xingjun Ni Senior Researcher Ant Financial Services
Lucy Lei Peng (*) Chairwoman Ant Financial Services
Sabrina Yijie Peng Vice President Ant Financial Services
Xiaofeng Shao Director of the Office of the Chairman
Alibaba Group
Timothy A. Steinert
General Counsel and Secretary Alibaba Group
Lijun Sun General Manager of Public Welfare Alibaba Group
Judy Wenhong Tong Chief People Officer Alibaba Group
Joseph C. Tsai (*) Executive Vice Chairman Alibaba Group
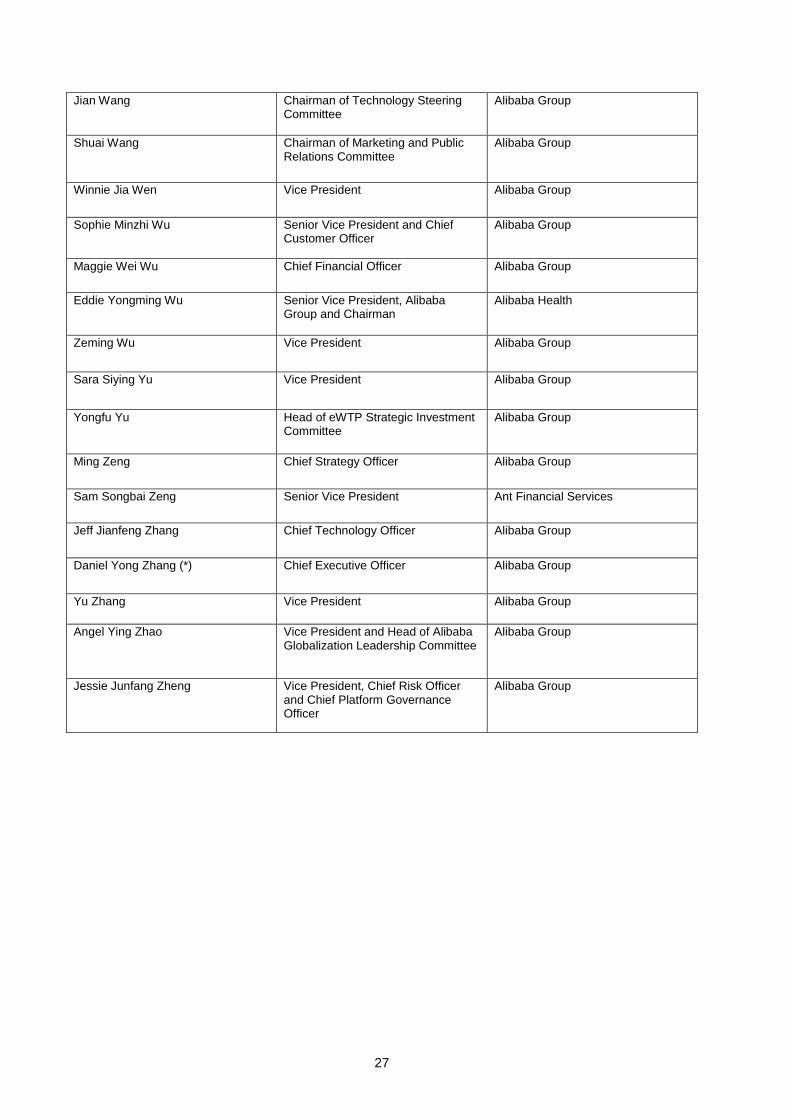
27
Jian Wang Chairman of Technology Steering Committee
Alibaba Group
Shuai Wang Chairman of Marketing and Public Relations Committee
Alibaba Group
Winnie Jia Wen Vice President Alibaba Group
Sophie Minzhi Wu Senior Vice President and Chief Customer Officer
Alibaba Group
Maggie Wei Wu Chief Financial Officer Alibaba Group
Eddie Yongming Wu Senior Vice President, Alibaba Group and Chairman
Alibaba Health
Zeming Wu Vice President Alibaba Group
Sara Siying Yu Vice President Alibaba Group
Yongfu Yu Head of eWTP Strategic Investment Committee
Alibaba Group
Ming Zeng Chief Strategy Officer Alibaba Group
Sam Songbai Zeng Senior Vice President Ant Financial Services
Jeff Jianfeng Zhang Chief Technology Officer Alibaba Group
Daniel Yong Zhang (*) Chief Executive Officer Alibaba Group
Yu Zhang Vice President Alibaba Group
Angel Ying Zhao Vice President and Head of Alibaba Globalization Leadership Committee
Alibaba Group
Jessie Junfang Zheng Vice President, Chief Risk Officer and Chief Platform Governance Officer
Alibaba Group
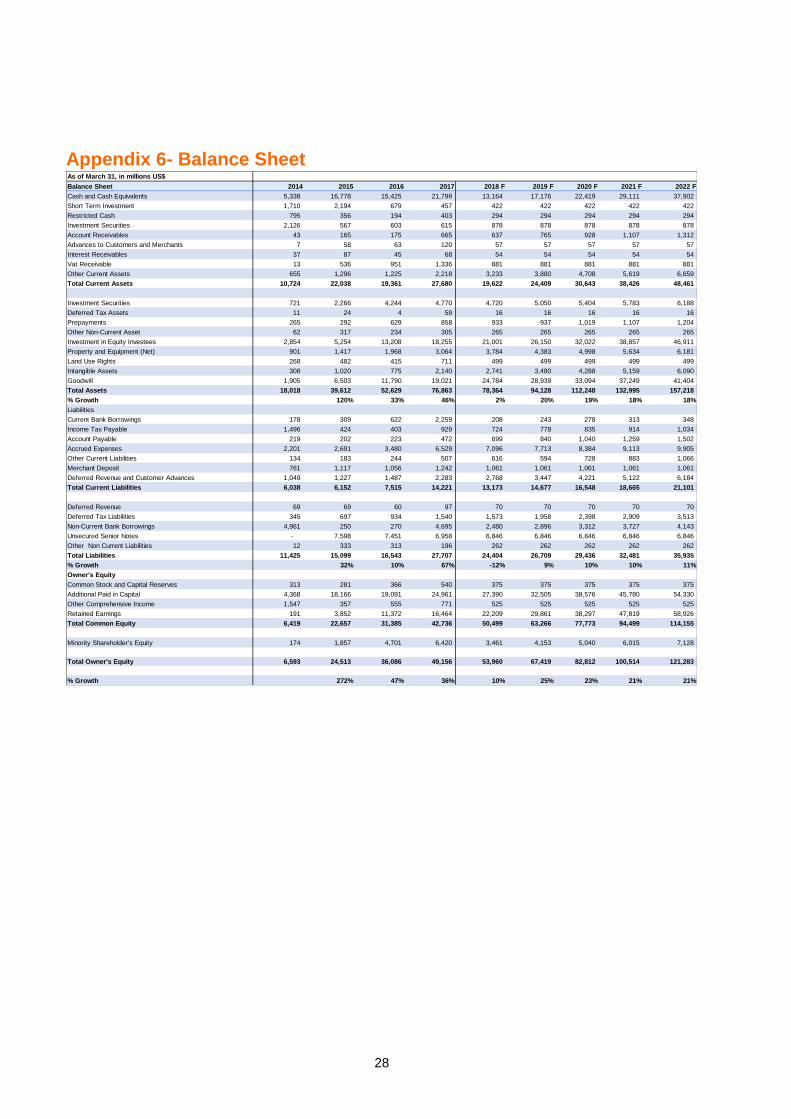
28
Appendix 6- Balance Sheet
As of March 31, in millions US$
Balance Sheet 2014 2015 2016 2017 2018 F 2019 F 2020 F 2021 F 2022 F
Cash and Cash Equivalents 5,338 16,778 15,425 21,799 13,164 17,176 22,419 29,111 37,902
Short Term Investment 1,710 2,194 679 457 422 422 422 422 422
Restricted Cash 795 356 194 403 294 294 294 294 294
Investment Securities 2,126 567 603 615 878 878 878 878 878
Account Receivables 43 165 175 665 637 765 928 1,107 1,312
Advances to Customers and Merchants 7 58 63 120 57 57 57 57 57
Interest Receivables 37 87 45 68 54 54 54 54 54
Vat Receivable 13 536 951 1,336 881 881 881 881 881
Other Current Assets 655 1,296 1,225 2,218 3,233 3,880 4,708 5,619 6,659
Total Current Assets 10,724 22,038 19,361 27,680 19,622 24,409 30,643 38,426 48,461
Investment Securities 721 2,266 4,244 4,770 4,720 5,050 5,404 5,783 6,188
Deferred Tax Assets 11 24 4 59 16 16 16 16 16
Prepayments 265 292 629 858 933 937 1,019 1,107 1,204
Other Non-Current Asset 62 317 234 305 265 265 265 265 265
Investment in Equity Investees 2,854 5,254 13,208 18,255 21,001 26,150 32,022 38,857 46,911
Property and Equipment (Net) 901 1,417 1,968 3,064 3,784 4,383 4,998 5,634 6,181
Land Use Rights 268 482 415 711 499 499 499 499 499
Intangible Assets 308 1,020 775 2,140 2,741 3,480 4,288 5,159 6,090
Goodwill 1,905 6,503 11,790 19,021 24,784 28,939 33,094 37,249 41,404
Total Assets 18,018 39,612 52,629 76,863 78,364 94,128 112,248 132,995 157,218
% Growth 120% 33% 46% 2% 20% 19% 18% 18%
Liabilities
Current Bank Borrowings 178 309 622 2,259 208 243 278 313 348
Income Tax Payable 1,496 424 403 929 724 778 835 914 1,034
Account Payable 219 202 223 472 699 840 1,040 1,259 1,502
Accrued Expenses 2,201 2,691 3,480 6,529 7,096 7,713 8,384 9,113 9,905
Other Current Liabilities 134 183 244 507 616 594 728 883 1,066
Merchant Deposit 761 1,117 1,056 1,242 1,061 1,061 1,061 1,061 1,061
Deferred Revenue and Customer Advances 1,049 1,227 1,487 2,283 2,768 3,447 4,221 5,122 6,184
Total Current Liabilities 6,038 6,152 7,515 14,221 13,173 14,677 16,548 18,665 21,101
Deferred Revenue 69 69 60 97 70 70 70 70 70
Deferred Tax Liabilities 345 697 934 1,540 1,573 1,958 2,398 2,909 3,513
Non-Current Bank Borrowings 4,961 250 270 4,695 2,480 2,896 3,312 3,727 4,143
Unsecured Senior Notes - 7,598 7,451 6,958 6,846 6,846 6,846 6,846 6,846
Other Non Current Liabilities 12 333 313 196 262 262 262 262 262
Total Liabilities 11,425 15,099 16,543 27,707 24,404 26,709 29,436 32,481 35,935
% Growth 32% 10% 67% -12% 9% 10% 10% 11%
Owner's Equity
Common Stock and Capital Reserves 313 281 366 540 375 375 375 375 375
Additional Paid in Capital 4,368 18,166 19,091 24,961 27,390 32,505 38,576 45,780 54,330
Other Comprehensive Income 1,547 357 555 771 525 525 525 525 525
Retained Earnings 191 3,852 11,372 16,464 22,209 29,861 38,297 47,819 58,926
Total Common Equity 6,419 22,657 31,385 42,736 50,499 63,266 77,773 94,499 114,155
Minority Shareholder's Equity 174 1,857 4,701 6,420 3,461 4,153 5,040 6,015 7,128
Total Owner's Equity 6,593 24,513 36,086 49,156 53,960 67,419 82,812 100,514 121,283
% Growth 272% 47% 36% 10% 25% 23% 21% 21%
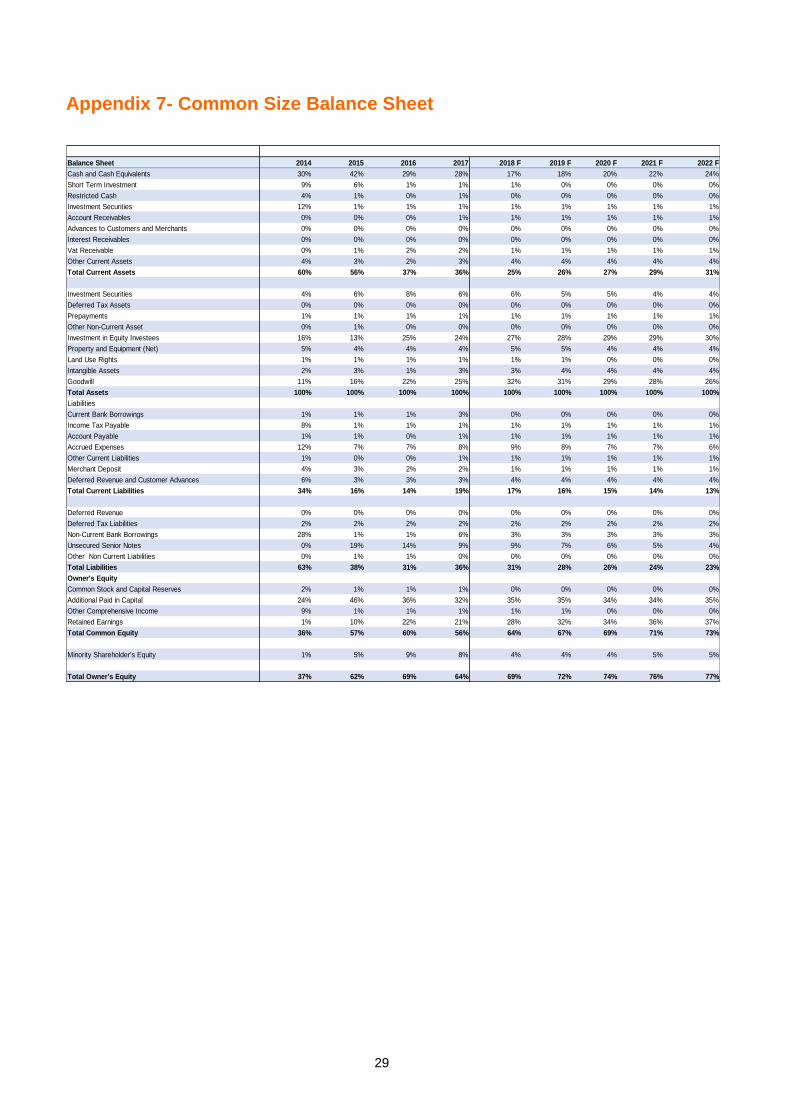
29
Appendix 7- Common Size Balance Sheet
Balance Sheet 2014 2015 2016 2017 2018 F 2019 F 2020 F 2021 F 2022 F
Cash and Cash Equivalents 30% 42% 29% 28% 17% 18% 20% 22% 24%
Short Term Investment 9% 6% 1% 1% 1% 0% 0% 0% 0%
Restricted Cash 4% 1% 0% 1% 0% 0% 0% 0% 0%
Investment Securities 12% 1% 1% 1% 1% 1% 1% 1% 1%
Account Receivables 0% 0% 0% 1% 1% 1% 1% 1% 1%
Advances to Customers and Merchants 0% 0% 0% 0% 0% 0% 0% 0% 0%
Interest Receivables 0% 0% 0% 0% 0% 0% 0% 0% 0%
Vat Receivable 0% 1% 2% 2% 1% 1% 1% 1% 1%
Other Current Assets 4% 3% 2% 3% 4% 4% 4% 4% 4%
Total Current Assets 60% 56% 37% 36% 25% 26% 27% 29% 31%
Investment Securities 4% 6% 8% 6% 6% 5% 5% 4% 4%
Deferred Tax Assets 0% 0% 0% 0% 0% 0% 0% 0% 0%
Prepayments 1% 1% 1% 1% 1% 1% 1% 1% 1%
Other Non-Current Asset 0% 1% 0% 0% 0% 0% 0% 0% 0%
Investment in Equity Investees 16% 13% 25% 24% 27% 28% 29% 29% 30%
Property and Equipment (Net) 5% 4% 4% 4% 5% 5% 4% 4% 4%
Land Use Rights 1% 1% 1% 1% 1% 1% 0% 0% 0%
Intangible Assets 2% 3% 1% 3% 3% 4% 4% 4% 4%
Goodwill 11% 16% 22% 25% 32% 31% 29% 28% 26%
Total Assets 100% 100% 100% 100% 100% 100% 100% 100% 100%
Liabilities
Current Bank Borrowings 1% 1% 1% 3% 0% 0% 0% 0% 0%
Income Tax Payable 8% 1% 1% 1% 1% 1% 1% 1% 1%
Account Payable 1% 1% 0% 1% 1% 1% 1% 1% 1%
Accrued Expenses 12% 7% 7% 8% 9% 8% 7% 7% 6%
Other Current Liabilities 1% 0% 0% 1% 1% 1% 1% 1% 1%
Merchant Deposit 4% 3% 2% 2% 1% 1% 1% 1% 1%
Deferred Revenue and Customer Advances 6% 3% 3% 3% 4% 4% 4% 4% 4%
Total Current Liabilities 34% 16% 14% 19% 17% 16% 15% 14% 13%
Deferred Revenue 0% 0% 0% 0% 0% 0% 0% 0% 0%
Deferred Tax Liabilities 2% 2% 2% 2% 2% 2% 2% 2% 2%
Non-Current Bank Borrowings 28% 1% 1% 6% 3% 3% 3% 3% 3%
Unsecured Senior Notes 0% 19% 14% 9% 9% 7% 6% 5% 4%
Other Non Current Liabilities 0% 1% 1% 0% 0% 0% 0% 0% 0%
Total Liabilities 63% 38% 31% 36% 31% 28% 26% 24% 23%
Owner's Equity
Common Stock and Capital Reserves 2% 1% 1% 1% 0% 0% 0% 0% 0%
Additional Paid in Capital 24% 46% 36% 32% 35% 35% 34% 34% 35%
Other Comprehensive Income 9% 1% 1% 1% 1% 1% 0% 0% 0%
Retained Earnings 1% 10% 22% 21% 28% 32% 34% 36% 37%
Total Common Equity 36% 57% 60% 56% 64% 67% 69% 71% 73%
Minority Shareholder's Equity 1% 5% 9% 8% 4% 4% 4% 5% 5%
Total Owner's Equity 37% 62% 69% 64% 69% 72% 74% 76% 77%
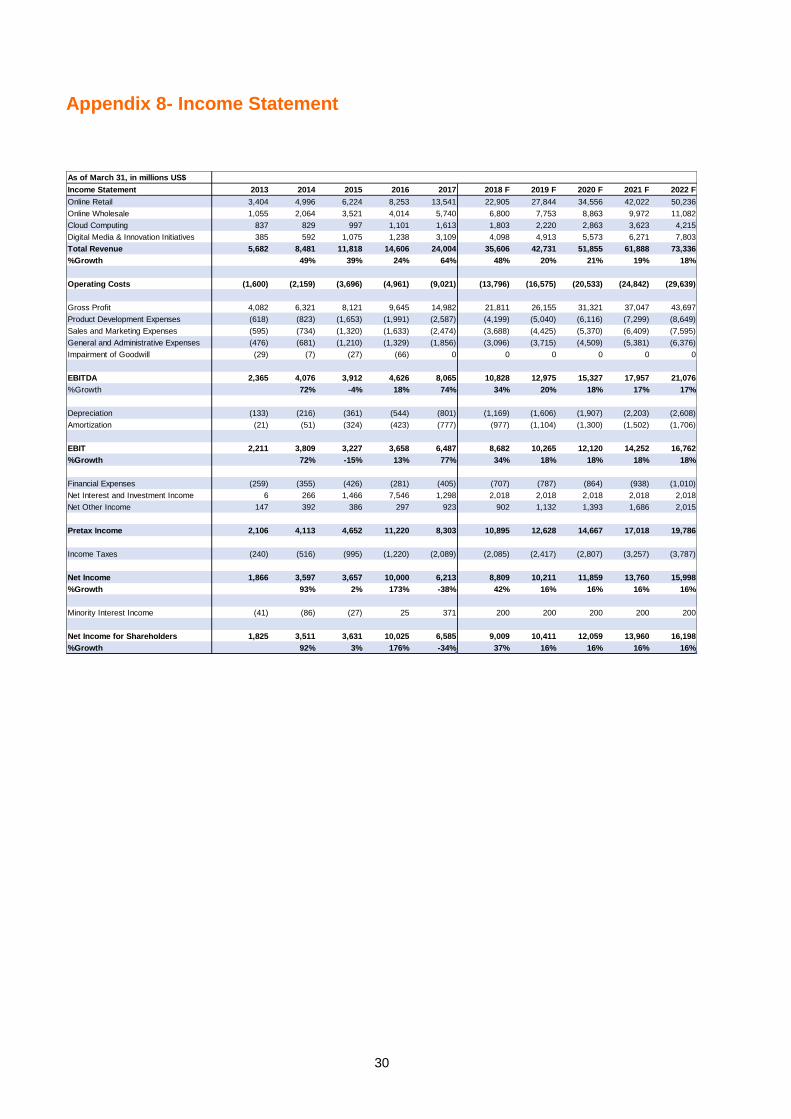
30
Appendix 8- Income Statement
As of March 31, in millions US$
Income Statement 2013 2014 2015 2016 2017 2018 F 2019 F 2020 F 2021 F 2022 F
Online Retail 3,404 4,996 6,224 8,253 13,541 22,905 27,844 34,556 42,022 50,236
Online Wholesale 1,055 2,064 3,521 4,014 5,740 6,800 7,753 8,863 9,972 11,082
Cloud Computing 837 829 997 1,101 1,613 1,803 2,220 2,863 3,623 4,215
Digital Media & Innovation Initiatives 385 592 1,075 1,238 3,109 4,098 4,913 5,573 6,271 7,803
Total Revenue 5,682 8,481 11,818 14,606 24,004 35,606 42,731 51,855 61,888 73,336
%Growth 49% 39% 24% 64% 48% 20% 21% 19% 18%
Operating Costs (1,600) (2,159) (3,696) (4,961) (9,021) (13,796) (16,575) (20,533) (24,842) (29,639)
Gross Profit 4,082 6,321 8,121 9,645 14,982 21,811 26,155 31,321 37,047 43,697
Product Development Expenses (618) (823) (1,653) (1,991) (2,587) (4,199) (5,040) (6,116) (7,299) (8,649)
Sales and Marketing Expenses (595) (734) (1,320) (1,633) (2,474) (3,688) (4,425) (5,370) (6,409) (7,595)
General and Administrative Expenses (476) (681) (1,210) (1,329) (1,856) (3,096) (3,715) (4,509) (5,381) (6,376)
Impairment of Goodwill (29) (7) (27) (66) 0 0 0 0 0 0
EBITDA 2,365 4,076 3,912 4,626 8,065 10,828 12,975 15,327 17,957 21,076
%Growth 72% -4% 18% 74% 34% 20% 18% 17% 17%
Depreciation (133) (216) (361) (544) (801) (1,169) (1,606) (1,907) (2,203) (2,608)
Amortization (21) (51) (324) (423) (777) (977) (1,104) (1,300) (1,502) (1,706)
EBIT 2,211 3,809 3,227 3,658 6,487 8,682 10,265 12,120 14,252 16,762
%Growth 72% -15% 13% 77% 34% 18% 18% 18% 18%
Financial Expenses (259) (355) (426) (281) (405) (707) (787) (864) (938) (1,010)
Net Interest and Investment Income 6 266 1,466 7,546 1,298 2,018 2,018 2,018 2,018 2,018
Net Other Income 147 392 386 297 923 902 1,132 1,393 1,686 2,015
Pretax Income 2,106 4,113 4,652 11,220 8,303 10,895 12,628 14,667 17,018 19,786
Income Taxes (240) (516) (995) (1,220) (2,089) (2,085) (2,417) (2,807) (3,257) (3,787)
Net Income 1,866 3,597 3,657 10,000 6,213 8,809 10,211 11,859 13,760 15,998
%Growth 93% 2% 173% -38% 42% 16% 16% 16% 16%
Minority Interest Income (41) (86) (27) 25 371 200 200 200 200 200
Net Income for Shareholders 1,825 3,511 3,631 10,025 6,585 9,009 10,411 12,059 13,960 16,198
%Growth 92% 3% 176% -34% 37% 16% 16% 16% 16%
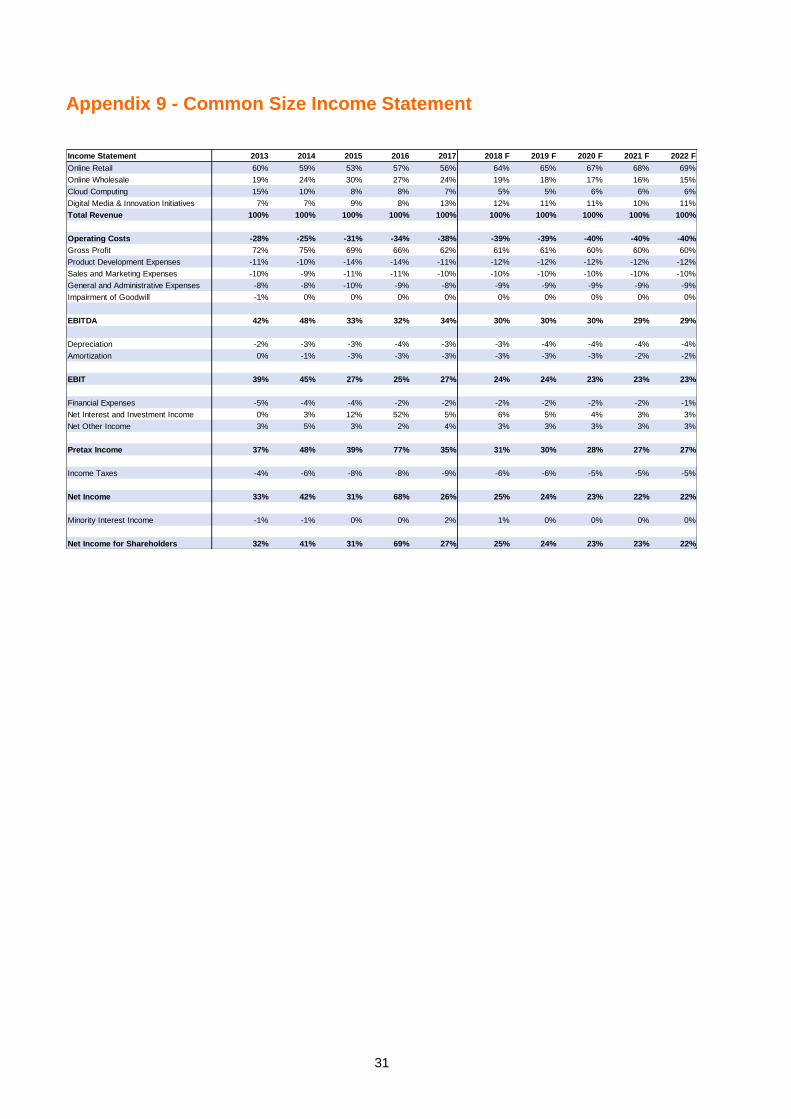
31
Appendix 9 - Common Size Income Statement
Income Statement 2013 2014 2015 2016 2017 2018 F 2019 F 2020 F 2021 F 2022 F
Online Retail 60% 59% 53% 57% 56% 64% 65% 67% 68% 69%
Online Wholesale 19% 24% 30% 27% 24% 19% 18% 17% 16% 15%
Cloud Computing 15% 10% 8% 8% 7% 5% 5% 6% 6% 6%
Digital Media & Innovation Initiatives 7% 7% 9% 8% 13% 12% 11% 11% 10% 11%
Total Revenue 100% 100% 100% 100% 100% 100% 100% 100% 100% 100%
Operating Costs -28% -25% -31% -34% -38% -39% -39% -40% -40% -40%
Gross Profit 72% 75% 69% 66% 62% 61% 61% 60% 60% 60%
Product Development Expenses -11% -10% -14% -14% -11% -12% -12% -12% -12% -12%
Sales and Marketing Expenses -10% -9% -11% -11% -10% -10% -10% -10% -10% -10%
General and Administrative Expenses -8% -8% -10% -9% -8% -9% -9% -9% -9% -9%
Impairment of Goodwill -1% 0% 0% 0% 0% 0% 0% 0% 0% 0%
EBITDA 42% 48% 33% 32% 34% 30% 30% 30% 29% 29%
Depreciation -2% -3% -3% -4% -3% -3% -4% -4% -4% -4%
Amortization 0% -1% -3% -3% -3% -3% -3% -3% -2% -2%
EBIT 39% 45% 27% 25% 27% 24% 24% 23% 23% 23%
Financial Expenses -5% -4% -4% -2% -2% -2% -2% -2% -2% -1%
Net Interest and Investment Income 0% 3% 12% 52% 5% 6% 5% 4% 3% 3%
Net Other Income 3% 5% 3% 2% 4% 3% 3% 3% 3% 3%
Pretax Income 37% 48% 39% 77% 35% 31% 30% 28% 27% 27%
Income Taxes -4% -6% -8% -8% -9% -6% -6% -5% -5% -5%
Net Income 33% 42% 31% 68% 26% 25% 24% 23% 22% 22%
Minority Interest Income -1% -1% 0% 0% 2% 1% 0% 0% 0% 0%
Net Income for Shareholders 32% 41% 31% 69% 27% 25% 24% 23% 23% 22%

32
Appendix 10- Cashflow Statement
In millions US$ 2015 2016 2017 2018 F 2019 F 2020 F 2021 F 2022 F
Operating Activities
Net Income 3,657 10,000 6,213 8,809 10,211 11,859 13,760 15,998
Depreciation 361 544 801 1,169 1,606 1,907 2,203 2,608
Amortization 324 423 777 977 1,104 1,300 1,502 1,706
Δ in Account Receivables 122- 9- 491- 28 127- 163- 180- 205-
Δ in Advances to Customers and Merchants 51- 5- 57- 62 - - - -
Δ in Vat Receivable 524- 415- 385- 455 - - - -
Δ in Other Current Assets 640- 71 994- 1,015- 647- 828- 911- 1,039-
Δ in Deferred Tax Assets 14- 20 54- 43 - - - -
Δ in Prepayments 27- 337- 229- 75- 5- 81- 89- 96-
Δ in Income Tax Payable 1,073- 21- 526 205- 53 57 79 120
Δ in Account Payable 17- 21 249 227 141 201 218 243
Δ in Accrued Expenses 490 789 3,049 568 617 671 729 792
Δ in Other Current Liabilities 48 61 263 108 21- 134 155 183
Δ in Deferred Revenue and Customer Advances 178 260 796 486 679 774 901 1,062
Δ in Deferred Revenue 0- 9- 37 27- - - - -
Δ in Deferred Tax Liabilities 352 238 605 33 385 440 512 603
Net Cashflow from operating Activities 2,943 11,631 11,108 11,644 13,996 16,269 18,881 21,975
Investing Activities
Δ in Short Term Investment 484- 1,515 222 34 - - - -
Δ in Investment Securities 1,558 36- 11- 263- - - - -
Δ in Investment Securities 1,545- 1,979- 526- 50 331- 354- 379- 405-
Δ in Other Non-Current Asset 255- 83 71- 39 - - - -
Δ in Investment in Equity Investees 2,818- 7,721- 7,290- 3,239- 5,888- 6,680- 7,706- 8,985-
Δ in Property and Equipment (Net) 705- 857- 1,227- 1,889- 2,205- 2,522- 2,839- 3,155-
Δ in Land Use Rights 213- 66 296- 213 - - - -
Δ in Intangible Assets 324- 423- 777- 977- 1,104- 1,300- 1,502- 1,706-
Δ in Goodwill 4,625- 5,353- 7,231- 5,763- 4,155- 4,155- 4,155- 4,155-
Δ in Other Non Current Liabilities 322 21- 117- 66 - - - -
Net Cashflows from Investing Activities 9,089- 14,724- 17,324- 11,728- 13,682- 15,011- 16,580- 18,406-
Financing Activities
Δ in Interest Receivables 50- 42 22- 13 - - - -
Δ in Current Bank Borrowings 131 313 1,638 2,051- 35 35 35 35
Δ in Merchant Deposit 356 61- 186 181- - - - -
Δ in Non-Current Bank Borrowings 4,711- 21 4,425 2,215- 416 416 416 416
Δ in Unsecured Senior Notes 7,598 147- 493- 111- - - - -
Δ in Common Stock and Capital Reserves 32- 85 174 165- - - - -
Δ in Additional Paid in Capital 13,798 925 5,869 2,429 5,115 6,071 7,204 8,550
Δ in Other Comprehensive Income 1,190- 198 216 246- - - - -
Δ in Retained Earnings 4 2,480- 1,122- 3,064- 2,559- 3,423- 4,238- 4,891-
Δ in Minority Shareholder's Equity 1,683 2,844 1,719 2,959- 692 887 975 1,113
Net Cashflows from Financing Activities 17,587 1,740 12,590 8,550- 3,699 3,985 4,392 5,221
Cash Beginning of the Period 5,338 16,778 15,425 21,799 13,164 17,176 22,419 29,111
Cash End of the Period 16,778 15,425 21,799 13,164 17,176 22,419 29,111 37,902
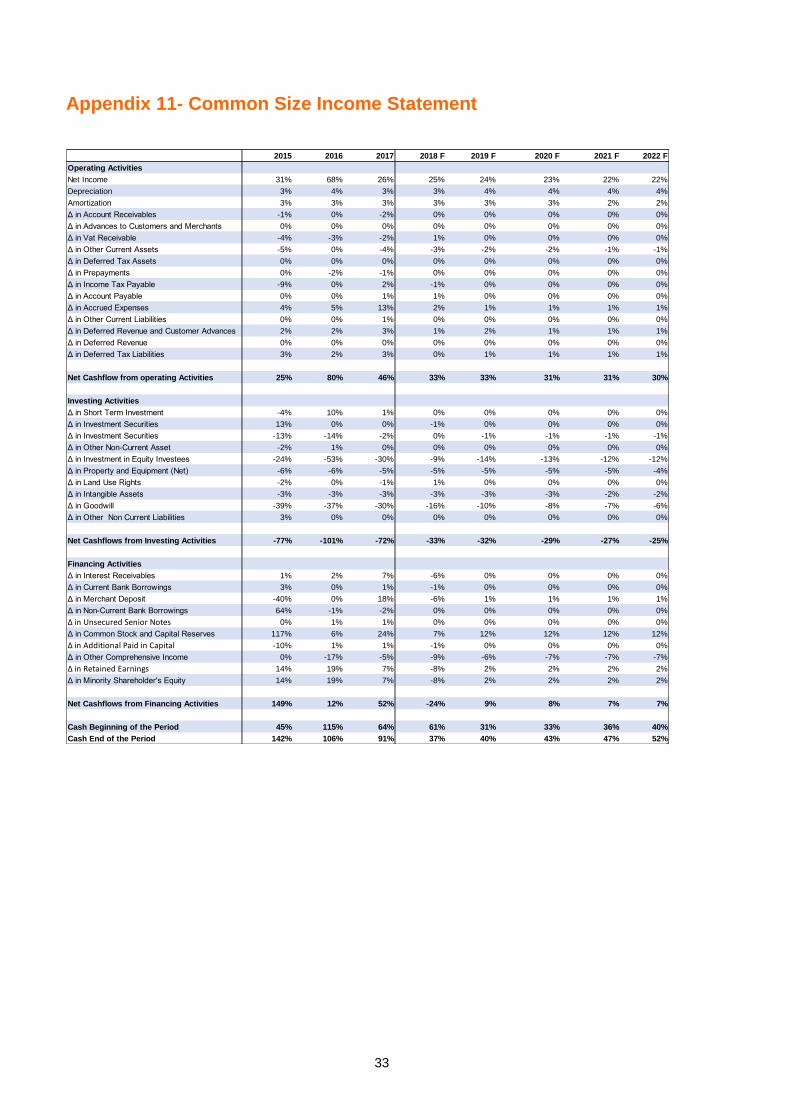
33
Appendix 11- Common Size Income Statement
2015 2016 2017 2018 F 2019 F 2020 F 2021 F 2022 F
Operating Activities
Net Income 31% 68% 26% 25% 24% 23% 22% 22%
Depreciation 3% 4% 3% 3% 4% 4% 4% 4%
Amortization 3% 3% 3% 3% 3% 3% 2% 2%
Δ in Account Receivables -1% 0% -2% 0% 0% 0% 0% 0%
Δ in Advances to Customers and Merchants 0% 0% 0% 0% 0% 0% 0% 0%
Δ in Vat Receivable -4% -3% -2% 1% 0% 0% 0% 0%
Δ in Other Current Assets -5% 0% -4% -3% -2% -2% -1% -1%
Δ in Deferred Tax Assets 0% 0% 0% 0% 0% 0% 0% 0%
Δ in Prepayments 0% -2% -1% 0% 0% 0% 0% 0%
Δ in Income Tax Payable -9% 0% 2% -1% 0% 0% 0% 0%
Δ in Account Payable 0% 0% 1% 1% 0% 0% 0% 0%
Δ in Accrued Expenses 4% 5% 13% 2% 1% 1% 1% 1%
Δ in Other Current Liabilities 0% 0% 1% 0% 0% 0% 0% 0%
Δ in Deferred Revenue and Customer Advances 2% 2% 3% 1% 2% 1% 1% 1%
Δ in Deferred Revenue 0% 0% 0% 0% 0% 0% 0% 0%
Δ in Deferred Tax Liabilities 3% 2% 3% 0% 1% 1% 1% 1%
Net Cashflow from operating Activities 25% 80% 46% 33% 33% 31% 31% 30%
Investing Activities
Δ in Short Term Investment -4% 10% 1% 0% 0% 0% 0% 0%
Δ in Investment Securities 13% 0% 0% -1% 0% 0% 0% 0%
Δ in Investment Securities -13% -14% -2% 0% -1% -1% -1% -1%
Δ in Other Non-Current Asset -2% 1% 0% 0% 0% 0% 0% 0%
Δ in Investment in Equity Investees -24% -53% -30% -9% -14% -13% -12% -12%
Δ in Property and Equipment (Net) -6% -6% -5% -5% -5% -5% -5% -4%
Δ in Land Use Rights -2% 0% -1% 1% 0% 0% 0% 0%
Δ in Intangible Assets -3% -3% -3% -3% -3% -3% -2% -2%
Δ in Goodwill -39% -37% -30% -16% -10% -8% -7% -6%
Δ in Other Non Current Liabilities 3% 0% 0% 0% 0% 0% 0% 0%
Net Cashflows from Investing Activities -77% -101% -72% -33% -32% -29% -27% -25%
Financing Activities
Δ in Interest Receivables 1% 2% 7% -6% 0% 0% 0% 0%
Δ in Current Bank Borrowings 3% 0% 1% -1% 0% 0% 0% 0%
Δ in Merchant Deposit -40% 0% 18% -6% 1% 1% 1% 1%
Δ in Non-Current Bank Borrowings 64% -1% -2% 0% 0% 0% 0% 0%
Δ in Unsecured Senior Notes 0% 1% 1% 0% 0% 0% 0% 0%
Δ in Common Stock and Capital Reserves 117% 6% 24% 7% 12% 12% 12% 12%
Δ in Additional Paid in Capital -10% 1% 1% -1% 0% 0% 0% 0%
Δ in Other Comprehensive Income 0% -17% -5% -9% -6% -7% -7% -7%
Δ in Retained Earnings 14% 19% 7% -8% 2% 2% 2% 2%
Δ in Minority Shareholder's Equity 14% 19% 7% -8% 2% 2% 2% 2%
Net Cashflows from Financing Activities 149% 12% 52% -24% 9% 8% 7% 7%
Cash Beginning of the Period 45% 115% 64% 61% 31% 33% 36% 40%
Cash End of the Period 142% 106% 91% 37% 40% 43% 47% 52%
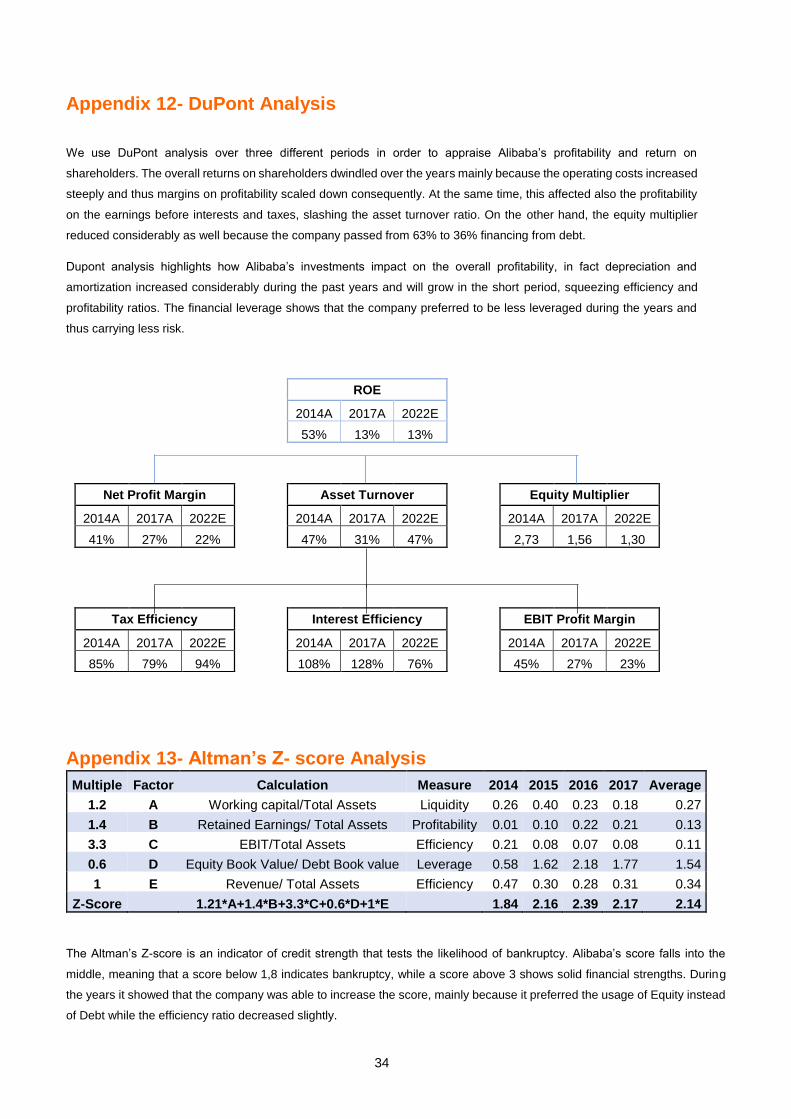
34
Appendix 12- DuPont Analysis
We use DuPont analysis over three different periods in order to appraise Alibaba’s profitability and return on
shareholders. The overall returns on shareholders dwindled over the years mainly because the operating costs increased
steeply and thus margins on profitability scaled down consequently. At the same time, this affected also the profitability
on the earnings before interests and taxes, slashing the asset turnover ratio. On the other hand, the equity multiplier
reduced considerably as well because the company passed from 63% to 36% financing from debt.
Dupont analysis highlights how Alibaba’s investments impact on the overall profitability, in fact depreciation and
amortization increased considerably during the past years and will grow in the short period, squeezing efficiency and
profitability ratios. The financial leverage shows that the company preferred to be less leveraged during the years and
thus carrying less risk.
Appendix 13- Altman’s Z- score Analysis
Multiple Factor Calculation Measure 2014 2015 2016 2017 Average
1.2 A Working capital/Total Assets Liquidity 0.26 0.40 0.23 0.18 0.27
1.4 B Retained Earnings/ Total Assets Profitability 0.01 0.10 0.22 0.21 0.13
3.3 C EBIT/Total Assets Efficiency 0.21 0.08 0.07 0.08 0.11
0.6 D Equity Book Value/ Debt Book value Leverage 0.58 1.62 2.18 1.77 1.54
1 E Revenue/ Total Assets Efficiency 0.47 0.30 0.28 0.31 0.34
Z-Score 1.21*A+1.4*B+3.3*C+0.6*D+1*E 1.84 2.16 2.39 2.17 2.14
The Altman’s Z-score is an indicator of credit strength that tests the likelihood of bankruptcy. Alibaba’s score falls into the
middle, meaning that a score below 1,8 indicates bankruptcy, while a score above 3 shows solid financial strengths. During
the years it showed that the company was able to increase the score, mainly because it preferred the usage of Equity instead
of Debt while the efficiency ratio decreased slightly.
ROE
2014A 2017A 2022E
53% 13% 13%
Net Profit Margin Asset Turnover Equity Multiplier
2014A 2017A 2022E 2014A 2017A 2022E 2014A 2017A 2022E
41% 27% 22% 47% 31% 47% 2,73 1,56 1,30
Tax Efficiency Interest Efficiency EBIT Profit Margin
2014A 2017A 2022E 2014A 2017A 2022E 2014A 2017A 2022E
85% 79% 94% 108% 128% 76% 45% 27% 23%
35
Appendix 14- Cost of Capital Analysis Cost of Equity
We assume the cost of equity was calculated using the Capital Asset Pricing Model (CAPM)
1. Risk free rate and Market Risk Premium
The risk-free rate is the result Damodaran Database (2018), taking into account the USA, having as result 2.80%. At the same
time, for the market risk premium, we applied a ratio of 79:21 to find out the combined Market Risk Premium between China
and U.S., respectively, using Damodaran Database (2018), for a total of 5.72%.
2. Beta
The beta is calculated by running a linear regression of Alibaba monthly returns over the New York Stock Exchange Composite
Index returns for the same period. The time range goes from September 2014 until June 2018.
The Adjusted Beta we estimated is 1.89
According to the classical CAPM model, we calculate the cost of equity as 13.63%
Cost of Debt
Since the short-term debt, including bank borrowings have a fluctuation that goes from 1.7% to 4.8% and the long-term debt
that includes either bank borrowings and bonds, with a yield to maturity of 4.5 and maturity in 2034, we decided to apply a rate
of 4.5%.
Tax Rate and Weighted Average Cost of Capital
Since the company operates mainly in China and for the rest of the world the sales in detail are not disclosed, we decided
to take into account an average of 19%, considering previous years effective tax rate for the corporation.
Alibaba’s leverage represents 34%, while equity consists of 66%, that is the reason why we decided to use the weighted
average cost of capital. As result, we apply a cost of capital of 10.23%.
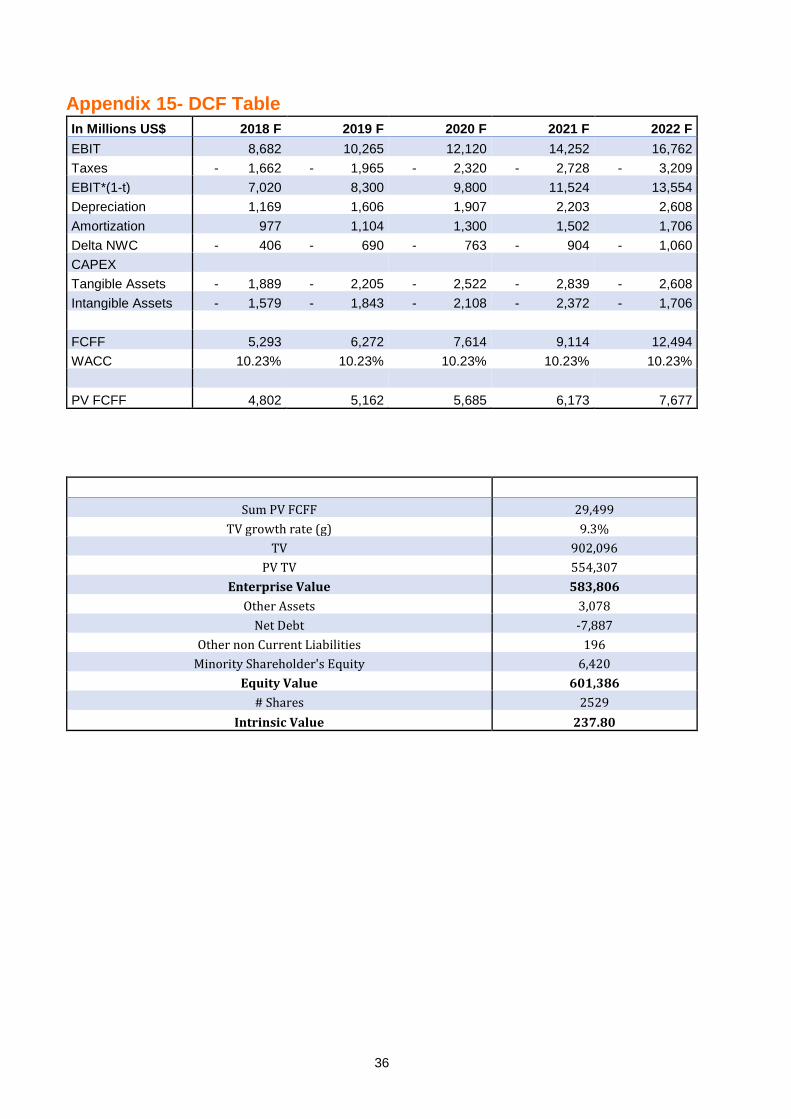
36
Appendix 15- DCF Table
In Millions US$ 2018 F 2019 F 2020 F 2021 F 2022 F
EBIT 8,682 10,265 12,120 14,252 16,762
Taxes - 1,662 - 1,965 - 2,320 - 2,728 - 3,209
EBIT*(1-t) 7,020 8,300 9,800 11,524 13,554
Depreciation 1,169 1,606 1,907 2,203 2,608
Amortization 977 1,104 1,300 1,502 1,706
Delta NWC - 406 - 690 - 763 - 904 - 1,060
CAPEX
Tangible Assets - 1,889 - 2,205 - 2,522 - 2,839 - 2,608
Intangible Assets - 1,579 - 1,843 - 2,108 - 2,372 - 1,706
FCFF 5,293 6,272 7,614 9,114 12,494
WACC 10.23% 10.23% 10.23% 10.23% 10.23%
PV FCFF 4,802 5,162 5,685 6,173 7,677
Sum PV FCFF 29,499
TV growth rate (g) 9.3%
TV 902,096
PV TV 554,307
Enterprise Value 583,806
Other Assets 3,078
Net Debt -7,887
Other non Current Liabilities 196
Minority Shareholder's Equity 6,420
Equity Value 601,386
# Shares 2529
Intrinsic Value 237.80
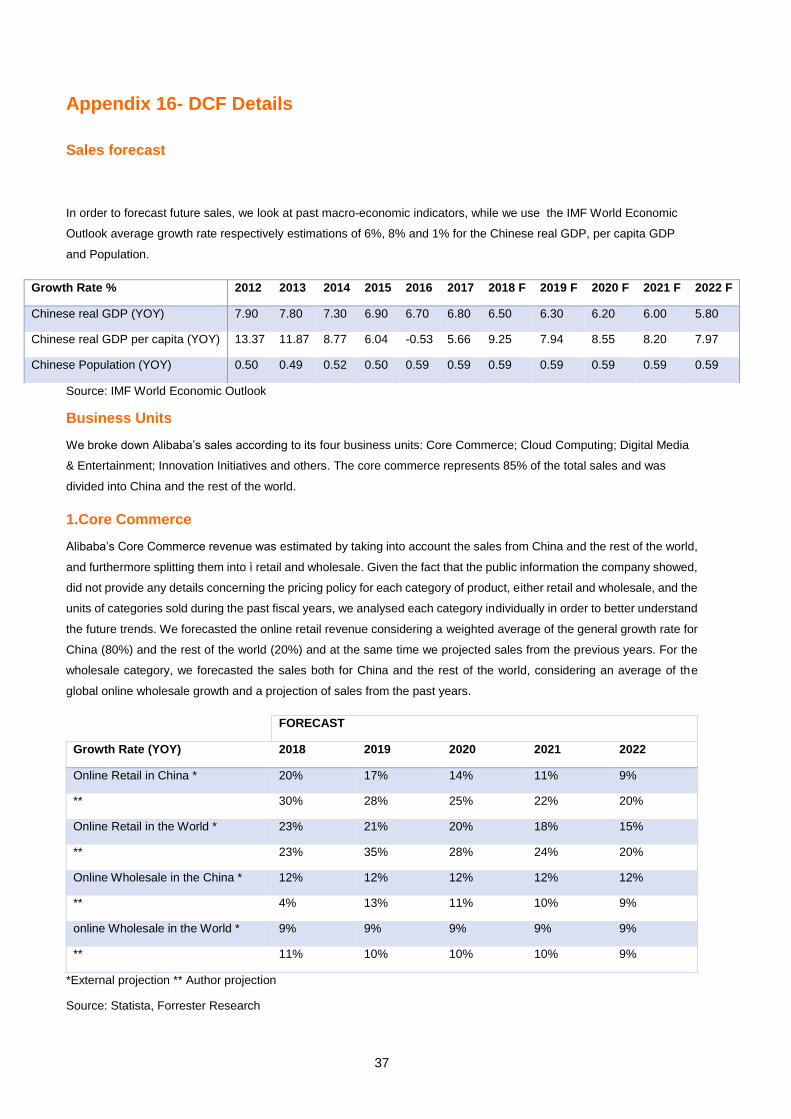
37
Appendix 16- DCF Details
Sales forecast
In order to forecast future sales, we look at past macro-economic indicators, while we use the IMF World Economic
Outlook average growth rate respectively estimations of 6%, 8% and 1% for the Chinese real GDP, per capita GDP
and Population.
Source: IMF World Economic Outlook
Business Units
We broke down Alibaba’s sales according to its four business units: Core Commerce; Cloud Computing; Digital Media
& Entertainment; Innovation Initiatives and others. The core commerce represents 85% of the total sales and was
divided into China and the rest of the world.
1.Core Commerce
Alibaba’s Core Commerce revenue was estimated by taking into account the sales from China and the rest of the world,
and furthermore splitting them into ì retail and wholesale. Given the fact that the public information the company showed,
did not provide any details concerning the pricing policy for each category of product, either retail and wholesale, and the
units of categories sold during the past fiscal years, we analysed each category individually in order to better understand
the future trends. We forecasted the online retail revenue considering a weighted average of the general growth rate for
China (80%) and the rest of the world (20%) and at the same time we projected sales from the previous years. For the
wholesale category, we forecasted the sales both for China and the rest of the world, considering an average of the
global online wholesale growth and a projection of sales from the past years.
FORECAST
Growth Rate (YOY) 2018 2019 2020 2021 2022
Online Retail in China * 20% 17% 14% 11% 9%
** 30% 28% 25% 22% 20%
Online Retail in the World * 23% 21% 20% 18% 15%
** 23% 35% 28% 24% 20%
Online Wholesale in the China * 12% 12% 12% 12% 12%
** 4% 13% 11% 10% 9%
online Wholesale in the World * 9% 9% 9% 9% 9%
** 11% 10% 10% 10% 9%
*External projection ** Author projection
Source: Statista, Forrester Research
Growth Rate % 2012 2013 2014 2015 2016 2017 2018 F 2019 F 2020 F 2021 F 2022 F
Chinese real GDP (YOY) 7.90 7.80 7.30 6.90 6.70 6.80 6.50 6.30 6.20 6.00 5.80
Chinese real GDP per capita (YOY) 13.37 11.87 8.77 6.04 -0.53 5.66 9.25 7.94 8.55 8.20 7.97
Chinese Population (YOY) 0.50 0.49 0.52 0.50 0.59 0.59 0.59 0.59 0.59 0.59 0.59
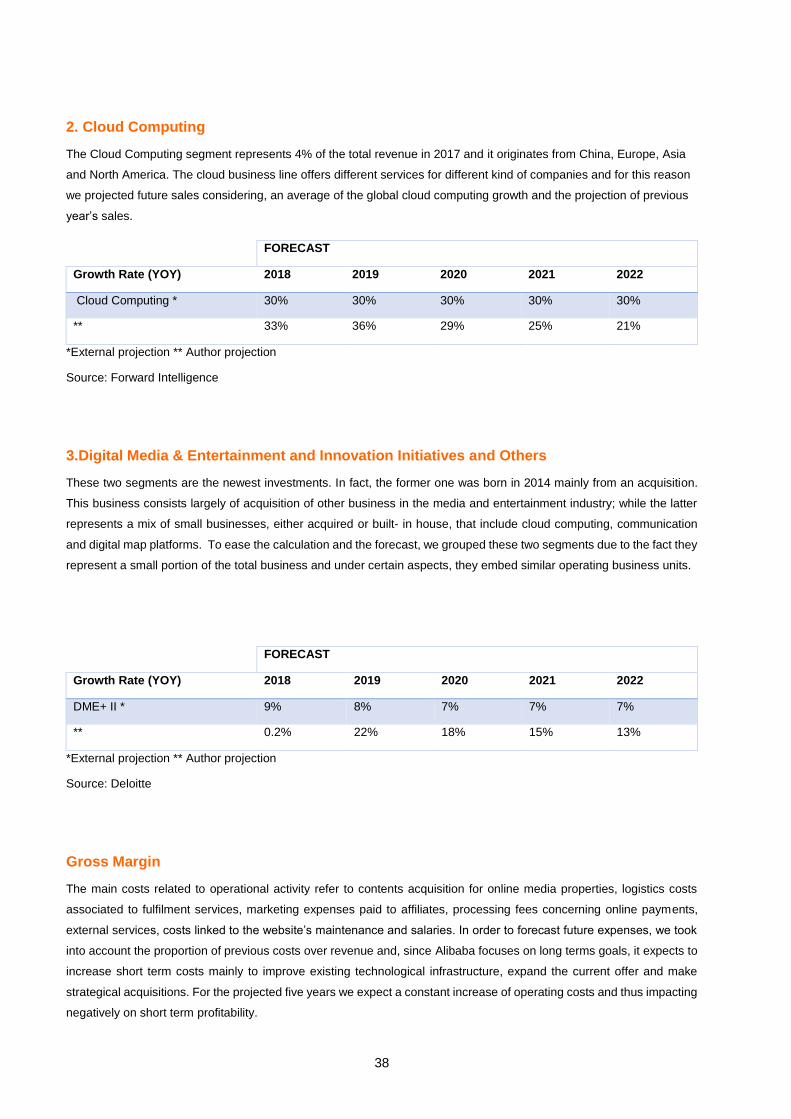
38
2. Cloud Computing
The Cloud Computing segment represents 4% of the total revenue in 2017 and it originates from China, Europe, Asia
and North America. The cloud business line offers different services for different kind of companies and for this reason
we projected future sales considering, an average of the global cloud computing growth and the projection of previous
year’s sales.
FORECAST
Growth Rate (YOY) 2018 2019 2020 2021 2022
Cloud Computing * 30% 30% 30% 30% 30%
** 33% 36% 29% 25% 21%
*External projection ** Author projection
Source: Forward Intelligence
3.Digital Media & Entertainment and Innovation Initiatives and Others
These two segments are the newest investments. In fact, the former one was born in 2014 mainly from an acquisition.
This business consists largely of acquisition of other business in the media and entertainment industry; while the latter
represents a mix of small businesses, either acquired or built- in house, that include cloud computing, communication
and digital map platforms. To ease the calculation and the forecast, we grouped these two segments due to the fact they
represent a small portion of the total business and under certain aspects, they embed similar operating business units.
FORECAST
Growth Rate (YOY) 2018 2019 2020 2021 2022
DME+ II * 9% 8% 7% 7% 7%
** 0.2% 22% 18% 15% 13%
*External projection ** Author projection
Source: Deloitte
Gross Margin
The main costs related to operational activity refer to contents acquisition for online media properties, logistics costs
associated to fulfilment services, marketing expenses paid to affiliates, processing fees concerning online payments,
external services, costs linked to the website’s maintenance and salaries. In order to forecast future expenses, we took
into account the proportion of previous costs over revenue and, since Alibaba focuses on long terms goals, it expects to
increase short term costs mainly to improve existing technological infrastructure, expand the current offer and make
strategical acquisitions. For the projected five years we expect a constant increase of operating costs and thus impacting
negatively on short term profitability.

39
Business and Management Expenses
This category represents mainly costs associated to business development, marketing campaigns and administrative
charges and since during the past years they had a similar portion compared to revenue, for simplicity reasons, we keep
the same portion for the following years.
Account Assumption
Product Development Expenses Percentage of Sales Revenue
Sales and Marketing Expenses Percentage of Sales Revenue
General and Administrative Expenses Percentage of Sales Revenue
Depreciation, Amortization & Financial Expenses
Depreciation and Amortization represents all the non-cash expenses and are forecasted according to previous portions
of tangible and intangible investments. On the other hand, we expect that Financial Expenses have the same rate over
the financial debt.
Account Assumptions
Depreciation Percentage of Beginning Tangible Assets Net
Amortization Percentage of Beginning Intangible Assets Net
Interest Expenses Derived from Short- and Long-Term Financial Debt
Other Accounts of Income Statements
Net Interest and investment Income mainly represent deconsolidation of previous investments, revaluation of previously
held equity interest and gains coming from disposal over certain investments. During past years this account was not
related neither to revenue nor capital expenditure, we assumed an average of previous years as a constant amount for
the following periods. Minority interest income shows how the non-controlled companies perform, while Other
Comprehensive Income we expect no changes. The amount of paid taxes during the past years was never the same
given by the fact the sources of revenue of the company were always different. For this reason, for the following periods
we kept a constant tax rate, considering an average of previous rates.
HISTORICAL FORECAST
2013 2014 2015 2016 2017 2018 2019 2020 2021 2022
Gross Margin 72% 75% 69% 66% 62% 61% 61% 60% 60% 60%

40
Account Assumptions
Net Interest and Investment Income Average of the past five years
Net Other Income Percentage of sales revenue
Minority Interest Income Percentage of Net Income
Tax Ratio Average of the past three years
Goodwill Impairment equal to 0
Other Comprehensive Income Average of the past three years
CAPEX
Property plant and equipment and intangible assets we applied the BASE (Beginning, Adding, Subtracting, End Value)
method. We assume that Alibaba will invest more on the short term, making strategical acquisition that concern either
the core commerce and the other business lines, while on the long term it will focus more on financial results, improving
margins and income. In addition, given the fact that the company does not show how investments will be split, we assume
the same proportion over the years for both typology of investments.
Account in BLN US$ FORECAST
2018 2019 2020 2021 2022
Fixed Assets
Balance at the Beginning of
Year
3.06 3.78
4.38
4.99 5.63
Addition (CAPEX)
1.89 2.20
2.52
2.84
3.16
Subtraction (Depreciation)
-
1.17 - 1.61
-
1.97
-
2.20
-
2.61
End Balance
3.78 4.38
4.99 5.63 6.18
Intangible Assets
Balance at the Beginning of
Year
2.14 2.74 3.48 4.29 5.16
Addition (CAPEX)
1.58 1.84
2.11
2.37
2.64
Subtraction (Depreciation)
-
0.98 - 1.10
-
1.3 - 1.5
-
1.71
End Balance
2.74 3.48 4.29 5.16 6.09
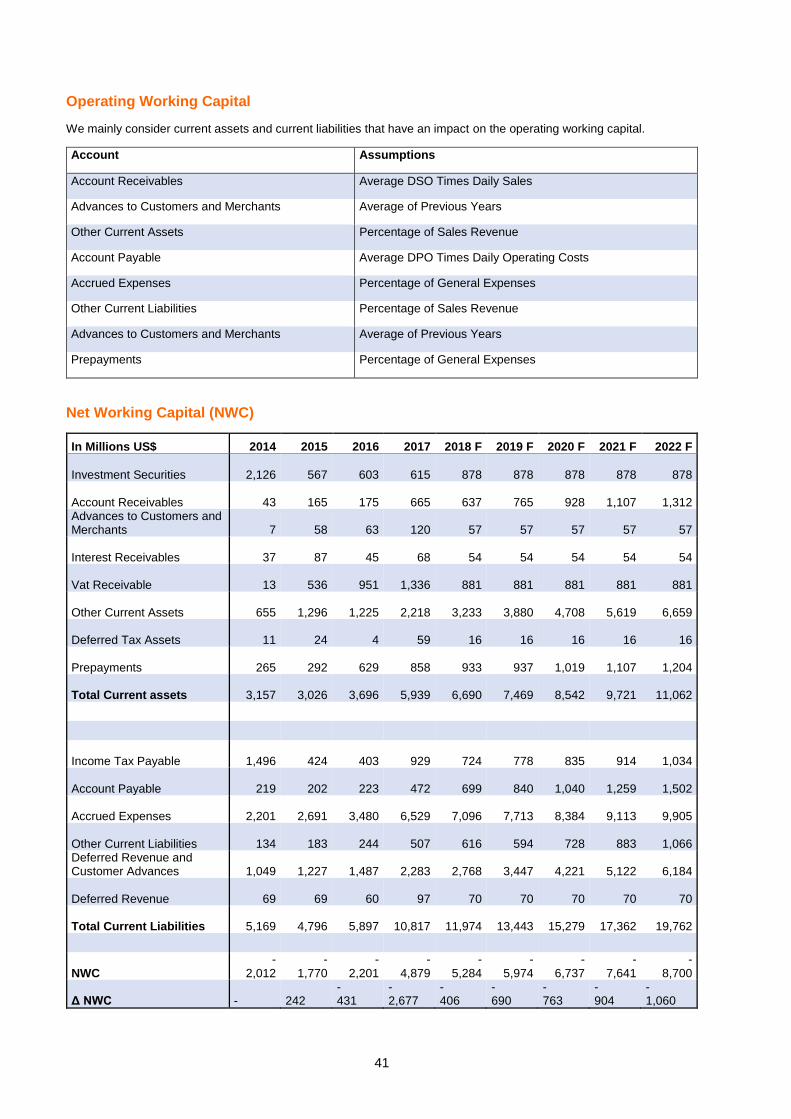
41
Operating Working Capital
We mainly consider current assets and current liabilities that have an impact on the operating working capital.
Account Assumptions
Account Receivables Average DSO Times Daily Sales
Advances to Customers and Merchants Average of Previous Years
Other Current Assets Percentage of Sales Revenue
Account Payable Average DPO Times Daily Operating Costs
Accrued Expenses Percentage of General Expenses
Other Current Liabilities Percentage of Sales Revenue
Advances to Customers and Merchants Average of Previous Years
Prepayments Percentage of General Expenses
Net Working Capital (NWC)
In Millions US$ 2014 2015 2016 2017 2018 F 2019 F 2020 F 2021 F 2022 F
Investment Securities
2,126
567
603
615
878
878
878
878
878
Account Receivables
43
165
175
665
637
765
928
1,107
1,312 Advances to Customers and Merchants
7
58
63
120
57
57
57
57
57
Interest Receivables
37
87
45
68
54
54
54
54
54
Vat Receivable
13
536
951
1,336
881
881
881
881
881
Other Current Assets
655
1,296
1,225
2,218
3,233
3,880
4,708
5,619
6,659
Deferred Tax Assets
11
24
4
59
16
16
16
16
16
Prepayments
265
292
629
858
933
937
1,019
1,107
1,204
Total Current assets
3,157
3,026
3,696
5,939
6,690
7,469
8,542
9,721
11,062
Income Tax Payable
1,496
424
403
929
724
778
835
914
1,034
Account Payable
219
202
223
472
699
840
1,040
1,259
1,502
Accrued Expenses
2,201
2,691
3,480
6,529
7,096
7,713
8,384
9,113
9,905
Other Current Liabilities
134
183
244
507
616
594
728
883
1,066 Deferred Revenue and Customer Advances
1,049
1,227
1,487
2,283
2,768
3,447
4,221
5,122
6,184
Deferred Revenue
69
69
60
97
70
70
70
70
70
Total Current Liabilities
5,169
4,796
5,897
10,817
11,974
13,443
15,279
17,362
19,762
NWC -
2,012 -
1,770 -
2,201 -
4,879 -
5,284 -
5,974 -
6,737 -
7,641 -
8,700
Δ NWC -
242
- 431
- 2,677
- 406
- 690
- 763
- 904
- 1,060
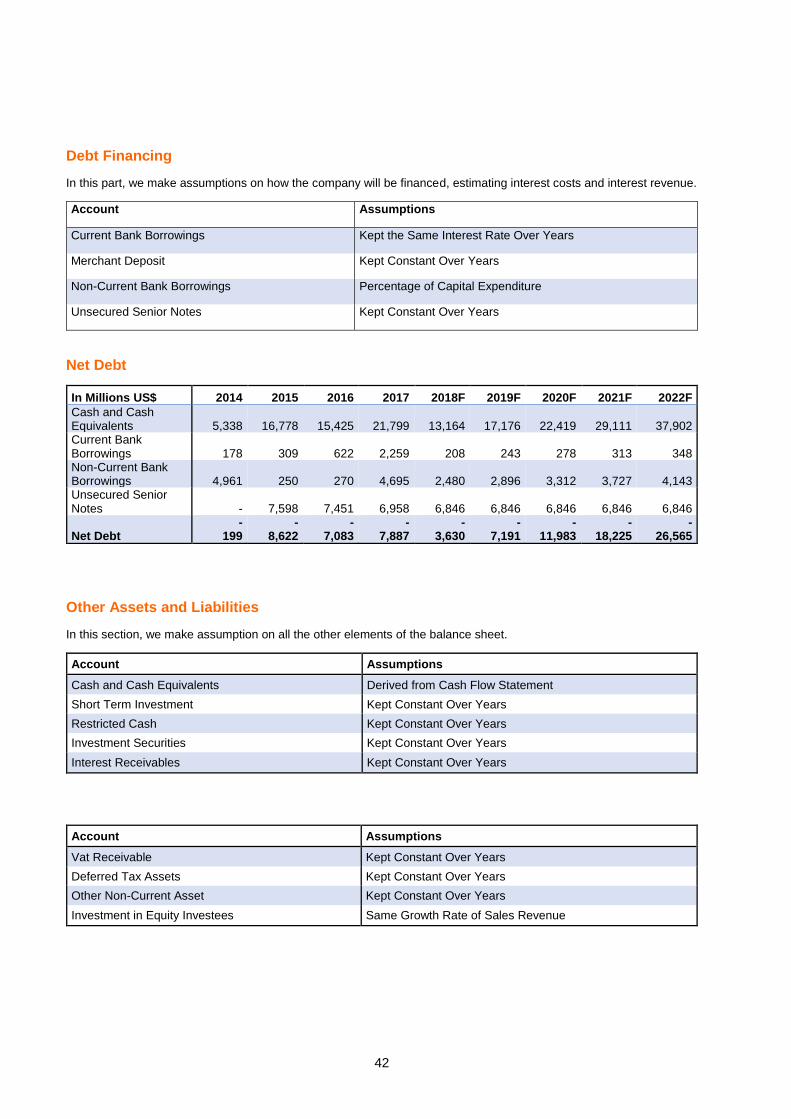
42
Debt Financing
In this part, we make assumptions on how the company will be financed, estimating interest costs and interest revenue.
Account Assumptions
Current Bank Borrowings Kept the Same Interest Rate Over Years
Merchant Deposit Kept Constant Over Years
Non-Current Bank Borrowings Percentage of Capital Expenditure
Unsecured Senior Notes Kept Constant Over Years
Net Debt
In Millions US$ 2014 2015 2016 2017 2018F 2019F 2020F 2021F 2022F
Cash and Cash Equivalents
5,338
16,778
15,425
21,799
13,164
17,176
22,419
29,111
37,902
Current Bank Borrowings
178
309
622
2,259
208
243
278
313
348
Non-Current Bank Borrowings
4,961
250
270
4,695
2,480
2,896
3,312
3,727
4,143
Unsecured Senior Notes
-
7,598
7,451
6,958
6,846
6,846
6,846
6,846
6,846
Net Debt -
199 -
8,622 -
7,083 -
7,887 -
3,630 -
7,191 -
11,983 -
18,225 -
26,565
Other Assets and Liabilities
In this section, we make assumption on all the other elements of the balance sheet.
Account Assumptions
Cash and Cash Equivalents Derived from Cash Flow Statement
Short Term Investment Kept Constant Over Years
Restricted Cash Kept Constant Over Years
Investment Securities Kept Constant Over Years
Interest Receivables Kept Constant Over Years
Account Assumptions
Vat Receivable Kept Constant Over Years
Deferred Tax Assets Kept Constant Over Years
Other Non-Current Asset Kept Constant Over Years
Investment in Equity Investees Same Growth Rate of Sales Revenue
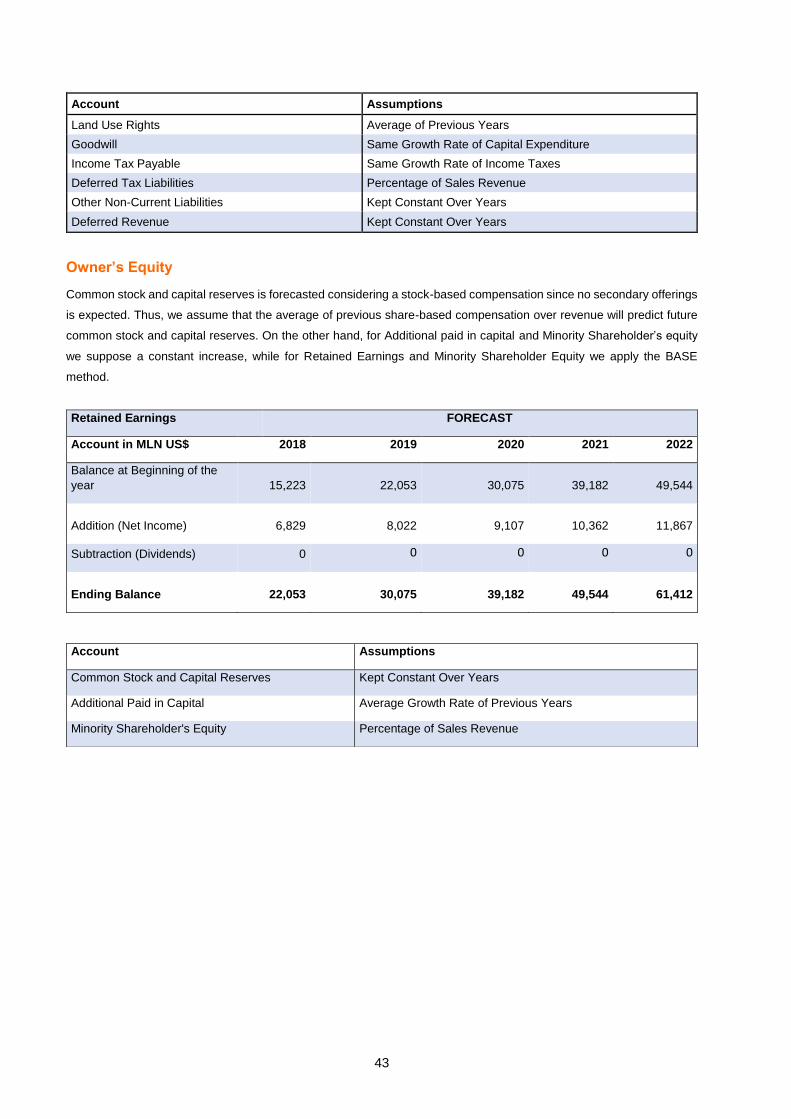
43
Account Assumptions
Land Use Rights Average of Previous Years
Goodwill Same Growth Rate of Capital Expenditure
Income Tax Payable Same Growth Rate of Income Taxes
Deferred Tax Liabilities Percentage of Sales Revenue
Other Non-Current Liabilities Kept Constant Over Years
Deferred Revenue Kept Constant Over Years
Owner’s Equity
Common stock and capital reserves is forecasted considering a stock-based compensation since no secondary offerings
is expected. Thus, we assume that the average of previous share-based compensation over revenue will predict future
common stock and capital reserves. On the other hand, for Additional paid in capital and Minority Shareholder’s equity
we suppose a constant increase, while for Retained Earnings and Minority Shareholder Equity we apply the BASE
method.
Retained Earnings FORECAST
Account in MLN US$ 2018 2019 2020 2021 2022
Balance at Beginning of the
year
15,223 22,053
30,075
39,182
49,544
Addition (Net Income)
6,829 8,022
9,107
10,362
11,867
Subtraction (Dividends) 0 0 0 0 0
Ending Balance
22,053 30,075
39,182
49,544
61,412
Account Assumptions
Common Stock and Capital Reserves Kept Constant Over Years
Additional Paid in Capital Average Growth Rate of Previous Years
Minority Shareholder's Equity Percentage of Sales Revenue
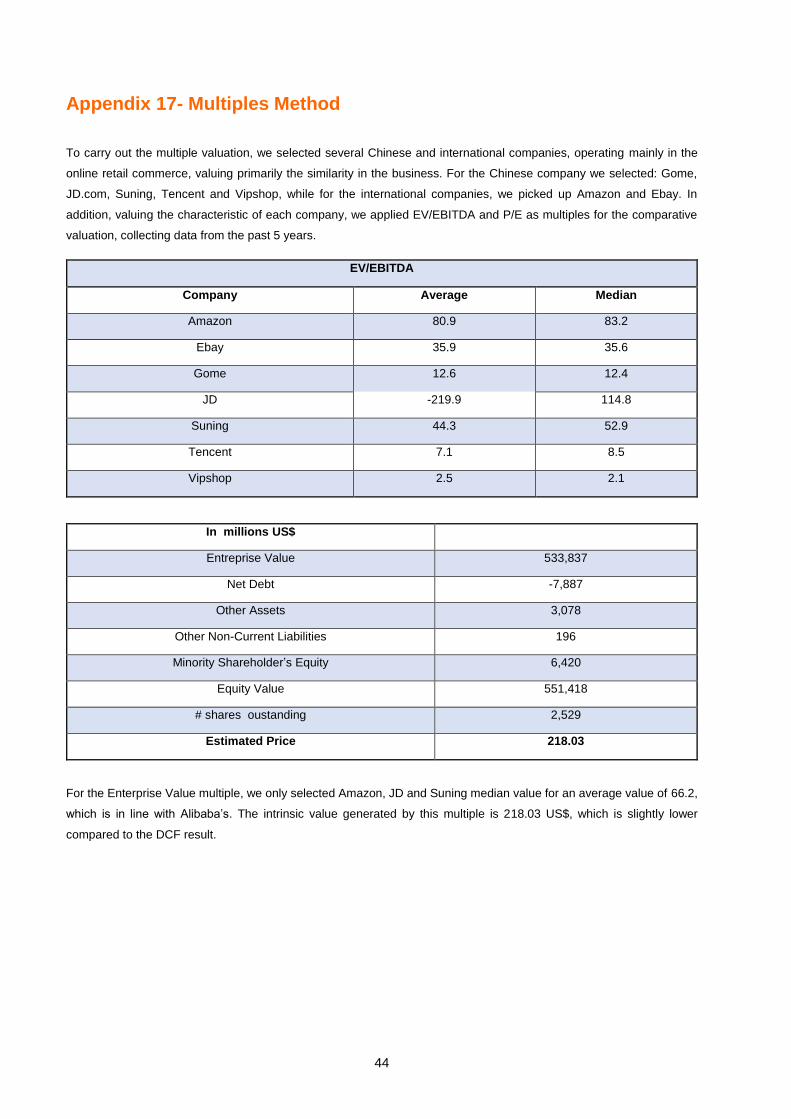
44
Appendix 17- Multiples Method
To carry out the multiple valuation, we selected several Chinese and international companies, operating mainly in the
online retail commerce, valuing primarily the similarity in the business. For the Chinese company we selected: Gome,
JD.com, Suning, Tencent and Vipshop, while for the international companies, we picked up Amazon and Ebay. In
addition, valuing the characteristic of each company, we applied EV/EBITDA and P/E as multiples for the comparative
valuation, collecting data from the past 5 years.
EV/EBITDA
Company Average Median
Amazon 80.9 83.2
Ebay 35.9 35.6
Gome 12.6 12.4
JD -219.9 114.8
Suning 44.3 52.9
Tencent 7.1 8.5
Vipshop 2.5 2.1
In millions US$
Entreprise Value 533,837
Net Debt -7,887
Other Assets 3,078
Other Non-Current Liabilities 196
Minority Shareholder’s Equity 6,420
Equity Value 551,418
# shares oustanding 2,529
Estimated Price 218.03
For the Enterprise Value multiple, we only selected Amazon, JD and Suning median value for an average value of 66.2,
which is in line with Alibaba’s. The intrinsic value generated by this multiple is 218.03 US$, which is slightly lower
compared to the DCF result.
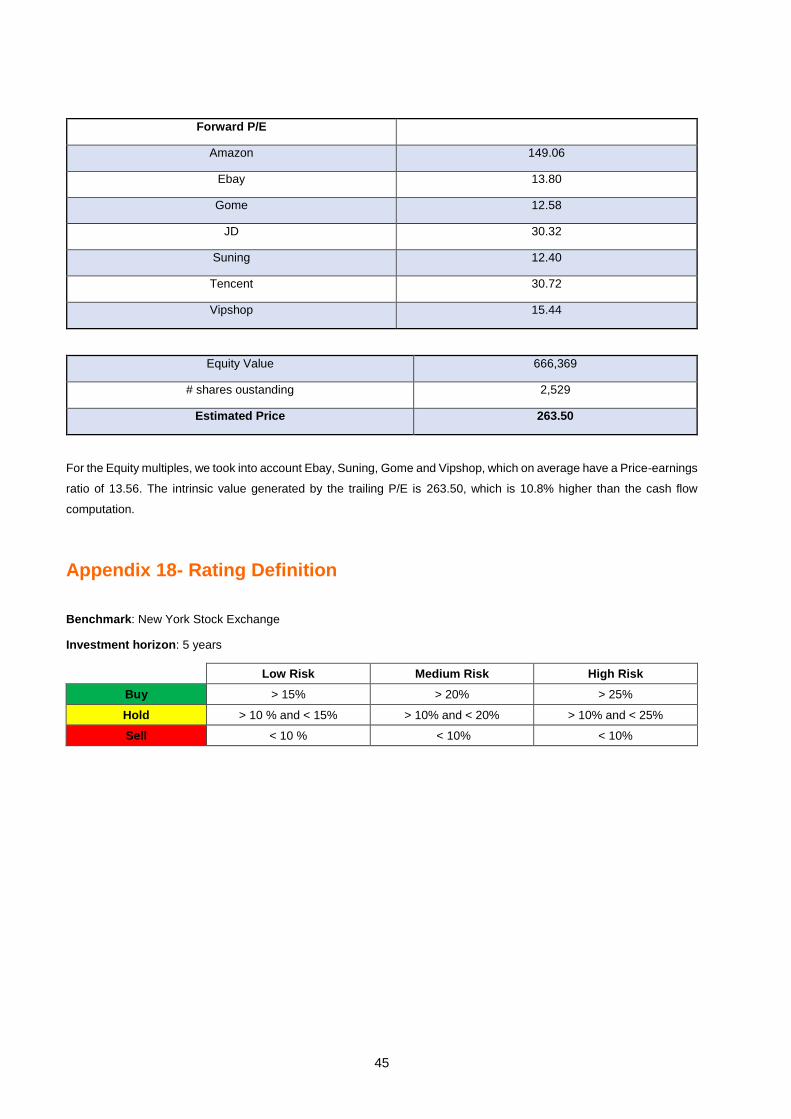
45
Forward P/E
Amazon 149.06
Ebay 13.80
Gome 12.58
JD 30.32
Suning 12.40
Tencent 30.72
Vipshop 15.44
Equity Value 666,369
# shares oustanding 2,529
Estimated Price 263.50
For the Equity multiples, we took into account Ebay, Suning, Gome and Vipshop, which on average have a Price-earnings
ratio of 13.56. The intrinsic value generated by the trailing P/E is 263.50, which is 10.8% higher than the cash flow
computation.
Appendix 18- Rating Definition
Benchmark: New York Stock Exchange
Investment horizon: 5 years
Low Risk Medium Risk High Risk
Buy > 15% > 20% > 25%
Hold > 10 % and < 15% > 10% and < 20% > 10% and < 25%
Sell < 10 % < 10% < 10%
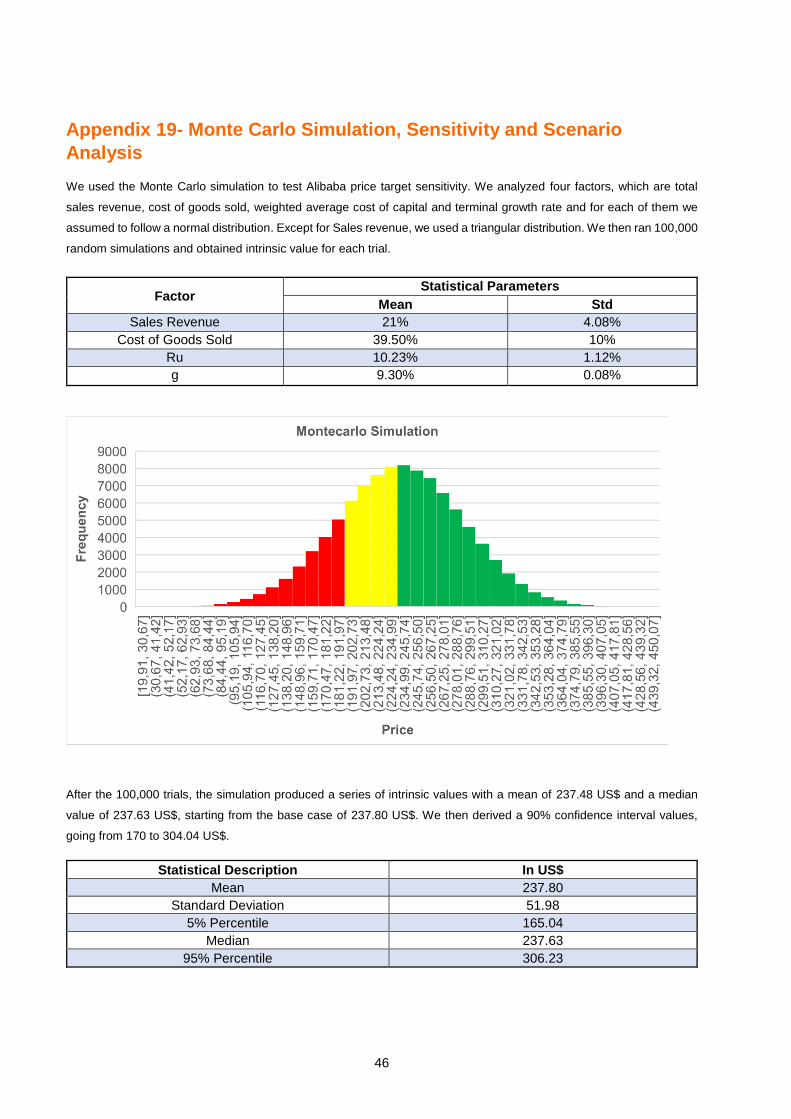
46
Appendix 19- Monte Carlo Simulation, Sensitivity and Scenario
Analysis
We used the Monte Carlo simulation to test Alibaba price target sensitivity. We analyzed four factors, which are total
sales revenue, cost of goods sold, weighted average cost of capital and terminal growth rate and for each of them we
assumed to follow a normal distribution. Except for Sales revenue, we used a triangular distribution. We then ran 100,000
random simulations and obtained intrinsic value for each trial.
Factor Statistical Parameters
Mean Std
Sales Revenue 21% 4.08%
Cost of Goods Sold 39.50% 10%
Ru 10.23% 1.12%
g 9.30% 0.08%
After the 100,000 trials, the simulation produced a series of intrinsic values with a mean of 237.48 US$ and a median
value of 237.63 US$, starting from the base case of 237.80 US$. We then derived a 90% confidence interval values,
going from 170 to 304.04 US$.
Statistical Description In US$
Mean 237.80
Standard Deviation 51.98
5% Percentile 165.04
Median 237.63
95% Percentile 306.23
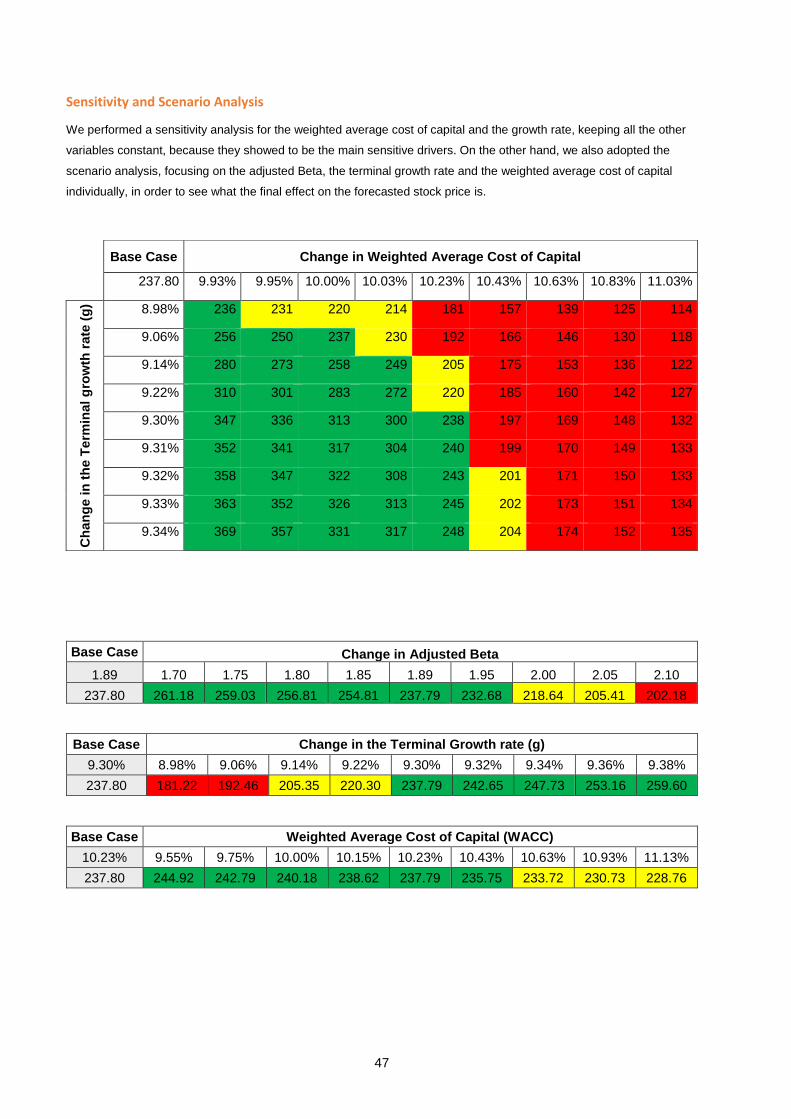
47
Sensitivity and Scenario Analysis
We performed a sensitivity analysis for the weighted average cost of capital and the growth rate, keeping all the other
variables constant, because they showed to be the main sensitive drivers. On the other hand, we also adopted the
scenario analysis, focusing on the adjusted Beta, the terminal growth rate and the weighted average cost of capital
individually, in order to see what the final effect on the forecasted stock price is.
Base Case Change in Adjusted Beta
1.89 1.70 1.75 1.80 1.85 1.89 1.95 2.00 2.05 2.10
237.80 261.18 259.03 256.81 254.81 237.79 232.68 218.64 205.41 202.18
Base Case Change in the Terminal Growth rate (g)
9.30% 8.98% 9.06% 9.14% 9.22% 9.30% 9.32% 9.34% 9.36% 9.38%
237.80 181.22 192.46 205.35 220.30 237.79 242.65 247.73 253.16 259.60
Base Case Weighted Average Cost of Capital (WACC)
10.23% 9.55% 9.75% 10.00% 10.15% 10.23% 10.43% 10.63% 10.93% 11.13%
237.80 244.92 242.79 240.18 238.62 237.79 235.75 233.72 230.73 228.76
Base Case Change in Weighted Average Cost of Capital
237.80 9.93% 9.95% 10.00% 10.03% 10.23% 10.43% 10.63% 10.83% 11.03%
Ch
an
ge in
th
e T
erm
inal
gro
wth
rate
(g
) 8.98% 236 231 220 214 181 157 139 125 114
9.06% 256 250 237 230 192 166 146 130 118
9.14% 280 273 258 249 205 175 153 136 122
9.22% 310 301 283 272 220 185 160 142 127
9.30% 347 336 313 300 238 197 169 148 132
9.31% 352 341 317 304 240 199 170 149 133
9.32% 358 347 322 308 243 201 171 150 133
9.33% 363 352 326 313 245 202 173 151 134
9.34% 369 357 331 317 248 204 174 152 135
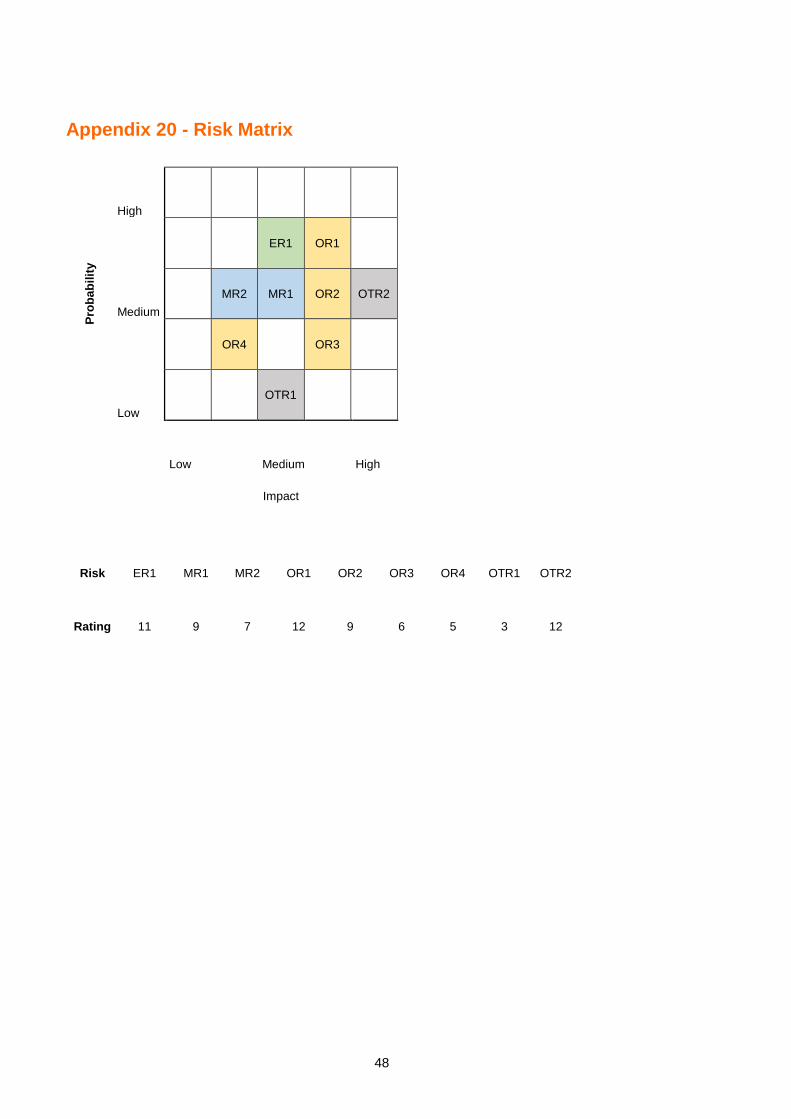
48
Appendix 20 - Risk Matrix
Pro
ba
bil
ity
High
ER1 OR1
Medium
MR2 MR1 OR2 OTR2
OR4 OR3
Low
OTR1
Low Medium High
Impact
Risk ER1 MR1 MR2 OR1 OR2 OR3 OR4 OTR1 OTR2
Rating 11 9 7 12 9 6 5 3 12

49
8. References Books
Berk, J., Demarzo, P. (2013). Corporate Finance, 3ª Ed. Boston: Pearson.
Damodaran, A. (1997). Corporate Finance- Theory and Pratice, 1ª Ed. John Wiley &
Sons. Damodaran, A. (2006). Valuation Approaches and Metrics: A Survey of the
Theory and Evidence, Stern School of Business: New York University.
Damodaran, A. (2012). Investment Valuation: Tools and Techniques for the determining
the value of any asset. 3ª Ed. Hoboken, New Jersey: John Wiley and Sons.
Defusco, R. A., Mcleavey, D. W. and Pinto, J. E. (2007). Quantitative Investment
Analysis. CFA Institute Investment Series, 2ª Ed. John Wiley & Sons.
Pinto, J. E., Henry, E., Robinson, T. R. and Stowe, J.D. (2010). Equity Asset Valuation,
CFA Institute Investment Series, 2ª Ed. John Wiley & Sons.
Articles
Blume E. Marshall (Mar. 1971). On the Assessment of Risk. The Journal of Finance Vol.
26, No1., 1-10.
Fernandez P. Bilan A. (2007). 110 Common Errors in Company Valuation. IESE
Business School. 1- 40.
Steven N. Kaplan, Richard S. Ruback (Sep. 1995). The Valuation of Cash Flow
Forecast: An Empirical Analysis. The Journal of Finance Vol. 50, Issue 4, 1059-1093.
Jonathan B. Berk, Jules H. Van Binsbergen (Jun. 2017). How Do Investors Compute the
Discounted Rate? They use the CAPM. Financial Analysts Journal. Vol 73, No. 2, 25-
32.
Jing Liu, Doron Nissim, Jacob Thomas (2007). Is Cash Flow king in Valuations?.
Financial Analysts Journal. Vol 63, No. 2, 56-69.
Investor Relations – Company Consolidated Reports
Alibaba Group Consolidated Annual Reports & Accounts from 2014 to 2017
Databases and Websites
Aswath Damodaran, http://pages.stern.nyu.edu/~adamodar/
Bloomberg Database

50
IMF World Economic Outlook April 2018 Database
Statista- https://www.statista.com/
Alibaba Group- https://www.alibabagroup.com/
OECD- https://www.oecd.org/china/
Deloitte- https://www2.deloitte.com/content/dam/Deloitte/cn/Documents/cip/deloitte-cn-cip-china-
online-retail-market-report-en-170123.pdf
McKinsey- https://www.mckinsey.com/featured-insights/asia-pacific/meet-the-chinese-consumer-of-
2020
iResearch- http://www.iresearchchina.com/
Euromonitor- https://www.euromonitor.com/
Yahoo Finance- https://finance.yahoo.com/
Related Documents