r Ii” AD A050 831 NAVAL AIR TEST CENTER PATUXENT RIVER MD FIG 14/2 ON IPVROVING THE FLIGHT FIDELITY OF OPERATIONAL FLIGHT/WEAPON S——€TC(U ~ OCT 75 N 0 HEWETT, R I GALLOWAY UNCLASSIFIED NATC—T* 75— ISA Pa. ri ~~~~~~ l .1!! EL urn H ____________

Welcome message from author
This document is posted to help you gain knowledge. Please leave a comment to let me know what you think about it! Share it to your friends and learn new things together.
Transcript
rIi” AD A050 831 NAVAL AIR TEST CENTER PATUXENT RIVER MD FIG 14/2
ON IPVROVING THE FLIGHT FIDELITY OF OPERATIONAL FLIGHT/WEAPON S——€ TC ( U~OCT 75 N 0 HEWETT, R I GALLOWAY
UNCLASSIFIED NATC—T* 75—ISA Pa.ri
~~~~~~ l
.1!!
EL urn
H ____________
i 4 TM 75I SA J
0
7ed~vieat 7 .uvcda.KON IMPROVING THE FLIGHT FIDELITY
OF OPERATIONAL FLIGHT~~~EAPON SYSTEM TRAINERS
by
~~~~~~) LJJ CDR M. D. Hewett/ u S
Mr. R. T. Galloway, Jr.
Strike Aircraft Test DirectorateI 1~
lOctober 1975
~~~NT OPzp Approved for public relea.e;distribution unlimited.
.
~~ 1~JJ * _ _ _ _ _ _ _ _ _ _ _ _ _ _ _ _ _ _ _ _ _ _ _ _ _ _ _ _ _
S NAVAL AIR TEST CENTERTE~t PATUXENT RIVER, MARYLAND
— — - --
UNCLASSIFIEDECURITY C&. AS$IFICATION 0’ THIS PAGE (II’Aan Data Irn.v.d)
__________________________________
~ It’ REPORT DOCUMENTATION PAGE BEFORE COMPLETING FORMr— -—— ~~~~~~~~~~ ~~~~~~~~ 2. GOVT ACCESS ION NO 3. RECIPiENT’S C A T A L O G NUMB ER
INA 11 ~~M’~54’6A ~ff _ _ _ _ _ _ _ _ _ _ _ _ _ _ _ _4. TITLE (and SubUfi.) ‘1 5. TYP E OF REPORT & PERIOD COVERED
.QN..,~ IPROVING THELLIGHT~ JDELITY OF ~~~~~~~~~~~~~~~~~~~~~~~~~~~~~~~~~~~~~~~~~~~~ MIIMRER
ATIONAL~~LlGF1t~~EAP~ N YSTEM~~~AINERS~ TM 75- 1 SA7. AUTHOR(s) S. CONTRACT OR GRANT NUMBER(S)
I ILEWETT _ _ _ _ _ _ _ _ _\t. ~~~~~~~~~~~~~~
TI~ ALLOWAY~JRr I NA
9. PEt L~~~ .IU I I ~~~aJr 1~~ NMaa.4D ADDR ESS tO. TA SIC
NAVAL AIR TEST CENTERNAVAL AIR STAT IONPATUX ENT RIVE R, MARYLAND 20670 ~~~~~. NA
I I . CONIROLL INGOFFICE NAME AND A DDRESS I I ~SPECIAL PROJECTSGROUP j f 7gC i •75STRIKE AIRCRAFT TESTDIRECTORA TE iPATUXENT RIVER , MARYLAND 20670 1 L.L ~i I
14. MONITORING AGENCY NAME & AODRESSOI dill. ,.nI Iron. Controlling Oif.c-s) 15. SECURITY f ~~o f IPt ic rI~oj
UNCLASSIFIED15. OI~CLAS S IFI~~A TION ~~~~~~~~~~~~~~SCi~ E JUL E
NA _______ __________
IA. DISTRIBUTION STATEMENT (of this Report)
I~~~~~~~~~~B N ~~~~A T M ~~~T~~~V t h . L~r~~~~~~~~~~ i~~~~’i ~~~~
.
‘
.
Ia SUPPLEMENTARY NOTES ~ ~~~~
IS, KEY WORDS (Continue on reverse side if necessary and id.ntify by block number)
SIMULATOR PARAM ETEROPERATION A L FLIGHT TRAINER STABILI TY DERIV ATIVEW EAPON SYSTEM TRAINER IDENTIFICATION
‘, FIDELITY IMPROVEMENT\ SOFTWARE
to ABSTRACT (Continue on rover., side If nscess.r~ and identity by block numb.,)
A team approach utilizing the complementary talents and expertise of Naval test pilots, flight testengineers, computer specialists, and simulator specialists from various Naval field activities has beeneffective in improving the flight fidelity of existing Operational Flight Trainers and Weapon SystemTrainers and in guiding contractors in providing the best fidelity possible in new flight simulators.The paper discusses this team approach and presents the results obtained in several programs.
DD , ~~~~~~ 1473 EDITION OF I NOV $S IS OBSOLETE UNCLASSIFIED
,~~ ~1_ ~~~
7
~~~~.)~~~~~CURITY CLASSI F ICATION OF THIS PAGE (Wt,efl Data Entered ) /
. - ~~~~~~~. -., -. -- .—.-.--- — -- -, —.~-— ~~~~~~~~~~~~~~~~~ ;,~~~. ~~~~~~~~~~

r ~~~~~I .~ .. ~ ~~~S~I~ IF’CA?IOW OF THIS PAOE~~~ an Data Ent.rod)
I
S I
I SECUmITY CL*SSPFPCAT ION OF THIS PAGE(1~ ,,,, Data ~nt.ppdt
_ _ _ _ _ _ _ _ _ ~~~~~~~~~~~~~~~~~~~~~~~~~~~~~~~~
rV
TM 75- 1 SA
FPREFACE
This Technical Memorandum contains a paper which will be submitted to the joint FlightMechanics Panel/Guidance and Control Panel Symposium on “Flight SimulationlGuidanceSystems Simulation.” The conference is to be held in The Hague, Nether lands, on 20 - 24 ,-October 1975. An abstract of the paper was submitted and accepted by the TechnicalProgram Committee on 21 February 1975. The paper will be presented by CDR M. D.Hewett (primary author) in Session 1V at 1400 on Tuesday, 21 October 1975.
A
~~
R
~~~EL
LEAS
RADM F. T. B ROW NCOMMANDERNAVAL AIR TEST CENTER
---~1~~~~~~~~~~~ .~TT .
t3
IUS~ ~‘ ~~~~~~~ -.
~~~~~ ~~ . .
SI~C~P”.
~~~~~~~~~~~~~
- -. —— - - -— r .~~~~~~~~~~r~~~~~~~- ~~~~~ .~~ -—-~~-—- -- - -.--
TM 75-1 SA
TABLE OF CONTENTSSc
PREFACE
TABLE OF CONTENTS ii
SUMMARY 1
SYMBOLS 2
INTRODUCTION 3
CONVENTIONAL TEST METHODS 5
ADVANCED TEST METHODS 12
CONCLUSIONS 13
REFERENCES 14
TAB LES 15
FIGURES 20
DISTRIBUTION 25
~~_~~~~~~~~~~~~~~~~~~~~~~~~
_ W~~~~~~~~~~~~
_ . ~~~~~~~~~~~~~ rwfl.- - - - .~~~~-~ ~~~~~~~
_ .~~~~~
. ~~~~~~~~~~~~~~~
---~~- -
TM 75- 1 SA
ON IMPROVING THE FLIGHT FIDELITYOF OPERATIONAL FLIGHT/WEAPON SYSTEM TRAINERS
CDR Marie D. Hewett USN Mr. R. Thomas GallowaySpecial Projects Officer Aerospace EngineerStrike Aircraft Test Directorate Special Projects BranchNaval Air Test Center Strike Aircraft Test DirectoratePatuxent River, Md. 20670 Naval Air Test CenterUSA Patuxent River , Md. 20670
USA
SUMMARY
A team approach utilizing the complementary talents and expertiseof Naval test pilots, flight test engineers, computer specialists, andsimulator specialists from various Naval field activities has been ef-fective in improving the flight fidelity of existing Operational FlightTrainers and Weapon System Trainers and in guiding contractors in pro—vidirtg the best fidelity possible in new flight simulators. The paperdiscusses this team approach and presents the results obtained in severalprograms.
The team uses conventional flight test techniques to quantify theparameters necessary to describe the flying qualities and performance ofthe simulator and the airplane. From this comparative data the flightfidelity deficiencies of the simulator are quantitatively identified .The software of the simulator (and in rare instances the hardware) isthen modified by an iterative process until the flying qualities ofthe simulator match those of the airplane. The paper discusses this pro-cess of matching flying qualities by conventional flight test techniquesin detail.
In addition, recent advances in the field of parameter identifica—tion are discussed as applied to the extraction of stability derivativesfrom flight test data. An advanced state—of—the—art max imum likelihoodestimation algorithm is now operational at the Naval Air Test Center.This algorithm can and is being used in several active programs to pro—vide an accurate flying qualities and performance data base for a givenairplane.
1
r
TM 75-1SA
SYMBOLS
drag coefficient Subscripts
CL lift coefficient n natural
CM pitching moment coeff icient d damped
C~ yawing moment coefficient
C1 rolling moment coef ficient
CM pitching moment derivative(x)yawing moment derivative
(x)Cl( ) rolling moment derivative
Cy (x) side force derivative
p roll rate
q pitch rate
r yaw rate
lateral control deflection
longitudinal control deflection
directional control deflection
normal acceleration
S wing area
u true airspeed
w gross weight
k a constant
angle of attack
8 sideslip
6 control deflection
damping ratio
p air density
frequency
2
~~~~~~~~~~~~~~~~~~~~~~~~~~~~~~~~~~~~~~~~~~~~~~~~~~~~~~~~~~~~~~~~~~~~~~~~~~~~~~~~~~~~~~~~~~~~~~~~~~~~~~~~~~~~~~~~~
INTRODUCTION
The U. S. Navy uses Operational Flight Trainers (OFT) and WeaponSystem Trainers (WST) to train pilots in today’s complicated andexpensive aircraft weapon systems. Over the years these devices haveacquired a dismal reputation for faithful simulation of a given airplane’sf lying qualities. As a result the training value of these simulatorshas been less than optimal. In many cases this lack of faithfulflying qualities simulation has reduced the role of these expensivedevices to that of procedures trainers for instrument flight andemergency conditions vice that for which they were designed: completeoperational flight and weapon system training.
This degraded training value could be tolerated by the Navy aslong as enough airplanes, fuel, and money were available to train andmaintain proficiency with actual flight time. However, the energycrisis, increased aircraft operating costs, and austere budgeting havemade actual flight time an expensive commodity. Because of thesefactors increased emphasis has been placed on the use of simulatorsfor training and proficiency. In fact, the Chief of Naval Operationshas issued instructions (reference (1)) that Naval Aviators participatingin the Proficiency Flying Program may substitute 10% (10 hours) oftheir total annual minimum flight time requirement with 12 hours ormore of simulator time on a certified OFT or WST. The instructionfurther states that “as additional simulators become available andmore is learned on the ‘transfer of learning’ gained through the useof simulation, the program will be expanded.” With this ever increasingemphasis on the use of simulators for training and proficiency and thegrowing need to actually substitute simulator time for flight time, wehave found it absolutely necessary to bring our full technical resourcesto bear on the problem of providing the best flight simulation possiblewithin given cost constraints.
Another factor which has highlighted the need for faithfui flyingqualities simulation in Operational Flight and Weapons System Trainersis the addition of visual display systems. Carrier and field landings,aerobatics , weapons delivery, and a multitude of other mission relatedtasks can now be simulated with visual systems . The addition of suchsystems, however , tends to magnify the flying qualities and perfor-mance discrepancies of the basic simulator. Recently , a visual displaysystem was added to one cockpit of a 2F90 Device at the Naval AirStation, Kingsvill e, Texas. It was quickly found that simulatedcarrier and field landings and bombing runs with the visual displayhad relatively little training value for student pilots because thesimulation of the real TA—4J airplane flying qualities was so poor.
3
_ ~~~~~~~~~~~~~~~~~~~~~~~~~~~~~~~~~~~~~~~~~~~~~~~~~~~~~~~~~~~~~~~~~~~~~~~~~~~~~~~~~~~~~~~~~~~~~~~~~~~~~~~~~~~~~~
_ _ _ _ _ _ _ _ _ _ _ _ _ _ _ _
TM 75- 1 SA
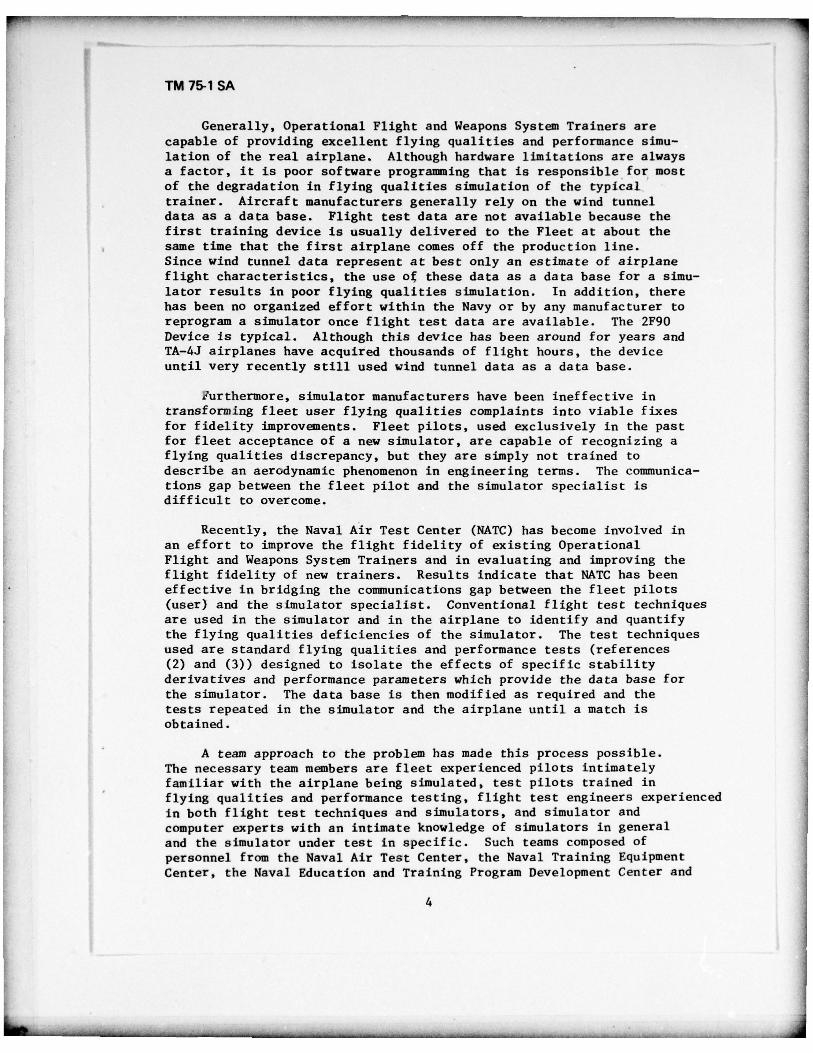
Generally, Operational Flight and Weapons System Trainers arecapable of providing excellent flying qualities and performance siinu—lation of the real airplane. Although hardware limitations are alwaysa factor, it is poor software programming that is responsible for mostof the degradation in flying qualities simulation of the typicaltrainer. Aircraft manufacturers generally rely on the wind tunneldata as a data base. Flight test data are not available because thefirst training device is usually delivered to the Fleet at about thesame time that the first airplane comes off the production line.Since wind tunnel data represent at best only an estimate of airplaneflight characteristics, the use o~ these data as a data base for a simu-lator results in poor flying qualities simulation. In addition , therehas been no organized effort within the Navy or by any manufacturer toreprogram a simulator once flight test data are available. The 2F90Device is typical. Although this device has been around for years andTA—4J airplanes have acquired thousands of flight hours, the deviceuntil very recently still used wind tunnel data as a data base.
2urthermore, simulator manufacturers have been ineffective intransforming fleet user flying qualities complaints into viable fixesfor fidelity improvements. Fleet pilots, used exclusively in the pastfor fleet acceptance of a new simulator, are capable of recognizing af lying qualities discrepancy, but they are simply not trained todescribe an aerodynamic phenomenon in engineering terms. The comrnunica—t ions gap between the fleet pilot and the simulator specialist isdifficult to overcome.
Recently, the Naval Air Test Center (NATC) has become involved inan effort to improve the flight fidelity of existing OperationalFlight and Weapons System Trainers and in evaluating and improving theflight fidelity of new trainers. Results indicate that NATC has beeneffective in bridging the communications gap between the fleet pilots(user) and the simulator specialist. Conventional flight test techniquesare used in the simulator and in the airplane to identify and quantifythe flying qualities deficiencies of the simulator. The test techniquesused are standard flying qualities and performance tests (references(2) and (3)) designed to isolate the effects of specific stabilityderivatives and performance parameters which provide the data base forthe simulator. The data base is then modified as required and thetests repeated in the simulator and the airplane until a match isobtained .
A team approach to the problem has made this process possible.The necessary team members are fleet experienced pilots intimatelyfamiliar with the airplane being simulated , test pilots trained inflying qualities and performance testing, flight test engineers experiencedin both flight test techniques and simulators, and simulator andcomputer experts with an intimate knowledge of simulators in generaland the simulator under test in specific . Such team s composed ofpersonnel from the Naval Air Test Center, the Naval Training EquipmentCenter, the Naval Education and Training Program Development Center and
4
_ _ _ _ _ _ _ _ _ _ _ _ _ _ _ _ _
TM 75-1 SA
the Naval Air Training Command have been successful in significantly im—proving the flight fidelity of the 2F90 Device which simulates the TA—4Jairplane and the new 2FlOl Device which simulates the T—2 airplane bothused by the Naval Air Training Command .
Recent advances in the field of parameter identification as appliedto flight test have significantly improved the process of extractingstability derivatives from flight time history responses to certaincontrol inputs. The identification algorithm used at the Naval Air TestCenter is based on a maximum likelihood estimation scheme which includesa rank deficient solution , and the capacity to handle both instrumentationand process noise. The algorithm has direct application to simulationflight fidelity because a far more accurate and complete data base canbe provided from flight test data than was ever possible in the past.The process is expected to have a significant impact on simulator sof t—ware programming.
This paper describes the ongoing programs at the Naval Air TestCenter to improve the flight fidelity of operational flight trainersusing both conventional flight tests and advanced systems identificationtechniques. Conventional test techniques will be described as to theexact flight tests used , their order of application and the iterativeprocess of optimizing the software package of a given simulator for goodflight fidelity . The parameter identification program will be discussedand results obtained from flight tests will be presented. The appli-cation and extrapolation of parameter identification techniques to im-prove simulator flight fidelity will be outlined .
CONVENTIONAL TEST METHODS
General
The conventional flight test techniques used to identify and quan-tify the flight fidelity discrepancies of a given OFT or WST are describedin this section. These conventional test methods are the standardperformance, stability, and control flight tests methods used to testnew aircraft for flying qualities and performance specification compliance.They are described in detail in references (2) and (3). It is possiblewith these methods to isolate the effects of a number of the stabilityderivatives and coefficients required to complete the mathematicalmodel used in the simulator software to model the motion of the simu-lated airplane. The effects of many other important coefficients andderivatives on the response of the simulation to control inputs cannotbe isolated by a specific test. In most of these cases, however, aniterative technique can be devised consisting of a series of testsperformed in a specific order to determine the individual contributionof each parameter to the response of the simulator. In this techniquethe concept is not to calculate specific values of each derivative orparameter but rather to use an identical series of tests in the simulatorand airplane to match the output or response of the simulator to controlinputs by adjusting these parameters. This technique is iterative inall cases except those in which certain tests can be used to isolate
5
~
TM 75-1 SA
specific parameters. The i terat ive technique amounts to an output errormethod in terms of mathematical optimization theory. Of course, as inany optimization technique an initial guess of all parameters must bemade at each flight condition to start the iterative procedure. Wesimply use those values present in the simulation at the beginning ofthe flight fidelity improvement program.
There are two basic categories of tests to be performed in bothsimulator and airplane. First, performance tests are conducted toquantify aircraft and simulator thrust and drag characteristics. Theidea in performance testing is to determine the various coefficients inthe lift and drag equations of motion. That is, we must determine liftand drag coefficients as functions of Mach number and angle of attack ,contributions to drag and lift of all functional devices such as landinggear, speed brakes, flaps, etc., engine thrust characteristics, and soon. The second basic category is stability and control testing. Thepurpose of stability and control testing is to determine the variouscoefficients and parametcrs in the three moment equations of motion ;roll, pitch and yaw.
Performance Tests
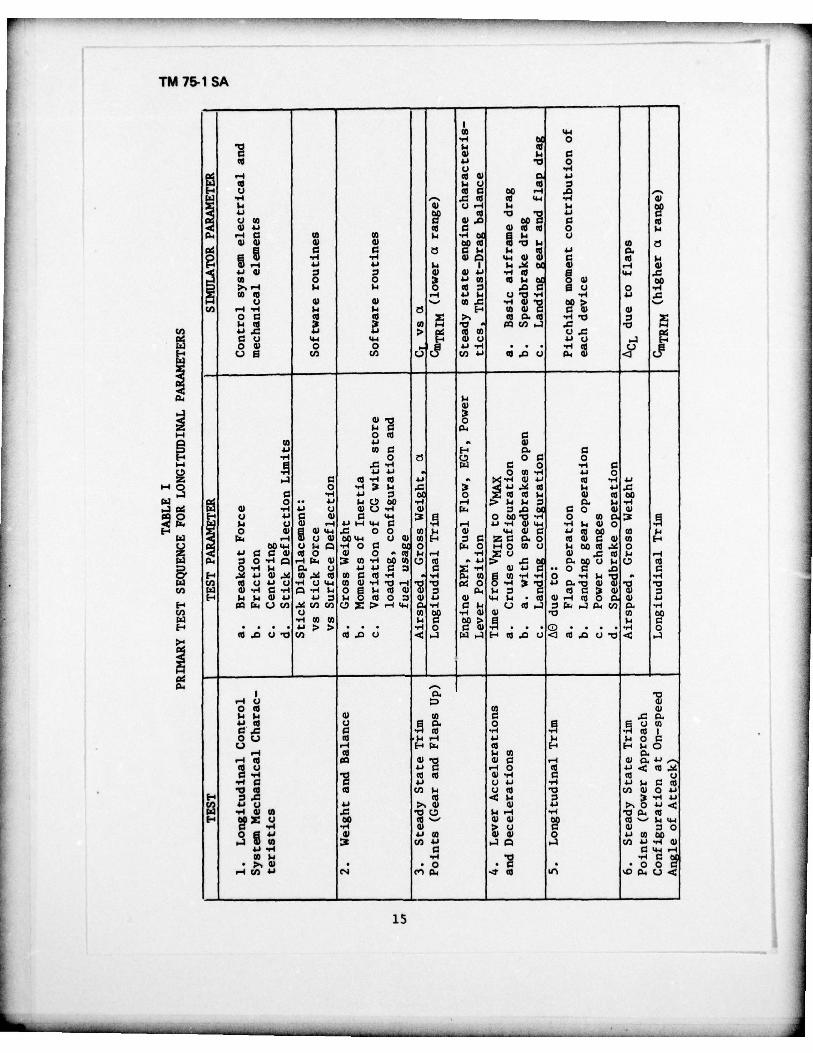
The performance tests used to quantify thrust and drag characteris-tics are shown in table I, Items 3, 4 and 6. The proper order of testsis also indicated . The test methods used in performance work are describedin detail in reference (2).
Steady state trim points are obtained throughout the flight envelopefor speed/power relationships. At each stabilized trim point we recordairspeed, altitude, engine parameters, angle of attack, power leverangle, aircraft attitude and gross weight. Since installed enginethrust is generally known as a function of airspeed and altitude, thesesteady state trim points can be used to establish or to verify drag
• polar information (basic drag and lift coefficients (CL and CD) as a• function of Mach number and angle of attack) in the simulator software.
Repeating the trim points in all aerodynamic configurations such aslanding gear down, flaps down, speed brakes deployed , etc., it is pos-sible to determine the contributions to lift and drag of each device.
Timed level accelerations, level decelerations, and timed climbsand descents can then be used to further refine and verify thrust, lift,and drag relationships.
Another important area in performance not listed in table I isengine acceleration and deceleration characteristics. Timed engineresponse Is obtained and matched by altering the engine model if neces-sary.
Of course, all of these performance tests are performed throughoutthe flight envelope in both simulator and airplane in all configurations.The process of incorporating software fixes as a result of these testsin the lift and drag equations of motion is iterative since certain
6
---- -•- ~~-— - - ----- ---—- •— —- — -,- .-- -- —-• a- - -•--~~~~~~ ••. _____~•___. — —-- —— -—~~~~~~~~~~
—~ ---- ----~ -.—- .- -~ -- • .• •~~~~~~~~~~~~~~~~~~ - - --• -- .~~~~~~~
TM 75- 1 SA
terms interact. For example, a change to the basic lift coefficientaffects the drag coefficient through the drag polar.
An Interesting performance fidelity problem arose in the 2F90 programwhich illustrates the degree of sophistication required of the mathemati-cal model to accurately simulate aircraft performance characteristicsand the d i f f i c u l t i e s encountered in translating a f idel i ty discrepancyto a software program fix. Pilots complained that simulator response tothrottle changes in the power approach configuration , in particular , wasnot realistic. The simulated airplane tended to float as power wasreduced and was not as responsive as the airplane to power addition.Engine and thrust acceleration and deceleration data failed to show adiscrepancy between simu~ator and airplane. Steady state thrust anddrag relationships obtained from trim points in the power approachconfiguration had already been corrected and matched well. The problemwas with aircraft transient response to throttle changes. After muchinvestigation, it was discovered that ram drag was not incorporated as aseparate term in the drag equation. Rain drag has a substantial effect
• on aircraft transient response to power changes due to the increase inram drag during engine decelerations from intake air spillage and viceversa. The incorporation of this term tailored by qualitative pilotopinion solved the aircraft response problem in the power approachconfiguration.
Stab ility and Control Tests
For flying qualities or stability and control work, the testing isdivided into two categories: longitudinal flying qualities and lateral—directional flying qualities. This is, of course, a natural break sincethe linearized pitching moment equation is decoupled from the yawing androlling moment equations. Stability and control test methods are dis—
• cussed in reference (3).
First, longitudinal flying qualities test methods will be considered .The tests used to isolate longitudinal flying qualities fidelity def I—ciencies are given in table I along with the previously discussed per-formance tests. The first step Is to perform static tests on the mechani-cal characteristics of the longitudinal control system . This is thestarting point for flying qualities testing . Breakout forces, dead—bands, static force versus deflection, full throw forces and deflections,control centering characteristics, friction levels, freeplay, viscouseffects, trim rates, and so forth, are measured and matched betweensimulator and airplane.
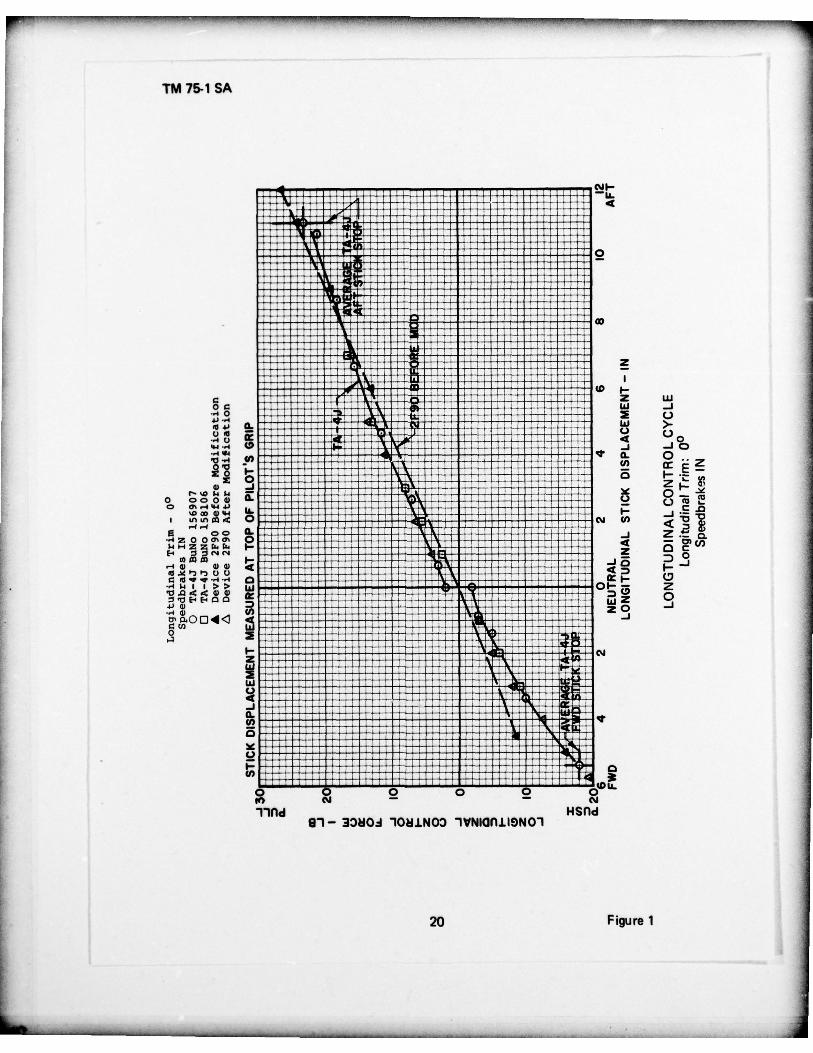
In the 2F90 and 2FlOl fidelity improvement programs a hardware changewas made in the area of mechanical characteristics of the longitudinaland lateral—directional control systems. Diodes were added in the analogforce circuitry to simulate breakout forces. In the 2F90 Deivce, germaniumdiodes with cut—in voltages of approximately 0.1 volts were suitable forlongitudinal and lateral control system breakout simulation whereas sili-con diodes with a cut—in voltage of 0.7 volts were more suitable for direc-tional control system breakout. In figure 1 the effect of the addition7
r -
TM 75-i SA
of breakou t diodes is shown in the longitudinal control system of the2F90 Device .
On the 2F90 and 2F101 f ideli ty improv ement programs hand heldinstrumentation and pilot recorded data was used for flying qualitiestesting and found to be adequate. Force gages, a three second stopwatch, tape measures and the like typified the instrumentation used. Ona new airplane and simulator an instrumented airplane Is available forflying qualities and performance work and would be used to gather flightdata for the simulator .
Having matched the static control system mechanical characteristics,we now turn to “in flight” tests. The pitching moment contribution ofvarious aerodynamic devices such as flaps, landing gear, speed brakes,etc. can be determined by performing longitudinal open loop trim changes.After stabilizing the airplane or simulitor at a given trim point in theflight envelope, a time history of the open loop pitch angle change fromtrim is recorded with actuation or deactuation of the various devices.A match is obtained between simulator and airplane by adjusting thepitching moment coefficient of the device in question until acceptabletime history matches are obtained.
The next test is designed to isolate the effects of the importantstability derivative C~~, the rate of change of pitching moment withangle of attack. Prom theoretical analysis (reference (3)) it can beshown that
(1)
where w~ is the longitudinal short period natural frequency. This is avery approximate t~nlation but is sufficient as a starting point. Shortperiod natural frequency can be estimated at a given flight condition byobserving the open loop pitch response to a pitch doublet designed toexcite the short period mode of motion or by a frequency response testsuch as observing the pitch response of the airplane to sinusoidalcontrol pumps of varying frequency. The derivative C~~ is consideredcorrect in the simulator software if airplane and simulator short periodresponses match when using the same type input in each vehicle.
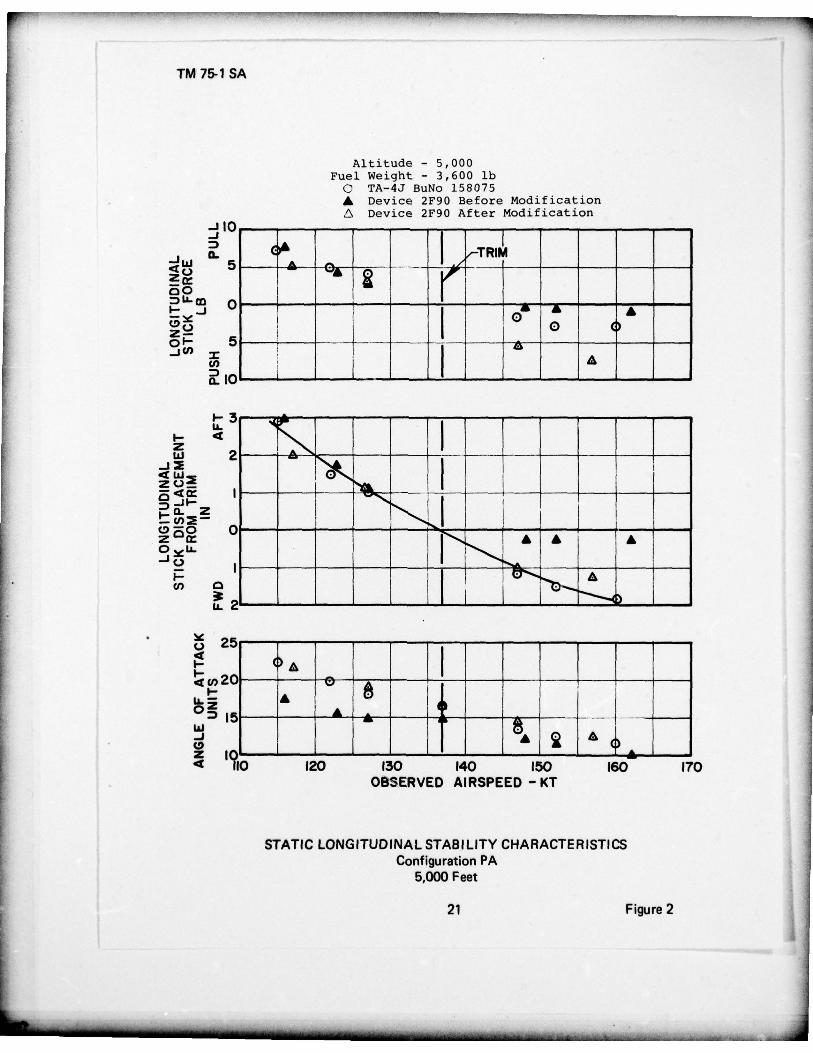
The next test yields indications of the longitudinal static stabi-lity of the airplane and simulator, and is used to determine longitudinalcontrol position and force from trim versus airspeed about a trim point.The test method is described in reference (3). Figure 2 shows an example
— from the 2F90 program. The trim points are as shown. The circles repre-sent airplane data . The shaded triangles represent the 2F90 OFT beforemodification. The open triangles represent the 2F90 after modification.From theoretical analysis it can be shown (reference (3)) that thestability derivatives that have the most effect on these control forceand deflection gradients are ~~~ and CM6e~
the rate of change of pitchingmoment with elevator deflection. Since C~~ has been determined from
• short period r esults, the static longitudinal stability test results can
L __ 8
_ _ _ _ _ _ _ _ _ _ _ _ —•- - - - - -~~ - - -~~~~~~
- - -
TM 75—1 SA
be matched between simulator and airplane by varying CM6e By alsorecording angle of attack data during the static longitudinal stabilitytests it Is possible to obtain a f i rs t cut at C~~ , l i f t curve slope.Figure 2 shows this angle of attack — airspeed gradient from a testpoint in the 2F90 program.
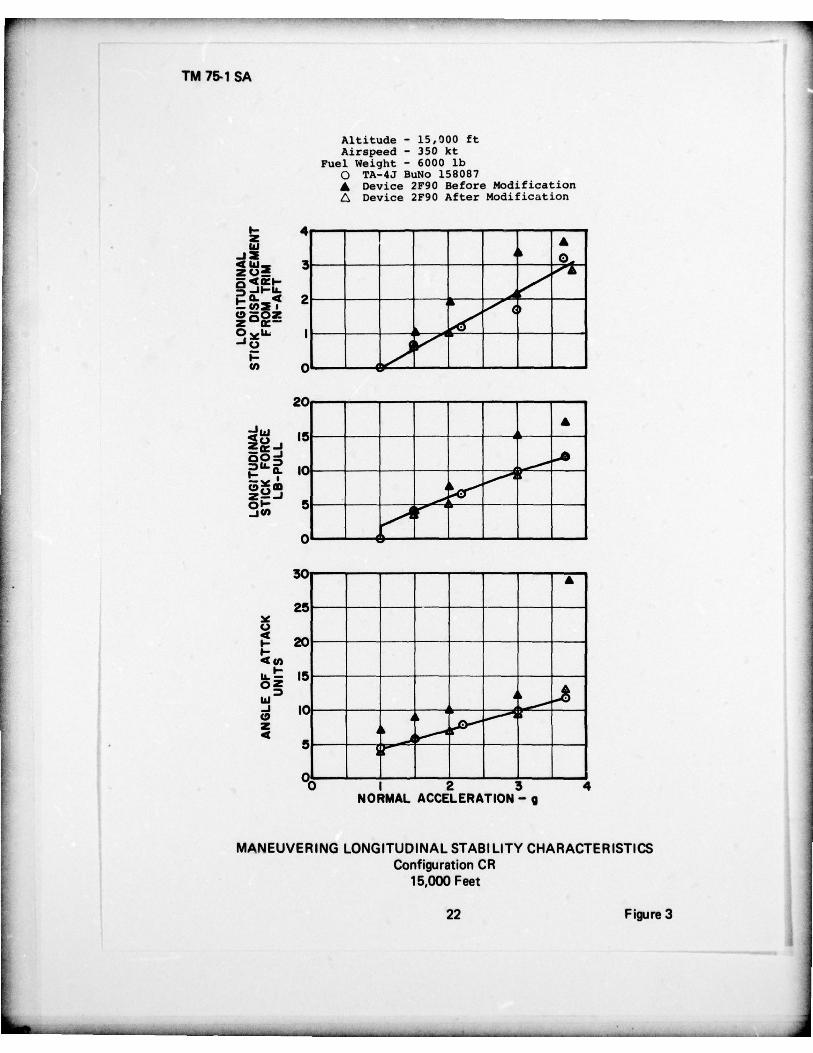
The next test listed in table I involves maneuvering longitudinalstability. The test method is described in detail in reference (3) .The objective is to obtain the following gradients from a number of trimpoints throughou t the flight envelope:
1) longitudinal control forces vs normal acceleration,
2) longitudinal control displacement vs normal acceleration,
3) angle of attack vs normal acceleration.
These gradients are all obtained at constant airspeed. Figure 3 is anexample f rom the 2F90 program . From theoretical analysis (reference (3))it can be shown tha t the rate of change of longitudinal control forceand displacement with normal acceleration- are a func t ion primarily ofthe stability der ivatives C~~ , CM6e~ and CM~ , the rate of change ofpitching moment with pitch rate, and bobweight effects. Since C~~ andCM6e have been adjusted at a given trim point by previous tests, the pri-mary derivative to be adjusted to match maneuvering stability results isC~~ . The l i f t curve slope , C~~ , can be further refined by matching thedata collected in f igure 3.
In order to obtain a good match of longitudinal flying qualitiesbetween simulator and airplane the entire sequence of tests listed intable I must be iterated a number of times and of course all tests must
• be performed throughout the flight envelope of the airplane.
The next test is a determination and match of aircraft stall andpost stall characteristics. In tactical fighter and attack aircraft anaccurate simulation of this area of flight is extremely desirable. Sincethis area cannot be modeled by linear equations of motion to any satis-factory degree and since nonlinear programming is costly in terms ofboth computation time and memory requirements, the degree of simulationrequired in this area is a critical decision early in the design stagesof the simulator . We have found that with a minimum of effort andexpense it is possible to provid e acceptable stall characteristics witha moderate number of logic routines and adjustments .to aerodynamiccoefficients in the linearized equations of motion at high angles ofattack. For example , in the 2F90 program a logic routine was added tosimulate wing rock and consisted of a sinusoidal roll function withamplitude increasing with increasing angle of attack commencing at 19units . In addition , CMMsIc was increased at stall angles of attackeffectively decreasing elevator control which provided an oscillatingmotion in pitch above stall that was very representative of the air—plane .
9
~
-- - --~~~-~~ - - - - -
_ -- --- - - - -~~~~~~~•--~~~~~~~~~~~~~~~~~~~~~~~~~~~~~~~~~~~~~~~ - - - ••
TM 75—1 SA
Other miscellaneous longitudinal f l y ing qualities tests includeinvestigations of phugoid frequency and damping , takeoff and land ingcharacteristics (ground effects) , transonic effects , and so on.
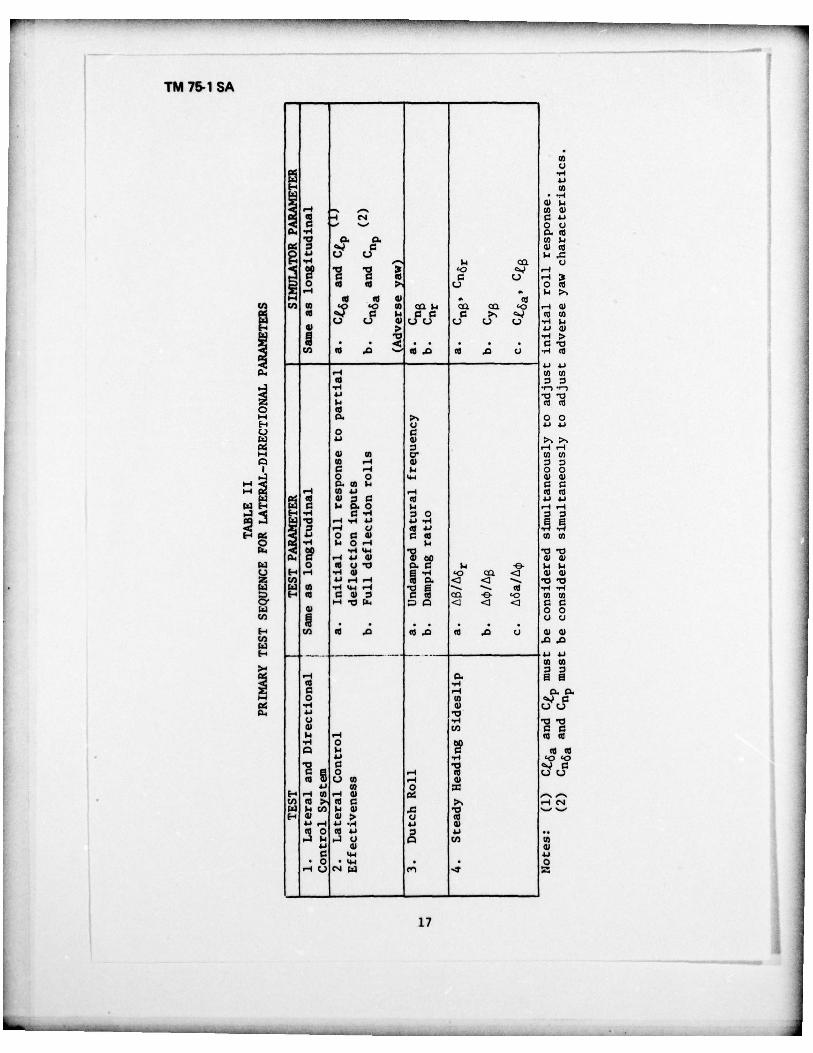
Lateral—directional f lying qualities tests methods will now beconsidered . The tests used to isolate lateral—directional f ly ing quali-ties fidelity deficiencies are given in table II. The f i rs t step is toperform static tests on the mechanical characteristics of the lateral(aileron) and directiona l (rudder) control system. As with the longi-tudinal controls, breakout forces, deadbands, static forces versus de-flection, full throw forces and deflections, control centering charac-teristics, friction levels, f reeplay , viscous effects, trim rates, etc.are measured and matched between simulator and airplane.
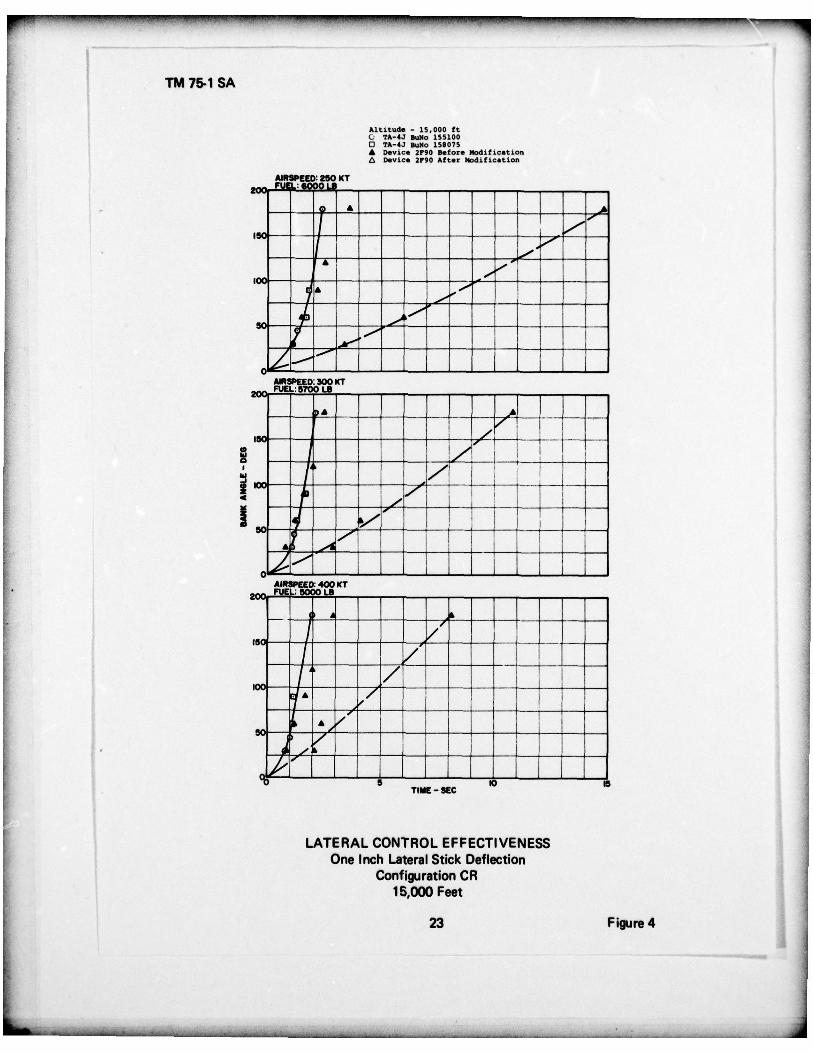
Nex t, lateral control effectiveness is evaluated with lateralcontrol rolls performed throughout the flight envelope. The most effec—tive test technique found was to observe the roll and yaw response ofthe airplane and simulator to a lateral control step input performed bythe pilot. In tactical aircraft with high roll rates it is desirable torestrict the step size to reduce roll rates to within accurately measurablelimits. On the 2F90 program a stick restriction jig was used to limitlateral stick displacement to one inch (2.54 cm.) while performing thesetests. Bank angle time histories were then generated by recording timesto given changes in bank angle. Representative results from the 2F90program are given in figure 4. The important stability derivativesCZOap aileron power, and C e1,, roll damping, have the most pronouncedeffects on the results of these teats and can be used to match simulatorand airplane roll rates. Before modification the 2F90 device exhibitedextr~ nely slow roll response for all one inch stick deflection tests asshown in figure 4. For example, in the simulator time to roll 180° at250 kt in configuration CR was 14.8 sec vice 2.4 sec for the airplane.However, roll response to full stick inputs closely matched published
- - flight test data. The slow roll response of the simulator was attributedto a software routine that modified the true commanded aileron deflectionby the relation:
oaf ( ó ) 2 (2)
where 6a is true aileron deflection and 6a~ is the modified ailerondeflection applied to the roll moment equation. The value 40 representsfull aileron deflection (total differential between left and right stir—faces) in degrees. This relation had been installed by the simulatormanufacturer in response to fleet user complaints that Device 2F90 wastoo sensitive laterally. Prior to NATC involvement, another effort hadbeen made to make Device 2F90 lateral response more realistic when usingthe visual display. The Oa~ relation was removed and a small dead zonearound neutral stick deflection was installed in the software routinethat calculated true aileron deflection as a function of lateral stickdeflection. This modification caused severe lateral PlO problems in the
~
- - -~ - - - - -~~~~~
• ~~~~~~~~~~~~~~~~~~~~~~~~~~~~~~~~~~~~~~~~~~~~~~~~~~~~~~~~~~~~~~ --~~~~~~~~~ -•- - •--~~~~~~~~~~~~~~~~~~ • •~~~~~~~~~~~~ - -~~ ~~~~~~~ - •~~~ •~~~~~~~~~~~~~ -
TM 75—1 SA
simulator that were uncharacteristic of the airplane especially duringhigh gain, closed loop tasks such as maintaining lineup during field andcarrier approaches when using the visual display .
In order to match simulator response to the airplane the 6a~relation and the deadzone were discarded . Adjustments were made to thevalues of aileron effectiveness, Ceoa, and roll damping, C~ ,, until aproper match was obtained by quantitative and qualitative analysis.Qualitative analysis through such tasks as turn reversals, instrumentpatterns, and approaches (using the visual display) was used to guidethe adjustment process.
The next tests to be performed are the dynamic lateral—directionalstability tests; specifically the determination of the Dutch roll modefrequency and damping. From these tests the derivatives CNR, the rateof change of yawing moment with sideslip, and CNr , the yaw äampingderivative can be determined (reference (3)).
Steady heading sideslip tests (reference (3)) can then be used todetermine CNOr, rudder power , Cr8, dihedral effect, and Cy8, the sideforce derivative.
Testing Peripheral Equipment for Flight Fidelity
After all major flying qualities and performance discrepancies areeiiminated in the fixed base simulation, the motion base is added andevaluated. Items to be evaluated include acceleration cues in arldegrees of freedom simulated, aerodynamic stall buffet and transonicbuffet simulation.
Again the experience gained on the 2F90 program is instructive.The buffet provided to simulate aerodynamic stall through the motionsystem was unsatisfactory in three respects. First, the buffet was ml -
• tiated at 20 units AOA regardless of the type stall encountered. Inessence, accelerated stall buffet, which is a function of Mach numberand angle of attack was not simulated. This was considered a majordiscrepancy since buffet onset is used by the pilot in most aerobaticand mission related visual maneuvers to gain optimum performance fromthe airplane. Second, the amplitude of the buffet at onset was high,simulating the heavy buffet associated with deep stall. In the airplane,buffet at onset is light in maneuvering flight and increases in amplitudewith increasing angle of attack. Third, the frequency of the buffet waslow (10 Hertz) and constant; again typical of deep stall buffet. Thelight buffet eu ountered in the airplane in maneuvering flight is ofmuch higher frequency. In summary, ig stall buffet was well simulatedwhereas accelerated stall buffet was not simulated. Data on buffetonset, amplitude and frequency were obtained from the airplane. Usingthese data as a basis, a function was added to the software to providebuffet onset as a function of angle of attack and Mach number. A secondfunction was added to the software to provide a different variablebuffet amplitude routine as a function of angle of attack after onsetfor the accelerated stall case. The final problem was buffet frequency.
11
- -~~~~~ -~~~• ~~~~~~~~~~~~~~~~~~~~~~~~~~~~~~~~~~~~~~~~~~~~~~~~~~~~~~~~~~~~~~~~~~~~~~~
TM 75-1 SA
Frequency limitations of the hydraulic motion system precluded increasingthe frequency of the buffet to simulate the high frequency light buffe tencountered in accelerated stalls. Thus no change was made to buffetfrequency.
The next stage in the flight fidelity improvement program is to addthe visual display to the basic simulator in the fixed base mode ofoperation if provided . In the 2F90 device the addition of the visualdisplay system allows pilot training to be conducted in VFR flight.Closed loop VFR flying tasks made possible by the addition of the visualdisplay include field landings and takeoffs, carrier landings and takeoffs,scored bombing, formation flight, aerobatics, and familiarization flying.The Computer Generated Image (CCI) display was not evaluated per se.The purpose of the flight fidelity improvement effort was to improve theflight dynamics of the simulator so that the simulator with the visualdisplay added could be used for VFR training. The visual display on the2F90 device was evaluated qualitatively by a test pilot using closedloop mission tasks to compare airplane and simulator performance andflying qualities. Many ref inements to the various stability derivativesand parameters in the mathematical model were made as a result of thesetests. In particular the ram drag trim addition referred to previouslyih the performance section of this paper originated during closed loopevaluations of the visual display in the landing mission.
Fidelity Improvement Program
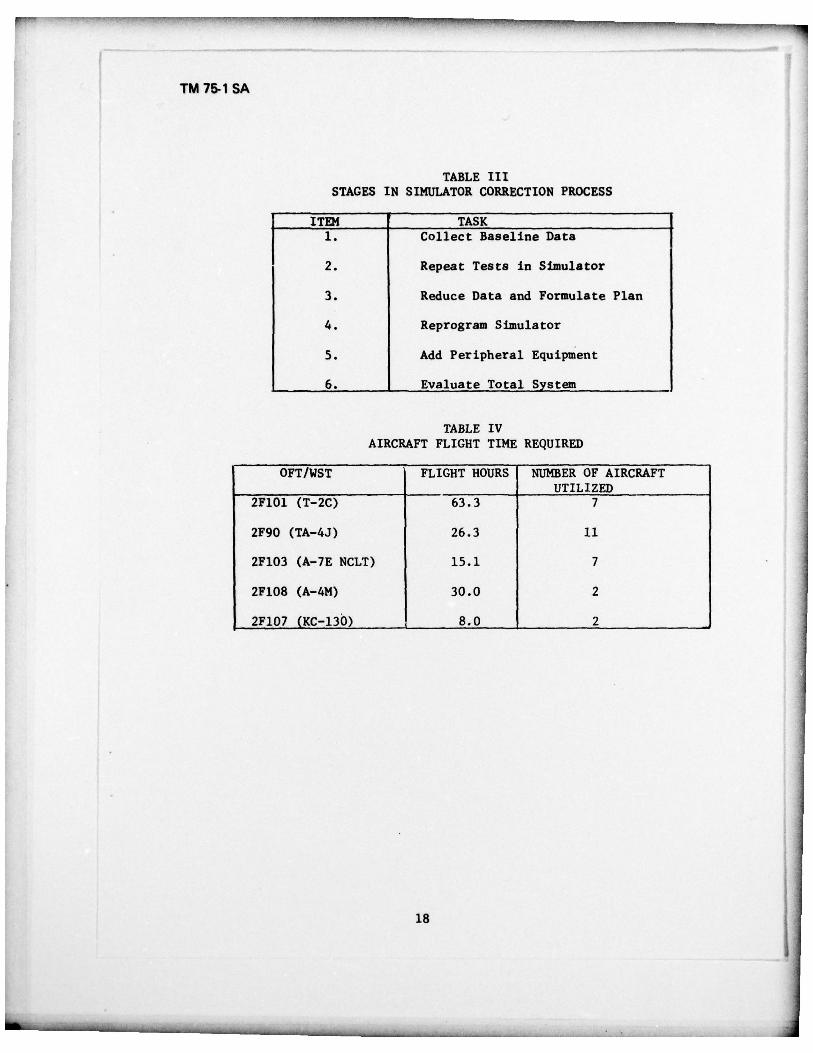
A flight fidelity improvement program is best conducted in stagesas indicated in table III. First, one must collect baseline data in theairplane. It is important to use more than one airplane to gather thisdata. Differences between airplanes are sometimes significant. Thetests are repeated in the simulator. Data reduction and the formulationof a plan of action for fidelity improvement follows. One then startsthe iterative reprogramming process.
An important aspect of the flight fidelity improvement programs wehave conducted was the continuous refamiliarization required by thepilots in the airplane. It is estimated that eight hours of simulatortime is sufficient to destroy a pilot’s familiarity with the airplane tothe point that he can no longer make valid qualitative ju4gements Onflying qualities during closed loop tests. Table IV presents a summaryof the actual flight time flown by test pilots in support of the variousfidelity improvement programs embarked upon by NATC.
ADVANCED TEST METHODS
The application of conventional test methods to simulator fidelityimprovement have been considered above. Let us now address advancedmethods. Specifically, the application of digital parameter identif i—cation methods to obtain the coefficients and stability derivatives fromflight test data will be discussed . As was mentioned before, this is notan easy task. All the services, the National Aeronautics and Space Ad—
12
_ _ _ _ _ _ _ _ _ _ _ _ _ _ _ _ _ _ _ _ _ ------ -~~~ -~~~
r
TM 75-1 SA
ministration, and industry have done a great deal of research in this area.The effort at the Naval Air Test Center is combined with Systems Control,Incorporated (Sd ) at Palo Alto, California, and the Office of NavalResearch. SCI has delivered a very powerful advanced algorithm recently
• which is being used In a number of programs at this time. The algorithmemploys a maximum likelihood estimation scheme to extract stabilityderivatives from flight test data in the presence of measurement noiseas well as process noise. The theory and program are presented in detailin references (4) and (5) along with flight test results obtained todate.
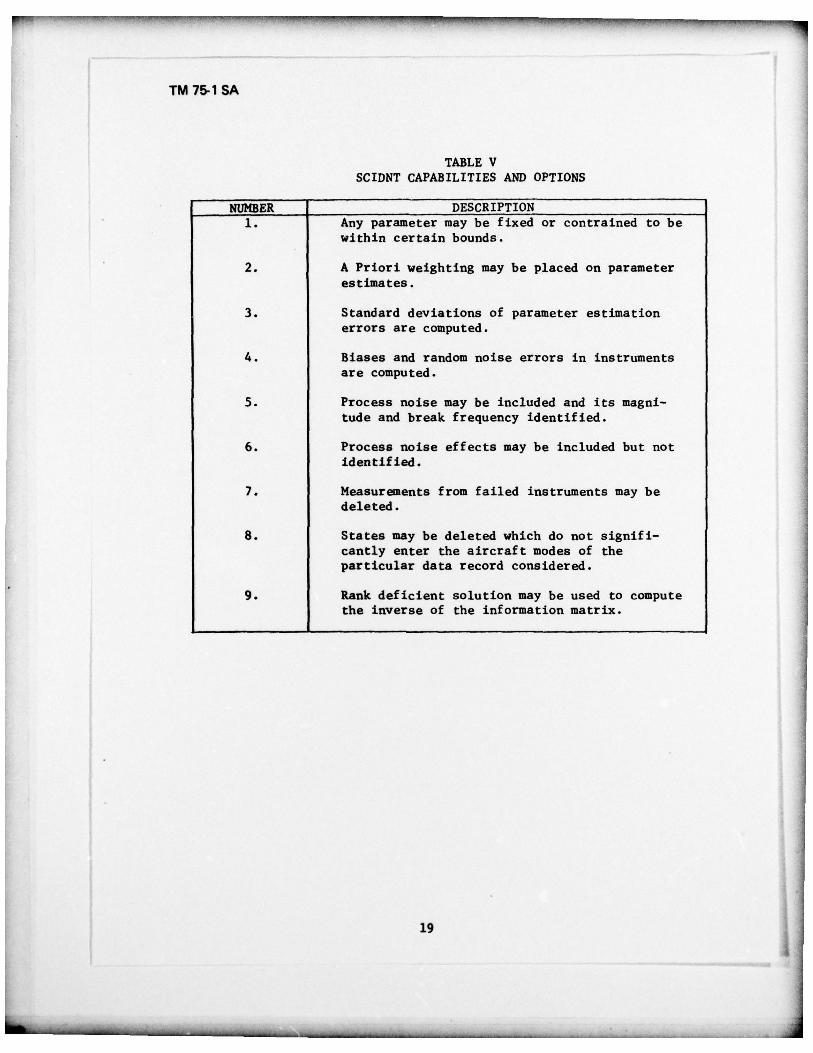
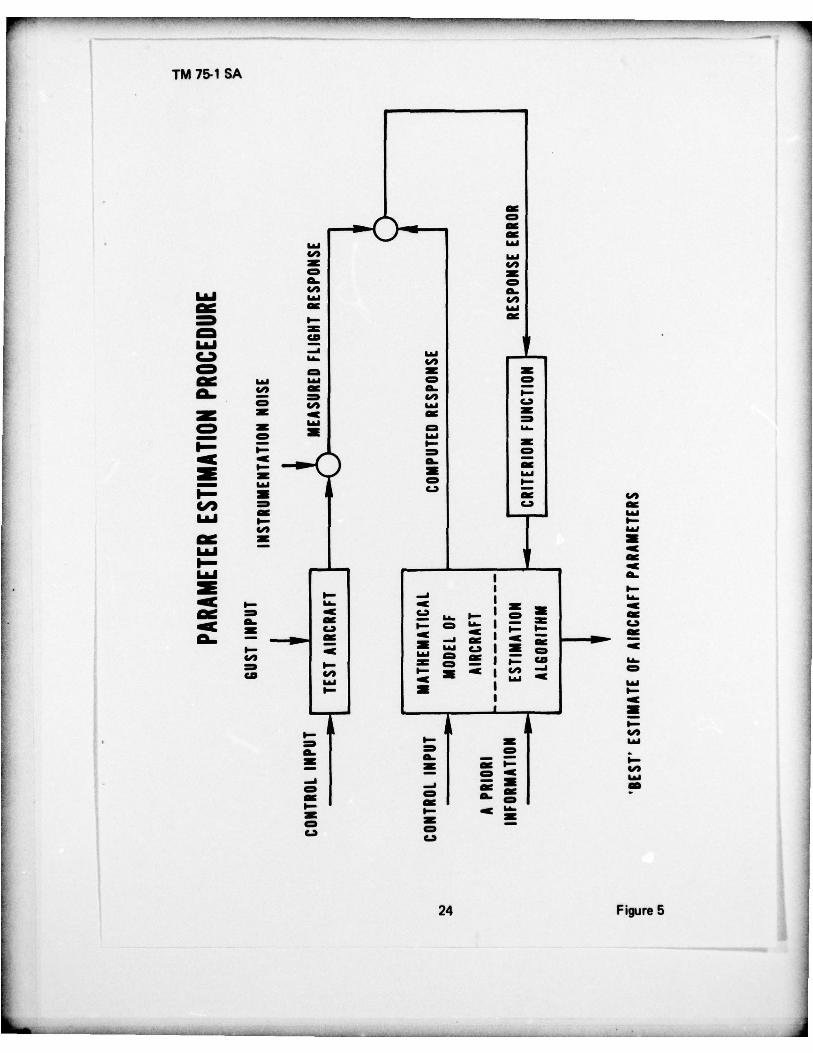
Basically the program can be descr ibed by figure 5. An appropriatelyinstrumented airplane is given a control input. The airplane responds.That response is contaminated by instrument noise and process noise. A.mathematical model of the aircraf t, using the equations of motion and aninitial guess f or the aircraf t coeff icients, is given the same input.The model response is compared to the contaminated aircraft response anda response error is generated. A criterion function is formed (responseerror squared is a good one) and this criterion function is minimized byan optimization algorithm; in this case a maximum likelihood estimator.The lower loop in the figure is iterated until a “best” estimate of air-craft parameters is obtained. The algorithm also generates the statisticsof both the measurement and process noise. The advantage of this programfor simulator applications is that we are able to obtain the aircraftcoefficients throughout the flight envelope very accurately and extremelyfast. Basic SCIDNT options are presented in reference (4) and are shownin table V.
This program is now operational at NATC and has significantlyincreased our capability to analyze flight data to obtain stabilityderivatives for use in a mathematical model in a simulator. The algorithm
• has been used successfully on several flight test programs but has not asyet been used specifically on a simulator flight fidelity improvement
• program.
CONCLUSIONS
In this paper the application of conventional fight test techniquesto the improvement of the flight fidelity of operational flight - andweapon system trainers has been discussed. Examples from flight f idelityimprovement programs conducted on a number of devices has been presented.In these programs it was discovered that the primary culprit in flightfidelity was inadequate and incorrect computer software programmingcaused by the inadequacy of the data base used to formulate the softwarepackage. The application of the conventional test methods discussedherein features the use of actual flight data to tailor simulator responsesby incorporation software fixes in the device. Fidelity improvementprograms using these techniques have been successful.
The application of advanced test methods has also been discussed.Recent advances in the practical applications of control and estimation
13
-
~
- - -
~
~~• -- ~~~~~~~~~~~~~~~~~~~~~~~~~~~~~~~~~~~~~~~~~~~
- - —~~~~—•- - - - •~~-- •~~~• ---- •~ --_~---~~•-—--,-. -- , — —.- ,—~~~ •- - - - -“-,~~~~
---- -~~~~~~--- - - - -~~
-~~~~~~
-, --
TM 75-1 SA
theory have made it possible to extract stability derivatives and otherparameters from flight test data to a degree and with accuracy notpossible in the past.
It is generally agreed that the training obtainable from a simulatordepends to a great extent on the state of mind of the trainee; specifically,his opinions of the fidelity of the simulation. Obviously, we cannotgive him everything. Simulators cost a lot of money. What we can do isgive him the best simulation possible within the limits of the hardwarewe can afford to buy. Software optimization takes time, team work, andcommitment. The results are well worth the effort.
REFERENCES
1. Chief of Naval Operations Instruction 3710.7G, CH—1 of 15 May 1973,Chapter X, General Instructions on Duty Involving Flying and AnnualReadiness/Proficiency Requirements.
2. U. S. Naval Test Pilot School Fixed Wing Performance Manual of28 July 1972, U. S. Naval Air Test Center, Patuxent River, Md., USA.
3. U. S. Naval Test Pilot School Fixed Wing Stability and Control Manual- ‘of 1 January 1975, U. S. Naval Air Test Center, Patuxent River, Md.,USA.
4. Burton, R. A., Advancement in Parameter Identification and AircraftPlight Testing, Paper 15, AGARD Conference Proceedings No. 172 onMethods for Aircraf t State and Parameter Identification, May 1975.
5. Stepner, D. E. and Mehra, R. K., NASA Contractor Report CR—2200,Maximum Likelihood Identification and Optimal Input Design for Iden—
• tifying Aircraft Stability and Control Derivatives, March 1973.
14
—~~~~~ ‘~~~- - -~~~~~~‘~~~ - ~~~~~~~~~~~~ ~~~~~~~~~~~~~~~~~~~~~~~~~~~~~~~~~~~~~~~~
TM 75-1 SA
S “4.,. I ~ 00 $4 415 41 1~41 ‘4 0
0 .r4~~ ‘.4 4 1 4 1 0 1.400 41 1 40 41• 14 U 4 1 4 1 00 ‘-4 ~000 ~P4 .541 (5 ..4 4)X Ii 4) Q~~-I 14 14< 4.4 00 41 ~
1.4~~ U S 41 w . s 0041 41 45.41 5) 4.4 (5 41 4 ) 4 5 4 5 Q 14~ 4 r-4 41 41 41 14 ‘.4~~~ 5 14 U
4 1 41 4) 4) 0041 ( 5 0 1 4 0B 41 41 41 14 l~ 15 1-~ 5.o s w .p4 4)~~~ ‘ 4 . 4 4 ) 0 ~ 1.~$.4 5) i-.I 4.~ 4.4 14 I I. .~ 0 4) ‘-4 4)
.41 4 . 4 4 ) 5 4) 4) 1 . 4 . _ I Ø 5 ~1-I .41,.~ 41 0 0 ~ ‘441 (5 1 4 0 04) 00~~ )~.‘-I 14 14 0 4 5 5 .5~~~ 5 0 0 .rIZ (0 45 —4 4.’ 14 0 41 4.4 .54-4 U 4) 4) —‘ 4 1 . 5 •,l 41~~0 0 0 >U) i-I~~ -4 14 14 E-4 0 4 1 4 1 4 1 5 1 41
0 4 1 41 (5 ( 5 5 . 4 1 .,.4 .41 5• 1 4 4 1 03 ~~~~~~~~ .41• In 4 . 4 . 5 ‘4 ‘4 4 5 4 1 0 . 5
41 0 ‘4.4 ~~ 4 ) 0 ‘ 4 000 05) 0 0 1.4 ._I . . . ._I
Cl) Cl) C.) ( l )u (5 .0 0 ~~
04 1441
0Z 1 4 4 1 044-I 0 ( 5 41
tO ‘4 - 41.1.4 0 ) 4 1 I-~ 5. 41
E-4 0 ~~ 0 4 1 0B .41~~r4 00 41 0 —4 41
‘~ 0Z 41 (5.,.I (5 4.4 )< - , . 4 W ’ 4 (5
4-4 0 0 ._I~~~~~ $4 .5 ~4 14J~~~~~ 45 $4 “ . 5i-I 41 ‘4 5 4 0 X ( 5 4 1 $ 4 41 4 1 0 0
00 0 . • ‘4 ) 4 C.D 0O ._I r4 5.00 41 -~4 4 J W O - , 4 5 .0 4 4 1 0 4 1 0 )
~~~0 1-4 U ‘ 4 4 1 4) 41 41.4 ~~~ B O 0 0~~~~-4 0 S 4 ~~~~.4104 $4 14 0 41 ..-4 4.4 4-4 4.4 41 ~~ .-4 1.4 ._I 41 4.~
.,.4 14 4) 0I- ’ Z 0 4 1 5 4 1 9. 4.5 0 0 0 ) 1 4 4) 9 . 4 4 ) 4 1 ‘ 4 ( 5 0 0 0) 1.4
00 04 ‘ . 4 5 ) 0 4 1 0 044-4 0 4 ) 0 ) 1 - i 5 4 1 Z 4 1 O . . 0 ( 5 4 1 4 1 4 ) 4 1 I-i0 U 1 4~~~~r 4 0 4 1 0 0
Z < 1 . 44 1 5 4) 4 1 0 41 0 41$4’ .4 •r4~~~~~t) 41 . 5 4 1 1 4 ‘-400 D~ 5 O _ I~~~~ , - 4 0 4 4 13 4 1 . r 400 41~~~~~41 ~~~~~~~ .4 1 4 0 . 0 0 U i iC.) 41
~00 tn 4 1 u ’ 4 0~~~~~0~~~~~ 0 ) W 0_ 4 ~~~~
,~ ~~~0 ’ 4 .~4 ) W W ~~~Cl) 00 W -rI 41 -’-4~~~~ -r4 $ 4 0 5 $ 4 ( 5 0~~ W 5 04 14 5 41 5
$-4 $ 4 1 4 4 1 1 . 4 1J 5 $.4 0 (5 0~~~~~ W U 41 4.414 . (5 W , - 4 4 1 0 4 4) ‘400 0 4 o 0 0 .~~ 00 cn (D Z~~~~.-4 ’14 4 ._l 41 1 4 ) ( 5~~~~ 5 0 4 ,~~04 0 0 5 . ._ICl) U (1) 00 ._4 W O) 0) 0000 ._4 0) 41 $ 4 4 1 b0~~~~ B 1-i 411-4 . .. ~~~~~~~~~~ .. . -ri o ~~~~ ~~ 0
1 5 .0 0 .41 ,~ 00..~~E-~~4 1 . 0 U~~~~ 4 1 . 0 U~~0.41 ,.~
~~ ii’.
+—
I ~~~Ui
N .~~~41 In
15
- --—-
~
•--
~
- - -- - - —— —-- --—-• -- --•- -~ — ••———~~~~ - - - - - -~~

_ _ - __
TM 75.1 SA
1.4(5(4Ii
- a)4.4 1.4 1.4 -)41 41 - 4)41 41
._I ._I 4 1 0-u -~~ $ 4 1 5(5 (5 1 5 4 . 41.4 14 5 .4 .4
00 -411.4
41 0 4 1 41 44.40 0(J .,.4 51.4 0 ( 4r4 - .r4 5 4 )
41 0) 41 0 ) 1 . 4‘-0 0 ‘0 0 . 5 0 0 4B 5 5 . 0 4 1 1 . .
C) C.) ._4 ‘4<.41- 0 - 0~~~ < 0.5
~~ ._I ~ ._I.5 d X ‘ 4 0S ‘ 4 0~~~~ ..~C.) C) 0 0 1 . ) 1 1) 0 0 0 C.) 0 4 . 5
‘-4IiI
5 (5 4.4 4.4‘4 41 1.4 41 1.1 41--4 41 41 41 4)
-~~ a) -‘-4 41 ‘4 Co‘4 0 -rI 4 J 4 1 —4 4.4 -41 00
~~ 4 1 4 1 .41 41 45 ‘41.4 (5 4 ) 1 4 (5 4) Ii 4.45) 14 r 4 U ) $4 ‘4 00 (45. 00 00 -ri
‘4 41 1 4 0 41 14 U 4) 4)14 0 0 ( 5 0 00 ‘5 5. 1-~— 0 ~rI 1.4 ‘4 4.4 41 000 4.4 4) 4.4 4.4 4) 4.4 14 (5.41 (0 ‘4 0 .41 -_I 0 .41 Si-I 14I-i 14 (4 14 45 (5‘ 4 10 0 04.4 0 0 ‘4.4 .54 ) 4 1 5. ‘e~~~0 5. 4.4 0 B C)5.41 55 5 .~~~W .)~ .~4 4.~ B15 0’ 0 0 ~.-l U U ~4 ‘4
~u w .ri -‘4 04 _I -rI 00 41 (54 1 1 4 1.4 4 . 4 41 4.4 4.4 41 ~i~4 1.4
~~~4.i 00 0 0< 00 Cl) ~~ >~ Cl)
I11 11 )00 ‘4 5
1 4_ I04 ‘4 4 1 1 5
41 C U S5 . _I ‘414 .r4 5 1.4 1J w-uQ 1 J Q4 41 rI 4 1 5 15
. 4 1 4 1 ‘4 .-I ‘4Cfl 1J .~~~Cl) ’4 U)‘ 4 0 .0U~ r4 IS
.~~~~~4.I .‘4 • 0 0
- ~~-_ -- -,-•-- ••~~~~~~- ••-- -—--~ -
~~~~~~~~~~~~~~~~~~~~~~~~~~~~~~ ~~~~~~~~~~~~~~~~~~~~~~~~~~~~~~~~~~~~~~~~~~~~~~~~~~~~~~~~~~
TM 75-1 SA
(1)U
-‘-44.4. - ~~414.1
0) 5)~~~41 4 N< 4 1 - 0 05 4, 4 5 . 1 5.45 5. 5. 0 ) 1 4
41 4 1 ( 5
0 45 45 0 - 0 ( 5‘-4
I ~~~~~I II
~~~~ ‘.4 . ~~~ 4J.41 ~~~5 ‘4 0 4 1 4 . 4I-4~~~ ~~~~‘4 0 4 1 5 ) 4 1 ( 5 (4 ( 4
0 ~~~ ‘4 1 40 _ I 1404 4 1 0 0 ‘4 41-’ -u -u -u
A4~~~ .-4 ’4 4) 4; 4 ) 4 )00 0 4 5 0 4 1 1, -0. 14 14C.) 1-4 —4 -‘-4 44 B - _ I ‘0 ~~ ‘1 4) 4)Z U) ‘4 .-I .-4 4 5 5 . .
~~~ S -45 -45
00 01 (4 -,-4 4.~~.-4 ‘41 S (5~~ ~4 4 5 415) 5 4 1 ( 5 ~~ 0 ‘0 0 ) 0 )0’ -4-4104 ~~~~ <3 <3 <3 4 1 4 100 4) 0 0Cl) . . . . 0 0
I-I CI) 45 .0 (5.0 (5 .0 U 0 ) 4 )Cl) .0 .0001-4 ~~~~~~~~ — — _- -.— ‘-‘ ‘4
0 ) 0 )>4 5 50. 5 515 --4
41 ‘4 5. 5.0 (I)-‘4 5) 01.)
54 ‘4U ‘44) CI) 4 1 4 11.4 ‘4 (5 41‘4 0 00~~ 44 1 5 4 5
1.’ ‘4 ‘O’O-41 41 .454 1 5 0 u-I (0 0 0( 5 5 ) 0 0 ) ‘4 4)
4.4 03 0
.41 ‘451-4 4) 4)~~~ U 15
4.4 5)41 ‘4Cl) In
‘4 4) 4)41 4.4.4 4.4
• 0 ~~t4.4 . 0c~~ -~ Z
17
~~~“_ ‘CW fl ‘~~~~~Wfl~’~~~~~’ ________________________________________________
TM 75.1 SA
TABLE IIISTAGES IN SIMULATOR CORRECTION PROCESS
ITEM TASK1. Collect Baseline Data
2. Repea t Tests in Simulator
3. Reduce Data and Formulate Plan
4. Reprogram Simulator
5. Add Peripheral Equipment
6. Evaluate Total System
TABLE IVAIRCRAFT FLIGHT TIME REQUIRED
OFT! WST • FLIGHT HOURS NUMBER OF AIRCRAFT_____________________ ______________
UTILIZED2FlOl (T—2C) 63.3 7
2F90 (TA—4J) 26.3 11
2F103 (A—7E NCLT) 15.1 7
2F108 (A—4M) 30.0 2
2F107 (j(C—l30) 8.0 2
18
_ _ _ _ _ j
‘~~~~~~~~~‘ ~~~~~~~~~~~~~~~~~~~ ~~~~~~~~~~~~~~~~ ‘T . -~- ____
TM 75-1 SA
TABLE VSCIDNT CAPABILITIES AND OPTIONS
NUMBER DESCRIPTION1. Any parameter may be fixed or contrained to be
within certain bounds .
2. A Priori weighting may be placed on parameterestimates.
3. Standard deviations of parameter estimationerrors are computed .
4. Biases and random noise errors in instrumentsare computed.
5. Process noise may be included and its magni—tude and break frequency identified.
6. Process noise effects may be included but notidentified .
7. Measurements from failed instruments may bedeleted.
8. States may be deleted which do not signif i—cantly enter the aircraft modes of theparticular data record considered.
9. Rank deficient solution may be used to computethe inverse of the information matrix.
19
~
“ -
~
-
~
-~~~~ ~~~~---~~~---~-• - - _ _-_ _ _ -_-
TM 75.1 SA
~~~~ ~H~:h:I 41t 4- t~~ -~~~~~ -~
~~ 4--
~~~ ~~~~~~ -~ ~~
-
4-4 4. 1- •— -+ —+ ~~-.. -•- -4- ,-
#-t-r -~
-~~~ r ~~~
- ~~
-~- -
~ 1 t t tr
~- 2
+ ~~~~~ + 4-,—~--,- 4 ~ ~~~~~~ ItI 1- -
~ 1
~zz — .~ r -~~~ ~~~- 4-1-p 4 :
‘-~--,-~ 1 -- ~ 4 - . -~~~~ -4. f + - 4 4-
4_ _,__ ,__ . + - r - -1- 4 - - ~- 4- 4 4- 4- ~~~~~~~~ i ~~# I ~ t -.-,- --.---+ 4 - . ~- - 4 . ~ 4.- -~~~ -‘- —
4 - - 4 - - - 1- ~~ + ~~± 4—.-. -- -— -. -~- ~~~ — -
~~~ ~ r r-~ t t ~ I
~~~~ .~I I
~~~~~~~~~~~~~ I.
~~ —‘--~ .—t- *-4- i—’ 4- F- —
‘~~~~1~ .—
~ .--‘- ~—F——-~— t -F- 4 - 4
‘—4- 4 ~-4--.—-~ 4 - • —~- .- ~~+.,- ~ ,-4—+ 4—~-~~~ r ~ t 44) 4.-41 ~~ ~~~~~~~ — ~ M T Z W_
~;~~Hi~~~~ ~~~~~ 4 +4.4 .,4 — - -4 — 4. W )-
~~ ~~
p -
N’0 14 1i ~-l--
--•. —- — ± -~ ~-o 0 0 0 4) - -+- - —. - + + ~ 2 Q (00 ~~~~~~4 4 .4 ~ L ~~~~I Ill Co 4 0 4 1-+- -
~- r-4- .~- -4- -‘ N U) .~~~
, -,. ~_L -.- .~ 1 -~ - -~ -~ ~-4--+--~-0 00
~- 1 -
~~~~ -. - ‘-f-n -
~~~~~--- — - — I + .J Z ~~
~ ± ~~~ ii:
’-
~ F4- ~~
~~~~~ ~~-~- 4—4~ -r ~ ~ I— W
...4 11 4 4 >- > u — .,-,.-*-_ -~~~ ~~~~~~~ ~~~~ s~ ~ 04- 2
~~~z 0~ ~~~
z O -j
-4 -4-4.~~~ ‘-~-1~~ ~~~~ ~~~~~~~
~r NZ -~--+ -~ -.- 4 4-i---. ~.-
_4--.---~--. -.—~ —~~~-+-~-01 ‘—~- -
~ - ~—4. ~~lt’~~ ~~~ ‘— -4—’
~~ :~i:-~ -. :~ ~~ ~~~ ~~~
00 -~ ~~~~~ - -4-4-. ~~~~~~~~~ ~~~~~~~~ -
U)
o 0 0 0 0N — — N
Tlfld HSfld91— 33~0~ lOd.LNO3 1VNIOflIISNO1
20 Figure 1
- - - - - -
r - - - - -- - -
TM 75-1 SA
Altitude — 5,000Fuel Weight - 3,600 lb
o TA-4J Bu~Jo 158075A Device 2F90 Before Modification~ Device 2F90 After Modification
~ Io — - — I
j
I- £O
~~~ie_ __ _ A _ h__ _ _ _ ._ _
I —
.A £
4( 120 130 140 150 160 iTOOBSERVED AIRSPEED - KT
STATIC LONGITUDINAL STABILITY CHARACTERISTICSConfiguration PA5,000 Feet
21 Figure 2
— -~~ ~~ ——-—--— -~~~~ .-
F- - -~~.-- - - - ~r-~~~~— -.-- ~~~~~~--~~~
TM 75-1 SA
Altitude - 15,000 ftAirspeed - 350 kt
Fuel Weight - 6000 lb0 TA-4J BuNo 158087£ Device 2F90 Before ModificationA Device 2F90 After Modification
4
‘—‘.4
~JI-b~~~~~~~~~
Z — — — — --- ç--—~~~~~ — — —
.1T ~II2~IIII
2 0 — — — — — — — —£—
r9- I C — ~~~~~~~~~~~~~~ r~~~
~r£
2EC.)4I.- 20I-<U)
OZ1IJ~~ -~~j ic — — — — — __ —
z
~~~~~~~~~~~~~~~~~~~~~~~~
NORMAL ACCELERATION — g
MANEUVERI NG LON GITU DIN A L STABILI TY CHA RACTER iSTI~ SConfigu ration CR
15,000 Feet
22 Figure 3
- -
~
-- - - - - - - - - - --- . - ——.-~~~~~~ --- -~~~-- -_- -~~- - - - .-~~~~--- - - —- -,--- • - - - - -
—U’
TM 75-1 SA
Altitud. — 15,000 ftC rA—4 J BuNO 155100D rA-4J 8,4440 158075£ D.vic. 2810 B.for. I4odi fica t ioI~A D.vio. 2810 Aft.r Nod ifica t ion
AIRSPEED: 250 KT20~ ‘~-~~~~~-~ — — — — — — — — _____ — —-- .
~~-- --- --_ -~~
o 1_ __LLL300 KI
FIN)- : 571l() LBE-EEI~-~~ EEE~~~~~~~~~~~~~~~~~~~~~~~~~~~~~~4
~~ —
AIRSPEED: 400 KTFUEL: 5000 LBaoc - - --
F 4 I- i~~~~~~~~ 17
- --
IT /~~~~~~
i-
~~~~~~~~~~~~~~~~~~~~~~~~~~~~~iiiiii i~~~iiisc_ _ / _ —~~~
— — —~~— — —~~~~~~~~~~ — — —~~~~~~~~~~~~~~~~~~~~~~~~~~~~~~~ L~~III Ii~~~I~~ HI
5TINE — SEC
LATERAL CONTROL EFFECTIVENESSOne Inch Lateral Stick Deflection
Configu ration CR15,000 Feet
23 Figure4
-— -- ------, - - -
~
- - - -
~
—- --—-- -,-- ----~~-- — -~~~~~~~~~-“
r
TM 75-1 SA
I
_ _ _ _
I a-
I- -J I
= ~~~~~~~~~~~~~~~~~
_ _— -~~~~~~~~~~~ ~~~ ~~ -~~as- 1
~~~~ —
— I.M c.~ I a ~ -
Ll~= — a ~~~ I “ -Jw .~ 8 L1J ~~~a 5-
~~~~~~~~~ - I — a
5-5-
- 1 . = 5-a. -
5
I -
24 Figure 5
___ - _ ___
—
~~~~~~
-
~~~
-
TM 75.1 SA4
Distribution:COMMAVAIRTESTCEN CTO2 (1)COMNAVAIRTESTCEN CTO3 (1)C0~~ AVAIRTESTCEN CTO8 (1)SATD SAO1 (1)SATD SAO2 (1) —
SATh SAO4 (1)SATD SA41 (200)SATD SA6O (1)SETD (1)RWTD (1)ATTD (1)CSD (1)TSD (1)TPS (1)
25
~ - - --- - ~~~~~~~~~~~~~~~~~~~~~~~~~~~~~~~~~~~~~~~~~~~~~~
Related Documents