materials Article Effects of Fillet Weld Size and Sleeve Material Strength on the Residual Stress Distribution and Structural Safety While Implementing the New Sleeve Repair Process Hongjie Zhang 1 , Tao Han 1, *, Yong Wang 1 and Qian Wu 2 Citation: Zhang, H.; Han, T.; Wang, Y.; Wu, Q. Effects of Fillet Weld Size and Sleeve Material Strength on the Residual Stress Distribution and Structural Safety While Implementing the New Sleeve Repair Process. Materials 2021, 14, 7463. https:// doi.org/10.3390/ma14237463 Academic Editors: Filippo Berto, Abílio M.P. De Jesus and José A.F.O. Correia Received: 16 October 2021 Accepted: 2 December 2021 Published: 5 December 2021 Publisher’s Note: MDPI stays neutral with regard to jurisdictional claims in published maps and institutional affil- iations. Copyright: © 2021 by the authors. Licensee MDPI, Basel, Switzerland. This article is an open access article distributed under the terms and conditions of the Creative Commons Attribution (CC BY) license (https:// creativecommons.org/licenses/by/ 4.0/). 1 School of Materials Science and Engineering, China University of Petroleum, West Changjiang Road, Huangdao District, Qingdao 266580, China; [email protected] (H.Z.); [email protected] (Y.W.) 2 Risk Assessment Institute, SINOPEC Research Institute of Safety Engineering, Co., Ltd., Songling Road, Laoshan District, Qingdao 266580, China; [email protected] * Correspondence: [email protected] Abstract: The process optimization and structural safety improvement of the in-service repair welding of the X80 pipeline are very important. In this paper, the temperature, microstructure, and stress distribution were analyzed using the combination of TMM (thermal-metallurgical-mechanical) simulations and the corresponding verification experiments. The effects of the sleeve material strength and the fillet weld size were discussed. The results showed that the fillet weld zone was mainly composed of ferrite and bainite when the material of the sleeve pipe was Q345B. Furthermore, the sleeve pipe’s HAZ (heat affected zone) was dominated by lath martensite, lath bainite, and granular bainite. Moreover, granular bainite and a small amount of ferrite were found in the HAZ of the X80 pipe. It was found that, as the fillet weld size increased, the welding residual stress distribution became more uniform. The hoop stress at weld toe reduced from ~860 MPa of case A to ~680 MPa of case E, and the axial stress at weld toe reduced from ~440 MPa of case A to ~380 MPa of case E. From the viewpoint of welding residual stress, fillet weld size was suggested to be larger than 1.4T. The stress concentration and the stress distribution showed a correlation with the cracking behavior. Weld re-solidification ripples on the weld surface and weld ripples between welding passes or near the weld toe could cause stress concentration and the corresponding crack initiation. Furthermore, when the material of the sleeve pipe changed from Q345B to X80, the high-level tensile stress zone was found to be enlarged. The hoop stress at weld toe increased from ~750 to ~800 MPa, and the axial stress at weld toe increased from ~500 to ~600 MPa. After implementing the new sleeve repair welding process where X80 replaces the material of sleeve pipe, the cracking risk in sleeve pipe will improve. From the perspective of the welding residual stress, it was concluded that the fillet weld size reduction and the sleeve material strength improvement are harmful to in-service welded structures’ safety and integrity. Keywords: in-service repair welding; fillet weld size; sleeve material strength; welding residual stress 1. Introduction In order to meet the energy demands and reduce the natural gas pipeline construction costs, X80 steel is widely used in China [1]. In contrast, the high-strength steel, exceeding X70, is rarely used in other countries. The investigations on the weldability and the crack-resistant ability [2–5] of X80 require further exploration. When compared to the initial welds, the repair welds were usually subjected to the multiaxial stress state, severe restraints in both hoop and axial directions, worse welding preparation, and welding environment [6,7]. Hence, the in-service repair welding of the X80 pipeline presents more challenges than the welding during the layout stage. As far as in-service welding is concerned, two fundamental problems have to be inves- tigated. One is the burn-through risk caused by the high temperature and corresponding Materials 2021, 14, 7463. https://doi.org/10.3390/ma14237463 https://www.mdpi.com/journal/materials

Welcome message from author
This document is posted to help you gain knowledge. Please leave a comment to let me know what you think about it! Share it to your friends and learn new things together.
Transcript
materials
Article
Effects of Fillet Weld Size and Sleeve Material Strength on theResidual Stress Distribution and Structural Safety WhileImplementing the New Sleeve Repair Process
Hongjie Zhang 1 , Tao Han 1,*, Yong Wang 1 and Qian Wu 2
�����������������
Citation: Zhang, H.; Han, T.; Wang,
Y.; Wu, Q. Effects of Fillet Weld Size
and Sleeve Material Strength on the
Residual Stress Distribution and
Structural Safety While Implementing
the New Sleeve Repair Process.
Materials 2021, 14, 7463. https://
doi.org/10.3390/ma14237463
Academic Editors: Filippo Berto,
Abílio M.P. De Jesus and José
A.F.O. Correia
Received: 16 October 2021
Accepted: 2 December 2021
Published: 5 December 2021
Publisher’s Note: MDPI stays neutral
with regard to jurisdictional claims in
published maps and institutional affil-
iations.
Copyright: © 2021 by the authors.
Licensee MDPI, Basel, Switzerland.
This article is an open access article
distributed under the terms and
conditions of the Creative Commons
Attribution (CC BY) license (https://
creativecommons.org/licenses/by/
4.0/).
1 School of Materials Science and Engineering, China University of Petroleum, West Changjiang Road,Huangdao District, Qingdao 266580, China; [email protected] (H.Z.); [email protected] (Y.W.)
2 Risk Assessment Institute, SINOPEC Research Institute of Safety Engineering, Co., Ltd., Songling Road,Laoshan District, Qingdao 266580, China; [email protected]
* Correspondence: [email protected]
Abstract: The process optimization and structural safety improvement of the in-service repairwelding of the X80 pipeline are very important. In this paper, the temperature, microstructure, andstress distribution were analyzed using the combination of TMM (thermal-metallurgical-mechanical)simulations and the corresponding verification experiments. The effects of the sleeve materialstrength and the fillet weld size were discussed. The results showed that the fillet weld zone wasmainly composed of ferrite and bainite when the material of the sleeve pipe was Q345B. Furthermore,the sleeve pipe’s HAZ (heat affected zone) was dominated by lath martensite, lath bainite, andgranular bainite. Moreover, granular bainite and a small amount of ferrite were found in the HAZof the X80 pipe. It was found that, as the fillet weld size increased, the welding residual stressdistribution became more uniform. The hoop stress at weld toe reduced from ~860 MPa of case A to~680 MPa of case E, and the axial stress at weld toe reduced from ~440 MPa of case A to ~380 MPaof case E. From the viewpoint of welding residual stress, fillet weld size was suggested to be largerthan 1.4T. The stress concentration and the stress distribution showed a correlation with the crackingbehavior. Weld re-solidification ripples on the weld surface and weld ripples between weldingpasses or near the weld toe could cause stress concentration and the corresponding crack initiation.Furthermore, when the material of the sleeve pipe changed from Q345B to X80, the high-level tensilestress zone was found to be enlarged. The hoop stress at weld toe increased from ~750 to ~800 MPa,and the axial stress at weld toe increased from ~500 to ~600 MPa. After implementing the new sleeverepair welding process where X80 replaces the material of sleeve pipe, the cracking risk in sleevepipe will improve. From the perspective of the welding residual stress, it was concluded that thefillet weld size reduction and the sleeve material strength improvement are harmful to in-servicewelded structures’ safety and integrity.
Keywords: in-service repair welding; fillet weld size; sleeve material strength; welding residual stress
1. Introduction
In order to meet the energy demands and reduce the natural gas pipeline constructioncosts, X80 steel is widely used in China [1]. In contrast, the high-strength steel, exceedingX70, is rarely used in other countries. The investigations on the weldability and thecrack-resistant ability [2–5] of X80 require further exploration. When compared to theinitial welds, the repair welds were usually subjected to the multiaxial stress state, severerestraints in both hoop and axial directions, worse welding preparation, and weldingenvironment [6,7]. Hence, the in-service repair welding of the X80 pipeline presents morechallenges than the welding during the layout stage.
As far as in-service welding is concerned, two fundamental problems have to be inves-tigated. One is the burn-through risk caused by the high temperature and corresponding
Materials 2021, 14, 7463. https://doi.org/10.3390/ma14237463 https://www.mdpi.com/journal/materials
Materials 2021, 14, 7463 2 of 20
material softening induced by welding. The other is the hydrogen-induced cracking afterin-service welding. As reported in API 1104 [8], burn-through is not likely to happenwhen the wall thickness is greater than 6.4 mm. Generally, the wall thicknesses of the X80pipeline are quite a bit larger than 6.4 mm. However, hydrogen-induced cracking becomesmore accessible as the steel grade level increases. Furthermore, it is well known that thereare three favorable factors to hydrogen-induced cracking namely hydrogen, susceptiblemicrostructure, and residual stress [9]. The low-hydrogen electrode was demonstrated toeffectively prevent hydrogen from being introduced to the welding joint [10]. By adoptingthe low-hydrogen electrode, the effects of hydrogen could be ignored. The microstructure isdependent on the welding thermal cycles. Hence, optimizing the susceptible microstructureis challenging for in-service repair welding. During the in-service welding, flowing naturalgas in the pipeline dissipates a lot of welding heat and generates a high cooling rate [11].Considering the preheating, and appropriately improving the heat input, usually show aninsignificant effect on the welding thermal cycles. In the literature, several investigationson the susceptible microstructure were carried out [1].
However, there are only some investigations carried out on the in-service weldingresidual stress of X80. The impacts of residual stress on the hydrogen embrittlement areoften ignored. The residual stress distributions of the repaired weld joints are uncompre-hending for the constructors. However, many failure cases were related to the high-levelresidual stresses [12–14]. The in-service welding is usually subjected to the multiaxial stressstate, i.e., pipe pressure and additional stress, and severe restraints in both hoop and axialdirection [6,7]. Moreover, accurate residual stress prediction has become challenging.
According to API 1104 [8] and GB/T 31032 [15], Q345B/R/C should be consideredto be the material of the sleeve pipe in the case of the sleeve repair welding of the X80pipeline. The wall thickness of the sleeve pipe was usually thicker than that of the X80pipeline, and the value might reach 60 mm. For security reasons, the fillet weld sizes weretraditionally designed as large as possible. According to ASME [16], the fillet weld sizeshould be 1.4 times the thickness of the pipeline that was to be repaired. Moreover, theother parts in the direction of the thickness of the sleeve pipe should be chamfered at a45◦ angle. Furthermore, GB/T 28055 [17] and SYT6150 [18] indicated that the fillet weldsize should be 2.0 times the wall thickness of the pipeline that was to be repaired. Thelatter was widely adopted for the in-service repair welding of the pipeline, as to the X80pipeline, which referred to an amount of the welding workload. Moreover, the qualityof the welding decreases as the number of welding passes increased. In order to addressthe above problem, replacing the sleeve material with higher-level steel, i.e., X80 steel,and reducing the fillet weld size obtained more attention. Presently, this new process isstill at the developing stage. In this work, investigations were carried out to provide thetemperature-microstructure-residual stress distributions in the repaired X80 weld joint,and to provide guidance for implementing the new process. Furthermore, the effectsof fillet weld size on the residual stress distribution and the structure safety were alsoanalyzed. Moreover, the effects of replacing the sleeve material from Q345B/R/C to X80were discussed.
2. Materials and Experimental Procedure2.1. Material and Experimental Process Description
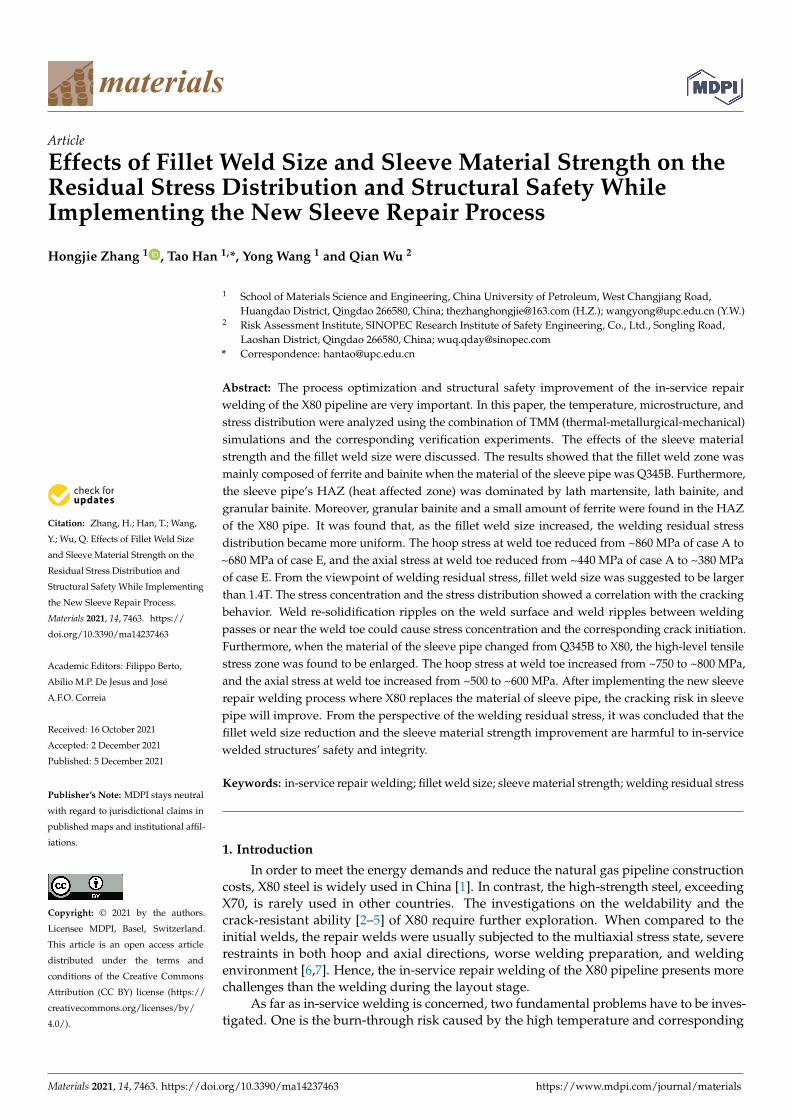
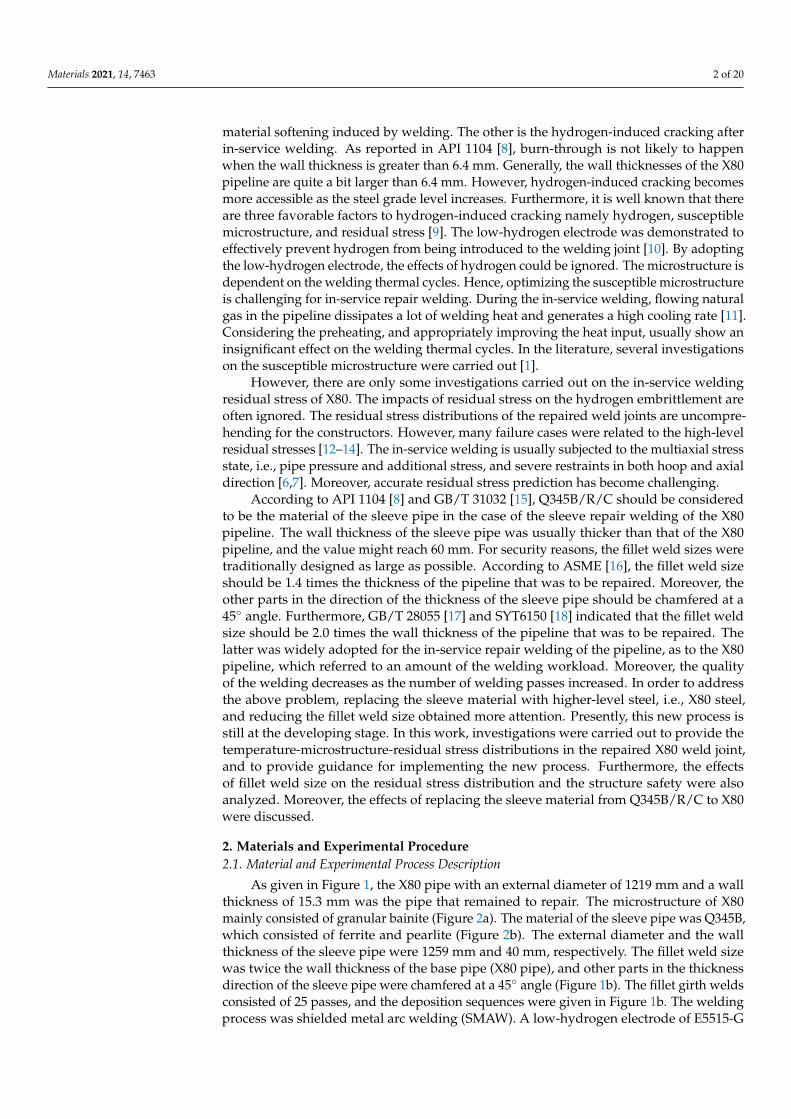
As given in Figure 1, the X80 pipe with an external diameter of 1219 mm and a wallthickness of 15.3 mm was the pipe that remained to repair. The microstructure of X80mainly consisted of granular bainite (Figure 2a). The material of the sleeve pipe was Q345B,which consisted of ferrite and pearlite (Figure 2b). The external diameter and the wallthickness of the sleeve pipe were 1259 mm and 40 mm, respectively. The fillet weld sizewas twice the wall thickness of the base pipe (X80 pipe), and other parts in the thicknessdirection of the sleeve pipe were chamfered at a 45◦ angle (Figure 1b). The fillet girth weldsconsisted of 25 passes, and the deposition sequences were given in Figure 1b. The weldingprocess was shielded metal arc welding (SMAW). A low-hydrogen electrode of E5515-G
Materials 2021, 14, 7463 3 of 20
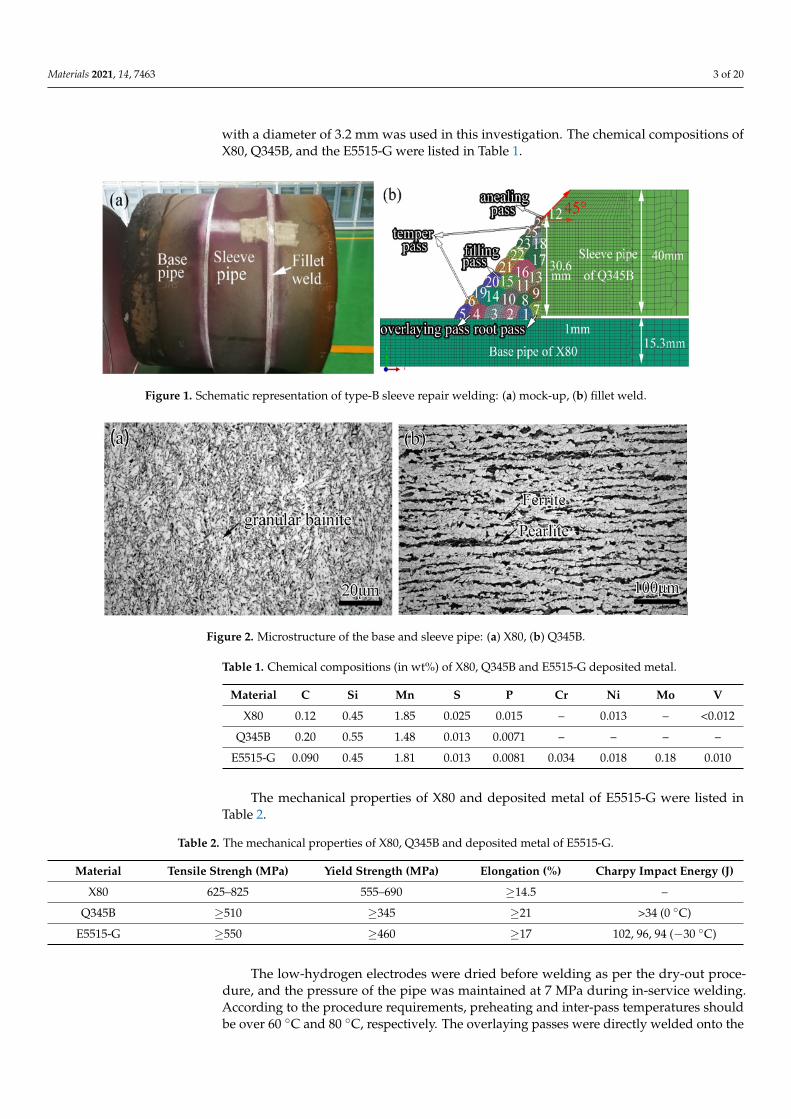
with a diameter of 3.2 mm was used in this investigation. The chemical compositions ofX80, Q345B, and the E5515-G were listed in Table 1.
Materials 2021, 14, 7463 3 of 21
Q345B, which consisted of ferrite and pearlite (Figure 2b). The external diameter and the wall thickness of the sleeve pipe were 1259 mm and 40 mm, respectively. The fillet weld size was twice the wall thickness of the base pipe (X80 pipe), and other parts in the thick-ness direction of the sleeve pipe were chamfered at a 45° angle (Figure 1b). The fillet girth welds consisted of 25 passes, and the deposition sequences were given in Figure 1b. The welding process was shielded metal arc welding (SMAW). A low-hydrogen electrode of E5515-G with a diameter of 3.2 mm was used in this investigation. The chemical compo-sitions of X80, Q345B, and the E5515-G were listed in Table 1.
Figure 1. Schematic representation of type-B sleeve repair welding: (a) mock-up, (b) fillet weld.
Table 1. Chemical compositions (in wt%) of X80, Q345B and E5515-G deposited metal.
Material C Si Mn S P Cr Ni Mo V X80 0.12 0.45 1.85 0.025 0.015 -- 0.013 -- <0.012
Q345B 0.20 0.55 1.48 0.013 0.0071 -- -- -- -- E5515-G 0.090 0.45 1.81 0.013 0.0081 0.034 0.018 0.18 0.010
Figure 2. Microstructure of the base and sleeve pipe: (a) X80, (b) Q345B.
The mechanical properties of X80 and deposited metal of E5515-G were listed in Ta-ble 2.
Table 2. The mechanical properties of X80, Q345B and deposited metal of E5515-G.
Material Tensile Strengh (MPa) Yield Strength (MPa) Elongation (%) Charpy Impact Energy (J) X80 625–825 555–690 ≥14.5 --
Q345B ≥510 ≥345 ≥21 >34 (0 °C) E5515-G ≥550 ≥460 ≥17 102, 96, 94 (−30 °C)
Figure 1. Schematic representation of type-B sleeve repair welding: (a) mock-up, (b) fillet weld.
Materials 2021, 14, 7463 3 of 21
Q345B, which consisted of ferrite and pearlite (Figure 2b). The external diameter and the wall thickness of the sleeve pipe were 1259 mm and 40 mm, respectively. The fillet weld size was twice the wall thickness of the base pipe (X80 pipe), and other parts in the thick-ness direction of the sleeve pipe were chamfered at a 45° angle (Figure 1b). The fillet girth welds consisted of 25 passes, and the deposition sequences were given in Figure 1b. The welding process was shielded metal arc welding (SMAW). A low-hydrogen electrode of E5515-G with a diameter of 3.2 mm was used in this investigation. The chemical compo-sitions of X80, Q345B, and the E5515-G were listed in Table 1.
Figure 1. Schematic representation of type-B sleeve repair welding: (a) mock-up, (b) fillet weld.
Table 1. Chemical compositions (in wt%) of X80, Q345B and E5515-G deposited metal.
Material C Si Mn S P Cr Ni Mo V X80 0.12 0.45 1.85 0.025 0.015 -- 0.013 -- <0.012
Q345B 0.20 0.55 1.48 0.013 0.0071 -- -- -- -- E5515-G 0.090 0.45 1.81 0.013 0.0081 0.034 0.018 0.18 0.010
Figure 2. Microstructure of the base and sleeve pipe: (a) X80, (b) Q345B.
The mechanical properties of X80 and deposited metal of E5515-G were listed in Ta-ble 2.
Table 2. The mechanical properties of X80, Q345B and deposited metal of E5515-G.
Material Tensile Strengh (MPa) Yield Strength (MPa) Elongation (%) Charpy Impact Energy (J) X80 625–825 555–690 ≥14.5 --
Q345B ≥510 ≥345 ≥21 >34 (0 °C) E5515-G ≥550 ≥460 ≥17 102, 96, 94 (−30 °C)
Figure 2. Microstructure of the base and sleeve pipe: (a) X80, (b) Q345B.
Table 1. Chemical compositions (in wt%) of X80, Q345B and E5515-G deposited metal.
Material C Si Mn S P Cr Ni Mo V
X80 0.12 0.45 1.85 0.025 0.015 – 0.013 – <0.012
Q345B 0.20 0.55 1.48 0.013 0.0071 – – – –
E5515-G 0.090 0.45 1.81 0.013 0.0081 0.034 0.018 0.18 0.010
The mechanical properties of X80 and deposited metal of E5515-G were listed inTable 2.
Table 2. The mechanical properties of X80, Q345B and deposited metal of E5515-G.
Material Tensile Strengh (MPa) Yield Strength (MPa) Elongation (%) Charpy Impact Energy (J)
X80 625–825 555–690 ≥14.5 –
Q345B ≥510 ≥345 ≥21 >34 (0 ◦C)
E5515-G ≥550 ≥460 ≥17 102, 96, 94 (−30 ◦C)
The low-hydrogen electrodes were dried before welding as per the dry-out proce-dure, and the pressure of the pipe was maintained at 7 MPa during in-service welding.According to the procedure requirements, preheating and inter-pass temperatures shouldbe over 60 ◦C and 80 ◦C, respectively. The overlaying passes were directly welded onto the
Materials 2021, 14, 7463 4 of 20
X80 pipe in small heat input in order to avoid the burn-though, as shown in Figure 1. Theseventh welding pass was found to be the root pass and used to connect the sleeve pipeand the X80 pipe. The filling, temper, and annealing passes are also shown in Figure 1. Thedetailed welding parameters are given in Table 3.
Table 3. Welding parameters.
Welding Passes Welding Voltage (V) Welding Current (A) Welding Speed (cm/min) Heat Input (KJ/mm)
Overlaying/temper pass 22–28 100–130 10–16 0.7–1.7Root pass 22–28 100–130 6–15 0.7–3.0
Filling pass 22–28 100–130 6–15 0.7–3.0Annealing pass 22–28 100–130 10–15 0.7–1.7
2.2. Verification Experiments
In this work, the temperature, microstructure, and stress field distributions wereobtained using the SYSWELD simulation (SYSWELD 2008, ESI GROUP, PAIRS, FRANCE),and the results were verified using the experimental methods. The weld joint samples wereetched with 4% Nital solution. The microstructures were characterized by the optical micro-scope (Leica DM2500 M, Leica Microsystems, ShangHai, China). The hardness of the weld-ing joint was measured using a Vickers hardness tester (HVS-50, Beijing ShiDaiZhiFengInstrument Co., Ltd., Beijing, China), with a force of 10 kgf (HV10) and a dwell time of10 s. The welding residual stress was measured by the hole-drilling strain gauge method(HDM) [19].
3. Finite Element Modeling
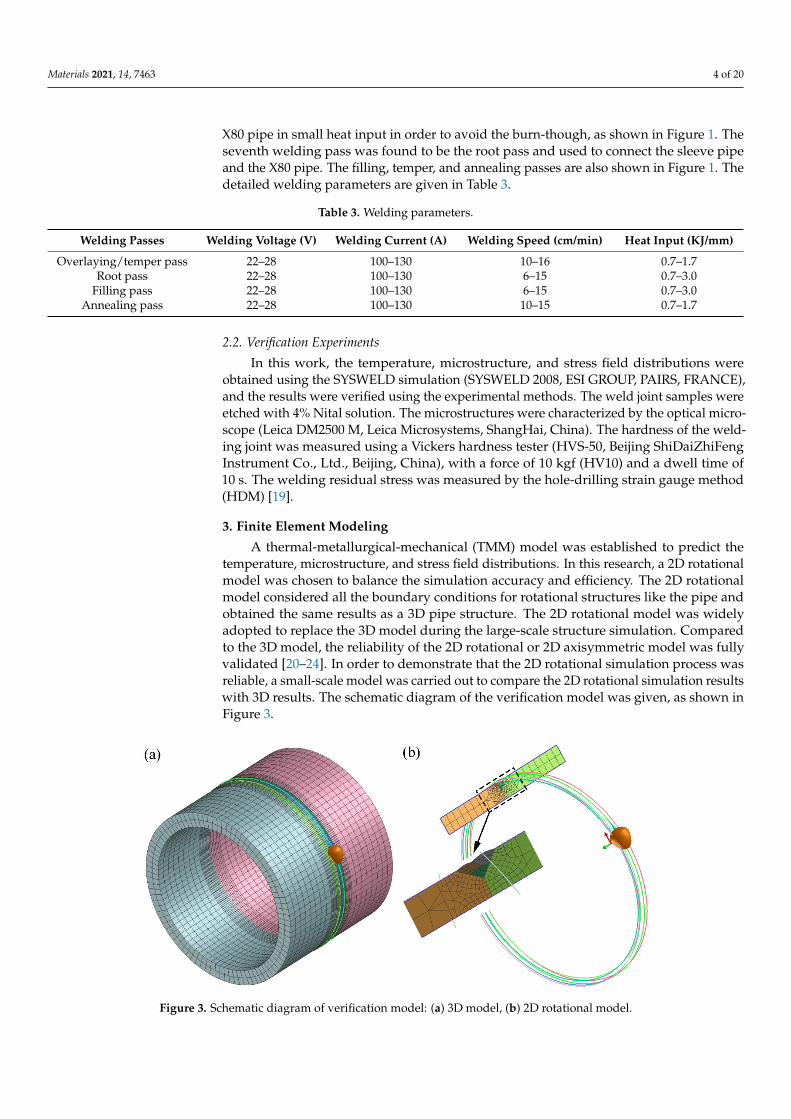
A thermal-metallurgical-mechanical (TMM) model was established to predict thetemperature, microstructure, and stress field distributions. In this research, a 2D rotationalmodel was chosen to balance the simulation accuracy and efficiency. The 2D rotationalmodel considered all the boundary conditions for rotational structures like the pipe andobtained the same results as a 3D pipe structure. The 2D rotational model was widelyadopted to replace the 3D model during the large-scale structure simulation. Comparedto the 3D model, the reliability of the 2D rotational or 2D axisymmetric model was fullyvalidated [20–24]. In order to demonstrate that the 2D rotational simulation process wasreliable, a small-scale model was carried out to compare the 2D rotational simulation resultswith 3D results. The schematic diagram of the verification model was given, as shown inFigure 3.
Materials 2021, 14, 7463 5 of 21
Figure 3. Schematic diagram of verification model: (a) 3D model, (b) 2D rotational model.
The results of 2D and 3D simulations were brought under the same welding condi-tions. As shown in Figure 4, the von Mises stress contour of the 2D rotational simulation was compared with that of 3D simulation. It can be found that the 2D results show good accuracy compared with the 3D results.
Figure 4. The von Mises stress contour: (a) 2D rotational simulation result, (b) 3D simulation result.
The in-service sleeve repair welding model (Figure 1) was built according to the ac-tual weld joint. By considering the different requirements in the standards [16–18], the fillet weld size was found to affect structural safety significantly. The implementation of the new procure in the X80 pipeline by replacing the sleeve material with the higher level grade steel (X80) and reducing the welding passes is imperative in the future. Hence, the new procedure was designed to clarify the effects of the fillet weld size on the tempera-ture-microstructure-stress fields and the structural safety.
3.1. Finite Element Model The fillet weld sizes, ranging from 1.0 times to 2.6 times the wall thickness of X80
pipe, were considered in this investigation. Accordingly, the finite element models were built, as shown in Figure 5. The sequence and the number of the welding passes are marked in the picture. The 45° chamfers were all implemented in these cases. Finite ele-ment models have meshed with hexahedron cubic elements. To balance the accuracy and efficiency, coarser meshes were used in the regions away from the weld zone, and finer meshes were used near the weld zone, with the smallest element size of 0.5 mm × 0.7mm. The total element number was 10,566. Rigid restraints were applied at the ends of the X80 pipe, as shown in Figure 5. The pipe pressure, which was perpendicular to the pipe’s inner
Figure 3. Schematic diagram of verification model: (a) 3D model, (b) 2D rotational model.
Materials 2021, 14, 7463 5 of 20
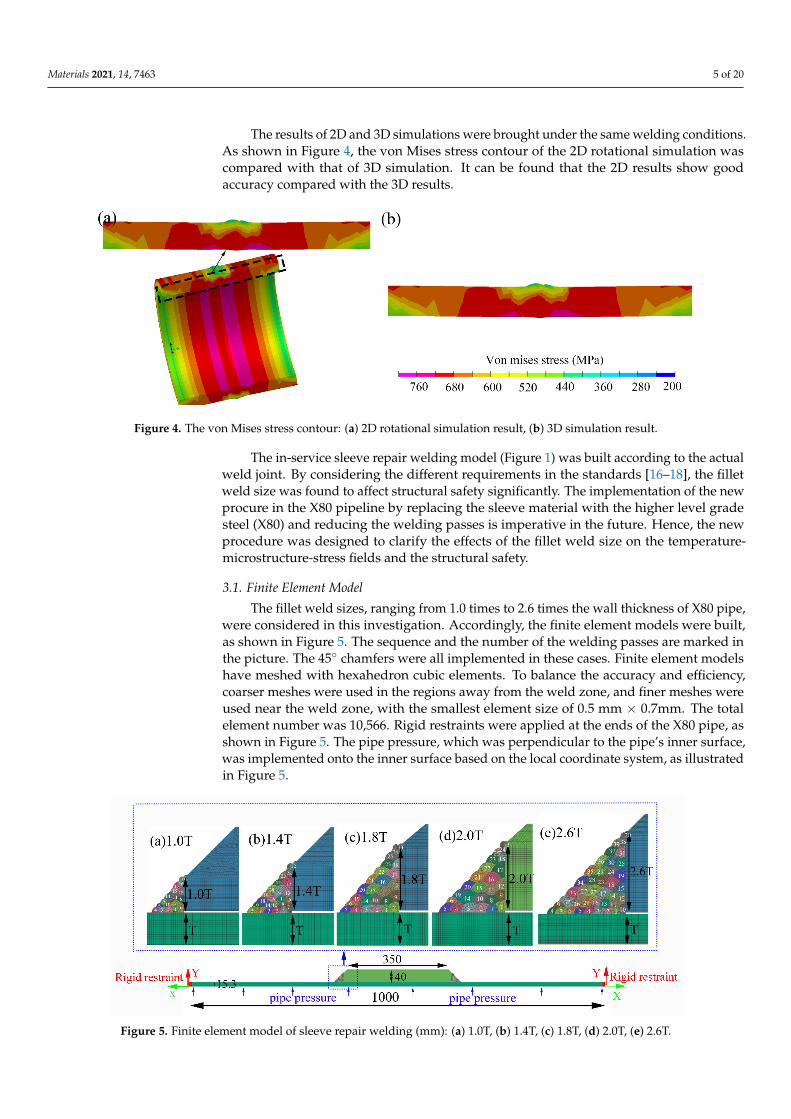
The results of 2D and 3D simulations were brought under the same welding conditions.As shown in Figure 4, the von Mises stress contour of the 2D rotational simulation wascompared with that of 3D simulation. It can be found that the 2D results show goodaccuracy compared with the 3D results.
Materials 2021, 14, 7463 5 of 21
Figure 3. Schematic diagram of verification model: (a) 3D model, (b) 2D rotational model.
The results of 2D and 3D simulations were brought under the same welding condi-tions. As shown in Figure 4, the von Mises stress contour of the 2D rotational simulation was compared with that of 3D simulation. It can be found that the 2D results show good accuracy compared with the 3D results.
Figure 4. The von Mises stress contour: (a) 2D rotational simulation result, (b) 3D simulation result.
The in-service sleeve repair welding model (Figure 1) was built according to the ac-tual weld joint. By considering the different requirements in the standards [16–18], the fillet weld size was found to affect structural safety significantly. The implementation of the new procure in the X80 pipeline by replacing the sleeve material with the higher level grade steel (X80) and reducing the welding passes is imperative in the future. Hence, the new procedure was designed to clarify the effects of the fillet weld size on the tempera-ture-microstructure-stress fields and the structural safety.
3.1. Finite Element Model The fillet weld sizes, ranging from 1.0 times to 2.6 times the wall thickness of X80
pipe, were considered in this investigation. Accordingly, the finite element models were built, as shown in Figure 5. The sequence and the number of the welding passes are marked in the picture. The 45° chamfers were all implemented in these cases. Finite ele-ment models have meshed with hexahedron cubic elements. To balance the accuracy and efficiency, coarser meshes were used in the regions away from the weld zone, and finer meshes were used near the weld zone, with the smallest element size of 0.5 mm × 0.7mm. The total element number was 10,566. Rigid restraints were applied at the ends of the X80 pipe, as shown in Figure 5. The pipe pressure, which was perpendicular to the pipe’s inner
Figure 4. The von Mises stress contour: (a) 2D rotational simulation result, (b) 3D simulation result.
The in-service sleeve repair welding model (Figure 1) was built according to the actualweld joint. By considering the different requirements in the standards [16–18], the filletweld size was found to affect structural safety significantly. The implementation of the newprocure in the X80 pipeline by replacing the sleeve material with the higher level gradesteel (X80) and reducing the welding passes is imperative in the future. Hence, the newprocedure was designed to clarify the effects of the fillet weld size on the temperature-microstructure-stress fields and the structural safety.
3.1. Finite Element Model
The fillet weld sizes, ranging from 1.0 times to 2.6 times the wall thickness of X80 pipe,were considered in this investigation. Accordingly, the finite element models were built,as shown in Figure 5. The sequence and the number of the welding passes are marked inthe picture. The 45◦ chamfers were all implemented in these cases. Finite element modelshave meshed with hexahedron cubic elements. To balance the accuracy and efficiency,coarser meshes were used in the regions away from the weld zone, and finer meshes wereused near the weld zone, with the smallest element size of 0.5 mm × 0.7mm. The totalelement number was 10,566. Rigid restraints were applied at the ends of the X80 pipe, asshown in Figure 5. The pipe pressure, which was perpendicular to the pipe’s inner surface,was implemented onto the inner surface based on the local coordinate system, as illustratedin Figure 5.
Materials 2021, 14, 7463 6 of 21
surface, was implemented onto the inner surface based on the local coordinate system, as illustrated in Figure 5.
Figure 5. Finite element model of sleeve repair welding (mm): (a) 1.0T, (b) 1.4T, (c) 1.8T, (d) 2.0T, (e) 2.6T.
3.2. Thermal Analysis The double ellipsoid heat source [25] was demonstrated to be appropriate to describe
the heat flux distribution of SMAW, and the equations of the double ellipsoid heat source were given below:
2 2 2
f 2 2 212 3 3 3 3q ( , , ) exp( ), 0
( ) f n hf r h h
UI x y zx y z xa b ca a b c
ηπ π
= − − − ≥+
(1)
2 2 2
f 2 2 212 3 3 3 3q ( , , ) exp( ), 0
( ) r n hf r h h
UI x y zx y z xa b ca a b c
ηπ π
= − − − ≤+
(2)
where q and q are the power density functions (W m−3), 𝜂 is the arc efficient, 𝑈 is the arc voltage (V), 𝐼 is the welding current (A), 𝑎 , 𝑎 , 𝑏 and 𝑐 are the distribution parameters.
During the 2D rotational finite element modeling, the weld line was created follow-ing the actual welding trajectory. This weld line would tell the double ellipsoid heat source running along the weld line, as shown in Figure 6.
Figure 5. Finite element model of sleeve repair welding (mm): (a) 1.0T, (b) 1.4T, (c) 1.8T, (d) 2.0T, (e) 2.6T.
Materials 2021, 14, 7463 6 of 20
3.2. Thermal Analysis
The double ellipsoid heat source [25] was demonstrated to be appropriate to describethe heat flux distribution of SMAW, and the equations of the double ellipsoid heat sourcewere given below:
qf(x, y, z) =12√
3ηUI(a f + ar)bhchπ
√π
exp(−3x2
a2f− 3y2
b2n− 3z2
c2h), x ≥ 0 (1)
qf(x, y, z) =12√
3ηUI(a f + ar)bhchπ
√π
exp(−3x2
a2r− 3y2
b2n− 3z2
c2h), x ≤ 0 (2)
where qf and qr are the power density functions (W m−3), η is the arc efficient, U is the arcvoltage (V), I is the welding current (A), a f , ar, bh and ch are the distribution parameters.
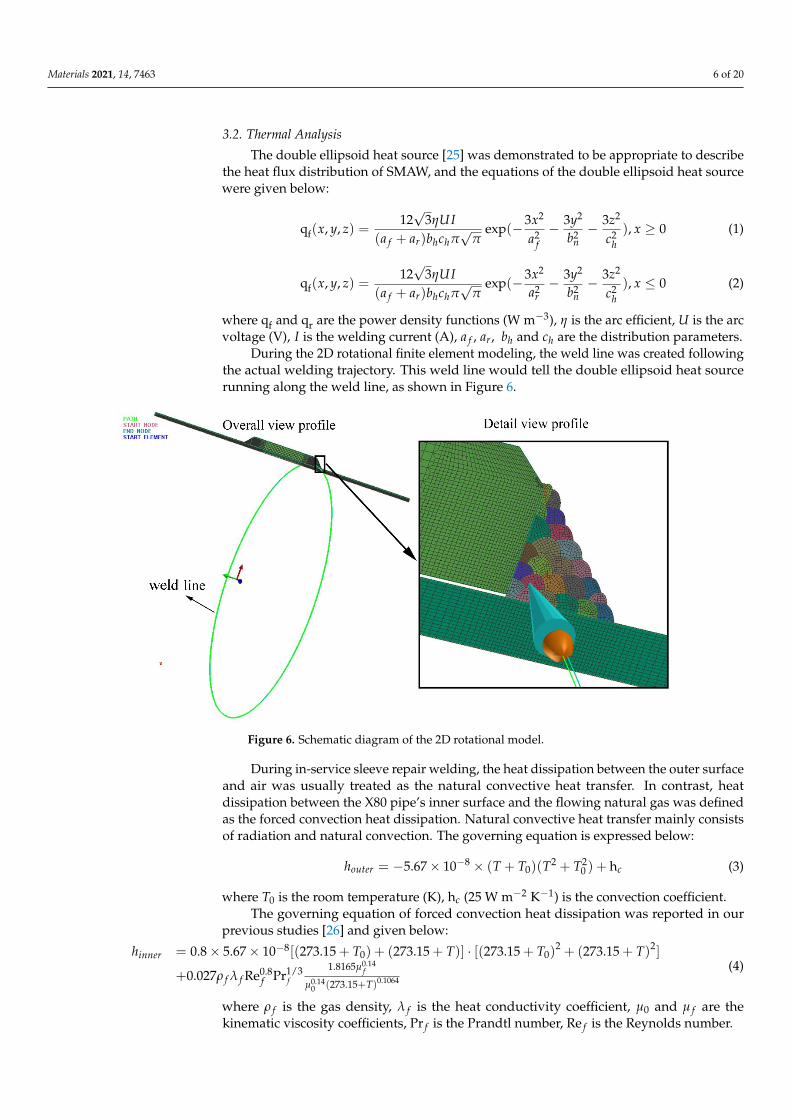
During the 2D rotational finite element modeling, the weld line was created followingthe actual welding trajectory. This weld line would tell the double ellipsoid heat sourcerunning along the weld line, as shown in Figure 6.
Materials 2021, 14, 7463 7 of 21
Figure 6. Schematic diagram of the 2D rotational model.
During in-service sleeve repair welding, the heat dissipation between the outer sur-face and air was usually treated as the natural convective heat transfer. In contrast, heat dissipation between the X80 pipe’s inner surface and the flowing natural gas was defined as the forced convection heat dissipation. Natural convective heat transfer mainly consists of radiation and natural convection. The governing equation is expressed below:
8 2 20 05.67 10 ( )( ) houter ch T T T T−= − × × + + + (3)
where 0T is the room temperature (K), hc (25 W m−2 K−1) is the convection coefficient. The governing equation of forced convection heat dissipation was reported in our
previous studies [26] and given below:
8 2 20 0
0.140.8 1/3
0.14 0.10640
0.8 5.67 10 [(273.15 ) (273.15 )] [(273.15 ) (273.15 ) ]1.8165
0.027 Re Pr273.15f
inner
ff f f
h T T T T
Tμ
ρ λμ
−= × × + + + ⋅ + + +
+( + )
(4)
where fρ is the gas density, fλ is the heat conductivity coefficient, 0μ and fμ are
the kinematic viscosity coefficients, Prf is the Prandtl number, Re f is the Reynolds number.
Non-linear transient heat transfer equation was expressed as follows [27]:
2 2 2
2 2 2( )T T T Tc k Qt x y z
ρ ∂ ∂ ∂ ∂= + + +∂ ∂ ∂ ∂
(5)
where ρ is the material density, c is the specific heat thermal conductivity, k is ther-mal conductivity, Q is mainly the latent heat of phase transition.
3.3. Metallurgical and Mechanical Analysis Generally, the diffusion-controlled and the shear-type transformations were consid-
ered in a developed TMM model based on SYSWELD. The Johnson–Mehl–Avrami–Kol-
Figure 6. Schematic diagram of the 2D rotational model.
During in-service sleeve repair welding, the heat dissipation between the outer surfaceand air was usually treated as the natural convective heat transfer. In contrast, heatdissipation between the X80 pipe’s inner surface and the flowing natural gas was definedas the forced convection heat dissipation. Natural convective heat transfer mainly consistsof radiation and natural convection. The governing equation is expressed below:
houter = −5.67× 10⁻⁸ × (T + T0)(T2 + T20 ) + hc (3)
where T0 is the room temperature (K), hc (25 W m−2 K−1) is the convection coefficient.The governing equation of forced convection heat dissipation was reported in our
previous studies [26] and given below:
hinner = 0.8× 5.67× 10−8[(273.15 + T0) + (273.15 + T)] · [(273.15 + T0)2 + (273.15 + T)2]
+0.027ρ f λ f Re0.8f Pr1/3
f
1.8165µ0.14f
µ0.140 (273.15+T)0.1064
(4)
where ρ f is the gas density, λ f is the heat conductivity coefficient, µ0 and µ f are thekinematic viscosity coefficients, Pr f is the Prandtl number, Re f is the Reynolds number.
Materials 2021, 14, 7463 7 of 20
Non-linear transient heat transfer equation was expressed as follows [27]:
ρc∂T∂t
= k(∂2T∂x2 +
∂2T∂y2 +
∂2T∂z2 ) + Q (5)
where ρ is the material density, c is the specific heat thermal conductivity, k is thermalconductivity, Q is mainly the latent heat of phase transition.
3.3. Metallurgical and Mechanical Analysis
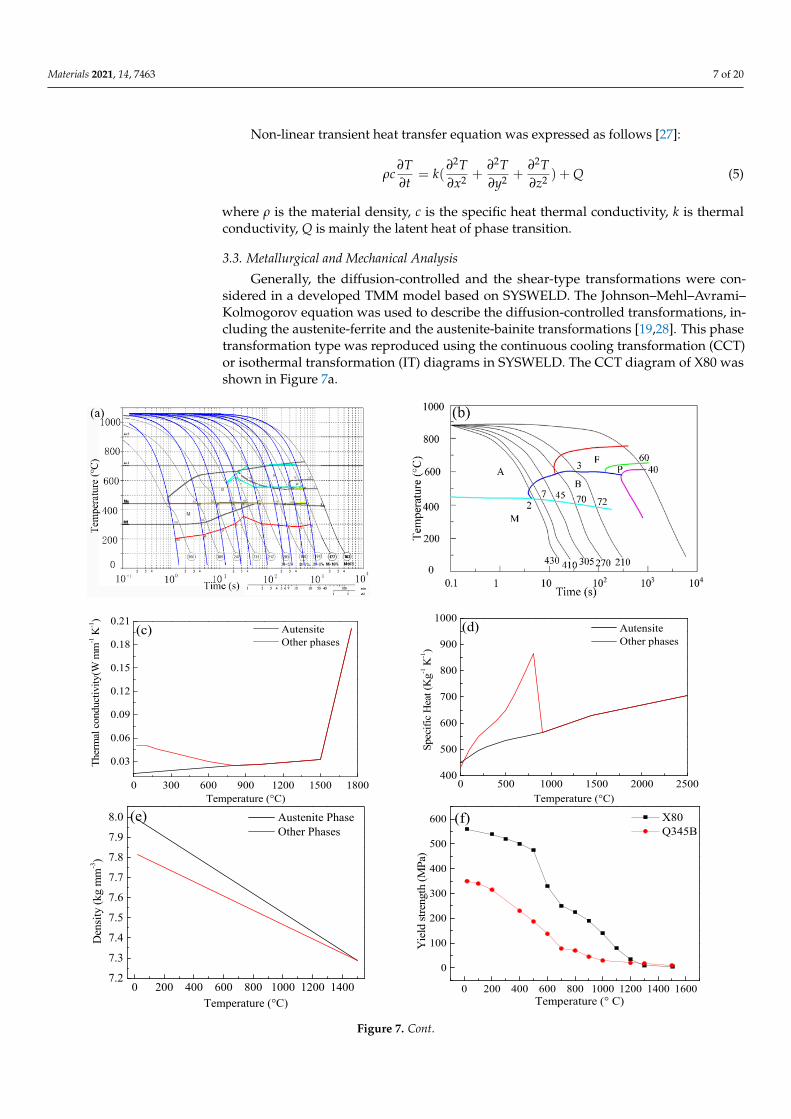
Generally, the diffusion-controlled and the shear-type transformations were con-sidered in a developed TMM model based on SYSWELD. The Johnson–Mehl–Avrami–Kolmogorov equation was used to describe the diffusion-controlled transformations, in-cluding the austenite-ferrite and the austenite-bainite transformations [19,28]. This phasetransformation type was reproduced using the continuous cooling transformation (CCT)or isothermal transformation (IT) diagrams in SYSWELD. The CCT diagram of X80 wasshown in Figure 7a.
Materials 2021, 14, 7463 8 of 21
mogorov equation was used to describe the diffusion-controlled transformations, includ-ing the austenite-ferrite and the austenite-bainite transformations [19,28]. This phase transformation type was reproduced using the continuous cooling transformation (CCT) or isothermal transformation (IT) diagrams in SYSWELD. The CCT diagram of X80 was shown in Figure 7a.
0 300 600 900 1200 1500 1800
0.03
0.06
0.09
0.12
0.15
0.18
0.21
Ther
mal
con
duct
ivity
(W m
m-1 K
-1)
Temperature (°C)
Autensite Other phases
(c)
0 500 1000 1500 2000 2500
400
500
600
700
800
900
1000
Spec
ific
Hea
t (K
g-1 K
-1)
Temperature (°C)
Autensite Other phases
(d)
0 200 400 600 800 1000 1200 14007.2
7.3
7.4
7.5
7.6
7.7
7.8
7.9
8.0
Den
sity
(kg
mm
-3)
Temperature (°C)
Austenite Phase Other Phases
(e)
0 200 400 600 800 1000 1200 1400 1600
0
100
200
300
400
500
600
Yie
ld st
reng
th (M
Pa)
Temperature (° C)
X80 Q345B
(f)
Figure 7. Cont.
Materials 2021, 14, 7463 8 of 20Materials 2021, 14, 7463 9 of 21
0.0 0.2 0.4 0.6 0.8 1.0 1.20
50
100
150
200
250
300
350
Plas
tic st
ress
(MPa
)
Plastic strain
20 200 300 400 500 600 700 800 900 1000 1100 1200 1300
(g) Q345B
0.0 0.2 0.4 0.6 0.8 1.0 1.2
0
50
100
150
200
250
300
Plas
tic st
ress
(MPa
)
Plastic strain
20 200 300 400 500 600 700 800 900 1000 1100 1200 1300
(h) X80
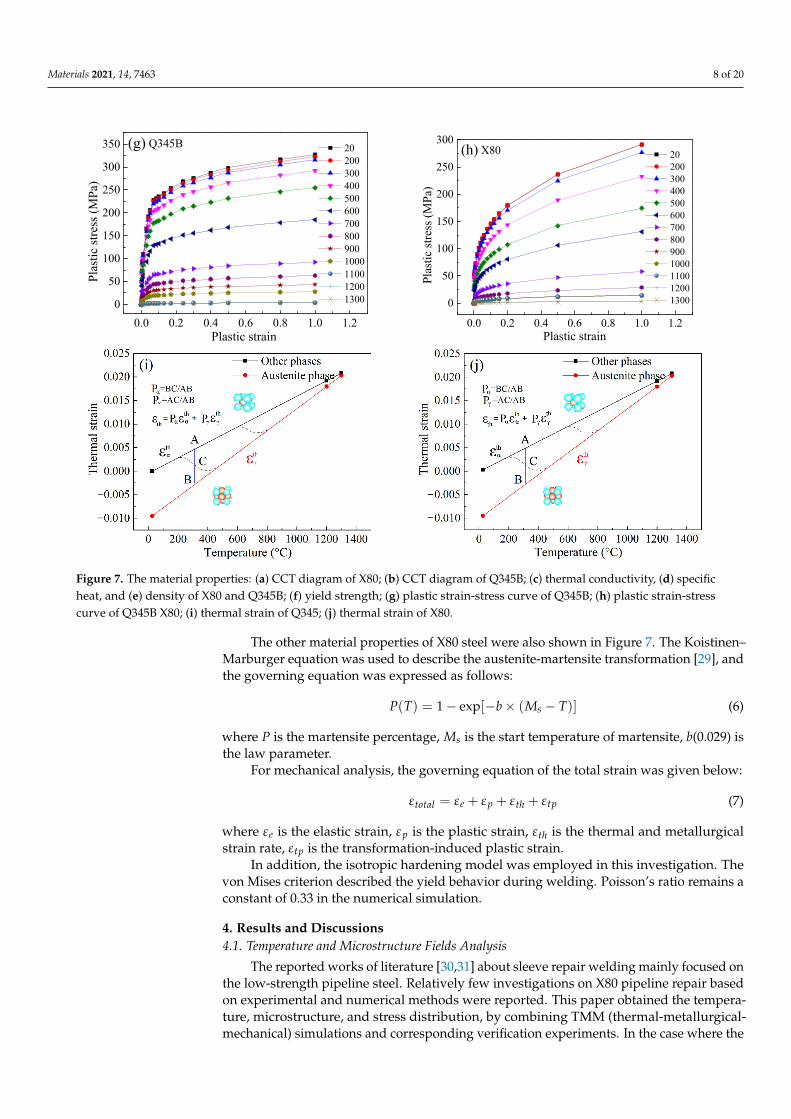
Figure 7. The material properties: (a) CCT diagram of X80; (b) CCT diagram of Q345B; (c) thermal conductivity, (d) specific heat, and (e) density of X80 and Q345B; (f) yield strength; (g) plastic strain-stress curve of Q345B; (h) plastic strain-stress curve of Q345B X80; (i) thermal strain of Q345; (j) thermal strain of X80.
The other material properties of X80 steel were also shown in Figure 7. The Koist-inen–Marburger equation was used to describe the austenite-martensite transformation [29], and the governing equation was expressed as follows:
( ) 1 exp[ ( )]sP T b M T= − − × − (6)
where P is the martensite percentage, sM is the start temperature of martensite, 𝑏(0.029) is the law parameter. For mechanical analysis, the governing equation of the total strain was given below:
total e p th tpε ε ε ε ε= + + + (7)
where eε is the elastic strain, pε is the plastic strain, thε is the thermal and metallurgi-
cal strain rate, tpε is the transformation-induced plastic strain. In addition, the isotropic hardening model was employed in this investigation. The
von Mises criterion described the yield behavior during welding. Poisson’s ratio remains a constant of 0.33 in the numerical simulation.
4. Results and Discussions 4.1. Temperature and Microstructure Fields Analysis
The reported works of literature [30,31] about sleeve repair welding mainly focused on the low-strength pipeline steel. Relatively few investigations on X80 pipeline repair based on experimental and numerical methods were reported. This paper obtained the
Figure 7. The material properties: (a) CCT diagram of X80; (b) CCT diagram of Q345B; (c) thermal conductivity, (d) specificheat, and (e) density of X80 and Q345B; (f) yield strength; (g) plastic strain-stress curve of Q345B; (h) plastic strain-stresscurve of Q345B X80; (i) thermal strain of Q345; (j) thermal strain of X80.
The other material properties of X80 steel were also shown in Figure 7. The Koistinen–Marburger equation was used to describe the austenite-martensite transformation [29], andthe governing equation was expressed as follows:
P(T) = 1− exp[−b× (Ms − T)] (6)
where P is the martensite percentage, Ms is the start temperature of martensite, b(0.029) isthe law parameter.
For mechanical analysis, the governing equation of the total strain was given below:
εtotal = εe + εp + εth + εtp (7)
where εe is the elastic strain, εp is the plastic strain, εth is the thermal and metallurgicalstrain rate, εtp is the transformation-induced plastic strain.
In addition, the isotropic hardening model was employed in this investigation. Thevon Mises criterion described the yield behavior during welding. Poisson’s ratio remains aconstant of 0.33 in the numerical simulation.
4. Results and Discussions4.1. Temperature and Microstructure Fields Analysis
The reported works of literature [30,31] about sleeve repair welding mainly focused onthe low-strength pipeline steel. Relatively few investigations on X80 pipeline repair basedon experimental and numerical methods were reported. This paper obtained the tempera-ture, microstructure, and stress distribution, by combining TMM (thermal-metallurgical-mechanical) simulations and corresponding verification experiments. In the case where the
Materials 2021, 14, 7463 9 of 20
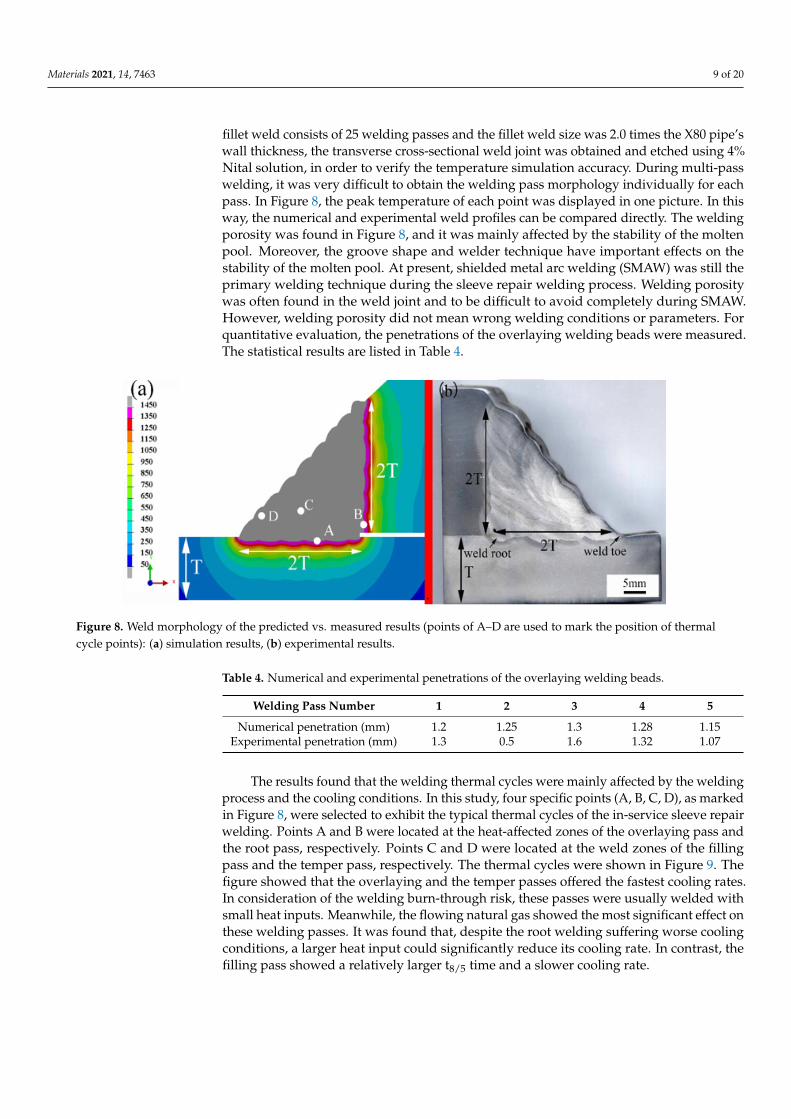
fillet weld consists of 25 welding passes and the fillet weld size was 2.0 times the X80 pipe’swall thickness, the transverse cross-sectional weld joint was obtained and etched using 4%Nital solution, in order to verify the temperature simulation accuracy. During multi-passwelding, it was very difficult to obtain the welding pass morphology individually for eachpass. In Figure 8, the peak temperature of each point was displayed in one picture. In thisway, the numerical and experimental weld profiles can be compared directly. The weldingporosity was found in Figure 8, and it was mainly affected by the stability of the moltenpool. Moreover, the groove shape and welder technique have important effects on thestability of the molten pool. At present, shielded metal arc welding (SMAW) was still theprimary welding technique during the sleeve repair welding process. Welding porositywas often found in the weld joint and to be difficult to avoid completely during SMAW.However, welding porosity did not mean wrong welding conditions or parameters. Forquantitative evaluation, the penetrations of the overlaying welding beads were measured.The statistical results are listed in Table 4.
Materials 2021, 14, 7463 10 of 21
temperature, microstructure, and stress distribution, by combining TMM (thermal-metal-lurgical-mechanical) simulations and corresponding verification experiments. In the case where the fillet weld consists of 25 welding passes and the fillet weld size was 2.0 times the X80 pipe’s wall thickness, the transverse cross-sectional weld joint was obtained and etched using 4 % Nital solution, in order to verify the temperature simulation accuracy. During multi-pass welding, it was very difficult to obtain the welding pass morphology individually for each pass. In Figure 8, the peak temperature of each point was displayed in one picture. In this way, the numerical and experimental weld profiles can be compared directly. The welding porosity was found in Figure 8, and it was mainly affected by the stability of the molten pool. Moreover, the groove shape and welder technique have im-portant effects on the stability of the molten pool. At present, shielded metal arc welding (SMAW) was still the primary welding technique during the sleeve repair welding pro-cess. Welding porosity was often found in the weld joint and to be difficult to avoid com-pletely during SMAW. However, welding porosity did not mean wrong welding condi-tions or parameters. For quantitative evaluation, the penetrations of the overlaying weld-ing beads were measured. The statistical results are listed in Table 4.
Figure 8. Weld morphology of the predicted vs. measured results (points of A-D are used to mark the position of ther-
mal cycle points): (a) simulation results, (b) experimental results.
Table 4. Numerical and experimental penetrations of the overlaying welding beads.
Welding Pass Number 1 2 3 4 5 Numerical penetration
(mm) 1.2 1.25 1.3 1.28 1.15
Experimental penetration (mm) 1.3 0.5 1.6 1.32 1.07
The results found that the welding thermal cycles were mainly affected by the weld-ing process and the cooling conditions. In this study, four specific points (A, B, C, D), as marked in Figure 8, were selected to exhibit the typical thermal cycles of the in-service sleeve repair welding. Points A and B were located at the heat-affected zones of the over-laying pass and the root pass, respectively. Points C and D were located at the weld zones of the filling pass and the temper pass, respectively. The thermal cycles were shown in Figure 9. The figure showed that the overlaying and the temper passes offered the fastest cooling rates. In consideration of the welding burn-through risk, these passes were usu-ally welded with small heat inputs. Meanwhile, the flowing natural gas showed the most significant effect on these welding passes. It was found that, despite the root welding suf-fering worse cooling conditions, a larger heat input could significantly reduce its cooling
Figure 8. Weld morphology of the predicted vs. measured results (points of A–D are used to mark the position of thermalcycle points): (a) simulation results, (b) experimental results.
Table 4. Numerical and experimental penetrations of the overlaying welding beads.
Welding Pass Number 1 2 3 4 5
Numerical penetration (mm) 1.2 1.25 1.3 1.28 1.15Experimental penetration (mm) 1.3 0.5 1.6 1.32 1.07
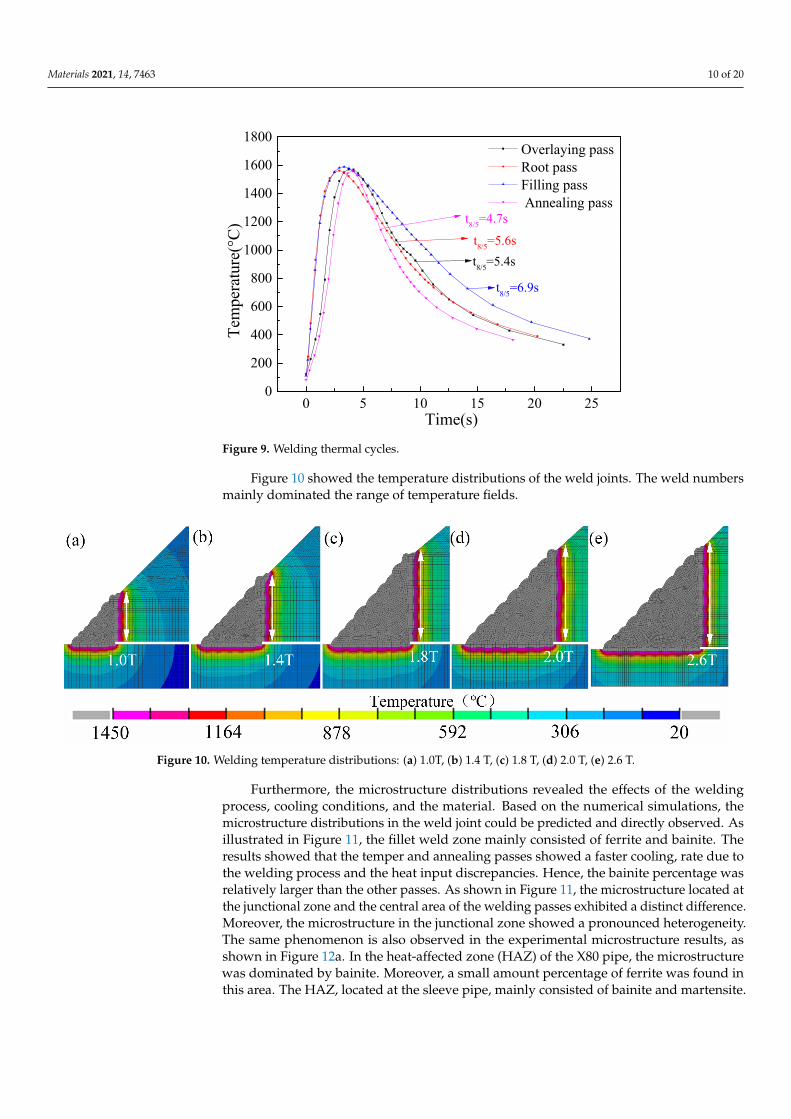
The results found that the welding thermal cycles were mainly affected by the weldingprocess and the cooling conditions. In this study, four specific points (A, B, C, D), as markedin Figure 8, were selected to exhibit the typical thermal cycles of the in-service sleeve repairwelding. Points A and B were located at the heat-affected zones of the overlaying pass andthe root pass, respectively. Points C and D were located at the weld zones of the fillingpass and the temper pass, respectively. The thermal cycles were shown in Figure 9. Thefigure showed that the overlaying and the temper passes offered the fastest cooling rates.In consideration of the welding burn-through risk, these passes were usually welded withsmall heat inputs. Meanwhile, the flowing natural gas showed the most significant effect onthese welding passes. It was found that, despite the root welding suffering worse coolingconditions, a larger heat input could significantly reduce its cooling rate. In contrast, thefilling pass showed a relatively larger t8/5 time and a slower cooling rate.
Materials 2021, 14, 7463 10 of 20
Materials 2021, 14, 7463 11 of 21
rate. In contrast, the filling pass showed a relatively larger t8/5 time and a slower cooling rate.
0 5 10 15 20 250
200
400
600
800
1000
1200
1400
1600
1800
t8/5=4.7st8/5=5.6s
t8/5=6.9s
Tem
pera
ture
(°C)
Time(s)
Overlaying pass Root pass Filling pass Annealing pass
t8/5=5.4s
Figure 9. Welding thermal cycles.
Figure 10 showed the temperature distributions of the weld joints. The weld numbers mainly dominated the range of temperature fields.
Figure 10. Welding temperature distributions: (a) 1.0T, (b) 1.4T, (c) 1.8T, (d) 2.0T, (e) 2.6T.
Furthermore, the microstructure distributions revealed the effects of the welding pro-cess, cooling conditions, and the material. Based on the numerical simulations, the micro-structure distributions in the weld joint could be predicted and directly observed. As il-lustrated in Figure 11, the fillet weld zone mainly consisted of ferrite and bainite. The results showed that the temper and annealing passes showed a faster cooling, rate due to the welding process and the heat input discrepancies. Hence, the bainite percentage was relatively larger than the other passes. As shown in Figure 11, the microstructure located at the junctional zone and the central area of the welding passes exhibited a distinct dif-ference. Moreover, the microstructure in the junctional zone showed a pronounced heter-ogeneity. The same phenomenon is also observed in the experimental microstructure re-sults, as shown in Figure 12a. In the heat-affected zone (HAZ) of the X80 pipe, the micro-structure was dominated by bainite. Moreover, a small amount percentage of ferrite was
Figure 9. Welding thermal cycles.
Figure 10 showed the temperature distributions of the weld joints. The weld numbersmainly dominated the range of temperature fields.
Materials 2021, 14, 7463 11 of 21
rate. In contrast, the filling pass showed a relatively larger t8/5 time and a slower cooling rate.
0 5 10 15 20 250
200
400
600
800
1000
1200
1400
1600
1800
t8/5=4.7st8/5=5.6s
t8/5=6.9s
Tem
pera
ture
(°C)
Time(s)
Overlaying pass Root pass Filling pass Annealing pass
t8/5=5.4s
Figure 9. Welding thermal cycles.
Figure 10 showed the temperature distributions of the weld joints. The weld numbers mainly dominated the range of temperature fields.
Figure 10. Welding temperature distributions: (a) 1.0T, (b) 1.4T, (c) 1.8T, (d) 2.0T, (e) 2.6T.
Furthermore, the microstructure distributions revealed the effects of the welding pro-cess, cooling conditions, and the material. Based on the numerical simulations, the micro-structure distributions in the weld joint could be predicted and directly observed. As il-lustrated in Figure 11, the fillet weld zone mainly consisted of ferrite and bainite. The results showed that the temper and annealing passes showed a faster cooling, rate due to the welding process and the heat input discrepancies. Hence, the bainite percentage was relatively larger than the other passes. As shown in Figure 11, the microstructure located at the junctional zone and the central area of the welding passes exhibited a distinct dif-ference. Moreover, the microstructure in the junctional zone showed a pronounced heter-ogeneity. The same phenomenon is also observed in the experimental microstructure re-sults, as shown in Figure 12a. In the heat-affected zone (HAZ) of the X80 pipe, the micro-structure was dominated by bainite. Moreover, a small amount percentage of ferrite was
Figure 10. Welding temperature distributions: (a) 1.0T, (b) 1.4 T, (c) 1.8 T, (d) 2.0 T, (e) 2.6 T.
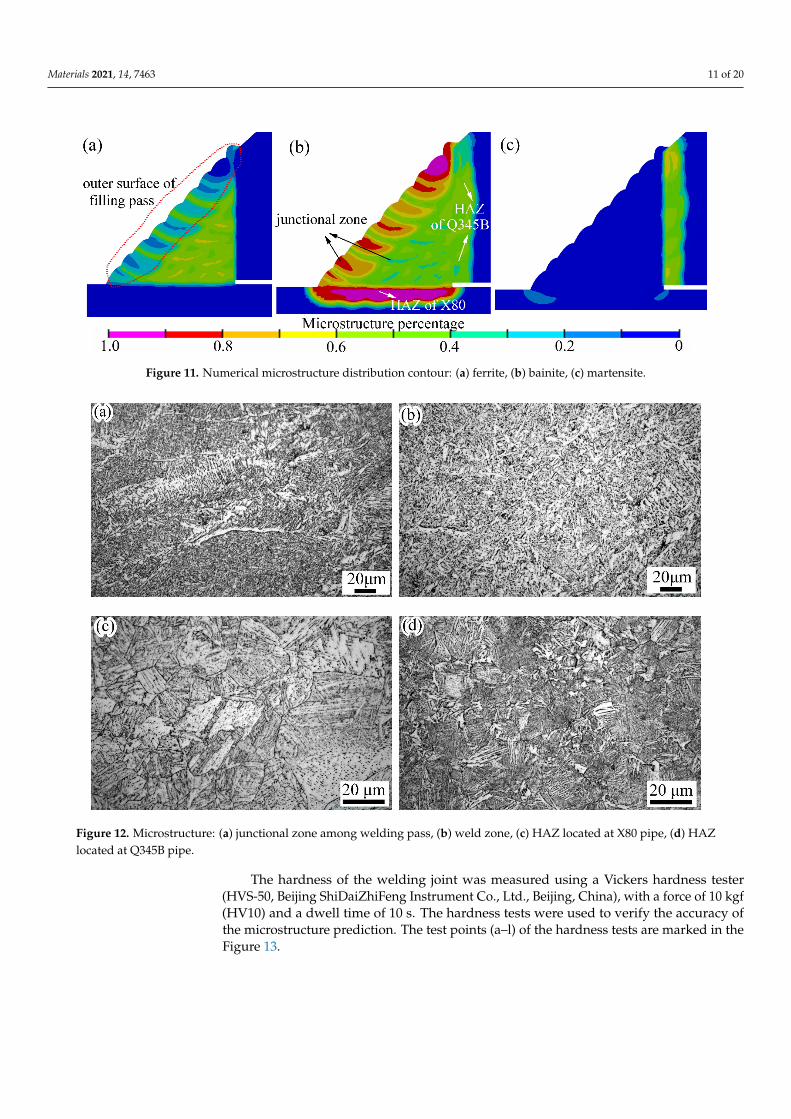
Furthermore, the microstructure distributions revealed the effects of the weldingprocess, cooling conditions, and the material. Based on the numerical simulations, themicrostructure distributions in the weld joint could be predicted and directly observed. Asillustrated in Figure 11, the fillet weld zone mainly consisted of ferrite and bainite. Theresults showed that the temper and annealing passes showed a faster cooling, rate due tothe welding process and the heat input discrepancies. Hence, the bainite percentage wasrelatively larger than the other passes. As shown in Figure 11, the microstructure located atthe junctional zone and the central area of the welding passes exhibited a distinct difference.Moreover, the microstructure in the junctional zone showed a pronounced heterogeneity.The same phenomenon is also observed in the experimental microstructure results, asshown in Figure 12a. In the heat-affected zone (HAZ) of the X80 pipe, the microstructurewas dominated by bainite. Moreover, a small amount percentage of ferrite was found inthis area. The HAZ, located at the sleeve pipe, mainly consisted of bainite and martensite.
Materials 2021, 14, 7463 11 of 20
Materials 2021, 14, 7463 12 of 21
found in this area. The HAZ, located at the sleeve pipe, mainly consisted of bainite and martensite.
Figure 11. Numerical microstructure distribution contour: (a) ferrite, (b) bainite, (c) martensite.
Figure 12. Microstructure: (a) junctional zone among welding pass, (b) weld zone, (c) HAZ located at X80 pipe, (d) HAZ located at Q345B pipe.
The hardness of the welding joint was measured using a Vickers hardness tester (HVS-50, Beijing ShiDaiZhiFeng Instrument Co., Ltd., Beijing, China), with a force of 10 kgf (HV10) and a dwell time of 10 s. The hardness tests were used to verify the accuracy of the microstructure prediction. The test points (a-l) of the hardness tests are marked in the Figure 13.
Figure 11. Numerical microstructure distribution contour: (a) ferrite, (b) bainite, (c) martensite.
Materials 2021, 14, 7463 12 of 21
found in this area. The HAZ, located at the sleeve pipe, mainly consisted of bainite and martensite.
Figure 11. Numerical microstructure distribution contour: (a) ferrite, (b) bainite, (c) martensite.
Figure 12. Microstructure: (a) junctional zone among welding pass, (b) weld zone, (c) HAZ located at X80 pipe, (d) HAZ located at Q345B pipe.
The hardness of the welding joint was measured using a Vickers hardness tester (HVS-50, Beijing ShiDaiZhiFeng Instrument Co., Ltd., Beijing, China), with a force of 10 kgf (HV10) and a dwell time of 10 s. The hardness tests were used to verify the accuracy of the microstructure prediction. The test points (a-l) of the hardness tests are marked in the Figure 13.
Figure 12. Microstructure: (a) junctional zone among welding pass, (b) weld zone, (c) HAZ located at X80 pipe, (d) HAZlocated at Q345B pipe.
The hardness of the welding joint was measured using a Vickers hardness tester(HVS-50, Beijing ShiDaiZhiFeng Instrument Co., Ltd., Beijing, China), with a force of 10 kgf(HV10) and a dwell time of 10 s. The hardness tests were used to verify the accuracy ofthe microstructure prediction. The test points (a–l) of the hardness tests are marked in theFigure 13.
Materials 2021, 14, 7463 12 of 20Materials 2021, 14, 7463 13 of 21
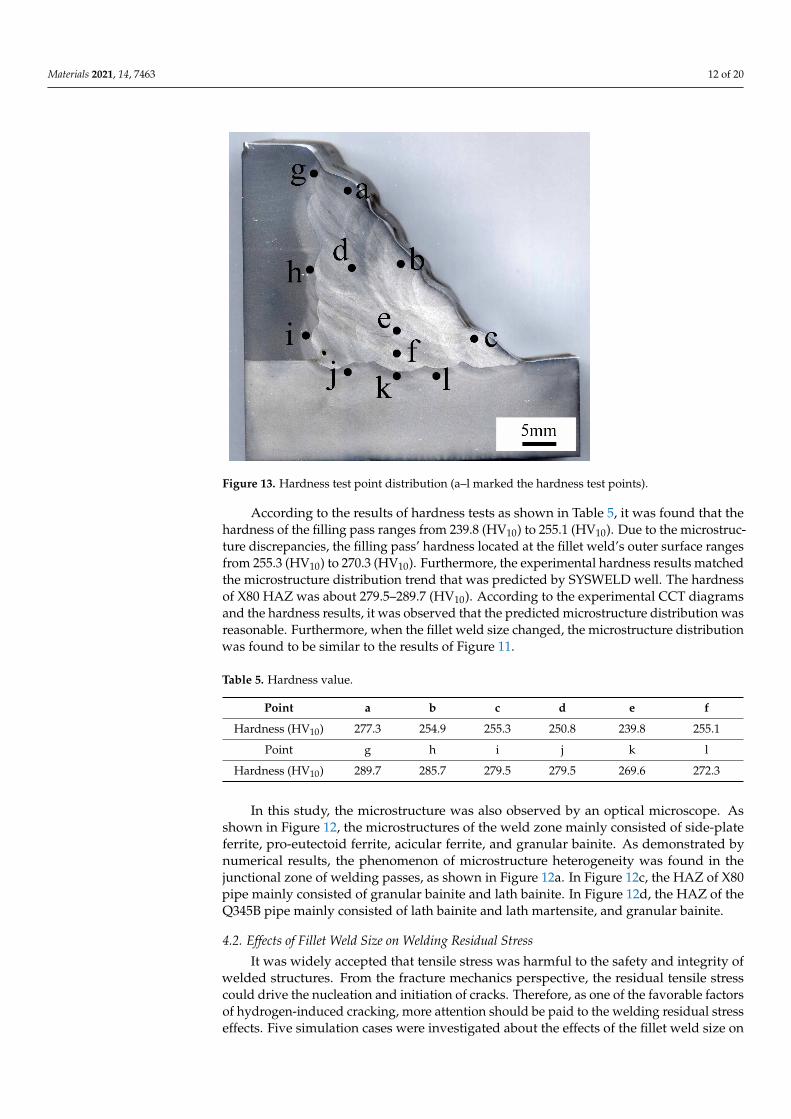
Figure 13. Hardness test point distribution (a–l marked the hardness test points).
According to the results of hardness tests as shown in Table 5, it was found that the hardness of the filling pass ranges from 239.8 (HV10) to 255.1 (HV10). Due to the micro-structure discrepancies, the filling pass’ hardness located at the fillet weld’s outer surface ranges from 255.3 (HV10) to 270.3 (HV10). Furthermore, the experimental hardness results matched the microstructure distribution trend that was predicted by SYSWELD well. The hardness of X80 HAZ was about 279.5–289.7 (HV10). According to the experimental CCT diagrams and the hardness results, it was observed that the predicted microstructure dis-tribution was reasonable. Furthermore, when the fillet weld size changed, the microstruc-ture distribution was found to be similar to the results of Figure 11.
Table 5. Hardness value.
Point a b c d e f Hardness
(HV10) 277.3 254.9 255.3 250.8 239.8 255.1
Point g h i j k l Hardness
(HV10) 289.7 285.7 279.5 279.5 269.6 272.3
In this study, the microstructure was also observed by an optical microscope. As shown in Figure 12, the microstructures of the weld zone mainly consisted of side-plate ferrite, pro-eutectoid ferrite, acicular ferrite, and granular bainite. As demonstrated by numerical results, the phenomenon of microstructure heterogeneity was found in the junctional zone of welding passes, as shown in Figure 12a. In Figure 12c, the HAZ of X80 pipe mainly consisted of granular bainite and lath bainite. In Figure 12d, the HAZ of the Q345B pipe mainly consisted of lath bainite and lath martensite, and granular bainite.
4.2. Effects of Fillet Weld Size on Welding Residual Stress It was widely accepted that tensile stress was harmful to the safety and integrity of
welded structures. From the fracture mechanics perspective, the residual tensile stress could drive the nucleation and initiation of cracks. Therefore, as one of the favorable fac-tors of hydrogen-induced cracking, more attention should be paid to the welding residual
Figure 13. Hardness test point distribution (a–l marked the hardness test points).
According to the results of hardness tests as shown in Table 5, it was found that thehardness of the filling pass ranges from 239.8 (HV10) to 255.1 (HV10). Due to the microstruc-ture discrepancies, the filling pass’ hardness located at the fillet weld’s outer surface rangesfrom 255.3 (HV10) to 270.3 (HV10). Furthermore, the experimental hardness results matchedthe microstructure distribution trend that was predicted by SYSWELD well. The hardnessof X80 HAZ was about 279.5–289.7 (HV10). According to the experimental CCT diagramsand the hardness results, it was observed that the predicted microstructure distribution wasreasonable. Furthermore, when the fillet weld size changed, the microstructure distributionwas found to be similar to the results of Figure 11.
Table 5. Hardness value.
Point a b c d e f
Hardness (HV10) 277.3 254.9 255.3 250.8 239.8 255.1
Point g h i j k l
Hardness (HV10) 289.7 285.7 279.5 279.5 269.6 272.3
In this study, the microstructure was also observed by an optical microscope. Asshown in Figure 12, the microstructures of the weld zone mainly consisted of side-plateferrite, pro-eutectoid ferrite, acicular ferrite, and granular bainite. As demonstrated bynumerical results, the phenomenon of microstructure heterogeneity was found in thejunctional zone of welding passes, as shown in Figure 12a. In Figure 12c, the HAZ of X80pipe mainly consisted of granular bainite and lath bainite. In Figure 12d, the HAZ of theQ345B pipe mainly consisted of lath bainite and lath martensite, and granular bainite.
4.2. Effects of Fillet Weld Size on Welding Residual Stress
It was widely accepted that tensile stress was harmful to the safety and integrity ofwelded structures. From the fracture mechanics perspective, the residual tensile stresscould drive the nucleation and initiation of cracks. Therefore, as one of the favorable factorsof hydrogen-induced cracking, more attention should be paid to the welding residual stresseffects. Five simulation cases were investigated about the effects of the fillet weld size on
Materials 2021, 14, 7463 13 of 20
the welding residual stress, as listed in Table 6. In these simulation cases, pipeline pressurewas set as 7 MPa. The residual stress results were compared in an in-service state with apipeline pressure of 7 MPa.
Table 6. Simulation cases.
Case A B C D E
Welding fillet size 1.0 T 1.4 T 1.8 T 2.0 T 2.6 T
Note: T (15.3 mm) is the wall thickness of the X80 pipe.
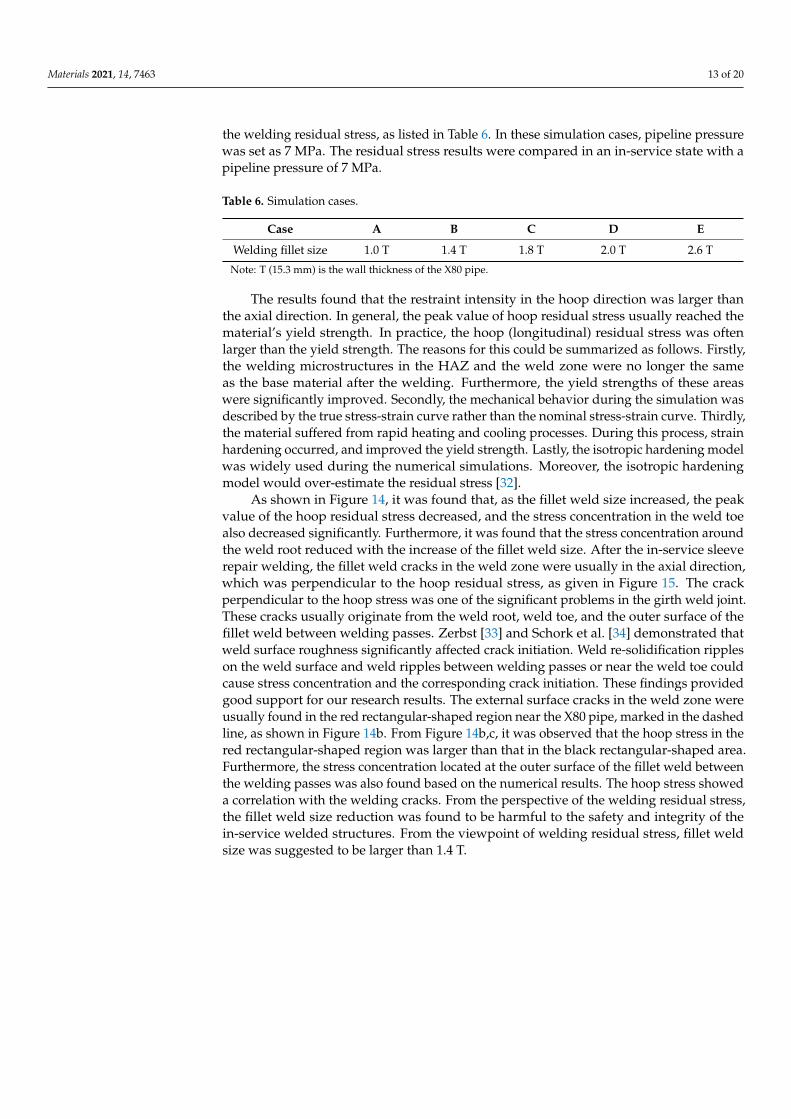
The results found that the restraint intensity in the hoop direction was larger thanthe axial direction. In general, the peak value of hoop residual stress usually reached thematerial’s yield strength. In practice, the hoop (longitudinal) residual stress was oftenlarger than the yield strength. The reasons for this could be summarized as follows. Firstly,the welding microstructures in the HAZ and the weld zone were no longer the sameas the base material after the welding. Furthermore, the yield strengths of these areaswere significantly improved. Secondly, the mechanical behavior during the simulation wasdescribed by the true stress-strain curve rather than the nominal stress-strain curve. Thirdly,the material suffered from rapid heating and cooling processes. During this process, strainhardening occurred, and improved the yield strength. Lastly, the isotropic hardening modelwas widely used during the numerical simulations. Moreover, the isotropic hardeningmodel would over-estimate the residual stress [32].
As shown in Figure 14, it was found that, as the fillet weld size increased, the peakvalue of the hoop residual stress decreased, and the stress concentration in the weld toealso decreased significantly. Furthermore, it was found that the stress concentration aroundthe weld root reduced with the increase of the fillet weld size. After the in-service sleeverepair welding, the fillet weld cracks in the weld zone were usually in the axial direction,which was perpendicular to the hoop residual stress, as given in Figure 15. The crackperpendicular to the hoop stress was one of the significant problems in the girth weld joint.These cracks usually originate from the weld root, weld toe, and the outer surface of thefillet weld between welding passes. Zerbst [33] and Schork et al. [34] demonstrated thatweld surface roughness significantly affected crack initiation. Weld re-solidification rippleson the weld surface and weld ripples between welding passes or near the weld toe couldcause stress concentration and the corresponding crack initiation. These findings providedgood support for our research results. The external surface cracks in the weld zone wereusually found in the red rectangular-shaped region near the X80 pipe, marked in the dashedline, as shown in Figure 14b. From Figure 14b,c, it was observed that the hoop stress in thered rectangular-shaped region was larger than that in the black rectangular-shaped area.Furthermore, the stress concentration located at the outer surface of the fillet weld betweenthe welding passes was also found based on the numerical results. The hoop stress showeda correlation with the welding cracks. From the perspective of the welding residual stress,the fillet weld size reduction was found to be harmful to the safety and integrity of thein-service welded structures. From the viewpoint of welding residual stress, fillet weldsize was suggested to be larger than 1.4 T.
Materials 2021, 14, 7463 14 of 20Materials 2021, 14, 7463 15 of 21
Figure 14. Hoop residual stress distribution: (a) case A, (b) case B, (c) case C, (d) case D, (e) case E.
Figure 15. Fillet weld cracks in the weld zone: (a) cracks found on the outer surface, (b) cracks at the weld toe.
Figure 16 showed the distribution contours of the axial residual stresses on the mid-dle transverse cross-section of the fillet weld joint. It was found that the stress concentra-tions that were induced by the geometrical shape changes were found in the locations of the weld toe and the weld root. Furthermore, it was found that, with the increase of the weld fillet size, the peak value of the axial residual stress decreased, and the stress distri-bution became uniform. It was also found that the stress concentration was reduced.
Figure 16. Axial residual stress distribution: (a) case A, (b) case B, (c) case C, (d) case D, (e) case E.
Compared to the non-destructive residual stress methods, the hole-drilling strain gauge method (HDM) was usually reliable and economical. In this research, HDM was chosen to characterize the residual stress distribution at the fillet weld zone. A schematic diagram was provided, as shown in Figure 17. Before residual stress measurement, the surface of the fillet weld zone was carefully polished. Thereafter, the strain gauges were stuck to the polished area. In practice, residual stress in the same welding pass usually had the same or similar values. The simulation results and theory also supported this law. This research arranged three or more strain gauges at the same welding pass to obtain
Figure 14. Hoop residual stress distribution: (a) case A, (b) case B, (c) case C, (d) case D, (e) case E.
Materials 2021, 14, 7463 15 of 21
Figure 14. Hoop residual stress distribution: (a) case A, (b) case B, (c) case C, (d) case D, (e) case E.
Figure 15. Fillet weld cracks in the weld zone: (a) cracks found on the outer surface, (b) cracks at the weld toe.
Figure 16 showed the distribution contours of the axial residual stresses on the mid-dle transverse cross-section of the fillet weld joint. It was found that the stress concentra-tions that were induced by the geometrical shape changes were found in the locations of the weld toe and the weld root. Furthermore, it was found that, with the increase of the weld fillet size, the peak value of the axial residual stress decreased, and the stress distri-bution became uniform. It was also found that the stress concentration was reduced.
Figure 16. Axial residual stress distribution: (a) case A, (b) case B, (c) case C, (d) case D, (e) case E.
Compared to the non-destructive residual stress methods, the hole-drilling strain gauge method (HDM) was usually reliable and economical. In this research, HDM was chosen to characterize the residual stress distribution at the fillet weld zone. A schematic diagram was provided, as shown in Figure 17. Before residual stress measurement, the surface of the fillet weld zone was carefully polished. Thereafter, the strain gauges were stuck to the polished area. In practice, residual stress in the same welding pass usually had the same or similar values. The simulation results and theory also supported this law. This research arranged three or more strain gauges at the same welding pass to obtain
Figure 15. Fillet weld cracks in the weld zone: (a) cracks found on the outer surface, (b) cracks at the weld toe.
Figure 16 showed the distribution contours of the axial residual stresses on the middletransverse cross-section of the fillet weld joint. It was found that the stress concentrationsthat were induced by the geometrical shape changes were found in the locations of theweld toe and the weld root. Furthermore, it was found that, with the increase of the weldfillet size, the peak value of the axial residual stress decreased, and the stress distributionbecame uniform. It was also found that the stress concentration was reduced.
Materials 2021, 14, 7463 15 of 21
Figure 14. Hoop residual stress distribution: (a) case A, (b) case B, (c) case C, (d) case D, (e) case E.
Figure 15. Fillet weld cracks in the weld zone: (a) cracks found on the outer surface, (b) cracks at the weld toe.
Figure 16 showed the distribution contours of the axial residual stresses on the mid-dle transverse cross-section of the fillet weld joint. It was found that the stress concentra-tions that were induced by the geometrical shape changes were found in the locations of the weld toe and the weld root. Furthermore, it was found that, with the increase of the weld fillet size, the peak value of the axial residual stress decreased, and the stress distri-bution became uniform. It was also found that the stress concentration was reduced.
Figure 16. Axial residual stress distribution: (a) case A, (b) case B, (c) case C, (d) case D, (e) case E.
Compared to the non-destructive residual stress methods, the hole-drilling strain gauge method (HDM) was usually reliable and economical. In this research, HDM was chosen to characterize the residual stress distribution at the fillet weld zone. A schematic diagram was provided, as shown in Figure 17. Before residual stress measurement, the surface of the fillet weld zone was carefully polished. Thereafter, the strain gauges were stuck to the polished area. In practice, residual stress in the same welding pass usually had the same or similar values. The simulation results and theory also supported this law. This research arranged three or more strain gauges at the same welding pass to obtain
Figure 16. Axial residual stress distribution: (a) case A, (b) case B, (c) case C, (d) case D, (e) case E.
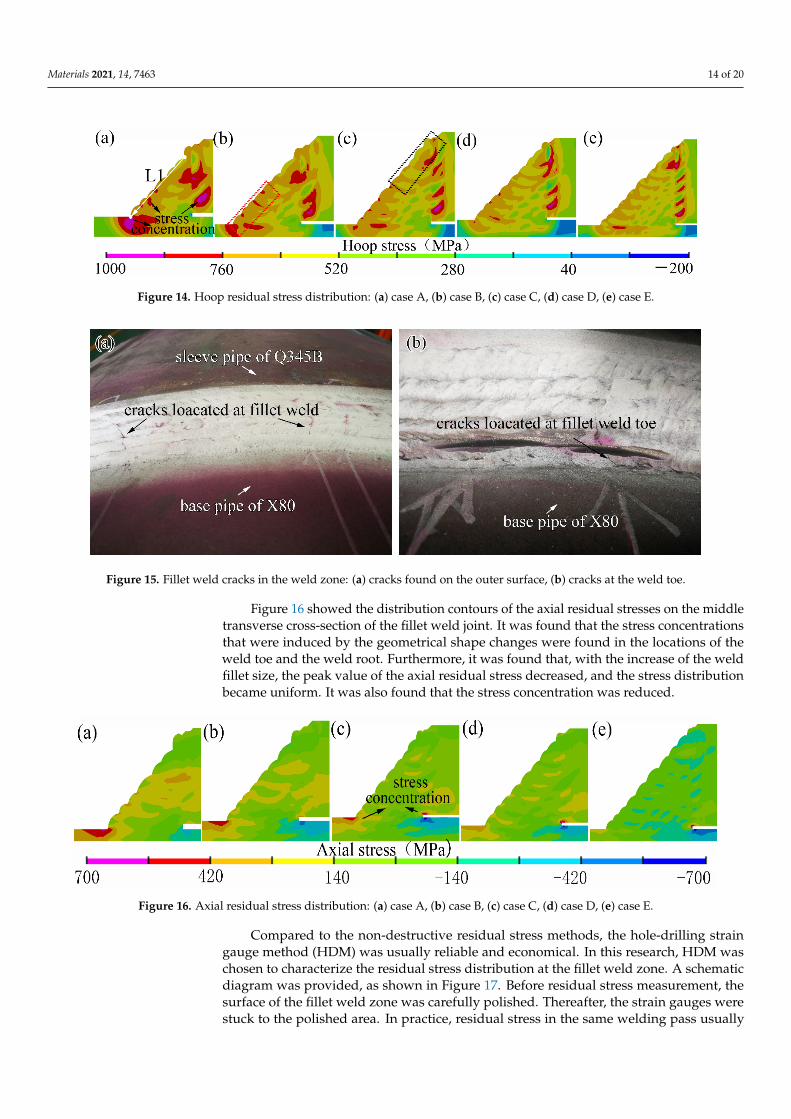
Compared to the non-destructive residual stress methods, the hole-drilling straingauge method (HDM) was usually reliable and economical. In this research, HDM waschosen to characterize the residual stress distribution at the fillet weld zone. A schematicdiagram was provided, as shown in Figure 17. Before residual stress measurement, thesurface of the fillet weld zone was carefully polished. Thereafter, the strain gauges werestuck to the polished area. In practice, residual stress in the same welding pass usually
Materials 2021, 14, 7463 15 of 20
had the same or similar values. The simulation results and theory also supported this law.This research arranged three or more strain gauges at the same welding pass to obtainreliable results, as shown in Figure 17. When two or more measurement values weresimilar, these values would be regarded as reliable results, and the average value wasadopted in our research.
Materials 2021, 14, 7463 16 of 21
reliable results, as shown in Figure 17. When two or more measurement values were sim-ilar, these values would be regarded as reliable results, and the average value was adopted in our research.
Figure 17. Schematic diagram of residual stress measurement.
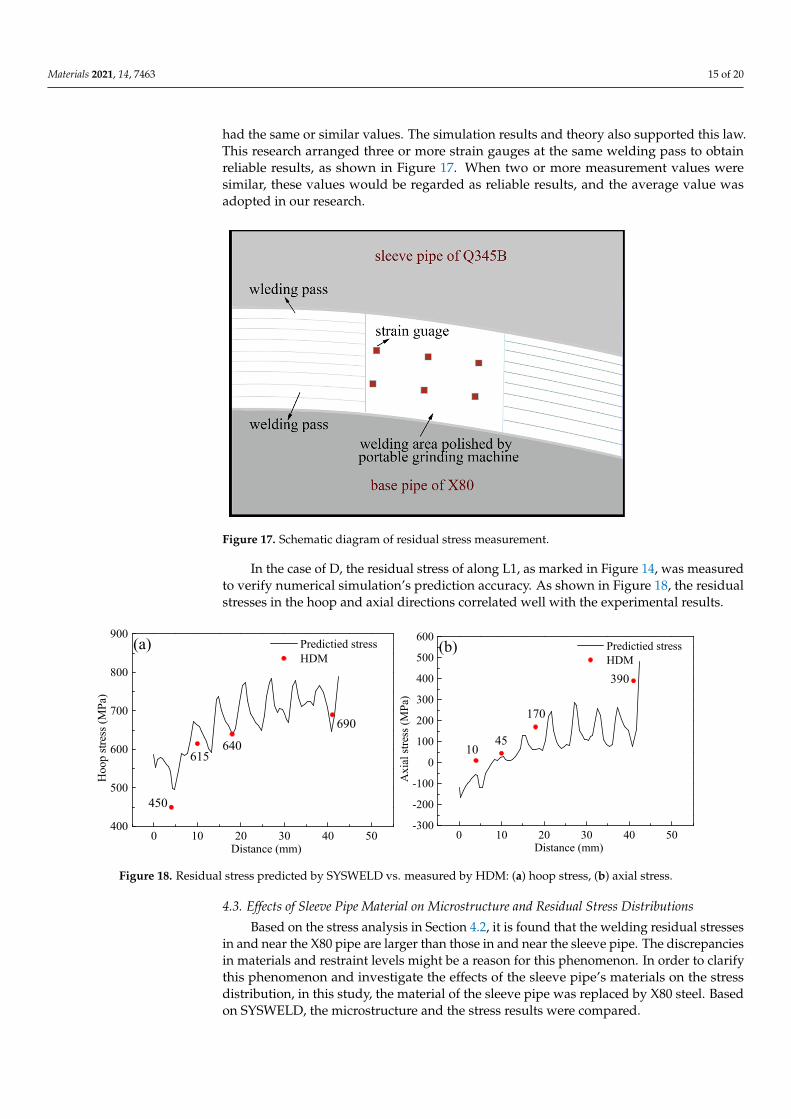
In the case of D, the residual stress of along L1, as marked in Figure 14, was measured to verify numerical simulation’s prediction accuracy. As shown in Figure 18, the residual stresses in the hoop and axial directions correlated well with the experimental results.
0 10 20 30 40 50400
500
600
700
800
900
690
640615
Hoo
p str
ess (
MPa
)
Distance (mm)
Predictied stress HDM
(a)
450
0 10 20 30 40 50-300
-200
-100
0
100
200
300
400
500
600
390
170
45
Axi
al st
ress
(MPa
)
Distance (mm)
Predictied stress HDM
(b)
10
Figure 18. Residual stress predicted by SYSWELD vs. measured by HDM: (a) hoop stress, (b) axial stress.
4.3. Effects of Sleeve Pipe Material on Microstructure and Residual Stress Distributions Based on the stress analysis in Section 4.2, it is found that the welding residual
stresses in and near the X80 pipe are larger than those in and near the sleeve pipe. The discrepancies in materials and restraint levels might be a reason for this phenomenon. In order to clarify this phenomenon and investigate the effects of the sleeve pipe’s materials on the stress distribution, in this study, the material of the sleeve pipe was replaced by X80 steel. Based on SYSWELD, the microstructure and the stress results were compared.
Note that the X80 pipe was usually defined as the base pipe, and the Q345B pipe was usually defined as sleeve pipe, as shown in Figure 1. The microstructure contours were shown in Figure 19. When compared with Figure 11, the microstructure in fillet weld and the HAZ of X80 was found to remain similar to those in Figure 11. In Figure 19b, the HAZ
Figure 17. Schematic diagram of residual stress measurement.
In the case of D, the residual stress of along L1, as marked in Figure 14, was measuredto verify numerical simulation’s prediction accuracy. As shown in Figure 18, the residualstresses in the hoop and axial directions correlated well with the experimental results.
Materials 2021, 14, 7463 16 of 21
reliable results, as shown in Figure 17. When two or more measurement values were sim-ilar, these values would be regarded as reliable results, and the average value was adopted in our research.
Figure 17. Schematic diagram of residual stress measurement.
In the case of D, the residual stress of along L1, as marked in Figure 14, was measured to verify numerical simulation’s prediction accuracy. As shown in Figure 18, the residual stresses in the hoop and axial directions correlated well with the experimental results.
0 10 20 30 40 50400
500
600
700
800
900
690
640615
Hoo
p str
ess (
MPa
)
Distance (mm)
Predictied stress HDM
(a)
450
0 10 20 30 40 50-300
-200
-100
0
100
200
300
400
500
600
390
170
45
Axi
al st
ress
(MPa
)
Distance (mm)
Predictied stress HDM
(b)
10
Figure 18. Residual stress predicted by SYSWELD vs. measured by HDM: (a) hoop stress, (b) axial stress.
4.3. Effects of Sleeve Pipe Material on Microstructure and Residual Stress Distributions Based on the stress analysis in Section 4.2, it is found that the welding residual
stresses in and near the X80 pipe are larger than those in and near the sleeve pipe. The discrepancies in materials and restraint levels might be a reason for this phenomenon. In order to clarify this phenomenon and investigate the effects of the sleeve pipe’s materials on the stress distribution, in this study, the material of the sleeve pipe was replaced by X80 steel. Based on SYSWELD, the microstructure and the stress results were compared.
Note that the X80 pipe was usually defined as the base pipe, and the Q345B pipe was usually defined as sleeve pipe, as shown in Figure 1. The microstructure contours were shown in Figure 19. When compared with Figure 11, the microstructure in fillet weld and the HAZ of X80 was found to remain similar to those in Figure 11. In Figure 19b, the HAZ
Figure 18. Residual stress predicted by SYSWELD vs. measured by HDM: (a) hoop stress, (b) axial stress.
4.3. Effects of Sleeve Pipe Material on Microstructure and Residual Stress Distributions
Based on the stress analysis in Section 4.2, it is found that the welding residual stressesin and near the X80 pipe are larger than those in and near the sleeve pipe. The discrepanciesin materials and restraint levels might be a reason for this phenomenon. In order to clarifythis phenomenon and investigate the effects of the sleeve pipe’s materials on the stressdistribution, in this study, the material of the sleeve pipe was replaced by X80 steel. Basedon SYSWELD, the microstructure and the stress results were compared.
Materials 2021, 14, 7463 16 of 20
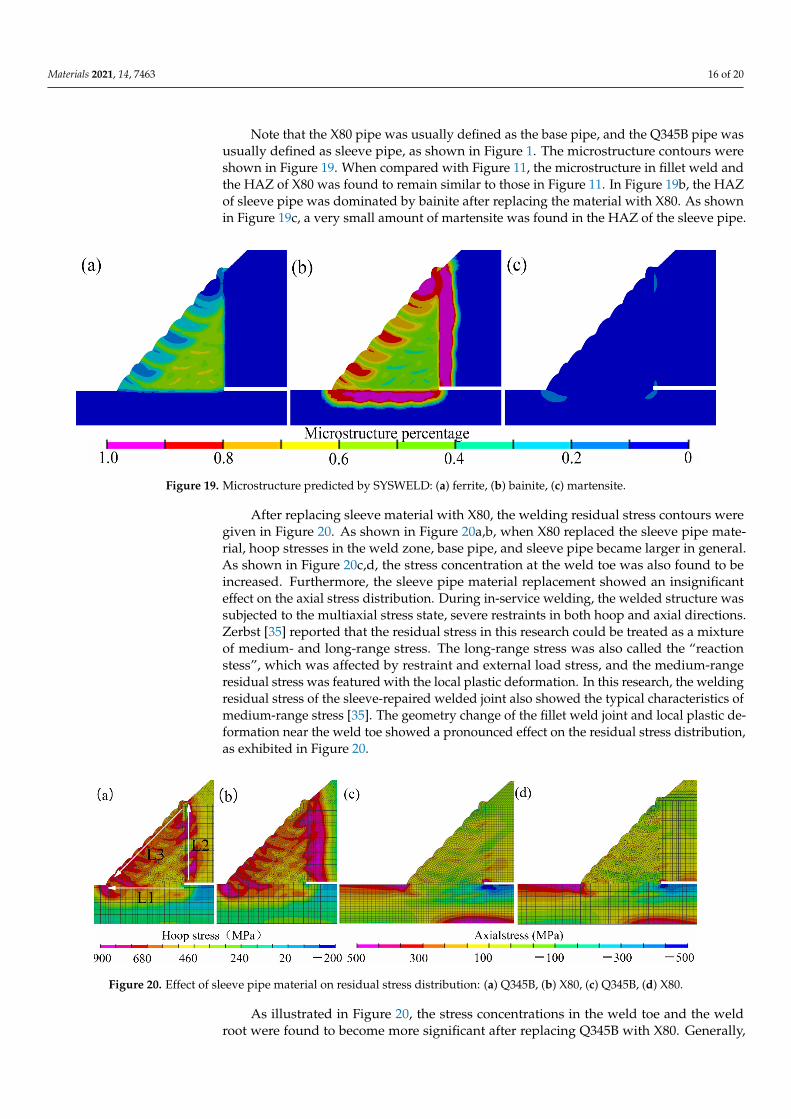
Note that the X80 pipe was usually defined as the base pipe, and the Q345B pipe wasusually defined as sleeve pipe, as shown in Figure 1. The microstructure contours wereshown in Figure 19. When compared with Figure 11, the microstructure in fillet weld andthe HAZ of X80 was found to remain similar to those in Figure 11. In Figure 19b, the HAZof sleeve pipe was dominated by bainite after replacing the material with X80. As shownin Figure 19c, a very small amount of martensite was found in the HAZ of the sleeve pipe.
Materials 2021, 14, 7463 17 of 21
of sleeve pipe was dominated by bainite after replacing the material with X80. As shown in Figure 19c, a very small amount of martensite was found in the HAZ of the sleeve pipe.
Figure 19. Microstructure predicted by SYSWELD: (a) ferrite, (b) bainite, (c) martensite.
After replacing sleeve material with X80, the welding residual stress contours were given in Figure 20. As shown in Figure 20a,b, when X80 replaced the sleeve pipe material, hoop stresses in the weld zone, base pipe, and sleeve pipe became larger in general. As shown in Figure 20c,d, the stress concentration at the weld toe was also found to be in-creased. Furthermore, the sleeve pipe material replacement showed an insignificant effect on the axial stress distribution. During in-service welding, the welded structure was sub-jected to the multiaxial stress state, severe restraints in both hoop and axial directions. Zerbst [35] reported that the residual stress in this research could be treated as a mixture of medium- and long-range stress. The long-range stress was also called the “reaction stess”, which was affected by restraint and external load stress, and the medium-range residual stress was featured with the local plastic deformation. In this research, the weld-ing residual stress of the sleeve-repaired welded joint also showed the typical character-istics of medium-range stress [35]. The geometry change of the fillet weld joint and local plastic deformation near the weld toe showed a pronounced effect on the residual stress distribution, as exhibited in Figure 20.
Figure 20. Effect of sleeve pipe material on residual stress distribution: (a) Q345B, (b) X80, (c) Q345B, (d)X80.
As illustrated in Figure 20, the stress concentrations in the weld toe and the weld root were found to become more significant after replacing Q345B with X80. Generally, the hoop stress in the sleeve pipe increased, and the values became larger than those in the base pipe. In the fillet weld zone, the residual stress near the base pipe was still larger than that near sleeve pipe. This phenomenon was mainly caused by the restraint level discrep-ancy and geometrical shape change [36]. The effects of material strength on the welding residual stress near the weld toe were also investigated by Zerbst [35] and Farajian [36].
Figure 19. Microstructure predicted by SYSWELD: (a) ferrite, (b) bainite, (c) martensite.
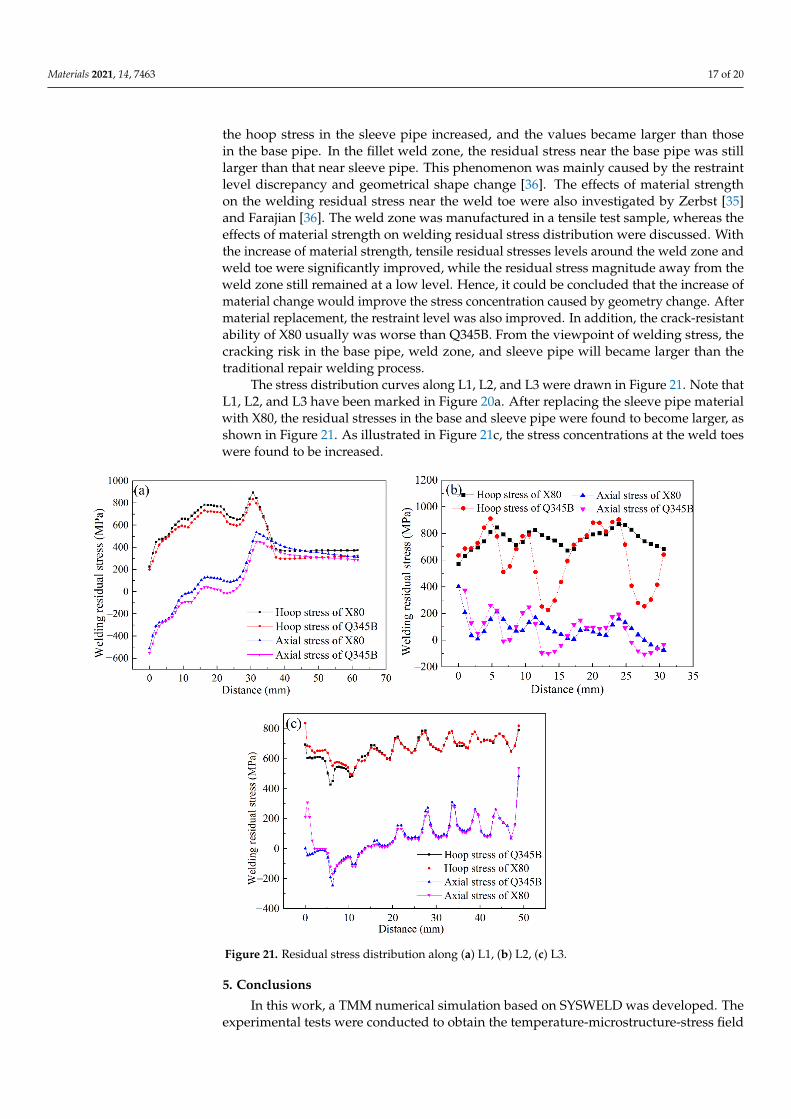
After replacing sleeve material with X80, the welding residual stress contours weregiven in Figure 20. As shown in Figure 20a,b, when X80 replaced the sleeve pipe mate-rial, hoop stresses in the weld zone, base pipe, and sleeve pipe became larger in general.As shown in Figure 20c,d, the stress concentration at the weld toe was also found to beincreased. Furthermore, the sleeve pipe material replacement showed an insignificanteffect on the axial stress distribution. During in-service welding, the welded structure wassubjected to the multiaxial stress state, severe restraints in both hoop and axial directions.Zerbst [35] reported that the residual stress in this research could be treated as a mixtureof medium- and long-range stress. The long-range stress was also called the “reactionstess”, which was affected by restraint and external load stress, and the medium-rangeresidual stress was featured with the local plastic deformation. In this research, the weldingresidual stress of the sleeve-repaired welded joint also showed the typical characteristics ofmedium-range stress [35]. The geometry change of the fillet weld joint and local plastic de-formation near the weld toe showed a pronounced effect on the residual stress distribution,as exhibited in Figure 20.
Materials 2021, 14, 7463 17 of 21
of sleeve pipe was dominated by bainite after replacing the material with X80. As shown in Figure 19c, a very small amount of martensite was found in the HAZ of the sleeve pipe.
Figure 19. Microstructure predicted by SYSWELD: (a) ferrite, (b) bainite, (c) martensite.
After replacing sleeve material with X80, the welding residual stress contours were given in Figure 20. As shown in Figure 20a,b, when X80 replaced the sleeve pipe material, hoop stresses in the weld zone, base pipe, and sleeve pipe became larger in general. As shown in Figure 20c,d, the stress concentration at the weld toe was also found to be in-creased. Furthermore, the sleeve pipe material replacement showed an insignificant effect on the axial stress distribution. During in-service welding, the welded structure was sub-jected to the multiaxial stress state, severe restraints in both hoop and axial directions. Zerbst [35] reported that the residual stress in this research could be treated as a mixture of medium- and long-range stress. The long-range stress was also called the “reaction stess”, which was affected by restraint and external load stress, and the medium-range residual stress was featured with the local plastic deformation. In this research, the weld-ing residual stress of the sleeve-repaired welded joint also showed the typical character-istics of medium-range stress [35]. The geometry change of the fillet weld joint and local plastic deformation near the weld toe showed a pronounced effect on the residual stress distribution, as exhibited in Figure 20.
Figure 20. Effect of sleeve pipe material on residual stress distribution: (a) Q345B, (b) X80, (c) Q345B, (d)X80.
As illustrated in Figure 20, the stress concentrations in the weld toe and the weld root were found to become more significant after replacing Q345B with X80. Generally, the hoop stress in the sleeve pipe increased, and the values became larger than those in the base pipe. In the fillet weld zone, the residual stress near the base pipe was still larger than that near sleeve pipe. This phenomenon was mainly caused by the restraint level discrep-ancy and geometrical shape change [36]. The effects of material strength on the welding residual stress near the weld toe were also investigated by Zerbst [35] and Farajian [36].
Figure 20. Effect of sleeve pipe material on residual stress distribution: (a) Q345B, (b) X80, (c) Q345B, (d) X80.
As illustrated in Figure 20, the stress concentrations in the weld toe and the weldroot were found to become more significant after replacing Q345B with X80. Generally,
Materials 2021, 14, 7463 17 of 20
the hoop stress in the sleeve pipe increased, and the values became larger than thosein the base pipe. In the fillet weld zone, the residual stress near the base pipe was stilllarger than that near sleeve pipe. This phenomenon was mainly caused by the restraintlevel discrepancy and geometrical shape change [36]. The effects of material strengthon the welding residual stress near the weld toe were also investigated by Zerbst [35]and Farajian [36]. The weld zone was manufactured in a tensile test sample, whereas theeffects of material strength on welding residual stress distribution were discussed. Withthe increase of material strength, tensile residual stresses levels around the weld zone andweld toe were significantly improved, while the residual stress magnitude away from theweld zone still remained at a low level. Hence, it could be concluded that the increase ofmaterial change would improve the stress concentration caused by geometry change. Aftermaterial replacement, the restraint level was also improved. In addition, the crack-resistantability of X80 usually was worse than Q345B. From the viewpoint of welding stress, thecracking risk in the base pipe, weld zone, and sleeve pipe will became larger than thetraditional repair welding process.
The stress distribution curves along L1, L2, and L3 were drawn in Figure 21. Note thatL1, L2, and L3 have been marked in Figure 20a. After replacing the sleeve pipe materialwith X80, the residual stresses in the base and sleeve pipe were found to become larger, asshown in Figure 21. As illustrated in Figure 21c, the stress concentrations at the weld toeswere found to be increased.
Materials 2021, 14, 7463 18 of 21
The weld zone was manufactured in a tensile test sample, whereas the effects of material strength on welding residual stress distribution were discussed. With the increase of ma-terial strength, tensile residual stresses levels around the weld zone and weld toe were significantly improved, while the residual stress magnitude away from the weld zone still remained at a low level. Hence, it could be concluded that the increase of material change would improve the stress concentration caused by geometry change. After material re-placement, the restraint level was also improved. In addition, the crack-resistant ability of X80 usually was worse than Q345B. From the viewpoint of welding stress, the cracking risk in the base pipe, weld zone, and sleeve pipe will became larger than the traditional repair welding process.
The stress distribution curves along L1, L2, and L3 were drawn in Figure 21. Note that L1, L2, and L3 have been marked in Figure 20a. After replacing the sleeve pipe mate-rial with X80, the residual stresses in the base and sleeve pipe were found to become larger, as shown in Figure 21. As illustrated in Figure 21c, the stress concentrations at the weld toes were found to be increased.
Figure 21. Residual stress distribution along (a) L1, (b) L2, (c) L3.
5. Conclusions In this work, a TMM numerical simulation based on SYSWELD was developed. The
experimental tests were conducted to obtain the temperature-microstructure-stress field distributions after in-service sleeve repair welding. The effects of the fillet weld size and the sleeve material strength on the residual stress distribution and the structural safety were discussed. The main conclusions were drawn as follows:
(1) The heat dissipation between the outer surface and air was usually treated as the natural convective heat transfer, and the heat dissipation between the X80 pipe’s inner
Figure 21. Residual stress distribution along (a) L1, (b) L2, (c) L3.
5. Conclusions
In this work, a TMM numerical simulation based on SYSWELD was developed. Theexperimental tests were conducted to obtain the temperature-microstructure-stress field
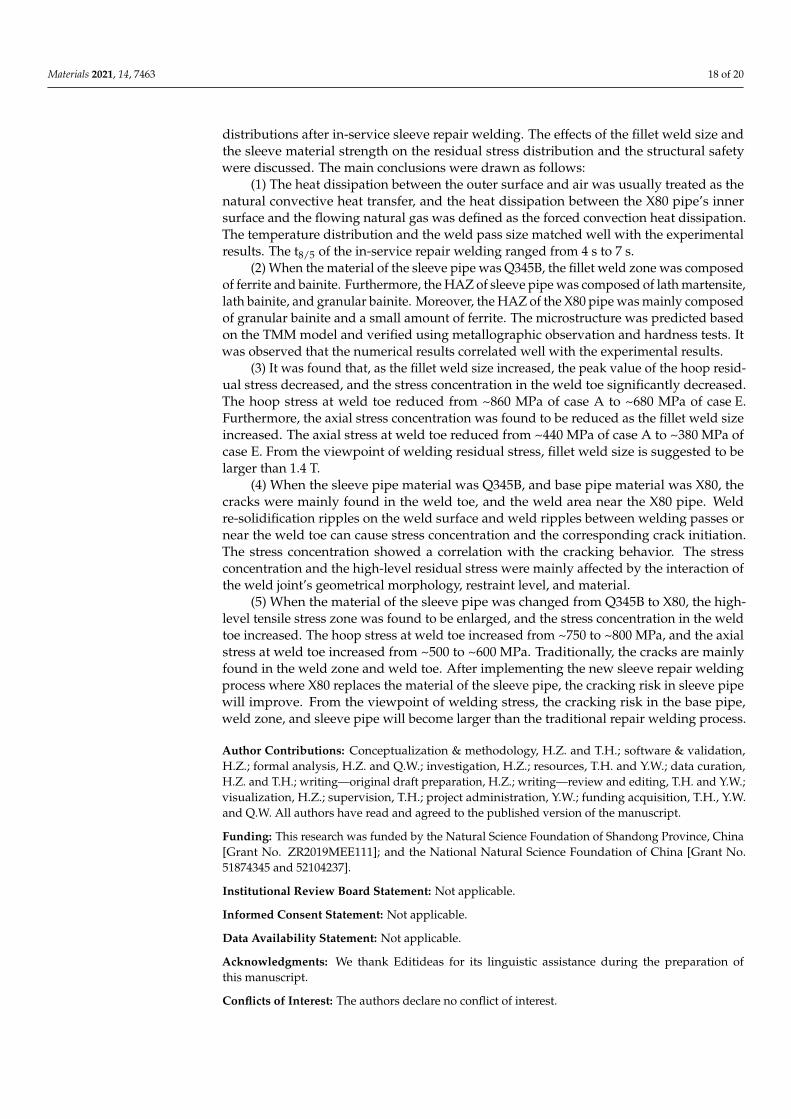
Materials 2021, 14, 7463 18 of 20
distributions after in-service sleeve repair welding. The effects of the fillet weld size andthe sleeve material strength on the residual stress distribution and the structural safetywere discussed. The main conclusions were drawn as follows:
(1) The heat dissipation between the outer surface and air was usually treated as thenatural convective heat transfer, and the heat dissipation between the X80 pipe’s innersurface and the flowing natural gas was defined as the forced convection heat dissipation.The temperature distribution and the weld pass size matched well with the experimentalresults. The t8/5 of the in-service repair welding ranged from 4 s to 7 s.
(2) When the material of the sleeve pipe was Q345B, the fillet weld zone was composedof ferrite and bainite. Furthermore, the HAZ of sleeve pipe was composed of lath martensite,lath bainite, and granular bainite. Moreover, the HAZ of the X80 pipe was mainly composedof granular bainite and a small amount of ferrite. The microstructure was predicted basedon the TMM model and verified using metallographic observation and hardness tests. Itwas observed that the numerical results correlated well with the experimental results.
(3) It was found that, as the fillet weld size increased, the peak value of the hoop resid-ual stress decreased, and the stress concentration in the weld toe significantly decreased.The hoop stress at weld toe reduced from ~860 MPa of case A to ~680 MPa of case E.Furthermore, the axial stress concentration was found to be reduced as the fillet weld sizeincreased. The axial stress at weld toe reduced from ~440 MPa of case A to ~380 MPa ofcase E. From the viewpoint of welding residual stress, fillet weld size is suggested to belarger than 1.4 T.
(4) When the sleeve pipe material was Q345B, and base pipe material was X80, thecracks were mainly found in the weld toe, and the weld area near the X80 pipe. Weldre-solidification ripples on the weld surface and weld ripples between welding passes ornear the weld toe can cause stress concentration and the corresponding crack initiation.The stress concentration showed a correlation with the cracking behavior. The stressconcentration and the high-level residual stress were mainly affected by the interaction ofthe weld joint’s geometrical morphology, restraint level, and material.
(5) When the material of the sleeve pipe was changed from Q345B to X80, the high-level tensile stress zone was found to be enlarged, and the stress concentration in the weldtoe increased. The hoop stress at weld toe increased from ~750 to ~800 MPa, and the axialstress at weld toe increased from ~500 to ~600 MPa. Traditionally, the cracks are mainlyfound in the weld zone and weld toe. After implementing the new sleeve repair weldingprocess where X80 replaces the material of the sleeve pipe, the cracking risk in sleeve pipewill improve. From the viewpoint of welding stress, the cracking risk in the base pipe,weld zone, and sleeve pipe will become larger than the traditional repair welding process.
Author Contributions: Conceptualization & methodology, H.Z. and T.H.; software & validation,H.Z.; formal analysis, H.Z. and Q.W.; investigation, H.Z.; resources, T.H. and Y.W.; data curation,H.Z. and T.H.; writing—original draft preparation, H.Z.; writing—review and editing, T.H. and Y.W.;visualization, H.Z.; supervision, T.H.; project administration, Y.W.; funding acquisition, T.H., Y.W.and Q.W. All authors have read and agreed to the published version of the manuscript.
Funding: This research was funded by the Natural Science Foundation of Shandong Province, China[Grant No. ZR2019MEE111]; and the National Natural Science Foundation of China [Grant No.51874345 and 52104237].
Institutional Review Board Statement: Not applicable.
Informed Consent Statement: Not applicable.
Data Availability Statement: Not applicable.
Acknowledgments: We thank Editideas for its linguistic assistance during the preparation ofthis manuscript.
Conflicts of Interest: The authors declare no conflict of interest.
Materials 2021, 14, 7463 19 of 20
References1. Sharma, S.K.; Maheshwari, S. A review on welding of high strength oil and gas pipeline steels. J. Nat. Gas Sci. Eng. 2016, 38,
203–217. [CrossRef]2. Bogatov, A.A. Crack Resistance of High-Strength Steel and Breakage of a Gas Pipeline. Metallurgist 2017, 61, 47–52. [CrossRef]3. Huo, C.; Li, H.; Zhang, W.W.; Yang, K.; Chi, Q.; Ma, Q.R. Crack control technology for the X80 large OD 1422 mm line pipes. Nat.
Gas Ind. B 2017, 3, 479–484.4. Schipaanboord, W.N.; Marquering, J.; Bruce, W.A. Benefits of low-yield weld filler metals for safe welding on live gas transmission
pipelines. Weld World 2014, 59, 97–118. [CrossRef]5. Zhang, W.; Li, H.; Qiang, C.; Zhao, X.; Yang, K. Technical specifications for X80 OD 1422 mm line pipes and corresponding
products. Nat. Gas Ind. B 2016, 3, 485–492. [CrossRef]6. Soanes, T.; Bell, W.; Vibert, A.J. Optimising residual stresses at a repair in a steam header to tubeplate weld. Int. J. Press. Vessel.
Pip. 2005, 82, 311–318. [CrossRef]7. Dong, P.; Hong, J.K.; Bouchard, P.J. Analysis of residual stresses at weld repairs. Int. J. Press. Vessel. Pip. 2005, 82, 258–269.
[CrossRef]8. API 1104, Welding of Pipelines and Related Facilities. Appendix B: In-Service Welding. Available online: https://www.techstreet.
com/api/standards/api-std-1104?product_id=2229358 (accessed on 1 December 2021).9. Deng, Q.S.; Zhao, W.M.; Jiang, W.; Zhang, T.M.; Li, T.T.; Zhao, Y.J. Hydrogen Embrittlement Susceptibility and Safety Control of
Reheated CGHAZ in X80 Welded Pipeline. J. Mater. Eng. Perform. 2018, 27, 1654–1663. [CrossRef]10. Otegui, J.L.; Rivas, A.; Manfredi, C.; Martins, C. Weld failures in sleeve reinforcements of pipelines. Eng. Fail. Anal. 2001, 8, 57–73.
[CrossRef]11. Huang, Z.Q.; Tang, H.P.; Ding, Y.P.; Wei, Q.W.; Xia, G.F. Numerical Simulations of temperature for the in-service welding of gas
pipeline. J. Mater. Process. Technol. 2017, 248, 72–78. [CrossRef]12. Sun, J.M.; Hensel, J.; Nitschke-Pagel, T.; Dilger, K. Influence of Restraint Conditions on Welding Residual Stresses in H-Type
Cracking Test Specimens. Materials 2019, 12, 2700. [CrossRef] [PubMed]13. Javadi, Y.; Sweeney, N.E.; Mohseni, E.; MacLeod, C.N.; Lines, D.; Vasilev, M.; Qiu, Z.; Mineo, C.; Pierce, S.G.; Gachagan, A.
Investigating the effect of residual stress on hydrogen cracking in multi-pass robotic welding through process compatiblenon-destructive testing. J. Manuf. Process. 2021, 63, 80–87. [CrossRef]
14. Hu, X.D.; Jiang, H.Y.; Luo, Y.; Jin, Q.; Peng, W.; Yi, C.M. A Study on Microstructure, Residual Stresses and Stress CorrosionCracking of Repair Welding on 304 Stainless Steel: Part II-Effects of Reinforcement Height. Materials 2020, 13, 2434. [CrossRef]
15. GB/T 31032-2014, Welding and Acceptance for Steel Pipepings and Pipelines. Available online: http://c.gb688.cn/bzgk/gb/showGb?type=online&hcno=DDB1AE5BB49DCDDFC9E9066C56D929D3 (accessed on 1 December 2021).
16. ASME B31.8-2007, Gas Transmission and Distribution Piping Systems. Available online: https://www.asme.org/codes-standards/find-codes-standards/b31-8-gas-transmission-distribution-piping-systems (accessed on 1 December 2021).
17. GB/T 28055-2011, Technical Standard for Hot Tapping and Plagging on Steel Pipeline. Available online: http://c.gb688.cn/bzgk/gb/showGb?type=online&hcno=A154F99A0231ECCC6AB28A35943173C8 (accessed on 1 December 2021).
18. SYT6150-2011, Technical Standard of Tapping and Plagging on Steel Pipeline. Available online: http://std.samr.gov.cn/hb/search/stdHBDetailed?id=8B1827F2418DBB19E05397BE0A0AB44A (accessed on 1 December 2021).
19. Zhang, H.J.; Wang, Y.; Han, T.; Bao, L.L.; Wu, Q.; Gu, S.W. Numerical and experimental investigation of the formation mechanismand the distribution of the welding residual stress induced by the hybrid laser arc welding of AH36 steel in a butt jointconfiguration. J. Manuf. Process. 2020, 51, 95–108. [CrossRef]
20. Xu, J.; Jia, X.L.; Fan, Y.; Sun, Z.; Liu, A.M.; Zhang, C.H. A Comparison of 3D and Axi-Symmetric Models in Pipe WeldingSimulation Process. Appl. Mech. Mater. 2014, 529, 277–281. [CrossRef]
21. Alberg, H.; Berglund, D.; Ghosh, S.; Castro, J.C.; Lee, J.K. Comparison of an axisymmetric and a three-dimensional model forwelding and stress relief heat treatment. Am. Inst. Phys. 2004, 712, 1230–1235.
22. Pakkanen, J.; Vallant, R.; Kicin, M. Experimental investigation and numerical simulation of resistance spot welding for residualstress evaluation of dp1000 steel. Weld World 2016, 60, 393–402. [CrossRef]
23. Brown, S.; Song, H. Finite element simulation of welding of large structures. Trans. ASME J. Eng. Ind. 1992, 114, 441–451.[CrossRef]
24. Sun, S.N.; Yu, D.J.; Qiu, Y.; Dong, Y.Y.; Chen, X. Finite Element Simulation on Welding Process of Nuclear Reactor PressureVessel’s Inner Ring. Press. Vessel Technol. 2016, 33, 24–32.
25. Goldak, J.; Chakravarti, A.; Bibby, M. A new finite element model for welding heat sources. Metall. Trans. B 1984, 15, 299–305.[CrossRef]
26. Chen, Y.H.; Wang, Y.; Wang, Z.F. Numerical Simulation of Thermal Cycle of In-Service Welding on X70 Steel Gas Pipeline. Adv.Mater. Res. 2009, 79-82, 1169–1172. [CrossRef]
27. Zhao, W.M.; Jiang, W.; Zhang, H.J.; Han, B.; Jin, H.C.; Gao, Q. 3D finite element analysis and optimization of welding residualstress in the girth joints of X80 steel pipeline. J. Manuf. Process. 2021, 66, 166–178. [CrossRef]
28. Li, S.; Ren, S.D.; Zhang, Y.B.; Deng, D.A.; Murakawab, H. Numerical investigation of formation mechanism of welding residualstress in P92 steel multi-pass joints. J. Mater. Process. Technol. 2017, 244, 240–252. [CrossRef]
Materials 2021, 14, 7463 20 of 20
29. Fortunier, R.; Leblond, J.B.; Bergheau, J.M. A numerical model for multiple phase transformations in steels during thermalprocesses. J. Shanghai Jiaotong Univ. 2000, E-5, 213–220.
30. Alian, A.R.; Shazly, M.; Megahed, M.M. 3D finite element modeling of in-service sleeve repair welding of gas pipelines. Int. J.Press. Vessel. Pip. 2016, 146, 216–229. [CrossRef]
31. Wang, Y.; Wang, L.; Di, X.; Shi, Y.; Bao, X. Simulation and analysis of temperature field for in-service multi-pass welding of asleeve fillet weld. Comput. Mater. Sci. 2013, 68, 198–205. [CrossRef]
32. Deng, D.A.; Zhang, C.H.; Pu, X.W.; Liang, W. Influence of Material Model on Prediction Accuracy of Welding Residual Stress inan Austenitic Stainless Steel Multi-pass Butt-Welded Joint. J. Mater. Eng. Perform. 2017, 26, 1494–1505. [CrossRef]
33. Zerbst, U. Application of fracture mechanics to welds with crack origin at the weld toe: A review Part 1: Consequences ofinhomogeneous microstructure for materials testing and failure assessment. Weld World 2019, 63, 1–18. [CrossRef]
34. Schork, B.; Kucharczyk, P.; Madia, M.; Zerbst, U.; Hensel, J.; Bernhard, J.; Tchuindjang, D.; Kaffenberger, M.; Oechsner, M. Theeffect of the local and global weld geometry as well as material defects on crack initiation and fatigue strength. Eng. Fract. Mech.2018, 198, 103–122. [CrossRef]
35. Zerbst, U. Application of fracture mechanics to welds with crack origin at the weld toe-a review. Part 2: Welding residual stresses.Residual and total life assessment. Weld World 2020, 64, 151–169. [CrossRef]
36. Farajian, M. Welding residual stress behavior under mechanical loading. Weld World 2013, 57, 157–169. [CrossRef]
Related Documents