agronomy Article Determination and Metabolite Profiling of Mixtures of Triterpenoid Saponins from Seeds of Chilean Quinoa (Chenopodium quinoa) Germplasm Archis Pandya 1, * , Björn Thiele 1,2 , Andres Zurita-Silva 3 , Björn Usadel 4 and Fabio Fiorani 1 Citation: Pandya, A.; Thiele, B.; Zurita-Silva, A.; Usadel, B.; Fiorani, F. Determination and Metabolite Profiling of Mixtures of Triterpenoid Saponins from Seeds of Chilean Quinoa (Chenopodium quinoa) Germplasm. Agronomy 2021, 11, 1867. https://doi.org/10.3390/ agronomy11091867 Academic Editors: Petr Smýkal and Juan Pablo Renzi Received: 19 August 2021 Accepted: 13 September 2021 Published: 17 September 2021 Publisher’s Note: MDPI stays neutral with regard to jurisdictional claims in published maps and institutional affil- iations. Copyright: © 2021 by the authors. Licensee MDPI, Basel, Switzerland. This article is an open access article distributed under the terms and conditions of the Creative Commons Attribution (CC BY) license (https:// creativecommons.org/licenses/by/ 4.0/). 1 Institute of Bio- and Geoscience, IBG-2: Plant Sciences, Forschungszentrum Jülich GmbH, 52428 Jülich, Germany; [email protected] (B.T.); f.fi[email protected] (F.F.) 2 Institute of Bio- and Geoscience, IBG-3: Agrosphere Forschungszentrum Jülich GmbH, 52428 Jülich, Germany 3 Instituto de Investigaciones Agropecuarias (INIA), La Serena 1700000, Chile; [email protected] 4 Institute of Bio- and Geoscience, IBG-4: Bioinformatics, Forschungszentrum Jülich GmbH, 52428 Jülich, Germany; [email protected] * Correspondence: [email protected] Abstract: The seed pericarp of Chenopodium quinoa Willd. (quinoa) contains a mixture of triterpenoid saponins conferring undesired organoleptic properties. In this study, we evaluated saponin content and their corresponding sapogenins in 114 different quinoa accessions. Relative saponin content ranged from 0.22 to 15.04 mg/g of seed dry weight among the genotypes studied and the genotype effect was significant (p < 0.001). About 75% of the genotypes could be classified as low-saponin content lines which is promising in view of ongoing plant breeding efforts. In addition to the quantitative determination of saponins, metabolic profiling was performed by LC-FTICR-MS and LC-MS/MS. We obtained highly accurate mass estimation from ion spectra allowing the identification of twelve saponins of the oleanane type. These differ in their aglycons and in the number and type of glycoside units. Interestingly, we identified a saponin compound that, to our knowledge, had not been reported previously. Our study highlights that there is considerable variability concerning saponin content in quinoa, which contributes to the valorization of genetic resources towards the identification of genotypes that could be utilized in current and future quinoa breeding programs. Keywords: quinoa; total saponins; sapogenins; GC-MS; LC-FTICR-MS; LC-MS/MS 1. Introduction Saponins, glycosylated secondary metabolites, are present in a wide range of plant species [1]. They consist of a triterpenoid (C 30 ) or steroid (C 27 ) aglycon (sapogenin) at- tached to sugar units varying by type, number, and position [2]. Saponins have been widely studied for their potential applications in agriculture due to their antifungal activity and in the food industry for use as preservatives, food additives, and flavor modifying properties [3,4]. Moreover, due to their significant role in anti-cholesterol activity and other bioactive properties including antioxidant, antiviral, antimicrobial and anti-inflammatory activities, saponins have been widely used in the cosmetic and pharmacology industry [5]. In recent years quinoa (Chenopodium quinoa Willd.), a member of the Amaranthaceae family, has gained attention for its high nutritional content [6–8] and its tolerance to abiotic stresses [9–11], showing potential to become an alternative crop to cereals, for example in defined crop rotations or on marginal lands. However, C. quinoa seeds contain a mixture of triterpenoid saponins in the seed pericarp that leads to bitterness. Saponin accumulation is not only limited to seeds but also other to plant organs including leaves, flowers, and fruits. The saponins in C. quinoa are a commixture of triterpenoid glycosides which are mainly derivatives of oleanolic acid (OA), hederagenin (HD), serjanic acid (SA), and phy- tolaccagenic acid (PA) [12–15]. A fifth sapogenin was characterized as 3,23,30-trihydroxy Agronomy 2021, 11, 1867. https://doi.org/10.3390/agronomy11091867 https://www.mdpi.com/journal/agronomy

Welcome message from author
This document is posted to help you gain knowledge. Please leave a comment to let me know what you think about it! Share it to your friends and learn new things together.
Transcript
agronomy
Article
Determination and Metabolite Profiling of Mixtures ofTriterpenoid Saponins from Seeds of Chilean Quinoa(Chenopodium quinoa) Germplasm
Archis Pandya 1,* , Björn Thiele 1,2, Andres Zurita-Silva 3 , Björn Usadel 4 and Fabio Fiorani 1
�����������������
Citation: Pandya, A.; Thiele, B.;
Zurita-Silva, A.; Usadel, B.; Fiorani, F.
Determination and Metabolite
Profiling of Mixtures of Triterpenoid
Saponins from Seeds of Chilean
Quinoa (Chenopodium quinoa)
Germplasm. Agronomy 2021, 11, 1867.
https://doi.org/10.3390/
agronomy11091867
Academic Editors: Petr Smýkal and
Juan Pablo Renzi
Received: 19 August 2021
Accepted: 13 September 2021
Published: 17 September 2021
Publisher’s Note: MDPI stays neutral
with regard to jurisdictional claims in
published maps and institutional affil-
iations.
Copyright: © 2021 by the authors.
Licensee MDPI, Basel, Switzerland.
This article is an open access article
distributed under the terms and
conditions of the Creative Commons
Attribution (CC BY) license (https://
creativecommons.org/licenses/by/
4.0/).
1 Institute of Bio- and Geoscience, IBG-2: Plant Sciences, Forschungszentrum Jülich GmbH,52428 Jülich, Germany; [email protected] (B.T.); [email protected] (F.F.)
2 Institute of Bio- and Geoscience, IBG-3: Agrosphere Forschungszentrum Jülich GmbH,52428 Jülich, Germany
3 Instituto de Investigaciones Agropecuarias (INIA), La Serena 1700000, Chile; [email protected] Institute of Bio- and Geoscience, IBG-4: Bioinformatics, Forschungszentrum Jülich GmbH,
52428 Jülich, Germany; [email protected]* Correspondence: [email protected]
Abstract: The seed pericarp of Chenopodium quinoa Willd. (quinoa) contains a mixture of triterpenoidsaponins conferring undesired organoleptic properties. In this study, we evaluated saponin contentand their corresponding sapogenins in 114 different quinoa accessions. Relative saponin contentranged from 0.22 to 15.04 mg/g of seed dry weight among the genotypes studied and the genotypeeffect was significant (p < 0.001). About 75% of the genotypes could be classified as low-saponincontent lines which is promising in view of ongoing plant breeding efforts. In addition to thequantitative determination of saponins, metabolic profiling was performed by LC-FTICR-MS andLC-MS/MS. We obtained highly accurate mass estimation from ion spectra allowing the identificationof twelve saponins of the oleanane type. These differ in their aglycons and in the number and typeof glycoside units. Interestingly, we identified a saponin compound that, to our knowledge, hadnot been reported previously. Our study highlights that there is considerable variability concerningsaponin content in quinoa, which contributes to the valorization of genetic resources towards theidentification of genotypes that could be utilized in current and future quinoa breeding programs.
Keywords: quinoa; total saponins; sapogenins; GC-MS; LC-FTICR-MS; LC-MS/MS
1. Introduction
Saponins, glycosylated secondary metabolites, are present in a wide range of plantspecies [1]. They consist of a triterpenoid (C30) or steroid (C27) aglycon (sapogenin) at-tached to sugar units varying by type, number, and position [2]. Saponins have beenwidely studied for their potential applications in agriculture due to their antifungal activityand in the food industry for use as preservatives, food additives, and flavor modifyingproperties [3,4]. Moreover, due to their significant role in anti-cholesterol activity and otherbioactive properties including antioxidant, antiviral, antimicrobial and anti-inflammatoryactivities, saponins have been widely used in the cosmetic and pharmacology industry [5].
In recent years quinoa (Chenopodium quinoa Willd.), a member of the Amaranthaceaefamily, has gained attention for its high nutritional content [6–8] and its tolerance to abioticstresses [9–11], showing potential to become an alternative crop to cereals, for example indefined crop rotations or on marginal lands. However, C. quinoa seeds contain a mixture oftriterpenoid saponins in the seed pericarp that leads to bitterness. Saponin accumulationis not only limited to seeds but also other to plant organs including leaves, flowers, andfruits. The saponins in C. quinoa are a commixture of triterpenoid glycosides which aremainly derivatives of oleanolic acid (OA), hederagenin (HD), serjanic acid (SA), and phy-tolaccagenic acid (PA) [12–15]. A fifth sapogenin was characterized as 3,23,30-trihydroxy
Agronomy 2021, 11, 1867. https://doi.org/10.3390/agronomy11091867 https://www.mdpi.com/journal/agronomy
Agronomy 2021, 11, 1867 2 of 18
olean-12-en-28 oic acid [16]. These sapogenins carry a hydroxy and carboxylic group atC-3 and C-28 position, respectively, which are linked to sugar units. Arabinose, glucose,and galactose are the major saccharides whereas glucuronic acid and xylose are presentto a minor extent [16–23]. Up to the present, nearly 140 different triterpene saponinshave been identified and annotated in C. quinoa seed samples [16,20,23,24]. Saponins con-fer a bitter flavor and, based on their content, C. quinoa varieties have been classifiedinto “sweet-varieties” or “low saponin varieties” (<0.11% or <0.11 g/100 g FW, and ca of≤0.6% or ≤6.0 mg/g of DW) and “bitter-varieties” or “high saponin varieties” (≥0.11%or ≥0.11 g/100 g of FW, and ca of ≥1.0% or ≥10.00 mg/g of DW) [6,25–27]. Since saponincompounds confer bitterness and other organoleptic properties to C. quinoa seeds, theymust be removed before seeds can be used for human consumption. In general, saponinscan be removed either by simple washing due to their amphiphilic nature or by a dehulling-abrasion process [23,28–30]. Because these processes consume water and require the use ofdedicated machinery, the development of low saponin C. quinoa varieties is an importantaim of current plant breeding programs. Today, several programs are in the process ofdeveloping saponin-free or low saponins varieties to be introduced in C. quinoa cultivationpractice [31–33]. Saponin content in C.quinoa has been assessed routinely by hemolytic,gravimetric, and foam-based approaches [25,28,34]. However, these assays are mostlyqualitative or at best semi-quantitative and are likely to lead to substantial errors resultingfrom overestimation or low recovery of saponins [34,35]. Therefore, recently, sophisti-cated technologies such as low-pressure lipid chromatography (LPLC), high-pressureliquid chromatography (HPLC), gas chromatography (GC), UV–vis spectroscopy, and gaschromatography-mass spectrometry (GC-MS) have emerged as appropriate methods forsaponin separation and detection [20,23,24,26,36–38].
For plant breeding purposes, it is important to consider both the total saponin contentand the individual saponin compounds. In the current study, we hypothesized that theabundance of saponins and their composition can differ depending on the ecotypes andgenetic background. Therefore, we aimed at characterizing the extent of variability insaponin content among 114 Chilean C. quinoa accessions representing variations within thecoastal-lowland and salares ecotypes. The C. quinoa diversity panel also included knownvarieties that have been previously characterized for their high or low saponin content,as positive and negative controls, respectively. Additionally, we focused on structureelucidation of saponins and on their fragmentation spectrum which enables detection ofaglycones as well as sugar moieties and their positions in the saponins for these genotypes.These resources will be used in further studies to identify underlying genomic regionslinked to saponins for future plant breeding efforts.
2. Materials and Methods2.1. Chemicals
Oleanolic acid (OA) and Hederagenin (HD) were purchased from Sigma-Aldrich/Merck,(Darmstadt, Germany), and VWR, (Darmstadt, Germany), respectively. Silyl-991 (bis(trimethy-lsilyl)trifluoroacetamide (BSTFA)–trimethylchlorosilane (TMCS) (99:1)) was obtained fromChromatographie Service, (Langerwehe, Germany). Methanol (LC-MS grade), ethyl acetate,acetonitrile, water (LC-MS grade), pyridine, hydrochloric acid, sodium chloride, and sodiumcarbonate were supplied by VWR, (Darmstadt, Germany).
2.2. C. quinoa Diversity Panel
In the reported study the saponin content was evaluated in 114 different C. quinoaaccessions including advanced breeding lines of the ongoing INIA’s Quinoa BreedingProgram (IQBP) in Chile. The C. quinoa diversity panel used for the experimental workwas initially selected based on morphological characteristics (i.e., plant height, branchinggrowth habit, panicle height, panicle shape) and yield traits (i.e., seed yield, seed diameter),and subsequently established by the Instituto de Investigaciones Agropecuarias (INIA),Chile. The C. quinoa panel (AZ = Arid Zones) was obtained by a combination of mass
Agronomy 2021, 11, 1867 3 of 18
selection, self–pollination of individual lines (through at least two seasons), and panicle-furrow selection. The entire C. quinoa panel belongs to the two groups of genotype thatrepresent variations from two different biomes in Chile: the coastal-lowland and the salaresecotypes. Here, salares genotypes are under-represented compared to the coastal-lowlandtype. The C. quinoa diversity panel covered 7 genotypes (salares ecotype) from the ChileanAltiplano (highlands region), 2 south Altiplano genotypes from Cancosa area, alongside102 genotypes from the Chilean coastal-lowland regions. Most of the genotypes werecultivated and harvested from the Huasco experimental station (28◦3′ S, 70◦4′ W). In thestudied genotypes, we also included the known C. quinoa cultivars (cv.) Titicaca (moderateto high saponin content, drought, and salinity tolerant), Vikinga (low saponin content, anddrought and salinity tolerant), and ATLAS (sweet cv) [26,36,39,40]. These cultivars wereprovided by Dr. Sven Erik Jacobsen from the University of Copenhagen, Denmark, andINIA, Chile, respectively. Detailed information on the diversity panel and the collection ofC. quinoa lines is given in Table 1.
2.3. Extraction and Hydrolysis of Saponins from C. quinoa Germplasm
Saponins were indirectly quantified via their corresponding sapogenins derived fromhydrolysis, according to Jarvis et al. [24]. Briefly, 50 mg ground C. quinoa seeds weresuspended in 1 mL methanol then vortexed for 1 min and treated in an ultrasonic bath for10 min. After centrifugation for 2 min at 14 ◦C at 14,000 rpm using Eppendorf mini-spin(Hamburg, Germany), 900 µL of supernatant was withdrawn. The remaining solventincluding the pellet was extracted a second time as mentioned above and the withdrawnsupernatant (1000 µL) was combined with the first. The supernatant was evaporated todryness and the residue hydrolyzed using 2 mL of 2.5 N hydrochloric acid at 90 ◦C for2 h. After the addition of 0.25 g of NaCl, the solution was extracted twice with 1 mL ofethyl acetate by vigorous vortexing for 1 min. The combined ethyl acetate extracts (800 and900 µL) were treated with 0.25 g of sodium carbonate. After centrifugation 1 mL solutionwas withdrawn and evaporated to dryness. For derivatization, 1 mL acetonitrile, 100 µLSilyl-991, and 100 µL pyridine were added to the residue and heated to 90 ◦C for 1 h.Afterward, derivatized samples were analyzed by gas chromatography-mass spectrometry(GC-MS).
2.4. Quantification of Sapogenins by Gas Chromatography-Mass Spectrometry (GC-MS) Analysis
The GC-MS system consisted of an Agilent 7890B gas chromatography and 7693 autosampler(Santa Clara, CA, USA) as well as a Jeol JMS-T200GC AccuTOF GCx mass spectrom-eter (Tokyo, Japan). Analytes were separated on a Zebron ZB-5 HT Inferno column(30 m × 0.25 mm i.d., 0.25 µm film thickness) (Phenomenex, Torrance, CA, USA). Heliumwas used as carrier gas at a constant gas flow of 1.0 mL/min. The oven temperature pro-gram employed for the analysis of silylated sapogenins was as follows: 180 ◦C (1 min), with6 ◦C/min to 350 ◦C (3 min). The injector temperature was held at 340 ◦C, and all injections(1 µL) were made in the split mode (1:10). The mass spectrometer was used in the electronimpact (EI, 70 eV) mode and scanned over the range m/z 35–750 with a sampling intervalof 0.25 ns and a recording interval of 0.4 s. The GC interface and ion chamber were kept at340 ◦C and 250 ◦C, respectively. Data processing was performed by use of the softwareMSAxel (Jeol) and XCalibur 2.0.7 (ThermoFisher Scientific, Waltham, MA, USA). Analysisof each quinoa genotype/cultivar was performed in duplicate. Quantification was doneby the method of external calibration with standard solutions in the concentration range25–200 µM. As phytolaccagenic acid (PA) was not commercially available, its quantificationwas carried out based on a linear regression equation with HD. This method was justifiedbecause of almost congruent regression lines for OA and HD.
Agronomy 2021, 11, 1867 4 of 18
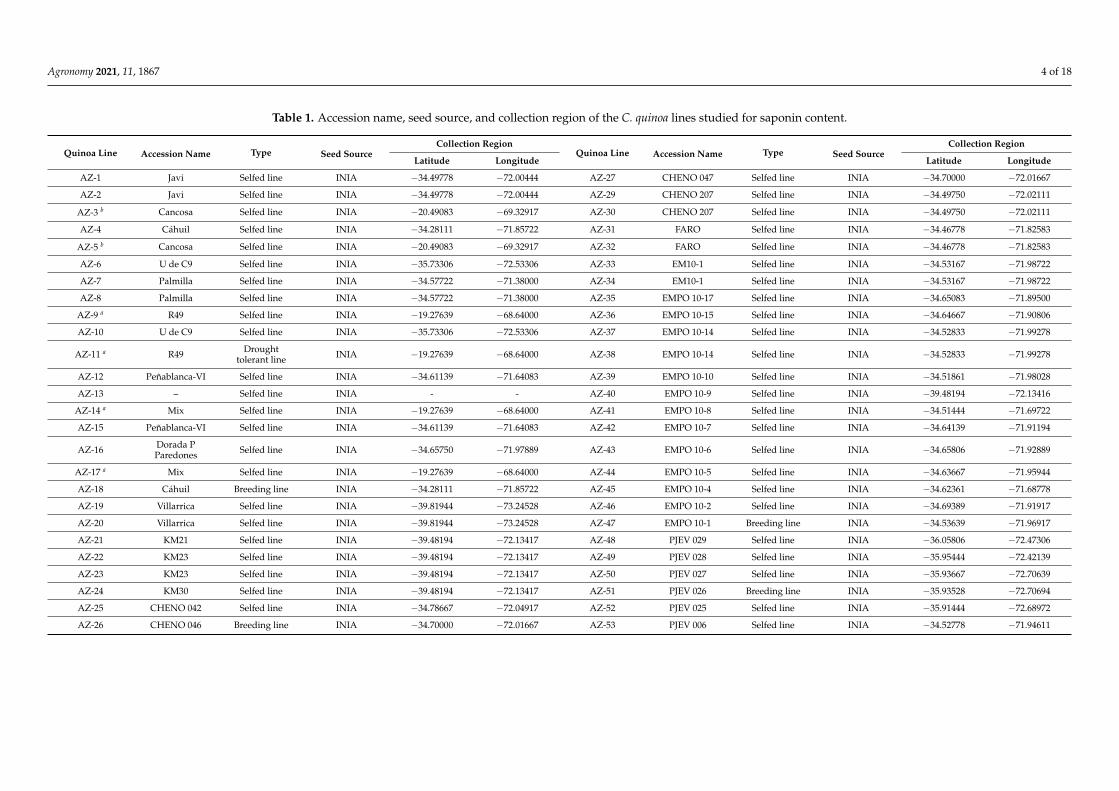
Table 1. Accession name, seed source, and collection region of the C. quinoa lines studied for saponin content.
Quinoa Line Accession Name Type Seed SourceCollection Region
Quinoa Line Accession Name Type Seed SourceCollection Region
Latitude Longitude Latitude Longitude
AZ-1 Javi Selfed line INIA −34.49778 −72.00444 AZ-27 CHENO 047 Selfed line INIA −34.70000 −72.01667
AZ-2 Javi Selfed line INIA −34.49778 −72.00444 AZ-29 CHENO 207 Selfed line INIA −34.49750 −72.02111
AZ-3 b Cancosa Selfed line INIA −20.49083 −69.32917 AZ-30 CHENO 207 Selfed line INIA −34.49750 −72.02111
AZ-4 Cáhuil Selfed line INIA −34.28111 −71.85722 AZ-31 FARO Selfed line INIA −34.46778 −71.82583
AZ-5 b Cancosa Selfed line INIA −20.49083 −69.32917 AZ-32 FARO Selfed line INIA −34.46778 −71.82583
AZ-6 U de C9 Selfed line INIA −35.73306 −72.53306 AZ-33 EM10-1 Selfed line INIA −34.53167 −71.98722
AZ-7 Palmilla Selfed line INIA −34.57722 −71.38000 AZ-34 EM10-1 Selfed line INIA −34.53167 −71.98722
AZ-8 Palmilla Selfed line INIA −34.57722 −71.38000 AZ-35 EMPO 10-17 Selfed line INIA −34.65083 −71.89500
AZ-9 a R49 Selfed line INIA −19.27639 −68.64000 AZ-36 EMPO 10-15 Selfed line INIA −34.64667 −71.90806
AZ-10 U de C9 Selfed line INIA −35.73306 −72.53306 AZ-37 EMPO 10-14 Selfed line INIA −34.52833 −71.99278
AZ-11 a R49 Droughttolerant line INIA −19.27639 −68.64000 AZ-38 EMPO 10-14 Selfed line INIA −34.52833 −71.99278
AZ-12 Peñablanca-VI Selfed line INIA −34.61139 −71.64083 AZ-39 EMPO 10-10 Selfed line INIA −34.51861 −71.98028
AZ-13 – Selfed line INIA - - AZ-40 EMPO 10-9 Selfed line INIA −39.48194 −72.13416
AZ-14 a Mix Selfed line INIA −19.27639 −68.64000 AZ-41 EMPO 10-8 Selfed line INIA −34.51444 −71.69722
AZ-15 Peñablanca-VI Selfed line INIA −34.61139 −71.64083 AZ-42 EMPO 10-7 Selfed line INIA −34.64139 −71.91194
AZ-16 Dorada PParedones Selfed line INIA −34.65750 −71.97889 AZ-43 EMPO 10-6 Selfed line INIA −34.65806 −71.92889
AZ-17 a Mix Selfed line INIA −19.27639 −68.64000 AZ-44 EMPO 10-5 Selfed line INIA −34.63667 −71.95944
AZ-18 Cáhuil Breeding line INIA −34.28111 −71.85722 AZ-45 EMPO 10-4 Selfed line INIA −34.62361 −71.68778
AZ-19 Villarrica Selfed line INIA −39.81944 −73.24528 AZ-46 EMPO 10-2 Selfed line INIA −34.69389 −71.91917
AZ-20 Villarrica Selfed line INIA −39.81944 −73.24528 AZ-47 EMPO 10-1 Breeding line INIA −34.53639 −71.96917
AZ-21 KM21 Selfed line INIA −39.48194 −72.13417 AZ-48 PJEV 029 Selfed line INIA −36.05806 −72.47306
AZ-22 KM23 Selfed line INIA −39.48194 −72.13417 AZ-49 PJEV 028 Selfed line INIA −35.95444 −72.42139
AZ-23 KM23 Selfed line INIA −39.48194 −72.13417 AZ-50 PJEV 027 Selfed line INIA −35.93667 −72.70639
AZ-24 KM30 Selfed line INIA −39.48194 −72.13417 AZ-51 PJEV 026 Breeding line INIA −35.93528 −72.70694
AZ-25 CHENO 042 Selfed line INIA −34.78667 −72.04917 AZ-52 PJEV 025 Selfed line INIA −35.91444 −72.68972
AZ-26 CHENO 046 Breeding line INIA −34.70000 −72.01667 AZ-53 PJEV 006 Selfed line INIA −34.52778 −71.94611
Agronomy 2021, 11, 1867 5 of 18
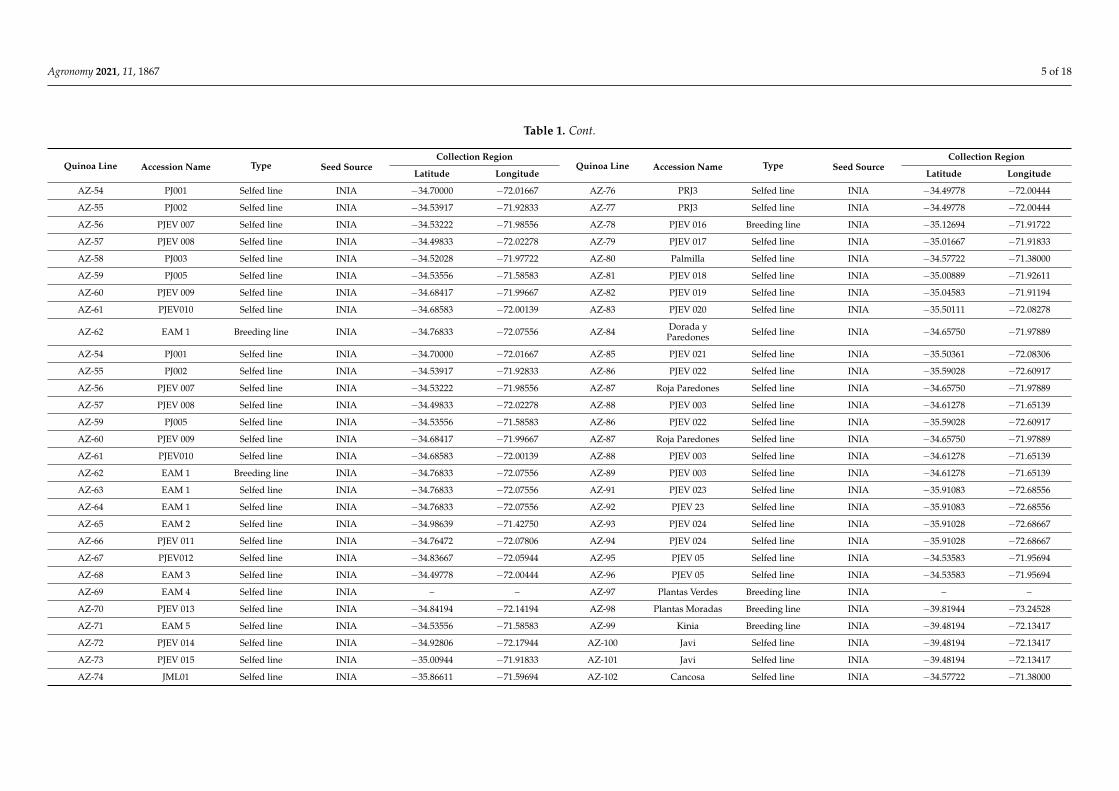
Table 1. Cont.
Quinoa Line Accession Name Type Seed SourceCollection Region
Quinoa Line Accession Name Type Seed SourceCollection Region
Latitude Longitude Latitude Longitude
AZ-54 PJ001 Selfed line INIA −34.70000 −72.01667 AZ-76 PRJ3 Selfed line INIA −34.49778 −72.00444
AZ-55 PJ002 Selfed line INIA −34.53917 −71.92833 AZ-77 PRJ3 Selfed line INIA −34.49778 −72.00444
AZ-56 PJEV 007 Selfed line INIA −34.53222 −71.98556 AZ-78 PJEV 016 Breeding line INIA −35.12694 −71.91722
AZ-57 PJEV 008 Selfed line INIA −34.49833 −72.02278 AZ-79 PJEV 017 Selfed line INIA −35.01667 −71.91833
AZ-58 PJ003 Selfed line INIA −34.52028 −71.97722 AZ-80 Palmilla Selfed line INIA −34.57722 −71.38000
AZ-59 PJ005 Selfed line INIA −34.53556 −71.58583 AZ-81 PJEV 018 Selfed line INIA −35.00889 −71.92611
AZ-60 PJEV 009 Selfed line INIA −34.68417 −71.99667 AZ-82 PJEV 019 Selfed line INIA −35.04583 −71.91194
AZ-61 PJEV010 Selfed line INIA −34.68583 −72.00139 AZ-83 PJEV 020 Selfed line INIA −35.50111 −72.08278
AZ-62 EAM 1 Breeding line INIA −34.76833 −72.07556 AZ-84 Dorada yParedones Selfed line INIA −34.65750 −71.97889
AZ-54 PJ001 Selfed line INIA −34.70000 −72.01667 AZ-85 PJEV 021 Selfed line INIA −35.50361 −72.08306
AZ-55 PJ002 Selfed line INIA −34.53917 −71.92833 AZ-86 PJEV 022 Selfed line INIA −35.59028 −72.60917
AZ-56 PJEV 007 Selfed line INIA −34.53222 −71.98556 AZ-87 Roja Paredones Selfed line INIA −34.65750 −71.97889
AZ-57 PJEV 008 Selfed line INIA −34.49833 −72.02278 AZ-88 PJEV 003 Selfed line INIA −34.61278 −71.65139
AZ-59 PJ005 Selfed line INIA −34.53556 −71.58583 AZ-86 PJEV 022 Selfed line INIA −35.59028 −72.60917
AZ-60 PJEV 009 Selfed line INIA −34.68417 −71.99667 AZ-87 Roja Paredones Selfed line INIA −34.65750 −71.97889
AZ-61 PJEV010 Selfed line INIA −34.68583 −72.00139 AZ-88 PJEV 003 Selfed line INIA −34.61278 −71.65139
AZ-62 EAM 1 Breeding line INIA −34.76833 −72.07556 AZ-89 PJEV 003 Selfed line INIA −34.61278 −71.65139
AZ-63 EAM 1 Selfed line INIA −34.76833 −72.07556 AZ-91 PJEV 023 Selfed line INIA −35.91083 −72.68556
AZ-64 EAM 1 Selfed line INIA −34.76833 −72.07556 AZ-92 PJEV 23 Selfed line INIA −35.91083 −72.68556
AZ-65 EAM 2 Selfed line INIA −34.98639 −71.42750 AZ-93 PJEV 024 Selfed line INIA −35.91028 −72.68667
AZ-66 PJEV 011 Selfed line INIA −34.76472 −72.07806 AZ-94 PJEV 024 Selfed line INIA −35.91028 −72.68667
AZ-67 PJEV012 Selfed line INIA −34.83667 −72.05944 AZ-95 PJEV 05 Selfed line INIA −34.53583 −71.95694
AZ-68 EAM 3 Selfed line INIA −34.49778 −72.00444 AZ-96 PJEV 05 Selfed line INIA −34.53583 −71.95694
AZ-69 EAM 4 Selfed line INIA – – AZ-97 Plantas Verdes Breeding line INIA – –
AZ-70 PJEV 013 Selfed line INIA −34.84194 −72.14194 AZ-98 Plantas Moradas Breeding line INIA −39.81944 −73.24528
AZ-71 EAM 5 Selfed line INIA −34.53556 −71.58583 AZ-99 Kinia Breeding line INIA −39.48194 −72.13417
AZ-72 PJEV 014 Selfed line INIA −34.92806 −72.17944 AZ-100 Javi Selfed line INIA −39.48194 −72.13417
AZ-73 PJEV 015 Selfed line INIA −35.00944 −71.91833 AZ-101 Javi Selfed line INIA −39.48194 −72.13417
AZ-74 JML01 Selfed line INIA −35.86611 −71.59694 AZ-102 Cancosa Selfed line INIA −34.57722 −71.38000
Agronomy 2021, 11, 1867 6 of 18
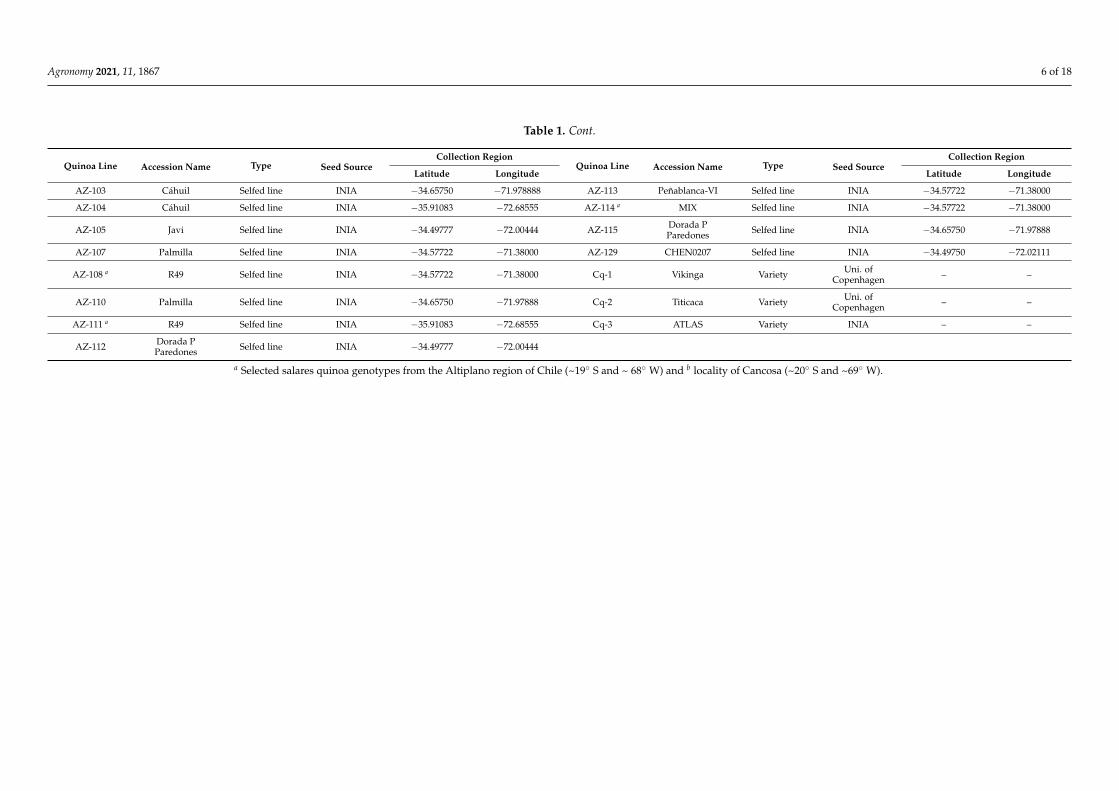
Table 1. Cont.
Quinoa Line Accession Name Type Seed SourceCollection Region
Quinoa Line Accession Name Type Seed SourceCollection Region
Latitude Longitude Latitude Longitude
AZ-103 Cáhuil Selfed line INIA −34.65750 −71.978888 AZ-113 Peñablanca-VI Selfed line INIA −34.57722 −71.38000
AZ-104 Cáhuil Selfed line INIA −35.91083 −72.68555 AZ-114 a MIX Selfed line INIA −34.57722 −71.38000
AZ-105 Javi Selfed line INIA −34.49777 −72.00444 AZ-115 Dorada PParedones Selfed line INIA −34.65750 −71.97888
AZ-107 Palmilla Selfed line INIA −34.57722 −71.38000 AZ-129 CHEN0207 Selfed line INIA −34.49750 −72.02111
AZ-108 a R49 Selfed line INIA −34.57722 −71.38000 Cq-1 Vikinga Variety Uni. ofCopenhagen – –
AZ-110 Palmilla Selfed line INIA −34.65750 −71.97888 Cq-2 Titicaca Variety Uni. ofCopenhagen – –
AZ-111 a R49 Selfed line INIA −35.91083 −72.68555 Cq-3 ATLAS Variety INIA – –
AZ-112 Dorada PParedones Selfed line INIA −34.49777 −72.00444
a Selected salares quinoa genotypes from the Altiplano region of Chile (~19◦ S and ~ 68◦ W) and b locality of Cancosa (~20◦ S and ~69◦ W).
Agronomy 2021, 11, 1867 7 of 18
2.5. Identification of Saponins by LC-FTICR-MS and LC-MS/MS
Liquid chromatography-Fourier transform ion cyclotron resonance mass spectrometry(LC-FTICR-MS) experiments were carried out using an Agilent 1200 series HPLC systemconsisting of a binary pump, autosampler, and column oven (Santa Clara, CA, USA).Saponins from the extraction with methanol (Section 2.3) were separated on an Aqua3 µm C18 column (150 × 2 mm, 3 µm particle size) equipped with a pre-column filterfrom Phenomenex (Waltham, MA, USA). The mobile phase consisted of 1 mM aqueousammonium acetate (A) and methanol + 1 mM ammonium acetate (B). Samples wereseparated at 40 ◦C and a flow rate of 0.3 mL/min using gradient elution: isocratic at 90%A for 1 min, linear gradient to 1% A over 29 min, isocratic at 1% A for 10 min, lineargradient to 90% A over 1 min and equilibration at 90% A for 4 min (total run time: 45 min).The injection volume was 10 µL. Mass spectrometry was performed using a hybrid linearion trap-FTICR-mass spectrometer LTQ-FT Ultra (ThermoFisher Scientific, Waltham, MA,USA) equipped with a 7 T supra-conducting magnet. The electrospray ionization (ESI)source was operated in the negative mode with a spray voltage of 2.80 kV. Nitrogen wasemployed as both sheath gas (8.0 arbitrary) and auxiliary gas (0 arbitrary). The transfercapillary temperature was set to 275 ◦C. Voltages for capillary and tube lens were set to−33 V and −135 V, respectively. Mass spectra were recorded in a full scan from 150 to1500 Da with a mass resolution of 100,000 at m/z 400 (full width at half maximum). Theautomatic gain control for providing a constant ion population in the ICR cell was setto 5E5 for the FTMS full scan mode. The maximum ion trap fill time was set to 10.0 msand the maximum ICR cell fill time to 500 ms. The accurate masses of quasi-molecularions [M–H]− were used for the calculation of chemical formulae with the Qual Browser inXcalibur software version 2.0.7. The search algorithm contained the isotopes 1H, 12C, 13C,and 16O. Each compound had to be represented by 3 mass peaks: the base peak and thepeaks of the corresponding 13C- and 13C2-isotopologues. Search results were restricted tomass errors of 3.0 ppm for the 12C- and the corresponding 13C- and 13C2-isotopologues.
Liquid chromatography-tandem mass spectrometry (LC-MS/MS) was carried out on aWaters ACQUITY® UHPLC system (binary pump, autosampler) coupled to a Waters XevoTQ-S® triple-quadrupole mass spectrometer (Waters Technologies Corp., Milford, MA,USA). Separation of saponins from the extraction with methanol (Section 2.3) was achievedon a Nucleoshell RP18 column (100× 4.6 mm., 2.7 µm.; Macherey-Nagel, Düren, Germany).The column was equipped with a pre-column (Macherey–Nagel, Düren, Germany). Themobile phases were water (A) and acetonitrile (B) each containing 0.1% formic acid, at aflow rate of 1.0 mL/min. The gradient program was as follows: 85% A, to 15% A within20 min, back to 85% A within 0.1 min, and holding for 2.9 min. The injection volume was10 µL. The electrospray ionization (ESI) interface of the mass spectrometer was driven inthe negative mode. The capillary voltage was set to 2.0 kV. The cone voltage was 35 V. Thedesolvation temperature and source temperature were 600 ◦C and 150 ◦C, respectively. Thedesolvation gas flow was set to 1000 L/h and the cone gas flow at 150 L/h using nitrogenin both cases. MS/MS spectra were obtained in the daughter ion scan mode on precursorions which were determined by LC-FTICR-MS before. Nitrogen was used as the collisiongas at a flow of 0.15 mL/min and ionization voltage was set to 30 and 50 eV, respectively.
2.6. Statistical Analysis
All analyzed results are reported as mean ± standard deviation (SD) values of theindependent sample extractions (n = 4). To determine the significant difference in saponincontent among C. quinoa accessions, the dataset was analyzed as a one-way analysis ofvariance ANOVA (Tukey’s-Honestly Significant Difference multiple comparisons) usingthe R-package Agricolae [41]. A p-value ≤ 0.05 was considered as a statistically significantdifference. Principal component analysis (PCA) and cluster analysis were done for thecomplete dataset to present the entire correlation distance matrix, and to group according tospecific variables. Hierarchical clustering was performed based on the Euclidean distance
Agronomy 2021, 11, 1867 8 of 18
and complete grouping method using PCA scores. The genotypic effect was definedaccording to a linear additive model:
yij = µ + Gi + εij (1)
where yij is the phenotypic value measured for the trait y on the plant j of the genotype i;µ corresponds to the overall mean; Gi is the random effect of genotype i representing theeffect of each genotype or genotypic effect on trait y, and εij is the random residual error perplant j of the genotype i. Vg was estimated according to the restricted maximum likelihood(REML) variance components using the lme4 library of R [42]. The significance of the effectswas assessed using the Akaike and Bayesian criteria and tested by the likelihood ratio.
3. Results and Discussion3.1. Extraction and Quantification of Triterpenoid Saponins in C. quinoa Germplasm
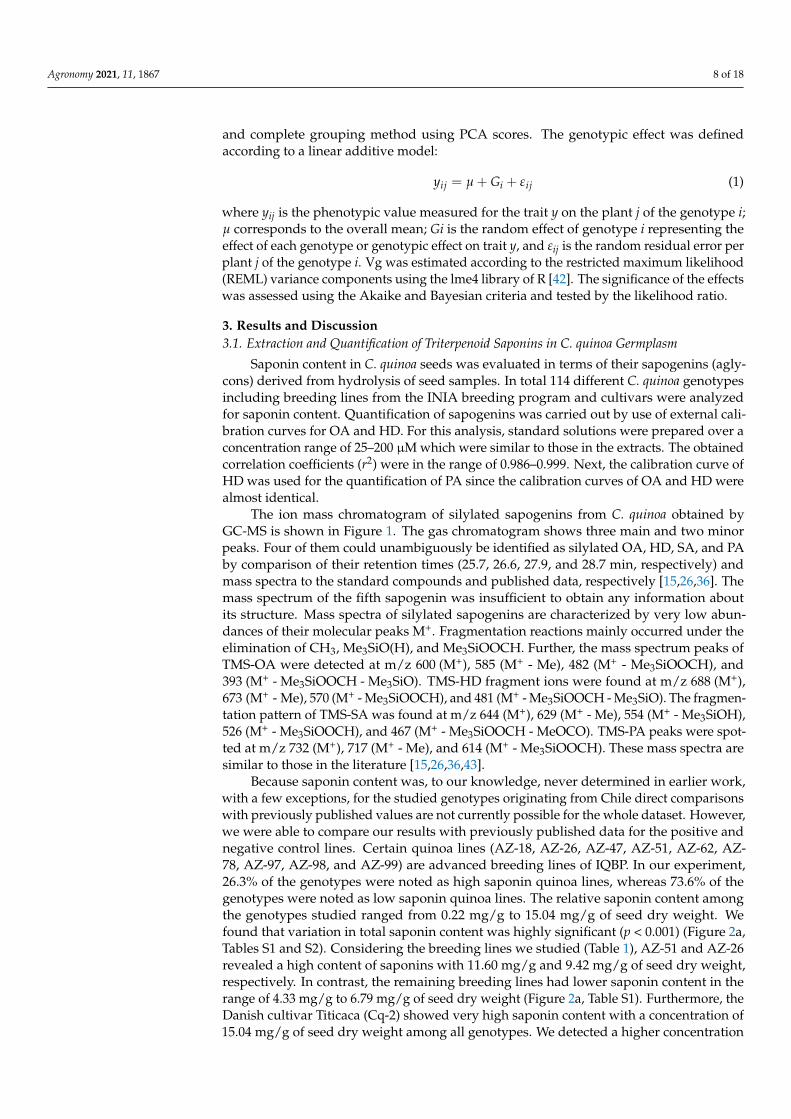
Saponin content in C. quinoa seeds was evaluated in terms of their sapogenins (agly-cons) derived from hydrolysis of seed samples. In total 114 different C. quinoa genotypesincluding breeding lines from the INIA breeding program and cultivars were analyzedfor saponin content. Quantification of sapogenins was carried out by use of external cali-bration curves for OA and HD. For this analysis, standard solutions were prepared over aconcentration range of 25–200 µM which were similar to those in the extracts. The obtainedcorrelation coefficients (r2) were in the range of 0.986–0.999. Next, the calibration curve ofHD was used for the quantification of PA since the calibration curves of OA and HD werealmost identical.
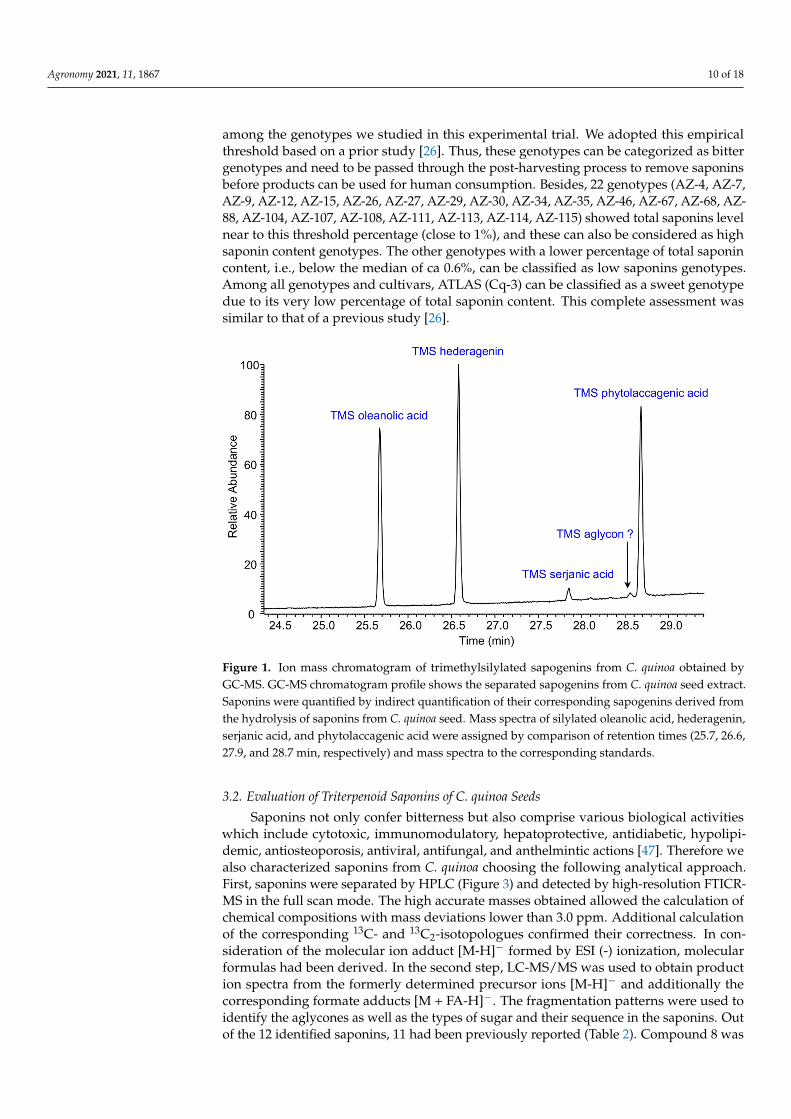
The ion mass chromatogram of silylated sapogenins from C. quinoa obtained byGC-MS is shown in Figure 1. The gas chromatogram shows three main and two minorpeaks. Four of them could unambiguously be identified as silylated OA, HD, SA, and PAby comparison of their retention times (25.7, 26.6, 27.9, and 28.7 min, respectively) andmass spectra to the standard compounds and published data, respectively [15,26,36]. Themass spectrum of the fifth sapogenin was insufficient to obtain any information aboutits structure. Mass spectra of silylated sapogenins are characterized by very low abun-dances of their molecular peaks M+. Fragmentation reactions mainly occurred under theelimination of CH3, Me3SiO(H), and Me3SiOOCH. Further, the mass spectrum peaks ofTMS-OA were detected at m/z 600 (M+), 585 (M+ - Me), 482 (M+ - Me3SiOOCH), and393 (M+ - Me3SiOOCH - Me3SiO). TMS-HD fragment ions were found at m/z 688 (M+),673 (M+ - Me), 570 (M+ - Me3SiOOCH), and 481 (M+ - Me3SiOOCH - Me3SiO). The fragmen-tation pattern of TMS-SA was found at m/z 644 (M+), 629 (M+ - Me), 554 (M+ - Me3SiOH),526 (M+ - Me3SiOOCH), and 467 (M+ - Me3SiOOCH - MeOCO). TMS-PA peaks were spot-ted at m/z 732 (M+), 717 (M+ - Me), and 614 (M+ - Me3SiOOCH). These mass spectra aresimilar to those in the literature [15,26,36,43].
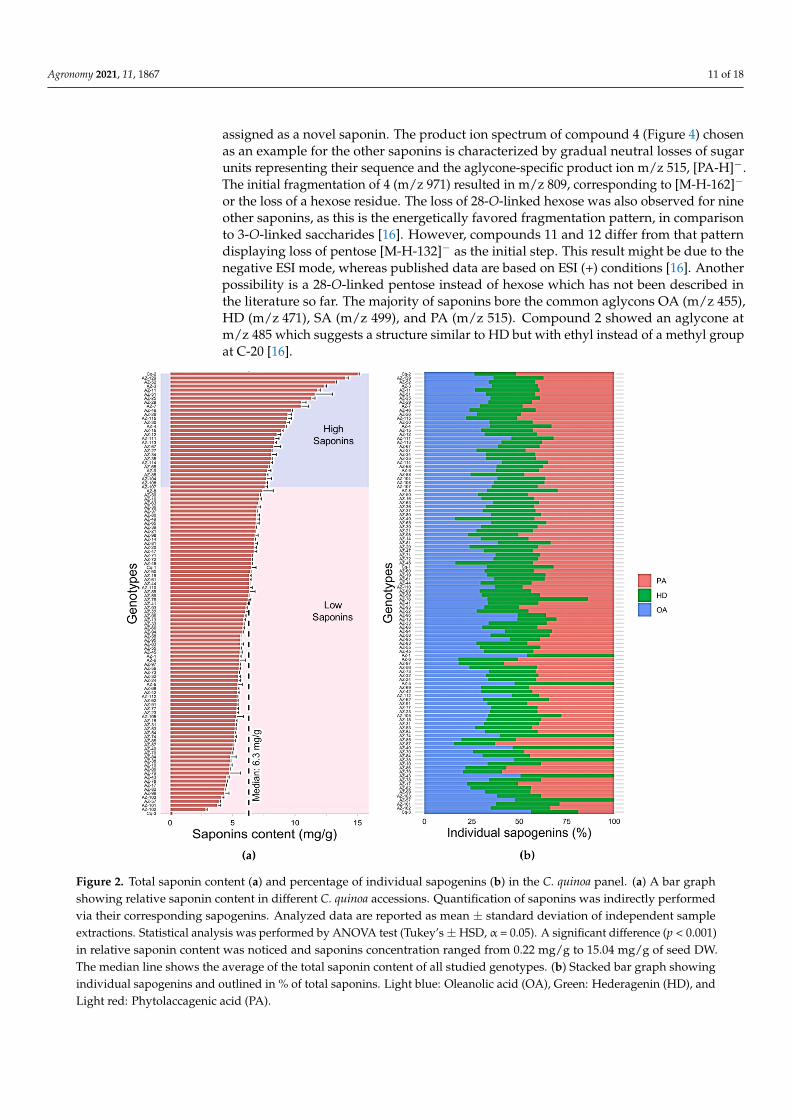
Because saponin content was, to our knowledge, never determined in earlier work,with a few exceptions, for the studied genotypes originating from Chile direct comparisonswith previously published values are not currently possible for the whole dataset. However,we were able to compare our results with previously published data for the positive andnegative control lines. Certain quinoa lines (AZ-18, AZ-26, AZ-47, AZ-51, AZ-62, AZ-78, AZ-97, AZ-98, and AZ-99) are advanced breeding lines of IQBP. In our experiment,26.3% of the genotypes were noted as high saponin quinoa lines, whereas 73.6% of thegenotypes were noted as low saponin quinoa lines. The relative saponin content amongthe genotypes studied ranged from 0.22 mg/g to 15.04 mg/g of seed dry weight. Wefound that variation in total saponin content was highly significant (p < 0.001) (Figure 2a,Tables S1 and S2). Considering the breeding lines we studied (Table 1), AZ-51 and AZ-26revealed a high content of saponins with 11.60 mg/g and 9.42 mg/g of seed dry weight,respectively. In contrast, the remaining breeding lines had lower saponin content in therange of 4.33 mg/g to 6.79 mg/g of seed dry weight (Figure 2a, Table S1). Furthermore, theDanish cultivar Titicaca (Cq-2) showed very high saponin content with a concentration of15.04 mg/g of seed dry weight among all genotypes. We detected a higher concentration
Agronomy 2021, 11, 1867 9 of 18
of PA with 7.76 mg/g of total saponins in comparison to other sapogenins in this cultivar(Table S1). Our data is comparable with data from Medina-Meza et al. [26] in which theTiticaca variety had an average total saponin content of 16.75 mg/g. Additionally, anotherstudy also revealed a high percentage of PA compared with the other sapogenins OA andHA in the bitter variety Titicaca, which is also in agreement with our result [39]. For thefew previously investigated C. quinoa genotypes, total average saponins among Cáhuilaccessions AZ-4, AZ-18, AZ-103, and AZ-104 were 9.24 mg/g, 5.23 mg/g, 4.08 mg/g, and7.69 mg/g of seed dry weight, respectively. The reported average amount of saponins inthis coastal-lowland Chilean genotype was comparable to the average values reported byMedina-Meza [26] and Ward [35] (10.95 mg/g and 4.65 mg/g, respectively). However, theaverage saponins amount for the Cáhuil genotype in our case was higher compared withthe one reported in another study (0.39 mg/g of saponins) [44]. Possible differences inthe variation in total saponins reported in various studies might occur due to numerousfactors including agronomical and environmental conditions as well as the handling ofthe standardized procedures that have been used for the extraction and quantificationof saponins. Concerning these points, the seeds of the Cáhuil genotype used in Medina-Meza’s and Ward’s experiments have been cultivated at different experimental locations inthe United States. Furthermore, in Miranda’s experiment, saponins were analyzed basedon an HPLC procedure although seeds of the Cáhuil genotype were all collected in Chile.Moreover, another central Chilean genotype, FARO (AZ-31 and AZ-32) showed on average5.33 mg/g of total saponins. This value was higher compared with the one found byMiranda’s study [44] (~0.30 mg/g of total saponins). Similarly, Cancosa correspondingto south Altiplano ecotype (AZ-3, AZ-5) and south Chilean coastal-lowland ecotypesfrom Villarrica locality (AZ-19, AZ-20) contained on average 8.87 mg/g and 6.53 mg/g ofsaponins, values which were higher than those reported by Miranda [44] (~0.20 mg/g and0.89 mg/g), respectively. Such contradictory results relating to the amount of saponinscan be concerned with the fact that in Miranda’s study the characterization of saponinswas carried out based on the reversed-phase HPLC approach. In the studied low saponinscultivar that we included as negative controls, Vikinga (Cq-1) showed an average saponincontent of 6.49 mg/g of seed dry weight, which is lower than 1% of total saponins. Therelative concentration of sapogenins OA and HD in Vikinga were detected in a 1:1 ratio,while the concentration of PA was in comparison slightly lower than OA and HD (Table S1).This result is nearly identical to the findings of a previous study where the authors reporteda 1:1 OA:HD ratio with a relatively low amount of PA in Vikinga [39]. Among the entirepanel of genotypes, we found that cv ATLAS (Cq-3) had a very low amount of saponins,as expected (0.22 mg/g of seed dry weight). The GC-MS chromatogram of this varietyhad 56.2% and 24.9% of OA and HD, respectively, while PA was 18.8% of total sapogenins(Figure 2b). This result implies a high ratio of OA:HD. This result can be explained by thefact that a high ratio of OA to HD is connected, to some extent, with the sweetness of seedsand a low ratio, to some extent, with the bitterness of seeds [14,39].
Our GC-MS results show that PA was the main compound of sapogenins as such rep-resenting 38.4% of the total saponin content followed by OA and HD with 33.0% and 28.6%,respectively (Figure 2b). This result is very similar to other previous experiments where PAwas reported as the main class of sapogenins (42–43%) followed by OA (30%–34%) and HD(24–27%) in coastal-lowland ecotypes [15]. Overall, we found a positive correlation betweenPA and total saponins (p < 0.001, r = 0.854; (Figure S1), as previously reported [26]. It hasbeen also noted that bitterness of C. quinoa seeds can be linked with a higher content of PA,whereby sweet C. quinoa genotypes have low or no apparent PA content [26,39,45]. How-ever, in other studies, OA was identified as the main class of sapogenins in C. quinoa [14,36].The variation in the relative amount of sapogenins can be linked with cross-pollination,which has been noted up to 9.9% in the C. quinoa, and its accumulation in the variousportion of the grain [14,46].
In general, results revealed that the seven C. quinoa genotypes Cq-2, AZ-3, AZ-11, AZ-25, AZ-51, AZ-52, AZ-129 had a total saponin content above the threshold percentage (>1%)
Agronomy 2021, 11, 1867 10 of 18
among the genotypes we studied in this experimental trial. We adopted this empiricalthreshold based on a prior study [26]. Thus, these genotypes can be categorized as bittergenotypes and need to be passed through the post-harvesting process to remove saponinsbefore products can be used for human consumption. Besides, 22 genotypes (AZ-4, AZ-7,AZ-9, AZ-12, AZ-15, AZ-26, AZ-27, AZ-29, AZ-30, AZ-34, AZ-35, AZ-46, AZ-67, AZ-68, AZ-88, AZ-104, AZ-107, AZ-108, AZ-111, AZ-113, AZ-114, AZ-115) showed total saponins levelnear to this threshold percentage (close to 1%), and these can also be considered as highsaponin content genotypes. The other genotypes with a lower percentage of total saponincontent, i.e., below the median of ca 0.6%, can be classified as low saponins genotypes.Among all genotypes and cultivars, ATLAS (Cq-3) can be classified as a sweet genotypedue to its very low percentage of total saponin content. This complete assessment wassimilar to that of a previous study [26].
Figure 1. Ion mass chromatogram of trimethylsilylated sapogenins from C. quinoa obtained byGC-MS. GC-MS chromatogram profile shows the separated sapogenins from C. quinoa seed extract.Saponins were quantified by indirect quantification of their corresponding sapogenins derived fromthe hydrolysis of saponins from C. quinoa seed. Mass spectra of silylated oleanolic acid, hederagenin,serjanic acid, and phytolaccagenic acid were assigned by comparison of retention times (25.7, 26.6,27.9, and 28.7 min, respectively) and mass spectra to the corresponding standards.
3.2. Evaluation of Triterpenoid Saponins of C. quinoa Seeds
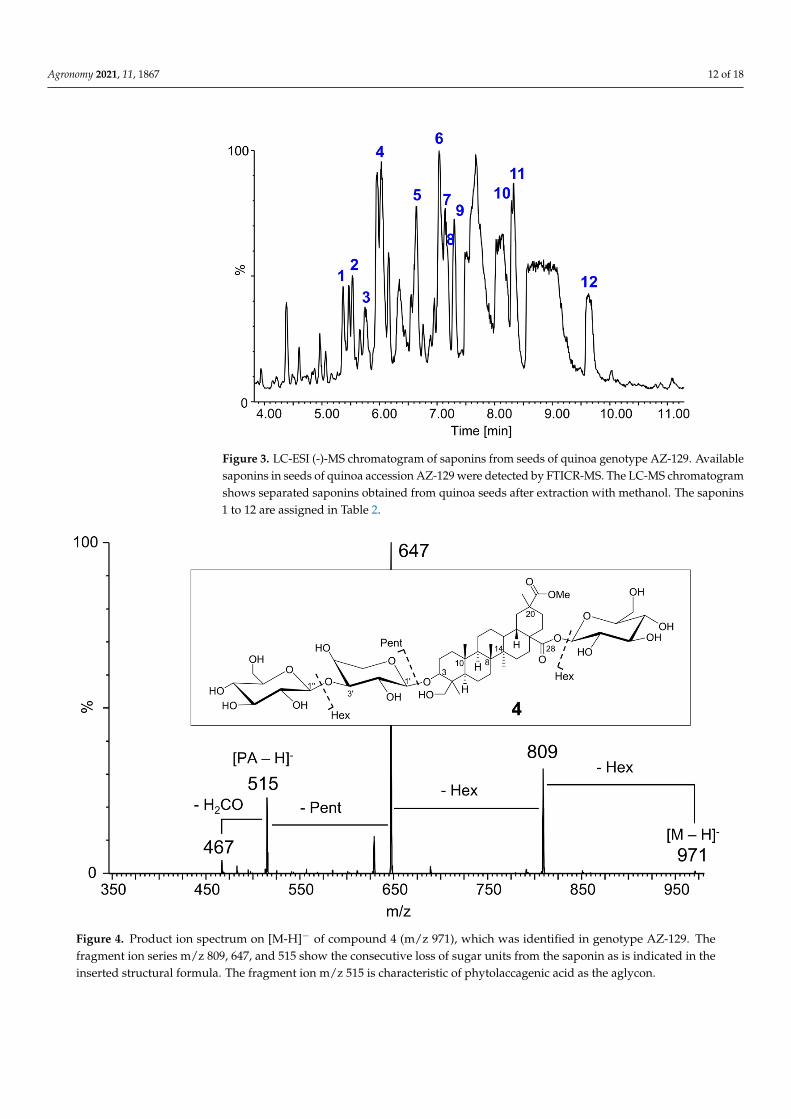
Saponins not only confer bitterness but also comprise various biological activitieswhich include cytotoxic, immunomodulatory, hepatoprotective, antidiabetic, hypolipi-demic, antiosteoporosis, antiviral, antifungal, and anthelmintic actions [47]. Therefore wealso characterized saponins from C. quinoa choosing the following analytical approach.First, saponins were separated by HPLC (Figure 3) and detected by high-resolution FTICR-MS in the full scan mode. The high accurate masses obtained allowed the calculation ofchemical compositions with mass deviations lower than 3.0 ppm. Additional calculationof the corresponding 13C- and 13C2-isotopologues confirmed their correctness. In con-sideration of the molecular ion adduct [M-H]− formed by ESI (-) ionization, molecularformulas had been derived. In the second step, LC-MS/MS was used to obtain production spectra from the formerly determined precursor ions [M-H]− and additionally thecorresponding formate adducts [M + FA-H]−. The fragmentation patterns were used toidentify the aglycones as well as the types of sugar and their sequence in the saponins. Outof the 12 identified saponins, 11 had been previously reported (Table 2). Compound 8 was
Agronomy 2021, 11, 1867 11 of 18
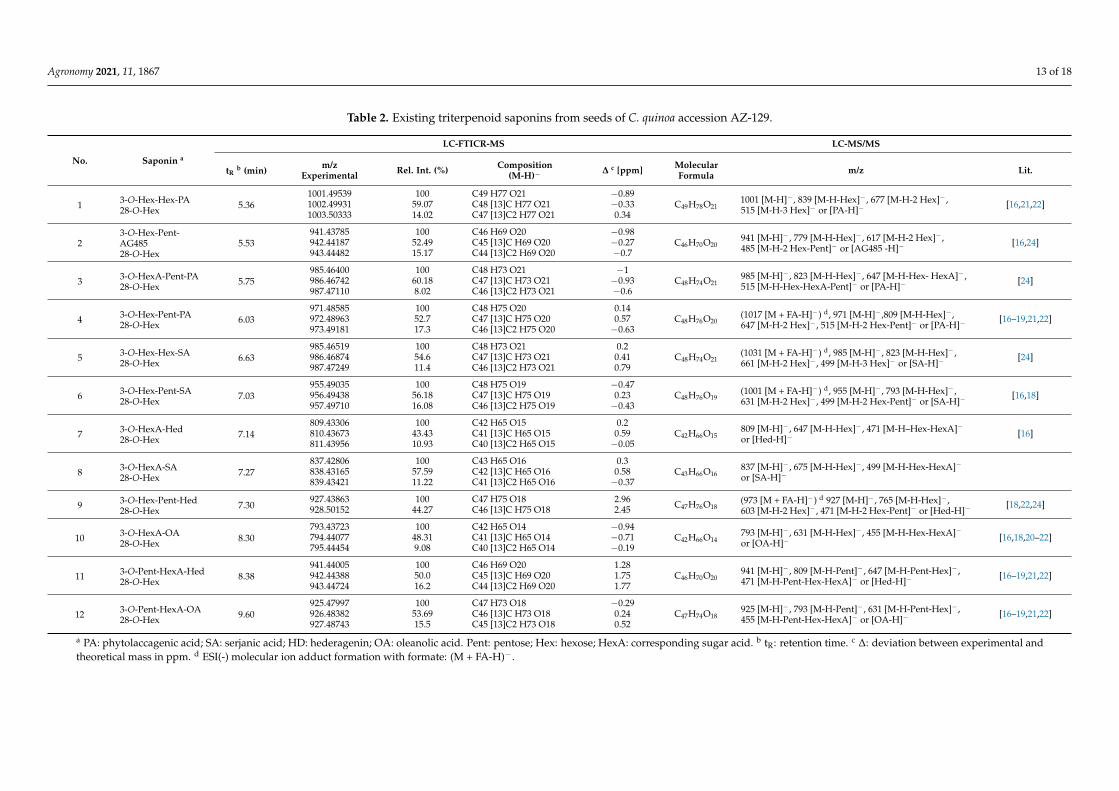
assigned as a novel saponin. The product ion spectrum of compound 4 (Figure 4) chosenas an example for the other saponins is characterized by gradual neutral losses of sugarunits representing their sequence and the aglycone-specific product ion m/z 515, [PA-H]−.The initial fragmentation of 4 (m/z 971) resulted in m/z 809, corresponding to [M-H-162]−
or the loss of a hexose residue. The loss of 28-O-linked hexose was also observed for nineother saponins, as this is the energetically favored fragmentation pattern, in comparisonto 3-O-linked saccharides [16]. However, compounds 11 and 12 differ from that patterndisplaying loss of pentose [M-H-132]− as the initial step. This result might be due to thenegative ESI mode, whereas published data are based on ESI (+) conditions [16]. Anotherpossibility is a 28-O-linked pentose instead of hexose which has not been described inthe literature so far. The majority of saponins bore the common aglycons OA (m/z 455),HD (m/z 471), SA (m/z 499), and PA (m/z 515). Compound 2 showed an aglycone atm/z 485 which suggests a structure similar to HD but with ethyl instead of a methyl groupat C-20 [16].
Figure 2. Total saponin content (a) and percentage of individual sapogenins (b) in the C. quinoa panel. (a) A bar graphshowing relative saponin content in different C. quinoa accessions. Quantification of saponins was indirectly performedvia their corresponding sapogenins. Analyzed data are reported as mean ± standard deviation of independent sampleextractions. Statistical analysis was performed by ANOVA test (Tukey’s±HSD, α = 0.05). A significant difference (p < 0.001)in relative saponin content was noticed and saponins concentration ranged from 0.22 mg/g to 15.04 mg/g of seed DW.The median line shows the average of the total saponin content of all studied genotypes. (b) Stacked bar graph showingindividual sapogenins and outlined in % of total saponins. Light blue: Oleanolic acid (OA), Green: Hederagenin (HD), andLight red: Phytolaccagenic acid (PA).
Agronomy 2021, 11, 1867 12 of 18
Figure 3. LC-ESI (-)-MS chromatogram of saponins from seeds of quinoa genotype AZ-129. Availablesaponins in seeds of quinoa accession AZ-129 were detected by FTICR-MS. The LC-MS chromatogramshows separated saponins obtained from quinoa seeds after extraction with methanol. The saponins1 to 12 are assigned in Table 2.
Figure 4. Product ion spectrum on [M-H]− of compound 4 (m/z 971), which was identified in genotype AZ-129. Thefragment ion series m/z 809, 647, and 515 show the consecutive loss of sugar units from the saponin as is indicated in theinserted structural formula. The fragment ion m/z 515 is characteristic of phytolaccagenic acid as the aglycon.
Agronomy 2021, 11, 1867 13 of 18
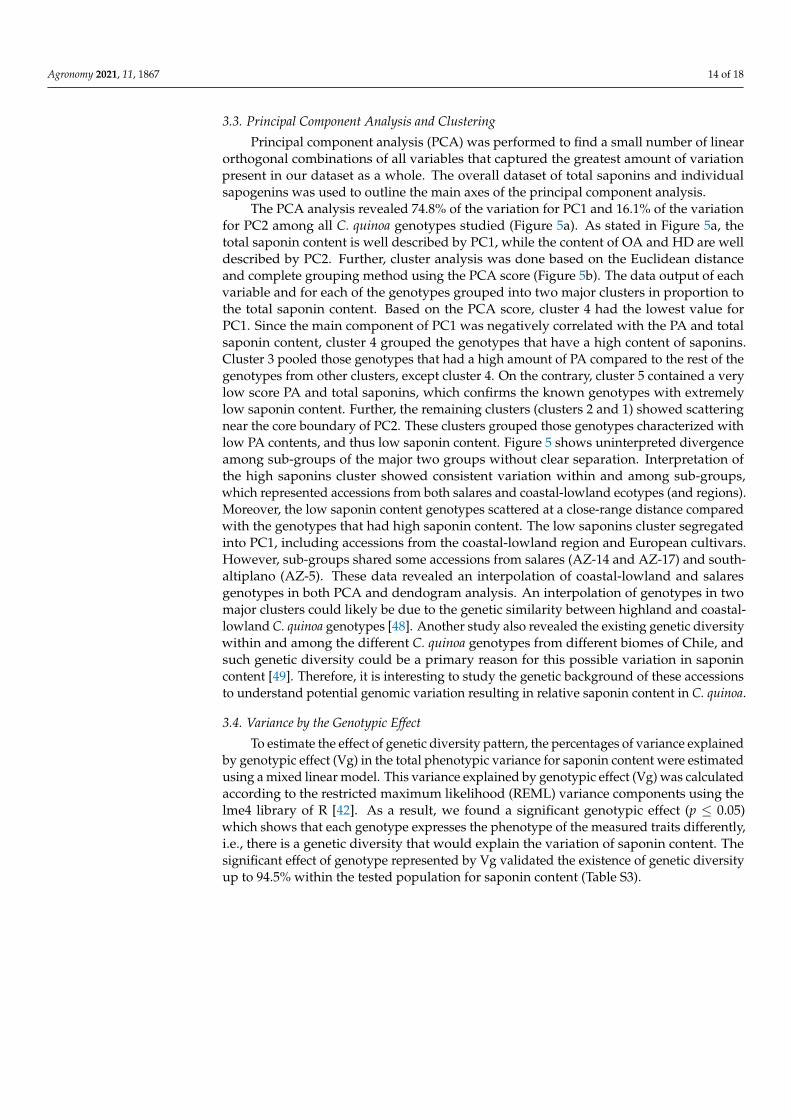
Table 2. Existing triterpenoid saponins from seeds of C. quinoa accession AZ-129.
LC-FTICR-MS LC-MS/MS
No. Saponin a
tRb (min) m/z
Experimental Rel. Int. (%) Composition(M-H)− ∆ c [ppm] Molecular
Formula m/z Lit.
1 3-O-Hex-Hex-PA28-O-Hex 5.36
1001.49539 100 C49 H77 O21 −0.89C49H78O21
1001 [M-H]− , 839 [M-H-Hex]− , 677 [M-H-2 Hex]− ,515 [M-H-3 Hex]− or [PA-H]−
[16,21,22]1002.49931 59.07 C48 [13]C H77 O21 −0.331003.50333 14.02 C47 [13]C2 H77 O21 0.34
23-O-Hex-Pent-AG48528-O-Hex
5.53941.43785 100 C46 H69 O20 −0.98
C46H70O20941 [M-H]− , 779 [M-H-Hex]− , 617 [M-H-2 Hex]− ,485 [M-H-2 Hex-Pent]− or [AG485 -H]−
[16,24]942.44187 52.49 C45 [13]C H69 O20 −0.27943.44482 15.17 C44 [13]C2 H69 O20 −0.7
3 3-O-HexA-Pent-PA28-O-Hex 5.75
985.46400 100 C48 H73 O21 −1C48H74O21
985 [M-H]− , 823 [M-H-Hex]− , 647 [M-H-Hex- HexA]− ,515 [M-H-Hex-HexA-Pent]− or [PA-H]−
[24]986.46742 60.18 C47 [13]C H73 O21 −0.93987.47110 8.02 C46 [13]C2 H73 O21 −0.6
4 3-O-Hex-Pent-PA28-O-Hex 6.03
971.48585 100 C48 H75 O20 0.14C48H76O20
(1017 [M + FA-H]−) d, 971 [M-H]− ,809 [M-H-Hex]− ,647 [M-H-2 Hex]− , 515 [M-H-2 Hex-Pent]− or [PA-H]−
[16–19,21,22]972.48963 52.7 C47 [13]C H75 O20 0.57973.49181 17.3 C46 [13]C2 H75 O20 −0.63
5 3-O-Hex-Hex-SA28-O-Hex 6.63
985.46519 100 C48 H73 O21 0.2C48H74O21
(1031 [M + FA-H]−) d, 985 [M-H]− , 823 [M-H-Hex]− ,661 [M-H-2 Hex]− , 499 [M-H-3 Hex]− or [SA-H]−
[24]986.46874 54.6 C47 [13]C H73 O21 0.41987.47249 11.4 C46 [13]C2 H73 O21 0.79
6 3-O-Hex-Pent-SA28-O-Hex 7.03
955.49035 100 C48 H75 O19 −0.47C48H76O19
(1001 [M + FA-H]−) d, 955 [M-H]− , 793 [M-H-Hex]− ,631 [M-H-2 Hex]− , 499 [M-H-2 Hex-Pent]− or [SA-H]−
[16,18]956.49438 56.18 C47 [13]C H75 O19 0.23957.49710 16.08 C46 [13]C2 H75 O19 −0.43
7 3-O-HexA-Hed28-O-Hex 7.14
809.43306 100 C42 H65 O15 0.2C42H66O15
809 [M-H]− , 647 [M-H-Hex]− , 471 [M-H–Hex-HexA]−or [Hed-H]−
[16]810.43673 43.43 C41 [13]C H65 O15 0.59811.43956 10.93 C40 [13]C2 H65 O15 −0.05
8 3-O-HexA-SA28-O-Hex 7.27
837.42806 100 C43 H65 O16 0.3C43H66O16
837 [M-H]− , 675 [M-H-Hex]− , 499 [M-H-Hex-HexA]−or [SA-H]−
838.43165 57.59 C42 [13]C H65 O16 0.58839.43421 11.22 C41 [13]C2 H65 O16 −0.37
9 3-O-Hex-Pent-Hed28-O-Hex 7.30
927.43863 100 C47 H75 O18 2.96 C47H76O18(973 [M + FA-H]−) d 927 [M-H]− , 765 [M-H-Hex]− ,603 [M-H-2 Hex]− , 471 [M-H-2 Hex-Pent]− or [Hed-H]−
[18,22,24]928.50152 44.27 C46 [13]C H75 O18 2.45
10 3-O-HexA-OA28-O-Hex 8.30
793.43723 100 C42 H65 O14 −0.94C42H66O14
793 [M-H]− , 631 [M-H-Hex]− , 455 [M-H-Hex-HexA]−or [OA-H]−
[16,18,20–22]794.44077 48.31 C41 [13]C H65 O14 −0.71795.44454 9.08 C40 [13]C2 H65 O14 −0.19
11 3-O-Pent-HexA-Hed28-O-Hex 8.38
941.44005 100 C46 H69 O20 1.28C46H70O20
941 [M-H]− , 809 [M-H-Pent]− , 647 [M-H-Pent-Hex]− ,471 [M-H-Pent-Hex-HexA]− or [Hed-H]−
[16–19,21,22]942.44388 50.0 C45 [13]C H69 O20 1.75943.44724 16.2 C44 [13]C2 H69 O20 1.77
12 3-O-Pent-HexA-OA28-O-Hex 9.60
925.47997 100 C47 H73 O18 −0.29C47H74O18
925 [M-H]− , 793 [M-H-Pent]− , 631 [M-H-Pent-Hex]− ,455 [M-H-Pent-Hex-HexA]− or [OA-H]−
[16–19,21,22]926.48382 53.69 C46 [13]C H73 O18 0.24927.48743 15.5 C45 [13]C2 H73 O18 0.52
a PA: phytolaccagenic acid; SA: serjanic acid; HD: hederagenin; OA: oleanolic acid. Pent: pentose; Hex: hexose; HexA: corresponding sugar acid. b tR: retention time. c ∆: deviation between experimental andtheoretical mass in ppm. d ESI(-) molecular ion adduct formation with formate: (M + FA-H)−.
Agronomy 2021, 11, 1867 14 of 18
3.3. Principal Component Analysis and Clustering
Principal component analysis (PCA) was performed to find a small number of linearorthogonal combinations of all variables that captured the greatest amount of variationpresent in our dataset as a whole. The overall dataset of total saponins and individualsapogenins was used to outline the main axes of the principal component analysis.
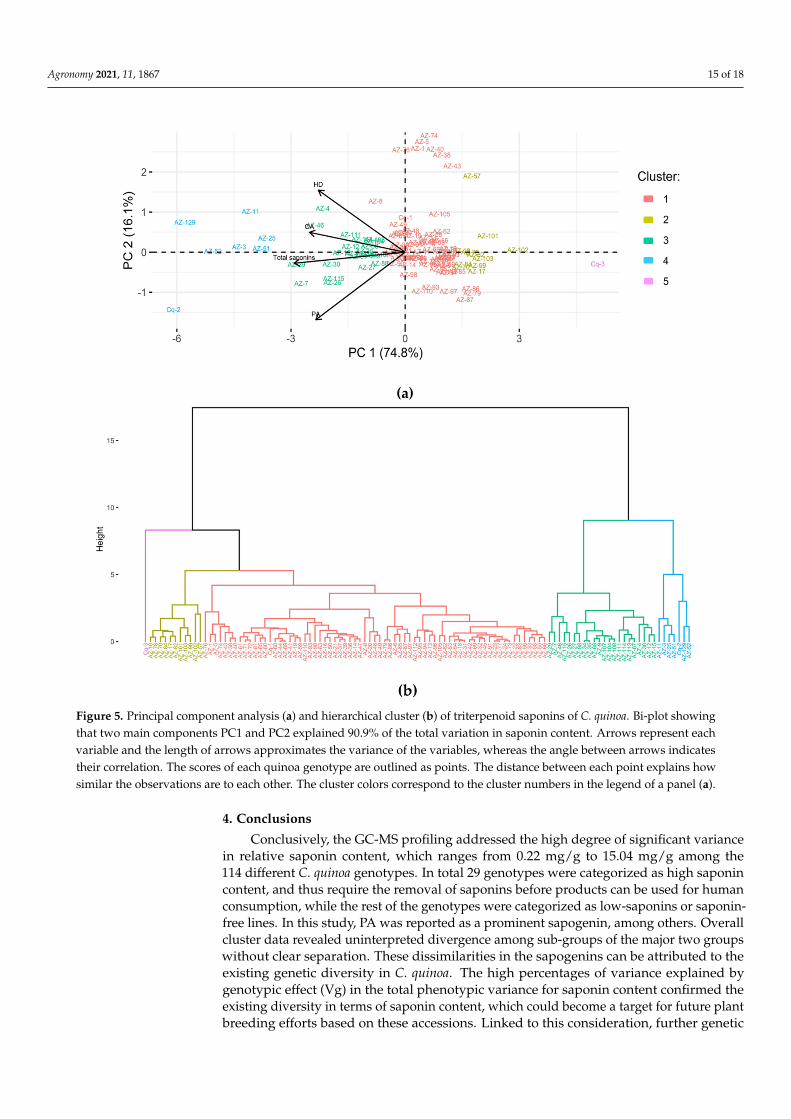
The PCA analysis revealed 74.8% of the variation for PC1 and 16.1% of the variationfor PC2 among all C. quinoa genotypes studied (Figure 5a). As stated in Figure 5a, thetotal saponin content is well described by PC1, while the content of OA and HD are welldescribed by PC2. Further, cluster analysis was done based on the Euclidean distanceand complete grouping method using the PCA score (Figure 5b). The data output of eachvariable and for each of the genotypes grouped into two major clusters in proportion tothe total saponin content. Based on the PCA score, cluster 4 had the lowest value forPC1. Since the main component of PC1 was negatively correlated with the PA and totalsaponin content, cluster 4 grouped the genotypes that have a high content of saponins.Cluster 3 pooled those genotypes that had a high amount of PA compared to the rest of thegenotypes from other clusters, except cluster 4. On the contrary, cluster 5 contained a verylow score PA and total saponins, which confirms the known genotypes with extremelylow saponin content. Further, the remaining clusters (clusters 2 and 1) showed scatteringnear the core boundary of PC2. These clusters grouped those genotypes characterized withlow PA contents, and thus low saponin content. Figure 5 shows uninterpreted divergenceamong sub-groups of the major two groups without clear separation. Interpretation ofthe high saponins cluster showed consistent variation within and among sub-groups,which represented accessions from both salares and coastal-lowland ecotypes (and regions).Moreover, the low saponin content genotypes scattered at a close-range distance comparedwith the genotypes that had high saponin content. The low saponins cluster segregatedinto PC1, including accessions from the coastal-lowland region and European cultivars.However, sub-groups shared some accessions from salares (AZ-14 and AZ-17) and south-altiplano (AZ-5). These data revealed an interpolation of coastal-lowland and salaresgenotypes in both PCA and dendogram analysis. An interpolation of genotypes in twomajor clusters could likely be due to the genetic similarity between highland and coastal-lowland C. quinoa genotypes [48]. Another study also revealed the existing genetic diversitywithin and among the different C. quinoa genotypes from different biomes of Chile, andsuch genetic diversity could be a primary reason for this possible variation in saponincontent [49]. Therefore, it is interesting to study the genetic background of these accessionsto understand potential genomic variation resulting in relative saponin content in C. quinoa.
3.4. Variance by the Genotypic Effect
To estimate the effect of genetic diversity pattern, the percentages of variance explainedby genotypic effect (Vg) in the total phenotypic variance for saponin content were estimatedusing a mixed linear model. This variance explained by genotypic effect (Vg) was calculatedaccording to the restricted maximum likelihood (REML) variance components using thelme4 library of R [42]. As a result, we found a significant genotypic effect (p ≤ 0.05)which shows that each genotype expresses the phenotype of the measured traits differently,i.e., there is a genetic diversity that would explain the variation of saponin content. Thesignificant effect of genotype represented by Vg validated the existence of genetic diversityup to 94.5% within the tested population for saponin content (Table S3).
Agronomy 2021, 11, 1867 15 of 18
Figure 5. Principal component analysis (a) and hierarchical cluster (b) of triterpenoid saponins of C. quinoa. Bi-plot showingthat two main components PC1 and PC2 explained 90.9% of the total variation in saponin content. Arrows represent eachvariable and the length of arrows approximates the variance of the variables, whereas the angle between arrows indicatestheir correlation. The scores of each quinoa genotype are outlined as points. The distance between each point explains howsimilar the observations are to each other. The cluster colors correspond to the cluster numbers in the legend of a panel (a).
4. Conclusions
Conclusively, the GC-MS profiling addressed the high degree of significant variancein relative saponin content, which ranges from 0.22 mg/g to 15.04 mg/g among the114 different C. quinoa genotypes. In total 29 genotypes were categorized as high saponincontent, and thus require the removal of saponins before products can be used for humanconsumption, while the rest of the genotypes were categorized as low-saponins or saponin-free lines. In this study, PA was reported as a prominent sapogenin, among others. Overallcluster data revealed uninterpreted divergence among sub-groups of the major two groupswithout clear separation. These dissimilarities in the sapogenins can be attributed to theexisting genetic diversity in C. quinoa. The high percentages of variance explained bygenotypic effect (Vg) in the total phenotypic variance for saponin content confirmed theexisting diversity in terms of saponin content, which could become a target for future plantbreeding efforts based on these accessions. Linked to this consideration, further genetic
Agronomy 2021, 11, 1867 16 of 18
investigation such as using genome-wide association studies (GWAS) will be used in futurestudies to identify underlying genomic regions linked with saponin content to be employedin plant breeding of quinoa through marker-assisted selection.
Supplementary Materials: The following are available online at https://www.mdpi.com/article/10.3390/agronomy11091867/s1, Figure S1: Pearson’s correlation heat map of total saponins andindividual sapogenins, Table S1: Total saponin content (mg/g) in C. quinoa lines, Table S2: Tukey’s-HSD multiple comparisons for saponin content, Table S3: Variance by genotypic effect.
Author Contributions: Conceptualization, A.P., B.T. and F.F.; methodology, software, validation, A.P.and B.T.; formal analysis, A.P.; investigation, resources, A.P.; data curation, A.P. and B.T.; writing-original draft preparation, A.P.; writing-review and editing, A.P. and B.T.; review and editing, F.F.,A.Z.-S. and B.U.; visualization, A.P.; supervision, B.T. and F.F.; project administration, F.F. and B.U.;funding acquisition, F.F. and B.U. All authors have read and agreed to the published version ofthe manuscript.
Funding: We thank the BMBF for funding the “Quinoa Diversity” project (Fkz. 031B0239) under theBioeconomy International funding scheme.
Institutional Review Board Statement: Not applicable.
Informed Consent Statement: Not applicable.
Data Availability Statement: The data presented in this study are available on request from thecorresponding author or other co-authors.
Acknowledgments: We delight to express our thanks towards, Dalma Castillo, and Christian Alfaroat the Instituto de Investigaciones Agropecuarias (INIA) for providing the C. quinoa diversity paneland other required information in regard to the C. quinoa lines. We are also warmly grateful toSven-Erik Jacobsen at the University of Copenhagen for providing us the known C. quinoa cultivarsTiticaca and Vikinga. We also thank Nathalie Wuyts, José Correa, Uwe Rascher, Ingar Janzik, andKathryn Dummschott for their creative suggestions and valuable support to conduct the experiments.
Conflicts of Interest: The authors declare no conflict of interest.
References1. Vincken, J.P.; Heng, L.; de Groot, A.; Gruppen, H. Saponins, classification and occurrence in the plant kingdom. Phytochem 2007,
68, 275–297. [CrossRef]2. Cheok, C.Y.; Salman, H.A.K.; Sulaiman, R. Extraction and quantification of saponins: A review. Food Res. Int. 2014, 59, 16–40.
[CrossRef]3. Stuardo, M.; Martin, R.S. Antifungal properties of quinoa (Chenopodium quinoa Willd.) alkali treated saponnins against Botrytis
cinerea. Ind. Crop. Prod. 2008, 27, 296–302. [CrossRef]4. FAO & CIRAD. State of the Art Report of Quinoa in the World in 2013; Bazile, D., Bertero, D., Nieto, C., Eds.; FAO & CIRAD: Rome,
Italy, 2015.5. Güclü-Üstündag, Ö.; Mazza, G. Saponins: Properties, applications and processing. Crit. Rev. Food Sci. Nutr. 2007, 47, 231–258.
[CrossRef] [PubMed]6. Vega-Galvez, A.; Miranda, M.; Vergara, J.; Uribe, E.; Puente, L.; Martinez, E.A. Nutrition facts and functional potential of quinoa
(Chenopodium quinoa Willd.), an ancient Andean grain: A review. J. Sci. Food Agric. 2010, 90, 2541–2547. [CrossRef] [PubMed]7. Rodríguez Gómez, M.J.; Matías Prieto, J.; Cruz Sobrado, V.; Calvo Magro, P. Nutritional characterization of six quinoa
(Chenopodium quinoa Willd) varieties cultivated in Southern Europe. J. Food Compos. Anal. 2021, 99, 103876. [CrossRef]8. Mhada, M.; Metougui, M.L.; El Hazzam, K.; El Kacimi, K.; Yasri, A. Variations of Saponins, Minerals and Total Phenolic
Compounds Due to Processing and Cooking of Quinoa (Chenopodium quinoa Willd.) Seeds. Foods 2020, 9, 660. [CrossRef]9. Adolf, V.I.; Shabala, S.; Andersen, M.N.; Razzaghi, F.; Jacobsen, S.E. Varietal differences of quinoa’s tolerance to saline conditions.
Plant Soil 2012, 357, 117–129. [CrossRef]10. Hariadi, Y.; Marandon, K.; Tian, Y.; Jacobsen, S.E.; Shabala, S. Ionic and osmotic relations in quinoa (Chenopodium quinoa Willd.)
plants grown at various salinity levels. J. Exp. Bot. 2011, 62, 185–193. [CrossRef]11. Jacobsen, S.E.; Mujica, A.; Jensen, C.R. The resistance of quinoa (Chenopodium quinoa Willd.) to adverse abiotic factors. Food Rev.
Int. 2003, 19, 99–109. [CrossRef]12. Burnoufradosevich, M.; Delfel, N.E.; England, R. Gas chromatography-mass spectrometry of olealane-type and ursane-type
triterpenes—Application to chenopodium-quinoa triterpenes. Phytochem 1985, 24, 2063–2066. [CrossRef]13. Cuadrado, C.; Ayet, G.; Burbano, C.; Muzquiz, M.; Camacho, L.; Cavieres, E.; Lovon, M.; Osagie, A.; Price, K.R. Occurence of
saponins and sapogenols in andean crops. J. Sci. Food Agric. 1995, 67, 169–172. [CrossRef]
Agronomy 2021, 11, 1867 17 of 18
14. Mastebroek, H.D.; Limburg, H.; Gilles, T.; Marvin, H.J.P. Occurrence of sapogenins in leaves and seeds of quinoa (Chenopodiumquinoa Willd). J. Sci. Food Agric. 2000, 80, 152–156. [CrossRef]
15. Ridout, C.L.; Price, K.R.; Dupont, M.S.; Parker, M.L.; Fenwick, G.R. Quinoa saponins—Analysis and preliminary investigationsinto the effects of reduction by processing. J. Sci. Food Agric. 1991, 54, 165–176. [CrossRef]
16. Madl, T.; Sterk, H.; Mittelbach, M. Tandem mass spectrometric analysis of a complex triterpene saponin mixture of Chenopodiumquinoa. J. Am. Soc. Mass Spectrom. 2006, 17, 795–806. [CrossRef]
17. Dini, I.; Schettino, O.; Simioli, T.; Dini, A. Studies on the constituents of Chenopodium quinoa seeds: Isolation and characterizationof new triterpene saponins. J. Agric. Food Chem. 2001, 49, 741–746. [CrossRef]
18. Dini, I.; Tenore, G.C.; Dini, A. Oleanane saponins in “kancolla”, a sweet variety of Chenopodium quinoa. J. Nat. Prod. 2002, 65,1023–1026. [CrossRef]
19. Dini, I.; Tenore, G.C.; Schettino, O.; Dini, A. New oleanane saponins in Chenopodium quinoa. J. Agric. Food Chem. 2001, 49,3976–3981. [CrossRef]
20. Kuljanabhagavad, T.; Thongphasuk, P.; Chamulitrat, W.; Wink, M. Triterpene saponins from Chenopodium quinoa Willd. Phytochem2008, 69, 1919–1926. [CrossRef]
21. Mizui, F.; Kasai, R.; Ohtani, K.; Tanaka, O. Saponins from bran of quinoa, Chenopodium quinoa WILLD. II. Chem. Pharm. Bull. 1990,38, 375–377. [CrossRef]
22. Zhu, N.Q.; Sheng, S.Q.; Sang, S.M.; Jhoo, J.W.; Bai, N.S.; Karwe, M.V.; Rosen, R.T.; Ho, C.T. Triterpene saponins from debitteredquinoa (Chenopodium quinoa) seeds. J. Agric. Food Chem. 2002, 50, 865–867. [CrossRef]
23. El Hazzam, K.; Hafsa, J.; Sobeh, M.; Mhada, M.; Taourirte, M.; El Kacimi, K.; Yasri, A. An Insight into Saponins from Quinoa(Chenopodium quinoa Willd): A Review. Molecules 2020, 25, 1059. [CrossRef]
24. Jarvis, D.E.; Ho, Y.S.; Lightfoot, D.J.; Schmockel, S.M.; Li, B.; Borm, T.J.A.; Ohyanagi, H.; Mineta, K.; Michell, C.T.; Saber, N.; et al.The genome of Chenopodium quinoa. Nature 2017, 542, 307–312. [CrossRef] [PubMed]
25. Koziol, M.J. Afrosimetric estimation of threshold saponin concentration for bitterness in quinoa (Chenopodium quinoa Willd). J. Sci.Food Agric. 1991, 54, 211–219. [CrossRef]
26. Medina-Meza, I.G.; Aluwi, N.A.; Saunders, S.R.; Ganjyal, G.M. GC-MS Profiling of Triterpenoid Saponins from 28 QuinoaVarieties (Chenopodium quinoa Willd.) Grown in Washington State. J. Agric. Food Chem. 2016, 64, 8583–8591. [CrossRef] [PubMed]
27. Martinez, E.A.; Veas, E.; Jorquera, C.; San Martin, R.; Jara, P. Re-Introduction of Quinoa into Arid Chile: Cultivation of TwoLowland Races under Extremely Low Irrigation. J. Agro. Crop Sci. 2009, 195, 1–10. [CrossRef]
28. Chauhan, G.S.; Eskin, N.A.M.; Tkachuk, R. Nutrients and antinutrients in quinoa seed. Cereal Chem. 1992, 69, 85–88.29. Gomez-Caravaca, M.A.; Iafelice, G.; Verardo, V.; Marconi, E.; Caboni, M.F. Influence of pearling process on phenolic and saponin
content in quinoa (Chenopodium quinoa Willd). Food Chem. 2014, 157, 174–178. [CrossRef]30. Lundberg, L. Saponin Removal from Quinoa by Abrasion Processing. Ph.D. Thesis, California Polytechnic State University, San
Luis Obispo, CA, USA, 2019.31. Zurita-Silva, A.; Fuentes, F.; Zamora, P.; Jacobsen, S.E.; Schwember, A.R. Breeding quinoa (Chenopodium quinoa Willd.): Potential
and perspectives. Mol. Breeding 2014, 34, 13–30. [CrossRef]32. van Erp, W. Marker Development for Bitter-Tasting-Saponin Gene in Quinoa (Chenopodium quinoa): Final report; Wageningen UR:
Wageningen, The Netherlands, 2016; Available online: http://edepot.wur.nl/394421 (accessed on 5 May 2021).33. Murphy, K.M.; Matanguihan, J.B.; Fuentes, F.F.; Gómez-Pando, L.R.; Jellen, E.N.; Maughan, P.J.; Jarvis, D.E. Quinoa Breeding and
Genomics. In Plant Breeding Reviews; Goldman, I., Ed.; Wiley: New York, NY, USA, 2018; Volume 42.34. Reichert, R.D.; Tatarynovich, J.T.; Tyler, R.T. Abrasive dehulling of quinoa (Chenopodium-quinoa)—Effect on saponin content as
determined by an adapted hemolytic assay. Cereal Chem. 1986, 63, 471–475.35. Ward, S.M. Response to selection for reduced grain saponin content in quinoa (Chenopodium quinoa Willd.). Field Crops Res. 2000,
68, 157–163. [CrossRef]36. Gómez-Caravaca, A.M.; Iafelice, G.; Lavini, A.; Pulvento, C.; Caboni, M.F.; Marconi, E. Phenolic Compounds and Saponins in
Quinoa Samples (Chenopodium quinoa Willd.) Grown under Different Saline and Nonsaline Irrigation Regimens. J. Agric. FoodChem. 2012, 60, 4620–4627. [CrossRef] [PubMed]
37. Ruales, J.; Nair, B.M. Saponins, phytic acid, tannins and protease inhibitors in quinoa (Chenopodium quinoa, Willd) seeds. FoodChem. 1993, 48, 137–143. [CrossRef]
38. Woldemichael, G.M.; Wink, M. Identification and biological activities of triterpenoid saponins from Chenopodium quinoa. J. Agric.Food Chem. 2001, 49, 2327–2332. [CrossRef]
39. Ruiz, K.B.; Khakimov, B.; Engelsen, S.B.; Bak, S.; Biondi, S.; Jacobsen, S.E. Quinoa seed coats as an expanding and sustainablesource of bioactive compounds: An investigation of genotypic diversity in saponin profiles. Ind. Crop. Prod. 2017, 104, 156–163.[CrossRef]
40. Jacobsen, S.E. Quinoa Quality. Available online: https://www.quinoaquality.com/contact-quinoa-quality (accessed on5 May 2021).
41. de Mendiburu, F. Agricolae: Statistical Procedures for Agricultural Research. Available online: https://CRAN.R-project.org/package=agricolae (accessed on 7 April 2021).
Agronomy 2021, 11, 1867 18 of 18
42. Bates, D.; Maechler, M.; Bolker, B.; Walker, S.; Christensen, R.H.B.; Singmann, H.; Dai, B.; Grothendieck, G.; Green, P. Package‘lme4’: Linear Mixed-Effects Models Using ‘Eigen’ and S4. Available online: https://github.com/lme4/lme4/ (accessed on16 April 2021).
43. Verza, S.G.; Kaiser, S.; de Resende, P.E.; Ortega, G.G. Determination and Characterization of Chenopodium quinoa Willd. Saponins.Lat. Am. J. Pharm. 2017, 36, 326–331.
44. Miranda, M.; Vega-Galvez, A.; Quispe-Fuentes, I.; Rodriguez, M.J.; Maureira, H.; Martinez, E.A. Nutritional aspects of six quinoa(Chenopodium quinoa Willd.) ecotypes from three geographical areas of Chile. Chil. J. Agric. Res. 2012, 72, 175–181. [CrossRef]
45. Ng, K.G.; Price, K.R.; Fenwick, G.R. A TLC method for the analysis of quinoa (Chenopodium quinoa) saponins. Food Chem. 1994, 49,311–315. [CrossRef]
46. Ando, H.; Chen, Y.C.; Tang, H.J.; Shimizu, M.; Watanabe, K.; Mitsunaga, T. Food components in fractions of quinoa seed. Food Sci.Technol. Res. 2002, 8, 80–84. [CrossRef]
47. Mroczek, A. Phytochemistry and bioactivity of triterpene saponins from Amaranthaceae family. Phytochem. Rev. 2015, 14, 577–605.[CrossRef]
48. Christensen, S.A.; Pratt, D.B.; Pratt, C.; Nelson, P.T.; Stevens, M.R.; Jellen, E.N.; Coleman, C.E.; Fairbanks, D.J.; Bonifacio, A.;Maughan, P.J. Assessment of genetic diversity in the USDA and CIP-FAO international nursery collections of quinoa (Chenopodiumquinoa Willd.) using microsatellite markers. Plant Genet. Resour. 2007, 5, 82–95. [CrossRef]
49. Fuentes, F.F.; Martinez, E.A.; Hinrichsen, P.V.; Jellen, E.N.; Maughan, P.J. Assessment of genetic diversity patterns in Chileanquinoa (Chenopodium quinoa Willd.) germplasm using multiplex fluorescent microsatellite markers. Conserv. Genet. 2009, 10,369–377. [CrossRef]
Related Documents