Comprehensive Assessment of Right Ventricular Function in Patients with Pulmonary Hypertension with Global Longitudinal Peak Systolic Strain Derived from Multiple Right Ventricular Views Sudarshan Rajagopal, MD, PhD, Daniel E. Forsha, MD, Niels Risum, MD, PhD, Christoph P. Hornik, MD, Abby D. Poms, RRT, Terry A. Fortin, MD, Victor F. Tapson, MD, Eric J. Velazquez, MD, Joseph Kisslo, MD, and Zainab Samad, MD, Durham, North Carolina; Hvidovre, Denmark; Beverly Hills, California Background: Right ventricular (RV) function is a strong predictor of mortality in pulmonary hypertension (PH), but two-dimensional (2D) echocardiography–derived assessments of RV function that could aid in risk assessment and management of patients with PH are of limited utility. RV longitudinal peak systolic strain (RVLS) derived from 2D speckle-tracking echocardiography is a relatively novel method for quantifying RV function but typically is derived from a single apical four-chamber view of the right ventricle and may have inherent limitations. The objective of this study was to determine the utility of regional and global RVLS calculated from multiple views of the right ventricle to comprehensively assess RV function in a cohort of patients with PH. Methods: Regional and global RVLS were obtained from multiple views of the right ventricle (centered on the right ventricle–focused apical position) in 40 patients with PH, defined as a mean pulmonary artery pressure $ 25 mm Hg, most of whom also had pulmonary capillary wedge pressures # 15 mm Hg and were thus defined as having pulmonary arterial hypertension. This was compared with other 2D echocardiography– derived parameters of RV function and functional parameters. Results: Global RVLS calculated from multiple views had a superior correlation with 6-min walk distance compared with other parameters of RV function, including tricuspid annular plane systolic excursion, RV myocardial performance index, and fractional area change. Although global RVLS calculated from multiple views displayed a similar correlation with 6-min walk distance as global RVLS calculated from a single four- chamber view, analysis of regional strains provided by multiple views identified distinct patterns of RV dysfunction, consisting of global, free wall, or septal dysfunction, that were associated with specific clinical characteristics. Conclusions: Global RVLS derived from multiple right ventricle–focused views yields a comprehensive quan- titative assessment of regional and global RV function that correlates moderately with functional parameters and may be useful in the assessment of PH. Distinct patterns of regional RV dysfunction are associated with different clinical characteristics. (J Am Soc Echocardiogr 2014;-:---.) Keywords: Pulmonary hypertension, Right ventricular function, Speckle-tracking echocardiography, Strain, 6-minute walk distance Pulmonary arterial hypertension (PAH), a subset of pulmonary hyper- tension (PH), is a disease of the pulmonary vasculature that leads to right ventricular (RV) dysfunction and failure. RV function is of critical importance in the prognosis of PAH. Hemodynamic parameters, including right atrial pressure and cardiac index, both reflecting RV function, 1 and pro–brain natriuretic peptide, associated with right heart failure, are all important prognostic biomarkers. 2 Patients with PAH are routinely followed using echocardiography, but the conventional two- dimensional (2D) echocardiographic assessment of the right ventricle does not include a clear quantitative assessment of function but rather a quantification of RV dimensions and a qualitative assessment of contractility. 3 This is due both to the complex geometry of the right ventricle and a poor understanding of its mechanical functioning compared with that of the left ventricle. 4 Quantitative assessments of From the Department of Medicine, Duke University Medical Center, Durham, North Carolina (S.R., A.D.P., T.A.F., E.J.V., J.K., Z.S.); Department of Pediatrics, Duke University Medical Center, Durham, North Carolina (D.E.F., C.P.H.); Department of Cardiology, Hvidovre Hospital, Hvidovre, Denmark (N.R.); and Department of Medicine, Cedars-Sinai Medical Center, Beverly Hills, California (V.F.T.). Dr Samad received research grant support from the American Society of Echocardiography (Morrisville, NC). Reprint requests: Sudarshan Rajagopal, MD, PhD, Duke University Medical Center, Box 3126, Durham, NC 27710 (E-mail: [email protected]. edu). 0894-7317/$36.00 Copyright 2014 by the American Society of Echocardiography. http://dx.doi.org/10.1016/j.echo.2014.02.001 1

Welcome message from author
This document is posted to help you gain knowledge. Please leave a comment to let me know what you think about it! Share it to your friends and learn new things together.
Transcript
From the Dep
Carolina (S.R.
University Me
of Cardiology
Medicine, Ced
Dr Samad re
Echocardiogr
Reprint reque
Center, Box 3
edu).
0894-7317/$3
Copyright 201
http://dx.doi.o
Comprehensive Assessment of Right VentricularFunction in Patients with Pulmonary Hypertension withGlobal Longitudinal Peak Systolic Strain Derived from
Multiple Right Ventricular Views
Sudarshan Rajagopal, MD, PhD, Daniel E. Forsha, MD, Niels Risum, MD, PhD, Christoph P. Hornik, MD,Abby D. Poms, RRT, Terry A. Fortin, MD, Victor F. Tapson, MD, Eric J. Velazquez, MD, Joseph Kisslo, MD,
and Zainab Samad, MD, Durham, North Carolina; Hvidovre, Denmark; Beverly Hills, California
Background:Right ventricular (RV) function is a strong predictor of mortality in pulmonary hypertension (PH),but two-dimensional (2D) echocardiography–derived assessments of RV function that could aid in riskassessment and management of patients with PH are of limited utility. RV longitudinal peak systolic strain(RVLS) derived from 2D speckle-tracking echocardiography is a relatively novel method for quantifying RVfunction but typically is derived from a single apical four-chamber view of the right ventricle and may haveinherent limitations. The objective of this study was to determine the utility of regional and global RVLScalculated from multiple views of the right ventricle to comprehensively assess RV function in a cohort ofpatients with PH.
Methods: Regional and global RVLS were obtained from multiple views of the right ventricle (centered on theright ventricle–focused apical position) in 40 patients with PH, defined as a mean pulmonary artery pressure$ 25 mm Hg, most of whom also had pulmonary capillary wedge pressures # 15 mm Hg and were thusdefined as having pulmonary arterial hypertension. This was compared with other 2D echocardiography–derived parameters of RV function and functional parameters.
Results: Global RVLS calculated from multiple views had a superior correlation with 6-min walk distancecompared with other parameters of RV function, including tricuspid annular plane systolic excursion, RVmyocardial performance index, and fractional area change. Although global RVLS calculated from multipleviews displayed a similar correlation with 6-min walk distance as global RVLS calculated from a single four-chamber view, analysis of regional strains provided by multiple views identified distinct patterns of RVdysfunction, consisting of global, free wall, or septal dysfunction, that were associated with specific clinicalcharacteristics.
Conclusions: Global RVLS derived from multiple right ventricle–focused views yields a comprehensive quan-titative assessment of regional and global RV function that correlates moderately with functional parametersand may be useful in the assessment of PH. Distinct patterns of regional RV dysfunction are associated withdifferent clinical characteristics. (J Am Soc Echocardiogr 2014;-:---.)
Keywords: Pulmonary hypertension, Right ventricular function, Speckle-tracking echocardiography, Strain,6-minute walk distance
artment ofMedicine, DukeUniversityMedical Center, Durham, North
, A.D.P., T.A.F., E.J.V., J.K., Z.S.); Department of Pediatrics, Duke
dical Center, Durham, North Carolina (D.E.F., C.P.H.); Department
, Hvidovre Hospital, Hvidovre, Denmark (N.R.); and Department of
ars-Sinai Medical Center, Beverly Hills, California (V.F.T.).
ceived research grant support from the American Society of
aphy (Morrisville, NC).
sts: Sudarshan Rajagopal, MD, PhD, Duke University Medical
126, Durham, NC 27710 (E-mail: [email protected].
6.00
4 by the American Society of Echocardiography.
rg/10.1016/j.echo.2014.02.001
Pulmonary arterial hypertension (PAH), a subset of pulmonary hyper-tension (PH), is a disease of the pulmonary vasculature that leads toright ventricular (RV) dysfunction and failure. RV function is of criticalimportance in the prognosis of PAH. Hemodynamic parameters,including right atrial pressure and cardiac index, both reflecting RVfunction,1 and pro–brain natriuretic peptide, associated with right heartfailure, are all important prognostic biomarkers.2 Patients with PAH areroutinely followed using echocardiography, but the conventional two-dimensional (2D) echocardiographic assessment of the right ventricledoes not include a clear quantitative assessment of function but rathera quantification of RV dimensions and a qualitative assessment ofcontractility.3 This is due both to the complex geometry of the rightventricle and a poor understanding of its mechanical functioningcompared with that of the left ventricle.4 Quantitative assessments of
1
Abbreviations
AP4 = Four-chamber rightventricular equivalent view
AP3 = Three-chamber rightventricular equivalent view
AP2 = Two-chamber right
ventricular equivalent view
FAC = Fractional area change
LV = Left ventricular
MPI = Myocardialperformance index
PA = Pulmonary artery
PAAT = Pulmonary arteryacceleration time
PAH = Pulmonary arterialhypertension
PH = Pulmonary hypertension
REVEAL = Registry toEvaluate Early and Long-Term
Pulmonary Arterial
Hypertension Disease
Management
RV = Right ventricular
RVLS = Right ventricular
longitudinal peak systolicstrain
6MWD = 6-min walk distance
TAPSE = Tricuspid annularplane systolic excursion
2D = Two-dimensional
2 Rajagopal et al Journal of the American Society of Echocardiography- 2014
RV function would aid in clinicaldecision making, as echocardio-graphic assessments of RV func-tion are routinely used to guidethe level of aggressiveness ofPAH therapy.5
To this end, a number of 2Dechocardiography–derived pa-rameters for RV functional assess-ment, such as tricuspid annularplane systolic excursion (TAPSE),RV fractional area change (FAC),and RV myocardial performanceindex (MPI), have been pro-posed, but all have inherentstrengths and weaknesses3
(Figure 1). RV longitudinal peaksystolic strain (RVLS) is a rela-tively novel approach for quanti-fying RV function and, whencalculated using 2D speckle-tracking echocardiography, isangle independent and yields aquantitative assessment of RVsystolic function. Moreover,recent studies have demonstratedrelationships between RVLS andoutcomes and response to ther-apy in patients with PAH.6-9
However, a continued limitationof RVLS from a single RV viewis that it does not yield a truly‘‘global’’ view of RV function.3
Recently, an approach for a globalassessment of RV function hasbeen developed that uses 3 rightventricle–focused views analo-
gous to their apical views of the left ventricle,10 to allow a full recon-struction of the right ventricle in an 18-segment or a 17-segmentmodel (Figure 2) with a calculation of a true ‘‘global RVLS.’’ In thiswork, we compared global RVLS between normal controls and pa-tients with PH, correlated global RVLS with other parameters of RVfunction (including TAPSE, MPI, and FAC) and with functionalstatus as assessed by 6-min walk distance (6MWD), and identifiedpatterns of regional RV dysfunction in patients with PH.
METHODS
Study Population
Clinically indicated echocardiographic studies incorporating the threeviews of the right ventricle (Figure 1) were performed on 42 consec-utive patients at Duke University Medical Center (Durham, NC) withdiagnoses of PH, defined as a mean pulmonary artery (PA) pressure$ 25 mm Hg, between May and December 2012. These patientshad diagnoses of PAH (mean PA pressure $ 25 mm Hg andPCWP # 15 mm Hg),11 exercise-induced PAH (normal mean PApressure at rest but mean PA pressure$ 30 mm Hg with exercise),12
or PH out of proportion to diastolic dysfunction (mean PA pressure$ 25 mm Hg, PCWP > 15 mm Hg, and pulmonary vascular resis-tance significantly higher than 3 Wood units).11 Of these patients,one did not have images of sufficient quality for strain calculations,
while one underwent repeat heart catheterization that demonstratedno evidence of PH on no medical therapy. The remaining 40 patientswith PH, along with a group of 40 previously described controls,10
were included in our final analysis. This normal population was acohort of young volunteers (mean age, 28.9 6 9.1 years) withoutany history of cardiovascular disease, with a minimum age of 18 yearsat the time of the study, normal echocardiographic findings, includinganatomy, left ventricular (LV) ejection fraction $ 50%, RV FAC$ 35%, and TAPSE$ 16 mm. Exclusion criteria for the control pop-ulation included any abnormal echocardiographic findings or pro-longed QRS duration. Subjects used as normal controls providedinformed consent for research echocardiography. For patients withPH whose images were obtained during clinically indicated echocar-diographic assessments, a waiver of consent was approved for theDuke Echocardiography Lab Database by the Duke UniversityMedical Center Institutional Review Board. This study was approvedby the Duke University Medical Center Institutional Review Board.
Echocardiography
All echocardiographic studies were performed using a Vivid E9 scannerwith a 3.5-MHz probe (GE Vingmed Ultrasound AS, Horten, Norway).A full standard echocardiographic examination, including grayscale im-ages optimized for 2D strain analysis (50–90 frames/sec) includingthree right ventricle–focused apical views,10 was performed. The threeapical RV views were equivalent to the imaging planes of the two-chamber, three-chamber, and four-chamber LV apical views with thetransducer angled rightward (Figure 1). View optimization oftenrequired repositioning of the transducer toward the left anterior axillaryline. The resulting four-chamber-equivalent view has four chambers(right atrium and ventricle, left ventricle and atrium), the two-chamber-equivalent view has three (right atrium, right ventricle, andRV outflow tract), and the three-chamber equivalent view has twochambers (right atrium and ventricle) (Figures 2A–2C).
All echocardiographic examinations were performed either on thesame day as a 6-min walk test or within 3months of 6-min walk test inpatients with PH. Six-minute walk tests were not done in three pa-tients with PH and were not performed in any of the normal controls.Right heart catheterization was typically not performed near the timeof echocardiography, except in those patients with new diagnoses ofPH. Offline analysis was performed using EchoPAC PC version BT11(GE Vingmed Ultrasound AS) by a single experienced reader, andanalysis was confirmed by a separate experienced reader; interreadervariability for this methodology has been shown to be low, with intra-observer variability (2 6 6%) and interobserver variability (1 6 9%)for global peak strain (percentagemean difference [bias]6 coefficientof variation).10
2D Echocardiography–Derived Parameters of RV Function
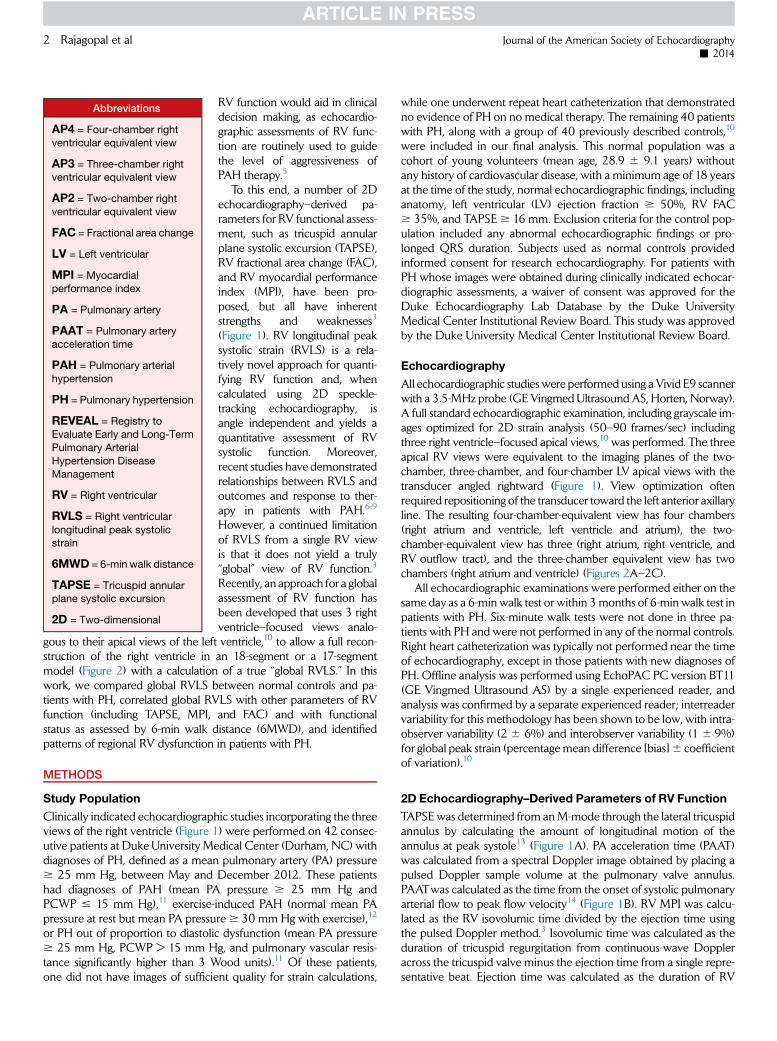
TAPSE was determined from anM-mode through the lateral tricuspidannulus by calculating the amount of longitudinal motion of theannulus at peak systole13 (Figure 1A). PA acceleration time (PAAT)was calculated from a spectral Doppler image obtained by placing apulsed Doppler sample volume at the pulmonary valve annulus.PAATwas calculated as the time from the onset of systolic pulmonaryarterial flow to peak flow velocity14 (Figure 1B). RV MPI was calcu-lated as the RV isovolumic time divided by the ejection time usingthe pulsed Doppler method.3 Isovolumic time was calculated as theduration of tricuspid regurgitation from continuous-wave Doppleracross the tricuspid valve minus the ejection time from a single repre-sentative beat. Ejection time was calculated as the duration of RV
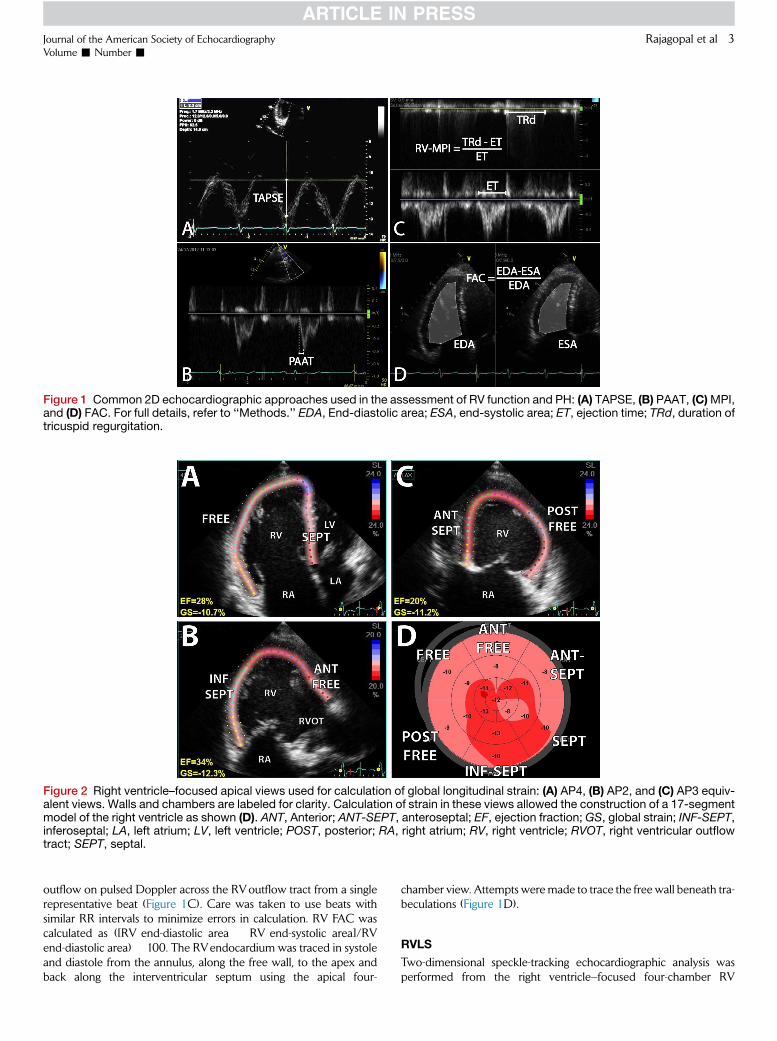
Figure 1 Common 2D echocardiographic approaches used in the assessment of RV function and PH: (A) TAPSE, (B) PAAT, (C)MPI,and (D) FAC. For full details, refer to ‘‘Methods.’’ EDA, End-diastolic area; ESA, end-systolic area; ET, ejection time; TRd, duration oftricuspid regurgitation.
Figure 2 Right ventricle–focused apical views used for calculation of global longitudinal strain: (A) AP4, (B) AP2, and (C) AP3 equiv-alent views. Walls and chambers are labeled for clarity. Calculation of strain in these views allowed the construction of a 17-segmentmodel of the right ventricle as shown (D). ANT, Anterior; ANT-SEPT, anteroseptal; EF, ejection fraction; GS, global strain; INF-SEPT,inferoseptal; LA, left atrium; LV, left ventricle; POST, posterior; RA, right atrium; RV, right ventricle; RVOT, right ventricular outflowtract; SEPT, septal.
Journal of the American Society of EchocardiographyVolume - Number -
Rajagopal et al 3
outflow on pulsed Doppler across the RVoutflow tract from a singlerepresentative beat (Figure 1C). Care was taken to use beats withsimilar RR intervals to minimize errors in calculation. RV FAC wascalculated as ([RV end-diastolic area � RV end-systolic area]/RVend-diastolic area) � 100. The RVendocardium was traced in systoleand diastole from the annulus, along the free wall, to the apex andback along the interventricular septum using the apical four-
chamber view. Attempts weremade to trace the free wall beneath tra-beculations (Figure 1D).
RVLS
Two-dimensional speckle-tracking echocardiographic analysis wasperformed from the right ventricle–focused four-chamber RV

Table 1 Characteristics of study population (n = 40)
Characteristic Value
ClinicalWomen 34 (85%)
Age (y) 58 6 14
BMI (kg/m2) 30.3 6 8.4
Symptom/disease duration (y) 4 (2–7)
WHO FC
I 4 (10%)
II 25 (63%)
III 10 (25%)
IV 1 (3%)
6MWD (m) 376 6 130
6MWD (% predicted) 75 6 23
REVEAL risk score 7.7 6 2.6
PH cause
Group 1 31 (78%)
Idiopathic 14 (35%)
Connective tissue disease 7 (18%)
Hereditary 4 (10%)
Congenital heart disease 2 (5%)
PVOD 2 (5%)
HIV 1 (2.5%)
Portopulmonary 1 (2.5%)
Out-of-proportion DD (group 2) 2 (5%)
Significant lung disease (group 3) 2 (5%)
CTEPH (group 4) 3 (7.5%)
Sarcoidosis (group 5) 1 (2.5%)
Exercise-induced (other) 1 (2.5%)Medications
ERA 23 (58%)PDE5 inhibitor 16 (40%)
Prostacyclin, inhaled 7 (18%)
4 Rajagopal et al Journal of the American Society of Echocardiography- 2014
equivalent (AP4), three-chamber RV equivalent (AP3), and two-chamber RV equivalent (AP2) views as previously described10 usingEchoPAC PC version BT11, which has previously been validatedfor LV strain10 (Figures 2 and Supplementary Figure1; available atwww.onlinejase.com). Images were optimized for strain analysis bydecreasing depth to improve resolution and decreasing sector widthto improve frame rate to 50 to 90 frames/sec. The reference pointfor a single cardiac cycle was placed at the beginning of the QRS com-plex. Pulmonic valve closure was determined from the pulsed-waveDoppler profile of the RVoutflow tract. For 2D speckle-tracking echo-cardiography, the endocardial border was traced in end-systole, andthe region of interest was adjusted to exclude the pericardium. Thequality of the speckle-tracking was assessed by EchoPAC andconfirmed visually from 2D images and from the strain traces.Segments with persistent inadequate tracking despite attempts atimproving border definition and region of interest were excludedfrom analysis (34 of 720 segments [4.7%]).
RVLSwas calculated for each region in these views, allowing calcu-lation of a 17-segment bull’s-eye plot (Figure 2D) and global RVLS. Inthis method, three right ventricle–focused apical views equivalent tothe four-chamber, two-chamber, and three-chamber LV views(termed the AP4, AP2, and AP3 views in this study) are obtainedby translation of the probe medially (Figure 2). These views allow acomprehensive reconstruction of the RV chamber in a 17-segmentbull’s-eye plot. For one patient, significant differences in RR intervalbetween the AP2, AP3, and AP4 views precluded a calculation ofglobal RVLS and a bull’s-eye plot. Examples of strain curves andbull’s-eye plots from a normal control and a patient with PH areshown in Supplementary Figure 1. The longitudinal strain of the RVfree wall was calculated as the average of the free wall strains andthe longitudinal strain of the RV septumwas calculated as the averageof the septal strains in the three RV views. All strain and other 2Dechocardiography–derived parameter analyses were performedblinded to 6MWD and other clinical data.
Prostacyclin, IV 8 (20%)
Combination therapy 21 (53%)None 6 (15%)
Other studiesSerum creatinine (mg/dL) 1.0 6 0.4
NT-proBNP (ng/L) 490 (124–1,232)DLCO 56 6 27
Most recent catheterizationRA pressure (mm Hg) 11 6 6
Cardiac index (L/min/m2) 2.4 6 0.7
Mean PA pressure (mm Hg) 50 6 15
PVR (Wood units) 9.5 6 5.3
BMI, Bodymass index;CTEPH, Chronic thromboembolic PH;DLCO,
diffusion capacity for carbon monoxide; DD, diastolic dysfunction;ERA, endothelin receptor antagonist; FC, functional class; HIV, hu-
man immunodeficiency virus; IV, intravenous; PDE5, phosphodies-
terase 5; NT-proBNP, N-terminal pro-brain natriuretic peptide;PVOD, pulmonary veno-occlusive disease; PVR, pulmonary vascular
resistance; RA, right atrial; WHO, World Health Organization.
Data are expressed as mean 6 SD, median (interquartile range), or
number (percentage).
Statistical Analysis
Unless otherwise stated, specified data are presented as mean6 SD oras percentages. We compared 2D echocardiography–derived parame-ters (regional and global RVLS, TAPSE, FAC, MPI, and PAAT) betweenpatients with PH and controls using two-tailed, unpaired Mann-Whitney tests. Correlations between pairs of 2D echocardiography–derived assessments of RV function were evaluated using Pearson’scorrelation coefficients. Correlations between 2D echocardiography–derived RV functional parameters, RVLS, and 6MWDwere examinedusing linear regression models. Clustering analysis was used to identifypatterns of regional RVLS. Hierarchical clustering of the 17-segmentregional RVLS arrays from 39 patients in whom global longitudinalstrain was performed in JMP 10 (SAS Institute Inc, Cary, NC).Missing valueswere imputed as either the average of all other segmentsor, if there were significant differences in strains between different seg-ments, the average of its nearest neighbors. Data were standardized bytheir segment means and standard deviations, and distances werecalculated using Ward’s minimum variance method. A visual assess-ment of the hierarchical clusters to assess similarities between differentpatterns was used to determine the cutoff point for the number of clus-ters. We compared clinical characteristics between the different clustersof regional RV strain using one-way analysis of variance followed bypairwise multiple comparison tests. We used Bonferroni’s method tocorrect for multiple testing. Statistical analyses were performed usingPrism 5.0 (GraphPad Software, San Diego, CA).
RESULTS
Characteristics of the Study Population
Baseline characteristics of the PH cohort are presented in Table 1. Asshown, the demographics of this population are similar to registries of

Table 2 Global and regional RVLS from the PH cohort compared with a control population of young individuals with no significantmedical problems10
Variable
Patients with PH
(n = 40)
Controls
(n = 41) P
StrainGlobal RVLS �15.6 6 4.6 �23.8 6 2.3 <.0001
Free wallBasal anterior free wall (1) �16.0 6 11.9 �31.4 6 7.7 <.0001
Basal free wall (2) �14.6 6 10.8 �25.3 6 5.9 <.0001
Basal posterior free wall (3) �12.2 6 8.3 �24.1 6 6.1 <.0001
Mid anterior free wall (7) �11.0 6 9.4 �30.0 6 7.0 <.0001
Mid free wall (8) �16.7 6 8.2 �28.4 6 4.7 <.0001
Mid posterior free wall (9) �14.7 6 8.0 �26.2 6 4.6 <.0001
Apical anterior wall (13) �15.3 6 7.3 �25.1 6 4.7 <.0001
Apical free wall (14) �16.7 6 6.5 �24.1 6 4.6 <.0001
Septum
Basal inferior septal wall (4) �15.1 6 8.1 �21.9 6 3.2 <.0001
Basal septal wall (5) �12.1 6 6.0 �17.9 6 4.8 <.0001
Basal anterior septal wall (6) �9.7 6 7.0 �16.7 6 4.5 <.0001
Mid inferior septal wall (10) �17.2 6 7.4 �21.5 6 2.9 <.0001
Mid septal wall (11) �14.5 6 5.5 �18.5 6 3.2 .0011Mid anterior septal wall (12) �11.0 6 7.0 �18.9 6 3.6 <.0001
Apical inferior wall (15) �15.6 6 7.5 �19.0 6 4.6 .0167Apical septal wall (16) �13.3 6 5.9 �22.2 6 5.0 <.0001
Apex (17) �15.2 6 6.1 �22.2 6 4.2 <.0001Other 2D echocardiography–derived parameters
TAPSE 1.8 6 0.5 2.1 6 0.3 .0041RV FAC 0.31 6 0.12 0.43 6 0.05 <.0001
RV MPI 0.35 6 0.25 0.27 6 0.10 .0342
PAAT 73 6 26 135 6 24 <.0001
Data are expressed as mean 6 SD. P values were calculated from two-tailed, unpaired Mann-Whitney tests. RV regions are described as in
Figure 2, with corresponding number in the 17-segment model in parentheses.
Journal of the American Society of EchocardiographyVolume - Number -
Rajagopal et al 5
PAH, as the majority of the patients were women with group 1 PAH,typically idiopathic PAH or PAH associated with connective tissue dis-ease.15 The predicted mortality for this cohort is average for PAH pa-tients, as assessed by their mean REVEAL (Registry to Evaluate Earlyand Long-Term Pulmonary Arterial Hypertension DiseaseManagement) risk score of 7.7.16
Global RVLS Is Reduced in Patients with PH
Images of sufficient quality for the calculation of regional RVLS wereobtained in 40 of 41 patients with PH (98%), and in the 40 patientsincluded in the final analysis, strains could not be traced because ofpoor tracking in 34 of 720 segments (4.7%). Strains and other 2Dechocardiography–derived parameters of RV function in this cohortof patients with PH are shown in Table 2, along with values from agroup of healthy control patients who have previously beendescribed.10 Patients with PH had lower global RVLS than controls,with the numerically largest differences in regional strains in the basal(�15.4) and middle (�19.0) anterior free wall segments and thenumerically smallest differences in the middle (�4.0) and apical infe-rior (�3.4) septal walls. On average, the difference between the pa-tients with PH and controls was higher in the RV free wall than inthe septum (difference in longitudinal strain of the RV free wall,�12.1 6 3.5; difference in longitudinal strain of the RV septum,�6.0 6 2.0; P = .007). Other echocardiography-derived parametersof RV function (i.e., TAPSE, FAC, MPI, hemodynamics, and PAAT)were also significantly different between patients with PH and
controls, consistent with RV dysfunction and higher PA pressures inpatients with PH.
Global and Regional RVLS as Assessments of RV Function
As expected, global RVLS correlated well with RVLS derived fromthe AP4, AP3, and AP2 views from which it was calculated(Table 3, Supplementary Figures 2A–2D) and was therefore, tosome degree, collinear. These differences suggest that althoughRVLS from these different views does report on the same global func-tion, there are also some regional differences in RV function. Weanalyzed the relationships between global RVLS and other 2D echo-cardiography–derived parameters of RV function and hemody-namics. Global RVLS displayed a poor to moderate correlation withTAPSE, FAC, and MPI (Supplementary Figures 2E–2G), in that order(Table 3). Global RVLS also correlated moderately with PAAT, whichwe used as a surrogate for PA hemodynamics, as it could be obtainedin all patients who were examined and it has a well-described corre-lation with PA systolic pressure and pulmonary arterial compli-ance.14,17
Because global RVLS correlated moderately with other 2D echo-cardiography–derived parameters of RV function and pulmonary he-modynamics, we then tested its correlation to an estimate of apatient’s functional capacity as assessed by 6MWD. This is acommonly used surrogate end point for clinical events in patientswith PH18 and correlates well with maximal oxygen consumptionand oxygen pulse.19 The correlations between TAPSE and RV MPI
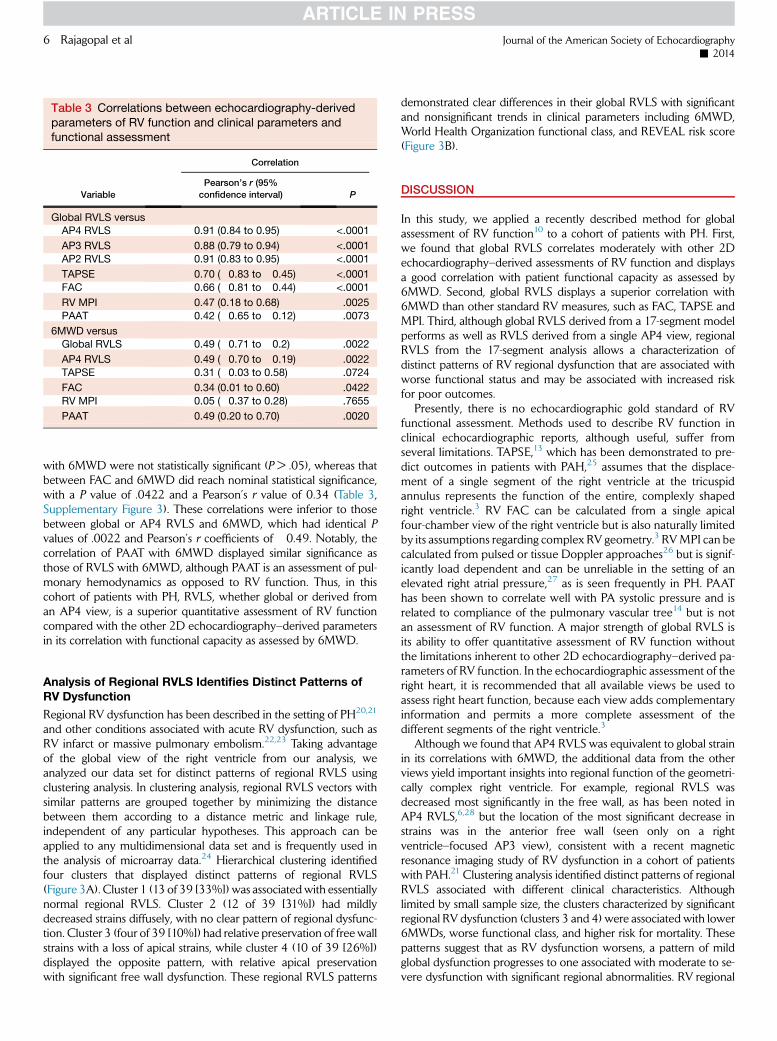
Table 3 Correlations between echocardiography-derivedparameters of RV function and clinical parameters andfunctional assessment
Variable
Correlation
Pearson’s r (95%
confidence interval) P
Global RVLS versusAP4 RVLS 0.91 (0.84 to 0.95) <.0001
AP3 RVLS 0.88 (0.79 to 0.94) <.0001
AP2 RVLS 0.91 (0.83 to 0.95) <.0001
TAPSE �0.70 (�0.83 to �0.45) <.0001
FAC �0.66 (�0.81 to �0.44) <.0001
RV MPI 0.47 (0.18 to 0.68) .0025
PAAT �0.42 (�0.65 to �0.12) .0073
6MWD versusGlobal RVLS �0.49 (�0.71 to �0.2) .0022
AP4 RVLS �0.49 (�0.70 to �0.19) .0022
TAPSE 0.31 (�0.03 to 0.58) .0724
FAC 0.34 (0.01 to 0.60) .0422
RV MPI �0.05 (�0.37 to 0.28) .7655
PAAT 0.49 (0.20 to 0.70) .0020
6 Rajagopal et al Journal of the American Society of Echocardiography- 2014
with 6MWD were not statistically significant (P > .05), whereas thatbetween FAC and 6MWD did reach nominal statistical significance,with a P value of .0422 and a Pearson’s r value of 0.34 (Table 3,Supplementary Figure 3). These correlations were inferior to thosebetween global or AP4 RVLS and 6MWD, which had identical Pvalues of .0022 and Pearson’s r coefficients of �0.49. Notably, thecorrelation of PAAT with 6MWD displayed similar significance asthose of RVLS with 6MWD, although PAAT is an assessment of pul-monary hemodynamics as opposed to RV function. Thus, in thiscohort of patients with PH, RVLS, whether global or derived froman AP4 view, is a superior quantitative assessment of RV functioncompared with the other 2D echocardiography–derived parametersin its correlation with functional capacity as assessed by 6MWD.
Analysis of Regional RVLS Identifies Distinct Patterns ofRV Dysfunction
Regional RV dysfunction has been described in the setting of PH20,21
and other conditions associated with acute RV dysfunction, such asRV infarct or massive pulmonary embolism.22,23 Taking advantageof the global view of the right ventricle from our analysis, weanalyzed our data set for distinct patterns of regional RVLS usingclustering analysis. In clustering analysis, regional RVLS vectors withsimilar patterns are grouped together by minimizing the distancebetween them according to a distance metric and linkage rule,independent of any particular hypotheses. This approach can beapplied to any multidimensional data set and is frequently used inthe analysis of microarray data.24 Hierarchical clustering identifiedfour clusters that displayed distinct patterns of regional RVLS(Figure 3A). Cluster 1 (13 of 39 [33%]) was associatedwith essentiallynormal regional RVLS. Cluster 2 (12 of 39 [31%]) had mildlydecreased strains diffusely, with no clear pattern of regional dysfunc-tion. Cluster 3 (four of 39 [10%]) had relative preservation of free wallstrains with a loss of apical strains, while cluster 4 (10 of 39 [26%])displayed the opposite pattern, with relative apical preservationwith significant free wall dysfunction. These regional RVLS patterns
demonstrated clear differences in their global RVLS with significantand nonsignificant trends in clinical parameters including 6MWD,World Health Organization functional class, and REVEAL risk score(Figure 3B).
DISCUSSION
In this study, we applied a recently described method for globalassessment of RV function10 to a cohort of patients with PH. First,we found that global RVLS correlates moderately with other 2Dechocardiography–derived assessments of RV function and displaysa good correlation with patient functional capacity as assessed by6MWD. Second, global RVLS displays a superior correlation with6MWD than other standard RV measures, such as FAC, TAPSE andMPI. Third, although global RVLS derived from a 17-segment modelperforms as well as RVLS derived from a single AP4 view, regionalRVLS from the 17-segment analysis allows a characterization ofdistinct patterns of RV regional dysfunction that are associated withworse functional status and may be associated with increased riskfor poor outcomes.
Presently, there is no echocardiographic gold standard of RVfunctional assessment. Methods used to describe RV function inclinical echocardiographic reports, although useful, suffer fromseveral limitations. TAPSE,13 which has been demonstrated to pre-dict outcomes in patients with PAH,25 assumes that the displace-ment of a single segment of the right ventricle at the tricuspidannulus represents the function of the entire, complexly shapedright ventricle.3 RV FAC can be calculated from a single apicalfour-chamber view of the right ventricle but is also naturally limitedby its assumptions regarding complex RV geometry.3 RVMPI can becalculated from pulsed or tissue Doppler approaches26 but is signif-icantly load dependent and can be unreliable in the setting of anelevated right atrial pressure,27 as is seen frequently in PH. PAAThas been shown to correlate well with PA systolic pressure and isrelated to compliance of the pulmonary vascular tree14 but is notan assessment of RV function. A major strength of global RVLS isits ability to offer quantitative assessment of RV function withoutthe limitations inherent to other 2D echocardiography–derived pa-rameters of RV function. In the echocardiographic assessment of theright heart, it is recommended that all available views be used toassess right heart function, because each view adds complementaryinformation and permits a more complete assessment of thedifferent segments of the right ventricle.3
Although we found that AP4 RVLS was equivalent to global strainin its correlations with 6MWD, the additional data from the otherviews yield important insights into regional function of the geometri-cally complex right ventricle. For example, regional RVLS wasdecreased most significantly in the free wall, as has been noted inAP4 RVLS,6,28 but the location of the most significant decrease instrains was in the anterior free wall (seen only on a rightventricle–focused AP3 view), consistent with a recent magneticresonance imaging study of RV dysfunction in a cohort of patientswith PAH.21 Clustering analysis identified distinct patterns of regionalRVLS associated with different clinical characteristics. Althoughlimited by small sample size, the clusters characterized by significantregional RV dysfunction (clusters 3 and 4) were associated with lower6MWDs, worse functional class, and higher risk for mortality. Thesepatterns suggest that as RV dysfunction worsens, a pattern of mildglobal dysfunction progresses to one associated with moderate to se-vere dysfunction with significant regional abnormalities. RV regional
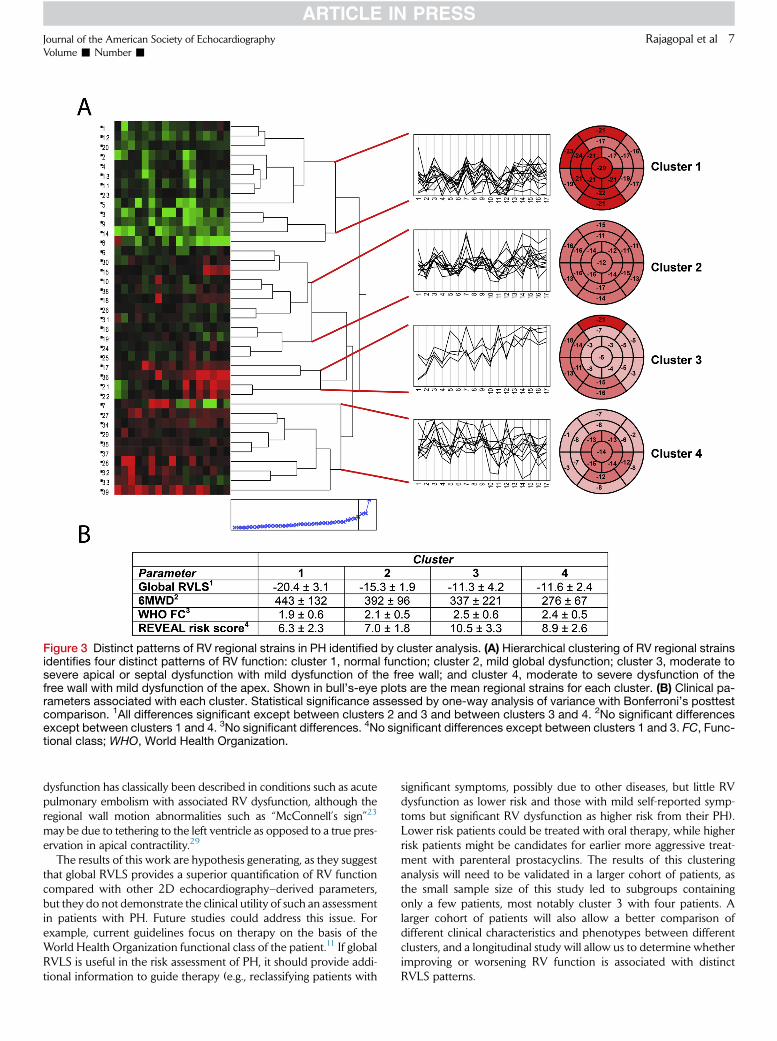
Figure 3 Distinct patterns of RV regional strains in PH identified by cluster analysis. (A) Hierarchical clustering of RV regional strainsidentifies four distinct patterns of RV function: cluster 1, normal function; cluster 2, mild global dysfunction; cluster 3, moderate tosevere apical or septal dysfunction with mild dysfunction of the free wall; and cluster 4, moderate to severe dysfunction of thefree wall with mild dysfunction of the apex. Shown in bull’s-eye plots are the mean regional strains for each cluster. (B) Clinical pa-rameters associated with each cluster. Statistical significance assessed by one-way analysis of variance with Bonferroni’s posttestcomparison. 1All differences significant except between clusters 2 and 3 and between clusters 3 and 4. 2No significant differencesexcept between clusters 1 and 4. 3No significant differences. 4No significant differences except between clusters 1 and 3. FC, Func-tional class; WHO, World Health Organization.
Journal of the American Society of EchocardiographyVolume - Number -
Rajagopal et al 7
dysfunction has classically been described in conditions such as acutepulmonary embolism with associated RV dysfunction, although theregional wall motion abnormalities such as ‘‘McConnell’s sign’’23
may be due to tethering to the left ventricle as opposed to a true pres-ervation in apical contractility.29
The results of this work are hypothesis generating, as they suggestthat global RVLS provides a superior quantification of RV functioncompared with other 2D echocardiography–derived parameters,but they do not demonstrate the clinical utility of such an assessmentin patients with PH. Future studies could address this issue. Forexample, current guidelines focus on therapy on the basis of theWorld Health Organization functional class of the patient.11 If globalRVLS is useful in the risk assessment of PH, it should provide addi-tional information to guide therapy (e.g., reclassifying patients with
significant symptoms, possibly due to other diseases, but little RVdysfunction as lower risk and those with mild self-reported symp-toms but significant RV dysfunction as higher risk from their PH).Lower risk patients could be treated with oral therapy, while higherrisk patients might be candidates for earlier more aggressive treat-ment with parenteral prostacyclins. The results of this clusteringanalysis will need to be validated in a larger cohort of patients, asthe small sample size of this study led to subgroups containingonly a few patients, most notably cluster 3 with four patients. Alarger cohort of patients will also allow a better comparison ofdifferent clinical characteristics and phenotypes between differentclusters, and a longitudinal study will allow us to determine whetherimproving or worsening RV function is associated with distinctRVLS patterns.

8 Rajagopal et al Journal of the American Society of Echocardiography- 2014
Study Limitations
A technical limitation in this analysis was the requirement for imagesthat were optimized for speckle-tracking, which is a limitation of strainanalysis in general. Also, all studies were performed onmachines froma single vendor (GE), using its software; the correlation with imagesobtained using other vendors’ machines or analyzing the data withvendor-independent software for assessment of RVLS is unknown,although LV strains obtained using different vendor-dependent andvendor-independent software demonstrate good reproducibility.30
Other limitations of this study include its relatively small size and per-formance at a single center with cardiac sonographers who werecomfortable using a relatively novel methodology for performing aright ventricle–focused examination. RVLS is also limited by its rela-tive lack of normative data in a large normal population across awide age range. Also, we compared RVLS with 6MWD, which hasinherent limitations in its applicability as a surrogate for hard clinicalend points.31 Ideally, as these patients are followed in a longitudinalfashion, global RVLS can be compared with hard end points suchas mortality.
CONCLUSIONS
Global RVLS demonstrates superior correlation with functional statusas assessed by 6MWD than other common 2D echocardiography–derived assessments of RV function such as TAPSE, FAC, and MPIin patients with PH. Analysis of regional RVLS demonstrates distinctpatterns of regional RV dysfunction that correlate with clinical param-eters and disease severity. These findings suggest that global RVLSmay be useful in the clinical assessment of patients with PH.
ACKNOWLEDGMENTS
We thank Amanda Tinnemore, Melissa Lefevre, Alicia Armour,Jennifer Tomfohr, and the sonographers of the Cardiac DiagnosticsUnit at Duke University Medical Center for image acquisition.
SUPPLEMENTARY DATA
Supplementary data related to this article can be found at http://dx.doi.org/10.1016/j.echo.2014.02.001.
REFERENCES
1. D’AlonzoGE, Barst RJ, Ayres SM, Bergofsky EH, Brundage BH, Detre KM,et al. Survival in patients with primary pulmonary hypertension. Resultsfrom a national prospective registry. Ann Intern Med 1991;115:343-9.
2. Benza RL, Miller DP, Gomberg-Maitland M, Frantz RP, Foreman AJ,Coffey CS, et al. Predicting survival in pulmonary arterial hypertension: in-sights from the Registry to Evaluate Early and Long-Term Pulmonary Arte-rial HypertensionDiseaseManagement (REVEAL). Circulation 2010;122:164-72.
3. Rudski LG, Lai WW, Afilalo J, Hua L, Handschumacher MD,Chandrasekaran K, et al. Guidelines for the echocardiographic assessmentof the right heart in adults: a report from the American Society of Echocar-diography endorsed by the European Association of Echocardiography, aregistered branch of the European Society of Cardiology, and the Cana-dian Society of Echocardiography. J Am Soc Echocardiogr 2010;23:685-713.
4. Sengupta PP, Narula J. RV form and function: a piston pump, vor-tex impeller, or hydraulic ram? JACC Cardiovasc Imaging 2013;6:636-9.
5. Galie N, Hoeper MM, Humbert M, Torbicki A, Vachiery JL, Barbera JA,et al. Guidelines for the diagnosis and treatment of pulmonary hyperten-sion: the Task Force for the Diagnosis and Treatment of Pulmonary Hy-pertension of the European Society of Cardiology (ESC) and theEuropean Respiratory Society (ERS), endorsed by the International Soci-ety of Heart and Lung Transplantation (ISHLT). Eur Heart J 2009;30:2493-537.
6. Sachdev A, Villarraga HR, Frantz RP, McGoon MD, Hsiao JF, Maalouf JF,et al. Right ventricular strain for prediction of survival in patients with pul-monary arterial hypertension. Chest 2011;139:1299-309.
7. Giusca S, Jurcut R, Coman IM, Ghiorghiu I, Catrina D, Popescu BA, et al.Right ventricular function predicts clinical response to specific vasodilatortherapy in patients with pulmonary hypertension. Echocardiography2013;30:17-26.
8. Haeck ML, Scherptong RW, Marsan NA, Holman ER, Schalij MJ, Bax JJ,et al. Prognostic value of right ventricular longitudinal peak systolic strainin patients with pulmonary hypertension. Circ Cardiovasc Imaging 2012;5:628-36.
9. Motoji Y, Tanaka H, Fukuda Y, Ryo K, Emoto N, Kawai H, et al. Efficacy ofright ventricular free-wall longitudinal speckle-tracking strain for predict-ing long-term outcome in patients with pulmonary hypertension. Circ J2013;77:756-63.
10. Forsha D, RisumN, Kropf PA, Rajagopal S, Smith PB, Kanter RJ, et al. RightVentricular Mechanics Using a Novel Comprehensive Three-View Echo-cardiographic Strain Analysis in a Normal Population. J Am Soc Echocar-diogr. 2014.
11. McLaughlin VV, Archer SL, Badesch DB, Barst RJ, Farber HW, Lindner JR,et al. ACCF/AHA 2009 expert consensus document on pulmonary hy-pertension: a report of the American College of Cardiology FoundationTask Force on Expert Consensus Documents and the American Heart As-sociation: developed in collaboration with the American College of ChestPhysicians, American Thoracic Society, Inc., and the Pulmonary Hyperten-sion Association. Circulation 2009;119:2250-94.
12. Tolle JJ, Waxman AB, Van Horn TL, Pappagianopoulos PP, Systrom DM.Exercise-induced pulmonary arterial hypertension. Circulation 2008;118:2183-9.
13. Kaul S, Tei C, Hopkins JM, Shah PM. Assessment of right ventricular func-tion using two-dimensional echocardiography. Am Heart J 1984;107:526-31.
14. Yared K, Noseworthy P, Weyman AE, McCabe E, Picard MH, Baggish AL.Pulmonary artery acceleration time provides an accurate estimate of sys-tolic pulmonary arterial pressure during transthoracic echocardiography.J Am Soc Echocardiogr 2011;24:687-92.
15. Badesch DB, Raskob GE, Elliott CG, Krichman AM, Farber HW, Frost AE,et al. Pulmonary arterial hypertension: baseline characteristics from theREVEAL registry. Chest 2010;137:376-87.
16. Benza RL, Gomberg-Maitland M, Miller DP, Frost A, Frantz RP,Foreman AJ, et al. The REVEAL registry risk score calculator in patientsnewly diagnosed with pulmonary arterial hypertension. Chest 2012;141:354-62.
17. Dabestani A, Mahan G, Gardin JM, Takenaka K, Burn C, Allfie A, et al.Evaluation of pulmonary artery pressure and resistance by pulsed Dopplerechocardiography. Am J Cardiol 1987;59:662-8.
18. Rasekaba T, Lee AL, Naughton MT, Williams TJ, Holland AE. The six-minute walk test: a useful metric for the cardiopulmonary patient. InternMed J 2009;39:495-501.
19. Miyamoto S, Nagaya N, Satoh T, Kyotani S, Sakamaki F, Fujita M, et al.Clinical correlates and prognostic significance of six-minute walk test inpatients with primary pulmonary hypertension. Comparison with car-diopulmonary exercise testing. Am J Respir Crit Care Med 2000;161:487-92.
20. Dambrauskaite V, Delcroix M, Claus P, Herbots L, D’Hooge J, Bijnens B,et al. Regional right ventricular dysfunction in chronic pulmonary hyper-tension. J Am Soc Echocardiogr 2007;20:1172-80.
Journal of the American Society of EchocardiographyVolume - Number -
Rajagopal et al 9
21. Shehata ML, Harouni AA, Skrok J, Basha TA, Boyce D, Lechtzin N, et al.Regional andGlobal biventricular function in pulmonary arterial hyperten-sion: a cardiac MR imaging study. Radiology 2013;266:114-22.
22. Haghi D, Sueselbeck T, Poerner T, Borggrefe M, Haase KK. A novelregional right ventricular wall-motion abnormality observed in a case ofacute pulmonary embolism (reverse McConnell sign). J Am Soc Echocar-diogr 2005;18:75-7.
23. McConnell MV, Solomon SD, Rayan ME, Come PC, Goldhaber SZ,Lee RT. Regional right ventricular dysfunction detected by echocardiogra-phy in acute pulmonary embolism. Am J Cardiol 1996;78:469-73.
24. Gollub J, Sherlock G. Clustering microarray data. Meth Enzymol 2006;411:194-213.
25. Forfia PR, Fisher MR, Mathai SC, Housten-Harris T, Hemnes AR,Borlaug BA, et al. Tricuspid annular displacement predicts survival in pul-monary hypertension. Am J Respir Crit Care Med 2006;174:1034-41.
26. Tei C, Ling LH, Hodge DO, Bailey KR, Oh JK, Rodeheffer RJ, et al. Newindex of combined systolic and diastolic myocardial performance: a sim-ple and reproducible measure of cardiac function—a study in normalsand dilated cardiomyopathy. J Cardiol 1995;26:357-66.
27. Yoshifuku S, Otsuji Y, Takasaki K, Yuge K, Kisanuki A, Toyonaga K, et al.Pseudonormalized Doppler total ejection isovolume (Tei) index in patientswith right ventricular acute myocardial infarction. Am J Cardiol 2003;91:527-31.
28. Fukuda Y, Tanaka H, Sugiyama D, Ryo K, Onishi T, Fukuya H, et al. Utilityof right ventricular free wall speckle-tracking strain for evaluation of rightventricular performance in patients with pulmonary hypertension. J AmSoc Echocardiogr 2011;24:1101-8.
29. Platz E, Hassanein AH, Shah A, Goldhaber SZ, Solomon SD. Regionalright ventricular strain pattern in patients with acute pulmonary embolism.Echocardiography 2012;29:464-70.
30. Risum N, Ali S, Olsen NT, Jons C, Khouri MG, Lauridsen TK, et al. Vari-ability of global left ventricular deformation analysis using vendor depen-dent and independent two-dimensional speckle-tracking software inadults. J Am Soc Echocardiogr 2012;25:1195-203.
31. Gabler NB, French B, Strom BL, Palevsky HI, Taichman DB,Kawut SM, et al. Validation of 6-minute walk distance as a surrogateend point in pulmonary arterial hypertension trials. Circulation 2012;126:349-56.
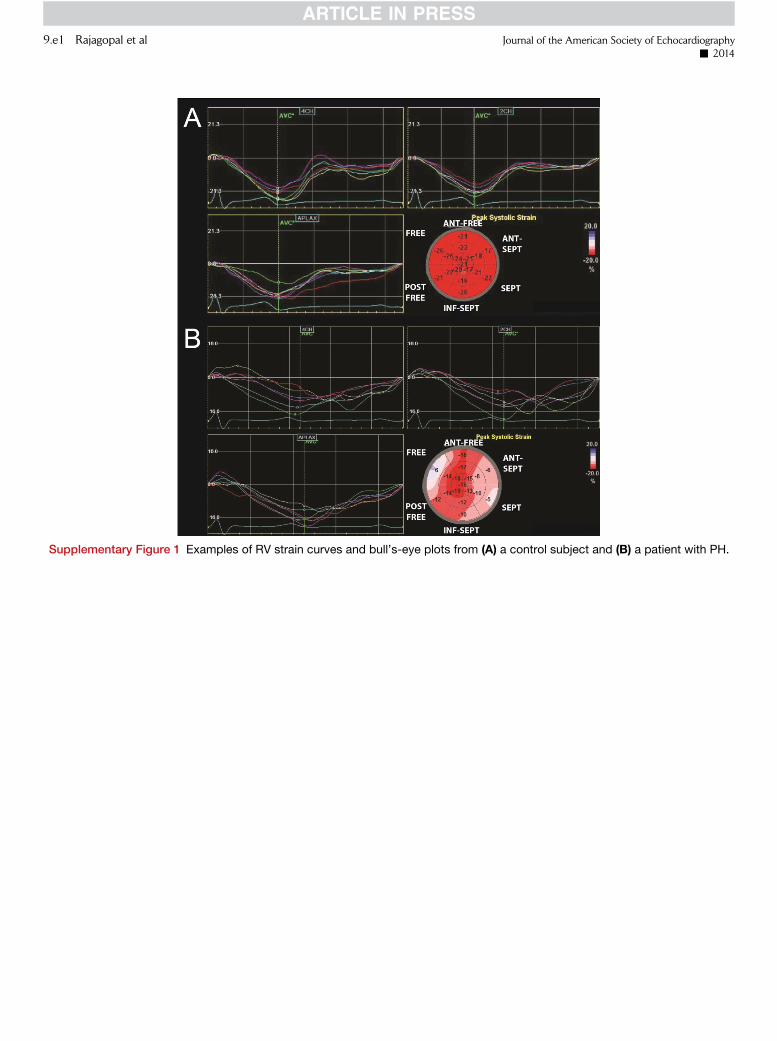
Supplementary Figure 1 Examples of RV strain curves and bull’s-eye plots from (A) a control subject and (B) a patient with PH.
9.e1 Rajagopal et al Journal of the American Society of Echocardiography- 2014

Supplementary Figure 2 Relationships between global RVLS, other 2D echocardiography–derived parameters of RV function or PApressure, and clinical measures. Excellent correlations between global RVLS and RVLS from the right ventricle–focused (A) AP4, (B)AP3, and (C) AP2 views. (D) Global RVLS with range of RVLS derived from different right ventricle–focused views. Correlations be-tween global RVLS and (E) TAPSE, (F) RV FAC, (G) RV MPI, and (H) PAAT (see Table 3 in main text).
Journal of the American Society of EchocardiographyVolume - Number -
Rajagopal et al 9.e2
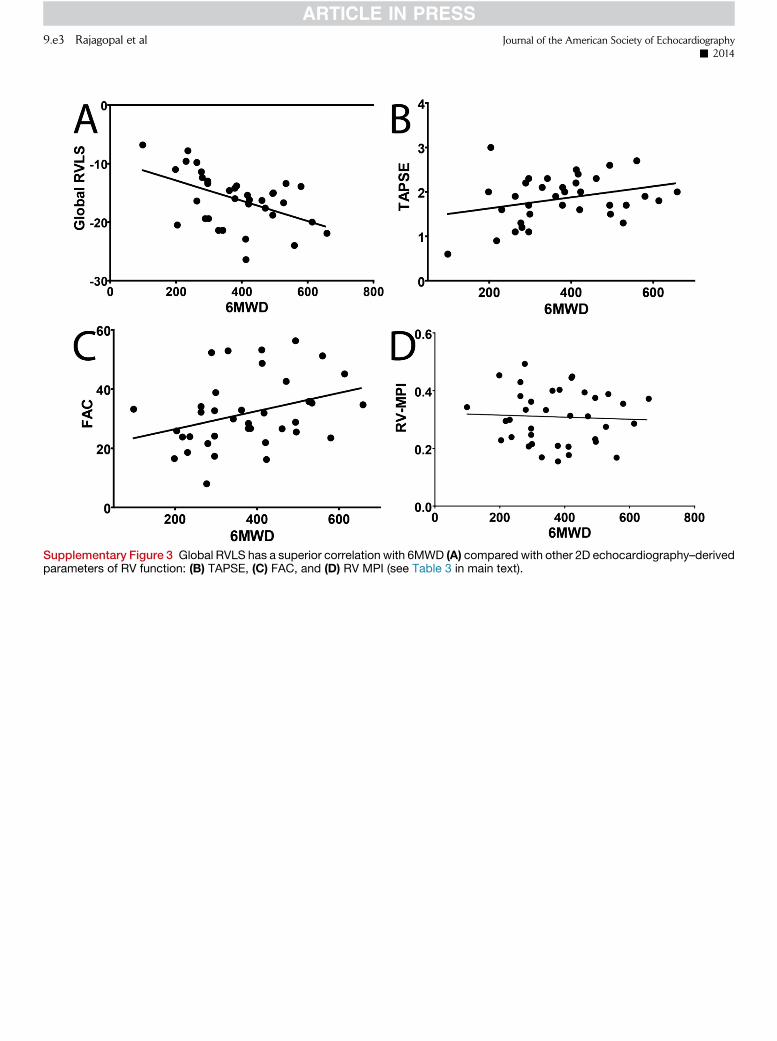
Supplementary Figure 3 Global RVLS has a superior correlation with 6MWD (A) compared with other 2D echocardiography–derivedparameters of RV function: (B) TAPSE, (C) FAC, and (D) RV MPI (see Table 3 in main text).
9.e3 Rajagopal et al Journal of the American Society of Echocardiography- 2014
Related Documents