Clinical research Imaging Reference right ventricular systolic and diastolic function normalized to age, gender and body surface area from steady-state free precession cardiovascular magnetic resonance Alicia M. Maceira 1 , Sanjay K. Prasad 1 , Mohammed Khan 2 , and Dudley J. Pennell 1 * 1 Cardiovascular Magnetic Resonance Unit, Royal Brompton Hospital, Sydney Street, London SW3 6NP, UK and 2 Statistics Unit, Royal Brompton Hospital, London, UK Received 26 June 2006; revised 29 September 2006; accepted 5 October 2006; online publish-ahead-of-print 6 November 2006 Aims Recent advances in cardiovascular magnetic resonance (CMR) include improved image quality with steady-state free precession (SSFP) sequences and advanced post-processing of high temporal resolution ventricular function. We used these techniques to establish the reference values for right ventricular (RV) volumes and function. Methods and results We studied 120 healthy subjects (60 men, 60 women; from 20 to 80 years) after exclusion of cardiovascular abnormality. Data were generated from SSFP cines, with three-dimensional modelling. Gender, body surface area (BSA), and age were independent predictors of several RV par- ameters. Normalized RV mass (RVM) and absolute and normalized RV volumes decreased significantly with age, whereas ejection fraction increased. For diastolic variables, absolute and normalized early peak filling rate (PFR E ) decreased and absolute and normalized active peak filling rate (PFR A ) in males increased, with decreased PFR E /PFR A . Increasing BSA was associated with increased RVM, volumes, and PFR E . Gender significantly influenced absolute and normalized mass and volumes, and absolute and normalized PFR A . Conclusion These data using state-of-the-art CMR show that normal values of RV systolic and diastolic parameters vary significantly by gender, BSA, and age. Appropriate reference ranges normalized to all three variables should be used in the determination of normality or severity of abnormality of RV dimen- sions and function. KEYWORDS Right ventricle; Normal values; Mass; Volume; Systolic function; Diastolic function Introduction Cardiovascular magnetic resonance (CMR) has been applied for the measurement of left ventricular (LV) and right ventri- cular (RV) volumes, systolic function, and mass for several years in the clinical arena, with standardized methods of short-axis multi-slice acquisition. 1 The excellent accuracy, 2 and reproducibility of CMR is well established, 3 making it a gold standard technique that can be very cost-effective. 4 This technique is well suited for the determination of RV parameters, because of the variable configuration of this chamber that requires a three-dimensional volume acqui- sition. CMR-derived RV volumes show good correlation with in vivo standards, 5 and this technique has shown good accu- racy 6 and reproducibility 7 for RV measurements. RV normal clinical ranges were established from a spoiled gradient echo sequence. 8 However, in recent years, the steady-state free precession (SSFP) technique has been introduced, which yields significantly improved blood-myocardium contrast, acquisition speed, and the ability to greatly improve the temporal resolution of the cines with improved image quality. 9 SSFP acquisitions yield slightly different results to the spoiled gradient echo sequence for cardiac volumes, because of superior discrimination between blood and endocardium, and between epicardium and epicardial fat. 10 This requires the determination of new reference ranges. The aim of this study was therefore to establish SSFP-based reference values in normal subjects for RV systolic function. In addition, in this study we estab- lish normal values for RV diastolic function. Methods Patients A total of 250 subjects working at the Royal Brompton and Harefield NHS Trust as well as their relatives were initially contacted by e-mail and invited to take part in our study as healthy volunteers, for which they should be asymptomatic, with no known risk factors of coronary artery disease and no history of cardiac disease. Finally, 142 subjects responded positively and agreed to & The European Society of Cardiology 2006. All rights reserved. For Permissions, please e-mail: [email protected] * Corresponding author. Tel: þ44 20 7351 8810; fax: þ44 20 7351 8816. E-mail address: [email protected] European Heart Journal (2006) 27, 2879–2888 doi:10.1093/eurheartj/ehl336 by guest on September 19, 2016 http://eurheartj.oxfordjournals.org/ Downloaded from

Welcome message from author
This document is posted to help you gain knowledge. Please leave a comment to let me know what you think about it! Share it to your friends and learn new things together.
Transcript
Clinical researchImaging
Reference right ventricular systolic and diastolicfunction normalized to age, gender and body surfacearea from steady-state free precession cardiovascularmagnetic resonance
Alicia M. Maceira1, Sanjay K. Prasad1, Mohammed Khan2, and Dudley J. Pennell1*
1Cardiovascular Magnetic Resonance Unit, Royal Brompton Hospital, Sydney Street, London SW3 6NP, UK and 2Statistics Unit,Royal Brompton Hospital, London, UK
Received 26 June 2006; revised 29 September 2006; accepted 5 October 2006; online publish-ahead-of-print 6 November 2006
Aims Recent advances in cardiovascular magnetic resonance (CMR) include improved image quality withsteady-state free precession (SSFP) sequences and advanced post-processing of high temporal resolutionventricular function. We used these techniques to establish the reference values for right ventricular(RV) volumes and function.Methods and results We studied 120 healthy subjects (60 men, 60 women; from 20 to 80 years) afterexclusion of cardiovascular abnormality. Data were generated from SSFP cines, with three-dimensionalmodelling. Gender, body surface area (BSA), and age were independent predictors of several RV par-ameters. Normalized RV mass (RVM) and absolute and normalized RV volumes decreased significantlywith age, whereas ejection fraction increased. For diastolic variables, absolute and normalized earlypeak filling rate (PFRE) decreased and absolute and normalized active peak filling rate (PFRA) inmales increased, with decreased PFRE/PFRA. Increasing BSA was associated with increased RVM,volumes, and PFRE. Gender significantly influenced absolute and normalized mass and volumes, andabsolute and normalized PFRA.Conclusion These data using state-of-the-art CMR show that normal values of RV systolic and diastolicparameters vary significantly by gender, BSA, and age. Appropriate reference ranges normalized to allthree variables should be used in the determination of normality or severity of abnormality of RV dimen-sions and function.
KEYWORDSRight ventricle;
Normal values;
Mass;
Volume;
Systolic function;
Diastolic function
Introduction
Cardiovascular magnetic resonance (CMR) has been appliedfor the measurement of left ventricular (LV) and right ventri-cular (RV) volumes, systolic function, and mass for severalyears in the clinical arena, with standardized methods ofshort-axis multi-slice acquisition.1 The excellent accuracy,2
and reproducibility of CMR is well established,3 making it agold standard technique that can be very cost-effective.4
This technique is well suited for the determination of RVparameters, because of the variable configuration of thischamber that requires a three-dimensional volume acqui-sition. CMR-derived RV volumes show good correlation within vivo standards,5 and this technique has shown good accu-racy6 and reproducibility7 for RV measurements. RV normalclinical ranges were established from a spoiled gradientecho sequence.8 However, in recent years, the steady-statefree precession (SSFP) technique has been introduced,which yields significantly improved blood-myocardium
contrast, acquisition speed, and the ability to greatlyimprove the temporal resolution of the cines with improvedimage quality.9 SSFP acquisitions yield slightly differentresults to the spoiled gradient echo sequence for cardiacvolumes, because of superior discrimination betweenblood and endocardium, and between epicardium andepicardial fat.10 This requires the determination of newreference ranges. The aim of this study was therefore toestablish SSFP-based reference values in normal subjectsfor RV systolic function. In addition, in this study we estab-lish normal values for RV diastolic function.
Methods
Patients
A total of 250 subjects working at the Royal Brompton and HarefieldNHS Trust as well as their relatives were initially contacted bye-mail and invited to take part in our study as healthy volunteers,for which they should be asymptomatic, with no known riskfactors of coronary artery disease and no history of cardiacdisease. Finally, 142 subjects responded positively and agreed to
& The European Society of Cardiology 2006. All rights reserved. For Permissions, please e-mail: [email protected]
* Corresponding author. Tel: þ44 20 7351 8810; fax: þ44 20 7351 8816.E-mail address: [email protected]
European Heart Journal (2006) 27, 2879–2888doi:10.1093/eurheartj/ehl336
by guest on September 19, 2016
http://eurheartj.oxfordjournals.org/D
ownloaded from
participate. Of these, five were rejected after initial assessment(two males found to be hypertensive, one female because ofq-waves on her electrocardiogram, one female because of morbidobesity, and one male found to have atrial fibrillation). Of the 137remaining subjects, four finally could not participate because ofclaustrophobia and another 13 were not included as the targetnumber had been reached before they could take part.Eventually, the study included 120 healthy volunteers, with10 men and 10 women in each of six age deciles from 20 to80 years. Data on analysis of LV parameters in these patients hasbeen reported elsewhere.11 All subjects were completely asympto-matic, with no known risk factors or history of cardiac disease andnormal physical examination and ECG. Also measured were theheight, weight, blood pressure, total cholesterol, HDL, and B-natriuretic peptide (BNP) (Table 1). Body surface area (BSA) was cal-culated according to the Mosteller formula.12 With the information,the coronary artery disease risk over 10 years was calculated.13 TheBNP levels were 2.5+ 2.1 pg/mL (range 0.5–12.0), and all were inthe normal range (,100 pg/mL).14 Moreover, relative stroke volume(SV) comparison with the LV11 confirmed the lack of shunting in all.Therefore, as far as it was possible to ascertain with conventionalnon-invasive techniques, all the apparently healthy subjects had anormal cardiovascular system with no evidence of heart failure.The study was approved by the institutional Ethics Committee,and all subjects gave written informed consent.
Cardiovascular magnetic resonance
CMR was performed with a 1.5T scanner (Siemens Sonata) using frontand back surface coils and retrospective ECG triggering for capture ofthe entire cardiac cycle including diastole. All CMR scans were per-formed by the same operator. SSFP end-expiratory breath-holdcines were acquired in the vertical and horizontal long-axis planes,with subsequent contiguous short-axis cines from the atrioventricular(AV) ring to the apex. Slice thickness was 7 mm. The temporalresolution was 21.6+ 1 ms. Sequence parameters included repeti-tion time/echo time of 3.2/1.6 ms, in-plane pixel size of2.1� 1.3 mm, flip angle 608, and acquisition time of 18 heartbeats.
CMR analysis
Analysis was performed with a personal computer and semi-automated software (CMRTools, Cardiovascular Imaging Solutions,London, UK) with the method described elsewhere.11 Analysis
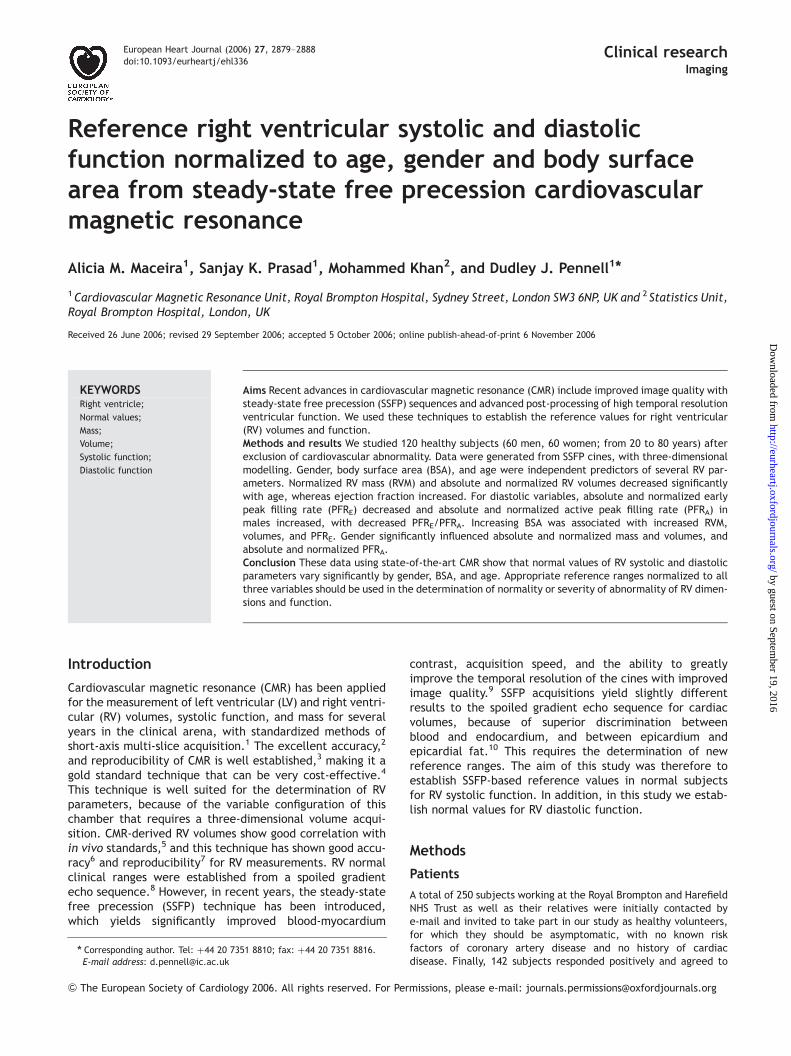
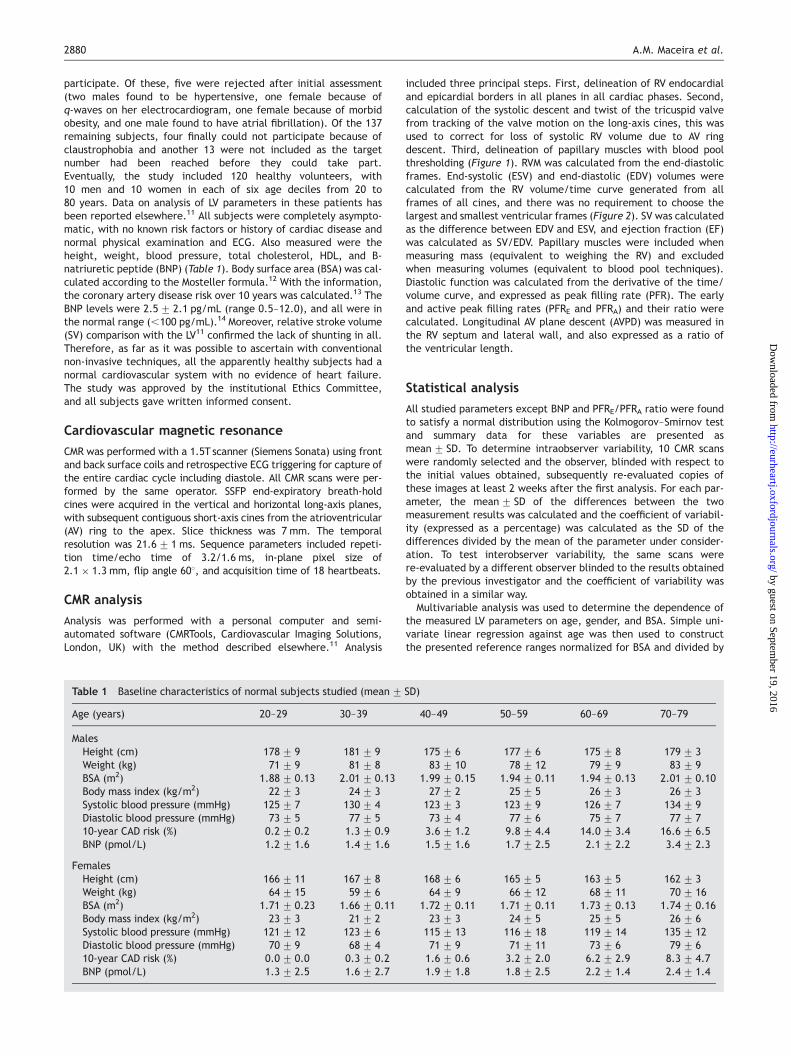
included three principal steps. First, delineation of RV endocardialand epicardial borders in all planes in all cardiac phases. Second,calculation of the systolic descent and twist of the tricuspid valvefrom tracking of the valve motion on the long-axis cines, this wasused to correct for loss of systolic RV volume due to AV ringdescent. Third, delineation of papillary muscles with blood poolthresholding (Figure 1). RVM was calculated from the end-diastolicframes. End-systolic (ESV) and end-diastolic (EDV) volumes werecalculated from the RV volume/time curve generated from allframes of all cines, and there was no requirement to choose thelargest and smallest ventricular frames (Figure 2). SV was calculatedas the difference between EDV and ESV, and ejection fraction (EF)was calculated as SV/EDV. Papillary muscles were included whenmeasuring mass (equivalent to weighing the RV) and excludedwhen measuring volumes (equivalent to blood pool techniques).Diastolic function was calculated from the derivative of the time/volume curve, and expressed as peak filling rate (PFR). The earlyand active peak filling rates (PFRE and PFRA) and their ratio werecalculated. Longitudinal AV plane descent (AVPD) was measured inthe RV septum and lateral wall, and also expressed as a ratio ofthe ventricular length.
Statistical analysis
All studied parameters except BNP and PFRE/PFRA ratio were foundto satisfy a normal distribution using the Kolmogorov–Smirnov testand summary data for these variables are presented asmean+ SD. To determine intraobserver variability, 10 CMR scanswere randomly selected and the observer, blinded with respect tothe initial values obtained, subsequently re-evaluated copies ofthese images at least 2 weeks after the first analysis. For each par-ameter, the mean+ SD of the differences between the twomeasurement results was calculated and the coefficient of variabil-ity (expressed as a percentage) was calculated as the SD of thedifferences divided by the mean of the parameter under consider-ation. To test interobserver variability, the same scans werere-evaluated by a different observer blinded to the results obtainedby the previous investigator and the coefficient of variability wasobtained in a similar way.
Multivariable analysis was used to determine the dependence ofthe measured LV parameters on age, gender, and BSA. Simple uni-variate linear regression against age was then used to constructthe presented reference ranges normalized for BSA and divided by
Table 1 Baseline characteristics of normal subjects studied (mean+ SD)
Age (years) 20–29 30–39 40–49 50–59 60–69 70–79
MalesHeight (cm) 178+ 9 181+ 9 175+ 6 177+ 6 175+ 8 179+ 3Weight (kg) 71+ 9 81+ 8 83+ 10 78+ 12 79+ 9 83+ 9BSA (m2) 1.88+ 0.13 2.01+ 0.13 1.99+ 0.15 1.94+ 0.11 1.94+ 0.13 2.01+ 0.10Body mass index (kg/m2) 22+ 3 24+ 3 27+ 2 25+ 5 26+ 3 26+ 3Systolic blood pressure (mmHg) 125+ 7 130+ 4 123+ 3 123+ 9 126+ 7 134+ 9Diastolic blood pressure (mmHg) 73+ 5 77+ 5 73+ 4 77+ 6 75+ 7 77+ 710-year CAD risk (%) 0.2+ 0.2 1.3+ 0.9 3.6+ 1.2 9.8+ 4.4 14.0+ 3.4 16.6+ 6.5BNP (pmol/L) 1.2+ 1.6 1.4+ 1.6 1.5+ 1.6 1.7+ 2.5 2.1+ 2.2 3.4+ 2.3
FemalesHeight (cm) 166+ 11 167+ 8 168+ 6 165+ 5 163+ 5 162+ 3Weight (kg) 64+ 15 59+ 6 64+ 9 66+ 12 68+ 11 70+ 16BSA (m2) 1.71+ 0.23 1.66+ 0.11 1.72+ 0.11 1.71+ 0.11 1.73+ 0.13 1.74+ 0.16Body mass index (kg/m2) 23+ 3 21+ 2 23+ 3 24+ 5 25+ 5 26+ 6Systolic blood pressure (mmHg) 121+ 12 123+ 6 115+ 13 116+ 18 119+ 14 135+ 12Diastolic blood pressure (mmHg) 70+ 9 68+ 4 71+ 9 71+ 11 73+ 6 79+ 610-year CAD risk (%) 0.0+ 0.0 0.3+ 0.2 1.6+ 0.6 3.2+ 2.0 6.2+ 2.9 8.3+ 4.7BNP (pmol/L) 1.3+ 2.5 1.6+ 2.7 1.9+ 1.8 1.8+ 2.5 2.2+ 1.4 2.4+ 1.4
2880 A.M. Maceira et al.
by guest on September 19, 2016
http://eurheartj.oxfordjournals.org/D
ownloaded from
gender, as mean and 95% confidence intervals. BNP and PFRE/PFRAdata were normally distributed after log-transformation, and afterregression, the means and confidence intervals were back-transformed for presentation. Student’s paired t-test was used tocompare RV SV with previously reported LV SV.11 Two-way ANOVAwas used to analyse variations in parameters due to age andgender. P-values ,0.05 were considered significant.
Results
Baseline characteristics and summary results
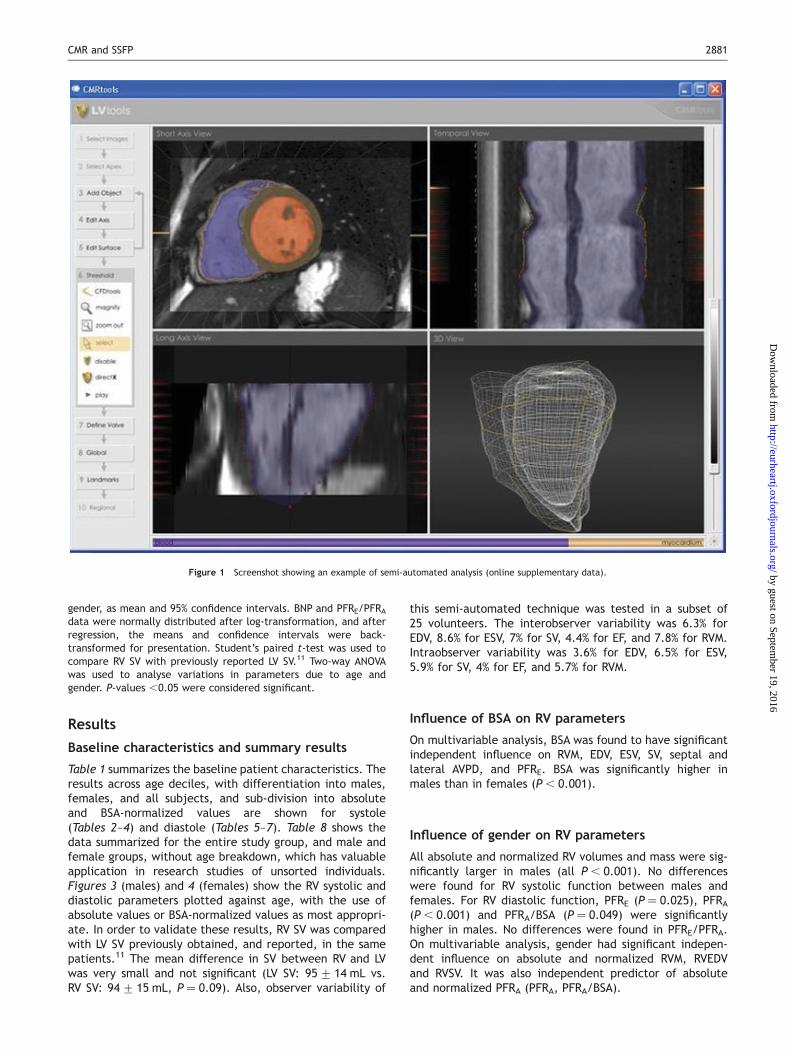
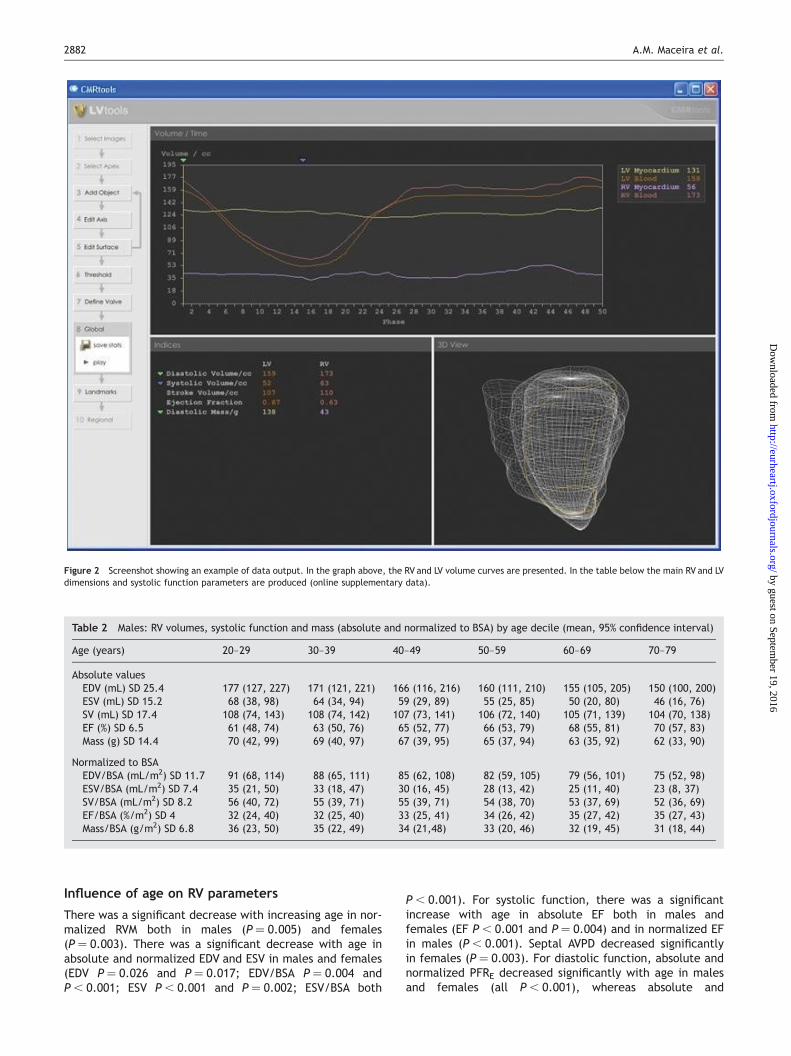
Table 1 summarizes the baseline patient characteristics. Theresults across age deciles, with differentiation into males,females, and all subjects, and sub-division into absoluteand BSA-normalized values are shown for systole(Tables 2–4) and diastole (Tables 5–7). Table 8 shows thedata summarized for the entire study group, and male andfemale groups, without age breakdown, which has valuableapplication in research studies of unsorted individuals.Figures 3 (males) and 4 (females) show the RV systolic anddiastolic parameters plotted against age, with the use ofabsolute values or BSA-normalized values as most appropri-ate. In order to validate these results, RV SV was comparedwith LV SV previously obtained, and reported, in the samepatients.11 The mean difference in SV between RV and LVwas very small and not significant (LV SV: 95+ 14 mL vs.RV SV: 94+ 15 mL, P ¼ 0.09). Also, observer variability of
this semi-automated technique was tested in a subset of25 volunteers. The interobserver variability was 6.3% forEDV, 8.6% for ESV, 7% for SV, 4.4% for EF, and 7.8% for RVM.Intraobserver variability was 3.6% for EDV, 6.5% for ESV,5.9% for SV, 4% for EF, and 5.7% for RVM.
Influence of BSA on RV parameters
On multivariable analysis, BSA was found to have significantindependent influence on RVM, EDV, ESV, SV, septal andlateral AVPD, and PFRE. BSA was significantly higher inmales than in females (P, 0.001).
Influence of gender on RV parameters
All absolute and normalized RV volumes and mass were sig-nificantly larger in males (all P, 0.001). No differenceswere found for RV systolic function between males andfemales. For RV diastolic function, PFRE (P ¼ 0.025), PFRA(P , 0.001) and PFRA/BSA (P ¼ 0.049) were significantlyhigher in males. No differences were found in PFRE/PFRA.On multivariable analysis, gender had significant indepen-dent influence on absolute and normalized RVM, RVEDVand RVSV. It was also independent predictor of absoluteand normalized PFRA (PFRA, PFRA/BSA).
Figure 1 Screenshot showing an example of semi-automated analysis (online supplementary data).
CMR and SSFP 2881
by guest on September 19, 2016
http://eurheartj.oxfordjournals.org/D
ownloaded from
Influence of age on RV parameters
There was a significant decrease with increasing age in nor-malized RVM both in males (P ¼ 0.005) and females(P ¼ 0.003). There was a significant decrease with age inabsolute and normalized EDV and ESV in males and females(EDV P ¼ 0.026 and P ¼ 0.017; EDV/BSA P ¼ 0.004 andP, 0.001; ESV P, 0.001 and P ¼ 0.002; ESV/BSA both
P , 0.001). For systolic function, there was a significantincrease with age in absolute EF both in males andfemales (EF P , 0.001 and P ¼ 0.004) and in normalized EFin males (P, 0.001). Septal AVPD decreased significantlyin females (P ¼ 0.003). For diastolic function, absolute andnormalized PFRE decreased significantly with age in malesand females (all P, 0.001), whereas absolute and
Table 2 Males: RV volumes, systolic function and mass (absolute and normalized to BSA) by age decile (mean, 95% confidence interval)
Age (years) 20–29 30–39 40–49 50–59 60–69 70–79
Absolute valuesEDV (mL) SD 25.4 177 (127, 227) 171 (121, 221) 166 (116, 216) 160 (111, 210) 155 (105, 205) 150 (100, 200)ESV (mL) SD 15.2 68 (38, 98) 64 (34, 94) 59 (29, 89) 55 (25, 85) 50 (20, 80) 46 (16, 76)SV (mL) SD 17.4 108 (74, 143) 108 (74, 142) 107 (73, 141) 106 (72, 140) 105 (71, 139) 104 (70, 138)EF (%) SD 6.5 61 (48, 74) 63 (50, 76) 65 (52, 77) 66 (53, 79) 68 (55, 81) 70 (57, 83)Mass (g) SD 14.4 70 (42, 99) 69 (40, 97) 67 (39, 95) 65 (37, 94) 63 (35, 92) 62 (33, 90)
Normalized to BSAEDV/BSA (mL/m2) SD 11.7 91 (68, 114) 88 (65, 111) 85 (62, 108) 82 (59, 105) 79 (56, 101) 75 (52, 98)ESV/BSA (mL/m2) SD 7.4 35 (21, 50) 33 (18, 47) 30 (16, 45) 28 (13, 42) 25 (11, 40) 23 (8, 37)SV/BSA (mL/m2) SD 8.2 56 (40, 72) 55 (39, 71) 55 (39, 71) 54 (38, 70) 53 (37, 69) 52 (36, 69)EF/BSA (%/m2) SD 4 32 (24, 40) 32 (25, 40) 33 (25, 41) 34 (26, 42) 35 (27, 42) 35 (27, 43)Mass/BSA (g/m2) SD 6.8 36 (23, 50) 35 (22, 49) 34 (21,48) 33 (20, 46) 32 (19, 45) 31 (18, 44)
Figure 2 Screenshot showing an example of data output. In the graph above, the RV and LV volume curves are presented. In the table below the main RV and LVdimensions and systolic function parameters are produced (online supplementary data).
2882 A.M. Maceira et al.
by guest on September 19, 2016
http://eurheartj.oxfordjournals.org/D
ownloaded from
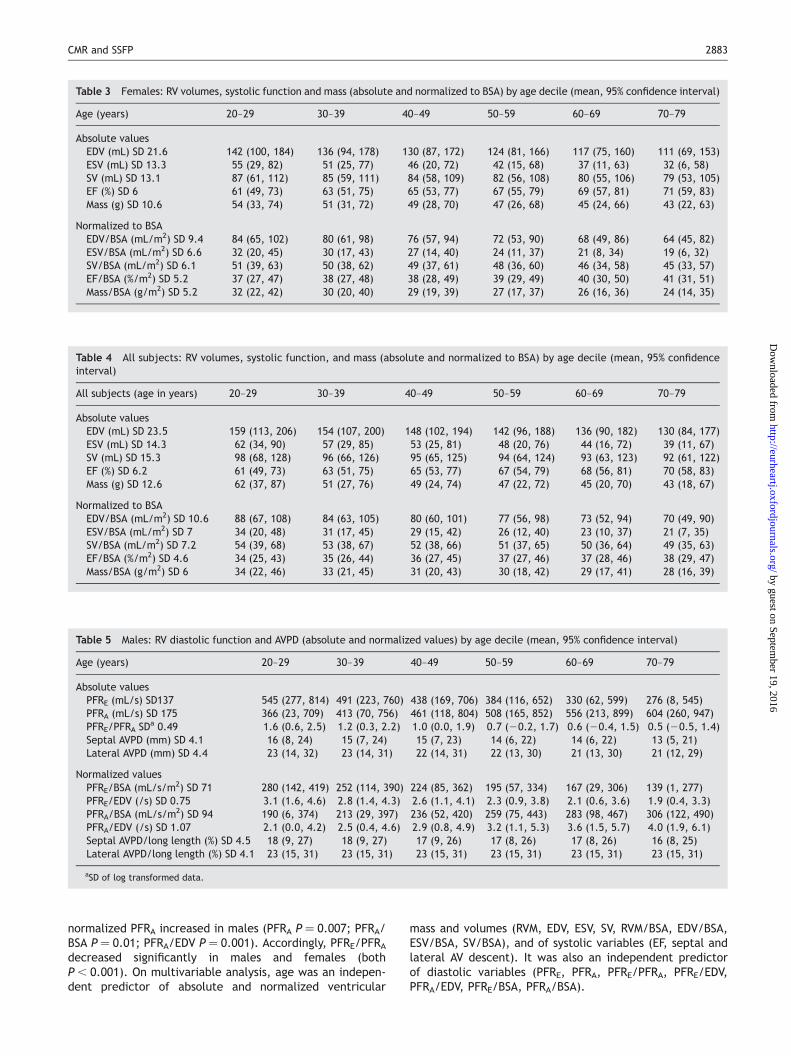
normalized PFRA increased in males (PFRA P ¼ 0.007; PFRA/BSA P ¼ 0.01; PFRA/EDV P ¼ 0.001). Accordingly, PFRE/PFRAdecreased significantly in males and females (bothP, 0.001). On multivariable analysis, age was an indepen-dent predictor of absolute and normalized ventricular
mass and volumes (RVM, EDV, ESV, SV, RVM/BSA, EDV/BSA,ESV/BSA, SV/BSA), and of systolic variables (EF, septal andlateral AV descent). It was also an independent predictorof diastolic variables (PFRE, PFRA, PFRE/PFRA, PFRE/EDV,PFRA/EDV, PFRE/BSA, PFRA/BSA).
Table 4 All subjects: RV volumes, systolic function, and mass (absolute and normalized to BSA) by age decile (mean, 95% confidenceinterval)
All subjects (age in years) 20–29 30–39 40–49 50–59 60–69 70–79
Absolute valuesEDV (mL) SD 23.5 159 (113, 206) 154 (107, 200) 148 (102, 194) 142 (96, 188) 136 (90, 182) 130 (84, 177)ESV (mL) SD 14.3 62 (34, 90) 57 (29, 85) 53 (25, 81) 48 (20, 76) 44 (16, 72) 39 (11, 67)SV (mL) SD 15.3 98 (68, 128) 96 (66, 126) 95 (65, 125) 94 (64, 124) 93 (63, 123) 92 (61, 122)EF (%) SD 6.2 61 (49, 73) 63 (51, 75) 65 (53, 77) 67 (54, 79) 68 (56, 81) 70 (58, 83)Mass (g) SD 12.6 62 (37, 87) 51 (27, 76) 49 (24, 74) 47 (22, 72) 45 (20, 70) 43 (18, 67)
Normalized to BSAEDV/BSA (mL/m2) SD 10.6 88 (67, 108) 84 (63, 105) 80 (60, 101) 77 (56, 98) 73 (52, 94) 70 (49, 90)ESV/BSA (mL/m2) SD 7 34 (20, 48) 31 (17, 45) 29 (15, 42) 26 (12, 40) 23 (10, 37) 21 (7, 35)SV/BSA (mL/m2) SD 7.2 54 (39, 68) 53 (38, 67) 52 (38, 66) 51 (37, 65) 50 (36, 64) 49 (35, 63)EF/BSA (%/m2) SD 4.6 34 (25, 43) 35 (26, 44) 36 (27, 45) 37 (27, 46) 37 (28, 46) 38 (29, 47)Mass/BSA (g/m2) SD 6 34 (22, 46) 33 (21, 45) 31 (20, 43) 30 (18, 42) 29 (17, 41) 28 (16, 39)
Table 5 Males: RV diastolic function and AVPD (absolute and normalized values) by age decile (mean, 95% confidence interval)
Age (years) 20–29 30–39 40–49 50–59 60–69 70–79
Absolute valuesPFRE (mL/s) SD137 545 (277, 814) 491 (223, 760) 438 (169, 706) 384 (116, 652) 330 (62, 599) 276 (8, 545)PFRA (mL/s) SD 175 366 (23, 709) 413 (70, 756) 461 (118, 804) 508 (165, 852) 556 (213, 899) 604 (260, 947)PFRE/PFRA SDa 0.49 1.6 (0.6, 2.5) 1.2 (0.3, 2.2) 1.0 (0.0, 1.9) 0.7 (20.2, 1.7) 0.6 (20.4, 1.5) 0.5 (20.5, 1.4)Septal AVPD (mm) SD 4.1 16 (8, 24) 15 (7, 24) 15 (7, 23) 14 (6, 22) 14 (6, 22) 13 (5, 21)Lateral AVPD (mm) SD 4.4 23 (14, 32) 23 (14, 31) 22 (14, 31) 22 (13, 30) 21 (13, 30) 21 (12, 29)
Normalized valuesPFRE/BSA (mL/s/m2) SD 71 280 (142, 419) 252 (114, 390) 224 (85, 362) 195 (57, 334) 167 (29, 306) 139 (1, 277)PFRE/EDV (/s) SD 0.75 3.1 (1.6, 4.6) 2.8 (1.4, 4.3) 2.6 (1.1, 4.1) 2.3 (0.9, 3.8) 2.1 (0.6, 3.6) 1.9 (0.4, 3.3)PFRA/BSA (mL/s/m2) SD 94 190 (6, 374) 213 (29, 397) 236 (52, 420) 259 (75, 443) 283 (98, 467) 306 (122, 490)PFRA/EDV (/s) SD 1.07 2.1 (0.0, 4.2) 2.5 (0.4, 4.6) 2.9 (0.8, 4.9) 3.2 (1.1, 5.3) 3.6 (1.5, 5.7) 4.0 (1.9, 6.1)Septal AVPD/long length (%) SD 4.5 18 (9, 27) 18 (9, 27) 17 (9, 26) 17 (8, 26) 17 (8, 26) 16 (8, 25)Lateral AVPD/long length (%) SD 4.1 23 (15, 31) 23 (15, 31) 23 (15, 31) 23 (15, 31) 23 (15, 31) 23 (15, 31)
aSD of log transformed data.
Table 3 Females: RV volumes, systolic function and mass (absolute and normalized to BSA) by age decile (mean, 95% confidence interval)
Age (years) 20–29 30–39 40–49 50–59 60–69 70–79
Absolute valuesEDV (mL) SD 21.6 142 (100, 184) 136 (94, 178) 130 (87, 172) 124 (81, 166) 117 (75, 160) 111 (69, 153)ESV (mL) SD 13.3 55 (29, 82) 51 (25, 77) 46 (20, 72) 42 (15, 68) 37 (11, 63) 32 (6, 58)SV (mL) SD 13.1 87 (61, 112) 85 (59, 111) 84 (58, 109) 82 (56, 108) 80 (55, 106) 79 (53, 105)EF (%) SD 6 61 (49, 73) 63 (51, 75) 65 (53, 77) 67 (55, 79) 69 (57, 81) 71 (59, 83)Mass (g) SD 10.6 54 (33, 74) 51 (31, 72) 49 (28, 70) 47 (26, 68) 45 (24, 66) 43 (22, 63)
Normalized to BSAEDV/BSA (mL/m2) SD 9.4 84 (65, 102) 80 (61, 98) 76 (57, 94) 72 (53, 90) 68 (49, 86) 64 (45, 82)ESV/BSA (mL/m2) SD 6.6 32 (20, 45) 30 (17, 43) 27 (14, 40) 24 (11, 37) 21 (8, 34) 19 (6, 32)SV/BSA (mL/m2) SD 6.1 51 (39, 63) 50 (38, 62) 49 (37, 61) 48 (36, 60) 46 (34, 58) 45 (33, 57)EF/BSA (%/m2) SD 5.2 37 (27, 47) 38 (27, 48) 38 (28, 49) 39 (29, 49) 40 (30, 50) 41 (31, 51)Mass/BSA (g/m2) SD 5.2 32 (22, 42) 30 (20, 40) 29 (19, 39) 27 (17, 37) 26 (16, 36) 24 (14, 35)
CMR and SSFP 2883
by guest on September 19, 2016
http://eurheartj.oxfordjournals.org/D
ownloaded from
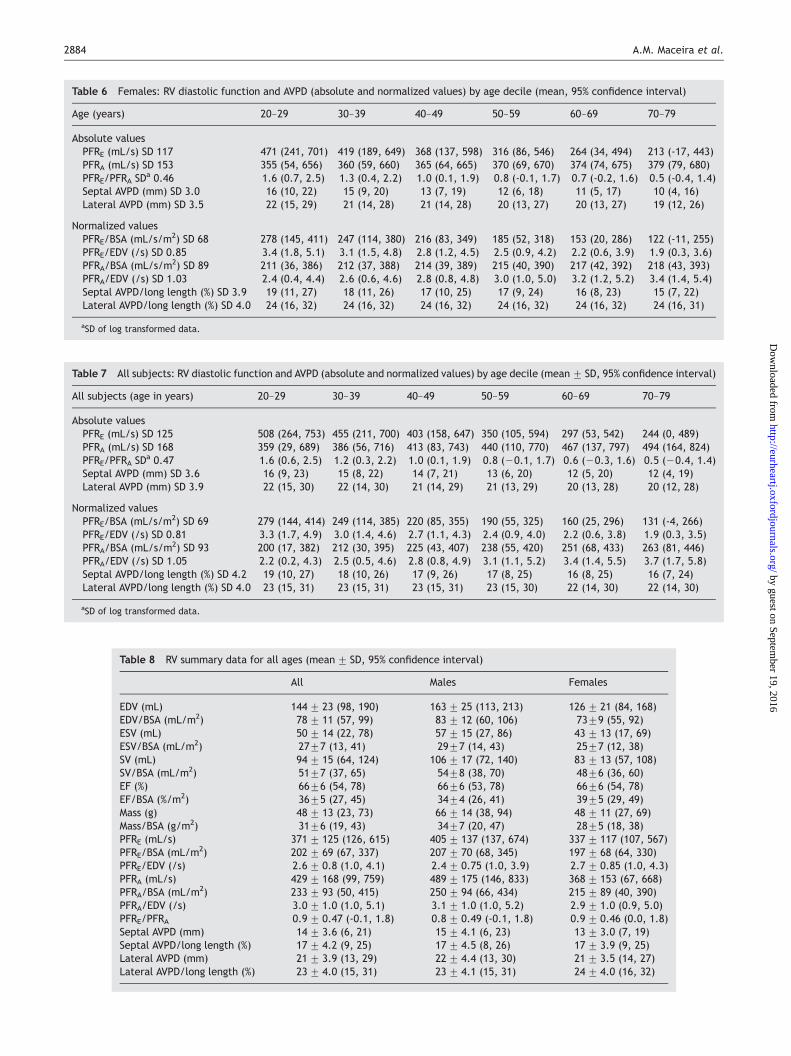
Table 7 All subjects: RV diastolic function and AVPD (absolute and normalized values) by age decile (mean+ SD, 95% confidence interval)
All subjects (age in years) 20–29 30–39 40–49 50–59 60–69 70–79
Absolute valuesPFRE (mL/s) SD 125 508 (264, 753) 455 (211, 700) 403 (158, 647) 350 (105, 594) 297 (53, 542) 244 (0, 489)PFRA (mL/s) SD 168 359 (29, 689) 386 (56, 716) 413 (83, 743) 440 (110, 770) 467 (137, 797) 494 (164, 824)PFRE/PFRA SDa 0.47 1.6 (0.6, 2.5) 1.2 (0.3, 2.2) 1.0 (0.1, 1.9) 0.8 (20.1, 1.7) 0.6 (20.3, 1.6) 0.5 (20.4, 1.4)Septal AVPD (mm) SD 3.6 16 (9, 23) 15 (8, 22) 14 (7, 21) 13 (6, 20) 12 (5, 20) 12 (4, 19)Lateral AVPD (mm) SD 3.9 22 (15, 30) 22 (14, 30) 21 (14, 29) 21 (13, 29) 20 (13, 28) 20 (12, 28)
Normalized valuesPFRE/BSA (mL/s/m2) SD 69 279 (144, 414) 249 (114, 385) 220 (85, 355) 190 (55, 325) 160 (25, 296) 131 (-4, 266)PFRE/EDV (/s) SD 0.81 3.3 (1.7, 4.9) 3.0 (1.4, 4.6) 2.7 (1.1, 4.3) 2.4 (0.9, 4.0) 2.2 (0.6, 3.8) 1.9 (0.3, 3.5)PFRA/BSA (mL/s/m2) SD 93 200 (17, 382) 212 (30, 395) 225 (43, 407) 238 (55, 420) 251 (68, 433) 263 (81, 446)PFRA/EDV (/s) SD 1.05 2.2 (0.2, 4.3) 2.5 (0.5, 4.6) 2.8 (0.8, 4.9) 3.1 (1.1, 5.2) 3.4 (1.4, 5.5) 3.7 (1.7, 5.8)Septal AVPD/long length (%) SD 4.2 19 (10, 27) 18 (10, 26) 17 (9, 26) 17 (8, 25) 16 (8, 25) 16 (7, 24)Lateral AVPD/long length (%) SD 4.0 23 (15, 31) 23 (15, 31) 23 (15, 31) 23 (15, 30) 22 (14, 30) 22 (14, 30)
aSD of log transformed data.
Table 6 Females: RV diastolic function and AVPD (absolute and normalized values) by age decile (mean, 95% confidence interval)
Age (years) 20–29 30–39 40–49 50–59 60–69 70–79
Absolute valuesPFRE (mL/s) SD 117 471 (241, 701) 419 (189, 649) 368 (137, 598) 316 (86, 546) 264 (34, 494) 213 (-17, 443)PFRA (mL/s) SD 153 355 (54, 656) 360 (59, 660) 365 (64, 665) 370 (69, 670) 374 (74, 675) 379 (79, 680)PFRE/PFRA SDa 0.46 1.6 (0.7, 2.5) 1.3 (0.4, 2.2) 1.0 (0.1, 1.9) 0.8 (-0.1, 1.7) 0.7 (-0.2, 1.6) 0.5 (-0.4, 1.4)Septal AVPD (mm) SD 3.0 16 (10, 22) 15 (9, 20) 13 (7, 19) 12 (6, 18) 11 (5, 17) 10 (4, 16)Lateral AVPD (mm) SD 3.5 22 (15, 29) 21 (14, 28) 21 (14, 28) 20 (13, 27) 20 (13, 27) 19 (12, 26)
Normalized valuesPFRE/BSA (mL/s/m2) SD 68 278 (145, 411) 247 (114, 380) 216 (83, 349) 185 (52, 318) 153 (20, 286) 122 (-11, 255)PFRE/EDV (/s) SD 0.85 3.4 (1.8, 5.1) 3.1 (1.5, 4.8) 2.8 (1.2, 4.5) 2.5 (0.9, 4.2) 2.2 (0.6, 3.9) 1.9 (0.3, 3.6)PFRA/BSA (mL/s/m2) SD 89 211 (36, 386) 212 (37, 388) 214 (39, 389) 215 (40, 390) 217 (42, 392) 218 (43, 393)PFRA/EDV (/s) SD 1.03 2.4 (0.4, 4.4) 2.6 (0.6, 4.6) 2.8 (0.8, 4.8) 3.0 (1.0, 5.0) 3.2 (1.2, 5.2) 3.4 (1.4, 5.4)Septal AVPD/long length (%) SD 3.9 19 (11, 27) 18 (11, 26) 17 (10, 25) 17 (9, 24) 16 (8, 23) 15 (7, 22)Lateral AVPD/long length (%) SD 4.0 24 (16, 32) 24 (16, 32) 24 (16, 32) 24 (16, 32) 24 (16, 32) 24 (16, 31)
aSD of log transformed data.
Table 8 RV summary data for all ages (mean+ SD, 95% confidence interval)
All Males Females
EDV (mL) 144+ 23 (98, 190) 163+ 25 (113, 213) 126+ 21 (84, 168)EDV/BSA (mL/m2) 78+ 11 (57, 99) 83+ 12 (60, 106) 73+9 (55, 92)ESV (mL) 50+ 14 (22, 78) 57+ 15 (27, 86) 43+ 13 (17, 69)ESV/BSA (mL/m2) 27+7 (13, 41) 29+7 (14, 43) 25+7 (12, 38)SV (mL) 94+ 15 (64, 124) 106+ 17 (72, 140) 83+ 13 (57, 108)SV/BSA (mL/m2) 51+7 (37, 65) 54+8 (38, 70) 48+6 (36, 60)EF (%) 66+6 (54, 78) 66+6 (53, 78) 66+6 (54, 78)EF/BSA (%/m2) 36+5 (27, 45) 34+4 (26, 41) 39+5 (29, 49)Mass (g) 48+ 13 (23, 73) 66+ 14 (38, 94) 48+ 11 (27, 69)Mass/BSA (g/m2) 31+6 (19, 43) 34+7 (20, 47) 28+5 (18, 38)PFRE (mL/s) 371+ 125 (126, 615) 405+ 137 (137, 674) 337+ 117 (107, 567)PFRE/BSA (mL/m2) 202+ 69 (67, 337) 207+ 70 (68, 345) 197+ 68 (64, 330)PFRE/EDV (/s) 2.6+ 0.8 (1.0, 4.1) 2.4+ 0.75 (1.0, 3.9) 2.7+ 0.85 (1.0, 4.3)PFRA (mL/s) 429+ 168 (99, 759) 489+ 175 (146, 833) 368+ 153 (67, 668)PFRA/BSA (mL/m2) 233+ 93 (50, 415) 250+ 94 (66, 434) 215+ 89 (40, 390)PFRA/EDV (/s) 3.0+ 1.0 (1.0, 5.1) 3.1+ 1.0 (1.0, 5.2) 2.9+ 1.0 (0.9, 5.0)PFRE/PFRA 0.9+ 0.47 (-0.1, 1.8) 0.8+ 0.49 (-0.1, 1.8) 0.9+ 0.46 (0.0, 1.8)Septal AVPD (mm) 14+ 3.6 (6, 21) 15+ 4.1 (6, 23) 13+ 3.0 (7, 19)Septal AVPD/long length (%) 17+ 4.2 (9, 25) 17+ 4.5 (8, 26) 17+ 3.9 (9, 25)Lateral AVPD (mm) 21+ 3.9 (13, 29) 22+ 4.4 (13, 30) 21+ 3.5 (14, 27)Lateral AVPD/long length (%) 23+ 4.0 (15, 31) 23+ 4.1 (15, 31) 24+ 4.0 (16, 32)
2884 A.M. Maceira et al.
by guest on September 19, 2016
http://eurheartj.oxfordjournals.org/D
ownloaded from
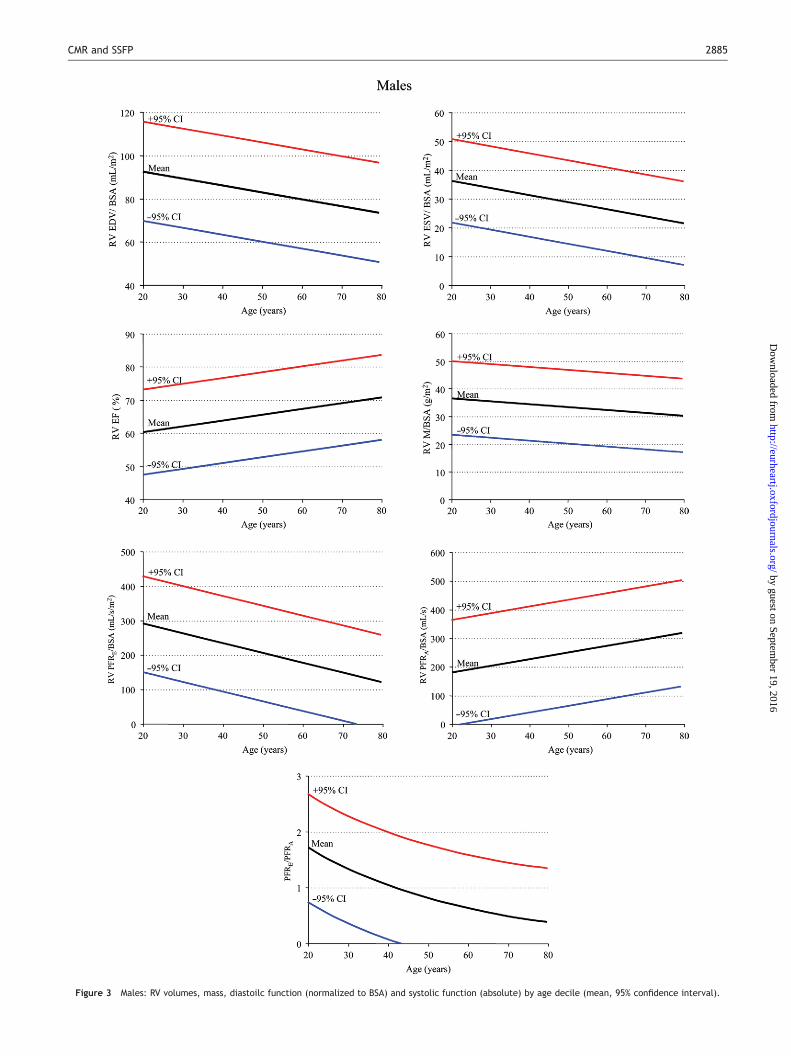
Figure 3 Males: RV volumes, mass, diastoilc function (normalized to BSA) and systolic function (absolute) by age decile (mean, 95% confidence interval).
CMR and SSFP 2885
by guest on September 19, 2016
http://eurheartj.oxfordjournals.org/D
ownloaded from
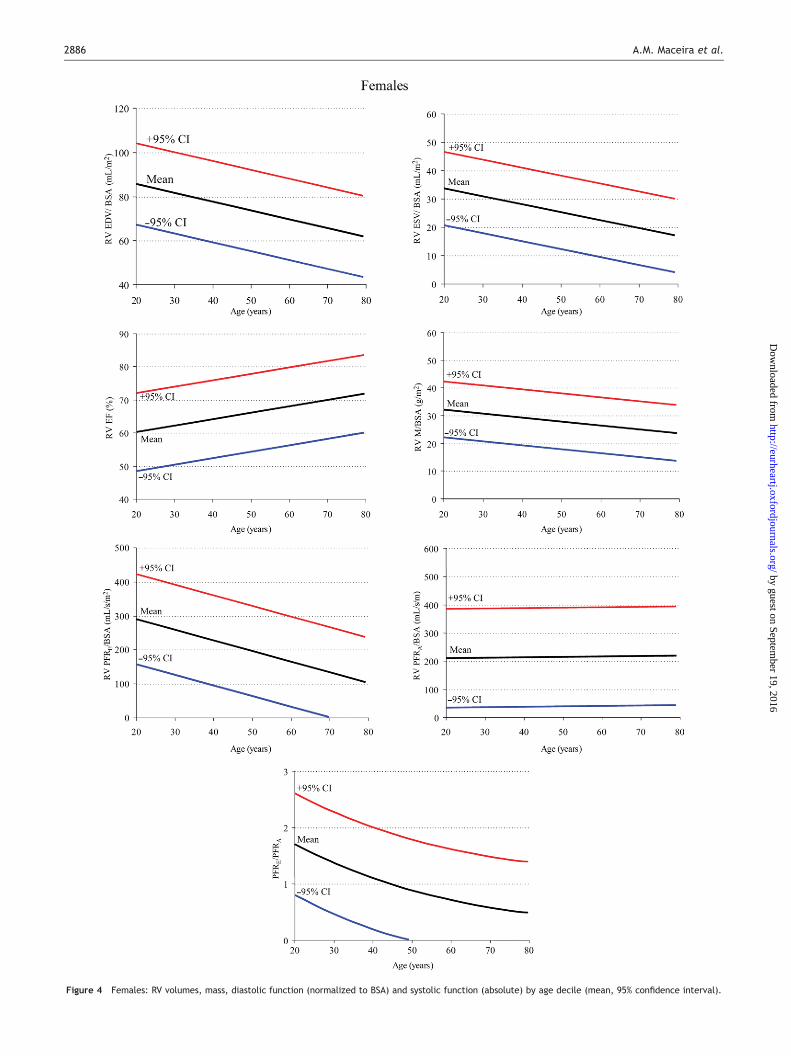
Figure 4 Females: RV volumes, mass, diastolic function (normalized to BSA) and systolic function (absolute) by age decile (mean, 95% confidence interval).
2886 A.M. Maceira et al.
by guest on September 19, 2016
http://eurheartj.oxfordjournals.org/D
ownloaded from
Discussion
These data show that many clinical parameters of RV volumeand systolic/diastolic function are significantly dependenton gender, age, and BSA. This study brings previous dataup to date using state-of-the-art CMR techniques and analy-sis, in a moderately large healthy population, well charac-terized for the absence of significant coronary disease andheart failure. We are unaware of any previously publishednormal values for RV diastolic function by CMR. The findingssuggest that the interpretation of RV parameters in border-line clinical cases, especially in arrhythmogenic RV cardio-myopathy, cardiovascular shunting, and adult congenitalheart disease should be referred to age, gender, and BSA-normalized values in order to determine normality, or sever-ity of abnormality. This is also of special interest becausethe functional capacity of the RV is an important prognosticdeterminant in several pathologies.In general there has been a lack of techniques that give a
reliable measurement of RV mass and volumes.Echocardiography plays an important role in the evaluationof patients with suspected RV pathology, but it has manylimitations and there is still no generally recommendedechocardiography method for quantifying RV function.15 AsCMR is now considered a gold standard clinical techniqueto measure RV volumes and function, these new data haveimportant current and future clinical and research utility.Previous CMR studies with other techniques accord with
some of the results presented in the current study, butthere are differences. The decrease in RV volumes withage with no effect on RVM is in agreement with a previousCMR study of 36 subjects using FLASH cines,16 although wefound in addition a decrease in normalized RVM with age.This may be because we controlled carefully for cardiovas-cular abnormality in all age groups. Sanstede’s study alsofound that females have lower RV mass and volumes, andthese differences persisted when normalized by BSA andthis accords with our study.RV diastolic parameters have not been extensively studied
in the past. Echocardiographic tissue Doppler of the tricus-pid annulus,17 and conventional pulsed Doppler of tricuspidand vena cava flows have been used. RV diastolic functionhas been shown to vary by age,18 which is in agreementwith our findings. Ageing causes a decrease in RV distensibil-ity that increases both the early diastolic filling time, allow-ing the ventricle more time to fill, and the contribution ofthe atrial kick to RV filling. There are differences betweenCMR and echocardiography however. Whereas echocardio-graphy provides peak velocities, CMR provides absolutePFRs from the volume/time curves. These are availablefrom radionuclide ventriculography, but CMR has signifi-cantly higher spatial and temporal resolution.Lorenz et al.8 published the first normal ranges for
CMR-derived LV and RV mass and volumes utilizing FLASHcines with free breathing. This study included 75 subjects(age range 8–55, mean 28 years) and all parameters werefound to be significantly different between males andfemales except EF. Other normal ranges with FLASH cinesand breath-holding have been published. Sandstedeet al.16 included 36 healthy volunteers subdivided in fourgroups of nine subjects each, according to gender and age(greater or less than 45 years). These ranges are now notideal, because of differences between spoiled gradient
echo and SSFP results and higher reproducibility of SSFPmeasurements.10 Thus, new normal ranges with SSFP areneeded. Some SSFP normal ranges for RV parameters havebeen performed. Alfakih et al.19 studied 60 subjects withan age range of 20–65 years, but subdivided only into twosubgroups (.40 years, n ¼ 34; ,40 years, n ¼ 26). The sub-jects had a normal examination and ECG, with no history ofheart disease but the 10-year risk and BNP was notmeasured. The data were analysed manually without AVplane correction, and the results were not divided into agedeciles for regression modelling. Therefore, the capacityto compare the results with our current data is limited.The question has been raised as to whether RV parameters
should be measured in the axial orientation. Alfakih et al.20
studied 20 normal subjects in whom he measured RVvolumes with the axial and short-axis orientations, andfound significant differences between volumes measuredwith the two different orientations. The axial orientationappeared to have better inter and intraobserver reproduc-ibilities. Grothues et al.7 used the short-axis orientationfor assessing the interstudy reproducibility of measurementsof RV volumes, function, and mass with a FLASH sequenceand obtained a good interstudy reproducibility for RV func-tion parameters in healthy subjects, patients with heartfailure, and patients with hypertrophy. We used the short-axis orientation because, in practice, it allows both theleft and RV dimensions to be measured simultaneously.In conclusion, RV volumes and function (systolic and dias-
tolic) vary with gender, age, and BSA. Identification particu-larly of early abnormality requires reference ranges, whichnormalize for all three variables. These ranges are suppliedwith this report in both tabular and graphical form and areof significant clinical and research utility for the interpret-ation of CMR studies.
Supplementary material
Supplementary material is available at European HeartJournal online.
Acknowledgements
This research was supported by CORDA and the British HeartFoundation.
Conflict of interest: D.J.P. is a consultant to Siemens and a directorof Cardiovascular Imaging Solutions. The other authors declare noconflicts.
References
1. Bellenger NG, Pennell DJ. Ventricular function. In: Manning WJ, PennellDJ, eds. Cardiovascular Magnetic Resonance. New York: ChurchillLivingstone; 2002.
2. Sechtem U, Pflugfelder PW, Gould RG, Cassidy MM, Higgins CB.Measurement of right and left ventricular volumes in healthy individualswith cine MR imaging. Radiology 1987;163:697–702.
3. Grothues F, Smith GC, Moon JCC, Bellenger NG, Collins P, Klein HU,Pennell DJ. Comparison of interstudy reproducibility of cardiovascularmagnetic resonance with two-dimensional echocardiography in normalsubjects and in patients with heart failure or left ventricular hyper-trophy. Am J Cardiol 2002;90:29–34.
4. Bellenger NG, Davies LC, Francis JM, Coats AJS, Pennell DJ. Reduction insample size for studies of remodelling in heart failure by the use ofcardiovascular magnetic resonance. J Cardiovasc Magn Reson2000;2:271–278.
CMR and SSFP 2887
by guest on September 19, 2016
http://eurheartj.oxfordjournals.org/D
ownloaded from
5. Mogelvang J, Stokholm KH, Stubgaard M. Assessment of right ventricularvolumes by magnetic resonance imaging and by radionuclide angiography.Am J Noninvasive Cardiol 1991;5:321–327.
6. Katz J, Whang J, Boxt LM, Barst RJ. Estimation of right ventricular massin normal subjects and in patients with primary pulmonary hypertensionby nuclear magnetic resonance imaging. J Am Coll Cardiol1993;21:1475–1481.
7. Grothues F, Moon JC, Bellenger NG, Smith GS, Klein HU, Pennell DJ.Interstudy reproducibility of right ventricular volumes, function and masswith cardiovascular magnetic resonance. Am Heart J 2004;147:218–223.
8. Lorenz CH, Walker ES, Morgan VL, Klein SS, Graham TP. Normal human rightand left ventricular mass, systolic function, and gender differences by cinemagnetic resonance imaging. J Cardiovasc Magn Reson 1999;1:7–21.
9. Carr JC, Simonetti O, Bundy J, Li D, Pereles S, Finn JP. Cine MR angio-graphy of the heart with segmented true fast imaging with steady-stateprecession. Radiology 2001;219:828–834.
10. Alfakih K, Thiele H, Plein S, Bainbridge GJ, Ridgway JP, Sivananthan MU.Comparison of right ventricular volume measurement between segmen-ted k-space gradient-echo and steady-state free precession magneticresonance imaging. J Magn Reson Imaging 2002;16:253–258.
11. Maceira AM, Prasad SK, Khan M, Pennell DJ. Normalized left ventricularsystolic and diastolic function by steady state free precession cardiovas-cular magnetic resonance. J Cardiovasc Magn Reson 2006;8:417–426.
12. Mosteller RD. Simplified calculation of body surface area. N Engl J Med1987;317:1098.
13. British Cardiac Society, British Hyperlipidaemia Association, BritishHypertension Society, endorsed by the British Diabetic Association.Joint British recommendations on prevention of coronary heart diseasein clinical practice. Heart 1998;80(Suppl. 2):S1–S29.
14. Maisel AS, Krishnaswamy P, Nowak RM, McCord J, Hollander JE, Duc P,Omland T, Storrow AB, Abraham WT, Wu AH, Clopton P, Steg PG,Westheim A, Knudsen CW, Perez A, Kazanegra R, Herrmann HC,McCullough PA, Breathing Not Properly Multinational StudyInvestigators. Rapid measurement of b-type natriuretic peptide inthe emergency diagnosis of heart failure. N Engl J Med 2002;347:161–167.
15. FeigenbaumH. Echocardiography. 5th ed. Philadelphia: Lea and Febiger;1994. p158–165.
16. Sandstede J, Lipke C, Beer M, Hofmann S, Pabst T, Kenn W, Neubauer S,Hahn D. Age- and gender-specific differences in left and right ventricularcardiac function and mass determined by cine magnetic resonance.Eur Radiol 2000;10:438–442.
17. Lindstrom L, Wilkenshoff UM, Larsson H, Wranne B. Echocardiographicassessment of arrhythmogenic right ventricular cardiomyopathy. Heart2001;86:31–38.
18. Kukulski T, Hubbert L, Arnold M, Wranne B, Hatle L, Sutherland GR.Normal regional right ventricular function and its change with age: aDoppler myocardial imaging study. J Am Soc Echocardiogr 2000;13:194–204.
19. Alfakih K, Plein S, Thiele H, Jones T, Ridgway JP, Sivananthan MU. Normalhuman left and right ventricular dimensions for MRI as assessed by turbogradient echo and steady-state free precession imaging sequences.J Magn Reson Imaging 2003;17:323–329.
20. Alfakih K, Plein S, Bloomer T, Jones T, Ridgway J, Sivananthan M.Comparison of right ventricular volume measurements between axialand short axis orientation using steady-state free precession magneticresonance imaging. J Magn Reson Imaging 2003;18:25–32.
2888 A.M. Maceira et al.
by guest on September 19, 2016
http://eurheartj.oxfordjournals.org/D
ownloaded from
Related Documents

![Review Article Similarities and Differences between the … · 2019. 7. 31. · to diastolic heart failure [ , ]. Compared with systolic heart failure, diastolic heart failure is](https://static.cupdf.com/doc/110x72/610a99d464112c7f8e47019f/review-article-similarities-and-differences-between-the-2019-7-31-to-diastolic.jpg)