Changes in arch dimensions after extraction and non-extraction orthodontic treatment EARL ARI MAC KRIEL A thesis submitted in fulfillment of the requirements for the degree of Master of Science in Dental Sciences in the Department of Orthodontics University of the Western Cape Supervisor: Prof. A.M.P. Harris June 2008

Welcome message from author
This document is posted to help you gain knowledge. Please leave a comment to let me know what you think about it! Share it to your friends and learn new things together.
Transcript
Changes in arch dimensions after
extraction and non-extraction orthodontic
treatment
EARL ARI MAC KRIEL
A thesis submitted in fulfillment of the requirements for the degree of
Master of Science in Dental Sciences in the
Department of Orthodontics
University of the Western Cape
Supervisor: Prof. A.M.P. Harris
June 2008
ii
Changes in arch dimensions after
extraction and non-extraction orthodontic treatment
Key words
1. Arch dimensions
2. orthodontic extractions
3. non-extraction
4. arch width
5. arch length
6. inter-canine width
7. inter-molar width
8. inter-premolar width
iii
Abstract
Changes in arch dimensions after extraction and non-extraction orthodontic
treatment
MSc Thesis, Department of Orthodontics, Faculty of Dentistry, University of the Western
Cape
Extraction of teeth in orthodontics has always been a controversial topic. The literature is
inconclusive about the changes in arch width and arch length during non-extraction and
premolar extraction orthodontic treatment.
Aim: The aim of this study was to determine whether there are changes in the interdental
arch widths and arch lengths of the mandibular and maxillary arches during non-
extraction and extraction orthodontic treatment.
Materials and Methods: The records of 78 patients treated by one orthodontist were
used for this study. Three treatment groups were selected: a nonextraction group (Group
NE), a group treated with extraction of maxillary and mandibular first premolars (Group
44), and a group treated with extraction of maxillary first premolars and mandibular
second premolars (Group 45).
The arch width measurements were measured in the inter-canine, inter-premolar and
inter-molar areas. The arch length was measured as the sum of the left and right distances
from mesial anatomic contact points of the first permanent molars to the contact point of
the central incisors or to the midpoint between the central incisor contacts, if spaced.
iv
Data analysis: Statistical analysis included descriptive statistics of the data, analysis of
the correlation matrices, Wilcoxon Signed Rank tests and Kruskal-Wallis tests of the
changes which occurred during treatment.
Results: The intercanine widths in the mandible and maxilla increased during treatment
in all three groups, with the extraction groups showing a greater increase than Group NE
(p<0.05). An increase in the inter-premolar arch widths in both dentitions occurred in
Group NE (p<0.05). Group 45 showed an increase in mandibular inter-first premolar arch
width (p<0.05) and Group 44 showed a decrease in mandibular inter-second premolar
arch width (p<0.05). Both extraction groups had a decrease in the inter-second premolar
arch width in the maxilla, with a statistically significant decrease in Group 44 (p<0.05).
There was a slight increase in intermolar arch width in both dentitions in Group NE
(p>0.05), while the extraction groups showed a decrease in these inter-molar widths
(p<0.05). There were no statistically significant differences between the inter-canine and
inter-molar arch width changes between the two extraction groups (p>0.05). In Group NE
the mandibular arch length increased (p<0.05), while the maxillary arch length remained
essentially unchanged. Both extraction groups showed decreases in arch length in the
dentitions (p<0.05), with greater decreases occurring in the maxilla. The difference in
arch length change between the two extraction groups was not significant (p>0.10).
Conclusion: The inter-canine arch width increased in all three treatment groups, more so
in the two extraction groups. From this it is evident that extraction treatment does not
necessarily lead to narrowing of the dental arches in the canine region. The inter-second
premolar arch width decreased in both extraction groups. Non-extraction treatment
resulted in an increase in the inter-premolar and inter-molar arch widths. Inter-molar arch
width decreased in both extraction groups. The arch lengths of both extraction groups
decreased during treatment, more so in group 45. Greater arch length decreases occurred
in the maxilla than the mandible in all the treatment groups.
June 2008
v
DECLARATION
I hereby declare that Changes in arch dimensions after extraction and non-extraction orthodontic treatment is my own work, that it has not been submitted before for any degree or examination at any university, and that all the sources I used or quoted have been indicated and acknowledged by complete references. Earl A. Mac Kriel June 2008 Signed: ______________ _____day of__________2008 The work reported in this thesis was carried out in the Department of Orthodontics, Faculty of Dentistry, University of the Western Cape, Tygerberg, South Africa.
vi
Acknowledgments
I wish to express my sincere gratitude to Professor Angela Harris who supervised this
research project. I am truly in dept for the guidance and the knowledge she has imparted
in me.
Dr Theunis Van Wyk Kotze, who did the statistical analyses of this research and assisted
me with the interpretation of the results.
Dr Keith Johannes, for allowing me to use study models from his practice.
My mother, Nancy, for her love, and what she has imparted in my life.
My wife, Chrislynn, and daughter, Charissa. They are my inspiration and a constant
source of support.
vii
TABLE OF CONTENTS PAGE
TITLE PAGE i
KEY WORDS ii
ABSTRACT iii
DECLARATION v
ACKNOWLEDGEMENTS vi
TABLE OF CONTENTS vii
LIST OF TABLES xi
LIST OF FIGURES xv
APPENDICES xviii
CHAPTER 1: INTRODUCTION 1
CHAPTER 2: LITERATURE REVIEW 3
2.1 Extractions in Orthodontics 3
2.2 Arch width 6
2.2.1 Arch width changes during normal growth 6
2.2.2 Growth in Males and Females 7
2.2.3 Gender and orthodontic treatment 7
2.2.4 Effects of non-extraction and extraction treatment on arch width 8
2.2.4.1 Mandibular arch width changes during treatment 8
2.2.4.2 Maxillary arch width changes during treatment 12
2.3 Arch length 15
2.3.1 Arch length changes during normal growth 15
2.3.2 Effect of non-extraction and extraction treatment on arch length 16
2.3.2.1 Mandibular arch length changes during treatment 16
2.3.2.2 Maxillary arch length changes during treatment 17
2.4 Summary 18
viii
CHAPTER 3: RESEARCH DESIGN AND METHODOLOGY 23
3.1 Aims and Objectives 23
3.2 Sample description 23
3.3 Arch width measurement 25
3.4 Arch length measurement 27
3.5 Analysis of data 28
3.5.1 Pilot study 28
3.5.2 Statistical Methods applied 28
3.6 Ethics statement 30
CHAPTER 4: RESULTS 31
4.1 Age comparison and average treatment period 31
4.2 Arch width 36
4.2.1 Comparison of arch widths measured on pre-treatment study models 36
4.2.1.1. Mandibular arch 36
a) Males compared with females 36
b) Averages of combined samples for mandibular arch widths 37
4.2.1.2 Maxillary arch 42
a) Males compared with females 42
b) Averages of combined samples for maxillary arch arch widths 43
4.2.2. Pre- and Post-treatment Average vs. Standard Deviation of the three treatment
groups for the arch width in the inter-canine and inter-molar areas 49
4.2.3 Average change in arch widths in the mandible 54
4.2.4 Average change in arch widths in the maxilla 60
4.3 Arch length 66
4.3.1 Pre-treatment study model comparison of arch length 66
4.3.1.1 Mandibular arch length 66
4.3.1.2 Maxillary arch length 66
4.3.2 Post-treatment study model comparison of arch length 67
4.3.2.1 Mandibular arch length 67
4.3.2.2 Maxillary arch length 67
ix
4.3.3 Pre- and Post-treatment Average vs. Standard Deviation of the three treatment
groups for the arch length in the mandibular and maxillary arches 70
4.3.4 Average change in arch length 73
4.3.4.1 Mandible 73
4.3.4.2 Maxilla 73
4.4 Summary of average change in the arch widths and lengths of the three treatment
groups for the mandible and maxilla. 75
4.5 Comparisons of the 3 study groups tested for level of significance. 77
4.6 Correlation analyses 80
4.6.1 Correlation analyses of non-extraction group (Group NE) 80
4.6.2 Correlation analyses of upper and lower first premolar extraction group (Group
44) 80
4.6.3 Correlation analyses of upper first and lower second premolar extraction group
(Group 45) 80
CHAPTER 5: DISCUSSION 90
5.1 Age comparison and average treatment period 90
5.2 Comparison of arch widths measured on pre-treatment study models 91
5.2.1 Males compared with females 91
5.2.2 Average of combined samples for mandibular and maxillary arch widths 92
5.3. Average vs. Standard Deviation of the three treatment groups for the arch width
in the inter-canine and inter-molar areas 92
5.4 Average change in arch width in mandible 93
5.4.1 Mandibular arch width 93
5.5 Average change in arch width in maxilla 98
5.5.1 Maxillary arch width 98
5.6 Arch length 101
5.6.1 Pre-treatment study model comparison of arch length 101
5.6.2 Post-treatment study model comparison of arch length 101
x
5.7 Average vs. Standard Deviation of the three treatment groups for arch
lengths in the mandibular and maxillary arches 101
5.8 Average change in arch length 102
5.8.1 Mandibular arch length 102
5.8.2 Maxillary arch length 103
5.5 Summary 104
5.6 Limitations of the study 105
CHAPTER 6: CONCLUSION 106
REFERENCES 108
xi
LIST OF TABLES PAGE
Table 1 Summary of some studies in the literature on the arch widths
changes in the inter-canine, inter-premolar and inter-molar areas, as
well as the arch length changes, in the maxilla and mandible during
non-extraction orthodontic treatment. 19
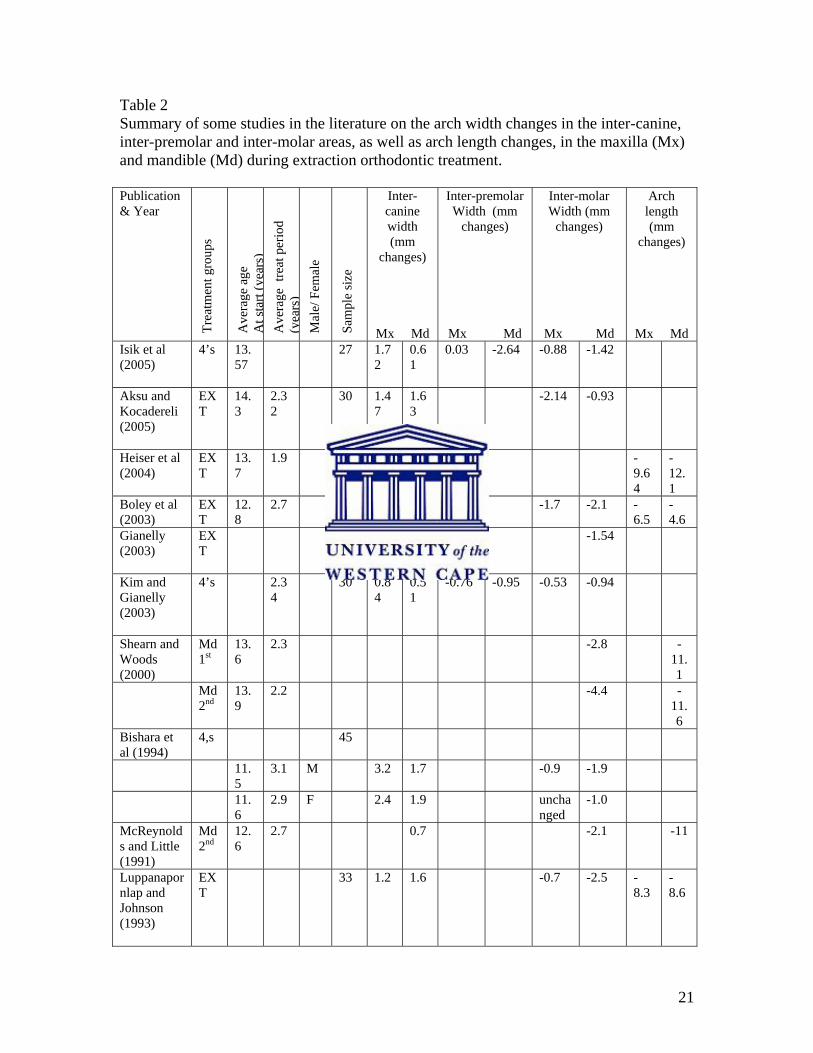
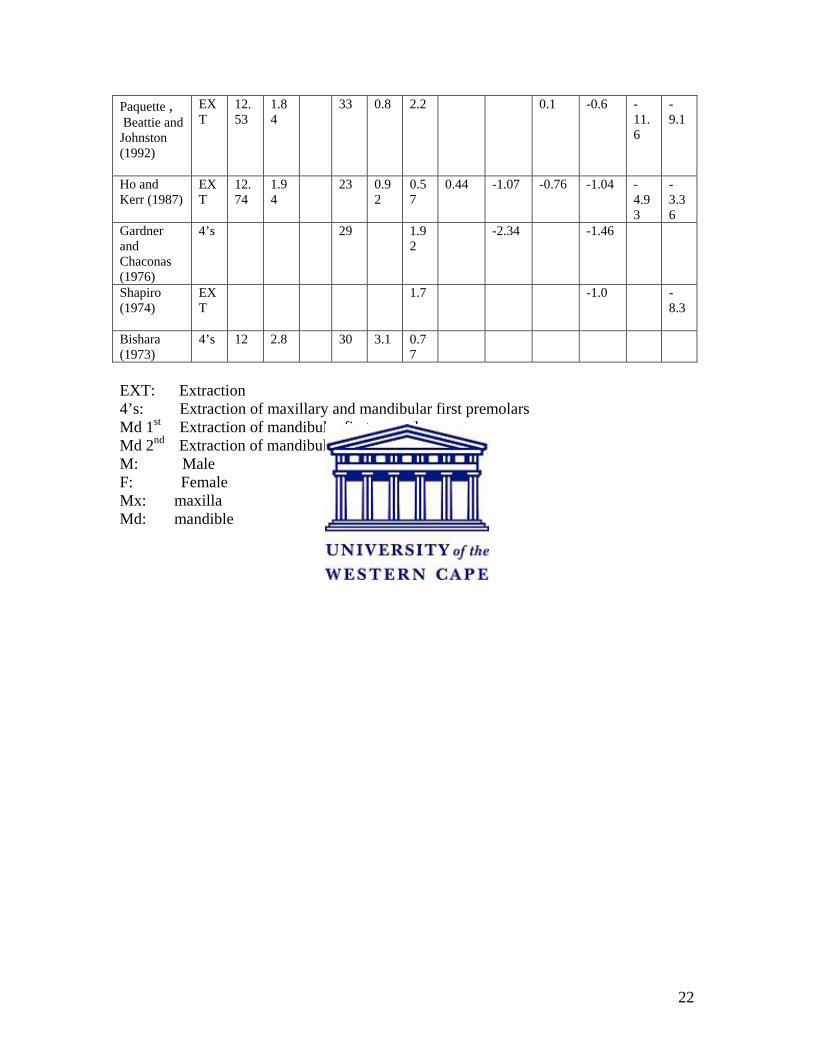
Table 2 Summary of some studies in the literature on the arch widths
changes in the inter-canine, inter-premolar and inter-molar areas, as
well as the arch length changes, in the maxilla and mandible during
extraction orthodontic treatment. 21
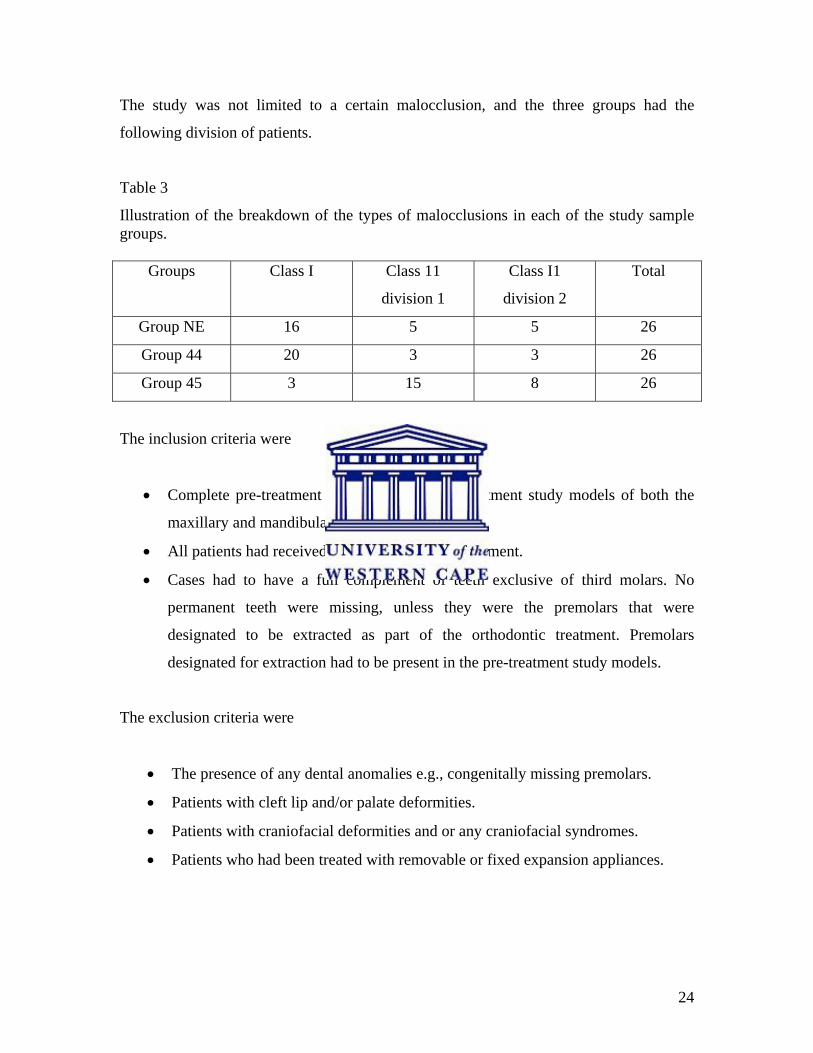
Table 3 Illustration of the breakdown of the types of malocclusions in each of the
study sample groups. 24
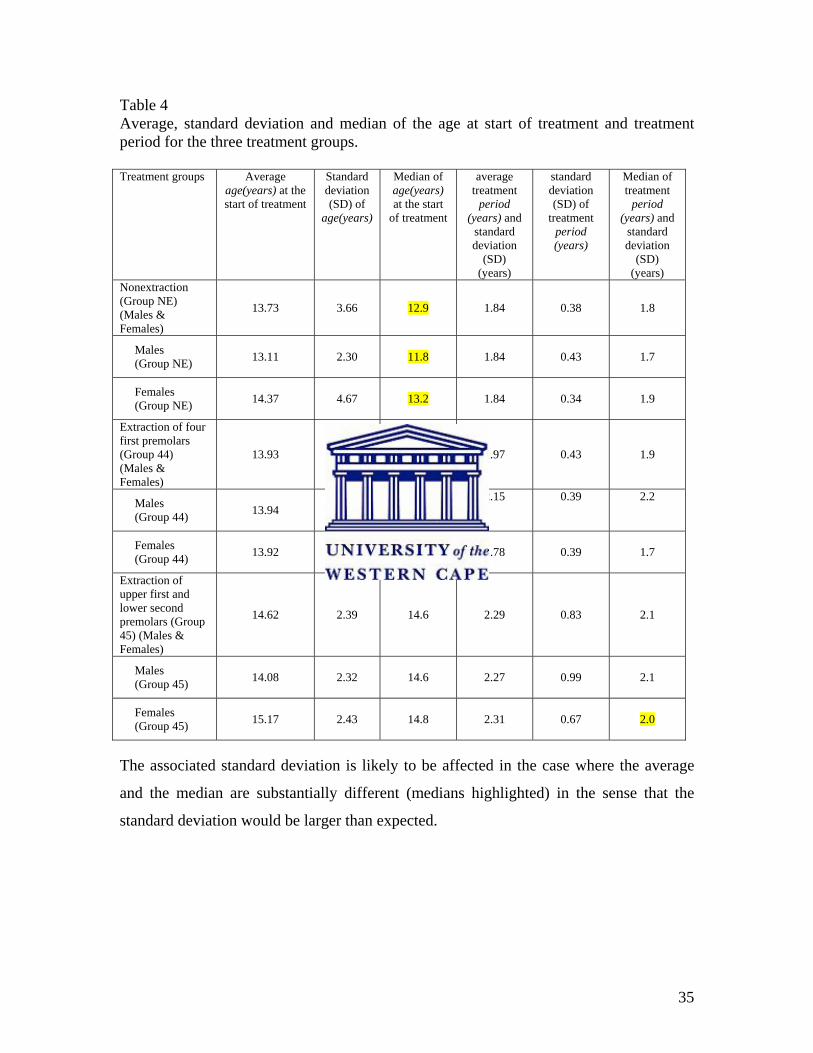
Table 4 Average, standard deviation and median of the age at start of treatment
and treatment period for the three treatment groups. 35
Table 5 Descriptive statistics for the three treatment groups for the mandibular
pre-treatment inter-canine arch width measurement. 38
Table 6 Descriptive statistics for the three treatment groups for the mandibular
post-treatment inter-canine arch width measurement. 38
Table 7 Descriptive statistics for the three treatment groups for the mandibular
pre-treatment inter-first premolar arch width measurement. 39
Table 8 Descriptive statistics for the three treatment groups for the mandibular
post-treatment inter-first premolar arch width measurement. 39
Table 9 Descriptive statistics for the three treatment groups for the mandibular
pre-treatment inter-second premolar arch width measurement. 40
Table 10 Descriptive statistics for the three treatment groups for the mandibular
post-treatment inter-second premolar arch width measurement. 40
Table 11 Descriptive statistics for the three treatment groups for the mandibular
pre-treatment inter-molar arch width measurement. 41
Table 12 Descriptive statistics for the three treatment groups for the mandibular
post-treatment inter-molar arch width measurement. 41
xii
Table 13 Descriptive statistics for the three treatment groups for the maxillary
pre-treatment inter-canine arch width measurement. 45
Table 14 Descriptive statistics for the three treatment groups for the maxillary
post-treatment inter-canine arch width measurement. 45
Table 15 Descriptive statistics for the three treatment groups for the maxillary
pre-treatment inter-first premolar arch width measurement. 46
Table 16 Descriptive statistics for the three treatment groups for the maxillary
post-treatment inter-first premolar arch width measurement. 46
Table 17 Descriptive statistics for the three treatment groups for the maxillary
pre-treatment inter-second premolar arch width measurement. 47
Table 18 Descriptive statistics for the three treatment groups for the maxillary
post-treatment inter-second premolar arch width measurement. 47
Table 19 Descriptive statistics for the three treatment groups for the maxillary
pre-treatment intermolar arch width measurement. 48
Table 20 Descriptive statistics for the three treatment groups for the maxillary
post-treatment intermolar arch width measurement. 48
Table 21 Descriptive and analytical statistics for the three treatment groups for the
average change in arch width in mandibular inter-canine region. 55
Table 22 Descriptive and analytical statistics for the two treatment groups for
the average change in arch width in mandibular inter-first premolar
region. 55
Table 23 Descriptive and analytical statistics for the two treatment groups for
the average change in arch width in mandibular inter-second premolar
region. 58
Table 24 Descriptive and analytical statistics for the three treatment groups for
the average change in arch width in mandibular inter-molar region. 58
Table 25 Descriptive and analytical statistics for the three treatment groups for
the average change in arch width in maxillary inter-canine region. 61
Table 26 Descriptive and analytical statistics for the NE treatment group for
the average change in arch width in maxillary inter-first premolar
region. 61
xiii
Table 27 Descriptive and analytical statistics for the three treatment groups for
the average change in arch width in maxillary inter-second premolar
region. 64
Table 28 Descriptive and analytical statistics for the three treatment groups for
the average change in arch width in maxillary inter-molar region. 64
Table 29 Descriptive statistics for the three treatment groups for the mandibular
pre-treatment arch length measurement. 68
Table 30 Descriptive statistics for the three treatment groups for the mandibular
post-treatment arch length measurement. 68
Table 31 Descriptive statistics for the three treatment groups for the maxillary
pre-treatment arch length measurement. 69
Table 32 Descriptive statistics for the three treatment groups for the maxillary
post-treatment arch length measurement. 69
Table 33 Descriptive and analytical statistics for the three treatment groups for the
average change in mandibular arch length measurement. 74
Table 34 Descriptive and analytical statistics for the three treatment groups for the
average change in maxillary arch length measurement. 74
Table 35 Summary of average change in arch width in mandible for the three
treatment groups: canine, inter-first premolar, inter-second premolar and
inter-molar. 75
Table 36 Summary of average change in arch width in maxilla for the three
treatment groups: canine, inter-first premolar, inter-second premolar and
inter-molar. 75
Table 37 Summary of average change in arch length for the three treatment
groups: Mandible and Maxilla. 76
Table 38 Kruskal-Wallis test values for comparison of the age at start of treatment,
treatment period, arch width and arch length: H-Stat, p-value and Chi-
squared Critical. 78
Table 39 Correlation analyses of the non-extraction group (Group NE). 82
Table 40 Correlation analyses of the extraction of upper and lower first premolar
group (Group 44). 83

xiv
Table 41 Correlation analyses of the extraction of upper first and lower second
premolar group (Group 45). 84
xv
LIST OF FIGURES PAGE
Figure 1 MAX-CAL electronic digital caliper MAX-Series electronic digital
Caliper with a resolution of 0, 01mm, Fowler & NSK, made in Japan. 26
Figure 2 Inter-canine width: distance between most convex point on the buccal
surfaces of canine. Inter-premolar width: distance between most convex
point on the buccal surfaces of premolars. Intermolar width: distance
between the most convex point on the buccal surfaces at the mesial buccal
groove of molars (Gianelly 2003, Gardner and Chaconas 1976). 26
Figure 3 Arch length is measured as the sum of the right and left distances from
mesial anatomic contact points of the first permanent molars to the
contact point of the central incisors or to the midpoint of the distance
between the central incisor contacts, if the teeth were spaced (Little and
Riedel, 1989). 27
Figure 4 Starting age of treatment vs. treatment period (Group NE) (One case of
22.3 years was excluded). 33
Figure 5 Starting age of treatment vs. treatment period (Group 44). 33
Figure 6 Starting age of treatment vs. treatment period (Group 45). (One case
with age 22.3 years at start of treatment and another with a treatment
period of 5.29 years was excluded). 34
Figure 7 Average vs. the Standard Deviation of the mandibular inter-canine pre-
treatment arch width values. 50
Figure 8 Average vs. the Standard Deviation of the mandibular inter-canine post-
treatment arch width values. 50
Figure 9 Average vs. the Standard Deviation of the mandibular inter-molar pre-
treatment arch width values. 51
Figure 10 Average vs. the Standard Deviation of the mandibular inter-molar post-
treatment arch width values. 51
xvi
Figure 11 Average vs. the Standard Deviation of the maxillary inter-canine pre-
treatment arch width values. 52
Figure 12 Average vs. the Standard Deviation of the maxillary inter-canine post-
treatment arch width values. 52
Figure 13 Average vs. the Standard Deviation of the maxillary inter-molar pre-
treatment arch width values. 53
Figure 14 Average vs. the Standard Deviation of the maxillary inter-molar post-
treatment arch width values. 53
Figure 15 Average changes in arch width for the mandibular inter-canine arch width
for the three treatment groups: 44, 45 and NE. 56
Figure 16 Average changes in arch width for the mandibular inter-molar arch width
for the three treatment groups: 44, 45 and NE. 59
Figure 17 Average changes in arch width for the maxillary inter-canine arch width
for the three treatment groups: 44, 45 and NE. 62
Figure 18 Average changes in arch width for the maxillary inter-molar arch width
for the three treatment groups: 44, 45 and NE. 65
Figure 19 Average vs. the Standard Deviation of the mandibular arch length pre-
treatment. 71
Figure 20 Average vs. the Standard Deviation of the mandibular arch length post-
treatment. 71
Figure 21 Average vs. the Standard Deviation of the maxillary arch length pre-
treatment. 72
Figure 22 Average vs. the Standard Deviation of the maxillary arch length post-
treatment. 72
Figure 23 Average change in arch width inter-canine vs. inter-molar in mandible
(Group NE). 86
Figure 24 Average change in arch width inter-canine vs. inter-molar in mandible
(Group 44). 86
Figure 25 Average change in arch width inter-canine vs. inter-molar in mandible
(Group 45). 87
xvii
Figure 26 Average change in arch width inter-canine vs. inter-molar in maxilla
(Group NE). 88
Figure 27 Average change in arch width inter-canine vs. inter-molar in maxilla
(Group 44). 88
Figure 28 Average change in arch width inter-canine vs. inter-molar in maxilla
(Group 45). 89

xviii
APPENDICES PAGE
Appendix A Form on which arch width and arch length measurements were captured 112
1
Chapter 1
Introduction
Extraction versus non-extraction orthodontic treatment will probably always be a topic of
discussion in orthodontics. Angle (1907) had a firm belief against the extraction of teeth.
Sometimes extractions are necessary, but often orthodontists will differ in their opinion
of whether it is necessary to extract teeth or treat the malocclusion without the extraction
of teeth (Case 1964).
In orthodontics, extraction of teeth is one of the options in the treatment of
malocclusions. The most commonly extracted teeth for orthodontic treatment are
premolars (Weintraub et al 1989).
Although a lot of research has been done on the arch width and arch length changes
during non-extraction and premolar extraction orthodontic treatment, the literature is not
conclusive. Most of the authors identified in the literature studied either first premolar
extraction samples or their extraction samples included cases having a combination of
various extraction sequences.
Some literature has suggested that extraction of premolars will lead to narrowing of the
inter-molar area (Gardner and Chaconas 1976, Shearn and Woods 2000, McReynolds and
Little 1991). These authors suggest that when the second premolars are extracted and the
molars are moved into a narrower area more anterior in the mouth, the arch widths
decrease. The narrower dental arch may contribute to the appearance of “black triangles”
in the corners of the mouth (Dierkes 1987). Gianelly (2003), however, found the increase
in the inter-canine width in his extraction sample to be larger than in the non-extraction
cases. In the same study he found the inter-molar widths in both extraction and non-
extraction cases essentially unchanged. Johnson and Smith (1995) studied the frontal
photographs of patients treated with extraction of four first premolars and of patients
2
treated non-extraction, and found that the transverse arch width at any particular location
in the buccal segment is maintained or slightly enlarged after extraction.
Some authors have reported that the arch length is reduced in both nonextraction and
extraction cases (Shapiro 1974, Luppanapornlap and Johnson 1993). Paquette, Beattie
and Johnston (1992) also found that the arch length decreased in extraction cases, but
differed from others in that they found an increase in arch length in non-extraction cases.
The objective of this study was to study the changes in the dental arch width in the
canine, premolar and molar areas of dental arches as well as the changes in the dental
arch lengths before and after orthodontic treatment in three groups of patients. One group
was treated non-extraction (Group NE), one extraction group was treated with extraction
of four first premolars (Group 44) and the other extraction group was treated with
extraction of maxillary first and mandibular second premolars (Group 45).
Two extraction samples were chosen to compare non-extraction treatment with extraction
treatments, and also to evaluate changes in arch width and arch length when different
premolar extraction sequences are used during orthodontic treatment. In this study the
arch widths and arch lengths of both the mandible and maxilla were measured. Many
other studies have measured only the mandibular arch width changes. Some of the studies
measured only inter-canine and inter-molar arch width changes, but the inter-premolar
arch width changes were not measured in many of the previous studies. Post retention
changes were not studied.
The literature review in Chapter 2 considers papers evaluating extractions in orthodontics
and the changes in arch width and arch length that occur with non-extraction and
extraction orthodontic treatment. In Chapter 3 the research design and methodology are
explained. In Chapter 4 the results regarding the pre- and post-treatment changes in the
arch width and arch length are described. The Discussion follows in Chapter 5 where the
results are compared with those of other studies in the literature. An overview of the
findings of this study and conclusions are presented in Chapter 6.
3
Chapter 2
Literature review
2.1 Extractions in Orthodontics
As in other fields, orthodontics has issues that are surrounded by a lot of controversy.
Orthodontists will differ from each other with regards to which treatment is most suitable
for a certain case, and this is also probably true for any other specialist field. An
important issue which is often debated in orthodontics is whether to extract teeth or to
treat the malocclusion without extractions (Case 1964). In orthodontics extraction of teeth
is only one of many treatment options which are available to the practitioner.
Angle was of the opinion that in the normal occlusion all 32 permanent teeth should
occupy their normal positions (Angle 1907). According to him there is no place for
extractions in orthodontics. Angle believed that a full complement of teeth would
establish the best harmony, and nature would allow this to happen through growth,
development and function. Lundstrom (1925) stated that the apical base also needed to be
considered, as orthodontic treatment was not necessarily accompanied by the
development of the apical base. He believed that the occlusion that will be attained by
orthodontic treatment cannot be maintained if the apical base position is not in harmony
with the position of the teeth. Case (1964) was of the opinion that in orthodontics
extraction of teeth is necessary to relieve the crowding, as well as to aid the stability of
the treatment. He believed that new bone could not be induced to grow beyond its
inherent size.
Dewel (1964) states that before Angle’s time extractions were far too common.
According to Dewel (1964) both Angle and Case played an enormous part in the
development of early orthodontics, although they had widely different opinions on the
subject of extraction of teeth in orthodontics.
4
Tweed (1944), like Angle, believed that normal occlusion or perfect facial aesthetics can
never be attained without the full complement of teeth. At the time Tweed firmly
believed in non-extraction treatment, and practiced it for a number of years. However
after recalling patients for evaluation, he came to the conclusion that he did not achieve
what he had set out to do in many of these patients he treated non-extraction. He then
reviewed his approach to treatment, and came to believe that when a discrepancy between
tooth size and the capacity of basal bone does exist, it would be better to remove teeth to
bring about a balance between the dentition and basal bone. Tweed re-treated these
patients with the extraction of premolars and achieved satisfactory results. Gradually the
pendulum swung in favor of including extractions, but the issue was not totally resolved.
Watson (1980) takes the question further and asks under what special circumstances we
should resort to tooth removal as a contributing factor to improving the patient’s total
health? He states that the decision to extract teeth must be made on an individual basis
and not by general classes of malocclusion.
Travess et al (2004) did a study on extractions and stated that several factors affect the
decision on whether to extract teeth. The patient’s medical history, the attitude to
treatment, oral hygiene, caries rate and the quality of teeth are all influential factors,
according to their study. Weintraub et al (1989) stated that on an individual basis a
number of factors enter the extraction decision. The factors include aetiologic and
morphologic features of the malocclusion, specific objectives of the treatment, and the
technique selected to accommodate the desired result. Their study canvassed opinions
among orthodontists in Michigan in the United States of America, who indicated that
about half of the patients in their practices had teeth extracted as part of treatment; and of
this group about 70% had four premolars extracted. A study by Peck and Peck (1979) on
the frequency of extractions in a single orthodontic practice in the United States of
America, reported the extraction rate to be 42.1%.
O’Connor (1993) did a survey among orthodontic specialists in the United States on the
trends in orthodontic practice. The survey revealed that more than half of the responding
5
orthodontists had reduced their extraction rate during the previous 5 years. Of the 800
responding orthodontists only about 4% reported an increase in their rate of extraction
cases.
Extraction of teeth in the permanent dentition has become one of the most common
treatment strategies for correcting Class11 malocclusions (Heiser et al 2004). Extractions
are also a common consideration in the orthodontic management of dental crowding.
Orthodontists may consider extractions in cases of jaw growth discrepancy, such as
Angle Class 11 relationships, tooth pathology or injury (Peck and Peck 1979). The
extraction of the four first premolars can be considered in cases with severe dento-
alveolar protrusion, as well as in cases with a significant arch length deficiency (Shields,
Little and Chapko 1985).
Shearn and Woods (2000) state that according to earlier studies premolars are probably
the most commonly extracted teeth for orthodontic purposes. They attribute this to the
fact that premolars are conveniently located between the anterior and posterior segments.
Extraction patterns also differ, as seen in the literature; e.g. Gianelly (2003) and Bishara
et al (1994) had samples having had extraction of four first premolars, Shearn and Woods
(2000) had an extraction sample which comprised patients having had mandibular first
and mandibular second premolar extractions, and others with a combination of different
maxillary premolar extractions.
The criticism of some orthodontists is that extraction treatment results in a narrower
dental arch when compared with nonextraction treatment outcomes (Ho and Kerr 1987).
It is also believed that extracting the first four premolars results in a narrower dental arch
and unaesthetic black triangles at the corners of the mouth is a result of the dentition
being too small for the mouth when the lips are extended during smiling (Gianelly 2003).
McNamara (2000) attributes these dark spaces to a maxillary deficiency, meaning a
deficiency in the transverse or sagittal dimension or both.
6
Hagler, Lupini and Johnson (1998) compared extraction and non-extraction treatment
results in African American patients. They found that extraction treatment tends to flatten
the profile, whereas non-extraction treatments tend to make the profile more protrusive.
Baumrind et al (1996) evaluated the decision-making patterns of a representative group
of orthodontic clinicians who were treating 100 adolescent and 48 adult subjects. In this
study little association was observed between clinician agreement on Angle classification
and clinician agreement on whether or not to extract.
If we knew where we end up with extraction and non-extraction treatment, we could
rationalize the decision whether we want to extract or not to extract. Ultimately we want
to treat the patient to achieve the most aesthetic and functional results.
A study of the literature makes it clear that in some cases extractions are necessary if
treatment goals are to be achieved. The premolars are the teeth most commonly extracted
for orthodontic purposes, although different extraction patterns of premolars may be
involved. The long-term consequences of extraction of teeth can only be appreciated by
time and study. The debate still continues over which treatment, extraction or non-
extraction orthodontic treatment, gives better long-term results.
2.2 Arch width
2.2.1 Arch width changes during normal growth
During normal growth there will be an increase in arch width as the child grows. The
dental arch undergoes changes from birth until mid-adulthood. The arch widths in the
intercanine and intermolar areas are significantly increased between three and 13 years of
age (Bishara et al 1997). This occurs in both the maxillary and mandibular arches. After
the permanent dentition has erupted, there is a slight decrease in the dental arch width,
more in the inter-canine area than the intermolar area (Bishara et al 1997). Bishara and
7
his co-workers also found that on average the mandibular inter-canine width is
established at around 8 years of age (Bishara et al 1997).
Knott (1972) did a longitudinal study of dental arch widths at four stages of dental
development and found that for most individuals, the maximum inter-canine diameter of
both arches showed little change after the stage of permanent dentition was attained. In
the mandibular arch it was found that the increase in the inter-canine width occurred
largely before the eruption of the permanent canine teeth.
2.2.2 Growth in Males and Females
Knott (1972) established that the average size of the dental arch was greater for males
than for females. This was found to be the same for both the deciduous and permanent
dentitions. In their studies on growth changes in the arch width Knott’s (1972) study was
supported by DeKock (1972) who also found that inter-molar and inter-canine arch
widths did not change after the age of 13 years in females and age 16 years in males.
DeKock (1972) found that there was a small, but statistically significant increase in arch
width from 12 to 15 years of age in males.
In a study of untreated individuals Barrow and White (1952) showed that the inter-canine
width decreased by varying amounts after the mid-teen years. They also reported that a
moderate increase in dental arch width can be expected, particularly in the anterior
regions, until the permanent canines erupt.
Sinclair and Little (1983) found that the inter-canine width of untreated individuals with
normal occlusion decreased into early adulthood.
2.2.3 Gender and orthodontic treatment
In a retrospective study by Ward et al (2006) on the changes in arch width in patients
who had received orthodontic treatment and untreated patients, they found that gender
8
had no statistically significant effect on the data gathered from patients that had received
orthodontic treatment and from untreated patients.
2.2.4 Effects of non-extraction and extraction treatment on arch width
2.2.4.1 Mandibular arch width changes during treatment
Inter-canine arch width
Many researchers have reported that the mandibular inter-canine width increases during
non-extraction treatment (Shapiro 1974, Gardner and Chaconas 1976, Glenn, Sinclair
and Alexander 1987, Paquette, Beattie and Johnston 1992, Luppanapornlap and Johnson
1993, Bishara et al 1994, Sadowsky et al 1994, Weinberg and Sadowsky 1996, Kim and
Gianelly 2003, Gianelly 2003, Taner et al 2004 and Aksu and Kocadereli 2005). The
range of increases reported is between 0.06mm and 2.4mm. Isik et al (2005), however,
found a decrease in mandibular inter-canine arch width, with an average decrease of
0.6mm. In these studies the average ages at the start of treatment ranged between 10.9
years and 14.21 years of age. The average treatment periods ranged between 1.6 years
and 3 years.
Strang (1940) was of the opinion that the mandibular dental arch dimensions in the inter-
canine area were uncompromising, and should not be changed if a stable end result was
to be achieved. Shapiro (1974) also concluded that any adjustments in the mandibular
dental arch dimensions in the intercanine area showed a strong tendency to relapse and
thus this area of the arch should not be changed during treatment.
Bishara et al (1994) found no significant changes for both the non-extraction and
extraction treatment groups in the inter-canine area pre- to post-treatment.
9
Numerous researchers have also reported that the mandibular inter-canine width
increases during extraction treatment (Bishara 1973, Shapiro 1974, Gardner and
Chaconas 1976, Ho and Kerr 1987, Paquette, Beattie and Johnston 1992,
Luppanapornlap and Johnson 1993, McReynolds and Little 1991, Bishara et al 1994,
Boley et al 2003, Gianelly 2003, Kim and Gianelly 2003, Isik et al 2005 and Aksu and
Kocadereli 2005). The range of increases reported is between 0.51mm and 2.2mm. The
average ages at the onset of treatment ranged between 11.5 years and 14.3 years in these
studies. The average treatment periods ranged between 1.84 years and 3.1 years.
King (1974) believed that if the canines are moved distally into the extraction spaces
they may be expanded buccally, but for this expansion the limits of their new distal
location must be appreciated.
In a retrospective study of 23 subjects treated with the extraction of four first premolars,
Ho and Kerr (1987) found that there was a general trend for a reduction in mean arch
dimensions both during and following treatment. An exception was in the inter-canine
width which showed slight expansion during extraction treatment, which was lost post-
treatment in the mandibular arch but maintained in some cases in the maxillary arch (Ho
and Kerr 1987).
In a study of comparable groups of borderline extraction versus non-extraction cases it
was found that the inter-canine widths of both arches showed no statistically significant
change long-term after extraction and non-extraction treatment (Paquette, Beattie and
Johnston 1992). The study consisted of 33 extraction and 30 non-extraction Class 11
division 1 subjects. It was not specified which premolars had been extracted in treatment.
It was found that the average post-treatment mandibular inter-canine dimension was
larger in four first premolar extraction than in non-extraction cases (Gianelly 2003).
10
Inter-premolar arch width
Increases in mandibular inter-premolar width during non-extraction treatment have been
described in the literature (Gardner and Chaconas 1976, Weinberg and Sadowsky 1996,
Sadowsky et al 1994, Kim and Gianelly 2003, Taner et al 2004 and Isik et al 2005). The
range of increases reported is between 0.75mm and 2.96mm for the inter-first premolar
and between 0.68mm and 2.8mm for the inter-second premolar widths. In these studies
the average ages at the commencement of treatment ranged between 10.9 years and 14.21
years of age. The average treatment periods ranged between 1.8 years and 2.96 years.
Many researchers have reported that mandibular inter-premolar width decreases during
extraction treatment (Gardner and Chaconas 1976, Ho and Kerr 1987, Kim and Gianelly
2003 and Isik et al 2005). The range of decreases reported is between 0.95mm and
2.64mm. The average ages at the beginning of treatment ranged between 12.74 years and
14.21 years of age in these studies. The average treatment periods ranged between 1.94
years and 2.34 years.
Isik et al (2005) in their study showed that the mandibular inter-premolar distances
decreased due to consolidation of the extraction spaces.
Inter-molar arch width
Increases in mandibular inter-molar width during non-extraction treatment have been
extensively reported in the literature (Shapiro 1974, Gardner and Chaconas 1976, Glenn,
Sinclair and Alexander 1987, Paquette, Beattie and Johnston 1992, Sadowsky et al 1994,
Bishara et al 1994, Weinberg and Sadowsky 1996, Kim and Gianelly 2003, Taner et al
2004, Isik et al 2005 and Aksu and Kocadereli 2005). The range of increases reported is
between 0.13mm and 3.5mm. Luppanapornlap and Johnson (1993) and Gianelly (2003),
however, found a decrease in mandibular inter-molar arch width, with an average
decrease between 0.13mm and 0.2mm. The average ages at the outset of treatment
11
ranged between 10.9 years and 14.21 years in these studies. The average treatment
periods ranged between 1.6 years and 3 years.
Strang (1940) believed that the mandibular dental arch dimensions in the inter-molar
area were uncompromising dimensions.
Taner et al (2004) found that the mandibular inter-molar arch width showed an increase,
but much less than did the maxillary arch. As all the patients in the study were Class 11
non-extraction patients, the significant increase in maxillary arch width is inevitable as
maxillary arch expansion is usual in the correction of Class11 patients (Taner et al 2004).
On the other hand Gianelly (2003) found the mandibular inter-molar widths of both non-
extraction and extraction groups were essentially unchanged during treatment.
Weinberg and Sadowsky (1996) studied 30 Class1 non-extraction patients. Their study
was to determine the manner in which mandibular crowding was resolved in Class 1
growing patients, and found that the molars showed no anteroposterior movement.
Many articles in the literature have described decreases in mandibular inter-molar width
during extraction treatment (Shapiro 1974, Gardner and Chaconas 1976, Ho and Kerr
1987, Paquette, Beattie and Johnston 1992, Luppanapornlap and Johnson 1993,
McReynolds and Little 1991, Bishara et al 1994, Shearn and Woods 2000, Boley et al
2003, Gianelly 2003, Kim and Gianelly 2003, Isik et al 2005 and Aksu and Kocadereli
2005). The range of decreases reported is between 0.6mm and 2.8mm for cases having
had mandibular first premolar extractions and between 2.1mm and 4.4mm for those
having mandibular second premolar extractions. In these studies the average ages at the
beginning of treatment ranged between 11.5 years and 14.3 years. The average treatment
periods ranged between 1.84 years and 3.1 years.
The treatment effects of mandibular first and mandibular second premolar extractions
were evaluated in a study of 73 patients by Shearn and Woods (2000). According to their
12
study there was evidence that mandibular second premolar extractions were associated
with more reduction in inter-molar arch width than were cases having mandibular first
premolar extractions. Their study also showed that there was generally more forward
movement of the lower molars than incisal retraction with the extraction of lower second
premolars, although a specific extraction pattern does not necessarily guarantee certain
amounts of incisor retraction or lower molar forward movement.
Shapiro (1974) also concluded that the mandibular dental arch dimensions in the inter-
molar area showed a strong tendency to relapse and thus should not be changed during
treatment. Isik et al (2005) in their study also showed that the lower inter-molar distances
decreased due to consolidation of the extraction spaces. Bishara et al (1994) found that
the inter-molar widths were significantly different between extraction and non-extraction
groups as extractions led to a decrease in width in the inter-molar area.
2.2.4.2 Maxillary arch width changes during treatment
Inter-canine arch width
Several published papers have described maxillary inter-canine width increases during
non-extraction treatment (Paquette, Beattie and Johnston 1992, Luppanapornlap and
Johnson 1993, Bishara et al 1994, Sadowsky et al 1994, Kim and Gianelly 2003, Taner et
al 2004, Isik et al 2005 and Aksu and Kocadereli 2005). The range of increases reported
is between 0.5mm and 3.1mm. The average ages at the start of treatment ranged between
10.9 years and 14.21 years in these studies. The average treatment periods ranged
between 1.84 years and 3.1 years.
When Isik et al (2005) evaluated their studies of three treatment modalities, non-
extraction patients, non-extraction with rapid maxillary expansion patients and extraction
of four first premolars patients, the results revealed that the distance between the upper
canines was not affected by the treatment modality.
13
Increases in maxillary inter-canine width during extraction treatment have been
extensively reported by many researchers (Bishara 1973, Ho and Kerr 1987, Paquette,
Beattie and Johnston 1992, Luppanapornlap and Johnson 1993, Bishara et al 1994, Boley
et al 2003, Kim and Gianelly 2003, Isik et al 2005 and Aksu and Kocadereli 2005). The
range of increases reported is between 0.8mm and 3.2mm. In these studies the average
ages at the initiation of treatment ranged between 12 years and 14.3 years. The average
treatment periods ranged between 1.84 years and 3.1 years.
Inter-premolar arch width
Many researchers have reported increases in maxillary inter-premolar width during non-
extraction treatment (Sadowsky et al 1994, Kim and Gianelly 2003, Taner et al 2004 and
Isik et al 2005). The range of increases reported is between 2.15mm and 4.33mm for the
inter-first premolar and between 2.11mm and 4.6mm for the inter-second premolar
width. The average ages at the outset of treatment ranged between 10.9 years and 14.21
years in these studies. The average treatment periods ranged between 1.86 years and 3
years.
Isik et al’s (2005) study showed that the maxillary inter-premolar widths increased more
in the non-extraction sample compared with the extraction sample.
Researchers report that maxillary inter-premolar width decreases during extraction
treatment (Kim and Gianelly 2003). The average decrease reported is 0.76mm. Ho and
Kerr (1987), Isik et al (2005), however, found an increase in maxillary inter-premolar
arch width, with an average expansion of between 0.03mm and 0.44mm. In these studies
the average ages at the beginning of treatment ranged between 12.74 years and 13.51
years. The average treatment periods ranged between 1.94 years and 2.34 years.

14
Inter-molar arch width
Many articles in the literature have described that maxillary inter-molar width increases
during non-extraction treatment (Paquette, Beattie and Johnston 1992, Luppanapornlap
and Johnson 1993, Bishara et al 1994, Sadowsky et al 1994, Kim and Gianelly 2003,
Taner et al 2004, Isik et al 2005 and Aksu and Kocadereli 2005). The range of increases
reported is between 1.2mm and 5.4mm. The average ages at the start of treatment ranged
between 10.9 years and 14.21 years in these studies. The average treatment periods
ranged between 1.6 years and 3 years.
Aksu and Kocadereli (2005) studied arch width changes in Class1 patients with
extraction and non-extraction orthodontic treatment. Their study consisted of 30
extraction and 30 non-extraction patients. They found that maxillary and mandibular
inter-molar widths were significantly greater in the non-extraction group than the
extraction group.
Isik et al’s (2005) study also showed that the maxillary inter-molar widths increased more
in the non-extraction sample compared with the widths in the extraction sample.
Decreases in maxillary inter-molar width during extraction treatment have been reported
in the literature (Ho and Kerr 1987, Luppanapornlap and Johnson 1993, Bishara et al
1994, Boley et al 2003, Kim and Gianelly 2003, Isik et al 2005 and Aksu and Kocadereli
2005). The range of decreases reported is between 0.53mm and 2.14mm. Bishara et al
(1994), however, found the maxillary inter-molar width in their female extraction sample
to be unchanged, and Paquette, Beattie and Johnston (1992) found an increase in average
maxillary intermolar width of 0.1mm. The average ages at the start of treatment ranged
between 11.5 years and 14.3 years in these studies. The average treatment periods ranged
between 1.84 years and 3.1 years.
Kim and Gianelly (2003) studied the arch width and smile aesthetics on 30 patients who
had received non-extraction treatment and 30 who had had their four first premolars

15
extracted. The results of this study indicated that arch width is not decreased at a constant
arch depth because of extraction treatment.
2.3 Arch length
2.3.1 Arch length changes during normal growth
Nance (1947) showed that there was a decrease in arch length in the transition from the
primary to the permanent dentition.
In a longitudinal study of untreated individuals it was determined in the study that the
arch length decreased from the age of 12 to 26 with an average loss of 3.2mm in males
and 2.3mm in females (DeKock 1972). Sinclair and Litlle (1983) found that the arch
length as well as the intercanine width of untreated individuals with normal occlusion
decreased into early adulthood in untreated individuals.
Warren and Bishara (2001) studied a sample of contemporary children in the deciduous
dentition and compared that data with a historical sample from about 50 years ago. The
sample was the same in terms of geographic area as well as socioeconomic status. In this
study it was clear that the maxillary and mandibular arch lengths were significantly
shorter in the contemporary children. Warren and Bishara (2003) did a follow up study
and found that the tooth sizes in contemporary children are generally similar but with a
tendency to be slightly larger when compared with those of children in the historical
sample. From these findings it seems that crowding is more common and severe in
contemporary children when compared with a similar sample of children but born half a
century earlier.
16
2.3.2 Effect of non-extraction and extraction treatment on arch length
2.3.2.1 Mandibular arch length changes during treatment
Increases in mandibular arch length have been reported during non-extraction treatment
(Glenn, Sinclair and Alexander 1987, Paquette, Beattie and Johnston 1992, Sadowsky et
al 1994 and Heiser et al 2004,). The range of increase reported is between 0.2mm and
2.9mm. Luppanapornlap and Johnson (1993) and Shapiro (1974), however, found a
decrease in average mandibular arch length with the range of decreases reported between
0.2mm and 0.7mm. The average ages at the beginning of treatment ranged between 10.9
years and 12.6 years in these studies. The average treatment periods ranged between 1.6
years and 2.96 years.
Many researchers report that mandibular arch length decreases during extraction
treatment (Shapiro 1974, McReynolds and Little 1991, Paquette, Beattie and Johnston
1992, Luppanapornlap and Johnson 1993 and Shearn and Woods 2000, Heiser et al
2004). The range of decreases reported is between 8.3mm and 12.1mm. Shearn and
Woods (2000) showed that with mandibular first premolar extractions the arch length
decreased 11.1mm. Shearn and Woods (2000) and McReynolds and Little (1991) showed
that with mandibular second premolar extractions the range of arch length decreases
reported was between 11mm and 11.6mm. Ho and Kerr (1987) used a different method to
determine the arch length and found a decrease of 3.36mm. In this study only one
measurement was used, which was a measurement from the contact points of the incisors
to the midpoint of a line connecting the distal contact points of the first molars. Boley et
al (2003) measured the arch length as from a point between the central incisors to the
midpoint of a line between the mesial contacts of the first molars and found a mandibular
arch length decrease of 4.6mm. In these studies the average ages at the beginning of
treatment ranged between 12.53 years and 13.9 years. The average treatment periods
ranged between 1.84 years and 2.7 years.
17
2.3.2.2 Maxillary arch length changes during treatment
Researchers report that the maxillary arch length increases during non-extraction
treatment (Paquette, Beattie and Johnston 1992 and Heiser et al 2004). The average
increases reported are between 1.7mm and 3.2mm. Luppanapornlap and Johnson (1993)
and Sadowsky et al (1994), however, reported a decrease in average maxillary arch
length of between 0.1mm and 0.9mm. The average ages at the start of treatment ranged
between 10.9 years and 12.6 years in these studies. The average treatment periods ranged
between 1.6 years and 2.96 years.
Sadowsky et al (1994) in their study found that in non-extraction patients the maxillary
arch lengths decreased slightly and the mandibular arch length increased slightly during
treatment.
Many articles in the literature have described maxillary arch length decreases during
extraction treatment (Paquette, Beattie and Johnston 1992, Luppanapornlap and Johnson
1993 and Heiser et al 2004). The range of decreases reported was between 8.3mm and
11.6mm. Ho and Kerr (1987) used a different method to determine the arch length and
found a decrease of 4.93mm, whilst Boley et al (2003), also using a different technique
found a maxillary arch length decrease of 6.5mm. For these studies the average ages at
the beginning of treatment ranged between 12.53 years and 13.7 years. The average
treatment periods ranged between 1.84 years and 1.94 years.
According to the study by Boley et al (2003) the arch lengths decrease during treatment
because of molar protraction and incisor retraction.

18
2.4 Summary
Many articles in the literature have shown that arch dimensional changes occur during
non-extraction and extraction orthodontic treatment. The literature has shown distinct
differences between the effects of extraction and non-extraction treatment. However,
considerable variation is seen in the data reflecting changes. Further investigations are
warranted. The reported effects of non-extraction and extraction treatment on arch width
and arch length from some articles in the literature are summarized in Table 1.
19
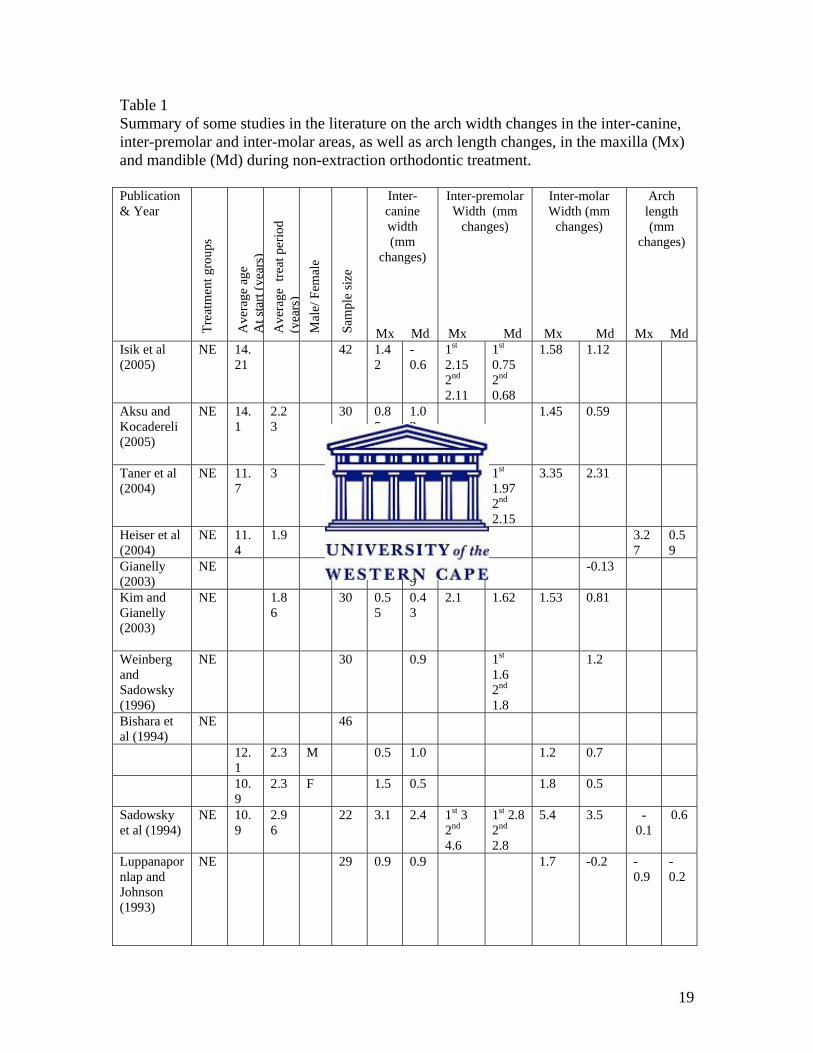
Table 1 Summary of some studies in the literature on the arch width changes in the inter-canine, inter-premolar and inter-molar areas, as well as arch length changes, in the maxilla (Mx) and mandible (Md) during non-extraction orthodontic treatment. Publication & Year
Trea
tmen
t gro
ups
Ave
rage
age
A
t sta
rt (y
ears
) A
vera
ge t
reat
per
iod
(yea
rs)
Mal
e/ F
emal
e
Sam
ple
size
Inter-canine width (mm
changes)
Mx Md
Inter-premolar Width (mm
changes)
Mx Md
Inter-molar Width (mm
changes)
Mx Md
Arch length (mm
changes)
Mx MdIsik et al (2005)
NE 14.21
42 1.42
-0.6
1st 2.15 2nd 2.11
1st 0.75 2nd 0.68
1.58 1.12
Aksu and Kocadereli (2005)
NE 14.1
2.23
30 0.85
1.02
1.45 0.59
Taner et al (2004)
NE 11.7
3 21 2.52
0.06
1st 4.33 2nd 3.95
1st 1.97 2nd 2.15
3.35 2.31
Heiser et al (2004)
NE 11.4
1.9 22 3.27
0.59
Gianelly (2003)
NE
0.69
-0.13
Kim and Gianelly (2003)
NE 1.86
30 0.55
0.43
2.1 1.62 1.53 0.81
Weinberg and Sadowsky (1996)
NE 30 0.9 1st 1.6 2nd 1.8
1.2
Bishara et al (1994)
NE 46
12.1
2.3 M 0.5 1.0 1.2 0.7
10.9
2.3 F 1.5 0.5 1.8 0.5
Sadowsky et al (1994)
NE 10.9
2.96
22 3.1 2.4 1st 3 2nd 4.6
1st 2.8 2nd 2.8
5.4 3.5 -0.1
0.6
Luppanapornlap and Johnson (1993)
NE 29 0.9 0.9 1.7 -0.2 -0.9
-0.2
20
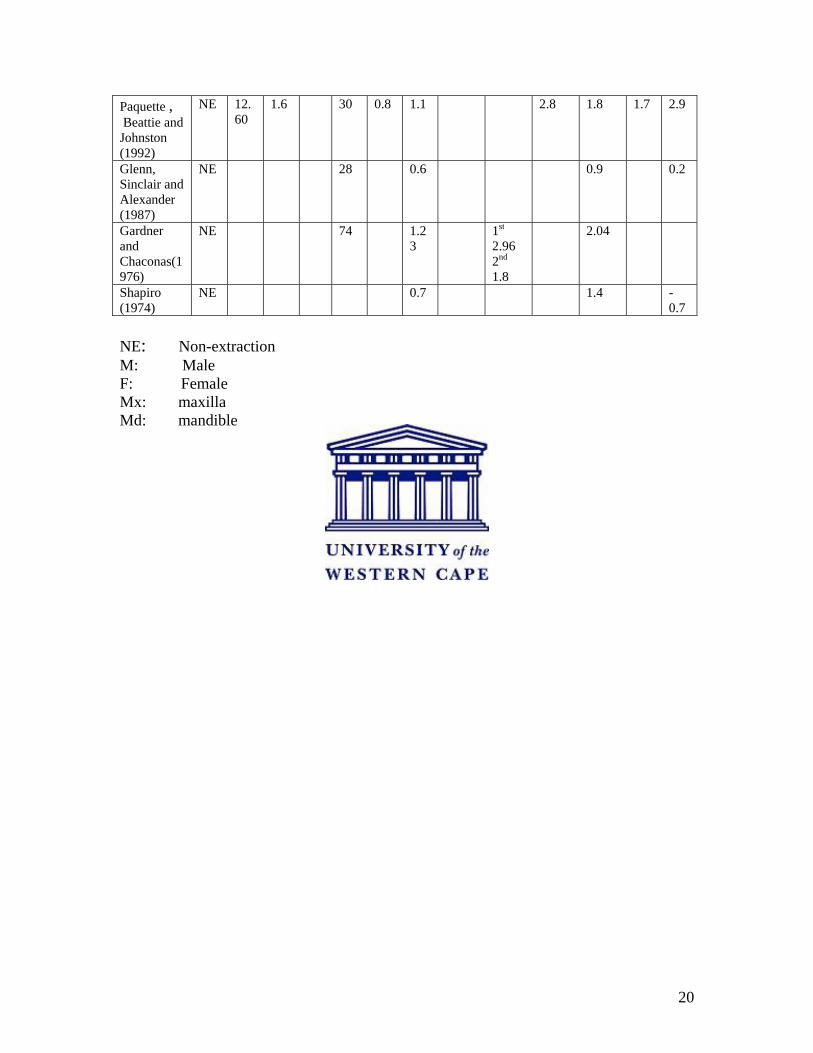
Paquette , Beattie and Johnston (1992)
NE 12.60
1.6 30 0.8 1.1 2.8 1.8 1.7 2.9
Glenn, Sinclair and Alexander (1987)
NE 28 0.6 0.9 0.2
Gardner and Chaconas(1976)
NE 74 1.23
1st 2.96 2nd 1.8
2.04
Shapiro (1974)
NE 0.7 1.4 -0.7
NE: Non-extraction M: Male F: Female Mx: maxilla Md: mandible
21
Table 2 Summary of some studies in the literature on the arch width changes in the inter-canine, inter-premolar and inter-molar areas, as well as arch length changes, in the maxilla (Mx) and mandible (Md) during extraction orthodontic treatment. Publication & Year
Trea
tmen
t gro
ups
Ave
rage
age
A
t sta
rt (y
ears
) A
vera
ge t
reat
per
iod
(yea
rs)
Mal
e/ F
emal
e
Sam
ple
size
Inter-canine width (mm
changes)
Mx Md
Inter-premolar Width (mm
changes)
Mx Md
Inter-molar Width (mm
changes)
Mx Md
Arch length (mm
changes)
Mx MdIsik et al (2005)
4’s 13.57
27 1.72
0.61
0.03 -2.64 -0.88 -1.42
Aksu and Kocadereli (2005)
EXT
14.3
2.32
30 1.47
1.63
-2.14 -0.93
Heiser et al (2004)
EXT
13.7
1.9 20 -9.64
-12.1
Boley et al (2003)
EXT
12.8
2.7 32 1.0 1.7 -1.7 -2.1 -6.5
-4.6
Gianelly (2003)
EXT
1.39
-1.54
Kim and Gianelly (2003)
4’s 2.34
30 0.84
0.51
-0.76 -0.95 -0.53 -0.94
Shearn and Woods (2000)
Md 1st
13.6
2.3 -2.8 -11.1
Md 2nd
13.9
2.2 -4.4 -11.6
Bishara et al (1994)
4,s 45
11.5
3.1 M 3.2 1.7 -0.9 -1.9
11.6
2.9 F 2.4 1.9 unchanged
-1.0
McReynolds and Little (1991)
Md 2nd
12.6
2.7 0.7 -2.1 -11
Luppanapornlap and Johnson (1993)
EXT
33 1.2 1.6 -0.7 -2.5 -8.3
-8.6
22
Paquette , Beattie and Johnston (1992)
EXT
12.53
1.84
33 0.8 2.2 0.1 -0.6 -11.6
-9.1
Ho and Kerr (1987)
EXT
12.74
1.94
23 0.92
0.57
0.44 -1.07 -0.76 -1.04 -4.93
-3.36
Gardner and Chaconas (1976)
4’s
29 1.92
-2.34 -1.46
Shapiro (1974)
EXT
1.7 -1.0 -8.3
Bishara (1973)
4’s 12 2.8 30 3.1 0.77
EXT: Extraction 4’s: Extraction of maxillary and mandibular first premolars Md 1st Extraction of mandibular first premolars
Md 2nd Extraction of mandibular second premolars
M: Male F: Female Mx: maxilla Md: mandible
23
Chapter 3
Research design and methodology
3.1 Aims and Objectives
The aim of this study was to determine the effect of non-extraction and premolar
extraction orthodontic treatment on interdental widths and arch lengths in the maxillary
and mandibular dentitions. The results of three treatment modalities were assessed and
the data analyzed statistically.
The objectives were to determine whether;
1. The dental arch widths and arch lengths increased during non-extraction treatment.
2. The dental arch widths and arch lengths decreased when premolar extractions are
done.
3. There were any differences in the dental arch widths and arch lengths with different
premolar extraction patterns.
3.2 Sample description
Three groups of patients treated by one orthodontist were selected; a non-extraction
group (Group NE), a group where the upper and lower first premolars were extracted
(Group 44) and a group which had extractions of the upper first and lower second
premolars (Group 45). The patients were randomly selected within the categories of non-
extraction and extraction treatment. The total sample consisted of 78 patients. The pre-
and post-treatment study models of 26 patients in each of the three treatment groups were
analyzed. Each group had an equal number of males and females (13 males and 13
females).
24
The study was not limited to a certain malocclusion, and the three groups had the
following division of patients.
Table 3
Illustration of the breakdown of the types of malocclusions in each of the study sample groups.
Groups Class I Class 11
division 1
Class I1
division 2
Total
Group NE 16 5 5 26
Group 44 20 3 3 26
Group 45 3 15 8 26
The inclusion criteria were
• Complete pre-treatment and immediate post-treatment study models of both the
maxillary and mandibular arches were available.
• All patients had received full fixed appliance treatment.
• Cases had to have a full complement of teeth exclusive of third molars. No
permanent teeth were missing, unless they were the premolars that were
designated to be extracted as part of the orthodontic treatment. Premolars
designated for extraction had to be present in the pre-treatment study models.
The exclusion criteria were
• The presence of any dental anomalies e.g., congenitally missing premolars.
• Patients with cleft lip and/or palate deformities.
• Patients with craniofacial deformities and or any craniofacial syndromes.
• Patients who had been treated with removable or fixed expansion appliances.
25
3.3 Arch width measurement
The arch widths in both the mandibular and maxillary arches were measured. The pre-
treatment maxillary and mandibular values as well as post-treatment maxillary and
mandibular values were measured in the inter-canine, inter-first and/ or inter-second
premolar and the inter-molar regions.
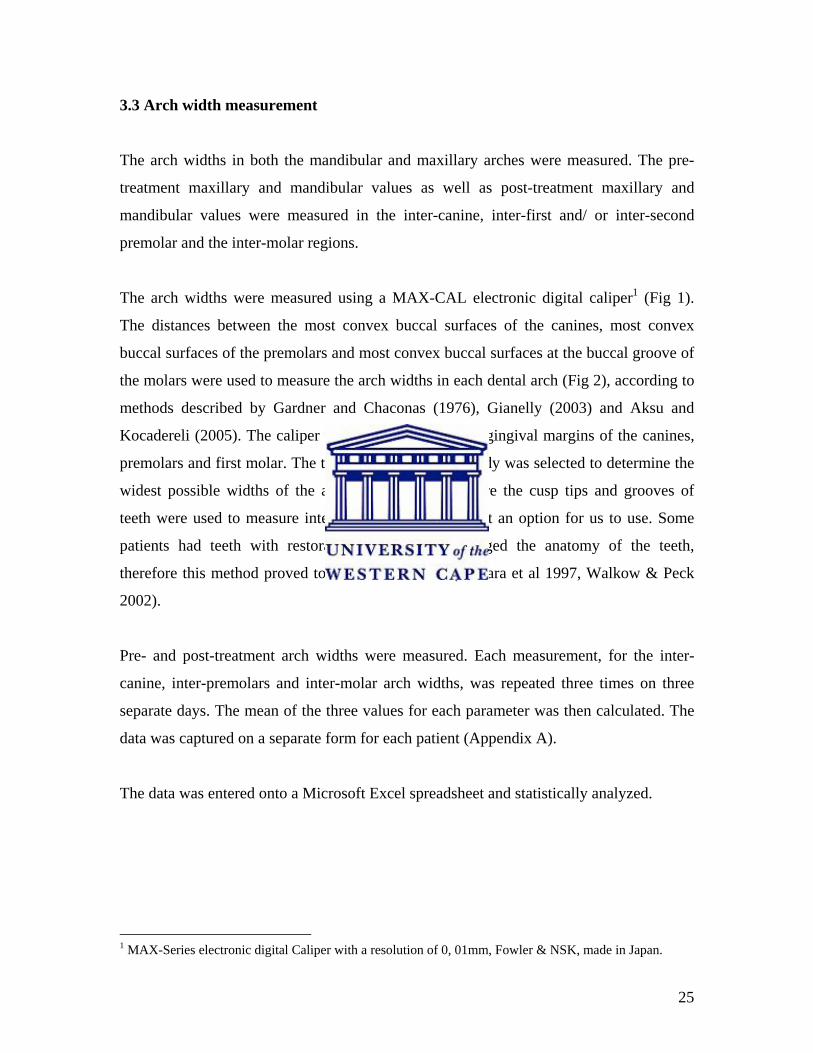
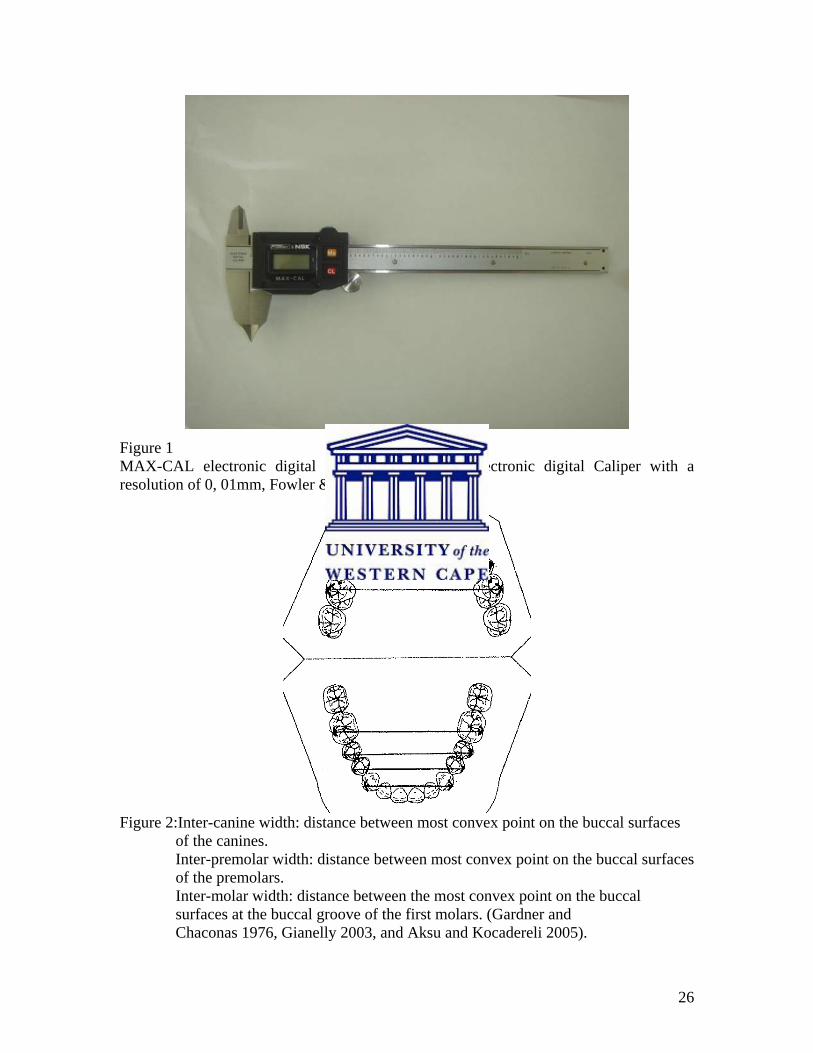
The arch widths were measured using a MAX-CAL electronic digital caliper1 (Fig 1).
The distances between the most convex buccal surfaces of the canines, most convex
buccal surfaces of the premolars and most convex buccal surfaces at the buccal groove of
the molars were used to measure the arch widths in each dental arch (Fig 2), according to
methods described by Gardner and Chaconas (1976), Gianelly (2003) and Aksu and
Kocadereli (2005). The caliper was placed at the bucco-gingival margins of the canines,
premolars and first molar. The technique used in this study was selected to determine the
widest possible widths of the arches. The method where the cusp tips and grooves of
teeth were used to measure inter-tooth distances was not an option for us to use. Some
patients had teeth with restorations, which had changed the anatomy of the teeth,
therefore this method proved to be difficult to use (Bishara et al 1997, Walkow & Peck
2002).
Pre- and post-treatment arch widths were measured. Each measurement, for the inter-
canine, inter-premolars and inter-molar arch widths, was repeated three times on three
separate days. The mean of the three values for each parameter was then calculated. The
data was captured on a separate form for each patient (Appendix A).
The data was entered onto a Microsoft Excel spreadsheet and statistically analyzed.
1 MAX-Series electronic digital Caliper with a resolution of 0, 01mm, Fowler & NSK, made in Japan.
26
Figure 1 MAX-CAL electronic digital caliper. MAX-Series electronic digital Caliper with a resolution of 0, 01mm, Fowler & NSK, made in Japan.
Figure 2:Inter-canine width: distance between most convex point on the buccal surfaces of the canines. Inter-premolar width: distance between most convex point on the buccal surfaces of the premolars. Inter-molar width: distance between the most convex point on the buccal surfaces at the buccal groove of the first molars. (Gardner and Chaconas 1976, Gianelly 2003, and Aksu and Kocadereli 2005).
27
3.4 Arch length measurement
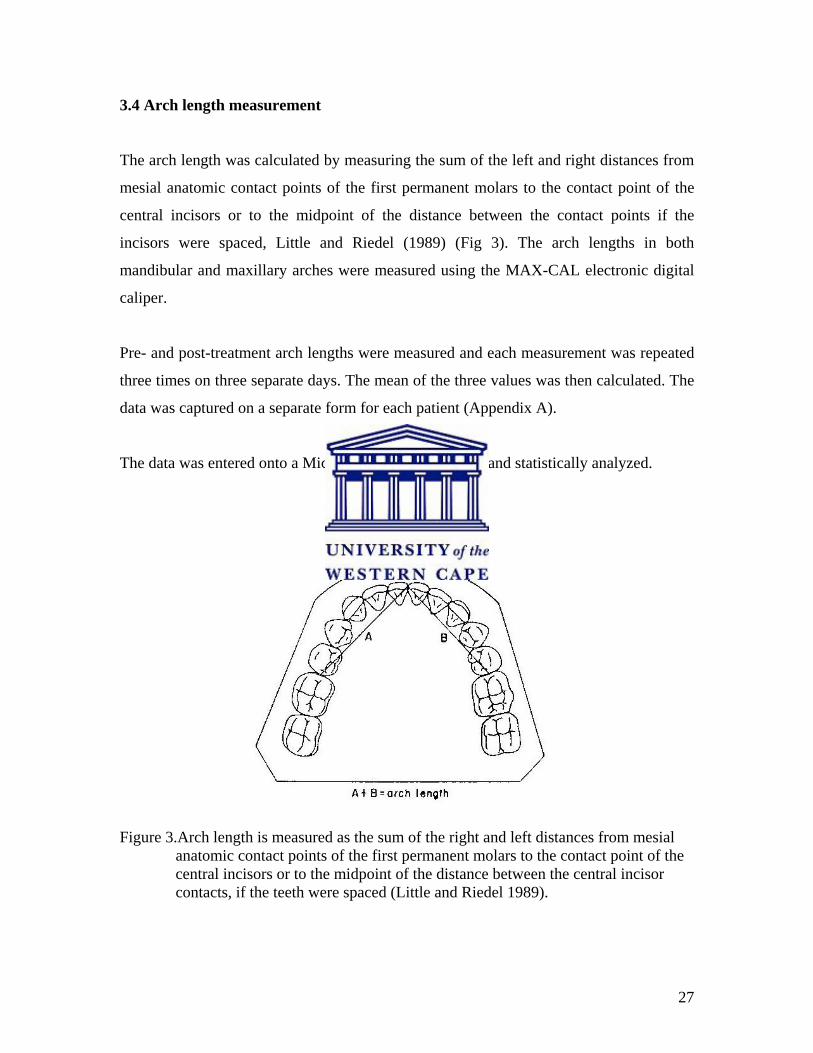
The arch length was calculated by measuring the sum of the left and right distances from
mesial anatomic contact points of the first permanent molars to the contact point of the
central incisors or to the midpoint of the distance between the contact points if the
incisors were spaced, Little and Riedel (1989) (Fig 3). The arch lengths in both
mandibular and maxillary arches were measured using the MAX-CAL electronic digital
caliper.
Pre- and post-treatment arch lengths were measured and each measurement was repeated
three times on three separate days. The mean of the three values was then calculated. The
data was captured on a separate form for each patient (Appendix A).
The data was entered onto a Microsoft Excel spreadsheet and statistically analyzed.
Figure 3.Arch length is measured as the sum of the right and left distances from mesial anatomic contact points of the first permanent molars to the contact point of the central incisors or to the midpoint of the distance between the central incisor contacts, if the teeth were spaced (Little and Riedel 1989).
28
3.5 Analysis of data
3.5.1 Pilot study
The pre-and post-treatment arch widths and arch lengths of ten patients were measured at
three different times, and the mean of the three values calculated for each patient.
Standardized error
These ten pairs of triplet measurements were analyzed for their accuracy.
The difference between the minimum and the maximum values is considered to be the
error. This error was standardized by means of taking the average of the three repeated
measurements. The standardized error is the range of the three repeats divided by their
average, and is expressed as a percentage. The medians of the standardized error for the
pre- and post-treatment arch width measurements ranged between 0.087% and 0.635%.
The maximum standardized errors for the pre- and post-treatment arch width
measurements varied between 0.298% and 1.700%. The medians of the standardized
error for the pre- and post-treatment arch length measurements ranged between 0.452%
and 1.225%. The maximum standardized errors for the pre- and post-treatment arch
length measurements varied between 1.190% and 3.419%. The maximum standardized
error was found to be in an acceptable range.
The intra-observer variability was found to be within an acceptable range.
3.5.2 Statistical Methods applied
Univariate exploratory data analysis was applied to all the measurements to detect
unusual values or even data errors. The data mistakes were identified by checking the
minimum and maximum values of each subgroup. After correcting such mistakes the
descriptive statistics were tabulated for the three groups.
29
For the data gathered from the mandible and the maxilla, descriptive statistics, including
the mean, standard deviation, minimum and maximum, were calculated. These
measurements were calculated for all three groups of treatment modalities.
The changes between pre- and post-treatment measurements were calculated for each
patient for each method. Thereafter sum versus difference plots were generated in order
to gain insight into the bi-variate distribution. These measures of change were tested,
studied and statistical inference was applied to the results.
The Wilcoxon signed rank test was used to test whether there were statistically
significant changes in the arch widths within the three treatment groups. This was done
for the inter-canine, inter-premolar and inter-molar arch widths in both the pre-treatment
and post-treatment groups.
The Kruskal-Wallis test was used to compare any changes in arch width for the two
extraction groups, and to identify any significant difference between these data. The
Kruskal-Wallis test was used to compare the change in the arch widths of the three
groups. A p-value less than 0.05 was considered to be significant.
The correlation coefficient between the changes in arch width was also studied. All
values above 0.6 were considered significant.
In the same manner, the descriptive statistics, Wilcoxon signed rank test, Kruskal-Wallis
test and correlation coefficient were also used for statistical analysis of the arch length
data, to determine whether there were changes within the three treatment groups from
pre- to post-treatment stages, and whether there was a difference between the data of the
two extraction groups.

30
3.6 Ethics statement
This study did not involve any clinical procedures on patients. The patients included in
this study were not identifiable from the records that were used.
31
Chapter 4
RESULTS
4.1 Age comparison and average treatment period
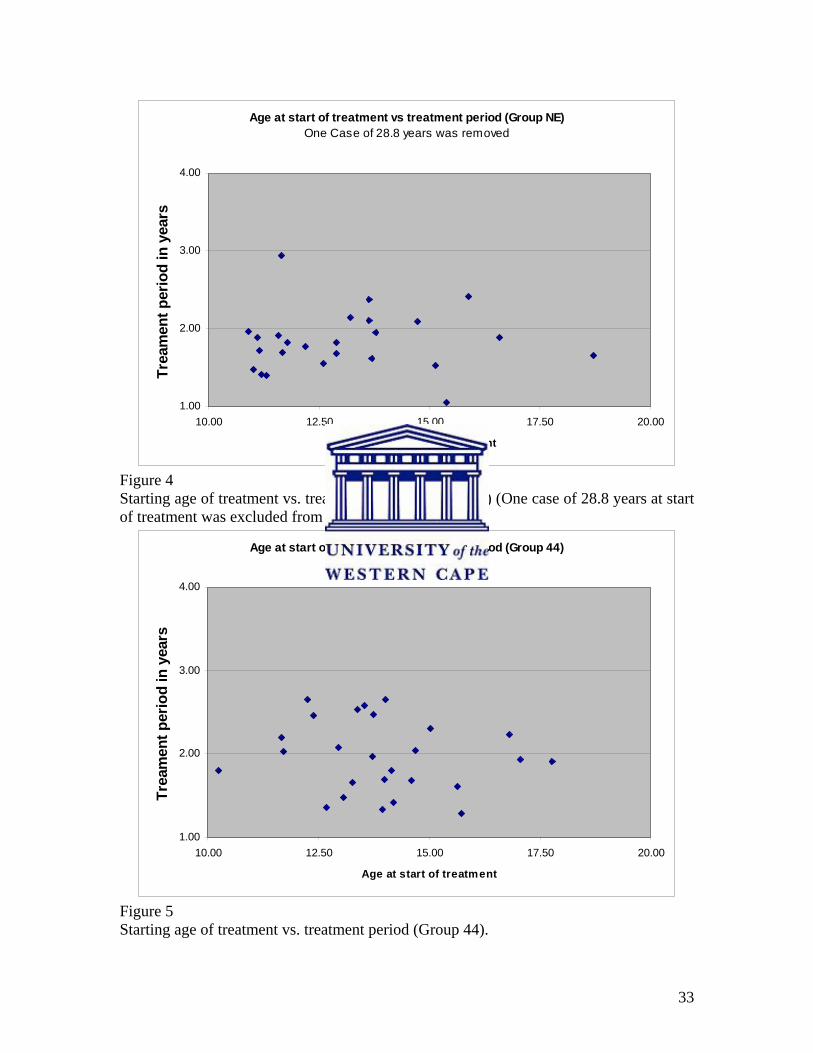
Figures 4, 5 and 6 show the distribution of age of the patients when treatment was started
in Group NE, Group 44 and Group 45 respectively. The average ages of the patient at the
start of treatment differed between the non-extraction group and the two extraction
groups. Treatment in Group NE started earlier than in the two extraction groups, the
average age at start of treatment being 13.73 years (Table 4).
A summary of the average ages at the start of treatment and the treatment periods for the
three groups of patients is presented in Table 4. Treatment took longer than one year in
all three treatment groups. In Group NE most treatments took less than 2 years. In a few
cases, however, the treatment lasted a little over 2 years and in one case the treatment
period was nearly 3 years (Figure 4). The average treatment period for Group NE was
1.84 years. (One case having an age of 28.8 years at start of treatment was excluded from
Figure 4, but included in the analysis).
The grouping for both extraction groups showed that treatment usually lasted around 2
years. In Group 44 the treatment lasted on average 1.97 years and in Group 45 lasted 2.29
years on average (Table 4). Group 44 (Figure 5) showed a nearly equal distribution of
patients for whom treatment was less than 2 years and of patients in whom the treatment
was longer than 2 years. For Group 44 the average age at start of treatment was 13.93
years (Table 4).
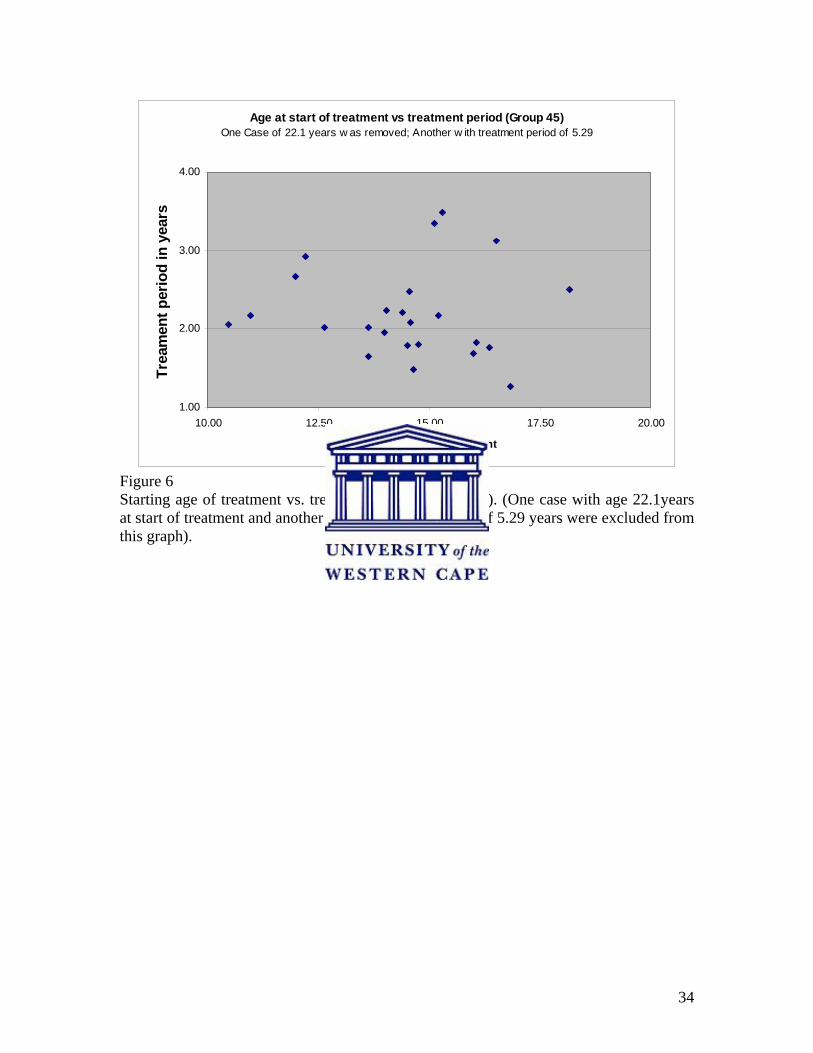
Group 45 had the longest treatment period with an average treatment duration of 2.29
years (Table 4). In three cases the treatment lasted longer than 3 years (Figure 6). For
Group 45 the average age at start of treatment was 14.62 years (Table 4). Excluded from

32
Figure 6 were one case who was 22.1years of age at start of treatment and one recording
a treatment period of 5.29 years.
There were no statistically significant differences (p>0.05) between the means when the
ages at the start of treatment were compared, nor when the treatment periods were
compared, between the three groups of treatment (Table 38).
33
Age at start of treatment vs treatment period (Group NE)One Case of 28.8 years was removed
1.00
2.00
3.00
4.00
10.00 12.50 15.00 17.50 20.00
Age at start of treatment
Trea
men
t per
iod
in y
ears
Figure 4 Starting age of treatment vs. treatment period (Group NE) (One case of 28.8 years at start of treatment was excluded from this graph).
Age at start of treatment vs treatment period (Group 44)
1.00
2.00
3.00
4.00
10.00 12.50 15.00 17.50 20.00
Age at start of treatment
Trea
men
t per
iod
in y
ears
Figure 5 Starting age of treatment vs. treatment period (Group 44).
34
Age at start of treatment vs treatment period (Group 45)One Case of 22.1 years w as removed; Another w ith treatment period of 5.29
1.00
2.00
3.00
4.00
10.00 12.50 15.00 17.50 20.00
Age at start of treatment
Trea
men
t per
iod
in y
ears
Figure 6 Starting age of treatment vs. treatment period (Group 45). (One case with age 22.1years at start of treatment and another with a treatment period of 5.29 years were excluded from this graph).
35
Table 4 Average, standard deviation and median of the age at start of treatment and treatment period for the three treatment groups. Treatment groups Average
age(years) at the start of treatment
Standard deviation (SD) of
age(years)
Median of age(years) at the start
of treatment
average treatment
period (years) and
standard deviation
(SD) (years)
standard deviation (SD) of
treatment period (years)
Median of treatment
period (years) and
standard deviation
(SD) (years)
Nonextraction (Group NE) (Males & Females)
13.73 3.66 12.9 1.84 0.38 1.8
Males (Group NE) 13.11 2.30
11.8
1.84 0.43 1.7
Females (Group NE) 14.37 4.67
13.2
1.84 0.34 1.9
Extraction of four first premolars (Group 44) (Males & Females)
13.93 1.72
13.8
1.97 0.43 1.9
Males (Group 44) 13.94 1.59
13.7
2.15 0.39 2.2
Females (Group 44) 13.92 1.91
14.0
1.78 0.39 1.7
Extraction of upper first and lower second premolars (Group 45) (Males & Females)
14.62 2.39
14.6
2.29 0.83
2.1
Males (Group 45) 14.08 2.32
14.6
2.27 0.99 2.1
Females (Group 45) 15.17 2.43
14.8
2.31 0.67 2.0
The associated standard deviation is likely to be affected in the case where the average
and the median are substantially different (medians highlighted) in the sense that the
standard deviation would be larger than expected.

36
4.2 Arch width
The descriptive statistics for the pre- and post-treatment values of the inter-canine, inter-
first premolar, inter-second premolar and inter-molar arch widths for the mandible and
maxilla for the three treatment groups are presented in Tables 5-20.
4.2.1 Comparison of arch widths measured on pre-treatment study models.
4.2.1.1 Mandibular arch
a) Males compared with females (Tables 5, 7, 9, 11)
The average inter-canine, inter-first premolar, inter-second premolar and inter-molar arch
widths in the males were larger in Group NE and Group 45 than the corresponding arch
widths of the females. In the Group 44, the females had slightly larger average arch
widths in the inter-canine, inter-first premolar, inter-second premolar and inter-molar
area.
Inter-canine arch width: Table 5
The inter-canine arch width in the female sample showed similar values for Group NE
and Group 45. The average arch width was +/- 0.8mm more in Group 44 compared with
the other two groups. In the male sample Group 44 had the smallest average arch width,
with Group NE an average of 0.62mm larger and Group 45 was an average of 1.34mm
larger than the first group.
Inter-first premolar arch width: Table 7
The inter-first premolar arch width of the female group showed similar values for Group
NE and Group 45. The female sample of Group 44 showed a larger average arch width of
+/- 0.85 mm. The male group showed similar values for Group NE and Group 45. In the
37
male sample the average arch width was +/- 0.83 less in Group 44 compared with the
other two groups.
Inter-second premolar arch width: Table 9
The inter-second premolar arch width for the female group showed almost similar values
for the two extraction groups. The average arch width in Group NE was +/- 0.81mm
larger compared with the two extraction groups for the female sample. In the male
sample the average arch width was the widest in Group NE, with Group 45 an average of
0.43mm less and Group 44 an average of 2.22mm less compared with the non-extraction
group.
Inter-molar arch width: Table 11
For the inter-molar arch width the female sample in Group 44 had the largest average
arch width, with Group NE showing an average of 0.67mm less and group 45 an average
of 1.14mm less compared with Group 44. In the male sample Group NE and Group 45
had almost similar values. In Group 44 the average arch width in males was +/- 1.31mm
less compared with the other two groups.
b) Averages of combined samples for mandibular arch widths
For the combined averages, the pre-treatment values in the mandibular arch showed
almost similar values for the three treatment groups, except for the inter-second premolar
arch width (Tables 5, 7, 9 and 11). In Group 45 the average inter-second premolar arch
width was 0.79mm more than the arch width of Group 44, and in Group NE the average
inter-second premolar arch width was 1.51mm more than that of Group 44.
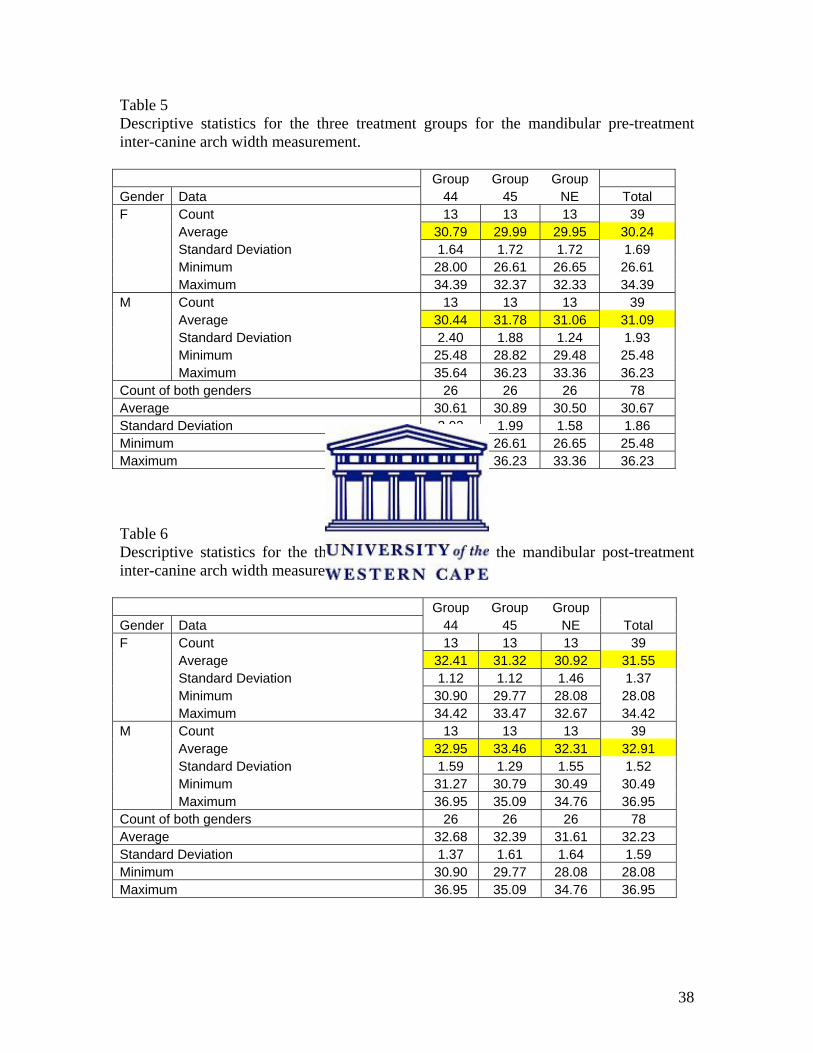
38
Table 5 Descriptive statistics for the three treatment groups for the mandibular pre-treatment inter-canine arch width measurement. Group Group Group Gender Data 44 45 NE Total F Count 13 13 13 39 Average 30.79 29.99 29.95 30.24 Standard Deviation 1.64 1.72 1.72 1.69 Minimum 28.00 26.61 26.65 26.61 Maximum 34.39 32.37 32.33 34.39 M Count 13 13 13 39 Average 30.44 31.78 31.06 31.09 Standard Deviation 2.40 1.88 1.24 1.93 Minimum 25.48 28.82 29.48 25.48 Maximum 35.64 36.23 33.36 36.23 Count of both genders 26 26 26 78 Average 30.61 30.89 30.50 30.67 Standard Deviation 2.02 1.99 1.58 1.86 Minimum 25.48 26.61 26.65 25.48 Maximum 35.64 36.23 33.36 36.23 Table 6 Descriptive statistics for the three treatment groups for the mandibular post-treatment inter-canine arch width measurement. Group Group Group Gender Data 44 45 NE Total F Count 13 13 13 39 Average 32.41 31.32 30.92 31.55 Standard Deviation 1.12 1.12 1.46 1.37 Minimum 30.90 29.77 28.08 28.08 Maximum 34.42 33.47 32.67 34.42 M Count 13 13 13 39 Average 32.95 33.46 32.31 32.91 Standard Deviation 1.59 1.29 1.55 1.52 Minimum 31.27 30.79 30.49 30.49 Maximum 36.95 35.09 34.76 36.95 Count of both genders 26 26 26 78 Average 32.68 32.39 31.61 32.23 Standard Deviation 1.37 1.61 1.64 1.59 Minimum 30.90 29.77 28.08 28.08 Maximum 36.95 35.09 34.76 36.95
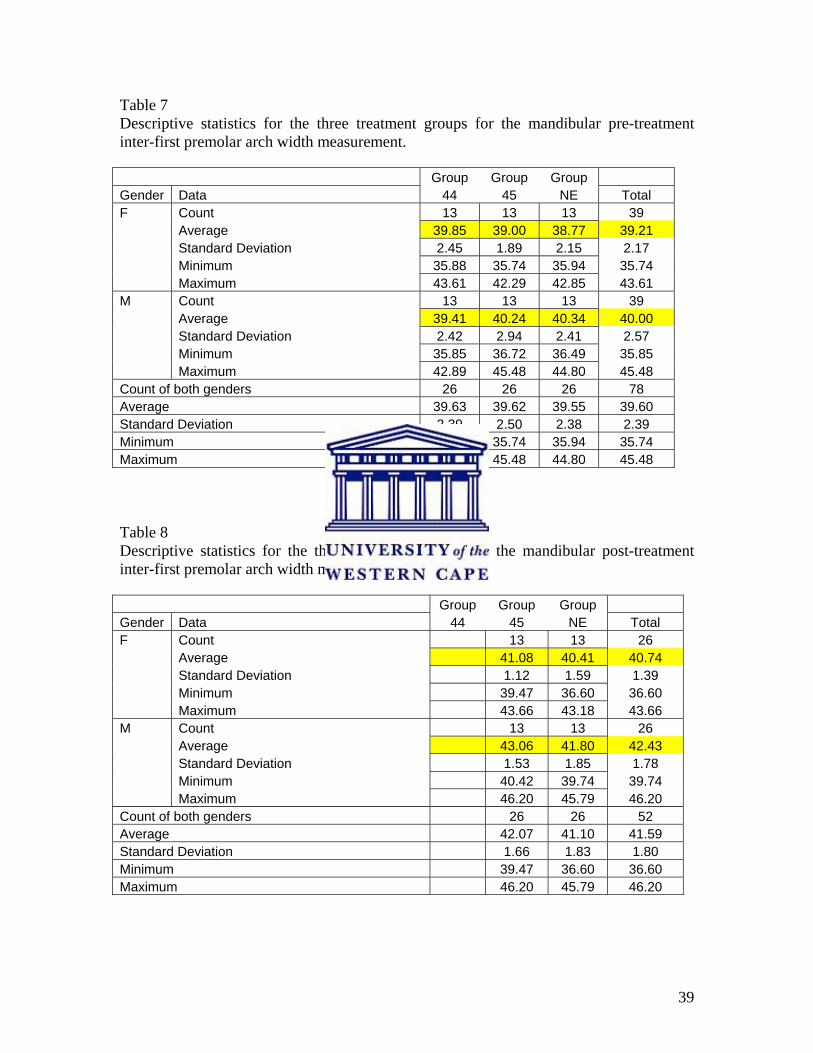
39
Table 7 Descriptive statistics for the three treatment groups for the mandibular pre-treatment inter-first premolar arch width measurement. Group Group Group Gender Data 44 45 NE Total F Count 13 13 13 39 Average 39.85 39.00 38.77 39.21 Standard Deviation 2.45 1.89 2.15 2.17 Minimum 35.88 35.74 35.94 35.74 Maximum 43.61 42.29 42.85 43.61 M Count 13 13 13 39 Average 39.41 40.24 40.34 40.00 Standard Deviation 2.42 2.94 2.41 2.57 Minimum 35.85 36.72 36.49 35.85 Maximum 42.89 45.48 44.80 45.48 Count of both genders 26 26 26 78 Average 39.63 39.62 39.55 39.60 Standard Deviation 2.39 2.50 2.38 2.39 Minimum 35.85 35.74 35.94 35.74 Maximum 43.61 45.48 44.80 45.48 Table 8 Descriptive statistics for the three treatment groups for the mandibular post-treatment inter-first premolar arch width measurement. Group Group Group Gender Data 44 45 NE Total F Count 13 13 26 Average 41.08 40.41 40.74 Standard Deviation 1.12 1.59 1.39 Minimum 39.47 36.60 36.60 Maximum 43.66 43.18 43.66 M Count 13 13 26 Average 43.06 41.80 42.43 Standard Deviation 1.53 1.85 1.78 Minimum 40.42 39.74 39.74 Maximum 46.20 45.79 46.20 Count of both genders 26 26 52 Average 42.07 41.10 41.59 Standard Deviation 1.66 1.83 1.80 Minimum 39.47 36.60 36.60 Maximum 46.20 45.79 46.20
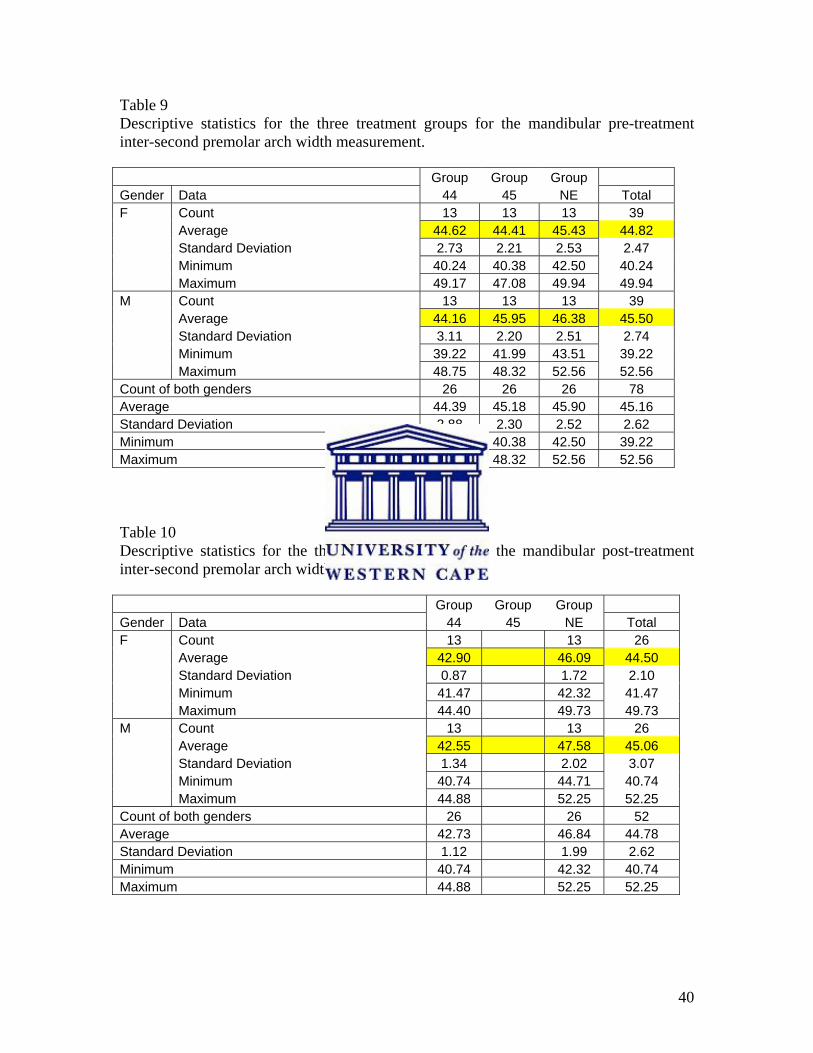
40
Table 9 Descriptive statistics for the three treatment groups for the mandibular pre-treatment inter-second premolar arch width measurement. Group Group Group Gender Data 44 45 NE Total F Count 13 13 13 39 Average 44.62 44.41 45.43 44.82 Standard Deviation 2.73 2.21 2.53 2.47 Minimum 40.24 40.38 42.50 40.24 Maximum 49.17 47.08 49.94 49.94 M Count 13 13 13 39 Average 44.16 45.95 46.38 45.50 Standard Deviation 3.11 2.20 2.51 2.74 Minimum 39.22 41.99 43.51 39.22 Maximum 48.75 48.32 52.56 52.56 Count of both genders 26 26 26 78 Average 44.39 45.18 45.90 45.16 Standard Deviation 2.88 2.30 2.52 2.62 Minimum 39.22 40.38 42.50 39.22 Maximum 49.17 48.32 52.56 52.56 Table 10 Descriptive statistics for the three treatment groups for the mandibular post-treatment inter-second premolar arch width measurement. Group Group Group Gender Data 44 45 NE Total F Count 13 13 26 Average 42.90 46.09 44.50 Standard Deviation 0.87 1.72 2.10 Minimum 41.47 42.32 41.47 Maximum 44.40 49.73 49.73 M Count 13 13 26 Average 42.55 47.58 45.06 Standard Deviation 1.34 2.02 3.07 Minimum 40.74 44.71 40.74 Maximum 44.88 52.25 52.25 Count of both genders 26 26 52 Average 42.73 46.84 44.78 Standard Deviation 1.12 1.99 2.62 Minimum 40.74 42.32 40.74 Maximum 44.88 52.25 52.25

41
Table 11 Descriptive statistics for the three treatment groups for the mandibular pre-treatment inter-molar arch width measurement. Group Group Group Gender Data 44 45 NE Total F Count 13 13 13 39 Average 52.39 51.25 51.72 51.79 Standard Deviation 2.10 2.09 2.48 2.22 Minimum 48.93 47.97 47.90 47.90 Maximum 54.93 54.88 56.74 56.74 M Count 13 13 13 39 Average 51.50 52.81 53.18 52.50 Standard Deviation 2.49 2.13 2.45 2.41 Minimum 47.81 49.18 50.29 47.81 Maximum 55.71 56.93 59.76 59.76 Count of both genders 26 26 26 78 Average 51.95 52.03 52.45 52.14 Standard Deviation 2.30 2.21 2.53 2.33 Minimum 47.81 47.97 47.90 47.81 Maximum 55.71 56.93 59.76 59.76 Table 12 Descriptive statistics for the three treatment groups for the mandibular post-treatment inter-molar arch width measurement. Group Group Group Gender Data 44 45 NE Total F Count 13 13 13 39 Average 50.26 48.94 51.76 50.32 Standard Deviation 1.51 1.64 2.06 2.06 Minimum 47.58 46.23 48.70 46.23 Maximum 52.39 51.97 56.86 56.86 M Count 13 13 13 39 Average 49.35 50.18 53.51 51.01 Standard Deviation 1.98 1.93 2.31 2.72 Minimum 46.22 46.86 50.20 46.22 Maximum 53.94 53.11 58.93 58.93 Count of both genders 26 26 26 78 Average 49.80 49.56 52.63 50.67 Standard Deviation 1.78 1.86 2.32 2.43 Minimum 46.22 46.23 48.70 46.22 Maximum 53.94 53.11 58.93 58.93

42
4.2.1.2 Maxillary arch
a) Males compared with females (Tables 13, 15, 17 and 19)
The average maxillary arch widths for all three treatment groups were larger in the males
in the inter-canine and inter-second premolar areas. In Group NE and Group 45 the males
also had a larger average arch width in the inter-second premolar and inter-molar areas
compared with the females. Group 44 showed a slightly larger average arch width for the
females in the inter-second premolar and inter-molar region (Tables 13, 15, 17 and 19).
Inter-canine arch width: Table 13
The average arch width of Group NE and Group 45 showed similar values in the female
groups. In the female sample of Group 44 the average arch width was +/-2mm larger
compared with the other two groups. In the male sample the three treatment groups had
similar values.
Inter-first premolar arch width: Table 15
The female sample had a greater average arch width in Group 44 compared with the other
groups. Group NE had an average arch width of 1.45mm less and Group 45 showed an
average of 2.69mm smaller arch width compared with Group 44. The males had similar
values for the three treatment groups.
Inter-second premolar arch width: Table 17
The female sample had a greater average arch width in Group 44 compared with the other
groups. Group NE had an average arch width of 1.28mm less and Group 45 had an
average of 2.41mm less arch width compared with Group 44. The males in Group NE
and Group 44 had similar values. In males Group 45 had an average arch width +/-0.6mm
smaller compared with the other two groups.
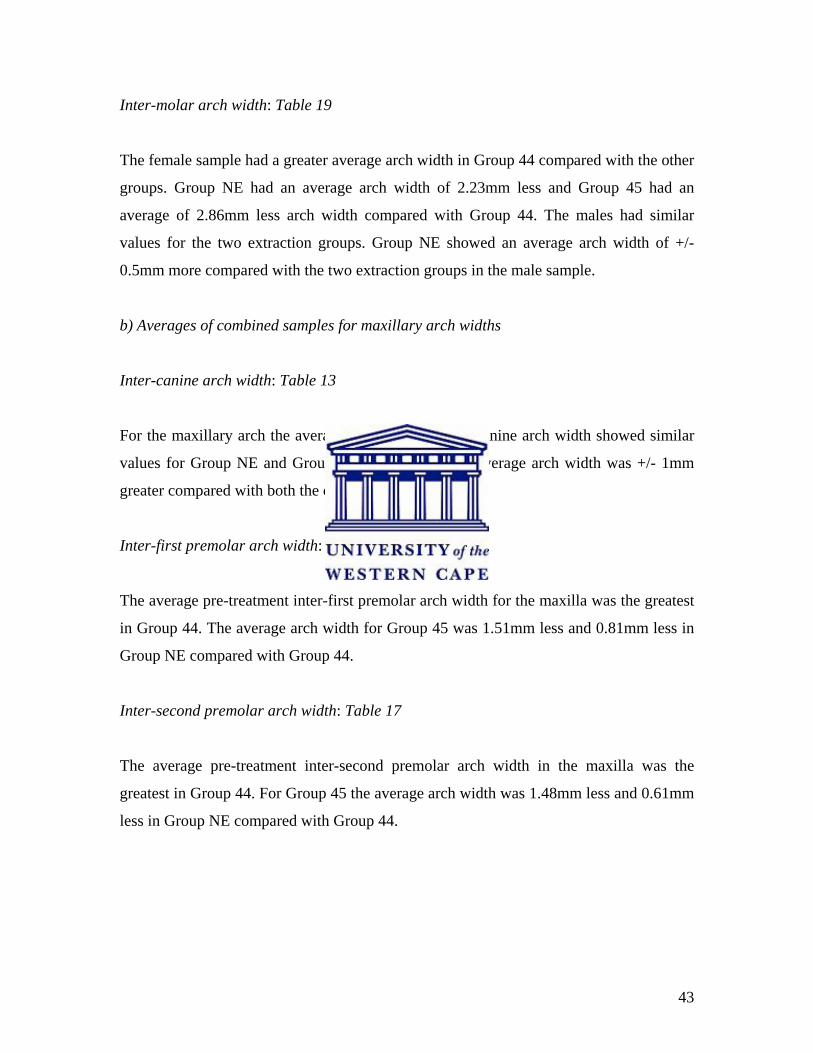
43
Inter-molar arch width: Table 19
The female sample had a greater average arch width in Group 44 compared with the other
groups. Group NE had an average arch width of 2.23mm less and Group 45 had an
average of 2.86mm less arch width compared with Group 44. The males had similar
values for the two extraction groups. Group NE showed an average arch width of +/-
0.5mm more compared with the two extraction groups in the male sample.
b) Averages of combined samples for maxillary arch widths
Inter-canine arch width: Table 13
For the maxillary arch the average pre-treatment inter-canine arch width showed similar
values for Group NE and Group 45. In Group 44 the average arch width was +/- 1mm
greater compared with both the other groups.
Inter-first premolar arch width: Table 15
The average pre-treatment inter-first premolar arch width for the maxilla was the greatest
in Group 44. The average arch width for Group 45 was 1.51mm less and 0.81mm less in
Group NE compared with Group 44.
Inter-second premolar arch width: Table 17
The average pre-treatment inter-second premolar arch width in the maxilla was the
greatest in Group 44. For Group 45 the average arch width was 1.48mm less and 0.61mm
less in Group NE compared with Group 44.

44
Inter-molar arch width: Table 19
The average pre-treatment inter-molar arch width in the maxilla was the greatest in
Group 44. The average arch width for Group 45 was 1.47mm less and 0.88mm less in
Group NE compared with Group 44.

45
Table 13 Descriptive statistics for the three treatment groups for the maxillary pre-treatment inter-canine arch width measurement. Group Group Group Gender Data 44 45 NE Total F Count 13 13 13 39 Average 38.76 36.77 36.78 37.44 Standard Deviation 2.08 2.28 3.03 2.61 Minimum 36.34 32.32 32.77 32.32 Maximum 42.91 41.32 41.99 42.91 M Count 13 13 13 39 Average 38.95 38.98 38.65 38.86 Standard Deviation 2.90 1.83 2.40 2.36 Minimum 31.62 36.60 34.67 31.62 Maximum 42.06 42.20 43.52 43.52 Count of both genders 26 26 26 78 Average 38.86 37.87 37.72 38.15 Standard Deviation 2.48 2.32 2.84 2.57 Minimum 31.62 32.32 32.77 31.62 Maximum 42.91 42.20 43.52 43.52 Table 14 Descriptive statistics for the three treatment groups for the maxillary post-treatment inter-canine arch width measurement. Group Group Group Gender Data 44 45 NE Total F Count 13 13 13 39 Average 40.54 38.93 38.49 39.32 Standard Deviation 1.49 1.89 2.13 2.01 Minimum 37.36 35.80 34.85 34.85 Maximum 42.51 42.45 41.29 42.51 M Count 13 13 13 39 Average 40.86 40.96 39.38 40.40 Standard Deviation 1.78 1.45 2.97 2.23 Minimum 37.75 38.08 32.00 32.00 Maximum 43.70 43.42 43.93 43.93 Count of both genders 26 26 26 78 Average 40.70 39.95 38.93 39.86 Standard Deviation 1.62 1.95 2.57 2.18 Minimum 37.36 35.80 32.00 32.00 Maximum 43.70 43.42 43.93 43.93
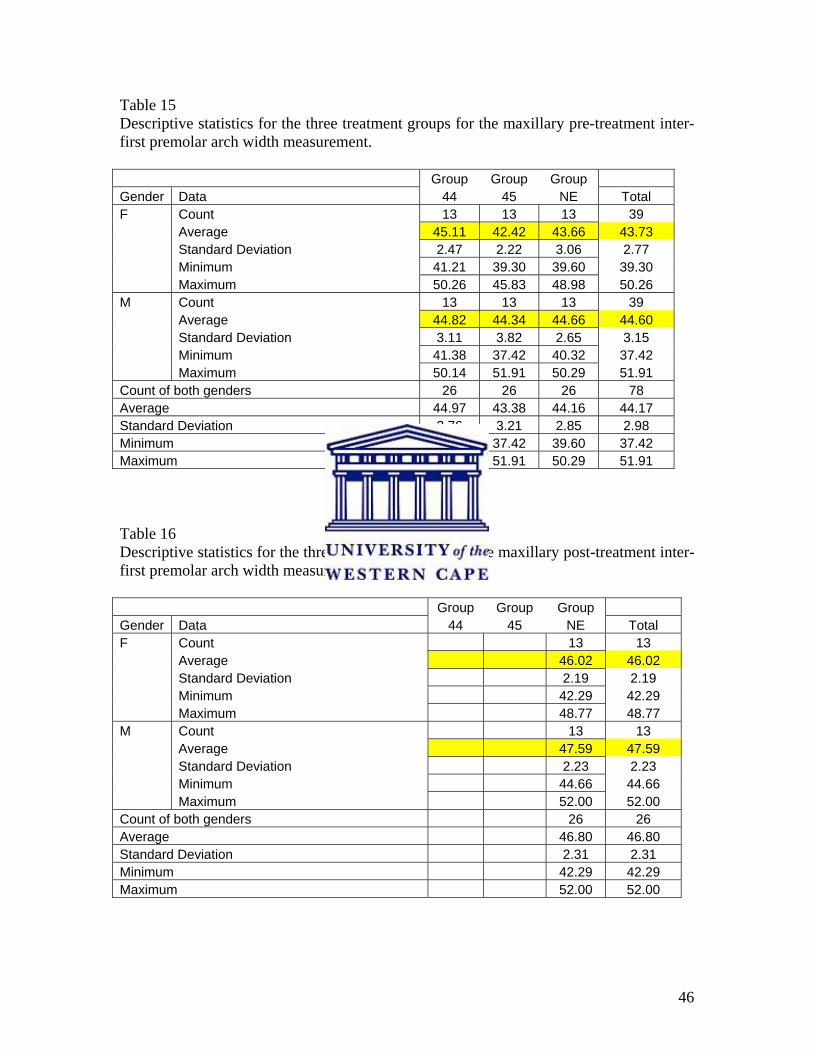
46
Table 15 Descriptive statistics for the three treatment groups for the maxillary pre-treatment inter-first premolar arch width measurement. Group Group Group Gender Data 44 45 NE Total F Count 13 13 13 39 Average 45.11 42.42 43.66 43.73 Standard Deviation 2.47 2.22 3.06 2.77 Minimum 41.21 39.30 39.60 39.30 Maximum 50.26 45.83 48.98 50.26 M Count 13 13 13 39 Average 44.82 44.34 44.66 44.60 Standard Deviation 3.11 3.82 2.65 3.15 Minimum 41.38 37.42 40.32 37.42 Maximum 50.14 51.91 50.29 51.91 Count of both genders 26 26 26 78 Average 44.97 43.38 44.16 44.17 Standard Deviation 2.76 3.21 2.85 2.98 Minimum 41.21 37.42 39.60 37.42 Maximum 50.26 51.91 50.29 51.91 Table 16 Descriptive statistics for the three treatment groups for the maxillary post-treatment inter-first premolar arch width measurement. Group Group Group Gender Data 44 45 NE Total F Count 13 13 Average 46.02 46.02 Standard Deviation 2.19 2.19 Minimum 42.29 42.29 Maximum 48.77 48.77 M Count 13 13 Average 47.59 47.59 Standard Deviation 2.23 2.23 Minimum 44.66 44.66 Maximum 52.00 52.00 Count of both genders 26 26 Average 46.80 46.80 Standard Deviation 2.31 2.31 Minimum 42.29 42.29 Maximum 52.00 52.00

47
Table 17 Descriptive statistics for the three treatment groups for the maxillary pre-treatment inter-second premolar arch width measurement. Group Group Group Gender Data 44 45 NE Total F Count 13 13 13 39 Average 49.33 46.92 48.05 48.10 Standard Deviation 2.76 2.41 3.23 2.92 Minimum 45.45 43.74 44.24 43.74 Maximum 54.32 50.37 55.00 55.00 M Count 13 13 13 39 Average 49.62 49.06 49.68 49.45 Standard Deviation 2.82 4.68 2.88 3.49 Minimum 46.04 40.85 45.70 40.85 Maximum 55.60 58.42 56.29 58.42 Count of both genders 26 26 26 78 Average 49.47 47.99 48.86 48.77 Standard Deviation 2.74 3.81 3.11 3.27 Minimum 45.45 40.85 44.24 40.85 Maximum 55.60 58.42 56.29 58.42 Table 18 Descriptive statistics for the three treatment groups for the maxillary post-treatment inter-second premolar arch width measurement. Group Group Group Gender Data 44 45 NE Total F Count 13 13 13 39 Average 48.55 46.65 50.15 48.45 Standard Deviation 1.74 1.48 2.09 2.26 Minimum 45.96 44.26 46.45 44.26 Maximum 51.05 49.20 53.74 53.74 M Count 13 13 13 39 Average 48.38 48.75 51.77 49.63 Standard Deviation 1.59 1.86 2.69 2.56 Minimum 46.08 45.69 47.92 45.69 Maximum 51.67 52.17 57.96 57.96 Count of both genders 26 26 26 78 Average 48.47 47.70 50.96 49.04 Standard Deviation 1.64 1.96 2.50 2.47 Minimum 45.96 44.26 46.45 44.26 Maximum 51.67 52.17 57.96 57.96

48
Table 19 Descriptive statistics for the three treatment groups for the maxillary pre-treatment inter-molar arch width measurement. Group Group Group Gender Data 44 45 NE Total F Count 13 13 13 39 Average 56.00 53.14 53.77 54.30 Standard Deviation 3.30 2.21 2.53 2.92 Minimum 50.71 50.34 50.17 50.17 Maximum 60.09 57.98 59.57 60.09 M Count 13 13 13 39 Average 55.11 55.01 55.57 55.23 Standard Deviation 2.83 3.30 3.18 3.04 Minimum 51.11 50.87 51.53 50.87 Maximum 61.09 61.19 64.83 64.83 Count of both genders 26 26 26 78 Average 55.55 54.08 54.67 54.77 Standard Deviation 3.05 2.91 2.96 3.00 Minimum 50.71 50.34 50.17 50.17 Maximum 61.09 61.19 64.83 64.83 Table 20 Descriptive statistics for the three treatment groups for the maxillary post-treatment inter-molar arch width measurement. Group Group Group Gender Data 44 45 NE Total F Count 13 13 13 39 Average 54.30 52.21 53.83 53.45 Standard Deviation 2.83 1.74 2.59 2.53 Minimum 49.56 49.78 49.93 49.56 Maximum 58.99 54.38 59.41 59.41 M Count 13 13 13 39 Average 53.24 53.77 55.97 54.32 Standard Deviation 1.91 2.11 3.16 2.67 Minimum 50.97 50.96 51.09 50.96 Maximum 57.71 57.64 63.57 63.57 Count of both genders 26 26 26 78 Average 53.77 52.99 54.90 53.89 Standard Deviation 2.42 2.05 3.03 2.62 Minimum 49.56 49.78 49.93 49.56 Maximum 58.99 57.64 63.57 63.57

49
4.2.2 Pre- and Post-treatment Average vs. Standard Deviation of the three treatment
groups for the arch width in the inter-canine and inter-molar areas
Figures 7 to 14 show graphic plots of the average vs. the standard deviation for the inter-
canine and inter-molar arch width for the three groups of treatment. The inter-canine and
inter-molar arch widths were chosen for this as they were arch widths which were present
pre- and post-treatment in all three groups. The inter-premolar arch widths were not
chosen as premolars were extracted in two of the treatment groups.
The average inter-canine arch width increased in all three treatment groups in both the
mandible and maxilla. The average inter-molar arch width increased slightly in Group
NE and decreased in both Group 44 and Group 45 for both the mandible and maxilla.
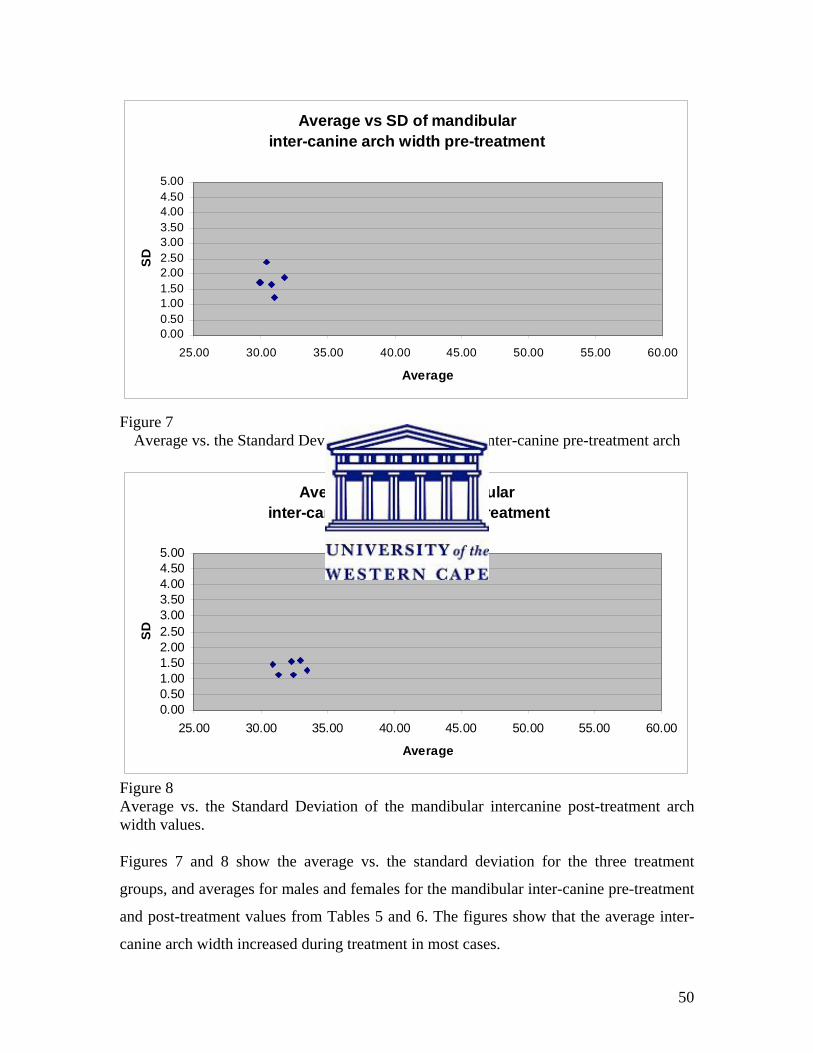
50
Average vs SD of mandibularinter-canine arch width pre-treatment
0.000.501.001.502.002.503.003.504.004.505.00
25.00 30.00 35.00 40.00 45.00 50.00 55.00 60.00
Average
SD
Figure 7
Average vs. the Standard Deviation of the mandibular inter-canine pre-treatment arch width values.
Average vs SD of mandibular inter-canine arch width post-treatment
0.000.501.001.502.002.503.003.504.004.505.00
25.00 30.00 35.00 40.00 45.00 50.00 55.00 60.00
Average
SD
Figure 8 Average vs. the Standard Deviation of the mandibular intercanine post-treatment arch width values. Figures 7 and 8 show the average vs. the standard deviation for the three treatment
groups, and averages for males and females for the mandibular inter-canine pre-treatment
and post-treatment values from Tables 5 and 6. The figures show that the average inter-
canine arch width increased during treatment in most cases.
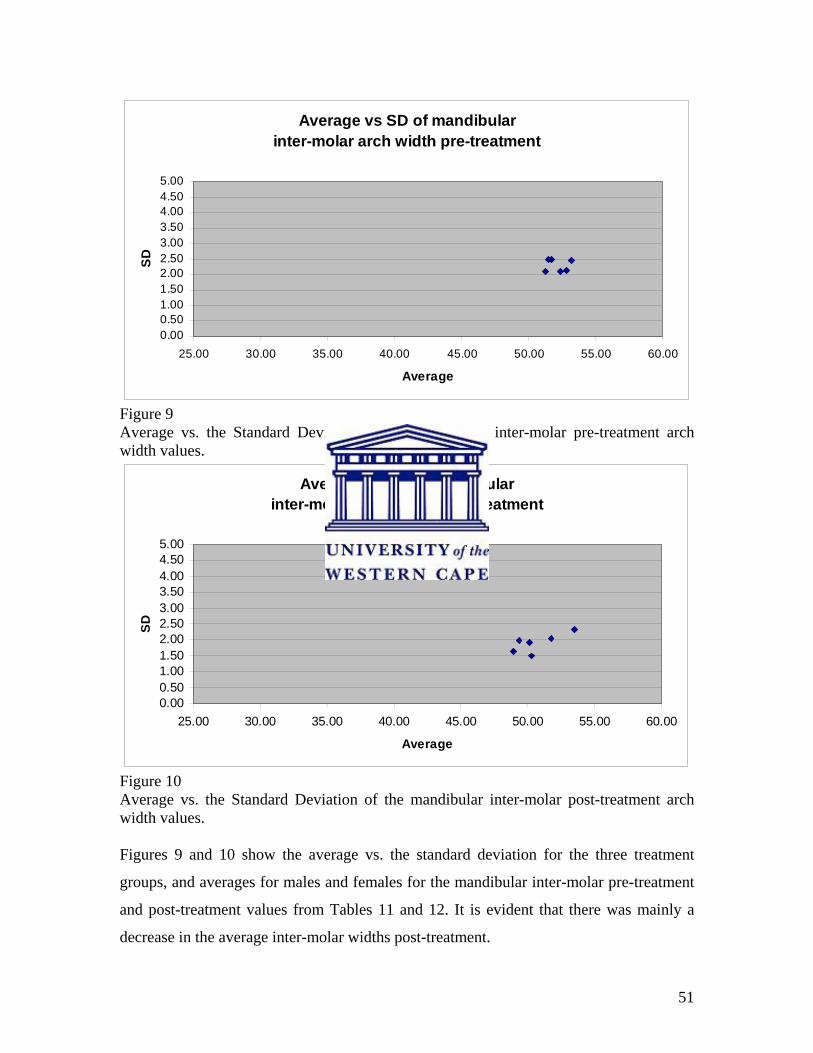
51
Average vs SD of mandibularinter-molar arch width pre-treatment
0.000.501.001.502.002.503.003.504.004.505.00
25.00 30.00 35.00 40.00 45.00 50.00 55.00 60.00
Average
SD
Figure 9 Average vs. the Standard Deviation of the mandibular inter-molar pre-treatment arch width values.
Average vs SD of mandibular inter-molar arch width post-treatment
0.000.501.001.502.002.503.003.504.004.505.00
25.00 30.00 35.00 40.00 45.00 50.00 55.00 60.00
Average
SD
Figure 10 Average vs. the Standard Deviation of the mandibular inter-molar post-treatment arch width values. Figures 9 and 10 show the average vs. the standard deviation for the three treatment
groups, and averages for males and females for the mandibular inter-molar pre-treatment
and post-treatment values from Tables 11 and 12. It is evident that there was mainly a
decrease in the average inter-molar widths post-treatment.
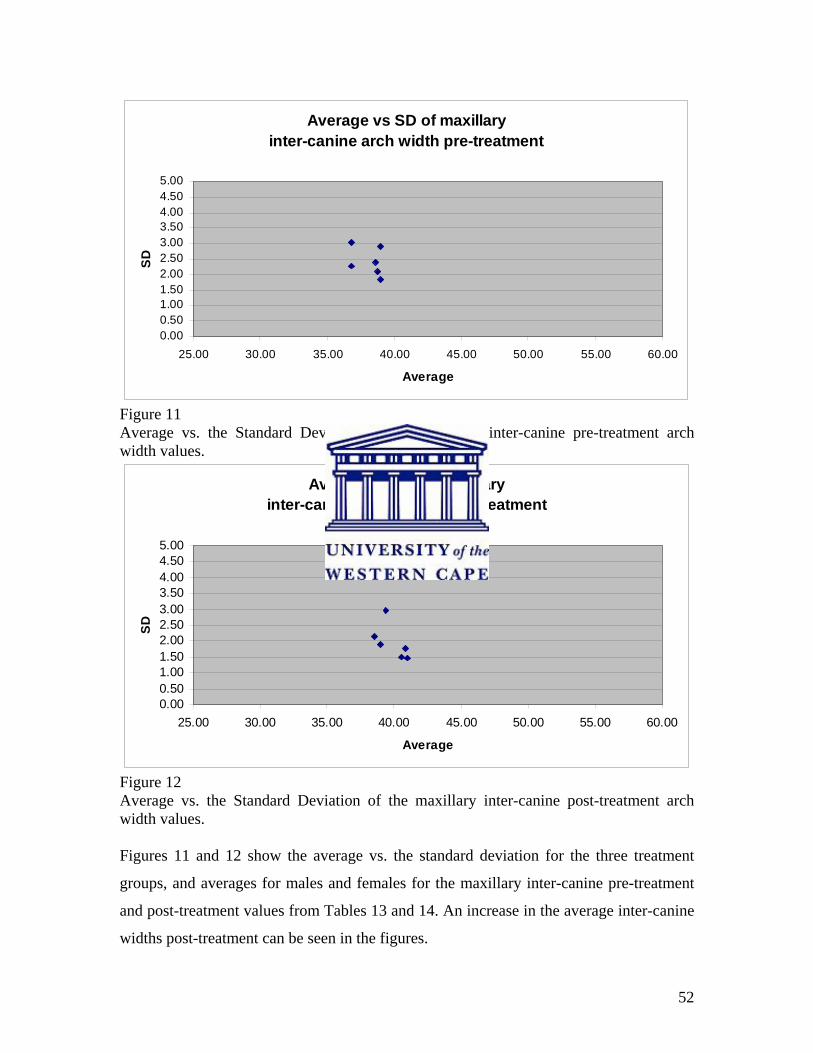
52
Average vs SD of maxillaryinter-canine arch width pre-treatment
0.000.501.001.502.002.503.003.504.004.505.00
25.00 30.00 35.00 40.00 45.00 50.00 55.00 60.00
Average
SD
Figure 11 Average vs. the Standard Deviation of the maxillary inter-canine pre-treatment arch width values.
Average vs SD of maxillaryinter-canine arch width post-treatment
0.000.501.001.502.002.503.003.504.004.505.00
25.00 30.00 35.00 40.00 45.00 50.00 55.00 60.00
Average
SD
Figure 12 Average vs. the Standard Deviation of the maxillary inter-canine post-treatment arch width values. Figures 11 and 12 show the average vs. the standard deviation for the three treatment
groups, and averages for males and females for the maxillary inter-canine pre-treatment
and post-treatment values from Tables 13 and 14. An increase in the average inter-canine
widths post-treatment can be seen in the figures.
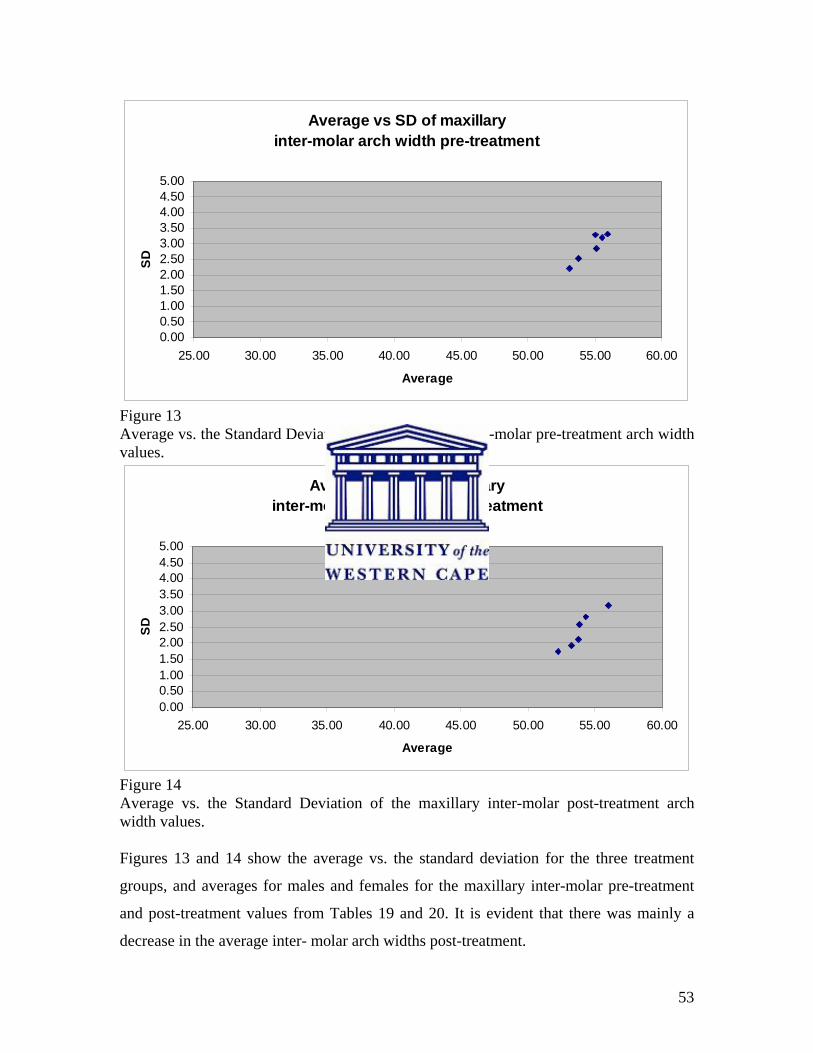
53
Average vs SD of maxillaryinter-molar arch width pre-treatment
0.000.501.001.502.002.503.003.504.004.505.00
25.00 30.00 35.00 40.00 45.00 50.00 55.00 60.00
Average
SD
Figure 13 Average vs. the Standard Deviation of the maxillary inter-molar pre-treatment arch width values.
Average vs SD of maxillaryinter-molar arch width post-treatment
0.000.501.001.502.002.503.003.504.004.505.00
25.00 30.00 35.00 40.00 45.00 50.00 55.00 60.00
Average
SD
Figure 14 Average vs. the Standard Deviation of the maxillary inter-molar post-treatment arch width values. Figures 13 and 14 show the average vs. the standard deviation for the three treatment
groups, and averages for males and females for the maxillary inter-molar pre-treatment
and post-treatment values from Tables 19 and 20. It is evident that there was mainly a
decrease in the average inter- molar arch widths post-treatment.

54
4.2.3 Average change in arch widths in the mandible
The descriptive and analytical statistics for the average changes in arch widths at the
inter-canine, inter-first premolar, inter-second premolar and inter-molar positions for the
mandible and maxilla for the three treatment groups are presented in Tables 21-28.
Inter-canine arch width: Table 21 and Figure 15
Group NE had an average arch width increase of 1.11mm. For Group 44 there was an
increase in average arch width of 2.07mm. In Group 45 there was in increase in average
arch width of 1.5mm. All these increases were statistically significant (p<0.05). In Group
44 the males showed an average increase of 0.89mm more than females in arch width.
The other two treatment groups showed almost similar values for both males and females.
The average inter-canine arch width increase was not statistically significant between
Group 44 and Group 45 (p>0.10).
Figure 15 shows the average changes in inter-canine arch width for the mandible for the
three treatment groups: Group NE, Group 44 and Group 45. All three treatment groups
showed an increase in average mandibular inter-canine arch width, with the two
extraction groups, Group 44 and Group 45, showing more of an increase compared with
Group NE.
Inter-first premolar arch width: Table 22
In group NE there was an average arch width increase of 1.55mm and group 45 showed
an average increase in arch width of 2.45mm (p<0.05). Group NE showed almost similar
values for both males and females. Group 45 showed an average increase of 0.74mm
more in arch width for the males.
.

55
Table 21 Descriptive and analytical statistics for the three treatment groups for the average change in arch width in mandibular inter-canine region. Group Group Group Gender Data 44 45 NE Total F Count 13 13 13 39 Average 1.62 1.33 0.97 1.31 Standard Deviation 1.56 1.52 0.99 1.37 Minimum -0.4 -1.0 -0.5 -1.0 Maximum 4.7 3.9 3.1 4.7 M Count 13 13 13 39 Average 2.51 1.68 1.24 1.81 Standard Deviation 1.52 1.32 1.15 1.41 Minimum 0.6 -1.1 -1.2 -1.2 Maximum 5.8 3.8 3.5 5.8 Count of both genders 26 26 26 78 Average 2.07 1.50 1.11 1.56 Standard Deviation 1.58 1.41 1.06 1.41 Minimum -0.4 -1.1 -1.2 -1.2 Maximum 5.8 3.9 3.5 5.8 Wilcoxon Signed rank sum test (p-value) 0.00001* 0.0002* 0.0002* Kruskal-Wallis test for Groups 44 and 45 (p-value) 0.3698 * = statistically significant at the 95% level of significance Table 22 Descriptive and analytical statistics for the two treatment groups for the average change in arch width in mandibular inter-first premolar region. Group Group Group Gender Data 44 45 NE Total F Count 13 13 26 Average 2.08 1.64 1.86 Standard Deviation 1.72 1.57 1.63 Minimum -0.5 -0.5 -0.5 Maximum 5.3 4.3 5.3 M Count 13 13 26 Average 2.82 1.46 2.14 Standard Deviation 1.89 2.31 2.18 Minimum -0.7 -2.4 -2.4 Maximum 5.9 7.5 7.5 Count of both genders 26 26 52 Average 2.45 1.55 2.00 Standard Deviation 1.81 1.94 1.91 Minimum -0.7 -2.4 -2.4 Maximum 5.9 7.5 7.5 Wilcoxon Signed rank sum test (p-value) 0.0001* 0.0002* Kruskal-Wallis test for Groups 44 and 45 (p-value) * = statistically significant at the 95% level of significance
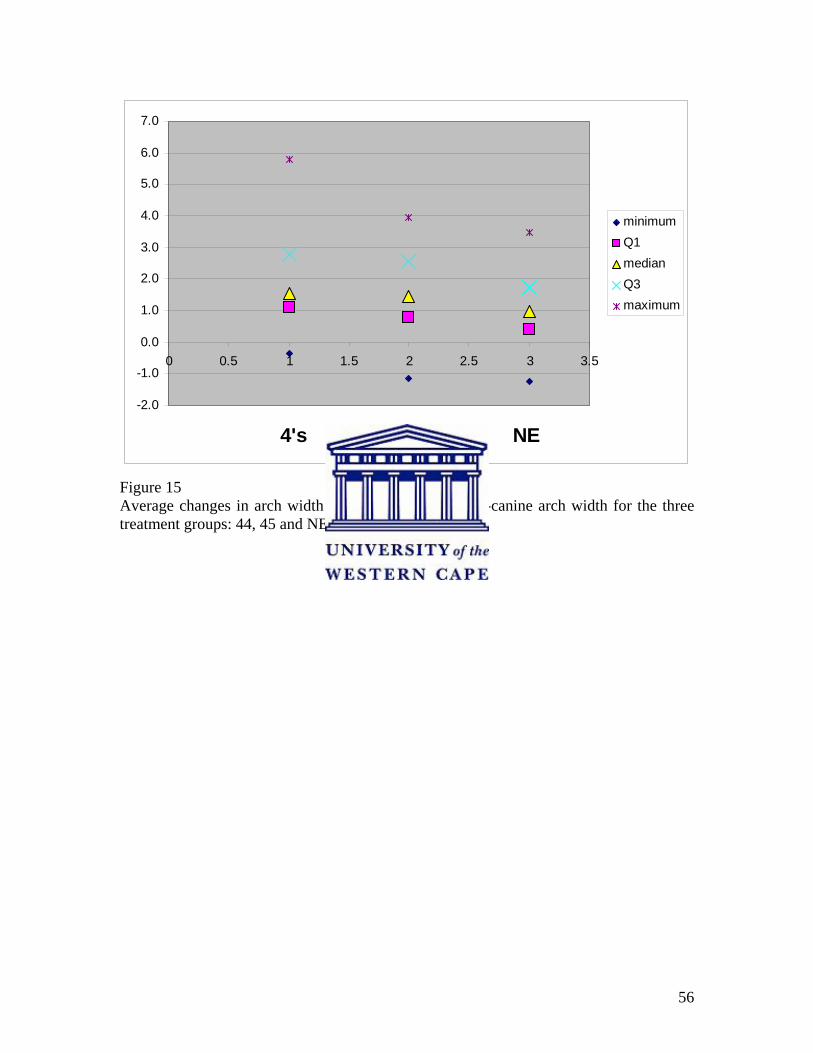
56
-2.0
-1.0
0.0
1.0
2.0
3.0
4.0
5.0
6.0
7.0
0 0.5 1 1.5 2 2.5 3 3.5
4's 4's&5's NE
minimumQ1medianQ3maximum
Figure 15 Average changes in arch width for the mandibular inter-canine arch width for the three treatment groups: 44, 45 and NE.

57
Inter-second premolar arch width: Table 23
Group NE had an average arch width increase of 0.93mm and in Group 44 there was a
decrease in average arch width of 1.66mm (p<0.05). Group NE showed an average of
0.52mm more increase in arch width for the males compared with females. Group 44
showed almost similar values for both males and females.
Inter-molar arch width: Table 24 and Figure 16
Group NE recorded an average arch width increase of 0.19mm. For Group 44 there was a
decrease in average arch width of 2.15mm. In Group 45 there was a decrease in average
arch width of 2.47mm. In Group 44 and Group 45 these decreases were statistically
significant (p<0.05). The average inter-molar arch width decrease was not statistically
significant however, between Group 44 and Group 45 (p>0.10). All three treatment
groups showed almost similar values for both males and females.
Figure 16 shows the average changes in arch width for the mandibular inter-molar region
for the three treatment groups: Group NE, Group 44 and Group 45. The two extraction
groups show a decrease in average arch width in the maxillary inter-molar area. Group 45
shows a greater decrease in average maxillary inter-molar arch width than did Group 44.

58
Table 23 Descriptive and analytical statistics for the two treatment groups for the average change in arch width in mandibular inter-second premolar region. Group Group Group Gender Data 44 45 NE Total F Count 13 13 26 Average -1.71 0.67 -0.52 Standard Deviation 2.16 1.41 2.16 Minimum -4.8 -1.4 -4.8 Maximum 2.4 2.4 2.4 M Count 13 13 26 Average -1.62 1.19 -0.21 Standard Deviation 2.12 1.90 2.44 Minimum -4.8 -1.1 -4.8 Maximum 1.7 5.7 5.7 Count of both genders 26 26 52 Average -1.66 0.93 -0.37 Standard Deviation 2.10 1.66 2.29 Minimum -4.8 -1.4 -4.8 Maximum 2.4 5.7 5.7 Wilcoxon Signed rank sum test (p-value) 0.0014* 0.0188* Kruskal-Wallis test for Groups 44 and 45 (p-value) * = statistically significant at the 95% level of significance Table 24 Descriptive and analytical statistics for the three treatment groups for the average change in arch width in mandibular inter-molar region. Group Group Group Gender Data 44 45 NE Total F Count 13 13 13 39 Average -2.14 -2.30 0.04 -1.47 Standard Deviation 1.08 1.41 1.22 1.63 Minimum -4.2 -4.9 -2.1 -4.9 Maximum 0.2 -0.3 2.5 2.5 M Count 13 13 13 39 Average -2.16 -2.63 0.33 -1.49 Standard Deviation 1.09 1.35 1.23 1.78 Minimum -4.4 -5.6 -1.3 -5.6 Maximum -0.6 -0.9 3.1 3.1 Count of both genders 26 26 26 78 Average -2.15 -2.47 0.19 -1.48 Standard Deviation 1.06 1.36 1.21 1.69 Minimum -4.4 -5.6 -2.1 -5.6 Maximum 0.2 -0.3 3.1 3.1 Wilcoxon Signed rank sum test (p-value) 0.0001* 0.0001* 0.501 Kruskal-Wallis test for Groups 44 and 45 (p-value) 0.453 * = statistically significant at the 95% level of significance
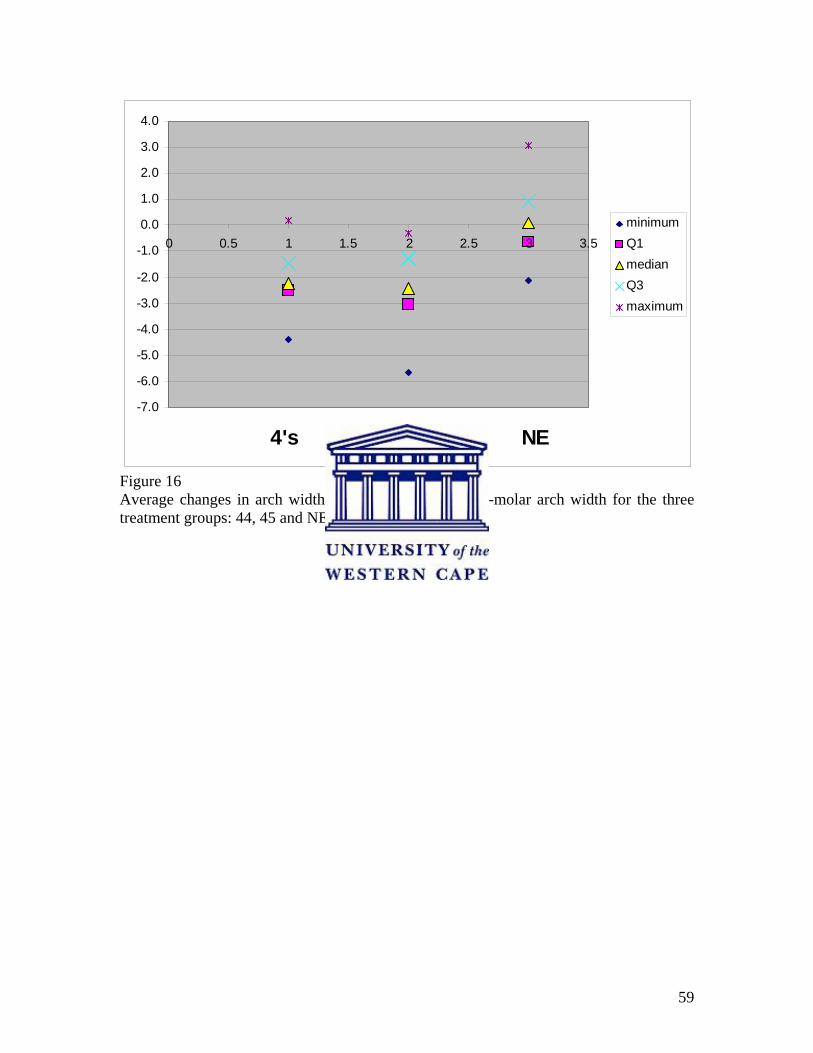
59
-7.0
-6.0
-5.0
-4.0
-3.0
-2.0
-1.0
0.0
1.0
2.0
3.0
4.0
0 0.5 1 1.5 2 2.5 3 3.5
4's 4's&5's NE
minimumQ1medianQ3maximum
Figure 16 Average changes in arch width for the mandibular inter-molar arch width for the three treatment groups: 44, 45 and NE.

60
4.2.4 Average change in arch widths in the maxilla
Inter-canine arch width: Table 25 and Figure 17
Group NE had an average arch width increase of 1.22mm, in Group 44 there was an
average increase in arch width of 1.84mm and in Group 45 there was an increase in
average arch width of 2.07mm. All these increases were statistically significant (p<0.05).
In Group NE the females had an average of about 1mm more arch width increase than the
males. The males and females had almost similar values for both the extraction groups.
The average inter-canine arch width increase was not significantly different between
Group 44 and Group 45 (p>0.10).
Figure 17 shows the average changes in arch width for the maxillary inter-canine region
for the three treatment groups: Group NE, Group 44 and Group 45. All three treatment
groups showed an increase in average maxillary inter-canine arch width, with the two
extraction groups, Group 44 and Group 45, showing more of an increase compared with
Group NE.
Inter-first premolar arch width: Table 26
Group NE had an average arch width increase of 2.64mm. This increase was statistically
significant (p<0.05). In Group NE there was an average of 0.58mm greater increase in the
male group.
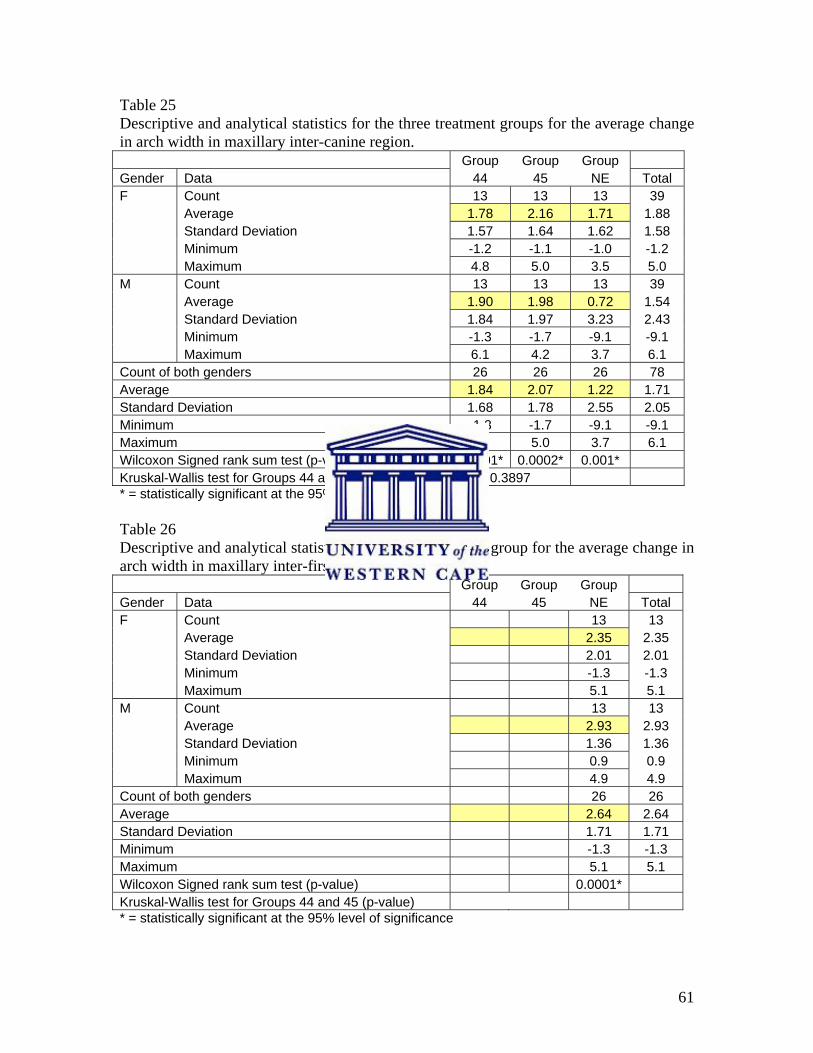
61
Table 25 Descriptive and analytical statistics for the three treatment groups for the average change in arch width in maxillary inter-canine region. Group Group Group Gender Data 44 45 NE Total F Count 13 13 13 39 Average 1.78 2.16 1.71 1.88 Standard Deviation 1.57 1.64 1.62 1.58 Minimum -1.2 -1.1 -1.0 -1.2 Maximum 4.8 5.0 3.5 5.0 M Count 13 13 13 39 Average 1.90 1.98 0.72 1.54 Standard Deviation 1.84 1.97 3.23 2.43 Minimum -1.3 -1.7 -9.1 -9.1 Maximum 6.1 4.2 3.7 6.1 Count of both genders 26 26 26 78 Average 1.84 2.07 1.22 1.71 Standard Deviation 1.68 1.78 2.55 2.05 Minimum -1.3 -1.7 -9.1 -9.1 Maximum 6.1 5.0 3.7 6.1 Wilcoxon Signed rank sum test (p-value) 0.0001* 0.0002* 0.001* Kruskal-Wallis test for Groups 44 and 45 (p-value) 0.3897 * = statistically significant at the 95% level of significance Table 26 Descriptive and analytical statistics for the NE treatment group for the average change in arch width in maxillary inter-first premolar region. Group Group Group Gender Data 44 45 NE Total F Count 13 13 Average 2.35 2.35 Standard Deviation 2.01 2.01 Minimum -1.3 -1.3 Maximum 5.1 5.1 M Count 13 13 Average 2.93 2.93 Standard Deviation 1.36 1.36 Minimum 0.9 0.9 Maximum 4.9 4.9 Count of both genders 26 26 Average 2.64 2.64 Standard Deviation 1.71 1.71 Minimum -1.3 -1.3 Maximum 5.1 5.1 Wilcoxon Signed rank sum test (p-value) 0.0001* Kruskal-Wallis test for Groups 44 and 45 (p-value) * = statistically significant at the 95% level of significance
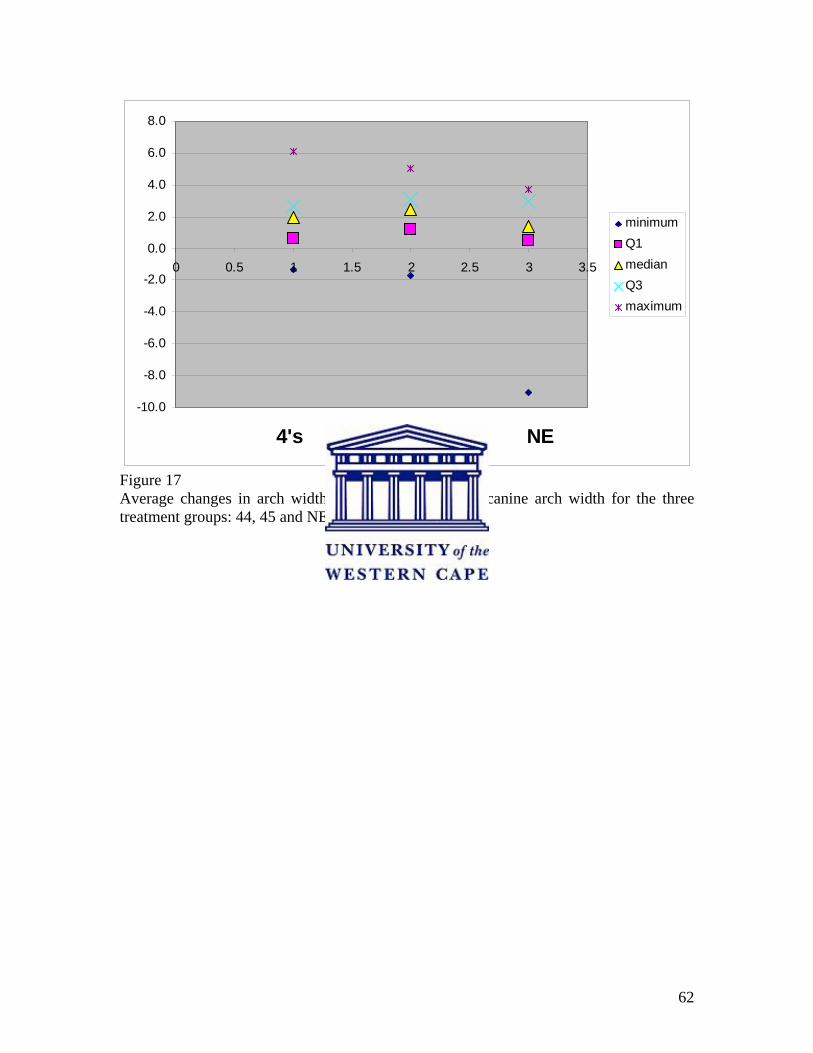
62
-10.0
-8.0
-6.0
-4.0
-2.0
0.0
2.0
4.0
6.0
8.0
0 0.5 1 1.5 2 2.5 3 3.5
4's 4's&5's NE
minimumQ1medianQ3maximum
Figure 17 Average changes in arch width for the maxillary inter-canine arch width for the three treatment groups: 44, 45 and NE.

63
Inter-second premolar arch width: Table 27
Group NE had an average arch width increase of 2.1mm. For Group 44 there was a
decrease in average arch width of 1.01mm. In Group 45 there was a decrease in average
arch width of 0.29mm. For Group NE and Group 44 these changes were statistically
significant (p<0.05). The average inter-second premolar arch width decrease was not
statistically significant between Group 44 and Group 45 (p>0.10). All three treatment
groups showed almost similar values for both males and females.
Inter-molar arch width: Table 28 and Figure 18
Group NE had an average arch width increase of 0.23mm. For Group 44 there was a
decrease in average arch width of 1.79mm. In Group 45 there was a decrease in arch
width of 1.09mm. For Group 44 and Group 45 these decreases were statistically
significant (p<0.05). For the maxillary inter-molar arch width, Group 44 showed a
significant more decrease in arch width compared with Group 45. The average inter-
molar arch width decrease was statistically significant between Group 44 and Group 45 at
the 90% level of significance (p<0.10). All three treatment groups showed almost similar
values for both males and females.
Figure 18 shows the average changes in arch width for the maxillary inter-molar region
for the 3 treatment groups: Group NE, Group 44 and Group 45. The two extraction
groups showed a decrease in average arch width in the maxillary inter-molar area. Group
44 shows a greater decrease in average maxillary inter-molar arch width than Group 45.
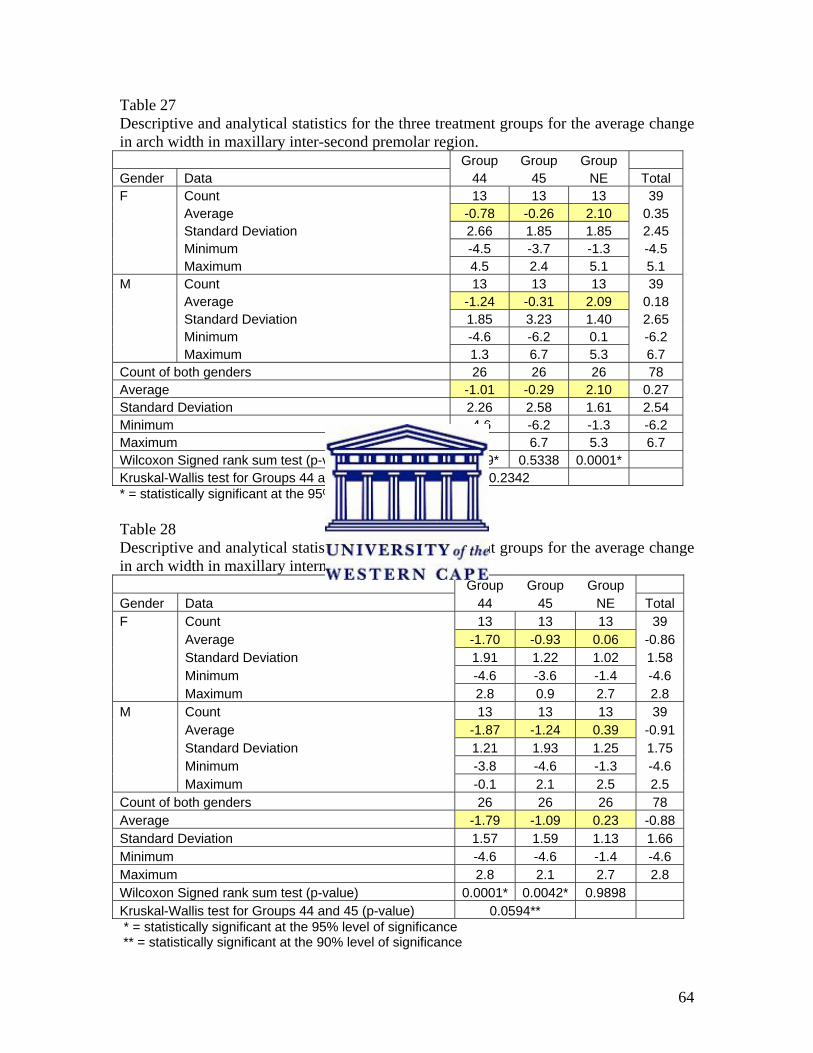
64
Table 27 Descriptive and analytical statistics for the three treatment groups for the average change in arch width in maxillary inter-second premolar region. Group Group Group Gender Data 44 45 NE Total F Count 13 13 13 39 Average -0.78 -0.26 2.10 0.35 Standard Deviation 2.66 1.85 1.85 2.45 Minimum -4.5 -3.7 -1.3 -4.5 Maximum 4.5 2.4 5.1 5.1 M Count 13 13 13 39 Average -1.24 -0.31 2.09 0.18 Standard Deviation 1.85 3.23 1.40 2.65 Minimum -4.6 -6.2 0.1 -6.2 Maximum 1.3 6.7 5.3 6.7 Count of both genders 26 26 26 78 Average -1.01 -0.29 2.10 0.27 Standard Deviation 2.26 2.58 1.61 2.54 Minimum -4.6 -6.2 -1.3 -6.2 Maximum 4.5 6.7 5.3 6.7 Wilcoxon Signed rank sum test (p-value) 0.049* 0.5338 0.0001* Kruskal-Wallis test for Groups 44 and 45 (p-value) 0.2342 * = statistically significant at the 95% level of significance Table 28 Descriptive and analytical statistics for the three treatment groups for the average change in arch width in maxillary intermolar region. Group Group Group Gender Data 44 45 NE Total F Count 13 13 13 39 Average -1.70 -0.93 0.06 -0.86 Standard Deviation 1.91 1.22 1.02 1.58 Minimum -4.6 -3.6 -1.4 -4.6 Maximum 2.8 0.9 2.7 2.8 M Count 13 13 13 39 Average -1.87 -1.24 0.39 -0.91 Standard Deviation 1.21 1.93 1.25 1.75 Minimum -3.8 -4.6 -1.3 -4.6 Maximum -0.1 2.1 2.5 2.5 Count of both genders 26 26 26 78 Average -1.79 -1.09 0.23 -0.88 Standard Deviation 1.57 1.59 1.13 1.66 Minimum -4.6 -4.6 -1.4 -4.6 Maximum 2.8 2.1 2.7 2.8 Wilcoxon Signed rank sum test (p-value) 0.0001* 0.0042* 0.9898 Kruskal-Wallis test for Groups 44 and 45 (p-value) 0.0594** * = statistically significant at the 95% level of significance ** = statistically significant at the 90% level of significance
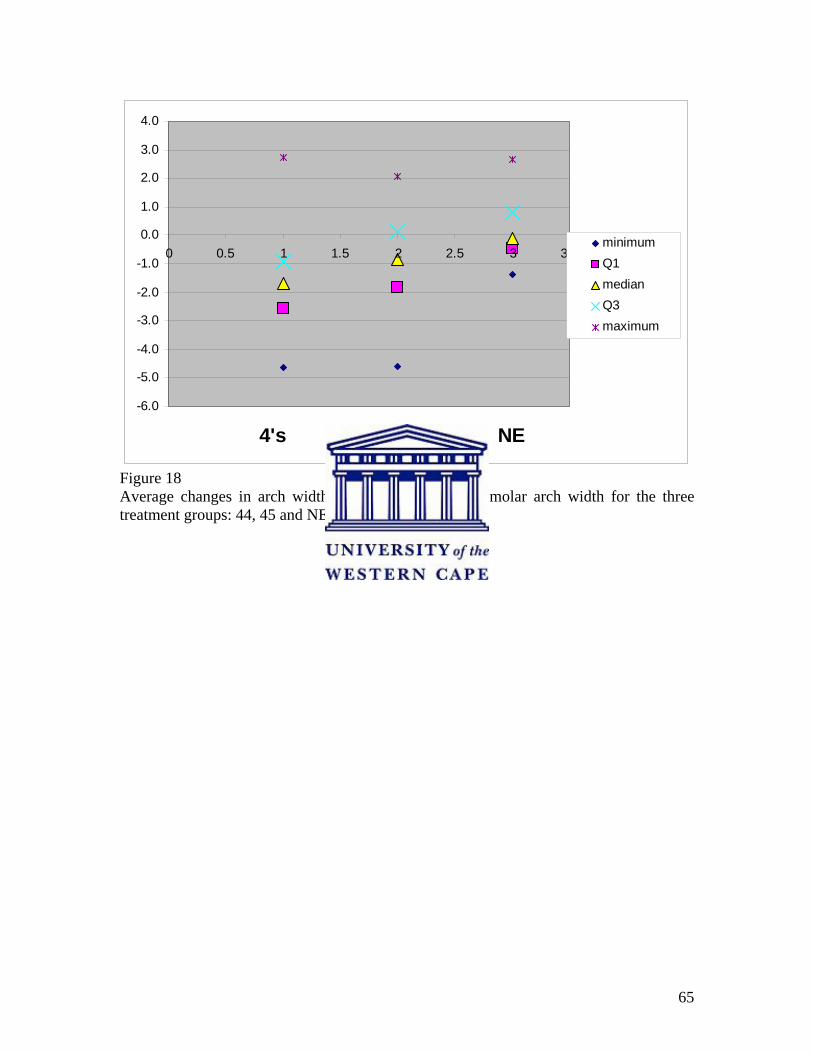
65
-6.0
-5.0
-4.0
-3.0
-2.0
-1.0
0.0
1.0
2.0
3.0
4.0
0 0.5 1 1.5 2 2.5 3 3.5
4's 4's&5's NE
minimumQ1medianQ3maximum
Figure 18 Average changes in arch width for the maxillary inter-molar arch width for the three treatment groups: 44, 45 and NE.
66
4.3 Arch length
The descriptive statistics for the pre- and post-treatment values of the average arch
lengths for the mandible and maxilla are presented in Tables 29 to 32.
4.3.1 Pre-treatment study model comparison of arch length
The male samples had a longer average arch length pre-treatment compared with the
female samples for all three treatment groups.
4.3.1.1 Mandibular arch length: Table 29
The female samples of the two extraction groups showed similar values for the average
arch length pre-treatment. Group NE had a shorter average arch length of +/- 1.30mm
compared with the two extraction groups in the female samples. In the male samples,
Group NE and Group 44 had similar values. In Group 45 the average arch length was +/-
2.9mm larger for the male sample.
For the combined averages Group 45 had the largest average arch length, with Group 44
showing an average of 1.38mm shorter and Group NE an average of 2.18mm shorter
compared with the Group 45.
4.3.1.2 Maxillary arch length: Table 31
In the female sample Group 44 had the largest average arch length, with Group NE an
average of 3.04mm shorter and Group 45 an average of 4.36mm shorter. The male
samples of Group NE and Group 45 had similar values. Group 44 had a longer average
arch length of +/-2.25mm in the male sample compared with the other two groups.

67
For the combined averages group 44 had the largest average arch length, with Group NE
an average of 2.64mm shorter and Group 45 an average of 3.41mm shorter in arch length
compared with the first group.
4.3.2 Post-treatment study model comparison of arch length
In Group NE and Group 45 the males had longer average arch lengths than females post-
treatment. Group 44 had almost similar values for the males and females.
4.3.2.1 Mandibular arch length: Table 30
The female group had a longer average arch length in Group 44 and the males had a
longer average arch length in Group 45. Group NE had a longer average arch length in
the male sample. For the two extraction groups the combined averages had almost similar
values.
4.3.2.2 Maxillary arch length: Table 32
Of the two extraction groups, Group 45 had the shortest average arch length in both the
female and male groups. In Group 44 the male and female samples had almost similar
values whereas the male group had a larger average arch length in Group 45. In Group
NE the males had a longer average arch length. Group 45 had the shortest average in the
combined averages.
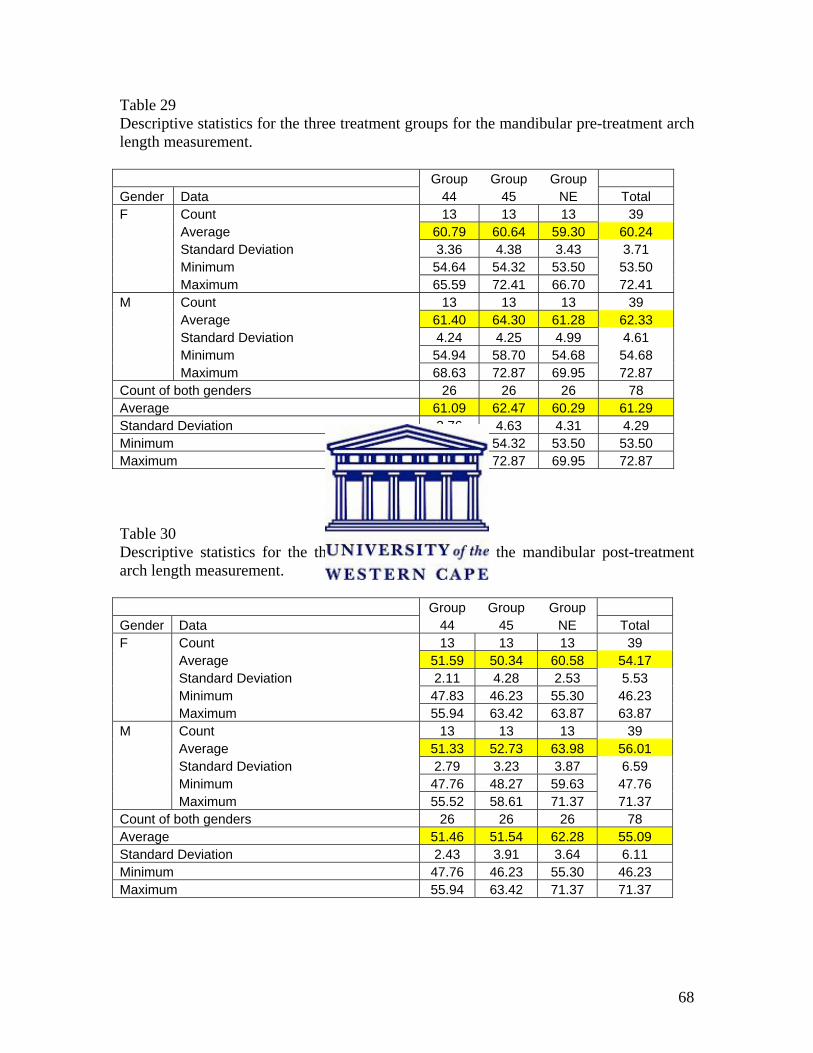
68
Table 29 Descriptive statistics for the three treatment groups for the mandibular pre-treatment arch length measurement. Group Group Group Gender Data 44 45 NE Total F Count 13 13 13 39 Average 60.79 60.64 59.30 60.24 Standard Deviation 3.36 4.38 3.43 3.71 Minimum 54.64 54.32 53.50 53.50 Maximum 65.59 72.41 66.70 72.41 M Count 13 13 13 39 Average 61.40 64.30 61.28 62.33 Standard Deviation 4.24 4.25 4.99 4.61 Minimum 54.94 58.70 54.68 54.68 Maximum 68.63 72.87 69.95 72.87 Count of both genders 26 26 26 78 Average 61.09 62.47 60.29 61.29 Standard Deviation 3.76 4.63 4.31 4.29 Minimum 54.64 54.32 53.50 53.50 Maximum 68.63 72.87 69.95 72.87 Table 30 Descriptive statistics for the three treatment groups for the mandibular post-treatment arch length measurement. Group Group Group Gender Data 44 45 NE Total F Count 13 13 13 39 Average 51.59 50.34 60.58 54.17 Standard Deviation 2.11 4.28 2.53 5.53 Minimum 47.83 46.23 55.30 46.23 Maximum 55.94 63.42 63.87 63.87 M Count 13 13 13 39 Average 51.33 52.73 63.98 56.01 Standard Deviation 2.79 3.23 3.87 6.59 Minimum 47.76 48.27 59.63 47.76 Maximum 55.52 58.61 71.37 71.37 Count of both genders 26 26 26 78 Average 51.46 51.54 62.28 55.09 Standard Deviation 2.43 3.91 3.64 6.11 Minimum 47.76 46.23 55.30 46.23 Maximum 55.94 63.42 71.37 71.37
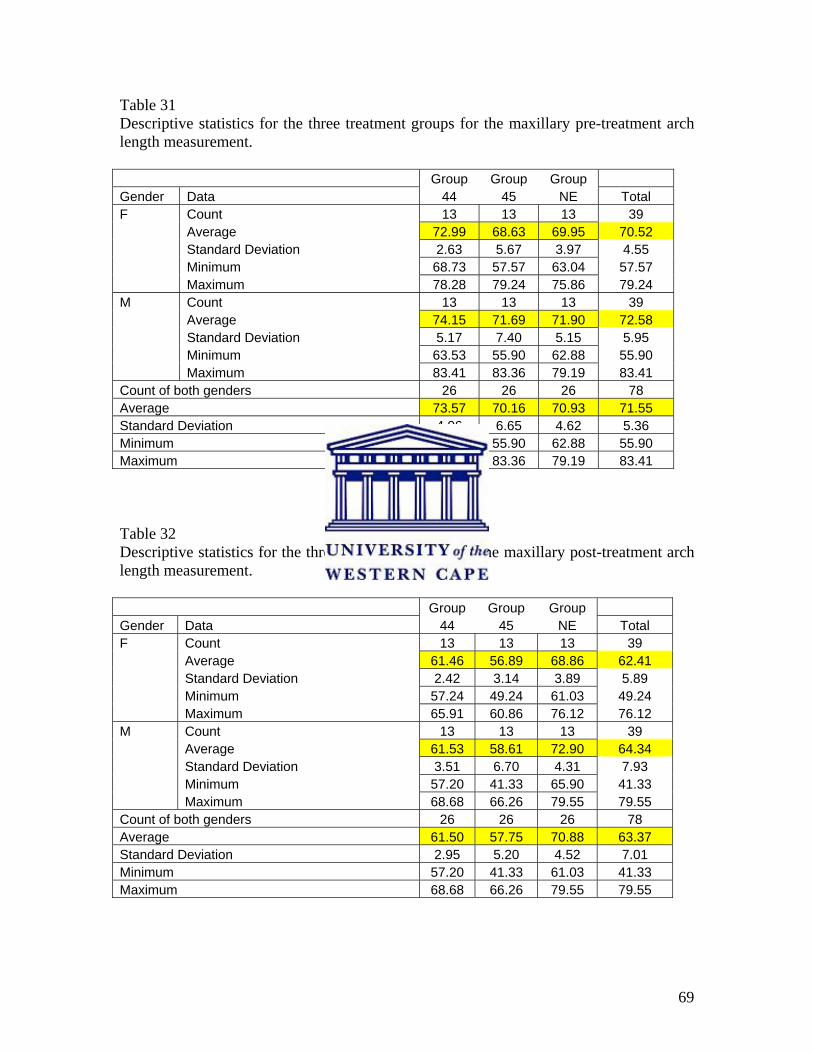
69
Table 31 Descriptive statistics for the three treatment groups for the maxillary pre-treatment arch length measurement. Group Group Group Gender Data 44 45 NE Total F Count 13 13 13 39 Average 72.99 68.63 69.95 70.52 Standard Deviation 2.63 5.67 3.97 4.55 Minimum 68.73 57.57 63.04 57.57 Maximum 78.28 79.24 75.86 79.24 M Count 13 13 13 39 Average 74.15 71.69 71.90 72.58 Standard Deviation 5.17 7.40 5.15 5.95 Minimum 63.53 55.90 62.88 55.90 Maximum 83.41 83.36 79.19 83.41 Count of both genders 26 26 26 78 Average 73.57 70.16 70.93 71.55 Standard Deviation 4.06 6.65 4.62 5.36 Minimum 63.53 55.90 62.88 55.90 Maximum 83.41 83.36 79.19 83.41 Table 32 Descriptive statistics for the three treatment groups for the maxillary post-treatment arch length measurement. Group Group Group Gender Data 44 45 NE Total F Count 13 13 13 39 Average 61.46 56.89 68.86 62.41 Standard Deviation 2.42 3.14 3.89 5.89 Minimum 57.24 49.24 61.03 49.24 Maximum 65.91 60.86 76.12 76.12 M Count 13 13 13 39 Average 61.53 58.61 72.90 64.34 Standard Deviation 3.51 6.70 4.31 7.93 Minimum 57.20 41.33 65.90 41.33 Maximum 68.68 66.26 79.55 79.55 Count of both genders 26 26 26 78 Average 61.50 57.75 70.88 63.37 Standard Deviation 2.95 5.20 4.52 7.01 Minimum 57.20 41.33 61.03 41.33 Maximum 68.68 66.26 79.55 79.55
70
4.3.3 Pre- and Post-treatment Average vs. Standard Deviation of the three treatment
groups for arch length in the mandibular and maxillary arches
Figures 19, 20, 21 and 22 plots the average against the standard deviation (SD) for the
three groups of treatment based on the averages for males and females of the arch length
of the mandible and maxilla, pre- and post-treatment, from Tables 29, 30, 31 and 32.
Post-treatment Group NE showed an increase in mandibular average arch length and
almost unchanged maxillary average arch length. For Group 44 and Group 45 the average
arch length decreased in both the mandible and maxilla.
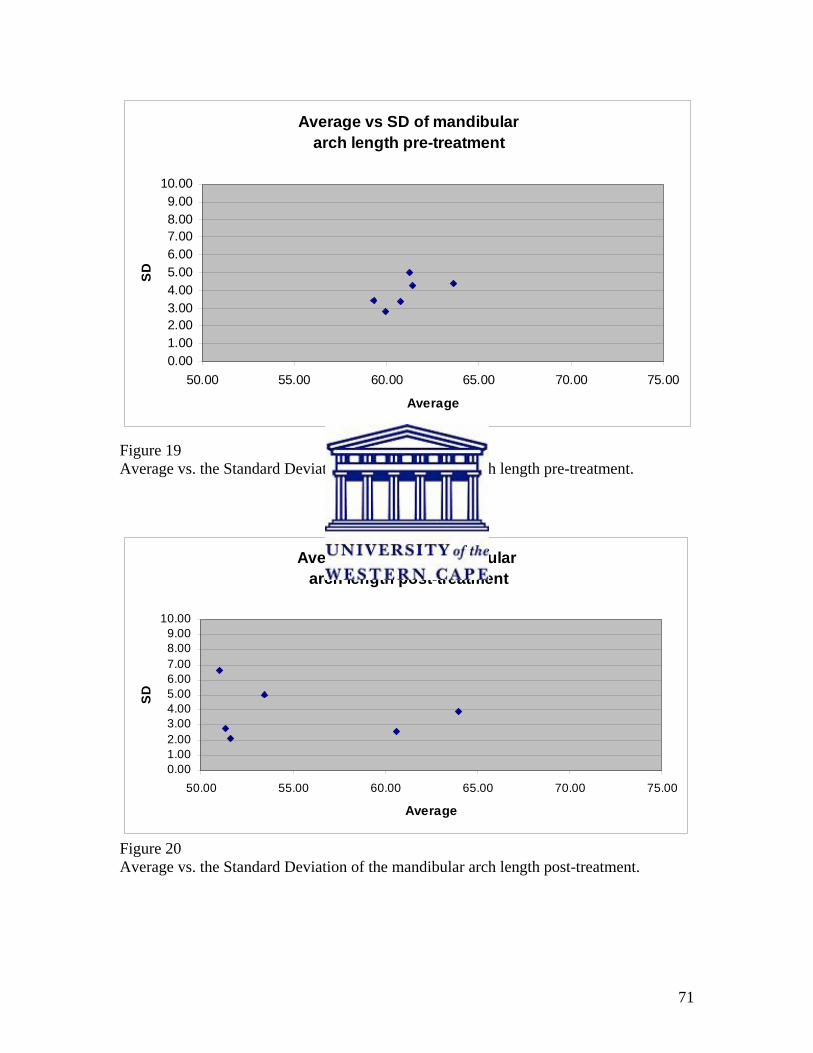
71
Average vs SD of mandibulararch length pre-treatment
0.001.002.003.004.005.006.007.008.009.00
10.00
50.00 55.00 60.00 65.00 70.00 75.00
Average
SD
Figure 19 Average vs. the Standard Deviation of the mandibular arch length pre-treatment.
Average vs SD of mandibular arch length post-treatment
0.001.002.003.004.005.006.007.008.009.00
10.00
50.00 55.00 60.00 65.00 70.00 75.00
Average
SD
Figure 20 Average vs. the Standard Deviation of the mandibular arch length post-treatment.
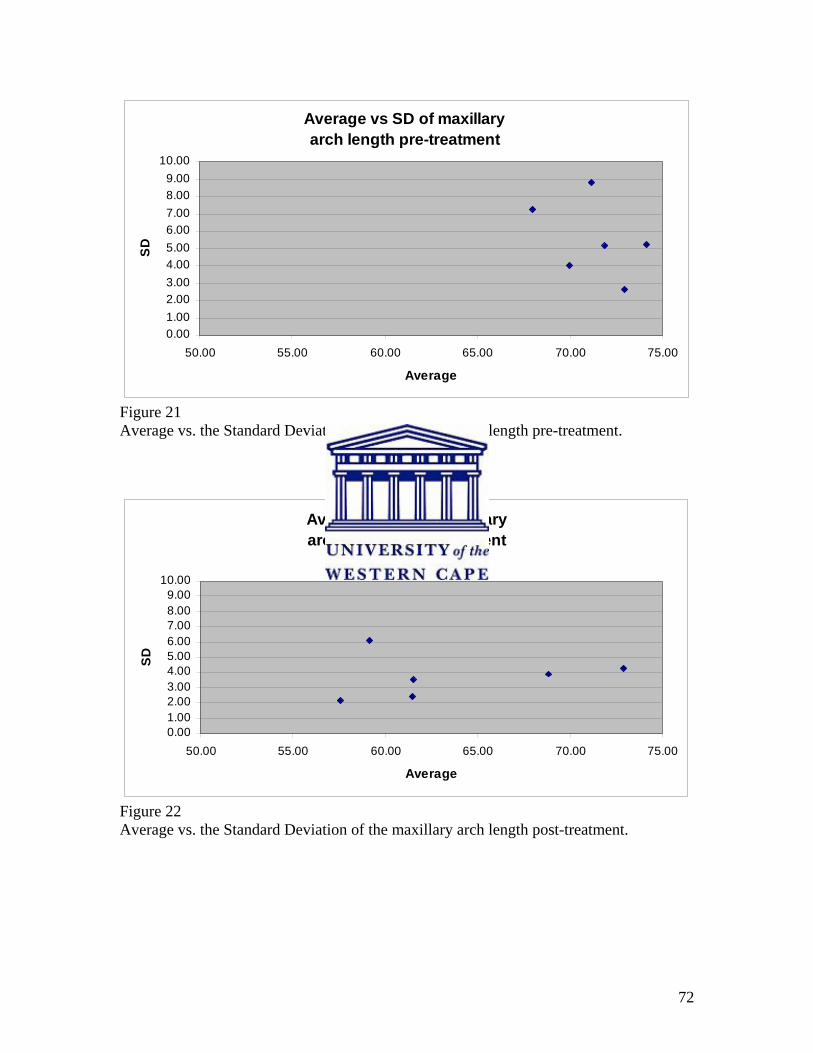
72
Average vs SD of maxillary arch length pre-treatment
0.001.002.003.004.005.006.007.008.009.00
10.00
50.00 55.00 60.00 65.00 70.00 75.00
Average
SD
Figure 21 Average vs. the Standard Deviation of the maxillary arch length pre-treatment.
Average vs SD of maxillaryarch length post-treatment
0.001.002.003.004.005.006.007.008.009.00
10.00
50.00 55.00 60.00 65.00 70.00 75.00
Average
SD
Figure 22 Average vs. the Standard Deviation of the maxillary arch length post-treatment.

73
4.3.4 Average change in arch length
The descriptive and analytical statistics for the average change in arch length for the
mandible and maxilla for the three treatment groups are presented in Tables 33 and 34.
4.3.4.1 Mandible: Table 33
Group NE had an average arch length increase of 1.99mm. For Group 44 there was a
decrease in average arch length of 9.64mm and in Group 45 there was a decrease in
average arch length of 10.93mm. The increase in Group NE and decreases in Group 44
and Group 45 were statistically significant (p<0.05). For Group NE there was a greater
average arch length increase in the males, compared with the females. In the two
extraction groups the males had greater average arch length decreases than the females.
The average mandibular arch length decrease was not statistically significant between
Group 44 and Group 45 (p>0.05).
4.3.4.2 Maxilla: Table 34
Group NE had an average arch length decrease of 0.05mm. For Group 44 there was a
decrease in average arch length of 12.07mm. In Group 45 there was a decrease in average
arch length of 12.41mm. The decreases in Group 44 and Group 45 were statistically
significant (p<0.05). For Group NE the males and females showed almost similar values.
The two extraction groups showed a greater average arch length decrease for the males
compared with the females. The average maxillary arch length decrease was not
significantly different between Group 44 and Group 45 (p>0.05).
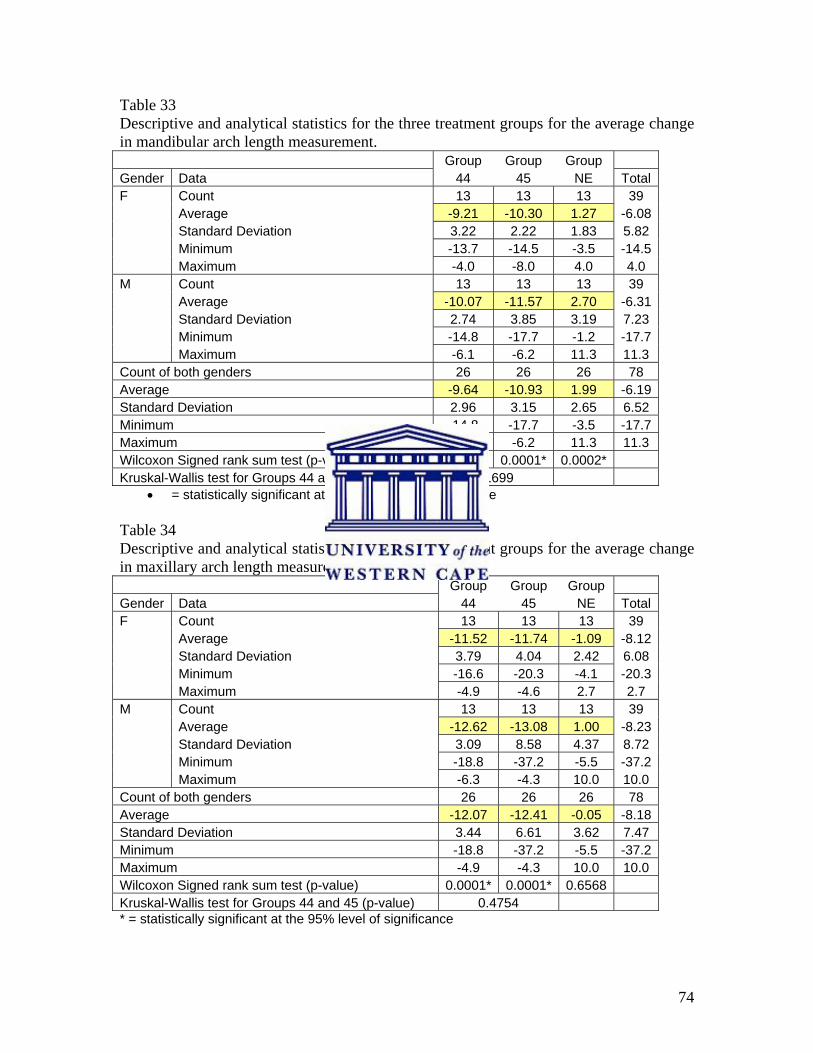
74
Table 33 Descriptive and analytical statistics for the three treatment groups for the average change in mandibular arch length measurement. Group Group Group Gender Data 44 45 NE Total F Count 13 13 13 39 Average -9.21 -10.30 1.27 -6.08 Standard Deviation 3.22 2.22 1.83 5.82 Minimum -13.7 -14.5 -3.5 -14.5 Maximum -4.0 -8.0 4.0 4.0 M Count 13 13 13 39 Average -10.07 -11.57 2.70 -6.31 Standard Deviation 2.74 3.85 3.19 7.23 Minimum -14.8 -17.7 -1.2 -17.7 Maximum -6.1 -6.2 11.3 11.3 Count of both genders 26 26 26 78 Average -9.64 -10.93 1.99 -6.19 Standard Deviation 2.96 3.15 2.65 6.52 Minimum -14.8 -17.7 -3.5 -17.7 Maximum -4.0 -6.2 11.3 11.3 Wilcoxon Signed rank sum test (p-value) 0.0001* 0.0001* 0.0002* Kruskal-Wallis test for Groups 44 and 45 (p-value) 0.1699
• = statistically significant at the 95% level of significance
Table 34 Descriptive and analytical statistics for the three treatment groups for the average change in maxillary arch length measurement. Group Group Group Gender Data 44 45 NE Total F Count 13 13 13 39 Average -11.52 -11.74 -1.09 -8.12 Standard Deviation 3.79 4.04 2.42 6.08 Minimum -16.6 -20.3 -4.1 -20.3 Maximum -4.9 -4.6 2.7 2.7 M Count 13 13 13 39 Average -12.62 -13.08 1.00 -8.23 Standard Deviation 3.09 8.58 4.37 8.72 Minimum -18.8 -37.2 -5.5 -37.2 Maximum -6.3 -4.3 10.0 10.0 Count of both genders 26 26 26 78 Average -12.07 -12.41 -0.05 -8.18 Standard Deviation 3.44 6.61 3.62 7.47 Minimum -18.8 -37.2 -5.5 -37.2 Maximum -4.9 -4.3 10.0 10.0 Wilcoxon Signed rank sum test (p-value) 0.0001* 0.0001* 0.6568 Kruskal-Wallis test for Groups 44 and 45 (p-value) 0.4754 * = statistically significant at the 95% level of significance
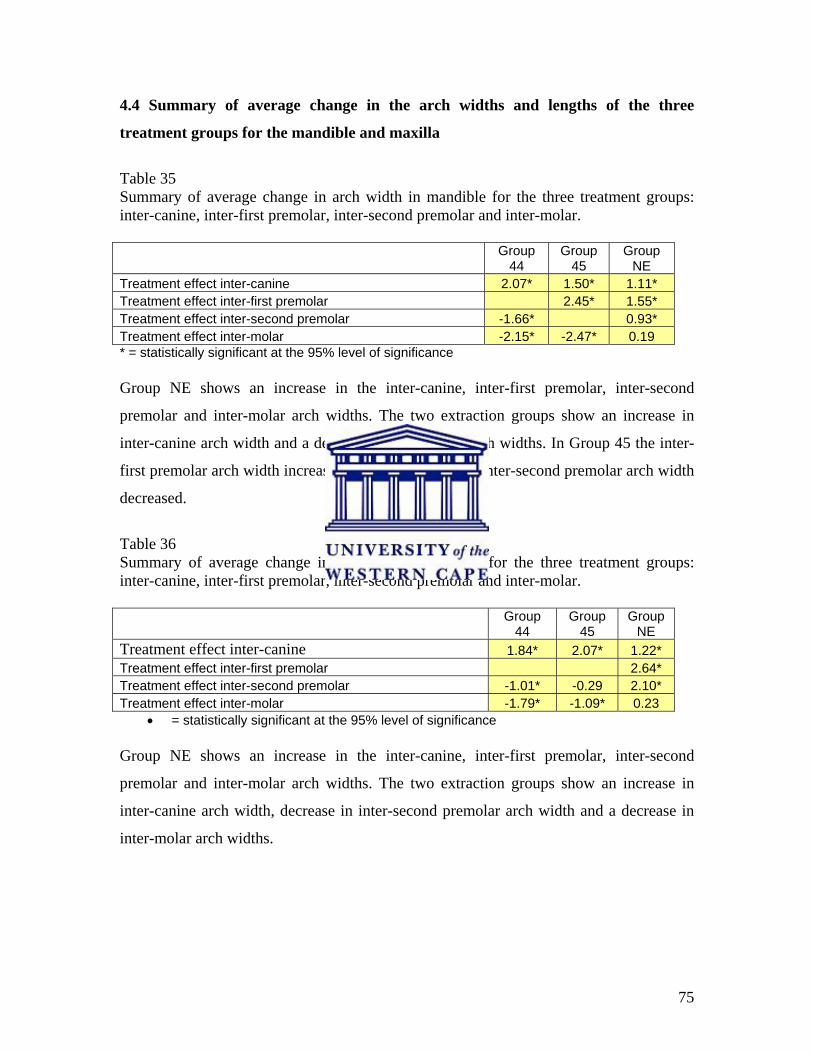
75
4.4 Summary of average change in the arch widths and lengths of the three
treatment groups for the mandible and maxilla
Table 35 Summary of average change in arch width in mandible for the three treatment groups: inter-canine, inter-first premolar, inter-second premolar and inter-molar.
Group
44 Group
45 Group
NE Treatment effect inter-canine 2.07* 1.50* 1.11* Treatment effect inter-first premolar 2.45* 1.55* Treatment effect inter-second premolar -1.66* 0.93* Treatment effect inter-molar -2.15* -2.47* 0.19 * = statistically significant at the 95% level of significance Group NE shows an increase in the inter-canine, inter-first premolar, inter-second
premolar and inter-molar arch widths. The two extraction groups show an increase in
inter-canine arch width and a decrease in inter-molar arch widths. In Group 45 the inter-
first premolar arch width increased and in Group 44 the inter-second premolar arch width
decreased.
Table 36 Summary of average change in arch width in maxilla for the three treatment groups: inter-canine, inter-first premolar, inter-second premolar and inter-molar.
Group
44 Group
45 Group
NE Treatment effect inter-canine 1.84* 2.07* 1.22* Treatment effect inter-first premolar 2.64* Treatment effect inter-second premolar -1.01* -0.29 2.10* Treatment effect inter-molar -1.79* -1.09* 0.23
• = statistically significant at the 95% level of significance
Group NE shows an increase in the inter-canine, inter-first premolar, inter-second
premolar and inter-molar arch widths. The two extraction groups show an increase in
inter-canine arch width, decrease in inter-second premolar arch width and a decrease in
inter-molar arch widths.

76
Table 37 Summary of average change in arch length for the three treatment groups: Mandible and Maxilla.
Group
44 Group
45 Group
NE Average change in Arch length Mandible -9.64* -10.93* 1.99* Average change in Arch length Maxilla -12.07* -12.41* -0.05 * = statistically significant at the 95% level of significance Group NE show an increase in mandibular arch length and the maxillary arch length
essentially unchanged. Both extraction groups show a decrease in arch length for both the
mandible and maxilla.

77
4.5 Comparisons of the 3 study groups tested for level of significance.
Table 38 shows the Kruskal-Wallis test values for the different average arch width
measurements as well as the average arch length measurements in the three treatment
groups. The three groups of treatment were compared with each other, to determine
whether the treatment was statistically significant or not for the arch width and arch
length measurements. Significant effect is indicated with a p-value less than 0.05.
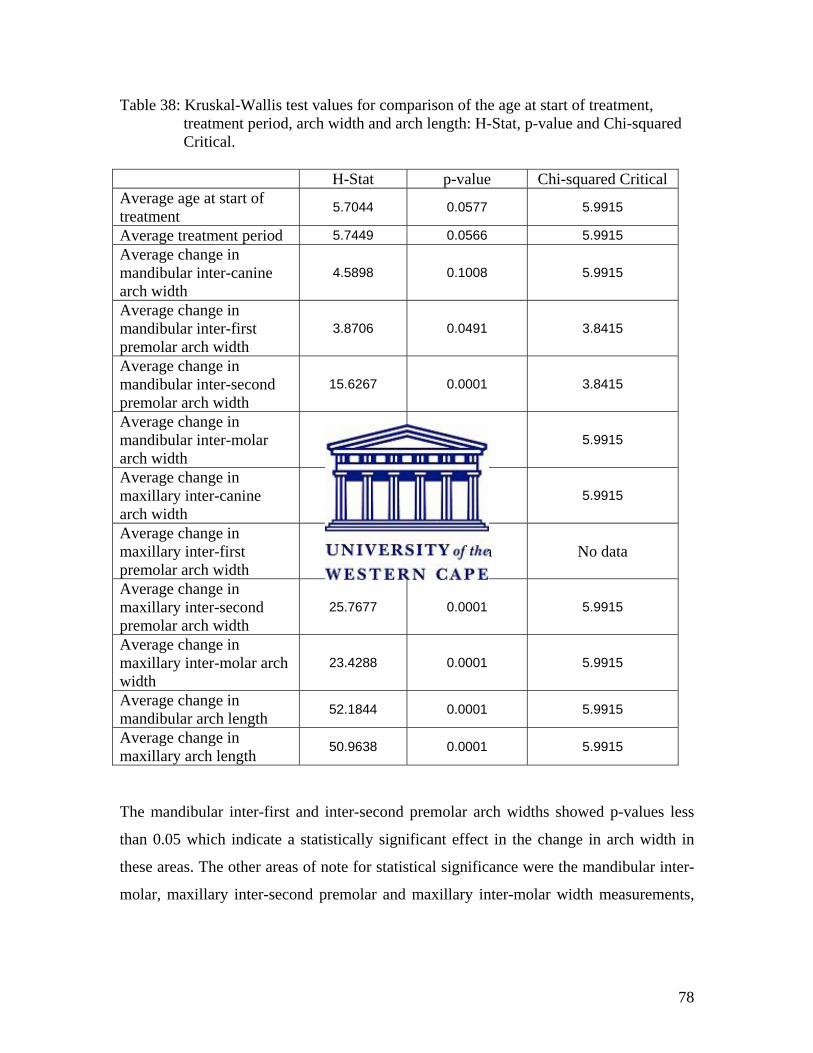
78
Table 38: Kruskal-Wallis test values for comparison of the age at start of treatment, treatment period, arch width and arch length: H-Stat, p-value and Chi-squared Critical. H-Stat p-value Chi-squared Critical Average age at start of treatment 5.7044 0.0577 5.9915
Average treatment period 5.7449 0.0566 5.9915 Average change in mandibular inter-canine arch width
4.5898 0.1008 5.9915
Average change in mandibular inter-first premolar arch width
3.8706 0.0491 3.8415
Average change in mandibular inter-second premolar arch width
15.6267 0.0001 3.8415
Average change in mandibular inter-molar arch width
41.1353 0.0001 5.9915
Average change in maxillary inter-canine arch width
1.6513 0.438 5.9915
Average change in maxillary inter-first premolar arch width
No data No data No data
Average change in maxillary inter-second premolar arch width
25.7677 0.0001 5.9915
Average change in maxillary inter-molar arch width
23.4288 0.0001 5.9915
Average change in mandibular arch length 52.1844 0.0001 5.9915
Average change in maxillary arch length 50.9638 0.0001 5.9915
The mandibular inter-first and inter-second premolar arch widths showed p-values less
than 0.05 which indicate a statistically significant effect in the change in arch width in
these areas. The other areas of note for statistical significance were the mandibular inter-
molar, maxillary inter-second premolar and maxillary inter-molar width measurements,

79
which show a very small p-value of 0.0001. For the arch length data both the mandibular
and maxillary p-values are 0.0001, indicating highly significant differences.
For the average age at start of treatment and average treatment period the p-values were
just more than 0.05, reflecting a comparison between the means.
80
4.6 Correlation analyses
4.6.1 Correlation analyses of non-extraction group (Group NE): Table 39
In Group NE there was a strong correlation between the arch width changes in the
mandibular inter-first premolar area and the arch width changes in the mandibular inter-
canine area. Changes in the arch width in the mandibular inter-second premolar area and
the mandibular inter-first premolar area were also strongly correlated. In the maxillary
arch the changes in the arch width of the maxillary inter-second premolar and maxillary
inter-first premolar areas showed strong correlation. The changes in the arch length in the
maxilla were strongly correlated with the changes in the arch length in the mandible. The
correlation coefficient values were all above 0.6.
4.6.2 Correlation analyses of upper and lower first premolar extraction group
(Group 44): Table 40
In Group 44 the arch width changes of the maxillary inter-canine area were strongly
correlated with the changes in arch width of the mandibular inter-canine area. The arch
width changes of the maxillary inter-second premolar showed strong correlation with the
arch width changes of the mandibular inter-second premolar area. All had correlation
coefficient values above 0.6.
4.6.3 Correlation analyses of upper first and lower second premolar extraction group
(Group 45): Table 41
In Group 45 there was strong correlation between the arch width changes in the maxillary
inter-second premolar and mandibular inter-canine area. The arch width changes of the
maxillary inter-second premolar also showed strong correlation with the arch width
changes in the mandibular inter-first premolar area. The arch width changes in the
maxillary inter-molar area showed strong correlation with the arch width changes in the
mandibular inter-molar area. The arch width changes of the maxillary inter-molar area

81
also showed strong correlation with the arch width changes in the maxillary inter-second
premolar area. The changes in the arch length in the maxilla showed strong correlation
with the changes in the arch length in the mandible. All these comparisons had
correlation coefficient values above 0.6.
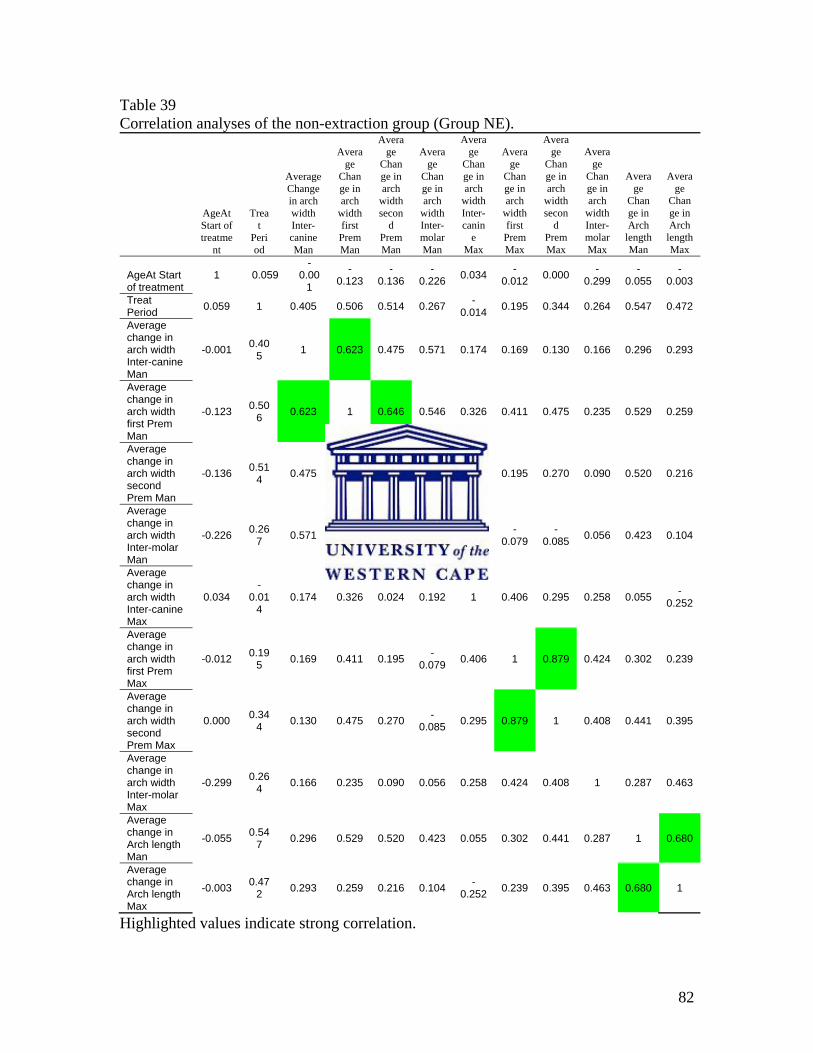
82
Table 39 Correlation analyses of the non-extraction group (Group NE).
AgeAt Start of treatme
nt
Treat
Period
Average Change in arch width Inter-canine Man
Average
Change in arch
width first PremMan
Average
Change in arch
width secon
d Prem Man
Average
Change in arch
width Inter-molar Man
Average
Change in arch
width Inter-canin
e Max
Average
Change in arch
width first Prem Max
Average
Change in arch
width secon
d Prem Max
Average
Change in arch
width Inter-molar Max
Average
Change in Arch
length Man
Average
Change in Arch
length Max
AgeAt Start of treatment
1 0.059 -
0.001
-0.123
-0.136
-0.226 0.034 -
0.012 0.000 -0.299
-0.055
-0.003
Treat Period 0.059 1 0.405 0.506 0.514 0.267 -
0.014 0.195 0.344 0.264 0.547 0.472
Average change in arch width Inter-canine Man
-0.001 0.405 1 0.623 0.475 0.571 0.174 0.169 0.130 0.166 0.296 0.293
Average change in arch width first Prem Man
-0.123 0.506 0.623 1 0.646 0.546 0.326 0.411 0.475 0.235 0.529 0.259
Average change in arch width second Prem Man
-0.136 0.514 0.475 0.646 1 0.585 0.024 0.195 0.270 0.090 0.520 0.216
Average change in arch width Inter-molar Man
-0.226 0.267 0.571 0.546 0.585 1 0.192 -
0.079 -
0.085 0.056 0.423 0.104
Average change in arch width Inter-canine Max
0.034 -
0.014
0.174 0.326 0.024 0.192 1 0.406 0.295 0.258 0.055 -0.252
Average change in arch width first Prem Max
-0.012 0.195 0.169 0.411 0.195 -
0.079 0.406 1 0.879 0.424 0.302 0.239
Average change in arch width second Prem Max
0.000 0.344 0.130 0.475 0.270 -
0.085 0.295 0.879 1 0.408 0.441 0.395
Average change in arch width Inter-molar Max
-0.299 0.264 0.166 0.235 0.090 0.056 0.258 0.424 0.408 1 0.287 0.463
Average change in Arch length Man
-0.055 0.547 0.296 0.529 0.520 0.423 0.055 0.302 0.441 0.287 1 0.680
Average change in Arch length Max
-0.003 0.472 0.293 0.259 0.216 0.104 -
0.252 0.239 0.395 0.463 0.680 1
Highlighted values indicate strong correlation.
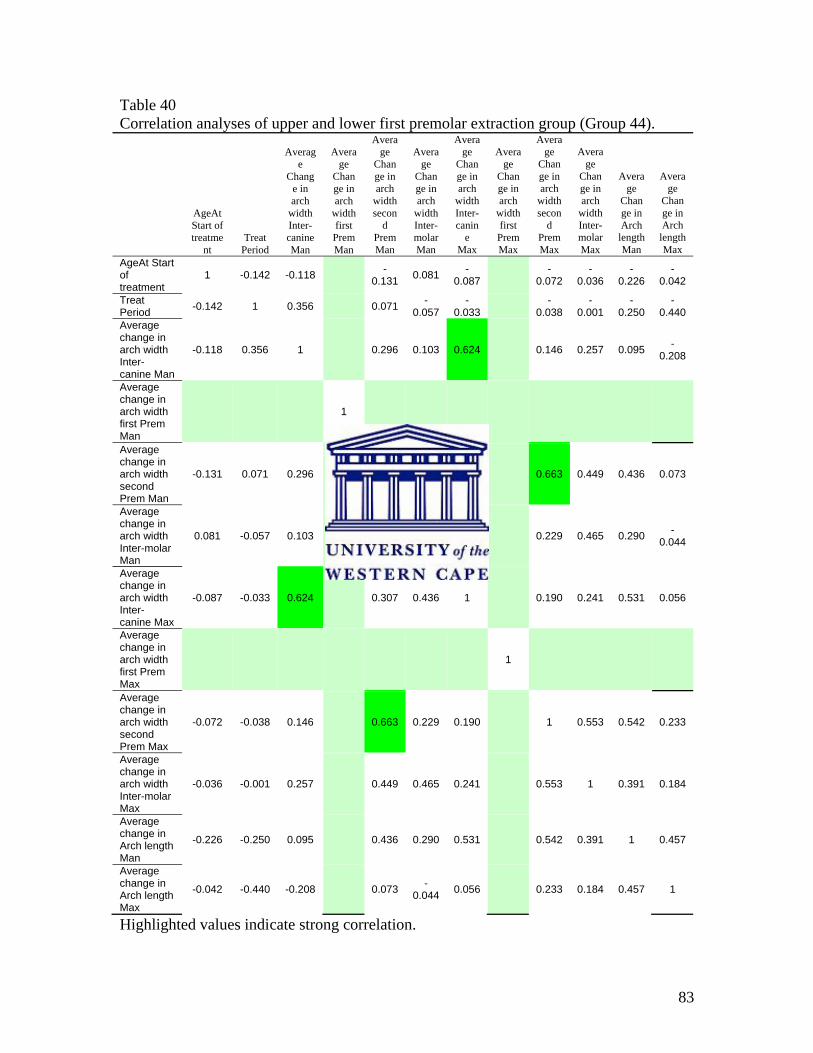
83
Table 40 Correlation analyses of upper and lower first premolar extraction group (Group 44).
AgeAt Start of treatme
nt Treat
Period
Average
Change in arch
width Inter-canine Man
Average
Change in arch
width first PremMan
Average
Change in arch
width secon
d Prem Man
Average
Change in arch
width Inter-molar Man
Average
Change in arch
width Inter-canin
e Max
Average
Change in arch
width first Prem Max
Average
Change in arch
width secon
d Prem Max
Average
Change in arch
width Inter-molar Max
Average
Change in Arch
length Man
Average
Change in Arch
length Max
AgeAt Start of treatment
1 -0.142 -0.118 -0.131 0.081 -
0.087 -0.072
-0.036
-0.226
-0.042
Treat Period -0.142 1 0.356 0.071 -
0.057 -
0.033 -0.038
-0.001
-0.250
-0.440
Average change in arch width Inter-canine Man
-0.118 0.356 1 0.296 0.103 0.624 0.146 0.257 0.095 -0.208
Average change in arch width first Prem Man
1
Average change in arch width second Prem Man
-0.131 0.071 0.296 1 0.471 0.307 0.663 0.449 0.436 0.073
Average change in arch width Inter-molar Man
0.081 -0.057 0.103 0.471 1 0.436 0.229 0.465 0.290 -0.044
Average change in arch width Inter-canine Max
-0.087 -0.033 0.624 0.307 0.436 1 0.190 0.241 0.531 0.056
Average change in arch width first Prem Max
1
Average change in arch width second Prem Max
-0.072 -0.038 0.146 0.663 0.229 0.190 1 0.553 0.542 0.233
Average change in arch width Inter-molar Max
-0.036 -0.001 0.257 0.449 0.465 0.241 0.553 1 0.391 0.184
Average change in Arch length Man
-0.226 -0.250 0.095 0.436 0.290 0.531 0.542 0.391 1 0.457
Average change in Arch length Max
-0.042 -0.440 -0.208 0.073 -0.044 0.056 0.233 0.184 0.457 1
Highlighted values indicate strong correlation.
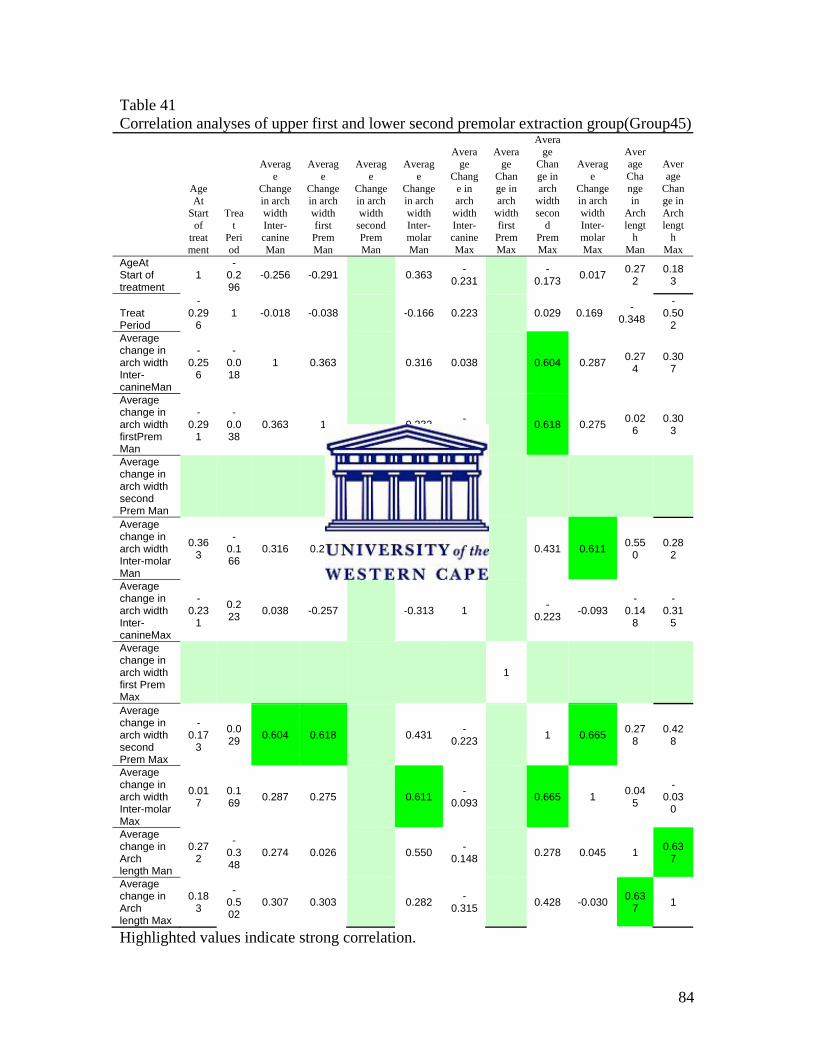
84
Table 41 Correlation analyses of upper first and lower second premolar extraction group(Group45)
AgeAt
Start of
treatment
Treat
Period
Average
Change in arch width Inter-canine Man
Average
Change in arch width first Prem Man
Average
Change in arch width
second Prem Man
Average
Change in arch width Inter-molar Man
Average
Change in arch
width Inter-canine Max
Average
Change in arch
width first Prem Max
Average
Change in arch
width secon
d Prem Max
Average
Change in arch width Inter-molar Max
Average Change in
Arch lengt
h Man
Average
Change in Arch lengt
h Max
AgeAt Start of treatment
1 -
0.296
-0.256 -0.291 0.363 -0.231 -
0.173 0.017 0.272
0.183
Treat Period
-0.29
6 1 -0.018 -0.038 -0.166 0.223 0.029 0.169 -
0.348
-0.50
2 Average change in arch width Inter-canineMan
-0.25
6
-0.018
1 0.363 0.316 0.038 0.604 0.287 0.274
0.307
Average change in arch width firstPrem Man
-0.29
1
-0.038
0.363 1 0.232 -0.257 0.618 0.275 0.02
6 0.30
3
Average change in arch width second Prem Man
1
Average change in arch width Inter-molar Man
0.363
-0.166
0.316 0.232 1 -0.313 0.431 0.611 0.55
0 0.28
2
Average change in arch width Inter-canineMax
-0.23
1
0.223 0.038 -0.257 -0.313 1 -
0.223 -0.093 -
0.148
-0.31
5
Average change in arch width first Prem Max
1
Average change in arch width second Prem Max
-0.17
3
0.029 0.604 0.618 0.431 -
0.223 1 0.665 0.278
0.428
Average change in arch width Inter-molar Max
0.017
0.169 0.287 0.275 0.611 -
0.093 0.665 1 0.045
-0.03
0
Average change in Arch length Man
0.272
-0.348
0.274 0.026 0.550 -0.148 0.278 0.045 1 0.63
7
Average change in Arch length Max
0.183
-0.502
0.307 0.303 0.282 -0.315 0.428 -0.030 0.63
7 1
Highlighted values indicate strong correlation.
85
Figures 23, 24 and 25 show the average change in arch width for the inter-canine arch
width vs. the average change in arch width for the inter-molar arch width for the three
treatment groups in the mandibular arch. Figures 26, 27 and 28 show average change in
arch width for the inter-canine arch width vs. the average change in arch width for the
inter-molar arch width for the three treatment groups in the maxillary arch. There is a
positive correlation between the average changes in arch width of the inter-canine and
inter-molar areas. The positive correlation can be seen in all three groups; Group NE,
Group 44 and Group 45, and also in both the mandible and maxilla. In Group NE in the
mandible and maxilla the values are mostly positive for both the average inter-canine and
inter-molar arch width. In both the extraction groups for both the mandible and maxilla
the average inter-canine arch width values are mostly positive and the average inter-
molar arch width values are mostly negative. The positive correlation might be the result
of the average inter-canine arch width increasing for all three treatment groups in both the
mandible and maxilla, and the average inter-molar arch width showing a decrease for
both extraction groups and only a slight increase in group NE in both the mandible and
maxilla.
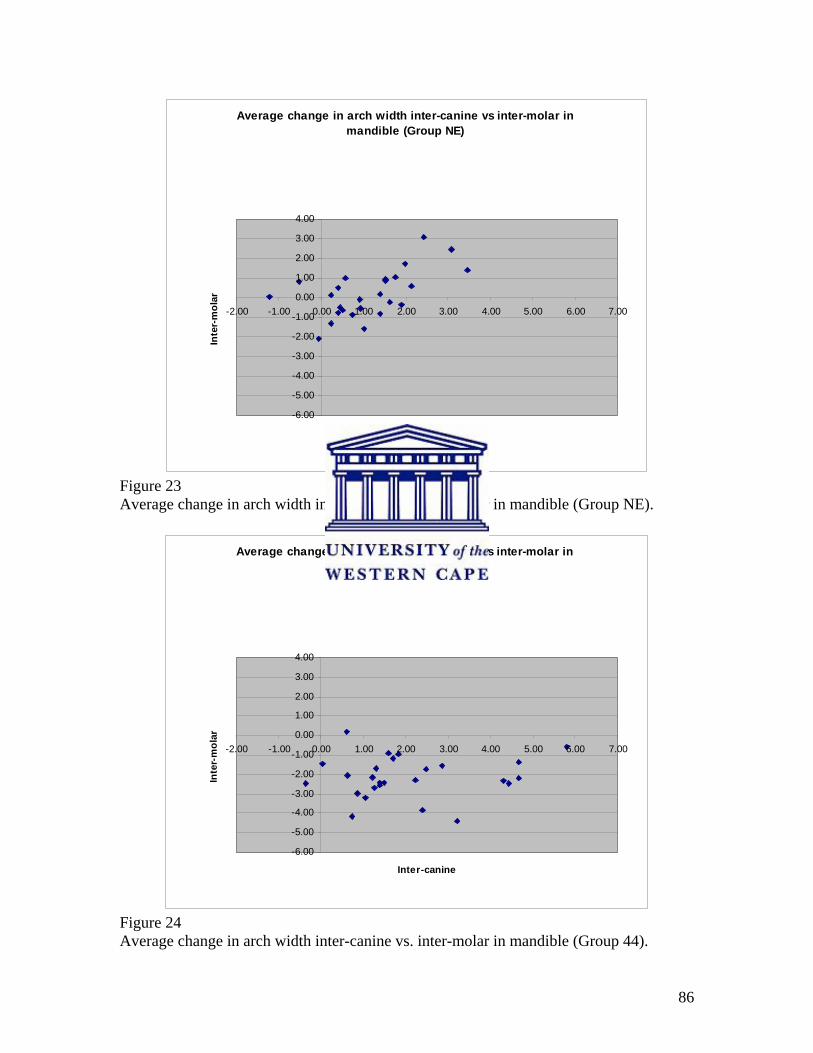
86
Average change in arch width inter-canine vs inter-molar in mandible (Group NE)
-6.00
-5.00
-4.00
-3.00
-2.00
-1.00
0.00
1.00
2.00
3.00
4.00
-2.00 -1.00 0.00 1.00 2.00 3.00 4.00 5.00 6.00 7.00
Inter-canine
Inte
r-m
olar
Figure 23 Average change in arch width inter-canine vs. inter-molar in mandible (Group NE).
Average change in arch width inter-canine vs inter-molar in mandible (Group 44)
-6.00
-5.00
-4.00
-3.00
-2.00
-1.00
0.00
1.00
2.00
3.00
4.00
-2.00 -1.00 0.00 1.00 2.00 3.00 4.00 5.00 6.00 7.00
Inter-canine
Inte
r-m
olar
Figure 24 Average change in arch width inter-canine vs. inter-molar in mandible (Group 44).
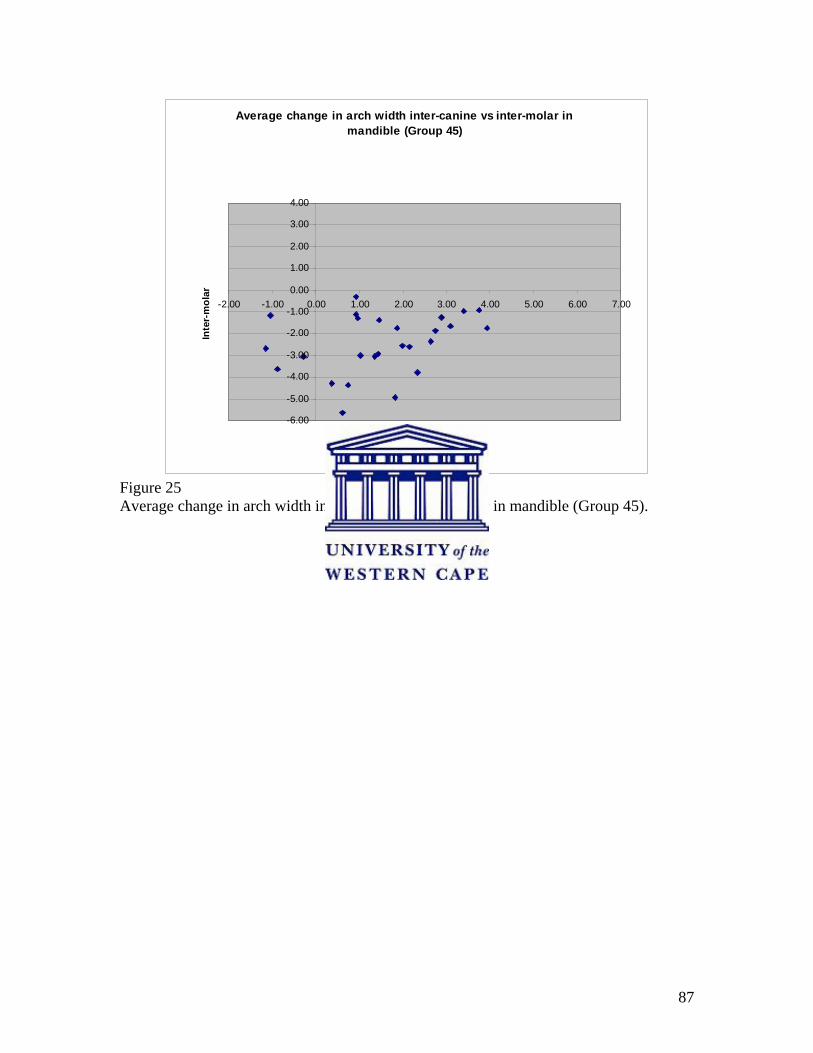
87
Average change in arch width inter-canine vs inter-molar in mandible (Group 45)
-6.00
-5.00
-4.00
-3.00
-2.00
-1.00
0.00
1.00
2.00
3.00
4.00
-2.00 -1.00 0.00 1.00 2.00 3.00 4.00 5.00 6.00 7.00
Inter-canine
Inte
r-m
olar
Figure 25 Average change in arch width inter-canine vs. inter-molar in mandible (Group 45).
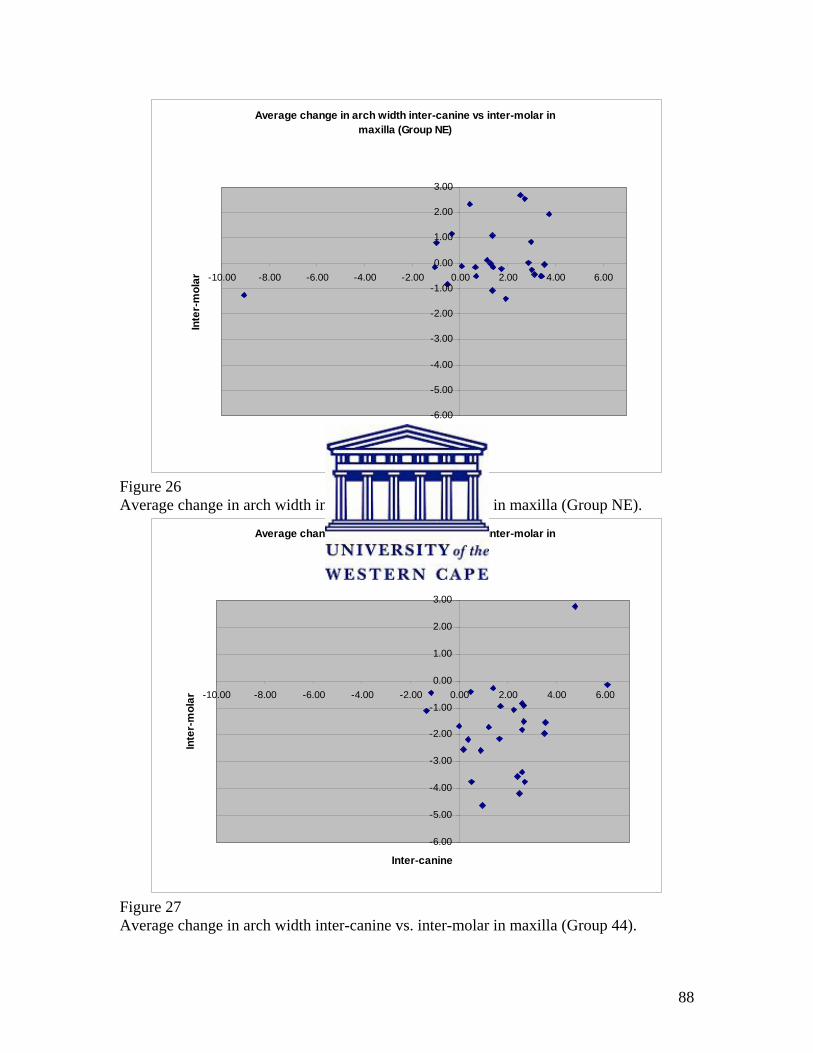
88
Average change in arch width inter-canine vs inter-molar in maxilla (Group NE)
-6.00
-5.00
-4.00
-3.00
-2.00
-1.00
0.00
1.00
2.00
3.00
-10.00 -8.00 -6.00 -4.00 -2.00 0.00 2.00 4.00 6.00
Inter-canine
Inte
r-m
olar
Figure 26 Average change in arch width inter-canine vs. inter-molar in maxilla (Group NE).
Average change in arch width inter-canine vs inter-molar in maxilla (Group 44)
-6.00
-5.00
-4.00
-3.00
-2.00
-1.00
0.00
1.00
2.00
3.00
-10.00 -8.00 -6.00 -4.00 -2.00 0.00 2.00 4.00 6.00
Inter-canine
Inte
r-m
olar
Figure 27 Average change in arch width inter-canine vs. inter-molar in maxilla (Group 44).
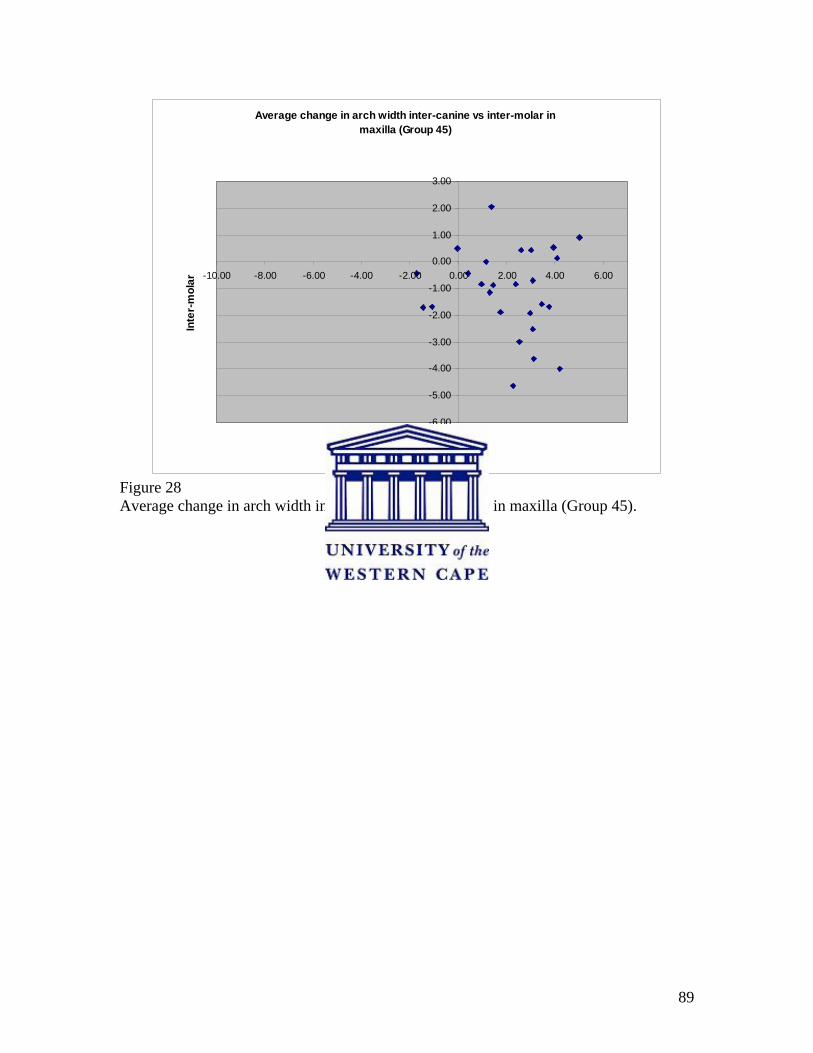
89
Average change in arch width inter-canine vs inter-molar in maxilla (Group 45)
-6.00
-5.00
-4.00
-3.00
-2.00
-1.00
0.00
1.00
2.00
3.00
-10.00 -8.00 -6.00 -4.00 -2.00 0.00 2.00 4.00 6.00
Inter-canine
Inte
r-m
olar
Figure 28 Average change in arch width inter-canine vs. inter-molar in maxilla (Group 45).
90
Chapter 5
DISCUSSION
It is clear that there are changes that occur in the arch dimensions with orthodontic
treatment (Paquette, Beattie and Johnston 1992, Bishara et al 1994, Heiser et al 2004,
Taner et al 2004, Isik et al 2005 and Aksu and Kocadereli 2005). This study investigated
the changes which occur in arch width and arch length in non-extraction and extraction
cases. The research did not study long-term stability of the different types of treatment.
The three treatment groups in this study were: non-extraction (Group NE), extraction of
first premolars (Group 44) and extraction of upper first and lower second premolars
(Group 45).
5.1 Age comparison and average treatment period
On average Group NE started treatment earlier than the two extraction groups. Group NE
was also the group with the shortest treatment period. In Group 45 treatment on average
started later and the treatment period was also longer compared to the other two groups.
Data gathered from the literature indicates that the average age when treatment is started
for non-extraction orthodontic treatment is between 10.9 years and 14.21 years (Paquette,
Beattie and Johnston 1992, Bishara et al 1994, Heiser et al 2004, Taner et al 2004, Isik et
al 2005 and Aksu and Kocadereli 2005). For extraction treatment the average age when
treatment is started is between 11.5 years and 14.3 years (McReynolds and Little 1991,
Paquette, Beattie and Johnston 1992, Bishara et al 1994, Shearn and Woods 2000, Boley
et al 2003, , Heiser et al 2004, Isik et al 2005 and Aksu and Kocadereli 2005). In the
current study the average age when treatment was started was 13.73 years for Group NE,
13.93 years for Group 44 and 14.62 years for Group 45. In Group 45, the average age at
which treatment started was later compared with the studies in the literature.
Data gathered from the literature indicates that the average treatment period for non-
extraction orthodontic treatment is between 1.6 years and 3 years (Paquette, Beattie and
91
Johnston 1992, Bishara et al 1994, Kim and Gianelly 2003, Heiser et al 2004, Taner et al
2004 and Aksu and Kocadereli 2005). For extraction treatment the average treatment
period reported is between 1.84 years and 3.1 years (McReynolds and Little 1991,
Paquette, Beattie and Johnston 1992, Bishara et al 1994, Shearn and Woods 2000, Boley
et al 2003, Kim and Gianelly 2003, Heiser et al 2004 and Aksu and Kocadereli 2005). In
the current study the average treatment period was 1.84 years for Group NE, 1.97 years
for Group 44 and 2.29 years for Group 45. For the current study the treatment period is
generally in agreement with those described in the literature.
5.2 Comparison of arch widths measured on pre-treatment study models
5.2.1 Males compared with females
Mandible and Maxilla
The males had larger average arch width measurements pre-treatment for all three
treatment groups, except for some areas in Group 44. In the latter group the males mostly
showed greater average arch widths except in the mandibular inter-first and inter-second
premolar areas, where the values did not differ significantly from those of the female
group. For the mandibular inter-molar, maxillary inter-first premolar and maxillary inter-
molar arch widths the females had greater average arch widths in Group 44. Some of
these findings are in accordance with those of Knott (1972) who found that the average
size of the dental arch was greater for males than for females.
In this study an equal number of males and females were included to balance the study
samples. As the study sample was not very large the differences for males and females
will not be discussed in detail. Most studies on arch width and arch length changes during
orthodontic studies in the literature have not studied the differences in males and females.
92
5.2.2 Average of combined samples for mandibular and maxillary arch width
Pre-treatment values in the mandibular arch showed almost similar values for Group NE,
group 44 and group 45, except for the inter-second premolar arch width where Group NE
had the largest average inter-second premolar arch width and Group 44 the smallest
average inter-second premolar arch width.
In the maxilla the pre-treatment values of Group NE and Group 45 were almost similar
for the inter-canine arch width, with Group 44 showing the greatest inter-canine arch
width. In the inter-first premolar, inter-second premolar and inter-molar arch widths
Group 44 showed the greatest arch width, with Group 45 showing the smallest arch
width.
5.3 Average vs. Standard Deviation of the three treatment groups for the arch width
in the intercanine and intermolar areas
The studies found in the literature did not compare the average and the standard deviation
for the arch width measurement. In the present study the average inter-canine arch width
increased in both the mandible and maxilla for all three treatment groups. The average
inter-molar arch width in the mandible and maxilla decreased in the two extraction
groups. The non-extraction group showed a slight increase in both the mandible and
maxilla for the average inter-molar arch width. Studies by Shapiro (1974), Gardner and
Chaconas (1976), Kim and Gianelly (2003) and Gianelly (2003) found similar results for
the average arch width changes in the inter-canine and inter-molar areas during
orthodontic treatment.
93
5.4 Average change in arch width in mandible
5.4.1 Mandibular arch width
In some width parameters the mandible and maxilla showed similar overall trends for
both the extraction and nonextraction groups, e.g., the inter-canine arch width increased
for all three treatment groups, but the inter-molar arch widths increased in the non-
extraction group and decreased in both extraction groups.
Inter-canine arch width
The data showed that the average mandibular inter-canine arch width increased in all
three treatment modalities (Table 33). The most significant increase was in Group 44,
being 2.07mm. Studies conducted by numerous researchers, including Shapiro (1974),
Gardner and Chaconas (1976), Paquette, Beattie and Johnston (1992) and
Luppanapornlap and Johnson (1993) showed similar changes for the average mandibular
inter-canine arch width in their extraction and non-extraction samples. Isik et al (2005),
however, found an average decrease of 0.6mm in mandibular inter-canine arch width
with non-extraction treatment. These authors suggest that this may be due to the arch
form being shaped so as to retain the inter-canine distance at the start of the treatment.
They further suggest that some space may also be attained through stripping when
necessary, and thus the decrease in arch width (Isik et al 2005). Sadowsky et al (1994)
showed a 2.4mm increase in average mandibular inter-canine arch width. In their study
some patients received expansion treatment and some also received rapid maxillary
expansion. Glenn, Sinclair and Alexander (1987) studied non-extraction cases, and the
combined findings of their Class1 and Class11 samples for mandibular canine widths are
in accordance with our study sample. Their results showed an increase in average inter-
canine arch width of 0.6mm. The present study showed a 1.11mm increase in average
inter-canine arch width. Aksu and Kocadereli (2005) found an increase in average
mandibular inter-canine arch width of 1.02mm, and they stated that the increase in
94
mandibular inter-canine arch width in non-extraction patients can be explained by a
minimal expansion with the archwires.
If the premolars are extracted, the canines are shifted into a wider part of the arch, and an
increase in the average arch width can therefore be expected in the extraction samples.
McReynolds and Little (1991) showed that cases treated with mandibular second
premolar extractions, experienced an increase in the average mandibular inter-canine arch
width of 0.7mm. The result of our study appears to support these findings.
Group 44 showed an increase of 2.07mm and group 45 showed an increase of 1.50mm in
average mandibular inter-canine arch width.
Inter-first premolar arch width
In Group NE the increase in average arch width in the mandibular first premolar region
was in agreement with the average 1.62mm increase reported by Kim and Gianelly
(2003), the 1.66mm average increase reported by Weinberg and Sadowsky (1996) and the
1.97mm average increase reported by Taner et al (2004). Isik et al’s (2005) study showed
an average increase 0.75mm, which is less than the findings of the current study. Gardner
and Chaconas (1976) and Sadowsky et al (1994) showed a greater average increase of
2.96mm and 2.8mm respectively. Gardner and Chaconas (1976), Sadowsky et al (1994),
Weinberg and Sadowsky (1996) and Taner et al (2004) attribute these findings to
expansion treatment. Weinberg and Sadowsky (1996) state that a number of patients in
their study received expansion treatment in the maxillary arch with reciprocal expansion
in the mandibular arch.
The increase of 2.45mm in the inter-first premolar arch width in the mandible for Group
45 is a significant increase. Unfortunately, this could not be compared with other studies
as we could not retrieve any published literature to support or dispute this. In group 44
the first premolars were extracted.
95
Some of the studies in the literature used samples where four first premolar extractions
had been done, but the inter-premolar arch width had not been measured (Bishara et al
1994, Bishara 1973). In other studies there was no indication of which premolars had
been extracted (Paquette, Beattie and Johnston 1992, Luppanapornlap and Johnson 1993,
Aksu and Kocadereli 2005). The findings of these studies could not, therefore, be
compared with the results of this research.
Inter-second premolar arch width
The changes in inter-second premolar arch width in Group NE were in agreement with
findings in the study by Isik et al (2005) and showed an increase in the inter-second
premolar mandibular arch width. In the current study the average increase in inter-second
premolar arch width was 0.93mm. Gardner and Chaconas (1976), Sadowsky et al (1994)
and Kim and Gianelly (2003) showed increases in inter-second premolar arch width of
between 1.62mm and 2.8mm. These are greater than the increase found in the current
study, but may be expected as Gardner and Chaconas (1976) and Sadowsky et al (1994)
had patients that received expansion treatment in their samples.
The average mandibular inter-second premolar arch width showed a decrease of 1.66mm
for Group 44. Studies by Gardner and Chaconas (1976), Kim and Gianelly (2003) and
Isik et al (2005) also showed a decrease in average arch width in the mandibular second
premolar area when the four first premolars were extracted. These changes may possibly
be attributed to the treatment, where extraction of the first premolars allows forward
movement of the second premolars and molars into a slightly narrower area of the dental
arch.
Inter-molar arch width
In the study done by Aksu and Kocadereli (2005) the results in the non-extraction
treatment groups are in agreement with the increased in average intermolar arch width of
0.19mm which was found in this research. Most of the other studies had an average inter-
96
molar arch width increase of between 1-2mm, which is significantly more than the
increase in the present study (Gardner and Chaconas 1976, Paquette, Beattie and
Johnston 1992, Isik et al 2005). Gardner and Chaconas (1976) state that in their study this
increase can be expected as the buccal segments were expanded. Sadowsky et al (1994)
showed the greatest increase with the average inter-molar arch width increasing 3.5mm.
In their study some patients received expansion treatment and some also received rapid
maxillary expansion. In Paquette, Beattie and Johnston (1992) and Isik et al’s (2005)
studies the non-extraction samples also received expansion treatment. Results of the
research done by Luppanapornlap and Johnson (1993) and Gianelly (2003) differed in
that they found a slight decrease in intermolar arch width in non-extraction treatment of
between 0.13mm and 0.2mm. Gianelly (2003) did not find these changes statistically
significant, and did not give reasons for this finding. Luppanapornlap and Johnson (1993)
did not discuss this finding either, but discussed post-treatment changes. In the studies by
Glenn, Sinclair and Alexander (1987) and Kim and Gianelly (2003) it was found that the
average mandibular inter-molar arch widths were slightly greater than the measurements
of this study. Their investigations showed an increase in average inter-molar arch width
of between 0.81mm and 0.9mm. Glenn, Sinclair and Alexander (1987) studied non-
extraction cases, and this finding was for their combined sample of Class1 and Class11
cases.
Weinberg and Sadowsky (1996) studied non-extraction cases and showed greater
increase in the inter-molar arch widths when compared with the data of the mandibular
arch of this study. In their study a number of patients received expansion treatment of the
maxillary arch with reciprocal expansion in the mandibular arch. These authors state that
according to the data of their study the molars showed no anteroposterior movement.
In the mandibular inter-molar area Group 44 and Group 45 both showed a significant
decrease in inter-molar arch width of more than 2mm. In Group 45 the average arch
width decreased more compared to Group 44, the average arch width decreasing 2.47mm
for Group 45 and decreasing 2.15mm for Group 44. Studies by Gianelly (2003), Kim and
Gianelly (2003), Isik et al (2005) and Aksu and Kocadereli (2005), on samples of four
97
first premolar extractions, also show decreases in inter-molar width. The decreases in
these studies were not as much as found by the present study. The authors attribute these
findings to the consolidation of the extraction spaces. Studies by Luppanapornlap and
Johnson (1993) showed an intermolar decrease of more than 2mm in the mandibular first
molar area, but this article does not state clearly which premolars were extracted. A study
by McReynolds and Little (1991) showed that in cases treated with mandibular second
premolar extractions, the mandibular inter-molar arch width showed a decrease of
2.1mm. These findings are in accordance with the data of this study.
Shearn and Woods (2000) evaluated the treatment effect of mandibular first and
mandidular second premolar extractions, and their study showed that there was evidence
that mandibular second premolar extractions lead to a greater reduction in intermolar arch
width. A reduction of 4.4mm in inter-molar arch width with mandibular second premolar
extractions was shown in their study. This is a considerably greater reduction than the
average reduction of 2.47mm derived from the data of this study. With mandibular first
premolar extractions Shearn and Woods (2000) found the inter-molar arch width to
decrease with 2.8mm. Shearn and Woods (2000) had 55 patients in their lower second
premolar extraction group, with accompanying upper first or upper second premolar
extractions for the sample.
98
5.5 Average change in arch width in maxilla
5.5.1 Maxillary arch width
Inter-canine arch width
The change in average inter-canine arch width in Group NE, (an average increase of
1.22mm), was in agreement with the increase shown in studies by Paquette, Beattie and
Johnston (1992), Luppanapornlap and Johnson (1993), Isik et al (2005) and Aksu and
Kocadereli (2005). Sadowsky et al (1994) showed the greatest increase with the average
inter-canine arch width increasing 3.1mm. In their study some patients received
expansion treatment and some received rapid maxillary expansion.
In the two extraction samples the increase in average arch width in the canine area was
significantly larger compared with the non-extraction sample, being 1.84mm for Group
44 and 2.07mm for Group 45. From this data, Group 45 showed more of an increase in
average inter-canine arch width compared with Group 44. Studies by Luppanapornlap
and Johnson (1993), Isik et al (2005) and Aksu and Kocadereli (2005) show similar
increases in inter-canine arch width in their extraction samples. In other studies done by
Ho and Kerr (1987), Paquette, Beattie and Johnston (1992), Boley et al (2003) and Kim
and Gianelly (2003) the extraction samples also show an increase in the maxillary inter-
canine arch width, but the increase is 1mm and less. In the extraction samples an increase
in the arch width can be expected as the canines are shifted into a wider part of the arch.
Inter-first premolar arch width
The average arch width in the first premolar region of Group NE showed a statistically
significant increase of 2.64mm. This is in agreement with studies by Isik et al (2005)
which showed a 2.15mm increase, Sadowsky et al (1994) which showed a 3.0mm
increase and Kim and Gianelly (2003) which showed an increase of 2.1mm in the first
premolar region of their nonextraction samples. Taner et al (2004) showed a greater
99
increase, with an average of 4.33mm, in their maxillary interpremolar arch widths with
nonextraction treatment. In their study, however, all patients received expansion
treatment.
Inter-second premolar arch width
Group NE showed an average increase of 2.10mm in inter-second premolar arch width.
Kim and Gianelly (2003) reported an increase of 2.1mm and Isik et al (2005) an increase
of 2.11mm in maxillary inter-second premolar arch width for their non-extraction
samples. Kim and Gianelly (2003) stated that large increases in the second premolar areas
in non-extraction treatment can be expected, because non-extraction treatment should be
expansionary to avoid creating crossbites in the buccal segments of the maxillary arch.
Taner et al (2004) and Sadowsky et al (1994) showed an increase in inter-second
premolar arch width of 3.95mm and 4.6mm respectively. In Taner et al’s (2004) study all
patients received expansion treatment and in Sadowsky et al’s (1994) study some patients
received expansion treatment and others received rapid maxillary expansion.
Both extraction samples showed a decrease in the average inter-second premolar arch
width in the maxillary arch. Group 44 showed a statistically significant greater decrease
in average arch width in this area compared with Group 45. The decrease in the average
inter-second premolar arch width of 0.29mm for Group 45 was not statistically
significant, but the decrease of 1.01mm for Group 44 was statistically significant. The
study by Kim and Gianelly (2003) where four first premolars had been extracted showed
a decrease in average arch width of 0.76mm. This is agreement with the data of this
study which shows an average decrease of 1.01mm in inter-second premolar arch width
for Group 44.
In their studies, Isik et al (2005) and Ho and Kerr (1987) found the inter-premolar arch
width in the maxillary arch to increase with extraction treatment. These studies showed
only slight increases of between 0.03mm and 0.44mm. These slight increases can be

100
compared with the slight decrease in interpremolar width shown by Group 45, as the
actual values are small.
Inter-molar arch width
Group NE showed a slight increase of 0.23mm in the average maxillary inter-molar arch
width. Studies by Paquette, Beattie and Johnston (1992), Luppanapornlap and Johnson
(1993), Sadowsky et al (1994), Kim and Gianelly (2003), Taner et al (2004), Isik et al
(2005) and Aksu and Kocadereli (2005) showed a significantly greater increase in
average maxillary inter-molar arch width. The increases in inter-molar arch widths
measured in these studies vary between 1.45mm-5.4mm. This may be attributed to
expansion treatment in the non-extraction samples of these studies.
In the inter-molar region for the maxilla both the extraction samples showed a decrease
in average arch width, with the Group 44 showing a significantly greater decrease in
average arch width. In Group 44 the average intermolar arch width decreased by 1.79mm
compared with the average decrease of 1.09mm in Group 45. Studies done by Ho and
Kerr (1987), Luppanapornlap and Johnson (1993), Kim and Gianelly (2003), Boley et al
(2003), Isik et al (2005) and Aksu and Kocadereli (2005) all showed a decrease in
average inter-molar arch width in their extraction samples. In the first two of these
studies, the extraction samples consisted of patients who had first premolar extractions.
In the study by Isik et al (2005) the decrease in average intermolar arch width was
0.88mm and in the study by Kim and Gianelly (2003) the average decrease was 0.53mm.
This was markedly less than the 1.79mm average decrease found in the present study for
Group 44. Expansion treatment together with the extraction treatment could be the
reason for the increase in inter-molar arch width in their study. Paquette, Beattie and
Johnston (1992) differed and found an almost imperceptible increase in average
maxillary inter-molar width of 0.1mm. They did not give a reason for their finding.
101
5.6 Arch length
5.6.1 Pre-treatment study model comparison of arch length
The male samples had longer average arch lengths pre-treatment compared with the
female samples for all three treatment groups. In the mandible Group 45 showed the
longest average arch length with Group NE showing the shortest average arch length. In
the maxilla Group 44 showed the longest average arch length with Group 45 showing the
shortest average arch length.
The studies found in the literature did not compare the pre-treatment study model arch
length.
5.6.2 Post-treatment study model comparison of arch length
In Group NE the average arch length increased in the mandible and was essentially
unchanged in the maxilla. Group 44 and Group 45 showed a decrease in average arch
length for both the mandibular and maxillary arches.
5.7 Average vs. Standard Deviation of the three treatment groups for arch
length in the mandibular and maxillary arches
The studies found in the literature did not compare the average and the standard deviation
for the arch length measurement. For Group NE there was an increase of 1.99mm in
average mandibular arch length and a decrease of 0.05mm in average maxillary arch
length. Glenn, Sinclair and Alexander (1987) and Paquette, Beattie and Johnston (1992)
also showed an increase in mandibular average arch length in their non-extraction group.
The amount of arch length decrease during treatment depends to a large extent on
whether extraction or non-extraction treatment is used (Shapiro 1974). As can be
expected, arch length decreased more in the extraction cases than the non-extraction
102
cases. In the maxillary and mandibular arches there was a decrease in average arch length
changes post-treatment for both Group 44 and Group 45.
5.8 Average change in arch length
5.8.1 Mandibular arch length
Group NE of the present study showed an increase in average arch length of 1.99mm in
the mandibular arch. Glenn, Sinclair and Alexander (1987), Heiser et al (2004) and
Sadowsky et al (1994) also showed an increase in average arch length mandibular in their
studies, but of only 0.2mm, 0.59mm and 0.6mm respectively. Paquette, Beattie and
Johnston (1992) reported an increase of 2.9mm which is greater than the increase of the
current study. Some studies have however shown a decrease in average mandibular arch
length in non-extraction samples. Shapiro (1974) showed an average arch length decrease
of 0.7mm and Luppanapornlap and Johnson (1993) showed a decrease of 0.2mm in
mandibular arch length.
Group 44 showed a decrease of 9.64mm in average arch length. Shearn and Woods
(2000) showed a decrease in average mandibular arch length of 11.1mm with first
premolar extractions.
Group 45 in this study showed a decrease of 10.93mm in average arch length, which is a
relatively similar value to that of Shearn and Woods (2000) which showed a decrease in
average mandibular arch length of 11.6mm with second premolar extractions, and
McReynolds and Little (1991) which showed a decrease in average arch length of
11.0mm with mandibular second premolar extractions.
Paquette, Beattie and Johnston (1992) showed a decrease of 9.1mm, Luppanapornlap and
Johnson (1993) showed a decrease of 8.6mm and Shapiro (1974) also showed a decrease
of 8.3mm in average mandibular arch length in their extraction groups. These studies did
not specify which premolars had been extracted. In the present study the average arch
103
length of the extraction groups decreased more compared with these studies.
Luppanapornlap and Johnson (1993) and Paquette, Beattie and Johnston (1992) studied
Class 11 patients and Shapiro’s (1974) sample included Class 11 patients. Some of these
patients received expansion treatment together with extraction treatment, and this may be
a reason why the decrease in arch length was less than that of the current study. Heiser et
al (2004) showed a decrease of 12.1mm, but they did not specify which premolars were
extracted.
The studies by Ho and Kerr (1987) and Boley et al (2003) showed a decrease in
mandibular arch length during treatment of 3.36mm and 4.6mm respectively. This is
significantly less than the findings of this study but may be due to a different method
being used to determine the arch length. Ho and Kerr (1987) used the method where a
line from the contact area of the incisors to the midpoint of a line that connected the distal
contact areas of the first molars was measured. Boley et al (2003) measured the arch
length in a similar manner but to the midpoint of a line between the mesial contacts of the
first molars.
5.8.2 Maxillary arch length
In the maxillary arch Group NE showed a slight decrease of 0.05mm in average
maxillary arch length. Luppanapornlap and Johnson (1993) and Sadowsky et al (1994)
showed a decrease in maxillary arch length of 0.9mm and 0.1mm respectively for their
nonextraction groups. Paquette, Beattie and Johnston (1992) and Heiser et al (2004)
differed in that there was an increase in average maxillary arch length of 1.7mm and
3.2mm respectively in their non-extraction group. A possible reason for some of these
differences may be that cases included in the studies had different maxillary arch space
deficiencies. Paquette, Beattie and Johnston (1992) and Heiser et al’s (2004) studies
included Class 11 patients and expansion treatment was often included in the treatment
planning. The increase in maxillary arch length in their study may be partly attributed to
the expansion treatment.
104
In the present study the arch length of Group 44 decreased 12.07mm and Group 45
decreased 12.41mm in the maxillary arch. Paquette, Beattie and Johnston (1992) showed
a decrease of 11.6mm in average maxillary arch length in their extraction sample.
Luppanapornlap and Johnson (1993) showed a decrease of 8.3mm in average maxillary
arch length in their extraction sample. Heiser et al (2004) showed a decrease of
9.64mm.These studies did not specify which premolars were extracted. The decrease in
average arch length in the present study is more than the decreases in these studies. Ho
and Kerr (1987) and Boley et al (2003) in their studies showed a decrease of 4.93mm and
6.5mm respectively. Ho and Kerr’s (1987) study did not specify which premolars were
extracted and Boley et al (2003) had different premolar extraction patterns. Their findings
are significantly less than the findings of this study, but as mentioned may be due to a
different method being used to determine the arch length. Some other possible reasons for
the differences reported among the various studies could be differences in initial arch
length deficiencies and treatment resulting in proclination and retroclination of anterior
teeth.
When comparing the two extraction samples, Group 45 showed a greater decrease in both
the mandible and maxilla. When comparing the mandible to the maxilla, both extraction
groups showed a greater decrease in arch length in the maxilla.
5.9 Summary
When comparing the average mandibular arch width changes, all values in Group NE
showed an increase, whilst the inter-second premolar and inter-molar arch widths of the
two extraction groups which showed a decrease in arch width (Table 33). In the maxillary
arch a similar effect was observed as all values showed an increase, except the inter-
premolar and inter-molar values of the extraction groups. The decrease in average inter-
premolar and inter-molar arch widths may be the result of teeth being extracted and then
the other teeth being shifted into a narrower part of the dental arch (Paquette, Beattie and
Johnston 1992, Luppanapornlap and Johnson 1993).
105
In both extraction and non-extraction treatment there was an increase in the average inter-
canine arch width in the mandible and maxilla. The extraction groups showed more of an
increase compared with the non-extraction group. From this it is evident that extraction
treatment does not necessarily lead to narrowing of the dental arches.
Group 45 showed a greater decrease in average mandibular arch width as well as greater
decrease in average mandibular arch length when compared with Group 44. These
changes may be due to relatively more mesial movement of the molars into the extraction
space during orthodontic treatment in the group where maxillary first and mandibular
second premolars were extracted. Of the two extraction samples Group 44 showed a
greater decrease in average maxillary arch width and Group 45 showed a slightly greater
arch length decrease in the maxilla.
5.6 Limitations of the study
• This study was not limited to a certain malocclusion. Some of the studies in the
literature were limited to certain malocclusions, with Class 11 malocclusions
being studied more often.
• The tooth size arch length deficiency was not brought into this study.
• The sample size of males and females was small. The sample sizes of both males
and females have to be increased to study gender differences.
• The post retention stability of treatment was not considered.
106
Chapter 6
CONCLUSION
The conclusions of the research can be summarized as the following:
The average inter-canine arch width increased during treatment in all three
treatment modalities, more so in the two extraction groups. The changes in inter-
canine arch width for all three treatment groups, for both the mandibular and
maxillary arches were significant (p<0.05). The differences in changes between
Group 44 and Group 45 were not significant (p>0.05).
Group NE showed statistically significant increases in inter-premolar arch width
for both the mandible and maxilla. The two extraction groups showed different
trends for the arch width changes in the mandibular premolar region. Group 45
showed an increase in arch width in the mandibular first premolar area, whereas
Group 44 showed a decrease in the mandibular second premolar area. In the
maxillary arch both extraction groups showed a decrease in arch width in the
second premolar area, with Group 44 showing a greater decrease in arch width.
The changes in inter-premolar arch widths were significant for all three treatment
groups for the mandibular and maxillary arches (p<0.05), except in the inter-
second premolar arch width of the maxillary arch where the change was not
significant (p>0.05). The differences in changes between Group 44 and Group 45
were not significant (p>0.05).
The average inter-molar arch width increased slightly in Group NE, and decreased
in both the extraction groups. For Group NE the change in average inter-molar
arch width was not statistically significant (p>0.05). For both Group 44 and
Group 45 the changes in average inter-molar arch width were statistically
significant (p<0.05). In the mandibular arch the average inter-molar arch width
107
decreased more in Group 45 compared with Group 44. The changes in the
mandibular intermolar arch width between Group 44 and Group 45 were not
significant (p>0.05). In the maxillary arch Group 44 showed a greater decrease in
inter-molar arch with. The changes between Group 44 and Group 45 in average
maxillary inter-molar arch width were statistically significant at the 90% level of
significance (p=0.0594). When extracting mandibular second premolars the data
shows that the mandibular inter-molar arch width decreases more, and the arch
length also decreases more, compared with the effects when extraction of
mandibular first premolars is the treatment plan.
The average mandibular arch length increased during treatment in Group NE. The
average maxillary arch length in Group NE was essentially unchanged. For both
the mandible and maxilla Group 45 showed a greater decrease in average arch
length when compared with Group 44. The mandibular and maxillary changes in
arch length for Group NE and both extraction groups were statistically significant
(p<0.05), except in the maxillary arch of Group NE where there was no
statistically significant difference (p>0.05). The differences in changes between
Group 44 and Group 45 were not significant (p>0.05).
108
References Aksu M, Kocadereli I. (2005). Arch width changes in extraction and nonextraction treatment in Class1 patients. Angle Orthodontist, 75, 948-952. Angle E. (1907). Malocclusion of the teeth. 7th ed. Philadelphia, SS White. Barrow GV, White JR. (1952). Developmental changes of the maxillary and mandibular dental arches. Angle Orthodontist, 22, 41-6. Baumrind S, Korn EL, Boyd RL, Maxwell R. (1996). The decision to extract: Part 1, interclinician agreement. American Journal of Orthodontics and Dentofacial Orthopaedics, 109, 297-309. Bishara SE, Chadha JM, Potter RB. (1973). Stability of intercanine width, overbite, and overjet correction. American Journal of Orthodontics, 63, 588-595. Bishara SE, Bayati P, Zaher AR, Jakobsen JR. (1994). Comparison of the dental arch changes in patients with Class II, division 1 malocclusion: extraction vs. nonextraction treatments. Angle Orthodontist, 64, 351-8. Bishara SE, Jakobsen JR, Treder J, Nowak A. (1997). Arch width changes from 6 weeks to 45 years of age. American Journal of Orthodontics and Dentofacial Orthopaedics, 111, 401-9. Boley JC, Mark JA, Sachdeva RSC, Buschang PH. (2003). Long-term stability of Class1 premolar extraction treatment. American Journal of Orthodontics and Dentofacial Orthopaedics, 124, 277-287. Case CS. (1964). The question of extraction in orthodontia (reprint). American Journal of Orthodontics, 50, 660-691. Dewel BF. (1964). The Case-Dewey-Cryer extraction debate: A commentary. Angle Orthodontist, 50, 862-5. DeKock WH. (1972). Dental arch depth and width studied longitudinally from 12 years of age to adulthood. American Journal of Orthodontics, 62, 56-66. Dierkes JM. (1987). The beauty of the face: an orthodontic perspective. Journal of the American Dental Association, 89E-95E. Gardner SD, Chaconas SJ. (1976). Post treatment and post retention changes following orthodontic therapy. Angle Orthodontist, 46, 151-161. Gianelly AA. (2003). Arch width after extraction and nonextraction treatment. American Journal of Orthodontics and Dentofacial Orthopaedics, 123, 25-8.
109
Glenn G, Sinclair PM, Alexander RG. (1987). Nonextraction orthodontic therapy: posttreatment dental and skeletal stability. American Journal of Orthodontics and Dentofacial Orthopaedics, 92, 321-8. Hagler BL, Lupini J, Johnson LE. (1998). Long-term comparison of extraction and nonextraction alternatives in matched samples of African American patients. American Journal of Orthodontics and Dentofacial Orthopaedics, 114, 393-403. Heiser W, Niedrewanger A, Bancher B, Bitterman G, Neunteufel N, Kulmer S. (2004). Three-dimensional dental arch and palatal form changes after extraction and nonextraction treatment. Part 1. Arch length and area. American Journal of Orthodontics and Dentofacial Orthopaedics, 126, 71-81. Ho KK, Kerr WJS. (1987). Arch dimensional changes during and following fixed appliance therapy. British Journal of Orthodontics, 14, 293-7. Isik F, Sayinsu K, Nalbantgil D, Arun T. (2005). A comparative study of dental arch widths: extraction and non-extraction treatment. European Journal of Orthodontics, 27, 585-9. Johnson DK, Smith RJ. (1995). Smile esthetics after orthodontic treatment with and without extraction of four first premolars. American Journal of Orthodontics and Dentofacial Orthopaedics, 108, 162-7. Kim E, Gianelly AA. (2003). Extraction vs. non-extraction: Arch widths and smile esthetics. Angle Orthodontist, 73, 354-8. King EW. (1974). Relapse of orthodontic treatment. Angle Orthodontist, 44, 300-315. Knott VB. (1972). Longitudinal study of dental arch widths at four stages of dentition. Angle Orthodontist, 42, 387-95. Little RM, Riedel RA. (1989). Post-treatment evaluation of stability and relapse-Mandibular arches with generalized spacing. American Journal of Orthodontics and Dentofacial Orthopaedics, 95, 37-41. Lundstrom AI. (1925). Malocclusion of the teeth regarded as a problem in connection with the apical base. International Journal of Orthodontics, 11, 591-602, 727-731, 933-941. Luppanapornlap S, Johnson LE. (1993). The effects of premolar extraction: a long-term comparison of outcomes in “clear-cut” extraction and nonextraction class11 patients. Angle Orthodontist, 63, 257-270. McNamara JA. (2000). Maxillary transverse deficiency. American Journal of Orthodontics and Dentofacial Orthopaedics, 117, 567-570.
110
McReynolds DC, Little RM. (1991). Mandibular second premolar extraction-postretention evaluation of stability and relapse. Angle Orthodontist, 61, 133-44. Nance HN. (1947). The limitations of orthodontic treatment. American Journal of Orthodontics, 33, 253-301. O’Connor BMP. (1993). Contemporary trends in orthodontic practice: A national survey. American Journal of Orthodontics and Dentofacial Orthopaedics, 103, 163-170. Peck S, Peck H. (1979). Frequency of tooth extraction in orthodontic treatment. American Journal of Orthodontics, 76, 491-6. Paquette DE, Beattie JR, Johnston LE. (1992). A long-term comparison of nonextraction and premolar extraction edgewise therapy in “borderline” Class II patients. American Journal of Orthodontics and Dentofacial Orthopaedics, 102, 1-14. Sadowsky C, Schneider BJ, BeGole EA, Tahir E. (1994). Long-term stability after orthodontic treatment: nonextraction with prolonged retention. American Journal of Orthodontics and Dentofacial Orthopaedics, 106, 243-9. Shearn BN, Woods MG. (2000). An occlusal and cephalometric analysis of lower first and second premolar extraction effects. American Journal of Orthodontics and Dentofacial Orthopaedics, 117, 351-361. Shapiro PA. (1974). Mandibular dental arch form and dimension. Treatment and postretention changes. American Journal of Orthodontics, 66, 58-70. Shields TE, Little RM, Chapko MK. (1985). Stability and relapse of mandibular anterior alignment: a cephalometric appraisal of first-premolar-extraction cases treated by traditional edgewise orthodontics. American Journal of Orthodontics, 87, 27-38. Sinclair PM, Little RM. (1983). Maturation of untreated normal occlusions. American Journal of Orthodontics, 83, 114-123. Strang R.H.W. (1940). The fallacy of the denture expansion as a treatment procedure. Angle Orthodontist, 19, 12-22. Taner T, Ciger S, El H, Germec D, Es A. (2004). Evaluation of dental arch width and form changes after orthodontic treatment and retention with a new computerized method. American Journal of Orthodontics and Dentofacial Orthopaedics, 126, 464-76. Travess H, Roberts-Harry D, Sandy J. (2004). Extractions in orthodontics. British Dental Journal, 196, 195-203. Tweed CH. (1944). Indications for the extraction of teeth in orthodontic procedure. Journal of Orthodontics and Oral Surgery, 30, 405-428.
111
Walkow TM, Peck S. (2002). Dental arch width in Class II division 2 deepbite malocclusion. American Journal of Orthodontics and Dentofacial Orthopaedics, 122, 608-613. Ward DE, Workman J, Brown R, Richmond S. (2006) Changes in arch width. A 20-year longitudinal study of orthodontic treatment. Angle Orthodontist, 76, 6-13. Warren JJ, Bishara SE. (2001). Comparison of dental arch measurements in the primary dentition between contemporary and historical samples. American Journal of Orthodontics and Dentofacial Orthopaedics, 119, 211-5. Warren JJ, Bishara SE. (2003). Tooth size-arch length relationship in the deciduous dentition: a comparison between contemporary and historical samples. American Journal of Orthodontics and Dentofacial Orthopaedics, 123, 614-9. Watson WG. (1980). An individual compass for extraction. American Journal of Orthodontics, 78, 111-3. Weinberg M, Sadowsky C. (1996). resolution of mandibular arch crowding in growing patients with Class1 malocclusion treated nonextraction. American Journal of Orthodontics and Dentofacial Orthopaedics, 110, 359-364. Weintraub JA, Vig PS, Brown C, Kowalski CJ. (1989). The prevalence of orthodontic extractions. American Journal of Orthodontics and Dentofacial Orthopaedics, 96, 462-6.
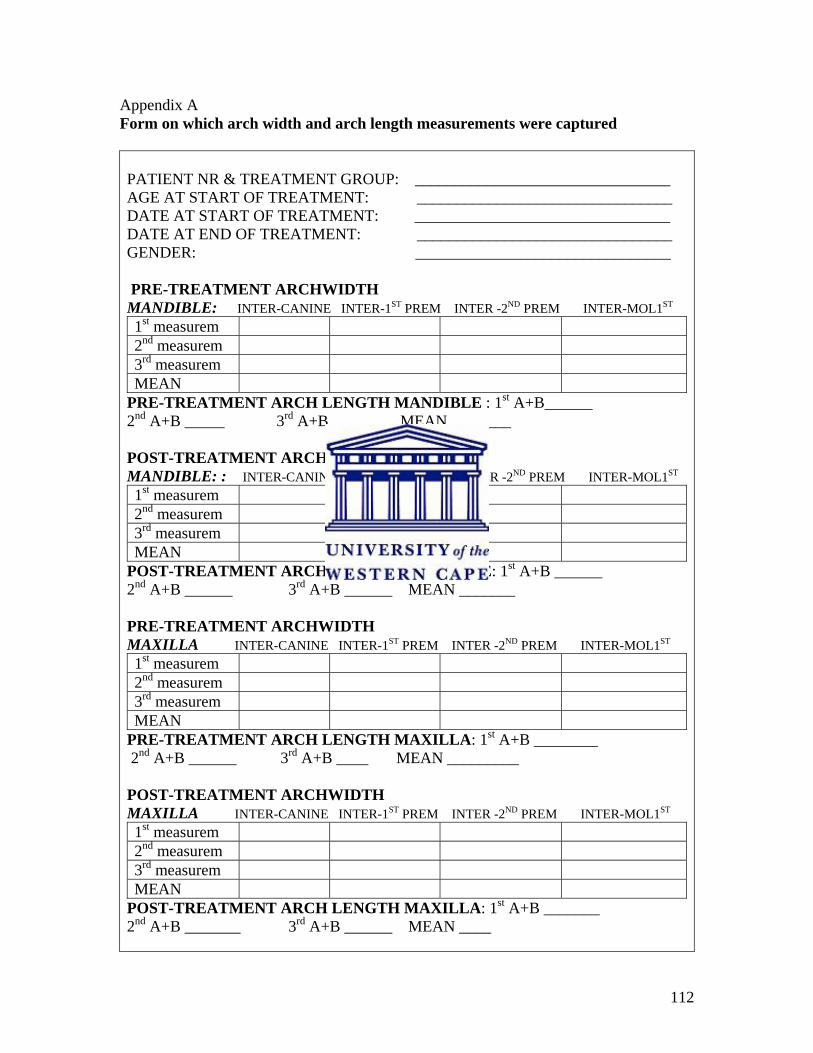
112
Appendix A Form on which arch width and arch length measurements were captured PATIENT NR & TREATMENT GROUP: ________________________________ AGE AT START OF TREATMENT: ________________________________ DATE AT START OF TREATMENT: ________________________________ DATE AT END OF TREATMENT: ________________________________ GENDER: ________________________________ PRE-TREATMENT ARCHWIDTH MANDIBLE: INTER-CANINE INTER-1ST PREM INTER -2ND PREM INTER-MOL1ST 1st measurem 2nd measurem 3rd measurem MEAN
PRE-TREATMENT ARCH LENGTH MANDIBLE : 1st A+B______ 2nd A+B _____ 3rd A+B ______ MEAN________ POST-TREATMENT ARCHWIDTH MANDIBLE: : INTER-CANINE INTER-1ST PREM INTER -2ND PREM INTER-MOL1ST 1st measurem 2nd measurem 3rd measurem MEAN
POST-TREATMENT ARCH LENGTH MANDIBLE: 1st A+B ______ 2nd A+B ______ 3rd A+B ______ MEAN _______ PRE-TREATMENT ARCHWIDTH MAXILLA INTER-CANINE INTER-1ST PREM INTER -2ND PREM INTER-MOL1ST 1st measurem 2nd measurem 3rd measurem MEAN
PRE-TREATMENT ARCH LENGTH MAXILLA: 1st A+B ________ 2nd A+B ______ 3rd A+B ____ MEAN _________ POST-TREATMENT ARCHWIDTH MAXILLA INTER-CANINE INTER-1ST PREM INTER -2ND PREM INTER-MOL1ST 1st measurem 2nd measurem 3rd measurem MEAN
POST-TREATMENT ARCH LENGTH MAXILLA: 1st A+B _______ 2nd A+B _______ 3rd A+B ______ MEAN ____

113
Related Documents