Cedar Rapids, Iowa Area 2010 Demographic Information It’s all in the details

Cedar Rapids 2010 Demographics Report
Mar 26, 2016
2010 Demographics Report for the Cedar Rapids area
Welcome message from author
This document is posted to help you gain knowledge. Please leave a comment to let me know what you think about it! Share it to your friends and learn new things together.
Transcript

Cedar Rapids, Iowa Area 2010 Demographic Information
It’s all in the
details

AshleyTaylor AllenMerta AdministrativeManager VicePresident EconomicDevelopment Financial& AdministrativePrograms
JeffRossate MarkSeckman DennisJordan VicePresident President VicePresident BusinessDevelopment EconomicDevelopment EconomicDevelopment
JimSullivan KathleenPeggKariLammerManager DirectorDirectorExistingBusinessServices Marketing,Communications,WorkforceInitiatives &Research
Updated:July2010
Aprojectof:
PriorityOneEconomicDevelopmentDivision
CedarRapidsAreaChamberofCommerce424FirstAvenueNE
CedarRapids,Iowa52401(319)398-5317
Fax(319)[email protected]://www.priority1.com
DEMOGRAPHICINFORMATIONFORTHE
GREATERCEDARRAPIDSAREA2010
2
It'sallinthe
detailsPopulation............................................................................................................................................... 6Population.of.Cedar.Rapids.Metropolitan.Area.........................................................................................................................................................6Population.of.Iowa.City.Metropolitan.Area..................................................................................................................................................................6Cedar.Rapids.MSA.Total.Population.(graph)................................................................................................................................................................7Cedar.Rapids.MSA.Population.by.Gender.and.Race.............................................................................................................................................7Marital.Status,.2000.(graph)...................................................................................................................................................................................................8Cedar.Rapids/Iowa.City.Technology.Corridor.Map.and.Population...............................................................................................................9Population.of.Cedar.Rapids.and.Surrounding.Region.............................................................................................................................................9Cedar.Rapids.MSA.Population.by.Age.Group.and.Gender.............................................................................................................................10Iowa.City.MSA.Population.by.Age.Group.and.Gender.......................................................................................................................................11
Income....................................................................................................................................................12Major.Sources.of.Personal.Income.................................................................................................................................................................................12Distribution.of.Personal.Income.......................................................................................................................................................................................12
Employment.-.Work.Force.........................................................................................................13Education.Level.of.Current.Work.force...................................................................................................................................................................... .13Place.of.Residence.Employment.Data..........................................................................................................................................................................14Technology.Corridor.Civilian.Labor.Force.................................................................................................................................................................14Linn.County.Resident.Unemployment.Rate.(graph)...........................................................................................................................................15Linn.County.Resident.Civilian.Labor.Force.(graph)..............................................................................................................................................15Cedar.Rapids/Iowa.City.Laborshed.Map.....................................................................................................................................................................16Average.Hourly.Work.Week.in.Manufacturing........................................................................................................................................................17Average.Hourly.Wages.in.Manufacturing....................................................................................................................................................................17Right-to-Work.Law..................................................................................................................................................................................................................172000.Census.Occupational.Attachment.of.the.Civilian.Labor.Force.........................................................................................................18..by.Race,.Gender.and.EEO-1.Category
Government.&.Taxes......................................................................................................................19Individual.Income.Tax.and.Current.Rates....................................................................................................................................................................19Sales.Tax.and.Municipal.&.County.Government.for.Metro.Area..................................................................................................................20City.of.Cedar.Rapids.Property.Tax.Rates.by.Taxing.Districts...........................................................................................................................20Comparative.Property.Tax.Rates.for.Iowa's.Seven.Largest.Cities.FY.2006............................................................................................20
�
Demographics
Industry...................................................................................................................................................21Cedar.Rapids.Area.Largest.Employers.(Service)....................................................................................................................................................21Cedar.Rapids.Area.Largest.Employers.(Manufacturing).....................................................................................................................................22Technology.Corridor's.25.Largest.Employers.(Service).....................................................................................................................................23Technology.Corridor's.25.Largest.Employers.(Manufacturing)......................................................................................................................24Manufacturing.Industries........................................................................................................................................................................................................25Mining.Industries........................................................................................................................................................................................................................26Construction.Industries..........................................................................................................................................................................................................26Retail.Trade....................................................................................................................................................................................................................................27Wholesale.Trade........................................................................................................................................................................................................................28Services...........................................................................................................................................................................................................................................29Finance,.Insurance.&.Real.Estate.......................................................................................................................................................................................31Transportation.&.Public.Utilities.......................................................................................................................................................................................31Forestry,.Fishing,.Hunting.&.Agricultural.Support....................................................................................................................................................322009.Employment.Composition.(graph)....................................................................................................................................................................32Retail.Sales.by.Municipalities...............................................................................................................................................................................................33Technology.Corridor.Retail.Sales.by.Business.Class.............................................................................................................................................34Building.Permit.Information.................................................................................................................................................................................................35New.Commercial.Building.Permits.................................................................................................................................................................................35New.Industrial.Building.Permits........................................................................................................................................................................................36
Housing..................................................................................................................................................37New.Single-Family.Dwelling.Building.Permits...........................................................................................................................................................37New.Multi-Family.Dwelling.Building.Permits.............................................................................................................................................................37Technology.Corridor.Single-Family.Home.Sales.by.Size....................................................................................................................................38Technology.Corridor.Annual.Residential.Sales,.2003-2008..............................................................................................................................39
Transportation....................................................................................................................................40Highways.Serving.Linn.County.(Map)...........................................................................................................................................................................40Traffic Counts..............................................................................................................................................................................................................................40Motor.Freight.Carriers...........................................................................................................................................................................................................40Bus.Service...................................................................................................................................................................................................................................40Rail.Transportation....................................................................................................................................................................................................................40Delivery.Time.of.Goods.in.Transit.(graph).................................................................................................................................................................41Technology.Corridor.Commuting.Characteristics.2008....................................................................................................................................42The.Eastern.Iowa.Airport.Facilities.................................................................................................................................................................................43Airlines.Serving.The.Eastern.Iowa.Airport.and.Air.Cargo.Carriers.............................................................................................................43Destinations.With.Non-Stop.Air.Passenger.Service.............................................................................................................................................43Air.Service.Activity.Summary.............................................................................................................................................................................................44

4
It'sallinthe
detailsEducation...............................................................................................................................................45School.District.Enrollment.for.Cedar.Rapids.Metro.Area,.2008-09............................................................................................................45Composite.American.College.Testing.(ACT).Scores............................................................................................................................................46High.School.Graduation.Rates.and.Post.Secondary.Education.Attendance.Rates............................................................................46Post.Secondary.Enrollment,.Fall.2008...........................................................................................................................................................................47
Communications...............................................................................................................................48Newspapers,.Business.Publications.................................................................................................................................................................................48Television.Stations,.Television.Market.Area.and.Cable.Television...................................................................................................................48
Utilities....................................................................................................................................................49Cable.Television......................................................................................................................................................................................................................... ..49Telecommunications.Service.and.Wireless.Service...............................................................................................................................................49The.Iowa.Communications.Network.(ICN).............................................................................................................................................................49Electric.Service.and.Natural.Gas.Service....................................................................................................................................................................49Water.Service.and.Waste.Water.Treatment.............................................................................................................................................................50
Climate...................................................................................................................................................51Average.Monthly.Temperature..........................................................................................................................................................................................51Average.Monthly.Precipitation..........................................................................................................................................................................................51Average.Monthly.Snowfall....................................................................................................................................................................................................52Miscellaneous.Statistics..........................................................................................................................................................................................................52
Other......................................................................................................................................................53Houses.of.Worship...................................................................................................................................................................................................................53Recreation.Facilities..................................................................................................................................................................................................................53
Crime.......................................................................................................................................................54Crime.Statistics.for.City.of.Cedar.Rapids.and.Violent.Crime.in.Linn.County.......................................................................................54
Healthcare............................................................................................................................................55Number.of.Practicing.Physicians,.by.Specialty...........................................................................................................................................................55Technology.Corridor.Number.of.Hospital.Employees.......................................................................................................................................55

�
Demographics
�
It'sallinthe
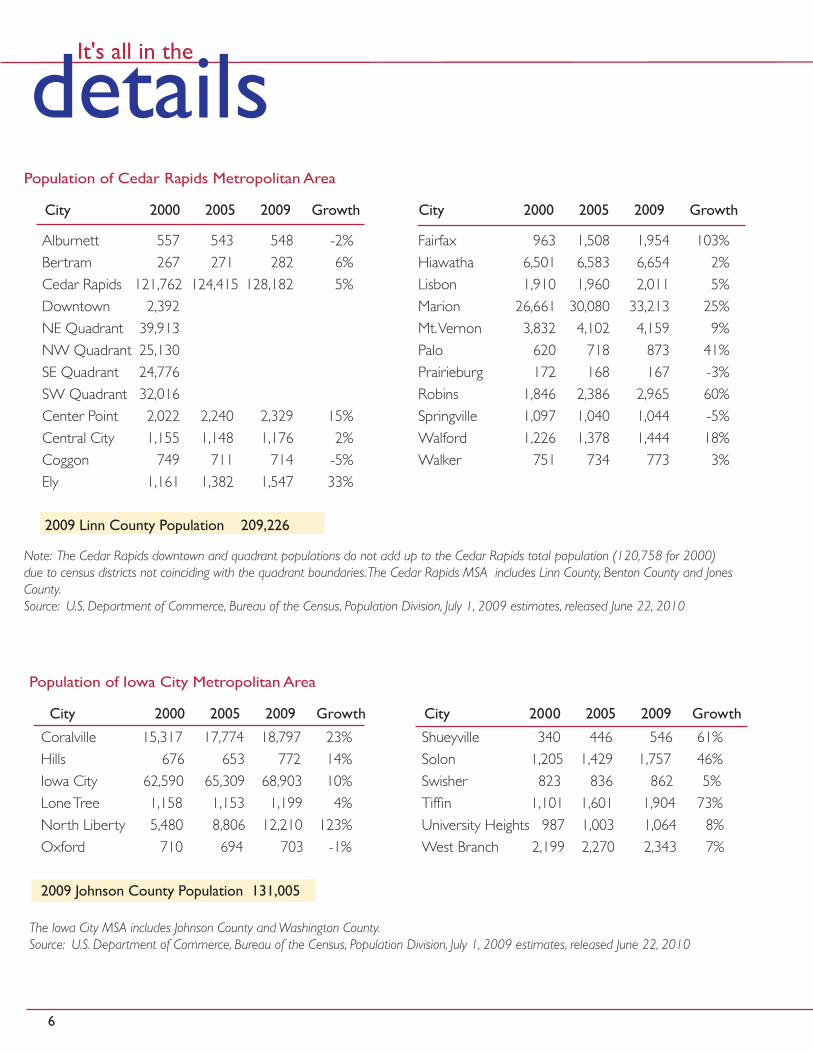
detailsPopulationofCedarRapidsMetropolitanArea
.....City200020052009GrowthCity200020052009Growth
....2009LinnCountyPopulation209,22�
Note: The Cedar Rapids downtown and quadrant populations do not add up to the Cedar Rapids total population (120,758 for 2000) due to census districts not coinciding with the quadrant boundaries. The Cedar Rapids MSA includes Linn County, Benton County and Jones County. Source: U.S. Department of Commerce, Bureau of the Census, Population Division, July 1, 2009 estimates, released June 22, 2010
Alburnett. 557. 543. 548. -2%Bertram. 267. 271. 282. 6%Cedar.Rapids....121,762..124,415. 128,182. 5%Downtown.. 2,392.. .NE.Quadrant. 39,913NW.Quadrant. 25,130SE.Quadrant. 24,776SW.Quadrant. 32,016Center.Point.. 2,022. 2,240. 2,329. 15%Central.City. 1,155. 1,148. 1,176. 2%Coggon. 749. 711. 714. -5%Ely. 1,161. 1,382. 1,547. 33%
Fairfax. ........963.. 1,508. 1,954. 103%Hiawatha. ......6,501. 6,583. 6,654. 2%Lisbon. 1,910. 1,960. 2,011. 5%Marion. 26,661. 30,080. 33,213. 25%Mt..Vernon. 3,832.....4,102. 4,159. 9%Palo. 620. 718. 873. 41%Prairieburg. 172. 168. 167. -3%Robins. 1,846. 2,386. 2,965. 60%Springville. 1,097. 1,040. 1,044. -5%Walford. 1,226. 1,378. 1,444. 18%Walker. 751. 734. 773. 3%
PopulationofIowaCityMetropolitanArea
City200020052009GrowthCity200020052009Growth
The Iowa City MSA includes Johnson County and Washington County. Source: U.S. Department of Commerce, Bureau of the Census, Population Division, July 1, 2009 estimates, released June 22, 2010
Shueyville..............340.......446.........546. .61%Solon..................1,205....1,429.......1,757. .46%Swisher.................823........836.........862. .5%Tiffin 1,101 1,601 1,904 73%University.Heights...987....1,003.......1,064.......8%West.Branch.........2,199....2,270.......2,343.......7%
Coralville...........15,317.....17,774.....18,797. . 23%Hills. 676..........653........772. . 14%Iowa.City............62,590.....65,309....68,903.. 10%Lone.Tree............1,158........1,153.......1,199.. 4%North.Liberty......5,480.......8,806.....12,210.. 123%Oxford...................710.........694.........703. ....-1%
2009JohnsonCountyPopulation131,005
�
Demographics
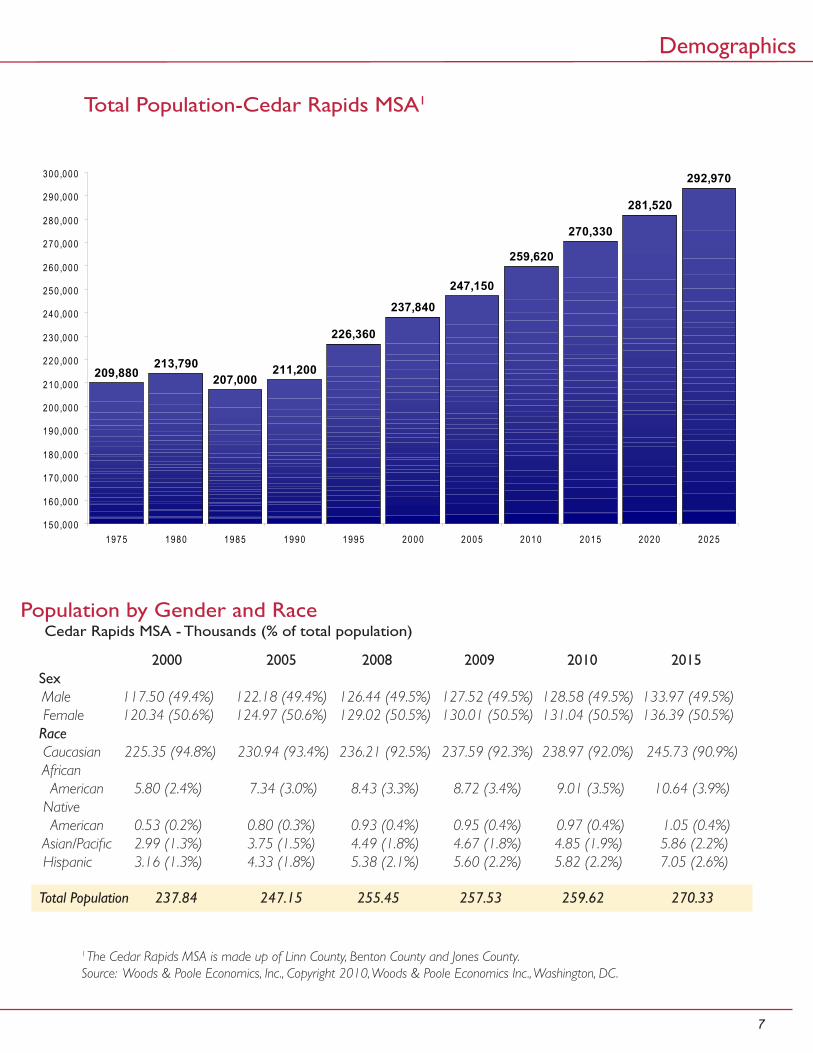
1 The Cedar Rapids MSA is made up of Linn County, Benton County and Jones County. Source: Woods & Poole Economics, Inc., Copyright 2010, Woods & Poole Economics Inc., Washington, DC.
TotalPopulation-CedarRapidsMSA1
2000 2005 2008 2009 2010 2015Sex Male 117.50 (49.4%) 122.18 (49.4%) 126.44 (49.5%) 127.52 (49.5%) 128.58 (49.5%) 133.97 (49.5%) Female 120.34 (50.6%) 124.97 (50.6%) 129.02 (50.5%) 130.01 (50.5%) 131.04 (50.5%) 136.39 (50.5%)Race Caucasian 225.35 (94.8%) 230.94 (93.4%) 236.21 (92.5%) 237.59 (92.3%) 238.97 (92.0%) 245.73 (90.9%) African American 5.80 (2.4%) 7.34 (3.0%) 8.43 (3.3%) 8.72 (3.4%) 9.01 (3.5%) 10.64 (3.9%) Native American 0.53 (0.2%) 0.80 (0.3%) 0.93 (0.4%) 0.95 (0.4%) 0.97 (0.4%) 1.05 (0.4%)Asian/Pacific 2.99(1.3%) 3.75(1.5%) 4.49(1.8%) 4.67(1.8%)4.85(1.9%)5.86(2.2%) Hispanic 3.16 (1.3%) 4.33 (1.8%) 5.38 (2.1%) 5.60 (2.2%) 5.82 (2.2%) 7.05 (2.6%) Total Population 237.84 247.15 255.45 257.53 259.62 270.33
PopulationbyGenderandRaceCedarRapidsMSA-Thousands(%oftotalpopulation)
209,880213,790
207,000211,200
226,360
237,840
247,150
259,620
270,330
281,520
292,970
150 ,000
160 ,000
170 ,000
180 ,000
190 ,000
200 ,000
210 ,000
220 ,000
230 ,000
240 ,000
250 ,000
260 ,000
270 ,000
280 ,000
290 ,000
300 ,000
1975 1980 1985 1990 1995 2000 2005 2010 2015 2020 2025

8
It'sallinthe
detailsMaritalStatus,2008
CedarRapidsMSA-PercentageofTotalPopulation15years&over
Source: U.S. Department of Commerce, Bureau of the Census, 2006-2008 American Community Survey.Note: Totals may not add up due to rounding.
M arried53%
S eparated1%
W idowed6%
Divorc ed12%
Never M arried28%
�
Demographics
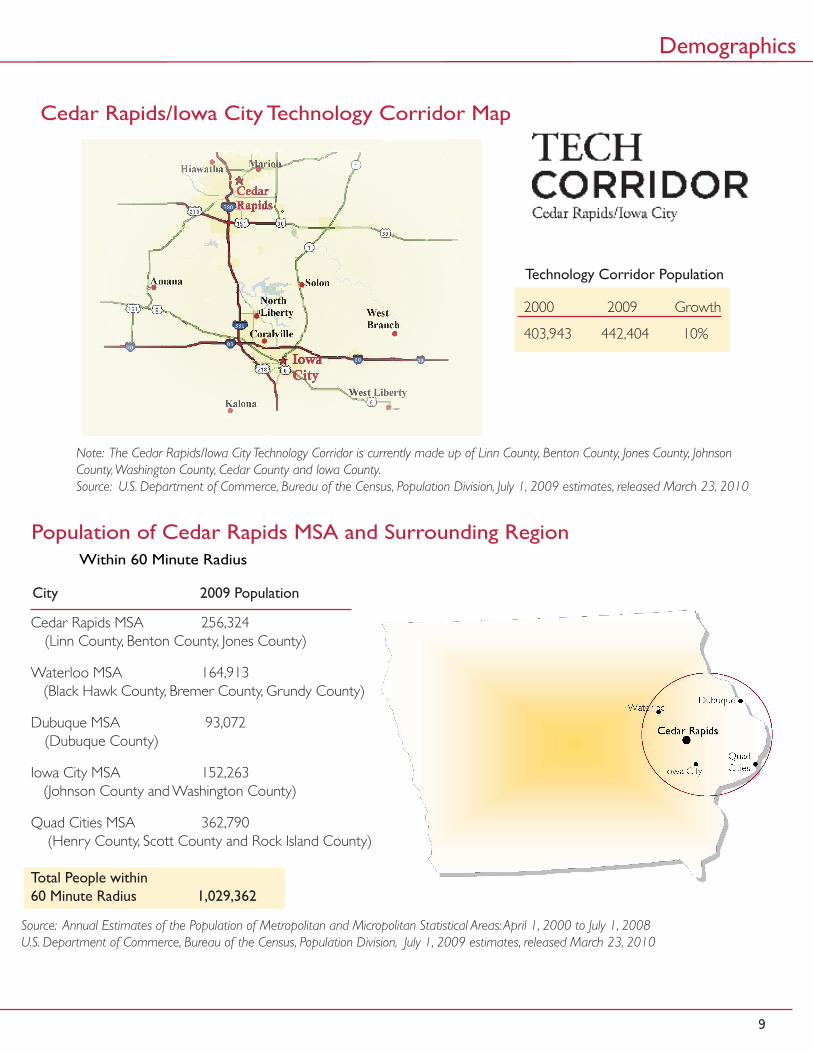
Note: The Cedar Rapids/Iowa City Technology Corridor is currently made up of Linn County, Benton County, Jones County, Johnson County, Washington County, Cedar County and Iowa County.Source: U.S. Department of Commerce, Bureau of the Census, Population Division, July 1, 2009 estimates, released March 23, 2010
PopulationofCedarRapidsMSAandSurroundingRegion Within�0MinuteRadius
Source: Annual Estimates of the Population of Metropolitan and Micropolitan Statistical Areas: April 1, 2000 to July 1, 2008 U.S. Department of Commerce, Bureau of the Census, Population Division, July 1, 2009 estimates, released March 23, 2010
City 2009Population
CedarRapids/IowaCityTechnologyCorridorMap
Cedar.Rapids.MSA.. ..256,324. (Linn.County,.Benton.County,.Jones.County)
Waterloo.MSA.. ..164,913....(Black.Hawk.County,.Bremer.County,.Grundy.County)
Dubuque.MSA.. ...93,072. (Dubuque.County)
Iowa.City.MSA.. ..152,263....(Johnson.County.and.Washington.County)
Quad.Cities.MSA. ..362,790....(Henry.County,.Scott.County.and.Rock.Island.County)
TotalPeoplewithin�0MinuteRadius 1,029,3�2
TechnologyCorridorPopulation. . . .2000.. 2009. Growth.403,943........442,404........10%

10
It'sallinthe
detailsMale Female Total MaleFemale Total Male Female Total Male FemaleTotal MaleFemaleTotal2000 2000 2000 20052005 2005 2009 2009 2009 2010 20102010 20152015 2015....8.40. ..7.81. 16.21. .8.42. .8.12. 16.54. .8.87. .8.51. 17.38. .8.93. .8.58. .17.51. .9.40. ..9.05. .18.45
..8.81. ..8.53. 17.34. .8.61. .7.99. 16.60. .8.87. .8.50. 17.37. .8.93. .8.67. .17.59. .9.25. ..8.98. .18.22
.8.63. ..8.13. 16.76. .9.01. .8.71. 17.72. .8.89. .8.19. 17.08. .8.91. .8.16. .17.07. .9.30. ..8.93. .18.23
.8.66. ..8.46. 17.12. .8.72. .8.16. 16.88. .9.17. .9.04. 18.21. .9.16. .9.05. .18.21. .8.95. ..8.29. .17.24
.
.7.91. ..7.78. 15.68. .8.12. .8.16. 16.28. .8.34. .7.84. 16.19. .8.59. .8.08. .16.67. .8.90. ..8.99. .17.89
16.73. .16.15. 32.88. 16.64. 16.52. 33.16. 17.00. 17.45. 34.45. 16.91. 17.52. .34.43. 17.54..17.36.. .34.90
19.48. .18.82. 38.31. 18.82. 18.07. 36.88. 18.24. 17.40. 35.64. 18.09. 17.24. .35.33. 18.26..17.67. .35.93
.16.23. .16.08. 32.31. 18.03. 17.71. 35.74. 19.09. 18.62. 37.71. 19.22. 18.64. .37.86. 18.29..18.02. .36.31
.10.03. .10.57. 20.60. 12.36. 12.77. 25.13. 14.39. 14.77. 29.16. 14.95. 15.14. .30.09. 16.65..16.81. .33.45
..7.05. ..8.29. 15.34. .7.42. .8.44. 15.86. .8.23. .9.25. 17.48. .8.36. .9.42. .17.78. .10.31...11.36..21.67
.5.58. ..9.73. 15.31. .6.05. 10.32. 16.37. .6.43. 10.44. 16.86. .6.54. 10.55. .17.09. .7.10. ..10.95..18.04
117.50. 102.34.237.84.122.18. 124.97.247.15.127.52.130.01..257.53.128.58.131.04..259.62.126.16.136.39..270.33
. . 35.8.. . . .36.8. . . .37.4. . . .37.5. . . .37.7
CedarRapidsMSA1(thousands)
1 The Cedar Rapids MSA is made up of Linn County, Benton County and Jones County. Note: Totals may not add up due to rounding.Source: Woods & Poole Economics, Inc., Copyright 2010, Woods & Poole Economics Inc., Washington, DC.
PopulationbyAgeGroupandGender
Under5years
5-9years
10-14years
15-19years
20-24years
25-34years
35-44years
45-54years
55-�4years
�5-74years
75+years
Total
MedianAge

11
Demographics
Male Female Total Male Female Total Male Female Total Male Female Total Male Female Total2000 2000 2000 2005 2005 2005 200� 200� 200� 200720072007 20082008 2008....4.00. ..3.81. .7.81. .4.63. ..4.54. 9.17. .4.72. ..4.63. .9.35. 4.75. ..4.65. .9.40. .4.79. .4.68. 9.47
..3.99. ..3.73. .7.72. .4.13. ..3.95. 8.08. .4.20. ..4.98. .8.27. 4.38. ..4.18. .8.56. .4.55. .4.32. 8.86
3.90. ..3.69. .7.59. .4.16. ..3.90. 8.06. .4.18. ..3.91. .809. 34.14...3.96. .8.10. .4.11. .3.99. 8.10
5.92. ..6.53....12.45. .6.15. ..6.73....12.87. .6.28. ..6.80. 13.08. 6.34. ..6.80. 13.13. .6.67. .6.80.....13.27
.
.9.92. ..9.91....19.83. .9.57. ..9.79....19.36. .9.64. ..9.67....19.31. 10.12...10.07. 20.18. .10.48..10.46...20.94
10.98. ..9.84....20.82. 11.51. ..10.53. 22.04. 11.34. .10.44. 21.76. 11.61...10.69. 22.29. .11.89..10.86...22.75
9.53. ..9.38....18.92. 9.89. ..9.21. 19.10. 9.84. ..9.40....19.34. 9.64. ..9.06. 18.69. .9.39..8.86.....18.25
8.14. ..8.29....16.43. 9.14. ..9.47. 18.62. 9.31. ..9.64....18.94. 9.33. ..9.69. 19.02. .9.40. 9.63.....19.03
4.17. ..4.42. 8.59. 5.79. ..5.94. 11.97. .6.44. ..6.40....12.60. 6.75. ..6.86. 13.61. .7.03. .7.32....14.34
2.70. ..3.24. 5.94. 2.82. ..3.42. 6.59. .3.12. ..3.67. 6.34. 3.26. ..3.76. 7.03. .3.43. .3.91.....7.35
2.19. ..3.87. 6.05. 2.49. ..4.09. 6.72. .2.60. ..4.30. 6.89. 2.66. ..4.36. 7.02. .2.71. .4.40.....7.10
65.45. .66.72..132.18. 70.70. .71.86..142.56. 71.72. .72.93..144.65. 72.95...74.09..147.04. 74.24..75.22.149.45
. ...........29.73. . ...........30.50. . ...........30.79. . ...........31.13. . ..........31.46
.
PopulationbyAgeGroupandGenderIowaCityMSA1(thousands)
1 The Iowa City MSA is made up of Johnson County and Washington County. Note: Totals may not add up due to rounding.Source: Woods & Poole Economics, Inc., Copyright 2008, Woods & Poole Economics Inc., Washington, DC.
Under5years
5-9years
10-14years
15-19years
20-24years
25-34years
35-44years
45-54years
55-�4years
�5-74years
75+years
Total
MedianAge

12
It'sallinthe
detailsMajorSourcesofPersonalIncome
CedarRapidsMSA1-2004Dollars2(Millions)
DistributionofPersonalIncomeCedarRapidsMSA1
1 The Cedar Rapids MSA is made up of Linn County, Benton County and Jones County.2All earnings, personal income and retail sales data in the Woods & Poole database are presented in 2004 dollars, these are "constantdollars"andareusedtomeasurethe"real"changeinearningsandincomewheninflationistakenintoaccount.3Earnings(earnedincome)isdefinedasthesumofwagesandsalaries,otherlaborincomeandproprietor’sincome.4ResidenceAdjustmentisdefinedastheincomeofcountyresidentsworkinginanothercountylesstheincomeofworkersfromotherareasworkinginthecounty.Anegativeresidenceadjustment(asinLinnCounty)impliesthatthecountyhasanumberofworkerswhocommuteintothecountytowork,butdonotresidethere.Source: Woods & Poole Economics, Inc., Copyright 2010, Woods & Poole Economics Inc., Washington, DC.
2000 2005 2008 2009 2010 2015
Personal.Income.(millions.'042.$). $7,708.75. $7,981.50. $8,806.05. $8,865.73. $9,050.81. $10,098.35Total.Population.(000s). 237.84. 247.15. 255.45. 257.53. 259.62. 270.33..Income.Per.Capita.(current.$). 29,903. 33,244. 38,672. 39,435. 40,936. 51,222..Income.Per.Capita.('04.$). 32,412. 32,294. 34,472. 34,427. 34,862. 37,355
Number.of.Households.(000s). 94.46. 199.97. 104.77. 106.15. 107.52. 114.25..Persons.Per.Household. 2.44. 2.40. 2.37. 2.36. 2.35. 2.30..Mean.Household.Income.(current.$). 73,539. 80,223. 92,123. 93,480. 96,583. 118,442..Mean.Household.Income.('04.$). ..79,711. 77,930. 82,120. 81,607. 82,251. 86,378.Wealth.Index3.(U.S.=100). 101.95. 97.64. 98.02. 98.83. ..98.82. 99.09
2000 2005 2008 2009 2010 2015
Total.Earnings3. $6,398.52. $6,616.18. $7,262.20. $7,257.62. $7,529.19. $8,164.55. Wages.and.Salaries. 4,962.22. 4,984.04. 5,438.56. 5,497.06. 5,720.63. 6,206.91. Other.Labor.Income. 967.69. 1,181.10. 1,260.50. 1,296.08. 1,334.81. 1,447.67. Proprietors.Income. 468.62. 415.04. 563.14. 464.49. 473.75. 509.97Dividends,.Interest.&.Rent. 1,411.98. 1,249.08. 1,383.20. 1,339.11. 1,376,89. 1,573.07Transfer.Payments.to.Persons. 843.50. 1,060.02. 1,218.22. 1,343.58. 1,312.04. 1,477.69Social.Insurance.Contribution.(less). (748.74). (772.14). (852.22). (869.78). (902.06). (1,005.13)Residence.Adjustment.(less)4. (196.51). (171.64). (205.35). (204.79). (265.25). (111.83)
PersonalIncome $7,708.75 $7,981.50 $8,80�.05 $8,8�5.73 $9,050.81$10,098.35

1�
Demographics
EducationLevelofCurrentWorkforce
LinnCounty JohnsonCounty
High.School.Graduate. 29.7%. 18.1%Some.College.or.Technical.Training. 23.2%. 18.3%Associate's.Degree. 11.0%. 8.6%Graduate.of.4-year.College. 20.9%. 25.8%Completed.Post.Graduate.Study. 8.1%. 23.9%
Source: U.S. Census Bureau, 2006-2008 American Community Survey, adults 25 years and older
EducationLevelofCurrentWorkforcebyIndustry(TechnologyCorridor)
SomeLevel BeyondHigh Undergraduate PostgraduateIndustry School Degree Degree
Agriculture,.Forestry.&.Mining. . 49.1%. . 10.9%. . 7.3%.Construction. . . . 55.0%. . 15.6%. . 2.8%Education. . . . 88.2%. . 32.1%. . 36.7%Personal.Services. . . 66.7%. . 10.6%. . 17.5%Finance,.Insurance.&.. . . 77.9%. . 24.4%. . 5.8%....Real.Estate. . . . . . . .Public.Administration./. . . 83.3%. . 23.1%. . 19.4%....Government..... . . . . . . .Health.Care.&.Social. . . 82.8%. . 28.8%. . 14.2%....ServicesManufacturing. . . . 50.6%. . 11.3%. . 5.1%Professional.Services. . . 76.1%. . 24.8%. . 17.9%Transportation,.Communication.. . 75.0%. . 18.6%. . 13.9%....&.UtilitiesEntertainment.&.Recreation. . 72.2%. . 27.8%. . 5.6%Wholesale/Retail.Trade. . . 60.6%. . 18.7%. . 6.1%
Source: 2008 Cedar Rapids/Iowa City Technology Corridor Laborshed
14
It'sallinthe
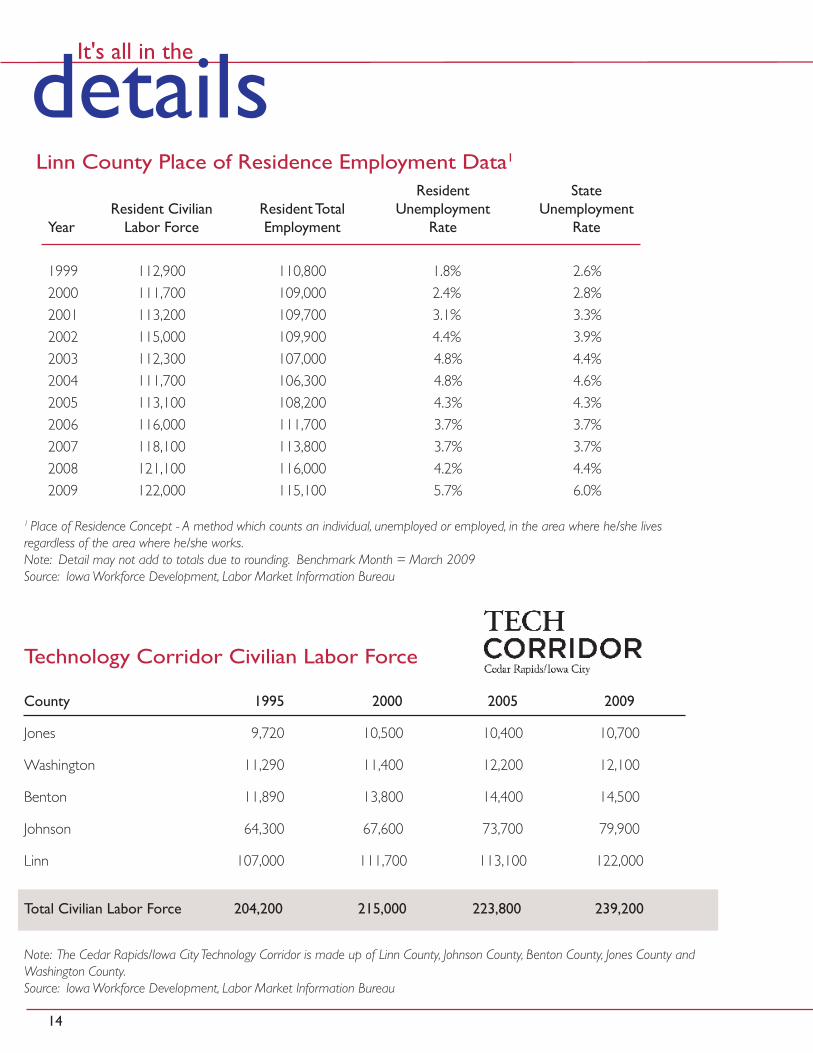
details Resident State ResidentCivilian ResidentTotal Unemployment UnemploymentYear LaborForce Employment Rate Rate
1999. 112,900. 110,800. 1.8%. 2.6%2000. 111,700. 109,000. 2.4%. 2.8%2001. 113,200. 109,700. 3.1%. 3.3%2002. 115,000. 109,900. 4.4%. 3.9%2003. 112,300. 107,000. .....4.8%.... 4.4%2004. 111,700. 106,300. ......4.8%. 4.6%.2005. 113,100. 108,200. ......4.3%. 4.3%2006. 116,000. 111,700. .....3.7%. 3.7%.2007. 118,100. 113,800. ......3.7%. 3.7%2008. 121,100. 116,000. ......4.2%. 4.4%2009. 122,000. 115,100. ......5.7%. 6.0%
1 Place of Residence Concept - A method which counts an individual, unemployed or employed, in the area where he/she lives regardlessoftheareawherehe/sheworks.Note:Detailmaynotaddtototalsduetorounding.BenchmarkMonth=March2009Source:IowaWorkforceDevelopment,LaborMarketInformationBureau
LinnCountyPlaceofResidenceEmploymentData1
County 1995 2000 2005 2009 Jones. . . 9,720. 10,500. 10,400. . 10,700. .
Washington. . . 11,290. 11,400. 12,200. . 12,100. .
Benton. . . 11,890. 13,800. 14,400. . 14,500. .
Johnson. . . 64,300. 67,600. 73,700. . 79,900. .. .Linn. . . 107,000. 111,700. 113,100. . 122,000.
TotalCivilianLaborForce 204,200 215,000 223,800 239,200
Note: The Cedar Rapids/Iowa City Technology Corridor is made up of Linn County, Johnson County, Benton County, Jones County and Washington County.Source:IowaWorkforceDevelopment,LaborMarketInformationBureau
TechnologyCorridorCivilianLaborForce
1�
Demographics
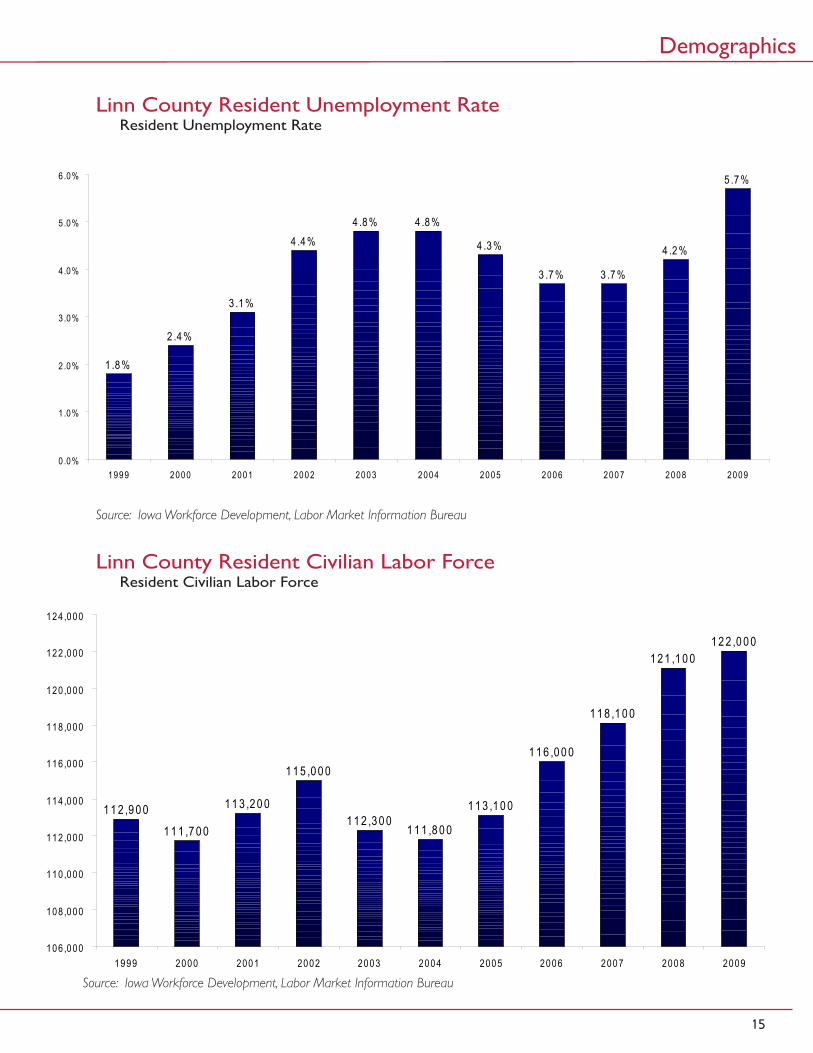
Source:IowaWorkforceDevelopment,LaborMarketInformationBureau
LinnCountyResidentCivilianLaborForceResidentCivilianLaborForce
Source:IowaWorkforceDevelopment,LaborMarketInformationBureau
LinnCountyResidentUnemploymentRateResidentUnemploymentRate
1 1 2 ,9 0 01 1 1 ,7 0 0
1 1 3 ,2 0 0
1 1 5 ,0 0 0
1 1 2 ,3 0 01 1 1 ,8 0 0
1 1 3 ,1 0 0
1 1 6 ,0 0 0
1 1 8 ,1 0 0
1 2 1 ,1 0 01 2 2 ,0 0 0
106 ,000
108 ,000
110 ,000
112 ,000
114 ,000
116 ,000
118 ,000
120 ,000
122 ,000
124 ,000
1999 2000 2001 2002 2003 2004 2005 2006 2007 2008 2009
1 .8 %
2 .4 %
3 .1 %
4 .4 %4 .8 % 4 .8 %
4 .3 %
3 .7 % 3 .7 %
4 .2 %
5 .7 %
0.0%
1.0%
2.0%
3.0%
4.0%
5.0%
6.0%
1999 2000 2001 2002 2003 2004 2005 2006 2007 2008 2009
1�
It'sallinthe
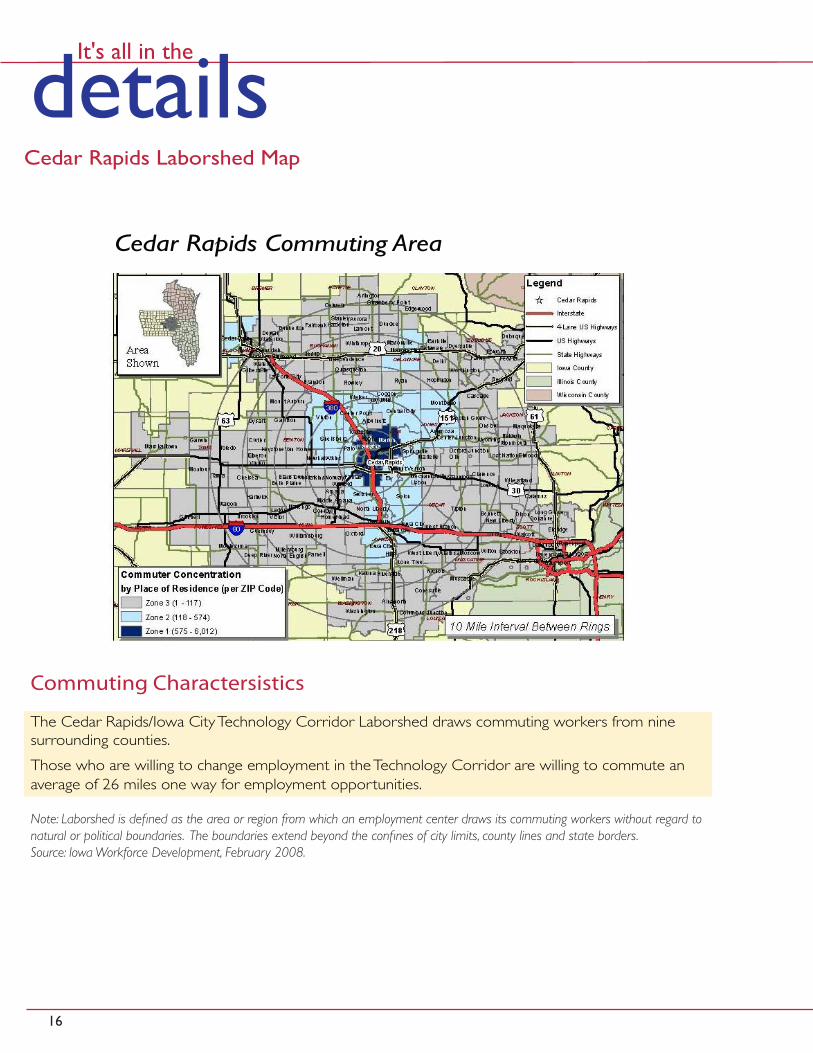
detailsCedarRapidsLaborshedMap
Note:Laborshedisdefinedastheareaorregionfromwhichanemploymentcenterdrawsitscommutingworkerswithoutregardtonaturalorpoliticalboundaries.Theboundariesextendbeyondtheconfinesofcitylimits,countylinesandstateborders.Source:IowaWorkforceDevelopment,February2008.
CommutingCharactersistics
The.Cedar.Rapids/Iowa.City.Technology.Corridor.Laborshed.draws.commuting.workers.from.nine.surrounding.counties.
Those.who.are.willing.to.change.employment.in.the.Technology.Corridor.are.willing.to.commute.an.average.of.26.miles.one.way.for.employment.opportunities.
Cedar Rapids Commuting Area
1�
Demographics
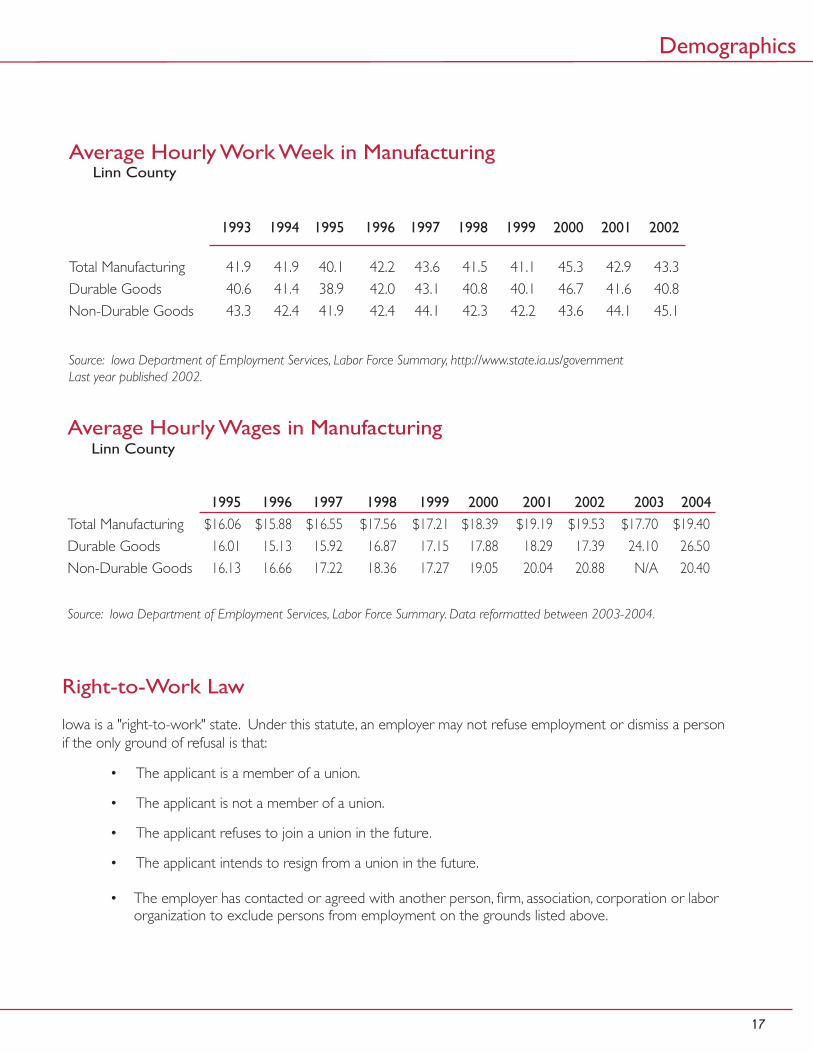
AverageHourlyWorkWeekinManufacturingLinnCounty
1993 1994 1995 199� 1997 1998 1999 2000 2001 2002
Total.Manufacturing. . 41.9. 41.9. 40.1. 42.2. 43.6. 41.5. 41.1. 45.3. 42.9. 43.3Durable.Goods.. . 40.6. 41.4. 38.9. 42.0. 43.1. 40.8. 40.1. 46.7. 41.6. 40.8Non-Durable.Goods. . 43.3. 42.4. 41.9. 42.4. 44.1. 42.3. 42.2. 43.6. 44.1. 45.1
Source: Iowa Department of Employment Services, Labor Force Summary, http://www.state.ia.us/governmentLast year published 2002.
AverageHourlyWagesinManufacturingLinnCounty
1995 199� 1997 1998 1999 2000 2001 200220032004Total.Manufacturing.. $16.06. $15.88. $16.55. $17.56. $17.21. $18.39.....$19.19... $19.53. $17.70....$19.40Durable.Goods... 16.01. 15.13. 15.92. 16.87. 17.15. 17.88. 18.29. 17.39. 24.10. 26.50Non-Durable.Goods. 16.13. 16.66. 17.22. 18.36. 17.27. 19.05. ..20.04. 20.88. N/A. 20.40
Source: Iowa Department of Employment Services, Labor Force Summary. Data reformatted between 2003-2004.
Right-to-WorkLaw
Iowa.is.a."right-to-work".state...Under.this.statute,.an.employer.may.not.refuse.employment.or.dismiss.a.person.if.the.only.ground.of.refusal.is.that:
.The.applicant.is.a.member.of.a.union.
.The.applicant.is.not.a.member.of.a.union.
.The.applicant.refuses.to.join.a.union.in.the.future.
.The.applicant.intends.to.resign.from.a.union.in.the.future.
The employer has contacted or agreed with another person, firm, association, corporation or labor . . organization.to.exclude.persons.from.employment.on.the.grounds.listed.above.
•
•
•
•
•

18
It'sallinthe
details2000CensusOccupationalAttachmentoftheCivilianLaborForceforLinnCountybyRace,GenderandEEO-1Category African American 2ormore/EEO-1Category Total Female WhiteAmericanIndianAsian Hispanic other
Officials/Mgrs. 11,890 4,571 11,525 75 8 145 69 72....................... . . 38.4%....... 96.9%....... 0.6%....... 0.0%. 1.2%........ 0.6%.. 0.6%
Professionals....... . 21,605........11,069. 20,360. 270. 25. 595. 190.. 168.................................. . 51.2%. 94.2%. 1.2%. 0.1%. 2.8%. 0.9%.. 0.7%................................Technicians........... . 2,545. 1,412. 2,425. 35. 10. 30. 23.. 14.................................. . 55.5%. 95.3%. 1.4%. 0.4%. 1.2%. 0.9%.. 0.6%.
Sales.Workers.......... 12,555. 6,069. 11,995. 155. 50. 95. 185.. 64.................................. . 48.3%. 95.5%. 1.2%. 0.4%. 0.8%. 1.5%.. 0.5%
Administration.. . 19,945. 15,034. 18,930. 510. 55. 175. 175. 103...Support.Wkrs........ . 75.9%. 94.6%. 2.6%. 0.3%. 0.9%... 0.9%.. 0.5%
Craft.Workers. . 9,300. 682. 8,980. 95. 24. 30. 105.. 58................................... . 7.3%. 96.6%. 1.0%. 0.3%.. 0.3%. 1.1%.. 0.6%
Operatives. . 12,465. 3,537. 11,470. 520. 55. 190. 134.. 88.................................. . 28.4%. 92.0%. 4.2%. 0.4%. 1.5%. 1.1%.. 0.7%
Laborers.&............ . .3,940. 618. 3,645. 110. 0.. 25. 115. 47...Helpers.............. . . 15.7%. 92.5%. 2.8%. 0.0%. 0.6%. 2.9%.. 1.2%
Service.Workers.. . 13,125. 8,250. 12,150. 310. 80. 145.. 280.. 135.................................. . 62.9%. 92.6%. 2.4%. 0.6%. 1.1%. 2.1%.. 1.1%
LaborForce 107,370 51,242 101,480 2,080 307 1,430 1,27� 749 43.�% 94.5% 1.9% 0.3% 1.2% 1.3% 0.7%
Source:BureauoftheCensus,2000SpecialEEOFileandLaborMarketInformationBureau,IowaWorkforceDevelopment

1�
Demographics
StatePersonalIncomeTax
The.basis.for.Iowa.taxable.income.is.the.adjusted.gross.income.as.reported.on.your.federal.income.tax.return...Thus,.for.the.most.part.Iowa.has.adopted.the.same.exclusions.from.income.like.the.IRA.and.Keogh.contribu-tions,.“combat.zone”.military.pay,.and.foreign-earned.income.as.allowed.for.federal.tax.purposes...In.certain.cases,.interest.earned.on.state.and/or.municipal.bonds.is.taxable,.while.interest.earned.on.certain.federal.securi-ties.is.exempt.
To.this.base.a.number.of.adjustments.are.made,.for.example:
There.is.an.option.of.either.taking.a.standard.deduction.or.itemizing...With.the.exception.of.Iowa.income.tax,.the.itemized.deductions.allowed.for.federal.tax.purposes.are.allowable.on.the.Iowa.income.tax.return...For.income earned in 2009, the standard deduction for taxpayers filing as unmarried head of household, qualifying widower and married filing jointly is $4,390. The standard deduction for single taxpayers and married taxpayers filing separately is not to exceed $1,780.
There.are.also.a.number.of.special.credits.for.taxpayers.who.itemize...Some.of.those.include:
.
CurrentRates
. %.Tax.Rate. . Taxable.Income
. 0.36% on the first $0
. 0.72%. on.the.second. 1,428
. 2.43%. on.the.next. 2,856
. 4.50%. on.the.next. 5,712
. 6.12%. on.the.next. 12,852
. 6.48%. on.the.next. 21,420
. 6.80%. on.the.next. 28,560
. 7.92%. on.the.next. 42,840
. 8.98%. on.all.over. 64,260
Note: For an example of how federal deductions are applied, please refer to www.state.ia.us/government/drf Source: www.state.ia.us/government/drf
100%offederalincometaxespaidare deducted.Mostotherstatesdonotallowthis.
.interest.from.most.state.and.municipal.obligations... is.added,.except.certain.Iowa.securities;
interest.from.federal.securities.is.subtracted;
certain.pension.income.up.to.$6,000.($12,000.on... .a.joint.return).may.be.deducted;
100%.of.health.insurance.premiums.(not.other-.. .wise.excluded).are.deducted;
special.Iowa.capital.gains.deduction.for.certain... .qualifying.capital.gains;.and
certain.disability.income.may.be.excluded.
.a.credit.for.child.and.dependent.care;.or.early.......... ...childhood.development
an.earned.income.credit;
a 25% credit on the first $1,000 paid per child for ....... .text.books.and.tuition.expenses.for.grades.kinder-......... .garten.through.12th.grade.
a.personal.exemption.credit.of.$40.each.for..the... . taxpayer.and.spouse;
additional.$20.exemption.credits.for.each.who... . is.over.65.years.old.and/or.legally.blind;
.for.each.dependent,.there.is.a.$40.credit;
20
It'sallinthe
details
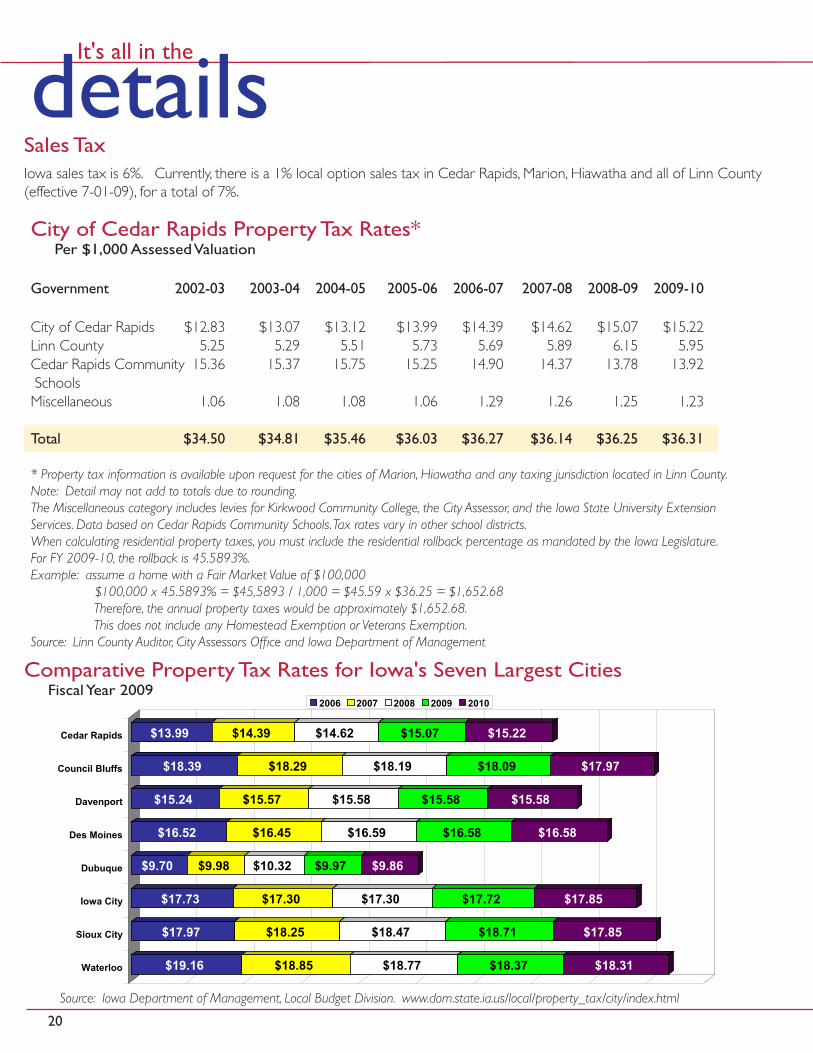
ComparativePropertyTaxRatesforIowa'sSevenLargestCitiesFiscalYear2009
Source: Iowa Department of Management, Local Budget Division. www.dom.state.ia.us/local/property_tax/city/index.html
SalesTaxIowa.sales.tax.is.6%....Currently,.there.is.a.1%.local.option.sales.tax.in.Cedar.Rapids,.Marion,.Hiawatha.and.all.of.Linn.County.(effective.7-01-09),.for.a.total.of.7%...
CityofCedarRapidsPropertyTaxRates*Per$1,000AssessedValuation
Government 2002-03 2003-04 2004-05 2005-0� 200�-07 2007-08 2008-09 2009-10City.of.Cedar.Rapids. $12.83. $13.07. $13.12. $13.99. $14.39. $14.62. $15.07. $15.22Linn.County. 5.25. 5.29. 5.51. 5.73. 5.69. 5.89. 6.15. 5.95Cedar.Rapids.Community. 15.36. 15.37. 15.75. 15.25. 14.90. 14.37. 13.78. 13.92.SchoolsMiscellaneous. 1.06. 1.08. 1.08. 1.06. 1.29. 1.26. 1.25. 1.23Total $34.50 $34.81 $35.4� $3�.03 $3�.27 $3�.14 $3�.25 $3�.31
* Property tax information is available upon request for the cities of Marion, Hiawatha and any taxing jurisdiction located in Linn County.Note: Detail may not add to totals due to rounding.TheMiscellaneouscategoryincludesleviesforKirkwoodCommunityCollege,theCityAssessor,andtheIowaStateUniversityExtensionServices. Data based on Cedar Rapids Community Schools. Tax rates vary in other school districts. Whencalculatingresidentialpropertytaxes,youmustincludetheresidentialrollbackpercentageasmandatedbytheIowaLegislature.ForFY2009-10,therollbackis45.5893%.Example:assumeahomewithaFairMarketValueof$100,000$100,000x45.5893%=$45,5893/1,000=$45.59x$36.25=$1,652.68Therefore,theannualpropertytaxeswouldbeapproximately$1,652.68.ThisdoesnotincludeanyHomesteadExemptionorVeteransExemption.Source:LinnCountyAuditor,CityAssessorsOfficeandIowaDepartmentofManagement
$19.16 $18.85 $18.77 $18.37 $18.31
$17.97 $18.25 $18.47 $18.71 $17.85
$17.73 $17.30 $17.30 $17.72 $17.85
$9.70 $9.98 $10.32 $9.97 $9.86
$16.52 $16.45 $16.59 $16.58 $16.58
$15.24 $15.57 $15.58 $15.58 $15.58
$18.39 $18.29 $18.19 $18.09 $17.97
$13.99 $14.39 $14.62 $15.07 $15.22Cedar Rapids
Council Bluffs
Davenport
Des Moines
Dubuque
Iowa City
Sioux City
Waterloo
2006 2007 2008 2009 2010

21
Demographics
TheCedarRapidsAreaLargestEmployersService
Organization HeadquaterLocation Industry Employees
AEGON.USA. The.Hauge,.The.Netherlands. Insurance/Financial. . 3,987Mercy.Medical.Center. . . Cedar.Rapids,.Iowa. . Healthcare. . . 1,724St..Luke's.Hospital. . . Cedar.Rapids,.Iowa. . Healthcare. . . 1,644Yellowbook.USA. . . Berkshire,.United.Kingdom. Customer.Service. . ..906Alliant.Energy. . . . Madison,.Wisconsin. . Utility. . . . ..881Nordstrom.Direct. . . Seattle,.Washington. . Logistics/Distribution. . ..851Kirkwood.Community.College. . Cedar.Rapids,.Iowa. . Education. . . ..785Verizon.Business. . . New.York,.New.York. . Customer.Service. . ..700NextEra.Energy.Duane.Arnold,.LLC. Juno.Beach,.Florida. . Utility. . . . ..619GE.Financial. . . . Danbury,.Connecticut. . Insurance/Financial. . ..600APAC Customer Service Deerfield, Illinois Customer Service 600Toyota.Finacial.Services.. . Torrance,.California. . Insurance/Financial. . ..585U.S..Cellular. . . . Chicago,.Illinois. . . Customer.Service. . ..549West.Side.Transport,.Inc. . Cedar.Rapids,.Iowa. . Logistics/Distribution. . ..530Paetec. . . . . Fairport,.New.York. . Customer.Service. . ..518CRST. . . . . Cedar.Rapids,.Iowa. . Logistics/Distribution. . ..400United.Fire.Group. . . Cedar.Rapids,.Iowa. . Insurance/Financial. . ..394St..Luke's.Physicians.&.Clinics. . Cedar.Rapids,.Iowa. . Healthcare. . . ..347Van.Meter.Industrial. . . Cedar.Rapids,.Iowa. . Logistics/Distribution. . ..344Physicians'.Clinic.of.Iowa. . Cedar.Rapids,.Iowa. . Healthcare. . . ..335Worley.Warehousing. . . Cedar.Rapids,.Iowa. . Logistics/Distribution. . ..300GreatAmerica.Leasing.Corporation. Cedar.Rapids,.Iowa. . Insurance/Financial. . ..281Coe.College. . . . Cedar.Rapids,.Iowa. . Education. . . ..276SourceMedia.Group. . . Cedar.Rapids,.Iowa. . News/Media. . . ..272Principal.Financial.Group. . Des.Moines,.Iowa. . Insurance/Financial. . ..251Intermec.Technologies.Corporation. Woodland.Hills,.California. Electronic.Equipment.&.Design. ..250Skogman.Companies. . . Cedar.Rapids,.Iowa. . Real.Estate. . .. ..250Pearson.. . . . London,.England. . Information.Services. .. ..249Cornell.College.. . . Mount.Vernon,.Iowa. . Education. . . ..244PRC. . . . . Plantation,.Florida. . Customer.Service. . ..203RuffaloCODY. . . . Cedar.Rapids,.Iowa. . Information.Services. . ..175Wells.Fargo.Bank. . . San.Francisco,.California.. Banking.. . . ..170Mount.Mercy.College. . . Cedar.Rapids,.Iowa. . Education. . . ..159StoneRiver. . . . Oakland,.California. . Information.Services. . ..152Reinhardt.Food.Service.. . La.Crosse,.Wisconsin. . Logistics/Distribution. . ..120Nash.Finch.Company. . . Minneapolis,.Minnesota. . Logistics/Distribution. . ..120Skyworks.Solutions. . . Woburn,.Massachusetts.. Electronic.Equipment.&.Design. ..100GoDaddy. . . . Phoenix,.Arizona. . Information.Services. . ..100
Full-time employment as of July 2010

22
It'sallinthe
detailsTheCedarRapidsAreaLargestEmployers
Manufacturing
Organization HeadquaterLocation Industry Employees
Rockwell.Collins,.Inc. Cedar.Rapids,.Iowa. . Electronic.Equipment.&.Design. 8,600Whirlpool.Corporation. Benton.Harbor,.Michigan. Process.Manufacturing. . 2,300Quaker.Food.&.Snacks. Chicago,.Illinois. . . Food.Processing. . 1,058General.Mills. Minneapolis,.Minnesota. . Food.Processing. . ..667Archer.Daniels.Midland. Decatur,.Illinois. . . Bioprocessing/Food.Ingredient. ..470Cargill,.Inc. Minneapolis,.Minnesota. . Bioprocessing/Food.Ingredient. ..420PMX.Industries,.Inc. Seoul,.Korea. . . Process.Manufacturing. . ..397Schneider.Electric. Paris,.France. . . Electronic.Equipment.&.Design. ..351International.Paper. Memphis,.Tennessee. . Process.Manufacturing. . ..346Clipper.WindPower. Carpinteria,.California. . Equipment.Manufacturing. ..299Penford.Products.Company. Denver,.Colorado. . Bioprocessing/Food.Ingredient. ..215Apache.Hose.&.Belting,.Inc. Cedar.Rapids,.Iowa. . Process.Manufacturing. . ..188H.J..Heinz.Company. Pittsburgh,.Pennsylvania. . Food.Processing. . ..165Terex-Cedarapids,.Inc. Westport,.Connecticut. . Process.Manufacturing. . ..158Ralston.Foods. St..Louis,.Missouri. . Food.Processing. . ..150Vector.Corporation. Marion,.Iowa. . . Equipment.Manufacturing. ..150Evergreen.Packaging.Equipment. Memphis,.Tennessee. . Equipment.Manufacturing. ..144U.S..Corrugated,.Inc. Newark,.New.Jersey. . Process.Manufacturing. . ..144Color.Web.Printers. Cedar.Rapids,.Iowa. . Printing.. . . ..144Highway.Equipment.Company. Cedar.Rapids,.Iowa. . Equipment.Manufacturing. ..130Diamond.V.Mills. Cedar.Rapids,.Iowa. . Bioprocessing/Food.Ingredient. ..125Genencor,.A.Danisco.Division. Copenhagen,.Denmark. . Bioprocessing/Food.Ingredient. ..117J&A.Printing. Hiawatha,.Iowa. . . Printing.. . . ..115H.S..Industries,.Inc. Cedar.Rapids,.Iowa. . Process.Manufacturing. . ..108Pickwick.Manufacturing.Services. Cedar.Rapids,.Iowa. . Contract.Manufacutring.. ..108Red.Star.Yeast. Lillie,.France. . . Bioprocessing/Food.Ingredient. ..106Midwest.Metal.Products. Cedar.Rapids,.Iowa. . Contract.Manufacturing.. ..106The.Fisher.Group. Cedar.Rapids,.Iowa. . Printing.. . . ..100
Full-time employment as of July 2010
2�
Demographics
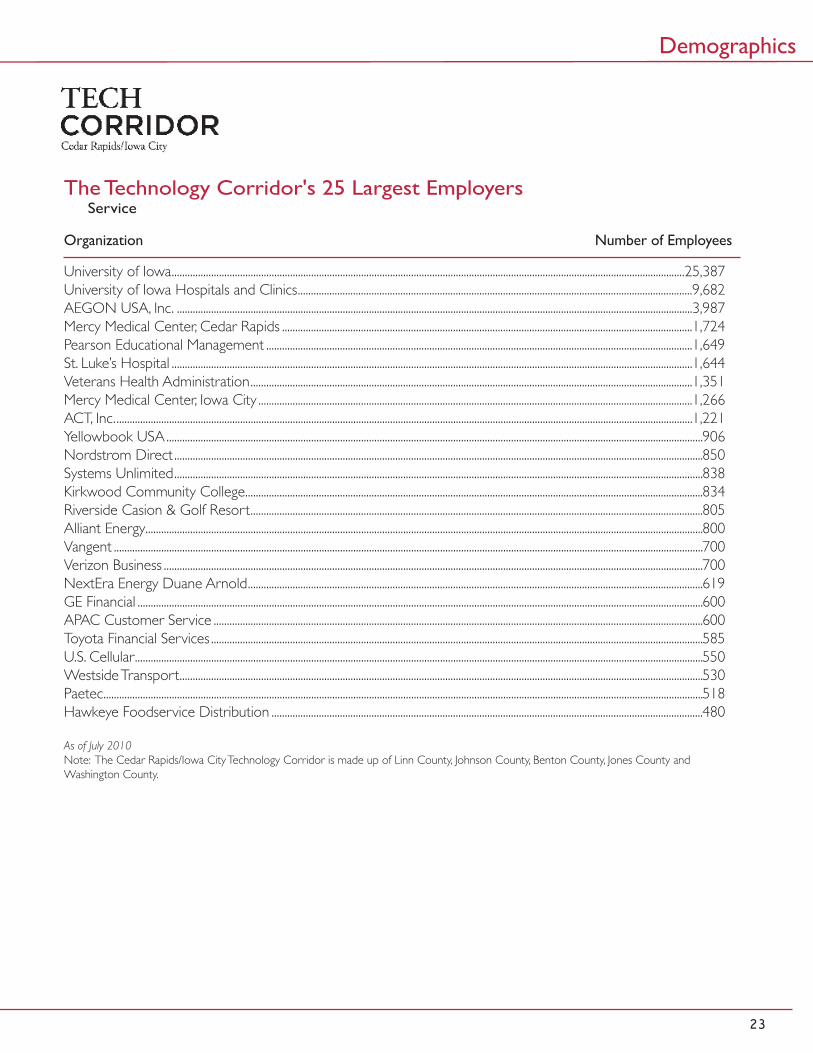
TheTechnologyCorridor's25LargestEmployersService
Organization NumberofEmployees
University.of.Iowa....................................................................................................................................................................................................25,387University.of.Iowa.Hospitals.and.Clinics.......................................................................................................................................................9,682AEGON.USA,.Inc......................................................................................................................................................................................................3,987Mercy.Medical.Center,.Cedar.Rapids.............................................................................................................................................................1,724Pearson.Educational.Management...................................................................................................................................................................1,649St..Luke’s.Hospital.......................................................................................................................................................................................................1,644Veterans.Health.Administration.........................................................................................................................................................................1,351Mercy.Medical.Center,.Iowa.City......................................................................................................................................................................1,266ACT,.Inc.............................................................................................................................................................................................................................1,221Yellowbook.USA.............................................................................................................................................................................................................906Nordstrom.Direct..........................................................................................................................................................................................................850Systems.Unlimited..........................................................................................................................................................................................................838Kirkwood.Community.College...............................................................................................................................................................................834Riverside.Casion.&.Golf.Resort.............................................................................................................................................................................805Alliant.Energy.....................................................................................................................................................................................................................800Vangent.................................................................................................................................................................................................................................700Verizon.Business..............................................................................................................................................................................................................700NextEra.Energy.Duane.Arnold..............................................................................................................................................................................619GE.Financial........................................................................................................................................................................................................................600APAC.Customer.Service...........................................................................................................................................................................................600Toyota.Financial.Services............................................................................................................................................................................................585U.S..Cellular.........................................................................................................................................................................................................................550Westside.Transport........................................................................................................................................................................................................530Paetec.....................................................................................................................................................................................................................................518Hawkeye.Foodservice.Distribution.....................................................................................................................................................................480
As of July 2010Note:..The.Cedar.Rapids/Iowa.City.Technology.Corridor.is.made.up.of.Linn.County,.Johnson.County,.Benton.County,.Jones.County.and.Washington.County.. .

24
It'sallinthe
detailsTheTechnologyCorridor's25LargestEmployers
Manufacturing
Rockwell.Collins,.Inc....................................................................................................................................................................................................9,428Whirlpool.Corporation............................................................................................................................................................................................2,300Quaker.Oats.Co............................................................................................................................................................................................................1,058Procter.&.Gamble............................................................................................................................................................................................................720General.Mills,.Inc................................................................................................................................................................................................................667Oral.B.Laboratories........................................................................................................................................................................................................493Archer.Daniels.Midland................................................................................................................................................................................................470Integrated.DNA.Technologies...................................................................................................................................................................................462Cargill,.Inc...............................................................................................................................................................................................................................420PMX.Industries.Inc...........................................................................................................................................................................................................397International.Automotive.Components..............................................................................................................................................................365Schneider.Electric.............................................................................................................................................................................................................351International.Paper...........................................................................................................................................................................................................346Centro.....................................................................................................................................................................................................................................309Cliper.WindPower...........................................................................................................................................................................................................299RR.Donnelly.........................................................................................................................................................................................................................223Penford.Products.Company.......................................................................................................................................................................................215CIVCO.Medical.Instruments.....................................................................................................................................................................................204Apache.Hose.&.Belting.Inc.........................................................................................................................................................................................188Loparex,.Inc...........................................................................................................................................................................................................................169H.J..Heinz.Company........................................................................................................................................................................................................165Terex-Cedarapids,.Inc.....................................................................................................................................................................................................158Vector.Corporation.........................................................................................................................................................................................................150Ralston.Foods......................................................................................................................................................................................................................150US.Corrugated,.Inc...........................................................................................................................................................................................................144
As of July 2010Note:..The.Cedar.Rapids/Iowa.City.Technology.Corridor.is.made.up.of.Linn.County,.Johnson.County,.Benton.County,.Jones.County.and.Washington.County.
Organization NumberofEmployees
2�
Demographics
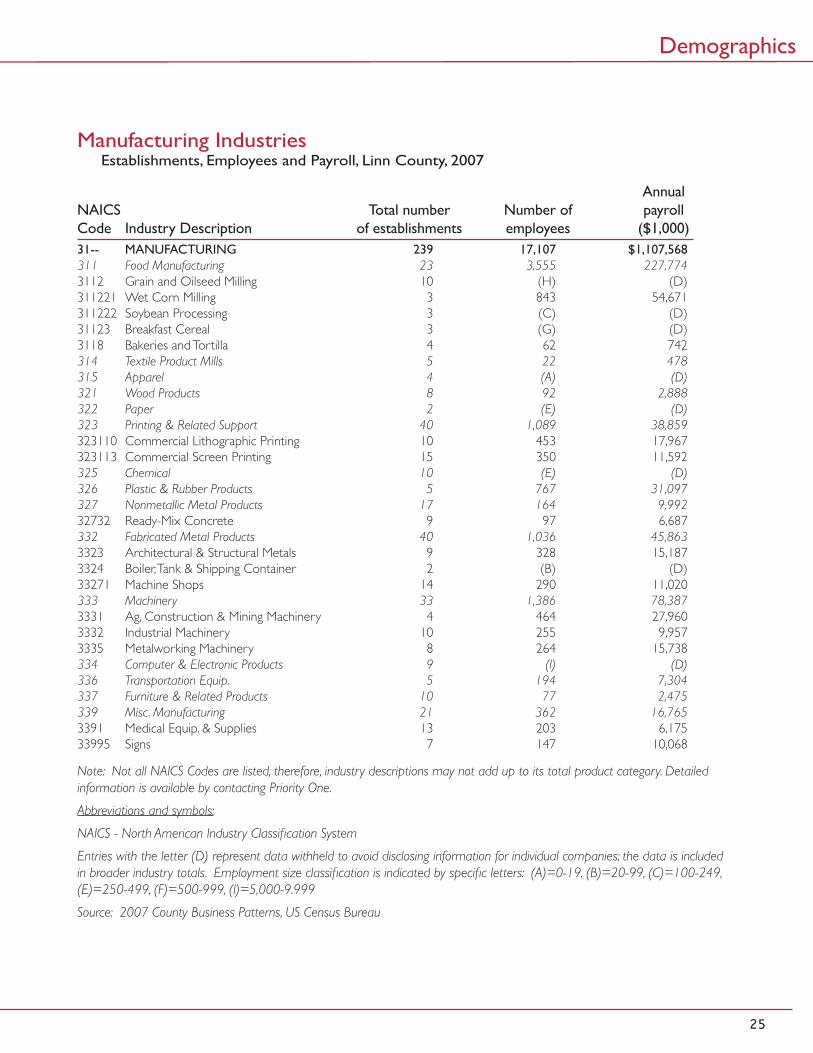
ManufacturingIndustriesEstablishments,EmployeesandPayroll,LinnCounty,2007
AnnualNAICS Totalnumber Numberof payrollCode IndustryDescription ofestablishments employees ($1,000)
Note: Not all NAICS Codes are listed, therefore, industry descriptions may not add up to its total product category. Detailed information is available by contacting Priority One.
Abbreviations and symbols:
NAICS-NorthAmericanIndustryClassificationSystem
Entries with the letter (D) represent data withheld to avoid disclosing information for individual companies; the data is included inbroaderindustrytotals.Employmentsizeclassificationisindicatedbyspecificletters:(A)=0-19,(B)=20-99,(C)=100-249,(E)=250-499,(F)=500-999,(I)=5,000-9.999
Source: 2007 County Business Patterns, US Census Bureau
31-- MANUFACTURING 239 17,107 $1,107,5�8311 Food Manufacturing 23 3,555 227,7743112. Grain.and.Oilseed.Milling. 10. (H). (D)311221. Wet.Corn.Milling. 3. 843. 54,671311222. Soybean.Processing. 3. (C). (D)31123. Breakfast.Cereal. 3. (G). (D)3118. Bakeries.and.Tortilla. 4. 62. 742314 Textile Product Mills 5 22 478315 Apparel 4 (A) (D)321 Wood Products 8 92 2,888322 Paper 2 (E) (D)323 Printing & Related Support 40 1,089 38,859323110 Commercial Lithographic.Printing 10. 453. 17,967323113 Commercial.Screen.Printing 15 350 11,592325 Chemical 10 (E) (D)326 Plastic & Rubber Products 5 767 31,097327 Nonmetallic Metal Products 17 164 9,99232732. Ready-Mix.Concrete. 9. 97. 6,687332 Fabricated Metal Products 40 1,036 45,8633323. Architectural.&.Structural.Metals. 9. 328. 15,1873324. Boiler,.Tank.&.Shipping.Container. 2. (B). (D)33271. Machine.Shops. 14. 290. 11,020333 Machinery 33 1,386 78,3873331. Ag,.Construction.&.Mining.Machinery. 4. 464. 27,9603332. Industrial.Machinery. 10. 255. 9,9573335. Metalworking.Machinery. 8. 264. 15,738334 Computer & Electronic Products 9 (I) (D)336 Transportation Equip. 5 194 7,304337 Furniture & Related Products 10 77 2,475339 Misc. Manufacturing 21 362 16,7653391. Medical.Equip..&.Supplies. 13. 203. 6,17533995. Signs. 7. 147. 10,068
2�
It'sallinthe
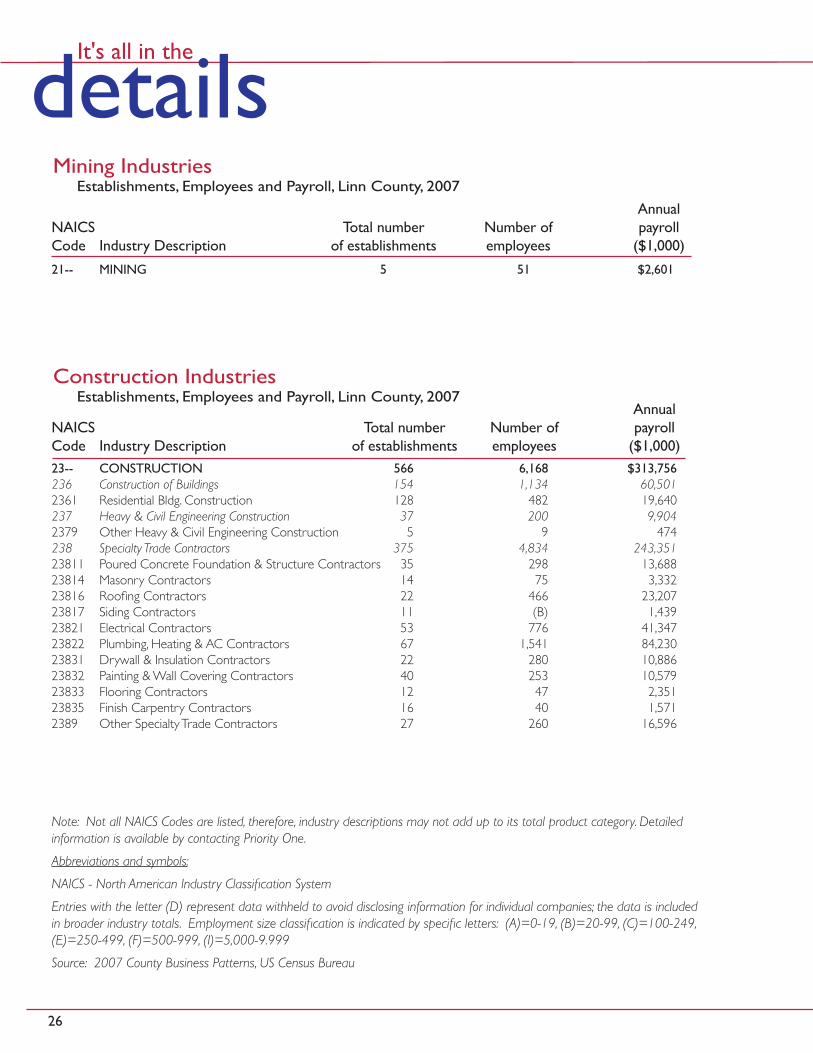
detailsMiningIndustries
Establishments,EmployeesandPayroll,LinnCounty,2007 AnnualNAICS Totalnumber Numberof payrollCode IndustryDescription ofestablishments employees ($1,000)
21-- MINING 5 51 $2,�01
ConstructionIndustriesEstablishments,EmployeesandPayroll,LinnCounty,2007
AnnualNAICS Totalnumber Numberof payrollCode IndustryDescription ofestablishments employees ($1,000)
Note: Not all NAICS Codes are listed, therefore, industry descriptions may not add up to its total product category. Detailed information is available by contacting Priority One.
Abbreviations and symbols:
NAICS-NorthAmericanIndustryClassificationSystem
Entries with the letter (D) represent data withheld to avoid disclosing information for individual companies; the data is included inbroaderindustrytotals.Employmentsizeclassificationisindicatedbyspecificletters:(A)=0-19,(B)=20-99,(C)=100-249,(E)=250-499,(F)=500-999,(I)=5,000-9.999
Source: 2007 County Business Patterns, US Census Bureau
23-- CONSTRUCTION 5�� �,1�8 $313,75�236 Construction of Buildings 154 1,134 60,5012361. Residential.Bldg..Construction. 128. 482. 19,640237 Heavy & Civil Engineering Construction 37 200 9,9042379. Other.Heavy.&.Civil.Engineering.Construction. 5. 9. 474238 Specialty Trade Contractors 375 4,834 243,35123811. Poured.Concrete.Foundation.&.Structure.Contractors. 35. 298. 13,68823814. Masonry.Contractors. 14. 75. 3,33223816 Roofing Contractors 22 466 23,20723817. Siding.Contractors. 11. (B). 1,43923821. Electrical.Contractors. 53. 776. 41,34723822. Plumbing,.Heating.&.AC.Contractors. 67. 1,541. 84,23023831. Drywall.&.Insulation.Contractors. 22. 280. 10,88623832. Painting.&.Wall.Covering.Contractors. 40. 253. 10,57923833. Flooring.Contractors. 12. 47. 2,35123835. Finish.Carpentry.Contractors. 16. 40. 1,5712389. Other.Specialty.Trade.Contractors. 27. 260. 16,596
2�
Demographics
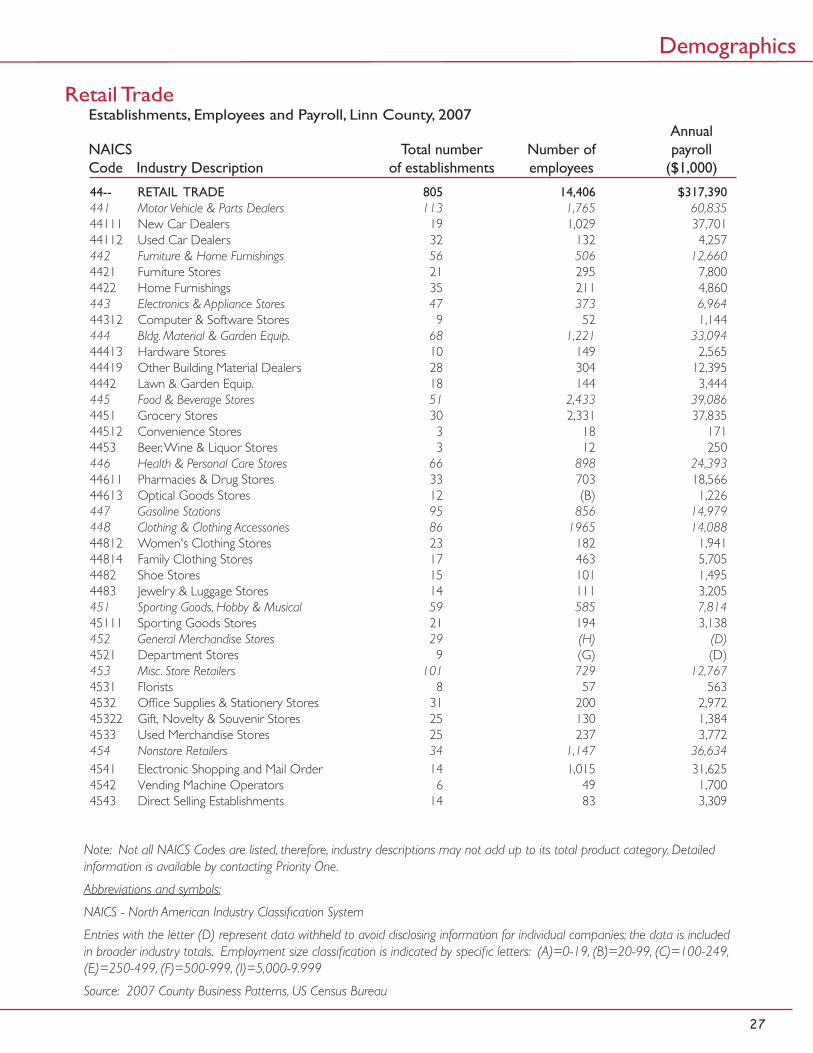
RetailTrade
Establishments,EmployeesandPayroll,LinnCounty,2007
Note: Not all NAICS Codes are listed, therefore, industry descriptions may not add up to its total product category. Detailed information is available by contacting Priority One.
Abbreviations and symbols:
NAICS-NorthAmericanIndustryClassificationSystem
Entries with the letter (D) represent data withheld to avoid disclosing information for individual companies; the data is included inbroaderindustrytotals.Employmentsizeclassificationisindicatedbyspecificletters:(A)=0-19,(B)=20-99,(C)=100-249,(E)=250-499,(F)=500-999,(I)=5,000-9.999
Source: 2007 County Business Patterns, US Census Bureau
44-- RETAILTRADE 805 14,40� $317,390441 MotorVehicle&PartsDealers 113 1,765 60,83544111. New.Car.Dealers. 19. 1,029. 37,70144112. Used.Car.Dealers. 32. 132. 4,257442 Furniture & Home Furnishings 56 506 12,6604421. Furniture.Stores. 21. 295. 7,8004422. Home.Furnishings. 35. 211. 4,860443 Electronics & Appliance Stores 47 373 6,96444312. Computer.&.Software.Stores. 9. 52. 1,144444 Bldg. Material & Garden Equip. 68 1,221 33,09444413. Hardware.Stores. 10. 149. 2,56544419. Other.Building.Material.Dealers. 28. 304. 12,3954442. Lawn.&.Garden.Equip.. 18. 144. 3,444445 Food & Beverage Stores 51 2,433 39,0864451. Grocery.Stores. 30. 2,331. 37,83544512. Convenience.Stores. 3. 18. 1714453. Beer,.Wine.&.Liquor.Stores. 3. 12. 250446 Health & Personal Care Stores 66 898 24,39344611. Pharmacies.&.Drug.Stores. 33. 703. 18,56644613. Optical.Goods.Stores. 12. (B). 1,226447 Gasoline Stations 95 856 14,979448 Clothing & Clothing Accessories 86 1965 14,08844812. Women's.Clothing.Stores. 23. 182. 1,94144814. Family.Clothing.Stores. 17. 463. 5,7054482. Shoe.Stores. 15. 101. 1,4954483. Jewelry.&.Luggage.Stores. 14. 111. 3,205451 Sporting Goods, Hobby & Musical 59 585 7,81445111. Sporting.Goods.Stores. 21. 194. 3,138452 General Merchandise Stores 29 (H) (D)4521. Department.Stores. 9. (G). (D)453 Misc. Store Retailers 101 729 12,7674531. Florists. 8. 57. 5634532 Office Supplies & Stationery Stores 31 200 2,97245322. Gift,.Novelty.&.Souvenir.Stores. 25. 130. 1,3844533. Used.Merchandise.Stores. 25. 237. 3,772454 Nonstore Retailers 34 1,147 36,6344541. Electronic.Shopping.and.Mail.Order. 14. 1,015. 31,6254542. Vending.Machine.Operators. 6. 49. 1,7004543. Direct.Selling.Establishments. 14. 83. 3,309
AnnualNAICS Totalnumber Numberof payrollCode IndustryDescription ofestablishments employees ($1,000)

28
It'sallinthe
details AnnualNAICS Totalnumber Numberof payrollCode IndustryDescription ofestablishments employees ($1,000)
WholesaleTradeEstablishments,EmployeesandPayroll,LinnCounty,2007
Note: Not all NAICS Codes are listed, therefore, industry descriptions may not add up to its total product category. Detailed information is available by contacting Priority One.
Abbreviations and symbols:
NAICS-NorthAmericanIndustryClassificationSystem
Entries with the letter (D) represent data withheld to avoid disclosing information for individual companies; the data is included inbroaderindustrytotals.Employmentsizeclassificationisindicatedbyspecificletters:(A)=0-19,(B)=20-99,(C)=100-249,(E)=250-499,(F)=500-999,(I)=5,000-9.999
Source: 2007 County Business Patterns, US Census Bureau
42---- WholesaleTrade 354 5,159 $234,33�423 Merchant Wholesalers, Durable Goods 229 3,621 171,3404231. Motor.Vehicle.and.Motor.Vehicle.Parts.&.Supplies.. 12. 535. 17,42842311. Automobile.and.Other.Motor.Vehicle.. 6. 314. 11,23642312. Motor.Vehicle.Supplies.&.New.Parts.. 5. (C). 5,8554232. Furniture.and.Home.Furnishing.. 7. 95. 3,5384233. Lumber.and.Other.Construction.Materials.. 10. 161. 6,6054234. Professional.and.Commercial.Equipment.&.Supplies.. 35. 433. 22,52342342 Office Equipment 13 162 7,06342343. Computer.Peripheral.Equipment.&.Software.. 11. 126. 7,9184235. Metal.and.Mineral.(except.Petroleum).. 13. 298. 17,6984236. Electrical.and.Electronic.Goods.. 38. 353. 20,7334237. Hardware,.Plumbing.and.Heating.Equipment.&.Supplies.. 23. 198. 8,8164238. Machinery,.Equipment,.and.Supplies.. 75. 1,186. 61,97242381. Construction.and.Mining.Machinery.&.Equipment.. 12. 262. 13,20342382. Farm.and.Garden.Machinery.&.Equipment.. 3. (B). (D).42383. Industrial.Machinery.&.Equipment.. 33. 662. 35,75742384. Industrial.Supplies.. 15. 108. 4,3914239. Miscellaneous.Durable.Goods.. 16. 362. 12,027424 Merchant Wholesalers, Nondurable Goods 69 1,206 50,4694241. Paper.and.Paper.Product.. 8. 98. 3,8484243. Apparel,.Piece.Goods,.and.Notions.. 5. 31. 1,3934244. Grocery.and.Related.Product.Wholesalers. 11. (F). (D)4245. Farm.Product.Raw.Material.. 13. 86. 3,2534246. Chemical.and.Allied.Products.. 6. (B). 1,7114248. Beer,.Wine,.and.Distilled.Alcoholic.Beverage.. 5. 191. 9,81742481. Beer.and.Ale.. 3. (C). (D)42491. Farm.Supplies.. 8. 132. 7,529

2�
Demographics
ServicesEstablishments,EmployeesandPayroll,LinnCounty,2007 AnnualNAICS Totalnumber Numberof payrollCode IndustryDescription ofestablishments employees ($1,000)
51-- InformationServices 151 5,509 2�0,302511 Publishing Industries (except Internet) 229 1,714 67,7285112. Software.Publishers. 5. 153. 4,884512 Motion Picture & Sound Publishing 12 174 2,470515 Broadcasting (except Internet) 11 306 12,600517 Telecommunications 68 (H) (D)518 Internet, Web Search,& Data Processing 29 737 40,3975182. Data.Processing.and.Hosting. 27. 698. 38,50554-- Professional,Scientific,andTechnicalServices 525 4,649 245,6325411. Legal.. 112. 713. 33,5025412. Accounting,.Tax.Preparation,.Bookkeeping,.&.Payroll.. 75. 689. 28,3595413. Architectural.and.Engineering. 64. 616. 40,12654133. Engineering.. 37. 430. 31,33954138. Testing.Laboratories. 3. 48. 2,0315415. Computer.Systems.Design.. 82. 838. 45,695541511. Custom.Computer.Programming.. 36. 427. 25,417541512. Computer.System.Design.. 42. 408. 20,1275416 Management, Scientific, and Technical Consulting 94 382 21,8075418. Advertising.and.Related.. 24. 253. 12,82454181. Advertising.Agencies. 7. 66. 3,47554192. Photographic.. 16. 91. 1,57454194. Veterinary.. 23. 248. 6,2515�-- Administrative,Support&WasteMngmnt.Services 292 7,249 1�1,711561 Administrative and Support 273 7,004 153,1825613. Employment.. 36. 2,219. 45,40656131. Employment.Placement.Agencies. 3. (C). (D)5614. Business.Support.. 28. 1,533. 31,19756142. Telephone.Call.Centers. 9. 1,389. 27,5885615. Travel.Arrangement.and.Reservation.. 15. 102. 3,3605616. Investigation.and.Security.. 22. (F). (D)56161. Investigation,.Guard,.and.Armored.Car.. 15. (F). (D)5617. Services.to.Buildings.and.Dwellings. 133. 1,875. 37,61756172. Janitorial.. 52. 1,167. 16,8685619. Other.Support.Services. 18. 300. 10,387�1-- EducationalServices 55 3,004 �2,12�6111. Elementary.and.Secondary.Schools. 12. 627. 12,1276113. Colleges,.Universities,.and.Professional.Schools. 3. 1,845. 36,5546116. Other.Schools.and.Instruction.Services. 26. 297. 3,650�2-- HealthCareandSocialAssistanceServices 537 13,297 487,034621 Ambulatory Health Care 322 3,675 215,6296211 Offices of Physicians 82 1,333 133,1186212 Offices of Dentists 86 656 29,1236213 Offices of Other Health Practitioners 102 556 18,76862131 Offices of Chiropractors 52 158 4,42862139 Offices of All Other Health Practitioners 12 64 2,7626214. Outpatient.Care.Centers. 15. 236. 9,7356216. Home.Health.Care.. 18. 553. 12,995623 Nursing and Residential Care Facilities 90 3,026 68,7576231. Nursing.Care.Facilities. 12. 1,183. 25,6286233. Community.Care.Facilities.for.the.Elderly. 22. 1,131. 22,782624 Social Assistance 123 2,159 33,4426241. Individual.and.Family.. 36. 1,036. 16,316
30
It'sallinthe
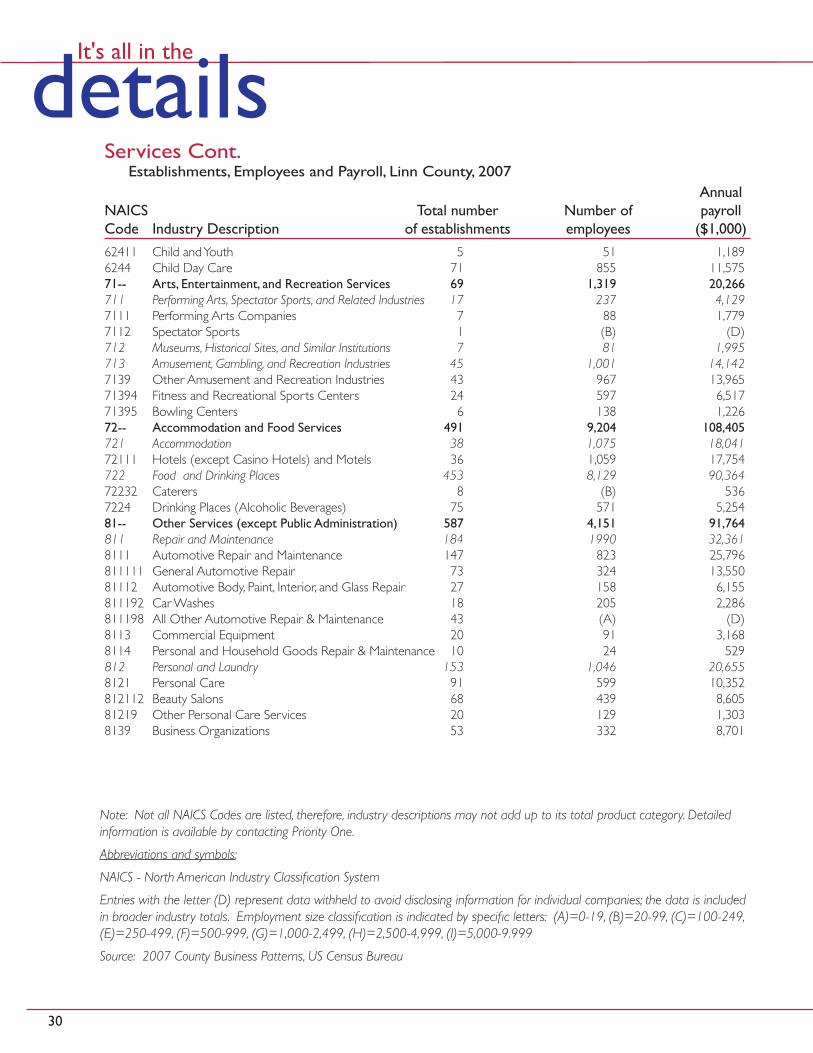
detailsServicesCont.
Establishments,EmployeesandPayroll,LinnCounty,2007 AnnualNAICS Totalnumber Numberof payrollCode IndustryDescription ofestablishments employees ($1,000)
Note: Not all NAICS Codes are listed, therefore, industry descriptions may not add up to its total product category. Detailed information is available by contacting Priority One.
Abbreviations and symbols:
NAICS-NorthAmericanIndustryClassificationSystem
Entries with the letter (D) represent data withheld to avoid disclosing information for individual companies; the data is included inbroaderindustrytotals.Employmentsizeclassificationisindicatedbyspecificletters:(A)=0-19,(B)=20-99,(C)=100-249,(E)=250-499,(F)=500-999,(G)=1,000-2,499,(H)=2,500-4,999,(I)=5,000-9.999
Source: 2007 County Business Patterns, US Census Bureau
62411. Child.and.Youth.. 5. 51. 1,1896244. Child.Day.Care.. 71. 855. 11,57571-- Arts,Entertainment,andRecreationServices �9 1,319 20,2��711 Performing Arts, Spectator Sports, and Related Industries 17 237 4,1297111. Performing.Arts.Companies. 7. 88. 1,7797112. Spectator.Sports. 1. (B). (D)712 Museums, Historical Sites, and Similar Institutions 7 81 1,995713 Amusement, Gambling, and Recreation Industries 45 1,001 14,1427139. Other.Amusement.and.Recreation.Industries. 43. 967. 13,96571394. Fitness.and.Recreational.Sports.Centers. 24. 597. 6,51771395. Bowling.Centers. 6. 138. 1,22672-- AccommodationandFoodServices 491 9,204 108,405721 Accommodation 38 1,075 18,04172111. Hotels.(except.Casino.Hotels).and.Motels. 36. 1,059. 17,754722 FoodandDrinkingPlaces 453 8,129 90,36472232. Caterers. 8. (B). 5367224. Drinking.Places.(Alcoholic.Beverages). 75. 571. 5,25481-- OtherServices(exceptPublicAdministration) 587 4,151 91,7�4811 Repair and Maintenance 184 1990 32,3618111. Automotive.Repair.and.Maintenance. 147. 823. 25,796811111. General.Automotive.Repair. 73. 324. 13,55081112. Automotive.Body,.Paint,.Interior,.and.Glass.Repair. 27. 158. 6,155811192. Car.Washes. 18. 205. 2,286811198. All.Other.Automotive.Repair.&.Maintenance. 43. (A). (D)8113. Commercial.Equipment. 20. 91. 3,1688114. Personal.and.Household.Goods.Repair.&.Maintenance. 10. 24. 529812 Personal and Laundry 153 1,046 20,6558121. Personal.Care.. 91. 599. 10,352812112. Beauty.Salons. 68. 439. 8,60581219. Other.Personal.Care.Services. 20. 129. 1,3038139. Business.Organizations. 53. 332. 8,701

�1
Demographics
Finance,InsuranceandRealEstateEstablishments,EmployeesandPayroll,LinnCounty,2007
AnnualNAICS Totalnumber Numberof payrollCode IndustryDescription ofestablishments employees ($1,000)
48---- TransportationandWarehousing 195 7,233 209,53�481 Air Transportation 5 (B) (D)484 TruckTransportation 117 4,727 160,1704841. General.Freight.Trucking. 70. 3,872. 123,5784842. Specialized.Freight.Trucking. 47. 855. 36,592485 Transit and Ground Passenger Transportation 7 (C) (D)488 Support Activities for Transportation 29 281 10,792492 Couriers and Messengers 22 443 13,793493 Warehousing and Storage 14 (G) 16,414
52---- FinanceandInsurance 452 8,832 483,022522 Credit Intermediation and Related Activities 172 3,497 182,6885221. Depository.Credit.Intermediation. 107. 1,496. 62,81152211. Commercial.Banking. 70. 1,062. 46,89852212. Savings.Institutions. 10. (B). (D)52213. Credit.Unions. 27. 355. 12,8595222. Nondepository.Credit.Intermediation. 34. 1,899. 117,140523 Securities and Commodity Contracts 81 486 39,79652312. Securities.Brokerage. 41. 258. 21,660524 Insurance Carriers and Related Activities 196 4,821 258,35652411. Direct.Life,.Health,.and.Medical.Insurance.Carriers. 18. (H). (D)52421. Insurance.Agencies.and.Brokerages. 149. 558. 25,340531 Real Estate 229 802 35,1785311. Lessors.of.Real.Estate. 83. 352. 9,5625322. Consumer.Goods.Rental. 18. 131. 2,165
Note: Not all NAICS Codes are listed, therefore, industry descriptions may not add up to its total product category. Detailed information is available by contacting Priority One.
Abbreviations and symbols:
NAICS-NorthAmericanIndustryClassificationSystem
Entries with the letter (D) represent data withheld to avoid disclosing information for individual companies; the data is included inbroaderindustrytotals.Employmentsizeclassificationisindicatedbyspecificletters:(A)=0-19,(B)=20-99,(C)=100-249,(E)=250-499,(F)=500-999,(I)=5,000-9.999
Source: 2007 County Business Patterns, US Census Bureau
AnnualNAICS Totalnumber Numberof payrollCode IndustryDescription ofestablishments employees ($1,000)
TransportationandPublicUtilitiesEstablishments,EmployeesandPayroll,LinnCounty,2007

32
It'sallinthe
detailsForestry,Fishing,Hunting&AgriculturalSupport
Establishments,EmployeesandPayroll,LinnCounty,2007
AnnualNAICS Totalnumber Numberof payrollCode IndustryDescription ofestablishments employees ($1,000)
11-- FORESTRY,FISHING,HUNTING &AGRICULTURALSUPPORT 9 (B) (D)115 Agricultural & Forestry Services 9 (B) (D)1151. Crop.Production.Support. 4. (A). (D)
Note: Not all NAICS Codes are listed, therefore, industry descriptions may not add up to its total product category. Detailed information is available by contacting Priority One.
Abbreviations and symbols:
NAICS-NorthAmericanIndustryClassificationSystem
Entries with the letter (D) represent data withheld to avoid disclosing information for individual companies; the data is included inbroaderindustrytotals.Employmentsizeclassificationisindicatedbyspecificletters:(A)=0-19,(B)=20-99,(C)=100-249,(E)=250-499,(F)=500-999,(I)=5,000-9.999
Source: 2007 County Business Patterns, US Census Bureau
Source:IowaWorkforceDevelopment
2009 Industry Breakdown by Employment - Cedar Rapids MSA
Trade21,100
Inform ation5,000
F inancia l Activit ies10,500
Edu/Health Services18,400
Leisure & Hospita lity11,100
Transporta tion & Utilit ies8,500
Natura l Resources & Construction
7,600G overnm ent
16,500M anufactur ing
20,900
Profess iona l Services12,700
O ther Services5,100

��
Demographics
RetailSalesbyMunicipalitiesMillionsofDollars
FiscalCedar Linn Iowa JohnsonYearRapidsMarionHiawatha County City Coralville County1990. 1,287.9. 137.1. 16.7.. 1,509.8. 464.9.. 107.4.. 613.21991. 1,362.9. 143.9. 15.4............ .1,595.3.......... 480.9........... 116.2...................642.11992. 1,417.6........... 149.9. 16.8....... 1,657.7...........505.2........... 123.1..................673.41993. 1,514.5....... 157.8. 19.5. 1,679.1......... 536.9........... 138.3..................717.91994. 1,652.8....... 175.4. 20.5. .1,928.5.......... 578.8........... 146.5..................772.41995. 1,780.2....... 190.2. 23.9. 2,078.5. 615.5.......... 159.3..................823.51996. 1,901.6....... 201.4. 30.2. 2,213.2.......... 657.7........... 155.3..................861.71997.... 1,899.7........... 213.9. 40.5. 2,239.3.......... 677.7........... 173.2..................906.81998..... 2,059.5. 222.7. 48.9. 2,415.8.......... 701.1........... 171.2..................931.81999. 2,168.0........... 234.1. 54.1. 2,548.4.......... 733.4........... 314.6.................1,109.52000.... 2,219.7.. 242.5. 59.7. 2,619.3.......... 756.1........... 381.4.................1,202.32001.......2,229.5. 237.9. 65.8. 2,623.4.......... 780.6........... 415.5.................1,266.12002. 2,292.9............ 253.6. 78.3. 2,721.1.......... 766.9........... 437.2.................1,275.82003. 2,328.2. 252.2. 72.9. .2,751.3. 776.7.. 461.5. 1,307.62004. 2,391.9. 259.1. 76.3. .2,832.7. 854.2.. 513.3. 1,445.72005. 2,398.2. 287.1. 83.5. .2,872.5. 878.0.. 525.9. 1,486.22006. 2,389.9. 337.1. 95.5. 2,925.7. 901.4.. 549.7. 1,547.82007. 2,444.5. 344.5. 92.8. 3,015.8. 934.9.. 579.6. 1,621.12008. 2,576.7. 315.6. 91.5. 3,112.5. 958.5.. 625.2. 1,692.32009. 2,894.8. 351.8. 88.5. .3,486.8. .905.1. .701.0. 1,725.4
Retailsalesasmeasuredbytaxablesalesbyfiscalyear(i.e.FY2005=April1,2004-March31,2005).Source: Iowa Retail Sales & Use Tax Report, Iowa Department of Revenue and Finance.

34
It'sallinthe
detailsRetailSalesbyBusinessClassLinnCounty-MillionsofDollars
2002 2003 2004 2005 200� 2007 2008 2009
Utilities.&.Transportation. 423.8. 497.2. 540.3. 522.9. 497.0. 431.9. 444.8. 569.4.Building.Materials. 127.3. 143.4. 188.5. 204.4. 204.7. 211.7. 216.9. 249.9General.Merchandise. 315.5. 376.4. 392.0. 400.6. 404.0. 462.1..... 461.1. 489.7Food.Stores. 74.5. 68.3. 88.4. 92.0. 95.7. 100.3. 99.9. 111.7Motor.Vehicle. 82.5. 76.7. 98.5. 111.6. 117.7. 117.1. 129.5. 139.8Apparel.and.Accessories. 43.0. 48.8. 52.8. 55.3. 56.8. 57.2. 57.4. 58.9Home.Furnishing,.Furniture. 104.6. 66.6. 122.7. 122.5. 115.2. 107.4. 103.4. 100.6Eating.&.Drinking.Places. 170.2. 171.1. 209.7. 224.7. 243.7. 266.1. 276.2. 290.1Specialty.Stores. 184.0. 182.7. 221.8. 224.3. 230.3. 257.8. 247.4. 257.8Services. 299.3. 313.2. 367.7. 384.6. 425.6. 453.8. 457.6. 484.7Wholesale. 211.2. 175.1. 203.3. 205.0. 204.2. 197.7. 206.1. 238.5Miscellaneous. 241.2. 209.3. 345.2. 323.5. 330.2. 352.8. 412.8. 495.8.Total 2,277.0 2,328.7 2,832.7 2,872.5 2,925.7 3,015.8 3,112.5 3,48�.8
Retailsalesasmeasuredbytaxablesalesbyfiscalyear(i.e.FY2005=April1,2005-March31,2006).Source: Iowa Retail Sales & Use Tax Report, Iowa Department of Revenue and Finance, Information & Management Services Division.
JohnsonCounty-MillionsofDollars
2002 2003 2004 2005 200� 2007 2008 2009
Utilities.&.Transportation. 111.9. 102.2. 95.7. 87.2. 87.5. 79.2. 104.9. 114.1.Building.Materials. 84.8. 90.8. 122.2. 126.3. 132.2. 126.7. 119.3. 126.5General.Merchandise. 219.5. 238.1. 242.5. 241.6. 233.4. 246.8. 252.1. 254.1Food.Stores. 71.5. 73.4. 74.5. 79.0. 84.5. 91.2. 90.4. 96.7.Motor.Vehicle. 40.6. 43.7. 49.2. 48.0. 53.9. 57.4. 59.2. 63.6Apparel.and.Accessories. 53.8. 55.3. 56.5. 52.2. 54.1. 59.5. 61.5. 65.8Home.Furnishing,.Furniture. 139.1. 136.8. 213.5. 245.3. 249.3. 261.5. 275.1. 232.9Eating.&.Drinking.Places. 155.7. 162.7. 171.3. 179.2. 186.3. 206.8. 219.2. 229.5Specialty.Stores. 127.8. 120.1. 120.2. 120.4. 141.5. 147.5. 158.0. 166.6Services. 160.5. 171.1. 179.0. 187.2. 198.2. 215.4. 226.7. 247.6Wholesale. 50.1. 50.6. 51.7. 50.3. 53.2. 53.1. 47.8. 42.6Miscellaneous. 67.7. 62.9. 68.2. 69.0. 73.0. 76.1. 78.2. 85.2
Total 1,282.8 1,307.� 1,444.5 1,48�.2 1,547.8 1,�21.2 1,�92.4 1,725.4
Retailsalesasmeasuredbytaxablesalesbyfiscalyear(i.e.FY2005=April1,2005-March31,2006).Source: Iowa Retail Sales & Use Tax Report, Iowa Department of Revenue and Finance, Information & Management Services Division.

��
Demographics
BuildingPermitInformationCityofCedarRapids
NewConstruction Repairs,Remodeling&Additions AllConstructionYear #ofPermits Valuation #ofPermits Valuation #ofPermits Valuation
1997. 1,872. $88,107,677. 5,136. $39,934,741. 7,008. $128,042,4181998. 2,027. $97,362,915. 5,453. $69,081,303. 7,480. $166,444,2191999. 2,071. $103,200,806. 5,554. $49,849,016. 7,625. $153,049,8212000. 1,925. $139,578,485. 4,737. $62,278,422. 6,662. $201,856,9082001. 1,768. $100,134,810. 5,067. $55,969,400. 6,835. $156,104,2102002. 1,737. $94,177,319. 6,334. $58,603,022. 8,071. $152,780,3412003. 1,822. $79,818,471. 5,282. $58,408,213. 7,104. $138,226,6842004. 1,805. $104,111,873. 4,436. $54,825,072. 6,241. $158,936,9442005. 1,680. $130,147,946. 4,457. $69,472,789. 6,137. $199,620,7362006. 1,495. $98,317,357. 4,161. $91,227,434. 5,656. $189,555,7912007. 1,362. $218,030,843. 4,074. $104,908,895. 5,436. $322,939,7382008. 1,143. $141,846,798. 5,545. $135,203,324. 6,688. $277,050,1222009. 1,264. $87,347,062. 4,396. $98,634,656. 5,660. $185,981,719.
Source: City of Cedar Rapids Building Department.
NewCommercialBuildingPermits CedarRapids Marion Hiawatha
Year1 #ofPermits Valuation #ofPermits Valuation #ofPermits Valuation..1997. 53. $25,751,798. 11. $1,354,963. 9. $1,597,3011998. 46. $33,084,726. 5. $1,701,162. 6. $4,170,3121999. 37. $22,946,051. 15. $5,790,886. 8. $6,304,4602000. 56. $42,126,701. 12. $3,360,064. 24. $9,515,0642001. 45. $24,095,638. 2. $317,117. 21. $5,296,1952002. 41. $17,987,403. 7. $1,198,331. 7. $2,462,3392003. 43. $15,849,336. 9. $1,888,957. 7. $2,317,0712004. 47. $16,796,266. 9. $1,292,890. 13. $8,049,0362005. 52. $54,653,299. 11. $15,823,935. 4. $1,937,7182006. 35. $31,775,555. 7. $2,964,070. 6. $1,722,0932007. 30. $58,819,301. 2. $684,852. 9. $7,022,6162008. 26. $36,693,287. 4. $6,200,525. 6. $3,347,3332009. 21. $19,387,965. 6. $902,214
1FiguresforMarionareforfiscalyearsexceptfrom1992-1997,duringwhichtimesthefiguresareforcalendaryears. Figures for Hiawatha are for calendar years.Source: City of Cedar Rapids Building Department, City of Marion and City of Hiawatha.

3�
It'sallinthe
detailsNewIndustrialBuildingPermits CedarRapids Marion
Year1 #ofPermits Valuation #ofPermits Valuation
1990. 19. $5,575,157. 2. $28,500.1991. 14. $7,482,670. 8. $1,111,416.1992. 16. $4,588,239. 3. $454,556.1993. 14. $1,488,800. 4. $153,620.1994. 17. $15,260,100. 10. $2,198,883.1995. 29. $30,561,535. 5. $1,630,608.1996. 8. $413,860. 0. $0. .......1997. 4. $914,702. 0. $0.1998. 12. $4,225,110. 1. $322,560. .....1999. 6. $1,683,505. 0. $0.2000. 6. $450,454. 0. $0.2001. 1. $45,000. 0. $0. .2002. 1. $225,000. 1. $1,877,468.2003. 3. $170,000...... 1. $114,8402004. 4. $2,989,448. 1. $277,0952005. 3. $764,800. 1. $130,0002006. 2. $8,095,188. 1. $229,6802007. 23. $34,114,203. 0. $02008. 12. $34,937,383. 0. $02009. 1. $163,900. 0. $0
1FiguresforMarionareforfiscalyearsexceptfrom1992-1999,duringwhichtimesthefiguresareforcalendaryears.Note: Hiawatha building permits are categorized as "commercial/industrial", therefore data relating to new commercial and new industrial permits for Hiawatha are provided for under 'New Commercial Building Permits'.Source: City of Cedar Rapids Building Department, City of Marion and City of Hiawatha.
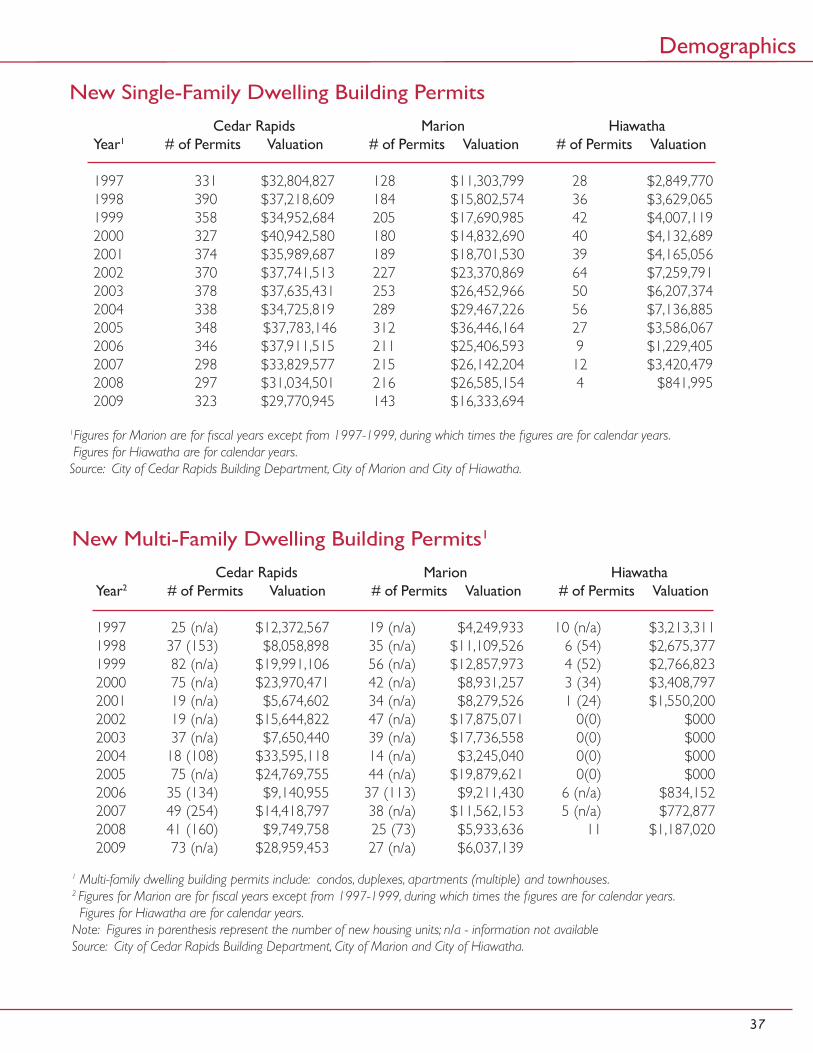
��
Demographics
NewSingle-FamilyDwellingBuildingPermits CedarRapids Marion Hiawatha
Year1 #ofPermits Valuation #ofPermits Valuation #ofPermits Valuation
1997. 331. $32,804,827. 128. $11,303,799. 28. $2,849,7701998. 390. $37,218,609. 184. $15,802,574. 36. $3,629,0651999. 358. $34,952,684. 205. $17,690,985. 42. $4,007,1192000. 327. $40,942,580. 180. $14,832,690. 40. $4,132,6892001. 374. $35,989,687. 189. $18,701,530. 39. $4,165,0562002. 370. $37,741,513. 227. $23,370,869. 64. $7,259,7912003. 378. $37,635,431. 253. $26,452,966. 50. $6,207,3742004. 338...........$34,725,819. 289.............$29,467,226. 56. ...$7,136,8852005. 348...........$37,783,146. 312.............$36,446,164. 27. ...$3,586,0672006. 346. $37,911,515. 211. $25,406,593. .9. $1,229,4052007. 298. $33,829,577. 215. $26,142,204. 12. $3,420,4792008. 297. $31,034,501. 216. $26,585,154. .4. $841,9952009. 323. $29,770,945. 143. $16,333,694
1FiguresforMarionareforfiscalyearsexceptfrom1997-1999,duringwhichtimesthefiguresareforcalendaryears. Figures for Hiawatha are for calendar years.Source: City of Cedar Rapids Building Department, City of Marion and City of Hiawatha.
NewMulti-FamilyDwellingBuildingPermits1
CedarRapids Marion HiawathaYear2 #ofPermits Valuation #ofPermits Valuation #ofPermits Valuation
1997. 25.(n/a). $12,372,567. 19.(n/a). $4,249,933. 10.(n/a). $3,213,3111998. 37.(153). $8,058,898. 35.(n/a). $11,109,526. 6.(54). $2,675,3771999. 82.(n/a). $19,991,106. 56.(n/a). $12,857,973. 4.(52). $2,766,8232000. 75.(n/a). $23,970,471. 42.(n/a). $8,931,257. 3.(34). $3,408,7972001. 19.(n/a). $5,674,602. 34.(n/a). $8,279,526. 1.(24). $1,550,2002002. 19.(n/a). $15,644,822. 47.(n/a). $17,875,071. 0(0). $0002003. 37.(n/a). $7,650,440. 39.(n/a). $17,736,558. 0(0). $0002004. 18.(108). $33,595,118. 14.(n/a). $3,245,040. 0(0). $0002005. 75.(n/a). $24,769,755. 44.(n/a). $19,879,621. 0(0). $0002006. 35.(134). $9,140,955. 37.(113). $9,211,430. 6.(n/a). $834,1522007. 49.(254). $14,418,797. 38.(n/a). $11,562,153. 5.(n/a). $772,8772008. 41.(160). $9,749,758. 25.(73). $5,933,636. 11. $1,187,0202009. 73.(n/a). $28,959,453. 27.(n/a). $6,037,139
1 Multi-family dwelling building permits include: condos, duplexes, apartments (multiple) and townhouses.2 FiguresforMarionareforfiscalyearsexceptfrom1997-1999,duringwhichtimesthefiguresareforcalendaryears. Figures for Hiawatha are for calendar years.Note: Figures in parenthesis represent the number of new housing units; n/a - information not availableSource: City of Cedar Rapids Building Department, City of Marion and City of Hiawatha.

38
It'sallinthe
detailsCedarRapidsArea
2004 2005 200� 2007 2008 2009 2bedroomsorless Total.#.sold. . 812. 396. 1,118. 531. 821. 711. . Average.price. . $93,357. $82,480. $101,950. $85,269. $102,451. $101,393
3bedrooms Total.#.sold. . 1,626. 1,593. 2,267. 1,937. 1,413. 1,434. . Average.price. . $138,147. $139,733. $143,222. $141,821. $143,578. $141,921
4ormorebedrooms Total.#.sold. . 801. 789. 1,183. 1,183. 760. 705. . Average.price. . $217,006. $218,257. $214,743. $231,947. $226,985. $218,856
IowaCityArea
2004 2005 200� 2007 2008 2009 2bedroomsorless Total.#.sold. . 226. 178. 224. 207. 211. 193. .. . Average.price. . $111,704. $116,764. $121,117. $122,977. $119,237. $121,567
3bedrooms . Total.#.sold. . 967. 813. 967. 949. 862. 893. . Average.price. . $162,144. $167,699. $170,077. $168,969. $166,154. $168,355
4ormorebedrooms Total.#.sold. . 646. 635. 725. 727. 666. 649. . Average.price. . $255,111. $264,083. $258,397. $273,211. $266,238. $261,332
Source: Iowa City Area Association of REALTORS® and Cedar Rapids Area Association of REALTORS®
Single-FamilyHomeSalesbySize
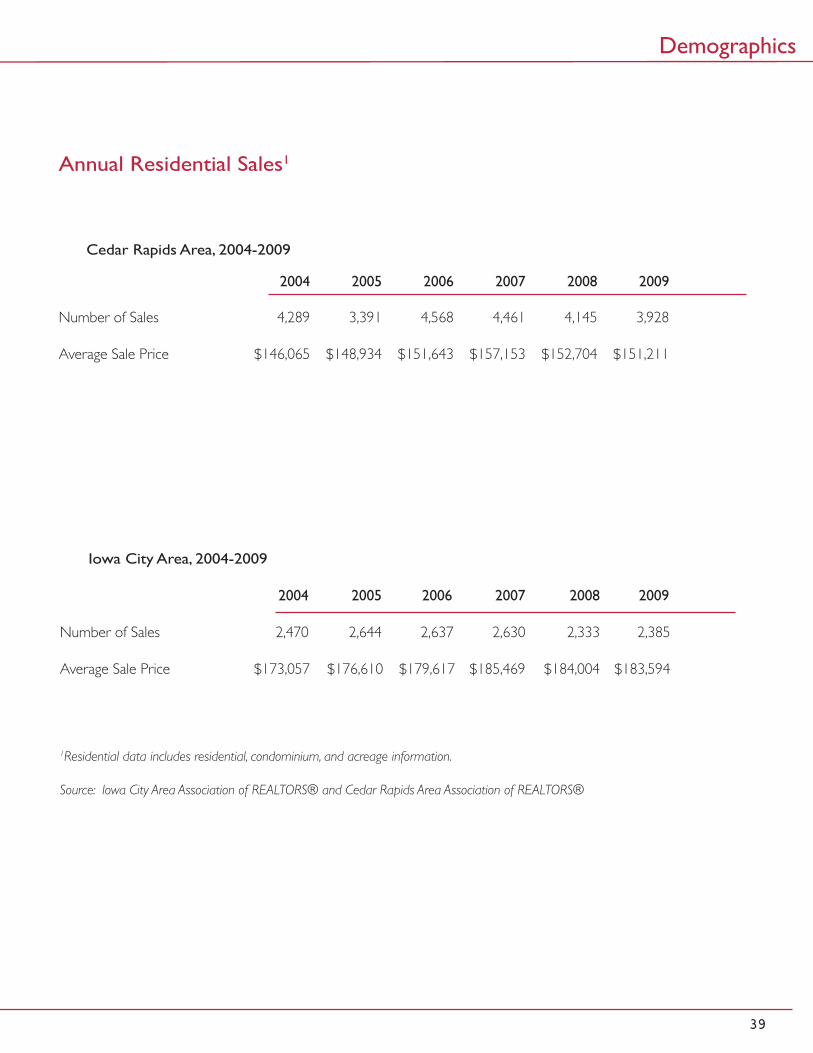
��
Demographics
CedarRapidsArea,2004-2009
2004 2005 200� 2007 2008 2009 Number.of.Sales. 4,289. 3,391. 4,568. 4,461. 4,145. 3,928
Average.Sale.Price. $146,065. $148,934. $151,643. $157,153. $152,704. $151,211
IowaCityArea,2004-2009
2004 2005 200� 2007 2008 2009 Number.of.Sales. . 2,470. 2,644. 2,637. 2,630. 2,333. 2,385.Average.Sale.Price. ... .$173,057. $176,610. .$179,617. $185,469. $184,004. $183,594
1Residential data includes residential, condominium, and acreage information.
Source: Iowa City Area Association of REALTORS® and Cedar Rapids Area Association of REALTORS®
AnnualResidentialSales1
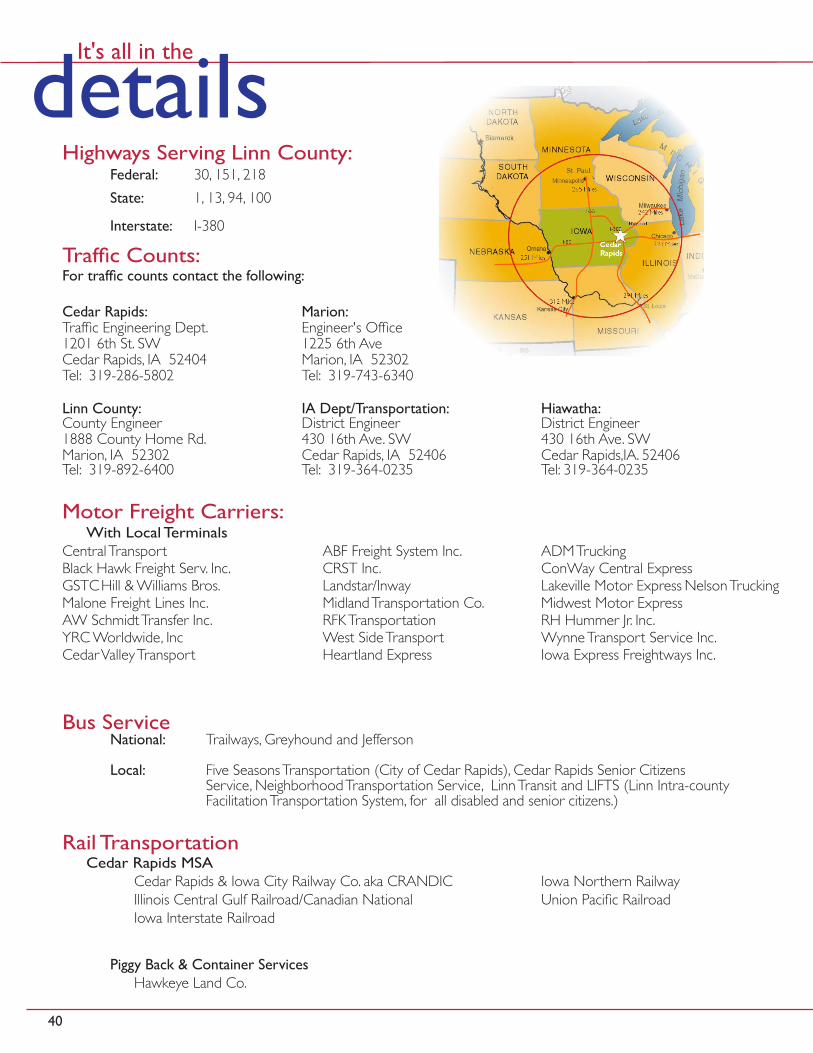
40
It'sallinthe
detailsHighwaysServingLinnCounty: Federal: 30,.151,.218
State: 1,.13,.94,.100
Interstate: I-380
TrafficCounts:Fortrafficcountscontactthefollowing:
CedarRapids: Marion: Traffic Engineering Dept. Engineer's Office 1201.6th.St..SW. . . 1225.6th.Ave. . . .Cedar.Rapids,.IA..52404. . . Marion,.IA..52302. . .Tel:..319-286-5802. . . Tel:..319-743-6340
LinnCounty: IADept/Transportation: Hiawatha:County.Engineer. District.Engineer. . . District.Engineer1888.County.Home.Rd.. 430.16th.Ave..SW. . . 430.16th.Ave..SWMarion,.IA..52302. Cedar.Rapids,.IA..52406. . Cedar.Rapids,IA..52406Tel:..319-892-6400. Tel:..319-364-0235. . . Tel:.319-364-0235
MotorFreightCarriers:WithLocalTerminals
Central.Transport. ABF.Freight.System.Inc.. . ADM.Trucking. . . . .Black.Hawk.Freight.Serv..Inc... CRST.Inc.. . . . ConWay.Central.Express. .GSTC.Hill.&.Williams.Bros.. Landstar/Inway. . . Lakeville.Motor.Express.Nelson.Trucking.Malone.Freight.Lines.Inc.. Midland.Transportation.Co.. . Midwest.Motor.Express..AW.Schmidt.Transfer.Inc.. RFK.Transportation. . . RH.Hummer.Jr..Inc.. . .YRC.Worldwide,.Inc. West.Side.Transport.. . Wynne.Transport.Service.Inc..Cedar.Valley.Transport. Heartland.Express. . . Iowa.Express.Freightways.Inc.. . .
BusServiceNational: Trailways,.Greyhound.and.Jefferson
Local: Five.Seasons.Transportation.(City.of.Cedar.Rapids),.Cedar.Rapids.Senior.Citizens.. . .. . Service,.Neighborhood.Transportation.Service,..Linn.Transit.and.LIFTS.(Linn.Intra-county.. .. . Facilitation.Transportation.System,.for..all.disabled.and.senior.citizens.)
RailTransportationCedarRapidsMSA
Cedar.Rapids.&.Iowa.City.Railway.Co..aka.CRANDIC. . Iowa.Northern.Railway..... Illinois Central Gulf Railroad/Canadian National Union Pacific Railroad. Iowa.Interstate.Railroad
PiggyBack&ContainerServices. Hawkeye.Land.Co..
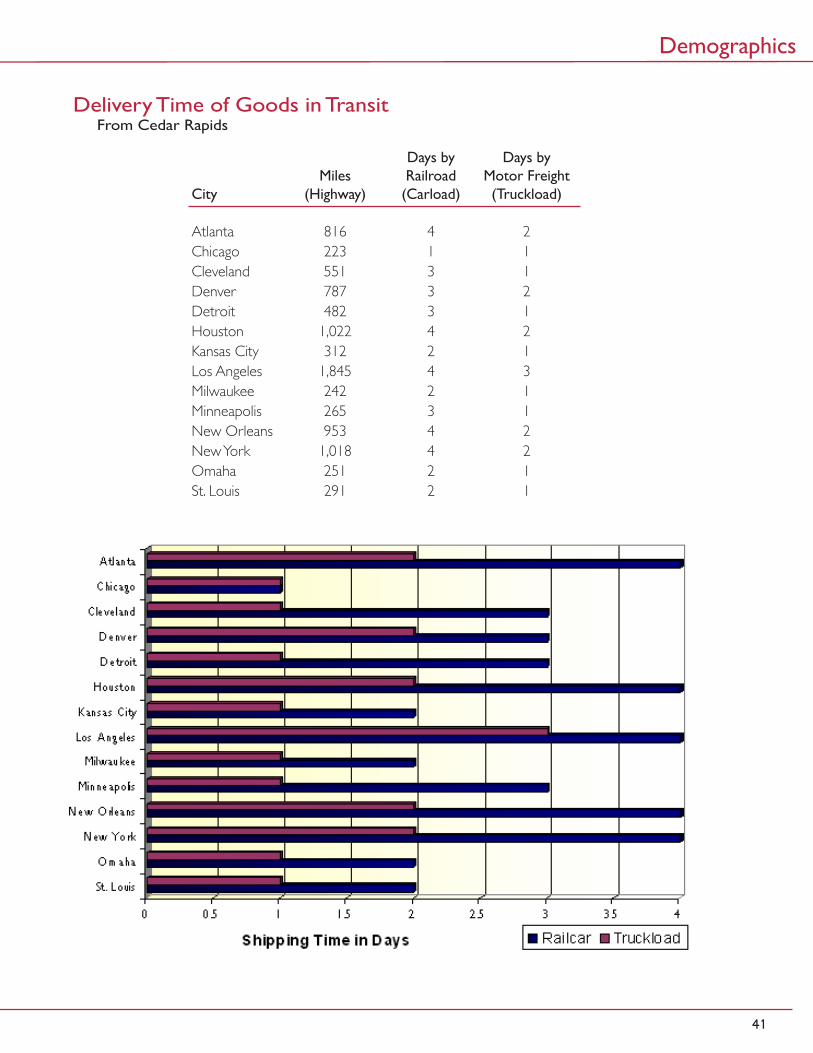
41
Demographics
DeliveryTimeofGoodsinTransitFromCedarRapids
Daysby Daysby Miles Railroad MotorFreightCity (Highway) (Carload) (Truckload)
Atlanta. 816. 4. 2Chicago. 223. 1. 1Cleveland. 551. 3. 1Denver. 787. 3. 2Detroit. 482. 3. 1Houston. 1,022. 4. 2Kansas.City. 312. 2. 1Los.Angeles. 1,845. 4. 3Milwaukee. 242. 2. 1Minneapolis. 265. 3. 1New.Orleans. 953. 4. 2New.York. 1,018. 4. 2Omaha. 251. 2. 1St..Louis. 291. 2. 1

42
It'sallinthe
detailsSelectedCommutingCharacteristics Cedar IowaNorthCommutingtoWork U.S. Iowa Rapids Hiawatha Marion City Liberty Coralville
Workers.16.yearsand.over. . 143,995,967. 1,568,781. 62,273. 3,635. 16,351. 38,512. 3,258. 8,861.Percent.drove.alone...... 75.5....... 77.9. 80.1. 81.1. 85.8. 55.7. 83.0. 74.5..................................Percent.in.carpools....... 10.7. 11.0. 10.2. 13.6. 6.7. 11.2. 13.9. 13.7
Percent.using.publictransportation......... 5.0. 1.2. 1.4. 2.1. 0.6. 10.4. 0.3. 6.2
Percent.walking. . 2.8. 4.1. 4.1. . 2.1. 16.3
Percent.using.othermeans. . 1.8. 1.4. 1.7. 0.0. 1.2. 3.6. 0.0. 0.9...Percent.workingfrom.home. . 4.1. 4.4. 2.5. 2.9. 3.6.. 2.8. 2.8. 4.4...Mean.travel.time.to.work.(minutes). . 25.5. 18.5. 16.8. 14.7. 20.3. 16.4. 19.2. 18.4...
VehiclesAvailable........... .Occupied.housing.units. 113,101,329. 1,215,351. 52,745. 2,854. 13,005. 24,821. 2,222.. 6,448
Percent.with.none.............. 8.8. 5.8. 8.0. 3.4. 6.3. 9.9. 3.0. 5.8
Percent.with.one. . 33.4. 29.6. 35.7. 38.3. 34.2. 41.8. 35.1. 43.9
Percent.with.two....... 37.8. 39.9. 39.2. 43.8.. 39.6.. 35.1. 45.5. 39.5
Percent.with.three.or.more....... 20.0. 24.8. 17.1. 14.5.. 20.0. 13.1. 16.4. 10.8
Source (Hiawatha, North Liberty, Coralville): U.S. Department of Commerce, Bureau of the Census, 2000 Census of the Population.Source (Marion): U.S. Census Bureau, 2006-2008 American Community SurveySource (all others): U.S. Census Bureau, 2008 American Community Survey
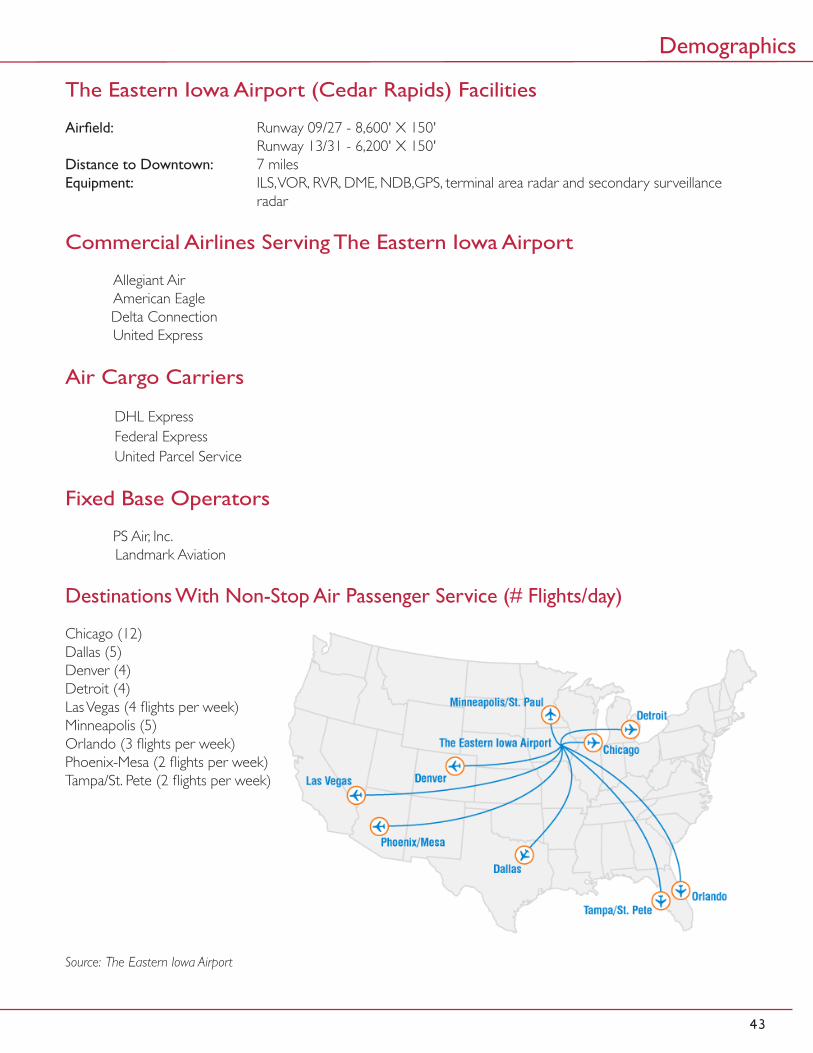
4�
Demographics
TheEasternIowaAirport(CedarRapids)Facilities
Airfield:. . Runway.09/27.-.8,600'.X.150'.. .. Runway.13/31.-.6,200'.X.150'DistancetoDowntown:. 7.milesEquipment:. . ILS,.VOR,.RVR,.DME,.NDB,GPS,.terminal.area.radar.and.secondary.surveillance.. .. . radar
CommercialAirlinesServingTheEasternIowaAirport
Allegiant.Air.. American.Eagle............Delta.Connection. . . .. United.Express. ....................... ..
AirCargoCarriers. DHL.Express. Federal.Express. United.Parcel.Service..
FixedBaseOperators
PS.Air,.Inc..............Landmark.Aviation
DestinationsWithNon-StopAirPassengerService(#Flights/day)
Chicago.(12)Dallas.(5)Denver.(4)Detroit.(4)Las Vegas (4 flights per week)Minneapolis.(5)Orlando (3 flights per week)Phoenix-Mesa (2 flights per week)Tampa/St. Pete (2 flights per week)
Source: The Eastern Iowa Airport
SelectedCommutingCharacteristics Cedar IowaNorthCommutingtoWork U.S. Iowa Rapids Hiawatha Marion City Liberty Coralville
Workers.16.yearsand.over. . 143,995,967. 1,568,781. 62,273. 3,635. 16,351. 38,512. 3,258. 8,861.Percent.drove.alone...... 75.5....... 77.9. 80.1. 81.1. 85.8. 55.7. 83.0. 74.5..................................Percent.in.carpools....... 10.7. 11.0. 10.2. 13.6. 6.7. 11.2. 13.9. 13.7
Percent.using.publictransportation......... 5.0. 1.2. 1.4. 2.1. 0.6. 10.4. 0.3. 6.2
Percent.walking. . 2.8. 4.1. 4.1. . 2.1. 16.3
Percent.using.othermeans. . 1.8. 1.4. 1.7. 0.0. 1.2. 3.6. 0.0. 0.9...Percent.workingfrom.home. . 4.1. 4.4. 2.5. 2.9. 3.6.. 2.8. 2.8. 4.4...Mean.travel.time.to.work.(minutes). . 25.5. 18.5. 16.8. 14.7. 20.3. 16.4. 19.2. 18.4...
VehiclesAvailable........... .Occupied.housing.units. 113,101,329. 1,215,351. 52,745. 2,854. 13,005. 24,821. 2,222.. 6,448
Percent.with.none.............. 8.8. 5.8. 8.0. 3.4. 6.3. 9.9. 3.0. 5.8
Percent.with.one. . 33.4. 29.6. 35.7. 38.3. 34.2. 41.8. 35.1. 43.9
Percent.with.two....... 37.8. 39.9. 39.2. 43.8.. 39.6.. 35.1. 45.5. 39.5
Percent.with.three.or.more....... 20.0. 24.8. 17.1. 14.5.. 20.0. 13.1. 16.4. 10.8
Source (Hiawatha, North Liberty, Coralville): U.S. Department of Commerce, Bureau of the Census, 2000 Census of the Population.Source (Marion): U.S. Census Bureau, 2006-2008 American Community SurveySource (all others): U.S. Census Bureau, 2008 American Community Survey

44
It'sallinthe
details
AirServiceActivitySummary
Year AirCargo(lbs) Passengers
1995. 77,254,590. 788,7121996. 79,673,766. 796,9611997. 75,017,827. 878,6731998. 74,980,100. 923,1451999. 69,217,235. 913,7032000. 62,792,632. 983,7362001. 54,527,610. 878,6502002. 57,015,882. 877,2152003. 55,190,523. 921,9862004. 47,706,000. 938,5552005. 48,051,224. 1,004,265. .2006. 52,314,000. 1,023,8722007. 54,660,599. 1,060,1202008. 55,187,914. 991,5122009. 47,191,324. 945,350......
Source: The Eastern Iowa Airport
SchoolDistrictEnrollmentfortheCedarRapidsArea2008-2009

4�
Demographics
CedarRapidsCommunitySchoolDistrictSchools Grades NumberofSchools NumberofTeachers EnrollmentElementary. K-5. 24. 488. 7,581Middle.Schools. 6-8. 6. 265. 3,447High.School. 9-12. 4. 341. 5,495Special.Education. -. -. ..-. 2,162*Total 34 1,093 1�,523
CollegeCommunitySchoolDistrictSchools GradesNumberofSchoolsNumberofTeachers EnrollmentElementary. K-5. 4. 157. 2,101Middle.Schools. 6-8. 1. 67. ...1,024High.School. 9-12. 1. 83. .1,217Special.Education. -. -. -. 485*Total � 307 4,342
LinnMarCommunitySchoolDistrictSchools Grades NumberofSchools NumberofTeachers EnrollmentElementary. K-5. 7. 232. 2,937Middle.School. 6-8. 2. 113. 1,355High.School. 9-12. 1. 115. 1,699Special.Education. -. -. -. 636*Total 8 4�0 5,991
MarionIndependentSchoolDistrictSchools Grades NumberofSchools NumberofTeachers EnrollmentElementary. K-3. 2. 51. 624Intermediate. 4-5. 1. 25. 307Middle.School. 6-8. 1. 39. 454High.School. 9-12. 1. 50. 631Special.Education. -. -. -... .n/aTotal 5 172 2,774**
CedarRapidsMetroCatholicEducationSystemSchools Grades NumberofSchools NumberofTeachers EnrollmentElementary/Middle. K-8. 8. 167. 2,117High.School. 9-12. 1. 49. 759Total 9 21� 2,87�
TotalCedarRapidsMetroAreaStudentEnrollment-32,50�
*Special Education enrollment has already been counted in the elementary, middle school and high school enrollment numbers so was not included in computing the total.**Total for the Marion Independent School District includes home schooled children.Source:EachschooldistrictandTheCatholicEducationOffice
SchoolDistrictEnrollmentfortheCedarRapidsArea2008-2009

4�
It'sallinthe
detailsCompositeAmericanCollegeTesting(ACT)Scores
Source: Each School District
HighSchoolGraduationRates&PostSecondaryEducationAttendanceRates
CedarCollegeLinn ParochialRapids Community Mar Marion Schools Iowa
Percent.of.High.SchoolSeniors..Who.Graduate. ........83. ........94. ........96. 99. .....100.. ..91
Percent.of.High.School............Graduates.who.Attend.a........Post.Secondary.Institution. 82. 78. 93. 83. 96. 82
Source: Each School District; The Iowa State Dept. of Education
2001 2002 2003 2004 2005 200� 2007 2008
C.R..Community.School.District. 23.0. 23.5. 23.1. .23.4. 23.4. 23.7. 24.0. 23.8College.Community.School.District. 21.9. 22.1. 22.7. 21.8. 21.6. 22.5. 23.1. 23.1Linn.Mar.Community.School.District. 23.4. 23.1. 23.3. 23.1. 23.7. 24.2. 24.1. 23.9Marion.Independent.School.District. 21.7. 21.8. 21.8. 22.5. 21.1. 22.6. N/A. 22.4.State.of.Iowa. 22.0. 22.0. 22.0. 22.0. 22.0. 22.1. 22.3. 22.4United.States. 21.0. 20.8. 20.8. 20.9. 20.9. 21.1. 21.2. 21.1
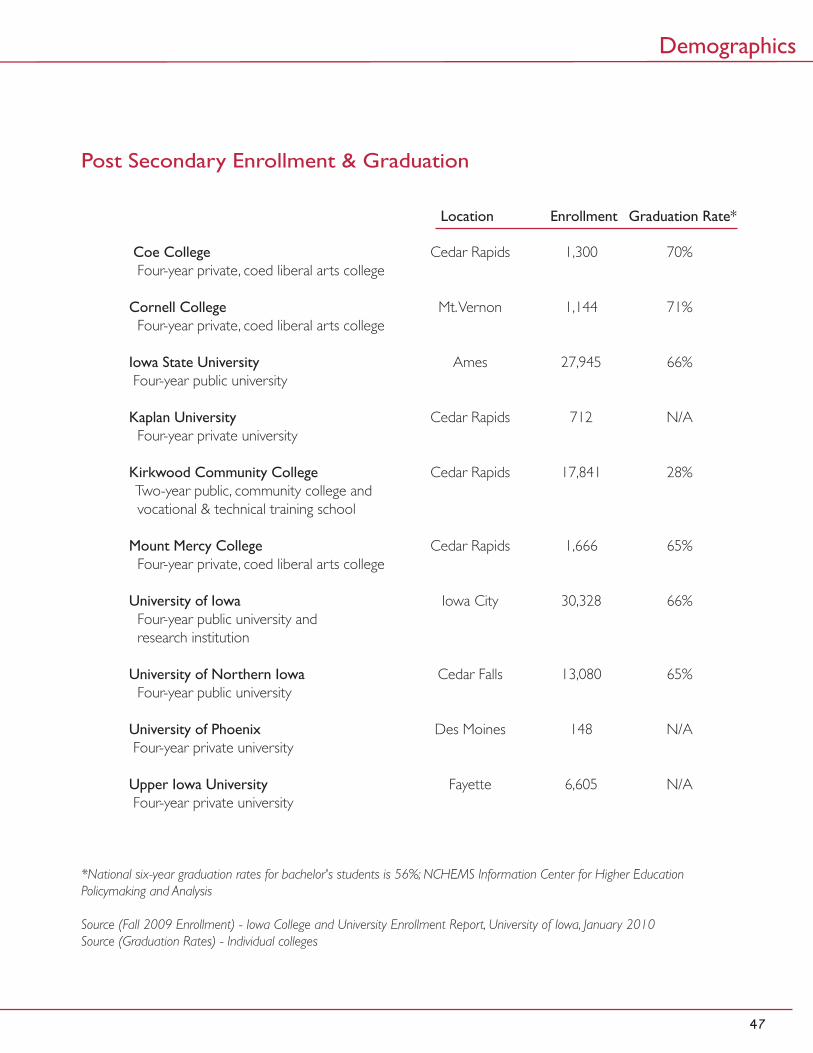
4�
Demographics
PostSecondaryEnrollment&Graduation
Location Enrollment GraduationRate*
CoeCollege . . . Cedar.Rapids.... 1,300. 70%... ..Four-year.private,.coed.liberal.arts.college
CornellCollege . . . Mt..Vernon. 1,144. 71%. ..Four-year.private,.coed.liberal.arts.college
IowaStateUniversity. . .. Ames. 27,945. 66%. .Four-year.public.university
. KaplanUniversity . . . Cedar.Rapids. 712. N/A.
. ..Four-year.private.university
. KirkwoodCommunityCollege. . Cedar.Rapids. 17,841. 28%
. ..Two-year.public,.community.college.and
. ..vocational.&.technical.training.school
. MountMercyCollege . . Cedar.Rapids. 1,666... 65%
. ..Four-year.private,.coed.liberal.arts.college
. UniversityofIowa . . . Iowa.City. 30,328. 66%
. ..Four-year.public.university.and.
. ..research.institution
. UniversityofNorthernIowa. . . Cedar.Falls. 13,080. 65%
. ..Four-year.public.university
UniversityofPhoenix. . . Des.Moines. 148. N/A. .Four-year.private.university
. UpperIowaUniversity. . . Fayette. 6,605. N/A
. .Four-year.private.university
*National six-year graduation rates for bachelor's students is 56%; NCHEMS Information Center for Higher Education PolicymakingandAnalysis
Source (Fall 2009 Enrollment) - Iowa College and University Enrollment Report, University of Iowa, January 2010Source (Graduation Rates) - Individual colleges
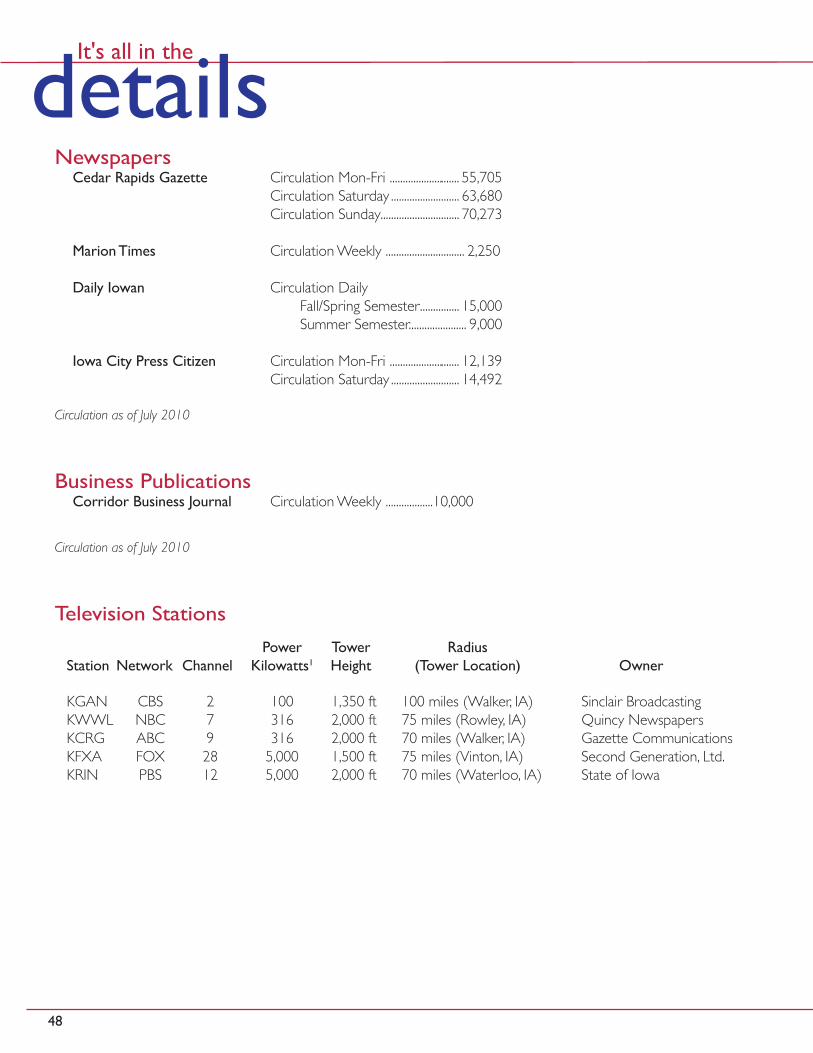
48
It'sallinthe
detailsNewspapers CedarRapidsGazette. Circulation.Mon-Fri............................ 55,705. . Circulation.Saturday........................... 63,680. . Circulation.Sunday.............................. 70,273 MarionTimes. Circulation.Weekly................................2,250 DailyIowan. Circulation.Daily. . . Fall/Spring.Semester................ 15,000. . . Summer.Semester.......................9,000
IowaCityPressCitizen Circulation.Mon-Fri............................ 12,139. . Circulation.Saturday........................... 14,492.Circulation as of July 2010
BusinessPublications. CorridorBusinessJournal. Circulation.Weekly...................10,000
Circulation as of July 2010
TelevisionStations Power Tower Radius Station Network Channel Kilowatts1 Height (TowerLocation) Owner
KGAN. CBS. 2. 100. 1,350.ft. 100.miles.(Walker,.IA). Sinclair.BroadcastingKWWL. NBC. 7. 316. 2,000.ft. 75.miles.(Rowley,.IA). Quincy.NewspapersKCRG. ABC. 9. 316. 2,000.ft. 70.miles.(Walker,.IA).. Gazette.CommunicationsKFXA. FOX. 28.. 5,000. 1,500.ft. 75.miles.(Vinton,.IA)............. Second.Generation,.Ltd.KRIN. PBS. 12. 5,000. 2,000.ft. 70.miles.(Waterloo,.IA)......... State.of.Iowa
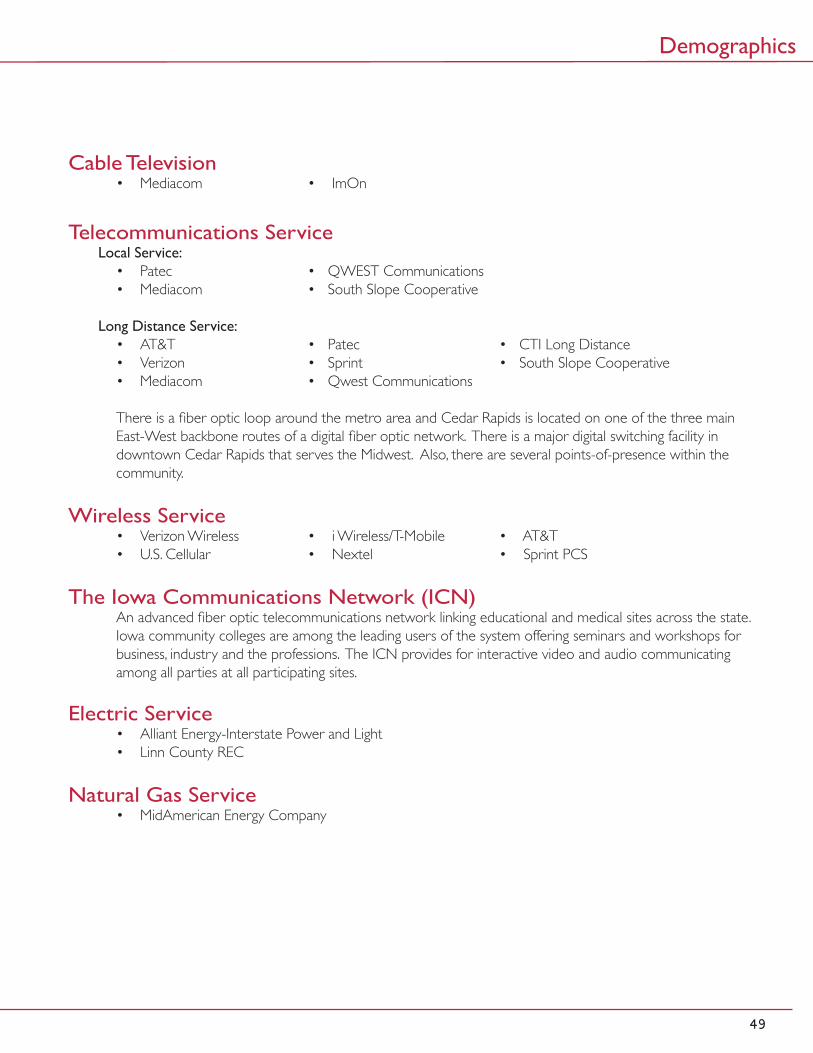
4�
Demographics
CableTelevisionMediacom.. . . •....ImOn
TelecommunicationsService LocalService: . .
Patec. . . . •...QWEST.CommunicationsMediacom. . . . •...South.Slope.Cooperative
LongDistanceService:.AT&T. . . •...Patec. . .. •...CTI.Long.DistanceVerizon. . . •...Sprint. . . •...South.Slope.CooperativeMediacom. . . •...Qwest.Communications
There is a fiber optic loop around the metro area and Cedar Rapids is located on one of the three main East-West backbone routes of a digital fiber optic network. There is a major digital switching facility in downtown.Cedar.Rapids.that.serves.the.Midwest...Also,.there.are.several.points-of-presence.within.the.community.
WirelessService Verizon.Wireless. . •....i.Wireless/T-Mobile. ... •....AT&T.U.S..Cellular.. . •....Nextel... . . •....Sprint.PCS
TheIowaCommunicationsNetwork(ICN)An advanced fiber optic telecommunications network linking educational and medical sites across the state. Iowa.community.colleges.are.among.the.leading.users.of.the.system.offering.seminars.and.workshops.for.business,.industry.and.the.professions...The.ICN.provides.for.interactive.video.and.audio.communicating.among.all.parties.at.all.participating.sites.
ElectricService Alliant.Energy-Interstate.Power.and.LightLinn.County.REC
NaturalGasService MidAmerican.Energy.Company
•
••
•••
••
••
•

50
It'sallinthe
detailsWaterService
CityofCedarRapids
WaterSource:Alluvial.Wells
CapacityofPlant:65.million.gallons.per.day. . . . AverageDailyConsumption:..37.8.million.gallons.per.day. . . PeakConsumption:.52.4.million.gallons.per.day. . . . TotalDistributionStorageCapacity:.25.million.gallons
WasteWaterTreatmentCityofCedarRapids
WasteWaterTreatment:Tertiary.Plant
DesignCapacity DailyUsage. HydraulicCapacity:. 56.million.gallons.per.day. .38.4.million.gallons.per.day. . BOD:. 406,000.lbs.per.day. . 241,000.lbs.per.day TKN:. 19,300.lbs.per.day. . 12,000.lbs.per.day. . . TSS:. 168,000.lbs.per.day. . 119,000.lbs.per.day

�1
Demographics
Source: http://www.weather.com
CedarRapidsAverageMonthlyPrecipitation
CedarRapidsAverageMonthlyTemperature
Source: http://www.weather.com
. . . . . . . . . . . . .
. JAN. FEB. MAR. APR. MAY. JUN. . JUL. AUG. ..SEP. OCT. NOV. DEC.
INCHES. 1.05. 1.10. .2.23. 3.22. .3.85. ..4.47. . 4.06. .4.23. ..3.27. .2.21. 2.24. 1.48.
. . . . . . . . . . . . .
. JAN. FEB. MAR. APR. MAY. JUN. JUL. AUG. SEP. OCT. NOV. DEC.
HIGH. .27. .33. .46. .60. .72. .82. .85. .83. .75. .63. .46. .32.LOW. .10. .16. .27. .38. .50. .59. .63. .62. .52. .40. .28. .15.
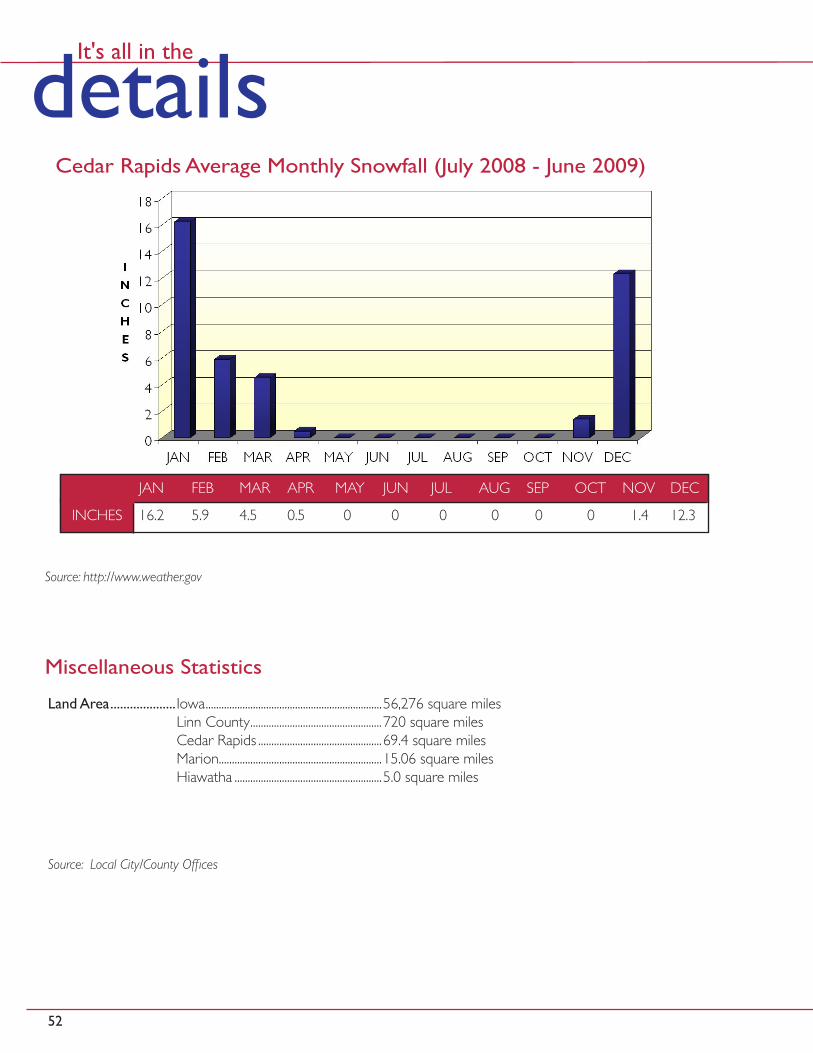
52
It'sallinthe
details
LandArea....................Iowa....................................................................56,276.square.miles..................................................Linn.County...................................................720.square.miles. Cedar.Rapids................................................69.4.square.miles. Marion..............................................................15.06.square.miles. Hiawatha.........................................................5.0.square.miles
Source: http://www.weather.gov
MiscellaneousStatistics
CedarRapidsAverageMonthlySnowfall(July2008-June2009)
. . . . . . . . . . . . .
. JAN. FEB. MAR. APR. MAY. JUN. JUL. AUG. SEP. OCT. NOV. DEC.
INCHES. 16.2. 5.9. 4.5. 0.5. ..0. ..0. ..0. ...0. ..0. ...0. ..1.4. 12.3.
Source:LocalCity/CountyOffices
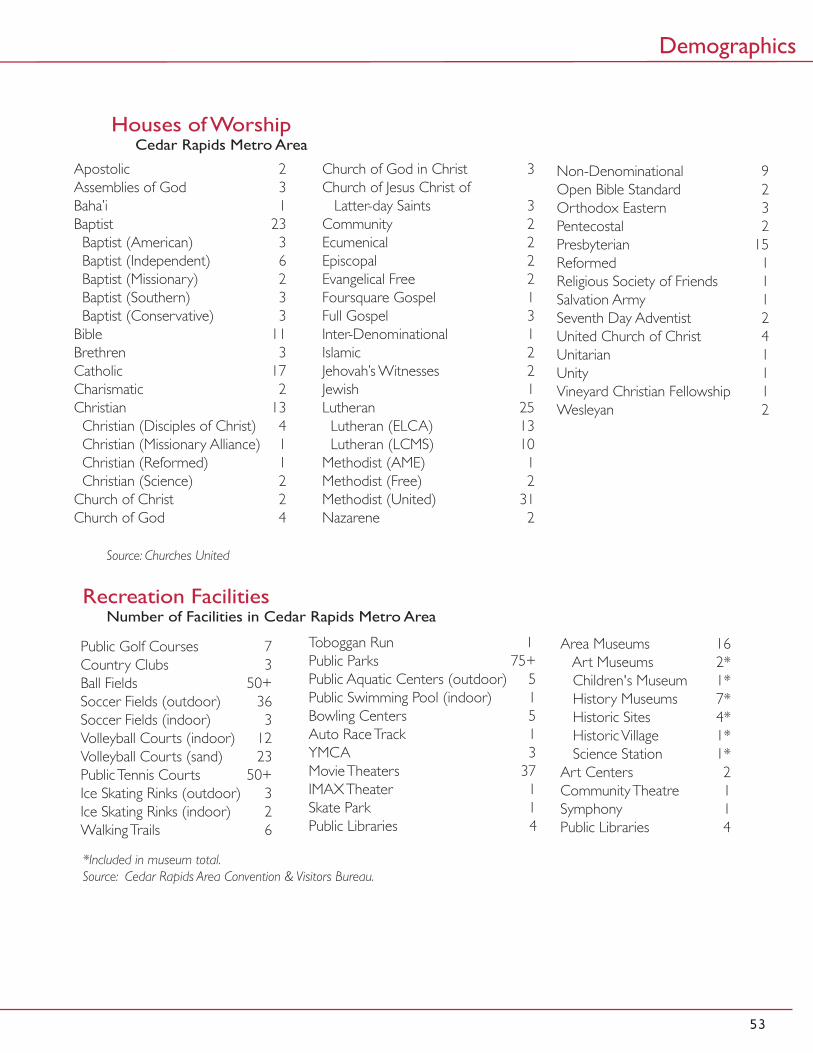
��
Demographics
RecreationFacilitiesNumberofFacilitiesinCedarRapidsMetroArea
*Included in museum total. Source:CedarRapidsAreaConvention&VisitorsBureau.
Source: Churches United
Public.Golf.Courses. 7Country.Clubs. 3Ball.Fields. .50+Soccer.Fields.(outdoor). 36Soccer.Fields.(indoor). 3Volleyball.Courts.(indoor). 12Volleyball.Courts.(sand). 23.Public.Tennis.Courts. ..50+Ice.Skating.Rinks.(outdoor). .3Ice.Skating.Rinks.(indoor). 2Walking.Trails.. 6
Toboggan.Run..................... 1Public.Parks. . . 75+Public.Aquatic.Centers.(outdoor)... 5Public.Swimming.Pool.(indoor). 1Bowling.Centers.. .. 5Auto.Race.Track. . 1YMCA. . . 3Movie.Theaters.. . 37IMAX.Theater. .. . 1Skate.Park. . . 1Public.Libraries. . . .......4
Area.Museums. . ......16. .......Art.Museums.. 2*....Children's.Museum. 1*....History.Museums. 7*....Historic.Sites. . 4*...Historic.Village. 1*...Science.Station. 1*Art.Centers.. ............. 2Community.Theatre.......... 1Symphony. . 1Public.Libraries. . 4
HousesofWorshipCedarRapidsMetroArea
Apostolic. . 2Assemblies.of.God. . 3Baha’i. . 1Baptist. . 23..Baptist.(American). . 3..Baptist.(Independent). . 6..Baptist.(Missionary). . 2..Baptist.(Southern). . 3..Baptist.(Conservative).. 3Bible. . 11Brethren. . 3Catholic. . 17Charismatic. . 2Christian. . 13..Christian.(Disciples.of.Christ). 4..Christian.(Missionary.Alliance). 1..Christian.(Reformed). . 1..Christian.(Science). . 2Church.of.Christ. . 2Church.of.God. . 4
Church.of.God.in.Christ. 3Church.of.Jesus.Christ.of.. Latter-day.Saints. 3Community. 2Ecumenical. 2Episcopal. 2Evangelical.Free. 2Foursquare.Gospel. 1Full.Gospel. 3Inter-Denominational. 1Islamic. 2Jehovah’s.Witnesses. 2Jewish. 1Lutheran. 25..Lutheran.(ELCA). 13..Lutheran.(LCMS). 10Methodist.(AME). 1Methodist.(Free). 2Methodist.(United) 31Nazarene. 2
Non-Denominational. 9Open.Bible.Standard. 2Orthodox.Eastern. 3Pentecostal. 2Presbyterian. .......15Reformed.. 1Religious.Society.of.Friends. 1Salvation.Army. 1Seventh.Day.Adventist. 2United.Church.of.Christ. 4Unitarian. 1Unity. 1Vineyard.Christian.Fellowship. 1Wesleyan. 2

54
It'sallinthe
detailsCrimeStatisticsforCedarRapids 2003 2004 2005 200� 2007 2008 Murder. 4. 0. ..1. ....6. 4. 3
Forcible.Rape. 46. 52. ...44. ...41. 34. 33
Robbery. 100. .84. .124. .137. 137. 128
Aggravated.Assault. 253. 249. 250. 230. 326. 278
Simple.Assault. 1,607. 1,592. 1,596. 1,560. 1,453. 1,367
Theft/Larceny. 5,216. 4,293. 5,017. 4,566. 4,669. 4,324
Domestic.Abuse. 669. 608. ..626. ..659. 687. 635
Burglary. 1,128. 1,365. 1,077. 1,121. 1,080. 1,222
Vehicle.Theft. 340. 261. ..235. ..312. 351. 345
Financial.Crimes*..... 174. 273. ..273. ..353. 402. 329.
*.Includes.forgery,.embezzlement,.counterfeiting,.ATM.fraud
Source:.IowaDepartmentofPublicSafety,OfficeoftheCommissioner
2003 2004 2005 200� 2007 2008
Murder. 4. 1. 2. 7. 5. 5
Forcible.Rape. 56. 55. 59. 62. 48. 44
Robbery. 106. 84. 124. 139. 144. 133
Aggravated.Assault. 313. 354. 330. 299. 384. 313
ViolentCrimeTotal 479 494 515 507 581 495
Source:IowaDepartmentofPublicSafety,OfficeoftheCommissioner
ViolentCrimeinLinnCounty

��
Demographics
Ophthalmology. 11Orthopedic. 16Otolaryngology. 4Pathology. 7Pediatrics. 4Plastic.Surgery. 3Psychiatry. 9Pulmonary.Medicine. 6Radiation.Oncology. 3Radiology. 23Radiation.Oncology. 3Rehabilitation. 2Rheumatology. 3Urology. 6Vascular.Surgery. 4
TotalPracticingPhysicians:2�3
Allergy. 3Anesthesiology. 28Cardiology. 16Cardiovascular.Surgery. 2Dermatology. 4Emergency.Medicine. 2Family.Practice. 43Gastroenterology. 5General.Surgery. 8Infectious.Disease. 1Internal.Medicine. 11Nephrology. 4Neurology. 6Neurosurgery. 1Occupational.Health. 1OBGYN. 17Oncology.&.Hematology. 7
Source: Linn County Medical Society
NumberofPracticingPhysicians,bySpecialtyLinnCounty
St.Luke's MercyMedical Hospital Center Doctors. . ...405. ...381.. Professional.Nurses. . ...780. ...670.. Staff.(full.and.part-time). . 2,790. 2,113
NumberofHospitalEmployees
CedarRapids
IowaCity
Mercy UniversityofIowa VeteransAffairs IowaCity HealthCare MedicalCenter.. Doctors. ...170. 1,428. ..123.. Professional.Nurses. ...460. 1,567. ...242. .. Staff.(full.and.part-time). 1,250. 7,638. 1,641
Note: The Cedar Rapids/Iowa City Technology Corridor is made up of Linn and Johnson CountiesSource:St.LukesHospital,MercyMedicalCenterandInternetwww.icgov.org/documents/demoinfo.pdf

5�
It'sallinthe
detailsForAdditionalInformationorResourcesPleaseContact:
KathleenPeggPH:(319)730-1422E-mail:[email protected]
Related Documents