1 “TOTAL QUALITY MANAGEMENT IN MAINTENANCE OPERATIONS” By CW2 Todd D. Brown Indiana Army National Guard Field Maintenance Shop (FMS) # 3 2 May 2012 To Louis M. Swiczewicz, Jr., Ph.D. School of Continuing Studies Roger Williams University

Brown_IT472.91_Practicum_Final Report
Aug 10, 2015
Welcome message from author
This document is posted to help you gain knowledge. Please leave a comment to let me know what you think about it! Share it to your friends and learn new things together.
Transcript
1
“TOTAL QUALITY MANAGEMENT IN MAINTENANCE OPERATIONS”
By
CW2 Todd D. Brown
Indiana Army National Guard
Field Maintenance Shop (FMS) # 3
2 May 2012
To
Louis M. Swiczewicz, Jr., Ph.D.
School of Continuing Studies
Roger Williams University
A Practicum Presented to Roger Williams University in Partial Fulfillment of the Requirements
for the BS Degree in Industrial Technology.
TOTAL QUALITY MANAGEMENT IN MAINTENANCE OPERATIONS 2
TABLE OF CONTENTS:
INTRODUCTION: 3
BACKGROUND AND SIGNIFICANCE (Parts Management) 4-5
PROCEDURES: 6-14
RESULTS: 15-17
RECOMMENDATION: 18-23
BACKGROUND AND SIGNIFICANCE (Tool Storage) 24
PROCEDURES: 25-26
RESULTS: 27
RECOMMENDATION: 27-30
BACKGROUND AND SIGNIFICANCE (Final Inspection) 30
PROCEDURES: 31-33
RESULTS: 33-35
RECOMMENDATION: 35-37
REFERENCES: 38
Figures: Figure 1 – pg 4 ~ Figure 4 – pg 8 ~ Figure 7 – pg 21 ~ Figure 10 – pg 36
Figure 2 – pg 5 ~ Figure 5 – pg 8 ~ Figure 8 – pg 28
Figure 3 – pg 6 ~ Figure 6 – pg 19 ~ Figure 9 – pg 33
Tables: Table 1 – pg 10 ~ Table 4 – pg 14 ~ Table 7 – pg 21 ~ Table 10 – pg 32
Table 2 – pg 12 ~ Table 5 – pg 14 ~ Table 8 – pg 26 ~ Table 11 – pg 32
Table 3 – pg 13 ~ Table 6 – pg 20 ~ Table 9 – pg 29 ~ Table 12 – pg 32
Charts: Chart 1 – pg 17 ~ Chart 2 – pg 22 ~ Chart 3 – pg 34

TOTAL QUALITY MANAGEMENT IN MAINTENANCE OPERATIONS 3
INTRODUCTION
Over the course of the last three years I have attempted to model and develop my
maintenance facility around the concepts of Total Quality Management (TQM), Lean Operations
as well as incorporate some of the facets of Just In Time (JIT) logistics. I have been a supervisor
of an Indiana Army National Guard maintenance facility for nine years and continue to evaluate
our procedures, protocols and practices as they relate to shop layout, work order management,
inventory management, and tool storage.
Over the last few years I have noticed a need to streamline our operation and make it
more efficient. A couple of specific areas that require attention are parts and tool storage. I
don’t believe our repair parts and special tools are stored properly, which in turn lead to
inefficient operations. Moreover, I believe we have too much inventory on hand. As I was
reviewing some of the key points of interest regarding Lean operations, I turned my attention to a
few focus areas that my facility could possibly improve upon if I can successfully implement
these changes. I believe that there are three significant areas that I need to address in order to
adopt the principles of lean operation, as well as Total Quality Management. The areas are as
follows: Parts Management; Tool Storage; and Final Inspection.
Additionally, as I reviewed the textbook Quality Management for Organization
Excellence by Goetsch and Davis I was drawn to a few chapters that I took particular interest in
and believe I could use to identify, assess, and implement quality management strategies and
techniques within my facility. Some of these areas include: Partnering, Leadership and Change,
Education and Training, and Total Quality Tools. Many of the Total Quality Tools mentioned in
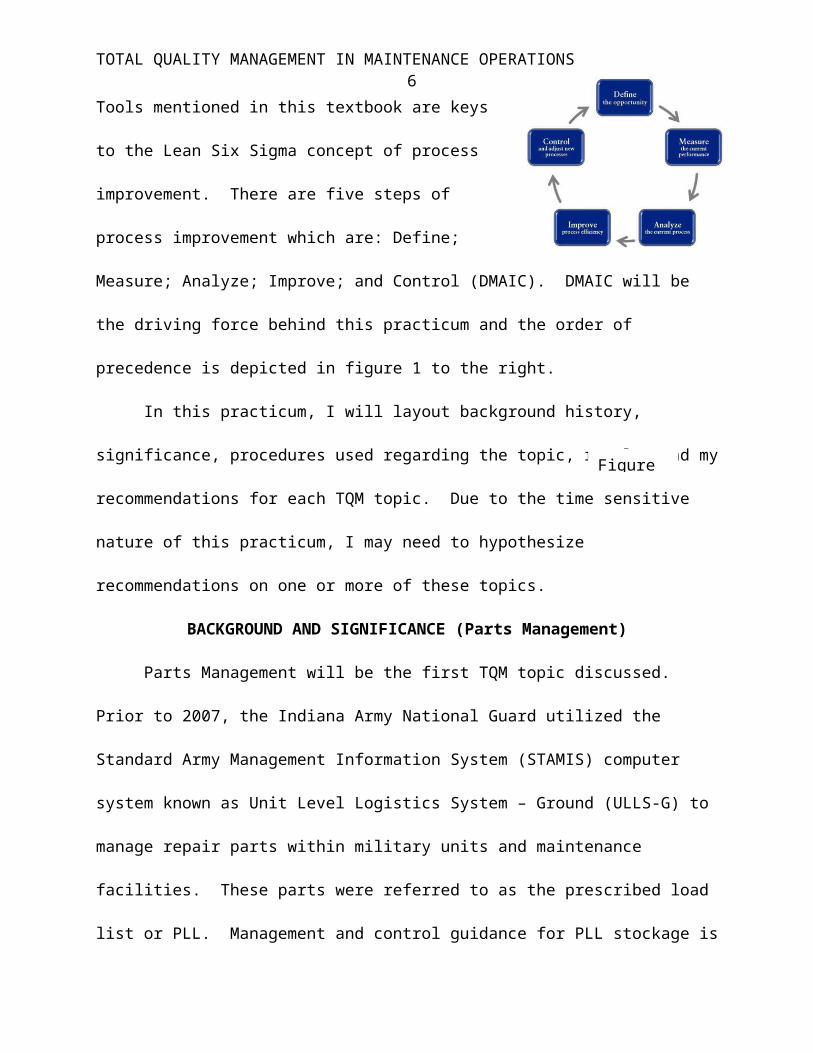
this textbook are keys to the Lean Six Sigma concept of process improvement. There are five
steps of process improvement which are: Define; Measure; Analyze; Improve; and Control
TOTAL QUALITY MANAGEMENT IN MAINTENANCE OPERATIONS 4
(DMAIC). DMAIC will be the driving force behind this
practicum and the order of precedence is depicted in figure 1 to
the right.
In this practicum, I will layout background history,
significance, procedures used regarding the topic, results and
my recommendations for each TQM topic. Due to the time sensitive nature of this practicum, I
may need to hypothesize recommendations on one or more of these topics.
BACKGROUND AND SIGNIFICANCE (Parts Management)
Parts Management will be the first TQM topic discussed. Prior to 2007, the Indiana
Army National Guard utilized the Standard Army Management Information System (STAMIS)
computer system known as Unit Level Logistics System – Ground (ULLS-G) to manage repair
parts within military units and maintenance facilities. These parts were referred to as the
prescribed load list or PLL. Management and control guidance for PLL stockage is governed by
Army Regulation (AR) 710-2. FMS # 3 stored and managed a significant amount of PLL
belonging to our customers. This PLL stockage was locked within cargo trucks stored at our
maintenance shop.
There was a frame of mind within the Army and specifically the Indiana Army National
Guard of what is known as hoarding. The hoarding of excessive amounts of repair parts and
hardware came to be in large part due to budget constraints. These budget constraints consisted
of two main issues which were the common theme of no funding and secondly the withholding
of repair parts funding until the end of the fiscal year. Some years, Maintenance facilities such as
mine would have to spend large amounts of repair parts funding very quickly. Moreover,
lengthy customer wait time (CWT) and requisition wait time (RWT) caused maintenance
Figure 1
TOTAL QUALITY MANAGEMENT IN MAINTENANCE OPERATIONS 5
supervisors to be fearful of not having large amounts
of repair parts on hand. These large quantities of
repair parts were considered a security blanket for
equipment readiness. Figure 2 to the right, provides
clarification regarding both CWT and RWT. The acronym SSA stands for Supply Support
Activity, and is basically a warehouse of repair parts. There are numerous SSA’s throughout the
U.S. Army.
There has been a paradigm shift in Army logistics since the mid 1990’s with the
inception of Velocity Management (Dumond et al 2001, ix). The term Velocity Management
was replaced in 2002 with the Army’s current logistics doctrine, and is now known as
Distribution Management. In the fall of 2007, FMS # 3 switched from the Prescribed Load List
to Shop Stock and Bench Stock. It was during this period that FMS # 3 absorbed all repair parts
previously stocked by the six units the facility supported. Distribution Management (DM) is a
system that takes a page right out of six sigma’s five steps of process improvement; utilizing
three of the five steps: define, measure and improve to make the Army’s logistics system more
responsive, effective and efficient.
One of the most significant contributions to the Army logistics system that can be
attributed to DM is the reduction of requisition wait times and customer wait times. These time
reductions are the key elements required to eliminate the need for units and facilities to maintain
large amounts of stock on hand and ties directly into what is known in the civilian sector as Just
In Time logistics.
Figure 2
TOTAL QUALITY MANAGEMENT IN MAINTENANCE OPERATIONS 6
Figure 3 to the right depicts the
process management techniques of
distribution management and the benefits
derived.
PROCEDURES
Define – The problem revolving around FMS # 3’s parts management system is twofold;
one that has been a perpetual issue of overstockage and also one of storage placement. One
additional area in parts management that requires defining is when mechanics order the wrong
part. As previously stated in the background and significance, there has been a paradigm shift in
the U.S. Army regarding parts stockage. The overstockage of parts has been an ongoing issue at
my facility, and one that I have addressed over the last couple of years. Although I have been
analyzing our stockage levels for quite some time, I felt compelled to show the significant
improvement in this area and further explain a few differences in types of stock. Army
maintenance facilities are authorized to stock either shop stock or bench stock.
“Shop stocks are demand-supported repair parts and consumables stocked within a
support-level maintenance activity. They are used to accomplish maintenance requests or
programmed repair” (Army Regulation (AR) 710-2 2008, 46). Bench stocks are low cost, high
use, consumable repair parts used by maintenance personnel at an unpredictable rate (AR 710-2
2008, 48). A computer database is used to track inventory stockage, demand or usage and
reorder as repair parts are consumed. Inventory of shop stock must be conducted on a quarterly
basis and bench stock on a semi-annual basis. Support activities with large amounts of inventory
on hand will naturally spend a significant amount of time performing these inventories.
Figure 3

TOTAL QUALITY MANAGEMENT IN MAINTENANCE OPERATIONS 7
The second problem that I will define is the issue of repair parts storage location. The
person responsible for work order and parts management is called the Production Controller
(PC). This person is undoubtedly one of the busiest employees within a maintenance facility. Of
particular note at FMS # 3, is our PC performs the function of two employees since we do not
have a Tool and Parts attendant on staff due to funding constraints. The Tool and Parts
attendant’s duties would encompass inventory control, stockage and issue of both repair parts
and tools. The normal day to day duties of the PC are further complicated by absorbing the
additional responsibilities of the Tool and Parts attendant. The location of the parts storage
conex and the work order storage conex required the PC an enormous amount of travel time
incurred walking across the facility and between the two storage conex’s.
Since this person has an enormous responsibility, I feel compelled to make their day
more efficient which should result in a more effective operation. During the execution of their
duties the PC is required to do the following: acquire repair parts from current stock for work
orders; stock repair parts delivered directly to the shop by commercial vendors; and issue parts to
mechanics for work orders that are ready to come into the facility for repair. Furthermore, the
PC was required to acquire repair parts for work orders from two locations, the first being the
Shop’s repair parts storage and the second being repair parts belonging to our supported units.
The second process was eliminated in the fall of 2007, but I have included this info to
help illuminate the existing problem and also show proof of some improvement prior to this
practicum. Figures 4 and 5 reflect the graphic depiction of the routes the PC must take on a daily
basis to acquire repair parts for work orders, handle direct deliveries and issue parts for work
orders.
TOTAL QUALITY MANAGEMENT IN MAINTENANCE OPERATIONS 8
W/O
P
arts
Shop PLL Parts Trucks
Shop PLL Parts Conex’s
Too
l R
oom Produc
tionControl Office
FMS # 3 Parts Storage Layout Before
Task – Issue Part/s for Work Order
Work Bays
POLHAZ
MAT
Mec
h
Eq
uip
Clerk acquires parts to issue for W/O
OutBack
Figure 5
27.7
se
c
27.7 sec
W/O
P
arts
Shop PLL Parts Trucks
Shop PLL Parts Conex’s
Too
l R
oom
ProductionControl Office
FMS # 3 Parts Storage Layout BeforeTask – Pick Part/s for Work Order &
Direct Delivery
Work Bays
POL M
ech
E
qu
ip
Clerk picks part/sClerk takes parts to W/O storage
41.7 sec
Direct Delivery (X2)
46
sec
18.3 sec
55
sec
27.7 sec
Figure 4

TOTAL QUALITY MANAGEMENT IN MAINTENANCE OPERATIONS 9
The third area within parts management that must be defined is based upon errors in parts
ordering. There are two types of errors that occur that can cost the facility both time and
funding. These two occurrences can happened when a mechanic either orders the wrong part to
repair an equipment deficiency or when the wrong part is ordered based upon misdiagnoses of
the malfunction. Although some of the repair parts that are ordered incorrectly may not be
expensive in nature, the overall effect on the shop operation is very detrimental. The main issue
is the delay of the timely completion of the work order and also places a burden upon the
Production Controller and Shop Supervisor’s ability to perform maintenance management
functions.
Repair cycle time (RCT), is the Army’s metric to track how long a work order takes to
complete. This time is tracked at both the Organizational (Unit) and Support level, and can be
accessed via the Army’s Integrated Logistics Analysis Program (ILAP). Long RCT reflects
poorly upon the support maintenance facility and also inhibit the Supported Unit’s ability to
conduct training or support State Active Duty missions. Moreover, if the wrong part is ordered
and then turned back into the SSA, the Indiana Army National Guard will not recover the
funding. Once the requisition is fulfilled, the Indiana Army Guard will be charged for the repair
part. This further emphasizes the need to order the correct part for the equipment malfunction.
Measure – Shop and bench stock listings are two significant reports that a manager can
use to determine the amount of shop and bench stock lines, quantity of each repair part on hand
for each line, the cost of each line, demands or usage, and the total cost of inventory on hand.
These reports are generated out of the SAMS-E database, and must be kept on file for a
minimum of two years. One of the other metrics that affects parts management is customer wait
TOTAL QUALITY MANAGEMENT IN MAINTENANCE OPERATIONS 10
time. As previously stated in the introduction, customer wait time is the time measurement of
when a part is requisitioned until the part is received by the customer.
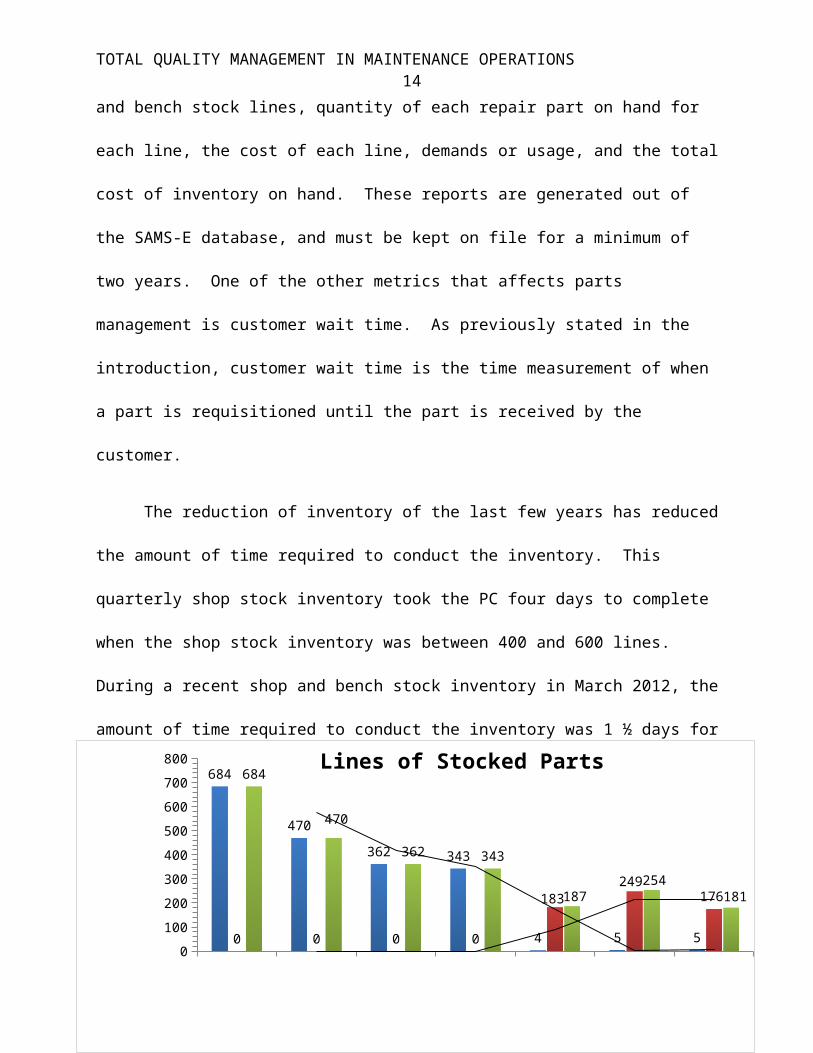
The reduction of inventory of the last few years has reduced the amount of time required
to conduct the inventory. This quarterly shop stock inventory took the PC four days to complete
when the shop stock inventory was between 400 and 600 lines. During a recent shop and bench
stock inventory in March 2012, the amount of time required to conduct the inventory was 1 ½
days for a delta of 2 ½ days per inventory. The shop stock inventory was conducted four times
per year, but the bench stock inventory is only conducted twice per year. Table # 1 displays the
reduction in total inventory since the inception of the SAMS-E system. Moreover, the table also
reflects the transition of shop stock to bench stock while reducing the total number of repair parts
lines within the shop. A line doesn’t reflect the quantity of parts on hand, it is a term used to
Sep-07 Apr-09 Sep-09 Feb-10 Apr-11 Sep-11 Mar-12
Shop Stock 684 470 362 343 4 5 5
Bench Stock 0 0 0 0 183 249 176
Total Lines of Stock 684 470 362 343 187 254 181
50
150
250
350
450
550
650
750 684
470
362 343
4 5 50 0 0 0
183249
176
684
470
362 343
187254
181
Lines of Stocked Parts
Table 1

TOTAL QUALITY MANAGEMENT IN MAINTENANCE OPERATIONS 11
reflect a stockage of repair parts. The quantity of a repair parts on hand for a stockage line could
be one to ninety-nine.
There are two ways our maintenance facility acquires parts required for work order
repair. Parts are requisitioned through the SAMS-E, and then funded via the National Guards
Integrated Material Automation Program (IMAP). IMAP is a web-based program that transmits
the requisition to Indiana’s SSA. If the SSA has the part on hand in their Authorized Storage
Listing (ASL), they will pick the part and place it in the maintenance facility’s repair parts bin.
If the part/s is not on hand, the requisition will be transmitted to the Army’s supply depots;
which are part of the Defense Supply Center network and the Defense Logistics Agency. The
National Guard receives these requisition fulfillments via commercial delivery, which is also
called direct delivery.
These two times directly influence what is known as repair cycle time, and help provide
the justification to maintenance manager’s decisions to reduce on hand inventory. I utilized two
measurement techniques to capture the average CWT for repair parts requisitioned for work
orders. Direct delivery metrics were captured through the use of the Army’s Integrated Logistics
Analysis Program portal that is accessed through the Logistics Information Warehouse (LIW)
website. The report utilized is called the Distribution Management/Supply Chain Metrics/CWT
Summary. Data was pulled from January 2012 to March 2012. Indiana’s SSA average CWT
during this period was six days.
The second metric was established using the SAMS-E report known as the document
control register (DCR). This process involved a few more steps that the CWT summary report.
Each repair part is assigned a document number when the requisition is created in the SAMS-E.

TOTAL QUALITY MANAGEMENT IN MAINTENANCE OPERATIONS 12
The date the part was ordered is embedded within the document number, and is represented by
the Julian date. All repair parts requested are shown on the DCR. When repair parts requested
are delivered by direct delivery, the PC would enter the date received on the DCR. This data was
captured from 1 Feb 12 through 29 Feb12. I added up the total number of days for each delivery
and divided the sum by the number of orders received. The average CWT during this period was
three days.
One of the other metrics that I needed to determine was the amount of time was necessary
for the PC to acquire repair parts for work orders, handle direct deliveries and issue parts for
work orders. The metric was achieved by first measuring the time required for the PC to walk to
each specific parts location. Three separate times were taken to measure this action.
Furthermore, an average number of events per day were required to determine an average daily
total time. The average number of events per day was based upon the total trips performed for
each action during the month of February 2012. The tasks labeled Pick Part/s for Work Order &
Direct Delivery and Issue Part/s for Work Order in Table 2 and Table 3 reveal the metrics
associated with the PC clerks travel time required to perform his day to day responsibilities.
Parts ordering errors were captured at the production control office. All employees were
briefed about the error data collection, and the need to track any repair part that was incorrectly
ordered. The PC was instructed to enter the number of occurrences, as well as the dollar value
associated with the incorrect parts. This flow of this information is dictated by the shop internal
standard operating procedures. These procedures are specific regarding the flow of work orders
Table 2 * Obsolete task (2007)
Table 3

TOTAL QUALITY MANAGEMENT IN MAINTENANCE OPERATIONS 13
and parts ordering within the shop. This guidance states that work orders are routed through the
production controller each time there is a status change. This status could be a work order
requiring repair parts, a work order that has been completed, or a work order issued to a
mechanic.
The cost associated with each repair part is determined by using the Defense Logistics
Agency (DLA) FEDLOG printout. The DLA FEDLOG system is updated monthly and provides
the user: unit of issue, price, class of supply, recoverability code, and characteristics. Tables 4 &
5 below exhibit the data metrics of the parts ordering errors for FMS # 3.
TOTAL QUALITY MANAGEMENT IN MAINTENANCE OPERATIONS 14
FEB-RU-ARY
MARCH
APRIL MAY JUNE JULY AU-GUST
SEP-TEM-BER
OC-TO-BER
NO-VEM-BER
DE-CEM-BER
JAN-UARY
Misdi-ag-nosed Repair Cost
$0 $0 $0 $0 $0 $0 $0 $0 $0 $0 $0 $0
Wrong Part Or-dered Cost
$1,400.00
$31.50 $0.00 $0.00 $0.00 $0.00 $0.00 $0.00 $0.00 $0.00 $0.00 $0.00
Monthly Cost
$1,400.00
$31.50 $0.00 $0.00 $0.00 $0.00 $0.00 $0.00 $0.00 $0.00 $0.00 $0.00
$100
$300
$500
$700
$900
$1,100
$1,300
$1,500
$0 $0 $0 $0 $0 $0 $0 $0 $0 $0 $0 $0
$1,400.00
$31.50 $0.00 $0.00 $0.00 $0.00 $0.00 $0.00 $0.00 $0.00 $0.00 $0.00
$1,400.00
$31.50 $0.00 $0.00 $0.00 $0.00 $0.00 $0.00 $0.00 $0.00 $0.00 $0.00
Shop Misdiagnosed Repair & Wrong Parts Cost
FEBRUARY MARCH APRIL MAY
Misdiagnosed Repair* 0 0 NaN NaN
Wrong Part Ordered** 1 4 NaN NaN
Parts Errors Monthly Total 1 4 NaN NaN
0.5
1.5
2.5
3.5
4.5
0 0
1
4
1
4
Shop Misdiagnosed Repair & Wrong Parts
Table 4

TOTAL QUALITY MANAGEMENT IN MAINTENANCE OPERATIONS 15
RESULTS
Analyze – As I look over the data and tables regarding FMS # 3’s parts management, I
can definitely see areas that can be improved upon. Parts stockage is trending in the right
direction, but needs further attention to determine if we are stocking the correct parts on hand. In
September 2007 the shop had a total stockage of 684 lines, and during the last inventory in
March 2012 the shop had reduced stockage to 181 lines for a delta of 503 lines of inventory.
This is a 74% reduction in stockage. One of the other items analyzed regarding shop stockage
and whether is the length of time required to acquire repair parts for work orders. SSA fulfilled
requests averaged six days of CWT and direct deliveries averaged three days of CWT for a
combined total repair parts average CWT of 4 ½ days for FMS # 3.
Based upon Army ILAP statistics during the 2nd Quarter of Fiscal Year 2012, Direct
Support RCT averaged 36 days for the entire state of Indiana. One of the main reasons repair
cycle time is over one month for maintenance activities within the Indiana Army National Guard
is attributed to a shortage of authorized man-power required to service and maintain tactical
equipment. With that said, a 4 ½ day average CWT for repair parts and a maintenance backlog
in excess of one month reduces the requirement to maintain large stocks of repair parts.
Moreover, FMS # 3 transitioned much of its repair parts stockage from shop stock to bench stock
in April of 2011.
Although by doctrine bench stock part usage is at an unpredictable rate, FMS # 3 stocks
low-cost scheduled service parts which are consumed at fairly predictable rate. In order to meet
regulatory guidance set forth in AR 710-2, we stock only 30 days of supply for each bench stock
line. This stock level was simple to determine by taking the total fleet size of equipment and
TOTAL QUALITY MANAGEMENT IN MAINTENANCE OPERATIONS 16
dividing by twelve months. This process was repeated for each scheduled service part required
for each piece of equipment supported by FMS # 3. Although much of the bench stock parts on
hand were scheduled service related, I determined that numerous bench stock lines were for
unscheduled repairs. Furthermore, many of the lines stocked at FMS # 3 had minimal or no
demands since the last inventory period.
One of the other benefits of reducing the high cost shop stock lines and transitioning the
inventory to bench stock, I eliminated two timely inventories. FMS # 3 only stocks five lines of
shop stock, which can be inventoried quarterly in about five minutes.
It is apparent after analyzing the walking times incurred by the PC throughout a typical
day at FMS # 3, this person is spending an enormous amount of time go to and from the repair
parts storage locations. The PC performs three major functions regarding the handling of repair
parts. The three tasks of acquire repair parts for work orders, handle direct deliveries and issue
parts for work orders take 7.66 minutes, 3.67 minutes, and 3.7 minutes per day respectively. The
sum of these three events totals just over 15 minutes per day spent walking during the duty day
of the FMS # 3 PC. My Production Controller is spending way too much time walking during
the day. The location of our stocked parts as well as parts for work order repairs is creating an
inefficient environment and is degrading the effectiveness of the Production Controller.
The data gathered regarding parts ordering errors identifies significant issues in the realm
of parts requisitions for work orders. Mechanics have been very accurate diagnosing
malfunctions, but have had some difficulty ordering the correct parts for the malfunction. One of
key areas of concern revolves around what is known as the usable on code (UOC). The UOC is
a code which identifies the model of equipment the repair part fits. For example, the High
TOTAL QUALITY MANAGEMENT IN MAINTENANCE OPERATIONS 17
Mobility Multipurpose Wheeled Vehicle (HMMWV) has multiple UOC’s for the numerous
models of HMMWV’s that are manufactured. The UOC for a M1097 will be different from a
M1097A2. The A2 model is the newer model and has updated suspension and drive train parts
that are not interchangeable.
Incorrect UOC4
80%
Wrong Item #1
20%
Type of Error
Incorrect UOC Wrong Item #
Chart # 1
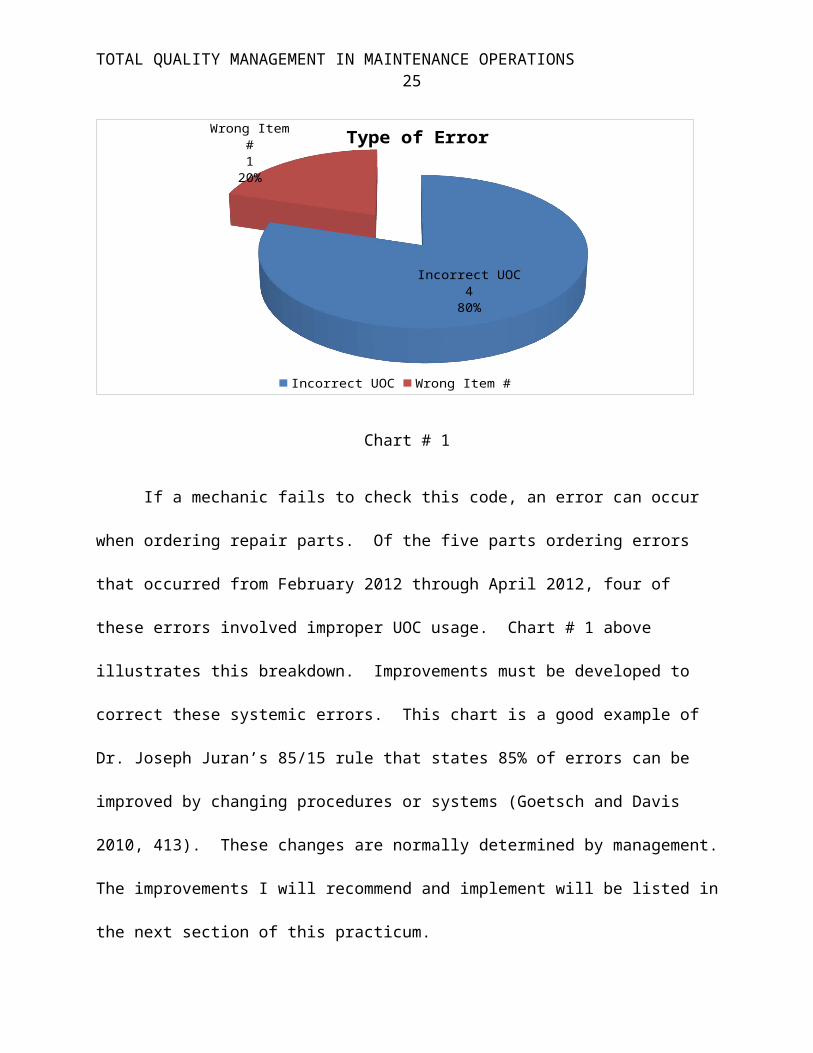
If a mechanic fails to check this code, an error can occur when ordering repair parts. Of
the five parts ordering errors that occurred from February 2012 through April 2012, four of these
errors involved improper UOC usage. Chart # 1 above illustrates this breakdown.
Improvements must be developed to correct these systemic errors. This chart is a good example
of Dr. Joseph Juran’s 85/15 rule that states 85% of errors can be improved by changing
procedures or systems (Goetsch and Davis 2010, 413). These changes are normally determined
by management. The improvements I will recommend and implement will be listed in the next
section of this practicum.

TOTAL QUALITY MANAGEMENT IN MAINTENANCE OPERATIONS 18
RECOMMENDATION
Improve – I have defined, measured and analyzed the three issues discussed earlier in this
practicum. After performing these steps, I have formulated a few recommendations to help
improve the efficiency of maintenance operations at FMS # 3. The first issue of the stockage
level of repair parts at the shop can be improved by reducing the bench stock inventory. In order
to systematically reduce this inventory, we must first ensure that scheduled service parts are kept
on hand. The stockage of scheduled service parts must be continually reviewed to ensure parts
stocked for obsolete equipment are turned in to the SSA, but also stocking service parts for new
equipment to our supported units.
Moreover, we must look at the demand history of each line between the semi-annual
inventory to determine what stockage lines should be eliminated. Regulatory guidance states
that in order to add a shop stock line, the repair part in question must have at least three demands
during the control period. Also, in order to retain the part there must be at least one demand to
retain the item. This guidance is only mandatory for shop stock and bench stock is not subject to
demand supported criteria. It is my recommendation that FMS # 3 utilize the same criteria
regarding our bench stock levels. Stocking service parts is very easy to manage due to the
perpetual process of equipment services. Each year every piece of equipment in the Indiana
Army National Guard inventory must serviced during the scheduled annual service. The demand
for stocked service parts is therefore very easy to justify their stockage levels.
The improvement for FMS # 3’s bench stock will require a detailed look at each line, the
demands during the last control cycle, and the preparation of turn in documents to reduce the
inventory on hand. We must eliminate subjective opinion regarding bench stock, and utilize

TOTAL QUALITY MANAGEMENT IN MAINTENANCE OPERATIONS 19
objective reports generated from the SAMS-E computer to determine the correct level of
inventory FMS # 3 should have on hand.
The second and most challenging improvement deals with the location of FMS # 3’s
repair parts storage locations. This challenge was constrained by the limitations the existing
floor plan and conex storage space. In order to reduce PC walking times, the shop and bench
stock inventory needed to be relocated to a closer location next to the facility. Furthermore, the
work order repair parts storage location needed to be relocated to a location closer to the PC
office. In order to accomplish this storage location recommendation, the key move to free the
space required was the placement of the FMS # 3 tool room. This location will be discussed
later within this practicum.

TOTAL QUALITY MANAGEMENT IN MAINTENANCE OPERATIONS 20
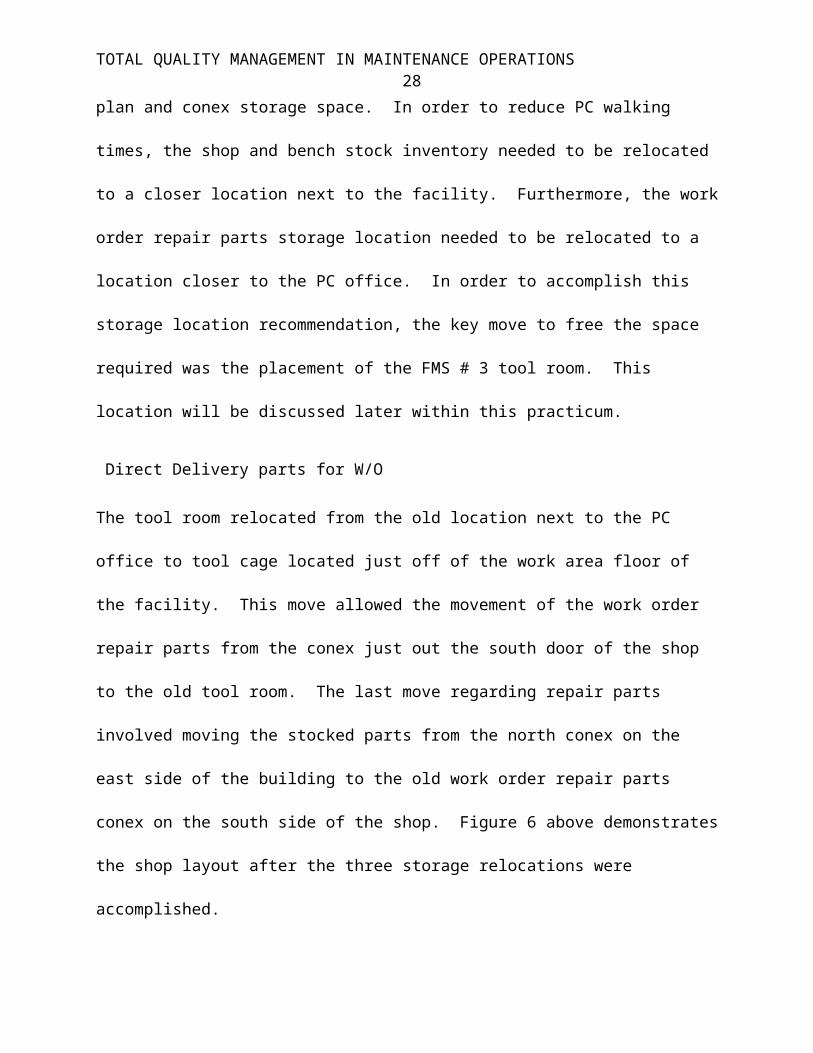
The tool room relocated from the old location next to the PC office to tool cage located just off
of the work area floor of the facility. This move allowed the movement of the work order repair
parts from the conex just out the south door of the shop to the old tool room. The last move
regarding repair parts involved moving the stocked parts from the north conex on the east side of
the building to the old work order repair parts conex on the south side of the shop. Figure 6
above demonstrates the shop layout after the three storage relocations were accomplished.
The movement of the repair parts storage location uses one of the lean principles of what
is known as point of use storage (POUS). By definition POUS is used to ensure tools and parts
are stored conveniently near the activity and to help minimize movement (Goetsch and Davis
2010, 510). Tables 6 and 7 below display the new time metrics taken after the recommended
moves were accomplished. These times were compiled using the same techniques demonstrated
in the paragraphs within the results section of this practicum. The three tasks of acquire repair
W/O
P
arts
Shop/Bench Stock Parts Conex
Tool Cage
ProductionControl Office
Work BaysBobcat Storage
Signal Equip
POLHAZ
MATM
ech
E
qu
ip
Shop PLL Parts Trucks
FMS # 3 Parts Storage Layout AfterTasks – Pick & Issue Part/s for Work
Order & Direct Delivery
Clerk picks parts for W/O
OutBackFigure
6
31 .7
se c
27.7 sec
Clerk acquires parts to issue for W/O
Direct Delivery parts for W/O
TOTAL QUALITY MANAGEMENT IN MAINTENANCE OPERATIONS 21
parts for work orders, handle direct deliveries and issue parts for work orders take 4.94 minutes,
33 seconds, and 33 seconds per day respectively. The sum of these three events totals just over
six minutes per day giving a delta of almost nine minutes per day. Over a one week period, this
move will save the PC forty-five minutes of time that can be spent performing more important
functions.
Figure 7

TOTAL QUALITY MANAGEMENT IN MAINTENANCE OPERATIONS 22
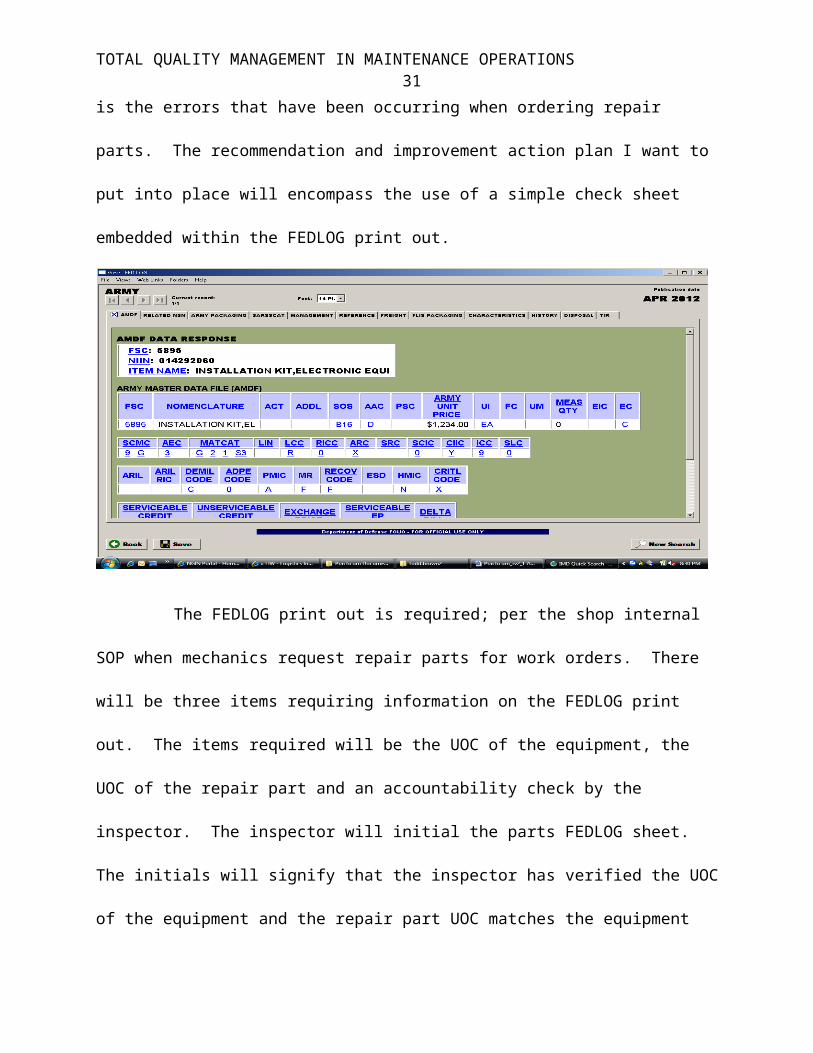
The last area of the parts management topic requiring improvement is the errors that have been
occurring when ordering repair parts. The recommendation and improvement action plan I want
to put into place will encompass the use of a simple check sheet embedded within the FEDLOG
print out.
The FEDLOG print out is required; per the shop internal SOP when mechanics
request repair parts for work orders. There will be three items requiring information on the
FEDLOG print out. The items required will be the UOC of the equipment, the UOC of the repair
part and an accountability check by the inspector. The inspector will initial the parts FEDLOG
sheet. The initials will signify that the inspector has verified the UOC of the equipment and the
repair part UOC matches the equipment UOC. Figure 7 above is an example of a FEGLOG print
out and the information that will be required for future requisitions. This improvement was
implemented on 1 April 2012.
TOTAL QUALITY MANAGEMENT IN MAINTENANCE OPERATIONS 23
FEB MAR APR MAY JUN JUL AUG SEP OCT NOV DEC JAN0 0 0 0
1
4
0 0
1
4
0 0
Repair Parts Error Trending
Misdiagnosed Repair* Wrong Part Ordered** Parts Errors Monthly Total
Fedlog check sheet imple-mented 1 Apr 12
Chart # 2 above displays a trend line of before the shop implemented the check sheet
version of the FEDLOG print out, and after the checks were instituted at the shop. It is clear by
the amount of errors that the check sheet version has reduced the parts ordering errors that were
occurring before the change. Although the FEDLOG changes were very simple, they have
forced each mechanic to verify the UOC of each part they order. Moreover, a “second set” of
eyes by the inspector ensures there is little chance that an error will occur because of a UOC
mistake.
Control – This is last step in the DMAIC system and is the step that requires standard
measures are implemented as well as maintained. It is imperative that we continue to review the
quarterly shop stock inventories and semi-annual bench stock inventories. The standard to
perform these inventories is set forth in AR 710-2, but FMS # 3 practices regarding bench stock
will be to perform a review of demands at the same time of this inventory. Based upon this
review, we will eliminate lines that do not have the necessary demands and also add bench stock
Chart # 2

TOTAL QUALITY MANAGEMENT IN MAINTENANCE OPERATIONS 24
parts that should be stocked. These procedures will be further codified in the FMS # 3 internal
standard operating procedure (SOP). This procedures and protocols in this SOP are reviewed
annual to determine effectiveness. Additionally, it is very important that all employee within the
facility understand these procedures of how to obtain repair parts for work orders and that these
procedures must be adhered to. If mechanics circumvent the PC for repair parts, inventory will
not be accurate and demands will not be properly captured. These procedures are also outlined
in the internal SOP.
The movement of storage locations will be much easier to control, because this is not a
fluid change. What must be continually reviewed is whether or not our facility has the required
amount of storage for work order repair parts and even stocked parts. We must be ready and
willing to make changes to the new storage plan, if it is not adequate for our operational needs.
Point of use repair parts storage will definitely make the PC’s job responsibilities much easier.
One of the focal points of POUS was also the manner in how our special tools were stored,
which will be discussed in the following pages.
Control of repair parts requisitions will require significant management involvement to
spot check requisitions to ensure proper procedures are being followed. Additionally, the PC
will need to ensure all FEDLOG sheets are filled out correctly when mechanics submit parts
request with work orders. They must “kick back” any FEDLOG sheet that is not filled out
correctly. The PC must inform the shop supervisor if mechanics systemically fail to fill out the
FED LOG sheet correctly. At the time of this practicum, parts ordered through the misdiagnoses
of malfunctions were not an issue for the shop, but I will remain watchful of this as a potential
problem area that may need further attention as the year progresses.
TOTAL QUALITY MANAGEMENT IN MAINTENANCE OPERATIONS 25
BACKGROUND AND SIGNIFICANCE (Tool Storage)
The second topic of this practicum focuses on special tool storage and some of the
requirements surrounding the storage and inventory. AR 710-2 states tool rooms will be
inventoried semi-annually. Before defining the problems regarding tool storage and inventory, I
will elaborate upon what these tools encompass. Special tools are tools that are required to
perform specific maintenance tasks. Special tools are not part of the individual’s personal tool
box inventory and are stored in a secure room or cage. Some of these tools can be basic hand
tools like a sledge hammer or sensitive hand tools like a micrometer.
Physical security regulations require any hand tool that can be used to breach an entry
must be secured. For example, a crow bar, a sledge hammer or a cutting torch would be tools
requiring secure storage. FMS # 3 has approximately 1,500 tools and components that are
stored within the tool room. Since FMS # 3 does not have a funded Tool and Parts attendant, the
duties of maintaining and inventorying the room are a collateral duty performed by an appointed
Tool Room Custodian and Alternate Tool Room Custodian.
PROCEDURES
Define – There are two problems with the tool storage at FMS # 3. The location of the
tool room is the most significant problem and segues off of the repair parts storage issues
addressed earlier within this practicum. The tool room is located in a back room next to the shop
office and is not near the mechanics work bays. Furthermore, the tools are stored within large
cabinets that make it difficult to identify and locate tools. Moreover, the tools are not labeled
and require the mechanic to remember which drawer they retrieved the tool from in order to
return it to that cabinet drawer. If the mechanic places the tool in the incorrect location, the next
TOTAL QUALITY MANAGEMENT IN MAINTENANCE OPERATIONS 26
mechanic will spend extra time trying to locate the tool because it was incorrectly stored.
Mechanics are spending too much time walking to and from the tool room, and searching for
tools. Additionally, the second order effect of having the tools stored within the cabinets and not
labeled properly creates an inefficient environment. This inefficiency manifests itself in more
time being spent on the semi-annual inventory performed by the Tool Room Custodian.
Measure – In order to develop an action plan regarding the tool room relocation, metrics
needed to be established. The first action that was measured was the amount of time it takes the
Tool Room Custodian to complete an inventory in the old tool room. This inventory took four
days to complete. Additionally, two more metrics were required to establish the amount of travel
time was expended to walk to the tool room and also the amount of time it took mechanics to
locate a tool.
At the time of this practicum, FMS # 3 had five direct labor mechanics working on the
bay floor. Bays 1 through 3 have one mechanic each, and Bay 4 has two mechanics. Three
separate measurements were taken from each bay to determine an average walking time to the
tool room. In order to acquire an accurate portrayal of the amount of trips each mechanic
performs each day to obtain an event per day metric, I had each mechanic track the amount of
times they signed out a tool from the tool room. Each mechanic was given a log to track this
info during from 30 Jan 12 to 2 Mar 12. This gave me a snap shot of four work weeks at the
shop. At the conclusion of the month, I added up the total number of trips to the tool room by
each mechanic and divided by that number by 20. At took the sum of each mechanic’s average
and divided that number by five to get a mean average number of trips for the entire facility.
Table 8 below illustrates the data that was collected during this period.

TOTAL QUALITY MANAGEMENT IN MAINTENANCE OPERATIONS 27
The last item measured was the amount time necessary for a mechanic to locate a specific
tool within the tool room. I took three measurements with three different mechanics who were
instructed to locate the same tool in the storage cabinet. Table 8 demonstrates this time as well.
RESULTS
Analyze – After reviewing the data collected of the tool room location, it is clear that the
location and method of storage is fueling an inefficient environment for the shop’s mechanics as
well as limiting their ability to perform maintenance operations. Mechanics should not be
wasting time walking extra distances and searching for tools to repair or service equipment on
work order to the shop. The tool room storage location issue runs parallel with the repair parts
storage issue. In order to improve and relocate the repair parts storage, the tool room storage
problems needed to be addressed using the DMAIC system.
I assessed FMS # 3’s the amount of tools on hand, the estimated space required and
shelving units to store to complete an improvement action plan. I estimated that an area of
approximately 10’ X 12’ is required to accommodate the shop tools, and eight shelving units to
properly store them. The shelving units will replace the cabinets, and will make the tools visible
for the mechanic. The improvement action plan will be discussed in the next section.
RECOMMENDATION
Improve – The first item that must be addressed is the new location of the tool room.
This improvement recommendation will also accommodate the work order repair parts storage
Table 8
TOTAL QUALITY MANAGEMENT IN MAINTENANCE OPERATIONS 28
problem, as well as place the tools in a more convenient location for the mechanics. After
relocating a shop safety board on the outside of the boiler room wall, I determined there was
adequate space to install a tool cage next to the boiler room. The floor space selected was a dead
space and was not being used in a manner to benefit the shop’s mission. Figure 8 below is gives
a graphic depiction of the tool room location before and after the improvement plan.
The lean technique of point of use storage is clearly in use by relocating the tool room to a tool
cage next to the mechanic’s work area. This move will reduce travel times immensely. Prior to
the move, mechanics were spending approximately 4.93 minutes per day walking and 8.67
minutes per day searching for tools. The sum of these two metrics is 13.6 minutes per day.
After we relocated the tool room, I used the same measurement techniques discussed in the
W/O
P
arts
Shop/Bench Stock Parts Conex
Tool Cage
ProductionControl Office
Work BaysBobcat Storage
Signal Equip
POLHAZM
AT
Mec
h
Eq
uip
FMS # 3 Tool Storage Layout Before & After
Task – Acquire Special Tool
Bay 4 Bay 3 Bay 2 Bay 1
Figure 8
Before
TOTAL QUALITY MANAGEMENT IN MAINTENANCE OPERATIONS 29
analyze portion of this topic which resulted in the following times. Mechanic walking time was
reduced to 2.4 minutes per day, search time was reduced to 2.87 minutes per day, and the total
time spent for both tasks was reduced to 5.27 minutes per day for a delta of 8.33 minutes per day
saved. Table # 9 below gives a better illustration of this data and the metrics utilized.
The total amount of time saved per month with this improvement will be 2 ¾ hours of
mechanic production. The initial cost of the tool cage and shelf units was $3,179. Because this
move was necessary to facilitate the repair parts storage relocation, I factored in the Production
controller’s time saved per month of 3 hours to determine the amount of time required to break
even. Based upon these two times, it will take approximately 20 months to recoup the initial
investment for the tool cage and shelf units.
5.27 MinutesPer day
Table 9

TOTAL QUALITY MANAGEMENT IN MAINTENANCE OPERATIONS 30
I derived at this by multiplying the average mechanics hourly wage and the PC’s hourly
wage by the monthly time saved for the improvements. I then divided the initial cost by this
amount to arrive number of months identified above. Lastly, I had the Tool Room Custodian
perform another inventory to determine how many days it would take to complete. The new
inventory took only two days to complete, which is half of the time required prior to the move.
Control – There is very little to control regarding this shop improvement, but one are that
was improved upon deals with tool marking. Prior to the move, tools were not labeled. During
the relocation of the tools, each tool was labeled with a shelf location. This improvement will
help control the misplacement of tools when they are returned after use. One other area that will
be addressed in the control phase is a semi-annual assessment of tools on hand to determine if
they are still required. Just like repair parts, tools can become antiquated due to equipment
losses by our supported units. If tools of this nature are identified during the semi-annual
inventory, they must be turned in to using proper supply channels to remove them from the shop
inventory.
BACKGROUND AND SIGNIFICANCE (Final Inspection)
The process of inspection is an integral part of the maintenance process. This step is also
referred to as quality assurance (QA) and quality control (QC) in the Army. Maintenance
Technicians are tasked to monitor the quality assurance program (DA PAM 750-3 2006, 16).
The quality assurance program must be continually evaluated for effectiveness and also to
determine if there are any systemic trends that may be affecting maintenance operations. A poor
quality assurance program may result in a work orders having to be reworked, which translates
into more labor costs. Poor quality assurance can also lengthen repair cycle times, which can
affect customer relations if we are unable to fulfill the customer’s requirements.
TOTAL QUALITY MANAGEMENT IN MAINTENANCE OPERATIONS 31
The current quality assurance program at FMS # 3 utilizes two senior Wage Grade (WG)
– 10 mechanics to perform final inspection on all work orders completed at the shop. One
inspector is a primary and the other is considered the alternate inspector to maintain coverage
within the facility. Once a work order has been completed by a mechanic, it is routed through
the PC before going to final inspection. The PC will change the status of the work order to
“awaiting final inspection”, and place it in the appropriate work order bin. Priority of the work
order will dictate how quickly the work order must be inspected. Once the Shop inspector
conducts his final inspection, he will bring the work order back to the PC and state whether the
vehicle is “ready for pickup” or must come back into the shop. The term “come back” is
synonymous with a final inspection failure, and is considered a derogatory term throughout the
maintenance community.
PROCEDURES
Define – To identify the problem within our final inspection and quality assurance
program, I will take a straight forward approach. Any final inspection failure is one too many,
and therefore when a work order fails final inspection there is an issue with our process. The Six
Sigma goal is to reduce defects to near zero in the work place, which equate to approximately a
99.99% accuracy rate. Using this metric as a goal, I can state that our facility will need improve
upon our quality assurance program.
Measure – I created a spreadsheet incorporating bar graphs, and a pie chart to track the
frequency of failure, mechanic responsible, and what type of malfunction caused the final
inspection failure. The Production Controller in concert with the Wage Grade 10 inspector was
tasked to track this data and fill in the appropriate information at the conclusion of the work
order. Mechanics production is also tracked as part of the data collection in order to determine

TOTAL QUALITY MANAGEMENT IN MAINTENANCE OPERATIONS 32
an accuracy rate. The total number of work orders performed correctly by each mechanic was
divided by total number of work order performed to arrive at this percentage. Table # 10
illustrates a by mechanic breakdown of work orders performed, final inspection failures, and
their accuracy rate.
5
15
25
35
45
55
8
139 9
13
52
0 1 1 1 25
100% 92% 89% 89% 85% 90%
Final Insp. Failure by Mechanic
Table # 10
I also measured the monthly accuracy rate to determine shops trends. Monthly numbers
are the sum of all work orders completed and final inspection failures. Table 11 demonstrates
monthly numbers regarding final inspection as well as accuracy percentage.
FEB MAR APR MAYMonthly Completed N/A 24 28 0
Monthly Failure N/A 2 3 0Shop Accuracy Rate N/A 92% 89% #DIV/0!
Table 12 below reflects the monthly accuracy trend for the facility.
Table # 11
MAR APR MAY
92% 89%
0%
Accuracy Rate
Shop Accuracy Rate

TOTAL QUALITY MANAGEMENT IN MAINTENANCE OPERATIONS 33
Additionally data was collected on any work order that failed final inspection to capture
what item was missed or occurred to cause the “come back”. This information and data will be
discussed in the analyze portion of this practicum.
RESULTS
Analyze – There are two areas that must be addressed in this section by answering the
questions of what is causing the mechanics to improperly complete a work order and why are
they making mistakes? Through the use of a cause and effect diagram, I was able to identify
some of the reasons work orders may fail final inspections. Figure # 9 below represents this
methodology.
Final Inspection Failure
SOP Employees
Process
Supported Equipment
Training
Input from employees
RushedOverconfident
Bad habits
Unclear?
No check sheet or checklist Define
roles
Inadequate Amount
Turnover of equipment
Mechanics lack experience on equipment
Out of date
Failure to follow
Different levels
Supported Units (Customers)
Short Suspense
Poor Communication
Lack of Teamwork
Table # 12
Figure # 9
Check sheet implemented on 12 Apr 12
TOTAL QUALITY MANAGEMENT IN MAINTENANCE OPERATIONS 34
As discussed earlier in this section, I have captured data on why the work orders failed
final inspection. I have inputted this information into a cascading Pareto chart. The Pareto chart
is a tool that was promoted by Dr. Joseph Juran, and is named after Italian economist Vilfredo
Pareto (Goetsch and Davis 2010, 352). This chart reveals that a vital few defects created most
of the problems surrounding final inspection failures. Chart # 3 below is the Pareto analysis for
FMS # 3.
0
0.5
1
1.5
2
2.5
3
3.5
0%
20%
40%
60%
80%
100%
Inco
mpl
ete
Oil
Lea
ks
Electrical Stee
ring
Air Leaks Dri
ve T
rain
Bra
kes
Type of Malfuncion
Vital Few Useful Many Cumulative% Cut Off %Causes
Def
ects
Cum
ulat
ive
%
[42]
Pareto Analysis
FMS # 3TQM in Maintenance Operations
The first 3 Causes cover 100% of the Total Defects
Cumulative Percentage Cutoff: 80%
# Causes Defects Cumulative%1 Incomplete 3 60.0%2 Oil Leaks 1 80.0%3 Electrical 1 100.0%4 Steering 100.0%5 Air Leaks 100.0%6 Drive Train 100.0%7 Brakes 100.0%

TOTAL QUALITY MANAGEMENT IN MAINTENANCE OPERATIONS 35
Chart # 3
As you can see, incomplete work orders accounted for 60% of the final inspection
failures for the shop. The problem here occurred because two mechanics did not complete an
onsite work order properly, and had to return to the supported unit to complete the mission. This
type of error is very costly, because of the man-hours expended traveling back to the onsite
location to complete. Additionally, the third incomplete was the product of a mechanic not
installing all required components on a gunner’s platform. This was captured during the final
inspection.
RECOMMENDATION
Improve – As I review both the cause and effect diagram and the Pareto chart, I felt that
much of our issues revolve around process and less on the individual. Dr. Juran’s 85/15 rule
characterizes this concept, where he states that 85% of the problem can be corrected by changing
systems and only 15% are under the workers control (Goetsch and Davis 2010, 413). I discussed
this principle earlier in this practicum in the parts management section, and feel that it is
applicable here as well. One of the process improvements that I am going to implement is the
use of a work order check sheet. This check sheet will list numerous items relating to work order
completion, and will serve as a reminder for both the mechanic and the PC to ensure all steps
have been completed during the work order process. One of the key steps included on this check
sheet is the use of the lean tool/technique of self-inspection.
The self-inspection procedure will be codified in the FMS # 3 internal SOP which is in
keeping with the TQM concept of catching errors before the end of the cycle or process. The
implementation of a mandatory self-inspection by each mechanic performing a repair or service
should help eliminate errors found by the senior mechanic performing the final inspection. For

TOTAL QUALITY MANAGEMENT IN MAINTENANCE OPERATIONS 36
example the electrical problem captured during the measurement phase was due to a mechanic
not inspecting the working lights on a forklift after replacing the lights. A self-inspection would
have caught this malfunction before the final inspection. Figure # 10 below is an example of the
check sheet that will be incorporated into the internal SOP.
Figure # 10
Two of the incomplete final inspection failures can be attributed to management and the
production controller not clearly communicating the intent of the onsite mission. This can be
improved upon by effective communication, where the message is received and understood by

TOTAL QUALITY MANAGEMENT IN MAINTENANCE OPERATIONS 37
the receiver in the manner the sender intended it to be. Another key to onsite repair accuracy is
to ensure work order tasks are clearly entered into the Support SAMS-E. The work order tasks
state what must be completed on the work order, and if they are ambiguous the mechanics may
have trouble fully completing the work order. Additionally, I must continue to create an
environment that encourages quality and the desire to deliver outstanding maintenance support.
Mechanics who fail to uphold these values must be counseled and trained to ensure they meet the
highest standards set forth within. This will reinforce a work climate that embraces quality.
Control – Controlling the final inspection failure process will be a perpetual system
which will encompass data collection used to determine trends as well as what caused the failure.
Trend analysis will need to take place to determine if changes in the process need to take place or
specific maintenance training tasks are required to improve mechanic’s skills. The internal SOP
also requires an annual review to ensure the information within the SOP is relevant to the
maintenance shop’s mission. This is a minimum requirement, but in order to embrace the TQM
philosophy our maintenance shop must continually assess our processes and procedures to
determine if they are efficient and effective.
In order to achieve an almost near perfect accuracy rating during final inspections,
everyone employee within the facility must accept the TQM principles. I must create a climate
that focuses on quality and institute new processes and procedures to facilitate this attitude. I
believe Dr. Deming’s fifth point of his fourteen points which states “Improve continuously and
forever the system of production and service. It is the management’s responsibility to constantly
improve processes, product, and services while reducing waste.” (Goetsch and Davis 2010, 16)
sums up this point.

TOTAL QUALITY MANAGEMENT IN MAINTENANCE OPERATIONS 38
References
Army Regulation 710-2. 2008. Inventory Management, Supply Policy Below the National Level
Department of the Army Pamphlet 750-3. 2006. Soldier’s Guide for Field Maintenance Operations
Goetsch, David L. and Stanley B. Davis. 2010. Quality Management for Organizational Excellence. New Jersey: Pearson
Pande, Peter S., Robert P. Neuman and Roland R. Cavanagh. 2002. The Six Sigma Way, An Implementation Guide for Process Improvement Teams. New York: McGraw-Hill
Related Documents