Boston + Waze Leveraging Crowd-Sourced Information to Drive Timely Alerts and Empower Deeper Analysis

Welcome message from author
This document is posted to help you gain knowledge. Please leave a comment to let me know what you think about it! Share it to your friends and learn new things together.
Transcript
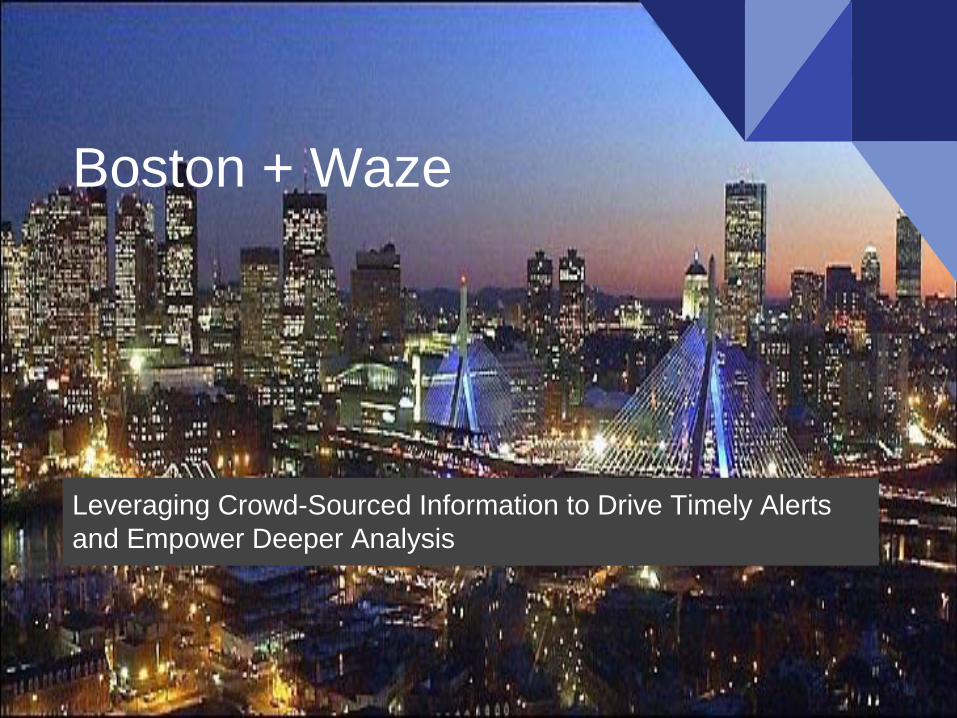
Boston + Waze
Leveraging Crowd-Sourced Information to Drive Timely Alerts and Empower Deeper Analysis
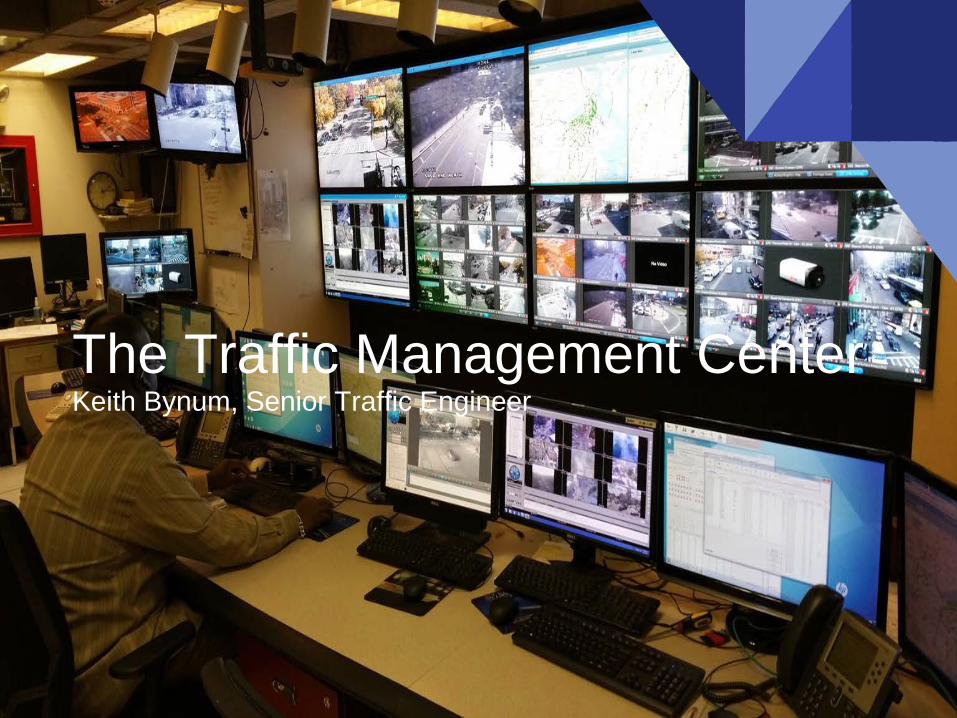
The Traffic Management CenterKeith Bynum, Senior Traffic Engineer
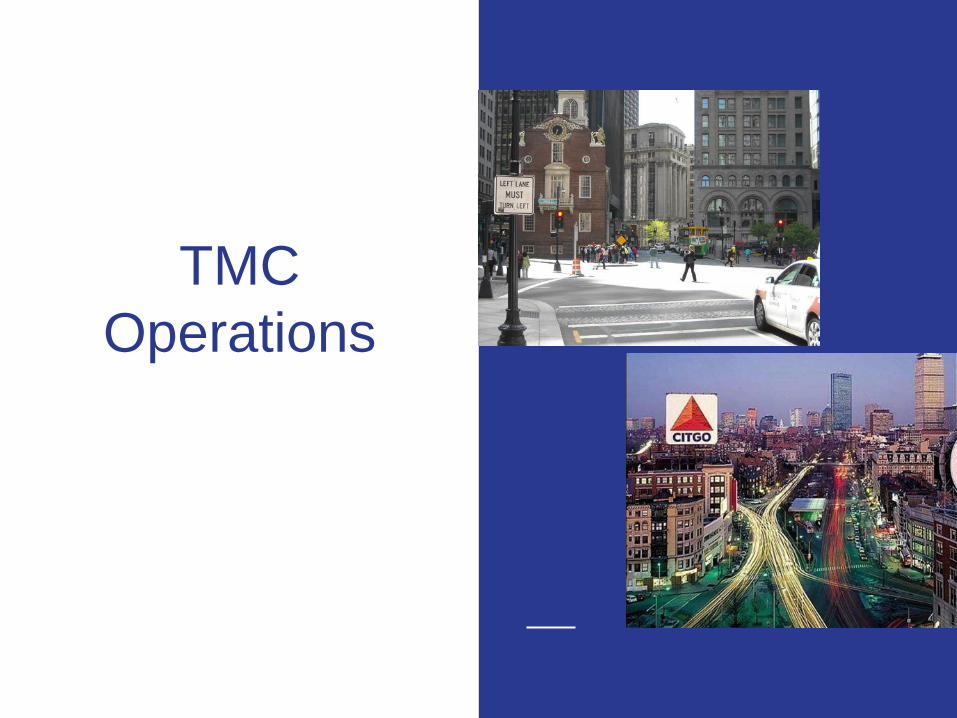
TMC Operations
TMC Operations
Central location for the management of incidents and special events
Identify and direct the repair of malfunctioning equipment,
Detect and coordinate the removal of vehicles obstructing the roadways
Coordinate with other transportation agencies and first responders
TMC Operations
Central location for the management of incidents and special events
Identify and direct the repair of malfunctioning equipment
Detect and coordinate the removal of vehicles obstructing the roadways
Coordinate with other transportation agencies and first responders
TMC Operations
Central location for the management of incidents and special events
Identify and direct the repair of malfunctioning equipment
Detect and coordinate the removal of vehicles obstructing the roadways
Coordinate with other transportation agencies and first responders
TMC Operations
Central location for the management of incidents and special events
Identify and direct the repair of malfunctioning equipment,
Detect and coordinate the removal of vehicles obstructing the roadways
Coordinate with other transportation agencies and first responders
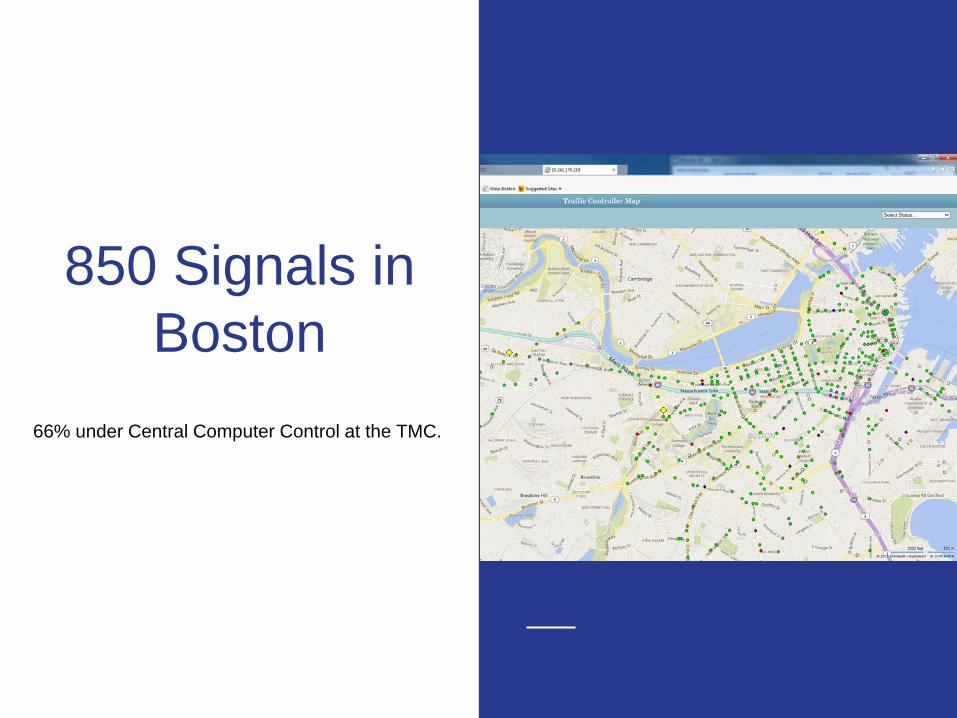
850 Signals in Boston
Computer control over 556 signals
66% under Central Computer Control at the TMC.
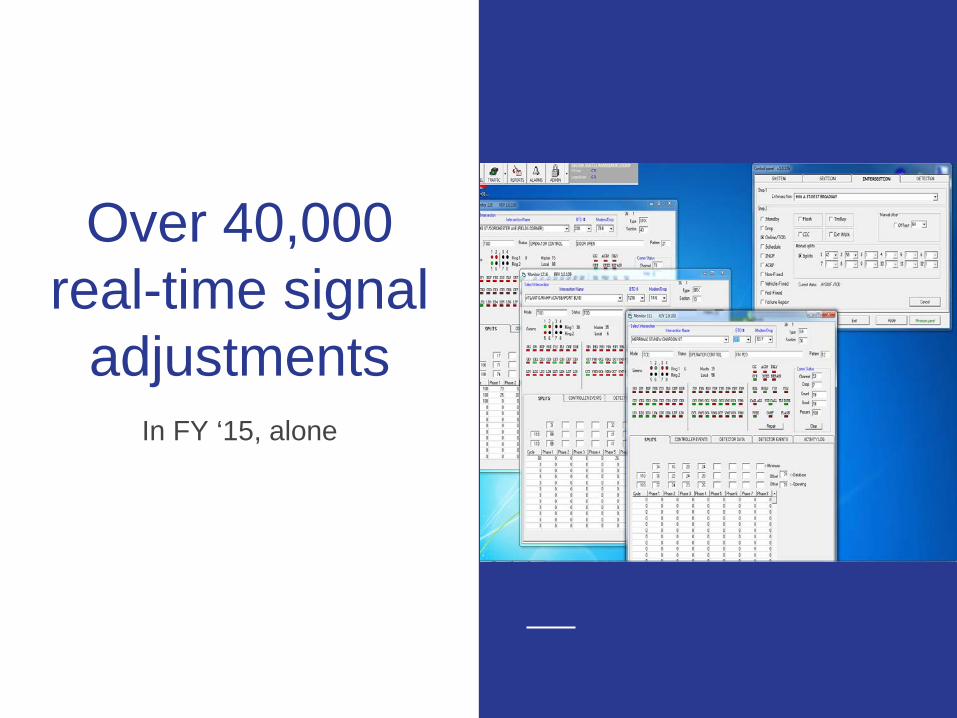
Over 40,000 real-time signal
adjustmentsIn FY ‘15, alone
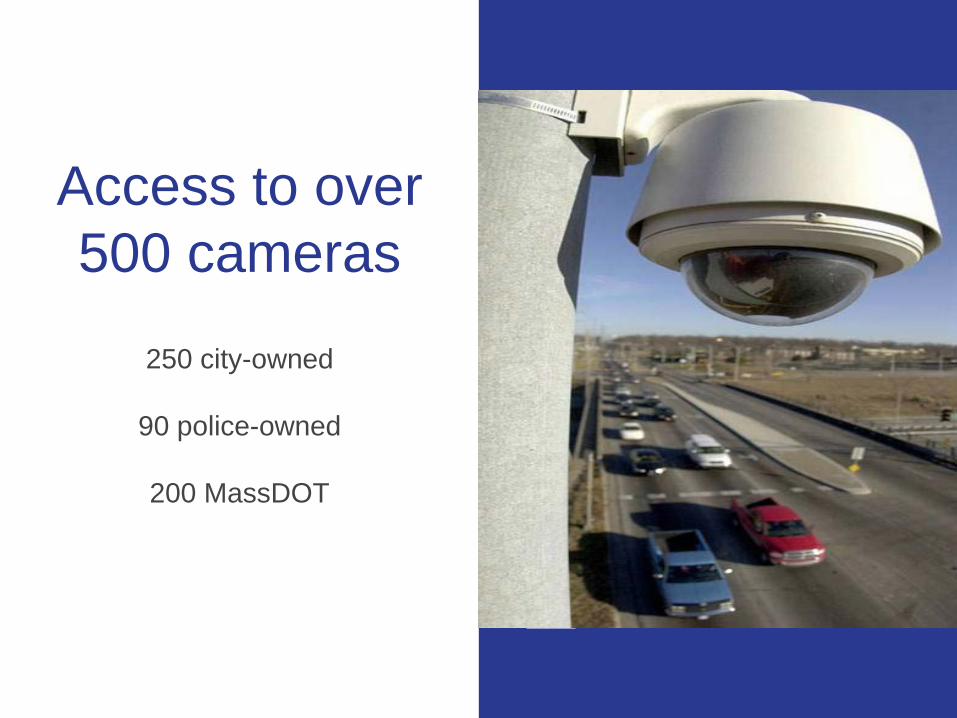
Access to over 500 cameras
250 city-owned
90 police-owned
200 MassDOT
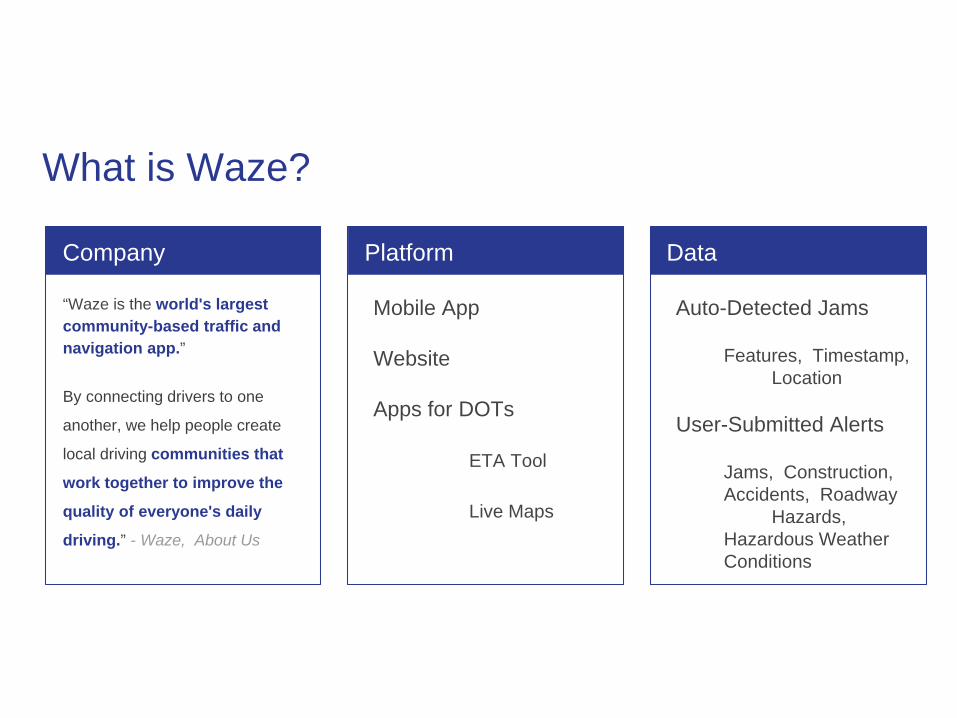
What is Waze?
Company
“Waze is the world's largest community-based traffic and navigation app.”
By connecting drivers to one
another, we help people create
local driving communities that
work together to improve the
quality of everyone's daily
driving.” - Waze, About Us
Platform
Mobile App
Website
Apps for DOTs
ETA Tool
Live Maps
Data
Auto-Detected Jams
Features, Timestamp, Location
User-Submitted Alerts
Jams, Construction, Accidents, Roadway
Hazards, Hazardous Weather Conditions
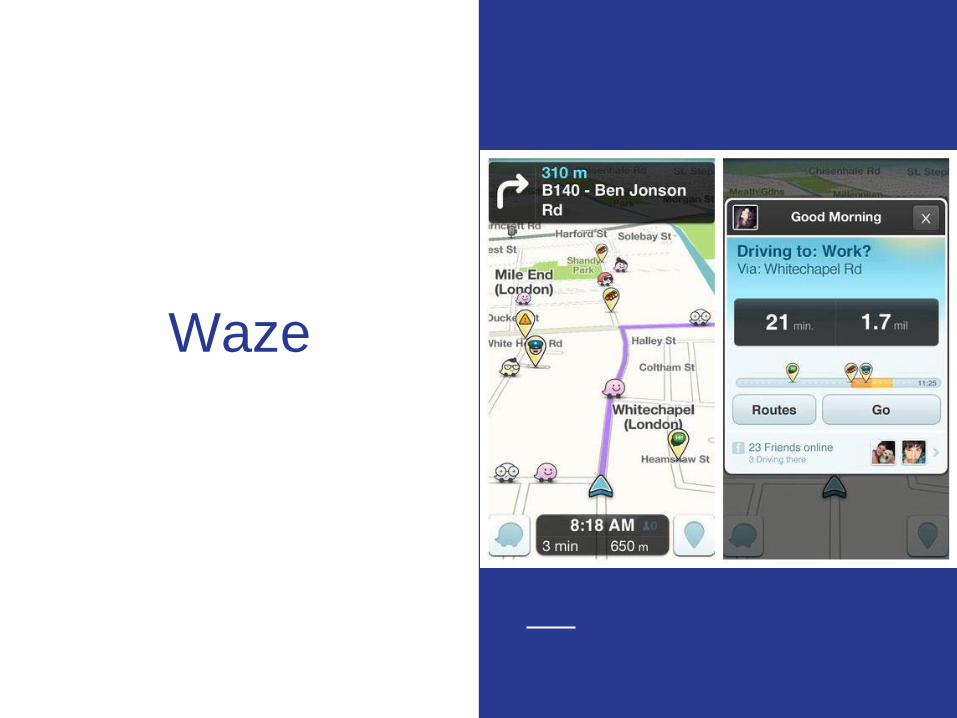
Waze
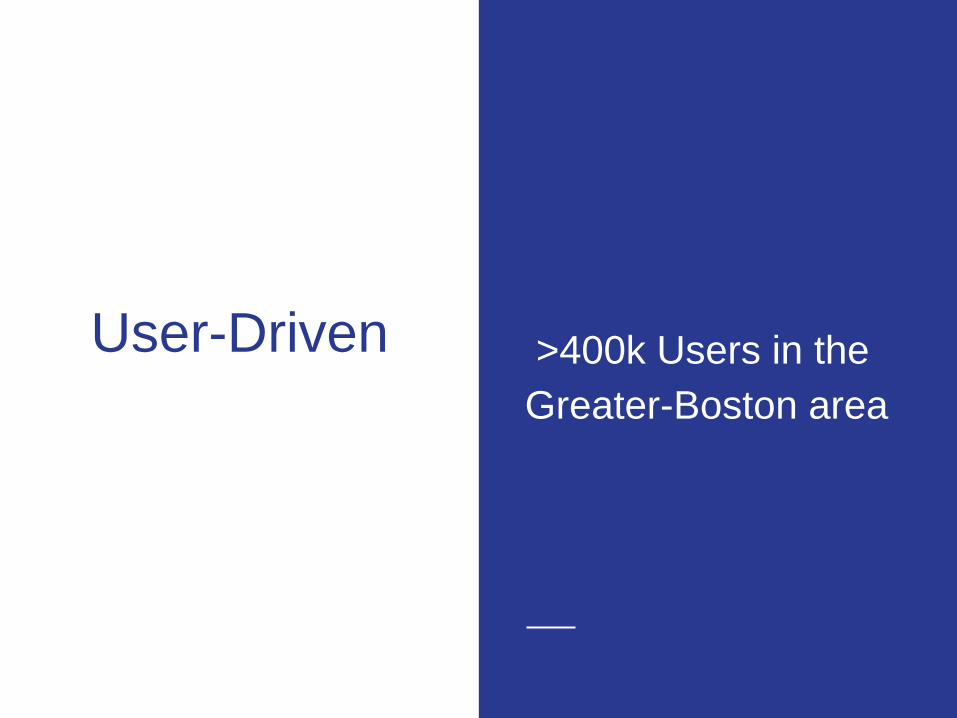
User-Driven >400k Users in the Greater-Boston area
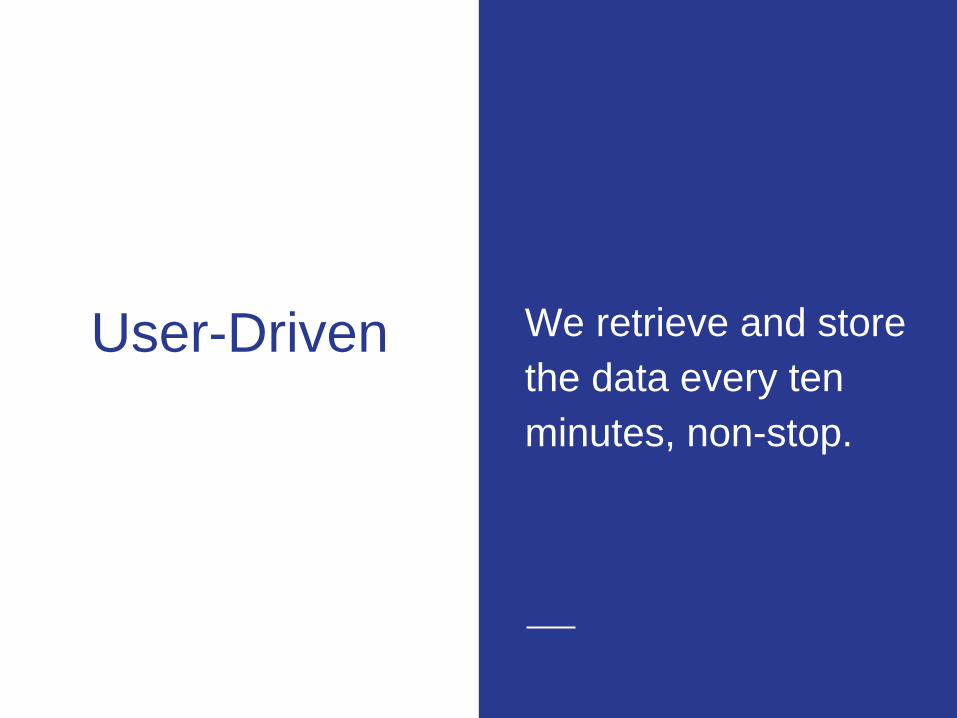
User-Driven We retrieve and store the data every ten minutes, non-stop.
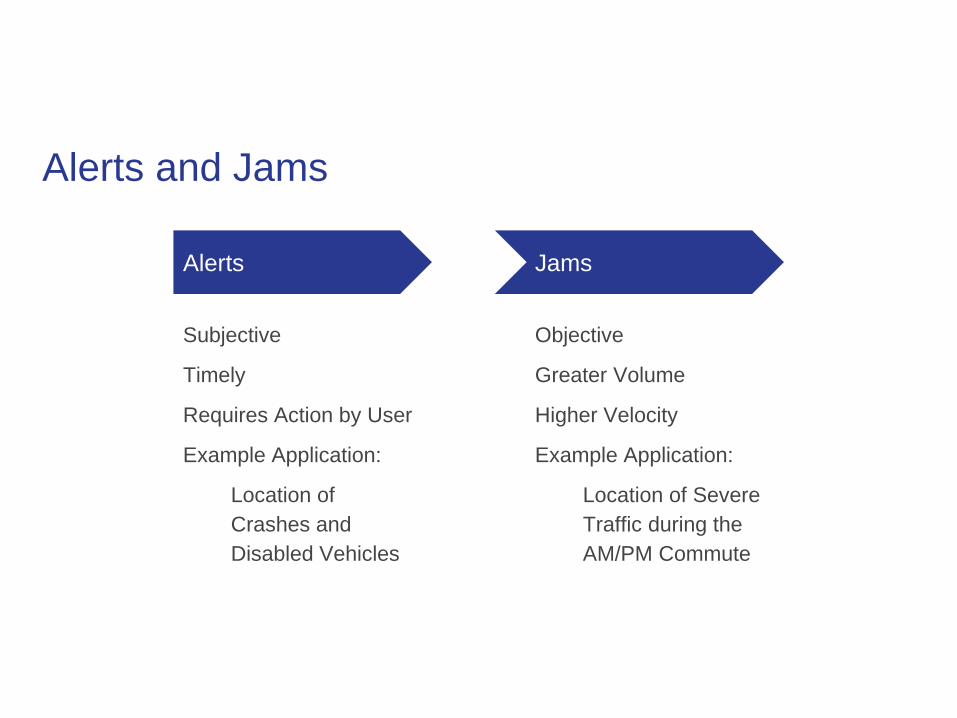
Alerts and Jams
Alerts
Subjective
Timely
Requires Action by User
Example Application:
Location of Crashes and Disabled Vehicles
Jams
Objective
Greater Volume
Higher Velocity
Example Application:
Location of Severe Traffic during the AM/PM Commute

How do we use this data?
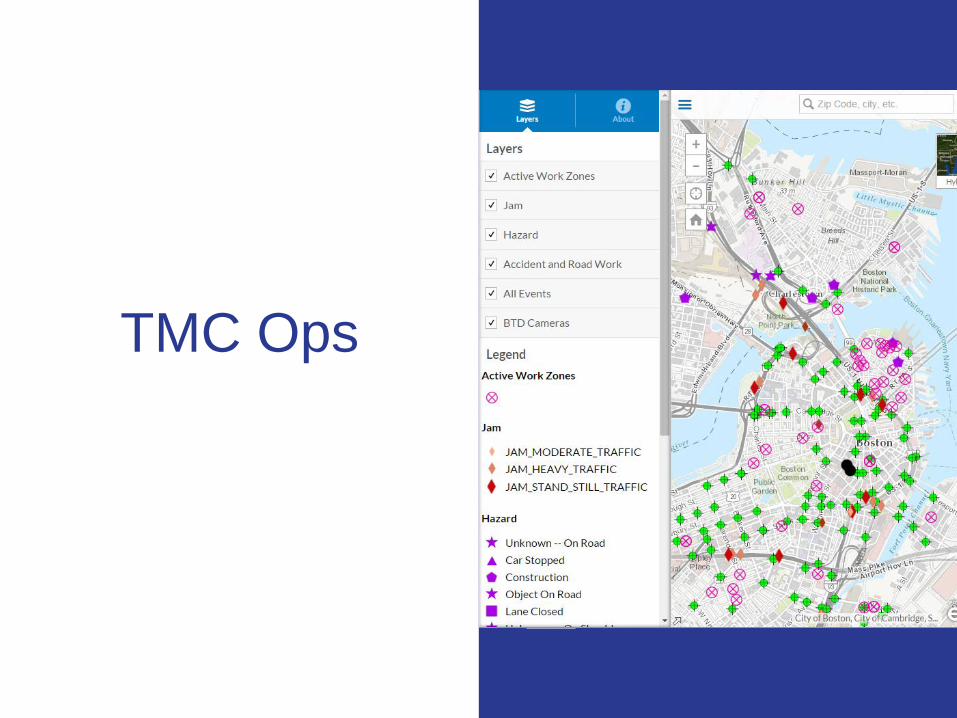
TMC Ops
Live Maps and Alerts for Traffic Management
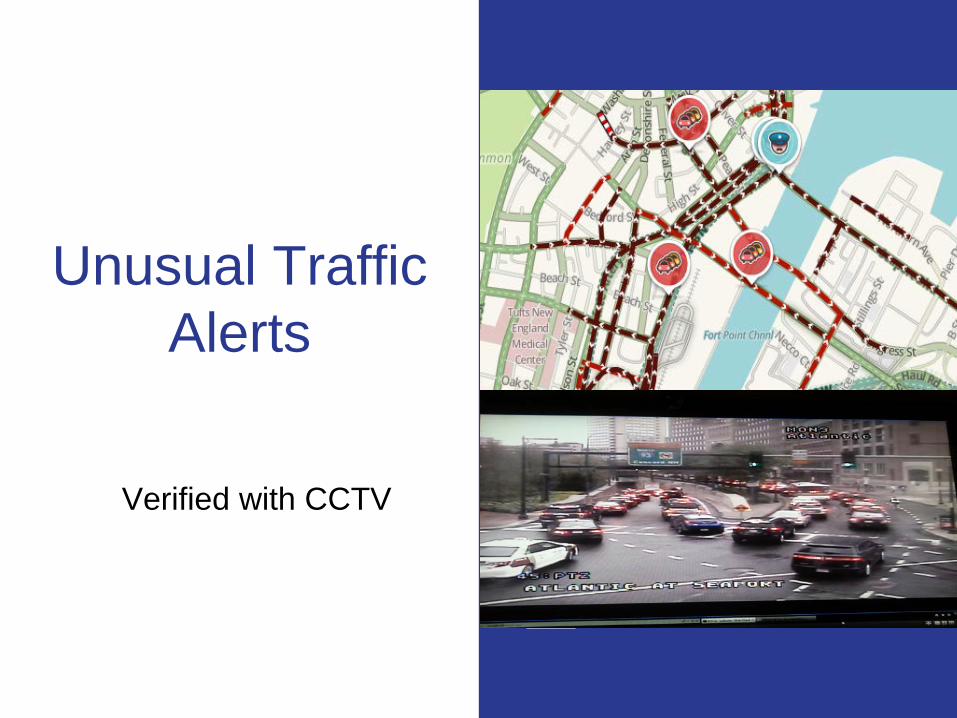
Unusual Traffic Alerts
Verified with CCTV
Studies and Analyses

Traffic Studies
Seaport Longitudinal
Analysis
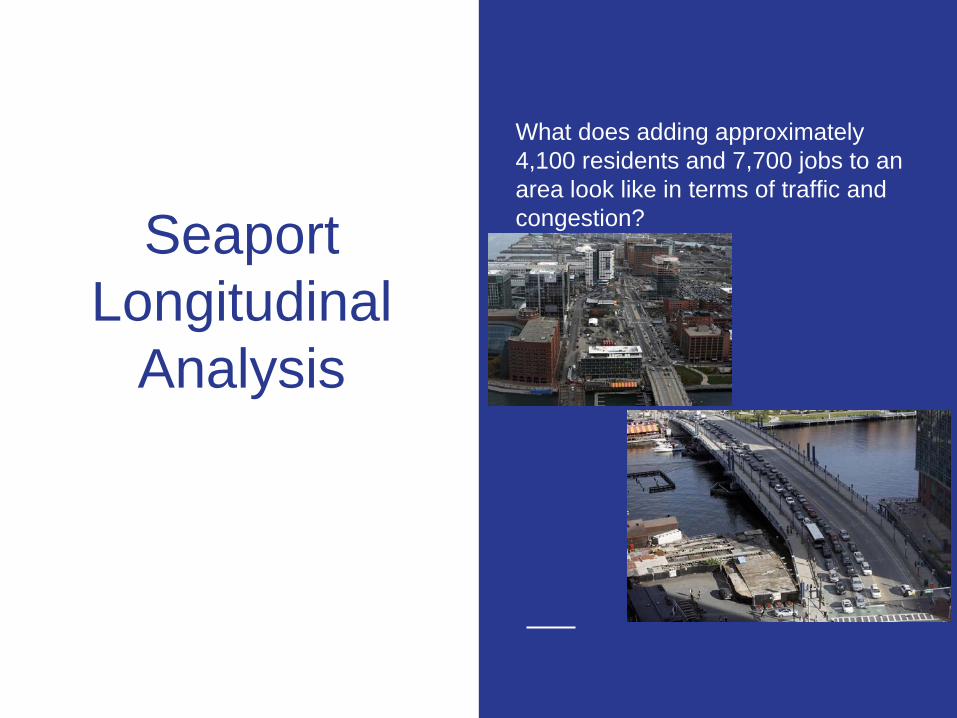
What does adding approximately 4,100 residents and 7,700 jobs to an area look like in terms of traffic and congestion?
Seaport Longitudinal
Analysis
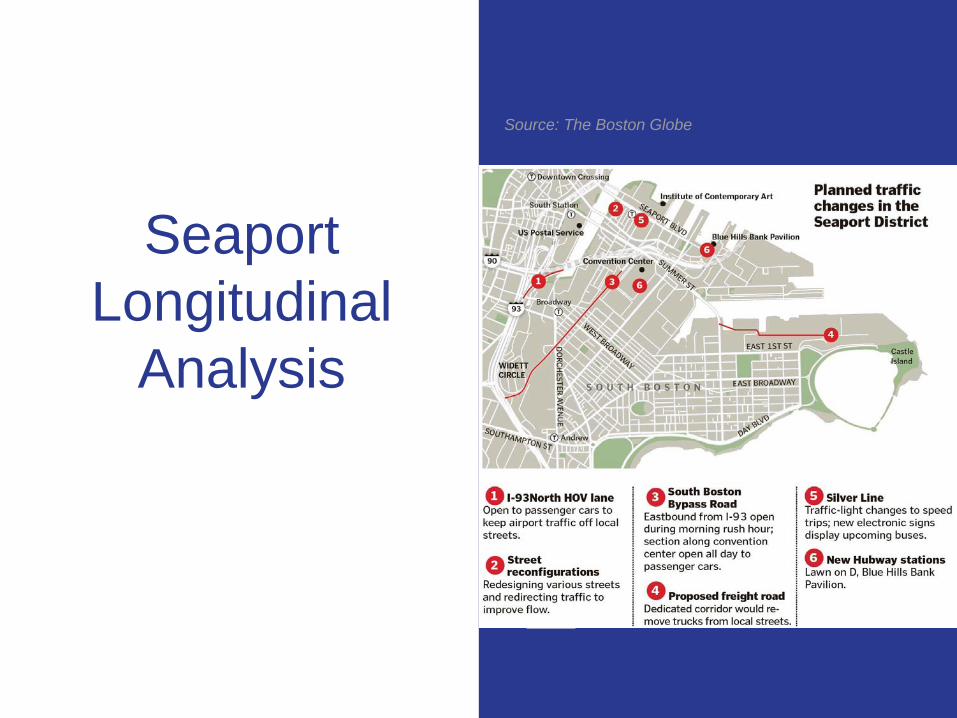
Source: The Boston Globe
Seaport Longitudinal
Analysis
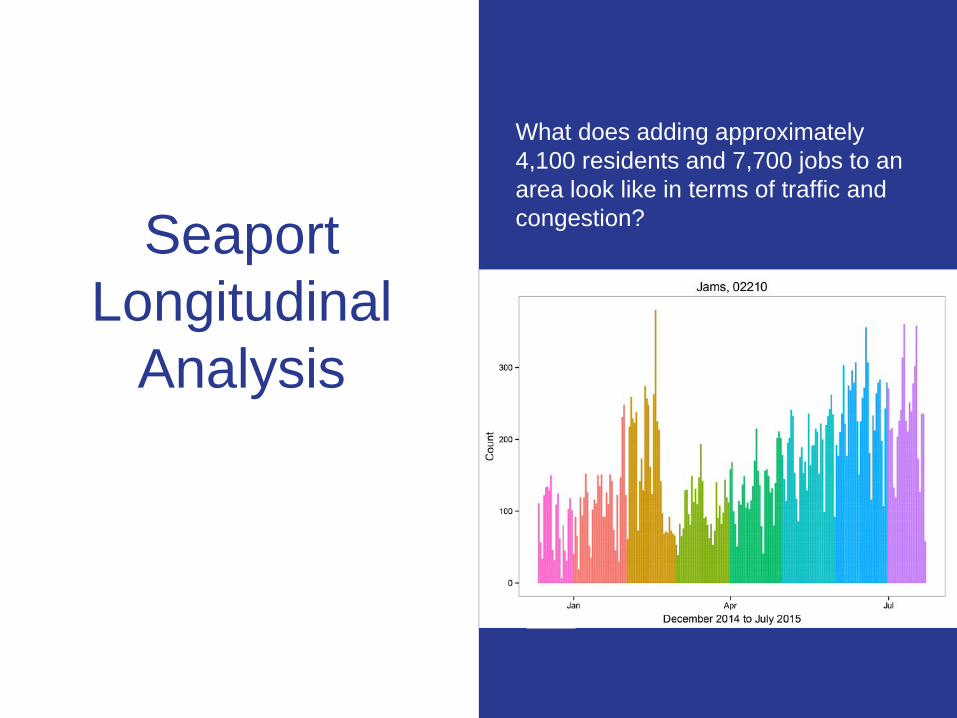
What does adding approximately 4,100 residents and 7,700 jobs to an area look like in terms of traffic and congestion?
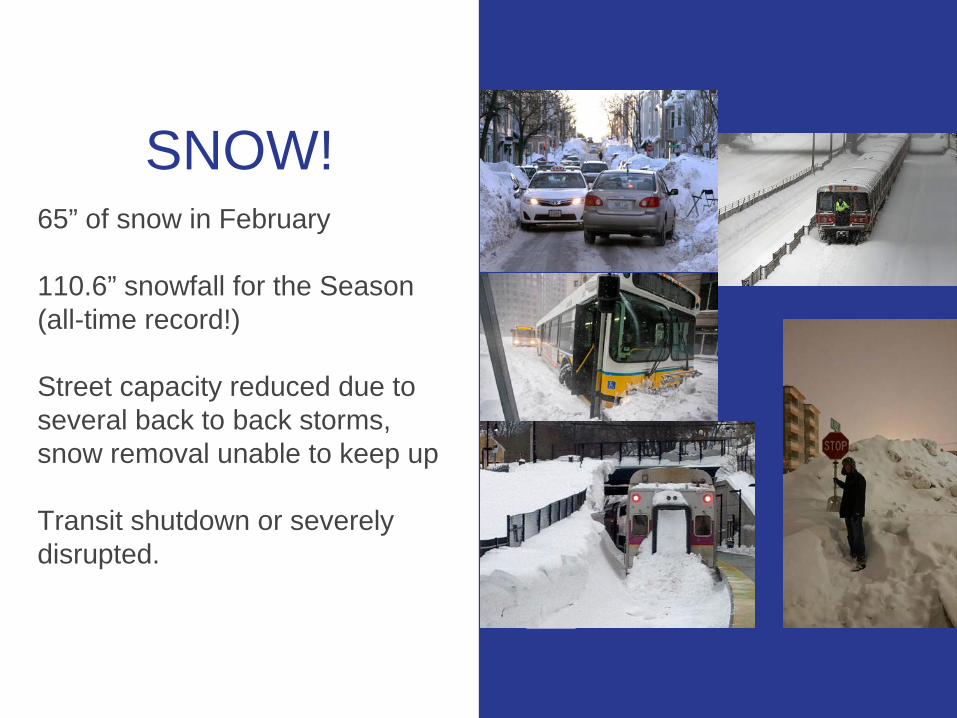
SNOW!65” of snow in February
110.6” snowfall for the Season (all-time record!)
Street capacity reduced due to several back to back storms, snow removal unable to keep up
Transit shutdown or severely disrupted.
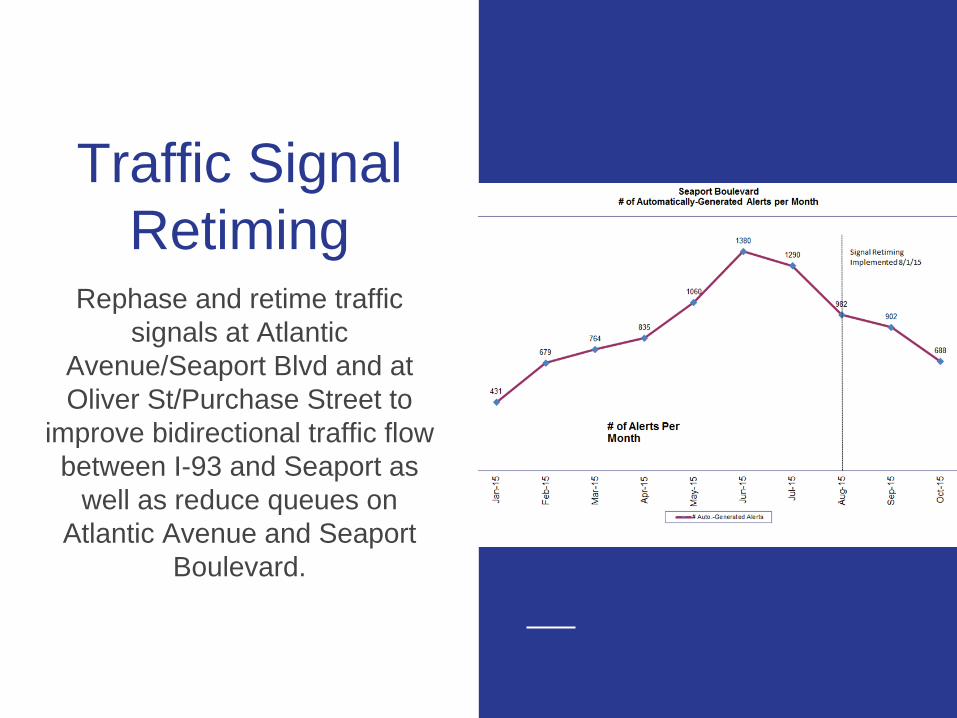
Traffic Signal Retiming
Rephase and retime traffic signals at Atlantic
Avenue/Seaport Blvd and at Oliver St/Purchase Street to
improve bidirectional traffic flow between I-93 and Seaport as
well as reduce queues on Atlantic Avenue and Seaport
Boulevard.

Experiment Evaluation
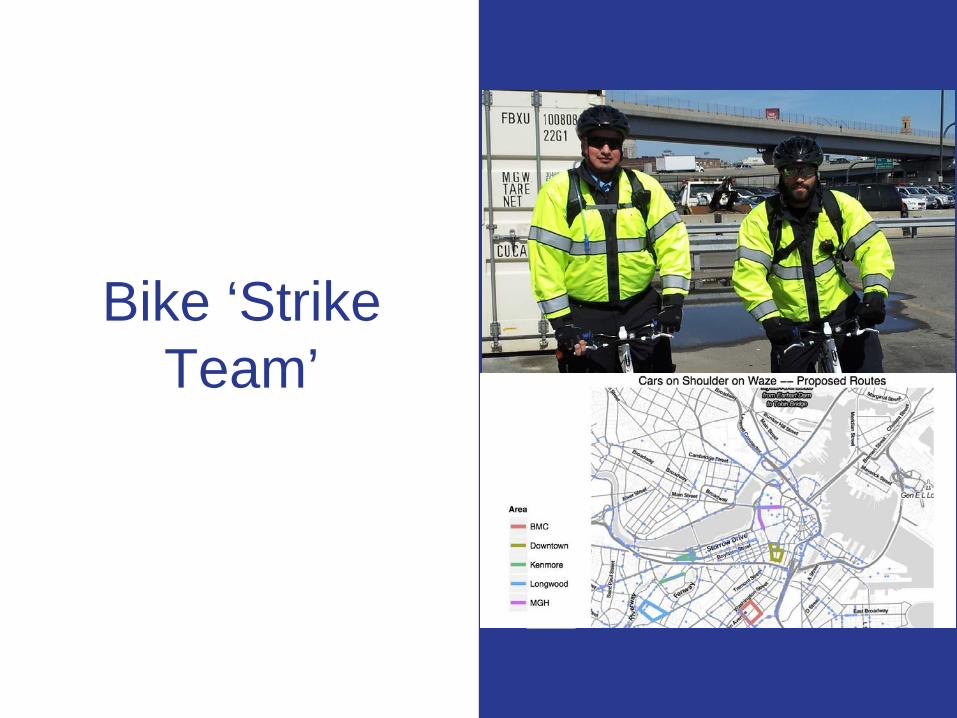
Bike ‘Strike Team’
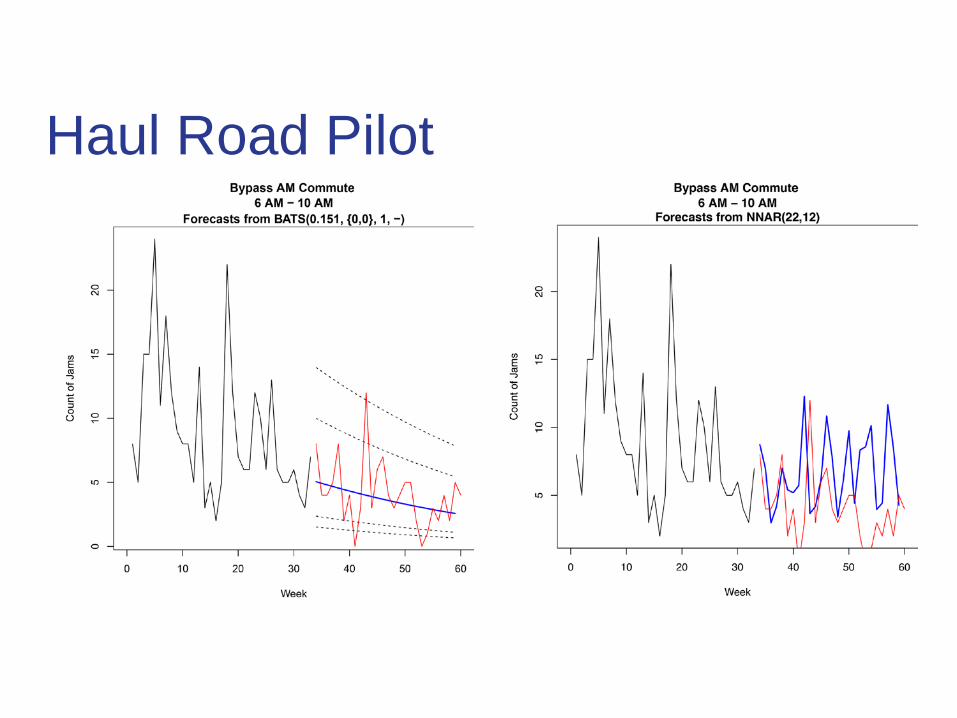
Haul Road Pilot
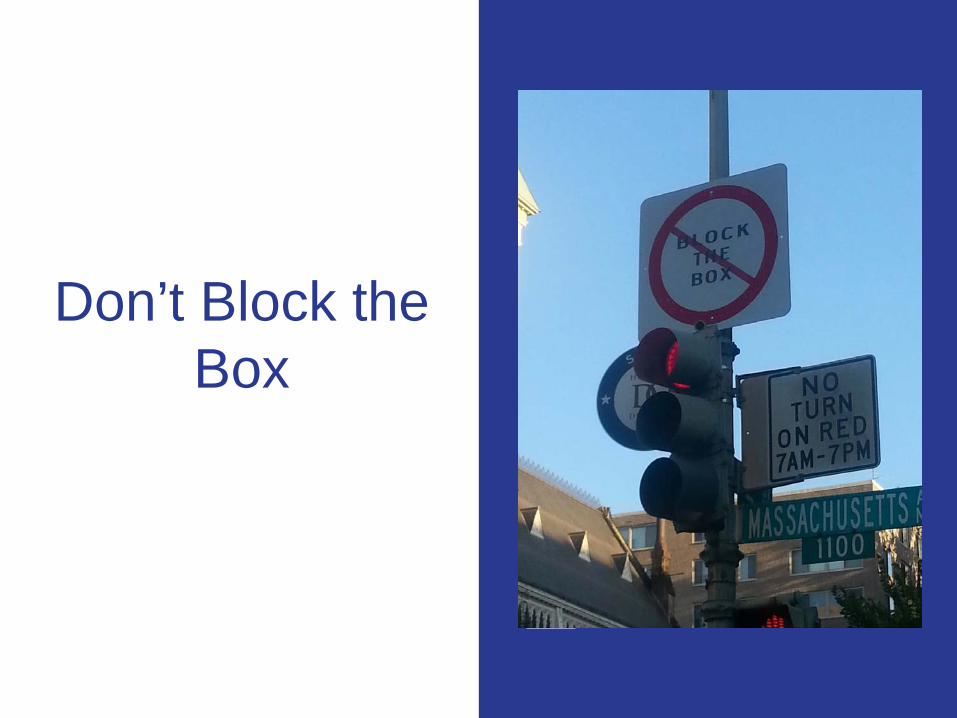
Don’t Block the Box
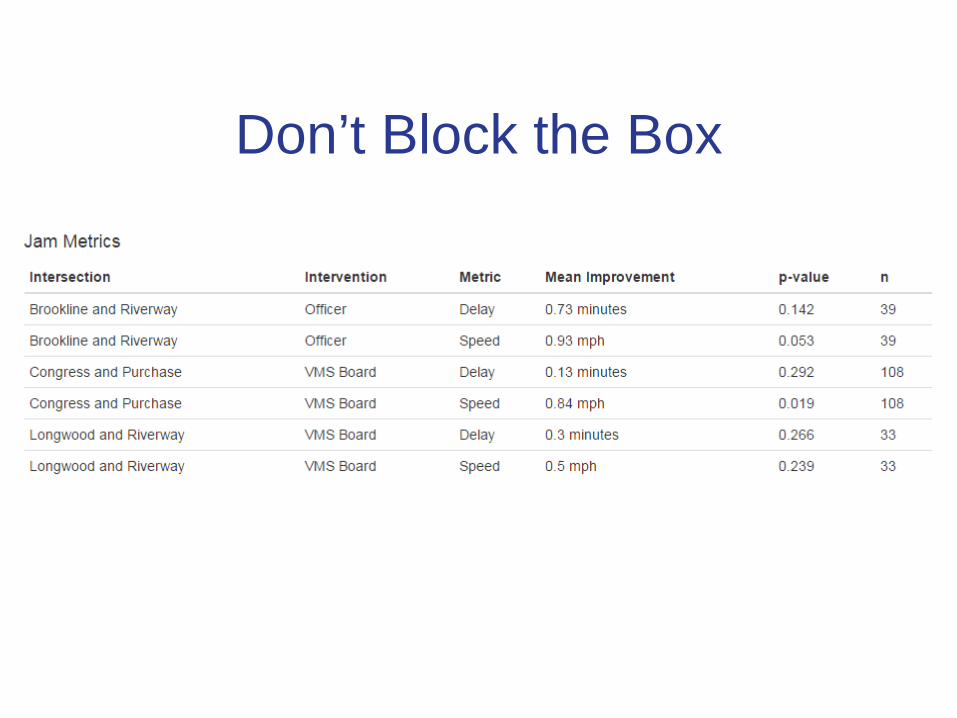
Don’t Block the Box
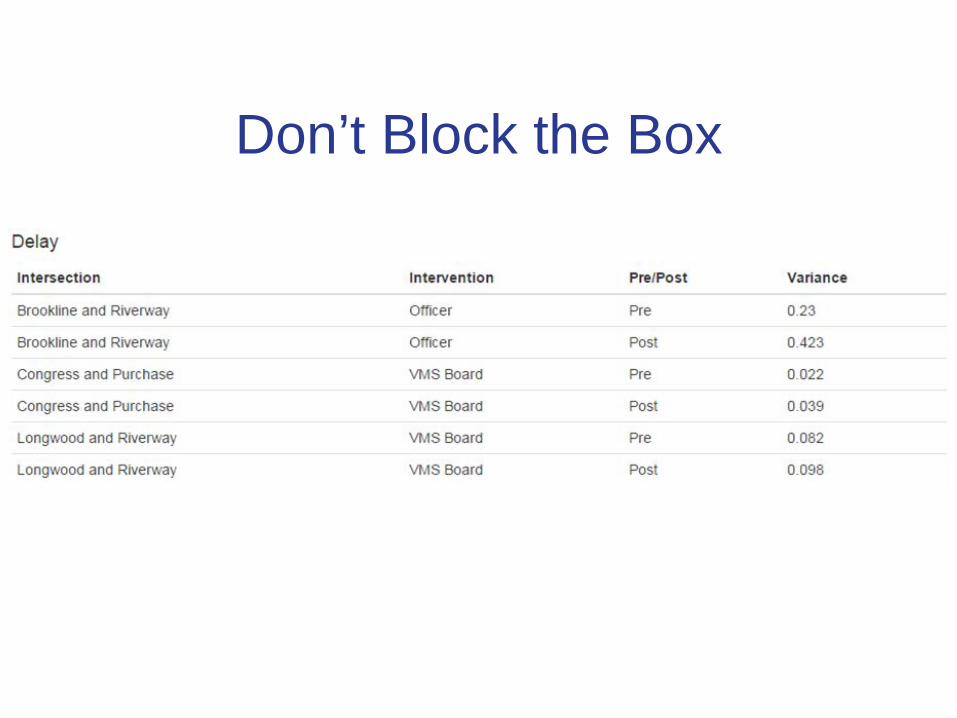
Don’t Block the Box
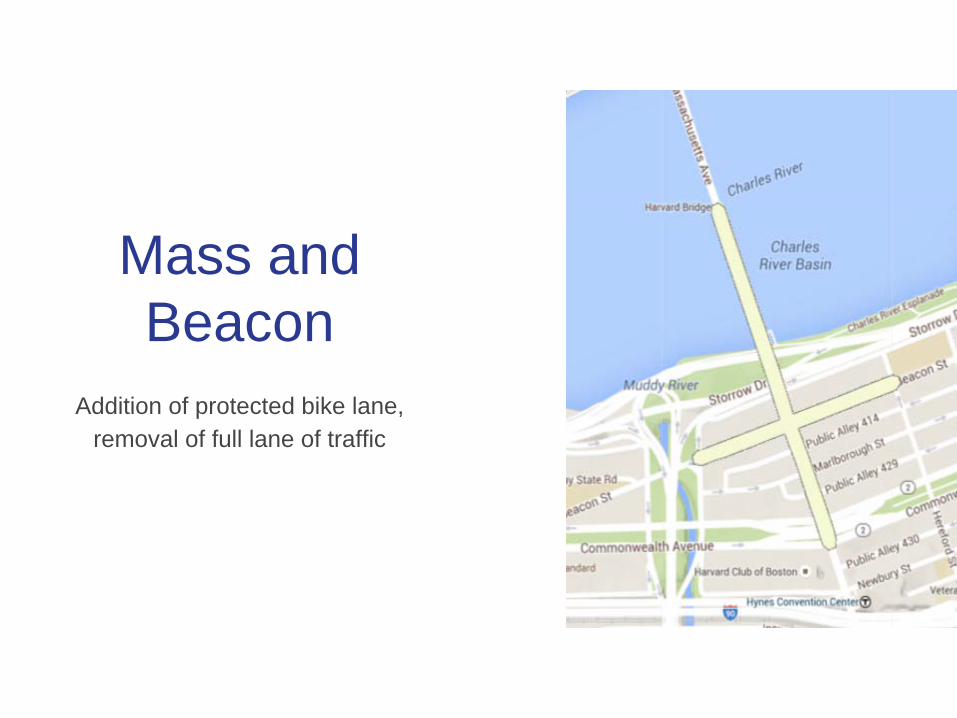
Mass and Beacon
Addition of protected bike lane, removal of full lane of traffic
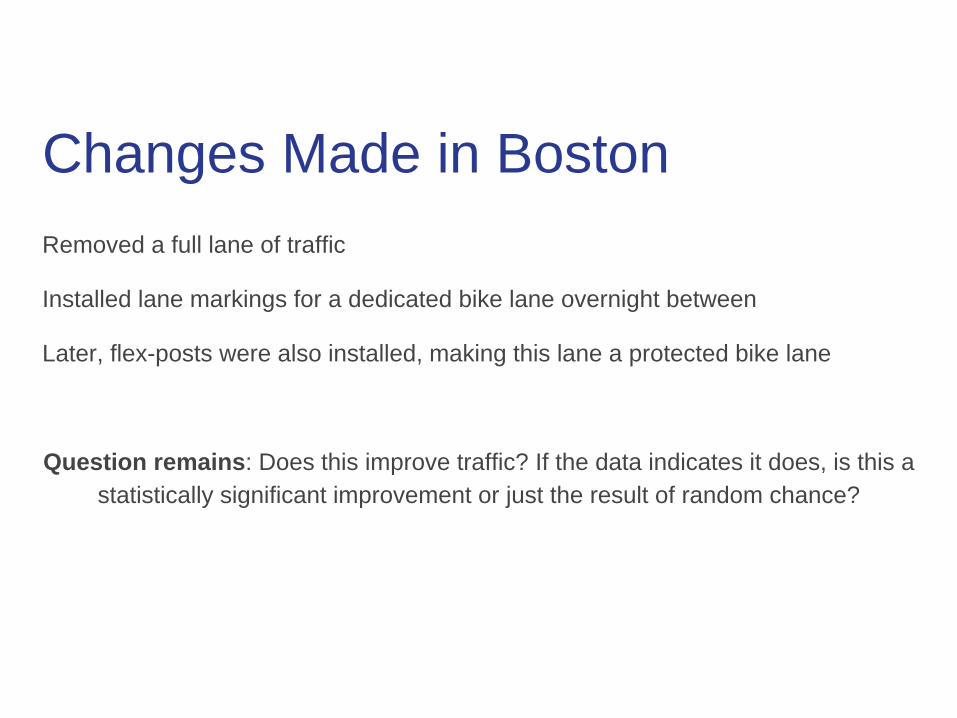
Changes Made in BostonRemoved a full lane of traffic
Installed lane markings for a dedicated bike lane overnight between
Later, flex-posts were also installed, making this lane a protected bike lane
Question remains: Does this improve traffic? If the data indicates it does, is this a statistically significant improvement or just the result of random chance?
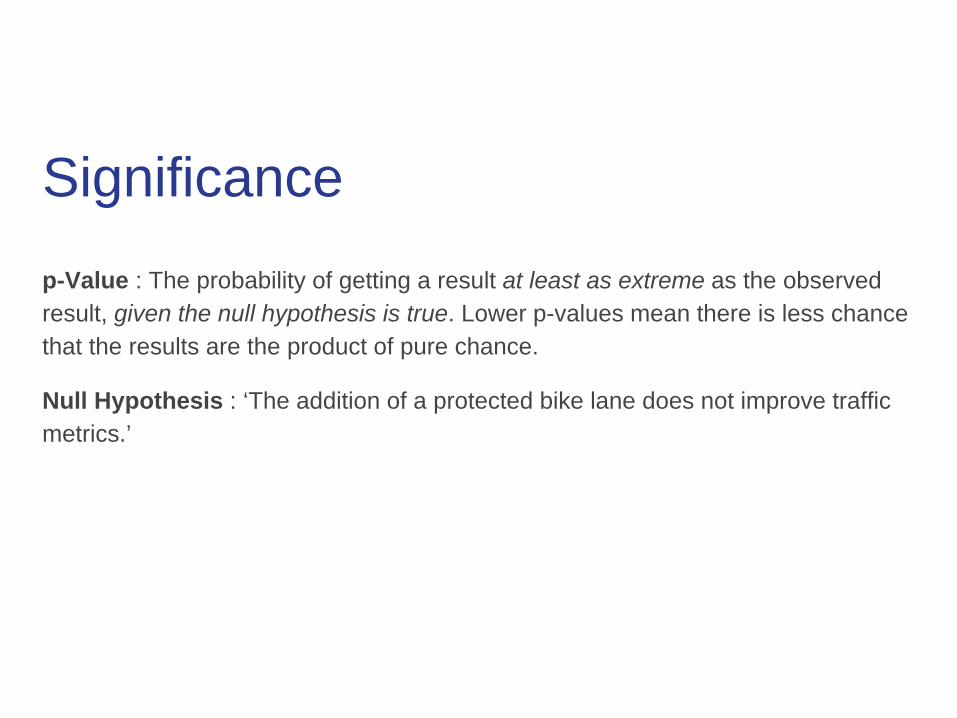
Significancep-Value : The probability of getting a result at least as extreme as the observed result, given the null hypothesis is true. Lower p-values mean there is less chance that the results are the product of pure chance.
Null Hypothesis : ‘The addition of a protected bike lane does not improve traffic metrics.’
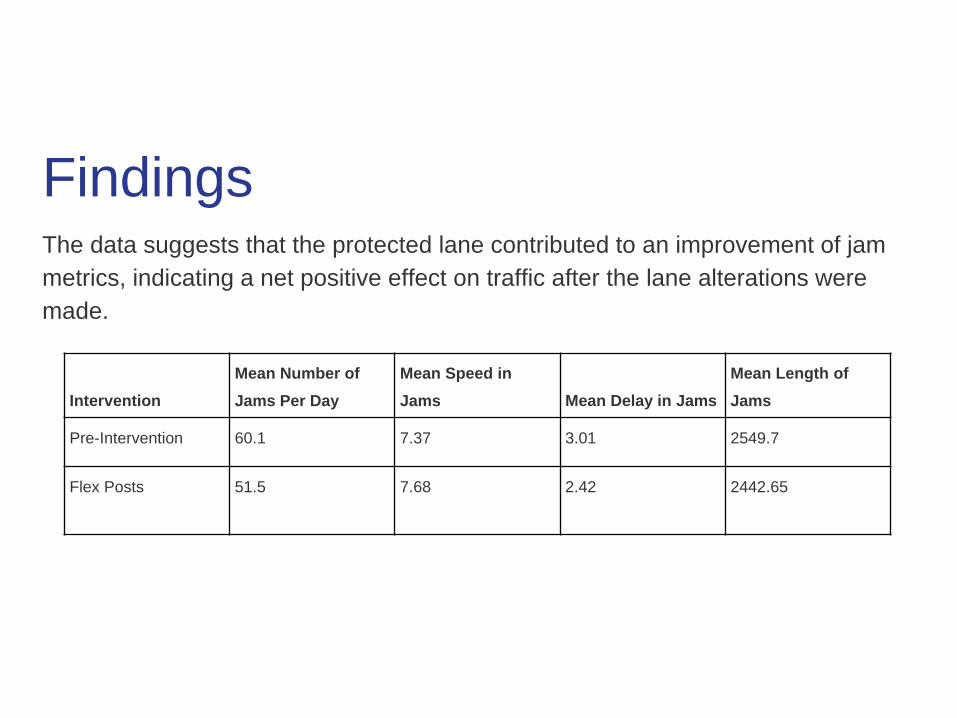
FindingsThe data suggests that the protected lane contributed to an improvement of jam metrics, indicating a net positive effect on traffic after the lane alterations were made.
InterventionMean Number of Jams Per Day
Mean Speed in Jams Mean Delay in Jams
Mean Length of Jams
Pre-Intervention 60.1 7.37 3.01 2549.7
Flex Posts 51.5 7.68 2.42 2442.65
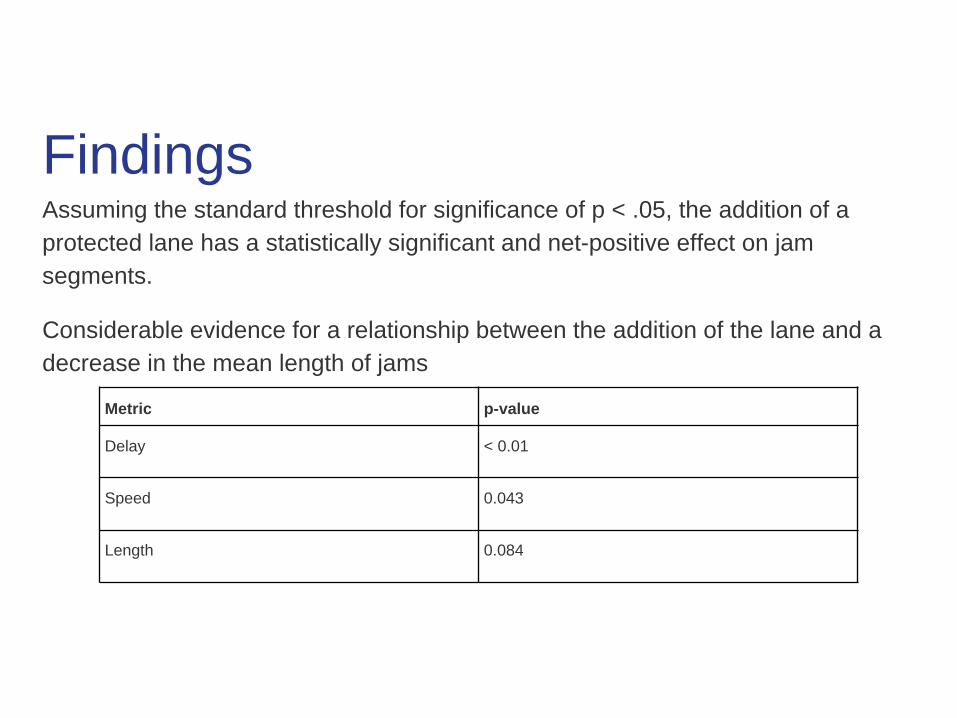
Findings Assuming the standard threshold for significance of p < .05, the addition of a protected lane has a statistically significant and net-positive effect on jam segments.
Considerable evidence for a relationship between the addition of the lane and a decrease in the mean length of jams
Metric p-value
Delay < 0.01
Speed 0.043
Length 0.084
Considerations The metrics included in this study relate to existing traffic jams detected by a single source.
It does not include travel times along the corridor, nor injury rates.
Although there is a demonstrably positive effect on auto-detected jam metrics, there is an observed increase in both the volume and severity of user-submitted jam alerts - a subjective measure of the roadway.

What tools are we using?

The StackSQL
Alerts
Points
Jams
R
ODBC
GISTools
maptools
RGDAL
ggmap
ffbase
SP
ETLUtils
ff
RODBC
ESRI GIS
Packages
TMC OPS MAP
Reports Analyses Maps/ Graphs
Related Documents