molecules Article Automated Photochemically Induced Method for the Quantitation of the Neonicotinoid Thiacloprid in Lettuce J. Jiménez-López, E.J. Llorent-Martínez , S. Martínez-Soliño and A. Ruiz-Medina * Department of Physical and Analytical Chemistry, Faculty of Experimental Sciences, University of Jaén, Campus Las Lagunillas, E-23071 Jaén, Spain; [email protected] (J.J.-L.); [email protected] (E.J.-L.M.); [email protected] (S.M.-S.) * Correspondence: [email protected]; Tel.: +34-953-212759; Fax: +34-953-212940 Received: 11 September 2019; Accepted: 6 November 2019; Published: 12 November 2019 Abstract: In this work, we present an automated luminescence sensor for the quantitation of the insecticide thiacloprid, one of the main neonicotinoids, in lettuce samples. A simple and automated manifold was constructed, using multicommutated solenoid valves to handle all solutions. The analyte was online irradiated with UV light to produce a highly fluorescent photoproduct (λ exc /λ em = 305/370 nm/nm) that was then retained on a solid support placed in the flow cell. In this way, the pre-concentration of the photoproduct was achieved in the detection area, increasing the sensitivity of the analytical method. A method-detection limit of 0.24 mg kg -1 was achieved in real samples, fulfilling the Maximum Residue Limit (MRL) of The European Union for thiacloprid in lettuce (1 mg kg -1 ). A sample throughput of eight samples per hour was obtained. Recovery experiments were carried out at values close to the MRL, obtaining recovery yields close to 100% and relative standard deviations lower than 5%. Hence, this method would be suitable for routine analyses in quality control, as an alternative to other existing methods. Keywords: neonicotinoid; thiacloprid; solid-phase spectroscopy; optosensor; luminescence 1. Introduction Neonicotinoid pesticides are the most widely used class of insecticides worldwide, representing a 25% share of the insecticides market in 2014 [1]. They have a wide range of applications: plant protection (crops, vegetables, and fruits), veterinary products, and biocides to invertebrate pest control in fish farming. However, their use is a controversial subject, as several toxicological studies proved that some neonicotinoids (imidacloprid, clothianidin, and thiamethoxam) produce the collapse of honey-producing bee colonies [2]. In 2018, the European Union decided to ban the outdoor use of these three pesticides [3], and the Environmental Protection Agency announced on May 2019 that the registration for 12 neonicotinoid-based products would be canceled. However, the mentioned ban does not affect thiacloprid (TCP) and other neonicotinoids, which makes it important to develop accurate and quick analytical methods for their reliable quantitation in a wide variety of food samples, in order to ensure their safe consumption. Among neonicotinoids, TCP is one of the most commonly used, and it belongs to the so-called “first generation” neonicotinoids. The usual analytical methods for TCP quantitation in food samples use liquid chromatography [4–8]. In particular, HPLC-MS/MS [9,10] and UHPLC-MS/MS [11,12] have been reported for their determination in lettuce. Moreover, electrochemistry [13,14], micellar electrokinetic chromatography [15], immunoassays [16,17], and luminescence [18–20] have been also proposed for TCP quantitation. The main goal of this work was to develop an alternative luminescence Molecules 2019, 24, 4089; doi:10.3390/molecules24224089 www.mdpi.com/journal/molecules

Welcome message from author
This document is posted to help you gain knowledge. Please leave a comment to let me know what you think about it! Share it to your friends and learn new things together.
Transcript
molecules
Article
Automated Photochemically Induced Methodfor the Quantitation of the Neonicotinoid Thiaclopridin Lettuce
J. Jiménez-López, E.J. Llorent-Martínez , S. Martínez-Soliño and A. Ruiz-Medina *
Department of Physical and Analytical Chemistry, Faculty of Experimental Sciences, University of Jaén,Campus Las Lagunillas, E-23071 Jaén, Spain; [email protected] (J.J.-L.); [email protected] (E.J.-L.M.);[email protected] (S.M.-S.)* Correspondence: [email protected]; Tel.: +34-953-212759; Fax: +34-953-212940
Received: 11 September 2019; Accepted: 6 November 2019; Published: 12 November 2019 �����������������
Abstract: In this work, we present an automated luminescence sensor for the quantitation ofthe insecticide thiacloprid, one of the main neonicotinoids, in lettuce samples. A simple andautomated manifold was constructed, using multicommutated solenoid valves to handle all solutions.The analyte was online irradiated with UV light to produce a highly fluorescent photoproduct(λexc/λem = 305/370 nm/nm) that was then retained on a solid support placed in the flow cell. In thisway, the pre-concentration of the photoproduct was achieved in the detection area, increasing thesensitivity of the analytical method. A method-detection limit of 0.24 mg kg−1 was achieved in realsamples, fulfilling the Maximum Residue Limit (MRL) of The European Union for thiacloprid in lettuce(1 mg kg−1). A sample throughput of eight samples per hour was obtained. Recovery experimentswere carried out at values close to the MRL, obtaining recovery yields close to 100% and relativestandard deviations lower than 5%. Hence, this method would be suitable for routine analyses inquality control, as an alternative to other existing methods.
Keywords: neonicotinoid; thiacloprid; solid-phase spectroscopy; optosensor; luminescence
1. Introduction
Neonicotinoid pesticides are the most widely used class of insecticides worldwide, representinga 25% share of the insecticides market in 2014 [1]. They have a wide range of applications: plantprotection (crops, vegetables, and fruits), veterinary products, and biocides to invertebrate pest controlin fish farming. However, their use is a controversial subject, as several toxicological studies provedthat some neonicotinoids (imidacloprid, clothianidin, and thiamethoxam) produce the collapse ofhoney-producing bee colonies [2]. In 2018, the European Union decided to ban the outdoor use ofthese three pesticides [3], and the Environmental Protection Agency announced on May 2019 thatthe registration for 12 neonicotinoid-based products would be canceled. However, the mentionedban does not affect thiacloprid (TCP) and other neonicotinoids, which makes it important to developaccurate and quick analytical methods for their reliable quantitation in a wide variety of food samples,in order to ensure their safe consumption.
Among neonicotinoids, TCP is one of the most commonly used, and it belongs to the so-called“first generation” neonicotinoids. The usual analytical methods for TCP quantitation in food samplesuse liquid chromatography [4–8]. In particular, HPLC-MS/MS [9,10] and UHPLC-MS/MS [11,12]have been reported for their determination in lettuce. Moreover, electrochemistry [13,14], micellarelectrokinetic chromatography [15], immunoassays [16,17], and luminescence [18–20] have been alsoproposed for TCP quantitation. The main goal of this work was to develop an alternative luminescence
Molecules 2019, 24, 4089; doi:10.3390/molecules24224089 www.mdpi.com/journal/molecules
Molecules 2019, 24, 4089 2 of 10
analytical method for TCP routine analysis in lettuce, one of the most widely consumed vegetables,paying special attention to the simplicity, economy, and sample throughput of the system developed.
The use of luminescence sensors has increased in the last decade, minimizing reagents consumptionand increasing the degree of automation. In this sense, the use of automated methodologies,such as multicommutated devices, provide advantages, such as increased precision, robustness,and high automation. The combination of flow methodologies and solid-phase spectroscopy (SPS)is a successful approach that maintains the key advantages of automated flow systems, increasingthe sensitivity and selectivity of the analytical methods due to the retention and pre-concentration ofthe target compounds on a solid support placed in the detection area [21]. For instance, a previousmethod was reported that used sequential injection analysis for the fluorometric determinationof hydroxytyrosol (phenolic phytochemical with antioxidant properties in vitro) in food samples,measuring its native fluorescence [22]. The use of multicommutation has proved successful, too,for the quantitation of clothianidin by photochemically induced fluorescence (PIF) in drinking water,rice, and honey [23]. As a follow-up to previous works, we report a multicommutated flow-injectionanalysis (MCFIA)-based method, using PIF detection to overcome the handicap of the absenceof native fluorescence of TCP. The main difference from the previous paper is the selected foodsample, lettuce, which made it necessary to carry out a different extraction procedure due to thedifferent matrix. In addition, the novel instrumental and chemical conditions made it possibleto discriminate between TCP and other neonicotinoids. The analyte is UV-irradiated to producea fluorescence photoproduct which is retained and detected on a solid support placed in the flow cell.By means of the MCFIA manifold, this irradiation takes place online, simplifying the procedure andincreasing sample throughput. The proposed method allows for the fulfillment of the MaximumResidue Limit (MRL) of the European Union [24] for TCP in lettuce.
2. Experimental
2.1. Reagents and Solutions
TCP (Sigma-Aldrich, Madrid, Spain) stock solution of 100 mg L−1 was prepared in Milli-Q water(Millipore); it was kept in the dark at 4 ◦C, and working solutions were prepared daily. Acetonitrile,graphitized carbon black (GBC), primary–secondary amine (PSA), hydrochloric acid (HCl), sodiumhydroxide (NaOH), sodium acetate, acetic acid, ammonium chloride (NH4Cl), ammonia (NH3),and magnesium sulphate (MgSO4) were purchased from Sigma (Sigma-Aldrich). Isolute QuEChERSextraction kit was acquired from Biotage (Sweden). Sephadex QAE A-25 and Sephadex SP C-25 insodium form, both of them 40–120 µm average particle size (Sigma-Aldrich, Buchs, Switzerland),and C18 bonded phase silica gel beads (Waters, Milford, MA, USA) of 55–105 µm average particle size,were tested as solid supports.
Ultrapure water (Milli-Q Waters purification system, Millipore, Milford, MA, USA) was used forall analyses.
2.2. Instrumentation and Apparatus
A Cary-Eclipse Luminescence Spectrometer (Varian Inc., Mulgrave, Australia) with Cary-Eclipse(Varian) software and a Hellma flow cell 176.752-QS (Hellma, Mülheim, Germany) (25 µL of innervolume, and a light path length of 1.5 mm) were used. The cell was filled with the solid support andwas blocked at the outlet with glass wool, to prevent displacement of the particles.
A four-channel Gilson Minipuls-3 (Villiers Le Bel, France) peristaltic pump with rate selectorand methanol-resistant pump tubes type Solvflex (Elkay Products, Shrewsbury, MA, USA) were used.An electronic interface based on ULN 2803 integrated circuit (Motorola, Phoenix, AZ, USA) wasemployed to generate the electric potential (12 V) and current (100 mA) required to control thethree 161T031 NResearch three-way solenoid valves (Neptune Research, West Caldwell, NJ, USA).
Molecules 2019, 24, 4089 3 of 10
The software for controlling the system was written in Java. Flow lines of 0.8 mm internal diameterPTFE tubing and methacrylate connections were used.
For UV-irradiation, a homemade continuous photochemical reactor was constructed by coilingPTFE tubing (180 cm, 0.8 mm i.d.) around a low-pressure mercury lamp (30 W, 254 nm). A SonorexDigital 10P (Bandelin Electronic, Berlin, Germany) ultrasonic bath, a pH-meter Crison GLP21(Crison Instruments, Barcelona, Spain), a centrifuge Mixtasel-BL (Selecta, Barcelona, Spain), and arotary evaporator (Heidolf, Schawabach, Germany) were also used.
2.3. Sample Preparation
All samples (iceberg lettuce, baby Romaine lettuce, and green oak leaf lettuce) were purchased atlocal markets. Approximately 200 g of each sample was ground and homogenized with a high-speedlaboratory homogenizer. TCP was extracted, following a modified QuEChERS method [25].An extraction kit (Isolute QuEChERS) containing GCB was used for all samples. This nonpolarsorbent allowed for the removal of hydrophobic interaction-based compounds, such as chlorophylland carotenoids. The method used was as follows: 10 g of sample was weighed in a 50 mL PTFEcentrifuge tube, and acetonitrile (10 mL) was added. Then, the content of a 15 mL tube extractionkit (4 g of MgSO4, 1 g of sodium citrate, 0.5 g of sodium citrate sesquihydrate, and 1 g of NaCl) wasadded, and the samples were vortexed for 1 min. After centrifugation (5 min, 4000 rpm), 6 mL of thesupernatant was transferred into a 15 mL dispersive SPE tube containing 150 mg of PSA, 900 mg ofMgSO4, and 15 mg of GCB. Samples were vortexed for 1 min and centrifuged for 5 min, at 4000 rpm.In this way, the acetonitrile (supernatant) contained the analyte. Prior to analysis, an appropriatevolume of the acetonitrile extract was diluted with acetate buffer (0.05 mol L−1, pH 4.6).
2.4. General Procedure
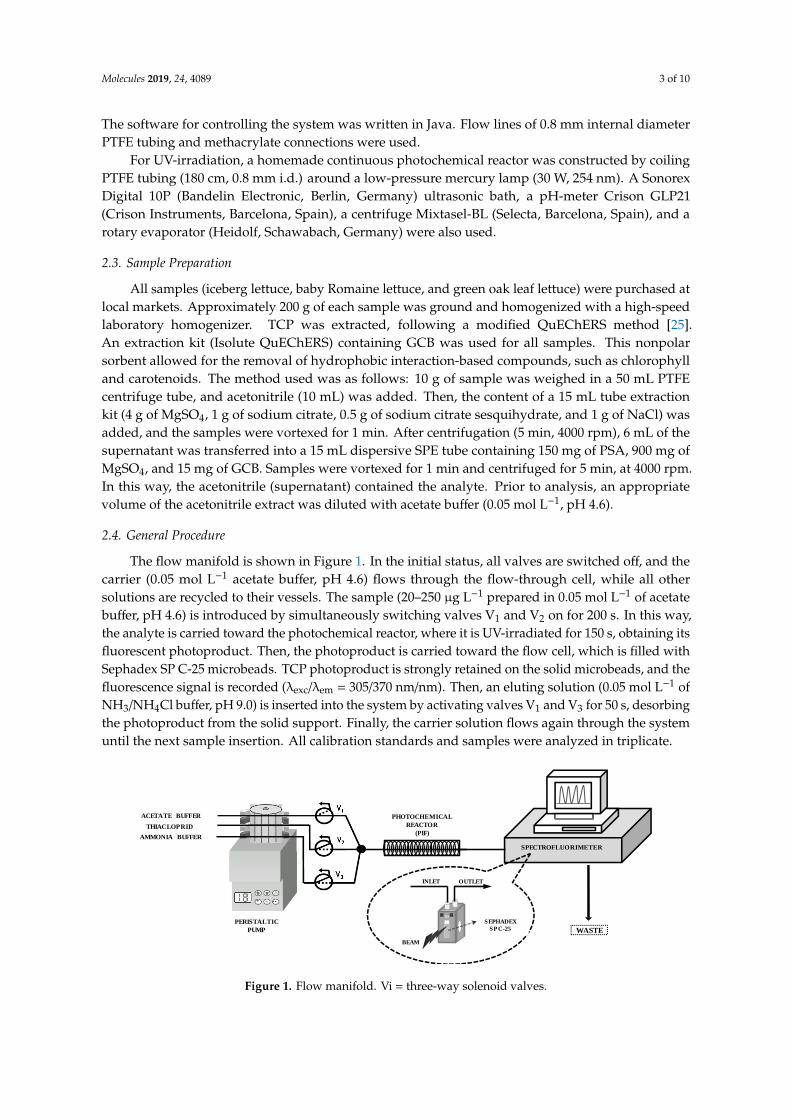
The flow manifold is shown in Figure 1. In the initial status, all valves are switched off, and thecarrier (0.05 mol L−1 acetate buffer, pH 4.6) flows through the flow-through cell, while all othersolutions are recycled to their vessels. The sample (20–250 µg L−1 prepared in 0.05 mol L−1 of acetatebuffer, pH 4.6) is introduced by simultaneously switching valves V1 and V2 on for 200 s. In this way,the analyte is carried toward the photochemical reactor, where it is UV-irradiated for 150 s, obtaining itsfluorescent photoproduct. Then, the photoproduct is carried toward the flow cell, which is filled withSephadex SP C-25 microbeads. TCP photoproduct is strongly retained on the solid microbeads, and thefluorescence signal is recorded (λexc/λem = 305/370 nm/nm). Then, an eluting solution (0.05 mol L−1 ofNH3/NH4Cl buffer, pH 9.0) is inserted into the system by activating valves V1 and V3 for 50 s, desorbingthe photoproduct from the solid support. Finally, the carrier solution flows again through the systemuntil the next sample insertion. All calibration standards and samples were analyzed in triplicate.
Molecules 2019, 24, x FOR PEER REVIEW 3 of 11
For UV-irradiation, a homemade continuous photochemical reactor was constructed by coiling
PTFE tubing (180 cm, 0.8 mm i.d.) around a low-pressure mercury lamp (30 W, 254 nm). A Sonorex
Digital 10P (Bandelin Electronic, Berlin, Germany) ultrasonic bath, a pH-meter Crison GLP21 (Crison
Instruments, Barcelona, Spain), a centrifuge Mixtasel-BL (Selecta, Barcelona, Spain), and a rotary
evaporator (Heidolf, Schawabach, Germany) were also used.
2.3. Sample Preparation
All samples (iceberg lettuce, baby Romaine lettuce, and green oak leaf lettuce) were purchased
at local markets. Approximately 200 g of each sample was ground and homogenized with a high-
speed laboratory homogenizer. TCP was extracted, following a modified QuEChERS method [25].
An extraction kit (Isolute QuEChERS) containing GCB was used for all samples. This nonpolar
sorbent allowed for the removal of hydrophobic interaction-based compounds, such as chlorophyll
and carotenoids. The method used was as follows: 10 g of sample was weighed in a 50 mL PTFE
centrifuge tube, and acetonitrile (10 mL) was added. Then, the content of a 15 mL tube extraction kit
(4 g of MgSO4, 1 g of sodium citrate, 0.5 g of sodium citrate sesquihydrate, and 1 g of NaCl) was
added, and the samples were vortexed for 1 min. After centrifugation (5 min, 4000 rpm), 6 mL of the
supernatant was transferred into a 15 mL dispersive SPE tube containing 150 mg of PSA, 900 mg of
MgSO4, and 15 mg of GCB. Samples were vortexed for 1 min and centrifuged for 5 min, at 4000 rpm.
In this way, the acetonitrile (supernatant) contained the analyte. Prior to analysis, an appropriate
volume of the acetonitrile extract was diluted with acetate buffer (0.05 mol L−1, pH 4.6).
2.4. General Procedure
The flow manifold is shown in Figure 1. In the initial status, all valves are switched off, and the
carrier (0.05 mol L−1 acetate buffer, pH 4.6) flows through the flow-through cell, while all other
solutions are recycled to their vessels. The sample (20–250 µg L−1 prepared in 0.05 mol L−1 of acetate
buffer, pH 4.6) is introduced by simultaneously switching valves V1 and V2 on for 200 s. In this way,
the analyte is carried toward the photochemical reactor, where it is UV-irradiated for 150 s, obtaining
its fluorescent photoproduct. Then, the photoproduct is carried toward the flow cell, which is filled
with Sephadex SP C-25 microbeads. TCP photoproduct is strongly retained on the solid microbeads,
and the fluorescence signal is recorded (λexc/λem = 305/370 nm/nm). Then, an eluting solution (0.05
mol L−1 of NH3/NH4Cl buffer, pH 9.0) is inserted into the system by activating valves V1 and V3 for 50
s, desorbing the photoproduct from the solid support. Finally, the carrier solution flows again
through the system until the next sample insertion. All calibration standards and samples were
analyzed in triplicate.
Figure 1. Flow manifold. Vi = three-way solenoid valves.
WASTE
SPECTROFLUORIMETER
INLET OUTLET
SEPHADEX
SP C-25
QS
BEAM
PHOTOCHEMICAL
REACTOR
(PIF)
PERISTALTIC
PUMP
THIACLOPRID
ACETATE BUFFER
AMMONIA BUFFER
Figure 1. Flow manifold. Vi = three-way solenoid valves.
Molecules 2019, 24, 4089 4 of 10
3. Results and Discussion
Neonicotinoids do not present native fluorescence (or very low luminescence in some cases).Therefore, different strategies are required to develop luminescent analytical methods for theirdetermination. In this case, we tested the possibility of irradiating TCP with a UV-lamp, in order togenerate possible fluorescent photoproducts. The absorption spectrum of thiacloprid (200–380 nm;maximum at 242 nm) makes this compound an interesting candidate to perform PIF with thelow-pressure mercury lamp (emission of 200–300 nm; maximum at 254 nm). The different parametersof the system were optimized to obtain the highest sensitivity.
3.1. Instrumental Variables and Selection of Solid Support
We tested different solid supports (Sephadex QAE A-25, Sephadex SP C-25, and C18 silica gel)in the flow cell, to select the optimum one for the retention of TCP photoproduct. The optimumsample pH was obtained for pH values of 4–6 (see Section 3.2); as expected, TCP photoproduct wasnot retained on the anion-exchange QAE A-25, which is suitable for anionic species at basic pH values.On the other hand, although both the cation-exchange SP C-25 and nonionic C18 silica gel beads couldretain the photoproduct, the signal obtained in C18 was very low, observing the highest signal with SPC-25, which was the selected solid support. However, it is important to consider that, when the signalis recorded on a solid support, there is a considerable background signal. Therefore, instrumentalparameters have to be carefully studied to achieve the maximum sensitivity without compromisingthe linear dynamic range due to a high background signal. Excitation and emission slit widths wereoptimized between 5 and 20 nm, whereas the voltage of the photomultiplier tube (PMT) was studiedin the range of 400–800 V. Wide slit widths and high PMT voltages increased the sensitivity, as wellas the background signal produced by the solid support. Overall, the best results were obtained forexcitation/emission slit widths of 5/10 nm/nm, respectively, and a PMT voltage of 780 V.
3.2. Chemical Variables
The chemical variables can affect the performance of the analytical methods not only from thepoint of view of the generation of the fluorescent photoproduct but also in terms of its retention/elutionkinetics on the solid support. We thus optimized the pH value of the sample solution in the first place,adjusting the pH with HCl and NaOH solutions.
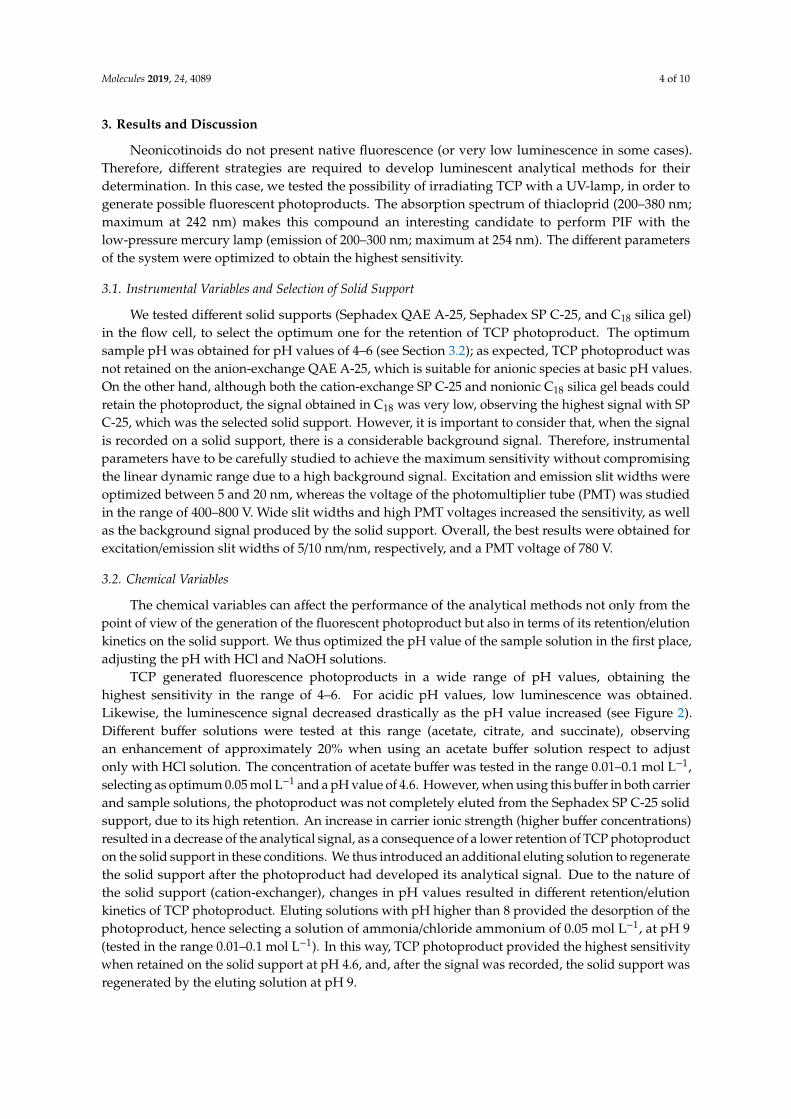
TCP generated fluorescence photoproducts in a wide range of pH values, obtaining thehighest sensitivity in the range of 4–6. For acidic pH values, low luminescence was obtained.Likewise, the luminescence signal decreased drastically as the pH value increased (see Figure 2).Different buffer solutions were tested at this range (acetate, citrate, and succinate), observingan enhancement of approximately 20% when using an acetate buffer solution respect to adjustonly with HCl solution. The concentration of acetate buffer was tested in the range 0.01–0.1 mol L−1,selecting as optimum 0.05 mol L−1 and a pH value of 4.6. However, when using this buffer in both carrierand sample solutions, the photoproduct was not completely eluted from the Sephadex SP C-25 solidsupport, due to its high retention. An increase in carrier ionic strength (higher buffer concentrations)resulted in a decrease of the analytical signal, as a consequence of a lower retention of TCP photoproducton the solid support in these conditions. We thus introduced an additional eluting solution to regeneratethe solid support after the photoproduct had developed its analytical signal. Due to the nature ofthe solid support (cation-exchanger), changes in pH values resulted in different retention/elutionkinetics of TCP photoproduct. Eluting solutions with pH higher than 8 provided the desorption of thephotoproduct, hence selecting a solution of ammonia/chloride ammonium of 0.05 mol L−1, at pH 9(tested in the range 0.01–0.1 mol L−1). In this way, TCP photoproduct provided the highest sensitivitywhen retained on the solid support at pH 4.6, and, after the signal was recorded, the solid support wasregenerated by the eluting solution at pH 9.
Molecules 2019, 24, 4089 5 of 10Molecules 2019, 24, x FOR PEER REVIEW 5 of 11
Figure 2. Effect of pH values on the analytical signal.
3.3. Irradiation Time
The irradiation time is an essential variable for the generation of fluorescent photoproducts. To
optimize this parameter, different UV lamps (8, 15, and 30 W) and irradiation times (30–230 s) were
tested for a TCP solution of 100 µg L−1. First of all, the 30 W UV lamp was selected, as a higher
analytical signal was obtained compared to the other lamps. Second, the irradiation time was studied
with this lamp, inserting the sample solution in the system and stopping the flow when the whole
plug of the sample was within the photoreactor. Then, the sample was irradiated for increasing
periods of time; the results are shown in Figure 3. The analytical signal increased up to an irradiation
time of 150 s, decreasing for higher values. The shape of the irradiation time curve suggests a two-
step photolysis mechanism, in which the photoproduct observed at 150 s suffered a posterior
photodegradation into nonfluorescent product(s) or different photoproduct(s) with lower
fluorescence emission. This kind of behavior was previously reported for imidacloprid [26]; hence,
the irradiation time was fixed at 150 s. To obtain this irradiation time without the need to stop the
flow, flow parameters were optimized. Although the exact structure of TCP photoproduct could not
be elucidated, a previous work reported the formula of the photoproduct as C10H11N4OS [27]. This
means that TCP (C10H9ClN4S) suffered a C–Cl bond cleavage to produce the photoproduct; the loss
of Cl results in an enhancement of the fluorescence.
R.F
.I. (a
.u.)
pH
0
50
100
150
200
250
0 2 4 6 8 10 12 14
Figure 2. Effect of pH values on the analytical signal.
3.3. Irradiation Time
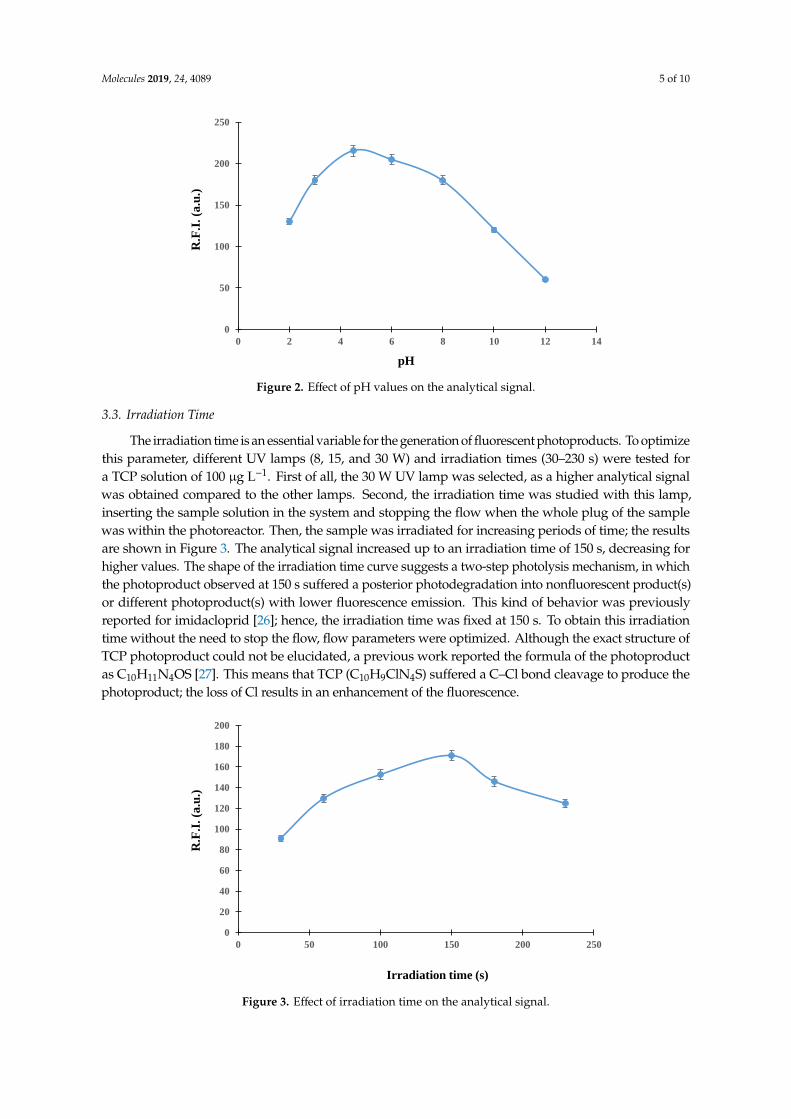
The irradiation time is an essential variable for the generation of fluorescent photoproducts. To optimizethis parameter, different UV lamps (8, 15, and 30 W) and irradiation times (30–230 s) were tested fora TCP solution of 100 µg L−1. First of all, the 30 W UV lamp was selected, as a higher analytical signalwas obtained compared to the other lamps. Second, the irradiation time was studied with this lamp,inserting the sample solution in the system and stopping the flow when the whole plug of the samplewas within the photoreactor. Then, the sample was irradiated for increasing periods of time; the resultsare shown in Figure 3. The analytical signal increased up to an irradiation time of 150 s, decreasing forhigher values. The shape of the irradiation time curve suggests a two-step photolysis mechanism, in whichthe photoproduct observed at 150 s suffered a posterior photodegradation into nonfluorescent product(s)or different photoproduct(s) with lower fluorescence emission. This kind of behavior was previouslyreported for imidacloprid [26]; hence, the irradiation time was fixed at 150 s. To obtain this irradiationtime without the need to stop the flow, flow parameters were optimized. Although the exact structure ofTCP photoproduct could not be elucidated, a previous work reported the formula of the photoproductas C10H11N4OS [27]. This means that TCP (C10H9ClN4S) suffered a C–Cl bond cleavage to produce thephotoproduct; the loss of Cl results in an enhancement of the fluorescence.Molecules 2019, 24, x FOR PEER REVIEW 6 of 11
Figure 3. Effect of irradiation time on the analytical signal.
3.4. Flow Parameters
The flow rate selected for the manifold is critical to improving the sample throughput of the
analytical method. However, it can also affect it in other ways: (a) a high flow rate may produce
overpressures due to the solid support placed in the flow cell; (b) the flow rate and photoreactor
length are critical to keeping the optimum irradiation time. As a result, a flow rate of 1.3 mL min-1
was selected. Using this flow rate, the length of the photoreactor was adjusted so that the sample
plug required 150 s to go through the whole photoreactor.
In flow-through optosensors, the sensitivity of the method improves by increasing the sample
volume inserted. The higher the sample volume (keeping the same concentration), the higher the
amount of analyte inserted in the system and retained on the solid support. In this way, a pre-
concentration of the analyte takes place on the solid microbeads. However, increases in sample
volumes also imply lower sample throughput, so a compromise solution is usually needed. When
multicommutation is used, sample insertion time, instead of sample volume, is used (when the time
and flow rate are known, the volume can be calculated). We thus checked the influence of sample-
insertion times between 20 and 300 s. The analytical signal increased up to 200 s, being constant for
higher insertion times; hence, 200 s was selected as the optimum insertion time, achieving the
required sensitivity for the applications.
3.5. Analytical Parameters
The analytical parameters of the system were studied under the optimized conditions previously
discussed. They are shown in Table 1, and all of them correspond to a sample insertion time of 200 s.
R.F
.I. (a
.u.)
Irradiation time (s)
0
20
40
60
80
100
120
140
160
180
200
0 50 100 150 200 250
Figure 3. Effect of irradiation time on the analytical signal.
Molecules 2019, 24, 4089 6 of 10
3.4. Flow Parameters
The flow rate selected for the manifold is critical to improving the sample throughput of theanalytical method. However, it can also affect it in other ways: (a) a high flow rate may produceoverpressures due to the solid support placed in the flow cell; (b) the flow rate and photoreactorlength are critical to keeping the optimum irradiation time. As a result, a flow rate of 1.3 mL min−1
was selected. Using this flow rate, the length of the photoreactor was adjusted so that the sample plugrequired 150 s to go through the whole photoreactor.
In flow-through optosensors, the sensitivity of the method improves by increasing the samplevolume inserted. The higher the sample volume (keeping the same concentration), the higher the amountof analyte inserted in the system and retained on the solid support. In this way, a pre-concentration ofthe analyte takes place on the solid microbeads. However, increases in sample volumes also implylower sample throughput, so a compromise solution is usually needed. When multicommutation isused, sample insertion time, instead of sample volume, is used (when the time and flow rate are known,the volume can be calculated). We thus checked the influence of sample-insertion times between 20and 300 s. The analytical signal increased up to 200 s, being constant for higher insertion times; hence,200 s was selected as the optimum insertion time, achieving the required sensitivity for the applications.
3.5. Analytical Parameters
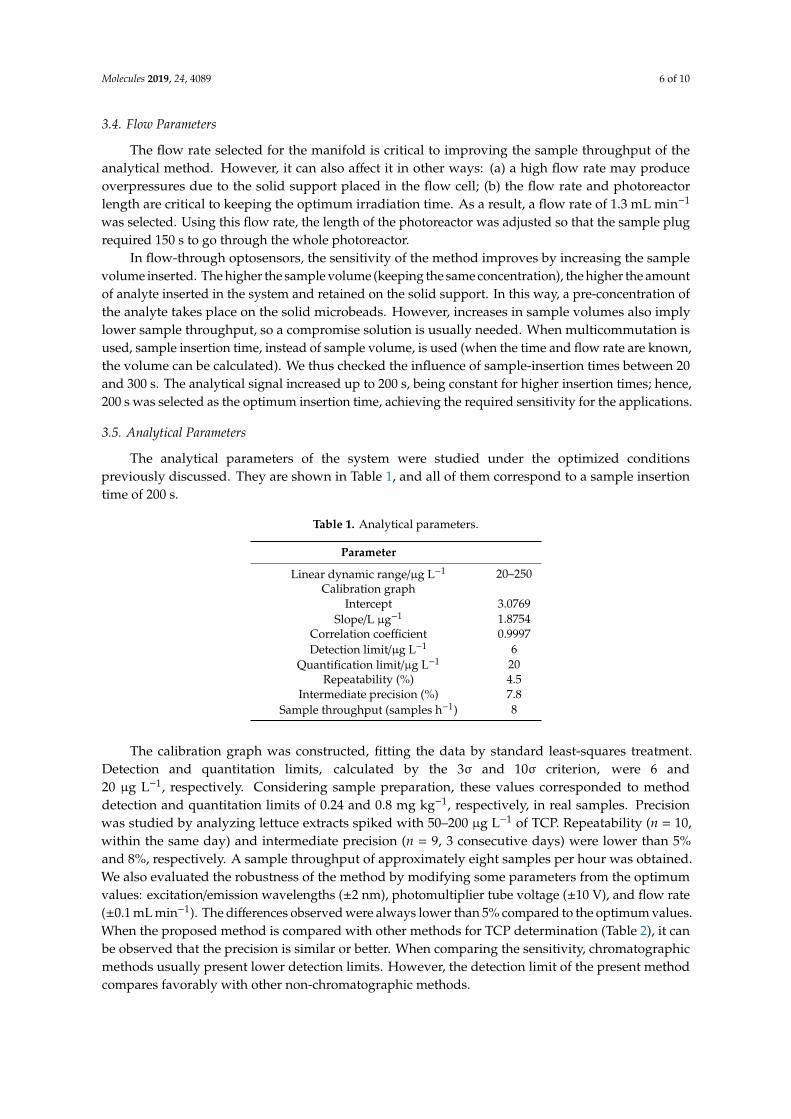
The analytical parameters of the system were studied under the optimized conditionspreviously discussed. They are shown in Table 1, and all of them correspond to a sample insertiontime of 200 s.
Table 1. Analytical parameters.
Parameter
Linear dynamic range/µg L−1 20–250Calibration graph
Intercept 3.0769Slope/L µg−1 1.8754
Correlation coefficient 0.9997Detection limit/µg L−1 6
Quantification limit/µg L−1 20Repeatability (%) 4.5
Intermediate precision (%) 7.8Sample throughput (samples h−1) 8
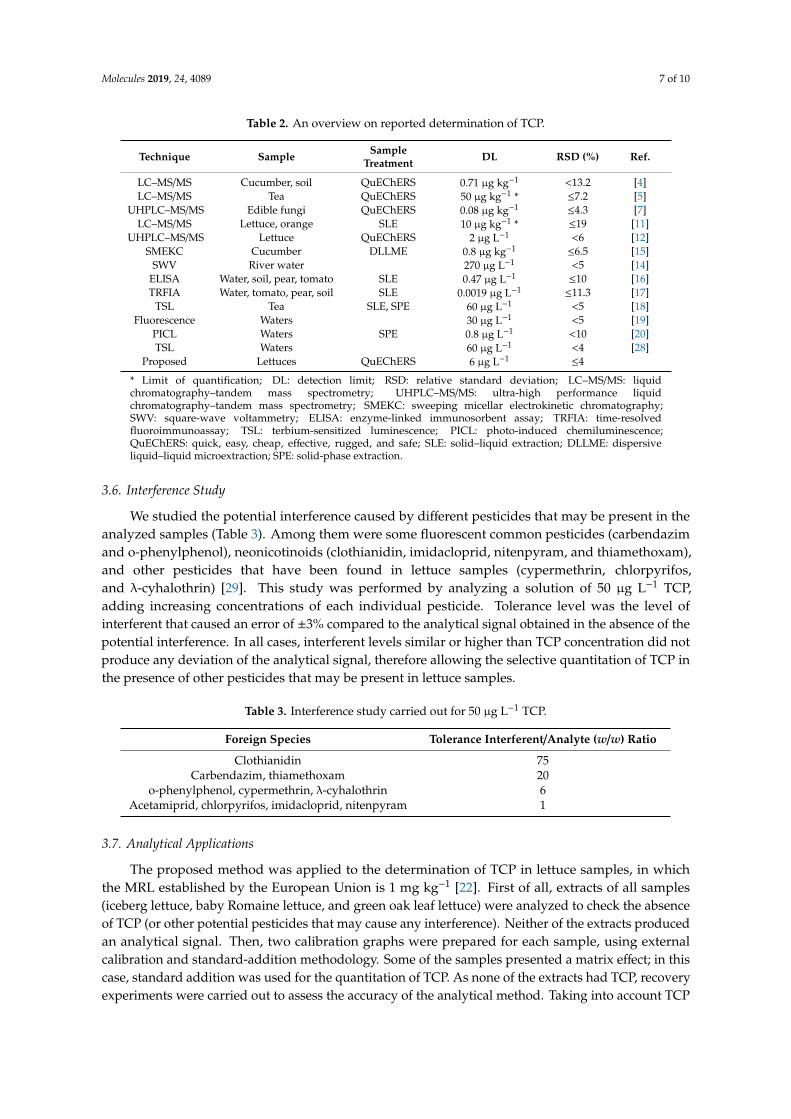
The calibration graph was constructed, fitting the data by standard least-squares treatment.Detection and quantitation limits, calculated by the 3σ and 10σ criterion, were 6 and20 µg L−1, respectively. Considering sample preparation, these values corresponded to methoddetection and quantitation limits of 0.24 and 0.8 mg kg−1, respectively, in real samples. Precisionwas studied by analyzing lettuce extracts spiked with 50–200 µg L−1 of TCP. Repeatability (n = 10,within the same day) and intermediate precision (n = 9, 3 consecutive days) were lower than 5%and 8%, respectively. A sample throughput of approximately eight samples per hour was obtained.We also evaluated the robustness of the method by modifying some parameters from the optimumvalues: excitation/emission wavelengths (±2 nm), photomultiplier tube voltage (±10 V), and flow rate(±0.1 mL min−1). The differences observed were always lower than 5% compared to the optimum values.When the proposed method is compared with other methods for TCP determination (Table 2), it canbe observed that the precision is similar or better. When comparing the sensitivity, chromatographicmethods usually present lower detection limits. However, the detection limit of the present methodcompares favorably with other non-chromatographic methods.
Molecules 2019, 24, 4089 7 of 10
Table 2. An overview on reported determination of TCP.
Technique Sample SampleTreatment DL RSD (%) Ref.
LC–MS/MS Cucumber, soil QuEChERS 0.71 µg kg−1 <13.2 [4]LC–MS/MS Tea QuEChERS 50 µg kg−1 * ≤7.2 [5]
UHPLC–MS/MS Edible fungi QuEChERS 0.08 µg kg−1 ≤4.3 [7]LC–MS/MS Lettuce, orange SLE 10 µg kg−1 * ≤19 [11]
UHPLC–MS/MS Lettuce QuEChERS 2 µg L−1 <6 [12]SMEKC Cucumber DLLME 0.8 µg kg−1 ≤6.5 [15]
SWV River water 270 µg L−1 <5 [14]ELISA Water, soil, pear, tomato SLE 0.47 µg L−1 ≤10 [16]TRFIA Water, tomato, pear, soil SLE 0.0019 µg L−1 ≤11.3 [17]
TSL Tea SLE, SPE 60 µg L−1 <5 [18]Fluorescence Waters 30 µg L−1 <5 [19]
PICL Waters SPE 0.8 µg L−1 <10 [20]TSL Waters 60 µg L−1 <4 [28]
Proposed Lettuces QuEChERS 6 µg L−1 ≤4
* Limit of quantification; DL: detection limit; RSD: relative standard deviation; LC–MS/MS: liquidchromatography–tandem mass spectrometry; UHPLC–MS/MS: ultra-high performance liquidchromatography–tandem mass spectrometry; SMEKC: sweeping micellar electrokinetic chromatography;SWV: square-wave voltammetry; ELISA: enzyme-linked immunosorbent assay; TRFIA: time-resolvedfluoroimmunoassay; TSL: terbium-sensitized luminescence; PICL: photo-induced chemiluminescence;QuEChERS: quick, easy, cheap, effective, rugged, and safe; SLE: solid–liquid extraction; DLLME: dispersiveliquid–liquid microextraction; SPE: solid-phase extraction.
3.6. Interference Study
We studied the potential interference caused by different pesticides that may be present in theanalyzed samples (Table 3). Among them were some fluorescent common pesticides (carbendazimand o-phenylphenol), neonicotinoids (clothianidin, imidacloprid, nitenpyram, and thiamethoxam),and other pesticides that have been found in lettuce samples (cypermethrin, chlorpyrifos,and λ-cyhalothrin) [29]. This study was performed by analyzing a solution of 50 µg L−1 TCP,adding increasing concentrations of each individual pesticide. Tolerance level was the level ofinterferent that caused an error of ±3% compared to the analytical signal obtained in the absence of thepotential interference. In all cases, interferent levels similar or higher than TCP concentration did notproduce any deviation of the analytical signal, therefore allowing the selective quantitation of TCP inthe presence of other pesticides that may be present in lettuce samples.
Table 3. Interference study carried out for 50 µg L−1 TCP.
Foreign Species Tolerance Interferent/Analyte (w/w) Ratio
Clothianidin 75Carbendazim, thiamethoxam 20
o-phenylphenol, cypermethrin, λ-cyhalothrin 6Acetamiprid, chlorpyrifos, imidacloprid, nitenpyram 1
3.7. Analytical Applications
The proposed method was applied to the determination of TCP in lettuce samples, in whichthe MRL established by the European Union is 1 mg kg−1 [22]. First of all, extracts of all samples(iceberg lettuce, baby Romaine lettuce, and green oak leaf lettuce) were analyzed to check the absenceof TCP (or other potential pesticides that may cause any interference). Neither of the extracts producedan analytical signal. Then, two calibration graphs were prepared for each sample, using externalcalibration and standard-addition methodology. Some of the samples presented a matrix effect; in thiscase, standard addition was used for the quantitation of TCP. As none of the extracts had TCP, recoveryexperiments were carried out to assess the accuracy of the analytical method. Taking into account TCP
Molecules 2019, 24, 4089 8 of 10
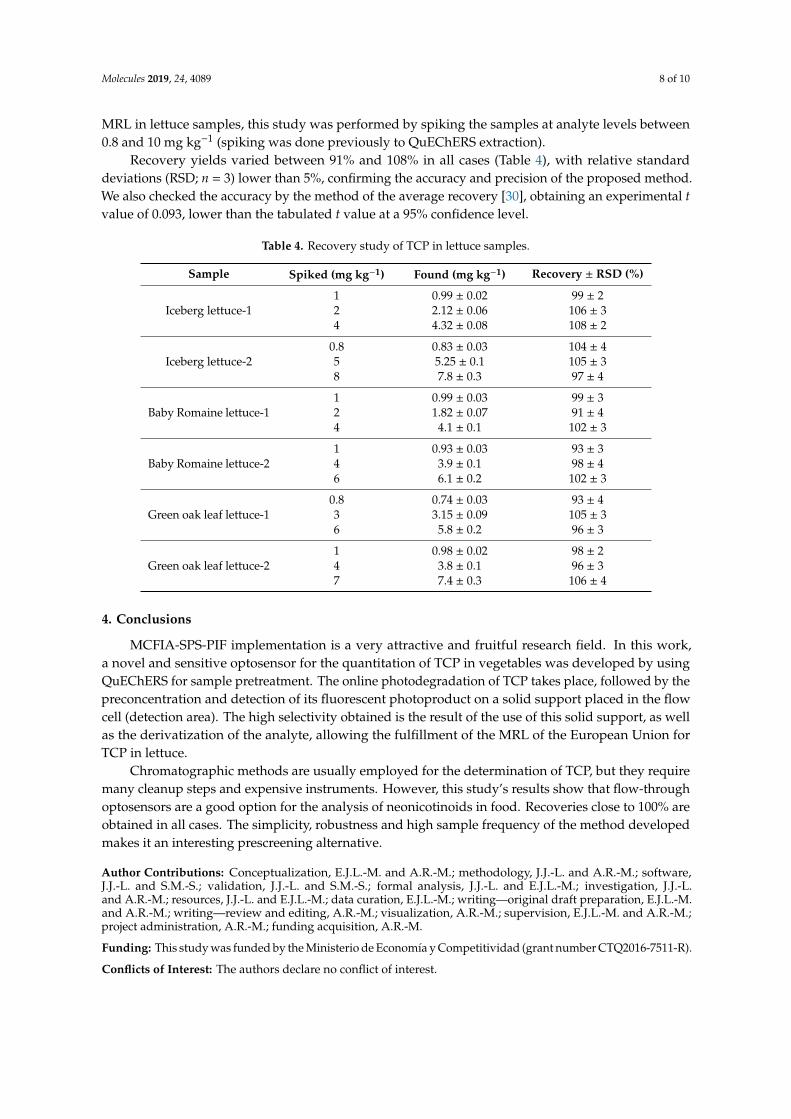
MRL in lettuce samples, this study was performed by spiking the samples at analyte levels between0.8 and 10 mg kg−1 (spiking was done previously to QuEChERS extraction).
Recovery yields varied between 91% and 108% in all cases (Table 4), with relative standarddeviations (RSD; n = 3) lower than 5%, confirming the accuracy and precision of the proposed method.We also checked the accuracy by the method of the average recovery [30], obtaining an experimental tvalue of 0.093, lower than the tabulated t value at a 95% confidence level.
Table 4. Recovery study of TCP in lettuce samples.
Sample Spiked (mg kg−1) Found (mg kg−1) Recovery ± RSD (%)
1 0.99 ± 0.02 99 ± 2Iceberg lettuce-1 2 2.12 ± 0.06 106 ± 3
4 4.32 ± 0.08 108 ± 2
0.8 0.83 ± 0.03 104 ± 4Iceberg lettuce-2 5 5.25 ± 0.1 105 ± 3
8 7.8 ± 0.3 97 ± 4
1 0.99 ± 0.03 99 ± 3Baby Romaine lettuce-1 2 1.82 ± 0.07 91 ± 4
4 4.1 ± 0.1 102 ± 3
1 0.93 ± 0.03 93 ± 3Baby Romaine lettuce-2 4 3.9 ± 0.1 98 ± 4
6 6.1 ± 0.2 102 ± 3
0.8 0.74 ± 0.03 93 ± 4Green oak leaf lettuce-1 3 3.15 ± 0.09 105 ± 3
6 5.8 ± 0.2 96 ± 3
1 0.98 ± 0.02 98 ± 2Green oak leaf lettuce-2 4 3.8 ± 0.1 96 ± 3
7 7.4 ± 0.3 106 ± 4
4. Conclusions
MCFIA-SPS-PIF implementation is a very attractive and fruitful research field. In this work,a novel and sensitive optosensor for the quantitation of TCP in vegetables was developed by usingQuEChERS for sample pretreatment. The online photodegradation of TCP takes place, followed by thepreconcentration and detection of its fluorescent photoproduct on a solid support placed in the flowcell (detection area). The high selectivity obtained is the result of the use of this solid support, as wellas the derivatization of the analyte, allowing the fulfillment of the MRL of the European Union forTCP in lettuce.
Chromatographic methods are usually employed for the determination of TCP, but they requiremany cleanup steps and expensive instruments. However, this study’s results show that flow-throughoptosensors are a good option for the analysis of neonicotinoids in food. Recoveries close to 100% areobtained in all cases. The simplicity, robustness and high sample frequency of the method developedmakes it an interesting prescreening alternative.
Author Contributions: Conceptualization, E.J.L.-M. and A.R.-M.; methodology, J.J.-L. and A.R.-M.; software,J.J.-L. and S.M.-S.; validation, J.J.-L. and S.M.-S.; formal analysis, J.J.-L. and E.J.L.-M.; investigation, J.J.-L.and A.R.-M.; resources, J.J.-L. and E.J.L.-M.; data curation, E.J.L.-M.; writing—original draft preparation, E.J.L.-M.and A.R.-M.; writing—review and editing, A.R.-M.; visualization, A.R.-M.; supervision, E.J.L.-M. and A.R.-M.;project administration, A.R.-M.; funding acquisition, A.R.-M.
Funding: This study was funded by the Ministerio de Economía y Competitividad (grant number CTQ2016-7511-R).
Conflicts of Interest: The authors declare no conflict of interest.
Molecules 2019, 24, 4089 9 of 10
References
1. Bass, C.; Denholm, I.; Williamson, M.S.; Nauen, R. The global status of insect resistanceto neonicotinoid insecticides. Pestic. Biochem. Physiol. 2015, 121, 78–87. [CrossRef] [PubMed]
2. Blacquière, T.; Smagghe, G.; van Gestel, C.A.M.; Mommaerts, V. Neonicotinoids in bees: A review onconcentrations, side-effects and risk assessment. Ecotoxicology 2012, 21, 973–992. [CrossRef] [PubMed]
3. Butler, D. EU expected to vote on pesticide ban after major scientific review. Nature 2018, 55, 150–151.[CrossRef] [PubMed]
4. Abdel-Ghany, M.F.; Hussein, L.A.; El Azab, N.F.; El-Khatib, A.H.; Linscheid, M.W. Simultaneousdetermination of eight neonicotinoid insecticide residues and two primary metabolites in cucumbersand soil by liquid chromatography–tandem mass spectrometry coupled with QuEChERS. J. Chromatogr. B2016, 1031, 15–28. [CrossRef] [PubMed]
5. Jiao, W.; Xiao, Y.; Qian, X.; Tong, M.; Hu, Y.; Hou, R.; Hua, R. Optimized combination of dilution and refinedQuEChERS to overcome matrix effects of six types of tea for determination eight neonicotinoid insecticidesby ultra performance liquid chromatography-electrospray tandem mass spectrometry. Food Chem. 2016,210, 26–34. [CrossRef] [PubMed]
6. Wang, F.; Li, S.; Feng, H.; Yang, Y.; Xiao, B.; Chen, D. An enhanced sensitivity and cleanup strategyfor the nontargeted screening and targeted determination of pesticides in tea using modified dispersivesolid-phase extraction and cold-induced acetonitrile aqueous two-phase systems coupled with liquidchromatography-high resolution mass spectrometry. Food Chem. 2019, 275, 530–538. [PubMed]
7. Lu, Z.; Fang, N.; Zhang, Z.; Wang, B.; Hou, Z.; Li, Y. Simultaneous determination of five neonicotinoidinsecticides in edible fungi using ultrahigh-performance liquid chromatography-tandem mass spectrometry(UHPLC-MS/MS). Food Anal. Methods 2018, 11, 1086–1094. [CrossRef]
8. Martínez-Domínguez, G.; Nieto-García, A.J.; Romero-González, R.; Frenich, A.G. Application of QuEChERSbased method for the determination of pesticides in nutraceutical products (Camellia sinensis) by liquidchromatography coupled to triple quadrupole tandem mass spectrometry. Food Chem. 2015, 177, 182–190.[CrossRef] [PubMed]
9. Han, Y.; Zou, N.; Song, L.; Li, Y.; Qin, Y.; Liu, S.; Li, X.; Pan, C. Simultaneous determination of 70 pesticideresidues in leek, leaf lettuce and garland chrysanthemum using modified QuEChERS method withmulti-walled carbon nanotubes as reversed-dispersive solid-phase extraction materials. J. Chromatogr. B 2015,1005, 56–64. [CrossRef] [PubMed]
10. Konatu, F.R.B.; Breitkreitz, M.C.; Jardim, I.C.S.F. Revisiting quick, easy, cheap, effective, rugged, and safeparameters for sample preparation in pesticide residue analysis of lettuce by liquid chromatography–tandemmass spectrometry. J. Chromatogr. A 2017, 1482, 11–22. [CrossRef] [PubMed]
11. Hanot, V.; Goxcinny, S.; Deridder, M. A simple multi-residue method for the determination ofpesticides in fruits and vegetables using a methanolic extraction and ultra-high-performance liquidchromatography-tandem mass spectrometry: Optimization and extension of scope. J. Chromatogr. A2015, 1384, 53–66. [CrossRef] [PubMed]
12. Konatu, F.R.B.; Jardim, I.C.S.F. Development and validation of an analytical method for multiresiduedetermination of pesticides in lettuce using QuEChERS-UHPLC-MS/MS. J. Sep. Sci. 2018, 41, 1726–1733.[CrossRef] [PubMed]
13. Li, Z.; Yu, Y.; Li, Z. A review of biosensing techniques for detection of trace carcinogen contamination infood products. Anal. Bioanal. Chem. 2015, 407, 2711–2726. [CrossRef] [PubMed]
14. Brycht, M.; Vajdle, O.; Papp, Z.; Guzsvány, V.; Obradovica, T.D. Renewable silver-amalgam film electrode fordirect cathodic SWV determination of clothianidin, nitenpyram and thiacloprid neonicotinoid insecticidesreducible in a fairly negative potential range. Int. J. Electrochem. Sci. 2012, 7, 10652–10665.
15. Zhang, S.; Yang, X.; Yin, X.; Wang, C.; Wang, Z. Dispersive liquid-liquid microextraction combined withsweeping micellar electrokinetic chromatography for the determination of some neonicotinoid insecticidesin cucumber samples. Food Chem. 2012, 133, 544–550. [CrossRef] [PubMed]
16. Liu, Z.; Li, M.; Shi, H. Development and evaluation of an enzyme-linked immunosorbent assay for thedetermination of thiacloprid in agricultural samples. Food Anal. Methods 2013, 6, 691. [CrossRef]
17. Liu, Z.; Yan, X.; Hua, X.; Wang, M. Time-resolved fluoroimmunoassay for quantitative determination ofthiacloprid in agricultural samples. Anal. Methods 2013, 5, 3572–3576. [CrossRef]
Molecules 2019, 24, 4089 10 of 10
18. Llorent-Martínez, E.J.; Soler-Gallardo, M.I.; Ruiz-Medina, A. Determination of thiacloprid, thiamethoxamand imidacloprid in tea samples by quenching terbium luminescence. Luminescence 2019, 34, 460–464.[CrossRef] [PubMed]
19. Liu, Y.; Cao, N.; Gui, W.; Ma, Q. Nitrogen-doped graphene quantum dots-based fluorescence molecularlyimprinted sensor for thiacloprid detection. Talanta 2018, 183, 339–344. [CrossRef] [PubMed]
20. Catalá-Icardo, M.; López-Paz, J.L.; Pérez-Plancha, L.M. Fast determination of thiacloprid by photoinducedchemiluminescence. Appl. Spectrosc. 2014, 68, 642–648. [CrossRef] [PubMed]
21. Llorent-Martínez, E.J.; Ortega-Barrales, P.; Fernández-de Córdova, M.L.; Ruiz-Medina, A. Contributionto automation for determination of drugs based on flow-through optosensors. App. Spectrosc. Rev. 2011,46, 339–367. [CrossRef]
22. Llorent-Martínez, E.J.; Jiménez-López, J.; Fernández-de Córdova, M.L.; Ortega-Barrales, P.; Fernández-deCórdova, M.L.; Ruiz-Medina, A. Quantitation of hydroxytirosol in food prodcuts using a sequential injectionanalysis fluorescence oprtosensor. J. Food Comp. Anal. 2013, 32, 99–104. [CrossRef]
23. Jiménez-López, J.; Ortega-Barrales, P.; Ruiz-Medina, A. Determination of clothianidin in food products byusing an automated system with photochemically induced fluorescence detection. J. Food Comp. Anal. 2016,49, 49–56. [CrossRef]
24. The European Comission, EU Pesticide Database. Available online: http://ec.europa.eu/food/plant/pesticides/eu-pesticides-database/public/?event=homepage&language=EN (accessed on 1 September 2019).
25. Jiménez-López, J.; Ortega-Barrales, P.; Ruiz-Medina, A. A photochemically induced fluorescence basedflow-through optosensor for screening of nitenpyram residues in cruciferous vegetables. Food Addit. Contam.Part. A 2018, 35, 941–949. [CrossRef] [PubMed]
26. Jeria, Y.; Bazaes, A.; Báez, M.E.; Espinoza, J.; Martínez, J.; Fuentes, E. Photochemically induced fluorescencecoupled to second-order multivariate calibration as analytical tool for determining imidacloprid in honeybees.Chemom. Intell. Lab. Syst. 2017, 160, 1–7. [CrossRef]
27. Lu, Z.; Challis, J.K.; Wong, C.S. Quantum yields for direct photolysis of neonicotinoid insecticides in water:Implications for exposure to nontarget aquatic organisms. Environ. Sci. Technol. Lett. 2015, 2, 188–192.[CrossRef]
28. Ruiz-Medina, A.; Soler-Gallardo, M.I.; Llorent-Martínez, E.J. Enhanced quenching effect of neonicotinoidpesticides on time-resolved terbium luminescence in presence of surfactants. J. Chem. 2018. [CrossRef]
29. Skovgaard, M.; Encinas, S.R.; Jensen, O.C.; Andersen, J.H.; Condarco, G.; Jørs, E. Pesticide residues incommercial lettuce, onion, and potato samples from Bolivia–A threat to public health? Environ. Health Insights2017, 11, 1–8. [CrossRef] [PubMed]
30. González, A.G.; Herrador, M.A.; Asuero, A.G. Intra-laboratory testing of method acccuracy fromrecovery assays. Talanta 1999, 48, 729–736. [CrossRef]
© 2019 by the authors. Licensee MDPI, Basel, Switzerland. This article is an open accessarticle distributed under the terms and conditions of the Creative Commons Attribution(CC BY) license (http://creativecommons.org/licenses/by/4.0/).
Related Documents