Appendix H4 Evaluation of RESL Biota Sampling

Welcome message from author
This document is posted to help you gain knowledge. Please leave a comment to let me know what you think about it! Share it to your friends and learn new things together.
Transcript

Appendix H4
Evaluation of RESL Biota Sampling

CONTENTS
ABSTRACT . . . . . . . . . . . . . . . . . . . . . . . . . . . . . . . . . . . . . . . . . . . . . . . . . . . . . . . . . . . . . . . . . . . . . . . . . . . . . . . . . . . . . . . . . . . . . . . . . . . . . . . . . . . . . . . . . . . . . . . . ...............
ACRONYMS . . . . . . . . . . . . . . . . . . . . . . . . . . . . . . . . . . . . . . . . . . . . . . . . . . . . . . . . . . . . . . . . . . . . . . . . . . . . . . . . . . . . . . . . . . . . . . . . . . . . . . . . . . . . . . . . . . . . . . . . .............
INTRODUCTION . . . . . . . . . . . . . . . . . . . . . . . . . . . . . . . . . . . . . . . . . . . . . . . . . . . . . . . . . . . . . . . . . . . . . . . . . . . . . . . . . . . . . . . . . . . . . . . . . . . . . . . . . . . . . . . . . . . . . . . . ......
STUDY AREA . . . . . . . . . . . . . . . . . . . . . . . . . . . . . . . . . . . . . . . . . . . . . . . . . . . . . . . . . . . . . . . . . . . . . . . . . . . . . . . . . . . . . . . . . . . . . . . . . . . . . . . . . . . . . . . . . . . . . . . . ...........
METHOD . . . . . . . . . . . . . . . . . . . . . . . . . . . . . . . . . . . . . . . . . . . . . . . . . . . . . . . . . . . . . . . . . . . . . . . . . . . . . . . . . . . . . . . . . . . . . . . . . . . . . . . . . . . . . . . . . . . . . . . . ...................
TISSUE CONCENTRATION PROM SOIL EXPOSURE . . . . . . . . . . . . . . . . . . . . . . . . . . . . . . . . . . . . . . . . . . . . . . . . . . . . . . . . . . . . . . .
WATER INGESTION . . . . . . . . . . . . . . . . . . . . . . . . . . . . . . . . . . . . . . . . . . . . . . . . . . . . . . . . . . . . . . . . . . . . . . . . . . . . . . . . . . . . . . . . . . . . . . . . . . . . . . . . . . . . . . . . . . . . . . .
SPECIES PARAMETER INPUT VALUES . . . . . . . . . . . . . . . . . . . . . . . . . . . . . . . . . . . . . . . . . . . . . . . . . . . . . . . . . . . . . . . . . . . . . . . . . . . . . . . . . . . . . .
LIMITATIONS . . . . . . . . . . . . . . . . . . . . . . . . . . . . . . . . . . . . . . . . . . . . . . . . . . . . . . . . . . . . . . . . . . . . . . . . . . . . . . . . . . . . . . . . . . . . . . . . . . . . . . . . . . . . . . . . . . . . . . . . ..........
CONCLUSIONS . . . . . . . . . . . . . . . . . . . . . . . . . . . . . . . . . . . . . . . . . . . . . . . . . . . . . . . . . . . . . . . . . . . . . . . . . . . . . . . . . . . . . . . . . . . . . . . . . . . . . . . . . . . . . . . . . . . . . . . . ........
REFERENCES . . . . . . . . . . . . . . . . . . . . . . . . . . . . . . . . . . . . . . . . . . . . . . . . . . . . . . . . . . . . . . . . . . . . . . . . . . . . . . . . . . . . . . . . . . . . . . . . . . . . . . . . . . . . . . . . . . . . . . . . ...........
Attachment l-Article Abstracts Used in the Study
1.
3 I.
3.
4.
5.
6.
TABLES
Species Parameter Input Valuesa used for TRA . . . . . . . . . . . . . . . . . . . . . . . . . . . . . . . . . . . . . . . . . . . . . . . . . . . . . . . . . . . . . . . . . . . . . .
Species Parameter Input Valuesa used for ICPP . . . . . . . . . . . . . . . . . . . . . . . . . . . . . . . . . . . . . . . . . . . . . . . . . . . . . . . . . . . . . . . . . . . . . .
Radionuclide Input Values used for TRA . . . . . . . . . . . . . . . . . . . . . . . . . . . . . . . . . . . . . . . . . . . . . . . . . . . . . . . . . . . . . . . . . . . . . . . . . . . . . . . .
Radionuclide Input Values used for ICPP . . . . . . . . . . . . . . . . . . . . . . . . . . . . . . . . . . . . . . . . . . . . . . . . . . . . . . . . . . . . . . . . . . . . . . . . . . . . . . .
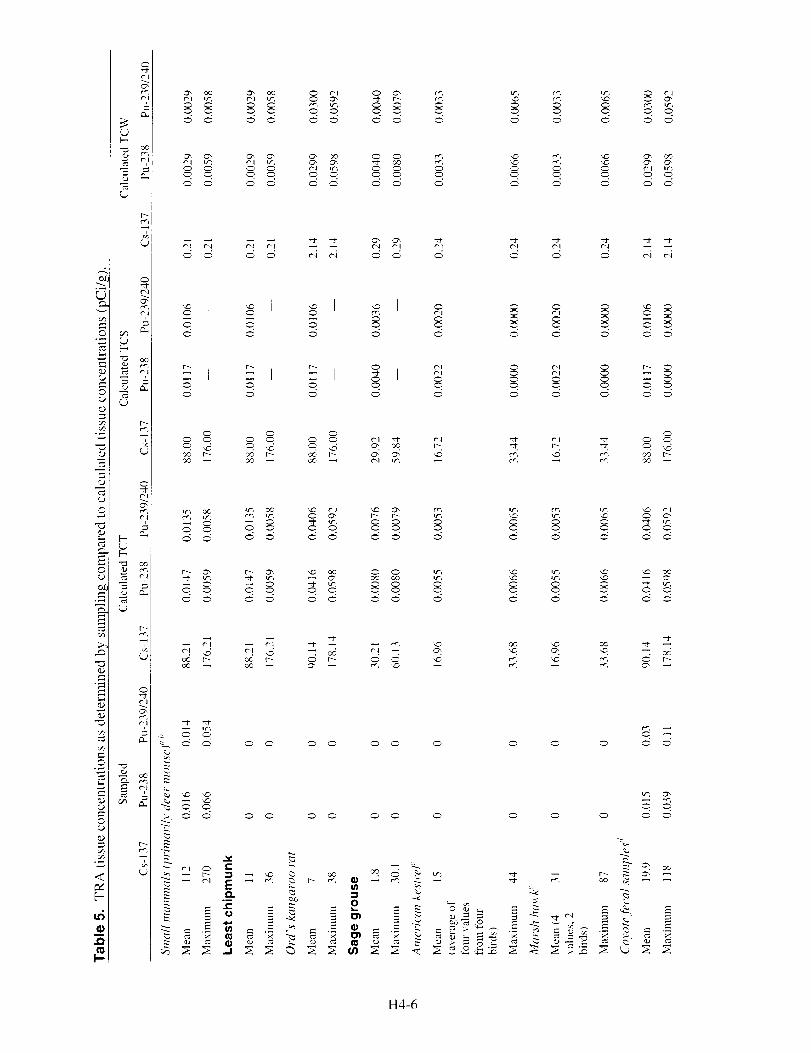
TRA tissue concentrations as determined by sampling compared to calculated tissue concentrations (pCi/o) a . . . . . . . . . . . . . . . . . . . . . . . . . . . . . . . . . . . . . . . . . . . . . . . . . . . . . . . . . . . . . . . . . . . . . . . . . . . . . . . . . . . . . . . . . . . . . . . . . . . . . . . . . . . . . .
ICPP tissue concentrations as determined by sampling compared to calculated tissue concentrations (pCi/g) . . . . . . . . . . . . . . . . . . . . . . . . . . . . . . . . . . . . . . . . . . . . . . . . . . . . . . . . . . . . . . . . . . . . . . . . . . . . . . . . . . . . . . . . . . . . . . . . . . . . . . . . . . . . . .
i
ii
H4-1
H4-1
H4-2
H4-2
H4-3
H4-3
H4-9
H4-9
H4-10
H4-4
H4-4
H4-5
H4-5
H4-6
H4-8

Appendix H4
Evaluation of RESL Biota Sampling
ABSTRACT
As a consequence of past activities, radionuclides with the potential to adversely affect ecological receptors have been released into the environment at the Idaho National Engineering and Environmental Laboratory (INEEL). Food web modeling was used to calculate the potential exposure of terrestrial ecological receptors to contaminant concentrations in various media for risk assessment purposes. The accuracy of an exposure model depends on the accuracy of the input parameter values and the validity of the model’s structure (i.e., the degree to which it represents the actual relationships among parameters at the site). The calibration and evaluation of modeling with site- and contaminant-specific data is critical to adequate risk characterization and interpretation in the risk assessment process. Site-specific field measurements of tissue residue levels (concentrations) are the most reliable means to calibrate model outputs or intermediate calculations. The Environmental Science and Research Foundation was tasked with evaluating the concentrations of radionuclides in terrestrial biota at the INEEL. The Foundation-sponsored studies resulted in a collection of radionuclide tissue concentrations in avian and mammalian receptors. One area that was extensively studied was a group of radioactive leaching ponds. The actual tissue concentration data collected were then compared to the calculated values to evaluate the terrestrial food web modeling used at the INEEL.
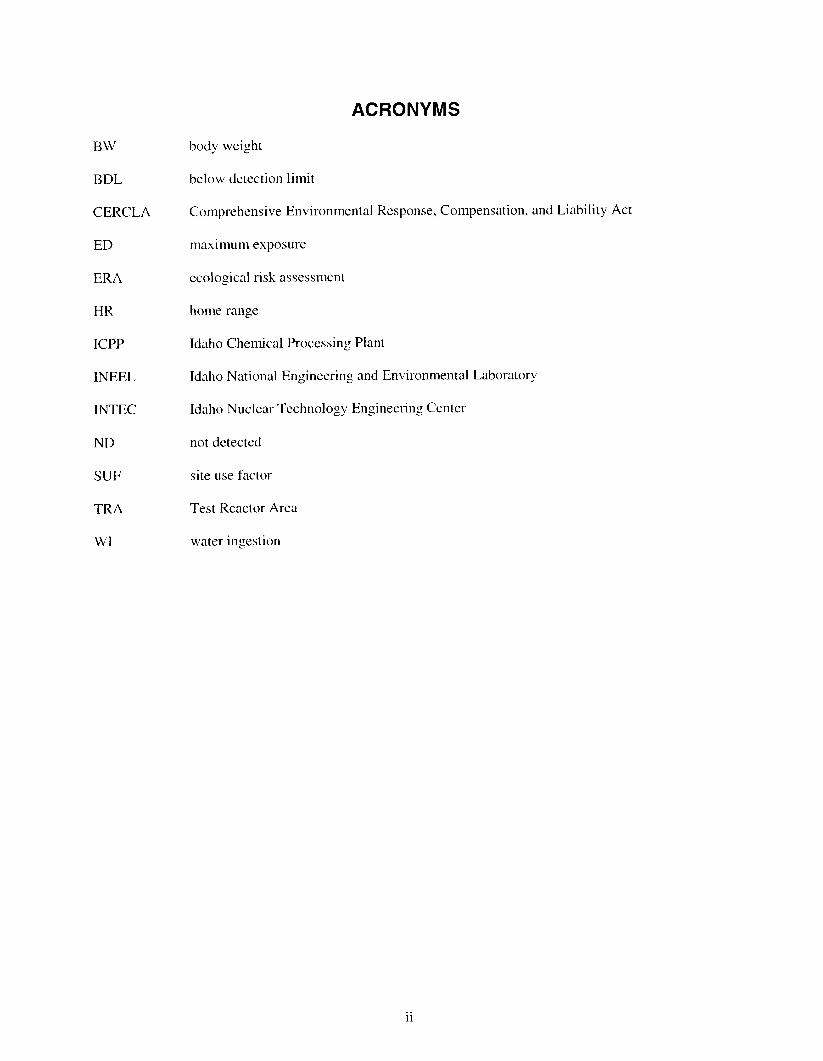
ACRONYMS
BW
BDL
CERCLA
ED
ERA
HR
ICPP
INEEL
INTEC
ND
SUF
TRA
WI
body weight
below detection limit
Comprehensive Environmental Response, Compensation, and Liability Act
maximum exposure
ecological risk assessment
home range
Idaho Chemical Processing Plant
Idaho National Engineering and Environmental Laboratory
Idaho Nuclear Technology Engineering Center
not detected
site use factor
Test Reactor Area
water ingestion

INTRODUCTION
Ecological risk assessment is the process of determining the potential for adverse effects from contaminants on ecological receptor populations and protected wildlife species (individuals and populations). Radionuclide contaminated sites have been identified as part of the CERCLA process at the INEEL. In the absence of radionuclide concentration in receptor tissue, modeling has been conducted to screen sites of concern for ecological receptors. This type of modeling uses conservative assumptions to ensure that the risk assessment results are protective of the receptor.
The INEEL site is typical of cold desert ecosystems and has limited available surface water. Man- made ponds, used to dispose of waste at the INEEL, provide a unique resource to cold desert species. They also provide a habitat for species that would not normally be present in this environment. Exposure modeling of native terrestrial species inhabiting facilities has been limited, because most of the man-made ponds are being remediated and no longer pose concern. It is important to evaluate the exposure modeling that was performed at these sites for adequate risk characterization in the ERA process. Additionally, a better understanding of exposure to terrestrial species in this environment will support the evaluation of new ponds at active facilities and support direction of long-term monitoring of existing ponds at the INEEL.
The Environmental Science and Research Foundation (the Foundation) has conducted numerous radioecological and descriptive ecological studies on the INEEL. Through these efforts, over 50 reports or papers characterizing the extent of contaminant movement have been produced and are considered useful for ERA. Thirty-six of these are useful for describing the nature and extent of contamination in the environment. Those papers used in this report can be found in Attachment 1.
This paper will evaluate the usefulness of using existing data in the reconstruction of exposure to terrestrial species at the INEEL and compare modeled exposure used in the screening risk assessment to actual data collected to identify data gaps, and direct future research.
STUDY AREA
During the late 70s and early 80s the Test Reactor Area (TRA) was extensively studied by Foundation researchers as was the Idaho Chemical Processing Plant (ICPP) now known as the Idaho Nuclear Technology Engineering Center (INTEC).
Terrestrial biota (and other material) sampled at these sites and the dates of the sampling include:
0 coyote fecal materials ( 1978-1979),
0 small mammals (primarily deer mice) (197%1979),
0 mourning dove ( 1974- 1977),
0 sage grouse ( 1977- 1980),
a barn swallow (1975-1978),
0 American kestrel and marsh hawk (1976),
0 antelope ( 1972- 1976),
H4-1

0 long-eared owl ( 1976).
The data used in this evaluation were collected from studies performed at the TRA radioactive leaching ponds and ICPP. At TRA, a complex of three ponds was used for disposal of low-level radioactive wastes from three l ight-water-moderated and cooled reactors. The first of the three ponds was dug in 1952 (pond 1) and a second pond was dug in 1957 (pond 2). The two ponds constituted a continuous body of water approximately 0.82 ha in area with a mean depth of 3 m . The third pond (0.93 ha) was excavated in 1964 (pond 3). The waste water was pumped into ponds 1 and 2 where it m ixed with previously accumulated water and, if necessary, f lowed through an overflow flume to pond 3. Pond 3 was nearly filled to capacity (2 m deep) in late 1969 and 1970. A marshy area developed in pond 3 (approximately 0.13 ha). The size of this area fluctuated and was dry during 1970. It has been estimated that approximately 48,880 Ci of beta-gamma activity were released to the ponds from the time of construction to 1978 (EG&G 1979). The leaching ponds were remediated in 1993 and were replaced by lined evaporative ponds. These new ponds are currently being mon itored by the Foundation. The ICPP was used to dissolve and recover uranium from spent nuclear fuel and solidify the resultant liquid waste. Trace amounts of radionuclides are atmospherically released as a result of these operations.
METHOD
Foundat ion studies at the TRA radioactive leaching ponds and ICPP were evaluated for applicability to this process. From this preliminary evaluation, only Cs- 137, Pu-238 and Pu-339/340 were adequately sampled. Data presented from both abiotic and biotic med ia were used to perform the evaluation. The Foundat ion abstracts are attached to this report, as are summarized tissue concentration data.
The exposure mode ls used in the screening ERAS were used to calculate tissue concentrations for the measured terrestrial species from existing abiotic med ia concentrations. These calculated concentrations was compared to actual data collected by the Foundation.
TISSUE CONCENTRATION FROM SOIL EXPOSURE
For screening purposes, tissue concentrations from exposure to soil were simplistically calculated by assuming that the steady-state whole body concentration is equivalent to the steady-state concentration of radionuclides in reproductive organs using the equation:
TCS= CS x CF x ED x SUF
where:
TCS =
ED =
tissue radionuclide concentration from exposure to contaminated soil (pCi/g)
exposure duration (fraction of year spent in affected area)(unitless)
cs = concentration of the radionuclide in the soil (pCi/g)
CF = concentration factor (unitless)
SUF = site area divided by home range up to 1 (unitless).
H4-2
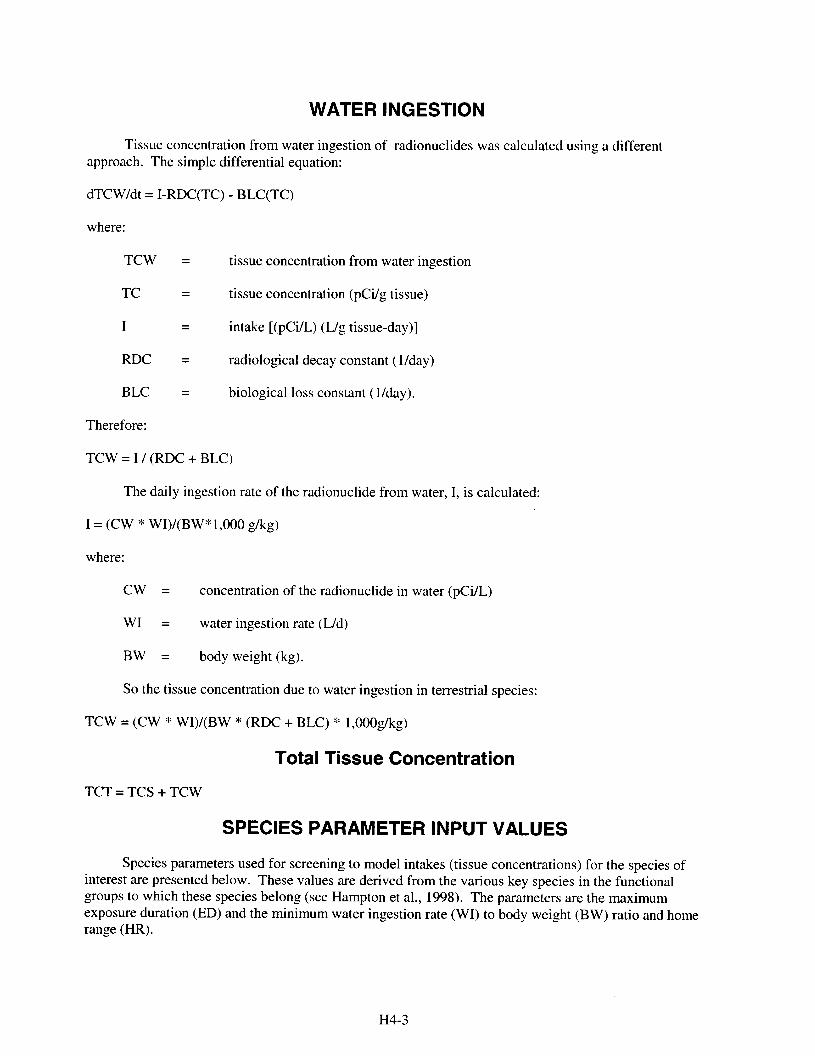
WATER INGESTION
Tissue concentration from water ingestion of radionuclides was calculated using a different approach. The simple differential equation:
dTCW/dt = I-RDC(TC) - BLC(TC)
where:
TCW = tissue concentration from water ingestion
TC = tissue concentration (pCi/g tissue)
I = intake [(PC&) (L/g tissue-day)]
RDC = radiological decay constant (l/day)
BLC =
Therefore:
biological loss constant (l/day).
TCW = I / (RDC + BLC)
The daily ingestion rate of the radionuclide from water, I, is calculated:
I = (CW tic WI)/(BW*l,OOO g/kg)
where:
cw = concentration of the radionuclide in water (pCi/L)
WI = water ingestion rate (L/d)
BW = body weight (kg).
So the tissue concentration due to water ingestion in terrestrial species:
TCW = (CW :i: WI)/(BW * (RDC + BLC) *: l,OOOg/kg)
Total Tissue Concentration
TCT = TCS + TCW
SPECIES PARAMETER INPUT VALUES
Species parameters used for screening to model intakes (tissue concentrations) for the species of interest are presented below. These values are derived from the various key species in the functional groups to which these species belong (see Hampton et al., 1998). The parameters are the maximum exposure duration (ED) and the minimum water ingestion rate (WI) to body weight (BW) ratio and home range (HR).
H4-3
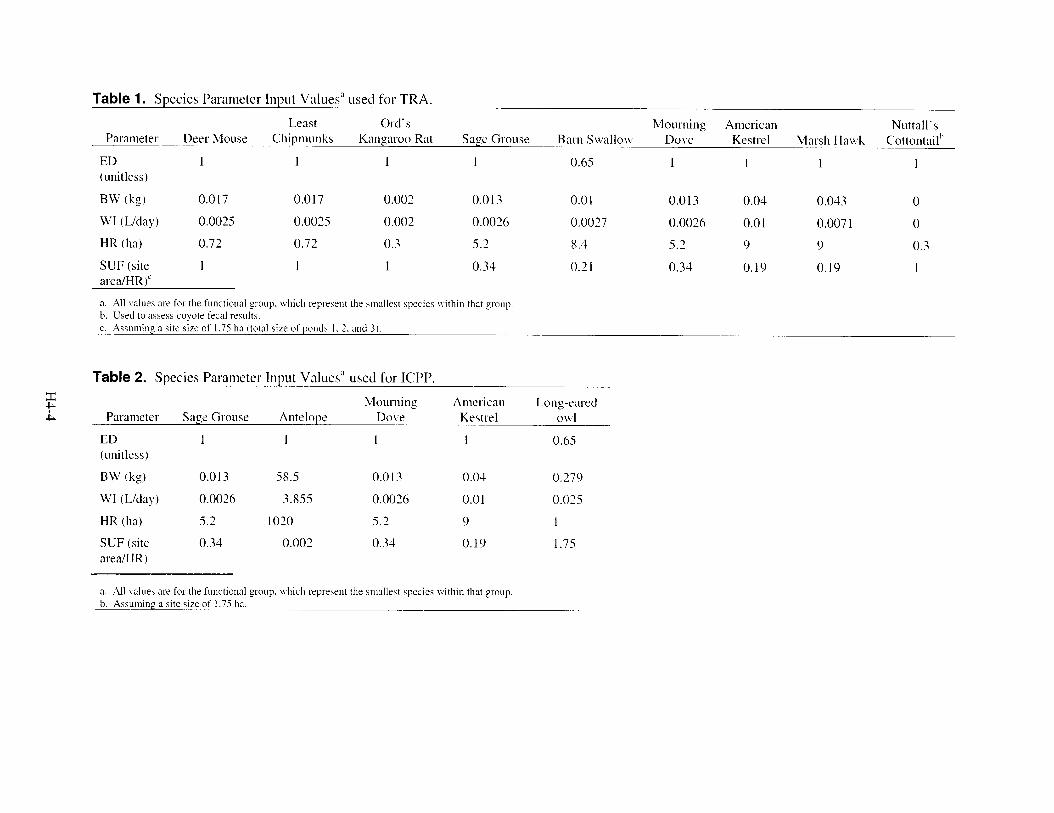
Table 1. Species Parameter Input Values” used for TRA.
Least Ord’ s Mourning American Nuttall’s Parameter Deer Mouse Chipmunks Kangaroo Rat Sage Grouse Barn Swallow Do\re Kestrel Marsh Hawk Cottontail”
ED 1 1 1 1 0.65 1 1 1 1 (witless)
BW (kg)
WI (L/day)
HR (ha)
SUF (site area/HR)’
0.017 0.017 0.002 0.013 0.01 0.013 0.04 0.043 0
0.0025 0.0025 0.002 0.0026 0.0027 0.0026 0.01 0.007 1 0
0.72 0.72 0.3 5.2 8.4 5.2 9 9 0.3
1 1 1 0.34 0.21 0.34 0.19 0.19 1
a. All 1 alues are for the functional goup. which represent the smallest speck \vithin that group. b. Used to assess coyote fecal results. c. Assuming a site size of 1.75 ha (total size of ponds 1, 2. and 3).
Table 2. Species Parameter Input Value? used for ICPP.
E Mourning American Long-eared k Parameter Sage Grouse Antelope Dove Kestrel owl
ED 1 1 1 1 0.65 (witless)
BW (kg) 0.013 58.5 0.013 0.04 0.279
WI (L/day) 0.0026 3.855 0.0026 0.01 0.025
HR (ha) 5.2 1020 5.2 9 1
SUF (site 0.34 0.002 0.34 0.19 1.75 are,a/HR)
a. All values me for the functional group. wkich reprerent the smallest species nithin that group. b. Ascunling a site size of 1.75 ha.

Table 3. Radionuclide Input Values used for TRA.
Parameter cs-137 Pu-238 Pu-239/240
CF RBCb
BLC’
Average concentration in waterC
Maximum concentration in water
Sediment (mean)
Average concentration in soild
Maximum concentration in soil”
8.00E-0 1
6.3 1 E-05
1.90E-03
2.8
2.8
22000
110
220
4SOE-04 4.50E-04
2.16E-05 7.78E-08
3.80E-04 3.8OE-04
0.008 0.0076
0.016 0.015
94 108
26.1 23.5
0 0
a. Concentration factors are from IAEA ( 1994) for Cs- I37 and EPA ( 1989) for plutonium. b. RBC and BLC from Whicker and Schultz (1982). c. Cs- 137 from (Millard et al., 1978), Pu-238,239/240 (highest average reported from pond 1 and 2, maximum was estimated from the mean + 2SD) from Ibrahim and Culp ( 1989). d. Used range of Cs- 137 soil concentrations reported as unpublished data from RESL, 197 1 to 1990 (VanHorn et al., 1996). The average was calculated by taking the medium of the values observed (0 to 230 pCi/g). Pu-238 and Pu-239/240 values are as reported in Halford ( 1987). No range or SD was reported.
Table 4. Radionuclide InDut Values used for ICPP.
Parameter cs-137 Pu-238 Pu-239/240
CF”
RBCb
BLCb
Average concentration in wate?
Maximum concentration in water
Sediment (mean)
Average concentration in soild
Maximum concentration in soil”
8 .OOE-0 1
6.3 lE-05
1.90E-03
0.115
0.360
57.3
6.24
199
4.5OE-04
2.16E-05 . 3.80E-04
0.38 1
1.365
8.48
0.02 1
0.387
4.5OE-04
7.78E-08
3.80E-04
0.018
0.076
0.39
0.018
0.073
a. Concentration factors are from IAEA ( 1994) for Cs- 137 and EPA ( 1989) for plutonium. b. RBC and BLC from Schultz and Whicker (1982). c. Values for water concentrations were calculated using sediment concentrations from sampling done at the percolation ponds on 717194. d. Used range of Cs-137 soil concentrations reported as unpublished data from RESL, 1971 to 1990 (VanHorn et al. 1996).
H4-5
s 5
H4-6

Table 5. (continued). Sampled Calculated TCT Calculated TCS Calculated TCW
cs-137
Barn swallowsh*f
Pu-238 Pu-239/240 cs-137 Pu-238 Pu-2391240 cs-137 Pu-238 Pu-239/240 cs-137 Pu-238 Pu-2391240
Mean 172 0 0 12.30 0.0056 0.0054 12.01 0.0016 0.0014 0.29 0.0040 0.0040
Maximum 254
Mourning dowsf 0 0 24.3 1 0.0080 0.0079 24.02 0.0000 0.0000 0.29 0.0080 0.0079
Mean 75.8 0 0 30.2 1 0.0080 0.0076 29.92 0.0040 0.0036 0.29 0.0040 0.0040
Maximum 430 0 0 60.13 0.0080 0.0079 59.84 0.0000 0.0000 0.29 0.0080 0.0079
a. Deer mouse tissue concentration for Cs-137 from Arthur and Markham (1982), other values for small mammals and deer mice are from Halford (1987). b. Used the maximum = mean + 2SD. c. Assumed that Cs-137 was the primary contributor to tissue concentration as stated (Craig et al., 1979). d. Coyote fecal samples were assessed as rabbit. e. Used the highest maximum and mean from all age groups. f. Used the highest maximum and mean from all years.

H4-8
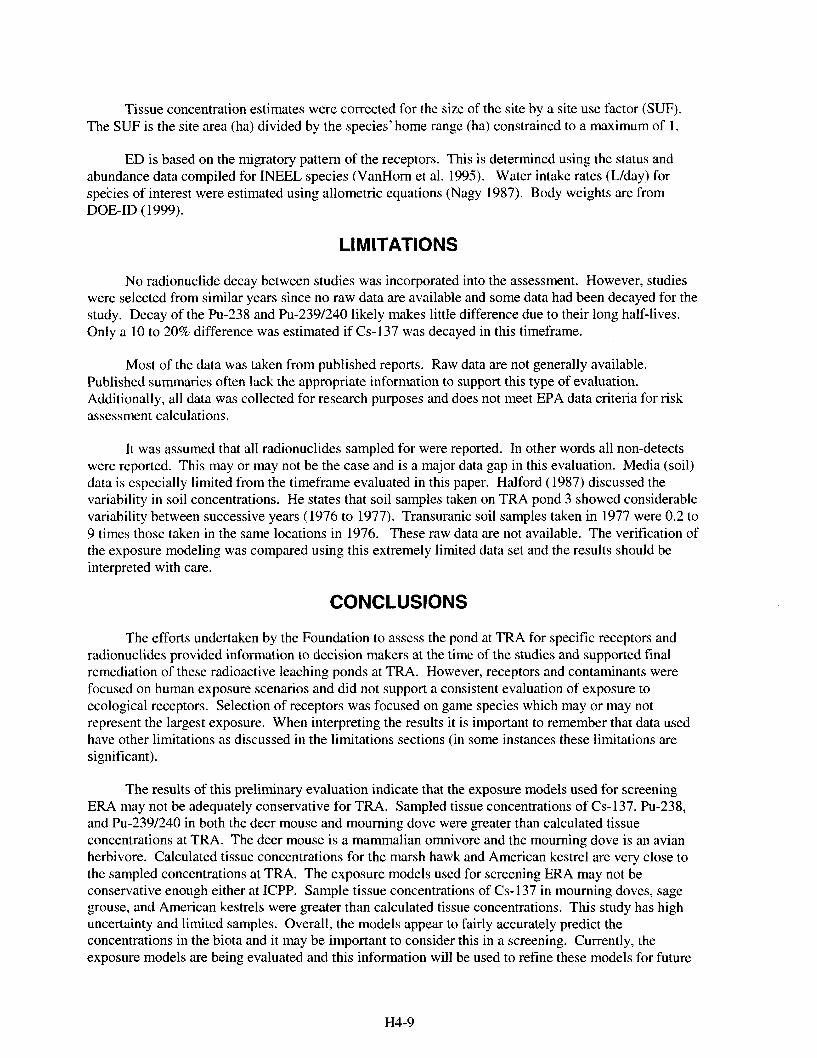
Tissue concentration estimates were corrected for the size of the site by a site use factor (SUF). The SUF is the site area (ha) divided by the species’ home range (ha) constrained to a maximum of 1.
ED is based on the migratory pattern of the receptors. This is determined using the status and abundance data compiled for INEEL species (VanHorn et al. 1995). Water intake rates (L/day) for species of interest were estimated using allometric equations (Nagy 1987). Body weights are from DOE-ID ( 1999).
LIMITATIONS
No radionuclide decay between studies was incorporated into the assessment. However, studies were selected from similar years since no raw data are available and some data had been decayed for the study. Decay of the Pu-238 and Pu-239/240 likely makes little difference due to their long half-lives. Only a 10 to 20% difference was estimated if Cs- 137 was decayed in this timeframe.
Most of the data was taken from published reports. Raw data are not generally available. Published summaries often lack the appropriate information to support this type of evaluation. Additionally, all data was collected for research purposes and does not meet EPA data criteria for risk assessment calculations.
It was assumed that all radionuclides sampled for were reported. In other words all non-detects were reported. This may or may not be the case and is a major data gap in this evaluation. Media (soil) data is especially limited from the timeframe evaluated in this paper. Halford (1987) discussed the variability in soil concentrations. He states that soil samples taken on TRA pond 3 showed considerable variability between successive years (1976 to 1977). Transuranic soil samples taken in 1977 were 0.2 to 9 times those taken in the same locations in 1976. These raw data are not available. The verification of the exposure modeling was compared using this extremely limited data set and the results should be interpreted with care.
CONCLUSIONS
The efforts undertaken by the Foundation to assess the pond at TRA for specific receptors and radionuclides provided information to decision makers at the time of the studies and supported final remediation of these radioactive leaching ponds at TRA. However, receptors and contaminants were focused on human exposure scenarios and did not support a consistent evaluation of exposure to ecological receptors. Selection of receptors was focused on game species which may or may not represent the largest exposure. When interpreting the results it is important to remember that data used have other limitations as discussed in the limitations sections (in some instances these limitations are significant).
The results of this preliminary evaluation indicate that the exposure models used for screening ERA may not be adequately conservative for TRA. Sampled tissue concentrations of Cs-137, Pu-238, and Pu-239/240 in both the deer mouse and mourning dove were greater than calculated tissue concentrations at TRA. The deer mouse is a mammalian omnivore and the mourning dove is an avian herbivore. Calculated tissue concentrations for the marsh hawk and American kestrel are very close to the sampled concentrations at TRA. The exposure models used for screening ERA may not be conservative enough either at ICPP. Sample tissue concentrations of Cs- 137 in mourning doves, sage grouse, and American kestrels were greater than calculated tissue concentrations. This study has high uncertainty and limited samples. Overall, the models appear to fairly accurately predict the concentrations in the biota and it may be important to consider this in a screening. Currently, the exposure models are being evaluated and this information will be used to refine these models for future
H4-9
assessments. This evaluation will also be useful to help direct future characterization and long-term monitoring sampling.
The new ponds at TRA are currently being evaluated by the Foundation and this preliminary evaluation should provide information at direct future studies. INTEC is also currently installing new percolation ponds. Studies should be directed to provide new information on these pond systems containing radionuclides, fill gaps in knowledge, and support decision making concerning the new TRA and INTEC pond complexs and other similar effluent ponds.
REFERENCES
Arthur, W. J., III, and 0. D. Markham, 1982, “Radionuclide Export and Elimination by Coyotes at Two Radioactive Waste Disposal Areas in Southeastern Idaho,” Health Physics, 43, pp. 493-500.
Craig, T. H., D. K. Halford, and 0. D. Markham, 1979. “Radionuclide Concentrations in Nestling Raptors Near Nuclear Facilities,” Wilson Bulletin, 91, pp. 72-77.
Connelly, J. W., and 0. D. Markham, 1983, “Movements and Radionuclide Concentrations of Sage Grouse in Southeastern Idaho,” Journal cf Wildlife Mauagcment, 47, pp. 169-l 77.
DOE-ID 1999, Work Plan for Waste Area Groups 6 and IO Operable Unit I O-04 Camp-ehemi\~e Remedial Investigation/Feasibility Study, DOE-ID- 10554, Revision 0, April 1999.
Halford, D. K., 1987, “Density, Movement, and Transuranic Tissue Inventory of Small Mammals at a Liquid Radioactive Waste Disposal Area,” Proceedings of the S>wzposium on Emil-ormen tal Research on Actinide Elements, CONF-860087 13, pp. 147- 156.
Hampton, N.L., Morris, R.C., and VanHorn, R.L., 1998. Methodology for screening-level ecological risk assessments for hazardous waste sites. Part II: grouping ecological components. Int. J. Environment and Pollution, Vol. 9, No. 1, 1998.
Ibrahim, S., and T. Culp, 1989, “Plutonium Distribution and Oxidation States in a Reactor Leaching Ponds System,” Health Physics, 57, pp. 607-6 14.
Markham, 0. D., D. K. Halford, R. E. Autenrieth and R. L. Dickson, 1982, “Radionuclides in Pronghorn Resulting from Nuclear Fuel Reprocessing and Worldwide Fallout,” Journal of Wildlife Managenzent, 46, pp. 30-42.
Markham, 0. D., and D. K. Halford, 1982, “Radionuclides in Mourning Doves Near a Nuclear Facility Complex in Southeastern Idaho,” Wilson Bulletill, 94, pp. 185-197.
Markham, 0. D., and D. K. Halford, 1985, ” Effects of Decreased Effluents from Nuclear Fuel Reprocessing on “7Cs Concentrations in Wildlife,” Northwest Scierzce, Vol. 59, No. 3, pp. 180- 184.
Millard, J. B., F. W. Whicker, and 0. D. Markham, 1990, “Radionuclide Uptake and Growth of Barn Swallows Nesting by Radioactive Leaching Ponds,” Health Physics, 58, pp. 429439.
Nagy, K.A., 1987. “Field metabolic Rate and Food Requirement Scaling in Mammals and Birds,” Ecological Monograph, 57: 1 1 l- 128.
H4-10
VanHorn, R.L., Hampton, N.L., and Morris, R.C. ( 1995) Draft Guidance Manual for Conducting Screening Level Ecological Risk Assessment at the INEL, Idaho National Engineering Laboratory, EG&G Idaho, Inc., Idaho Falls, ID, INEL-95/0190, April, 1995.
Whicker, F. W., and V. Schultz, 1982, Radioecology: Nuclear Energy and the Environment, CRC Press, Inc., Boca Raton, FL.
H4-11
Attachment 1
Article Abstracts Used in the Study
Attachment 1
Article Abstracts Used in the Study
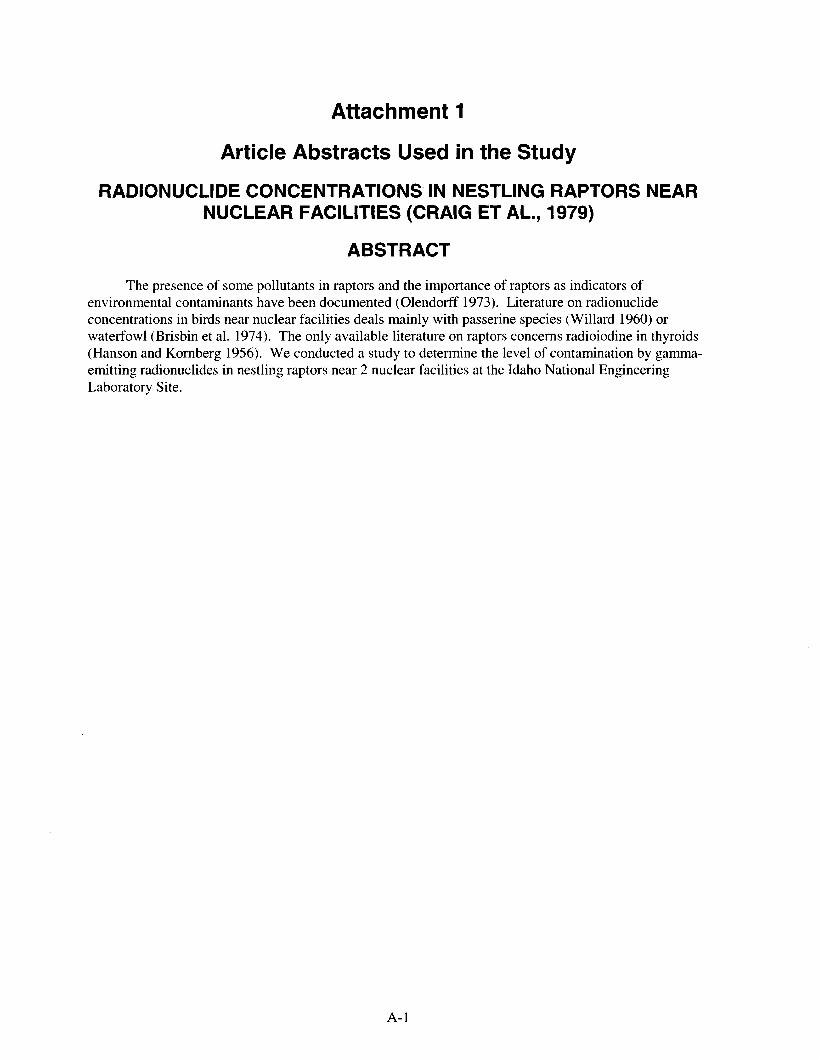
RADIONUCLIDE CONCENTRATIONS IN NESTLING RAPTORS NEAR NUCLEAR FACILITIES (CRAIG ET AL., 1979)
ABSTRACT
The presence of some pollutants in raptors and the importance of raptors as indicators of environmental contaminants have been documented (Olendorff 1973). Literature on radionuclide concentrations in birds near nuclear facilities deals mainly with passerine species (Willard 1960) or waterfowl (Brisbin et al. 1974). The only available literature on raptors concerns radioiodine in thyroids (Hanson and Kornberg 1956). We conducted a study to determine the level of contamination by gamma- emitting radionuclides in nestling raptors near 2 nuclear facilities at the Idaho National Engineering Laboratory Site.
A-l

A-2
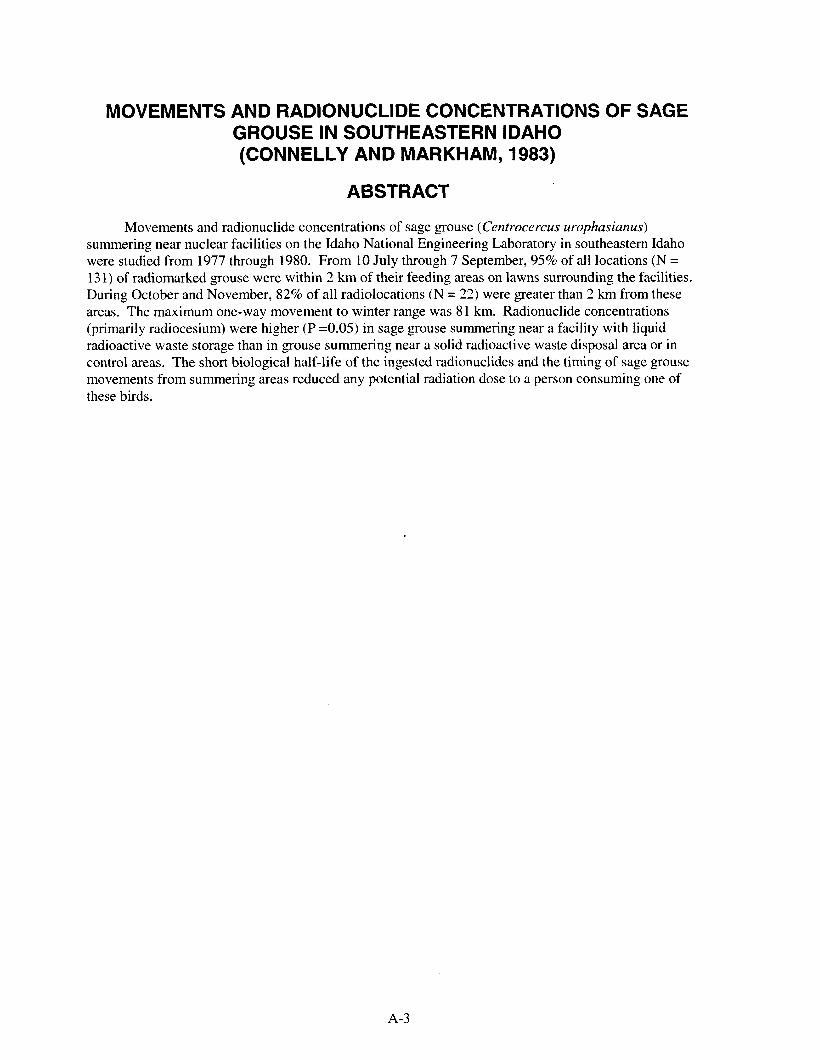
MOVEMENTS AND RADIONUCLIDE CONCENTRATIONS OF SAGE GROUSE IN SOUTHEASTERN IDAHO (CONNELLY AND MARKHAM, 1983)
ABSTRACT
Movements and radionuclide concentrations of sage grouse (Centrocercus urophasianus) summering near nuclear facilities on the Idaho National Engineering Laboratory in southeastern Idaho were studied from 1977 through 1980. From 10 July through 7 September, 95% of all locations (N = 13 1) of radiomarked grouse were within 2 km of their feeding areas on lawns surrounding the facilities, During October and November, 82% of all radiolocations (N = 22) were greater than 2 km from these areas. The maximum one-way movement to winter range was 8 1 km. Radionuclide concentrations (primarily radiocesium) were higher (P =O.OS) in sage grouse summering near a facility with liquid radioactive waste storage than in grouse summering near a solid radioactive waste disposal area or in control areas. The short biological half-life of the ingested radionuclides and the timing of sage grouse movements from summering areas reduced any potential radiation dose to a person consuming one of these birds.
A-3
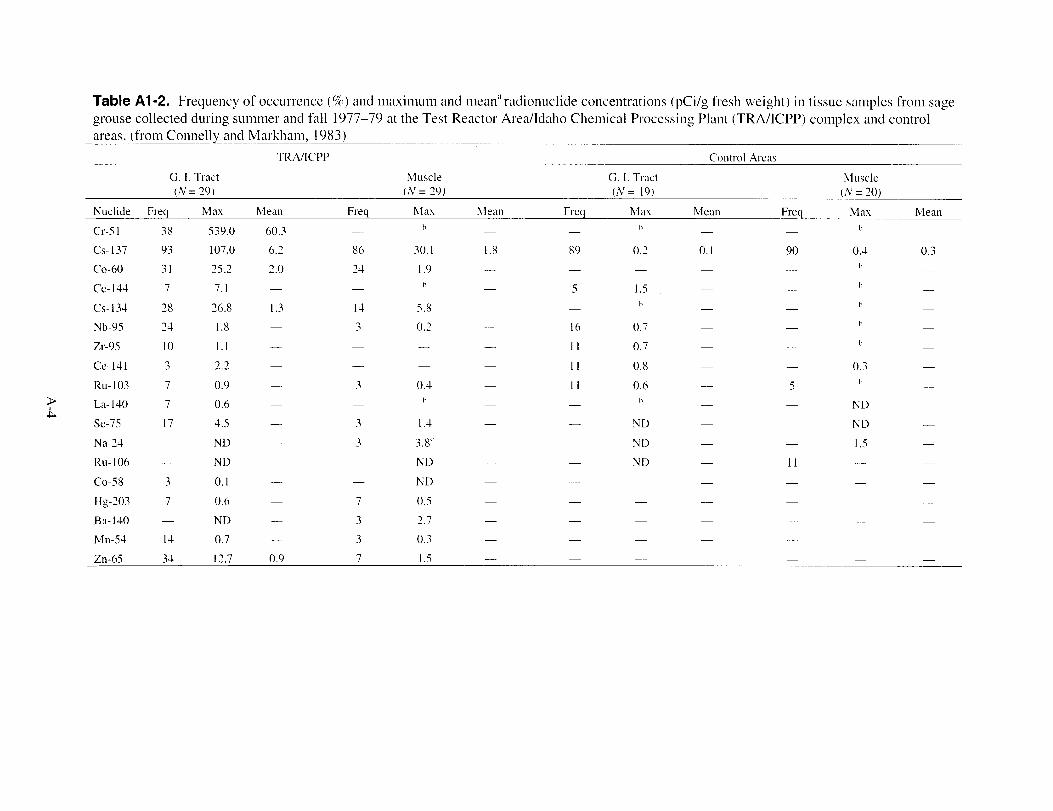
Table Al -2. Frequency of occurrence (5%) and nlaximum and mean” radionuclide concentrations (pCi/g fresh weight) in tissue samples from sage grouse collected during summer and fall 1977-79 at the Test Reactor Area/Idaho Chemical Processing Plant (TRA/ICPP) complex and control areas. (from Connelly and Markham, 1983)
TRA/ICPP Control Areas
G. I. Tract Muscle G. I. Tract Muscle (N = 29) (N = 29) (N= 19) (N = 20)
Nuclide Freq Max Mean Freq hklX hlean Freq Max Mean Freq Max Mean Cr-5 1 38 539.0 60.3 h h h - - - - -
cs-137 93 107.0 6.2 86 30.1 1.8 89 0.3 0.1 90 0.4 0.3 Co-60 31 -_ 35 .^ ’ 2.0 24 1.9 h - - - -
Ce- 144 7 7.1 h - - - 5 1.5 h - - -
cs-134 28 26.8 1.3 I4 5.8 h h - - - - - Nb-95 24 1.8 - 3 0.2 - 16 0.7 h -
Zr-9s 10 1.1 11 0.7 11 - - - - -
Ce-141 3 2.2 - - - 11 0.8 - - 0.3 -
Ru-103 7 0.9 - 3 0.4 11 0.6 h - 5 -
La-140 7 0.6 11 h - - - ND -
Se-75 17 4.5 - 3 I.4 - ND - ND -
Na-24 ND - 3 3.8’ - - ND - - 1.5 -
Ru-106 - ND - - ND - - ND - 11 - -
Co-58 3 0.1 - - ND - - - - - -
Hg-203 7 0.6 - 7 0.5 - - - -
Ba-140 ND - 3 2.7 - - - - - Mn-54 I4 0.7 - 3 0.3 - - - - - -
Zn-65 34 12.7 0.9 7 1.5 - - - - -
DENSITY, MOVEMENT, AND TRANSURANIC TISSUE INVENTORY OF SMALL MAMMALS AT A LIQUID RADIOACTIVE WASTE DISPOSAL
AREA (HALFORD, 1987)
ABSTRACT
Linear movement, density, and transuranic radionuclide inventory were estimated for small mammals residing at a liquid radioactive waste disposal area in southeastern Idaho. Deer mice (Peromyscus maniculatus), kangaroo rats (Dipodomys ordii), western harvest mice (Reithrodontomys megalotis), and Great Basin pocket mice (Perognathus pawus) were the predominant species. The total small mammal population within the 3.0-ha waste area was estimated to be 93. The distance between consecutive captures for all species combined averaged 41 m and ranged from 7 to 201 m. Above 30% of the rodents captured inside the waste area were also captured outside its boundaries. The total population inventory of Pu-238, Pu-2391240, Am-241, Cm-242, and Cm-244 was 44 pCi, 30 pCi, 19 pCi, 2lpCi, and <l pCi, respectively. One-third, or about 35 pCi of transuranics, could be removed from the waste area by small mammals during the summer of 198 1.
A-S
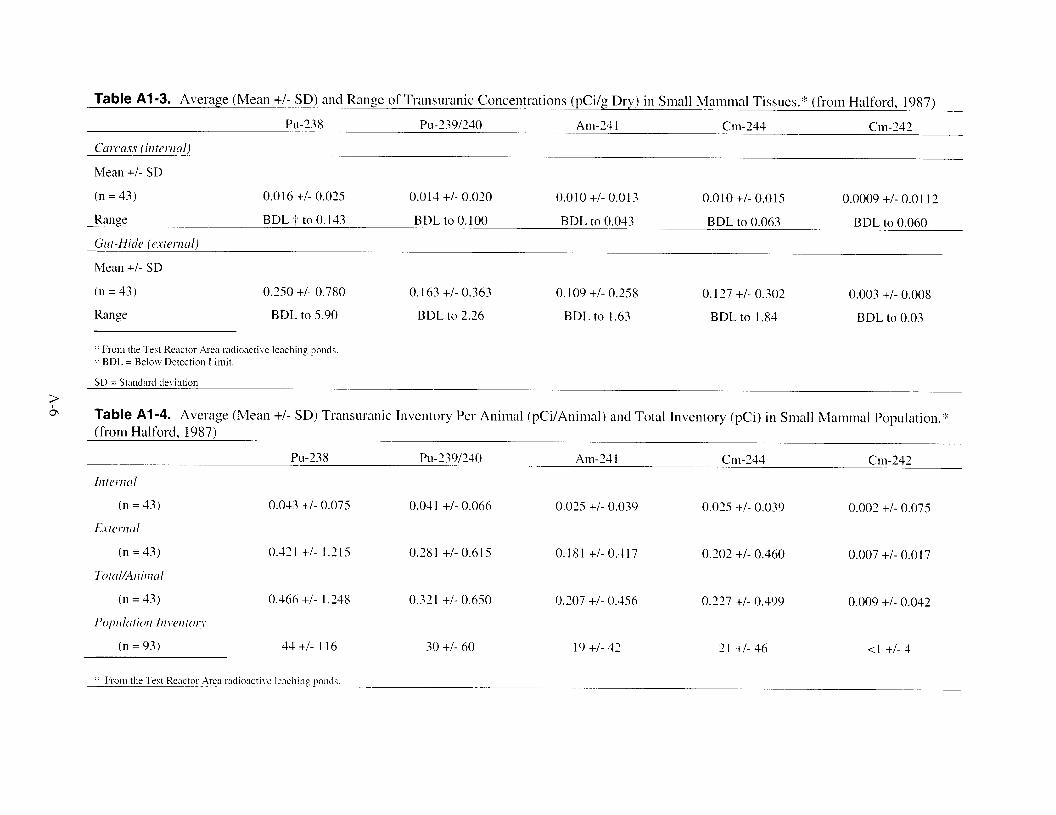
Table Al-3. Average (Mean +/- SD) and Range of Transuranic Concentrations (pCi/g Dry) in Small Mammal Tissues.“’ (from Halford, 1987)
Pu-23 8 Pll-239/240 Am-24 1 Cm-244 Cm-242
Mean +I- SD
(n = 43) 0.016 +/- 0.025 0.014 +/- 0.020 0.010 +/- 0.013 0.010 +/- 0.015 0.0009 +/- 0.01 I2
Range
Gut-Hide (exterml)
hlean +/- SD
BDL T to 0.143 BDL to 0.100 BDL to 0.043 BDL to 0.063 BDL to 0.060
(n = 43) 0.250 +/- 0.780 0.163 +/- 0.363 0.109 +/- 0.258 0.127 +/- 0.302 0.003 +/- 0.008
Range BDL to 5.90 BDL to 2.26 BDL to 1.63 BDL to 1.84 BDL to 0.03
” From the Test Reactor Area mdioncti\e leaching ponds. .;- BDL = Below Detection Limit.
SD = Standard de\ intion
P cr Table Al-4. Average (Mean +/- SD) Transuranic Inventory Per Animal (pCi/Aninnal) and Total Inventory (pCi) in SInall Mamnnal Population.:‘:
(from Halford, 1987)
Illtel’llal
(n = 43)
E.rtc1mI
(n = 43) Totol/Animnl
(n = 43) Poprlntiori Iii\witoi?*
(n = 93)
Pu-238
0.043 +/- 0.075
0.421 +/- 1.215
0.466 +/- 1.248
44+/- 116
Pu-x39/240
0.041 +/- 0.066
0.281 +/- 0.615
0.321 +/- 0.650
30 +/- 60
Am-24 1 Cm-244 Cm-242
0.025 +/- 0.039 0.025 +/- 0.039 0.002 +/- 0.075
0.181 +/- 0.417 0.202 +/- 0.460 0.007 +/- 0.017
0.207 +/- 0.456 0.227 +/- 0.499 0.009 +/- 0.042
19 +I- 42 21 +/- 46 <I +/- 4

RADIONUCLIDE EXPORT AND ELIMINATION BY COYOTES AT TWO RADIOACTIVE WASTE DISPOSAL AREAS IN SOUTHEASTERN IDAHO
(ARTHUR AND MARKHAM, 1982)
ABSTRACT
Coyote fecal samples were collected near a radioactive waste leaching pond and a solid radioactive waste disposal facility and analyzed for radioactivity. Elevated concentrations of Cs-137, Sr-90, and Pu- 238 in the samples from the liquid radioactive waste leaching area were attributed to coyotes ingesting contaminated pond water and/or small mammals. Assumptions relative to the coyote use of these areas permitted an estimate of the maximum quantity of radioactivity exported and eliminated around the facilities. An annual total of 7.2, 3 1.4, and 1.8 FCi (Sr-90, Cs- 137, Pu-238, Pu-239/240, Am-241, Cm- 242, and Cm-244) was eliminated by coyotes within a 6.3 km radius of the solid radioactive waste disposal facility, liquid waste leaching pond, and control area, respectively. These quantities of radioactivity eliminated by coyotes were similar or less than quantities transported by other mechanisms such as waterfowl and vegetative uptake of radioactivity. Coyotes are a mode of radionuclide transport from the two radioactive waste disposal areas; however, due to the low radionuclide concentrations and low yearly radionuclide inventories in coyote fecal samples, it is doubtful that any significant environmental consequences occur as a result of this transport mechanism.
A-7

Table Al -5. Radiouuclide concentrations in coyote fecal samples collected at the Test Reactor Area (TRA) leaching ponds and control area. (from Arthur and Markham, 1982)
Radionuclide (pCi/g dry Lveight )
Asea s-90 cs-137 Pil-238 Pll-239/240 Alll-24 1 cm-242 Cm-244
TRA 0 +/- SD 7.6,,\ +I- 7.3’:’ 19.9, +/- 49.2 0.0 IS.1 +/- 0.0 12 0.03,, +/- 0.04 0.011, +/- 0.01 0.0003* +/- 0.0007 o.oos,\ +/- 0.009
Range 2.8 - 21.7 BDL-271 BDL - 0.036 0.01 -0.12 0.004 - 0.04 I BDL - 0.030 BDL - 0.026
N:::::: 7(7) 38(3-c) 7(S) 7(7) 7(7) 7(l) 7(S)
Control 0 +/- SD 0.9n +I- 0.2 0.7R +/- 0.5 0.003~] +/- 0.003 0.006, +/- 0.003 0.003c +/- 0.002 0.00 I ZA +/- 0.0026 0.003,~ +/- 0.002
Range 0.7 - 1.2 BDL- 1.8 BDL - 0.009 BDL - 0.010 BDL - 0.005 BDL - 0.007 BDL - 0.006
N 7(7) 12(S) S(1) 3-c) 6(2) 7(l) S(1)
!: Rlenns we fottomed by the letter A-C. For each radionuclide. mean\ that do not share the same letter we cignificantty different (P # 0.05). ‘! : First number is sample size; number of samples nbo\ e detection limit in parenthesis; BDL = below detection limit.
Table Al -6. Concentrations (pCi/g) and frequency of occurrence of fission and activation radionuclides (excluding Sr-90 and Cs-137) in coyote fecal samples from the Test Reactor Area (TRA) leaching ponds and control area. (from Arthur and Markham, 1982)
P Radionuclide do
Asea cs-134 Co-60 co-57 Mn-54 Zn-65 Ce-144 Ru-103 Nb-95 Zr-95
TRA Range 0.6 - 17.0 0.6 - 148 0.5 1 .o - 120 3.9 11.5 - 35.7 1.1 11.0 9.5
N::: 337) 38( 10) 38(l) 38(-c) 38( 1) 38( 2) 38( 1) 33(l) 38( 1)
Control Range ND 0.2 ND ND ND ND ND ND ND
N 12(O) 12(l) 12(O) 12(O) 12(O) 12(O) 12(O) 12(O) 1 mu
:: First number is sample size: number of samples nbo\ e tolver detection limit in parenthesis. ‘: : Not detected.

Table Al -7. Meana and maximum whole-body radionuclide concentrations and their contributions to internal dose rates in small mammals captured at the Test Reactor Area radionuclide leaching ponds. (from Arthur and Markham, 1982)
Nuclide Concentrations (pCi/g fresh weight)
Peromyscus n?anicctlatus Eutamias minimus Dipodomys ordii (I? = 13) (n = 13) (n = 9)
Radionuclide Mean Maximum Mean Maximum Mean Maximum
Cr-5 1 157 690 29 134 2 11
cs-137 112 270 11 36 7 38
Co-60 36 313 5 20 4 13
Zn-65 29 73 1 4 <l 5
I-131 12 38 20 72 <1 5
Se-75b 12 25 <l 2 <l 2
cs-134 11 30 1 P
3 1 14
b Ce-141 4 37 <l 2 ND’ -
Ce-144 4 26 <I 3 ND -
Nb-95 2 15 1 2 ND -
La-140 2 17 1 4 <1 1
a. Zero used in mean for sample when nuclide not detected. b. Water concentrations of Se-75 are too low for detection by the analytical procedures used. Therefore, it is not found in the waste data presented in White (1977b). c. ND = not detected.
RADIONUCLIDE UPTAKE AND GROWTH OF BARN SWALLOWS NESTING BY RADIOACTIVE LEACHING PONDS
(MILLARD ET AL., 1990)
ABSTRACT
Populations of barn swallows (Hirmdu rustica) nested seasonally near the Test Reactor Area (TRA) radioactive leaching ponds on the Idaho National Engineering Laboratory (INEL). These birds utilized leaching pond arthropods as a food source and contaminated mud for nest construction and thus accumulated radioactive materials. Over 20 fission and activation products were detected in immature and adult TRA birds. The radionuclide exhibiting the highest mean concentration in adult birds was ‘I Cr, with 16.1 Bq g-’ (435 pCi g-’ ). Mean concentrations of detectable radionuclides were used to calculate internal dose rates. Approximately 72% of the total dose rate of 2 19 microGy d-’ (22 mrad d-‘) for adult birds was due to “Na. Swallow thyroids contained a mean 13’1 concentration of 3,330 Bq g-‘. An average dose rate to the thyroid was calculated to be 4,300 microGy d-’ or 450 mGy (45 rad) for the entire breeding season. Data from LiF-700 thermoluminescent dosimeters in swallow nests indicated that average dose rates were 840 microGy de’ for eggs and 2,200 Gy d-’ for nestlings, for a total of 54 mGy (5.4 rad) during the nesting period. The breeding biology and growth rate were investigated for TRA swallows and comparison groups located 15 km and 100 km away. Total mortality rates for the comparison group vs. 1976 and 1977 TRA populations were not found to be significantly (p >0.9) different. Nonlinear regression was used to fit individual growth curves and estimate parameters using a logistic model. First clutch TRA swallows were found to have a significantly (~~0.0) lower mean growth rate compared to either the first clutch comparison group or the second clutch of TRA birds. Mean asymptotic weights achieved by immature TRA birds were also found to be significantly (~~0.05) lower than those achieved by comparison group birds. Both growth rate and asymptotic weights for TRA birds were within the normal range reported in the literature. The cause for the statistical difference in growth rate between the comparison group and TRA first clutch populations could not be determined.
A-10

Table Al-8. Average radionuclide concentrations and mean whole-body dose rates in barn swallows nesting by the Test Reactor Area Ponds and under a nearby highway bridge.” (from Millard et al., 1990)
Concentration (pCi/g whole-body +/- SD)
Immature&) TRA Immatures TRA Adults
Nuclide >lO g O-log >lOg (n = 6) (n = 34) (n = 79) (n= 16)
Na-24 33.0 +/- 14.9
Cr-5 1 57.0 +/-/- 23.0
Co-60 2.43 +/- 0.54
Zn-65 21.9 +/- 1.89
Se-75 5.95 +/- 1.08
I-131 8.11 +/- 5.14
cs-134 3.24 +/- 0.8 1
cs-137 7.03 +/- 1.89
Ba-140 5.95 +/- 1.89
1.23 +/- 15.9 171 +/- 33.0
278 +I- 35.1 289 +I- 75.9
34.1 +/- 5.95 8.11 +/- 1.08
158 +/- 21.9 330 +/- 28.9
30.0 +/- 2.97 91.9 +/- 8.11
30.0 +/- 5.95 98.1 +/- 8.11
11.1 +/- 1.89 18.1 +/- 1.89
38.1 +/- 5.95 68.9 +/- 8.11
28.9 +/- 5.95 61.1 +/- 7.03
233 +/- 47.0
435 +I- 64.1
40.0 +/- 5.14
160 +/- 28.1
135 +I- 25.9
150 +/- 33.0
35.9 +/- 7.03
172 +/- 41.1
21.9 +/- 5.14
a. Whole-body wet weight concentrations were reported for radionuclides with percent occurrences greater than 50%. Lanthanum- 140 was not included because this nuclide could not be decay-corrected to sampling date. Concentrations included contributions from feathers and the Gl tract and its contents. b. Immature birds collected from highway bridge 1.5 km from ponds. Note: Dose rates were calculated for individual swallows assuming the above radionuclide concentrations were uniformly distributed in tissues.
A-11

RADIONUCLIDES IN MOURNING DOVES NEAR A NUCLEAR FACILITY COMPLEX IN SOUTHEASTERN IDAHO
(MARKHAM AND HALFORD, 1982)
ABSTRACT
The Idaho National Engineering Laboratory Site in southeastern Idaho contains the world’s largest concentration of nuclear reactors; to date some 53 reactors have been constructed and 17 reactors are still operable. In addition, the INEL contains a nuclear fuel reprocessing plant, terrestrial areas for the disposal of solid radioactive wastes, and leaching ponds for the disposal of contaminated liquid wastes. With the exception of uranium mining and fuel fabrication, the INEL activities include all the nuclear fuel cycle.
Mourning doves (Zennida 1~zc1c~o.0~1~~) are ubiquitous game birds in Idaho and are common on the INEL during the summer (Reynolds and Trost 198 1). They forage, obtain grit and/or drink water at or near these facilities (Trost et al. 1976, Halford and Millard 1978, Arthur and Markham 1978).
The potential exists for mourning doves at these facilities to ingest radionuclides. Since birds are the most mobile of the animals occurring near nuclear facilities and since doves are a popular game species, it is possible that radioctively-contaminated birds could be ingested by and thus provide a radiation dose to man. Other predators, such as raptors, could also ingest radionuclides by consuming doves. The purposes of this study were ( 1) to determine the concentrations of radionuclides in mourning dove tissues near various types of nuclear facilities, (3) to determine the consequent radiation dose to doves, (3) to determine the consequence of the transfer of radionuclides through the food chain and (4) to relate these concentrations to potential radiation doses to man.
A-12
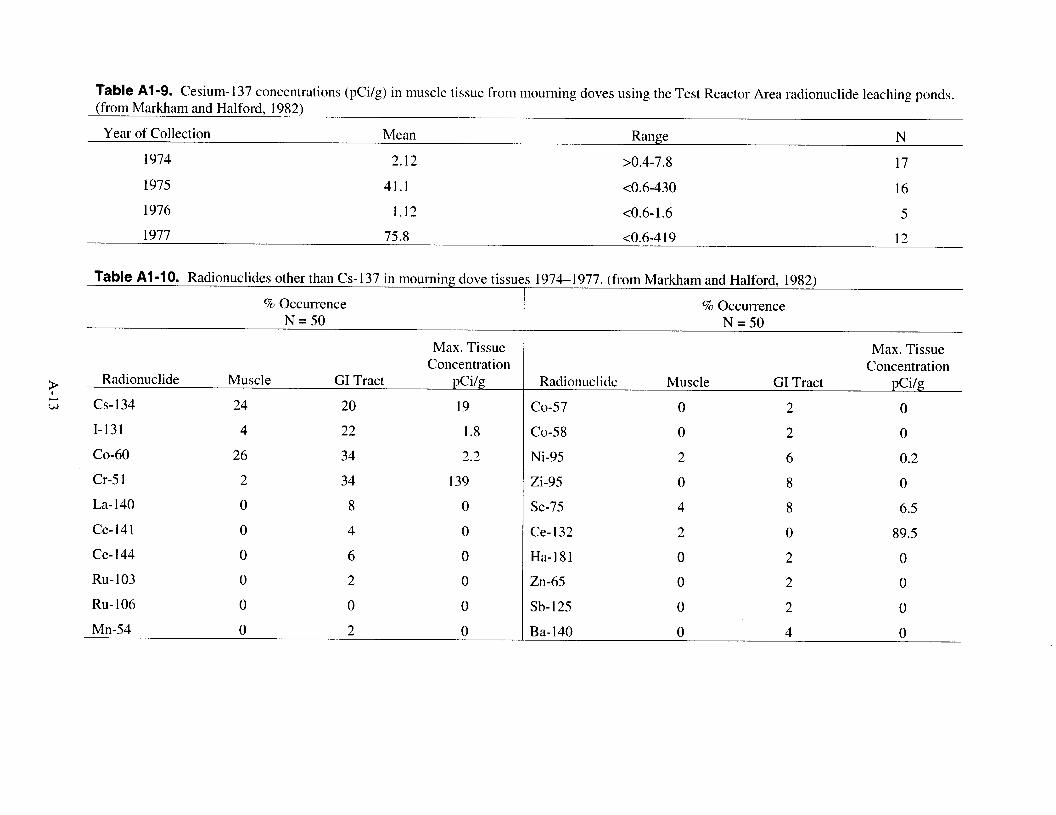
Table Al-g. Cesium-137 concentrations (pCi/g) in muscle tissue from mourning doves using the Test Reactor Area radionuclide leaching ponds. (from Markham and Halford, 1982)
Year of Collection Mean Range N
1974 2.12 >0.4-7.8 17
1975 41.1 <0.6-430 16
1976 1.12 <0.6- 1.6 5
1977 75.8 <0.6-4 19 12
% Occurrence % Occurrence N = 50 N=50
Table Al -10. Radionuclides other than Cs-137 in mourning dove tissues 1974-1977. (from Markham and Halford. 1982) \ I
Max. Tissue Concentration
? Radionuclide Muscle GI Tract pCi/g
G cs-134 24 20 19
I-131 4 22 1.8 Co-58 0 2 0
Co-60 26 34 2.2 Ni-95 2 6 0.2
Cr-5 1 2 34 139
La-140 0 8 0 Se-75 4 8 6.5
Ce-141 0 4 0
Ce-144 0 6 0 Ha-181 0 2 0
Ru-103 0 2 0
Ru- 106 0 0 0
Mn-54 0 2 0 Ba- 140 0 4 I)
Radionuclide Muscle GI Tract
co-57 0 2
Max. Tissue Concentration
pCi/g
0
Zi-95 0 8 0
Ce-132 2 0 89.5
Zn-65 0 2 0
Sb-125 0 2 0
RADIONUCLIDES IN PRONGHORN RESULTING FROM NUCLEAR FUEL REPROCESSING AND WORLDWIDE FALLOUT
0. D. MARKHAM ET AL. (1982)
ABSTRACT
During 1972-76, rumen, lung, muscle, and liver tissues from pronghorn (Antilocapra americana) collected near the Idaho Chemical Processing Plant (ICPP) on the Idaho National Engineering Laboratory (INEL) Site, on adjacent INEL areas, and on offsite control areas were analyzed for gamma-emitting radionuclides. Although up to 14 radionuclides appeared in pronghorn rumen contents, only 17’Cs was consistently detected in muscle and liver samples. Cesium- 137 concentrations in pronghorn muscle from near the ICPP averaged 384 PC&g, and were higher (P < 0.01) than concentrations in other onsite pronghorn (53 pCi/kg) and offsite controls (38 pCi/kg). Concentrations of 137Cs in livers were slightly higher, and lung concentrations were much lower than muscle concentrations. Maximum dose commitment to man consuming the muscle and liver of a pronghorn was 3.7 mrem. Radiation doses to pronghorn from radionuclides reported in this and other studies are discussed in relation to the 3 study areas, and are compared to doses pronghorn receive from naturally occurring radionuclides. Radiation doses to pronghorn and to man eating the pronghorn are below guidelines established for man. Pronghorn appear to be useful bioindicators of radionuclides in the environment.
A-14

Table Al -11. Gamma-emitting radionuclides in rumen, muscle, and liver samples from pronghorn collected near the Idaho Chemical Processing Plant and other areas on or near the Idaho National Engineering Laboratory Site, 1972-76. (from 0. D. Markham et al. 1982)
Concentrations (pCi/kg dry)
5 km of ICPP Remainder of INEL Offsite
Nuclide Percent
Occurrence Max. Avg.” Percent
Occurrence Max. Avg. Percent
Occurrence Max. Avg.
Rurnen
(N= 17) (N = 21) (N = 12)
cs-137 94 24,000 5,680 95 1,460 365 92 460 250
cs-134 47 9,100 550 0 0 Ru-106 53 53,000 5,880 14 1,520 b 0
Ru-103 0 24 270 85 33 230 90
? Ce- 144 47 7,460 1,285 43 6,730 1,020 33 2,000 380 t; Ce-141 6 970 b 24 995 144 0
Zr-95 18 990 b 48 8,500 655 50 980 220
Nb-95 35 1,800 330 52 11,000 895 58 780 290 Sb-125 24 4,000 825 14 275 b 0 La-140 6 180 b 19 330 b 0 Mn-54 0 10 70 b 0
Co-60 12 430 b 0 0
Ba-140 6 180 b 0 0
Eu-154 6 420 b 0 0
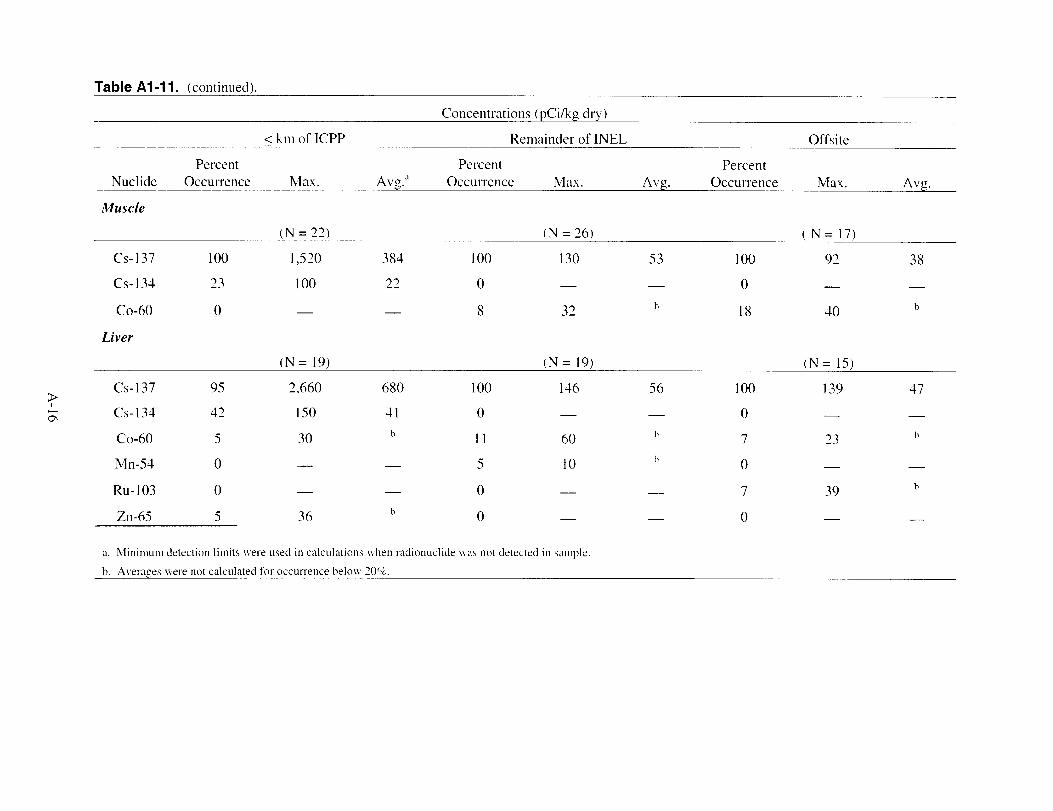
Table Al -11. (continued).
Nuclide
Muscle
Concentrations (pCi/kg dry)
5 km of ICPP Remainder of INEL Offsite
Percent Percent Percent Occurrence Max. A\‘U.;’ Occwence Max. Avg. Occurrence Max. Avg.
(N = 22) (N = 26) (N= 17)
cs- 137
cs-134 Co-60
Liver
100
23 0
1,520
100
(N= 19)
384
22
100
0 8
130
32
(N= 19)
53
b
100
0 18
92
40
(N= 15)
38
b
95 ? cs-137 2,660 680 100 146 56 100 139 47
E;t cs-134 42 150 41 0 0 Co-60 5 30 b 11 60 h 7 23 h
Mn-54 0 5 10 h 0 Ru- 103 0 0 7 39 b
Zn-65 5 36 h 0 0
a. Minimum detection limits were used in calculations when radionuclide was not detected in sample.
b. Averages \irere not calculated for occurrence below 20%.

EFFECTS OF DECREASED EFFLUENTS FROM NUCLEAR FUEL REPROCESSING ON 137CS CONCENTRATIONS IN WILDLIFE
0. D. MARKHAM AND D. K. HALFORD (1985)
ABSTRACT
During 1975, additional fiberglass prefilters and HEPA filters were added to the existing air filtering system for atmospheric effluents from the Idaho Chemical Processing Plant (ICPP) on the Idaho National Engineering Laboratory. Pronghorn (Antilocapra americana) muscle and liver samples collected near the ICPP prior to filter installation contained Cesium-137 concentrations that were 13 and 18 times, respectively, the concentrations in tissues of control animals. Muscle and liver samples collected after filter installation had only 2.5 times the 137Cs concentrations in control tissues. The potential committed dose equivalent to man consuming the muscle and liver of a pronghom from the ICPP vicinity was reduced by a factor of 10 by the addition of the filtering system. Although not statistically significant (P > O.OS), lJ7Cs concentrations in mourning doves (Zenaida macroura) were reduced by a factor of four after the additional effluent filters at ICPP were installed.
A-17

Table Al -12. Cesium- 137 in edible tissues of pronghorn antelope and mourning doves before and after installation of additional atmospheric effluent filters at the Idaho Chemical Plant (ICPP). (from 0. D. Markham and D. K. Halford 1985)
Sample Date Size
Pimglmri2 Mitsclc (pCi/g)
ICPP Avg. If: SD Range
Sample Control Area Size Avg. k SD Range
1972- Aug. 1975 14 0.57 IL 0.48 0.03 - 1.52 12 0.04 f 0.02 0.02 - 0.09
Sept. 1975-1976 8 0.05 f 0.04 0.05 - 0.14 5 0.02 zk 0.01 0.01 - 0.03
Proi2ghom Liver (@i/g)
1972- Aug. 1975 12 1.04 f 0.83 0.06 I!I 1.77 10 0.06 310.04 0.02 - 0.14
Sept. 1975-1976 7 0.07 + 0.08 BDC”- ” “’ 5 0.03 f 0.01 0.02 - 0.04
1974 16 3.2 zk 3.6 BDC - 1 1.6 16 <0.4 + 0.1 BDC - 0.8
1976 4
a. BDC - Below detectable concentration
2.0 + 2.2 0.7 - 5.3 8 BDC BDC

Table Al -13. Annual Cs- 137 atmospheric releases from the Idaho Chemical Processing Plant. (from 0. D. Markham and D. K. Halford 1985)
Year
Before Additional Filters
13’Cs Released W
1972 4.6
1973 5.4
1974 6.7
After Additional Filters
1975 0.6
1976 0.1
A-19
Related Documents