~ ÄMPl.TR.71^ m 03 m ANALYSIS OP THi VESTIBULO^OCUUR COÜNTERROLL REFLEX IN PRIMATES A. M. JUNKER, CAl TAIN, USAP C. R. REPLOGLE. PhD K. A. SMILES. 1ST LT, USAF R. D. BROWN, CAPTAIN, USAF AEROSPACE MEDICAL PJESEARCH LABORATORY R. V/HEFLER, CAPTAIN, VSAF AIR FORCE INSTITUTE OF TECHNOLOGY NOVEMBER mi Approved for public rebase; distribution anlsaiited fl D C r- NATIONAL TECHNiCAL INFORMATION StRViCE AEROSPACE MEDICAL RESEARCH LABORATORY AERC^PACE MEDICAL DIVISION AIR FORCE SYSTEMS COMMAND WRIGHT-PATTERSON AIR FORCE BASE, OHIO \ ii

Welcome message from author
This document is posted to help you gain knowledge. Please leave a comment to let me know what you think about it! Share it to your friends and learn new things together.
Transcript
~ ■
ÄMPl.TR.71^
m
03
m
ANALYSIS OP THi VESTIBULO^OCUUR COÜNTERROLL REFLEX IN PRIMATES
A. M. JUNKER, CAl TAIN, USAP
C. R. REPLOGLE. PhD
K. A. SMILES. 1ST LT, USAF
R. D. BROWN, CAPTAIN, USAF
AEROSPACE MEDICAL PJESEARCH LABORATORY
R. V/HEFLER, CAPTAIN, VSAF
AIR FORCE INSTITUTE OF TECHNOLOGY
NOVEMBER mi
Approved for public rebase; distribution anlsaiited
fl D C r-
NATIONAL TECHNiCAL INFORMATION StRViCE
AEROSPACE MEDICAL RESEARCH LABORATORY AERC^PACE MEDICAL DIVISION AIR FORCE SYSTEMS COMMAND
WRIGHT-PATTERSON AIR FORCE BASE, OHIO
\ ii

SOTS^
When VS Govenmeat drawiugs.. spetMcatiovs, as «fther dsta are used for aayjHiFpt^^eothfe'thacjwafinite-, ly related GovsrruneBt procurement oparaüoc, the Covermnart tha^sby iiMajKv so responsibility nor any (ky ligatiOB wfaateoever, and the i&k Oat the Govenanent msy have fonnolatedl fumiäied, or in any mf0^i plied the said drawing spedficstlons, or otha- data, is Bgt to he i§garded by imphcadon or otherwise, as k? fny manner licensing the holder or any other person or corporation, or eoifesynlg my^gsü is ^rnmsssam to mamifacture, üSö, iff sell any patented inveBt&a that may in aey way b&ielated thereto.
tor, w^r« sail« ^K \m m sari« Q
üsrntjuai
iir .^..^ :
~m. i m\i. m/m »ssÄ!
\K
The experiments reported hereir ^ere conducted according to the "Guide for Laborato; y Animal Facilities and Care," 1965 prepared by the mmittee on the Guide for Laboratory Animal Resources, National Acad- emy of Sciences -~ National Rese&. db Council. AIR FORCE: 4-1-72/100
DOCUMENT CONTROL DATA - R * D (Smcvritr ctmmmlllcwiiem of fill», hodr of *fc«lf»cl mnd Sndmmmg mmotmaan mumt hm tmtmmd wtm rif iff I» <cio««IBM0
ORiciNATiNC ACTIVITY fCoipamoaMakar)
Aerospace Medical Research taborötory AMD CAFSC), Wright-Patterson AFB, OH 45433 Air Force Institute of Technoloqv*.*WPAFB. OH 45433
L REPOiTT SCCURITTCLAaSIFICATIOM
UNCLASSIFIED CROUP
N/A 3. REPORT TITLE
ANALYSIS OF THE VESTIBULO-OCULAR CX)UNTERROLL REFLEX IN PRIMATES
<■- DESCRIPTIVE NOTES f1>po of raptirt and fncfuolr« dato«)
Final Report S..AUTHOR») (Fltmt immm, mldm» HtlUmt, tool noiao; *A. M. Junker, Capt, USAF *C. R- Replogle, PhD *K. A. SmUes, 1st Lt, USAF
** R. D. Brown, Capt, USAF R. Wheeler, Capt, USAF
• . REPORT DATE
November 1971 TO. TOTAL MO. OF PACES Tfc. HO. OF REFS
■«. CONTRACT OR CRANT NO.
b. PROJECT MO. 7222
c.Task No. 722^08
ML ORICINATOIfS REPORT KUMRERI»
AMRL-TR-71-59
M. OTHER REPORT MOISI (An? oAor : (Mo rmport}
10. DISTRIBUTION STATEMENT
Approved for public release; distribution unlimited
II. SUPPLEMENTARY NOTES 12. SPONSORING MILITARY ACTIVITY
Aerospace Medical Research Laboratory Aerospace Medical Div, Air FOTCC Systems Command, Wright-Patterson AFB, OH45433
19. ABSTRAC r
The 'estibulo-ocular reflex manifest by countenroll was used to determine the re- sponse dynamics of the vestibu!.ar system and alterations in these dynamics sub- sequent to +Gx exposure. Six rhesus monkeys we.'e tested before and after acceler- ation exposure to determine if significant changes had occurred in the vestibulo- ocular countenroll reflex. The tests consisted of constant speed rotation, pendular oscillations and multiple sine wave oscillations about the subject's cyclopean axis. Ocular countenroll was recorded using a linear resolver mechanically fixed to the monkey's eyeball. The data collected was analyzed by use of the Fast Fourier Transform. This work demonstrates that there is no significant decrease in the system gain with Inputs up to 1Hz; the observed phase lag can be accounted for by a time delay of approximately 0.2 seconds, and there is no significant re- sponse alteration caused by acceleration loading up to 75 +Gx.
DD .Fr..l473 Security Clssuification
,i^aijMidiBila^MittMtHflaig<tiaattMMataflaflafiMatfo' '-*■' '-^—-"—' -^-.■^-^~-^.... •^^»•■-'■■^ummmMtiMiiMeikaimmm ■ -

FOREWORD
These experiments were conducted *y personnel of the Environmental Physi- ology Branch, Environmental Medicine Division of the Aerospace Medical Research Laboratory and the Air Force Institute of Technology. This research supported Project 7222, "Combined Stress Environments in Aerospace Oper- ations," and Task 722208, "Physiology of Combined Stress Environments."
The authors would like to thank Lt Robin Pearse, presently assigned to CINCNORAD (NPCP-MJ), for his programming assistance on this project.
This technical report has been reviewed and is approved.
CLINTON L. HOLT, Colonel, USAF, MC Commander Aerospace Medical Research Laboratory
111
'-, ■■■■'■ ■- i ■-■■■■■ ..■■.-■■•:■-■-. mmummM tmmm
■ ■ r — -■

SECTION I
INTRODUCriON
Recent emphasis on the interaction of vestibular function and human operator performance has demonstrated a critical need for a mathematical analysis of the vestibular system. The primary purpose of our work is to define the transfer function characteristics of the vestibular system to predict vesti- bular influence on man/machine control performance.
Previous studies have indicated that the ocular counterroll reflex is a measure of vestibular function and that both the semicircular canals and otolith organs are involved. To assess the influence of the semicircular canals and otolith organs on human operator performance, a quantitative description of these sys- tems is necessary. It has been postulated that otolith organs act as linear acceleration sensors and that the semicircular canals act as angular acceler- ation sensors. Their functions may therefore bo separated by correlating the smooth pursuit component of ocular counterroll with the lincer acceleration portion of the forcing function and by correlating the rotary nystagmus portion with the angular acceleration component of the forcing function.
Parker et al., (1) have reported otolith organ damage in guinea pigs exposed to acceleration levels as low as 12 +Gx. This suggests that commonly used ex- perimental acceleration levels might cause functional otolith organ damage. Monkeys were exposed to +Gx acceleration (12.5 to 75 +Gx) in an attempt to alter vestibular function. Using ocular counterroll a:' an indicator of vesti- bular function (specifically otolith organ function), counterroll measurements were made before and after +Gx acceleration.

SECTION II
METHODS
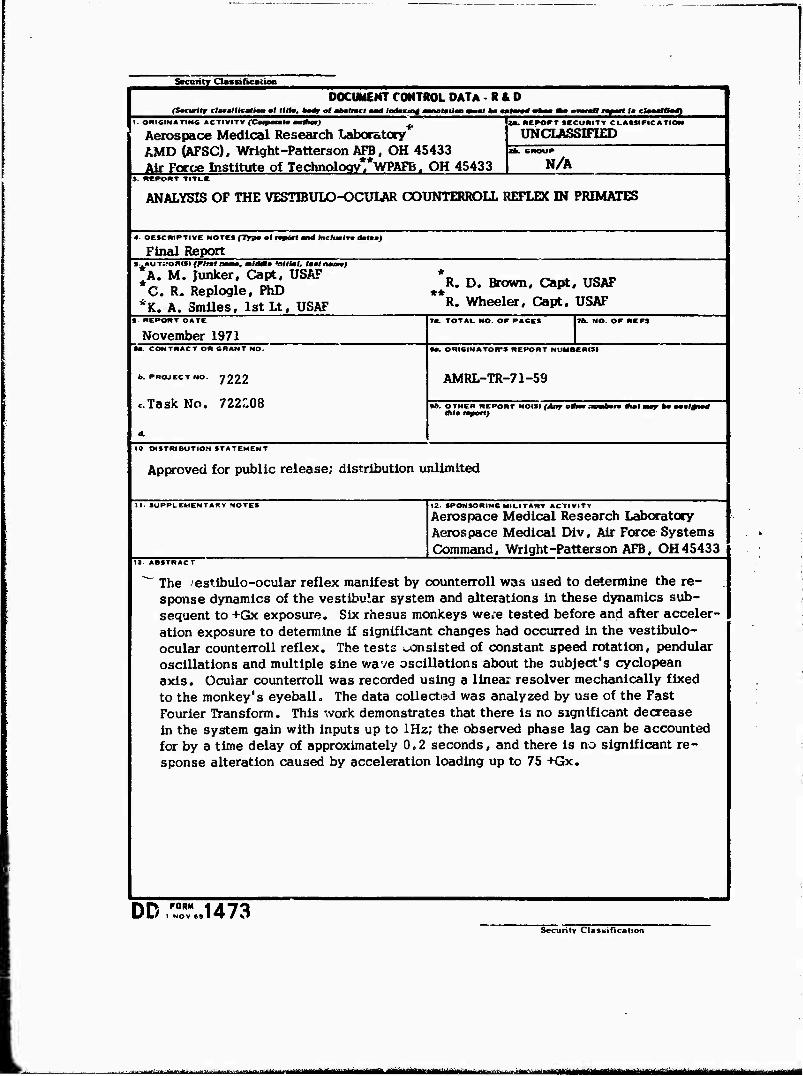
Experiments designed to yield baseline data were conducted with 12 rhesus monkeys. Direct measurements of eyeball counterroll relative to the median sagittal plane were made by using a custom fitted contact lens coupled to a linear transformer. To eliminate slippage, the lens was sutured to the eyeball using two sutures placed at the medial and lateral limbus (figure 1). During suture placement, the monkey was under metered halothane anesthesia. The sutures are passed through holes drilled in the lens, the lens is next inserted and the sutures tied. Subjects were immobilized in a restraint chair mounted on a controlled motion platform. The contact lens was then coup, d via a flexible shaft (figure 2) to a linear transformer mounted on the motion platform. During the experiment, a topical anesthetic was administered to minimize discomfort. The other eye was covered and the experiment conducted in near darkness.
The subjects were exposed to three types of motion input about the cyciopean axis: constant speed, pendular oscillations and multiple sine wave oscillations. The position of the subject's median sagittal plane relative to the local gravity vector was measured by means of a potentiometer connected to the drive shaft of the rotating platform. We define the potentiometer output as 0C . To facili- tate viewing of the time traces for positive potentiometer values, counterroll output from the linear transformer was defined as positive. Constant speed rotations (0.05-1.0 Hz) were ased because they afford lineai acceleration in- puts with no angular acceleration component. For this input, the acceleration, As, is given by As = gsin6c/ where g is 980. For constant speed input, the potentiometer reads from + 180° to + 180° and resets at the null point on the winding (figure 3). Pendular motions (0C ±90°, 0.05-0.5 Hz) were also used. The linear acceleration component of this input is much like that for constant speed rotations with the addition of a sinusoidal angular acceleration component (6C). Since this input is a combination of linear and angular accelerations, the response to both can be separated, assuming linearity. The third input was random appearing pendular motions designed to produce a nonpredictive input. The summation of five sine waves (0.05-0.6 Hz) was used as the nonpredictive forcing function to the motion platform. Input (9C) and output (eye position) signals were recorded on analog tape and subsequently digitized and recorded on digital tape for anal/Pis on an IBM 360 Model 40 graphics computer. The Fourier Transforms of the input and output time records were approximated using the discrete Fourier Transform implemented by the Cooley-Tuckey Algorithm or Fast Fourier Transform. From the transform values, the power spectral densi- ties (PSD) for the input and output signals were computed.
Figure 1. Custom fitted contact lens about to be inserted. Sutures have been placed through llmbus and lens. Note how the stalk is integral with the contact lens.
Figure 2. The monkey has been packed in the restraint chair to eliminate head movements. The flexible shaft of the linear transformer has been coupled to the contact lens stalk to record torsional eye movements.
3
.

Six of the twelve rhesus monkeys for which baseline data was collected were exposed to high +Gx acceleration levels. Each monkey was anesthetized, placed in a restraint device and exposed to various acceleration profiles (Table 1). Ocular counterroll response of all six subjects was measured at different times ranging from one day to several months after acceleration exposure.

Table 1. Table of G-Exposure Profiles
F 0 R c E
M A 6 N I T U 0 E
Monkey Date tl
(Sec) t2
(3ec) IgefiL T
(??9)
M
(Qx)
M76 6 Nov 70 26 61 70 35 50
M76 13 Nov 70 37 67 85 30 60
M76 30 Nov 70 49 94 117 45 70
N88 10 Dec 70 48 101 123 55 70
080 18 Mar 71 11 71 78 60 12.5
092 18 Mar 71 19 79 89 60 25
P20 18 Mar 71 51 81 104 30 75
P42 18 Mar 71 10 70 76 60 12.5
MiiitettriiaaflMria' aüttfiniinitfi'rTüfrri« aäM&E^aMaajtoatMMiiaiaa ■^^'^^^-^"-^^-^-"— -■--■"■---lia.i^^-w. imtf^^p**u.i^^,,. m
SECTION m
RESULTS AND DISCUSSION
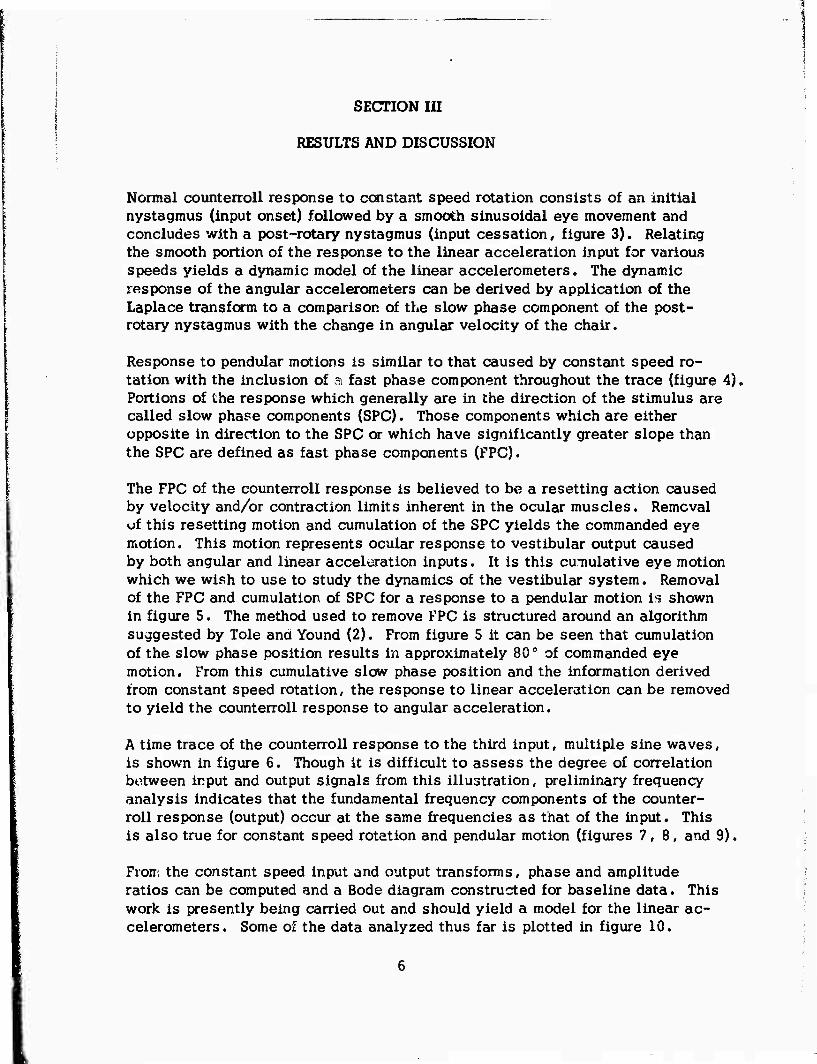
Normal counterroll response to constant speed rotation consists of an initial nystagmus (input onset) followed by a smooth sinusoidal eye movement and concludes with a post-rotary nystagmus (input cessation/ figure 3). Relating the smooth portion of the response to the linear acceleration input for various speeds yields a dynamic model of the linear accelerometers. The dynamic response of the angular accelerometers can be derived by application of the Laplace transform to a comparison of the slow phase component of the post- rotary nystagmus with the change in angular velocity of the chair.
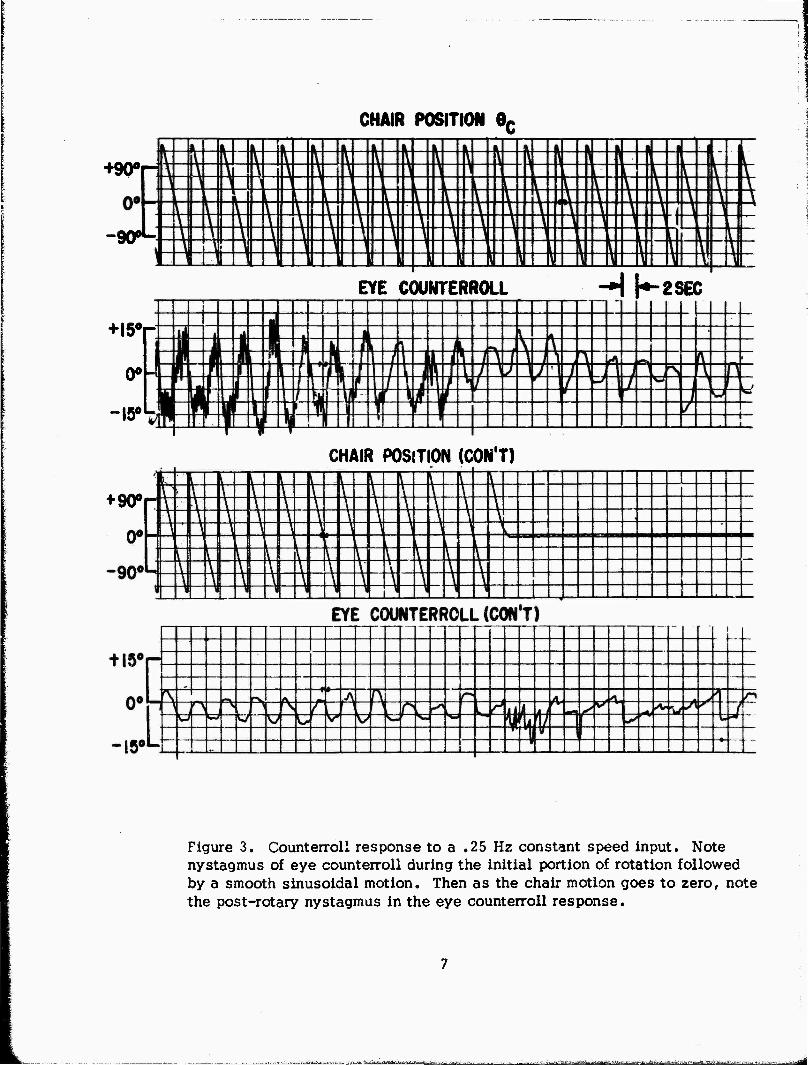
Response to pendular motions is similar to that caused by constant speed ro- tation with the inclusion of a fast phase component throughout the trace (figure 4). Portions of the response which generally are in the direction of the stimulus are called slow pha^e components (SPC). Those components which are either opposite in direction to the SPC or which have significantly greater slope than the SPC are defined as fast phase components (FPC).
The FPC of the counterroll response is believed to be a resetting action caused by velocity and/or contraction limits inherent in the ocular muscles. Removal of this resetting motion and cumulation of the SPC yields the commanded eye motion. This motion represents ocular response to vestibular output caused by both angular and linear acceleration inputs. It is this cuTiulative eye motion which we wish to use to study the dynamics of the vestibular system. Removal of the FPC and cumulation of SPC for a response to a pendular motion i« shown in figure 5. The method used to remove FPC is structured around an algorithm suggested by Tole and Yound (2). From figure 5 it can be seen that cumulation of the slow phase position results in approximately 80° of commanded eye motion. From this cumulative slow phase position and the information derived from constant speed rotation, the response to linear acceleration can be removed to yield the counterroll response to angular acceleration.
A time trace of the counterroll response to the third input, multiple sine waves, is shown in figure 6. Though It is difficult to assess the degree of correlation between input and output signals from this illustration, preliminary frequency analysis indicates that the fundamental frequency components of the counter- roll response (output) occur at the same frequencies as that of the input. This is also true for constant speed rotation and pendular motion (figures 7,8, and 9).
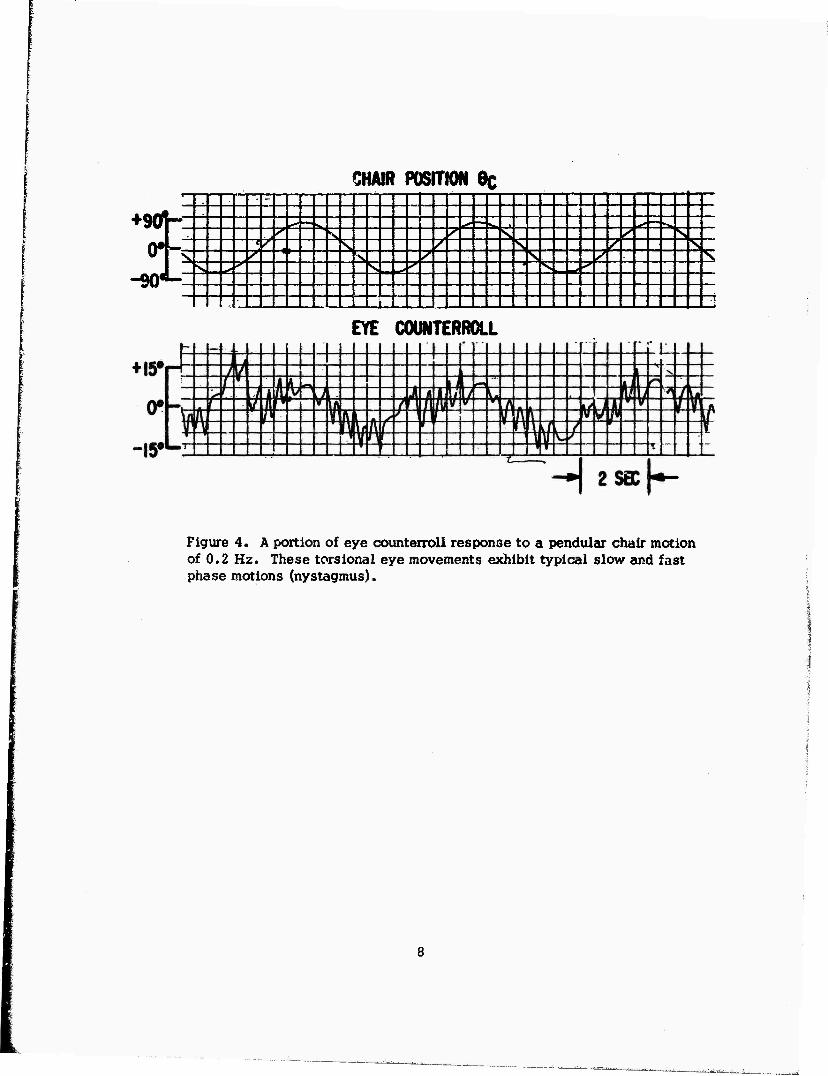
Fron; the constant speed input and output transforms, phase and amplitude ratios can be computed and a Bode diagram constructed for baseline data. This work is presently being carried out and should yield a model for the linear ac- celerometers. Some of the data analyzed thus far is plotted in figure 10.
+90ör
~W*-
+I5V
0°
-IRO 15«
+901»
CHAIR POSITION ec
EYE COUNTERROLL ♦-2SEC
CHAIR POSITION (CON'T)
Figure 3. Counterroll response to a .25 Hz constant speed input. Note nystagmus of eye counterroil during the initial portion of rotation followed by a smooth sinusoidal motion. Then as the chair motion goes to zero, note the post-rotary nystagmus in the eye counterroil response.
fc'Si^aiBaiia^MiaaaiiifiitkJäit^a^aLtJi .^c^u£^^^t/;-Jt»w:..:.-j---.,1tf:-v.f.^;»J);'..v^i^^-Jaj.
CHAIR POSITION Oc 11 i i i i i' i i i i i i i i i i i i i
♦901 "* 1 1 1 1 1 1 i L-4—4^! 1 1 J 1 i 1 1^4—U 1 1 I 1 1 i 1 1 1 l^r^k.! 1 t 1 1 1 1 1 1 y-T 1 rrvl 1 Irl 1 1 rJ ^rrrNL M rSL H - Tl 1 iKl r >L KI iNu
M Ln t 4 KI KM iLkr• p IN -r 1 IN ^
-iMr "■ 1 1 » 1 ! I 1 1 1 1 1 1 1 1 1 I 1 11 1 I 1.1.1.1 1 1 1 1 L L i 1 . I.I 1
EYE C0UNTERR0LL
Figure 4. A portion of eye counterroll response to a pendular chair motion of 0.2 Hz. These torsional eye movements exhibit typical slow and fast phase motions (nystagmus).

«•C*l*f«l «•
'1 I I
-JO «^ —
::km¥^
-it »4
o • H.*t •» r.nmtm ••tiriaa •••■«•■lac «•».€. >nf
I
• «• • >• M» If ••»ItlO» «» >■«
t« ••
»•4
.,..J <. It • «• «I
< . • M »• • U ■ ••
1 «J »•c« • I*
Figure 5. Shewn in the lower trace of figure 5-A is the recorded eye counter- roll response to at? 0.2 Hz pendular motion. The upper trace of figure 5-A is the cumulative slow phase response with the fast phase portions removed. Figure 5-B is an expanded segment of 5-A.
9
aaw=M.,i.i:VraB mmmtmimitmmiimiiitmtm

• 11 • I* • »I • 11 t «>. • LI« t «4» « ■€»• F •€»• L* »if« I* • W •• »It III J •!•
Figure 6. Eye counterroll response to a multiple sine wave motion input. Included within the eye trace are two vertical lines (at approximately 30 and 100 zee). It is over the range delineated by these lines that the Four- ier Transtorm and PSD shown in figure 7 were calculated.
CCCVIMWI WO I *^
mL rVy^_ ■A-»ftA-A/\.^Art-- -A, * ^
hU. ■UK k ill 0.00 0 I« 0 41 t •• »IS
■Will'it «UK n U 'I '1 '•€• M ••••« ml »I« »f4 •<> CM 4«c erf u loi » » » i o ii»i -a» in it M n -n «
Figure 7. Power spectral densities (PSD) for eye counterroll and chair motion resulting from a multiple sine wave forcing function. Both traces have been normalized to their maxima.
10

m- w*
•.»
■.'•a
t.m
I
JL •.• •.•« 1.11
oMfTui; ««cce n TI n »» •<■> ca« 4M era
'«• a a.» ».*»
»MM «it »I« Mt «• •.• 2.« •.«•»•• -tk.««1 .!«.■» iwca -I».11
Figure 8. Power spectral densities for a constant speed rotational test of 0.488 Hz. Both traces have been normalized to their maximum values. For this test, the amplitude ratio at 0.483 Hz was -46.97 db and the phase was -41.79°.
ial«l ■•. ni.
..ILA •-«
• •)
r»4
•-•<
• J4
• • L • « ..« 1 It
•im «'•'•ni n ft '■ »t »«• ^» CM .w ft 1» «I . . » » •.«<•"•
Figure 9. Power spectral densities for a penduiar motion of 0.244 Hz. Both traces have been normalized to their maximum values. At 0.244 Hz,, the gain was -39.3db and the phase was +25.8* .
11
-90
6 A -S5
1 N -40
1 N -4»
0 -5 0
B -5 5
H } Hii
40
p H A S E
20
l_ >
1 N
•20
-40 ■ • '
0 E 6 R
-to
-80
E S -«00
S -120
-140
TRANSPORT LAG OF 0.296 SEC.
005 OJ06 OUO« 0.1 0.2 0.4 0.5 CS 1.0
FREQUENCY IN HZ
Figure 10. Gain and phase plot constructed from constant speed baseline data.
12
:^:;.-~' .■■-::■■.:-■-■■ -^^ .:,.,i,r:Ut.^:

f This data indicates that there is no significant decease in amplitude ratio with increasing frequency up to 1 Kz. The observed phase lag shewn in the lower portion of figure 10 can be accounted for by a time delay of approximately 0.2 seconds.
The cumulated slow phase counterroll due to pendular motion input represents a response to both linear and angular acceleration. Using the model far the linear accelerometers, the response due to linear acceleration can be removed. From the remaining counterroll response and the angular acceleration input, anc ther Bode diagram can be constructed to give the dynamic characteristics of the an- gular accelerometers about the cyclopean axis.
The pre and post acceleration counterroll responses appear quaUtatively the same and the Gx exposure levels used seem to have no demonstrable effect on the functional characteristics of the vestibular organs. Phase and ampli- tude ratios of the counterroll response to constant speed rotations after acceler- ation exposure do not vary significantly from values before exposure. In ad- dition , none of the monkeys exposed to +Gx acceleration exhibited behavioral abnormalities symptomatic of vestibular end organ damage. Preliminary tem- poral bone examination suggests that these levels of acceleration do not result in gross displacement of ccoconia.
13
REFERENCES
1. Parker, D. E., Covell, W. P. and von Gierke, K. E. "Behavioral Loss and Otoconia Displacement in Guinea Pigs Following Linear Acceleration," from Third Symposium on the Role of the Vcstibular Organs in Space Explora- tion, NASASP-152, 1967.
2. Tole, John R. and Young, Laurence R. MITNYS; A Hybrid Program for On- Line Analysis of Nystagmus, Cambridge, Massachusetts, Man-Vehicle Labcar- atory, MIT, Unpublished Report.
1 4 «US.Qovernmem Printing Otfice: 1972 - 759-081/285
■iH-i-ii-.ffnv-"-->-—^-—"•■•- riitmwm'""~',"-,^~''t^"a'-"«^-^-'-'-"-"^^ dl
Related Documents